Exhibit 99.7
Budget and Fiscal Plan
2012/13 — 2014/15
February 21, 2012
National Library of Canada Cataloguing in Publication Data
British Columbia.
Budget and fiscal plan. — 2002/03/2004/05-
Annual
Also available on the Internet.
Continues: British Columbia. Ministry of Finance and
Corporate Relations. Budget ... reports. ISSN 1207-5841
ISSN 1705-6071 = Budget and fiscal plan — British Columbia.
1. Budget — British Columbia — Periodicals. 2. British
Columbia — Appropriations and expenditures — Periodicals.
I. British Columbia. Ministry of Finance. II. Title.
HJ12.B742 352.48’09711’05 C2003-960048-3
TABLE OF CONTENTS
Budget and Fiscal Plan 2012/13 — 2014/15 | | February 21, 2012 |
Attestation by the Secretary to Treasury Board
Summary | 1 |
| |
Part 1: Three Year Fiscal Plan | |
Introduction | 5 |
Changes from Budget 2011 Fiscal Plan | 8 |
Measures to Balance the Budget | 9 |
Revenue | 9 |
Major Revenue Sources | 11 |
Expense | 18 |
Consolidated Revenue Fund Spending | 19 |
Management of the BC Public Service | 30 |
Recovered Expenses | 31 |
Operating Transfers | 32 |
Service Delivery Agency Spending | 32 |
Capital Spending | 33 |
Taxpayer-supported Capital Spending | 34 |
Self-supported Capital Spending | 38 |
Projects over $50 million | 39 |
Provincial Debt | 42 |
Risks to the Fiscal Plan | 45 |
Accounting Policy Changes | 50 |
Tables: | |
1.1 | Three Year Fiscal Plan | 5 |
1.2 | Fiscal Plan Update — Changes from Budget 2011 | 8 |
1.3 | Major Factors Underlying Revenue | 11 |
1.4 | Personal Income Tax Revenue | 11 |
1.5 | Corporate Income Tax Revenue | 12 |
1.6 | Sales Taxes Revenue | 12 |
1.7 | Federal Government Contributions | 14 |
1.8 | Revenue by Source | 16 |
1.9 | Expense by Ministry, Program and Agency | 17 |
1.10 | Health Per Capita Costs and Outcomes: Canadian Comparisons | 22 |
1.11 | Health Funding Plan | 23 |
1.12 | BC Post-secondary Annual Credentials Awarded and Student Satisfaction | 24 |
1.13 | High School Completion Rates for BC Students | 25 |
1.14 | Transition Rates from High School to Post-secondary Education | 26 |
1.15 | Justice System | 28 |
1.16 | Supports to Individuals and Families | 29 |
Budget and Fiscal Plan – 2012/13 to 2014/15
Table of Contents
1.17 | Capital Spending | 33 |
1.18 | Provincial Transportation Investments | 36 |
1.19 | Capital Expenditure Projects Greater Than $50 million | 40 |
1.20 | Provincial Debt Summary | 42 |
1.21 | Provincial Borrowing Requirements | 43 |
1.22 | Reconciliation of Summary Results to Provincial Debt Changes | 44 |
1.23 | Key Fiscal Sensitivities | 45 |
1.24 | Draw Down of the Contingencies Vote | 48 |
1.25 | Notional Allocations to Contingencies | 48 |
| |
Topic Boxes: | |
Release of Surplus Corporate Assets for Economic Generation | 51 |
Achieving Increased Efficiencies in the SUCH Sector | 52 |
The Justice System in British Columbia | 54 |
Community Living British Columbia | 55 |
| |
Part 2: | Tax Measures | |
Tax Measures — Supplementary Information | 57 |
Transition to Provincial Sales Tax | 64 |
| |
Tables: | |
2.1 Summary of Tax Measures | 56 |
| |
Topic Boxes: | |
Carbon Tax | 66 |
Return to PST | 69 |
PST Re-implementation Timeline | 75 |
| |
Part 3: | British Columbia Economic Review and Outlook | |
Summary | 77 |
British Columbia Economic Activity and Outlook | 78 |
The Labour Market | 78 |
Consumer Spending and Housing | 79 |
Business and Government | 81 |
External Trade and Commodity Markets | 81 |
Demographics | 84 |
Inflation | 84 |
Risks to the Economic Outlook | 84 |
External Outlook | 85 |
United States | 85 |
Canada | 88 |
Other economies | 90 |
Financial Markets | 91 |
Interest Rates | 91 |
Exchange Rate | 93 |
| | | |
Budget and Fiscal Plan – 2012/13 to 2014/15
iv
Table of Contents
Tables: | |
3.1 | British Columbia Economic Indicators | 78 |
3.2 | Ministry of Finance Economic Forecast: Key Economic Indicators | 78 |
3.3 | US real GDP forecast: Consensus vs Ministry of Finance | 88 |
3.4 | Canadian real GDP forecast: Consensus vs Ministry of Finance | 89 |
3.5 | Private Sector Canadian Interest Rate Forecasts | 92 |
3.6 | Private Sector Exchange Rate Forecasts | 93 |
3.7.1 | Gross Domestic Product: British Columbia | 94 |
3.7.2 | Components of Nominal Income and Expenditure | 95 |
3.7.3 | Labour Market Indicators | 95 |
3.7.4 | Major Economic Assumptions | 96 |
| |
Topic Boxes: | |
The Economic Forecast Council, 2012 | 97 |
Balance Sheet Recessions | 101 |
| |
Part 4: 2011/12 Revised Financial Forecast (Third Quarterly Report) | |
2011/12 Fiscal Year in Review | 107 |
Changes Since the Second Quarterly Report | 108 |
Contingencies | 110 |
Health Funding Report | 110 |
Capital Spending | 111 |
Provincial Debt | 112 |
Risks to the 2011/12 Outlook | 113 |
2011/12 Third Quarterly Report and Full Year Forecast Tables | 113 |
Tables: | |
4.1 | Budget 2011 and Quarterly Report Forecasts | 107 |
4.2 | 2011/12 Forecast Update | 109 |
4.3 | 2011/12 Notional Allocations to Contingencies | 110 |
4.4 | Health Funding Report | 110 |
4.5 | 2011/12 Capital Spending Update | 111 |
4.6 | 2011/12 Provincial Debt Update | 112 |
4.7 | 2011/12 Operating Statement | 113 |
4.8 | 2011/12 Revenue by Source | 114 |
4.9 | 2011/12 Expense by Ministry, Program and Agency | 115 |
4.10 | 2011/12 Expense by Function | 116 |
4.11 | 2011/12 Capital Spending | 117 |
4.12 | 2011/12 Provincial Debt | 118 |
4.13 | 2011/12 Statement of Financial Position | 119 |
| | |
Appendices | 121 |
Budget and Fiscal Plan – 2012/13 to 2014/15
v

| | February 21, 2012 |
As required by Section 7(d) of the Budget Transparency and Accountability Act (BTAA), and Section 4a(v) of the Carbon Tax Act, I confirm that Budget 2012 contains the following elements:
· The fiscal and economic forecasts for 2012/13 and the next two years — provided in Parts 1 and 3.
· Advice received from the Economic Forecast Council in November 2011 (updated January 2012), on the economic growth outlook for BC, including a range of forecasts for 2012 and 2013 (see Part 3, page 97).
· Material economic, demographic, fiscal, accounting policy and other assumptions and risks underlying Budget 2012 economic and fiscal forecasts, including:
· An economic forecast that reflects slower growth in 2012 but steady improvement thereafter for BC, recognizing the ongoing challenges that remain as Europe enters into a recession and economic recovery for the US continues to be sluggish. Accordingly, the economic projections assumed in Budget 2012 are more prudent relative to the average of the forecasts provided by the Economic Forecast Council.
· Forecast allowances of $200 million for 2012/13 increasing to $250 million and $350 million in the two outer years of the fiscal plan respectively are included to help achieve operating and debt level targets. The growing level of these allowances is intended to recognize the increased uncertainty in revenue forecasts, commodity prices and the global economic recovery for projections further out in the fiscal plan.
· The spending (expense) forecast in Budget 2012 assumes that average annual growth in operating expenses (excluding tax transfers) will not exceed 2.0 per cent over the three years of the fiscal plan. This constraint on spending continues with the direction established in Budget 2009 but requires ongoing monitoring if the legislative requirement to balance the provincial budget by 2013/14 is to be met.
· Budget 2012 includes an allocation of $300 million to the Contingencies (All Ministries) and New Programs Vote in 2012/13, and $250 million in each of the following two fiscal years. These allocations are based on a review of ministry pressures and government’s priorities.
· Revenue forecasts are based on the economic forecasts assumed in Budget 2012 and assume the reinstatement of the provincial sales tax (PST) on April 1, 2013. Further details on the mechanics of the return to PST, including transitional rules, are provided in a topic box included on page 69. Budget 2012 assumes the full repayment of $1.6 billion in federal HST transitional assistance over five years beginning March 2012.
· The natural gas price forecast included in Budget 2012 is based on an average of private forecasts (see Table A6, page 137). The fiscal plan assumes no incremental revenue from Liquefied Natural Gas (LNG) development in the province.
· Revenue to be realized on the sale of surplus corporate assets is dependent on a successful marketing program and completed sales.
· Budget 2012 includes $369 million in project reserves in the three year capital plan in order to cover risks from higher than expected costs and to fund emerging government priorities. Any major new capital projects will have the added oversight of cross government sourced project board members.
· Budget 2012 assumes that public sector collective agreements expiring before December 31, 2011, for which negotiations have not yet been concluded (primarily teachers bargaining through the BC Teachers’ Federation), will be settled consistent with the 2010 two-year, net zero compensation mandate set by Cabinet.
· For public sector collective agreements expiring on or after December 31, 2011, Budget 2012 assumes that no incremental funding will be provided for such negotiations. The 2012 Cooperative Gains Mandate approved by Cabinet requires that any negotiated increases in public sector compensation must be fully offset by identified savings in existing public sector budgets.
· Budget 2012 assumes three-year financial projections for health authorities, K—12 school districts and post-secondary institutions, as provided by the Ministries of Health, Education, and Advanced Education, based on plans submitted by those sectors in preparation of Budget 2012.
· British Columbia Hydro and Power Authority’s (BC Hydro) forecasts for 2011/12 to 2013/14, included in Budget 2012, reflect its Amended Revenue Requirements Application that is currently before the BC Utilities Commission (BCUC), with a decision expected in the fall of 2012. The forecast for 2014/15 is based on the assumed allowed return on deemed equity for that year.
· The Insurance Corporation of British Columbia (ICBC) forecast included in Budget 2012 is based on its BCUC approved interim Basic insurance rate, pending a final decision on its rate application expected in the summer of 2012. As well, government is conducting an internal review of ICBC operations which may impact ICBC projections and by extension, Basic insurance rate increases.
· The provincial support for British Columbia Ferry Services Inc. remains as defined in the existing contract.
· To the best of my knowledge, the three-year fiscal plan contained in Budget 2012 conforms to the standards and guidelines of generally accepted accounting principles (GAAP) for senior governments and with Public Sector Accounting Board (PSAB) guidelines. The adoption of International Financial Reporting Standards (IFRS) on January 1, 2011, by commercial Crown corporations is assumed in Budget 2012.
· Major areas of risk to the Budget 2012 fiscal plan are shown in Part 1 and the Appendix tables.
· Carbon tax reports for 2010/11 and 2011/12, and a carbon tax plan for 2012/13 to 2014/15 — see Carbon Tax topic box at the end of Part 2: Tax Measures (page 66).
· A health funding report for 2010/11 and 2011/12 and a plan that includes a forecast for health spending and the specific revenue sources fully dedicated to these purposes for 2012/13 to 2014/15, are provided on page 110 and page 23 respectively.
| 
|
| Peter Milburn |
| Deputy Minister and |
| Secretary to Treasury Board |
Ministry of | | Office of the | | Mailing Address: | | Location Address: |
Finance | | Deputy Minister | | PO Box 9417 Stn Prov Govt | | Room 109 |
| | | | Victoria BC V8W 9V1 | | 617 Government Street |
| | | | www.gov.bc.ca/fin | | Victoria BC |
Summary: BUDGET AND FISCAL PLAN — 2012/13 to 2014/15
| | Updated
Forecast | | Budget
Estimate | | Plan | | Plan | |
($ millions) | | 2011/12 | | 2012/13 | | 2013/14 | | 2014/15 | |
Revenue | | 41,945 | | 43,101 | | 44,603 | | 45,711 | |
Expense | | (44,392 | ) | (43,869 | ) | (44,199 | ) | (45,111 | ) |
Surplus (deficit) before forecast allowance | | (2,447 | ) | (768 | ) | 404 | | 600 | |
Forecast allowance | | (50 | ) | (200 | ) | (250 | ) | (350 | ) |
Surplus (deficit) | | (2,497 | ) | (968 | ) | 154 | | 250 | |
Capital spending: | | | | | | | | | |
Taxpayer-supported capital spending | | 3,997 | | 3,757 | | 3,477 | | 3,429 | |
Self-supported capital spending | | 3,144 | | 3,346 | | 2,553 | | 2,606 | |
| | 7,141 | | 7,103 | | 6,030 | | 6,035 | |
Provincial debt: | | | | | | | | | |
Taxpayer-supported debt | | 34,786 | | 38,736 | | 41,656 | | 43,702 | |
Self-supported debt | | 16,149 | | 18,667 | | 20,808 | | 22,302 | |
Total debt (including forecast allowance) | | 50,985 | | 57,603 | | 62,714 | | 66,354 | |
Taxpayer-supported debt-to-GDP ratio | | 16.4 | % | 17.6 | % | 18.2 | % | 18.3 | % |
| | 2011 | | 2012 | | 2013 | | 2014 | |
Economic Forecast: | | | | | | | | | |
Real GDP growth | | 2.0 | % | 1.8 | % | 2.2 | % | 2.5 | % |
Nominal GDP growth | | 4.3 | % | 3.7 | % | 4.1 | % | 4.4 | % |
Reinforcing Priorities
Budget 2012 confirms government’s ongoing commitment to its key fiscal plan objectives:
· protection of essential health care, education, and social services;
· a balanced budget by 2013/14; and
· a fiscally sustainable taxpayer-supported debt to GDP ratio that maintains a AAA credit rating.
In support of these priorities, government is continuing its management strategy of prudence and spending discipline.
Budget 2012 focuses on maintaining government services within existing budget allocations for most ministries, requiring them to continue to carefully manage priorities. Incremental funding has been provided to key core services, including healthcare, K-12 education, justice and social supports. Budget reallocations have been made through the drawdown of the Contingencies vote and from administrative efficiencies and reduced debt servicing costs.
Over the fiscal plan period, government will be redirecting over $1.0 billion to priority areas in ministries.
Balancing the Budget
Government projects it will be able to deliver on its commitment to return to balanced budgets by 2013/14. Average annual revenue growth of 2.9 per cent is consistent with the Ministry of Finance economic forecast, and reflects strengthening economic conditions and rising commodity prices over the next three years.
The revenue growth includes continuation of the small business corporate income tax rate at 2.5 per cent and a one percentage point increase in the general corporate income tax rate to 11 per cent in April 2014, to assist with achieving a balanced budget. Further revenue will be generated from a government initiative to identify surplus assets and release them for sale.
Emerging from the downturn
A cornerstone of government’s plan to balance the budget is management control of operating expenditures. Over the fiscal plan period, full realization of the efficiencies driven by government’s expenditure management strategies will result in an average annual growth rate of 2.0 per cent, enabling revenue growth to bridge the deficit gap by 2013/14.
Budget and Fiscal Plan – 2012/13 to 2014/15
1
Summary
Total spending also includes refundable tax credit transfers. These transfers previously were netted from revenue, but are now included as an expense due to an accounting policy change. Including these transfers, total spending will reach $45.1 billion by 2014/15.
BC’s Economy still Vulnerable
Following an estimated increase of 2.0 per cent in 2011, the Ministry of Finance forecasts British Columbia’s economy to grow by 1.8 per cent in 2012, 2.2 per cent in 2013 and 2.5 per cent per year in the medium term.
Ministry forecast more prudent than private sector
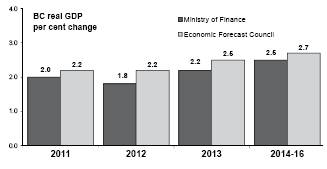
The Ministry’s outlook for BC’s real GDP growth is 0.4 percentage points lower in 2012 and 0.3 percentage points lower in 2013 than the outlook provided by the Economic Forecast Council. This level of prudence for both years acknowledges the significant downside risks to the forecast.
These downside risks, largely due to ongoing uncertainty around global economic activity, include:
· a return to recession in the US (characterized by weaker consumer spending, widespread deleveraging causing slower investment, a very slow job market recovery, continued weakness in the housing market and further fiscal restraint by federal, state and local governments);
· the sovereign debt crisis in Greece, Ireland and Portugal spreading to larger European economies like Italy and Spain, and threatening the stability of global financial markets as well as another global credit crisis;
· slower than anticipated Asian demand resulting in weaker demand for BC’s exports;
· exchange rate volatility; and
· further weakening of the US dollar, resulting in significant disruptions to global financial and commodity markets.
If one or more of these risks materialize in a significant way it may create pressures that cannot be accommodated in the fiscal plan.
Capital Spending
Taxpayer-supported infrastructure spending on hospitals, schools, post-secondary facilities, transit, and roads will total $10.7 billion over the fiscal plan period, and will be financed by $7.2 billion in borrowing with the remainder funded by third parties such as the federal government, and from internal cash flows.
Self-supported infrastructure spending on electrical generation, transmission and distribution projects, the Port Mann Bridge and other capital assets will total $8.5 billion over the fiscal plan period, and will be financed by $6.2 billion in borrowing, with the remainder funded internally.
Keeping Debt Affordable
Government’s borrowing requirement for the next three years totals $23.6 billion, and includes $1.6 billion for operating needs and $8.5 billion to retire maturing debt in addition to the capital borrowing outlined above. Overall, total provincial debt is projected to increase to $66.4 billion by 2014/15.
Due to the anticipated deficits, additional borrowing to support infrastructure spending, and lower GDP projections in the near term, the taxpayer-supported debt to GDP ratio will peak at 18.3 per cent in 2014/15.
Risks to the Fiscal Plan
The main risks to the government’s fiscal plan include:
· risks to the BC economic outlook, largely due to the continued uncertainty surrounding global economic activity;
· assumptions underlying revenue and Crown corporation forecasts, such as economic factors, commodity prices and weather conditions; and
· utilization rates for government services, such as health care, children and family services, and income assistance.
Budget and Fiscal Plan – 2012/13 to 2014/15
2
Summary
Government has three main levels of prudence in its projections to mitigate the risks to the fiscal plan, including:
· the lower Ministry outlook for BC’s real GDP growth relative to the outlook provided by the Economic Forecast Council;
· Contingencies of $300 million in 2012/13, and $250 million in each of 2013/14 and 2014/15 to help manage unexpected pressures and fund priority initiatives; and
· a forecast allowance of $200 million in 2012/13, increasing to $250 million in 2013/14 and $350 million in 2014/15 to guard against revenue volatility.
Conclusion
In summary, Budget 2012:
· maintains the core services of health care, education, and social services that British Columbians depend upon;
· augments priority program funding in the key areas of health, social services, and justice;
· delivers on government’s commitment to return to balanced budgets by 2013/14;
· continues government’s infrastructure program in support of government initiatives and to create jobs over the next three years;
· sets the stage for government to emerge from the economic downturn in a fiscally strong position.
Looking Beyond the Fiscal Plan
As the economy improves, by 2015/16 the government will emerge from the economic downturn in a fiscally strong position. This is due in large part to government’s continuing focus on management of operating costs to ensure effective use of resources.
Sustainable fiscal outlook provides flexibility
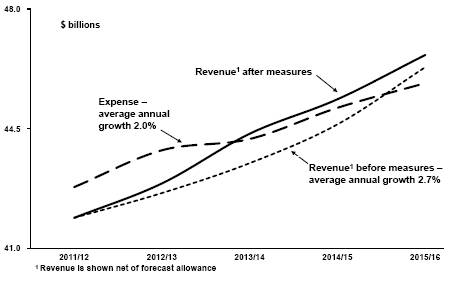
Since the fall of 2008, government’s average annual spending growth of 5.9 per cent has been reduced to a more sustainable average annual spending growth of 2.0 per cent.
Maintaining this spending discipline has enabled revenue to recover and eliminate the deficit, even at a relatively modest growth of 2.7 per cent when projected forward to 2015/16.
By 2015/16, the base revenue excluding the measures introduced in Budget 2012 will exceed expense projections. This will give government the flexibility to re-evaluate its revenue measures, including the provisional corporate income tax increase.
Government is also committed to stabilizing capital expenditures at a level that ensures existing infrastructure will be maintained in good operating condition. New infrastructure will be targeted towards meeting the needs of a growing British Columbia.
The combination of spending discipline, revenue growth and holistic capital planning will ensure that debt remains at fiscally sustainable levels, as is demonstrated by the debt to GDP ratio projections.
It is government’s ongoing commitment to these principles of fiscal stability that will enable it to continue to protect essential services, and ensure they are there for British Columbians to depend on in the future.
Fiscally sustainable debt
Budget and Fiscal Plan – 2012/13 to 2014/15
3
Part 1: THREE YEAR FISCAL PLAN
Table 1.1 Three Year Fiscal Plan
| | Updated
Forecast | | Budget
Estimate | | Plan | | Plan | |
($ millions) | | 2011/12 | | 2012/13 | | 2013/14 | | 2014/15 | |
Revenue | | 41,945 | | 43,101 | | 44,603 | | 45,711 | |
Expense | | (44,392 | ) | (43,869 | ) | (44,199 | ) | (45,111 | ) |
Surplus (deficit) before forecast allowance | | (2,447 | ) | (768 | ) | 404 | | 600 | |
Forecast allowance | | (50 | ) | (200 | ) | (250 | ) | (350 | ) |
Surplus (deficit) | | (2,497 | ) | (968 | ) | 154 | | 250 | |
Capital spending: | | | | | | | | | |
Taxpayer-supported capital spending | | 3,997 | | 3,757 | | 3,477 | | 3,429 | |
Self-supported capital spending | | 3,144 | | 3,346 | | 2,553 | | 2,606 | |
| | 7,141 | | 7,103 | | 6,030 | | 6,035 | |
Provincial Debt: | | | | | | | | | |
Taxpayer-supported debt | | 34,786 | | 38,736 | | 41,656 | | 43,702 | |
Self-supported debt | | 16,149 | | 18,667 | | 20,808 | | 22,302 | |
Total debt (including forecast allowance) | | 50,985 | | 57,603 | | 62,714 | | 66,354 | |
Taxpayer-supported debt-to-GDP ratio | | 16.4 | % | 17.6 | % | 18.2 | % | 18.3 | % |
| | 2011 | | 2012 | | 2013 | | 2014 | |
Economic Forecast: | | | | | | | | | |
Real GDP growth | | 2.0 | % | 1.8 | % | 2.2 | % | 2.5 | % |
Nominal GDP growth | | 4.3 | % | 3.7 | % | 4.1 | % | 4.4 | % |
Introduction
Budget 2012 continues government’s ongoing commitment to its key fiscal plan objectives:
· protection of essential healthcare, education, and social services;
· a balanced budget by 2013/14; and
· a fiscally sustainable taxpayer-supported debt to GDP ratio that maintains a AAA credit rating.
In support of these priorities, government is continuing its management strategy of prudence and spending discipline.
Budget 2012 focuses on maintaining government services within existing budget allocations for most ministries, requiring them to continue to carefully manage priorities. Incremental funding has been provided to key core services, including healthcare, K-12 education, justice and social supports.
In recognition of the funding pressures and challenges faced by caseload ministries, Budget 2012 provides additional funding to the Ministries of Justice and Social Development through the drawdown of the Contingencies vote and the reallocation of resources from reduced debt servicing costs and targeted administrative efficiencies.
Resources have also been reallocated to the Ministries of Health and Education to ensure that the high standards of healthcare and education outcomes for British Columbians are maintained. Over the fiscal plan period government will be redirecting over $1.0 billion to priority areas in ministries.
Budget and Fiscal Plan – 2012/13 to 2014/15
4
Three Year Fiscal Plan
Trough prudent expense management, Budget 2012 also supports the BC Jobs Plan and provides additional funding for community gaming grants, the operation and maintenance of heritage properties, and the new Auditor General for Local Government.
Government projects it will be able to deliver on its commitment to return to balanced budgets by 2013/14. Average annual revenue growth of 2.9 per cent is consistent with the Ministry of Finance economic forecast, and reflects strengthening economic conditions and rising commodity prices over the next three years.
The revenue growth includes the continuation of the small business corporate income tax rate at 2.5 per cent and a one percentage point increase in the corporate income tax rate to 11 per cent in April 2014, to assist with achieving a balanced budget by 2013/14. Further revenue will be generated from a government initiative to identify surplus assets and release them for sale. Further information on tax policy changes is provided in Part 2: Tax Measures; and, on the sale of surplus assets, in the Release of Surplus Corporate Assets for Economic Generation topic box on page 51.
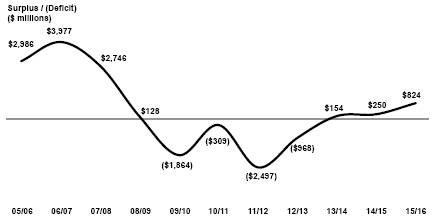
Chart 1.1 Bridging the deficit gap
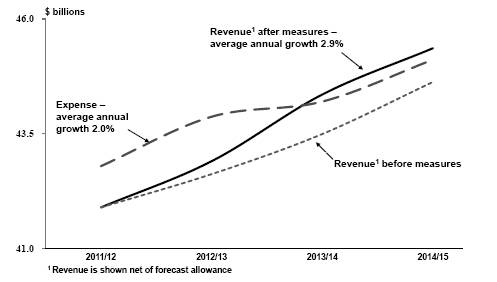
A cornerstone of government’s plan to balance the budget is management control of operating expenditures. Over the fiscal plan period, full realization of the efficiencies driven by government’s expenditure management strategies will result in an average annual growth rate of 2.0 per cent, enabling revenue growth to bridge the deficit gap by 2013/14.
Taxpayer-supported infrastructure spending on hospitals, schools, post-secondary facilities, transit, and roads will total $10.7 billion over the fiscal plan period, and will be financed by $7.2 billion in borrowing with the remainder funded by third parties such as the federal government, and from internal cash flows.
Self-supported infrastructure spending on electrical generation, transmission and distribution projects, the Port Mann Bridge and other capital assets will total $8.5 billion over the fiscal plan period, and will be financed by $6.2 billion in borrowing, with the remainder funded internally. More information on the three year capital spending plan is found on page 33.
Budget and Fiscal Plan – 2012/13 to 2014/15
6
Three Year Fiscal Plan
Government’s borrowing requirement for the next three years totals $23.6 billion, and includes $1.6 billion for operating needs and $8.5 billion to retire maturing debt in addition to the capital borrowing outlined above. Overall, total provincial debt is projected to increase to $66.4 billion by 2014/15. Additional information on the debt outlook is found starting on page 42.
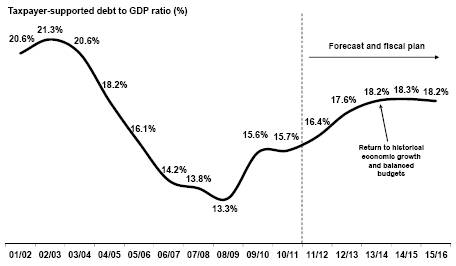
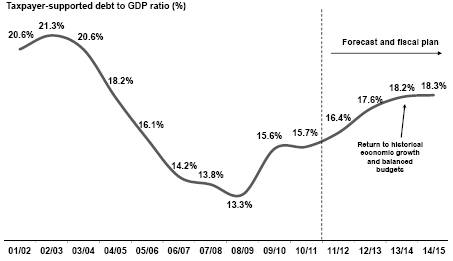
Due to the anticipated deficits, additional borrowing to support infrastructure spending, and lower GDP projections in the near term, the taxpayer-supported debt to GDP ratio will peak at 18.3 per cent in 2014/15. As government returns to balancing its budget and GDP growth returns to historical levels, government anticipates this measure of affordability will remain at fiscally sustainable levels that support a AAA credit rating.
Chart 1.2 Taxpayer-supported debt remains fiscally sustainable
The major risks to the fiscal plan stem from changes in factors that government does not directly control. These include:
· Risks to the BC economic outlook, largely due to the continued uncertainty surrounding global economic activity.
· Assumptions underlying revenue and Crown corporation forecasts such as economic factors, commodity prices and weather conditions.
· Utilization rates for government services such as healthcare, children and family services, and income assistance.
Government incorporates three main levels of prudence in its projections to mitigate the risks to the fiscal plan:
· A lower Ministry outlook for BC’s real GDP growth relative to the outlook provided by the Economic Forecast Council (0.4 percentage points lower in 2012 and 0.3 percentage points lower in 2013).
· Government has included a forecast allowance of $200 million in 2012/13, $250 million in 2013/14, and $350 million in 2014/15 to guard against revenue volatility.
Budget and Fiscal Plan – 2012/13 to 2014/15
7
Three Year Fiscal Plan
· The fiscal plan includes contingencies of $300 million in 2012/13, and $250 million in each of 2013/14 and 2014/15 to help manage unexpected pressures and fund priority initiatives.
A complete discussion of the risks to the fiscal plan can be found beginning on page 45. Economic risks are discussed in the introduction to Part 3: British Columbia Economic Review and Outlook.
Changes from Budget 2011 Fiscal Plan
Over the past year, the Budget 2011 fiscal plan (2011/12 to 2013/14) has deteriorated by $3.3 billion. Of this, $2.2 billion was due to the liability for repayment of the $1.6 billion HST transition funding plus the impacts of transitioning from an HST system to a PST/GST system by 2013/14, including $111 million in transition relief for the housing industry as follows:
· increasing the HST rebate threshold to $850,000 from $525,000 on the purchase of new homes intended as a primary residence;
· introducing a similar grant program for HST paid on new housing used as a second or recreational residence in certain geographical regions; and
· introducing a temporary tax credit for first time buyers of new homes.
Other tax relief being provided by government includes:
· introducing children’s fitness and children’s arts tax credits; and
· introducing a BC Seniors’ Home Renovation Tax Credit to assist seniors with the cost of renovations that provide increased independence, giving them the flexibility to remain in their homes longer.
Table 1.2 Fiscal Plan Update — Changes from Budget 2011
($ millions) | | 2011/12 | | 2012/13 | | 2013/14 | |
Budget 2011 Fiscal Plan | | (925 | ) | (440 | ) | 175 | |
Repayment of HST transition funding and revenue impacts of returning to PST | | (1,599 | ) | (7 | ) | (427 | ) |
Transition relief and other tax reductions | | (6 | ) | (145 | ) | (36 | ) |
Revenue losses | | (360 | ) | (609 | ) | (715 | ) |
Spending changes — net (increase) decrease | | 93 | | (198 | ) | 197 | |
Forecast allowance updates | | 300 | | 150 | | 100 | |
Fiscal plan before measures | | (2,497) | | (1,249 | ) | (706 | ) |
| | | | | | | |
Measures to balance the budget: | | | | | | | |
Corporate income tax measures: | | | | | | | |
Small business tax rate remains at 2.5 per cent | | — | | 281 | | 261 | |
General tax rate increased to 11.0 per cent | | — | | — | | 49 | |
Other tax measures | | — | | — | | 75 | |
Release of surplus assets | | — | | — | | 475 | |
Net changes | | — | | 281 | | 860 | |
Budget 2012 Fiscal Plan | | (2,497 | ) | (968 | ) | 154 | |
Budget and Fiscal Plan – 2012/13 to 2014/15
8
Three Year Fiscal Plan
Revenue projections deteriorated a further $1.7 billion due to the effects of slower economic growth, lower commodity prices and weaker commercial Crown corporation income.
Overall, spending from 2011/12 to 2013/14 is projected to increase by $92 million compared to the same period in the Budget 2011 fiscal plan. This slight increase reflects the reallocation of resources to priority program areas as well as between fiscal years. Further information on spending initiatives can be found starting on page 18.
Government also re-profiled its forecast allowance to reflect the increasing uncertainty in projecting future years’ revenue.
Measures to Balance the Budget
In support of balancing the budget by 2013/14, government initiated a number of strategies for bridging the deficit gap until the effects of strengthening economic growth provides sustainable improvements to government revenue (see Table 1.2).
These strategies include the following tax policy changes that are projected to generate $666 million in additional revenue:
· maintaining the small business corporate income tax rate at 2.5 per cent, previously assumed to decline to zero effective April 1, 2012;
· increasing the general corporate income tax rate to 11 per cent from 10 per cent, effective April 1, 2014, as a provisional measure; and
· increasing the tobacco tax rate effective April 1, 2013 to offset the reduction in tax due to the elimination of the HST.
As well, government intends to release surplus assets into the BC economy in order to generate revenue and help spur economic activity and development.
For further information on all the tax measures, including transitional relief, see Part 2: Tax Measures; for additional details on the release of surplus assets, see the topic box on page 51.
Revenue
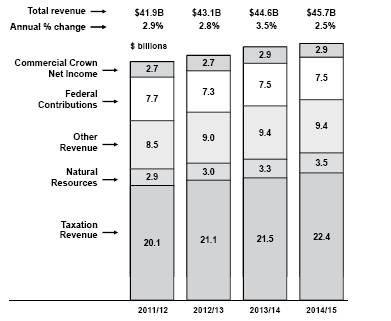
Total revenue is expected to average 2.9 per cent annual growth over the fiscal plan period (2012/13 to 2014/15). This reflects strengthening economic conditions and rising energy prices over the next three years.
Over the three years of the Budget 2012 fiscal plan, taxation revenue is expected to average 3.5 per cent annual growth, consistent with the Ministry of Finance economic forecast including projections for growth in nominal GDP, personal income, corporate profits, consumer expenditures and housing starts. The forecast also includes the effects of the return to the PST system. A variety of tax measures and initiatives are detailed in Part 2.
Budget and Fiscal Plan – 2012/13 to 2014/15
9
Three Year Fiscal Plan
Chart 1.3 Revenue trends

Growth in natural resource revenue is forecast to average 7.2 per cent over the next three years reflecting the relatively low base in 2011/12 and increases in commodity prices and markets, in particular for natural gas, lumber and electricity. Revenue growth from fees, investment earnings and other miscellaneous sources excluding the gain on the disposal of surplus assets is expected to average 2.6 per cent annually based on projected Medical Services Plan premium rate increases and forecasts provided by taxpayer-supported Crown and SUCH sector agencies.
Excluding the $580 million HST transition payment in 2011/12, federal government transfers are expected to average 1.9 per cent annual growth over the next three years as the scheduled end of stimulus and other one-time transfers partially offset standard growth in the Canada Health Transfer and Canada Social Transfer programs.
Commercial Crown net income is expected to average 1.8 per cent annual growth over three years, mainly reflecting improvements from the Insurance Corporation of British Columbia and the BC Lottery Corporation. More details on Crown corporation net income are provided below.
Chart 1.4 Revenue forecast
Budget and Fiscal Plan – 2012/13 to 2014/15
10
Three Year Fiscal Plan
Table 1.3 Major Factors Underlying Revenue
Calendar Year | | February 21, 2012 | | May 3, 2011 | |
Per cent growth unless otherwise indicated | | 2011 | | 2012 | | 2013 | | 2014 | | 2011 | | 2012 | | 2013 | | 2014 | |
Real GDP | | 2.0 | | 1.8 | | 2.2 | | 2.5 | | 2.0 | | 2.6 | | 2.7 | | 2.8 | |
Nominal GDP | | 4.3 | | 3.7 | | 4.1 | | 4.4 | | 4.1 | | 4.9 | | 4.8 | | 4.8 | |
Personal income | | 3.7 | | 3.7 | | 3.8 | | 4.0 | | 3.5 | | 4.5 | | 4.4 | | 4.4 | |
Corporate profits | | 10.6 | | 3.6 | | 4.3 | | 6.5 | | 8.6 | | 6.5 | | 6.8 | | 7.7 | |
Consumer expenditures | | 3.6 | | 4.3 | | 3.8 | | 4.6 | | 4.6 | | 5.0 | | 4.9 | | 4.8 | |
Consumer expenditures on durable goods | | 3.1 | | 1.7 | | 2.1 | | 2.1 | | 2.3 | | 2.5 | | 2.2 | | 2.3 | |
Business investment | | 3.8 | | 4.2 | | 5.9 | | 4.5 | | 3.9 | | 5.8 | | 5.5 | | 5.7 | |
Residential investment | | 4.9 | | 2.8 | | 4.7 | | 3.5 | | 3.7 | | 6.7 | | 5.2 | | 6.0 | |
Retail sales | | 1.8 | | 3.3 | | 3.5 | | 4.0 | | 4.1 | | 4.5 | | 4.4 | | 4.4 | |
Employment | | 0.8 | | 0.9 | | 1.4 | | 1.4 | | 1.4 | | 1.8 | | 1.7 | | 1.7 | |
BC Housing starts | | -0.3 | | -5.4 | | 4.2 | | 2.7 | | -5.8 | | 6.4 | | 2.3 | | 3.6 | |
US Housing starts | | 3.4 | | -4.4 | | 20.7 | | 14.3 | | 3.8 | | 31.1 | | 12.5 | | 11.1 | |
SPF 2x4 price ($US/thousand board feet) | | $ | 255 | | $ | 260 | | $ | 288 | | $ | 300 | | $ | 263 | | $ | 288 | | $ | 300 | | $ | 300 | |
Pulp ($US/tonne) | | $ | 961 | | $ | 838 | | $ | 800 | | $ | 800 | | $ | 888 | | $ | 738 | | $ | 700 | | $ | 700 | |
Exchange rate (US cents/Canadian dollar) | | 101.1 | | 96.6 | | 100.5 | | 99.6 | | 99.7 | | 100.5 | | 97.6 | | 97.6 | |
Fiscal Year | | 2011/12 | | 2012/13 | | 2013/14 | | 2014/15 | | 2011/12 | | 2012/13 | | 2013/14 | | 2014/15 | |
Natural gas price ($Cdn/GJ at plant inlet) | | $ | 2.32 | | $ | 2.52 | | $ | 3.04 | | $ | 3.56 | | $ | 3.02 | | $ | 3.60 | | $ | 4.20 | | $ | 4.85 | |
Bonus bids average bid price per hectare ($) | | $ | 1,167 | | $ | 1,200 | | $ | 1,200 | | $ | 1,000 | | $ | 500 | | $ | 550 | | $ | 575 | | $ | 600 | |
Electricity price ($US/mega-watt hour, Mid-C) | | $ | 30 | | $ | 32 | | $ | 37 | | $ | 41 | | $ | 37 | | $ | 43 | | $ | 46 | | $ | 49 | |
Metallurgical coal price ($US/tonne, fob west coast) | | $ | 257 | | $ | 218 | | $ | 219 | | $ | 212 | | $ | 224 | | $ | 218 | | $ | 212 | | $ | 205 | |
Copper price ($US/lb) | | $ | 3.78 | | $ | 3.68 | | $ | 3.74 | | $ | 3.31 | | $ | 3.65 | | $ | 3.40 | | $ | 3.04 | | $ | 2.73 | |
Crown harvest volumes (million cubic metres) | | 64.0 | | 65.0 | | 65.0 | | 66.0 | | 59.0 | | 60.0 | | 60.0 | | 62.0 | |
Major Revenue Sources
Key assumptions and sensitivities relating to revenue are provided in Appendix Table A5. The major revenue components are:
· Personal income tax — over the next three years, the revenue is forecast to average 5.7 per cent annual growth.
This is consistent with Budget 2012 projections of personal and labour incomes and includes the effect of reversing the basic personal amount tax credit enhancement introduced in 2010 with the implementation of HST.
Table 1.4 Personal Income Tax Revenue
($ millions) | | 2011/12 | | 2012/13 | | 2013/14 | | 2014/15 | |
Base personal income tax revenue | | 6,307 | | 6,594 | | 6,942 | | 7,323 | |
Measure: | | | | | | | | | |
– Reversal of basic personal amount tax credit enhancement | | — | | 36 | | 195 | | 206 | |
Prior-Year adjustment | | 63 | | — | | — | | — | |
Budget 2012 revenue | | 6,370 | | 6,630 | | 7,137 | | 7,529 | |
Annual growth | | 9.6 | % | 4.1 | % | 7.6 | % | 5.5 | % |
Personal income growth (calendar year) | | 3.7 | % | 3.7 | % | 3.8 | % | 4.0 | % |
Labour income growth (calendar year) | | 4.8 | % | 3.6 | % | 4.1 | % | 4.2 | % |
Elasticity(1) (calendar year bass, policy neutral) | | 1.0 | | 1.2 | | 1.4 | | 1.4 | |
(1) Per cent growth in current year tax relative to per cent growth in personal income.
Budget and Fiscal Plan – 2012/13 to 2014/15
11
Three Year Fiscal Plan
· Corporate income tax — revenue is recorded on a cash basis and annual changes reflect changes in payment share, instalments and adjustments for the prior year. Actual calendar-year entitlement before measures is forecast to rise in line with corporate profits. The revenue forecast incorporates the small business tax rate remaining at 2.5 per cent and a planned general corporate tax rate increase to 11 per cent from 10 per cent, effective April 1, 2014.
Table 1.5 Corporate Income Tax Revenue
($ millions) | | 2011/12 | | 2012/13 | | 2013/14 | | 2014/15 | |
Advance instalments from the federal government: | | | | | | | | | |
– Payment share | | 11.6 | % | 11.8 | % | 11.5 | % | 11.1 | % |
– Advances | | 1,883 | | 2,305 | | 2,184 | | 2,335 | |
International Business Activity Act refunds | | (25 | ) | (20 | ) | (20 | ) | (15 | ) |
Prior-year adjustment | | 157 | | (19 | ) | (122 | ) | (114 | ) |
Corporate income tax revenue | | 2,015 | | 2,266 | | 2,042 | | 2,206 | |
Annual per cent growth | | 0.6 | % | 12.5 | % | -9.9 | % | 8.0 | % |
· Sales taxes — over the next three years, sales taxes are expected to average 0.9 per cent annual growth as the effects of economic growth are partially offset by the impacts of returning to the provincial sales tax (PST) system. Sales tax revenues consist of HST, the tax on designated property, and the PST, which includes the former hotel room tax. HST revenue in 2012/13 includes the impact of increasing the HST rebate threshold to $850,000 from $525,000 on the purchase on new homes intended as a primary residence.
Table 1.6 Sales Taxes Revenue
($ millions) | | 2011/12 | | 2012/13 | | 2013/14 | | 2014/15 | |
Harmonized Sales Tax (BC’s portion of HST) | | | | | | | | | |
Gross | | 7,233 | | 7,527 | | — | | — | |
Temporary restrictions of input tax credits | | 139 | | 145 | | — | | — | |
Rebates | | (1,561 | ) | (1,669 | ) | — | | — | |
BC’s portion of HST | | 5,811 | | 6,003 | | — | | — | |
Social service tax | | 45 | | — | | 5,819 | | 6,011 | |
Tax on designated property | | 96 | | 98 | | 99 | | 101 | |
Annual per cent change (calendar year) | | 2011 | | 2012 | | 2013 | | 2014 | |
Consumer expenditure | | 3.6 | % | 4.3 | % | 3.8 | % | 4.6 | % |
Residential investment | | 4.9 | % | 2.8 | % | 4.7 | % | 3.5 | % |
Government expenditures | | 3.6 | % | 2.1 | % | 2.8 | % | 2.9 | % |
Nominal GDP | | 4.3 | % | 3.7 | % | 4.1 | % | 4.4 | % |
Retail sales | | 1.8 | % | 3.3 | % | 3.5 | % | 4.0 | % |
· Carbon tax — as announced in Budget 2008, the carbon tax rate per tonne of CO2-equivalent will increase by $5 each year to $30 per tonne by July 1, 2012. The forecast assumes that purchased volumes of natural gas will grow by 2.0 per cent annually, while consumption of gasoline is expected to remain constant. Revenue is expected to increase in line with these higher rates and assumed volume growth. Carbon tax revenue is fully returned to taxpayers through tax reductions. For more details on carbon tax recycling, see the Carbon Tax topic box on page 66.
Budget and Fiscal Plan – 2012/13 to 2014/15
12
Three Year Fiscal Plan
· Property tax — over the three year plan, revenue is expected to grow by an average of 4.2 per cent annually, in line with the outlook for BC housing starts and the inflation rate.
· Property transfer tax — consistent with the forecast for BC housing starts and trends in the housing market, annual revenue growth is forecast to average 0.6 per cent over the next three years. This reflects a 4.5 per cent decline in 2012/13 before averaging 3.3 per cent annual growth between 2012/13 and 2014/15.
· Natural gas royalties — over the next three years, revenue increases on average by 32 per cent annually due to rising natural gas prices and production volumes, partially offset by increasing production from wells qualifying for royalty programs and credits. In 2013/14, natural gas royalties are expected to increase by 64 per cent due to higher volumes, prices, and an increase in gross royalty rates, which reach their maximum when prices are above $3.00 CDN per gigajoule (at plant inlet).
Although prices are forecast to average 15 per cent annual growth over the next three years, they are expected to remain below the $4 level. Growth in production volumes is due in part to the effects of the royalty programs and an expected increase in demand and prices with an improving North American economy. See Appendix Table A6 for more details regarding natural gas price forecasts.
Chart 1.5 Revenue from energy, metals and minerals
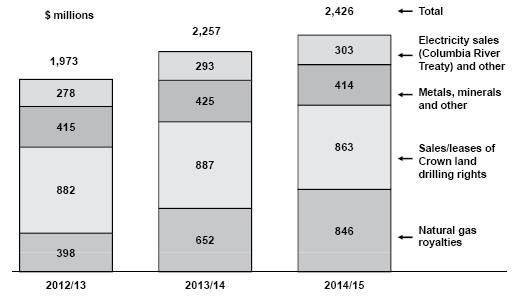
· Other energy, metals and minerals — average annual revenue growth from sales of Crown land tenures is forecast to decline 2.1 per cent over the three years due to the lower outlook for average bid prices per hectare. The revenue forecast from other energy, metals and minerals is relatively flat over the fiscal plan reflecting the outlook for electricity, coal and copper prices.
· Forests — revenue is forecast to increase $76 million or 16.6 per cent in 2012/13 mainly reflecting improving stumpage rates from very low levels in 2011/12. Over the next two years revenue is expected to increase $24 million and $49 million respectively, as increasing stumpage revenue is offset by declining border tax revenue collected under the Softwood Lumber Agreement (SLA). SLA border tax revenue is expected to decrease as the rate applied to US exports falls to 5 per cent from 10 per cent, consistent with the assumed recovery of lumber prices to US $300 per thousand feet.
Budget and Fiscal Plan – 2012/13 to 2014/15
13
Three Year Fiscal Plan
· Fees, licences and other miscellaneous sources — excluding the gain on the disposal of surplus assets, revenue is expected to average 1.7 per cent annual growth over the three year fiscal plan period reflecting projected increases to Medical Services Plan premium rates in support of rising healthcare expenditures and forecasts provided by taxpayer-supported agencies.
· Investment earnings — averaging 9.3 per cent annual growth over the three year fiscal plan period mainly due to rising earnings from fiscal agency loans. Earnings from fiscal agency loans have offsetting expenses resulting in no impact on the bottom line.
· Health and social transfers — Over the three years, revenue is expected to average 3.7 per cent annual growth reflecting national base growth and a rising BC population share. The forecast of Canada Health Transfer revenue in 2014/15 is based solely on per capita funding of the national base.
Table 1.7 Federal Government Contributions
($ millions) | | 2011/12 | | 2012/13 | | 2013/14 | | 2014/15 | |
Canada Health Transfer (CHT) | | 3,798 | | 4,051 | | 4,326 | | 4,289 | |
Wait Times Reduction Transfer | | 33 | | 33 | | 33 | | — | |
Deferred health equipment grants | | 23 | | 23 | | 22 | | 17 | |
Canada Social Transfer (CST) | | 1,519 | | 1,575 | | 1,627 | | 1,681 | |
Total health and social transfers | | 5,373 | | 5,682 | | 6,008 | | 5,987 | |
Other contributions | | 2,292 | | 1,575 | | 1,556 | | 1,511 | |
Total Federal Contributions | | 7,665 | | 7,257 | | 7,564 | | 7,498 | |
BC share of national population (June 1) | | 13.27 | % | 13.28 | % | 13.32 | % | 13.36 | % |
· Other federal contributions — excluding the $580 million HST transition payment in 2011/12, revenue falls $137 million or 8.0 per cent in 2012/13 primarily reflecting reduced funding for disaster financial assistance, vote recoveries (including the federal stimulus program) and transfers to taxpayer-supported service delivery agencies. Changes in vote recoveries do not affect the bottom line as expenses fall by the same amount. Over the next two years other federal contributions are expected to decline 1.2 per cent and 2.9 per cent respectively.
Commercial Crown Corporation Net Income
· British Columbia Hydro and Power Authority — BC Hydro’s net income is forecast to average $580 million annually over the fiscal plan period (2012/13 to 2014/15). BC Hydro’s projections reflect the utility’s amended Revenue Requirements Application (RRA), which is currently before the BC Utilities Commission (BCUC) with the commission’s decision expected in the Fall 2012. As the RRA ends with 2013/14, projections have been extended by one year based on BC Hydro’s current allowed return on deemed equity.
· British Columbia Liquor Distribution Branch — LDB’s liquor sales continue to be impacted by changes in consumer purchasing patterns that are affecting product mix and gross margins. As well, the reinstatement of the PST/GST system effective April 2013 will result in a downward adjustment to LDB margins that will have an ongoing impact on the sales revenue trend. As a result, total sales revenue is only expected to increase 1.3 per cent over the fiscal plan period.
Budget and Fiscal Plan – 2012/13 to 2014/15
14
Three Year Fiscal Plan
· British Columbia Lottery Corporation — BCLC’s net income is expected to grow by 12.4 per cent over the fiscal plan period reflecting moderate revenue growth in the lottery and casino/community gaming channels (5.7 per cent and 6.9 per cent respectively) and strong growth from e-Gaming (65.7 per cent). Revenue growth is mainly due to continuing product development (primarily in PlayNow internet gaming), distribution enhancements, and facility improvements to casinos and community gaming centres. As well, a return to the PST/GST system in 2013 will result in lower taxes paid by the corporation and an improvement to net income.
The government will distribute 20 per cent ($719 million) of its gaming income to charities and local governments over the next three years, reflecting a $15 million increase to charities in each year of the fiscal plan. As well, $441 million of the gaming income retained by government will be allocated to the Health Special Account in support of health services.
· Insurance Corporation of British Columbia — ICBC’s net income outlook is forecast at $146 million in 2012, $230 million in 2013 and $229 million in 2014. The outlook reflects an 11.2 per cent increase on Basic premiums and a 6 per cent decrease on Optional insurance, effective February 1, 2012 (the interim premium adjustments are subject to approval by the BCUC). The outlook also assumes average annual growth of 1.5 per cent in the number of insured vehicles and a 2.5 per cent average annual increase in claims costs. Over the fiscal plan period, ICBC is forecast to remit $497 million of its excess optional capital to the consolidated revenue fund to support core government services.
ICBC is in its second year of a multi-year $400 million Transformation Program that is designed to promote a fairer, customer-based risk pricing model, resulting in better rates for safer drivers; simplified systems and processes to facilitate better support for customers and business partners with less paperwork; and more efficient business practices. The Transformation Program, forecast to be complete in the fall of 2016, will be funded entirely from Optional insurance capital so as to not impact Basic insurance rates.
· Transportation Investment Corporation — TI Corp manages the construction of the new Port Mann Bridge, which is scheduled to open in December 2012. TI Corp’s projections in the fiscal plan reflect operating losses during the construction phase, changing to net income as tolls are introduced.
Budget and Fiscal Plan – 2012/13 to 2014/15
15
Three Year Fiscal Plan
Table 1.8 Revenue by Source
| | Updated | | Budget | | | | | |
| | Forecast | | Estimate | | Plan | | Plan | |
($ millions) | | 2011/12 | | 2012/13 | | 2013/14 | | 2014/15 | |
Taxation revenue | | | | | | | | | |
Personal income | | 6,370 | | 6,630 | | 7,137 | | 7,529 | |
Corporate income | | 2,015 | | 2,266 | | 2,042 | | 2,206 | |
Sales (1) | | 5,952 | | 6,101 | | 5,918 | | 6,112 | |
Fuel | | 939 | | 937 | | 946 | | 955 | |
Carbon | | 960 | | 1,172 | | 1,241 | | 1,261 | |
Tobacco | | 652 | | 652 | | 727 | | 727 | |
Property | | 1,925 | | 2,013 | | 2,094 | | 2,178 | |
Property transfer | | 935 | | 893 | | 928 | | 952 | |
Other (2) | | 407 | | 424 | | 434 | | 434 | |
| | 20,155 | | 21,088 | | 21,467 | | 22,354 | |
| | | | | | | | | |
Natural resource revenue | | | | | | | | | |
Natural gas royalties | | 367 | | 398 | | 652 | | 846 | |
Forests | | 457 | | 533 | | 557 | | 606 | |
Other resource (3) | | 2,048 | | 2,055 | | 2,102 | | 2,088 | |
| | 2,872 | | 2,986 | | 3,311 | | 3,540 | |
| | | | | | | | | |
Other revenue | | | | | | | | | |
Medical Services Plan premiums | | 1,915 | | 2,047 | | 2,158 | | 2,274 | |
Other fees (4) | | 2,803 | | 2,876 | | 2,867 | | 2,890 | |
Investment earnings | | 977 | | 1,083 | | 1,145 | | 1,274 | |
Miscellaneous (5) | | 2,845 | | 3,047 | | 2,765 | | 2,788 | |
Release of surplus assets | | — | | — | | 475 | | 231 | |
| | 8,540 | | 9,053 | | 9,410 | | 9,457 | |
| | | | | | | | | |
Contributions from the federal government | | | | | | | | | |
Health and social transfers | | 5,373 | | 5,682 | | 6,008 | | 5,987 | |
Harmonized sales tax transition payments | | 580 | | — | | — | | — | |
Other federal contributions (6) | | 1,712 | | 1,575 | | 1,556 | | 1,511 | |
| | 7,665 | | 7,257 | | 7,564 | | 7,498 | |
| | | | | | | | | |
Commercial Crown corporation net income | | | | | | | | | |
BC Hydro | | 595 | | 566 | | 599 | | 576 | |
Liquor Distribution Branch | | 899 | | 906 | | 844 | | 851 | |
BC Lotteries (net of payments to federal government) | | 1,068 | | 1,115 | | 1,190 | | 1,200 | |
ICBC (7) | | 140 | | 146 | | 230 | | 229 | |
Transportation Investment Corporation (Port Mann) | | (16 | ) | (48 | ) | (49 | ) | (28 | ) |
Other | | 27 | | 32 | | 37 | | 34 | |
| | 2,713 | | 2,717 | | 2,851 | | 2,862 | |
Total revenue | | 41,945 | | 43,101 | | 44,603 | | 45,711 | |
(1) Includes harmonized sales tax, provincial sales tax, tax on designated property and HST/PST housing transition tax.
(2) Corporation capital and insurance premium taxes.
(3) Columbia River Treaty, other energy and minerals, water rental and other resources.
(4) Post-secondary, healthcare-related, motor vehicle, and other fees.
(5) Includes reimbursements for healthcare and other services provided to external agencies, and other recoveries.
(6) Includes contributions for health, education, community development, housing and social service programs, and transportation projects.
(7) The amounts represent projected earnings on ICBC’s fiscal year basis (December).
Budget and Fiscal Plan – 2012/13 to 2014/15
16
Three Year Fiscal Plan
Table 1.9 Expense by Ministry, Program and Agency
| | Updated | | Budget | | | | | |
| | Forecast | | Estimate | | Plan | | Plan | |
($ millions) | | 2011/12 (1) | | 2012/13 | | 2013/14 | | 2014/15 | |
Office of the Premier | | 9 | | 9 | | 9 | | 9 | |
Aboriginal Relations and Reconciliation | | 80 | | 80 | | 81 | | 82 | |
Advanced Education | | 1,963 | | 1,972 | | 1,952 | | 1,922 | |
Agriculture | | 66 | | 66 | | 66 | | 66 | |
Children and Family Development | | 1,331 | | 1,333 | | 1,333 | | 1,333 | |
Community, Sport and Cultural Development | | 254 | | 311 | | 172 | | 211 | |
Education | | 5,242 | | 5,315 | | 5,321 | | 5,342 | |
Energy and Mines | | 437 | | 439 | | 421 | | 421 | |
Environment | | 130 | | 129 | | 129 | | 129 | |
Finance | | 175 | | 173 | | 161 | | 161 | |
Forests, Lands and Natural Resource Operations | | 590 | | 602 | | 555 | | 592 | |
Health | | 15,622 | | 16,180 | | 16,785 | | 17,281 | |
Jobs, Tourism and Innovation | | 238 | | 235 | | 235 | | 235 | |
Justice | | 1,106 | | 1,110 | | 1,123 | | 1,126 | |
Labour, Citizens’ Services and Open Government | | 543 | | 549 | | 544 | | 553 | |
Social Development | | 2,338 | | 2,457 | | 2,498 | | 2,505 | |
Transportation and Infrastructure | | 807 | | 807 | | 807 | | 807 | |
Total ministries and Office of the Premier | | 30,931 | | 31,767 | | 32,192 | | 32,775 | |
Management of public funds and debt | | 1,265 | | 1,287 | | 1,346 | | 1,398 | |
Contingencies | | 603 | | 300 | | 250 | | 250 | |
Funding for capital expenditures | | 1,306 | | 1,062 | | 970 | | 1,044 | |
Refundable tax credit transfers | | 957 | | 1,091 | | 748 | | 764 | |
Legislative and other appropriations | | 121 | | 124 | | 129 | | 126 | |
Subtotal | | 35,183 | | 35,631 | | 35,635 | | 36,357 | |
Liability for reimbursement of HST transition funding | | 1,599 | | — | | — | | — | |
Prior year liability adjustments | | (24 | ) | — | | — | | — | |
Consolidated revenue fund expense | | 36,758 | | 35,631 | | 35,635 | | 36,357 | |
Expenses recovered from external entities | | 2,777 | | 2,756 | | 2,792 | | 2,843 | |
Funding provided to service delivery agencies | | (21,267 | ) | (21,127 | ) | (21,454 | ) | (21,834 | ) |
Ministry and special office direct program spending | | 18,268 | | 17,260 | | 16,973 | | 17,366 | |
Service delivery agency expense: | | | | | | | | | |
School districts | | 5,532 | | 5,569 | | 5,601 | | 5,641 | |
Universities | | 3,909 | | 4,050 | | 4,089 | | 4,111 | |
Colleges and institutes | | 1,097 | | 1,095 | | 1,100 | | 1,107 | |
Health authorities and hospital societies | | 12,092 | | 12,431 | | 12,835 | | 13,139 | |
Other service delivery agencies | | 3,494 | | 3,464 | | 3,601 | | 3,747 | |
Total service delivery agency expense | | 26,124 | | 26,609 | | 27,226 | | 27,745 | |
Total expense | | 44,392 | | 43,869 | | 44,199 | | 45,111 | |
(1) Restated to reflect government’s current organization and accounting policies.
Budget and Fiscal Plan – 2012/13 to 2014/15
17
Three Year Fiscal Plan
Expense
Budget 2012 continues government’s commitment to maintaining the core services of healthcare, education, and social support that British Columbians depend upon. In support of these priorities, government is continuing its management strategy of prudence and spending discipline.
Budget 2012 focuses on maintaining government services within existing budget allocations, requiring ministries to continue to carefully manage priorities, and provides incremental funding to key core services, including healthcare, education, justice and social supports, through the drawdown of the Contingencies vote and the reallocation of resources from administrative efficiencies and reduced debt servicing costs.
Over the fiscal plan period, government will be redirecting over $1.0 billion to priority areas in ministries.
As a result of the expenditure management measures that were initiated after the economic downturn in the fall of 2008, government average annual spending growth of 5.9 per cent during the period leading up to the downturn was reduced to an average annual spending growth of 3.0 per cent from 2009/10 to 2011/12.
Chart 1.6 Expense trends (excluding refundable tax credit transfers) (1)

Budget 2012 continues to bend the spending curve downward by maintaining the Budget 2011 spending track of 2.0 per cent average annual spending growth. This rate of expense growth will still enable government to increase its program spending by $2.5 billion over the fiscal plan period (from $41.8 billion in 2011/12 to $44.3 billion by 2014/15, excluding refundable tax credit transfers).
Total spending also includes refundable tax credit transfers. These transfers previously were netted from revenue, but are now included as an expense due to an accounting policy change (see page 50). Including these transfers, total spending will reach $45.1 billion by 2014/15.
Budget and Fiscal Plan – 2012/13 to 2014/15
18
Three Year Fiscal Plan
Consolidated Revenue Fund Spending
Budget 2012 requires most ministries to continue providing general government services from within existing budget allocations, requiring them to carefully manage priorities. Potential funding pressures, such as the Public Sector Compensation Mandate, are being managed within existing budgets through productivity increases, efficiencies and savings.
Budget 2012 maintains government’s commitment to priority services by providing additional funding to healthcare, K-12 education, justice and social services through the drawdown of the Contingencies vote, the reallocation of resources from reduced debt servicing costs and other savings from targeted restraint and efficiency measures.
Creating Jobs and Sustaining Communities: The BC Jobs Plan and Other Measures
BC Jobs Plan
There are several initiatives underway, led mainly by the Ministry of Jobs, Tourism and Innovation, to fulfill the commitments made in Canada Starts Here: The BC Jobs Plan released in September 2011. Many of these are funded by reallocations from within the Ministry of Jobs, Tourism and Innovation, but Contingencies funding may be accessed for certain targeted programs. Initiatives include:
· Major Investments Office: This new entity will work with potential investors, ministries, and other public agencies to identify and propose solutions to barriers that may be impeding specific economic investment opportunities.
· Jobs and Investment Board: This new board, which replaces the Progress Board, will be comprised of appointed members who provide government with recommendations on how to attract investment and increase economic development.
· Aboriginal Business and Investment Council: Members of the council will be appointed to advise government, First Nations, and the business community on improvements that can be undertaken to improve aboriginal participation in the BC economy.
· Doubling the International Trade Presence: BC currently has 49 staff/contractors located in nine locations around the world. The Plan will expand this presence by a factor of two, in both existing and new locations, with an initial focus on key overseas markets. The key objectives are two-fold – identify more customers for BC products and encourage overseas investors to create or expand operations in BC.
· Growing our International Student Presence: Foreign students create a significant source of economic activity and add to the vibrancy of many communities across the province. British Columbians studying in foreign countries learn important information about how to work and live in those countries. The Ministry of Advanced Education is developing an international strategy to increase the number of foreign students in BC. This will include using BC’s overseas trade offices to help connect international students to BC’s educational opportunities.
Auditor General for Local Government
The new Auditor General for Local Government (AGLG) will be established as an office reporting through an independent Audit Council, with members selected for their relevant backgrounds and expertise. The AGLG will undertake “value for money” audits
Budget and Fiscal Plan – 2012/13 to 2014/15
19
Three Year Fiscal Plan
of the operations of local governments. This supports local governments and taxpayers by strengthening accountability, providing relevant new information, and making recommendations that support increased efficiency and effectiveness. Budget 2012 establishes an annual budget of $2.6 million for the AGLG.
Community Gaming Grants
Consistent with the feedback from the public consultation process undertaken by the government in the summer of 2011, the allocation for community gaming grants has been increased. The budgeted amount, fully recovered from gaming revenues, has risen from $120 million to $135 million annually in Budget 2012. This funding will re-institute eligibility for adult arts and sports organizations, and environmental and animal welfare groups, as well as increase funding for other charitable organizations.
Maintaining our Heritage Properties
Budget 2012 provides $21 million over three years for the maintenance and operation of provincial heritage property sites – these are significant regional tourism attractions that play a valuable local economic, educational and cultural role. Funding directed towards Barkerville Historic Town, Fort Steele Town and other provincially owned heritage sites will preserve existing assets and provide for their ongoing operations. Annually, approximately 200,000 British Columbians and other tourists visit and enjoy these heritage assets while learning about the province’s colorful history.
Re-profiling Grants/Payments to Communities and Others
In uncertain economic times, the fiscal challenges faced by governments require innovative solutions. For both the BC government and entities dependent on provincial funding, the current world economic volatility causes significant revenue uncertainty, which could reduce budget flexibility over the medium term as the government returns to balancing its budget in 2013/14.
Therefore, the province intends to re-profile $133 million of discretionary grants to external entities, including local governments and agencies, in 2011/12 and 2012/13 in order to increase financial certainty for recipients. As well, $10 million in additional silviculture, inventory, and forest and ecosystem health/restoration activities will be undertaken in 2012/13 by the Ministry of Forests, Lands and Natural Resource Operations to mitigate a one year reduction of $30 million in funding for similar activities in 2013/14.
Effective Management in the SUCH Sector with Limited Resources
The majority of the spending by the Ministries of Health, Education, and Advanced Education is devoted to funding their SUCH sector agencies (schools, universities, colleges, and health organizations). These organizations provide most of the services accounted for in the provincial budget under the broad categories of health and education.
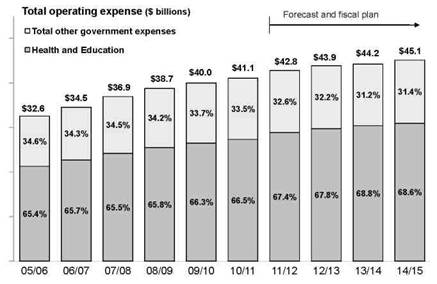
As shown in Chart 1.7 currently government’s expenditures on these important services comprise over two-thirds of all expenditures, and this proportion is rising.
Budget and Fiscal Plan – 2012/13 to 2014/15
20
Three Year Fiscal Plan
Chart 1.7 Health, K—12 and post-secondary education as a percentage of total government expenses
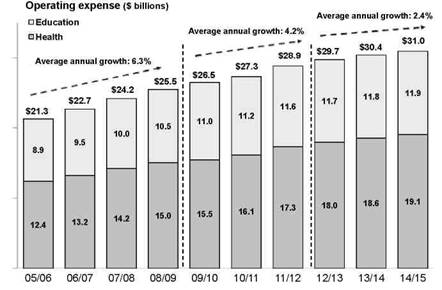
Since the onset of the world-wide economic crisis in 2008, BC has implemented an expenditure management program that has slowed the rate of growth of overall spending, including within the health and education sectors. This is demonstrated in Chart 1.8 — the growth rate for these sectors has been moderating significantly since 2008/09, and is projected in the current fiscal plan to continue to do so.
Chart 1.8 Expenditure growth trends for the SUCH sector
While the quantum of spending is often highlighted, success of these key government programs is best measured by performance outcomes. For some programming (such as healthcare), budget increases are needed to keep up with rapid population growth and fundamental demographic changes; however, improved outcomes can also be generated by simply using existing resources more efficiently (see the Achieving Increased Efficiencies in the SUCH Sector topic box on page 52).
Budget and Fiscal Plan – 2012/13 to 2014/15
21
Three Year Fiscal Plan
In general for the SUCH sector, a survey of the most recent available data demonstrates either positive results compared with other jurisdictions (for health) or improved results over time (for education). This indicates that our SUCH sector agencies are on a relatively strong footing to continue to produce quality results in the face of “flattening” expenditure profiles, more recently and moving forward.
Healthcare — Striving for Affordability and Maintaining Positive Outcomes
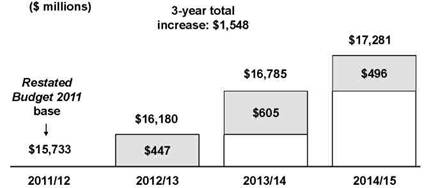
Incremental to the current 2011/12 base budget for the Ministry of Health of $15,733 million, the ministry’s annual budget is projected to increase by a further $1,548 million by 2014/15. In addition to the funding added in last year’s fiscal plan, this latter amount includes new funding of $496 million in 2014/15, as shown in Chart 1.9.
Chart 1.9 Ministry of Health budget increases
Notwithstanding the short term fiscal challenges in BC, given the mounting demographic pressures that are driving expenditures, it is imperative that costs be brought under control for the benefit of future generations. Even with a more modest increase in 2014/15, BC healthcare spending is still projected to reach 42.2 per cent of overall government spending by that year.
By focusing on identifying additional best practices in delivering care, as well as finding administrative savings, it is possible to manage expenditures while at the same time delivering results that compare favorably with other jurisdictions. As was the case last year when health outcomes were first reported in Budget 2011, the updated information reported in Table 1.10 shows that not only does BC continue to have the second lowest per capita costs of all the provinces, but our results continue to be at the forefront.
Table 1.10 Health Per Capita Costs and Outcomes: Canadian Comparisons
| | 2011 Per | | Life | | Infant Mortality | | Cancer Mortality Rate | | Diseases of the Heart |
| | Capita Health | | Expectancy at | | per 1000 Live | | per 100,000 | | Mortality Rate per |
Province | | Care Costs ($) | | Birth (Years) | | Births | | Population | | 100,000 Population |
Quebec | | 3,407 | | 81.0 | | 4.3 | | 179.9 | | 98.8 |
British Columbia | | 3,604 | | 81.4 | | 3.7 | | 147.4 | | 104.0 |
Ontario | | 3,645 | | 81.3 | | 5.3 | | 157.7 | | 105.5 |
Nova Scotia | | 3,972 | | 79.9 | | 3.5 | | 183.6 | | 114.4 |
New Brunswick | | 4,033 | | 80.2 | | 3.2 | | 178.1 | | 111.4 |
Prince Edward Island | | 4,058 | | 80.2 | | 2.0 | | 170.6 | | 127.5 |
Manitoba | | 4,266 | | 79.5 | | 6.5 | | 167.5 | | 128.2 |
Saskatchewan | | 4,348 | | 79.5 | | 6.2 | | 159.0 | | 127.4 |
Alberta | | 4,528 | | 80.6 | | 6.2 | | 153.1 | | 123.7 |
Newfoundland | | 5,077 | | 78.5 | | 5.1 | | 182.2 | | 143.7 |
Sources: Canadian Institute for Health Information (cost data) and Statistics Canada (outcomes data).
Budget and Fiscal Plan – 2012/13 to 2014/15
22
Three Year Fiscal Plan
More specifically, BC continues to rank best in Life Expectancy and Cancer Mortality, and is second best in terms of Mortality related to Diseases of the Heart. While this more recent data shows BC 4th best for Infant Mortality, the actual rate has improved since last year’s report from 4.0 per 1,000 Live Births down to 3.7.
Health Funding Plan
As required under Part 14 of the Consumption Tax Rebate and Transition Act the following table shows the health funding for 2012/13 to 2014/15.
Table 1.11 Health Funding Plan
($ millions) | | 2012/13 | | 2013/14 | | 2014/15 | |
Harmonized sales tax | | 6,003 | | — | | — | |
Medical Services Plan premiums | | 2,047 | | 2,158 | | 2,274 | |
Tobacco tax | | 652 | | 727 | | 727 | |
Health Special Account | | 147 | | 147 | | 147 | |
Canada Health Transfer | | 4,051 | | 4,326 | | 4,289 | |
Wait Times Reduction Transfer | | 33 | | 33 | | — | |
Total revenue from above sources | | 12,933 | | 7,391 | | 7,437 | |
Total government spending on health | | 17,970 | | 18,564 | | 19,047 | |
Health spending in excess of revenue | | 5,037 | | 11,173 | | 11,610 | |
The Act does not specify a provincial sales tax as a source of health funding; therefore, the table reflects funding from the HST. If PST were included, the health spending in excess of revenue would be $5,368 million in 2013/14 and $5,613 million in 2014/15. The Health Funding Report for 2010/11 and 2011/12 is found in Part 4 on page 110.
Post-secondary Education — Improved Results and Finding Efficiencies
After significant annual increases earlier in the last decade, spending by post-secondary institutions (PSIs) has been growing at a much less rapid pace in recent years. In fact the portion of post-secondary expenditures that is funded directly through transfers from the Ministry of Advanced Education has been essentially constant since 2009/10. Nonetheless, the most recent data indicates that the province’s 25 PSIs are continuing to offer high quality programming to British Columbians seeking higher education. In other words, the sector is demonstrating the ability to use the more limited funding while still delivering beneficial results.
Table 1.12 shows two clear trends worthy of note:
· The number of “credentials” (degrees, diplomas, etc.) awarded in BC has been increasing each year since at least 2004, for both university and other post-secondary programs; and
· Student satisfaction, as measured by rigorous surveys of thousands of graduates through the student outcomes surveys, is continually in the 93 per cent to 97 per cent range for both degree and career program offerings.
Budget and Fiscal Plan – 2012/13 to 2014/15
23
Three Year Fiscal Plan
Table 1.12 BC Post-secondary Annual Credentials Awarded and Student Satisfaction
| | | | | | | | Diploma and | | |
| | Graduate and | | Diplomas, | | Bachelors Degree | | Certificate Graduates: | | Apprenticeship |
| | Undergraduate | | Certificates and | | Graduates: Satisifed | | Satisifed or Very | | Students: Satisifed |
| | Degrees | | Other | | or Very Satisfied | | Satisfied | | or Very Satisfied |
2004 | | 23,585 | | 25,735 | | 97% | | 96% | | n/a |
2005 | | 23,985 | | 25,615 | | 97% | | 96% | | 95% |
2006 | | 25,495 | | 26,045 | | 96% | | 95% | | 93% |
2007 | | 25,705 | | 26,110 | | 96% | | 96% | | 93% |
2008 | | 26,175 | | 26,220 | | 95% | | 95% | | 94% |
2009 | | 26,930 | | 26,410 | | 94% | | 94% | | 93% |
2010 | | n/a | | n/a | | 95% | | 95% | | 95% |
Sources: Ministry of Advanced Education; Student Satisfaction from 2010 Student Outcomes Survey.
Note: “Credentials” includes university degrees, college/institute diplomas, trades accreditations, and developmental certificates (e.g. ESL).
Likely the most important outcome for students graduating from BC’s post-secondary institutions is success in finding employment. Chart 1.10 shows that the unemployment rates in recent years for those subsets of the population holding career diploma, apprenticeship, or university degree accreditation is consistently lower over time when compared to those aged 18-29 who only have Grade 12 or less. Clearly, the public PSIs are instrumental in improving the chances that British Columbians obtain employment, regardless of the prevailing economic situation at the time.
Chart 1.10 BC unemployment rates by credential type
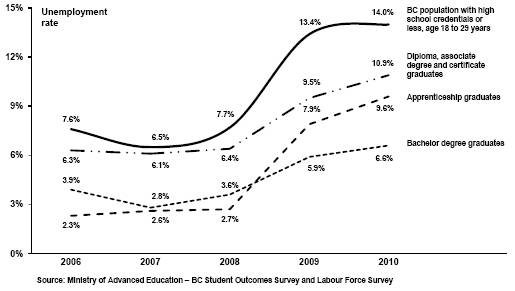
Meeting the commitment to achieve a balanced budget during tight fiscal times requires many difficult choices. Government is therefore challenging the public post-secondary sector to reduce its administrative (i.e. travel, executive overhead, support services, etc.) and any other expenditures not related to direct program delivery by a total of $20 million in 2013/14 and by $50 million in 2014/15.
Note that spending by the PSI’s in BC is over $5 billion annually; therefore $50 million represents less than 1 per cent of the total annual costs of the sector. That said, difficult decisions must be made and a thoughtful process must be established to achieve these savings.
Budget and Fiscal Plan – 2012/13 to 2014/15
24
Three Year Fiscal Plan
As discussed in the Achieving Increased Efficiencies in the SUCH Sector topic box, both the Health and K—12 sectors have undergone or are undergoing similar cost-savings exercises. Given that the projected savings outlined in Budget 2012 do not begin to take effect until 2013/14, the sector has a full year to plan and the Ministry of Advanced Education will work closely with the public PSIs to achieve these targets with the objective of protecting program quality.
Given the performance of the PSIs as demonstrated by the strong results noted above, government believes they are well-positioned to achieve these savings while maintaining the high standards to which British Columbians have become accustomed.
K—12 Education — Strong Performance with Continued Stable Funding
Despite continuing declining enrolment, block funding to school districts remains unchanged from Budget 2011, at $4.7 billion annually through to 2014/15. Similarly, the annual facilities grant to fund maintenance of schools, through a combination of operating and capital funding, again totals $110 million in 2012/13.
However, there is some increase in the Ministry of Education’s budget over the fiscal plan period, mainly due to the addition in Budget 2012 of $165 million over three years for the establishment of the Learning Improvement Fund. This fund is being established as part of the response to the issues surrounding the Bill 28 court ruling in the spring of 2011. Consultations with the BC Teachers Federation regarding how to address those issues occurred during the past summer and fall, and government announced this fund in October 2011. These new resources will target vulnerable learners and challenges regarding class composition in those classrooms with the highest needs.
Although funding for the school system has been stable over the last several years, the available data exhibits favorable trends in recent K—12 performance. For example, a key indicator of success is the proportion of students achieving high school completion within 6 years of entering grade eight. The data show that the high school completion rate for all students in public schools (of which there were 477,000 in 2011/12) surpassed 80 per cent in 2010/11, and when students attending independent schools (almost 59,000 in 2011/12), are included the completion rate is only a slightly higher 81 per cent. (Note that most independent schools also receive a portion of their funding from the Ministry of Education.)
However, the data in Table 1.13 clearly points out that the most striking improvement in completion rates has been for aboriginal students in BC. In 2001/02, the rate was almost 43 per cent, and after a decade, it has risen to approximately 54 per cent.
Table 1.13 High School Completion Rates for BC Students
| | Public Schools Only | | Public and Independent Schools | |
| | All Students | | Aboriginal Students | | All Students | | Aboriginal Students | |
2001/02 | | 76.5 | % | 42.5 | % | 77.4 | % | 42.6 | % |
2002/03 | | 78.5 | % | 46.1 | % | 79.1 | % | 45.9 | % |
2003/04 | | 78.9 | % | 46.8 | % | 79.6 | % | 46.6 | % |
2004/05 | | 79.1 | % | 48.6 | % | 79.7 | % | 48.0 | % |
2005/06 | | 79.4 | % | 48.3 | % | 80.2 | % | 47.7 | % |
2006/07 | | 79.4 | % | 47.6 | % | 80.1 | % | 47.3 | % |
2007/08 | | 77.9 | % | 47.0 | % | 78.8 | % | 46.9 | % |
2008/09 | | 78.3 | % | 49.0 | % | 79.2 | % | 48.8 | % |
2009/10 | | 79.0 | % | 50.9 | % | 79.7 | % | 50.4 | % |
2010/11 | | 80.3 | % | 54.1 | % | 81.0 | % | 53.7 | % |
Source: Ministry of Education
Budget and Fiscal Plan – 2012/13 to 2014/15
25
Three Year Fiscal Plan
According to information that the Ministry of Education has collected from school districts, it is generally a combination of factors that contributes to increases in the completion rates. Districts that have seen improvements tend to share some of the following characteristics:
· they connect with each student;
· they make excellent use of data to inform progress; and
· they take an inquiry-driven approach to learning and/or school improvement.
Specific strategies employed by the school districts exhibiting the most improvement tend to include:
· special attention to early learning with clearly defined targets and measures for each student;
· a clear focus on keeping students in school (e.g. providing as many electives as possible through technology, if not possible in other ways);
· enhancing school-family connections;
· lowering the turnover rate for school administration teams;
· appropriate support for special education for those students who face special challenges; and
· for First Nations learners, offering curriculum that is more relevant to that group from a cultural standpoint.
In reality, while there are good practices that are consistent across improving districts, the specific individual circumstances of schools and school districts also have an impact. For example, some areas of the province are characterized by very transient populations which will generally place downward pressure on the completion rate.
An important function of our school system is to prepare the next generation for further education and career training at post-secondary institutions, be they universities, colleges, or other training institutes. A relevant measure of how well students are prepared for this “next level” of learning is the rate at which high school graduates “transition” into post-secondary education. Upon leaving high school, many students will postpone further educational training for a variety of reasons; so measuring how many Grade 12 graduates immediately enter post-secondary institutions, while relevant, portrays a less than complete picture.
Table 1.14 Transition Rates from High School to Post-secondary Education
Year of High School | | Immediate Entry to Post- | | Two-year Delay of Entry to Post- | |
Graduation | | Secondary Education | | Secondary Education* | |
2001/02 | | 50.9 | % | 67.3 | % |
2002/03 | | 51.2 | % | 67.2 | % |
2003/04 | | 49.9 | % | 65.3 | % |
2004/05 | | 50.2 | % | 65.9 | % |
2005/06 | | 50.9 | % | 66.8 | % |
2006/07 | | 51.7 | % | 67.8 | % |
2007/08 | | 52.4 | % | 68.8 | % |
2008/09 | | 53.6 | % | 70.0 | % |
Source: Ministry of Advanced Education — Student Transitions Project, June 2011.
Note: The percentages for last 2 years of the delayed entry stream are estimates based on the most recent actual data.
Budget and Fiscal Plan – 2012/13 to 2014/15
26
Three Year Fiscal Plan
Table 1.14 shows the rate of transition from high school for students undertaking post-secondary education/training both immediately after graduation and two years after graduation. The key conclusions are that while the rates of transition have been relatively stable for those who have delayed entry into the post-secondary system, for those just leaving Grade 12, the rate has increased noticeably from 50.9 per cent in 2001/02 to 53.6 per cent by 2008/09. It is also noteworthy that within two years of high school graduation in BC, an estimated 70 per cent of those individuals decide to pursue formal higher education. These trends indicate that BC’s K—12 system continues to improve in terms of preparing its students for continued learning after moving on from the public school system.
Justice System
Despite reform and efficiency initiatives undertaken over the past several years, the justice system continues to suffer from backlogs and delays, as outlined in the Green Paper Modernizing British Columbia’s Justice System, released February 8, 2012. The paradox however, is that inputs that drive the justice system, such as the rate of crime and number of new criminal court cases are down, yet delays and the costs of delivering justice are increasing. (See The Justice System in British Columbia topic box on page 54 for more information.)
Government took action to address pressures in the court system throughout fiscal 2011/12 by hiring additional sheriffs, Crown counsel, and Crown and court support staff and by appointing judges. As noted earlier, government has made notional provisions in the contingencies allowance for these costs and will draw down the Contingencies vote to reallocate funding to the Ministry of Justice beginning in 2012/13.
Budget 2012 allocates an additional $237 million over the next three years to the Ministry of Justice to address immediate funding pressures while further work is completed over the medium to long term to reform the system and achieve better outcomes and accountability for the current investment of over $1 billion in the justice system. Justice reforms will consider the optimal scope of independence required by law to achieve business process improvements.
Resources have been allocated as follows:
· $30 million over the next three years to fund RCMP cost increases, mainly salary and pension costs. This maintains the existing number of provincially funded RCMP officers in detachments throughout the province as well as those providing specialized policing services.
· $66 million over the next three years to preserve the 168 additional officers hired in 2009 to combat organized crime and gang activity in recognition of the continued importance of these anti-gang strategies and programs. The province will provide funding to roll these positions into the provincial policing strategy on a permanent basis. These positions were previously funded from one-time Police Officer Recruitment Funding provided by the Federal government which expired in 2011. This brings the total number of police officers funded by the province to 2,100 regular and civilian members.
· $42 million over the next three years to sustain court services (court administration staff and sheriffs) and prosecution services personnel, hired in 2011/12 to avoid
Budget and Fiscal Plan – 2012/13 to 2014/15
27
Three Year Fiscal Plan
unscheduled courtroom closures due to staff shortages. There are currently 290 courtrooms and 98 other types of hearing rooms across 89 locations in BC that provide over 167,000 hours of court time annually.
· $81 million over the next three years to fund the operating costs of the 216 cell expansion to the Surrey Pretrial Services Centre to be completed in 2013 to address inmate overcrowding as well as fund higher adult custody and community corrections caseloads. The current average number of adults in custody is 2,590, of which 70 per cent are double bunked, and is projected to increase by 1.5 per cent annually prior to any potential impact of the federal Safe Streets and Communities Act Bill C-10. Similarly the current average number of offenders sentenced to community supervision is 24,000 and is conservatively projected to increase by 1.9 per cent annually.
· $29 million over the next three years to fund the operating costs of the newly established Independent Investigations Office to investigate incidents in BC involving municipal police and the RCMP that result in serious harm or death, as recommended by the Braidwood Inquiry and the Davies Inquiry.
· $6 million over the next three years is provided to the Legal Services Society to increase legal aid funding to support families who need assistance to resolve matters related to custody, access and other legal matters. This new funding will allow representation for up to 800 clients who otherwise would not have received representation over the next three years.
· $3 million over the next three years to address the recent arbitration decision which provides Crown Counsel Association members and other legal staff with additional earned days off and an increase in professional requirements allowance; and
· $2 million over the next three years to fund enhanced benefits for Judges and Judicial Justices of the Peace as approved by the Legislature in response to the Judges Compensation Commission recommendations tabled in May 2011.
The funding increases noted above are offset by efficiencies, totaling $22 million over the next three years, from the consolidation of management services within the Ministry of Justice.
Table 1.15 Justice System
($ millions) | | 2012/13 | | 2013/14 | | 2014/15 | |
Supporting increased Provincial RCMP policing costs | | 10 | | 10 | | 10 | |
Maintaining dedicated officers to combat organized crime and gangs | | 22 | | 22 | | 22 | |
Sustaining court and prosecution services | | 14 | | 14 | | 14 | |
Expanding adult custody capacity and supporting higher inmate caseloads | | 11 | | 30 | | 40 | |
Implementing the new Independent Investigations Office | | 9 | | 10 | | 10 | |
Increased funding for Legal Aid | | 2 | | 2 | | 2 | |
Crown Counsel and Judicial Compensation increases | | 1 | | 2 | | 2 | |
Total resource allocation to funding pressures | | 69 | | 90 | | 100 | |
Reallocation of savings from consolidation of management services | | (4 | ) | (7 | ) | (11 | ) |
Ministry of Justice budget increase | | 65 | | 83 | | 89 | |
Budget and Fiscal Plan – 2012/13 to 2014/15
28
Three Year Fiscal Plan
Supports to Individuals and Families
Budget 2012 provides an additional $444 million over the next three years to support individuals and families.
Table 1.16 Supports to Individuals and Families
($ millions) | | 2012/13 | | 2013/14 | | 2014/15 | |
Income Assistance | | 68 | | 115 | | 111 | |
Supports to individuals with developmental disabilities and their families | | 38 | | 48 | | 58 | |
Communications assistance for youth and adults | | 2 | | 2 | | 2 | |
Total | | 108 | | 165 | | 171 | |
Income Assistance
Budget 2012 provides an additional $294 million over three years for individuals and families in need of income assistance, including temporary income assistance, disability income assistance and supplementary assistance (health and other supports for families on income assistance). As noted earlier, a significant portion of these caseload increases were being tracked in the contingencies allocation which will be drawn down to provide base budget increases to the Ministry of Social Development starting in 2012/13.
Budget 2012 provides an additional $122 million over three years to support a temporary assistance caseload of 54,500 (3 year average). The temporary income assistance caseload has not declined at the rate previously anticipated in Budget 2011, due to the prolonged economic recovery.
Those in receipt of temporary assistance consist mainly of “expected to work” clients and are supported through employment programs and various supplements to meet strict employment and work search obligations to regain employment. Ministry of Social Development policies have been effective at reducing and preventing dependency on temporary income assistance. For example, while the unemployment rate in BC in 2010 was comparable to that in 2001, the proportion of the unemployed on temporary assistance has decreased more than 50 per cent as shown in Chart 1.11.
Chart 1.11 Unemployed receiving temporary assistance

Budget and Fiscal Plan – 2012/13 to 2014/15
29
Three Year Fiscal Plan
Budget 2012 provides an additional $121 million over three years to support a disability assistance caseload of 85,200 (3 year average). Disability assistance caseloads are forecast to increase due to population growth and a higher incidence of persons with disabilities.
Budget 2012 also provides an additional $51 million over three years for supplementary assistance supports (i.e. basic dental, school supplies, medical equipment) and higher program delivery costs associated with the increase in income assistance caseloads.
Community Living British Columbia
Budget 2012 provides an additional $144 million over three years to increase capacity and improve services for individuals with developmental disabilities and their families consistent with the recommendations made by the Deputy Ministers’ Review of Community Living British Columbia (CLBC). See the Community Living British Columbia topic box on page 55 for more information.
Government recognized challenges existed in CLBC and had assigned a notional amount in the Contingencies vote in anticipation of the review recommendations. As noted previously, funding will be reallocated from the Contingencies vote to provide the following increases to the Ministry of Social Development:
· $54 million over three years to fund the full-year cost of the approximately 540 people in receipt of additional CLBC services in 2011/12;
· $60 million over three years to support the development of new approaches to day and employment programs, improve transition planning for youth with developmental disabilities, facilitate transition to individualized funding, and support innovations in the sector; and
· $30 million over three years to fund CLBC’s incremental costs for Community Social Services Employers’ Association employees adopting the Municipal Pension Plan in order to protect front-line services.
In addition, $12 million continues to be notionally allocated in the Contingencies vote to further support anticipated CLBC caseload increases.
Communications Assistance for Youth and Adults
Budget 2012 provides additional funding of $6 million over 3 years for communications tools (e.g. speech-generating devices) and other supports to assist young adults with severe communications disabilities. The funding will serve approximately 90 new clients annually, as well as provide ongoing support to existing clients.
Management of the BC Public Service
During the period 2001/02 to 2010/11, the core BC public service (ministries and special offices) as measured in full-time equivalents (FTEs) was approximately 30,000 FTEs. Consistent with recent budget presentations, BC public service FTEs are presented in Budget 2012 on an aggregated basis, as shown in Chart 1.12.
In 2010/11, responsibility for the BC Ambulance Service shifted from the Ministry of Health Services to the Provincial Health Services Authority, which is part of the SUCH sector (schools, universities, colleges and health organizations). Under the Budget Transparency and Accountability Act SUCH sector FTEs are not included in government reporting on staff levels, therefore government FTE estimates starting in 2011/12 have been reduced in accordance with this change in status (by approximately 3,200 FTEs).
Budget and Fiscal Plan – 2012/13 to 2014/15
30
Three Year Fiscal Plan
While government continues its policy of limited external hiring in order to manage within available salary budgets, higher than anticipated hiring occurred in 2011/12 as a result of government’s efforts to improve front-line service delivery in areas including court services, income assistance, and natural resource permitting. Other factors included the transfer of former BC College of Teachers staff into government as well as increased hiring of seasonal forest fire personnel when early indicators identified increased fire risk. The fire personnel were also made available for use in other provinces on a cost recovery basis.
Going forward, FTE utilization is projected to decrease at an annual average rate of 2.7 per cent over the three year fiscal plan. The forecast decline reflects the continued budgetary requirement for government to prioritize key government services and programs and achieve savings and improved effectiveness in their delivery. It is expected that the projected decrease for the next three years will be achieved through attrition — that is, through normal annual voluntary exits, including retirements, which are expected to continue at consistent rates throughout the period.
Notwithstanding, in 2012/13, there will be some offsetting upward pressures in FTEs due to the creation of the Office of the Auditor General for Local Government, the Independent Investigations Office, and the return of PST administration staff. These factors reduce the revised projected rate of FTE decrease that was projected in Budget 2011. However, the overall trend of decreasing FTEs is expected to continue over the fiscal plan period.
Chart 1.12 Managing FTEs
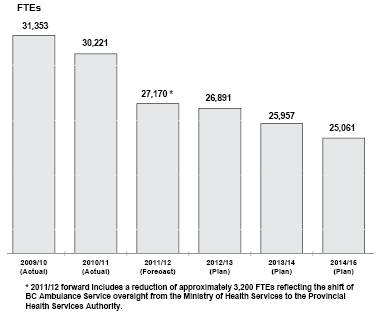
Recovered Expenses
Over the fiscal plan period (2012/13 to 2014/15), government projects it will incur $8.4 billion in program spending whose costs will be recovered from third parties. This includes a total of $2.0 billion spent on delivering programs on behalf of the federal government, such as the Labour Market Development Agreement and local government services transfers.
Budget and Fiscal Plan – 2012/13 to 2014/15
31
Three Year Fiscal Plan
In addition, an estimated $2.8 billion in interest costs will be recovered from the commercial Crown corporations through the fiscal agency loan program and from sinking fund investment returns.
The remaining $3.6 billion in recoveries costs are incurred by a variety of programs, including hospital expansion recovered from regional health boards, industry-funded regulatory programs recovered through fees, and distribution of free Crown grants recovered through the revaluation of the land being distributed.
Operating Transfers
Transfers to service delivery agencies will total $64.4 billion over the fiscal plan period (2012/13 to 2014/15) in support of education, healthcare, social services, housing, and transportation programs delivered by the agencies on behalf of government. These service delivery agencies include the SUCH sector (schools, universities, colleges and health organizations), Community Living British Columbia, BC Housing Management Commission, BC Transit, and the BC Transportation Financing Authority. Transfers to these organizations comprise over 60 per cent of ministry spending.
Service Delivery Agency Spending
Service delivery agency spending is projected to total $27.7 billion by 2014/15, reflecting an increase of $1.6 billion over the fiscal plan period.
School district spending is projected at $5.6 billion in 2014/15 — an increase of $109 million over the three year period. This includes increased spending to address class composition issues and full-day kindergarten, partially offset by lower anticipated operating costs. Other influences on school district spending include stable enrolment projections and government’s current wage mandate (over 80 per cent of school district spending is on salaries).
Spending by universities is forecast to increase by $202 million over the three year period, and will total $4.1 billion by 2014/15. The increase mainly reflects additional faculty and operating costs for education and research programs and amortization for capital assets resulting from provincial and federal government stimulus spending.
Projected spending by colleges and institutes will remain virtually unchanged at $1.1 billion, with only a minor increase of $10 million over the three year period. This increase mainly relates to additional salary and wages and operating costs for education programs.
Health authority and hospital society spending is projected to rise from $12.1 billion in 2011/12 to $13.1 billion by 2014/15 — an increase of $1.0 billion, or 8.7 per cent over the three year period. This increase reflects the projected growth in demand for the health services delivered by these organizations on behalf of government and is projected to be funded by additional provincial grants and own-source revenue.
Projected spending by other service delivery agencies is forecast to increase by $253 million by 2014/15. The increase is primarily due to additional spending on transportation initiatives by the BC Transportation Financing Authority and increased debt servicing costs, partially offset by the decline of accelerated social housing programs by the BC Housing Management Commission.
Budget and Fiscal Plan – 2012/13 to 2014/15
32
Three Year Fiscal Plan
Capital Spending
Capital spending on schools, hospitals, roads, bridges, hydro-electric projects and other infrastructure across the province over the fiscal plan period is expected to total $19.2 billion. Provincial capital infrastructure investments are made through school districts, health authorities, post-secondary institutions, Crown agencies and ministries.
Table 1.17 Capital Spending
| | Updated | | Budget | | | | | |
| | Forecast | | Estimate | | Plan | | Plan | |
($ millions) | | 2011/12 | | 2012/13 | | 2013/14 | | 2014/15 | |
Taxpayer-supported | | | | | | | | | |
Education | | | | | | | | | |
Schools (K–12) | | 530 | | 486 | | 456 | | 454 | |
Post-secondary | | 779 | | 688 | | 548 | | 561 | |
Health | | 841 | | 879 | | 700 | | 685 | |
BC Transportation Financing Authority | | 958 | | 1,069 | | 1,143 | | 1,062 | |
BC Transit | | 50 | | 90 | | 87 | | 110 | |
BC Place redevelopment | | 249 | | — | | 12 | | — | |
Government ministries | | 318 | | 454 | | 439 | | 482 | |
Other (1) | | 272 | | 91 | | 92 | | 75 | |
Total taxpayer-supported | | 3,997 | | 3,757 | | 3,477 | | 3,429 | |
Self-supported | | | | | | | | | |
BC Hydro | | 2,082 | | 2,361 | | 2,150 | | 2,222 | |
Columbia River power projects (2) | | 89 | | 122 | | 64 | | 26 | |
Transportation Investment Corporation (Port Mann) | | 742 | | 606 | | 94 | | 147 | |
BC Railway Company | | 13 | | 13 | | 9 | | 1 | |
ICBC | | 86 | | 101 | | 98 | | 69 | |
BC Lotteries | | 107 | | 116 | | 110 | | 105 | |
Liquor Distribution Branch | | 25 | | 27 | | 28 | | 36 | |
Total self-supported commercial | | 3,144 | | 3,346 | | 2,553 | | 2,606 | |
Total capital spending | | 7,141 | | 7,103 | | 6,030 | | 6,035 | |
(1) Includes BC Housing Management Commission, Provincial Rental Housing Corporation, other service delivery agencies.
(2) Joint ventures of the Columbia Power Corporation and Columbia Basin Trust.
The total capital investment of $19.2 billion is comprised of $10.7 billion in taxpayer-supported capital investments and $8.5 billion in capital investments by commercial Crown corporations. These investments will support the BC Jobs Plan and the province’s Pacific Gateway Strategy.
The capital spending forecast for 2012/13 reflects completion of existing approved projects, new investments to expand and sustain provincial infrastructure, including schools, hospitals and universities, and investments by self-supported commercial Crown corporations in power projects and the Port Mann Bridge replacement project.
Taxpayer-supported capital spending is projected to decline from recent peak levels following substantial completion of the accelerated infrastructure program in October 2011.
Budget and Fiscal Plan – 2012/13 to 2014/15
33
Three Year Fiscal Plan
Taxpayer-supported capital spending
Taxpayer-supported capital spending includes capital infrastructure for school districts, health authorities, post-secondary institutions, taxpayer-supported Crown agencies, and ministries.
Taxpayer-supported capital spending is projected at $3.8 billion in 2012/13, declining to $3.5 billion in 2013/14 and $3.4 billion in 2014/15, reflecting completion of approved projects within the capital plan and new investments to sustain or expand provincial infrastructure.
In Budget 2012, increased emphasis has been placed on protecting the province’s existing investments. Over the three year plan period, an additional $1.1 billion will be invested in maintaining and upgrading existing infrastructure including schools, post-secondary institutions, health facilities, social housing, highways and government buildings. These investments will ensure the ongoing delivery of core services, reduce deferred maintenance, and ensure the useful life of government assets is realized.
Budget 2012 also includes new priority investments for new, expanded or replacement infrastructure. Over the three year plan period, an additional $1.3 billion will be invested in schools, hospitals, universities, colleges and correctional facilities. Budget allocations are notional subject to the approval of satisfactory business cases.
Spending on Schools
Over the three years of the capital plan, $1.4 billion will be invested to maintain, replace, renovate or expand K–12 facilities, including continued investment in new school space to accommodate increasing enrolment in growth districts, and continued investment in the program to seismically upgrade or replace schools.
New priority investments in Budget 2012 include:
· two new secondary schools to replace the existing Belmont Secondary School in Langford and create a new secondary school in Colwood. The additional secondary school space will help address enrolment pressures from these growing communities;
· a new elementary school in East Clayton, which with other projects in the Surrey School District, will help ease enrolment pressures at the elementary and secondary levels in the growing communities of Surrey; and
· a new elementary school in West Kelowna to accommodate increasing enrolment in this growing community.
In addition to major capital projects, over $300 million of additional investments during the plan period will be dedicated to maintaining the quality of school infrastructure. School districts use these funds for routine maintenance as well as larger projects such as roofing and mechanical system upgrades to maintain facilities through their economic life and prevent premature deterioration.
For example:
· Hawthorne Elementary in Delta is to be re-roofed in order to improve structural integrity and to maintain the economic life of the building; and
· Isabella Dickens Elementary in Fernie is to undergo an upgrade of its electrical systems to make it safer and more efficient.
Budget and Fiscal Plan – 2012/13 to 2014/15
34
Three Year Fiscal Plan
Spending to Support Post-Secondary Education
Budget 2012 includes $1.8 billion in capital spending by post-secondary institutions throughout the province. Projects include the replacement and renewal of existing infrastructure to address deferred maintenance and safeguard the province’s investment in capital assets, as well as new priority projects to build capacity and help ensure that the province’s future workforce needs in key sectors are met.
Post-secondary capital spending also includes a significant level of investment funded through other sources, including foundations, donations, cash balances, federal funding and revenues generated from services.
In addition to major capital projects, over $260 million of additional capital investments during the plan period will be directed to ensuring safe, functional and efficient facilities are maintained to support the delivery of post-secondary programs. Examples of investments include:
· electrical, emergency lighting and fire alarm systems upgrades at various trade shops and classrooms; and
· upgrades and renewal of heating, ventilation and air conditioning systems.
Expanding and Improving Health Facilities
Capital spending in the health sector will total $2.3 billion over the next three years. These investments support new major construction and upgrading of health facilities, medical and diagnostic equipment, and information management technology systems, and include funding from the province as well as other sources, such as regional hospital districts and foundations.
Existing investments include the Children’s and Women’s Hospital, the Cancer Centre for the North in Prince George, the Fort St. John Hospital and Residential Care facility, and major redevelopment projects underway at Surrey Memorial and Kelowna General hospitals.
In addition to major capital projects, over $300 million of additional capital investments in the health sector during the plan period will be dedicated to upgrading and updating hospitals to ensure facilities continue to provide healthcare services to British Columbians.
The investments include improvements to building components and equipment such as nurse call and fire alarm systems; heating, ventilation and air conditioning systems; medical, diagnostic and hospital support equipment; and health information and data communication systems.
Examples of investments underway include:
· upgrading the electrical power system at St. Paul’s Hospital in Vancouver and Bulkley Valley and District Hospital in Smithers; and
· acquiring new and replacement x-ray and imaging equipment at hospitals in Maple Ridge, Langley and Golden.
Budget and Fiscal Plan – 2012/13 to 2014/15
35
Three Year Fiscal Plan
Continuing the Transportation Investment Plan
Budget 2012 continues to invest in government’s transportation investment plan. The province has secured significant federal cost sharing on projects and has leveraged investments through partnerships with private partners. The public and private sector together will provide $4.5 billion for transportation investments over the next three years, including:
· $2.8 billion of provincial investment in transportation infrastructure;
· $0.9 billion of investment leveraged through federal cost sharing and partnerships with private partners, local governments and other agencies; and
· $0.8 billion of investment for the Port Mann Bridge/Highway 1 project.
In addition to major capital projects, more than $70 million of additional capital investments during the fiscal plan period over the previous base allocation of $146 million per year will be dedicated to maintaining, upgrading and rehabilitating highway infrastructure. As well, $40 million will be directed to oil and gas rural road development.
Further information is provided in Table 1.18.
Table 1.18 Provincial Transportation Investments
| | Updated | | | | | | | | | |
| | Forecast | | | | | | | | 3-Year | |
($ millions) | | 2011/12 | | 2012/13 | | 2013/14 | | 2014/15 | | Total | |
Transportation Investment Plan | | | | | | | | | | | |
– Rehabilitation | | 178 | | 146 | | 179 | | 190 | | 515 | |
– Interior and rural side roads | | 57 | | 50 | | 50 | | 50 | | 150 | |
– Oil and gas rural road improvement program | | 35 | | 45 | | 20 | | 20 | | 85 | |
– Mountain pine beetle strategy | | 32 | | 30 | | 30 | | 30 | | 90 | |
– Highway 1 (Kicking Horse Canyon, Kamloops to Golden) | | 77 | | 74 | | 32 | | 35 | | 141 | |
– Gateway program | | 194 | | 128 | | 56 | | 2 | | 186 | |
– Okanagan Valley corridor | | 54 | | 32 | | 30 | | 25 | | 87 | |
– Cariboo connector program | | 13 | | 48 | | 22 | | 38 | | 108 | |
– Other highway corridors and programs | | 105 | | 156 | | 148 | | 135 | | 439 | |
– Cycling infrastructure | | 2 | | 6 | | 3 | | 2 | | 11 | |
Total transportation investment plan | | 747 | | 715 | | 570 | | 527 | | 1,812 | |
Provincial Transit Plan | | | | | | | | | | | |
– Canada Line rapid transit project | | 20 | | 20 | | 20 | | 20 | | 60 | |
– Evergreen Line rapid transit project | | 20 | | 123 | | 163 | | 126 | | 412 | |
– Rapid transit, buses and other transit priorities | | 88 | | 106 | | 168 | | 219 | | 493 | |
Total provincial transit plan | | 128 | | 249 | | 351 | | 365 | | 965 | |
Total provincial investment (1) | | 875 | | 964 | | 921 | | 892 | | 2,777 | |
Investments funded through contributions from other partners | | | | | | | | | | | |
– Evergreen Line (federal contribution and TransLink) | | 88 | | 101 | | 261 | | 240 | | 602 | |
– Contributions to the Transportation Investment Plan | | 108 | | 113 | | 92 | | 30 | | 235 | |
– Contributions to the Provincial Transit Plan | | 19 | | 1 | | 10 | | 37 | | 48 | |
Total investments funded through contributions from other partners | | 215 | | 215 | | 363 | | 307 | | 885 | |
Total investment in transportation infrastructure | | 1,090 | | 1,179 | | 1,284 | | 1,199 | | 3,662 | |
Transportation Investment Corporation | | | | | | | | | | | |
– Port Mann Bridge/Highway 1 project | | 742 | | 606 | | 94 | | 147 | | 847 | |
Total investment in transportation infrastructure including the Port Mann Bridge/Highway 1 project | | 1,832 | | 1,785 | | 1,378 | | 1,346 | | 4,509 | |
(1) Total provincial investment includes operating and capital spending.
Budget and Fiscal Plan – 2012/13 to 2014/15
36
Three Year Fiscal Plan
Ministry Capital Spending
Budget 2012 includes $1.4 billion in capital spending by government ministries over the plan period. This will fund investments in maintaining, upgrading or expanding infrastructure such as courthouses and correctional centres (e.g. a new Okanagan Correctional Centre that is being planned to address safety and capacity issues in the system), office buildings, industrial roads, and information systems.
In addition to major capital projects, almost $100 million of additional capital investments during the plan period will be directed by the Ministry of Labour, Citizens’ Services and Open Government into maintaining and upgrading existing facilities, including courthouses, correctional centres, and office buildings throughout the province.
These investments protect the health and safety of the public and enable government employees to deliver quality services to citizens. Examples of investments will include refurbishing plumbing, electrical, ventilation and other building systems at the Law Courts in Vancouver, and upgrades to support modernizing safety and security equipment in correctional centres in the lower Mainland, Kamloops and Prince George.
Capital Project Reserves
The province has included $369 million in project reserves in its three year capital plan as a prudent planning measure. In addition to covering risks from higher than expected costs, the reserves will be used to fund emerging government priorities.
These priorities include two new funds designed to assist government in meeting its longer term strategic objectives:
· A Transformation and Technology Fund totaling $70 million over the plan period has been established for information management and technology initiatives that will transform government services. These initiatives are to enable government to deliver on its e-government strategy to increase citizen participation, self service and business innovation. Examples include Drive BC that provides on-line access to road information, the Open Data Infrastructure, and Identity Information Management.
· A Capital Innovation Fund of $100 million has been established to encourage innovative projects that provide a positive return on investment by increasing government revenues and/or generating operating efficiencies, support government priorities, and enhance trade and economic development. The fund will be phased in — $20 million in 2012/13, $30 million in 2013/14 and $50 million in 2014/15. Access to the fund requires approval of satisfactory business cases.
Financing Capital Projects
Provincial capital infrastructure spending is financed through a combination of sources:
· cash balances (e.g. school districts, post-secondary institutions, health authorities);
· partnerships with the private sector (public-private-partnerships);
· cost-sharing with partners (e.g. federal government, regional hospital districts); and
· borrowing (debt financing).
Budget and Fiscal Plan – 2012/13 to 2014/15
37
Three Year Fiscal Plan
Chart 1.13 Financing government’s capital plan
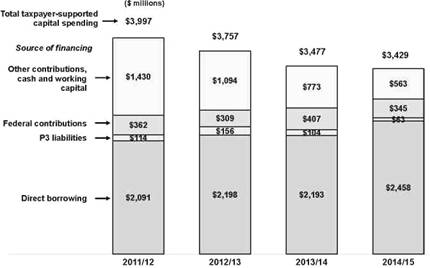
Since debt financing continues to represent a significant source of financing for provincial capital spending, the level of capital spending has a significant impact on projected provincial debt.
Self-supported capital spending
Total capital spending includes capital infrastructure for self-supported commercial Crown agencies.
Self-supported capital spending is projected at $3.3 billion in 2012/13, $2.6 billion in 2013/14 and $2.6 billion in 2014/15. Over the three year period:
· $6.9 billion (82 per cent) of total self-supported capital spending will be used for electrical generation, transmission and distribution projects to meet growing customer demand, to enhance reliability and to implement the smart metering and infrastructure program.
Large generating facilities built between the late 1960s and early 1980s provide about 90 per cent of the province’s electrical power. The major mechanical and electrical components (such as turbines and transformers) in these facilities are nearing the end of their design life and require major overhauls to maintain reliability. A significant portion of self-supported capital spending represents measures to address the issue of ageing infrastructure.
· $847 million will be used for the Port Mann Bridge replacement and Highway 1 improvement project.
· $331 million will be used for BC Lottery Corporation projects including the modernization of business systems and acquisition of gaming equipment to support lottery, PlayNow internet gaming, casino and community gaming activities.
· $268 million will be used for ICBC projects including reinvestment in critical business systems as part of its Transformation Program.
Table 1.19 provides information on major power generation and transmission projects. Further details on provincial capital investments are shown in the service plans of ministries and Crown agencies.
Budget and Fiscal Plan – 2012/13 to 2014/15
38
Three Year Fiscal Plan
Projects over $50 million
As required under the Budget Transparency and Accountability Act, approved major capital projects with multi-year budgets from provincial sources totaling $50 million or more are shown in Table 1.19. Annual allocations of the full budget for these projects are included as part of the provincial government’s capital investment spending shown in Table 1.17.
In addition to financing through provincial sources, major projects may be cost-shared with the federal government, municipalities and regional districts, and/or the private sector. Total capital spending for these major projects is $18.0 billion, reflecting provincial financing of $16.1 billion through internal sources or borrowing, $0.8 billion from federal government contributions and $1.1 billion from other sources including private donations.
Major capital investments include:
· $432 million for school replacement projects including Revelstoke Elementary and Secondary, Chilliwack Secondary, Burnaby Central Secondary, Centennial Secondary, Alberni District Secondary, and to provide space for full-day kindergarten;
· $133 million for the Pharmaceutical Sciences and Centre for Drug Research and Development at UBC, of which the province is funding $86.4 million;
· $3 billion for health facilities including the Jim Pattison Outpatient Care and Surgery Centre in Surrey; the Royal Jubilee Hospital Patient Care Centre in Victoria; the Fort St. John Hospital and Residential Care Centre; the Kelowna General and Vernon Jubilee Hospitals; the Northern Cancer Control Strategy in Prince George; Lions Gate Hospital (mental health) Redevelopment; the Surrey Memorial Hospital — Emergency Department/Critical Care Tower; the Interior Heart and Surgical Centre in Kelowna; and the Children’s and Women’s Hospital;
· $4.7 billion for major transportation capital infrastructure including the South Fraser Perimeter Road, Sierra Yoyo Desan (SYD) Road upgrade, and the Port Mann Bridge/Highway 1 project;
· $1.9 billion for completion of the BC Place redevelopment, the integrated case management system, the Surrey Pretrial Service Centre expansion and the e—Health initiative;
· $7.4 billion for power generation and transmission capital projects by BC Hydro and for Columbia River power projects including estimates for a 49 per cent share in the expansion of the Waneta Dam (a public-private partnership with Fortis Inc.);
· $104 million for the replacement of BC Lottery Corporation gaming management system that supports the generation of over $1.5 billion in annual revenue from 34 casinos and community gaming centres operating more than 11,000 slot machines and 500 table games; and
· $208 million for the capital component of ICBC’s $400 million business transformation program that will completely overhaul its claims, insurance, customer, and business processes and technologies.
Budget and Fiscal Plan – 2012/13 to 2014/15
39
Three Year Fiscal Plan
Table 1.19 Capital Expenditure Projects Greater Than $50 million (1)
Note: Information in bold type denotes changes from the 2011/12 second Quarterly Report.
| | Projected | | Total Costs | | Projected | | Total | | Project Financing | |
| | Completion | | to | | Costs to | | Capital | | Internal/ | | Federal | | Other | |
($ millions) | | Date | | Dec. 31, 2011 | | Complete | | Costs | | Debt | | Government | | Contributions | |
Taxpayer-supported | | | | | | | | | | | | | | | |
School districts | | | | | | | | | | | | | | | |
Revelstoke Elementary and Secondary | | Fall 2012 | | 44 | | 16 | | 60 | | 58 | | — | | 2 | |
Chilliwack Secondary | | Fall 2013 | | 10 | | 48 | | 58 | | 58 | | — | | — | |
Burnaby Central Secondary | | Spring 2012 | | 44 | | 16 | | 60 | | 60 | | — | | — | |
Centennial Secondary | | Fall 2014 | | — | | 62 | | 62 | | 62 | | — | | — | |
Alberni District Secondary | | Fall 2012 | | 29 | | 29 | | 58 | | 54 | | — | | 4 | |
Full-day kindergarten | | Fall 2012 | | 99 | | 35 | | 134 | | 134 | | — | | — | |
Total school districts | | | | 226 | | 206 | | 432 | | 426 | | — | | 6 | |
Post-secondary institutions | | | | | | | | | | | | | | | |
University of British Columbia | | | | | | | | | | | | | | | |
– Pharmaceutical Sciences and Centre for Drug Research & Development | | Fall 2012 | | 78 | | 55 | | 133 | | 86 | | 3 | | 44 | |
Health facilities | | | | | | | | | | | | | | | |
Jim Pattison Outpatient Care and Surgery Centre (2), (3) | | | | | | | | | | | | | | | |
– Government direct cost | | Fall 2012 | | 54 | | 11 | | 65 | | 65 | | — | | — | |
– P3 contract | | Spring 2011 | | 172 | | — | | 172 | | 172 | | — | | — | |
Victoria Royal Jubilee Hospital — Patient Care Centre | | | | | | | | | | | | | | | |
– Government direct cost | | Spring 2013 | | 141 | | 9 | | 150 | | 23 | | — | | 127 | |
– P3 contract | | Spring 2011 | | 199 | | — | | 199 | | 199 | | — | | — | |
Fort St. John Hospital and Residential Care | | | | | | | | | | | | | | | |
– Government direct cost | | Spring 2012 | | 244 | | 21 | | 265 | | 169 | | — | | 96 | |
– P3 contract | | Spring 2012 | | 2 | | 31 | | 33 | | 33 | | — | | — | |
Expansions to Kelowna General and Vernon Jubilee Hospitals | | | | | | | | | | | | | | | |
– Government direct cost | | Spring 2012 | | 251 | | 24 | | 275 | | 26 | | — | | 249 | |
– P3 contract | | Spring 2012 | | 158 | | — | | 158 | | 158 | | — | | — | |
Northern Cancer Control Strategy | | | | | | | | | | | | | | | |
– Government direct cost | | Fall 2012 | | 59 | | 32 | | 91 | | 87 | | — | | 4 | |
– P3 contract | | Summer 2012 | | 14 | | 1 | | 15 | | 15 | | — | | — | |
Lions Gate Hospital (Mental Health) Redevelopment (4) | | Fall 2013 | | — | | 58 | | 58 | | 34 | | — | | 24 | |
Surrey Emergency/Critical Care Tower (5) | | | | | | | | | | | | | | | |
– Government direct cost | | Summer 2014 | | 55 | | 252 | | 307 | | 287 | | — | | 20 | |
– P3 contract | | Summer 2014 | | 53 | | 126 | | 179 | | 179 | | — | | — | |
Interior Heart and Surgical Centre (6) | | Spring 2017 | | 89 | | 304 | | 393 | | 302 | | — | | 91 | |
Children’s and Women’s Hospital (7) | | Fall 2017 | | 14 | | 668 | | 682 | | 532 | | — | | 150 | |
Total health facilities | | | | 1,505 | | 1,537 | | 3,042 | | 2,281 | | — | | 761 | |
Transportation | | | | | | | | | | | | | | | |
South Fraser Perimeter Road | | | | | | | | | | | | | | | |
– Government direct cost | | Summer 2014 | | 769 | | 293 | | 1,062 | | 714 | | 348 | | — | |
– P3 contract | | Summer 2014 | | 107 | | 95 | | 202 | | 202 | | — | | — | |
Sierra Yoyo-Desan Road upgrade (8) | | Fall 2012 | | 77 | | 60 | | 137 | | 137 | | — | | — | |
Total transportation | | | | 953 | | 448 | | 1,401 | | 1,053 | | 348 | | — | |
Other | | | | | | | | | | | | | | | |
Vancouver Convention Centre expansion project | | Summer 2009 | (3) | 834 | | 2 | | 836 | | 494 | | 222 | | 120 | |
BC Place redevelopment (9) | | Fall 2011 | | 490 | | 73 | | 563 | | 563 | | — | | — | |
Integrated case management system | | Fall 2014 | | 95 | | 87 | | 182 | | 179 | | 3 | | — | |
Surrey Pretrial Service Centre expansion (10) | | | | | | | | | | | | | | | |
– Government direct cost | | Fall 2013 | | 7 | | 7 | | 14 | | 14 | | — | | — | |
– P3 contract | | Fall 2013 | | 17 | | 73 | | 90 | | 90 | | — | | — | |
e-Health initiative (11) | | Spring 2013 | | 242 | | 20 | | 262 | | 138 | | 124 | | — | |
Total other | | | | 1,685 | | 262 | | 1,947 | | 1,478 | | 349 | | 120 | |
Total taxpayer-supported | | | | 4,447 | | 2,508 | | 6,955 | | 5,324 | | 700 | | 931 | |
Budget and Fiscal Plan – 2012/13 to 2014/15
40
Three Year Fiscal Plan
Table 1.19 Capital Expenditure Projects Greater Than $50 million (1) (continued )
Note: Information in bold type denotes changes from the 2011/12 second Quarterly Report.
| | Projected | | Total Costs | | Projected | | Total | | Project Financing | |
| | Completion | | to | | Costs to | | Capital | | Internal/ | | Federal | | Other | |
($ millions) | | Date | | Dec. 31, 2011 | | Complete | | Costs | | Debt | | Government | | Contributions | |
Self-supported | | | | | | | | | | | | | | | |
Transportation | | | | | | | | | | | | | | | |
Port Mann Bridge / Highway 1 | | Winter 2013 | | 2,325 | | 994 | | 3,319 | | 3,319 | | — | | — | |
Power generation and transmission | | | | | | | | | | | | | | | |
BC Hydro (12) | | | | | | | | | | | | | | | |
– GM Shrum G1—G4 stator replacement | | Fall 2010 | (3) | 75 | | 1 | | 76 | | 76 | | — | | — | |
– Revelstoke Unit 5 generation | | Fall 2010 | (3) | 242 | | 7 | | 249 | | 249 | | — | | — | |
– Central Vancouver Island transmission line | | Fall 2010 | (3) | 59 | | 1 | | 60 | | 60 | | — | | — | |
– Cheakamus spillway gate reliability upgrade | | Summer 2011 | (3) | 61 | | 2 | | 63 | | 63 | | — | | — | |
– Columbia Valley transmission | | Fall 2012 | | 66 | | 67 | | 133 | | 133 | | — | | — | |
– Fort Nelson generating station upgrade (13) | | Winter 2012 | | 154 | | 9 | | 163 | | 163 | | — | | — | |
– Stave Falls spillway gate reliability upgrade (13) | | Winter 2013 | | 29 | | 35 | | 64 | | 64 | | — | | — | |
– Vancouver City Central transmission | | Spring 2013 | | 80 | | 97 | | 177 | | 177 | | — | | — | |
– Smart metering and infrastructure program | | Summer 2013 | | 221 | | 709 | | 930 | | 930 | | — | | — | |
– Dawson Creek area reinforcement (13) | | Fall 2013 | | 8 | | 242 | | 250 | | 250 | | — | | — | |
– Mica gas insulated switchgear replacement (13) | | Winter 2014 | | 104 | | 84 | | 188 | | 188 | | — | | — | |
– Northwest transmission line | | Spring 2014 | | 62 | | 499 | | 561 | | 234 | | 130 | | 197 | |
– Seymour Arm series capacitor (13) | | Spring 2014 | | 1 | | 99 | | 100 | | 100 | | — | | — | |
– Hugh Keenleyside spillway gate reliability upgrade (13) | | Spring 2014 | | 24 | | 70 | | 94 | | 94 | | — | | — | |
– Interior to Lower Mainland transmission line | | Winter 2015 | | 85 | | 624 | | 709 | | 709 | | — | | — | |
– GM Shrum units 1 to 5 turbine upgrade (13) | | Spring 2015 | | 24 | | 264 | | 288 | | 288 | | — | | — | |
– Mica units 5 and 6 project (13) | | Fall 2015 | | 145 | | 594 | | 739 | | 739 | | — | | — | |
– Ruskin Dam safety and powerhouse upgrade (13) | | Winter 2018 | | 65 | | 715 | | 780 | | 780 | | — | | — | |
– Southern Interior series compensation (13) | | Fall 2018 | | 1 | | 81 | | 82 | | 82 | | — | | — | |
– John Hart replacement (13) | | TBD | | 56 | | 1,294 | | 1,350 | | 1,350 | | — | | — | |
Columbia River power projects (14) | | | | | | | | | | | | | | | |
– Waneta Dam power expansion | | May 2015 | | 99 | | 250 | | 349 | | 349 | | — | | — | |
Total power generation and transmission | | | | 1,661 | | 5,744 | | 7,405 | | 7,078 | | 130 | | 197 | |
Other | | | | | | | | | | | | | | | |
British Columbia Lottery Corporation | | | | | | | | | | | | | | | |
– Gaming management system | | Winter 2015 | | 1 | | 103 | | 104 | | 104 | | — | | — | |
Insurance Corporation of British Columbia | | | | | | | | | | | | | | | |
– Business transformation program | | Fall 2016 | | 48 | | 160 | | 208 | | 208 | | — | | — | |
Total other | | | | 49 | | 263 | | 312 | | 312 | | — | | — | |
Total self-supported | | | | 4,035 | | 7,001 | | 11,036 | | 10,709 | | 130 | | 197 | |
Total $50 million projects | | | | 8,482 | | 9,509 | | 17,991 | | 16,033 | | 830 | | 1,128 | |
(1) Only projects that receive provincial funding and have been approved by Treasury Board and/or Crown corporation boards are included in this table. Ministry service plans may include projects that still require final approval. Capital costs reflect current government accounting policy.
(2) Figures shown do not include an additional $2 million to establish an offsite access road to the facility.
(3) Assets have been put into service and only trailing costs remain.
(4) Figures shown do not include an approved project reserve of $4 million.
(5) Figures shown do not include an approved project reserve of $26 million. The Emergency Department is expected to be operational by summer 2013.
(6) Figures shown are based on preliminary Treasury Board approvals and do not include an approved project reserve of $37 million. These amounts will change after P3 contracts are finalized.
(7) Figures shown are based on preliminary Treasury Board approvals. These amounts will change after P3 contracts are finalized.
(8) Figures shown do not include a $50 million capital reserve for future oil and gas access road development in the Northern Rockies area.
(9) The BC Place redevelopment project achieved substantial completion in September 2011. Work to complete the project continued through the fall of 2011 and is expected to last until the spring of 2012. Remaining work items include completion and commissioning of the fixed and retractable roof components, various upgrades (e.g. mechanical and electrical upgrades), and resolution of any contractor claims.
(10) Figures shown do not include an approved project reserve of $9 million.
(11) The e-Health initiative is comprised of 7 distinct projects. Figures shown reflect the total costs of the 7 Ministry of Health’s provincially co-ordinated e-Health projects. The federal government portion is an estimate based on a signed agreement with Canada Health Infoway and the actual amount may vary, depending on eligible project costs incurred.
(12) BC Hydro has restated the capital cost of a number of its projects to conform with the move to International Financial Reporting Standards. For further details, please see Appendix I of the F2012-F2014 Amended Revenue Requirements Application currently before the BC Utilities Commission.
(13) Total costs and completion dates for these projects vary depending on the final scope. Information shown represents current assumptions.
(14) Joint ventures of the Columbia Power Corporation and Columbia Basin Trust. In October 2010, CPC/CBT reached an agreement for a partnership with Fortis Inc. to develop an electricity generating facility at the Waneta Dam south of Trail. Capital spending information reflects 49 per cent of the total project — CPC’s 32.5 per cent share combined with CBT’s 16.5 per cent share.
Budget and Fiscal Plan – 2012/13 to 2014/15
41
Three Year Fiscal Plan
Provincial Debt
In recent years, debt has increased due to government’s need to post annual deficits in order to protect core services and implement an accelerated infrastructure plan to keep British Columbians working and help stimulate the economy during the global economic downturn. As government continues its capital investment program (albeit at pre-accelerated infrastructure plan levels), and given the impact of reverting to a PST/ GST system, total provincial debt, including commercial Crown self-supported debt, will reach $66.4 billion by 2014/15.
Table 1.20 Provincial Debt Summary (1)
| | Updated | | Budget | | | | | |
| | Forecast | | Estimate | | Plan | | Plan | |
($ millions unless otherwise indicated) | | 2011/12 | | 2012/13 | | 2013/14 | | 2014/15 | |
Taxpayer-supported debt | | | | | | | | | |
Provincial government operating | | 4,994 | | 6,590 | | 7,071 | | 6,579 | |
Provincial government general capital | | 2,696 | | 2,696 | | 2,696 | | 2,696 | |
Provincial government direct operating | | 7,690 | | 9,286 | | 9,767 | | 9,275 | |
Other taxpayer-supported debt (mainly capital) | | | | | | | | | |
Education | | 10,746 | | 11,334 | | 11,935 | | 12,558 | |
Health (2) | | 5,317 | | 5,864 | | 6,310 | | 6,771 | |
Highways and public transit (3) | | 8,633 | | 9,424 | | 10,212 | | 11,195 | |
Other | | 2,400 | | 2,828 | | 3,432 | | 3,903 | |
Total other taxpayer-supported debt | | 27,096 | | 29,450 | | 31,889 | | 34,427 | |
Total taxpayer-supported debt | | 34,786 | | 38,736 | | 41,656 | | 43,702 | |
Self-supported debt | | 16,149 | | 18,667 | | 20,808 | | 22,302 | |
Total debt before forecast allowance | | 50,935 | | 57,403 | | 62,464 | | 66,004 | |
Forecast allowance (4) | | 50 | | 200 | | 250 | | 350 | |
Total provincial debt | | 50,985 | | 57,603 | | 62,714 | | 66,354 | |
| | | | | | | | | |
Debt as a per cent of GDP | | | | | | | | | |
Provincial government direct operating | | 3.6 | % | 4.2 | % | 4.3 | % | 3.9 | % |
Taxpayer-supported | | 16.4 | % | 17.6 | % | 18.2 | % | 18.3 | % |
Total provincial | | 24.1 | % | 26.2 | % | 27.4 | % | 27.8 | % |
Taxpayer-supported debt per capita ($) | | 7,606 | | 8,379 | | 8,899 | | 9,215 | |
Taxpayer-supported interest bite (cents per dollar of revenue) | | 4.1 | | 4.1 | | 4.2 | | 4.4 | |
(1) Debt is after deduction of sinking funds and unamortized discounts, and excludes accrued interest. Government direct and fiscal agency accrued interest is reported in the government’s accounts as an accounts payable.
(2) Health facilities’ debt includes public-private partnership obligations of $994 million for fiscal 2011/12, $1,104 million for fiscal 2012/13, $1,158 million for fiscal 2013/14, and $1,205 million for fiscal 2014/15.
(3) BC Transportation Financing Authority’s debt includes public-private partnership obligations of $891 million for fiscal 2011/12, $922 million for fiscal 2012/13, $929 million for fiscal 2013/14, and $901 million for fiscal 2014/15.
(4) Reflects the operating statement forecast allowance for each year (amounts are not cumulative). Since it is unknown as to which agency would require this debt, the forecast allowance is shown as a separate item over the plan.
As government returns to a balanced budget by 2013/14, the rate of annual debt growth will decline from a peak of 12.9 per cent in 2011/12 to 5.8 per cent in 2014/15. Government borrowing projections include both the support of its operating and capital requirements and the retirement of existing debt that will mature during the fiscal plan period. Over the next three years, government will borrow $23.6 billion and retire $8.5 billion in maturing debt (see Table 1.21).
Budget and Fiscal Plan – 2012/13 to 2014/15
42
Three Year Fiscal Plan
Table 1.21 Provincial Borrowing Requirements
| | Updated | | Budget | | | | | |
| | Forecast | | Estimate | | Plan | | Plan | |
($ millions) | | 2011/12 | | 2012/13 | | 2013/14 | | 2014/15 | |
Total provincial debt (1) at beginning of year | | 45,154 | | 50,985 | | 57,603 | | 62,714 | |
New borrowing (2) | | 9,324 | | 8,388 | | 7,606 | | 6,867 | |
Direct borrowing by Crown corporations and agencies | | 609 | | 291 | | 261 | | 190 | |
Retirement provision (3) | | (4,152 | ) | (2,211 | ) | (2,806 | ) | (3,517 | ) |
Change in forecast allowance | | 50 | | 150 | | 50 | | 100 | |
Net change in total debt | | 5,831 | | 6,618 | | 5,111 | | 3,640 | |
Total provincial debt (1) at year end | | 50,985 | | 57,603 | | 62,714 | | 66,354 | |
Annual growth in debt (per cent) | | 12.9 | | 13.0 | | 8.9 | | 5.8 | |
(1) Debt is after deduction of sinking funds and unamortized discounts, and excludes accrued interest which is reported in the financial statements as an accounts payable.
(2) New long-term borrowing plus net change in short-term debt
(3) Sinking fund contributions, sinking fund earnings and net maturities of long-term debt (after deduction of sinking fund balances for maturing issues).
Taxpayer-supported debt is forecast to increase to $43.7 billion by 2014/15, up $8.9 billion from 2011/12, reflecting the significant investment in capital assets planned over the next three years. This includes a $3.3 billion increase due to capital spending on education and health facilities, a $2.5 billion increase in support of transportation projects, and a $1.5 billion increase for other initiatives. As well, direct operating debt is projected to increase by $1.6 billion.
The self-supported debt of commercial Crown corporations is forecast to increase to $22.3 billion by 2014/15, up $6.1 billion from 2011/12. The increase is primarily due to the additional investment in improving and expanding British Columbia’s hydro generation assets ($4.9 billion) and the construction of the Port Mann Bridge ($1.2 billion). Other self-supported debt is incurred to finance the Columbia River power projects and BC Lottery Corporation equipment and information systems.
Additional details on government’s outstanding debt are provided in Appendix Tables A17 to A19.
Debt affordability
The taxpayer-supported debt to GDP ratio is one of the indicators that investors use to measure government’s ability to service its debt load. As government implements its infrastructure investment plan to create jobs and stimulate the economy and protects core services, the ratio will rise to a peak level of 18.3 per cent in 2014/15. As government returns to balancing its budget and GDP returns closer to historical levels, this ratio will return to a downward trend and fall to 18.2 per cent in 2015/16. Also, taxpayer-supported interest costs continue to remain low, averaging 4.2 cents per dollar of revenue over the fiscal plan period.
Budget and Fiscal Plan – 2012/13 to 2014/15
43
Three Year Fiscal Plan
Chart 1.14 Taxpayer-supported debt remains fiscally sustainable

Relationship between debt and deficit
The change in debt will not equal the surplus/deficit due to:
· investment and working capital changes, including financing for the capital assets of commercial Crown corporations;
· capital and other asset changes, including taxpayer-supported capital spending and non-cash amortization costs included in the surplus/deficit; and
· other debt changes, including sinking fund balances, guarantees, and the non-guaranteed debt of commercial Crown corporations.
Table 1.22 reconciles forecast surplus/deficit with changes in debt.
Table 1.22 Reconciliation of Summary Results to Provincial Debt Changes
| | Updated | | Budget | | | | | |
| | Forecast | | Estimate | | Plan | | Plan | |
($ millions) | | 2011/12 | | 2012/13 | | 2013/14 | | 2014/15 | |
(Surplus) deficit for the year | | 2,497 | | 968 | | (154 | ) | (250 | ) |
Investment and working capital changes: | | | | | | | | | |
Cash and temporary investments — increase (decrease) | | (1,970 | ) | 309 | | 529 | | 531 | |
Other working capital changes | | (148 | ) | 1,121 | | (218 | ) | 175 | |
Financed assets of commercial Crown corporations | | 2,546 | | 2,525 | | 2,146 | | 1,501 | |
Commercial Crown corporation retained earnings | | 465 | | 388 | | 425 | | 401 | |
| | 893 | | 4,343 | | 2,882 | | 2,608 | |
Capital and other asset changes: | | | | | | | | | |
Taxpayer-supported capital spending | | 3,997 | | 3,757 | | 3,477 | | 3,429 | |
Amortization (non-cash expense included in the surplus) | | (2,027 | ) | (2,171 | ) | (2,205 | ) | (2,248 | ) |
Increase (decrease) in other assets (mainly prepaid expenses) | | 70 | | 6 | | 21 | | 15 | |
| | 2,040 | | 1,592 | | 1,293 | | 1,196 | |
Other debt changes: | | | | | | | | | |
Sinking fund balance — (increase) decrease | | 122 | | (279 | ) | 1,096 | | 93 | |
Guarantees and non-guaranteed debt — increase (decrease) | | 279 | | (6 | ) | (6 | ) | (7 | ) |
| | 401 | | (285 | ) | 1,090 | | 86 | |
Total provincial debt increase | | 5,831 | | 6,618 | | 5,111 | | 3,640 | |
Budget and Fiscal Plan – 2012/13 to 2014/15
44
Three Year Fiscal Plan
Risks to the Fiscal Plan
The major risks to the fiscal plan stem from changes in factors that government does not directly control. These include:
· assumptions underlying revenue and Crown corporation forecasts such as economic factors, commodity prices and weather conditions;
· the outcome of litigation, arbitrations, and negotiations with third parties;
· potential changes to federal transfer allocations, cost-sharing agreements with the federal government and impacts on the provincial income tax bases arising from federal tax policy and budget changes; and
· utilization rates for government services such as healthcare, children and family services, and income assistance.
In addition, changes in accounting treatment or revised interpretations of generally accepted accounting principles (GAAP) could have material impacts on the bottom line.
Table 1.23 summarizes the approximate effect of changes in some of the key variables on the surplus. However, individual circumstances and inter-relationships between the variables may cause the actual variances to be higher or lower than the estimates shown in the table. For example, an increase in the US/Cdn dollar exchange rate may be offset by higher commodity prices.
Table 1.23 Key Fiscal Sensitivities
| | | | Annual Fiscal Impact | |
Variable | | Increases of | | ($ millions) | |
Nominal GDP | | 1% | | $150 – $250 | |
Lumber prices (US$/thousand board feet) | | $50 | | $25 – $50 (1) | |
Natural gas prices (Cdn$/gigajoule) | | $1 | | $350 – $390 (2) | |
US exchange rate (US cent/Cdn $) | | 1 cent | | -$25 to -$40 | |
Interest rates | | 1 percentage point | | -$102 | |
Debt | | $500 million | | -$15 | |
(1) Sensitivity relates to stumpage revenue only. Depending on market conditions, changes in stumpage revenues may be offset by changes in border tax revenues.
(2) Sensitivities can vary significantly especially at lower prices.
Own Source Revenue
The main areas that may affect own source revenue forecasts are BC’s overall economic performance, the relative health of its major trading partners, the exchange rate and commodity prices.
Revenues are sensitive to economic performance. For example, taxation and other revenue sources are driven by economic factors such as personal income, retail sales, population growth and the exchange rate. The revenue forecast contained in the fiscal plan is based on the economic forecast detailed in Part 3: British Columbia Economic Review and Outlook. As well, it incorporates commodity price forecasts developed by the Ministry of Forests, Lands and Natural Resource Operations and the Ministry of Energy and Mines based on private sector information.
Budget and Fiscal Plan – 2012/13 to 2014/15
45
Three Year Fiscal Plan
Income tax revenue forecasts are based on projections of personal and corporate income. The forecasts are updated from reports on tax assessments provided by the Canada Revenue Agency. As a result, revenue estimates can be affected by timing lags in the reporting of current and prior year tax assessments by the Canada Revenue Agency.
Revenues in British Columbia can also be volatile, largely due to the influence of the cyclical natural resource sector in the economy and the importance of natural resource revenues in the province’s revenue base. Changes in commodity prices such as natural gas or lumber may have a significant effect on natural resource revenues.
Details on major assumptions and sensitivities resulting from changes to those assumptions are outlined in Appendix Table A5.
Softwood Lumber Agreement
On January 18, 2011, the United States requested arbitration with Canada under the Softwood Lumber Agreement of 2006 (SLA), claiming BC is breaching the SLA by subsidizing its forest industry through low stumpage rates. BC believes it has a strong case and it is expected the arbitration panel will validate that provincial timber pricing practices are in line with the SLA, as ensured by the province’s auction-based interior pricing system. The arbitration panel’s decision is not likely before the fall of 2012, and may take longer. In the interim, there is no change to BC’s market based stumpage system and the export tax on lumber shipments to the US will continue to be collected as determined under the SLA.
Release of Assets for Sale
Revenue to be realized on the sale of surplus corporate assets is dependent on a successful marketing program.
Federal Government Contributions
Potential policy changes regarding federal transfer allocations, including federal health transfers and cost-sharing agreements, could affect the revenue forecast.
Crown Corporations
Crown corporations have provided their own forecasts. These forecasts, as well as their statements of assumptions, were used to prepare the fiscal plan. The boards of those corporations and agencies have also included these forecasts, along with further details on assumptions and risks, in the service plans being released with the budget.
Factors such as energy prices, water inflows into the BC Hydro system, accident trends, interest/exchange rates, decisions of an independent regulator, or pending litigation could significantly change actual financial results over the forecast period. BC Hydro’s and ICBC’s results may be affected by the outcome of BC Utilities Commission decisions on current and future rate applications.
SUCH Sector
Health authorities have submitted balanced financial plans for 2012/13 to 2014/15 based on policy assumptions provided by the Ministry of Health. These plans have been signed off by the board chairs of the respective health authorities. As funding allocations for
Budget and Fiscal Plan – 2012/13 to 2014/15
46
Three Year Fiscal Plan
2014/15 have not been finalized, the health authority plans reflect status quo funding in that year. Notional funding allocations have been reported at the ministry level pending final discussions with the health authorities. The Ministry of Health will continue to work with the health authorities to manage any emerging revenue and spending risks and spending pressures.
Forecasts for the universities, colleges, and institutions have been signed off by chairs of the board or audit committee and lead financial officers.
Forecasts for the combined school districts have been compiled by the Ministry of Education based on the requirements of the School Act, the current year plans developed by the school districts, and ministry policy assumptions respecting future funding allocations. Variances from these assumptions could impact the fiscal plan.
Spending
Government funds a number of demand-driven programs, including those delivered through third party delivery agencies, such as healthcare, K—12 and post-secondary education, income assistance, and community social services. The budgets for these programs reflect reasonable estimates of demand and other factors such as price inflation. If demand is higher than estimated, this will result in a spending pressure to be managed.
The spending plans for the Ministry of Forests, Lands and Natural Resource Operations and the Ministry of Justice include base amounts to fight wildfires and deal with other emergencies such as floods. Unanticipated occurrences may affect expenses in these ministries.
Details on major assumptions and sensitivities resulting from changes to those assumptions are shown in Appendix Table A7 and in ministry service plans.
Public Sector Compensation Mandate
Virtually all of BC’s public sector is now covered by collective agreements settled under the 2010 Net Zero mandate, with the main exception being the teachers, bargaining through the BC Teachers’ Federation. Collective agreements that expired in 2010 and 2011 and that have not yet been renegotiated are still expected to meet the 2010 Net Zero mandate for two years. Under this mandate, parties can fund any improvements in the collective agreements by finding savings from changes to other parts of those agreements.
For collective agreements effective 2012, the government’s main priority remains unchanged — i.e. balance the budget while continuing to provide essential services to the public. As in 2010, the government will not provide additional funding for increases in compensation negotiated through collective bargaining.
The new 2012 Cooperative Gains mandate applies to all public sector employers whose collective agreements expire on or after December 31, 2011. The key feature of this mandate is that it provides public sector employers with the ability to negotiate modest wage increases made possible by a combination of productivity increases, efficiencies and savings found within existing budgets. However, government has been clear that employers may not reduce service levels and may not transfer the costs of existing services to the public in order to fund compensation increases.
Budget and Fiscal Plan – 2012/13 to 2014/15
47
Three Year Fiscal Plan
Contingencies Vote
The allocation to contingencies is a prudent budgeting measure that protects the fiscal plan from unforeseen and unbudgeted costs that may arise, and from pressures for costs that are currently budgeted based on estimates whose final values are impacted by external events or prices.
As previously noted, the Contingencies vote also included notional allocations for income assistance, Community Living British Columbia (CLBC) and the justice system due to uncertainty around the outcomes of the various reviews and the final amounts that would be required. Budget 2012 will therefore draw down the Contingencies vote by $153 million in 2012/13 and by $203 million in 2013/14 and 2014/15 and reallocate funding to the Ministry of Justice and Ministry of Social Development budgets.
Table 1.24 Draw Down of the Contingencies Vote
($ millions) | | 2012/13 | | 2013/14 | | 2014/15 | |
Budget 2011 Contingencies Allocation | | 453 | | 453 | | 453 | |
Less: Draw down of the contingencies allowance to provide base budget adjustments for income assistance caseload pressures, Community Living BC and the justice system | | (153 | ) | (203 | ) | (203 | ) |
Budget 2012 Contingencies Allocation | | 300 | | 250 | | 250 | |
Budget 2012 includes notional allocations of $12 million annually to further support anticipated CLBC caseload increases, and $36 million for costs related to the upcoming provincial election. As well, Budget 2012 continues to include funding for two specific allocations that were established in Budget 2010 — the 2010 Sports and Arts Legacy and Climate Action and Clean Energy initiatives — that are being managed from the Contingencies vote.
Finally, there is a cost pressure to government as a result of having to rehire PST administrative and auditing staff due to the transition from the HST. Due to ongoing discussions with the federal government regarding staffing details, costs and the timing have not been finalized. However, when known an allocation may be required from contingencies.
Table 1.25 Notional Allocations to Contingencies
($ millions) | | 2012/13 | | 2013/14 | | 2014/15 | |
2010 Sports and Arts Legacy | | 20 | | — | | — | |
Climate action and clean energy initiatives | | 40 | | — | | — | |
Community Living BC anticipated caseload increases | | 12 | | 12 | | 12 | |
Elections BC event-related funding | | 36 | | — | | — | |
Subtotal notional allocations | | 108 | | 12 | | 12 | |
Reserved for unforeseen pressures related to litigation, caseload, natural disasters, and other contingent items | | 192 | | 238 | | 238 | |
Total contingencies | | 300 | | 250 | | 250 | |
Budget and Fiscal Plan – 2012/13 to 2014/15
48
Three Year Fiscal Plan
Treaty Negotiations and the New Relationship
BC continues to negotiate treaties and incremental treaty agreements with a number of First Nations. While implementation and settlement costs associated with existing Final Agreements have been accounted for in the fiscal plan, the outcomes of other treaty negotiations and their ratification process could affect both the economic outlook and the fiscal plan.
Government is also committed to negotiating new revenue-sharing agreements and reconciliation agreements with First Nations to streamline consultation on natural resource decisions, provide increased certainty for investors, and provide new economic opportunities to communities. Where agreements have been concluded, the costs associated with those agreements have been accounted for in the fiscal plan. The number of possible new commitments is uncertain, and government will need to accommodate associated fiscal plan impacts as individual negotiations progress.
The province is also involved in litigation with First Nations relating to aboriginal rights. Settlement of these issues, either in or out of court, may result in additional costs to government.
Capital Risks
The capital spending forecasts assumed in the fiscal plan may be affected by bids and proposals resulting in project costs that are higher than the initial approved budgets. For large projects, government will review the budget and scope risks, and the strategies to mitigate these risks.
Other risks impacting capital spending forecasts include:
· weather and geotechnical conditions, including the outcome of environmental impact studies, causing project delays or unusual costs;
· changes in market conditions, including service demand, the impact of inflation on building material costs, the availability of and wage rates for skilled workers, and borrowing costs;
· the accuracy of capital project forecasts, including planned construction schedules;
· the successful negotiation/timing of cost-sharing agreements with the federal government and other funding partners; and
· the success of public-private sector partnership negotiations.
Pending Litigation
The spending plan for the Ministry of Justice contains provisions for payments under the Crown Proceedings Act based on estimates of expected claims and related costs of settlements likely to be incurred. Litigation developments may occur that are beyond the assumptions used in the plan (for example, higher-than-expected volumes, or size of claim amounts and timing of settlements). These developments may affect government revenues and/or expenditures in other ministries.
Budget and Fiscal Plan – 2012/13 to 2014/15
49
Three Year Fiscal Plan
One-time Write-downs and Other Adjustments
Ministry budgets provide for anticipated levels of asset or loan write-downs where estimates can be reasonably predicted. The overall spending forecast does not make allowance for extraordinary items other than the amount provided in the Contingencies vote.
Accounting Policy Changes
In the fall of 2011/12, the Public Sector Accounting Board (PSAB) issued guidance on refundable tax transfers that has a significant impact on both revenue and expense, but no bottom line impact(1). Previously, refundable tax transfers were netted from revenue; the PSAB guidance defines these transfers as financial benefits paid through the tax system for a purpose other than the relief of taxes and directs that these transfers be shown as an expense. While there is statutory appropriation for tax transfers, for transparency an estimate of the annual expense is included in the Tax Transfers Vote in Other Appropriations. See Table 1.9 for annual transfer amounts.
PSAB also directed that commissions paid to agents for the collection of taxes should be expensed instead of being netted from revenue. While PSAB guidance was silent with respect to commissions paid for the collection of non-tax revenue, for transparency and consistency government has decided to expense all commissions paid for the collection of revenue, regardless of its source. This change too will increase both revenue and expense, with no impact to the summary net results.
Resolution of Other Accounting Policy Issues
A number of exposure drafts on adjustments in those standards are being circulated by the Public Sector Accounting Board (PSAB) for comment from the accounting profession. This includes issues such as valuation of financial instruments and foreign currency translation. Decisions on these issues by the PSAB may impact government’s financial statements.
(1) Refundable transfers are transfers available to all income tax filers, regardless of whether they paid any income tax, as opposed to tax credits that are only available for relief of income taxes paid or owing.
Budget and Fiscal Plan – 2012/13 to 2014/15
50
Three Year Fiscal Plan
Release of Surplus Corporate Assets for Economic Generation
As a key component of its ongoing mandate to ensure government’s resources are efficiently and appropriately allocated and recognizing the need to explore opportunities in all sectors of government, the Province undertook a targeted review of its major asset base to identify those that were surplus to its needs and no longer offered a financial or strategic ownership benefit.
The results of this initiative will see a number of surplus properties and assets released for sale over the next number of years. The sale of these surplus properties and assets will not only provide much needed revenue to the Province but will also generate economic activity such as development and new business opportunities in communities around British Columbia.
Defining Surplus
Surplus properties and assets were determined to be those that are no longer in use, not required for future utilization, or those properties and assets where there was no strategic benefit for the province to be the owner.
Real estate assets that were classified as a strategic priority and are not included in the inventory are those properties whose ownership is essential to the delivery of a government funded service, for example: hospitals, jails, schools and other special purpose facilities currently used for delivery of services, and assets that are being held for an identified future need of the government as approved by Cabinet or one of its committees.
Approach
The surplus properties and assets of all organizations in the government reporting entity including ministries, the SUCH sector entities (schools, universities, colleges and health authorities) and Crown corporations and agencies were considered in the development of the inventory of surplus properties and assets.
Properties and assets will be marketed by the responsible agencies as part of their established business practices over the course of the next eighteen months.
In some cases, the sale of an asset will make available the necessary capital for future development within a sector, as in school districts and health authorities.
The province respects the need to consult with First Nations on the disposition of any Crown lands.
Profile of Surplus Properties and Assets
The surplus properties identified represent less than 2 per cent of the value of overall property holdings of the province.
Generally the assets identified for disposal have an assessed value of $1 million and higher and are able to be marketed within the 2013/14 and 2014/15 fiscal years.
With over 100 properties and assets identified as surplus through its initial review, the Province has estimated a net gain of approximately $700 million over the fiscal plan period on the disposal of a portion of those properties and assets.
Properties under consideration include surplus land acquired for the development of transportation corridors, vacant parcels of Crown land and a number of long standing provincial holdings that are more appropriately developed by the private sector.
The inventory of surplus corporate assets includes, for example, a parking lot near the Legislative buildings in Victoria, six hectares of vacant land in Surrey zoned for commercial and multi-family use, and a seven hectare site north of Kelowna that was being tentatively held for the new correctional facility that will now be built near Oliver.
Additionally, government has recently announced its intention to sell its Liquor Distribution warehousing facilities and associated distribution services to the private sector.
Budget and Fiscal Plan – 2012/13 to 2014/15
51
Three Year Fiscal Plan
Achieving Increased Efficiencies in the SUCH sector
The Challenge
Given the cost pressures in the SUCH sector, much of which is driven by population growth as well as cost inflation, new technologies, etc., government is working with the health authorities, school districts, and post-secondary institutions to find administrative savings and other efficiencies in order to protect front-line services while at the same time meeting fiscal plan objectives. In the face of slow growth in government revenues and budget pressures in all sectors, it is critical that savings be generated by finding innovative ways of delivering services that minimize unnecessary overhead costs and duplication.
Health Sector
These types of cost saving initiatives have been ongoing in the health sector since the onset of the worldwide financial crisis in 2008. Formally launched in the beginning of 2009, the Ministry of Health announced the creation of Health Shared Services BC (HSSBC), an organization comprised of representatives from the six health authorities, which targeted $150 million in savings over five years. HSSBC’s goal is to identify savings through such means as leveraging the buying power of the Health Authorities to undertake joint purchasing agreements for supplies, coordination of contracted services such as information technology, consolidation of “supply chain” services, and avoidance of capital spending by cooperating on less costly solutions.
According to HSSBC, the projected total procurement savings generated during its first five years of operation (February 2009 — March 2014), taking into account contracts signed to-date, is $200 million. This will surpass the $150 million in savings first identified, after less than two years of operation.
A second Ministry of Health effort in achieving efficiencies is the Lower Mainland Consolidation (LMC) project, which began in mid-2009. The focus of this initiative is to consolidate administrative, support, and other “back-office” functions across the participating Lower Mainland Health Authorities and related organizations. These include the Vancouver Coastal and Fraser Health Authorities, as well as the Provincial Health Services Authority and Providence Health Care. A governance committee is chaired by the Deputy Minister of Health.
The three year LMC project is expected to achieve annual budget savings of $100 million by the end of the 2012/13 fiscal year (roughly 10 per cent of in-scope services estimated at $1 billion), and as of 2011/12, budget reductions of approximately $55 million have been identified. The types of functions that are included in the exercise are support functions relating to human resource administration, communications, facilities management, information management, security and parking services, laboratory services, diagnostic/medical imaging, pharmacy services, biomedical engineering, and other related services.
K—12 Sector
The Ministry of Education and the school districts are continually attempting to find efficiencies in order to maximize the amount of funding that is channelled directly to the classroom. Given that an increase to block funding is not possible in the current fiscal climate, the ministry is taking further steps to find savings in non-instructional areas that leave instructional services delivered in our schools intact.
More specifically, the public school sector annually spends approximately $840 million on district administration, operations and maintenance, and transportation services. As is the case with the Ministry of Health, the sector is working toward shared service approaches to enable more effective use of funds to support student learning.
Budget and Fiscal Plan – 2012/13 to 2014/15
52
Three Year Fiscal Plan
With shared arrangements, there is an opportunity for the 17 school districts in the lower mainland to more efficiently deliver $400 million of “outside the classroom” services. Potential savings could range from 3 to 8 per cent annually. In addition, province-wide progress is being made with:
· joint tendering and purchasing of transportation services across regions and provincially;
· reducing rates charged for voice services under the provincially-negotiated Telus contract that also provides these services to school districts; and
· centralized Worksafe BC claims management.
Post-secondary Institutions
To meet the savings target established by government in Budget 2012, the post-secondary sector may be able to benefit from the experience and lessons learned by the other SUCH sector agencies, or other provinces.
As noted above, health authorities have found opportunities to improve cost-effectiveness by working collaboratively to streamline common services and get the most value for every dollar spent. There are opportunities for the post-secondary education system to do something similar, and to maximize resources going directly to students, researchers and educational programming.
In the provincial health sector’s regional-based shared services project, efficiencies are being found in administrative, corporate support, back-office, and other functions across health providers. Another model for consideration is establishing regional or province-wide Centres of Excellence for function-specific delivery, such as capital project management or procurement services. The post-secondary sector in Ontario is also undertaking an initiative to find similar sources of savings though using tools such as collective purchasing of materials and equipment, and common procurement of certain information technology services.
It is recognized that government’s relationship with BC’s post-secondary sector may be diffrerent than with other SUCH organizations, and that efficiencies achieved by other SUCH organizations may not apply to the post-secondary sector in exactly the same manner; however, post-secondary institutions looking to find efficiencies while not compromising “front-line” service offerings should be able to take advantage of the insights developed by the other sectors from their savings initiatives.
The Ministry of Advanced Education will work with the institutions in the sector to provide the necessary leadership, structure, and coordination in establishing a process to identify the nature and extent of savings that need to be found in the relevant areas of their operations.
The planned budget reductions to the sector in the out-years are not aimed at students, education programs or research. The Province will take a “common sense” approach to exploring ways where system-wide, administrative back office functions and procurement can be streamlined to enhance value and save taxpayer resources.
Budget and Fiscal Plan – 2012/13 to 2014/15
53
Three Year Fiscal Plan
The Justice System in British Columbia
The paradox: “Inputs” into the justice system are down; yet costs and delays are up
Overall justice system indicators are positive, particularly in the area of criminal justice — a 33 per cent drop in the crime rate over the past six years; and a decline in new provincial criminal court cases. However, despite these improvements and the implementation of a number of reform initiatives to increase efficiencies and alleviate pressures on the justice system, delays in the justice system are growing as are costs — adult criminal justice costs increased by 35 per cent in the past six years.
Deputy Ministers’ / Internal Audit Review
In the fall of 2011, a Deputy Ministers’ Working Group was established to assess increasing resource demands in the justice system. A detailed program review of the Ministry of Attorney General and the Ministry of Public Safety and Solicitor General was completed by the Internal Audit and Advisory Services Branch, Ministry of Finance. The review validated cost pressures in the justice system as both real and escalating, while acknowledging that BC does not appear to be as efficient as some jurisdictions in Canada.
In addition, the review identified: the need for a system-wide integrated approach to providing justice services among the two ministries, including integrated performance measures or metrics to allow for system planning and evaluation of justice reforms; and the linkage of resourcing requests with system performance.
Budget 2012
On February 8, 2012 the Ministries of Attorney General and Public Safety and Solicitor General were amalgamated to improve justice system coordination.
Budget 2012 allocates an additional $237 million over the next three years to stabilize justice system capacity at status quo levels while further work is completed over the medium to longer-term to implement systemic reforms to improve justice services and outcomes for British Columbians and their families.
Budget 2012 additional funding is in part a reallocation of internal ministry savings from the consolidation of management services and the drawdown of the Contingencies vote.
Rethinking Our Approach to Justice
Reforms are required to improve the performance and efficiency of the justice system. However, there are real challenges in fixing the system. These include the complexity of the overall system, the entrenched culture and the traditions of the system, the interpretation of independence, and limited system-wide strategic and business practices.
Steps to Reform
To reach an appropriate, well-supported and well-informed strategy to reform the justice system the province will, as outlined in the Green Paper on Modernizing British Columbia’s Justice System released on February 8, 2012:
1. Conduct a short-term review of justice reform considerations, led by Geoffrey Cowper, QC who will report to the Minister of Justice in July 2012;
2. Engage with stakeholders and the public; and
3. Based on the above, develop a concrete plan of action on justice reform. Government anticipates the distribution of a White Paper detailing this action plan on justice reform in September 2012.
Budget and Fiscal Plan – 2012/13 to 2014/15
54
Three Year Fiscal Plan
Community Living British Columbia
Reviews of CLBC
Throughout the fall and early winter of 2011 two separate reviews of CLBC were completed by the CLBC Board of Directors, and by the Ministry of Finance, Internal Audit and Advisory Services Branch.
A Deputy Minister’s Working Group was convened in September 2011 to look at the suite of services and programs that families of individuals with developmental disabilities receive from across government, including CLBC Services.
Key Findings of the Reviews
· CLBC funds are well managed; caseload growth is real, though the tools used to measure this pressure are ineffective and misleading. For example, the Request for Services List (RFSL) is an inaccurate assessment of need. Internal Audit found that 42 per cent of the high priority files it tested from the RFSL were in error.
· BC is among the more generous of Canadian jurisdictions in funding services for people with disabilities and is seen as a leader in services to people with developmental disabilities in Canada.
· Multi-ministry service supports to individuals with developmental disabilities are fragmented, use different eligibility and assessment criteria, and are frequently misunderstood or completely overlooked.
· Planning for the transition of youth from the Ministry of Children and Family Development to CLBC is not working well for many individuals and their families.
· A more tailored approach, including individualized funding, must be accelerated and supported so the system puts individuals at the centre.
Plan Going Forward
In January 2012, government announced a comprehensive 12-Point Plan to address issues and concerns around CLBC and the government-wide system of supports for British Columbians with developmental disabilities.
Key components of the 12-Point Plan include:
· development of a “one-government” policy framework to improve planning and collaboration across government and to ensure that individuals’ needs are at the centre of all decisions;
· increasing employment services planning and supports, as well as alternative day programming options;
· implementing a consistent assessment platform across all ministries to ensure consistency and clarity of needs assessment and planning for individuals and families;
· use of a coherent system to track demand, wait times and service delivery across relevant ministries and CLBC; and
· support greater utilization of individualized funding as part of the broader disability assistance policy reform.
Budget 2012
Government recognized challenges existed in CLBC and had assigned a notional amount in the Contingencies vote in anticipation of review outcomes.
Budget 2012 will draw down the contingencies vote to provide a base budget lift to the Ministry of Social Development to improve services for individuals with developmental disabilities and their families by increasing funding by $38 million in 2012/13, $48 million in 2013/14 and $58 million in 2014/15.
In addition, Budget 2012 will also notionally track an additional $12 million in the Contingencies vote to support caseload increases.
Timelines and Next Steps
A cross-ministry action team is being established with CLBC with the expectation of developing a cross-ministry assessment platform and a one-government funding envelope by the spring of 2012.
Budget and Fiscal Plan – 2012/13 to 2014/15
55
Part 2: TAX MEASURES
Table 2.1 Summary of Tax Measures
| | | | Taxpayer Impacts | |
| | Effective Date | | 2012/13 | | 2013/14 | |
| | | | ($ millions) | |
Income Tax Act | | | | | | | |
· Introduce BC Seniors’ Home Renovation Tax Credit | | April 1, 2012 | | (27 | ) | (27 | ) |
· Introduce Children’s Fitness Credit and Children’s Arts Credit | | January 1, 2012 | | (9 | ) | (9 | ) |
· Remove medical expense credit expenditure limit for other dependents | | January 1, 2012 | | * | | * | |
· Increase the enhanced dividend tax credit rate | | January 1, 2012 | | (7 | ) | (7 | ) |
· Extend BC Training Tax Credits for three years to December 31, 2014 | | January 1, 2012 | | (31 | ) | (31 | ) |
· Introduce training tax credits for shipbuilding and ship repair industry employers | | Regulation | | — | | (3 | ) |
· Extend Book Publishing Tax Credit for five years to March 31, 2017 | | April 1, 2012 | | (2 | ) | (2 | ) |
· Allow full Film Incentive BC tax credits for eligible interprovincial co-productions | | January 1, 2012 | | (2 | ) | (2 | ) |
· Clarify tax credits for cutscene productions | | September 1, 2010 | | * | | * | |
| | | | | | | |
Small Business Venture Capital Act | | | | | | | |
· Increase equity tax credit budget by $3 million per year for investments in eligible new small businesses | | Regulation | | (3 | ) | (3 | ) |
| | | | | | | |
Medicare Protection Act | | | | | | | |
· Increase Medical Services Plan premiums by about 4 per cent and enhance premium assistance | | January 1, 2013 | | 22 | | 87 | |
| | | | | | | |
Carbon Tax Act | | | | | | | |
· Clarify tax rates continue at $30 per tonne after June 30, 2013 | | July 1, 2013 | | * | | * | |
· Clarify commercial marine services refunds | | February 22, 2012 | | * | | * | |
| | | | | | | |
Carbon Tax Act and Motor Fuel Tax Act | | | | | | | |
· Streamline obligations related to fuel imported by ship | | May 1, 2012 | | * | | * | |
| | | | | | | |
Motor Fuel Tax Act | | | | | | | |
· Exempt jet fuel used in international flights | | April 1, 2012 | | (12 | ) | (12 | ) |
| | | | | | | |
Insurance Premium Tax Act | | | | | | | |
· Clarify classes of insurance definitions | | July 1, 2012 | | * | | * | |
| | | | | | | |
Home Owner Grant Act | | | | | | | |
· Increase home owner grant phase-out threshold | | 2012 tax year | | * | | * | |
· Raise thresholds for income-tested home owner grant | | 2012 tax year | | * | | * | |
· Introduce low-income veteran’s supplement | | 2012 tax year | | * | | * | |
· Extend home owner grant for individuals moving into a residential facility | | 2012 tax year | | * | | * | |
| | | | | | | |
School Act | | | | | | | |
· Set provincial residential school property tax rates | | 2012 tax year | | * | | * | |
· Set provincial non-residential school property tax rates | | 2012 tax year | | * | | * | |
| | | | | | | |
Taxation (Rural Area) Act | | | | | | | |
· Set provincial rural area property tax rates | | 2012 tax year | | * | | * | |
· Clarify exemption for property held in trust for a First Nation | | 2012 tax year | | * | | * | |
| | | | | | | |
Taxation (Rural Area) Act and School Act | | | | | | | |
· Provide authority for certain partial property tax exemptions | | 2011 tax year | | * | | * | |
| | | | | | | |
Police Act | | | | | | | |
· Streamline approval of police tax administration fee | | 2012 tax year | | * | | * | |
| | | | | | | |
Land Tax Deferment Act | | | | | | | |
· Remove fire insurance requirement for home owners with sufficient equity | | 2012 tax year | | * | | * | |
· Clarify eligibility of leaseholders to defer tax | | 2012 tax year | | * | | * | |
| | | | | | | |
Property Transfer Tax Act | | | | | | | |
· Introduce general refund provision | | Royal Assent | | * | | * | |
· Exempt re-registration of certain life estates | | Royal Assent | | * | | * | |
| | | | | | | |
Subtotal | | | | (71 | ) | (9 | ) |
Budget and Fiscal Plan — 2012/13 to 2014/15
Tax Measures
Table 2.1 Summary of Tax Measures — Continued
| | | | Taxpayer Impacts | |
| | Effective Date | | 2012/13 | | 2013/14 | |
| | | | ($ millions) | |
Transition to provincial sales tax | | | | | | | |
Income Tax Act | | | | | | | |
· Eliminate BC HST Credit | | April 1, 2013 | | — | | 315 | |
· Re-implement BC Sales Tax Credit | | January 1, 2013 | | (13 | ) | (53 | ) |
· Reverse basic personal amount tax credit enhancement | | January 1, 2013 | | 36 | | 195 | |
· Introduce BC First-Time New Home Buyers’ Bonus | | February 21, 2012 | | (24 | ) | — | |
| | | | | | | |
Sales Tax | | | | | | | |
· Increase BC HST New Housing Rebate threshold to $850,000 from $525,000 ** | | April 1, 2012 | | (60 | ) | — | |
· Eliminate BC HST ** | | April 1, 2013 | | — | | (6,326 | ) |
· Re-implement provincial sales tax | | April 1, 2013 | | — | | 5,819 | |
· Continue tax on private sales of vehicles, boats and aircraft | | April 1, 2013 | | * | | * | |
| | | | | | | |
Motor Fuel Tax Act | | | | | | | |
· Re-implement motor fuel tax on propane | | April 1, 2013 | | — | | 4 | |
| | | | | | | |
Tobacco Tax Act | | | | | | | |
· Adjust tobacco tax rates to keep total tax constant | | April 1, 2013 | | — | | 75 | |
| | | | | | | |
Subtotal | | | | (61 | ) | 29 | |
Total | | | | (132 | ) | 20 | |
* Denotes measures that have no material impact on taxpayers.
** These measures will require changes to the Excise Tax Act (Canada).
Tax Measures — Supplementary Information
For more details on tax changes see:
www.sbr.gov.bc.ca/msbr/budget/budget.html
Income Tax Act
BC Seniors’ Home Renovation Tax Credit Introduced
Effective for the 2012 and future tax years, the government intends to introduce a Seniors’ Home Renovation Tax Credit. The credit will be a new refundable personal income tax credit to assist with the cost of permanent home renovations that provide individuals age 65 and over with increased independence, allowing them the flexibility to remain in their own homes longer.
The maximum credit will be $1,000 annually calculated as 10 per cent of eligible expenditures. The credit will be available to individuals who incur eligible expenditures on or after April 1, 2012. The credit can be claimed by seniors, whether they own their home or rent, and by individuals who share a home with a senior relative.
Legislation will be introduced later this year at which time a list of eligible expenditures will be available. However, the government intends to include the following as eligible expenditures:
· upgrades to improve accessibility, including handrails, grab bars, walk-in bathtubs and wheel-in showers;
· wheelchair ramps, lifts and elevators;
· motion-activated lighting; and
· certain renovations to allow a first-floor occupancy or secondary suite for a senior relative.
Budget and Fiscal Plan – 2012/13 to 2014/15
57
Tax Measures
Below are some expenditures that the government intends to exclude from eligibility:
· general maintenance, including roof repairs, windows, flooring, insulation and painting;
· standard appliances;
· equipment for medical monitoring and home security; and
· services, including home care, housekeeping and gardening.
The credit will be claimed when individuals file their personal income tax return.
Children’s Fitness Credit and Children’s Arts Credit Introduced
Effective for the 2012 and future tax years, a new Children’s Fitness Credit and a new Children’s Arts Credit are introduced.
The Children’s Fitness Credit is a non-refundable tax credit of 5.06 per cent of eligible expenditures up to $500 for each child, providing a benefit of up to $25 per child. The Children’s Arts Credit is a non-refundable tax credit of 5.06 per cent of eligible expenditures up to $500 for each child, providing a benefit of up to $25 per child.
For both the Children’s Fitness Credit and the Children’s Arts Credit, eligible expenditures are those that qualify for the federal children’s fitness credit and children’s arts credit.
Medical Expense Credit Expenditure Limit for Other Dependents Removed
Effective for the 2012 and future tax years, the $10,000 limit that applied to medical expenses claimed in respect of dependents, other than a spouse or minor child, is eliminated.
Enhanced Dividend Tax Credit Rate Increased
Effective for the 2012 and future tax years, the dividend tax credit rate on eligible dividends is increased from 9.76 per cent to 10 per cent.
BC Training Tax Credits Extended
As announced on September 21, 2011, the BC Training Tax Credits are extended for an additional three years to the end of 2014.
Training Tax Credits for Shipbuilding and Ship Repair Industry Employers Introduced
To support British Columbia’s shipbuilding and ship repair industry efforts under the National Shipbuilding Procurement Strategy and to support marine industry jobs, new training tax credits are introduced for eligible employers that employ apprentices in the British Columbia shipbuilding and ship repair industry.
Eligible shipbuilding and ship repair industry employers can receive a refundable tax credit of 20 per cent of wages paid per year, up to $5,250, per eligible apprentice in the first 24 months of an eligible apprenticeship program and can also receive similar credits based on an apprentice’s completion of higher training levels.
Budget and Fiscal Plan – 2012/13 to 2014/15
58
Tax Measures
Shipbuilding and ship repair industry employer tax credits are enhanced by 50 per cent in respect of apprentices who are First Nations individuals or persons with disabilities.
Eligible shipbuilding and ship repair industry employers that claim the new training tax credits will not be eligible to claim training tax credits under the existing training tax credit program. The training tax credits for shipbuilding and ship repair industry employers will be made effective by regulation and will expire at the end of 2019.
Book Publishing Tax Credit Extended
The corporate income tax Book Publishing Tax Credit is extended for an additional five years to March 31, 2017.
Full Film Incentive BC Tax Credits for Eligible Interprovincial Co-productions Allowed
Under the Film Incentive BC tax credit, interprovincial co-productions are subject to a reduction in the credit when corporations own less than 100 per cent of the copyright. This copyright grind is removed and copyright ownership requirements for interprovincial co-productions are amended for productions with principal photography starting on or after January 1, 2012.
Tax Credits for Cutscene Productions Clarified
Regulations are amended to clarify that cutscene productions are eligible activities under the Interactive Digital Media Tax Credit, provided all other requirements of the credit are met, and effective September 1, 2010, the regulations are clarified to exclude cutscene productions from British Columbia’s film tax credits.
Generally, cutscenes are non-interactive animated or live action scenes included in a video game to provide storyline, character development or context.
Small Business Venture Capital Act
Equity Tax Credit Budget Increased
As announced on September 21, 2011, effective for the 2012 program year, the budget for the Small Business Venture Capital Program is increased by $3 million to provide tax credits for direct investments in eligible new corporations.
Under the Program, eligible investors can receive an income tax credit of 30 per cent of their investment in eligible business corporations up to an annual limit of $60,000. An eligible new corporation must:
· qualify as an eligible business corporation under the Act,
· have been incorporated for less than two years, and
· must be doing business in a targeted sector: community diversification; development of interactive digital media products; clean technology; prescribed manufacturing and processing; destination tourism; or research and development of proprietary technology.
The $3 million increase will allow for up to $10 million in additional equity financing for qualifying new businesses in 2012, 2013 and 2014.
Budget and Fiscal Plan – 2012/13 to 2014/15
59
Tax Measures
Medicare Protection Act
Medical Services Plan Premiums Increased and Premium Assistance Enhanced
Medical Service Plan premiums are increased effective January 1, 2013, to help fund health care for British Columbians.
Maximum monthly premium rates will increase by about 4 per cent or $2.50 per month to $66.50 for single persons, by $4.50 per month to $120.50 for two person families and by $5 per month to $133 for families of three or more persons.
Also effective January 1, 2013, premium assistance is enhanced to ensure those receiving assistance will not be affected by the increase. Details will be available later in 2012.
Carbon Tax Act
Carbon Tax Rates Clarified
Carbon tax rates are scheduled to increase on July 1, 2012 to be equivalent to $30 per tonne of carbon dioxide equivalent (CO2e). The Act is amended to clarify that the carbon tax continues beyond June 30, 2013 at the same rate of $30 per tonne of CO2e
Commercial Marine Services Refunds Clarified
Effective February 22, 2012, amendments are made to clarify the distinction between an intra-provincial leg and an inter-jurisdictional leg of a marine trip by a commercial marine service to ensure that refunds of carbon tax are only provided for fuel used inter-jurisdictionally.
Carbon Tax Act and Motor Fuel Tax Act
Obligations Related to Fuel Imported by Ship Streamlined
Effective May 1, 2012, the obligations of collectors, retail dealers, and purchasers for fuel imported by ship into British Columbia are amended to be generally more consistent with the federal obligations regarding fuel imported by ship. These amendments streamline the compliance burden on importers.
Motor Fuel Tax Act
Jet Fuel used in International Flights Exempted
Effective April 1, 2012, the refund for jet fuel used for the cargo portion of a fight that begins or ends outside North America is expanded to provide an exemption and refund for jet fuel used in all international passenger and cargo flights, including flights to the United States.
Insurance Premium Tax Act
Classes of Insurance Definitions Clarified
Effective July 1, 2012, an amendment to the Act introduced by the Insurance Amendment Act, 2009 is brought into force. The amendment repeals classes of insurance definitions
Budget and Fiscal Plan – 2012/13 to 2014/15
60
Tax Measures
and allows those classes to be defined by regulation. The regulation will reference the new Classes of Insurance Regulation under the Financial Institutions Act, which is also effective July 1, 2012. This does not change the application of tax.
Home Owner Grant Act
Threshold for Home Owner Grant Phase-out Increased
As announced on January 3, 2012, the threshold for the phase-out of the home owner grant is increased from $1,150,000 to $1,285,000 for the 2012 tax year. This increase ensures that at least 95 per cent of homeowners are eligible for the full grant, consistent with longstanding government policy.
For properties valued above the threshold of $1,285,000, the grant is reduced by $5 for every $1,000 of assessed value in excess of the threshold.
Thresholds for Income-Tested Home Owner Grant Raised
The home owner grant allows low-income seniors and certain other low-income individuals to qualify for the full home owner grant despite the value of their homes.
Effective for the 2012 tax year, the income threshold below which home owners may qualify for the full benefit is increased from $28,000 to $30,000. The income threshold for a partial benefit is increased from $30,000 to $32,000. The income threshold is based on adjusted net income as defined by regulation.
Low-Income Veteran’s Supplement Introduced
As announced on November 10, 2011, effective for the 2012 and future tax years, the Act is amended to create a veteran’s supplement for qualifying low-income veterans under the age of 65 who have served in the Canadian Forces as officers or non-commissioned members.
The supplement is intended to provide low-income veterans with the same home owner grant enhancements that already apply to seniors, some persons with disabilities and their families, and certain veterans of older conflicts and their spouses.
Eligible low-income veterans will receive a home owner grant supplement which:
· is up to $275 (the difference between the current basic and senior’s grant amounts);
· effectively lowers the minimum tax payable before enhanced benefits begin from $350 to $100; and
· replaces some or all of any reduction in the basic grant amount related to high-valued homes.
The income test is based on the previous year’s income. The income threshold below which veterans may qualify for the full supplement is $30,000. The income threshold for a partial supplement is $32,000. The income threshold is based on adjusted net income as defined by regulation.
Budget and Fiscal Plan – 2012/13 to 2014/15
61
Tax Measures
A veteran will be required to apply through the local property tax collector for the basic home owner grant. After this application is approved, a separate application for the supplement must be made directly to the Home Owner Grant Administrator. For more information on the application procedure, please see http://www.sbr.gov.bc.ca/msbr/budget/budget.html.
Home Owner Grant Extended for Individuals Moving into a Residential Facility
Effective for the 2012 and future tax years, the Act is amended to allow qualifying homeowners who have moved into a residential facility to apply for the Home Owner Grant for one additional year. The grant can only be claimed on the home that they continue to own and that qualified in the previous year.
School Act
Provincial Residential School Property Tax Rates Set
The longstanding rate setting policy is that average residential school property taxes, before application of the home owner grant, will increase by the previous year’s provincial inflation rate. This rate setting policy has been in place since 2003 and will continue in 2012. The rates will be set when revised assessment roll data are available.
Provincial Non-Residential School Property Tax Rates Set
A single province-wide rate is set for each of the non-residential property classes. Consistent with longstanding policy, the rates for 2012, except the rate for the major industry property class, will be set so that non-residential school tax revenue will increase by inflation plus new construction. The rates will be set when revised assessment roll data are available.
The major industry class tax rate will be set to be the same as the business class tax rate, consistent with the policy announced in Budget 2008.
Taxation (Rural Area) Act
Provincial Rural Area Property Tax Rates Set
A single rural area residential property tax rate applies province-wide. The longstanding rate setting policy that average residential rural property taxes increase by the previous year’s provincial inflation rate will continue for 2012.
Consistent with longstanding policy, non-residential rural area property tax rates will be set so that total non-residential rural area tax revenue will increase by inflation plus new construction. The rates will be set when revised assessment roll data are available.
Exemption for Property Held in Trust for a First Nation Clarified
Effective for the 2012 and future tax years, the Act is amended to clarify that the exemption for property held in trust for a First Nation only applies with respect to property held by the Crown.
Budget and Fiscal Plan – 2012/13 to 2014/15
62
Tax Measures
Taxation (Rural Area) Act and School Act
Authority for Certain Partial Property Tax Exemptions Provided
In some cases the Crown, which is exempt from tax, is a registered owner of property together with one or more taxable owners. Under the Acts, if one or more registered owners of a property are taxable, the entire property is taxable. The Acts are amended to provide the authority to exempt from property tax the proportion of a property owned by the Crown or its agent.
Police Act
Approval of Police Tax Administration Fee Streamlined
Municipalities receive an administration fee for collecting the police tax within their boundaries on behalf of the province. Currently, the minister approves the fee each year even though the fee has not changed since the police tax was introduced. The Act is amended so that the minister only has to approve changes to the fee.
Land Tax Deferment Act
Fire Insurance Requirement Removed for Homeowners with Sufficient Equity
Homeowners must have a minimum amount of equity in their property to be eligible to defer their property taxes under the province’s property tax deferment program. Currently, homeowners must also have fire insurance on their home to be eligible for the program. These requirements are intended to ensure that the province can secure the deferred taxes.
Effective for the 2012 and future tax years, the Act is amended to remove the fire insurance requirement and to replace it with a more general requirement. In calculating whether the homeowner has a minimum amount of equity in the property, the calculation will now exclude uninsured improvements to the property.
Eligibility of Leaseholders to Defer Tax Clarified
The property tax deferment program is intended to apply to property owners who have sufficient equity in their property to secure the deferred taxes. Some leaseholders on Crown or municipal land have qualified to defer taxes in the past. The Act is amended to clarify that beginning in 2012 no new leaseholders will be eligible to defer taxes. Any leaseholders who currently defer taxes will be grandparented and will not be affected by this change.
Property Transfer Tax Act
New General Refund Provision Introduced
The Act is amended to provide the administrator with authority to refund an amount paid under the Act in circumstances where there was no legal obligation for the tax to be paid.
Budget and Fiscal Plan – 2012/13 to 2014/15
63
Tax Measures
Re-registration of Certain Life Estates Exempted
A life estate is an interest in property that is registered on title and that entitles a person to live on a property even though the person is not the registered owner. If the property owner wishes to register a mortgage against the property, the land title office requires the life estate to be removed from the title to give the mortgage priority over other interests in the property. No exemption currently exists if the life estate is then re-registered on title.
The Act is amended to provide an exemption for the re-registration of a life estate following the registration of a mortgage. The exemption only applies if the re-registration of the life estate involves the same owner, the same life estate holder, the same property and the same terms as the initial life estate.
Transition to Provincial Sales Tax
Income Tax Act
BC HST Credit Eliminated
As a result of the HST referendum, the government intends to eliminate the BC HST Credit of up to $230 annually per family member with the elimination of the HST. The final quarterly BC HST payment will be issued in January 2013.
BC Sales Tax Credit Re-Implemented
Effective for the 2013 and future tax years, the government intends to re-implement the BC Sales Tax Credit. The BC Sales Tax Credit will have the same eligibility criteria and benefit calculation as existed prior to its replacement by the BC HST Credit. The maximum annual tax credit will be $75 per adult. The maximum credit will be reduced by two per cent of family net income over $15,000 for single individuals and over $18,000 for couples.
Eligible taxpayers will be able to claim the BC Sales Tax Credit when they file their 2013 income tax return.
Basic Personal Amount Tax Credit Enhancement Reversed
As part of HST implementation, the basic personal amount tax credit was increased from $9,373 in 2009 to $11,000 in 2010. As a result of the HST referendum, the government intends to reverse this enhancement with the re-implementation of the PST on April 1, 2013.
The revised credit amount will be set at $9,373 plus any inflation indexing that has occurred since 2009.
For the 2013 tax year only, the basic personal amount tax credit will be set at a blended amount to reflect the higher credit amount for the first three months of 2013 in which the HST applies and the lower credit amount for the nine months in 2013 in which the PST applies. The exact 2013 credit amount will be available in late 2012 when the 2013 provincial inflation indexing factor is available.
Budget and Fiscal Plan – 2012/13 to 2014/15
64
Tax Measures
BC First-Time New Home Buyers’ Bonus Introduced
Effective for the period from February 21, 2012 to March 31, 2013, the government intends to introduce a temporary BC First-Time New Home Buyers’ Bonus. The BC First-Time New Home Buyers’ Bonus will be a refundable income tax credit for first-time home buyers who purchase a newly constructed home.
The credit will be calculated as 5 per cent of the purchase price of the home up to a maximum credit of $10,000. The credit will be phased out at a rate of 20 per cent of net income in excess of $150,000 for single individuals and at a rate of 10 per cent of family net income in excess of $150,000 for couples. Only one credit will be claimable per home.
The credit will be available in respect of purchases of newly constructed housing where both the HST applies and where a written agreement of purchase and sale is entered into on or after February 21, 2012. The credit will not be available in respect of homes where an individual had entered into an agreement of purchase and sale before February 21, 2012.
The government’s intention is that eligibility criteria for the credit will include the following:
· the home must be a newly constructed home located in BC;
· it must be an individual’s and their spouse or common-law partner’s first home; and
· the home must be intended as the individual’s primary residence.
Individuals must apply for the credit through the BC government. Application forms will be available on the BC Ministry of Finance website later this year.
Sales Taxes
For information about the elimination of the HST and re-implementation of the provincial sales tax, see the Return to PST topic box.
Motor Fuel Tax Act
Motor Fuel Tax on Propane Re-implemented
With the implementation of the HST, an exemption from motor fuel tax for propane used in motor vehicles was provided because propane was not eligible for the BC HST point-of-sale rebate for motor fuels. With the elimination of the HST, the government intends to re-implement the tax on propane used in motor vehicles. The tax rate will be 2.7 cents per litre, the same rate as prior to harmonization.
Tobacco Tax Act
Tobacco Tax Rates Adjusted
With the elimination of the HST, the provincial portion of the HST on tobacco products will be eliminated. To offset this reduction, the government intends to adjust tobacco tax rates to generally keep the overall tax on tobacco constant.
Budget and Fiscal Plan – 2012/13 to 2014/15
65
Tax Measures
Carbon Tax
Carbon Tax Review
The carbon tax was implemented on July 1, 2008 and the final scheduled increase will take effect on July 1, 2012. No further increases or expansions are planned at this time.
Over the next year, the government will undertake a comprehensive review of the carbon tax and its impact on British Columbians. The review will cover all aspects of the carbon tax, including revenue neutrality, and will consider the impact on the competitiveness of BC businesses such as the agricultural sector, and in particular, BC’s food producers.
British Columbians will have the opportunity to make written submissions to the Minister of Finance. Changes will be considered as part of the 2013 Budget process. Additional information will be available soon on the Ministry of Finance website at http://www.gov.bc.ca/fin/.
Carbon Tax Report and Plan
As required under Part 2 of the Carbon Tax Act the following tables show the Revenue Neutral Carbon Tax Report for 2010/11 and 2011/12 and the Revenue Neutral Carbon Tax Plan for 2012/13 to 2014/15.
Material Assumptions and Policy Decisions
In the Report and the Plan the estimates and forecasts of carbon tax revenue and the cost of tax reductions to return revenues to taxpayers are consistent with, and have the same material assumptions and policy decisions underlying them, as the revenue estimates and forecasts prepared for Budget 2012. The only material assumption specific to the Revenue Neutral Carbon Tax Report and Plan is that the cost of the revenue reductions, due to personal income tax rate cuts, increases with increases in personal income tax revenues for each year.
Table 1 Revenue Neutral Carbon Tax Report 2010/11 and 2011/12
| | | | Revised | |
| | | | Forecast | |
| | 2010/11 (1) | | 2011/12 | |
| | $ millions | |
Carbon tax revenue (2) | | 741 | | 960 | |
Reduction in provincial revenues due to designated measures (3) | | | | | |
Personal tax measures: | | | | | |
· Low income climate action tax credit | | (165 | ) | (188 | ) |
· Reduction of 5% in the first two personal income tax rates | | (207 | ) | (218 | ) |
· Northern and Rural Homeowner benefit of $200 (4) | | (19 | ) | (75 | ) |
Total personal tax measures | | (391 | ) | (481 | ) |
Business tax measures: | | | | | |
· General corporate income tax rate cut from 12% to 11% effective July 1, 2008, to 10.5% effective January 1, 2010 and to 10% effective January 1, 2011 | | (271 | ) | (381 | ) |
· Small business corporate income tax rate reduced from 4.5% to 3.5% effective July 1, 2008 and to 2.5% effective December 1, 2008 | | (144 | ) | (220 | ) |
· Industrial Property Tax Credit of 50% of school property taxes payable by light and major industrial properties starting in 2009 taxation year rising to 60% in 2011 | | (58 | ) | (68 | ) |
· School property taxes reduced by 50% for land classified as “farm” starting in 2011 | | (1 | ) | (2 | ) |
Total business tax measures | | (474 | ) | (671 | ) |
Total designated revenue measures | | (865 | ) | (1,152 | ) |
(1) | | Based on 2010/11 Public Accounts. |
| | |
(2) | | The carbon tax applies to fossil fuels and combustibles at rates based on the CO2 equivalent emission of each particular fuel starting at $10 per tonne effective July 1, 2008 and increasing by $5 per tonne each July 1 to $30 per tonne on July 1, 2012. |
| | |
(3) | | Designated measures are measures designated to return carbon tax to taxpayers. Designated measures for 2010/11 are set out in the Carbon Tax Plan presented with Budget 2010 and designated measures for 2011/12 are set out in the Carbon Tax Plan presented with Budget 2011. |
| | |
(4) | | Eligible homeowners are those in areas outside the Capital, Greater Vancouver and Fraser Valley regional districts. |
Budget and Fiscal Plan – 2012/13 to 2014/15
66
Tax Measures
Revenue Neutral Carbon Tax Report
Revenue neutrality means that tax reductions must be provided that fully return the estimated revenue from the carbon tax to taxpayers in each fiscal year. Table 1, Revenue Neutral Carbon Tax Report for 2010/11 and 2011/12, reports the carbon tax revenues and the cost of the tax reductions for the 2010/11 and 2011/12 fiscal years. For the 2010/11 fiscal year, this report is based on the 2010/11 Public Accounts and updates the Report for 2010/11 presented with Budget 2011.
Carbon tax revenues for 2010/11 are $741 million. The tax reductions for 2010/11 are those that were designated in the Revenue Neutral Carbon Tax Plan presented with Budget 2010. The personal tax measures are the Low Income Climate Action Tax Credit, the five per cent reductions in rates for the first two tax brackets, and the Northern and Rural Home Owner benefit. The business tax measures are the reductions in the general and small business corporate income tax rates, the industrial property tax credit and the 50 per cent reduction in school property tax for land classified as “farm”.
The estimated reduction in provincial revenues for 2010/11, as a result of the designated revenue measures is $391 million for the personal tax measures and $474 million for the business tax measures, for a total reduction of $865 million. Based on these revenue and tax reduction estimates, revenue neutrality has been met for 2010/11. In fact, the reduction in provincial revenue exceeds the $741 million in carbon tax revenue by $124 million.
Carbon tax revenues for 2011/12 are estimated to be $960 million, up slightly from the estimate in Budget 2011 of $950 million.
The tax reductions shown for the 2011/12 fiscal year are those that were designated in the Revenue Neutral Carbon Tax Plan presented with Budget 2011. The personal tax measures are the Low Income Climate Action Tax Credit, the five per cent reductions in rates for the first two tax brackets and the Northern and Rural Homeowner benefit. The business tax measures are the reductions in each of the general and small business corporate income tax rates, the industrial property tax credit and the 50 per cent reduction in school property tax for land classified as “farm”.
The estimated reduction in provincial revenues for 2011/12, as a result of the designated revenue measures is $481 million for the personal tax measures and $671 million for the business tax measures, for a total reduction of $1,152 million. Based on these revenue and tax reduction estimates, revenue neutrality has been met for 2011/12. In fact, the reduction in provincial revenue exceeds the $960 million in carbon tax revenue by $192 million. The Budget 2013 Revenue Neutral Carbon Tax Report for 2011/12 will be based on actual carbon tax revenues for 2011/12 as reported in the 2011/12 Public Accounts.
Revenue Neutral Carbon Tax Plan
Table 2, the Revenue Neutral Carbon Tax Plan 2012/13 to 2014/15, shows carbon tax revenue and tax reduction cost estimates for the revenue measures designated as those that return the carbon tax revenues to taxpayers for 2012/13 to 2014/15.
Carbon tax revenues are now forecast to be slightly higher than estimated when Budget 2011 was prepared.
The three-year fiscal plan for Budget 2012 assumes that the small business corporate tax rate will be maintained at 2.5 per cent beyond April 1, 2012, the general corporate tax rate will increase to 11 per cent on April 1, 2014, and the Scientific Research and Experimental Development Tax Credit will be extended beyond August 2014. The Carbon Tax Plan presented in Table 2 reflects these adjustments to the fiscal plan.
New designated measures from Budget 2012 included in the Revenue Neutral Carbon
Budget and Fiscal Plan – 2012/13 to 2014/15
67
Tax Measures
Tax Plan 2012/13 to 2014/15 are: the BC Seniors’ Home Renovation Tax Credit; the Children’s Fitness Credit; the Children’s Arts Credit; the increase to the small business venture capital tax credit; and the extension of the training tax credits for individuals and employers. In addition, the Plan includes tax cut measures from Budget 2009 and Budget 2010. These are the corporate income tax small business threshold increase to $500,000 from $400,000, the extension of the Film Incentive BC tax credit beyond its expiry date and the new interactive digital media tax credit. Finally, as noted above, the cost of extending the Scientific Research and Experimental Development Tax Credit beyond August 2014, the legislated expiry date, is included in the Plan.
As shown in Table 2, revenue from the carbon tax and the cost of the tax reductions are now estimated to be $1,172 million and $1,275 million respectively for 2012/13. This means that the tax cuts are expected to exceed carbon tax revenues for 2012/13 by $103 million. Carbon tax revenues are now estimated at $1,241 million in 2013/14 and $1,261 million in 2014/15 and equal the cost of the designated revenue measures in each of those years.
Table 2 Revenue Neutral Carbon Tax Plan 2012/13 to 2014/15
| | Forecast | |
| | 2012/13 | | 2013/14 | | 2014/15 | |
| | $ millions | |
Carbon tax revenue (1) | | 1,172 | | 1,241 | | 1,261 | |
| | | | | | | |
Designated revenue measures: | | | | | | | |
Personal tax measures: | | | | | | | |
· Low income climate action tax credit of $115.50 per adult (1) plus $34.50 per child effective July 1, 2011 | | (190 | ) | (190 | ) | (190 | ) |
· Reduction of 5% in the first two personal income tax rates | | (228 | ) | (244 | ) | (255 | ) |
· Northern and Rural Homeowner benefit of up to $200 (2) | | (77 | ) | (79 | ) | (81 | ) |
· BC Seniors Home Renovation Tax Credit | | (27 | ) | (27 | ) | (27 | ) |
· Children’s Fitness Credit and Children’s Arts Credit | | (9 | ) | (9 | ) | (9 | ) |
· Small business venture capital tax credit budget increased | | (3 | ) | (3 | ) | (3 | ) |
· Training Tax Credit extended - Individuals | | (20 | ) | (20 | ) | (20 | ) |
Total personal tax measures | | (554 | ) | (572 | ) | (585 | ) |
Business tax measures: | | | | | | | |
· General corporate income tax rate reduced from 12% to 11% effective July 1, 2008, to 10.5% effective January 1, 2010, to 10% effective January 1, 2011 and increased to 11% effective January 1, 2014 | | (374 | ) | (316 | ) | (209 | ) |
· Small business corporate income tax rate reduced from 4.5% to 3.5% effective July 1, 2008 and to 2.5% effective December 1, 2008 | | (205 | ) | (206 | ) | (210 | ) |
· Corporate income tax small business threshold increased to $500,000 from $400,000 | | (20 | ) | (20 | ) | (21 | ) |
· Industrial Property Tax Credit of 60% of school property taxes payable by light and major industrial properties | | (71 | ) | (73 | ) | (76 | ) |
· Provincial school property taxes reduced by 50% for land classified as “farm” | | (2 | ) | (3 | ) | (3 | ) |
· Interactive digital media tax credit | | (38 | ) | (35 | ) | (35 | ) |
· Training Tax Credit extended - Businesses | | (11 | ) | (11 | ) | (11 | ) |
· Extend Scientific Research and Experimental Development Tax Credit beyond August 2014 | | — | | — | | (81 | ) |
· Film Incentive BC tax credit continued (3) | | — | | (5 | ) | (30 | ) |
Total business tax measures | | (721 | ) | (669 | ) | (676 | ) |
Total revenue measures | | (1,275 | ) | (1,241 | ) | (1,261 | ) |
(1) | | The carbon tax applies to fossil fuels and combustibles at rates based on the CO2 equivalent emission of each particular fuel starting at $10 per tonne effective July 1, 2008 and increasing by $5 per tonne each July 1 to $30 per tonne on July 1, 2012. |
| | |
(2) | | Eligible homeowners are those in areas outside the Capital, Greater Vancouver and Fraser Valley regional districts. |
| | |
(3) | | The total cost of the extension to the Film Incentive BC tax credit is about $60 million per year. In the table, only a portion of the cost of is shown. |
Budget and Fiscal Plan – 2012/13 to 2014/15
68
Tax Measures
Return to PST
During the summer of 2011, British Columbians had the opportunity to participate in a province-wide referendum on the harmonized sales tax (HST).
On August 26, 2011, Elections BC announced that British Columbians had voted in favour of eliminating the HST and returning to the provincial sales tax (PST) plus federal goods and services tax (GST) system. Details of the referendum can be found at http://www. elections.bc.ca/.
Following the referendum results, government committed to make the transition back to the PST/GST system as quickly as responsibly possible. Subject to the approval of the Legislature of British Columbia, the PST will be re-implemented effective April 1, 2013.
Until the PST is re-implemented, the provincial portion of the HST will continue at a rate of seven per cent, for a combined federal-provincial HST rate of 12 per cent in British Columbia. Subject to the approval of the Parliament of Canada, the HST will be eliminated effective April 1, 2013.
As of April 1, 2013, British Columbia will return to the PST/GST system, with a general PST rate of seven per cent and a federal GST rate of five per cent.
Transitional Rules
General Transitional Rules
The general transitional rules for the PST will generally mirror the federal HST transitional rules.
Generally, PST will apply where tax becomes payable on or after April 1, 2013. Tax in respect of sales of taxable goods and services will generally become payable at the earlier of the time the consideration becomes due or the time the consideration is paid without becoming due. When consideration becomes due will be determined in a manner consistent with the federal rules regarding consideration.
Detailed PST transitional rules for specific types of transactions, including goods brought, sent or delivered into British Columbia and goods used in the improvement of real property, will be made available as soon as possible.
Detailed information for persons selling goods and services who will be required to collect and remit the PST will be made available as soon as possible.
Unlike the transition to the HST, there will be no pre-payment period for the PST.
Transitional Rules for New Housing
The HST and PST transitional rules for new housing provide certainty for purchasers and the residential construction industry about the application of tax during the transition from the HST to the PST.
The temporary PST transition measures for new housing will help to ensure that purchasers are treated equitably and smooth the transition from the HST to the PST.
Background
Under the previous PST/GST system, purchasers of new homes did not pay PST on the purchase price of the home. However, builders paid PST on most construction materials (e.g. wood, cement, plaster, nails) used to build the home. The PST was part of the cost of building the home and was embedded in the price of the home. The embedded PST in new homes in BC was estimated, on average, to be equal to about two per cent of the price of the home.
Under the HST there is no tax embedded in the price of newly constructed housing because builders, like most other businesses, can recover the HST they pay on their materials
Budget and Fiscal Plan – 2012/13 to 2014/15
69
Tax Measures
and other business inputs through input tax credits. However, the HST applies directly to purchases of new homes.
BC provides an HST rebate for new housing purchased as a primary residence to reduce the net provincial tax payable to two per cent of the new home price for eligible purchasers of new homes up to a threshold price ($525,000 prior to April 1, 2012 and $850,000 on or after April 1, 2012). This is the same amount of provincial tax that, on average, was embedded in the price of a new home under the PST system.
Temporary Housing Transition Measures
The temporary housing transition measures are designed to help ensure that the amount of tax payable in respect of a new home during the transition, regardless of when construction begins, is comparable to the amount of tax payable in respect of a home fully constructed under the PST.
Without transition measures, there would be no tax payable in respect of certain purchases of new housing. For example, where a new home is constructed under the HST and sold after the PST is re-implemented, there would be no direct or embedded tax in the new home — no embedded tax because the builder is able to recover all the HST paid on materials through input tax credits, and no direct provincial tax because neither HST nor PST would be payable on the purchase (only GST).
This would be unfair to other purchasers of new housing, who, on average, pay at least two per cent provincial tax in respect of their new home, either directly as the provincial portion of the HST or indirectly because PST is embedded in the purchase price.
Temporary Housing Transition Tax
To provide equitable treatment among purchasers of new homes, and mitigate the loss of provincial revenue, a temporary housing transition tax of two per cent will apply to purchases of new housing (i.e. newly constructed or substantially renovated housing) that is not subject to HST and where construction was completed, or partially completed (at least 10 per cent complete as of April 1, 2013) prior to PST re-implementation.
The temporary housing transition tax will also apply in certain situations where there has been a deemed sale of new housing on or after April 1, 2013.
Temporary Housing Transition Rebate
To help ensure there is no double taxation, builders of newly constructed housing will be able to claim a transition rebate if they pay PST on construction materials used in housing which is subject to the temporary housing transition tax.
The amount of the rebate will be based on the degree of completion as of April 1, 2013 and the purchase price of the new housing. To be eligible for the rebate, builders must certify that they paid PST on the construction materials incorporated on or after April 1, 2013 into the new housing.
Disclosure Requirements
Builders will be required to disclose information to the purchaser that will allow purchasers and builders to have a shared understanding of the taxes and rebates that are included in or excluded from the purchase price.
Duration and Administration
The temporary housing transition measures will be in place for two years, from April 1, 2013 until March 31, 2015, and will be administered by the Canada Revenue Agency on behalf of the government of British Columbia.
Additional Information
Generally, HST will continue to apply to sales of new housing where either ownership or
Budget and Fiscal Plan – 2012/13 to 2014/15
70
Tax Measures
possession transfers to the purchaser before April 1, 2013. It will also continue to apply to deemed sales of new housing made before April 1, 2013.
Previously occupied (i.e. used/resale) housing, was not subject to PST or HST and will not be subject to the transitional housing measures.
Additional information about British Columbia’s PST transitional rules and temporary transition measures for new housing will be available at: http://www.pstinbc.ca.
For additional information about the application of HST, including the federal HST transitional rules, please contact the Canada Revenue Agency.
Transitional Relief Measures for New Housing
BC New Housing Rebate Threshold Increase to $850,000
Until the PST is re-implemented, HST will continue to apply to sales of new housing. Since the HST was implemented, BC has provided a rebate of 71.43 per cent of the provincial portion of the HST paid on new housing purchased as a primary residence, to a maximum of $26,250.
To assist British Columbia families and the residential construction industry during the transition to PST, the BC HST New Housing Rebate threshold will be increased from $525,000 to $850,000 for eligible new housing where the HST is payable on or after April 1, 2012. Te maximum rebate available to purchasers will increase from $26,250 to $42,500.
Owner-built housing will be eligible for the higher rebate if the new home becomes substantially completed on or after April 1, 2012 and the rebate application is fled with the Canada Revenue Agency on or after April 1, 2012.
Additional information about the increased BC HST New Housing Rebate will be available at http://www.pstinbc.ca.
Grant for New Second and Recreational Homes
Effective April 1, 2012, certain purchasers of new housing used as a second or recreational residence will be eligible for a grant in an amount that is equivalent to the BC HST New Housing Rebate available for primary residences.
Eligibility for the grant is limited to purchases made in areas of the province outside the Capital Regional District and the Greater Vancouver Regional District. The intent of this measure is to assist workers and communities in BC that depend on the residential recreational development industry during the transition to PST.
This program will be a temporary relief measure that applies to purchases of new homes used as a second or recreational residence where HST is payable on or after April 1, 2012.
Purchasers of new homes that will be used for commercial purposes (e.g. vacation rentals, small businesses) will not be eligible for the grant.
Purchasers of new second or recreational homes must apply to the province for the grant.
Additional information about this program will be available at http://www.pstinbc.ca.
BC First-Time New Home Buyers’ Bonus
Until the PST is re-implemented, a refundable income tax credit for first-time home buyers who purchase a newly constructed home will be available.
This measure will provide tax relief during the transition period for families and individuals
Budget and Fiscal Plan – 2012/13 to 2014/15
71
Tax Measures
who are purchasing their first home and will assist the residential construction industry by encouraging purchases of newly constructed homes.
The credit will be available in respect of purchases of newly constructed housing where both the HST applies and a written agreement of purchase and sale is entered into on or after February 21, 2012. The credit will not be available where the agreement of purchase and sale was entered into before February 21, 2012 or in respect of purchases where no HST applies.
The credit will be calculated as five per cent of the purchase price of the home up to a maximum credit of $10,000 and will be phased out for individuals and families with incomes above $150,000.
Further information is available in Part 2: Tax Measures.
Provincial Sales Tax
PST Basics
British Columbia’s provincial sales tax (PST) will be re-implemented effective April 1, 2013 at a general tax rate of seven per cent.
The PST will apply to the same goods and services that were subject to PST prior to the implementation of the HST.
All permanent PST exemptions will be re-implemented with the new PST, including:
· all food for human consumption (e.g. basic groceries and prepared food such as restaurant meals);
· most services (e.g. personal services such as haircuts, dry cleaning, funeral services);
· admissions and memberships;
· bicycles;
· newspapers and magazines; and
· all permanent PST exemptions for business.
How the PST Applies
The re-implemented PST, like the previous PST, will be a retail sales tax that is payable when a taxable good or service is acquired for personal use or business use, unless a specific exemption applies.
PST generally applies to:
· the purchase or lease of new or used goods;
· goods brought into BC for use in BC;
· the purchase of most services to goods (for example, vehicle maintenance, furniture assembly, computer repair);
· the purchase of telecommunication services including internet access, non-basic cable, non-residential telephone services, cell phone use, satellite services and facsimile services; and
· the purchase of legal services.
Re-Implementation of Certain Taxes and Levies
With the re-implementation of the PST, the following levies and taxes will be re-implemented:
· the Passenger Vehicle Rental Tax of $1.50 per day which raises dedicated revenue for the BC Transportation Financing Authority;
· the surtax of one per cent to three per cent on passenger vehicles with a purchase price of $55,000 and over;
· the multijurisdictional vehicle tax for inter-jurisdictional commercial carriers licensed under the International Registration Plan; and
· the Innovative Clean Energy (ICE) Fund levy of 0.4 per cent of the purchase price on residential and commercial energy purchases of natural gas, fuel oil and propane sold on a grid in the same manner as before harmonization. However, the re-implemented ICE Fund levy will not apply to residential and commercial purchases of electricity.
Budget and Fiscal Plan – 2012/13 to 2014/15
72
Tax Measures
Hotel Room Taxes
The tax on short term accommodation (formerly the provincial Hotel Room Tax) will be re-implemented at the same time as the PST. The tax rate will be 8 per cent, the same rate as prior to harmonization, and tax will apply in the same way it did prior to the HST.
To streamline the administration, collection and remittance of provincial taxes, short term accommodation will be taxed under the same legislation as the PST and the separate Hotel Room Tax Act will be repealed.
As announced previously, the two per cent municipal and regional district hotel room tax levied on behalf of local governments, regional districts, and eligible entities such as tourism associations that are used for local tourism marketing, programs and projects will continue.
The British Columbia Resort Municipality Initiative provided eligible resort municipalities with a portion of the provincial hotel room tax. When the hotel room tax was eliminated with the introduction of the HST, funding for resort municipalities was continued. Provincial government funding for eligible resort municipalities will continue with the re-implementation of the PST.
Natural Gas and Propane
The tax on propane will be re-implemented at the same time as the PST. The tax rate will be 2.7 cents per litre, the same rate as prior to the implementation of the HST.
The taxation of natural gas and propane under the PST and under the Motor Fuel Tax Act will be clarified to streamline the administration, collection and remittance of the taxes. There will be no change in tax rates or the circumstances in which natural gas and propane are subject to tax.
Elimination of Battery Levy
With the implementation of the HST and the elimination of the PST, the $5 battery levy was eliminated effective July 1, 2010. The battery levy will not be re-implemented, as an industry stewardship program for the proper recycling and disposal of lead acid batteries was implemented as of July 1, 2011.
Continuation of Tax on Private Sales of Vehicles, Boats and Aircraft
The tax on private sales of vehicles, boats and aircraft will continue at a rate of 12 per cent. These sales are not subject to GST. The 12 per cent provincial tax rate ensures similar tax treatment between private sales and sales by GST registered businesses. Sales of vehicles, boats and aircraft will be subject to either PST or the tax on private sales, not both.
Elimination of BC HST Credit and Re-implementation of BC Sales Tax Credit
With the elimination of the HST, the BC HST Credit of up to $230 per family member will also be eliminated. The final quarterly BC HST payment will be issued in January 2013.
Effective for the 2013 and future tax years, the BC Sales Tax Credit will be re-implemented and will have the same eligibility criteria and benefit calculation as existed prior to its replacement by the BC HST Credit.
Reversal of Basic Personal Amount Tax Credit Enhancement
As part of HST implementation, the basic personal amount tax credit was increased. This enhancement will be reversed with the re-implementation of the PST on April 1, 2013.
Liquor Mark—ups
The PST rate of 10 per cent on liquor will be reinstated with the re-implementation of the PST. Liquor mark-ups will be reduced to their pre-HST levels to generally keep shelf prices constant.
Budget and Fiscal Plan – 2012/13 to 2014/15
73
Tax Measures
Tobacco Tax Rates
With the re-implementation of the PST, the provincial portion of the HST on tobacco products will be eliminated. To offset this reduction, tobacco tax rates will be adjusted to generally keep the overall tax on tobacco constant.
TransLink Parking Sales Tax
Effective July 1, 2010, legislation related to the imposition of the TransLink parking tax was transferred to the South Coast British Columbia Transportation Authority Act and administration of the tax was transferred to TransLink. TransLink will retain the administration and enforcement of this parking sales tax.
Administrative Improvements:
Government will make administrative improvements to the PST, including streamlining administration for businesses and government, and modernizing the new PST legislation and regulations.
As a result of these administrative improvements, while the actual tax treatment of goods and services purchased by businesses and consumers will be substantially the same under the new PST as it was prior to the implementation of the HST, there will be some differences. The intent of the changes is to reduce the administrative and compliance burden on businesses by making it simpler for businesses to collect and remit tax to government when they are selling goods and services and to claim exemptions when they are making purchases.
As part of the “Canada Starts Here: BC Jobs Plan”, the Minister of Finance appointed an Expert Panel on Business Taxation to review British Columbia taxes to develop recommendations to support business competitiveness, economic growth and jobs for British Columbians. The Expert Panel has also been asked to develop recommendations for administrative improvements to streamline the PST. More information is available at: http://www2.news.gov.bc.ca/news_releases_2009-2013/2012FIN0002-000018.pdf.
Approval of Legislature of British Columbia and Parliament of Canada
Elimination of the HST on April 1, 2013 is subject to the approval of the Parliament of Canada. Re-implementation of the PST and related tax changes are subject to the approval of the Legislature of British Columbia.
Budget and Fiscal Plan – 2012/13 to 2014/15
74
Tax Measures
PST Re-implementation Timeline
The government plans to re-implement the provincial sales tax (PST) on April 1, 2013, well within the 18-24 month transition period recommended by the independent panel report of May 2010.
The return to a PST plus federal goods and services tax (GST) system in British Columbia is complex and requires careful planning, coordination and implementation throughout the various stages to help ensure an orderly, responsible transition.
Transition Timeline
The government remains on track with its plan to re-establish the PST in BC. The following chart summarizes the processes and timelines required for that transition.
Transitional Rules and Provincial Legislation / Regulations
The government expects to introduce legislation to re-implement the PST in the Spring 2012 legislative session. Transitional rules for new housing were released in February 2012. More detailed provincial regulations and transitional rules will follow.
The governments of Canada and BC reached an agreement in January 2012 regarding the return of $1.6 billion BC received to support the transition to the HST. Under this arrangement, BC will make equal instalments over five years beginning March 2012. Compared to making this repayment all at once, the BC government will save significant borrowing costs — money it can use instead to help protect core services.
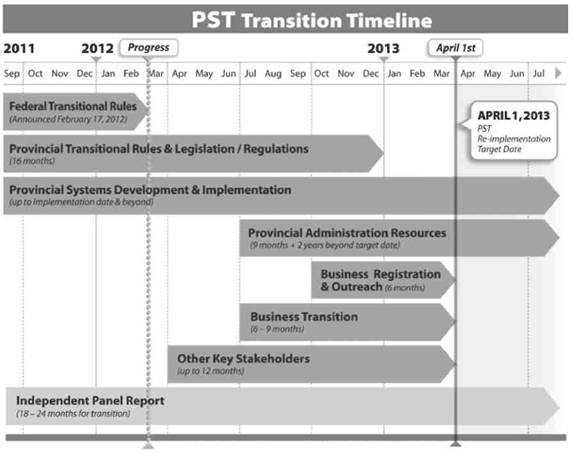
Budget and Fiscal Plan – 2012/13 to 2014/15
75
Tax Measures
Provincial Systems Development and Administration
The government, in co-operation with businesses and other partners, is continuing to re-build an administrative structure that supports the return to the PST in an orderly and responsible way.
Discussions are continuing with the federal government in relation to rebuilding provincial resources with staff previously transferred to the Canada Revenue Agency. The government is also working to re-establish facilities and other supports necessary for administration of the PST. Funding will be temporarily provided through the Contingencies vote until there is more certainty about the resources required to complete the transition.
The Insurance Corporation of British Columbia, as a collector of PST, will be making changes to its systems and administrative processes to support the return of the PST.
Provincial Business Registration and Outreach
The government will register approximately 100,000 businesses as tax collectors and provide information and training on the tax application, collection, compliance and reporting rules related to the PST.
Communication and business outreach programs now being developed include:
· web-based training videos;
· educational seminars, conducted across the province and over the Internet; and
· a new web-site interface allowing online business registrations.
The government is also implementing new registration, compliance and reporting software to help streamline administration (and reduce costs) for both government and businesses.
Business Transition
Businesses will need to change their own electronic and manual systems and processes to assess, collect, report and remit the PST and other related taxes to the provincial government. The provincial outreach programs will assist business in understanding their responsibilities in administering the PST.
Progress Reports
The government has committed to providing quarterly updates on its progress in returning to the PST. Additional information is available on the Ministry of Finance’s website at: http://www.fin.gov.bc.ca/pst-return.htm
Budget and Fiscal Plan – 2012/13 to 2014/15
76
Part 3: BRITISH COLUMBIA ECONOMIC REVIEW AND OUTLOOK(1)
Summary
Following an estimated increase of 2.0 per cent in 2011, the Ministry of Finance forecasts British Columbia’s economy to grow by 1.8 per cent in 2012, 2.2 per cent in 2013 and 2.5 per cent per year in the medium-term.
The Ministry’s outlook for BC’s real GDP growth in 2012 is 0.4 percentage points lower than the outlook provided by the Economic Forecast Council. For 2013, the Ministry’s forecast is 0.3 percentage points below the Council’s projection. This level of prudence for both years acknowledges the significant downside risks to the forecast.
Chart 3.1 British Columbia’s economic outlook
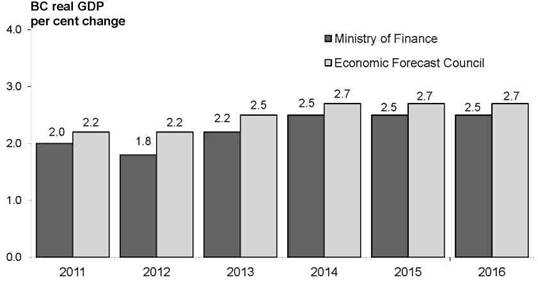
These downside risk, largely due to ongoing uncertainty around global economic activity, include:
· a return to recession in the US (characterized by weaker consumer spending, widespread deleveraging causing slower investment, a very slow job market recovery, continued weakness in the housing market and further fiscal restraint by federal, state and local governments);
· the sovereign debt crisis in Greece, Ireland and Portugal spreading to larger European economies like Italy and Spain, and threatening the stability of global financial markets as well as another global credit crisis;
· slower than anticipated Asian demand resulting in weaker demand for BC’s exports;
· exchange rate volatility; and
· further weakening of the US dollar, resulting in significant disruptions to global financial and commodity markets.
(1) Reflects information available as of February 3, 2012, unless otherwise indicated.
Budget and Fiscal Plan – 2012/13 to 2014/15
77
British Columbia Economic Review and Outlook
British Columbia Economic Activity and Outlook
The performance of key BC economic indicators in recent quarters is presented in Table 3.1.
Table 3.1 British Columbia Economic Indicators
| | Third Quarter | | Fourth Quarter | | Annual | |
| | Jul. to Sep. 2011 | | Oct. to Dec. 2011 | | Jan. to Dec. 2011 | |
Data seasonally adjusted unless | | change from | | change from | | change from | |
otherwise noted | | Apr. to Jun. 2011 | | Jul. to Sep. 2011 | | Jan. to Dec. 2010 | |
| | | | Per cent change | | | |
Employment | | 0.4 | | 0.3 | | 0.8 | * |
Manufacturing shipments (1) | | 1.9 | | 0.3 | | 7.0 | |
Exports (1) | | 8.0 | | -2.2 | | 14.7 | |
Retail sales (1) | | 0.3 | | 2.8 | | 2.1 | |
Housing starts | | 6.9 | | -4.5 | | -0.3 | * |
Non-residential building permits (1) | | -11.6 | | 0.5 | | 2.0 | |
* annual non-seasonally adjusted data
(1) data to November
Indicators of economic performance through 2011 have been mixed. Overall through 2011, most BC indicators show improvement compared to the same period in 2010. However, as Table 3.1 reveals, slowing quarter-over-quarter growth occurred during the October to December period in employment, manufacturing shipments, exports and housing starts. Table 3.2 summarizes the Ministry’s outlook for BC’s key economic indicators, while Tables 3.7.1 to 3.7.4 at the end of Part 3 provide additional detail on the economic forecast.
Table 3.2 Ministry of Finance Economic Forecast: Key Economic Indicators
| | | | Forecast | |
| | 2011 | | 2012 | | 2013 | | 2014 | | 2015 | | 2016 | |
| | Per cent change unless otherwise noted | |
British Columbia Economic Indicators | | | | | | | | | | | | | |
Real GDP | | 2.0 | (e) | 1.8 | | 2.2 | | 2.5 | | 2.5 | | 2.5 | |
Nominal GDP | | 4.3 | (e) | 3.7 | | 4.1 | | 4.4 | | 4.6 | | 4.6 | |
Employment | | 0.8 | | 0.9 | | 1.4 | | 1.4 | | 1.5 | | 1.5 | |
Unemployment rate (per cent) | | 7.5 | | 7.5 | | 7.3 | | 7.2 | | 7.1 | | 7.1 | |
Total net in-migration (thousands of persons) | | 32.5 | (1) | 47.0 | | 51.1 | | 53.2 | | 54.9 | | 55.1 | |
Personal income | | 3.7 | (e) | 3.7 | | 3.8 | | 4.0 | | 4.1 | | 4.1 | |
Corporate pre-tax profits | | 10.6 | (e) | 3.6 | | 4.3 | | 6.5 | | 7.4 | | 7.5 | |
Housing starts (thousands of units) | | 26.4 | | 25.0 | | 26.0 | | 26.7 | | 27.2 | | 27.2 | |
Retail sales | | 1.8 | (e) | 3.3 | | 3.5 | | 4.0 | | 4.0 | | 4.0 | |
(e) Ministry of Finance estimate
(1) BC Stats estimate
The Labour Market
Employment growth in BC was slow in 2011, increasing by just 0.8 per cent (or 18,200 jobs) compared to 2010. Full-time employment rose by 0.5 per cent (or 9,300 jobs) last year, while part-time employment increased by 1.7 per cent (or 8,800 jobs). Major job gains were observed in accommodation and food services (+19,500 jobs), construction (+14,100 jobs) and professional, scientific and technical services (+7,800 jobs). These increases helped to offset job losses in the trade sector (-15,100 jobs), agriculture (-5,700 jobs) and healthcare and social assistance (-2,900 jobs).
BC employment fell by 2,200 jobs in January 2012 from the previous month, while the monthly unemployment rate dropped to 6.9 per cent from 7.0 per cent in December.
Budget and Fiscal Plan – 2012/13 to 2014/15
78
British Columbia Economic Review and Outlook
Chart 3.2 BC employment recovering
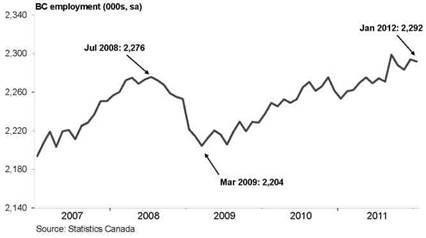
Outlook
The Ministry forecasts employment in BC to increase by 0.9 per cent in 2012, or approximately 20,000 jobs. The pace of employment growth is expected to pick up in 2013, with a projected gain of 1.4 per cent, or 33,000 jobs. In the medium-term, employment is forecast to rise by about 1.5 per cent each year from 2014 to 2016. The province’s unemployment rate is expected to hold at 7.5 per cent in 2012, after averaging the same rate in 2011. The rate is forecast to fall gradually after 2012, reaching 7.3 per cent in 2013 and then averaging about 7.1 per cent per year over the medium-term.
Consumer Spending and Housing
Retail sales advanced 2.1 per cent during the first 11 months of 2011, compared to the same period in 2010. Major gains were observed at gas stations, clothing stores and motor vehicle and parts dealers. Although sales activity has been positive in 2011 compared to 2010 (including four consecutive monthly increases between August and November), BC still lags other Canadian provinces in retail sales growth. Slow employment growth, heavy debt loads and falling consumer confidence have put downward pressure on retail sales for most of 2011.
Chart 3.3 BC retail sales
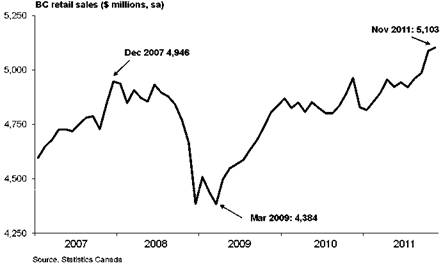
Budget and Fiscal Plan – 2012/13 to 2014/15
79
British Columbia Economic Review and Outlook
Housing starts in BC fell slightly in 2011, averaging 26,400 units — a decrease of 0.3 per cent from the previous year. This annual pace in 2011 placed BC sixth among provinces in housing starts. Home construction activity was volatile through most of the year, with large quarterly declines observed in the first and last quarters of the year, and fairly strong gains in the second and third quarters. Further, residential building permits (a precursor of new housing activity) fell by 10.9 per cent year-to-date to November 2011 compared to the same period in 2010, suggesting further weakness in housing construction in the coming months.
Chart 3.4 BC housing starts flat
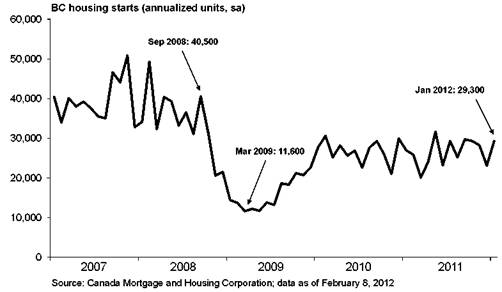
After a significant decrease in 2010, the number of BC home sales improved modestly in 2011, rising 2.8 per cent on the year. The price of homes in BC, however, continued to grow at a very strong pace last year, with the average price reaching about $561,000 (up by 11.1 per cent over 2010). Sales of some very expensive high-end homes in parts of Greater Vancouver are partly responsible for driving up the overall average home price last year.
The value of total non-residential building permits increased by 2.0 per cent during the first 11 months of 2011, compared to the same period in 2010. Gains in industrial (+45.8 per cent) and commercial (+6.7 per cent) permits more than offset a decline in institutional and government (-17.1 per cent) permits. In recent quarters, the value of total non-residential permits ticked up 0.5 per cent so far in the October to December quarter of 2011 following a decline of 11.6 per cent in the July to September quarter.
Outlook
The Ministry forecasts real consumption of goods and services to increase by 2.4 per cent in 2012, following an estimated gain of 1.3 per cent in 2011. An increase in real consumer spending is also projected in 2013, rising again by 2.4 per cent, and then averaging 2.7 per cent growth annually in the medium-term. Steady consumer spending is a critical component to a sustained economic recovery in BC, going forward.
Budget and Fiscal Plan – 2012/13 to 2014/15
80
British Columbia Economic Review and Outlook
Following last year’s 1.8 per cent estimated growth in BC retail sales, a gain of 3.3 per cent is forecast for 2012. Retail sales are expected to subsequently grow by 3.5 per cent in 2013 and by about 4.0 per cent each year from 2014 to 2016.
BC’s housing starts are projected to remain lower than the elevated levels observed during the pre-recession boom. The Ministry forecasts housing starts to total approximately 25,000 units in 2012 — a decrease of 5.4 per cent from the 26,400 starts observed in 2011. Starts are expected to reach 26,000 units in 2013 and average about 27,000 units per year from 2014 to 2016.
Business and Government
Real business investment (including residential) is estimated to have grown by 2.9 per cent in 2011, with steady increases in non-residential construction and machinery and equipment, along with a smaller gain in residential construction.
Total real dollar expenditures by federal, provincial and municipal governments are estimated to have grown by 1.4 per cent in 2011, following growth of 1.6 per cent in government spending in 2010.
Outlook
Real business investment (including residential) is projected to rise by 3.5 per cent in 2012, supported by further steady gains in residential and non-residential construction as well as in machinery and equipment. Growth in total business investment of 4.2 per cent is anticipated in 2013 and of about 3.7 per cent annually in the medium-term.
The Ministry expects corporate pre-tax profits to rise by 3.6 per cent in 2012, following an estimated increase of 10.6 per cent in 2011. Growth in corporate profits is forecast to be 4.3 per cent in 2013 and average 7.1 per cent per year in the medium-term.
Combined real spending by the three levels of government (federal, provincial and municipal) on goods and services is expected to climb by 0.2 per cent in 2012, and by 1.1 per cent in 2013. Government spending is then projected to grow by about 1.5 per cent annually from 2014 to 2016.
External Trade and Commodity Markets
Despite a weaker performance in recent months, BC’s exports had a strong showing through the first 11 months of 2011 compared to the same period in 2010. Facing continued slow demand from the US and a strong Canadian dollar, BC’s diversified export portfolio (relative to other Canadian jurisdictions) has helped to insulate the province against weakening demand from some of its trading partners. Exports to China, in particular, have grown considerably in recent years, comprising a growing proportion of BC’s total merchandise exports. In 2008, exports to China made up just 5.9 per cent of BC’s total international goods exports (about $2.0 billion), while year-to-date to November 2011, exports to China comprised 14.6 per cent of the total (about $4.4 billion). BC’s softwood lumber exports to China, in particular, have seen substantial gains over the last few years, while exports of the same commodity to the US have tumbled with eroding demand from the troubled US housing market (see Chart 3.5).
Budget and Fiscal Plan – 2012/13 to 2014/15
81
British Columbia Economic Review and Outlook
Chart 3.5 BC lumber exports to China and US

The value of BC’s total merchandise exports increased 14.7 per cent year-to-date to November 2011 over the same period the previous year. Substantial gains were observed in several export categories, including energy products (+27.5 per cent), industrial and consumer products (+13.8 per cent), forestry (+10.3 per cent) and machinery, equipment and automotive products (+7.6 per cent).
Chart 3.6 BC exports up year-over-year
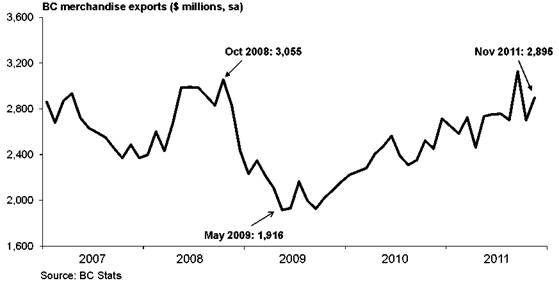
While some commodity prices have recovered to a large extent since the 2008/09 recession, they are expected to remain volatile in the near-term due to the ongoing global economic uncertainty and troubled world financial markets.
Budget and Fiscal Plan – 2012/13 to 2014/15
82
British Columbia Economic Review and Outlook
On average, lumber prices held fairly steady in 2011 compared to 2010, with Western spruce-pine-fir (SPF) 2x4 prices averaging $255 US/000 board feet (a slight decline of 0.3 per cent). Monthly prices were volatile, however, as prices began the year at $311 US/000 board feet in January, fell as low as $222 US/000 board feet in May and finished the year at $240 US/000 board feet in December.
Pulp prices rose quickly in early 2011, reaching a record high $1,016 US per tonne in June. Although pulp prices retreated somewhat through the latter half of 2011, annual prices averaged $961 US per tonne—an increase of 3.3 per cent over 2010.
The price of oil fluctuated widely through 2011, with the daily West Texas Intermediate oil price reaching $113.39 US/barrel in April and falling as low as $75.40 US/barrel in October. Oil prices averaged $94.88 US/barrel in 2011, representing a hefty 19.4 per cent increase from the $79.48 US/barrel recorded in 2010. Meanwhile, the price of natural gas has remained low since early 2010. The Plant Inlet price averaged $2.44 C/GJ during 2011, down 17.0 per cent from the $2.94 C/GJ observed in 2010. The price of natural gas ended the year at $1.92 C/GJ in December 2011 — the lowest monthly price recorded since July 1999.
Most metals and minerals prices continued to see substantial annual increases in 2011, following healthy annual gains in 2010. Annual increases occurred in prices for silver (+74.2 per cent), gold (+28.1 per cent), copper (+16.6 per cent), lead (+11.4 per cent), aluminum (+10.0 per cent) and zinc (+1.1 per cent). However, price declines were observed during this period for molybdenum (-3.2 per cent) and magnesium (-3.6 per cent).
Outlook
Real exports of goods and services are forecast to rise by 2.5 per cent in 2012, following an estimated increase of 4.5 per cent in 2011. Stronger real export growth is forecast for 2013, reaching 3.0 per cent on the year. In the medium-term, average annual growth of 3.1 per cent is anticipated for real exports.
Due to continued weakness in the US housing market, lumber prices are projected to remain fairly low through 2012, averaging $260 US/000 board feet for the year. As the US housing market is expected to gradually recover over the next few years, prices are forecast to average $288 US/000 board feet in 2013 and $300 US/000 board feet for the 2014 to 2016 period.
The price of natural gas fell heavily during the 2008/09 recession and is expected to remain low in the near-term due to a large supply of shale gas in North America. Based on private sector forecasts, natural gas prices are expected to strengthen somewhat over the forecast period. Between fiscal years 2012/13 and 2016/17, prices are projected to rise from $2.52 C/GJ to $4.51 C/GJ.
Budget and Fiscal Plan – 2012/13 to 2014/15
83
British Columbia Economic Review and Outlook
Demographics
BC’s population on July 1, 2011 was 4.57 million people, 1.0 per cent higher than the 4.53 million people counted on the same date in 2010. During the first three quarters of 2011, BC saw a net inflow of 30,221 people, as the province welcomed 31,788 individuals from other countries but lost 1,567 people relocating to other provinces — registering BC’s first net interprovincial outflow since 2003.
Outlook
The forecast calls for BC’s July 1st population to increase by 1.1 per cent in 2012, to reach a total of 4.62 million people, and by a further 1.3 per cent in 2013, to total 4.68 million.
Total net migration is forecast to rise in 2012, climbing to a net inflow of 47,000 persons from an estimated 32,500 persons in 2011, due to improvement in both interprovincial and international migration. On the interprovincial front, a return to net inflow is expected this year, with a projected gain of 5,900 people following a net outflow in 2011. Stronger international migration is also forecast for 2012, with an anticipated net gain of 41,100 people from other countries.
Inflation
Consumer price inflation in BC rose by 2.4 per cent in 2011 compared to the previous year, as strong increases in the inflation of non-durables and services more than offset price deflation in durable and semi-durable goods. Rising gasoline, electricity and food prices drove the increase in non-durables, while higher prices for restaurants and education provided upward inflationary pressure on the services side. Prices for durables eased in response to lower prices for home entertainment equipment, furniture and household appliances. At the same time, lower prices for items such as clothing, footwear and household textiles led to the overall decline in the semi-durable component.
Outlook
Consumer price inflation in BC is forecast to be 1.9 per cent in 2012, 1.5 per cent in 2013 (as the return to PST slows the rate of inflation) and about 2.0 per cent per year on average in the medium-term. The Canadian rate of inflation is assumed to be 2.1 per cent in 2012 and 2.0 per cent in 2013 and over the medium-term, in line with the Bank of Canada’s inflation target.
Risks to the Economic Outlook
Risks to the BC economic outlook continue to be weighted to the downside, largely due to ongoing uncertainty around global economic activity. The most significant risks to the current outlook include:
· a return to recession in the US (characterized by weaker consumer spending, widespread deleveraging causing slower investment, a very slow job market recovery, continued weakness in the housing market and further fiscal restraint by federal, state and local governments);
· the sovereign debt crisis in Greece, Ireland and Portugal spreading to larger European economies like Italy and Spain, and threatening the stability of global financial markets as well as another global credit crisis;
Budget and Fiscal Plan – 2012/13 to 2014/15
84
British Columbia Economic Review and Outlook
· slower than anticipated Asian demand resulting in weaker demand for BC’s exports;
· exchange rate volatility; and
· further weakening of the US dollar, resulting in significant disruptions to global financial and commodity markets.
External Outlook
United States
The US economy is currently experiencing a period of sluggish economic activity as it continues its very slow recovery from the housing collapse and ensuing financial crisis it experienced starting in late 2008. This long recovery period is consistent with economic performance in a balance sheet recession, in which widespread deleveraging occurs for several years before an economy can return to a sustainable path. See the topic box on page 101 for more information on balance sheet recessions.
After expanding by 3.0 per cent in 2010, the US economy slowed considerably in 2011, growing by just 1.7 per cent. Growth was restrained by rising commodity prices, the Japanese earthquake, sovereign debt woes in Europe, political gridlock in the US Congress, and tepid performances in the domestic housing and labour markets. US real GDP increased at an annualized rate of 2.8 per cent in the October to December quarter of 2011, fuelled mainly by a substantial gain in inventories. Excluding inventories, real GDP rose by just 0.8 per cent in last year’s final quarter. While this recent period showed the fastest pace of quarterly growth in 1½ years slower gains are anticipated in 2012 due to expected fiscal restraint from all levels of US government and to troubled European economies placing downward pressure on US exports.
Chart 3.7 US employment improving
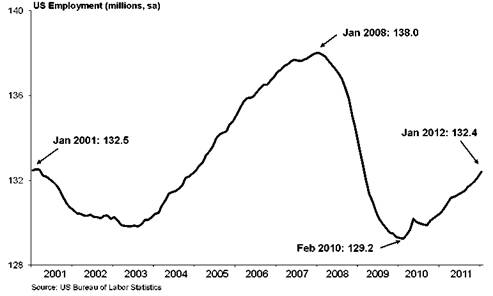
Despite modest job gains in recent months, the US employment situation remains bleak, with 5.6 million American workers having lost their jobs since the January 2008 peak. As a result, US employment currently sits near levels observed in early 2001 (see Chart 3.7). Although the monthly unemployment rate has fallen since September 2011, it still sat at a relatively high 8.3 per cent as of January 2012. Positive monthly job gains
Budget and Fiscal Plan – 2012/13 to 2014/15
85
British Columbia Economic Review and Outlook
were observed through 2011, at a pace of about 151,700 new jobs per month on average. Although new jobs are now being created, it would take nearly two years at the fairly strong January 2012 rate of 243,000 new jobs per month just to replace all of the jobs lost since employment began to fall in February 2008. Further, there are 1.1 million discouraged workers in the US, which is higher than the number observed during the 2008/09 recession. Discouraged workers are individuals who have stopped actively seeking work since they believe there are no jobs for them.
Chart 3.8 US housing starts remain weak
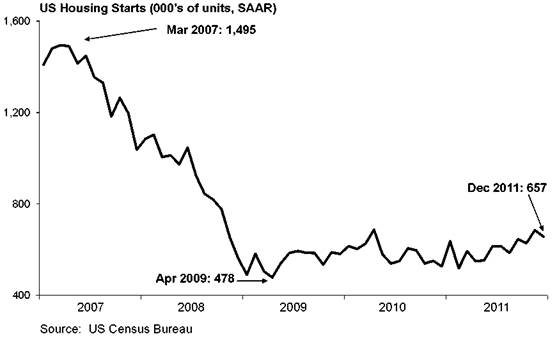
The deeply troubled American housing market also continued to be a major source of weakness for the US economy last year, as housing starts averaged just 606,900 units in 2011. Although this represents a 3.4 per cent increase from 2010, housing starts remain extremely slow and show little indication of recovering to historical levels anytime soon.
Existing home sales are also suffering in the US, remaining at extremely low levels. Sales averaged just 4.3 million in 2011, with several months of very weak activity occurring in the middle of the year. However, a small 2.5 per cent annual increase was observed in 2011, climbing slightly from the 4.2 million sales observed in 2010. High unemployment, low prices (the Case-Shiller 20-city price index was 32.9 per cent below its July 2006 peak as of November 2011) and negative home equity (where the amount owed on a mortgage is now worth more than the home) are all placing downward pressure on sales.
Concerns about the sustainability of the US economic recovery continue to hold US consumer confidence low by historical standards. After dipping to 40.9 in October 2011, the Conference Board consumer confidence index rose in November and December to reach 64.8 and then dropped again to reach 61.1 in January 2012. A steady reading of 90 is indicative of a healthy US economy—a level this index has not approached since 2007. High unemployment, slow wage growth, falling home prices and limited credit availability continue to weigh on US consumer sentiment.
Budget and Fiscal Plan – 2012/13 to 2014/15
86
British Columbia Economic Review and Outlook
Chart 3.9 US consumer confidence remains depressed
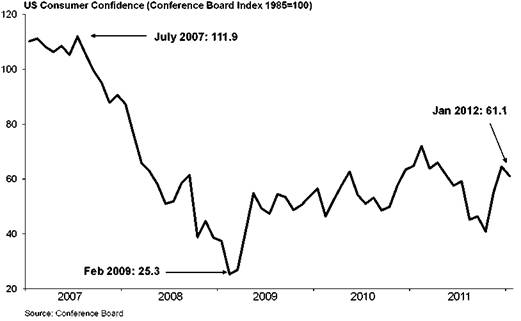
Outlook
According to the January 2012 Consensus, US real GDP is projected to increase by 2.2 per cent this year (see Chart 3.10). The Consensus forecast was revised slightly upward in recent months due mainly to positive employment gains in the final months of 2011. Consensus analysts also cited strong third quarter growth in business investment as a sign that more new hiring could be on the way in 2012. Forecasters project US real GDP to increase at a slightly greater rate in 2013, rising by 2.5 per cent.
Chart 3.10 US Consensus outlook for 2012

Budget and Fiscal Plan – 2012/13 to 2014/15
87
British Columbia Economic Review and Outlook
The Ministry acknowledges a significant risk of weaker than expected US economic growth in 2012, characterized by slower consumer spending, a very slow job market recovery and continued weakness in the housing market. In recognition of these significant risks, the Ministry’s US growth assumptions are prudent relative to the January 2012 Consensus. The Ministry assumes that the US economy will expand by 1.4 per cent in 2012, compared to the 2.2 per cent increase projected in the January Consensus. The Ministry then expects 1.8 per cent US real GDP growth in 2013 (compared to 2.5 per cent in the Consensus) and 2.6 per cent annually over the medium-term.
Table 3.3 US real GDP forecast: Consensus vs Ministry of Finance
| | 2012 | | 2013 | |
| | Per cent change in real GDP | |
Ministry of Finance | | 1.4 | | 1.8 | |
Consensus Economics (January 2012) | | 2.2 | | 2.5 | |
Canada
Canadian real GDP resumed growing at an annualized rate of 3.5 per cent in the July to September quarter of 2011, the same pace as the January to March quarter, after being interrupted by a 0.5 per cent contraction in the April to June quarter due to a drop in exports. A strong rebound in exports, together with a decline in imports, was the main driver behind the Canadian economy’s return to growth in the July to September quarter.
Like BC, Canada’s domestic economy has seen modest improvement in some major indicators in 2011 relative to the previous year. Canadian retail sales advanced by 3.6 per cent year-to-date to November 2011 compared to the same period in 2010. Despite slower activity through the first two quarters of 2011, the pace of sales growth improved over the latter two quarters. Further, national housing starts averaged 194,000 units in 2011, an increase of 2.1 per cent over 2010. Unlike retail sales, however, the pace of housing starts activity slowed over the final two quarters of last year. Canadian home sales also saw a modest rise overall in 2011, with the number of units sold up by 2.2 per cent over 2010.
Employment in Canada grew by 265,200 jobs (or 1.6 per cent) in 2011 compared to 2010, raising the annual number of jobs above the pre-recession peak in 2008. The national unemployment rate averaged 7.4 per cent in 2011, down from the 8.0 per cent observed the previous year. Despite the annual gain last year over 2010, the pace of employment growth slowed during the latter half of 2011, registering a slight 0.3 per cent quarterly gain in the July to September quarter and a 0.1 per cent drop in the October to December period. The monthly unemployment rate was 7.6 per cent in January 2012, up slightly from 7.5 per cent in December 2011.
Despite a strong dollar valued above parity through the first eight months of 2011, Canada’s trade sector made substantial gains in 2011. The value of Canadian merchandise exports improved by 12.2 per cent during the first 11 months of 2011 compared to the same period in 2010. This increase was led by advances in exports of energy and industrial goods. Canadian shipments of manufactured goods also performed well in 2011, as the total value of these shipments climbed by 7.7 per cent year-to-date to November 2011.
Budget and Fiscal Plan – 2012/13 to 2014/15
88
British Columbia Economic Review and Outlook
The principal threats to continued Canadian growth are external: slowing economic activity in emerging markets, an anemic US recovery and the intensifying threat of a global financial market shock being sparked by one or more sovereign debt defaults in Europe. If the European debt situation deteriorates further, the economies of the US and several Asian nations could face significant downward pressure due to their strong trade connections with Europe. As a result, Canada could see considerable slowing in its exports due to strong trade links with the US and Asian economies.
Chart 3.11 Consensus outlook for Canada in 2012 holds steady
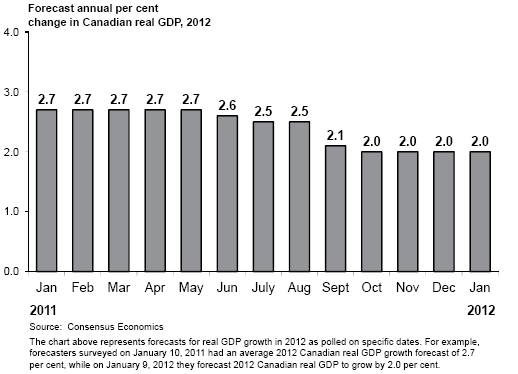
Outlook
The January 2012 Consensus projects Canada’s real GDP to grow by 2.0 per cent this year and 2.3 per cent in 2013. Due to the potential for further near-term weakness in the US and global economies, the Ministry assumes that the Canadian economy will experience a 1.5 per cent expansion in 2012, followed by a 2.0 per cent increase in 2013. Over the medium-term, the Ministry assumes 2.5 per cent growth per year.
Table 3.4 Canadian real GDP forecast: Consensus vs Ministry of Finance
| | 2012 | | 2013 | |
| | Per cent change in real GDP | |
Ministry of Finance | | 1.5 | | 2.0 | |
Consensus Economics (January 2012) | | 2.0 | | 2.3 | |
Budget and Fiscal Plan – 2012/13 to 2014/15
89
British Columbia Economic Review and Outlook
Other economies
Europe
The European sovereign debt crisis represents the largest and most immediate threat to the global economic outlook. In recent weeks, forecasters have slashed their projections for global growth in 2012, due largely to an expected recession in the Euro zone that will weigh heavily on world economic activity.
In January 2012, European governments attempted to agree on another rescue package for the beleaguered Greek government, as Greece requires billions in aid by late March in order to avoid defaulting on its enormous debt. At the time of writing, no agreement had been reached, as the German government’s insistence on an EU-appointed overseer of Greece’s budget was met with stiff resistance from Greek leaders and citizens.
Widespread concern over contagion beyond Greece was on the rise recently as bond yields on Italian and Spanish debt remained at very high rates in early 2012. Due to the increased risk of Italy defaulting on its debt, Italian ten-year bond yields hovered around seven per cent in recent months — a level viewed as unsustainable by financial markets and at which Ireland and Portugal sought international aid. Further, several troubled European nations received downgrades on their bond ratings from Standard and Poor’s in January 2012. This list of troubled countries included not just Spain, Italy and Portugal, but also Austria and France. Of the 17 Euro zone member states, just four now hold AAA bond ratings from Standard and Poor’s: Finland, Germany, Luxembourg and the Netherlands.
As a consequence, European banks are currently facing significant difficulty securing financing, as credit conditions tighten in many areas of the Euro zone. As such, Europe’s banks are preparing to tap the European Central Bank’s emergency funding scheme for a substantial amount of money in February 2012. The ECB’s three-year loan program,
Chart 3.12 Europe enters recession
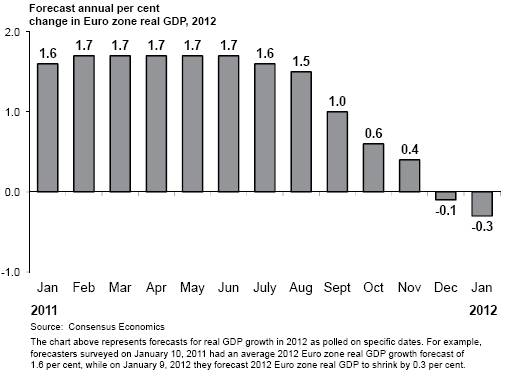
Budget and Fiscal Plan – 2012/13 to 2014/15
90
British Columbia Economic Review and Outlook
which lends money to banks in need of liquidity, commands a very low interest rate of 1.0 per cent and provided Europe’s banks with nearly €500 billion through its first auction in December 2011. At February’s auction, some banks expect they will seek double or triple the amount they borrowed in December.
The January 2012 Consensus projects a European recession in 2012, as Euro zone real GDP is expected to contract by 0.3 per cent this year. Sluggish growth is anticipated the following year, with the January Consensus forecasting European growth at 1.0 per cent in 2013. With the expectation for further forecast downgrades in coming months, the Ministry assumes a contraction in the Euro zone of 1.1 per cent in 2012 and fat growth in 2013.
China
The rapidly expanding Chinese economy has shown signs of cooling in recent months. China’s real GDP increased by an annualized rate of 8.2 per cent in the final quarter of 2011, down from the 9.5 per cent observed in the third quarter of last year. The 8.2 per cent rate in the most recent quarter represents the slowest quarterly growth rate in ten quarters, which may prompt Chinese officials to loosen monetary policy in the coming months in order to stimulate economic activity. Overall in 2011, the Chinese economy grew by 9.2 per cent, which is slower than the 10.4 per cent increase the country registered in 2010.
January 2012’s Blue Chip Economic Indicators publication projects that China’s real GDP will expand by 8.0 per cent this year. China’s performance in 2012 is a critical factor shaping how the global economy will perform overall. As the Chinese economy is slowing somewhat from the rapid expansion it experienced in recent years, whether or not a soft landing occurs following this slowdown will have major implications for the stability of world financial markets and for the economic well-being of China’s trading partners.
Financial Markets
Interest rates
At its most recent meeting in January 2012, the Bank of Canada announced that it will continue to hold its target for the overnight rate at 1.00 per cent (where it has remained since September 2010). Bank officials noted that the global outlook has deteriorated since its last Monetary Policy Report in October 2011, due to rising concerns over the European debt crisis and expectations of a very slow US recovery.
The US Federal Reserve has held its intended federal funds rate in the 0.00 to 0.25 per cent range since December 2008. In response to ongoing weakness in the US economy, the Fed announced in January 2012 that it would keep its key interest rate at this historic low until late 2014. If the rate remains at this level until that time, the Fed will have maintained a near-zero interest rate for a full six years in an effort to stimulate US economic activity.
Outlook
Based on the average of six private sector forecasts as of January 5, 2012, the Ministry’s interest rate outlook assumes that the Bank of Canada will hold the overnight target rate at 1.0 per cent until the first quarter of 2013. These six forecasters expect the rate to rise
Budget and Fiscal Plan – 2012/13 to 2014/15
91
British Columbia Economic Review and Outlook
Chart 3.13 Private sector expects low Canadian and US interest rates in 2012
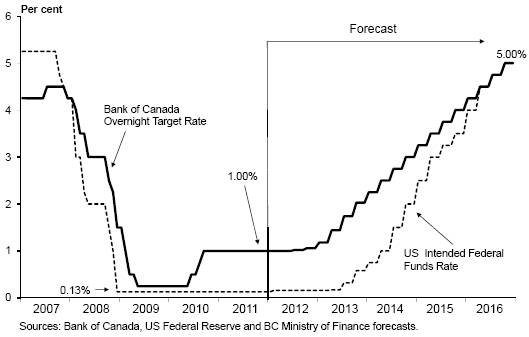
slowly next year, reaching 2.0 per cent by the end of 2013. The forecasters project the overnight target rate to average 1.0 per cent in 2012 and 1.9 per cent in 2013.
As of January 5, 2012, the same six forecasters project that the US Federal Reserve will keep the fed funds rate in the 0.0 per cent to 0.25 per cent range for the duration of 2012. They then expect the rate to reach 0.50 per cent in the third quarter of 2013 and 0.75 per cent in the fourth quarter of that year. On average, the six forecasters project the fed funds rate will be 0.2 per cent in 2012 and 0.3 per cent in 2013. Note that private sector forecasts do not reflect the Fed’s January 25, 2012 pledge to hold the Fed funds rate exceptionally low through 2014. As such, the January 5, 2012 private sector interest rate forecast can be considered a slightly prudent projection.
The average of private sector forecasters’ views on Canadian short-term interest rates (three month Treasury bills) as of January 5, 2012 indicates that three month rates will average 1.0 per cent in 2012 and 1.6 per cent in 2013. The same private sector forecasters expect ten-year Government of Canada bonds to average 2.4 per cent in 2012 and 3.0 per cent in 2013.
Table 3.5 Private Sector Canadian Interest Rate Forecasts
| | 3-month Treasury Bill | | 10-year Government Bond | |
Average annual interest rate (per cent) | | 2012 | | 2013 | | 2012 | | 2013 | |
Global Insight | | 1.0 | | 1.6 | | 2.5 | | 3.0 | |
CIBC | | 0.9 | | 1.0 | | 2.4 | | 2.6 | |
Bank of Montreal | | 0.9 | | 1.6 | | 2.1 | | 2.8 | |
Scotiabank | | 0.9 | | 1.7 | | 2.2 | | 3.1 | |
TD Economics | | 0.9 | | 1.8 | | 2.4 | | 3.4 | |
RBC Capital Markets | | 1.2 | | 2.1 | | 2.6 | | 3.2 | |
Average (as of January 5, 2012) | | 1.0 | | 1.6 | | 2.4 | | 3.0 | |
Budget and Fiscal Plan – 2012/13 to 2014/15
92
British Columbia Economic Review and Outlook
Exchange rate
The Canadian dollar began 2011 above parity with the US dollar and remained above par nearly every day until mid-September. The loonie reached as high as 105.8 US cents in July 2011, fuelled by strong commodity prices and a weaker US dollar. The Canadian dollar has fallen slightly below parity in recent months, as cautious investors sought the perceived safety of the US dollar in response to rising global economic uncertainty. The dollar averaged 101.1 US cents in 2011, and was trading very close to parity as of February 3, 2012.
Chart 3.14 Private sector expects lower Canadian dollar in 2012
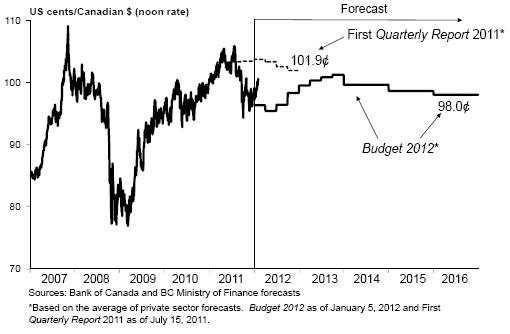
Outlook
An average of six private sector forecasts as of January 5, 2012 sees the Canadian dollar falling slightly to average 96.6 US cents in 2012, and then rising to average 100.5 US cents in 2013. The Ministry’s exchange rate outlook is based on these private sector averages.
Table 3.6 Private Sector Exchange Rate Forecasts
Average annual exchange rate (US cents/Can $) | | 2012 | | 2013 | |
Global Insight | | 97.8 | | 98.2 | |
CIBC | | 95.5 | | 99.0 | |
Bank of Montreal | | 96.3 | | 101.0 | |
Scotiabank | | 99.5 | | 102.8 | |
TD Economics | | 92.3 | | 98.7 | |
RBC Capital Markets | | 98.2 | | 103.1 | |
Average (as of January 5, 2012) | | 96.6 | | 100.5 | |
Budget and Fiscal Plan – 2012/13 to 2014/15
93
British Columbia Economic Review and Outlook
Table 3.7.1 Gross Domestic Product: British Columbia
| | | | | | Forecast | |
| | 2010 | | 2011 (e) | | 2012 | | 2013 | | 2014 | | 2015 | | 2016 | |
BRITISH COLUMBIA: | | | | | | | | | | | | | | | |
Gross Domestic Product at Market Prices: | | | | | | | | | | | | | | | |
– Real (2002 $ billion; chain-weighted) | | 167.1 | | 170.5 | | 173.6 | | 177.5 | | 182.0 | | 186.5 | | 191.2 | |
(% change) | | 3.0 | | 2.0 | | 1.8 | | 2.2 | | 2.5 | | 2.5 | | 2.5 | |
– Current dollar ($ billion) | | 203.1 | | 212.0 | | 219.8 | | 228.7 | | 238.6 | | 249.6 | | 261.1 | |
(% change) | | 5.9 | | 4.3 | | 3.7 | | 4.1 | | 4.4 | | 4.6 | | 4.6 | |
– GDP price deflator (2002 = 100) | | 121.5 | | 124.3 | | 126.6 | | 128.8 | | 131.1 | | 133.8 | | 136.5 | |
(% change) | | 2.7 | | 2.3 | | 1.8 | | 1.8 | | 1.8 | | 2.0 | | 2.0 | |
Real GDP per person | | | | | | | | | | | | | | | |
(2002 $; chain-weighted) | | 36,899 | | 37,292 | | 37,561 | | 37,919 | | 38,370 | | 38,816 | | 39,261 | |
(% change) | | 1.4 | | 1.1 | | 0.7 | | 1.0 | | 1.2 | | 1.2 | | 1.1 | |
Real GDP per employed person | | | | | | | | | | | | | | | |
(% change) | | 1.3 | | 1.2 | | 0.9 | | 0.8 | | 1.1 | | 1.0 | | 1.0 | |
Unit labour cost(1) (% change) | | 0.9 | | 2.7 | | 1.7 | | 1.8 | | 1.6 | | 1.7 | | 1.7 | |
Components of British Columbia Real GDP at Market Prices ($2002 billions; chain-weighted) | | | | | | | | | | | | | | | |
Personal expenditure on | | | | | | | | | | | | | | | |
Goods and services | | 119.2 | | 120.7 | | 123.6 | | 126.6 | | 130.0 | | 133.4 | | 137.0 | |
(% change) | | 3.8 | | 1.3 | | 2.4 | | 2.4 | | 2.7 | | 2.7 | | 2.7 | |
– Goods | | 47.5 | | 47.3 | | 48.2 | | 49.1 | | 50.4 | | 51.6 | | 52.9 | |
(% change) | | 3.1 | | -0.4 | | 1.9 | | 1.9 | | 2.5 | | 2.5 | | 2.5 | |
– Services | | 71.5 | | 73.2 | | 75.1 | | 77.2 | | 79.3 | | 81.5 | | 83.8 | |
(% change) | | 4.2 | | 2.3 | | 2.7 | | 2.7 | | 2.8 | | 2.8 | | 2.8 | |
Government current expenditures on | | | | | | | | | | | | | | | |
Goods and services | | 33.4 | | 33.9 | | 34.0 | | 34.4 | | 34.7 | | 35.3 | | 35.9 | |
(% change) | | 1.6 | | 1.4 | | 0.2 | | 1.1 | | 1.0 | | 1.6 | | 1.8 | |
Investment in fixed capital | | 39.4 | | 40.4 | | 41.0 | | 42.3 | | 43.4 | | 45.1 | | 46.3 | |
(% change) | | 13.4 | | 2.6 | | 1.5 | | 3.2 | | 2.7 | | 3.7 | | 2.7 | |
Final domestic demand | | 191.8 | | 194.8 | | 198.3 | | 203.0 | | 207.8 | | 213.5 | | 218.9 | |
(% change) | | 5.3 | | 1.6 | | 1.8 | | 2.3 | | 2.4 | | 2.7 | | 2.5 | |
Exports goods and services | | 70.4 | | 73.5 | | 75.4 | | 77.6 | | 80.0 | | 82.5 | | 85.1 | |
(% change) | | 6.0 | | 4.5 | | 2.5 | | 3.0 | | 3.1 | | 3.1 | | 3.1 | |
Imports goods and services | | 94.8 | | 98.4 | | 101.2 | | 104.7 | | 108.1 | | 111.5 | | 114.9 | |
(% change) | | 9.9 | | 3.9 | | 2.8 | | 3.4 | | 3.2 | | 3.2 | | 3.0 | |
Inventory change | | -1.7 | | -0.8 | | -0.3 | | 0.1 | | 0.7 | | 0.6 | | 0.6 | |
Statistical discrepancy | | 0.1 | | 0.1 | | 0.1 | | 0.1 | | 0.1 | | 0.1 | | 0.1 | |
Real GDP at market prices | | 167.1 | | 170.5 | | 173.6 | | 177.5 | | 182.0 | | 186.5 | | 191.2 | |
(% change) | | 3.0 | | 2.0 | | 1.8 | | 2.2 | | 2.5 | | 2.5 | | 2.5 | |
(1) Unit labour cost is the nominal cost of labour incurred to produce one unit of real output.
(e) Ministry of Finance estimate.
Budget and Fiscal Plan – 2012/13 to 2014/15
94
British Columbia Economic Review and Outlook
Table 3.7.2 Components of Nominal Income and Expenditure
| | | | | | Forecast | |
| | 2010 | | 2011 | | 2012 | | 2013 | | 2014 | | 2015 | | 2016 | |
Labour income(1) ($ million) | | 104,630 | | 109,653 | (e) | 113,577 | | 118,185 | | 123,097 | | 128,299 | | 133,723 | |
(% change) | | 4.0 | | 4.8 | | 3.6 | | 4.1 | | 4.2 | | 4.2 | | 4.2 | |
Personal income ($ million) | | 163,953 | | 170,030 | (e) | 176,328 | | 182,954 | | 190,337 | | 198,093 | | 206,291 | |
(% change) | | 4.0 | | 3.7 | | 3.7 | | 3.8 | | 4.0 | | 4.1 | | 4.1 | |
Corporate profits before taxes ($ million) | | 21,608 | | 23,909 | (e) | 24,771 | | 25,828 | | 27,497 | | 29,526 | | 31,750 | |
(% change) | | 21.5 | | 10.6 | | 3.6 | | 4.3 | | 6.5 | | 7.4 | | 7.5 | |
Retail sales ($ million) | | 58,145 | | 59,182 | (e) | 61,154 | | 63,288 | | 65,837 | | 68,490 | | 71,259 | |
(% change) | | 5.3 | | 1.8 | | 3.3 | | 3.5 | | 4.0 | | 4.0 | | 4.0 | |
Housing starts | | 26,479 | | 26,400 | | 24,978 | | 26,037 | | 26,741 | | 27,198 | | 27,156 | |
(% change) | | 64.7 | | -0.3 | | -5.4 | | 4.2 | | 2.7 | | 1.7 | | -0.2 | |
Residential investment(2) ($ million) | | 17,182 | | 18,028 | (e) | 18,542 | | 19,408 | | 20,092 | | 21,000 | | 21,968 | |
(% change) | | 8.5 | | 4.9 | | 2.8 | | 4.7 | | 3.5 | | 4.5 | | 4.6 | |
BC consumer price index (2002 = 100) | | 113.8 | | 116.5 | | 118.8 | | 120.5 | | 122.9 | | 125.5 | | 128.2 | |
(% change) | | 1.3 | | 2.4 | | 1.9 | | 1.5 | | 1.9 | | 2.1 | | 2.1 | |
(1) Domestic basis; wages, salaries and supplementary labour income.
(2) Includes renovations and improvements.
(e) Ministry of Finance estimate.
Table 3.7.3 Labour Market Indicators
| | | | | | Forecast | |
| | 2010 | | 2011 | | 2012 | | 2013 | | 2014 | | 2015 | | 2016 | |
Population (on July 1) (000’s) | | 4,530 | | 4,573 | | 4,623 | | 4,681 | | 4,743 | | 4,806 | | 4,870 | |
(% change) | | 1.6 | | 1.0 | | 1.1 | | 1.3 | | 1.3 | | 1.3 | | 1.3 | |
Labour force population, 15+ Years (000’s) | | 3,729 | | 3,779 | | 3,825 | | 3,877 | | 3,931 | | 3,984 | | 4,038 | |
(% change) | | 1.8 | | 1.3 | | 1.2 | | 1.4 | | 1.4 | | 1.4 | | 1.3 | |
Net in-migration (000’s) | | | | | | | | | | | | | | | |
– International(1),(3) | | 37.3 | | 35.0 | (e) | 41.1 | | 42.4 | | 44.2 | | 44.6 | | 44.8 | |
– Interprovincial(3) | | 4.7 | | -2.5 | (e) | 5.9 | | 8.7 | | 9.0 | | 10.3 | | 10.3 | |
– Total | | 42.0 | | 32.5 | (e) | 47.0 | | 51.1 | | 53.2 | | 54.9 | | 55.1 | |
Participation rate(2) (%) | | 65.5 | | 65.0 | | 64.9 | | 64.7 | | 64.8 | | 64.8 | | 64.9 | |
Labour force (000’s) | | 2,443 | | 2,458 | | 2,482 | | 2,510 | | 2,545 | | 2,580 | | 2,619 | |
(% change) | | 1.7 | | 0.6 | | 1.0 | | 1.1 | | 1.4 | | 1.4 | | 1.5 | |
Employment (000’s) | | 2,257 | | 2,275 | | 2,295 | | 2,328 | | 2,361 | | 2,396 | | 2,432 | |
(% change) | | 1.7 | | 0.8 | | 0.9 | | 1.4 | | 1.4 | | 1.5 | | 1.5 | |
Unemployment rate (%) | | 7.6 | | 7.5 | | 7.5 | | 7.3 | | 7.2 | | 7.1 | | 7.1 | |
(1) International migration includes net non-permanent residents and returning emigrants less net temporary residents abroad.
(2) Percentage of the population 15 years of age and over in the labour force.
(3) Components may not sum to total due to rounding.
(e) BC Stats estimate.
Budget and Fiscal Plan – 2012/13 to 2014/15
95
British Columbia Economic Review and Outlook
Table 3.7.4 Major Economic Assumptions
| | | | | | Forecast | |
| | 2010 | | 2011 | | 2012 | | 2013 | | 2014 | | 2015 | | 2016 | |
GDP (billions) | | | | | | | | | | | | | | | |
Canada real (2002 $; chain-weighted) | | 1,325 | | 1,355 | (e) | 1,375 | | 1,403 | | 1,438 | | 1,474 | | 1,511 | |
(% change) | | 3.2 | | 2.3 | | 1.5 | | 2.0 | | 2.5 | | 2.5 | | 2.5 | |
US real (2005 US$; chain-weighted) | | 13,088 | | 13,313 | | 13,494 | | 13,742 | | 14,081 | | 14,449 | | 14,829 | |
(% change) | | 3.0 | | 1.7 | | 1.4 | | 1.8 | | 2.5 | | 2.6 | | 2.6 | |
Japan real (2005 Yen; chain-weighted) | | 511,204 | | 504,899 | (e) | 512,357 | | 517,585 | | 522,649 | | 527,754 | | 532,947 | |
(% change) | | 4.5 | | -1.2 | | 1.5 | | 1.0 | | 1.0 | | 1.0 | | 1.0 | |
Europe real(1) (% change) | | 1.9 | | 1.4 | (e) | -1.1 | | 0.0 | | 1.0 | | 1.5 | | 1.5 | |
Industrial production index | | | | | | | | | | | | | | | |
US (2007 = 100) | | 90.1 | | 93.8 | | 95.1 | | 97.0 | | 99.4 | | 102.0 | | 104.7 | |
(% change) | | 5.3 | | 4.1 | | 1.4 | | 2.0 | | 2.5 | | 2.6 | | 2.6 | |
Japan (2005 = 100) | | 94.9 | | 91.6 | | 93.4 | | 94.6 | | 95.6 | | 96.5 | | 97.5 | |
(% change) | | 16.1 | | -3.5 | | 2.0 | | 1.3 | | 1.0 | | 1.0 | | 1.0 | |
Europe(1) (2005 = 100) | | 97.4 | | 101.1 | (e) | 99.5 | | 99.5 | | 100.5 | | 102.0 | | 103.5 | |
(% change) | | 7.4 | | 3.8 | | -1.6 | | 0.0 | | 1.0 | | 1.5 | | 1.5 | |
Housing starts(2) (000’s) | | | | | | | | | | | | | | | |
Canada | | 190 | | 194 | | 170 | | 175 | | 180 | | 180 | | 180 | |
(% change) | | 27.4 | | 2.1 | | -12.3 | | 2.9 | | 2.9 | | 0.0 | | 0.0 | |
US | | 587 | | 607 | | 580 | | 700 | | 800 | | 900 | | 1,000 | |
(% change) | | 5.9 | | 3.4 | | -4.4 | | 20.7 | | 14.3 | | 12.5 | | 11.1 | |
Japan | | 813 | | 834 | | 840 | | 850 | | 850 | | 850 | | 850 | |
(% change) | | 3.1 | | 2.6 | | 0.7 | | 1.2 | | 0.0 | | 0.0 | | 0.0 | |
Consumer price index | | | | | | | | | | | | | | | |
Canada (2002 = 100) | | 116.5 | | 119.9 | | 122.4 | | 124.9 | | 127.4 | | 129.9 | | 132.5 | |
(% change) | | 1.8 | | 2.9 | | 2.1 | | 2.0 | | 2.0 | | 2.0 | | 2.0 | |
Canadian interest rates (%) | | | | | | | | | | | | | | | |
3-Month treasury bills | | 0.6 | | 0.9 | | 1.0 | | 1.6 | | 2.6 | | 3.6 | | 4.6 | |
10-year government bonds | | 3.2 | | 2.8 | | 2.4 | | 3.0 | | 3.9 | | 4.9 | | 5.8 | |
United States interest rates (%) | | | | | | | | | | | | | | | |
3-Month treasury bills | | 0.1 | | 0.1 | | 0.1 | | 0.3 | | 1.3 | | 3.1 | | 4.6 | |
10-year government bonds | | 3.2 | | 2.8 | | 2.3 | | 2.9 | | 3.6 | | 4.6 | | 5.6 | |
Exchange rate (US cents / Canadian $) | | 97.1 | | 101.1 | | 96.6 | | 100.5 | | 99.6 | | 98.6 | | 98.0 | |
British Columbia goods and services Export price deflator (% change) | | 1.7 | | 1.2 | (e) | 2.3 | | 1.8 | | 2.9 | | 2.5 | | 2.6 | |
(1) Euro zone (12) is Austria, Belgium, Finland, France, Germany, Greece, Ireland, Italy, Luxembourg, Netherlands, Portugal and Spain.
(2) British Columbia housing starts appear in Table 3.7.2.
(e) Ministry of Finance estimate.
Budget and Fiscal Plan – 2012/13 to 2014/15
96
British Columbia Economic Review and Outlook
The Economic Forecast Council, 2012
Introduction
In accordance with the Budget Transparency and Accountability Act, the Minister of Finance, in preparing each year’s provincial budget, consults the Economic Forecast Council (the Council) on British Columbia’s economic outlook. The Council is comprised of 14 leading economists from several of Canada’s major banks and private research institutions.
The most recent meeting between the Minister and Council occurred on November 18, 2011, with Council members presenting their estimates for economic performance in 2011, as well as their forecasts for 2012 and beyond (BC real GDP growth forecasts were made public on the date of the meeting). The central issues discussed by the Council included the European debt crisis, the slow US economic recovery, balancing BC’s budget and housing affordability in BC.
Subsequent to November’s meeting, participants were permitted to submit revised forecasts until January 11, 2012 (11 of the 14 members chose to revise). Forecast details from the Council surveys are summarized in the table at the end of this topic box.
British Columbia Forecast
Council members’ estimates for economic growth in BC in 2011 averaged 2.2 per cent, while their forecasts for future growth averaged 2.2 per cent in 2012, 2.5 per cent in 2013
Chart 1 — Economic Forecast Council Outlook for the BC Economy
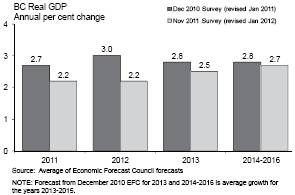
and 2.7 per cent for the 2014 to 2016 period. The Council lowered its average outlook for BC’s economy substantially in both the near and medium-term from a year ago (for Budget 2011, members projected increases of 2.7 per cent in 2011, 3.0 per cent in 2012 and 2.8 per cent for 2013 — see Chart 1).
Council members, on average, expect BC’s economic growth to be slightly lower than Canada’s in 2011, slightly higher in 2012, and equal to the national average in 2013. For the 2014 to 2016 period, the Council projects BC’s economy to outperform Canada’s on average (see Chart 2).
Chart 2 — Economic Forecast Council Outlook for BC and Canada
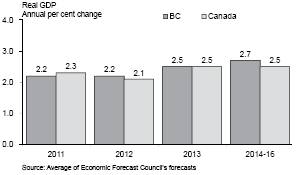
Members generally agreed that the recent global recession has affected BC’s economy less severely than it has most other Canadian provinces. Participants noted that BC’s high proportion of exports to Chinese and other rapidly-expanding Asian economies (relative to other provinces) provide BC with some offset to existing risks in the US and European economies. Further, members pointed to potential natural resource projects (e.g. mining, natural gas) coming on in northern BC as a source of economic strength going forward. However, Council members also noted that BC’s domestic economy is recovering at a slow pace, with recent retail sales figures having a weak performance. Further, they highlighted that private sector employment in BC is still below its pre-recession peak.
Participants suggested that significant risks to the BC outlook continue to stem from foreign nations, especially from the US and European
Budget and Fiscal Plan – 2012/13 to 2014/15
97
British Columbia Economic Review and Outlook
economies. Members expect the US recovery to proceed at a fairly sluggish pace for several years, placing downward pressure on BC’s exports to the US. Ongoing weakness in the US housing market will continue to have a negative effect on BC’s wood products exports in particular. Instability in global financial markets due to debt concerns in several large European nations was also listed by members as a significant risk to BC’s outlook. Participants noted that continued demand from Asia for BC exports would likely have a positive effect on the BC economic outlook going forward. Further in Asia, the rebuilding in Japan following the massive earthquake that occurred there in 2011 could provide a short-term boost in Japanese demand for materials produced in BC.
Council members praised the BC government’s prudent approach to economic forecasting and budgeting in the past. Several participants advised the BC government to stay the course on its current plan to balance the provincial budget in the 2013/14 fiscal year. However, a number of members also noted that some flexibility around the specific date of budget balance is acceptable, given the considerable downside risks to the global economic outlook. The Council also acknowledged the challenges associated with providing increasingly expensive health care services to an aging population, and the financial pressure that these challenges place on the BC government’s fiscal situation going forward.
Some discussion also centred on the BC housing market and concerns over affordability for BC citizens. While there was general consensus that a housing bubble does not exist in BC (as it did in the US a few years ago), members noted that housing costs take up a considerable proportion of residents’ incomes relative to other provinces. Also, some participants pointed out that BC’s high cost of living (mainly due to housing) is acting as a deterrent to workers from other jurisdictions relocating to BC. Some members commented that there is no evidence behind recent media reports of foreign homebuyers driving up housing prices in the Lower Mainland.
Participants generally agreed that the removal of HST will likely have a negative effect on BC’s tax competitiveness relative to other jurisdictions. Council members encouraged the BC government to maintain the attractive business investment climate of the province after the upcoming return to PST. Some members noted that returning to PST has created some uncertainty in the BC economy, particularly in the housing sector, as some housing activity may be delayed until the HST is removed from sales of new homes.
British Columbia Economic Forecast Council:
Summary of BC real GDP Forecasts, annual per cent change
| | | | | | | | | | Average | |
Participant | | Organization | | 2011 | | 2012 | | 2013 | | 2014-2016 | |
Doug Porter | | Bank of Montreal(1) | | 2.4 | | 2.3 | | 2.7 | | 2.6 | |
Ken Peacock | | BC Business Council(1) | | 2.0 | | 2.0 | | 2.6 | | 2.5 | |
Cameron Muir | | BC Real Estate Association(1) | | 2.1 | | 2.3 | | 2.5 | | 2.5 | |
Warren Lovely | | CIBC | | 2.4 | | 2.2 | | 2.4 | | 2.7 | |
Helmut Pastrick | | Central 1 Credit Union(1) | | 2.1 | | 2.5 | | 2.8 | | 3.4 | |
Marie-Christine Bernard | | Conference Board(1) | | 2.6 | | 2.2 | | 3.1 | | 2.6 | |
Arlene Kish | | IHS Global Insight(1) | | 2.4 | | 2.0 | | 2.4 | | 2.6 | |
Carl Sonnen | | Informetrica (1) | | 2.0 | | 2.3 | | 2.7 | | 2.8 | |
Carlos Leitao | | Laurentian Bank Securities (1) | | 2.2 | | 1.9 | | 2.0 | | 2.5 | |
Craig Wright | | RBC(1) | | 2.1 | | 2.3 | | 2.5 | | 2.9 | |
Warren Jestin | | Scotiabank(1) | | 2.3 | | 2.0 | | 2.8 | | 2.8 | |
Ernie Stokes | | Stokes Economic Consulting | | 2.0 | | 2.1 | | 2.3 | | 2.9 | |
Derek Burleton | | TD(1) | | 1.9 | | 1.7 | | 2.0 | | 2.2 | |
David Baxter | | Urban Futures Institute | | 2.5 | | 3.1 | | 2.6 | | 2.6 | |
Average | | | | 2.2 | | 2.2 | | 2.5 | | 2.7 | |
Standard Deviation | | | | 0.2 | | 0.3 | | 0.3 | | 0.3 | |
(1) Updated subsequent to the November 18, 2011 meeting.
Budget and Fiscal Plan – 2012/13 to 2014/15
98
British Columbia Economic Review and Outlook
Canadian Outlook
The Council estimates, on average, that the Canadian economy grew by 2.3 per cent in 2011, and forecasts Canadian growth to be 2.1 per cent in 2012, 2.5 per cent in 2013 and 2.5 per cent during the 2014 to 2016 period.
Members pointed out that Canada is well positioned to withstand the continued weakness expected in the US and global economies. As only a small proportion of Canadian goods and services are exported to Europe, a possible slowdown in European demand will not be felt as severely in Canada as in other nations. Council members also noted that expected fiscal tightening by the Canadian federal government in the near future will likely place downward pressure on national economic growth and on growth in all provinces.
International Outlook
The Council’s estimates for growth in US real GDP averaged 1.7 per cent for 2011, while its forecasts averaged 2.1 per cent for 2012, 2.5 per cent for 2013 and 3.0 per cent for the 2014 to 2016 period.
Several participants explained that recent data releases from the US point to some improvement in US economic activity, noting stable or improving trends in employment, housing and quarterly real GDP figures. Some Council members suggested that the US housing market, after hovering at very low levels for a number of years, has finally reached bottom and may begin to recover. However, members also noted that sluggish US economic activity is forecast for the next several years, as widespread deleveraging by individuals and businesses is expected to continue for some time before a stable recovery takes hold. Participants suggested that despite the recent good news on some US indicators, the housing and labour markets remain deeply troubled.
Further, Council members suggested that the ongoing political gridlock within the US federal government is a substantial risk to the US economic outlook, acting as a major impediment to policymakers’ attempts at dealing with the nation’s massive debt problems. Some participants noted that the US federal government will eventually be forced to raise taxes in order to reduce its enormous annual deficits.
The debt troubles of several European countries were identified by the Council as the largest and most immediate risk to the global economic outlook. Participants noted the massive accumulation of public debt — and the probable inability to repay that debt — in nations like Portugal, Italy, Spain and (especially) Greece. Members pointed out that financial troubles in Europe could last several years before they are resolved, and that further worsening of the European debt crisis could lead to another global credit crisis (similar to the crisis that froze the world’s credit markets in late 2008).
The Chinese economy was discussed as well, as several members suggested that the recent moderation from China’s rapid expansion in recent years is likely due to weakening demand from the US and Europe (the largest consumers of Chinese exports).
Canadian Dollar
Council members continued to produce divergent forecasts for the value of the Canadian dollar in 2012, with estimates ranging from 92.3 US cents to 103.6 US cents. For 2013, projections ranged from 96.2 US cents to 104.0 US cents, and from 93.0 US cents to 105.0 US cents over the 2014 to 2016 period.
Chart 3 — Economic Forecast Council Outlook for the Exchange Rate
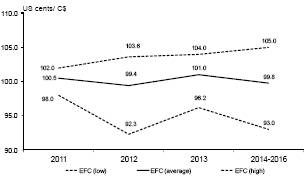
Budget and Fiscal Plan – 2012/13 to 2014/15
99
British Columbia Economic Review and Outlook
Forecast Survey — Participants’ Opinions
All figures are based | | 2011 | | 2012 | | 2013 | | 2014 to 2016 | |
on annual averages | | Range | | Average (1) | | Range | | Average (1) | | Range | | Average (1) | | Range | | Average (2) | |
British Columbia | | | | | | | | | | | | | | | | | |
| | | | | | | | | | | | | | | | | |
Real GDP (% change) | | 1.9 – 2.6 | | 2.2 (14) | (3) | 1.7 – 3.1 | | 2.2 (14) | | 2.0 – 3.1 | | 2.5 (14) | | 2.2 – 3.4 | | 2.7 (14) | |
Nominal GDP (% change) | | 4.0 – 6.3 | | 4.9 (13) | | 2.7 – 5.5 | | 4.1 (13) | | 3.3 – 5.5 | | 4.6 (13) | | 4.2 – 6.6 | | 4.9 (13) | |
GDP Deflator (% change) | | 1.8 – 3.4 | | 2.7 (13) | | 1.0 – 3.0 | | 2.0 (13) | | 0.9 – 2.7 | | 2.1 (13) | | 1.3 – 3.2 | | 2.1 (13) | |
Real business non-residential investment (% change) | | -4.5 – 17.6 | | 6.1 (9) | | 2.0 – 9.2 | | 5.8 (9) | | -2.5 – 10.0 | | 4.0 (9) | | 1.5 – 16.0 | | 5.4 (9) | |
Real business machinery and equipment investment (%change) | | 5.0 – 17.1 | | 9.3 (8) | | 4.0 – 12.3 | | 7.3 (8) | | -5.0 – 8.0 | | 3.6 (8) | | 0.2 – 10.0 | | 4.7 (8) | |
Personal Income (% change) | | 3.0 – 5.0 | | 3.7 (11) | | 2.5 – 5.5 | | 4.0 (11) | | 3.0 – 6.0 | | 4.5 (11) | | 3.7 – 6.5 | | 4.6 (11) | |
Net Migration (thousand persons) | | 25.0 – 52.0 | | 36.2 (12) | | 30.0 – 50.0 | | 39.6 (12) | | 32.3 – 50.2 | | 42.5 (12) | | 35.5 – 51.0 | | 44.0 (12) | |
Employment (% change) | | 0.7 – 0.8 | | 0.8 (14) | | 0.6 – 2.1 | | 1.3 (14) | | 1.0 – 2.4 | | 1.6 (14) | | 1.0 – 2.3 | | 1.6 (14) | |
Unemployment rate (%) | | 7.5 – 7.6 | | 7.5 (14) | | 6.6 – 7.8 | | 7.3 (14) | | 6.3– 7.7 | | 7.0 (14) | | 5.3 – 7.5 | | 6.4 (14) | |
Corporate pre-tax profits (% change) | | 8.0 – 15.0 | | 10.1 (9) | | 4.0 – 11.0 | | 7.1 (9) | | -0.5 – 11.5 | | 6.3 (9) | | 3.5 – 12.5 | | 6.8 (9) | |
Housing starts (thousand units) | | 25.5 – 27.6 | | 26.6 (14) | | 20.5 – 29.0 | | 25.9 (14) | | 22.5 – 31.9 | | 26.8 (14) | | 21.5 – 32.8 | | 28.0 (14) | |
Retail sales (% change) | | 1.4 – 5.5 | | 2.1 (14) | | 1.0 – 5.7 | | 3.4 (14) | | 2.9 – 5.0 | | 4.2 (14) | | 3.1 – 6.0 | | 4.3 (14) | |
Consumer price index (% chg) | | 2.1 – 2.6 | | 2.4 (14) | | 1.2 – 2.2 | | 1.7 (14) | | 1.4 – 2.1 | | 1.7 (14) | | 1.4 – 2.3 | | 2.0 (14) | |
| | | | | | | | | | | | | | | | | |
United States | | | | | | | | | | | | | | | | | |
| | | | | | | | | | | | | | | | | |
Real GDP (% change) | | 1.6 – 1.9 | | 1.7 (14) | | 1.8 – 2.7 | | 2.1 (14) | | 2.0 – 3.2 | | 2.5 (14) | | 2.3 – 3.8 | | 3.0 (14) | |
Intended Federal Funds rate (%) | | 0.10 – 0.25 | | 0.14 (13) | | 0.10 – 0.25 | | 0.15 (13) | | 0.10 – 1.00 | | 0.42 (13) | | 1.25 – 4.00 | | 2.41 (13) | |
Housing starts (million units) | | 0.58 – 0.61 | | 0.60 (13) | | 0.63 – 0.76 | | 0.68 (13) | | 0.69 – 1.00 | | 0.82 (13) | | 0.75 – 1.57 | | 1.12 (13) | |
| | | | | | | | | | | | | | | | | |
Canada | | | | | | | | | | | | | | | | | |
| | | | | | | | | | | | | | | | | |
Real GDP (% change) | | 2.2 – 2.7 | | 2.3 (14) | | 1.7 –2.5 | | 2.1 (14) | | 1.9 – 2.9 | | 2.5 (14) | | 2.1 – 3.2 | | 2.5 (14) | |
Bank of Canada overnight target rate (%) | | 0.90 – 1.00 | | 0.99 (14) | | 0.80 – 1.13 | | 1.00 (14) | | 1.00 – 2.50 | | 1.69 (14) | | 1.50 – 4.00 | | 3.10 (14) | |
Exchange rate (US cents/C$) | | 98.0 – 102.0 | | 100.5 (14) | | 92.3 – 103.6 | | 99.4 (14) | | 96.2 – 104.0 | | 101.0 (14) | | 93.0 – 105.0 | | 99.8 (14) | |
Housing starts (million units) | | 0.18 – 0.20 | | 0.19 (14) | | 0.18 – 0.20 | | 0.19 (14) | | 0.17 – 0.20 | | 0.19 (14) | | 0.17 – 0.22 | | 0.19 (14) | |
Consumer price index (% chg) | | 2.7 – 3.0 | | 2.9 (14) | | 1.5 – 2.4 | | 1.9 (14) | | 1.7 – 2.2 | | 2.0 (14) | | 1.8 – 2.2 | | 2.0 (14) | |
(1) Based on responses from participants providing forecasts.
(2) Participants provided an average forecast for 2014 to 2016.
(3) Number of respondents shown in parenthesis.
Budget and Fiscal Plan – 2012/13 to 2014/15
100
British Columbia Economic Review and Outlook
Balance Sheet Recessions
Economic activity in the US and across the world has been very weak since the onset of the global downturn in late 2008. Not only was the decline itself unusually steep but the subsequent recovery in the US and other nations has been sluggish and inconsistent. Despite the injection of billions of dollars in government stimulus, the US economy (which led the world into recession) has shown only modest signs of recovery following the crash that occurred in late 2008 and early 2009, interspersed with numerous setbacks.
The US economy is currently recovering from a “Balance Sheet Recession”, which is different in many ways from a typical recession. Balance sheet recessions involve the collapse of a large asset bubble followed by a long recovery period of slow economic activity and high unemployment. This topic box will highlight the differences between typical recessions and balance sheet recessions, pointing to the current economic situation in the US and to other historical examples.
Typical recessions
Typical recessions since World War II are inventory-based, meaning that they are caused by businesses building up their inventories in order to meet expected consumer demand that does not materialize. Generally, when sales of goods in an economy increase, businesses ramp up their goods production and build up inventories simultaneously, with this accumulation adding value to the economy and boosting a country’s GDP. However, when sales of goods decline (for reasons such as weakening consumer confidence or higher interest rates), the opposite effect occurs. Inventories grow as consumers slow their purchasing, signalling businesses to reduce their production. This slows down a country’s economy, as an excess supply of goods now exists that is not being purchased by consumers. Such an inventory imbalance is usually temporary, as inventories are eventually drawn down to a point where excess demand exists, and businesses then increase their production in order to meet this demand—
Chart 1 — “V” shaped recovery from typical recession
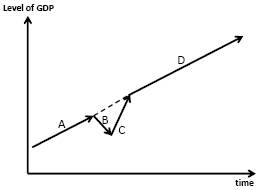
A. pre-recession
B. downturn (recession)
C. recovery (bounce back)
D. post-recovery
adding value to the economy and boosting GDP.
This type of recovery from a slowdown is often called a “V-shaped recovery” (see Chart 1), as the economy both contracts and then expands relatively quickly. Recovery from typical post-World War II recessions lasts from about six months to two years. Examples of typical inventory-led recessions in recent US history are included in the following table:
Table 1: Typical inventory-led recessions in the US
| | | | Peak | | GDP Decline | |
Date | | Length | | Unemployment | | Peak to Trough | |
1973 | | 16 months | | 8.6 | % | 3.2 | % |
1981 | | 16 months | | 10.8 | % | 2.6 | % |
1990 | | 8 months | | 6.8 | % | 1.4 | % |
Sources: US National Bureau of Economic Research, US Bureau of Labor Statistics
Characteristics of balance sheet recessions
Balance sheet recessions occur much less frequently and are different in many ways from typical post-World War II inventory-led recessions. Balance sheet recessions are associated with the collapse of a large asset bubble, which is preceded by a massive accumulation of private sector debt that worked to fuel the bubble. After the bubble bursts, a long period of slow, stagnant
Budget and Fiscal Plan – 2012/13 to 2014/15
101
British Columbia Economic Review and Outlook
economic activity occurs, lasting about ten years by many estimates. Some examples of major asset collapses leading to balance sheet recessions include: the US Great Depression (caused by the 1929 stock market crash); the Japanese lost decade (caused by a real estate price crash in Japan in the early 1990s); the Swedish real estate crisis (also caused by a collapse in Swedish housing prices in the early 1990s); and the recent US recession (caused by the US housing crash in 2008).
When a debt-financed bubble bursts, asset prices collapse while large debts remain. This leaves many households and businesses owing more money to creditors than the now heavily-reduced value of their assets. In order to regain their financial health, households and businesses are forced to repair their balance sheets by increasing their savings or paying down debt.
Due to falling confidence and eroding wealth, consumers significantly reduce their spending, applying most additional funds to debt repayment or savings rather than new purchases. Chart 2 shows that the savings rate of US consumers (the percentage of disposable income not used for consumption) more than doubled during the recent recession and has remained relatively high during the slow recovery period. Further, businesses have difficulty raising capital (to pay workers or invest in new equipment) as banks and financial institutions tighten lending in order to protect their own balance sheets. With slowing revenues from consumers and difficulty obtaining credit from banks, businesses cut their expenditures by reducing staff and halting investment. Growing unemployment means many households have trouble making interest payments on debts, causing defaults on loans and further damage to the balance sheets of banks that previously lent them money. All of these events result in slowing economic activity and high unemployment for several years after an asset bubble bursts.
Historically, balance sheet recessions bring large declines in economic output, employment and asset values (usually real estate prices). Following a crash, a country’s unemployment rate typically grows by about five percentage points and median home prices remain about 15 per cent lower ten years after a crash than prior to the crash.
Chart 2 — US savings rate rises as consumers rein in spending
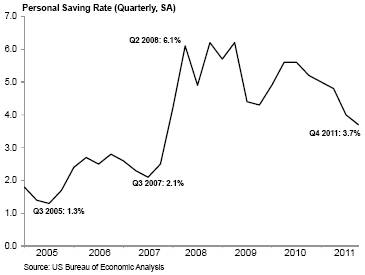
Effect of policy responses
When faced with a slowing economy, governments often attempt to stimulate economic activity and reduce unemployment. This intervention can take the form of lower interest rates to induce borrowing, tax rebates given to individuals in an effort to boost consumption, as well as government purchases of troubled assets from banks to help them repair their balance sheets and increase lending. Note that holding interest rates very low for an extended period can induce borrowers to take on debts that may become unmanageable in future years when interest rates eventually rise.
In a typical inventory-led recession, where individuals and businesses are not burdened with crashing asset values and massive debt loads, such measures are generally effective at stimulating consumer demand. For example, in an effort to boost borrowing and lending in the wake of the early 1990s inventory-led recession, the US Federal Reserve lowered its key interest rate from 8.25 per cent in January 1990 to 3.0 per cent by September 1992. The lower cost of borrowing prompted many consumers to borrow money
Budget and Fiscal Plan – 2012/13 to 2014/15
102
British Columbia Economic Review and Outlook
in large amounts, stimulating consumption following the downturn and thus improving economic activity.
However, in the aftermath of a balance sheet recession, consumers and businesses are not interested in borrowing more money even at very low interest rates. Most additional funds received are applied to pay down debts, rather than spending, investing or hiring. Nor are banks interested in lending to borrowers with troubled balance sheets, especially when banks themselves have significant balance sheet problems. The reluctance of consumers to spend, businesses to hire or invest and banks to lend makes governments’ efforts to stimulate demand unsuccessful at quickly reviving robust economic activity.
In the recent US balance sheet recession, the US government injected billions in stimulus to purchase troubled assets from banks and bail out businesses on the verge of bankruptcy. The US Federal Reserve has kept its key interest rate close to zero since December 2008 and embarked on two rounds of quantitative easing in order to push more liquidity into the US economy. In recent weeks, the Federal Reserve announced that it will keep its key interest rate close to zero until late 2014—meaning that rates will be held at this level for an unprecedented six full years (see Chart 3). However, American banks continue to hoard cash rather than lend, 22 per cent of all US mortgages are underwater (where the value of the home is lower than the amount owed on the mortgage) and the national unemployment rate remains above eight per cent. US real GDP growth also continues to muddle along, with slow and inconsistent quarterly growth occurring in the years since the 2008 crash.
During Japan’s slow recovery from its early 1990s balance sheet recession, the Japanese government lowered its key interest rate steadily from 1991 to 1995. The rate was set at 6.0 per cent in mid-1991 but gradually dropped to 0.5 per cent by late 1995. Further, between 1992 and 1999, the government unveiled nine different stimulus packages, each worth about 2.8 per cent of Japan’s annual nominal GDP. Despite rock bottom interest rates and billions in stimulus spending through the 1990s, the Japanese economy averaged only about 1.0 per cent compound annual real GDP growth from 1992 to 2000.
Chart 3 — US to hold interest rate near zero until 2014
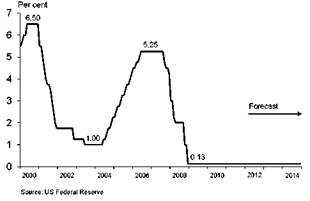
While this does not mean that the US economy will face similarly slow growth going forward, Japan’s experience is an example of how extensive policy measures aimed at stimulating economic activity do not necessarily achieve their intended results when faced with the slow recovery that follows a balance sheet recession.
Public debt
A government’s efforts to stimulate economic activity in the face of a balance sheet recession often result in substantial increases in public debt. The massive amount of spending required to inject liquidity into the economy and bail out troubled banks and businesses often forces a government to borrow heavily in order to finance its policies. This accumulation of public debt, combined with rapidly eroding revenues from a troubled economy, often push a government into several years of hefty fiscal deficits.
Several troubled European countries are currently experiencing a very serious debt crisis, as governments in these nations are having difficulty making interest payments on very large amounts of public debt. As the
Budget and Fiscal Plan – 2012/13 to 2014/15
103
British Columbia Economic Review and Outlook
effects of the 2008 US housing market crash caused widespread losses to the global financial system, several European nations (that were already carrying enormous debt loads prior to the global downturn) have been forced to deal with large declines in government revenues, rising unemployment and increases in spending to bail out troubled financial institutions. Greece, Ireland and Portugal have sought financial aid from other nations in order to avoid defaulting on their debts, while bond yields in Italy and Spain are approaching dangerously high levels.
Long recovery period
The long recovery from a balance sheet recession is much different from the recovery that follows an inventory-led recession. Conceptually, this recovery resembles a “U” (rather than a “V”— see Chart 1 for “V”-shape and Charts 4 and 5 for “U”-shape), as there is a steep decline followed by about a decade of slow activity, then a return to growth. Several examples of these lengthy recoveries have occurred in the twentieth century, including the US Great Depression (1929 — 9 years), the Japanese lost decade (1992 — 11 years), Finland (1991 — 9 years), Sweden (1991 — 10 years) and the recent US recession (2008 — ongoing).
Chart 4 — Growth usually returns after long recovery
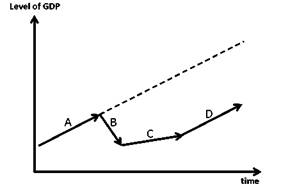
A. pre-recession
B. downturn (recession)
C. long recovery period, sluggish growth
D. post-recovery
Effect on output after the recovery
Potential output is a measure of how much an economy can produce when its resources are employed at normal levels, without accelerating inflation, nor any boom or bust cycles. In the past few years, several economists have examined how a balance sheet recession affects a country’s potential output, with a general consensus emerging that these recessions lead to a permanent reduction in a country’s level of potential output following the recovery period. There are various reasons for this reduction, including a mismatch between the skills supplied by the labour force and the skills demanded by employers if the structure of an economy changes after a crash and the labour force is slow to adapt. The number of jobs can also decline if the recession depresses levels of immigration or if unemployed labourers become discouraged and stop searching for work. In addition, the amount of productive equipment in an economy (used to make high value goods) may decrease due to more businesses going bankrupt or to declining business investment caused by heightened uncertainty over the state of the economy, slower demand from consumers or difficulty obtaining bank financing.
Chart 5 — Economy grows at slower rate after recovery, in some cases
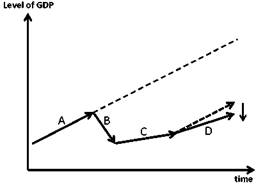
A. pre-recession
B. downturn (recession)
C. long recovery period, sluggish growth
D. post-recovery
Budget and Fiscal Plan – 2012/13 to 2014/15
104
British Columbia Economic Review and Outlook
Following the long recovery period that occurs after a balance sheet recession, a country’s level of potential output remains at a lower level, but the pace at which potential output grows generally returns to its pre-crisis rate. In most cases, the pre-crash potential growth rate is restored following the recovery period (e.g. after the Swedish recession of the 1990s — see Chart 4). However, in some cases, the pre-crash rate of potential output growth is not restored and remains at a permanently lower rate (e.g. following the Japanese recession in the 1990s — see Chart 5).
In the few years immediately prior to the bursting of an asset bubble, in which very strong growth is fuelled by a massive accumulation of debt, an economy is generally expanding at a rate well above its potential. This occurred during the recent US economic boom in the early to mid 2000s, where strong growth was fuelled by excessive and reckless leveraging related to the housing market. Some academics believe that the recent balance sheet recession in the US will result in permanently lower potential output growth following the recovery period (similar to the scenario in Chart 5). Bank of Canada governor Mark Carney recently made reference to this scenario, suggesting that the US economy may never fully recover from its current weakness.
Effect on BC
The current sluggish US recovery carries significant downside risks for BC. A long period of slow growth means continued weak demand from US consumers and businesses for BC exports, placing downward pressure on BC’s real GDP growth. If a Japanese-type scenario occurs in the US following the long recovery (where the pace of economic growth is slower than before the recession), BC’s exporters may be faced with permanently slower US demand going forward.
Compared to other provinces, however, BC is well-positioned to weather the negative effects of a sluggish US recovery. Although the US is still BC’s largest trading partner, BC is far less dependent on the US as a destination for its exports than other Canadian jurisdictions. In 2010, the US was the destination for about 46 per cent of BC’s total goods exports, compared to 87 per cent of Alberta’s exports and 79 per cent for Ontario’s. BC’s export partners have become more diversified in recent years, with a growing share of BC’s goods exports now destined for emerging Asian economies like China and South Korea.
Also helping the province to weather a potential global economic storm is BC’s competitiveness relative to other jurisdictions around the world. This includes advantages such as low rates of taxation, numerous deregulatory initiatives and a highly skilled workforce.
References:
Abiad, A. et al (2009). “What’s the Damage? Medium-term Output Dynamics after Banking Crises”. IMF Working Paper, 09/245.
Ergungor, O. (2007). “On the Resolution of Financial Crises: The Swedish Experience. Federal Reserve Bank of Cleveland Discussion Papers, 21.
Koo, R. (2011). “The World in Balance Sheet Recession”. Real-world Economics Review. 58, 19-37.
Lemoine, M. and Pavot, J. (2009). “Impact of the Financial Crisis on Long-term Growth” Banque de France Current Issues, 2.
Reinhart, C. and Rogoff, K. (2009). This Time is Different: Eight Centuries of Financial Folly. Princeton.
Reinhart, C. and Rogoff, K. (2010). “Growth in a Time of Debt”. American Economic Review. 100, 573-578.
Reinhart, C. and Rogoff, K. (2011). “From Financial Crash to Debt Crisis”. American Economic Review. 101, 1676-1706.
“US Economy May never Fully Recover: Carney” Globe and Mail (January 22, 2012).
Budget and Fiscal Plan – 2012/13 to 2014/15
105
Part 4: 2011/12 REVISED FINANCIAL FORECAST
(THIRD QUARTERLY REPORT)
2011/12 Fiscal Year in Review
Prior to expensing the liability for repayment of the HST transition funding, the deficit for 2011/12 is projected at $898 million, which is a $27 million improvement over budget. Including the HST transition funding liability increases the deficit to $2.5 billion.
Table 4.1 Budget 2011 and Quarterly Report Forecasts
| | | | First | | Second | | Third | |
| | Budget | | Quarterly | | Quarterly | | Quarterly | |
($ millions) | | 2011 | | Report | | Report | | Report | |
Revenue | | 41,337 | | 41,173 | | 40,870 | | 40,971 | |
Expense | | (41,912 | ) | (42,002 | ) | (42,012 | ) | (41,819 | ) |
| | (575 | ) | (829 | ) | (1,142 | ) | (848 | ) |
Liability for repayment of HST transition funding | | — | | (1,599 | ) | (1,599 | ) | (1,599 | ) |
Deficit before forecast allowance | | (575 | ) | (2,428 | ) | (2,741 | ) | (2,447 | ) |
Forecast allowance | | (350 | ) | (350 | ) | (350 | ) | (50 | ) |
Deficit | | (925 | ) | (2,778 | ) | (3,091 | ) | (2,497 | ) |
Capital spending: | | | | | | | | | |
Taxpayer-supported capital spending | | 4,105 | | 4,331 | | 4,161 | | 3,997 | |
Self-supported capital spending | | 3,243 | | 3,348 | | 3,229 | | 3,144 | |
| | 7,348 | | 7,679 | | 7,390 | | 7,141 | |
Provincial Debt: | | | | | | | | | |
Taxpayer-supported debt | | 36,816 | | 36,872 | | 36,521 | | 34,786 | |
Self-supported debt | | 16,271 | | 16,265 | | 16,241 | | 16,149 | |
Total debt (including forecast allowance) | | 53,437 | | 53,487 | | 53,112 | | 50,985 | |
Taxpayer-supported debt-to-GDP ratio | | 17.5 | % | 17.5 | % | 17.2 | % | 16.4 | % |
| | | | | | | | | |
| | 2011 | |
Economic Forecast: | | | | | | | | | |
Real GDP growth | | 2.0 | % | 2.0 | % | 2.0 | % | 2.0 | % |
Nominal GDP growth | | 4.1 | % | 4.2 | % | 4.2 | % | 4.3 | % |
The forecast reflects $366 million in lower revenue, mainly due to the effects of lower commodity prices on natural resource revenues, the delay in the completion of the sale of the Little Mountain property, and reduced earnings from commercial Crown corporations, partially offset by higher revenue from property transfer tax receipts and federal government contributions.
Chart 4.1 Progress of 2011/12 financial forecast

Budget and Fiscal Plan – 2012/13 to 2014/15
2011/12 Revised Financial Forecast (Third Quarterly Report)
The reduction in revenue is partially offset by a $93 million reduction in projected operating expense for the year. In addition, the forecast allowance has been reduced by $300 million to reflect the reduction in risks to the 2011/12 forecast for the remainder of the fiscal year.
Further details on the changes from Budget 2011 are provided in Table 4.2.
Changes since the second Quarterly Report
The 2011/12 forecast has improved by $594 million from the second Quarterly Report. In addition to the $300 million forecast allowance reduction, the improvement reflects higher revenues and lower expenses as follows:
Revenue in 2011/12 is projected to be $101 million higher than the forecast in the second Quarterly Report, due primarily to:
· lower claims costs for the Insurance Corporation of BC; and
· higher property transfer, fuel and carbon tax receipts;
partially offset by:
· a reduction in income tax revenues mainly due to lower personal income growth and lower 2010 corporate income tax assessments;
· lower HST receipts based on more recent information received from the federal government relating to 2010; and
· lower natural gas and stumpage receipts.
Expense is forecast to be $193 million lower than the forecast in the second Quarterly Report, including:
· cost savings from Ministry of Health mainly due to efficiency measures being implemented by the health authorities;
· lower interest costs due to lower debt levels; and
· reduced SUCH sector spending due to operating and administrative cost savings.
More details on the changes from the second Quarterly Report can be found in Table 4.2.
Budget and Fiscal Plan – 2012/13 to 2014/15
108
2011/12 Revised Financial Forecast (Third Quarterly Report)
Table 4.2 2011/12 Forecast Update
| | Q1 | | Q2 | | Q3 | | Total | |
($ millions) | | Update | | Update | | Update | | Changes | |
2011/12 deficit — Budget 2011 Fiscal Plan (May 3, 2011) | | (925 | ) | | | | | (925 | ) |
2011/12 deficit — first Quarterly Report (September 8, 2011) | | | | (2,778 | ) | | | | |
2011/12 deficit — second Quarterly Report (November 28, 2011) | | | | | | (3,091 | ) | | |
Revenue changes: | | | | | | | | | |
Personal income tax — mainly improved 2010 results | | 32 | | 23 | | (36 | ) | 19 | |
Corporate income tax — reflects higher prior-year taxes, changes in federal government instalments and weaker 2010 results | | 215 | | (111 | ) | (51 | ) | 53 | |
Harmonized sales tax and other sales taxes — improved 2010 and year-to-date results | | 56 | | 10 | | (50 | ) | 16 | |
Property transfer tax — higher year-to-date results | | 50 | | 50 | | 25 | | 125 | |
Fuel and carbon taxes — weaker year-to-date results | | 20 | | (45 | ) | 10 | | (15 | ) |
Other tax sources | | (7 | ) | (1 | ) | 1 | | (7 | ) |
Natural gas royalties — mainly reduced price outlook and lower volumes | | (34 | ) | (32 | ) | (14 | ) | (80 | ) |
Coal, metals and minerals — mainly higher mining costs, partially offset by coal price increases | | (85 | ) | 31 | | (1 | ) | (55 | ) |
Forests — mainly lower stumpage rates and border tax collections, partially offset by improved harvest volumes | | (32 | ) | (18 | ) | (19 | ) | (69 | ) |
Columbia River Treaty electricity sales — mainly lower electricity prices | | (20 | ) | (10 | ) | — | | (30 | ) |
Other natural resources | | 2 | | (17 | ) | 20 | | 5 | |
Fees and licenses | | 55 | | (69 | ) | 21 | | 7 | |
Investment earnings — mainly the effects of weaker equity and financial markets | | (22 | ) | (41 | ) | 3 | | (60 | ) |
Miscellaneous revenue — delay in the completion date of the sale of Little Mountain property, partially offset by improved vote recoveries and SUCH sector revenue | | (198 | ) | 8 | | 58 | | (132 | ) |
Health and social transfers — mainly lower population share | | (21 | ) | (6 | ) | 2 | | (25 | ) |
Other federal government transfers | | 46 | | 71 | | (7 | ) | 110 | |
Commercial Crown agencies operating results: | | | | | | | | | |
Liquor Distribution Branch — mainly reduced sales and consumer shift to purchasing products with lower margins | | (26 | ) | — | | — | | (26 | ) |
BC Lotteries — mainly reduced revenue from casino operations | | (33 | ) | 5 | | — | | (28 | ) |
ICBC — mainly higher bodily injury and accident benefit claims (partially reversed in the third quarter), and lower investment income | | (141 | ) | (149 | ) | 140 | | — (150 | ) |
Other commercial Crown agencies changes | | (21 | ) | (2 | ) | (1 | ) | (24 | ) |
Revenue changes before HST transition repayment | | (164 | ) | (303 | ) | 101 | | (366 | ) |
Liabilty for 2011 HST transition funding repayment — report as an expense | | (580 | ) | 580 | | — | | — | |
Total revenue changes | | (744 | ) | 277 | | 101 | | (366 | ) |
Less : expense increases (decreases): | | | | | | | | | |
Consolidated Revenue Fund changes: | | | | | | | | | |
Emergency program flood-related costs | | 17 | | 30 | | 14 | | 61 | |
Ministry of Health savings mainly due to cost efficiencies in health authorities | | — | | — | | (111 | ) | (111 | ) |
Management of public debt (net) — mainly lower debt balances | | (19 | ) | (34 | ) | (31 | ) | (84 | ) |
Prior year over accruals | | — | | — | | (24 | ) | (24 | ) |
Increase (decrease) in spending funded by third party recoveries | | 70 | | (25 | ) | 43 | | 88 | |
(Increase) decrease in operating transfers to service delivery agencies | | (167 | ) | 45 | | (13 | ) | (135 | ) |
Changes in spending profile of service delivery agencies: | | | | | | | | | |
School districts — higher operating and amortization costs | | 13 | | — | | 6 | | 19 | |
Universities — changes in spending related to federal research grants offset by lower operating costs | | 48 | | 13 | | (32 | ) | 29 | |
Colleges — spending related to higher student enrolment | | 21 | | 4 | | 9 | | 34 | |
Health authorities and hospital societies — higher demand for healthcare services | | 138 | | 7 | | (42 | ) | 103 | |
Other service delivery agencies | | (31 | ) | (30 | ) | (12 | ) | (73 | ) |
Expense increases (decreases) before HST transition repayment | | 90 | | 10 | | (193 | ) | (93 | ) |
Liability for reimbursement of HST transition funding, including the 2011 amount previously recorded as a reduction in revenue | | 1,019 | | 580 | | — | | 1,599 | |
Total expense increases (decreases) | | 1,109 | | 590 | | (193 | ) | 1,506 | |
Reduction in forecast allowance | | — | | — | | 300 | | 300 | |
Total changes | | (1,853 | ) | (313 | ) | 594 | | (1,572 | ) |
2011/12 deficit — first Quarterly Report | | (2,778 | ) | | | | | | |
2011/12 deficit — second Quarterly Report | | | | (3,091 | ) | | | | |
2011/12 deficit — third Quarterly Report | | | | | | (2,497 | ) | (2,497 | ) |
Budget and Fiscal Plan – 2012/13 to 2014/15
109
2011/12 Revised Financial Forecast (Third Quarterly Report)
Contingencies
Spending commitments and pressures totalling $324 million have been notionally allocated to the Contingencies vote, as shown in Table 4.3.
The remaining $279 million has been reserved for other spending pressures which ministries and agencies are working to manage from within existing budgets, with additional funding provided from the Contingencies vote as necessary; as well as unforeseen costs arising from litigation, potential changes in accounting treatment, natural disasters and other contingent items.
Table 4.3 2011/12 Notional Allocations to Contingencies
| | ($ millions) | |
Elections BC — 2011 Initiative Vote | | 12 | |
2010 Sports and Arts Legacy | | 20 | |
Climate Action and Clean Energy initiatives | | 40 | |
Additional courtroom staffing and major trial costs | | 15 | |
Community Recreation Program Infrastructure | | 30 | |
Re-profiling grants to local governments and agencies | | 60 | |
Community gaming grants | | 15 | |
RCMP cost increases and dedicated “Guns and Gangs” additional officers | | 25 | |
Crime Victim Assistance Program liability increases | | 10 | |
Supports for income assistance and Community Living BC | | 70 | |
Teachers Pension Plan Liabilitiy | | 27 | |
Subtotal notional allocations | | 324 | |
Reserved for unforeseen pressures | | 279 | |
Total contingencies | | 603 | |
Health Funding Report
As required under Part 14 of the Consumption Tax Rebate and Transition Act the following table shows the health funding report for 2011/12. The health funding plan provides details related to the 2012/13 to 2014/15 forecast period and is discussed in Part 1: Three Year Fiscal Plan.
Government spending on health services by function in 2010/11(see Table 4.10) exceeded revenues from the harmonized sales tax, Medical Services Plan premiums, tobacco tax, Health Special Account, Canada Health Transfer and Wait Times Reduction Transfer by $5.7 billion and is projected to exceed these revenues in 2011/12 by $4.9 billion.
Table 4.4 Health Funding Report
| | Public | | Updated | |
| | Accounts | | Forecast | |
($ millions) | | 2010/11 | | 2011/12 | |
Harmonized sales tax | | 4,176 | | 5,811 | |
Medical Services Plan premiums | | 1,787 | | 1,915 | |
Tobacco tax | | 734 | | 652 | |
Health Special Account | | 147 | | 147 | |
Canada Health Transfer | | 3,607 | | 3,807 | |
Wait Times Reduction Transfer | | 33 | | 33 | |
Total revenue from above sources | | 10,484 | | 12,365 | |
Total government spending on health | | 16,150 | | 17,266 | |
Health spending in excess of revenue | | 5,666 | | 4,901 | |
Budget and Fiscal Plan – 2012/13 to 2014/15
110
2011/12 Revised Financial Forecast (Third Quarterly Report)
Capital spending
Total capital spending is forecast to be $7.1 billion in 2011/12, $249 million lower than the projection in the second Quarterly Report (see Table 4.5).
The change in taxpayer-supported capital spending is mainly due to project scheduling changes, partially offset by higher than expected spending by post-secondary institutions from their own sources of funds.
The reduction in projected commercial Crown corporation capital expenditures mainly reflects a shift in timing for spending on the Port Mann Bridge.
Table 4.5 2011/12 Capital Spending Update
| | Q1 | | Q2 | | Q3 | | Total | |
($ millions) | | Update | | Update | | Update | | Changes | |
2011/12 capital spending — Budget 2011 Fiscal Plan (May 3, 2011) | | 7,348 | | | | | | 7,348 | |
2011/12 capital spending — first Quarterly Report (September 8, 2011) | | | | 7,679 | | | | | |
2011/12 capital spending — second Quarterly Report (November 28, 2011) | | | | | | 7,390 | | | |
| | | | | | | | | |
Taxpayer-supported changes: | | | | | | | | | |
School districts — change in timing of spending | | 48 | | 2 | | (40 | ) | 10 | |
Post-secondary institutions — mainly changes in spending on self-funded projects | | 107 | | 7 | | 66 | | 180 | |
Health — mainly due to changes in timing of capital spending | | 98 | | (71 | ) | (45 | ) | (18 | ) |
BCTFA — change in timing of spending | | 61 | | — | | (89 | ) | (28 | ) |
BC Transit — as a result of timing changes to reflect local affordability constraints | | (67 | ) | (29 | ) | (16 | ) | (112 | ) |
BC Place — adjusted project schedules for redevelopment and maintenance | | 100 | | — | | 2 | | 102 | |
Government ministries — mainly rescheduling of the Sierra-Yoyo-Desan road upgrade | | — | | (64 | ) | — | | (64 | ) |
Other changes | | (3 | ) | (15 | ) | (42 | ) | (60 | ) |
Capital contingencies — reflects allocation to BC Place redevelopment for carry-over of underspending from 2010/11 and others | | (118 | ) | — | | — | | (118 | ) |
Total taxpayer-supported | | 226 | | (170 | ) | (164 | ) | (108 | ) |
| | | | | | | | | |
Self-supported changes: | | | | | | | | | |
BC Hydro — reflects capital project re-prioritization | | (18 | ) | (95 | ) | — | | (113 | ) |
Transportation Investment Corporation — Port Mann Bridge/Highway 1 | | 119 | | (21 | ) | (73 | ) | 25 | |
Other | | 4 | | (3 | ) | (12 | ) | (11 | ) |
Total self-supported | | 105 | | (119 | ) | (85 | ) | (99 | ) |
Total changes | | 331 | | (289 | ) | (249 | ) | (207 | ) |
2011/12 capital spending — first Quarterly Report | | 7,679 | | | | | | | |
2011/12 capital spending — second Quarterly Report | | | | 7,390 | | | | | |
2011/12 capital spending — third Quarterly Report | | | | | | 7,141 | | 7,141 | |
Budget and Fiscal Plan – 2012/13 to 2014/15
111
2011/12 Revised Financial Forecast (Third Quarterly Report)
Provincial debt
Total provincial debt is projected to be $2.1 billion lower at March 31, 2012 compared to the projections in the second Quarterly Report, reflecting reductions in the projected taxpayer-supported debt, self-supported debt and the forecast allowance (see Table 4.6).
The reduction in taxpayer-supported debt is mainly due to a change in the repayment schedule of the HST transition funding to the federal government, improved working capital requirements and changes in timing of funding grants to service delivery agencies for capital spending.
The decline in self-supported debt primarily reflects reduced capital cash flow requirements for BC Hydro and changes in timing of capital asset investments and accounting policy differences for the Transportation Investment Corporation.
As a result of the forecasted lower provincial debt, the key taxpayer-supported debt-to-GDP ratio is projected to be 16.4 per cent by the end of 2011/12, an improvement of 0.8 percentage points from the second Quarterly Report.
Table 4.6 2011/12 Provincial Debt Update
| | Q1 | | Q2 | | Q3 | | Total | |
($ millions) | | Update | | Update | | Update | | Changes | |
2011/12 provincial debt — Budget 2011 Fiscal Plan (May 3, 2011) | | 53,437 | | | | | | 53,437 | |
2011/12 provincial debt — first Quarterly Report (September 8, 2011) | | | | 53,487 | | | | | |
2011/12 provincial debt — second Quarterly Report (November 28, 2011) | | | | | | 53,112 | | | |
Taxpayer-supported changes: | | | | | | | | | |
2010/11 changes: | | | | | | | | | |
— Improved government operating deficit | | (806 | ) | — | | — | | (806 | ) |
— Reduced borrowing requirements for capital spending | | (510 | ) | — | | — | | (510 | ) |
— Changes in working capital and others | | (217 | ) | — | | — | | (217 | ) |
Impact of lower debt balance at March 31, 2011 | | (1,533 | ) | — | | — | | (1,533 | ) |
2011/12 forecast updates: | | | | | | | | | |
— Repayment of HST transition funding | | 1,599 | | — | | (1,279 | ) | 320 | |
— CRF working capital requirements mainly cash revenue and higher accounts payable | | — | | (160 | ) | (210 | ) | (370 | ) |
— Education facilities | | 66 | | 4 | | (18 | ) | 52 | |
— Health facilities | | 3 | | (107 | ) | 10 | | (94 | ) |
— Transportation infrastructure | | 9 | | (18 | ) | (114 | ) | (123 | ) |
— Other changes | | (88 | ) | (70 | ) | (124 | ) | (282 | ) |
Total taxpayer-supported | | 56 | | (351 | ) | (1,735 | ) | (2,030 | ) |
Self-supported changes: | | | | | | | | | |
— BC Hydro | | (23 | ) | 6 | | (54 | ) | (71 | ) |
— Transportation Investment Corporation | | 10 | | (25 | ) | (38 | ) | (53 | ) |
— Other changes | | 7 | | (5 | ) | — | | 2 | |
Total self-supported | | (6 | ) | (24 | ) | (92 | ) | (122 | ) |
Forecast allowance changes: | | | | | | | | | |
Forecast allowance — reduction to match income statement | | — | | — | | (300 | ) | (300 | ) |
Total changes | | 50 | | (375 | ) | (2,127 | ) | (2,452 | ) |
2011/12 provincial debt — first Quarterly Report | | 53,487 | | | | | | | |
2011/12 provincial debt — second Quarterly Report | | | | 53,112 | | | | | |
2011/12 provincial debt — third Quarterly Report | | | | | | 50,985 | | 50,985 | |
Budget and Fiscal Plan – 2012/13 to 2014/15
112
2011/12 Revised Financial Forecast (Third Quarterly Report)
Risks to the 2011/12 outlook
The major risks to the 2011/12 forecast stem from changes to the main tax bases (personal and corporate income, sales and property transfer) that are dependent on economic activity in BC and its trading partners, commodity prices (especially natural gas, lumber and electricity) and exchange rate fluctuations.
The spending forecast contained in the fiscal plan is based on ministry and service delivery agency spending plans and strategies. Changes to planning assumptions, such as utilization or demand rates for government services in the health care, education, or community social services sectors, represent the main spending risks.
These risks, as well as further government spending initiatives and the potential impact of accounting policy changes, are covered by the $603 million Contingencies vote and the $50 million forecast allowance.
2011/12 third Quarterly Report and full year forecast tables
The following tables present 2011/12 fiscal year-to-date and full year budget to actual comparisons for multiple financial indicators. Prior year actual results are included as well for comparison purposes.
Table 4.7 2011/12 Operating Statement
| | Year-to-Date to December 31 | | Full Year | |
| | 2011/12 | | Actual | | 2011/12 | | Actual | |
($ millions) | | Budget | | Actual | | Variance | | 2010/11 | | Budget | | Forecast | | Variance | | 2010/11 | |
Revenue | | 30,208 | | 30,083 | | (125 | ) | 29,206 | | 41,337 | | 40,971 | | (366 | ) | 39,926 | |
Expense | | (29,767 | ) | (30,974 | ) | (1,207 | ) | (29,135 | ) | (41,912 | ) | (43,418 | ) | (1,506 | ) | (40,235 | ) |
Surplus (deficit) before forecast allowance | | 441 | | (891 | ) | (1,332 | ) | 71 | | (575 | ) | (2,447 | ) | (1,872 | ) | (309 | ) |
Forecast allowance | | — | | — | | — | | — | | (350 | ) | (50 | ) | 300 | | — | |
Surplus (deficit) | | 441 | | (891 | ) | (1,332 | ) | 71 | | (925 | ) | (2,497 | ) | (1,572 | ) | (309 | ) |
Accumulated surplus beginning of the year | | 3,595 | | 4,143 | | 548 | | 4,705 | | 3,595 | | 4,396 | | 801 | | 4,705 | |
Accumulated surplus before comprehensive income | | 4,036 | | 3,252 | | (784 | ) | 4,776 | | 2,670 | | 1,899 | | (771 | ) | 4,396 | |
Accumulated other comprehensive income from self-supported Crown agencies | | 233 | | 55 | | (178 | ) | 415 | | 199 | | 117 | | (82 | ) | 436 | |
Accumulated surplus end of period | | 4,269 | | 3,307 | | (962 | ) | 5,191 | | 2,869 | | 2,016 | | (853 | ) | 4,832 | |
Budget and Fiscal Plan – 2012/13 to 2014/15
113
2011/12 Revised Financial Forecast (Third Quarterly Report)
Table 4.8 2011/12 Revenue by Source
| | Year-to-Date to December 31 | | Full Year | |
| | 2011/12 | | Actual | | 2011/12 | | Actual | |
($ millions) | | Budget | | Actual | | Variance | | 2010/11 | | Budget | | Forecast | | Variance | | 2010/11 | |
Taxation | | | | | | | | | | | | | | | | | |
Personal income | | 4,275 | | 4,317 | | 42 | | 4,053 | | 5,796 | | 5,815 | | 19 | | 5,361 | |
Corporate income | | 1,066 | | 1,128 | | 62 | | 1,009 | | 1,571 | | 1,624 | | 53 | | 1,658 | |
Harmonized sales | | 4,303 | | 4,375 | | 72 | | 2,735 | | 5,820 | | 5,811 | | (9 | ) | 4,176 | |
Other sales (1) | | 88 | | 119 | | 31 | | 1,347 | | 116 | | 141 | | 25 | | 1,387 | |
Fuel | | 727 | | 708 | | (19 | ) | 719 | | 964 | | 939 | | (25 | ) | 940 | |
Carbon | | 670 | | 683 | | 13 | | 523 | | 950 | | 960 | | 10 | | 741 | |
Tobacco | | 517 | | 488 | | (29 | ) | 585 | | 676 | | 651 | | (25 | ) | 734 | |
Property | | 1,402 | | 1,404 | | 2 | | 1,431 | | 1,898 | | 1,922 | | 24 | | 1,918 | |
Property transfer | | 647 | | 767 | | 120 | | 675 | | 810 | | 935 | | 125 | | 855 | |
Other (2) | | 326 | | 308 | | (18 | ) | 338 | | 413 | | 407 | | (6 | ) | 427 | |
| | 14,021 | | 14,297 | | 276 | | 13,415 | | 19,014 | | 19,205 | | 191 | | 18,197 | |
Natural resources | | | | | | | | | | | | | | | | | |
Natural gas royalties | | 319 | | 267 | | (52 | ) | 258 | | 447 | | 367 | | (80 | ) | 313 | |
Forests | | 363 | | 311 | | (52 | ) | 284 | | 526 | | 457 | | (69 | ) | 436 | |
Other natural resource (3) | | 1,596 | | 1,493 | | (103 | ) | 1,438 | | 2,127 | | 2,047 | | (80 | ) | 1,978 | |
| | 2,278 | | 2,071 | | (207 | ) | 1,980 | | 3,100 | | 2,871 | | (229 | ) | 2,727 | |
Other revenue | | | | | | | | | | | | | | | | | |
Medical Services Plan premiums | | 1,459 | | 1,436 | | (23 | ) | 1,334 | | 1,945 | | 1,915 | | (30 | ) | 1,787 | |
Other fees (4) | | 1,863 | | 2,037 | | 174 | | 1,908 | | 2,762 | | 2,799 | | 37 | | 2,658 | |
Investment earnings | | 769 | | 751 | | (18 | ) | 589 | | 1,037 | | 977 | | (60 | ) | 859 | |
Miscellaneous (5) | | 2,031 | | 1,898 | | (133 | ) | 1,957 | | 2,958 | | 2,826 | | (132 | ) | 2,790 | |
| | 6,122 | | 6,122 | | — | | 5,788 | | 8,702 | | 8,517 | | (185 | ) | 8,094 | |
Contributions from the federal government | | | | | | | | | | | | | | | | | |
Health and social transfers | | 4,049 | | 4,037 | | (12 | ) | 3,862 | | 5,398 | | 5,373 | | (25 | ) | 5,176 | |
Harmonized sales tax transition payment | | 580 | | 580 | | — | | 769 | | 580 | | 580 | | — | | 769 | |
Other federal contributions (6) | | 1,047 | | 1,023 | | (24 | ) | 1,229 | | 1,602 | | 1,712 | | 110 | | 2,052 | |
| | 5,676 | | 5,640 | | (36 | ) | 5,860 | | 7,580 | | 7,665 | | 85 | | 7,997 | |
Commercial Crown corporation net income | | | | | | | | | | | | | | | | | |
BC Hydro | | 331 | | 369 | | 38 | | 381 | | 611 | | 595 | | (16 | ) | 591 | |
Liquor Distribution Branch | | 725 | | 726 | | 1 | | 702 | | 925 | | 899 | | (26 | ) | 890 | |
BC Lotteries (net of payments to the federal government) | | 822 | | 816 | | (6 | ) | 829 | | 1,096 | | 1,068 | | (28 | ) | 1,096 | |
ICBC | | 221 | | 31 | | (190 | ) | 247 | | 290 | | 140 | | (150 | ) | 323 | |
Transportation Investment Corporation (Port Mann) | | (12 | ) | (11 | ) | 1 | | (6 | ) | (15 | ) | (16 | ) | (1 | ) | (7 | ) |
Other | | 24 | | 22 | | (2 | ) | 10 | | 34 | | 27 | | (7 | ) | 18 | |
| | 2,111 | | 1,953 | | (158 | ) | 2,163 | | 2,941 | | 2,713 | | (228 | ) | 2,911 | |
Total revenue | | 30,208 | | 30,083 | | (125 | ) | 29,206 | | 41,337 | | 40,971 | | (366 | ) | 39,926 | |
(1) Includes social service tax and continuation of the tax on designated property.
(2) Corporation capital, insurance premium and hotel room taxes.
(3) Columbia River Treaty, other energy and minerals, water rental and other resources.
(4) Post-secondary, healthcare-related, motor vehicle, and other fees.
(5) Includes asset dispositions, reimbursements for health care and other services provided to external agencies, and other recoveries.
(6) Includes contributions for health, education, community development, housing and social service programs, and transportation projects.
Budget and Fiscal Plan – 2012/13 to 2014/15
114
2011/12 Revised Financial Forecast (Third Quarterly Report)
Table 4.9 2011/12 Expense by Ministry, Program and Agency
| | Year-to-Date to December 31 | | Full Year | |
| | 2011/12 | | Actual | | 2011/12 | | Actual | |
($ millions) | | Budget | | Actual | | Variance | | 2010/11 (1) | | Budget (1) | | Forecast | | Variance | | 2010/11 (1) | |
Office of the Premier | | 7 | | 7 | | — | | 5 | | 9 | | 9 | | — | | 9 | |
Aboriginal Relations and Reconciliation | | 60 | | 56 | | (4 | ) | 83 | | 80 | | 80 | | — | | 95 | |
Advanced Education | | 1,485 | | 1,487 | | 2 | | 1,505 | | 1,980 | | 1,980 | | — | | 1,975 | |
Agriculture | | 58 | | 60 | | 2 | | 63 | | 66 | | 66 | | — | | 80 | |
Children and Family Development | | 968 | | 982 | | 14 | | 983 | | 1,331 | | 1,331 | | — | | 1,334 | |
Community, Sport and Cultural Development | | 224 | | 218 | | (6 | ) | 221 | | 254 | | 254 | | — | | 433 | |
Education | | 3,933 | | 3,950 | | 17 | | 3,853 | | 5,242 | | 5,242 | | — | | 5,197 | |
Energy and Mines | | 327 | | 307 | | (20 | ) | 338 | | 437 | | 437 | | — | | 479 | |
Environment | | 93 | | 94 | | 1 | | 66 | | 130 | | 130 | | — | | 132 | |
Finance | | 123 | | 64 | | (59 | ) | 187 | | 173 | | 173 | | — | | 176 | |
Forests, Lands and Natural Resource Operations | | 440 | | 404 | | (36 | ) | 614 | | 590 | | 590 | | — | | 810 | |
Health | | 11,729 | | 11,432 | | (297 | ) | 10,976 | | 15,714 | | 15,603 | | (111 | ) | 14,721 | |
Jobs, Tourism and Innovation | | 178 | | 173 | | (5 | ) | 109 | | 238 | | 238 | | — | | 299 | |
Justice | | 778 | | 802 | | 24 | | 1,073 | | 1,043 | | 1,104 | | 61 | | 1,124 | |
Labour, Citizens’ Services and Open Government | | 400 | | 404 | | 4 | | 427 | | 566 | | 566 | | — | | 585 | |
Social Development | | 1,768 | | 1,805 | | 37 | | 1,463 | | 2,338 | | 2,338 | | — | | 2,369 | |
Transportation and Infrastructure | | 548 | | 549 | | 1 | | 553 | | 807 | | 807 | | — | | 752 | |
Total ministries and Office of the Premier | | 23,119 | | 22,794 | | (325 | ) | 22,519 | | 30,998 | | 30,948 | | (50 | ) | 30,570 | |
Management of public funds and debt | | 1,020 | | 942 | | (78 | ) | 946 | | 1,349 | | 1,265 | | (84 | ) | 1,243 | |
Contingencies | | — | | — | | — | | — | | 603 | | 603 | | — | | 1 | |
Funding for capital expenditures | | 706 | | 787 | | 81 | | 690 | | 1,543 | | 1,306 | | (237 | ) | 1,083 | |
Legislative and other appropriations | | 94 | | 94 | | — | | 85 | | 125 | | 125 | | — | | 120 | |
Subtotal | | 24,939 | | 24,617 | | (322 | ) | 24,240 | | 34,618 | | 34,247 | | (371 | ) | 33,017 | |
Liability for reimbursement of HST transition funding | | — | | 1,599 | | 1,599 | | — | | — | | 1,599 | | 1,599 | | — | |
Prior year liability adjustments | | — | | (14 | ) | (14 | ) | (23 | ) | — | | (24 | ) | (24 | ) | (167 | ) |
Consolidated revenue fund expense | | 24,939 | | 26,202 | | 1,263 | | 24,217 | | 34,618 | | 35,822 | | 1,204 | | 32,850 | |
Expenses recovered from external entities | | 1,839 | | 1,832 | | (7 | ) | 2,028 | | 2,651 | | 2,739 | | 88 | | 2,924 | |
Funding provided to service delivery agencies | | (15,761 | ) | (15,691 | ) | 70 | | (14,975 | ) | (21,369 | ) | (21,267 | ) | 102 | | (20,303 | ) |
Total direct program spending | | 11,017 | | 12,343 | | 1,326 | | 11,270 | | 15,900 | | 17,294 | | 1,394 | | 15,471 | |
Service delivery agency expense | | | | | | | | | | | | | | | | | |
School districts | | 3,953 | | 3,958 | | 5 | | 3,885 | | 5,513 | | 5,532 | | 19 | | 5,418 | |
Universities | | 2,766 | | 2,741 | | (25 | ) | 2,662 | | 3,880 | | 3,909 | | 29 | | 3,734 | |
Colleges and institutes | | 767 | | 784 | | 17 | | 768 | | 1,063 | | 1,097 | | 34 | | 1,064 | |
Health authorities and hospital societies | | 8,776 | | 8,718 | | (58 | ) | 8,189 | | 11,989 | | 12,092 | | 103 | | 11,187 | |
Other service delivery agencies | | 2,488 | | 2,430 | | (58 | ) | 2,361 | | 3,567 | | 3,494 | | (73 | ) | 3,361 | |
| | 18,750 | | 18,631 | | (119 | ) | 17,865 | | 26,012 | | 26,124 | | 112 | | 24,764 | |
Total expense | | 29,767 | | 30,974 | | 1,207 | | 29,135 | | 41,912 | | 43,418 | | 1,506 | | 40,235 | |
(1) Restated to reflect government’s current organization and/or accounting policies.
Budget and Fiscal Plan – 2012/13 to 2014/15
115
2011/12 Revised Financial Forecast (Third Quarterly Report)
Table 4.10 2011/12 Expense By Function
| | Year-to-Date to December 31 | | Full Year | |
| | 2011/12 | | Actual | | 2011/12 | | Actual | |
($ millions) | | Budget | | Actual | | Variance | | 2010/11 (1) | | Budget | | Forecast | | Variance | | 2010/11 (1) | |
Health: | | | | | | | | | | | | | | | | | |
Medical Services Plan | | 2,925 | | 2,884 | | (41 | ) | 2,878 | | 4,026 | | 4,082 | | 56 | | 3,799 | |
Pharmacare | | 919 | | 906 | | (13 | ) | 885 | | 1,140 | | 1,159 | | 19 | | 1,129 | |
Regional services | | 8,420 | | 8,077 | | (343 | ) | 7,861 | | 11,593 | | 11,319 | | (274 | ) | 10,597 | |
Other healthcare expenses (2) | | 496 | | 484 | | (12 | ) | 449 | | 718 | | 706 | | (12 | ) | 625 | |
| | 12,760 | | 12,351 | | (409 | ) | 12,073 | | 17,477 | | 17,266 | | (211 | ) | 16,150 | |
Education: | | | | | | | | | | | | | | | | | |
School districts | | 4,134 | | 4,156 | | 22 | | 4,102 | | 5,911 | | 5,924 | | 13 | | 5,802 | |
Post-secondary institutions | | 3,546 | | 3,564 | | 18 | | 3,515 | | 4,825 | | 5,052 | | 227 | | 4,865 | |
Other education expenses (3) | | 285 | | 284 | | (1 | ) | 321 | | 558 | | 554 | | (4 | ) | 504 | |
| | 7,965 | | 8,004 | | 39 | | 7,938 | | 11,294 | | 11,530 | | 236 | | 11,171 | |
Social services: | | | | | | | | | | | | | | | | | |
Social assistance (2),(3) | | 1,155 | | 1,169 | | 14 | | 1,128 | | 1,495 | | 1,483 | | (12 | ) | 1,512 | |
Childcare services (2) | | 817 | | 825 | | 8 | | 821 | | 1,112 | | 1,115 | | 3 | | 1,118 | |
Community living and other services | | 549 | | 540 | | (9 | ) | 538 | | 770 | | 763 | | (7 | ) | 754 | |
| | 2,521 | | 2,534 | | 13 | | 2,487 | | 3,377 | | 3,361 | | (16 | ) | 3,384 | |
Protection of persons and property | | 1,005 | | 1,030 | | 25 | | 1,002 | | 1,322 | | 1,362 | | 40 | | 1,448 | |
Transportation | | 1,049 | | 1,069 | | 20 | | 1,101 | | 1,617 | | 1,597 | | (20 | ) | 1,577 | |
Natural resources and economic development | | 1,067 | | 962 | | (105 | ) | 1,310 | | 1,347 | | 1,385 | | 38 | | 2,054 | |
Other | | 891 | | 853 | | (38 | ) | 811 | | 1,220 | | 1,226 | | 6 | | 1,213 | |
Contingencies | | — | | — | | — | | — | | 603 | | 603 | | — | | — | |
General government | | 670 | | 2,392 | | 1,722 | | 715 | | 1,102 | | 2,681 | | 1,579 | | 985 | |
Debt servicing costs | | 1,839 | | 1,779 | | (60 | ) | 1,698 | | 2,553 | | 2,407 | | (146 | ) | 2,253 | |
Total expense | | 29,767 | | 30,974 | | 1,207 | | 29,135 | | 41,912 | | 43,418 | | 1,506 | | 40,235 | |
(1) Restated to reflect government’s current organization and accounting policies.
(2) Payments for healthcare services by the Ministry of Social Development and the Ministry of Children and Family Development made on behalf of their clients are reported in the Health function.
(3) Payments for training costs by the Ministry of Social Development made on behalf of its clients are reported in the Education function.
Budget and Fiscal Plan – 2012/13 to 2014/15
116
2011/12 Revised Financial Forecast (Third Quarterly Report)
Table 4.11 2011/12 Capital Spending
| | Year-to-Date to December 31 | | Full Year | |
| | 2011/12 | | Actual | | 2011/12 | | Actual | |
($ millions) | | Budget | | Actual | | Variance | | 2010/11 | | Budget | | Forecast | | Variance | | 2010/11 | |
Taxpayer-supported | | | | | | | | | | | | | | | | | |
Education | | | | | | | | | | | | | | | | | |
School districts | | 390 | | 438 | | 48 | | 304 | | 520 | | 530 | | 10 | | 433 | |
Post-secondary institutions | | 450 | | 416 | | (34 | ) | 551 | | 599 | | 779 | | 180 | | 925 | |
Health | | 644 | | 391 | | (253 | ) | 482 | | 859 | | 841 | | (18 | ) | 916 | |
BC Transportation Financing Authority | | 838 | | 865 | | 27 | | 988 | | 986 | | 958 | | (28 | ) | 1,080 | |
BC Transit | | 121 | | 31 | | (90 | ) | 25 | | 162 | | 50 | | (112 | ) | 39 | |
Vancouver Convention Centre expansion project | | — | | 1 | | 1 | | 6 | | — | | 3 | | 3 | | 10 | |
BC Place redevelopment | | 147 | | 175 | | 28 | | 156 | | 147 | | 249 | | 102 | | 197 | |
Government operating (ministries) | | 249 | | 151 | | (98 | ) | 131 | | 332 | | 268 | | (64 | ) | 261 | |
Other (1) | | 198 | | 164 | | (34 | ) | 189 | | 300 | | 237 | | (63 | ) | 252 | |
Capital spending contingencies (2) | | — | | — | | — | | — | | 200 | | 82 | | (118 | ) | — | |
Total taxpayer-supported | | 3,037 | | 2,632 | | (405 | ) | 2,832 | | 4,105 | | 3,997 | | (108 | ) | 4,113 | |
| | | | | | | | | | | | | | | | | |
Self-supported | | | | | | | | | | | | | | | | | |
BC Hydro | | 1,603 | | 1,385 | | (218 | ) | 1,110 | | 2,195 | | 2,082 | | (113 | ) | 1,519 | |
Columbia River power projects (3) | | 75 | | 64 | | (11 | ) | 52 | | 98 | | 89 | | (9 | ) | 67 | |
Transportation Investment Corporation (Port Mann) | | 538 | | 594 | | 56 | | 623 | | 717 | | 742 | | 25 | | 738 | |
BC Rail | | 14 | | 8 | | (6 | ) | 8 | | 18 | | 13 | | (5 | ) | 6 | |
ICBC | | 64 | | 79 | | 15 | | 40 | | 81 | | 86 | | 5 | | 48 | |
BC Lotteries | | 82 | | 52 | | (30 | ) | 60 | | 109 | | 107 | | (2 | ) | 81 | |
Liquor Distribution Branch | | 18 | | 12 | | (6 | ) | 11 | | 25 | | 25 | | — | | 18 | |
Total self-supported | | 2,394 | | 2,194 | | (200 | ) | 1,904 | | 3,243 | | 3,144 | | (99 | ) | 2,477 | |
Total capital spending | | 5,431 | | 4,826 | | (605 | ) | 4,736 | | 7,348 | | 7,141 | | (207 | ) | 6,590 | |
(1) Includes BC Housing Management Commission, Provincial Rental Housing Corporation, other service delivery agencies and project reserves held by the Ministry of Finance.
(2) Includes $50 million for ministry capital contingencies.
(3) Joint ventures of the Columbia Power Corporation and Columbia Basin Trust.
Budget and Fiscal Plan – 2012/13 to 2014/15
117
2011/12 Revised Financial Forecast (Third Quarterly Report)
Table 4.12 2011/12 Provincial Debt (1)
| | Year-to-Date to December 31 | | Full Year | |
| | 2011/12 | | Actual | | 2011/12 | | Actual | |
($ millions) | | Budget | | Actual | | Variance | | 2010/11 | | Budget | | Forecast | | Variance | | 2010/11 | |
Taxpayer-supported debt | | | | | | | | | | | | | | | | | |
Provincial government operating | | 5,873 | | 4,557 | | (1,316 | ) | 3,927 | | 6,067 | | 4,994 | | (1,073 | ) | 4,268 | |
Provincial government general capital | | 2,696 | | 2,696 | | — | | 2,696 | | 2,696 | | 2,696 | | — | | 2,696 | |
Provincial government operating | | 8,569 | | 7,253 | | (1,316 | ) | 6,623 | | 8,763 | | 7,690 | | (1,073 | ) | 6,964 | |
Other taxpayer-supported debt (mainly capital) | | | | | | | | | | | | | | | | | |
Education (2) | | | | | | | | | | | | | | | | | |
School districts | | 6,384 | | 6,282 | | (102 | ) | 5,895 | | 6,499 | | 6,532 | | 33 | | 6,016 | |
Post-secondary institutions | | 4,186 | | 4,152 | | (34 | ) | 4,040 | | 4,218 | | 4,214 | | (4 | ) | 4,092 | |
| | 10,570 | | 10,434 | | (136 | ) | 9,935 | | 10,717 | | 10,746 | | 29 | | 10,108 | |
Health (2),(3) | | 5,282 | | 5,081 | | (201 | ) | 4,646 | | 5,411 | | 5,317 | | (94 | ) | 4,895 | |
Highways and public transit BC Transportation Financing Authority (4) | | 6,345 | | 6,207 | | (138 | ) | 5,576 | | 6,493 | | 6,278 | | (215 | ) | 5,785 | |
Public transit | | 997 | | 999 | | 2 | | 997 | | 997 | | 999 | | 2 | | 997 | |
Sky Train extension | | 1,153 | | 1,175 | | 22 | | 1,155 | | 1,153 | | 1,175 | | 22 | | 1,155 | |
BC Transit | | 223 | | 187 | | (36 | ) | 161 | | 240 | | 181 | | (59 | ) | 158 | |
| | 8,718 | | 8,568 | | (150 | ) | 7,889 | | 8,883 | | 8,633 | | (250 | ) | 8,095 | |
Other | | | | | | | | | | | | | | | | | |
Social housing (5) | | 676 | | 649 | | (27 | ) | 471 | | 716 | | 668 | | (48 | ) | 511 | |
Provincial government general capital | | 995 | | 718 | | (277 | ) | 423 | | 1,087 | | 838 | | (249 | ) | 570 | |
BC Pavilion Corporation | | 408 | | 371 | | (37 | ) | 227 | | 445 | | 378 | | (67 | ) | 250 | |
BC Immigrant Investment Fund | | 391 | | 374 | | (17 | ) | 337 | | 406 | | 400 | | (6 | ) | 347 | |
Other (6) | | 349 | | 91 | | (258 | ) | 123 | | 388 | | 116 | | (272 | ) | 115 | |
| | 2,819 | | 2,203 | | (616 | ) | 1,581 | | 3,042 | | 2,400 | | (642 | ) | 1,793 | |
Total other taxpayer-supported | | 27,389 | | 26,286 | | (1,103 | ) | 24,051 | | 28,053 | | 27,096 | | (957 | ) | 24,891 | |
Total taxpayer-supported debt | | 35,958 | | 33,539 | | (2,419 | ) | 30,674 | | 36,816 | | 34,786 | | (2,030 | ) | 31,855 | |
Self-supported debt | | | | | | | | | | | | | | | | | |
Commercial Crown corporations | | | | | | | | | | | | | | | | | |
BC Hydro | | 12,743 | | 13,318 | | 575 | | 11,738 | | 13,537 | | 13,466 | | (71 | ) | 11,710 | |
Columbia River power projects (7) | | 464 | | 480 | | 16 | | 183 | | 463 | | 482 | | 19 | | 183 | |
BC Lotteries | | 82 | | 90 | | 8 | | 65 | | 87 | | 98 | | 11 | | 85 | |
Transportation Investment Corporation (Port Mann) | | 1,827 | | 1,723 | | (104 | ) | 1,133 | | 1,983 | | 1,930 | | (53 | ) | 1,148 | |
Liquor Distribution Branch | | — | | — | | — | | 1 | | — | | — | | — | | — | |
Post-secondary institutions’ subsidiaries | | 201 | | 173 | | (28 | ) | 201 | | 201 | | 173 | | (28 | ) | 173 | |
| | 15,317 | | 15,784 | | 467 | | 13,321 | | 16,271 | | 16,149 | | (122 | ) | 13,299 | |
Warehouse borrowing program | | — | | 2,527 | | 2,527 | | 609 | | — | | — | | — | | — | |
Total self-supported debt | | 15,317 | | 18,311 | | 2,994 | | 13,930 | | 16,271 | | 16,149 | | (122 | ) | 13,299 | |
Forecast allowance | | — | | — | | — | | — | | 350 | | 50 | | (300 | ) | — | |
Total provincial debt | | 51,275 | | 51,850 | | 575 | | 44,604 | | 53,437 | | 50,985 | | (2,452 | ) | 45,154 | |
(1) Debt is after deduction of sinking funds and unamortized discounts, and excludes accrued interest. Government direct and fiscal agency accrued interest is reported in the government’s accounts as an accounts payable.
(2) Includes debt and guarantees incurred by the government on behalf of school districts, universities, colleges and health authorities/hospital societies (SUCH), and debt directly incurred by these entities.
(3) Health facilities’ debt includes public-private partnership obligations of $886 million for the nine months ended December 31, 2010, $957 million for the nine months ended December 31, 2011, $935 million for fiscal 2010/11 and $994 million forecast for fiscal 2011/12.
(4) BC Transportation Financing Authority debt includes public-private partnership obligations of $824 million for the nine months ended December 31, 2010, $875 million for the nine months ended December 31, 2011, $838 million for fiscal 2010/11 and $891 million forecast for fiscal 2011/12.
(5) Includes the BC Housing Management Commission and the Provincial Rental Housing Corporation.
(6) Includes service delivery agencies, student loan guarantees, loan guarantees to agricultural producers, guarantees issued under economic development and home mortgage assistance programs and loan guarantee provisions.
(7) Joint ventures of the Columbia Power Corporation and Columbia Basin Trust.
Budget and Fiscal Plan – 2012/13 to 2014/15
118
2011/12 Revised Financial Forecast (Third Quarterly Report)
Table 4.13 2011/12 Statement of Financial Position
| | Actual | | Year-to-Date | | Forecast | |
| | March 31, | | December 31, | | March 31, | |
($ millions) | | 2011 | | 2011 | | 2012 | |
Financial assets | | | | | | | |
Cash and temporary investments | | 3,096 | | 3,409 | | 1,126 | |
Other financial assets | | 9,603 | | 8,549 | | 9,278 | |
Sinking funds | | 1,410 | | 1,587 | | 1,288 | |
Investments in commercial Crown corporations: | | | | | | | |
Retained earnings | | 6,968 | | 6,680 | | 7,114 | |
Recoverable capital loans | | 12,947 | | 15,130 | | 15,493 | |
| | 19,915 | | 21,810 | | 22,607 | |
Warehouse borrowing program assets | | — | | 2,527 | | — | |
| | 34,024 | | 37,882 | | 34,299 | |
Liabilities | | | | | | | |
Accounts payable and accrued liabilities | | 7,664 | | 8,043 | | 7,595 | |
Deferred revenue | | 10,854 | | 10,729 | | 10,624 | |
Debt: | | | | | | | |
Taxpayer-supported debt | | 31,855 | | 33,539 | | 34,786 | |
Self-supported debt | | 13,299 | | 18,311 | | 16,149 | |
Forecast allowance | | — | | — | | 50 | |
Total provincial debt | | 45,154 | | 51,850 | | 50,985 | |
Add: debt offset by sinking funds | | 1,410 | | 1,587 | | 1,288 | |
Less: guarantees and non-guaranteed debt | | (421 | ) | (733 | ) | (700 | ) |
Financial statement debt | | 46,143 | | 52,704 | | 51,573 | |
| | 64,661 | | 71,476 | | 69,792 | |
Net liabilities | | (30,637 | ) | (33,594 | ) | (35,493 | ) |
Capital and other non-financial assets | | | | | | | |
Tangible capital assets | | 34,390 | | 35,541 | | 36,360 | |
Other non-financial assets | | 1,079 | | 1,360 | | 1,149 | |
| | 35,469 | | 36,901 | | 37,509 | |
Accumulated surplus (deficit) | | 4,832 | | 3,307 | | 2,016 | |
Changes in Financial Position
| | Year-to-Date | | Forecast | |
| | December 31, | | March 31, | |
($ millions) | | 2011 | | 2012 | |
(Surplus) deficit for the period | | 891 | | 2,497 | |
Comprehensive income and accounting adjustments (increase) decrease | | 634 | | 319 | |
(Increase) decrease in accumulated surplus | | 1,525 | | 2,816 | |
Capital and other non-financial asset changes: | | | | | |
Increase in taxpayer-supported capital investments | | 2,632 | | 3,997 | |
Less: amortization and other accounting changes | | (1,481 | ) | (2,027 | ) |
Change in net capital assets | | 1,151 | | 1,970 | |
Increase (decrease) in other non-financial assets | | 281 | | 70 | |
| | 1,432 | | 2,040 | |
Increase (decrease) in net liabilities | | 2,957 | | 4,856 | |
Investment and working capital changes: | | | | | |
Increase (reduction) in cash and temporary investments | | 313 | | (1,970 | ) |
Increase in total investment in commercial Crown corporations: | | | | | |
Increase (decrease) in retained earnings | | (288 | ) | 146 | |
Self-supported capital investments | | 2,194 | | 3,144 | |
Less: loan repayments and other accounting changes | | (11 | ) | (598 | ) |
| | 1,895 | | 2,692 | |
Other working capital changes | | 1,396 | | (148 | ) |
| | 3,604 | | 574 | |
Increase (decrease) in financial statement debt | | 6,561 | | 5,430 | |
(Increase) decrease in sinking fund debt | | (177 | ) | 122 | |
Increase (decrease) in guarantees and non-guaranteed debt | | 312 | | 279 | |
Increase (decrease) in total provincial debt | | 6,696 | | 5,831 | |
Budget and Fiscal Plan – 2012/13 to 2014/15
119
APPENDICES
A1 | Tax Expenditures | 122 |
A1.1 | Personal Income Tax — Tax Expenditures | 125 |
A1.2 | Corporate Income Tax — Tax Expenditures | 126 |
A1.3 | Property Taxes — Tax Expenditures | 126 |
A1.4 | Consumption Taxes — Tax Expenditures | 127 |
A2 | Interprovincial Comparisons of Tax Rates — 2012 | 128 |
A3 | Comparison of Provincial and Federal Taxes by Province — 2012 | 129 |
A4 | Interprovincial Comparisons of Provincial Personal Income Taxes Payable — 2012 | 131 |
A5 | Material Assumptions — Revenue | 132 |
A6 | Natural Gas Price Forecasts — 2012/13 to 2014/15 | 137 |
A7 | Material Assumptions — Expense | 138 |
A8 | Operating Statement — 2005/06 to 2014/15 | 141 |
A9 | Revenue by Source — 2005/06 to 2014/15 | 142 |
A10 | Revenue by Source Supplementary Information — 2005/06 to 2014/15 | 143 |
A11 | Expense by Function — 2005/06 to 2014/15 | 144 |
A12 | Expense by Function Supplementary Information — 2005/06 to 2014/15 | 145 |
A13 | Full-Time Equivalents (FTEs) 2005/06 to 2014/15 | 146 |
A14 | Capital Spending — 2005/06 to 2014/15 | 147 |
A15 | Statement of Financial Position — 2005/06 to 2014/15 | 148 |
A16 | Changes in Financial Position — 2005/06 to 2014/15 | 149 |
A17 | Provincial Debt — 2005/06 to 2014/15 | 150 |
A18 | Provincial Debt Supplementary Information — 2005/06 to 2014/15 | 151 |
A19 | Key Provincial Debt Indicators — 2005/06 to 2014/15 | 152 |
| | |
Budget and Fiscal Plan – 2012/13 to 2014/15
Appendices
A1: Tax Expenditures
Introduction
A tax expenditure is the reduction in revenues from delivering government programs or benefits through the tax system rather than through voted budget appropriations. Tax expenditures are usually made by offering special tax rates, exemptions, or tax credits. Governments introduce tax expenditures primarily to achieve social policy objectives such as transfers to lower income families or to promote economic development and job creation.
Reporting tax expenditures improves government accountability by providing a more complete picture of government activities. The tax expenditure appendix does not include tax expenditures introduced or expanded in Budget 2012. These are described in Part 2: Tax Measures. With Budget 2012, refundable tax transfers are now accounted for in a voted appropriation. This change does not affect the reporting of tax expenditure costs in the following tables.
The Role of Tax Expenditure Programs
Using the tax system to deliver programs can reduce administration costs and compliance costs for recipients. In certain situations, the tax system allows intended beneficiaries to be readily identified from information that is already collected. In these cases setting up a separate expenditure program would result in costly overlap and duplication of effort. An example is the Low Income Climate Action Tax Credit, which is delivered through the income tax system. If this were a direct provincial expenditure program, a provincial agency or office would have to be established to duplicate much of the work already done by the Canada Revenue Agency. In addition, it would require individuals to undertake a separate, time-consuming application process in order to qualify for the benefit.
There are, however, several potential drawbacks to tax expenditure programs. First, their overall cost often receives less public scrutiny than is the case for spending programs because annual budget appropriations by the legislature are not typically required. Second, tax expenditure programs do not always effectively target those who are intended to benefit from them. Some expenditure programs that are intended to provide tax relief for low income earners may, in reality, confer the greatest benefit on high income earners who pay the most taxes. Finally, costs are often more difficult to control under a tax expenditure program because the benefits tend to be more open-ended and enforcement is often more difficult than for spending programs.
Tax Expenditure Reporting
Not all tax reductions, credits and exemptions are classed as tax expenditures.
The emphasis is on tax reductions, exemptions and refunds that are close equivalents to spending programs. By implication, the list does not include tax measures designed to meet broad tax policy objectives such as improving fairness in the tax system, or measures designed to simplify the administration of the tax. The list also does not include anything that is not intended to be part of a tax base.
Tax expenditures that cost less than $2 million are generally not included. Where practical, smaller items have been presented together as an aggregate figure.
Budget and Fiscal Plan – 2012/13 to 2014/15
122
Appendices
British Columbia Tax Expenditures
The following tables report tax expenditure estimates.
The cost of individual tax expenditures cannot be added together to reach a total tax expenditure figure for two reasons:
· in some cases the programs interact with one another so that eliminating one program could increase or decrease the cost of another; and
· eliminating certain tax expenditure programs could change the choices taxpayers make, which in turn would affect the cost estimates.
The estimates for each tax expenditure are based on a static analysis of the costs and do not take into account any behavioral changes which could change the costs over time. In addition, all estimates are recalculated each year using current data sources and using refinements to the methods of estimation that can result in significant changes to the value of a given tax expenditure from prior years’ reports.
In Table A1.1, Personal Income Tax — Tax Expenditures, the list of tax expenditures delivered through the income tax system has been separated into two sub-categories.
· Provincial Measures: This includes all major tax expenditures that are under provincial policy control.
· Federal Measures: British Columbia shares the cost of some federal income tax expenditure programs because, under the tax collection agreement between British Columbia and the federal government, the province has agreed to maintain a consistent income tax base with the federal government in the interest of reducing administrative and compliance costs.
Harmonized Sales Tax
The Harmonized Sales Tax (HST) combines a seven per cent BC rate with the five per cent federal Goods and Services Tax (GST) for a combined HST rate of 12 per cent.
The federal portion of the HST applies to the same goods and services that were taxable under the GST. The provincial portion of the HST applies to the same goods and services that were subject to GST, except items eligible for a provincial point-of-sale rebate or credit.
Exemptions, zero-rating and other measures that apply for the purposes of the federal portion of the HST also apply for the provincial portion of the HST. BC also provides a number of provincial rebates and credits.
BC provides point-of-sale rebates for the provincial portion of the HST on motor fuels, child-sized clothing and footwear, children’s car seats and car booster seats, children’s diapers, and feminine hygiene products. Purchasers pay only the five per cent federal portion of HST on point-of-sale rebate items.
There is also a provincial Residential Energy Credit. The credit is equal to the provincial portion of the HST payable on the purchase of residential energy (excluding service and administration charges).
Budget and Fiscal Plan – 2012/13 to 2014/15
123
Appendices
Other rebates provided by the province include the BC New Housing Rebate, the BC HST Credit for low and modest income families and individuals, and rebates for public service bodies, including municipalities and other eligible local government entities, universities and public colleges, school authorities, hospital authorities, registered charities and qualifying non-profit organizations.
During the summer of 2011, British Columbians had the opportunity to participate in a province-wide referendum on the HST. On August 26, 2011, Elections BC announced that British Columbians had voted in favour of eliminating the HST and returning to the PST/GST system.
Following the referendum results, government committed to make the transition back to the PST/GST system. Subject to the approval of the Legislature of British Columbia, the PST will be re-implemented effective April 1, 2013. The HST will remain in place until the PST is re-implemented.
The HST, including provincial HST rebates and credits, will continue until the HST is replaced by the PST/GST system.
HST tax expenditures are shown in Table A1.4.
Budget and Fiscal Plan – 2012/13 to 2014/15
124
Appendices
Table A1.1 Personal Income Tax — Tax Expenditures
| | 2011/12 | |
| | Estimated Cost | |
| | ($ millions) | |
Personal Income Tax | | | |
Provincial Measures | | | |
BC Family Bonus (1) | | 4 | |
BC Low Income Climate Action Tax Credit | | 188 | |
BC HST Credit | | 314 | |
Training tax credit | | 20 | |
Venture capital tax credit | | 26 | |
Employee venture capital tax credit | | 2 | |
BC mining flow-through tax credit | | 4 | |
Political contributions tax credit | | 1 | |
Provincial Non-Refundable Credits: (2) | | | |
· Charitable donations tax credit | | 155 | |
· Tax credits for tuition and education | | 41 | |
· Tax credits for persons with disability and medical expenses | | 64 | |
· Pension income tax credit | | 22 | |
· Credit for persons older than 65 years | | 56 | |
· Married and equivalent-to-married credits | | 77 | |
· Tax credit for Canada Pension Plan contributions | | 132 | |
· Tax credit for Employment Insurance premiums paid | | 42 | |
Federal Measures (3) | | | |
· Pension income splitting | | 50 | |
· Child care expense deduction | | 38 | |
· Exemption from capital gains up to $750,000 for small businesses and family farms | | 35 | |
· Deduction for residents of northern and isolated areas | | 9 | |
· Non-taxation of business-paid health and dental benefits | | 146 | |
· Tax-Free Savings Accounts | | 12 | |
· Registered Retirement Savings Plans: (4) | | | | | |
| · exemption for | – contributions | | 342 | | | |
| | – investment earnings | | 354 | | | |
| · taxation of | – withdrawals | | (237 | ) | | |
| | Total | | | | 459 | |
· Registered Pension Plans: (4) | | | | | |
| · exemption for | – contributions | | 549 | | | |
| | – investment earnings | | 517 | | | |
| · taxation of | – withdrawals | | (342 | ) | | |
| | Total | | | | 724 | |
(1) The $4 million represents the tax expenditure portion of the program’s cost. The tax expenditure portion represents family bonus payments that effectively reduce the recipient’s personal income tax. The remaining cost of the program, including recoveries and administration costs, of $4 million for 2011/12, is presented in the BC Family Bonus Vote because it represents payments to families which exceed their provincial income tax liabilities. In 2011/12, the total program cost was $8.5 million.
(2) Provincial non-refundable credits are generally based on estimates of credit claims by British Columbia residents.
(3) The estimates show provincial revenue costs only. They are based on estimates of projected federal costs contained in Government of Canada: Tax Expenditures and Evaluations, 2011. British Columbia personal income tax expenditures for the federal measures are based on the amounts claimed by British Columbia residents for the measure and the relevant provincial tax rates for the period. Certain tax expenditure items have been excluded where no data were available or the amounts were immaterial.
(4) Registered retirement savings plans and registered pension plans are treated in the same way as in the federal tax expenditure report. The tax expenditure associated with these plans is presented as the amount of tax that would otherwise be paid in the year of deferral, were the deferral not available. However, this type of estimate overstates the true costs of these preferences because taxes are eventually paid, including tax on investment earnings. An estimate that does not overstate these costs would, however, be difficult to develop and would require some largely speculative assumptions.
Budget and Fiscal Plan – 2012/13 to 2014/15
125
Appendices
Table A1.2 Corporate Income Tax — Tax Expenditures
| | 2011/12 | |
| | Estimated Cost | |
| | ($ millions) | |
Corporate Income Tax | | | |
Charitable donations deduction (1) | | 32 | |
Training tax credit | | 11 | |
Film and video tax credit | | 57 | |
Production services tax credit | | 162 | |
International business activities tax refund (2) | | 25 | |
Scientific Research and Experimental Development Tax Credit | | 138 | |
Mining Exploration Tax Credit | | 25 | |
Interactive Digital Media Tax Credit | | 35 | |
(1) The deduction offered for corporate charitable donations is a federal measure, but the estimate shows only the provincial revenue loss. This is calculated from the federal revenue loss by applying British Columbia’s share of corporate taxable income and the relevant tax rates to the federal estimate.
(2) Includes employee income tax refunds.
Table A1.3 Property Taxes — Tax Expenditures
| | 2011/12 | |
| | Estimated Cost | |
| | ($ millions) | |
| | | |
School and Rural Area Property Tax | | | |
Assessment exemption of $10,000 for industrial and business properties (1) | | 8 | |
Overnight tourist accommodation assessment relief (1) | | 3 | |
Homeowner Grant (2) | | 780 | |
| | | |
Property Transfer Tax | | | |
Exemption for first-time home buyers | | 67 | |
Exemptions for the following: | | | |
· Property transfers between related individuals | | 77 | |
· Property transfers to municipalities, regional districts, hospital districts, library boards, school boards, water districts and educational institutions | | 6 | |
· Property transfers to charities registered under the Income Tax Act (Canada) | | 5 | |
(1) Estimates are for the 2011 calendar year and include only school and rural area property taxes levied by the province.
(2) The Home Owner Grant includes the Northern and Rural Home Owner Benefit. The cost shown is for the 2011/12 fiscal year.
Budget and Fiscal Plan – 2012/13 to 2014/15
126
Appendices
Table A1.4 Consumption Taxes — Tax Expenditures
| | 2011/12 | |
| | Estimated Cost | |
| | ($ millions) | |
Fuel Tax | | | |
Tax exemption for alternative fuels | | 15 | |
Tax exemption for international flights carrying cargo | | 2 | |
Tax exemption for farmers | | 2 | |
Tax exemption for compressor fuel used to transmit natural gas from wellhead to processing plant | | 15 | |
Harmonized Sales Tax | | | |
| | | |
BC-specific Rebates and Credits (1) | | | |
BC Point-of-Sale Rebates | | | |
Motor fuels | | 265 | |
Books | | 45 | |
Child-sized clothing and footwear | | 36 | |
Children’s car seats/booster seats | | 2 | |
Feminine hygiene products and children’s diapers | | 9 | |
BC Public Service Body Rebates | | | |
Municipalities and other eligible local government entities | | 241 | |
Universities and public colleges | | 67 | |
School authorities | | 71 | |
Hospital authorities | | 85 | |
Registered charities and qualifying non-profit organizations | | 49 | |
Other BC Measures | | | |
BC New Housing Rebate (2) | | 476 | |
Residential Energy Credit | | 208 | |
| | | |
Exemptions, Zero-rating and Other Measures Shared with the Federal Government (3) | | | |
Zero-rating of basic groceries | | 712 | |
Zero-rating of prescription drugs | | 108 | |
Zero-rating of medical devices | | 38 | |
Exemption for residential rent (long term) | | 329 | |
Exemption for health care services | | 147 | |
Exemption for child care and personal services | | 24 | |
Exemption for education services (tuition) | | 115 | |
Exemption for water and basic garbage collection services | | 49 | |
Exemption for municipal transit | | 35 | |
Exemption for ferry, road and bridge tolls | | 8 | |
Exemption and rebate for legal aid services | | 5 | |
Foreign Convention and Tour Incentive Program | | 2 | |
Small suppliers’ threshold | | 32 | |
Exemption for certain supplies made by charities and non-profit organizations | | 155 | |
(1) Estimates are based on Statistics Canada data and/or administrative data.
(2) The new housing rebate cost does not include foregone HST revenue related to grandparented purchases of new housing. There is no provincial HST on grandparented new housing purchases. This foregone revenue is taken into account in gross HST revenue estimates.
(3) The estimates show provincial foregone revenue only. They are based on the federal GST tax expenditure estimates contained in Government of Canada: Tax Expenditures and Evaluations, 2011. British Columbia HST tax expenditures for the federal measures are based on the portion of the expenditure estimated to be attributable to British Columbia and adjusted for the provincial HST rate. Certain tax expenditure items have been excluded where no data are available.
Budget and Fiscal Plan – 2012/13 to 2014/15
127
Appendices
Table A2 Interprovincial Comparisons of Tax Rates — 2012 (Rates known as of February 1, 2012)(1)
Tax | | British
Columbia | | Alberta | | Saskat-
chewan | | Manitoba | | Ontario | | Quebec | | New
Brunswick | | Nova
Scotia | | Prince
Edward
Island | | New-
foundland | |
Corporation income tax (2)
(per cent of taxable income) | | | | | | | | | | | | | | | | | | | | | |
General rate | | 10 | | 10 | | 12 | | 12 | | 11.5 | | 11.9 | | 10 | | 16 | | 16 | | 14 | |
Manufacturing rate | | 10 | | 10 | | 10 | | 12 | | 10 | | 11.9 | | 10 | | 16 | | 16 | | 5 | |
Small business rate | | 2.5 | | 3 | | 2 | | 0 | | 4.5 | | 8.0 | | 4.5 | | 4 | | 1 | | 4 | |
Small business threshold ($000s) | | 500 | | 500 | | 500 | | 400 | | 500 | | 500 | | 500 | | 400 | | 500 | | 500 | |
Corporation capital tax (3) | | | | | | | | | | | | | | | | | | | | | |
Non-financial | | Nil | | Nil | | Nil | | Nil | | Nil | | Nil | | Nil | | .05 | | Nil | | Nil | |
Financial | | Nil | | Nil | | .7/3.25 | | 3.0 | | Nil | | .25 | | 3.0 | | 4.0 | | 5.0 | | 4.0 | |
Health care premiums/month (4) | | | | | | | | | | | | | | | | | | | | | |
Individual/family | | 64/128 | | Nil | | Nil | | Nil | | Nil | | 16.67/33.33 | | Nil | | Nil | | Nil | | Nil | |
Payroll tax (per cent) (5) | | Nil | | Nil | | Nil | | 2.15 | | 1.95 | | 4.26 | | Nil | | Nil | | Nil | | 2.0 | |
Insurance premium tax (per cent) (6) | | 2-4.4 | | 2-3 | | 3-4 | | 2-3 | | 2-3.5 | | 2-3 | | 2-3 | | 3-4 | | 3.5 | | 4 | |
Fuel tax (cents per litre) (7) | | | | | | | | | | | | | | | | | | | | | |
Gasoline | | 20.06 | | 9.0 | | 15.0 | | 11.5 | | 22.7 | | 27.5 | | 21.9 | | 26.2 | | 15.8 | | 25.4 | |
Diesel | | 21.39 | | 9.0 | | 15.0 | | 11.5 | | 23.5 | | 29.5 | | 28.7 | | 26.5 | | 20.2 | | 26.2 | |
Sales tax (per cent) (8) | | | | | | | | | | | | | | | | | | | | | |
General rate | | 7 | | Nil | | 5 | | 7 | | 8 | | 9.5 | | 8 | | 10 | | 10 | | 8 | |
Tobacco tax (dollars per carton of 200 cigarettes) (9) | | 42.70 | | 40.00 | | 46.30 | | 51.20 | | 30.20 | | 21.80 | | 40.20 | | 51.70 | | 50.80 | | 44.60 | |
(1) Rates shown are those known as of February 1, 2012 and that are in effect for 2012.
(2) Ontario plans to reduce its general corporate income tax rate to 11 per cent effective July 1, 2012 and to 10 per cent effective July 1, 2013. BC intends to increase its general corporate income tax rate to 11 per cent effective April 1, 2014. BC will not reduce its small business corporate income tax rate to zero on April 1, 2012 as previously announced.
(3) Nova Scotia plans to eliminate its large corporations tax on capital of non-financial institutions effective July 1, 2012. Quebec levies a 0.25 per cent compensation tax on the paid-up capital of financial institutions.
(4) British Columbia has a two-person rate of $116; rates will increase effective January 1, 2013. British Columbia provides premium assistance in the form of lower rates or an exemption from premiums for lower income individuals and families. Quebec levies a Health Contribution of up to $200 annually per adult. Ontario levies a health premium as part of provincial personal income taxes payable.
(5) Provinces with payroll taxes provide payroll tax relief for small businesses. Quebec also levies a compensation tax of up to 3.9 per cent on salaries and wages paid by financial institutions.
(6) The lower rate applies to premiums for life, sickness and accident insurance; the higher rate applies to premiums for property insurance including automobile insurance. In Ontario, Quebec and Newfoundland specific sales taxes also apply to insurance premiums, except those related to individual life and health.
(7) Tax rate is for regular fuel used on highways and includes all provincial taxes payable by consumers at the pump. The British Columbia rate includes 6.75 cents per litre dedicated to the BC Transportation Financing Authority and the carbon tax rates of 5.56 cents per litre for gasoline and 6.39 cents per litre for diesel. As of July 1, 2012, carbon tax rates for gasoline and diesel will increase to 6.67 cents per litre and 7.67 cents per litre, respectively. The British Columbia rates do not include regional taxes that effectively increase the gasoline and diesel tax rates by 9 cents per litre in the South Coast British Columbia transportation service region and by 3.5 cents per litre in the Capital Regional District. The tax rates on gasoline and diesel in the South Coast British Columbia transportation service region will increase by 2 cents per litre on April 1, 2012. The tax rates for Ontario, Quebec, New Brunswick, Nova Scotia and Newfoundland include provincial sales tax based on average pump prices as of January 2012. In British Columbia, gasoline and diesel fuel are eligible for a point of sale rebate of the provincial portion of the HST. The Prince Edward Island rate consists of an ad valorem tax rate capped at 8.7 cents per litre and a volume-based motor fuel tax rate set at 7.1 cents per litre for gasoline and 11.5 cents per litre for diesel fuel.
(8) The rates shown are statutory rates. Quebec and Prince Edward Island impose tax on the purchase price including GST. British Columbia, Ontario, Nova Scotia, New Brunswick and Newfoundland have harmonized their sales taxes with the federal GST. Alberta imposes a 4 per cent tax on short-term rental accommodation. BC intends to return to a retail sales tax (PST) effective April 1, 2013.
(9) Includes estimated provincial sales tax in all provinces except Alberta, Quebec and Prince Edward Island.
Budget and Fiscal Plan – 2012/13 to 2014/15
128
Appendices
Table A3 Comparison of Provincial and Federal Taxes by Province — 2012
Tax | | British
Columbia | | Alberta | | Saskat-
chewan | | Manitoba | | Ontario | | Quebec | | New
Brunswick | | Nova
Scotia | | Prince
Edward
Island | | New-
foundland | |
| | ( $ ) | |
Two Income Family of Four - $90,000 | | | | | | | | | | | | | | | | | | | | | |
1. Provincial Income Tax | | 3,085 | | 4,386 | | 4,175 | | 6,667 | | 4,125 | | 7,833 | | 5,702 | | 6,832 | | 6,862 | | 5,649 | |
Net Child Benefits | | 0 | | 157 | | 0 | | — | | 0 | | -1,924 | | 0 | | 0 | | — | | 0 | |
2. Property Tax - Gross | | 3,566 | | 2,792 | | 4,368 | | 3,332 | | 4,927 | | 4,820 | | 4,774 | | 3,980 | | 3,399 | | 2,651 | |
- Net | | 2,996 | | 2,792 | | 4,368 | | 2,632 | | 4,927 | | 4,820 | | 4,774 | | 3,980 | | 3,399 | | 2,651 | |
3. Sales Tax | | 1,602 | | 12 | | 988 | | 1,313 | | 1,923 | | 2,421 | | 1,960 | | 2,297 | | 1,764 | | 1,887 | |
4. Fuel Tax | | 218 | | 135 | | 225 | | 173 | | 347 | | 413 | | 329 | | 393 | | 237 | | 381 | |
5. Net Carbon Tax | | 177 | | — | | — | | — | | — | | — | | — | | — | | — | | — | |
6. Provincial Direct Taxes | | 8,078 | | 7,482 | | 9,755 | | 10,785 | | 11,321 | | 13,562 | | 12,765 | | 13,501 | | 12,262 | | 10,568 | |
7. Health Care Premiums/Payroll Tax | | 1,536 | | — | | — | | 1,935 | | 1,755 | | 4,234 | | — | | — | | — | | 1,800 | |
8. Total Provincial Tax | | 9,614 | | 7,482 | | 9,755 | | 12,720 | | 13,076 | | 17,796 | | 12,765 | | 13,501 | | 12,262 | | 12,368 | |
9. Federal Income Tax | | 7,775 | | 7,775 | | 7,775 | | 7,775 | | 7,775 | | 7,746 | | 7,775 | | 7,775 | | 7,775 | | 7,775 | |
10. Net Federal GST | | 1,287 | | 1,365 | | 1,329 | | 1,188 | | 1,236 | | 1,152 | | 1,240 | | 1,192 | | 1,216 | | 1,193 | |
11. Total Tax | | 18,676 | | 16,621 | | 18,859 | | 21,683 | | 22,088 | | 26,694 | | 21,779 | | 22,468 | | 21,253 | | 21,336 | |
| | | | | | | | | | | | | | | | | | | | | |
Two Income Family of Four - $60,000 | | | | | | | | | | | | | | | | | | | | | |
1. Provincial Income Tax | | 1,190 | | 1,881 | | 1,219 | | 3,514 | | 1,300 | | 3,874 | | 3,182 | | 3,534 | | 3,791 | | 3,024 | |
Net Child Benefits | | 0 | | -344 | | 0 | | — | | 0 | | -3,024 | | 0 | | 0 | | — | | 0 | |
2. Property Tax - Gross | | 2,596 | | 2,266 | | 2,910 | | 2,694 | | 3,534 | | 3,313 | | 2,655 | | 2,497 | | 2,704 | | 1,825 | |
- Net | | 2,026 | | 2,266 | | 2,910 | | 1,994 | | 3,534 | | 3,313 | | 2,655 | | 2,497 | | 2,704 | | 1,825 | |
3. Sales Tax | | 1,262 | | 10 | | 804 | | 1,063 | | 1,567 | | 2,052 | | 1,560 | | 1,855 | | 1,414 | | 1,514 | |
4. Fuel Tax | | 218 | | 135 | | 225 | | 173 | | 347 | | 413 | | 329 | | 393 | | 237 | | 381 | |
5. Net Carbon Tax | | 156 | | — | | — | | — | | — | | — | | — | | — | | — | | — | |
6. Provincial Direct Taxes | | 4,852 | | 3,949 | | 5,157 | | 6,743 | | 6,748 | | 6,628 | | 7,726 | | 8,278 | | 8,146 | | 6,744 | |
7. Health Care Premiums/Payroll Tax | | 1,536 | | — | | — | | 1,290 | | 1,170 | | 2,956 | | — | | — | | — | | 1,200 | |
8. Total Provincial Tax | | 6,388 | | 3,949 | | 5,157 | | 8,033 | | 7,918 | | 9,584 | | 7,726 | | 8,278 | | 8,146 | | 7,944 | |
9. Federal Income Tax | | 3,774 | | 3,774 | | 3,774 | | 3,774 | | 3,774 | | 3,756 | | 3,774 | | 3,774 | | 3,774 | | 3,774 | |
10. Net Federal GST | | 1,014 | | 1,109 | | 1,081 | | 962 | | 1,007 | | 981 | | 986 | | 962 | | 975 | | 957 | |
11. Total Tax | | 11,176 | | 8,832 | | 10,013 | | 12,769 | | 12,699 | | 14,322 | | 12,486 | | 13,014 | | 12,896 | | 12,676 | |
| | | | | | | | | | | | | | | | | | | | | |
Two Income Family of Four - $30,000 | | | | | | | | | | | | | | | | | | | | | |
1. Provincial Income Tax | | 0 | | 0 | | -636 | | 435 | | -448 | | -2,703 | | 202 | | 316 | | 960 | | 161 | |
Net Child Benefits | | 0 | | -1,196 | | 0 | | — | | -1,693 | | -3,394 | | -52 | | 0 | | — | | 0 | |
2. Property Tax - Gross | | 2,596 | | 2,266 | | 2,910 | | 2,694 | | 3,534 | | 3,313 | | 2,655 | | 2,497 | | 2,704 | | 1,825 | |
- Net | | 2,026 | | 2,266 | | 2,910 | | 1,994 | | 3,534 | | 3,313 | | 2,655 | | 2,497 | | 2,704 | | 1,825 | |
3. Sales Tax | | 237 | | 8 | | 608 | | 835 | | 323 | | 1,830 | | 1,210 | | 1,445 | | 1,084 | | 1,183 | |
4. Fuel Tax | | 145 | | 90 | | 150 | | 115 | | 231 | | 275 | | 219 | | 262 | | 158 | | 254 | |
5. Net Carbon Tax | | -169 | | — | | — | | — | | — | | — | | — | | — | | — | | — | |
6. Provincial Direct Taxes | | 2,239 | | 1,167 | | 3,032 | | 3,379 | | 1,947 | | -680 | | 4,234 | | 4,520 | | 4,905 | | 3,423 | |
7. Health Care Premiums/Payroll Tax | | 0 | | — | | — | | 645 | | 585 | | 1,678 | | — | | — | | — | | 600 | |
8. Total Provincial Tax | | 2,239 | | 1,167 | | 3,032 | | 4,024 | | 2,532 | | 998 | | 4,234 | | 4,520 | | 4,905 | | 4,023 | |
9. Federal Income Tax | | 203 | | 203 | | 203 | | 203 | | 203 | | 194 | | 203 | | 203 | | 203 | | 203 | |
10. Net Federal GST | | 20 | | 80 | | 35 | | -28 | | 58 | | 100 | | -18 | | -34 | | -36 | | -35 | |
11. Total Tax | | 2,462 | | 1,450 | | 3,269 | | 4,199 | | 2,793 | | 1,292 | | 4,419 | | 4,689 | | 5,072 | | 4,191 | |
| | | | | | | | | | | | | | | | | | | | | |
Unattached Individual - $25,000 | | | | | | | | | | | | | | | | | | | | | |
1. Provincial Income Tax | | 326 | | 485 | | 561 | | 757 | | 379 | | 24 | | 750 | | 957 | | 1,413 | | 1,070 | |
2. Property Tax | | — | | — | | — | | — | | — | | — | | — | | — | | — | | — | |
3. Sales Tax | | 494 | | 4 | | 341 | | 477 | | 536 | | 903 | | 710 | | 833 | | 654 | | 672 | |
4. Fuel Tax | | 145 | | 90 | | 150 | | 115 | | 231 | | 275 | | 219 | | 262 | | 158 | | 254 | |
5. Net Carbon Tax | | -65 | | — | | — | | — | | — | | — | | — | | — | | — | | — | |
6. Provincial Direct Taxes | | 899 | | 579 | | 1,053 | | 1,349 | | 1,146 | | 1,202 | | 1,679 | | 2,052 | | 2,225 | | 1,995 | |
7. Health Care Premiums/Payroll Tax | | 154 | | — | | — | | 538 | | 488 | | 1,265 | | — | | — | | — | | 500 | |
8. Total Provincial Tax | | 1,053 | | 579 | | 1,053 | | 1,887 | | 1,633 | | 2,467 | | 1,679 | | 2,052 | | 2,225 | | 2,495 | |
9. Federal Income Tax | | 1,532 | | 1,532 | | 1,532 | | 1,532 | | 1,532 | | 1,524 | | 1,532 | | 1,532 | | 1,532 | | 1,532 | |
10. Net Federal GST | | 79 | | 103 | | 84 | | 55 | | 63 | | 49 | | 61 | | 49 | | 43 | | 37 | |
11. Total Tax | | 2,663 | | 2,213 | | 2,669 | | 3,473 | | 3,228 | | 4,040 | | 3,272 | | 3,632 | | 3,800 | | 4,064 | |
Budget and Fiscal Plan – 2012/13 to 2014/15
129
Appendices
Table A3 Comparison of Provincial and Federal Taxes by Province — 2012 (continued)
Tax | | British
Columbia | | Alberta | | Saskat-
chewan | | Manitoba | | Ontario | | Quebec | | New
Brunswick | | Nova
Scotia | | Prince
Edward
Island | | New-
foundland | |
| | ( $ ) | |
Unattached Individual - $80,000 | | | | | | | | | | | | | | | | | | | | | |
1. Provincial Income Tax | | 3,964 | | 5,327 | | 6,750 | | 7,831 | | 5,319 | | 9,099 | | 6,648 | | 8,423 | | 8,110 | | 6,820 | |
2. Property Tax - Gross | | 1,776 | | 2,242 | | 3,157 | | 3,979 | | 3,426 | | 4,398 | | 2,158 | | 3,280 | | 2,492 | | 1,872 | |
- Net | | 1,206 | | 2,242 | | 3,157 | | 3,279 | | 3,426 | | 4,398 | | 2,158 | | 3,280 | | 2,492 | | 1,872 | |
3. Sales Tax | | 1,368 | | 9 | | 774 | | 1,050 | | 1,606 | | 1,913 | | 1,635 | | 1,851 | | 1,513 | | 1,557 | |
4. Fuel Tax | | 218 | | 135 | | 225 | | 173 | | 347 | | 413 | | 329 | | 393 | | 237 | | 381 | |
5. Net Carbon Tax | | 139 | | — | | — | | — | | — | | — | | — | | — | | — | | — | |
6. Provincial Direct Taxes | | 6,895 | | 7,713 | | 10,906 | | 12,333 | | 10,698 | | 15,822 | | 10,770 | | 13,947 | | 12,351 | | 10,630 | |
7. Health Care Premiums/Payroll Tax | | 768 | | — | | — | | 1,720 | | 1,560 | | 3,608 | | — | | — | | — | | 1,600 | |
8. Total Provincial Tax | | 7,663 | | 7,713 | | 10,906 | | 14,053 | | 12,258 | | 19,430 | | 10,770 | | 13,947 | | 12,351 | | 12,230 | |
9. Federal Income Tax | | 10,965 | | 10,965 | | 10,965 | | 10,965 | | 10,965 | | 10,934 | | 10,965 | | 10,965 | | 10,965 | | 10,965 | |
10. Net Federal GST | | 1,113 | | 1,159 | | 1,080 | | 982 | | 1,037 | | 918 | | 1,042 | | 978 | | 1,004 | | 992 | |
11. Total Tax | | 19,741 | | 19,837 | | 22,951 | | 26,000 | | 24,259 | | 31,282 | | 22,778 | | 25,890 | | 24,320 | | 24,188 | |
| | | | | | | | | | | | | | | | | | | | | |
Senior Couple with Equal Pension Incomes - $30,000 | | | | | | | | | | | | | | | | | | | | | |
1. Provincial Income Tax | | 0 | | 0 | | -454 | | -316 | | -1,510 | | -1,155 | | 0 | | -243 | | 13 | | 0 | |
2. Property Tax - Gross | | 2,596 | | 2,266 | | 2,910 | | 2,694 | | 3,534 | | 3,313 | | 2,655 | | 2,497 | | 2,704 | | 1,825 | |
- Net | | 1,751 | | 2,266 | | 2,910 | | 1,994 | | 3,534 | | 3,313 | | 2,655 | | 2,497 | | 2,704 | | 1,825 | |
3. Sales Tax | | 749 | | 7 | | 581 | | 869 | | 886 | | 1,609 | | 1,255 | | 1,532 | | 1,129 | | 1,293 | |
4. Fuel Tax | | 145 | | 90 | | 150 | | 115 | | 231 | | 275 | | 219 | | 262 | | 158 | | 254 | |
5. Net Carbon Tax | | -100 | | — | | — | | — | | — | | — | | — | | — | | — | | — | |
6. Provincial Direct Taxes | | 2,545 | | 2,363 | | 3,187 | | 2,662 | | 3,141 | | 4,043 | | 4,129 | | 4,048 | | 4,004 | | 3,371 | |
7. Health Care Premiums/Payroll Tax | | 0 | | — | | — | | — | | — | | 400 | | — | | — | | — | | — | |
8. Total Provincial Tax | | 2,545 | | 2,363 | | 3,187 | | 2,662 | | 3,141 | | 4,443 | | 4,129 | | 4,048 | | 4,004 | | 3,371 | |
9. Federal Income Tax | | 0 | | 0 | | 0 | | 0 | | 0 | | 0 | | 0 | | 0 | | 0 | | 0 | |
10. Net Federal GST | | 333 | | 356 | | 323 | | 334 | | 316 | | 276 | | 286 | | 285 | | 290 | | 309 | |
11. Total Tax | | 2,878 | | 2,719 | | 3,510 | | 2,996 | | 3,457 | | 4,719 | | 4,415 | | 4,333 | | 4,293 | | 3,681 | |
Personal Income Tax
· Income tax is based on basic personal credits, applicable credits and typical major deductions at each income level. Quebec residents pay federal income tax less an abatement of 16.5 per cent of basic federal tax. This abatement has been used to reduce Quebec provincial tax rather than federal tax, for comparative purposes. The family with $90,000 annual income is assumed to have one spouse earning $50,000 and the other $40,000, the two income family of four with $60,000 annual income is assumed to have one spouse earning $40,000 and the other $20,000, the family with $30,000 annual income is assumed to have each spouse earning $15,000 and each senior is assumed to receive $15,000. All representative families are assumed to have employment income except the senior couple.
Net Child Benefits
· Net child benefits are provincial measures affecting payments to families with children. Provincial child benefit measures are available in British Columbia (BC Family Bonus), Alberta (Family Employment Credit), Saskatchewan (Child Benefit), Ontario (Child Benefit), Quebec (Child Assistance Payments), New Brunswick (Child Tax Benefit), Nova Scotia (Child Benefit) and Newfoundland (Child Benefit). In addition, the Alberta government has chosen to vary the amount of the basic federal child tax benefit that its residents receive (shown as a net amount).
Property Tax
· It is assumed that the individual at $25,000 rents accommodation; the family at $30,000 and at $60,000 and the senior couple own bungalows; the single at $80,000 owns a luxury condominium; and the family at $90,000 owns a two-story executive style home, in a major city for each province. Net local and provincial property taxes are estimated as taxes owing after credits provided through the property tax system are subtracted.
Sales, Fuel and Carbon Tax Estimates
· Includes sales tax on meals, liquor and accommodation. Estimates are based on expenditure patterns from the Survey of Household Spending. In estimating individual and family taxable consumption, disposable income is reduced by 20 per cent to reflect housing (mortgage and property taxes or rent) costs. The senior couple is assumed to own their home and have no mortgage costs. For each province, disposable income is further reduced by estimated federal income taxes, estimated provincial income taxes and health care premiums if applicable. In addition, the single individual with $80,000 annual income and the family with $90,000 annual income are assumed to have savings equal to 5 per cent of their disposable income. For each family, disposable income is distributed among expenditures using the consumption pattern of a typical family with the relevant characteristics as estimated by the family expenditure survey and the relevant sales tax component is extracted. Sales tax includes provincial retail sales taxes in Saskatchewan, Manitoba and Prince Edward Island, Quebec’s value added tax, the provincial component of the HST in BC, Ontario, New Brunswick, Nova Scotia and Newfoundland, Alberta’s Tourism Levy and the federal GST. Sales tax estimates are reduced by sales tax credits where applicable.
· For Ontario, Quebec, New Brunswick, Nova Scotia and Newfoundland, the fuel tax includes the provincial tax payable on fuel based on average pump prices as of January 2012. The provincial sales tax on fuel is excluded from the sales tax in the table. Fuel tax is based on annual consumption: 1,000 litres of unleaded fuel for the single at $25,000, the family at $30,000 and the senior couple; others are assumed to consume 1,500 litres.
· Carbon tax applies in British Columbia to household consumption of gasoline, natural gas and home heating fuel. Estimated carbon tax liabilities are based on natural gas and home heating fuel consumption amounts from the Survey of Household Spending and the assumed fuel consumption noted above. Net carbon tax is estimated as carbon tax liabilities less the BC Low Income Climate Action Tax Credit where applicable. In previous years, the five per cent personal income tax cut in the first two tax bracket rates was shown as a reduction in carbon tax.
Health Care Premiums/Payroll Tax
· A health care premium is levied in British Columbia and Quebec only. Approximately 50 per cent of British Columbia premiums are paid by employers on behalf of their employees with the remainder paid by individuals, either by employees or by residents who are not employed. Payroll taxes, in the four provinces that levy them, are paid by the employer. Employer-paid payroll taxes and health care premiums are generally reflected in reduced wages.
Effective Tax Rates
· British Columbia taxes have been calculated using rates in effect for 2012. Taxes for other provinces were calculated using rates that were announced prior to February 1, 2012, and that come into effect during 2012.
Budget and Fiscal Plan – 2012/13 to 2014/15
130
Appendices
Table A4 Interprovincial Comparisons of Provincial Personal Income Taxes Payable (1) — 2012
(Rates known as of February 1, 2012)
Taxable income | | British
Columbia | | Alberta | | Saskat-
chewan | | Manitoba | | Ontario | | Quebec(2) | | New
Brunswick | | Nova
Scotia | | Prince
Edward
Island | | New-
foundland | |
| | Annual provincial taxes payable(3) ($) | |
$ | 10,000 | | 0 | | 0 | | 0 | | 0 | | 0 | | 0 | | 0 | | 0 | | 0 | | 0 | |
$ | 20,000 | | 41 | | 154 | | 426 | | 1,071 | | 475 | | 416 | | 453 | | 859 | | 1,089 | | 730 | |
$ | 30,000 | | 833 | | 1,086 | | 1,452 | | 2,107 | | 1,246 | | 1,785 | | 1,601 | | 1,753 | | 2,002 | | 1,532 | |
$ | 40,000 | | 1,400 | | 2,018 | | 2,477 | | 3,289 | | 1,907 | | 3,372 | | 2,626 | | 3,189 | | 3,236 | | 2,591 | |
$ | 50,000 | | 2,139 | | 2,958 | | 3,669 | | 4,499 | | 2,942 | | 5,047 | | 3,781 | | 4,631 | | 4,557 | | 3,795 | |
$ | 60,000 | | 2,909 | | 3,957 | | 4,969 | | 5,773 | | 3,856 | | 6,684 | | 4,990 | | 6,139 | | 5,937 | | 5,045 | |
$ | 70,000 | | 3,679 | | 4,957 | | 6,269 | | 7,188 | | 4,771 | | 8,321 | | 6,200 | | 7,806 | | 7,492 | | 6,328 | |
$ | 80,000 | | 4,616 | | 5,957 | | 7,569 | | 8,928 | | 6,058 | | 9,958 | | 7,421 | | 9,473 | | 9,162 | | 7,658 | |
$ | 100,000 | | 6,985 | | 7,957 | | 10,169 | | 12,408 | | 9,444 | | 13,885 | | 9,901 | | 12,865 | | 12,502 | | 10,318 | |
$ | 125,000 | | 10,583 | | 10,457 | | 13,515 | | 16,758 | | 13,797 | | 18,812 | | 13,017 | | 17,240 | | 17,094 | | 13,643 | |
$ | 150,000 | | 14,258 | | 12,957 | | 17,265 | | 21,108 | | 18,149 | | 23,653 | | 16,592 | | 21,615 | | 21,687 | | 16,968 | |
| | Provincial personal income taxes as a per cent of taxable income (%) | |
$ | 10,000 | | 0.0 | | 0.0 | | 0.0 | | 0.0 | | 0.0 | | 0.0 | | 0.0 | | 0.0 | | 0.0 | | 0.0 | |
$ | 20,000 | | 0.2 | | 0.8 | | 2.1 | | 5.4 | | 2.4 | | 2.1 | | 2.3 | | 4.3 | | 5.4 | | 3.6 | |
$ | 30,000 | | 2.8 | | 3.6 | | 4.8 | | 7.0 | | 4.2 | | 6.0 | | 5.3 | | 5.8 | | 6.7 | | 5.1 | |
$ | 40,000 | | 3.5 | | 5.0 | | 6.2 | | 8.2 | | 4.8 | | 8.4 | | 6.6 | | 8.0 | | 8.1 | | 6.5 | |
$ | 50,000 | | 4.3 | | 5.9 | | 7.3 | | 9.0 | | 5.9 | | 10.1 | | 7.6 | | 9.3 | | 9.1 | | 7.6 | |
$ | 60,000 | | 4.8 | | 6.6 | | 8.3 | | 9.6 | | 6.4 | | 11.1 | | 8.3 | | 10.2 | | 9.9 | | 8.4 | |
$ | 70,000 | | 5.3 | | 7.1 | | 9.0 | | 10.3 | | 6.8 | | 11.9 | | 8.9 | | 11.2 | | 10.7 | | 9.0 | |
$ | 80,000 | | 5.8 | | 7.4 | | 9.5 | | 11.2 | | 7.6 | | 12.4 | | 9.3 | | 11.8 | | 11.5 | | 9.6 | |
$ | 100,000 | | 7.0 | | 8.0 | | 10.2 | | 12.4 | | 9.4 | | 13.9 | | 9.9 | | 12.9 | | 12.5 | | 10.3 | |
$ | 125,000 | | 8.5 | | 8.4 | | 10.8 | | 13.4 | | 11.0 | | 15.0 | | 10.4 | | 13.8 | | 13.7 | | 10.9 | |
$ | 150,000 | | 9.5 | | 8.6 | | 11.5 | | 14.1 | | 12.1 | | 15.8 | | 11.1 | | 14.4 | | 14.5 | | 11.3 | |
(1) Calculated for a single individual with wage income and claiming credits for Canada Pension Plan and Quebec Pension Plan contributions, Employment Insurance premiums, Quebec Parental Insurance Plan premiums, and the basic personal amount.
(2) Quebec residents pay federal tax less an abatement of 16.5 per cent of federal tax. In the table, the Quebec abatement has been used to reduce Quebec provincial personal income tax for comparative purposes.
(3) Includes provincial low income reductions (all provinces except Alberta and Saskatchewan), surtaxes payable in Ontario, Nova Scotia and Prince Edward Island, and the Ontario Health Premium tax. Excludes sales and property tax credits.
Budget and Fiscal Plan – 2012/13 to 2014/15
131
Appendices
Table A5 Material Assumptions — Revenue (1)
| | Updated | | Budget | | | | | | |
Revenue Source and Assumptions | | Forecast | | Estimate | | Plan | | Plan | | |
($ millions unless otherwise specified) | | 2011/12 | | 2012/13 | | 2013/14 | | 2014/15 | | Sensitivities 2012/13 |
Personal income tax | | $6,370 | | $6,630 | | $7,137 | | $7,529 | | |
Current calendar year assumptions | | | | | | | | | | |
Personal income growth | | 3.7% | | 3.7% | | 3.8% | | 4.0% | | +/- 1% change in 2012 BC |
Labour income growth | | 4.8% | | 3.6% | | 4.1% | | 4.2% | | personal income growth |
Tax base growth | | 3.0% | | 3.7% | | 4.4% | | 4.9% | | equals +/- $50 to $100 million |
Average tax yield | | 4.84% | | 4.88% | | 5.06% | | 5.10% | | |
Current-year tax | | $6,005 | | $6,273 | | $6,745 | | $7,179 | | +/- 1% change in 2011 BC |
BC Tax Reduction | | -$109 | | -$111 | | -$113 | | -$115 | | personal or taxable income |
Non-Refundable BC tax credits | | -$43 | | -$47 | | -$47 | | -$47 | | growth equals +/- $50 to $100 |
Policy neutral elasticity * | | 1.0 | | 1.2 | | 1.4 | | 1.4 | | million one-time effect |
Fiscal year assumptions | | | | | | | | | | (prior-year adjustment) |
Prior-year adjustment | | $64 | | | | | | | | and could result in an |
| | | | | | | | | | additional +/-$55 to $75 million |
| | | | | | | | | | base change in 2012/13 |
| | 2010 Assumptions | | | | | | |
2010 Tax-year | | | | | | | | | | |
Personal income growth | | 4.0% | | | | | | | | |
Tax base growth | | 2.2% | | | | | | | | |
Average 2010 tax yield | | 4.81% | | | | | | | | |
2010 tax | | $ | 5,787 | | | | | | | | |
BC Tax Reduction | | -$107 | | | | | | | | |
Non-Refundable BC tax credits | | -$44 | | | | | | | | |
Policy neutral elasticity * | | 0.7 | | | | | | | | |
| | | | | | | | | | | |
* Ratio of annual per cent change in current-year revenue to annual per cent change in personal income (calendar year).
Corporate income tax | | $2,015 | | $2,266 | | $2,042 | | $2,206 | | |
Components of revenue (fiscal year) | | | | | | | | | | |
Advance instalments | | $1,883 | | $2,305 | | $2,184 | | $2,335 | | |
International Business Activity Act refunds | | -$25 | | -$20 | | -$20 | | -$15 | | |
Prior-year adjustment | | $157 | | -$19 | | -$122 | | -$114 | | |
Current calendar year assumptions | | | | | | | | | | |
National tax base ($ billions) | | $228.7 | | $245.9 | | $262.9 | | $277.1 | | +/- 1% change in the 2012 |
BC instalment share of national tax base | | 11.6% | | 11.8% | | 11.5% | | 11.1% | | national tax base equals |
Effective tax rates (general/small business) | | 10.0 / 2.5 | | 10.0 / 2.5 | | 10.0 / 2.5 | | 10.75 / 2.5 | | +/- $20 to $30 million |
BC tax base growth (post federal measures) | | 10.7% | | 4.8% | | 4.4% | | 6.4% | | |
BC corporate profits growth | | 10.5% | | 3.5% | | 4.5% | | 6.5% | | +/- 1% change in the 2011 |
Non-Refundable BC tax credits | | -$76 | | -$76 | | -$80 | | -$85 | | BC tax base equals +/- $20 |
| | | | | | | | | | to $30 million in 2012/13 |
| | 2010 Assumptions | | | | | | |
2010 Tax-year | | | | | | | | | | |
BC tax base growth | | 6.3% | | | | | | | | |
BC corporate profits growth | | 21.5% | | | | | | | | |
Gross 2010 tax | | $1,840 | | | | | | | | |
Prior-year adjustments | | $157 | | | | | | | | |
Prior years losses/gains (included in above) | | $16 | | | | | | | | |
Non-Refundable BC tax credits | | -$69 | | | | | | | | |
Revenue is recorded on a cash basis. Due to lags in the federal collection and instalment systems, changes to the BC corporate profits and tax base forecasts affect revenue in the succeeding year. The 2012/13 instalments from the federal government reflect 9 months of payments related to the 2012 tax year (Apr/12-Dec/12) and one-third of 2013 payments, assuming the proposed timing change in payments is incorporated in the Tax Collection Agreement. Instalments for the 2012 (2013) tax year are based on BC’s share of the national tax base for the 2010 (2011) tax year and a forecast of the 2012 (2013) national tax base. BC’s share of the 2010 national tax base was 11.8%, based on tax assessments as of December 31, 2011. Cash adjustments for any under/over payments from the federal government in respect of 2011 will be received/paid on March 28, 2013.
Budget and Fiscal Plan – 2012/13 to 2014/15
132
Appendices
Table A5 Material Assumptions — Revenue (1) (continued)
| | Updated | | Budget | | | | | | |
Revenue Source and Assumptions | | Forecast | | Estimate | | Plan | | Plan | | |
($ millions unless otherwise specified) | | 2011/12 | | 2012/13 | | 2013/14 | | 2014/15 | | Sensitivities 2012/13 |
Harmonized sales tax | | $ | 5,811 | | $ | 6,003 | | $ | 0 | | $ | 0 | | |
Calendar Year | | | | | | | | | | +/- 1% change in consumer |
Nominal consumer expenditure | | 3.6 | % | 4.3 | % | | | | | expenditure growth equals up to |
Nominal residential investment | | 4.9 | % | 2.8 | % | | | | | +/- $35 million |
Above two bases represent about 84% of the total base | | | | | | | | | | +/- 1% change in residential |
HST Rebates (% rebate of the provincial portion of the HST paid) | | | | | | | | | | construction growth equals up to |
Municipalities | | 75 | % | 75 | % | | | | | +/- $15 million |
Charities and non-profit organizations | | 57 | % | 57 | % | | | | | |
New housing (up to $26,250) | | 71.43 | % | 71.43 | % | | | | | |
School authorities | | 87 | % | 87 | % | | | | | |
Universities and public colleges | | 75 | % | 75 | % | | | | | |
Hospital authorities | | 58 | % | 58 | % | | | | | |
Components of revenue | | | | | | | | | | |
Gross | | $ | 7,233 | | $ | 7,527 | | | | | | |
Input tax credit denial (temporary) | | $ | 139 | | $ | 145 | | | | | | |
Rebates: | | | | | | | | | | |
· Point of sale | | $ | (357 | ) | $ | (372 | ) | | | | | |
· Municipalities, charities & non profit organizations | | $ | (308 | ) | $ | (315 | ) | | | | | |
· SUCH sector | | $ | (213 | ) | $ | (218 | ) | | | | | |
· New housing | | $ | (476 | ) | $ | (552 | ) | | | | | |
· Residential energy use | | $ | (207 | ) | $ | (212 | ) | | | | | |
Other sales taxes | | $ | 141 | | $ | 98 | | $ | 5,918 | | $ | 6,112 | | |
Social service tax base growth (fiscal year) | | | | | | 3.9 | % | 4.1 | % | |
Components of Provincial sales tax revenue | | | | | | | | | | |
Consolidated Revenue Fund | | $ | 45 | | $ | 0 | | $ | 5,805 | | $ | 5,997 | | |
BC Transportation Financing Authority | | $ | 0 | | $ | 0 | | $ | 14 | | $ | 14 | | |
Tax on designated property (12% rate) | | $ | 96 | | $ | 98 | | $ | 99 | | $ | 101 | | |
Fuel and carbon taxes | | $ | 1,899 | | $ | 2,109 | | $ | 2,187 | | $ | 2,216 | | |
Carbon tax | | $ | 960 | | $ | 1,172 | | $ | 1,241 | | $ | 1,261 | | |
Calendar Year | | | | | | | | | | |
Real GDP | | 2.0 | % | 1.8 | % | 2.2 | % | 2.5 | % | |
Gasoline volumes | | -2.4 | % | 0.0 | % | 0.0 | % | 0.0 | % | |
Diesel volumes | | 4.6 | % | 2.0 | % | 2.0 | % | 2.0 | % | |
Natural gas volumes | | 4.7 | % | 2.0 | % | 2.0 | % | 2.0 | % | |
Carbon tax rates (July 1) | | | | | | | | | | |
Carbon dioxide equivalent emissions ($/tonne) | | $ | 25 | | $ | 30 | | $ | 30 | | $ | 30 | | |
Natural gas (cents/gigajoule) | | 124.15 | ¢ | 148.98 | ¢ | 148.98 | ¢ | 148.98 | ¢ | |
Gasoline (cents/litre) | | 5.56 | ¢ | 6.67 | ¢ | 6.67 | ¢ | 6.67 | ¢ | |
Light fuel oil (cents/litre) | | 6.39 | ¢ | 7.67 | ¢ | 7.67 | ¢ | 7.67 | ¢ | |
Fuel tax | | $ | 939 | | $ | 937 | | $ | 946 | | $ | 955 | | |
Carbon tax revenue | | $ | 960 | | $ | 1,172 | | $ | 1,241 | | $ | 1,261 | | |
Carbon tax rates change on July 1 | | | | | | | | | | |
Components of fuel tax revenue | | | | | | | | | | |
Consolidated Revenue Fund | | $ | 496 | | $ | 491 | | $ | 495 | | $ | 501 | | |
BC Transit | | $ | 11 | | $ | 11 | | $ | 12 | | $ | 12 | | |
BC Transportation Financing Authority | | $ | 432 | | $ | 435 | | $ | 439 | | $ | 442 | | |
| | $ | 939 | | $ | 937 | | $ | 946 | | $ | 955 | | |
Budget and Fiscal Plan – 2012/13 to 2014/15
133
Appendices
Table A5 Material Assumptions — Revenue (1) (continued)
| | Updated | | Budget | | | | | | |
Revenue Source and Assumptions | | Forecast | | Estimate | | Plan | | Plan | | |
($ millions unless otherwise specified) | | 2011/12 | | 2012/13 | | 2013/14 | | 2014/15 | | Sensitivities 2012/13 |
Property taxes | | $ | 1,925 | | $ | 2,013 | | $ | 2,094 | | $ | 2,178 | | |
Calendar Year | | | | | | | | | | |
BC Consumer Price Index | | 2.5 | % | 1.9 | % | 1.5 | % | 1.9 | % | +/- 1% change in new |
Housing starts | | 26,400 | | 24,978 | | 26,037 | | 26,741 | | construction and inflation |
Home owner grants (fiscal year) | | $ | -780 | | $ | -799 | | $ | -819 | | $ | -840 | | equals up to +/- $5 million |
| | | | | | | | | | in residential property |
Components of revenue | | | | | | | | | | taxation revenue |
Residential (net of home owner grants) | | $ | 671 | | $ | 704 | | $ | 735 | | $ | 764 | | |
Non-residential | | $ | 992 | | $ | 1,030 | | $ | 1,067 | | $ | 1,098 | | +/- 1% change in new |
Rural area | | $ | 90 | | $ | 92 | | $ | 93 | | $ | 96 | | construction and inflation |
Police | | $ | 28 | | $ | 30 | | $ | 31 | | $ | 32 | | equals up to +/- $5 million |
BC Assessment Authority | | $ | 77 | | $ | 79 | | $ | 82 | | $ | 84 | | in non-residential property |
BC Transit | | $ | 67 | | $ | 78 | | $ | 86 | | $ | 104 | | taxation revenue |
Other taxes | | $ | 1,994 | | $ | 1,969 | | $ | 2,089 | | $ | 2,113 | | |
Calendar Year | | | | | | | | | | |
Population | | 1.0 | % | 1.1 | % | 1.3 | % | 1.3 | % | |
BC Consumer Price Index | | 2.5 | % | 1.9 | % | 1.5 | % | 1.9 | % | |
BC housing starts | | -0.3 | % | -5.4 | % | 4.2 | % | 2.7 | % | |
Real GDP | | 2.0 | % | 1.8 | % | 2.2 | % | 2.5 | % | |
Nominal GDP | | 4.3 | % | 3.7 | % | 4.1 | % | 4.4 | % | |
Components of revenue | | | | | | | | | | |
Property transfer | | $ | 935 | | $ | 893 | | $ | 928 | | $ | 952 | | |
Tobacco | | $ | 652 | | $ | 652 | | $ | 727 | | $ | 727 | | |
Corporation capital | | ($6 | ) | $ | 0 | | $ | 0 | | $ | 0 | | |
Insurance premium | | $ | 413 | | $ | 424 | | $ | 434 | | $ | 434 | | |
Energy, sales of Crown land tenures, metals, minerals and other | | $ | 1,992 | | $ | 1,973 | | $ | 2,257 | | $ | 2,426 | | |
Natural gas price | | | | | | | | | | +/- $1.00 change in the |
Plant inlet, $Cdn/gigajoule | | $ | 2.32 | | $ | 2.52 | | $ | 3.04 | | $ | 3.56 | | natural gas price equals |
Sumas, $US/ MMBtu | | $ | 3.77 | | $ | 3.88 | | $ | 4.55 | | $ | 5.05 | | +/- $350 to $390 million. |
Natural gas production volumes (petajoules) | | 1,461 | | 1,648 | | 1,830 | | 2,025 | | Sensitivities can vary |
Annual per cent change | | 19.3 | % | 12.8 | % | 11.0 | % | 10.7 | % | significantly especially at |
| | | | | | | | | | lower prices. |
Oil price ($US/bbl at Cushing, Ok) | | $ | 95.40 | | $ | 97.07 | | $ | 98.64 | | $ | 100.48 | | +/- 1% change in natural gas |
| | | | | | | | | | volumes equals +/- $3 million |
Auctioned land base (000 hectares) | | 221 | | 245 | | 269 | | 341 | | |
Average bid price/hectare ($) | | $ | 1,167 | | $ | 1,200 | | $ | 1,200 | | $ | 1,000 | | +/- 1 cent change in the |
Cash sales of Crown land tenures | | $ | 258 | | $ | 294 | | $ | 323 | | $ | 341 | | exchange rate equals |
Metallurgical coal price ($US/tonne, fob west coast) | | $ | 257 | | $ | 218 | | $ | 219 | | $ | 212 | | +/- $4 million on |
Copper price ($US/lb) | | $ | 3.78 | | $ | 3.68 | | $ | 3.74 | | $ | 3.31 | | natural gas royalties |
Annual electricity volumes set by treaty | | 4.5 | | 4.3 | | 4.3 | | 4.1 | | |
(million mega-watt hours) | | | | | | | | | | |
Mid-Columbia electricity price | | $ | 30 | | $ | 32 | | $ | 37 | | $ | 41 | | +/- 10% change in the average |
($US/mega-watt hour) | | | | | | | | | | Mid-Columbia electricity price |
Exchange rate (US¢/ Cdn$, calendar year) | | 101.1 | | 96.6 | | 100.5 | | 99.6 | | equals +/- $12 million |
| | | | | | | | | | |
Components of revenue | | | | | | | | | | |
Natural gas royalties | | $ | 367 | | $ | 398 | | $ | 652 | | $ | 846 | | |
Bonus bids, fees and rentals | | $ | 919 | | $ | 882 | | $ | 887 | | $ | 863 | | Based on a recommendation |
Petroleum royalties | | $ | 103 | | $ | 105 | | $ | 105 | | $ | 102 | | from the Auditor General to be |
Columbia River Treaty electricity sales | | $ | 120 | | $ | 125 | | $ | 140 | | $ | 150 | | consistent with generally |
Coal | | $ | 379 | | $ | 341 | | $ | 338 | | $ | 326 | | accepted accounting principles, |
Minerals, metals and other | | $ | 60 | | $ | 74 | | $ | 87 | | $ | 88 | | bonus bid revenue recognition |
Oil and Gas Commission fees and levies | | $ | 44 | | $ | 48 | | $ | 48 | | $ | 51 | | reflects nine-year deferral of |
| | | | | | | | | | | | | | |
Royalty programs and infrastructure credits | | | | | | | | | | cash receipts from the sale of |
Summer drilling | | $ | -20 | | $ | -25 | | $ | -27 | | $ | -31 | | Crown land tenures |
Deep drilling | | $ | -146 | | $ | -122 | | $ | -178 | | $ | -248 | | |
Road and pipeline infrastructure | | $ | -66 | | $ | -188 | | $ | -115 | | $ | -98 | | |
Total | | $ | -232 | | $ | -335 | | $ | -320 | | $ | -377 | | |
Implicit average natural gas royalty rate | | 10.8 | % | 9.5 | % | 11.7 | % | 11.7 | % | |
| | | | | | | | | | | | | | | | | | |
Royalty program (marginal, low productivity and ultra marginal drilling) adjustments reflect reduced royalty rates.
Natural gas royalties incorporate royalty programs and Treasury Board approved infrastructure credits.
Budget and Fiscal Plan – 2012/13 to 2014/15
134
Appendices
Table A5 Material Assumptions — Revenue (1) (continued)
| | Updated | | Budget | | | | | | |
Revenue Source and Assumptions | | Forecast | | Estimate | | Plan | | Plan | | |
($ millions unless otherwise specified) | | 2011/12 | | 2012/13 | | 2013/14 | | 2014/15 | | Sensitivities 2012/13 |
Forests | | $ | 457 | | $ | 533 | | $ | 557 | | $ | 606 | | |
Prices (calendar year average) | | | | | | | | | | +/- US$50 change in SPF |
SPF 2x4 ($US/1000 bd ft) | | $ | 255 | | $ | 260 | | $ | 288 | | $ | 300 | | price equals +/- $25 to |
Random Lengths Composite | | | | | | | | | | $50 million |
($US/thousand board feet) | | $ | 272 | | $ | 295 | | $ | 323 | | $ | 335 | | |
Pulp ($US/tonne) | | $ | 961 | | $ | 838 | | $ | 800 | | $ | 800 | | +/- US$50 change in pulp price |
Coastal log ($Cdn/cubic metre) | | | | | | | | | | equals +/-$5 to $10 million |
(Vancouver Log Market, fiscal year) | | $ | 74 | | $ | 73 | | $ | 78 | | $ | 79 | | +/- Cdn$10 change in average |
| | | | | | | | | | log price equals +/-$10 to |
Fiscal Year Trade Assumptions | | | | | | | | | | $20 million |
Export tax rate (effective rate) | | 15.0 | % | 11.3 | % | 6.3 | % | 5.0 | % | |
Lumber shipments and consumption (billion board feet) | | | | | | | | | | +/- 1 cent change in |
U.S. lumber consumption | | 33.1 | | 33.1 | | 32.7 | | 35.2 | | exchange rate equals |
BC surge trigger volumes | | 7.0 | | 7.0 | | 6.9 | | 7.5 | | +/- $5 to $10 million on |
BC lumber exports to US | | 4.6 | | 5.1 | | 6.2 | | 7.4 | | stumpage revenue |
| | | | | | | | | | +/- 10% change in Interior |
Crown harvest volumes (million cubic metres) | | | | | | | | | | harvest volumes equals |
Interior | | 50.3 | | 50.8 | | 50.8 | | 51.8 | | +/- $10 to $15 million |
Coast | | 13.7 | | 14.2 | | 14.2 | | 14.2 | | +/- 10% change in Coastal |
Total | | 64.0 | | 65.0 | | 65.0 | | 66.0 | | harvest volumes equals |
BC Timber Sales (included in above) | | 10.8 | | 11.8 | | 11.8 | | 11.9 | | +/- $3 to $6 million |
| | | | | | | | | | |
Components of revenue | | | | | | | | | | The above sensitivities relate |
Tenures | | $ | 113 | | $ | 186 | | $ | 236 | | $ | 283 | | to stumpage revenue only. |
BC Timber Sales | | $ | 153 | | $ | 178 | | $ | 187 | | $ | 191 | | Depending on market |
Federal border tax (SLA 2006) | | $ | 140 | | $ | 128 | | $ | 88 | | $ | 86 | | conditions, changes in |
Logging tax | | $ | 12 | | $ | 15 | | $ | 20 | | $ | 20 | | stumpage revenues may be |
Other CRF revenue | | $ | 18 | | $ | 16 | | $ | 16 | | $ | 16 | | offset by changes in border |
Recoveries | | $ | 21 | | $ | 10 | | $ | 10 | | $ | 10 | | tax revenues. |
Other natural resources | | $ | 423 | | $ | 480 | | $ | 497 | | $ | 508 | | |
Components of revenue | | | | | | | | | | |
Water rental and licences* | | $ | 364 | | $ | 411 | | $ | 427 | | $ | 440 | | |
Recoveries | | $ | 37 | | $ | 49 | | $ | 50 | | $ | 48 | | |
Angling and hunting permits and licences | | $ | 13 | | $ | 13 | | $ | 13 | | $ | 13 | | |
Recoveries | | $ | 9 | | $ | 7 | | $ | 7 | | $ | 7 | | |
* BC Hydro rate increases are indexed to Consumer Price Index.
Other revenue | | $ | 8,540 | | $ | 9,053 | | $ | 9,410 | | $ | 9,457 | | |
Components of revenue | | | | | | | | | | |
Fees and licences | | | | | | | | | | |
Consolidated Revenue Fund | | $ | 2,686 | | $ | 2,811 | | $ | 2,918 | | $ | 3,019 | | |
Recoveries | | $ | 174 | | $ | 223 | | $ | 174 | | $ | 179 | | |
Crown corporations and agencies | | $ | 103 | | $ | 105 | | $ | 106 | | $ | 108 | | |
Other service delivery agencies | | $ | 1,755 | | $ | 1,784 | | $ | 1,827 | | $ | 1,858 | | |
Investment earnings | | | | | | | | | | |
Consolidated Revenue Fund | | $ | 60 | | $ | 65 | | $ | 72 | | $ | 80 | | |
Fiscal agency loans & sinking funds earnings | | $ | 802 | | $ | 854 | | $ | 901 | | $ | 1,015 | | |
Crown corporations and agencies | | $ | 31 | | $ | 36 | | $ | 39 | | $ | 46 | | |
Other service delivery agencies | | $ | 84 | | $ | 128 | | $ | 133 | | $ | 133 | | |
Sales of goods and services | | $ | 882 | | $ | 889 | | $ | 914 | | $ | 928 | | |
Miscellaneous | | | | | | | | | | |
Consolidated Revenue Fund | | $ | 207 | | $ | 203 | | $ | 207 | | $ | 213 | | |
Recoveries | | $ | 562 | | $ | 501 | | $ | 487 | | $ | 474 | | |
Crown corporations and agencies | | $ | 128 | | $ | 371 | | $ | 60 | | $ | 63 | | |
Other service delivery agencies | | $ | 1,066 | | $ | 1,083 | | $ | 1,097 | | $ | 1,110 | | |
Asset Sales | | $ | 0 | | $ | 0 | | $ | 475 | | $ | 231 | | |
Budget and Fiscal Plan – 2012/13 to 2014/15
135
Appendices
Table A5 Material Assumptions — Revenue (1) (continued)
| | Updated | | Budget | | | | | | |
Revenue Source and Assumptions | | Forecast | | Estimate | | Plan | | Plan | | |
($ millions unless otherwise specified) | | 2011/12 | | 2012/13 | | 2013/14 | | 2014/15 | | Sensitivities 2012/13 |
Health and social transfers | | $ | 5,373 | | $ | 5,682 | | $ | 6,008 | | $ | 5,987 | | |
National Cash Transfers | | | | | | | | | | |
Canada Health Transfer (CHT) | | $ | 26,952 | | $ | 28,569 | | $ | 30,283 | | $ | 32,100 | | |
Wait Times Reduction Transfer (WTRT) | | $ | 250 | | $ | 250 | | $ | 250 | | — | | +/- 0.1% change in BC’s |
Canada Social Transfer (CST) | | $ | 11,514 | | $ | 11,859 | | $ | 12,215 | | $ | 12,582 | | population share equals |
BC share of national population (June 1) | | 13.27 | % | 13.28 | % | 13.32 | % | 13.36 | % | +/- $50 to $55 million |
BC health and social transfers revenue | | | | | | | | | | |
CHT | | $ | 3,807 | | $ | 4,051 | | $ | 4,326 | | $ | 4,289 | | |
WTRT | | $ | 33 | | $ | 33 | | $ | 33 | | — | | |
CST | | $ | 1,527 | | $ | 1,575 | | $ | 1,627 | | $ | 1,681 | | |
Prior-year adjustments | | $ | (17 | ) | | | | | | | |
Health deferral | | | | | | | | | | |
Diagnostic and Medical Equipment | | $ | 16 | | $ | 16 | | $ | 15 | | $ | 10 | | |
Medical Equipment Trust | | $ | 7 | | $ | 7 | | $ | 7 | | $ | 7 | | |
Other federal contributions | | $ | 2,292 | | $ | 1,575 | | $ | 1,556 | | $ | 1,511 | | |
Components of revenue | | | | | | | | | | |
HST Transitional Funding | | $ | 580 | | — | | — | | — | | |
Other Consolidated Revenue Fund | | $ | 233 | | $ | 150 | | $ | 138 | | $ | 135 | | |
Labour Market Development Agreement | | $ | 284 | | $ | 285 | | $ | 285 | | $ | 285 | | |
Local Government Services and Transfers | | $ | 6 | | $ | 33 | | $ | 25 | | — | | |
Canada-BC Co-operation on Immigration | | $ | 99 | | $ | 120 | | $ | 122 | | $ | 122 | | |
Labour Market Agreement | | $ | 66 | | $ | 66 | | $ | 66 | | $ | 66 | | |
Other recoveries | | $ | 264 | | $ | 199 | | $ | 188 | | $ | 186 | | |
Crown corporations and agencies | | $ | 254 | | $ | 213 | | $ | 218 | | $ | 197 | | |
Other service delivery agencies | | $ | 506 | | $ | 509 | | $ | 514 | | $ | 520 | | |
Service delivery agency direct revenue | | $ | 5,440 | | $ | 5,769 | | $ | 5,794 | | $ | 5,670 | | |
School districts | | $ | 488 | | $ | 481 | | $ | 482 | | $ | 481 | | |
Post-secondary institutions | | $ | 2,766 | | $ | 2,873 | | $ | 2,947 | | $ | 3,001 | | |
Health authorities and hospital societies | | $ | 809 | | $ | 801 | | $ | 804 | | $ | 811 | | |
BC Transportation Financing Authority | | $ | 493 | | $ | 465 | | $ | 681 | | $ | 500 | | |
Other service delivery agencies | | $ | 884 | | $ | 1,149 | | $ | 880 | | $ | 877 | | |
Commercial Crown corporation net income | | $ | 2,713 | | $ | 2,717 | | $ | 2,851 | | $ | 2,862 | | |
BC Hydro | | $ | 595 | | $ | 566 | | $ | 599 | | $ | 576 | | |
reservoir water inflows | | 100 | % | 100 | % | 100 | % | 100 | % | +/-1% in hydro generation |
| | | | | | | | | | = +/-$10 million |
mean gas price | | 4.30 | | 4.77 | | 5.17 | | 5.54 | | +/-10% = -/+$5 million |
(Sumas, $US/MMbtu — BC Hydro forecast based on NYMEX forward selling prices) | | | | | | | | | | |
electricity prices | | 28.69 | | 36.67 | | 41.01 | | 44.88 | | +/-$1/MWh in electricity trade |
(Mid-C, $US/MWh) | | | | | | | | | | margins = +/-$35 million |
allowed return on deemed equity | | 14.38 | % | 12.75 | % | 12.75 | % | 11.84% | | +/-1% = +/-$44 to 49 million |
ICBC | | $ | 140 | | $ | 146 | | $ | 230 | | $ | 229 | | |
vehicle growth | | +1.3 | % | +1.3 | % | +1.5 | % | +1.9 | % | +/-1% = +/-$37 to $40 million |
current claims cost percentage change | | +4.6 | % | +1.4 | % | +3.6 | % | +2.5 | % | +/-1% = -/+$29 to $31 million |
investment return | | 3.8 | % | 3.4 | % | 3.6 | % | 3.7 | % | +/-1% return = +/-$115 |
| | | | | | | | | | to $122 million |
loss ratio | | 86.8 | % | 86.4 | % | 85.8 | % | 85.9 | % | |
| | | | | | | | | | | | | | | |
(1) Revenue is based on information available as of January 30, 2012.
Budget and Fiscal Plan – 2012/13 to 2014/15
136
Appendices
Table A6 Natural Gas Price Forecasts — 2012/13 to 2014/15
| | | | | | | | Adjusted to fiscal years and | |
Private sector forecasts (calendar year) | | $C/gigajoule at plant inlet | |
| | 2012 | | 2013 | | 2014 | | 2012/13 | | 2013/14 | | 2014/15 | |
GLJ Henry Hub US$/MMBtu (Jan 1, 12) | | 3.80 | | 4.50 | | 5.00 | | 2.72 | | 3.02 | | 3.55 | |
Sproule Henry Hub US$/MMBtu (Dec 31, 11) | | 3.55 | | 4.18 | | 4.54 | | 2.26 | | 2.68 | | 3.36 | |
McDaniel Henry Hub US$/MMBtu (Jan 1, 12) | | 3.75 | | 4.50 | | 5.05 | | 2.49 | | 3.04 | | 3.58 | |
AJM Henry Hub US$/Mcf (Dec 31, 11) | | 3.80 | | 4.50 | | 5.00 | | 2.39 | | 2.87 | | 3.36 | |
GLJ Alberta AECO-C Spot CDN$/MMBtu (Jan 1, 12) | | 3.49 | | 4.13 | | 4.59 | | 2.90 | | 3.28 | | 3.72 | |
Sproule Alberta AECO-C Spot CDN$/MMBtu (Dec 31, 11) | | 3.16 | | 3.78 | | 4.13 | | 2.40 | | 2.92 | | 3.53 | |
McDaniel AECO-C Spot C$/MMBtu (Jan 1, 12) | | 3.50 | | 4.20 | | 4.70 | | 2.75 | | 3.36 | | 3.80 | |
AJM AECO-C Spot C$/Mcf (Dec 31, 11) | | 3.50 | | 4.10 | | 4.70 | | 2.60 | | 3.15 | | 3.66 | |
GLJ Sumas Spot US$/MMBtu (Jan 1, 12) | | 3.50 | | 4.20 | | 4.70 | | 2.52 | | 2.84 | | 3.36 | |
Sproule Sumas Spot CDN$/MMBtu (Dec 31, 11) | | 3.65 | | 4.27 | | 4.62 | | 2.37 | | 2.88 | | 3.50 | |
GLJ BC Spot Plant Gate CDN$/MMBtu (Jan 1, 12) | | 3.14 | | 3.78 | | 4.23 | | 2.60 | | 2.99 | | 3.42 | |
Sproule BC Plant Inlet CDN$/MMBtu (Dec 31, 11) | | 2.48 | | 3.10 | | 3.45 | | 2.52 | | 3.03 | | 3.65 | |
McDaniel BC Spot Plant Gate C$MMBtu (Jan 1, 12) | | 3.20 | | 3.90 | | 4.40 | | 2.51 | | 3.12 | | 3.57 | |
AJM BC Spot Plant Gate C$/Mcf (Dec 31, 11) | | 3.20 | | 3.80 | | 4.40 | | 2.37 | | 2.92 | | 3.43 | |
GLJ Midwest Chicago US$/MMBtu (Jan 1, 12) | | 3.90 | | 4.60 | | 5.10 | | 2.47 | | 2.77 | | 3.30 | |
Sproule Alliance Plant Gate CDN$/MMBtu (Dec 31, 11) | | 2.11 | | 2.83 | | 3.23 | | 1.43 | | 2.03 | | 2.68 | |
EIA Henry Hub US$/MMBtu (Dec 6, 2011) | | 3.70 | | n/a | | n/a | | n/a | | n/a | | n/a | |
TD Economics Henry Hub FuturesUS$/MMBtu (Dec 16, 11) | | 4.00 | | 4.50 | | n/a | | 2.66 | | n/a | | n/a | |
Scotiabank Group Henry Hub US$/MMBtu (Jan 2, 12) | | 3.50 | | 4.25 | | n/a | | 2.25 | | n/a | | n/a | |
BMO Alberta Empress US$/MMBtu (Dec 23, 11) | | 3.15 | | 3.60 | | n/a | | 1.82 | | n/a | | n/a | |
RBC Financial Henry Hub US$/Mcf (Oct 7, 11) | | 5.00 | | n/a | | n/a | | n/a | | n/a | | n/a | |
CIBC World Marktes Inc. Henry Hub US$/MMBtu (Oct 21, 11) | | 4.50 | | n/a | | n/a | | n/a | | n/a | | n/a | |
InSite Petroleum Consultants Ltd Henry Hub US$/MMBtu (Sep 30, 11) | | 4.75 | | 5.50 | | 6.15 | | 4.11 | | 4.66 | | 5.28 | |
Fekete AECO-C Spot CDN$/MMBtu (Oct 11, 11) | | 4.20 | | 4.60 | | 5.10 | | 3.33 | | 3.74 | | 4.22 | |
NYMEX Forward Market converted to Plant Inlet CDN$/GJ (Jan 6, 12) | | | | | | | | 2.05 | | 2.50 | | 2.89 | |
Average all minus high/low | | | | | | | | 2.52 | | 3.04 | | 3.56 | |
Average one forecast per consultant minus high/low | | | | | | | | 2.51 | | 3.16 | | 3.66 | |
Natural gas royalty price forecast | | | | | | | | 2.52 | | 3.04 | | 3.56 | |
GLJ: Gilbert Laustsen Jung Petroleum Consultants Ltd
AJM: Ashton Jenkins Mann Petroleum Consultants
US EIA: US Energy Information Administration
McDaniel: McDaniel & Associates Consultants Ltd
AECO: Alberta Energy Company
Natural Gas Prices | |
| |
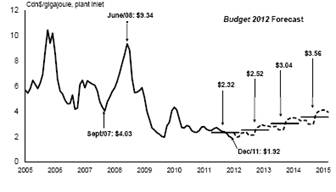
| |
· High storage levels in 2011 have reduced the private sector natural gas price outlook.
Budget and Fiscal Plan – 2012/13 to 2014/15
137
Appendices
Table A7 Material Assumptions — Expense
| | Updated | | Budget | | | | | | | |
Ministry Programs and Assumptions | | Forecast | | Estimate | | Plan | | Plan | | | |
($ millions unless otherwise specified) | | 2011/12 | | 2012/13 | | 2013/14 | | 2014/15 | | Sensitivities 2012/13 | |
Advanced Education | | 1,963 | | 1,972 | | 1,952 | | 1,922 | | The number of student spaces may vary depending on the financial and other policies of post-secondary institutions. | |
Student spaces in public institutions (# FTEs) | | 206,320 | | 201,307 | | 201,467 | | 201,605 | |
|
Children and Family Development | | 1,331 | | 1,333 | | 1,333 | | 1,333 | | Caseload is expected to decline. The child population (age 0 to 18) is projected to start increasing in 2013, potentially decelerating the downward trend. A 1% increase in the cost per case or a 1% increase in the average caseload will affect expenditures by approximately $2.8 million. | |
Average children-in-care caseload (#) | | 8,215 | | 8,070 | | 7,905 | | 7,905 | |
Average annual residential cost per child in care ($) | | 34,500 | | 35,200 | | 35,900 | | 35,900 | |
Education | | 5,242 | | 5,315 | | 5,321 | | 5,342 | | Enrolment figures are based on BC Stats enrolment trends, to which the Ministry has added forecasts for distributed learning, adult education, and summer learning. | |
Enrolment (# of FTEs) | | 558,696 | | 556,660 | | 557,004 | | 558,168 | |
School age (K—12) | | 531,864 | | 530,220 | | 530,564 | | 531,728 | |
Distributed Learning (online) | | 12,721 | | 12,329 | | 12,329 | | 12,329 | |
Summer | | 6,117 | | 6,117 | | 6,117 | | 6,117 | |
Adults | | 7,994 | | 7,994 | | 7,994 | | 7,994 | |
Forests, Lands and Natural Resource Operations | | 590 | | 602 | | 555 | | 592 | | Targets can be impacted by changes to actual inventory costs incurred. There is a lag of approximately 2 years between when inventory costs are incurred and when they are expensed. Volume harvested can also impact targets. For example, if volume harvested is less than projected in any year then capitalized expenses will also be reduced in that year. | |
BC Timber Sales | | 157 | | 160 | | 157 | | 164 | |
|
|
|
Direct Fire Fighting | | 54 | | 63 | | 63 | | 63 | | Over the past several years, Direct fire fighting costs have ranged from a low of $19 million in 1997 to $382 million in 2009. | |
Health | | 15,622 | | 16,180 | | 16,785 | | 17,281 | | A 1% change in utilization or drug prices affects costs by approximately $10 million. | |
Pharmacare | | 1,129 | | 1,185 | | 1,229 | | 1,266 | |
Medical Services Plan (MSP) | | 3,775 | | 3,895 | | 4,027 | | 4,120 | | A 1% increase in volume of services provided by fee-for-service physicians affects costs by approximately $25 million. | |
| | | | | | | | | | |
| | | | | | | | | | |
| | | | | | | | | | |
Regional Services | | 10,383 | | 10,859 | | 11,287 | | 11,652 | | | |
Budget and Fiscal Plan – 2012/13 to 2014/15
138
Appendices
Table A7 Material Assumptions — Expense (continued)
| | Updated | | Budget | | | | | | | |
Ministry Programs and Assumptions | | Forecast | | Estimate | | Plan | | Plan | | | |
($ millions unless otherwise specified) | | 2011/12 | | 2012/13 | | 2013/14 | | 2014/15 | | Sensitivities 2012/13 | |
Justice | | 1,106 | | 1,110 | | 1,123 | | 1,126 | | The number of criminal cases proceeded on by the provincial and federal Crown (including appeals to higher courts in BC), the number of civil and family litigation cases, the number of violation tickets disputed, and the number of municipal bylaw tickets disputed which would go to court for resolution. | |
New cases filed/processed (# for all courts) | | 295,000 | | 295,000 | | 295,000 | | 295,000 | |
| |
|
Crown Proceedings Act (CPA) | | 25 | | 25 | | 25 | | 25 | | The number and size of litigation brought against the province, as well as the effectiveness of mitigation strategies and legal defence. | |
Policing, Victim Services and Corrections | | 527 | | 569 | | 582 | | 586 | | The volume and severity of criminal activity, the number of inmate beds occupied and the number of offenders under community supervision. | |
|
Emergency Program Act (EPA) | | 76 | | 15 | | 15 | | 15 | | The number and severity of natural disasters. | |
Social Development | | 2,338 | | 2,457 | | 2,498 | | 2,505 | | The expected to work caseload is sensitive to fluctuations in economic and employment trends in the service sector. A 1% change in the Temporary Assistance annual average caseload or average cost per case will affect expenditures by approximately $4.5 million annually. | |
Temporary Assistance annual average caseload (#) | | 57,100 | | 55,000 | | 54,500 | | 54,000 | |
|
|
|
Disability Assistance annual average caseload (#) | | 79,800 | | 83,000 | | 86,300 | | 86,300 | | The caseload for persons with disabilities is sensitive to the aging of the population and longer life expectancy for individuals with disabilities and significant health issues. A 1% change in the Disability Assistance annual average caseload or average cost per case will affect expenditures by approximately $7.5 million annually. | |
|
Total annual average caseload (#) | | 136,900 | | 138,000 | | 140,800 | | 140,300 | | The average cost per case is sensitive to the composition of the caseload, and reported income. | |
Adult Community Living: | | | | | | | | | | | |
Residential Services: | | | | | | | | | | | |
Average caseload (#) | | 5,408 | | 5,536 | | 5,808 | | 6,077 | | The adult community living caseload is sensitive to the pressures of an aging population. A 1% increase in the adult caseload will increase expenditures by approximately $2.4 million. | |
Average cost per client ($) | | 72,300 | | 74,800 | | 72,650 | | 70,450 | |
Day Programs: | | | | | | | | | |
Average caseload (#) | | 13,845 | | 14,570 | | 15,286 | | 15,992 | |
Average cost per client ($) | | 17,550 | | 18,150 | | 17,150 | | 16,650 | |
Personal Supports Initiative | | | | | | | | | | | |
Average caseload (#) | | 249 | | 419 | | 609 | | 805 | |
Average cost per client ($) | | 27,300 | | 23,700 | | 16,300 | | 12,350 | |
Budget and Fiscal Plan – 2012/13 to 2014/15
139
Appendices
Table A7 Material Assumptions — Expense (continued)
| | Updated | | Budget | | | | | | | |
Ministry Programs and Assumptions | | Forecast | | Estimate | | Plan | | Plan | | | |
($ millions unless otherwise specified) | | 2011/12 | | 2012/13 | | 2013/14 | | 2014/15 | | Sensitivities 2012/13 | |
Tax Transfers | | 957 | | 1,091 | | 748 | | 764 | | | |
Personal Income | | 569.4 | | 632.3 | | 331.1 | | 331.6 | | These tax transfers are now expensed as required under generally accepted accounting principles. Previously for the family bonus was split 50/50 between expense program and as reduction to revenue while all other refundable credits were recorded as reduction to revenue. | |
Family Bonus Program | | 8.5 | | 4.5 | | 2.6 | | 2.6 |
Low Income Climate Action | | 184.0 | | 190.0 | | 190.0 | | 190.0 |
Sales Tax / BC HST | | 316.4 | | 328.3 | | 53.0 | | 53.0 |
Small Business Venture Capital | | 25.8 | | 28.0 | | 28.0 | | 28.0 |
Other Personal income | | 34.8 | | 81.5 | | 57.5 | | 58.0 |
Corporate Income | | 387.9 | | 459.2 | | 417.1 | | 432.6 |
Film and Television | | 66.6 | | 70.0 | | 60.0 | | 60.0 |
Production Services | | 181.3 | | 217.4 | | 194.3 | | 204.3 |
Scientific Research & Experimental Development | | 57.9 | | 79.2 | | 83.8 | | 89.3 |
Interactive Digital Media | | 30.5 | | 37.9 | | 35.0 | | 35.0 |
Other Corporate income | | 51.6 | | 54.7 | | 44.0 | | 44.0 | |
Management of Public Funds and Debt | | 1,265 | | 1,287 | | 1,346 | | 1,398 | | Full year impact on MoPD on interest costs of a 1% change in interest rates equals $64.2 million; $100 million increase in debt level equals $2.9 million. | |
Interest rates for new provincial borrowing: | | | | | | | | | | |
Short-term | | 0.96 | % | 1.11 | % | 1.96 | % | 2.98 | % | |
Long-term | | 3.41 | % | 3.47 | % | 4.10 | % | 5.05 | % | |
CDN/US exchange rate (cents) | | 100.2 | | 102.7 | | 99.5 | | 100.7 | | |
Service delivery agency net spending | | 4,857 | | 5,482 | | 5,772 | | 5,911 | | | |
School districts | | 170 | | 204 | | 218 | | 237 |
Post-secondary institutions | | 2,707 | | 2,834 | | 2,903 | | 2,910 |
Health authorities and hospital societies | | 614 | | 646 | | 687 | | 671 |
BC Transportation Financing Authority | | 863 | | 946 | | 1,047 | | 1,171 |
Other service delivery agencies | | 503 | | 852 | | 917 | | 922 |
Budget and Fiscal Plan – 2012/13 to 2014/15
140
Appendices
Table A8 Operating Statement — 2005/06 to 2014/15
| | | | | | | | | | | | | | Updated | | Budget | | | | | | Average | |
| | Actual | | Actual | | Actual | | Actual | | Actual | | Actual | | Forecast | | Estimate | | Plan | | Plan | | annual | |
($ millions) | | 2005/06 | | 2006/07 | | 2007/08 | | 2008/09 | | 2009/10 | | 2010/11 | | 2011/12 | | 2012/13 | | 2013/14 | | 2014/15 | | change | |
| | | | | | | | | | | | | | | | | | | | | | (per cent) | |
Revenue | | 36,248 | | 38,776 | | 40,124 | | 38,855 | | 38,126 | | 40,752 | | 41,945 | | 43,101 | | 44,603 | | 45,711 | | 2.6 | |
Expense | | (32,552 | ) | (34,535 | ) | (36,934 | ) | (38,745 | ) | (39,990 | ) | (41,061 | ) | (42,793 | ) | (43,869 | ) | (44,199 | ) | (45,111 | ) | 3.7 | |
Surplus (deficit) before unusual items | | 3,696 | | 4,241 | | 3,190 | | 110 | | (1,864 | ) | (309 | ) | (848 | ) | (768 | ) | 404 | | 600 | | | |
Forecast allowance | | — | | — | | — | | — | | — | | — | | (50 | ) | (200 | ) | (250 | ) | (350 | ) | | |
Negotiating Framework incentive payments | | (710 | ) | (264 | ) | (4 | ) | (2 | ) | — | | — | | — | | — | | — | | — | | | |
Climate Action Dividend | | — | | — | | (440 | ) | 20 | | — | | — | | — | | — | | — | | — | | | |
Liability for HST transition funding repayment | | — | | — | | — | | — | | — | | — | | (1,599 | ) | — | | — | | — | | | |
Surplus (deficit) | | 2,986 | | 3,977 | | 2,746 | | 128 | | (1,864 | ) | (309 | ) | (2,497 | ) | (968 | ) | 154 | | 250 | | | |
| | | | | | | | | | | | | | | | | | | | | | | |
Per cent of GDP: (1) | | | | | | | | | | | | | | | | | | | | | | | |
Surplus (deficit) | | 1.8 | | 2.2 | | 1.4 | | 0.1 | | -1.0 | | -0.2 | | -1.2 | | -0.4 | | 0.1 | | 0.1 | | | |
Per cent of revenue: | | | | | | | | | | | | | | | | | | | | | | | |
Surplus (deficit) | | 8.2 | | 10.3 | | 6.8 | | 0.3 | | -4.9 | | -0.8 | | -6.0 | | -2.2 | | 0.3 | | 0.5 | | | |
Per capita: (2) | | | | | | | | | | | | | | | | | | | | | | | |
Surplus (deficit) | | 711 | | 937 | | 637 | | 29 | | (418 | ) | (68 | ) | (546 | ) | (209 | ) | 33 | | 53 | | | |
(1) Surplus (deficit) as a per cent of GDP is calculated using GDP for the calendar year ending in the fiscal year (e.g. 2012/13 amounts divided by GDP for the 2012 calendar year).
(2) Per capita revenue and expense is calculated using July 1 population (e.g. 2012/13 amounts divided by population on July 1, 2012).
Budget and Fiscal Plan – 2012/13 to 2014/15
141
Appendices
Table A9 Revenue by Source — 2005/06 to 2014/15
| | | | | | | | | | | | | | Updated | | Budget | | | | | | Average | |
| | Actual | | Actual | | Actual | | Actual | | Actual | | Actual | | Forecast | | Estimate | | Plan | | Plan | | annual | |
($ millions) | | 2005/06 | | 2006/07 | | 2007/08 | | 2008/09 | | 2009/10 | | 2010/11 | | 2011/12 | | 2012/13 | | 2013/14 | | 2014/15 | | change | |
Taxation revenue: | | | | | | | | | | | | | | | | | | | | | | | |
Personal income | | 5,960 | | 7,020 | | 7,074 | | 6,309 | | 5,769 | | 5,810 | | 6,370 | | 6,630 | | 7,137 | | 7,529 | | 2.6 | |
Corporate income | | 1,582 | | 1,725 | | 2,473 | | 2,286 | | 1,673 | | 2,004 | | 2,015 | | 2,266 | | 2,042 | | 2,206 | | 3.8 | |
Sales | | 4,528 | | 4,886 | | 5,248 | | 5,137 | | 4,945 | | 5,614 | | 5,952 | | 6,101 | | 5,918 | | 6,112 | | n/a | |
Fuel | | 911 | | 901 | | 935 | | 891 | | 884 | | 940 | | 939 | | 937 | | 946 | | 955 | | 0.5 | |
Carbon | | — | | — | | — | | 306 | | 541 | | 741 | | 960 | | 1,172 | | 1,241 | | 1,261 | | n/a | |
Tobacco | | 702 | | 727 | | 693 | | 709 | | 683 | | 735 | | 652 | | 652 | | 727 | | 727 | | 0.4 | |
Property | | 1,719 | | 1,734 | | 1,797 | | 1,850 | | 1,887 | | 1,920 | | 1,925 | | 2,013 | | 2,094 | | 2,178 | | 2.7 | |
Property transfer | | 843 | | 914 | | 1,068 | | 715 | | 887 | | 855 | | 935 | | 893 | | 928 | | 952 | | 1.4 | |
Corporation capital | | 162 | | 91 | | 117 | | 108 | | 95 | | (3 | ) | (6 | ) | — | | — | | — | | n/a | |
Insurance Premium | | 330 | | 353 | | 373 | | 389 | | 389 | | 399 | | 413 | | 424 | | 434 | | 434 | | 3.1 | |
| | 16,737 | | 18,351 | | 19,778 | | 18,700 | | 17,753 | | 19,015 | | 20,155 | | 21,088 | | 21,467 | | 22,354 | | 3.3 | |
| | | | | | | | | | | | | | | | | | | | | | | |
Natural resource revenue: | | | | | | | | | | | | | | | | | | | | | | | |
Natural gas royalties | | 1,921 | | 1,207 | | 1,132 | | 1,314 | | 406 | | 313 | | 367 | | 398 | | 652 | | 846 | | -8.7 | |
Crown land tenures | | 386 | | 441 | | 569 | | 814 | | 867 | | 923 | | 919 | | 882 | | 887 | | 863 | | 9.4 | |
Columbia River Treaty | | 319 | | 223 | | 246 | | 231 | | 168 | | 136 | | 120 | | 125 | | 140 | | 150 | | -8.0 | |
Other energy and minerals | | 392 | | 456 | | 367 | | 479 | | 421 | | 514 | | 586 | | 568 | | 578 | | 567 | | 4.2 | |
Forests | | 1,214 | | 1,276 | | 1,087 | | 557 | | 387 | | 436 | | 457 | | 533 | | 557 | | 606 | | -7.4 | |
Other resources | | 317 | | 342 | | 341 | | 413 | | 398 | | 406 | | 423 | | 480 | | 497 | | 508 | | 5.4 | |
| | 4,549 | | 3,945 | | 3,742 | | 3,808 | | 2,647 | | 2,728 | | 2,872 | | 2,986 | | 3,311 | | 3,540 | | -2.7 | |
| | | | | | | | | | | | | | | | | | | | | | | |
Other revenue: | | | | | | | | | | | | | | | | | | | | | | | |
Medical Services Plan premiums | | 1,482 | | 1,524 | | 1,557 | | 1,595 | | 1,666 | | 1,787 | | 1,915 | | 2,047 | | 2,158 | | 2,274 | | 4.9 | |
Post-secondary education fees | | 892 | | 928 | | 979 | | 1,039 | | 1,126 | | 1,237 | | 1,285 | | 1,318 | | 1,359 | | 1,389 | | 5.0 | |
Other health-care related fees | | 225 | | 237 | | 248 | | 257 | | 267 | | 308 | | 322 | | 318 | | 320 | | 321 | | 4.0 | |
Motor vehicle licences and permits | | 405 | | 427 | | 445 | | 450 | | 450 | | 467 | | 480 | | 485 | | 491 | | 496 | | 2.3 | |
Other fees and licences | | 682 | | 692 | | 751 | | 670 | | 615 | | 650 | | 716 | | 755 | | 697 | | 684 | | 0.0 | |
Investment earnings | | 955 | | 1,041 | | 1,155 | | 823 | | 957 | | 859 | | 977 | | 1,083 | | 1,145 | | 1,274 | | 3.3 | |
Sales of goods and services | | 719 | | 678 | | 637 | | 694 | | 728 | | 752 | | 882 | | 889 | | 914 | | 928 | | 2.9 | |
Miscellaneous | | 1,554 | | 1,878 | | 1,924 | | 1,930 | | 1,980 | | 2,041 | | 1,963 | | 2,158 | | 1,851 | | 1,860 | | 2.0 | |
Release of surplus assets | | — | | — | | — | | — | | — | | — | | — | | — | | 475 | | 231 | | | |
| | 6,914 | | 7,405 | | 7,696 | | 7,458 | | 7,789 | | 8,101 | | 8,540 | | 9,053 | | 9,410 | | 9,457 | | 3.5 | |
| | | | | | | | | | | | | | | | | | | | | | | |
Contributions from the federal government: | | | | | | | | | | | | | | | | | | | | | | | |
Health and social transfers | | 4,220 | | 4,473 | | 4,614 | | 4,743 | | 4,883 | | 5,176 | | 5,373 | | 5,682 | | 6,008 | | 5,987 | | 4.0 | |
Harmonized sales tax transition payments | | — | | — | | — | | — | | 250 | | 769 | | 580 | | — | | — | | — | | n/a | |
Equalization | | 590 | | 459 | | — | | — | | — | | — | | — | | — | | — | | — | | n/a | |
Other cost shared agreements | | 1,015 | | 1,455 | | 1,318 | | 1,242 | | 1,784 | | 2,052 | | 1,712 | | 1,575 | | 1,556 | | 1,511 | | 4.5 | |
| | 5,825 | | 6,387 | | 5,932 | | 5,985 | | 6,917 | | 7,997 | | 7,665 | | 7,257 | | 7,564 | | 7,498 | | 2.8 | |
| | | | | | | | | | | | | | | | | | | | | | | |
Commercial Crown corporation net income: | | | | | | | | | | | | | | | | | | | | | | | |
BC Hydro | | 266 | | 407 | | 369 | | 365 | | 447 | | 591 | | 595 | | 566 | | 599 | | 576 | | 9.0 | |
Liquor Distribution Branch | | 800 | | 840 | | 857 | | 891 | | 877 | | 890 | | 899 | | 906 | | 844 | | 851 | | 0.7 | |
BC Lotteries (net of payments to federal gov’t) | | 914 | | 1,011 | | 1,080 | | 1,082 | | 1,070 | | 1,096 | | 1,068 | | 1,115 | | 1,190 | | 1,200 | | 3.1 | |
ICBC | | 191 | | 381 | | 633 | | 512 | | 601 | | 323 | | 140 | | 146 | | 230 | | 229 | | 2.0 | |
BC Railway Company | | 33 | | 30 | | 13 | | 36 | | 2 | | 10 | | 13 | | 14 | | 19 | | 15 | | -8.4 | |
Transportation Invest. Corp. (Port Mann) | | — | | — | | — | | (8 | ) | (4 | ) | (7 | ) | (16 | ) | (48 | ) | (49 | ) | (28 | ) | n/a | |
Other | | 19 | | 19 | | 24 | | 26 | | 27 | | 8 | | 14 | | 18 | | 18 | | 19 | | 0.0 | |
| | 2,223 | | 2,688 | | 2,976 | | 2,904 | | 3,020 | | 2,911 | | 2,713 | | 2,717 | | 2,851 | | 2,862 | | 2.8 | |
Total revenue | | 36,248 | | 38,776 | | 40,124 | | 38,855 | | 38,126 | | 40,752 | | 41,945 | | 43,101 | | 44,603 | | 45,711 | | 2.6 | |
Budget and Fiscal Plan – 2012/13 to 2014/15
142
Appendices
Table A10 Revenue by Source Supplementary Information — 2005/06 to 2014/15
| | | | | | | | | | | | | | Updated | | Budget | | | | | | Average | |
| | Actual | | Actual | | Actual | | Actual | | Actual | | Actual | | Forecast | | Estimate | | Plan | | Plan | | annual | |
($ millions) | | 2005/06 | | 2006/07 | | 2007/08 | | 2008/09 | | 2009/10 | | 2010/11 | | 2011/12 | | 2012/13 | | 2013/14 | | 2014/15 | | change | |
| | | | | | | | | | | | | | | | | | | | | | (per cent) | |
Per cent of nominal GDP: (1) | | | | | | | | | | | | | | | | | | | | | | | |
Taxation | | 9.9 | | 10.1 | | 10.3 | | 9.4 | | 9.3 | | 9.4 | | 9.5 | | 9.6 | | 9.4 | | 9.4 | | -0.6 | |
Natural resources | | 2.7 | | 2.2 | | 1.9 | | 1.9 | | 1.4 | | 1.3 | | 1.4 | | 1.4 | | 1.4 | | 1.5 | | -6.4 | |
Other | | 4.1 | | 4.1 | | 4.0 | | 3.7 | | 4.1 | | 4.0 | | 4.0 | | 4.1 | | 4.1 | | 4.0 | | -0.3 | |
Contributions from the federal government | | 3.4 | | 3.5 | | 3.1 | | 3.0 | | 3.6 | | 3.9 | | 3.6 | | 3.3 | | 3.3 | | 3.1 | | -1.0 | |
Commercial Crown corporation net income | | 1.3 | | 1.5 | | 1.5 | | 1.5 | | 1.6 | | 1.4 | | 1.3 | | 1.2 | | 1.2 | | 1.2 | | -1.0 | |
Total revenue | | 21.4 | | 21.3 | | 20.9 | | 19.5 | | 19.9 | | 20.1 | | 19.8 | | 19.6 | | 19.5 | | 19.2 | | -1.2 | |
| | | | | | | | | | | | | | | | | | | | | | | |
Growth rates: | | | | | | | | | | | | | | | | | | | | | | | |
Taxation | | 12.2 | | 9.6 | | 7.8 | | -5.5 | | -5.1 | | 7.1 | | 6.0 | | 4.6 | | 1.8 | | 4.1 | | n/a | |
Natural resources | | 14.9 | | -13.3 | | -5.1 | | 1.8 | | -30.5 | | 3.1 | | 5.3 | | 4.0 | | 10.9 | | 6.9 | | n/a | |
Other | | 3.5 | | 7.1 | | 3.9 | | -3.1 | | 4.4 | | 4.0 | | 5.4 | | 6.0 | | 3.9 | | 0.5 | | n/a | |
Contributions from the federal government | | 11.5 | | 9.6 | | -7.1 | | 0.9 | | 15.6 | | 15.6 | | -4.2 | | -5.3 | | 4.2 | | -0.9 | | n/a | |
Commercial Crown corporation net income | | -13.3 | | 20.9 | | 10.7 | | -2.4 | | 4.0 | | -3.6 | | -6.8 | | 0.1 | | 4.9 | | 0.4 | | n/a | |
Total revenue | | 8.7 | | 7.0 | | 3.5 | | -3.2 | | -1.9 | | 6.9 | | 2.9 | | 2.8 | | 3.5 | | 2.5 | | n/a | |
| | | | | | | | | | | | | | | | | | | | | | | |
Per capita: (2) | | | | | | | | | | | | | | | | | | | | | | | |
Taxation | | 3,988 | | 4,324 | | 4,589 | | 4,265 | | 3,981 | | 4,198 | | 4,407 | | 4,562 | | 4,586 | | 4,713 | | 1.9 | |
Natural resources | | 1,084 | | 930 | | 868 | | 869 | | 594 | | 602 | | 628 | | 646 | | 707 | | 746 | | -4.1 | |
Other | | 1,647 | | 1,745 | | 1,786 | | 1,701 | | 1,746 | | 1,788 | | 1,867 | | 1,958 | | 2,010 | | 1,994 | | 2.1 | |
Contributions from the federal government | | 1,388 | | 1,505 | | 1,376 | | 1,365 | | 1,551 | | 1,765 | | 1,676 | | 1,570 | | 1,616 | | 1,581 | | 1.5 | |
Commercial Crown corporation net income | | 530 | | 633 | | 691 | | 662 | | 677 | | 643 | | 593 | | 588 | | 609 | | 603 | | 1.4 | |
Total revenue | | 8,637 | | 9,138 | | 9,310 | | 8,863 | | 8,549 | | 8,997 | | 9,172 | | 9,324 | | 9,528 | | 9,638 | | 1.2 | |
| | | | | | | | | | | | | | | | | | | | | | | |
Real Per Capita Revenue (2014 $) (3) | | 9,986 | | 10,389 | | 10,402 | | 9,699 | | 9,355 | | 9,716 | | 9,676 | | 9,645 | | 9,718 | | 9,638 | | -0.4 | |
Growth rate (per cent) | | 5.5 | | 4.0 | | 0.1 | | -6.8 | | -3.5 | | 3.9 | | -0.4 | | -0.3 | | 0.8 | | -0.8 | | 0.2 | |
(1) Revenue as a per cent of GDP is calculated using nominal GDP for the calendar year ending in the fiscal year (e.g. 2012/13 revenue divided by nominal GDP for the 2012 calendar year). Totals may not add due to rounding.
(2) Per capita revenue is calculated using July 1 population (e.g. 2012/13 revenue divided by population on July 1, 2012). Totals may not add due to rounding.
(3) Revenue is converted to real (inflation-adjusted) terms using the consumer price index (CPI) for the corresponding calendar year (e.g. 2012 CPI for 2012/13 revenue).
Budget and Fiscal Plan – 2012/13 to 2014/15
143
Appendices
Table A11 Expense by Function — 2005/06 to 2014/15
| | | | | | | | | | | | | | Updated | | Budget | | | | | | Average | |
| | Actual | | Actual | | Actual | | Actual | | Actual | | Actual | | Forecast | | Estimate | | Plan | | Plan | | annual | |
($ millions) | | 2005/06 | | 2006/07 | | 2007/08 | | 2008/09 | | 2009/10 | | 2010/11 | | 2011/12 | | 2012/13 | | 2013/14 | | 2014/15 | | change | |
| | | | | | | | | | | | | | | | | | | | | | (per cent) | |
Function: | | | | | | | | | | | | | | | | | | | | | | | |
Health: | | | | | | | | | | | | | | | | | | | | | | | |
Medical Services Plan | | 2,696 | | 2,964 | | 3,263 | | 3,391 | | 3,536 | | 3,799 | | 4,085 | | 4,162 | | 4,291 | | 4,368 | | 5.5 | |
Pharmacare | | 868 | | 914 | | 955 | | 1,010 | | 1,053 | | 1,129 | | 1,165 | | 1,210 | | 1,254 | | 1,291 | | 4.5 | |
Regional services | | 8,346 | | 8,751 | | 9,321 | | 10,030 | | 10,273 | | 10,597 | | 11,326 | | 11,840 | | 12,254 | | 12,622 | | 4.7 | |
Other healthcare expenses | | 470 | | 566 | | 668 | | 602 | | 598 | | 626 | | 738 | | 758 | | 765 | | 766 | | 5.6 | |
| | 12,380 | | 13,195 | | 14,207 | | 15,033 | | 15,460 | | 16,151 | | 17,314 | | 17,970 | | 18,564 | | 19,047 | | 4.9 | |
Education: | | | | | | | | | | | | | | | | | | | | | | | |
Elementary and secondary | | 4,829 | | 5,272 | | 5,521 | | 5,740 | | 5,778 | | 5,802 | | 5,940 | | 5,973 | | 6,004 | | 6,045 | | 2.5 | |
Post-secondary | | 3,914 | | 4,072 | | 4,314 | | 4,554 | | 4,740 | | 4,865 | | 5,039 | | 5,204 | | 5,250 | | 5,277 | | 3.4 | |
Other education expenses | | 171 | | 147 | | 152 | | 158 | | 528 | | 504 | | 559 | | 584 | | 583 | | 584 | | 14.6 | |
| | 8,914 | | 9,491 | | 9,987 | | 10,452 | | 11,046 | | 11,171 | | 11,538 | | 11,761 | | 11,837 | | 11,906 | | 3.3 | |
Social services: | | | | | | | | | | | | | | | | | | | | | | | |
Social assistance | | 1,089 | | 1,231 | | 1,255 | | 1,339 | | 1,454 | | 1,506 | | 1,476 | | 1,545 | | 1,577 | | 1,572 | | 4.2 | |
Child welfare | | 832 | | 964 | | 925 | | 1,073 | | 1,077 | | 1,118 | | 1,068 | | 1,060 | | 1,061 | | 1,061 | | 2.7 | |
Low income tax credit transfers | | 134 | | 101 | | 85 | | 188 | | 216 | | 408 | | 509 | | 523 | | 246 | | 246 | | 7.0 | |
Community living and other services | | 682 | | 586 | | 756 | | 723 | | 729 | | 754 | | 762 | | 800 | | 809 | | 821 | | 2.1 | |
| | 2,737 | | 2,882 | | 3,021 | | 3,323 | | 3,476 | | 3,786 | | 3,815 | | 3,928 | | 3,693 | | 3,700 | | 3.4 | |
Protection of persons and property | | 1,250 | | 1,189 | | 1,435 | | 1,434 | | 1,385 | | 1,453 | | 1,391 | | 1,380 | | 1,398 | | 1,403 | | 1.3 | |
Transportation | | 1,197 | | 1,251 | | 1,378 | | 1,401 | | 1,453 | | 1,577 | | 1,597 | | 1,655 | | 1,732 | | 1,784 | | 4.5 | |
Natural resources & economic development | | 1,647 | | 1,780 | | 2,073 | | 1,869 | | 2,224 | | 2,373 | | 1,722 | | 1,792 | | 1,647 | | 1,703 | | 0.4 | |
Other | | 1,082 | | 1,235 | | 1,389 | | 1,652 | | 1,386 | | 1,213 | | 1,236 | | 1,360 | | 1,191 | | 1,197 | | 1.1 | |
Contingencies | | — | | — | | — | | — | | — | | — | | 603 | | 300 | | 250 | | 250 | | n/a | |
General government | | 1,147 | | 1,242 | | 1,208 | | 1,423 | | 1,356 | | 1,084 | | 1,170 | | 1,207 | | 1,231 | | 1,232 | | 0.8 | |
Debt servicing | | 2,198 | | 2,270 | | 2,236 | | 2,158 | | 2,204 | | 2,253 | | 2,407 | | 2,516 | | 2,656 | | 2,889 | | 3.1 | |
Operating expense | | 32,552 | | 34,535 | | 36,934 | | 38,745 | | 39,990 | | 41,061 | | 42,793 | | 43,869 | | 44,199 | | 45,111 | | 3.7 | |
Unusual items: | | | | | | | | | | | | | | | | | | | | | | | |
Negotiating Framework incentive payments | | 710 | | 264 | | 4 | | 2 | | — | | — | | — | | — | | — | | — | | | |
Climate Action Dividend | | — | | — | | 440 | | (20 | ) | — | | — | | — | | — | | — | | — | | | |
Liability for HST transition funding repayment | | — | | — | | — | | — | | — | | — | | 1,599 | | — | | — | | — | | | |
Total expense | | 33,262 | | 34,799 | | 37,378 | | 38,727 | | 39,990 | | 41,061 | | 44,392 | | 43,869 | | 44,199 | | 45,111 | | | |
Per cent of operating expense: | | | | | | | | | | | | | | | | | | | | | | | |
Health | | 38.0 | | 38.2 | | 38.5 | | 38.8 | | 38.7 | | 39.3 | | 40.5 | | 41.0 | | 42.0 | | 42.2 | | 1.2 | |
Education | | 27.4 | | 27.5 | | 27.0 | | 27.0 | | 27.6 | | 27.2 | | 27.0 | | 26.8 | | 26.8 | | 26.4 | | -0.4 | |
Social services and housing | | 8.4 | | 8.3 | | 8.2 | | 8.6 | | 8.7 | | 9.2 | | 8.9 | | 9.0 | | 8.4 | | 8.2 | | -0.3 | |
Protection of persons and property | | 3.8 | | 3.4 | | 3.9 | | 3.7 | | 3.5 | | 3.5 | | 3.3 | | 3.1 | | 3.2 | | 3.1 | | -2.3 | |
Transportation | | 3.7 | | 3.6 | | 3.7 | | 3.6 | | 3.6 | | 3.8 | | 3.7 | | 3.8 | | 3.9 | | 4.0 | | 0.8 | |
Natural resources & economic development | | 5.1 | | 5.2 | | 5.6 | | 4.8 | | 5.6 | | 5.8 | | 4.0 | | 4.1 | | 3.7 | | 3.8 | | -3.2 | |
Other | | 3.3 | | 3.6 | | 3.8 | | 4.3 | | 3.5 | | 3.0 | | 2.9 | | 3.1 | | 2.7 | | 2.7 | | -2.5 | |
Contingencies | | — | | — | | — | | — | | — | | — | | 1.4 | | 0.7 | | 0.6 | | 0.6 | | n/a | |
General government | | 3.5 | | 3.6 | | 3.3 | | 3.7 | | 3.4 | | 2.6 | | 2.7 | | 2.8 | | 2.8 | | 2.7 | | -2.8 | |
Debt servicing | | 6.8 | | 6.6 | | 6.1 | | 5.6 | | 5.5 | | 5.5 | | 5.6 | | 5.7 | | 6.0 | | 6.4 | | -0.6 | |
| | 100.0 | | 100.0 | | 100.0 | | 100.0 | | 100.0 | | 100.0 | | 100.0 | | 100.0 | | 100.0 | | 100.0 | | | |
Budget and Fiscal Plan – 2012/13 to 2014/15
144
Appendices
Table A12 Expense by Function Supplementary Information — 2005/06 to 2014/15
| | | | | | | | | | | | | | Updated | | Budget | | | | | | Average | |
| | Actual | | Actual | | Actual | | Actual | | Actual | | Actual | | Forecast | | Estimate | | Plan | | Plan | | annual | |
($ millions) | | 2005/06 | | 2006/07 | | 2007/08 | | 2008/09 | | 2009/10 | | 2010/11 | | 2011/12 | | 2012/13 | | 2013/14 | | 2014/15 | | change | |
| | | | | | | | | | | | | | | | | | | | | | (per cent) | |
Per cent of nominal GDP: (1) | | | | | | | | | | | | | | | | | | | | | | | |
Health | | 7.3 | | 7.2 | | 7.4 | | 7.5 | | 8.1 | | 8.0 | | 8.2 | | 8.2 | | 8.1 | | 8.0 | | 1.0 | |
Education | | 5.3 | | 5.2 | | 5.2 | | 5.2 | | 5.8 | | 5.5 | | 5.4 | | 5.4 | | 5.2 | | 5.0 | | -0.6 | |
Social services | | 1.6 | | 1.6 | | 1.6 | | 1.7 | | 1.8 | | 1.9 | | 1.8 | | 1.8 | | 1.6 | | 1.6 | | -0.4 | |
Protection of persons and property | | 0.7 | | 0.7 | | 0.7 | | 0.7 | | 0.7 | | 0.7 | | 0.7 | | 0.6 | | 0.6 | | 0.6 | | -2.5 | |
Transportation | | 0.7 | | 0.7 | | 0.7 | | 0.7 | | 0.8 | | 0.8 | | 0.8 | | 0.8 | | 0.8 | | 0.7 | | 0.6 | |
Natural resources & economic development | | 1.0 | | 1.0 | | 1.1 | | 0.9 | | 1.2 | | 1.2 | | 0.8 | | 0.8 | | 0.7 | | 0.7 | | -3.4 | |
Other | | 0.6 | | 0.7 | | 0.7 | | 0.8 | | 0.7 | | 0.6 | | 0.6 | | 0.6 | | 0.5 | | 0.5 | | -2.6 | |
Contingencies | | — | | — | | — | | — | | — | | — | | 0.3 | | 0.1 | | 0.1 | | 0.1 | | n/a | |
General government | | 0.7 | | 0.7 | | 0.6 | | 0.7 | | 0.7 | | 0.5 | | 0.6 | | 0.5 | | 0.5 | | 0.5 | | -3.0 | |
Debt servicing | | 1.3 | | 1.2 | | 1.2 | | 1.1 | | 1.1 | | 1.1 | | 1.1 | | 1.1 | | 1.2 | | 1.2 | | -0.8 | |
Operating expense | | 19.2 | | 18.9 | | 19.2 | | 19.4 | | 20.8 | | 20.2 | | 20.2 | | 20.0 | | 19.3 | | 18.9 | | -0.2 | |
| | | | | | | | | | | | | | | | | | | | | | | |
Growth rates: | | | | | | | | | | | | | | | | | | | | | | | |
Health | | 7.8 | | 6.6 | | 7.7 | | 5.8 | | 2.8 | | 4.5 | | 7.2 | | 3.8 | | 3.3 | | 2.6 | | n/a | |
Education | | 5.0 | | 6.5 | | 5.2 | | 4.7 | | 5.7 | | 1.1 | | 3.3 | | 1.9 | | 0.6 | | 0.6 | | n/a | |
Social services | | 8.9 | | 5.3 | | 4.8 | | 10.0 | | 4.6 | | 8.9 | | 0.8 | | 3.0 | | -6.0 | | 0.2 | | n/a | |
Protection of persons and property | | 17.0 | | -4.9 | | 20.7 | | -0.1 | | -3.4 | | 4.9 | | -4.3 | | -0.8 | | 1.3 | | 0.4 | | n/a | |
Transportation | | -8.6 | | 4.5 | | 10.2 | | 1.7 | | 3.7 | | 8.5 | | 1.3 | | 3.6 | | 4.7 | | 3.0 | | n/a | |
Natural resources & economic development | | 4.3 | | 8.1 | | 16.5 | | -9.8 | | 19.0 | | 6.7 | | -27.4 | | 4.1 | | -8.1 | | 3.4 | | n/a | |
Other | | 6.0 | | 14.1 | | 12.5 | | 18.9 | | -16.1 | | -12.5 | | 1.9 | | 10.0 | | -12.4 | | 0.5 | | n/a | |
General government | | 27.6 | | 8.3 | | -2.7 | | 17.8 | | -4.7 | | -20.1 | | 7.9 | | 3.2 | | 2.0 | | 0.1 | | n/a | |
Debt servicing | | -4.6 | | 3.3 | | -1.5 | | -3.5 | | 2.1 | | 2.2 | | 6.8 | | 4.5 | | 5.6 | | 8.8 | | n/a | |
Operating expense | | 6.2 | | 6.1 | | 6.9 | | 4.9 | | 3.2 | | 2.7 | | 4.2 | | 2.5 | | 0.8 | | 2.1 | | n/a | |
| | | | | | | | | | | | | | | | | | | | | | | |
Per capita: (2) | | | | | | | | | | | | | | | | | | | | | | | |
Health | | 2,950 | | 3,109 | | 3,297 | | 3,429 | | 3,466 | | 3,566 | | 3,786 | | 3,887 | | 3,966 | | 4,016 | | 3.5 | |
Education | | 2,124 | | 2,237 | | 2,317 | | 2,384 | | 2,477 | | 2,466 | | 2,523 | | 2,544 | | 2,529 | | 2,510 | | 1.9 | |
Social services | | 652 | | 679 | | 701 | | 758 | | 779 | | 836 | | 834 | | 850 | | 789 | | 780 | | 2.0 | |
Protection of persons and property | | 298 | | 280 | | 333 | | 327 | | 311 | | 321 | | 304 | | 299 | | 299 | | 296 | | -0.1 | |
Transportation | | 285 | | 295 | | 320 | | 320 | | 326 | | 348 | | 349 | | 358 | | 370 | | 376 | | 3.1 | |
Natural resources & economic development | | 392 | | 419 | | 481 | | 426 | | 499 | | 524 | | 377 | | 388 | | 352 | | 359 | | -1.0 | |
Other | | 258 | | 291 | | 322 | | 377 | | 311 | | 268 | | 270 | | 294 | | 254 | | 252 | | -0.3 | |
Contingencies | | — | | — | | — | | — | | — | | — | | 132 | | 65 | | 53 | | 53 | | n/a | |
General government | | 273 | | 293 | | 280 | | 325 | | 304 | | 239 | | 256 | | 261 | | 263 | | 260 | | -0.5 | |
Debt servicing | | 524 | | 535 | | 519 | | 492 | | 494 | | 497 | | 526 | | 544 | | 567 | | 609 | | 1.7 | |
Operating expense | | 7,756 | | 8,138 | | 8,570 | | 8,838 | | 8,967 | | 9,065 | | 9,357 | | 9,490 | | 9,442 | | 9,511 | | 2.3 | |
| | | | | | | | | | | | | | | | | | | | | | | |
Real Per Capita Operating Expense (2014 $) (3) | | 8,968 | | 9,252 | | 9,575 | | 9,672 | | 9,813 | | 9,790 | | 9,871 | | 9,817 | | 9,630 | | 9,512 | | 0.7 | |
Growth rate (per cent) | | 2.8 | | 3.2 | | 3.5 | | 1.0 | | 1.5 | | -0.2 | | 0.8 | | -0.5 | | -1.9 | | -1.2 | | 0.9 | |
(1) | | Expense as a per cent of GDP is calculated using nominal GDP for the calendar year ending in the fiscal year (e.g. 2012/13 expense divided by nominal GDP for the 2012 calendar year). Totals may not add due to rounding. |
(2) | | Per capita expense is calculated using July 1 population (e.g. 2012/13 expense divided by population on July 1, 2012). Totals may not add due to rounding. |
(3) | | Expense is converted to real (inflation-adjusted) terms using the consumer price index (CPI) for the corresponding calendar year (e.g. 2012 CPI for 2012/13 expense). |
Budget and Fiscal Plan – 2012/13 to 2014/15
145
Appendices
Table A13 Full-Time Equivalents (FTEs) – 2005/06 to 2014/15
| | | | | | | | | | | | | | Updated | | Budget | | | | | | Average | |
| | Actual | | Actual | | Actual | | Actual | | Actual | | Actual | | Forecast | | Estimate | | Plan | | Plan | | annual | |
| | 2005/06 | | 2006/07 | | 2007/08 | | 2008/09 | | 2009/10 | | 2010/11 | | 2011/12 (1) | | 2012/13 | | 2013/14 | | 2014/15 | | change | |
| | | | | | | | | | | | | | | | | | | | | | (per cent) | |
Taxpayer-supported programs and agencies: | | | | | | | | | | | | | | | | | | | | | | | |
Ministries and special offices (CRF) | | 27,129 | | 28,647 | | 30,224 | | 31,874 | | 31,353 | | 30,221 | | 27,170 | | 26,891 | | 25,957 | | 25,061 | | -0.9 | |
Service delivery agencies (2) | | 3,992 | | 3,917 | | 4,128 | | 4,403 | | 4,508 | | 4,423 | | 4,506 | | 4,568 | | 4,577 | | 4,616 | | 1.6 | |
Total FTEs | | 31,121 | | 32,564 | | 34,352 | | 36,277 | | 35,861 | | 34,644 | | 31,676 | | 31,459 | | 30,534 | | 29,677 | | -0.5 | |
| | | | | | | | | | | | | | | | | | | | | | | |
Growth rates: | | | | | | | | | | | | | | | | | | | | | | | |
Ministries and special offices (CRF) | | -0.5 | | 5.6 | | 5.5 | | 5.5 | | -1.6 | | -3.6 | | -10.1 | | -1.0 | | -3.5 | | -3.5 | | -0.7 | |
Service delivery agencies | | 4.4 | | -1.9 | | 5.4 | | 6.7 | | 2.4 | | -1.9 | | 1.9 | | 1.4 | | 0.2 | | 0.9 | | 1.9 | |
Population per FTE: (3) | | 134.9 | | 130.3 | | 125.5 | | 120.8 | | 124.4 | | 130.7 | | 144.4 | | 146.9 | | 153.3 | | 159.8 | | 1.9 | |
(1) The ministry 2011/12 FTE total includes a reduction of approximately 3,200 FTEs reflecting the shift of BC Ambulance Service oversight from the Ministry of Health Services to the Provincial Health Services Authority.
(2) Service delivery agency FTE amounts do not include SUCH sector staff employment.
(3) Population per FTE is calculated using July 1 population (e.g. population on July 1, 2012 divided by 2012/13 FTEs).
Budget and Fiscal Plan – 2012/13 to 2014/15
146
Appendices
Table A14 Capital Spending — 2005/06 to 2014/15
| | | | | | | | | | | | | | Updated | | Budget | | | | | | Average | |
| | Actual | | Actual | | Actual | | Actual | | Actual | | Actual | | Forecast | | Estimate | | Plan | | Plan | | annual | |
($ millions) | | 2005/06 | | 2006/07 | | 2007/08 | | 2008/09 | | 2009/10 | | 2010/11 | | 2011/12 | | 2012/13 | | 2013/14 | | 2014/15 | | change | |
| | | | | | | | | | | | | | | | | | | | | | (per cent) | |
Taxpayer-supported: | | | | | | | | | | | | | | | | | | | | | | | |
Education | | | | | | | | | | | | | | | | | | | | | | | |
Schools districts | | 286 | | 322 | | 380 | | 413 | | 449 | | 433 | | 530 | | 486 | | 456 | | 454 | | 5.3 | |
Post-secondary institutions | | 790 | | 874 | | 782 | | 658 | | 672 | | 925 | | 779 | | 688 | | 548 | | 561 | | -3.7 | |
Health | | 848 | | 760 | | 881 | | 892 | | 927 | | 916 | | 841 | | 879 | | 700 | | 685 | | -2.3 | |
BC Transportation Financing Authority | | 713 | | 821 | | 884 | | 881 | | 918 | | 1,080 | | 958 | | 1,069 | | 1,143 | | 1,062 | | 4.5 | |
BC Transit | | 24 | | 13 | | 37 | | 77 | | 150 | | 39 | | 50 | | 90 | | 87 | | 110 | | 18.4 | |
Rapid Transit Project 2000 | | 16 | | 15 | | — | | — | | — | | — | | — | | — | | — | | — | | n/a | |
Vancouver Convention Centre expansion | | 85 | | 105 | | 251 | | 242 | | 41 | | 10 | | 3 | | — | | — | | — | | n/a | |
BC Place redevelopment | | — | | — | | — | | 45 | | 75 | | 197 | | 249 | | — | | 12 | | — | | n/a | |
Government direct (ministries) | | 320 | | 355 | | 335 | | 430 | | 306 | | 261 | | 318 | | 454 | | 439 | | 482 | | 4.7 | |
Other | | 71 | | 144 | | 122 | | 140 | | 190 | | 252 | | 269 | | 91 | | 92 | | 75 | | 0.6 | |
| | 3,153 | | 3,409 | | 3,672 | | 3,778 | | 3,728 | | 4,113 | | 3,997 | | 3,757 | | 3,477 | | 3,429 | | 0.9 | |
| | | | | | | | | | | | | | | | | | | | | | | |
Self-supported: | | | | | | | | | | | | | | | | | | | | | | | |
BC Hydro | | 610 | | 807 | | 1,076 | | 1,397 | | 2,406 | | 1,519 | | 2,082 | | 2,361 | | 2,150 | | 2,222 | | 15.4 | |
BC Transmission Corporation | | 21 | | 50 | | 70 | | 19 | | 12 | | — | | — | | — | | — | | — | | n/a | |
Columbia River power projects | | 30 | | 19 | | 29 | | 32 | | 16 | | 67 | | 89 | | 122 | | 64 | | 26 | | -1.6 | |
Transportation Invest. Corp. (Port Mann) | | — | | — | | — | | 215 | | 777 | | 738 | | 742 | | 606 | | 94 | | 147 | | n/a | |
BC Railway Company | | 15 | | 19 | | 20 | | 10 | | 14 | | 6 | | 13 | | 13 | | 9 | | 1 | | -26.0 | |
ICBC | | 27 | | 22 | | 23 | | 22 | | 22 | | 48 | | 86 | | 101 | | 98 | | 69 | | 11.0 | |
BC Lotteries | | 83 | | 44 | | 60 | | 97 | | 92 | | 81 | | 107 | | 116 | | 110 | | 105 | | 2.6 | |
Liquor Distribution Branch | | 19 | | 22 | | 18 | | 17 | | 19 | | 18 | | 25 | | 27 | | 28 | | 36 | | 7.4 | |
| | 805 | | 983 | | 1,296 | | 1,809 | | 3,358 | | 2,477 | | 3,144 | | 3,346 | | 2,553 | | 2,606 | | 13.9 | |
Total capital spending | | 3,958 | | 4,392 | | 4,968 | | 5,587 | | 7,086 | | 6,590 | | 7,141 | | 7,103 | | 6,030 | | 6,035 | | 4.8 | |
| | | | | | | | | | | | | | | | | | | | | | | |
Per cent of nominal GDP: (1) | | | | | | | | | | | | | | | | | | | | | | | |
Taxpayer-supported | | 1.9 | | 1.9 | | 1.9 | | 1.9 | | 1.9 | | 2.0 | | 1.9 | | 1.7 | | 1.5 | | 1.4 | | -2.8 | |
Self-supported | | 0.5 | | 0.5 | | 0.7 | | 0.9 | | 1.8 | | 1.2 | | 1.5 | | 1.5 | | 1.1 | | 1.1 | | 9.7 | |
Total | | 2.3 | | 2.4 | | 2.6 | | 2.8 | | 3.7 | | 3.2 | | 3.4 | | 3.2 | | 2.6 | | 2.5 | | 0.9 | |
Growth rates: | | | | | | | | | | | | | | | | | | | | | | | |
Taxpayer-supported | | 33.4 | | 8.1 | | 7.7 | | 2.9 | | -1.3 | | 10.3 | | -2.8 | | -6.0 | | -7.5 | | -1.4 | | 4.3 | |
Self-supported | | 3.7 | | 22.1 | | 31.8 | | 39.6 | | 85.6 | | -26.2 | | 26.9 | | 6.4 | | -23.7 | | 2.1 | | 16.8 | |
Total | | 26.1 | | 11.0 | | 13.1 | | 12.5 | | 26.8 | | -7.0 | | 8.4 | | -0.5 | | -15.1 | | 0.1 | | 7.5 | |
Per capita: (2) | | | | | | | | | | | | | | | | | | | | | | | |
Taxpayer-supported | | 751 | | 803 | | 852 | | 862 | | 836 | | 908 | | 874 | | 813 | | 743 | | 723 | | -0.4 | |
Self-supported | | 192 | | 232 | | 301 | | 413 | | 753 | | 547 | | 687 | | 724 | | 545 | | 549 | | 12.4 | |
Total | | 943 | | 1,035 | | 1,153 | | 1,274 | | 1,589 | | 1,455 | | 1,561 | | 1,537 | | 1,288 | | 1,273 | | 3.4 | |
| | | | | | | | | | | | | | | | | | | | | | | |
Real Per Capita Capital Spending (2014 $) (3) | | 1,090 | | 1,177 | | 1,288 | | 1,395 | | 1,739 | | 1,571 | | 1,647 | | 1,590 | | 1,314 | | 1,273 | | 1.7 | |
Growth rate (per cent) | | 22.1 | | 7.9 | | 9.5 | | 8.3 | | 24.7 | | -9.6 | | 4.8 | | -3.5 | | -17.3 | | -3.1 | | 4.4 | |
(1) Capital spending as a per cent of GDP is calculated using nominal GDP for the calendar year ending in the fiscal year (e.g. 2012/13 amounts divided by nominal GDP for the 2012 calendar year). Totals may not add due to rounding.
(2) Per capita capital spending is calculated using July 1 population (e.g. 2012/13 amounts divided by population on July 1, 2012). Totals may not add due to rounding.
(3) Capital spending is converted to real (inflation-adjusted) terms using the consumer price index (CPI) for the corresponding calendar year (e.g. 2012 CPI for 2012/13 capital spending).
Budget and Fiscal Plan – 2012/13 to 2014/15
147
Appendices
Table A15 Statement of Financial Position — 2005/06 to 2014/15
| | | | | | | | | | | | | | Updated | | Budget | | | | | | Average | |
| | Actual | | Actual | | Actual | | Actual | | Actual | | Actual | | Forecast | | Estimate | | Plan | | Plan | | annual | |
($ millions) | | 2005/06 | | 2006/07 | | 2007/08 | | 2008/09 | | 2009/10 | | 2010/11 | | 2011/12 | | 2012/13 | | 2013/14 | | 2014/15 | | change | |
| | | | | | | | | | | | | | | | | | | | | | (per cent) | |
Financial assets: | | | | | | | | | | | | | | | | | | | | | | | |
Cash and temporary investments | | 3,922 | | 3,492 | | 5,994 | | 5,226 | | 2,957 | | 3,096 | | 1,126 | | 1,435 | | 1,964 | | 2,495 | | -4.9 | |
Other financial assets | | 7,085 | | 8,003 | | 8,294 | | 7,360 | | 8,723 | | 9,603 | | 9,278 | | 9,895 | | 10,711 | | 11,081 | | 5.1 | |
Sinking funds | | 4,059 | | 3,798 | | 2,649 | | 2,134 | | 1,329 | | 1,410 | | 1,288 | | 1,567 | | 471 | | 378 | | -23.2 | |
Investments in commercial Crown corporations: | | | | | | | | | | | | | | | | | | | | | | | |
Retained earnings | | 3,463 | | 4,415 | | 5,081 | | 5,728 | | 7,231 | | 6,968 | | 7,114 | | 7,554 | | 7,983 | | 8,357 | | 10.3 | |
Recoverable capital loans | | 6,916 | | 7,170 | | 7,719 | | 9,149 | | 11,471 | | 12,947 | | 15,493 | | 18,018 | | 20,164 | | 21,665 | | 13.5 | |
| | 10,379 | | 11,585 | | 12,800 | | 14,877 | | 18,702 | | 19,915 | | 22,607 | | 25,572 | | 28,147 | | 30,022 | | 12.5 | |
Warehouse borrowing program assets | | — | | — | | — | | 2,081 | | — | | — | | — | | — | | — | | — | | n/a | |
| | 25,445 | | 26,878 | | 29,737 | | 31,678 | | 31,711 | | 34,024 | | 34,299 | | 38,469 | | 41,293 | | 43,976 | | 6.3 | |
Liabilities: | | | | | | | | | | | | | | | | | | | | | | | |
| | | | | | | | | | | | | | | | | | | | | | | |
Accounts payable & accrued liabilities | | 7,441 | | 7,223 | | 8,074 | | 7,408 | | 7,009 | | 7,664 | | 7,595 | | 7,682 | | 7,780 | | 7,922 | | 0.7 | |
Deferred revenue | | 5,911 | | 6,244 | | 7,465 | | 9,485 | | 10,093 | | 10,854 | | 10,624 | | 10,312 | | 10,152 | | 10,112 | | 6.1 | |
Debt: | | | | | | | | | | | | | | | | | | | | | | | |
Taxpayer-supported debt | | 27,251 | | 25,968 | | 26,589 | | 26,446 | | 30,021 | | 31,855 | | 34,786 | | 38,736 | | 41,656 | | 43,702 | | 5.4 | |
Self-supported debt | | 7,206 | | 7,471 | | 8,048 | | 11,568 | | 11,864 | | 13,299 | | 16,149 | | 18,667 | | 20,808 | | 22,302 | | 13.4 | |
Forecast allowance | | — | | — | | — | | — | | — | | — | | 50 | | 200 | | 250 | | 350 | | n/a | |
Total provincial debt | | 34,457 | | 33,439 | | 34,637 | | 38,014 | | 41,885 | | 45,154 | | 50,985 | | 57,603 | | 62,714 | | 66,354 | | 7.6 | |
Add: debt offset by sinking funds | | 4,059 | | 3,798 | | 2,649 | | 2,134 | | 1,329 | | 1,410 | | 1,288 | | 1,567 | | 471 | | 378 | | -23.2 | |
Less: guarantees and non-guaranteed debt | | (459 | ) | (416 | ) | (452 | ) | (452 | ) | (493 | ) | (421 | ) | (700 | ) | (694 | ) | (688 | ) | (681 | ) | 4.5 | |
Financial statement debt | | 38,057 | | 36,821 | | 36,834 | | 39,696 | | 42,721 | | 46,143 | | 51,573 | | 58,476 | | 62,497 | | 66,051 | | 6.3 | |
| | 51,409 | | 50,288 | | 52,373 | | 56,589 | | 59,823 | | 64,661 | | 69,792 | | 76,470 | | 80,429 | | 84,085 | | 5.6 | |
Net liabilities | | (25,964 | ) | (23,410 | ) | (22,636 | ) | (24,911 | ) | (28,112 | ) | (30,637 | ) | (35,493 | ) | (38,001 | ) | (39,136 | ) | (40,109 | ) | 5.0 | |
Capital and other assets: | | | | | | | | | | | | | | | | | | | | | | | |
Tangible capital assets | | 24,954 | | 26,800 | | 28,737 | | 30,655 | | 32,340 | | 34,390 | | 36,360 | | 37,946 | | 39,218 | | 40,399 | | 5.5 | |
Other assets | | 729 | | 753 | | 706 | | 758 | | 889 | | 1,079 | | 1,149 | | 1,155 | | 1,176 | | 1,191 | | 5.6 | |
| | 25,683 | | 27,553 | | 29,443 | | 31,413 | | 33,229 | | 35,469 | | 37,509 | | 39,101 | | 40,394 | | 41,590 | | 5.5 | |
Accumulated surplus (deficit) | | (281 | ) | 4,143 | | 6,807 | | 6,502 | | 5,117 | | 4,832 | | 2,016 | | 1,100 | | 1,258 | | 1,481 | | n/a | |
Per cent of nominal GDP: (1) | | | | | | | | | | | | | | | | | | | | | | | |
Net liabilities | | 15.3 | | 12.8 | | 11.8 | | 12.5 | | 14.7 | | 15.1 | | 16.7 | | 17.3 | | 17.1 | | 16.8 | | 1.0 | |
Capital and other assets | | 15.1 | | 15.1 | | 15.3 | | 15.8 | | 17.3 | | 17.5 | | 17.7 | | 17.8 | | 17.7 | | 17.4 | | 1.6 | |
Growth rates: | | | | | | | | | | | | | | | | | | | | | | | |
Net liabilities | | -4.5 | | -9.8 | | -3.3 | | 10.1 | | 12.8 | | 9.0 | | 15.9 | | 7.1 | | 3.0 | | 2.5 | | 4.3 | |
Capital and other assets | | 7.3 | | 7.3 | | 6.9 | | 6.7 | | 5.8 | | 6.7 | | 5.8 | | 4.2 | | 3.3 | | 3.0 | | 5.7 | |
Per capita: (2) | | | | | | | | | | | | | | | | | | | | | | | |
Net liabilities | | 6,187 | | 5,517 | | 5,252 | | 5,682 | | 6,303 | | 6,764 | | 7,761 | | 8,220 | | 8,360 | | 8,457 | | 3.5 | |
Capital and other assets | | 6,120 | | 6,493 | | 6,832 | | 7,165 | | 7,451 | | 7,830 | | 8,202 | | 8,458 | | 8,629 | | 8,770 | | 4.1 | |
(1) Net liabilities as a per cent of GDP is calculated using nominal GDP for the calendar year ending in the fiscal year (e.g. 2012/13 amount divided by nominal GDP for the 2012 calendar year).
(2) Per capita net liabilities is calculated using July 1 population (e.g. 2012/13 amount divided by population on July 1, 2012).
Budget and Fiscal Plan – 2012/13 to 2014/15
148
Appendices
Table A16 Changes in Financial Position — 2005/06 to 2014/15
| | | | | | | | | | | | | | Updated | | Budget | | | | | | | |
| | Actual | | Actual | | Actual | | Actual | | Actual | | Actual | | Forecast | | Estimate | | Plan | | Plan | | 10-Year | |
($ millions) | | 2005/06 | | 2006/07 | | 2007/08 | | 2008/09 | | 2009/10 | | 2010/11 | | 2011/12 | | 2012/13 | | 2013/14 | | 2014/15 | | Total | |
(Surplus) deficit for the year | | (2,986 | ) | (3,977 | ) | (2,746 | ) | (127 | ) | 1,864 | | 309 | | 2,497 | | 968 | | (154 | ) | (250 | ) | (4,602 | ) |
Comprehensive income (increase) decrease | | — | | (447 | ) | 82 | | 432 | | (479 | ) | (24 | ) | 319 | | (52 | ) | (4 | ) | 27 | | (146 | ) |
Change in accumulated (surplus) deficit | | (2,986 | ) | (4,424 | ) | (2,664 | ) | 305 | | 1,385 | | 285 | | 2,816 | | 916 | | (158 | ) | (223 | ) | (4,748 | ) |
Capital and other asset changes: | | | | | | | | | | | | | | | | | | | | | | | |
Taxpayer-supported capital investments | | 3,153 | | 3,409 | | 3,672 | | 3,778 | | 3,728 | | 4,113 | | 3,997 | | 3,757 | | 3,477 | | 3,429 | | 36,513 | |
Less: amortization and other accounting changes | | (1,615 | ) | (1,563 | ) | (1,735 | ) | (1,860 | ) | (2,043 | ) | (2,063 | ) | (2,027 | ) | (2,171 | ) | (2.205 | ) | (2,248 | ) | (19,530 | ) |
Increase in net capital assets | | 1,538 | | 1,846 | | 1,937 | | 1,918 | | 1,685 | | 2,050 | | 1,970 | | 1,586 | | 1,272 | | 1,181 | | 16,983 | |
Increase (decrease) in other assets | | 220 | | 24 | | (47 | ) | 52 | | 131 | | 190 | | 70 | | 6 | | 21 | | 15 | | 682 | |
| | 1,758 | | 1,870 | | 1,890 | | 1,970 | | 1,816 | | 2,240 | | 2,040 | | 1,592 | | 1,293 | | 1,196 | | 17,665 | |
Increase (decrease) in net liabilities | | (1,228 | ) | (2,554 | ) | (774 | ) | 2,275 | | 3,201 | | 2,525 | | 4,856 | | 2,508 | | 1,135 | | 973 | | 12,917 | |
Investment and working capital changes: | | | | | | | | | | | | | | | | | | | | | | | |
Increase (reduction) in cash and temporary investments | | 291 | | (430 | ) | 2,502 | | (768 | ) | (2,269 | ) | 139 | | (1,970 | ) | 309 | | 529 | | 531 | | (1,136 | ) |
Increase (decrease) in warehouse borrowing investments | | — | | — | | — | | 2,081 | | (2,081 | ) | — | | — | | — | | — | | — | | — | |
Investment in commercial Crown corporations: | | | | | | | | | | | | | | | | | | | | | | | |
Increase (decrease) in retained earnings | | 283 | | 952 | | 666 | | 647 | | 1,503 | | (263 | ) | 146 | | 440 | | 429 | | 374 | | 5,177 | |
Self-supported capital investments | | 805 | | 983 | | 1,296 | | 1,809 | | 3,358 | | 2,477 | | 3,144 | | 3,346 | | 2,553 | | 2,606 | | 22,377 | |
Less: loan repayments and other accounting changes | | (790 | ) | (729 | ) | (747 | ) | (379 | ) | (1,036 | ) | (1,001 | ) | (598 | ) | (821 | ) | (407 | ) | (1,105 | ) | (7,613 | ) |
| | 298 | | 1,206 | | 1,215 | | 2,077 | | 3,825 | | 1,213 | | 2,692 | | 2,965 | | 2,575 | | 1,875 | | 19,941 | |
Other working capital changes | | (1,216 | ) | 542 | | (2,930 | ) | (2,803 | ) | 349 | | (455 | ) | (148 | ) | 1,121 | | (218 | ) | 175 | | (5,583 | ) |
| | (627 | ) | 1,318 | | 787 | | 587 | | (176 | ) | 897 | | 574 | | 4,395 | | 2,886 | | 2,581 | | 13,222 | |
Increase (decrease) in financial statement debt | | (1,855 | ) | (1,236 | ) | 13 | | 2,862 | | 3,025 | | 3,422 | | 5,430 | | 6,903 | | 4,021 | | 3,554 | | 26,139 | |
(Increase) decrease in sinking fund debt | | 456 | | 261 | | 1,149 | | 515 | | 805 | | (81 | ) | 122 | | (279 | ) | 1,096 | | 93 | | 4,137 | |
Increase (decrease) in guarantees and non-guaranteed debt | | (13 | ) | (43 | ) | 36 | | — | | 41 | | (72 | ) | 279 | | (6 | ) | (6 | ) | (7 | ) | 209 | |
Increase (decrease) in total provincial debt | | (1,412 | ) | (1,018 | ) | 1,198 | | 3,377 | | 3,871 | | 3,269 | | 5,831 | | 6,618 | | 5,111 | | 3,640 | | 30,485 | |
Represented by increase (decrease) in: | | | | | | | | | | | | | | | | | | | | | | | |
Taxpayer-supported debt | | (1,417 | ) | (1,283 | ) | 621 | | (143 | ) | 3,575 | | 1,834 | | 2,931 | | 3,950 | | 2,920 | | 2,046 | | 15,034 | |
Self-supported debt | | 5 | | 265 | | 577 | | 3,520 | | 296 | | 1,435 | | 2,850 | | 2,518 | | 2,141 | | 1,494 | | 15,101 | |
Forecast allowance | | — | | — | | — | | — | | — | | — | | 50 | | 150 | | 50 | | 100 | | 350 | |
Total provincial debt | | (1,412 | ) | (1,018 | ) | 1,198 | | 3,377 | | 3,871 | | 3,269 | | 5,831 | | 6,618 | | 5,111 | | 3,640 | | 30,485 | |
Budget and Fiscal Plan – 2012/13 to 2014/15
149
Appendices
Table A17 Provincial Debt — 2005/06 to 2014/15
| | | | | | | | | | | | | | Updated | | Budget | | | | | | Average | |
| | Actual | | Actual | | Actual | | Actual | | Actual | | Actual | | Forecast | | Estimate | | Plan | | Plan | | annual | |
($ millions) | | 2005/06 | | 2006/07 | | 2007/08 | | 2008/09 | | 2009/10 | | 2010/11 | | 2011/12 | | 2012/13 | | 2013/14 | | 2014/15 | | change | |
| | | | | | | | | | | | | | | | | | | | | | (per cent) | |
Taxpayer-supported debt: | | | | | | | | | | | | | | | | | | | | | | | |
Provincial government operating | | 9,952 | | 6,928 | | 5,330 | | 3,048 | | 4,663 | | 4,268 | | 4,994 | | 6,590 | | 7,071 | | 6,579 | | -4.5 | |
Provincial government general capital | | 1,391 | | 1,961 | | 2,274 | | 2,696 | | 2,696 | | 2,696 | | 2,696 | | 2,696 | | 2,696 | | 2,696 | | 7.6 | |
Provincial government direct operating | | 11,343 | | 8,889 | | 7,604 | | 5,744 | | 7,359 | | 6,964 | | 7,690 | | 9,286 | | 9,767 | | 9,275 | | -2.2 | |
Other taxpayer-supported debt (mainly capital): | | | | | | | | | | | | | | | | | | | | | | | |
Education facilities | | | | | | | | | | | | | | | | | | | | | | | |
Schools | | 4,860 | | 5,013 | | 5,216 | | 5,522 | | 5,777 | | 6,016 | | 6,532 | | 6,985 | | 7,461 | | 7,906 | | 5.6 | |
Post-secondary institutions | | 2,772 | | 3,024 | | 3,437 | | 3,626 | | 3,843 | | 4,092 | | 4,214 | | 4,349 | | 4,474 | | 4,652 | | 5.9 | |
| | 7,632 | | 8,037 | | 8,653 | | 9,148 | | 9,620 | | 10,108 | | 10,746 | | 11,334 | | 11,935 | | 12,558 | | 5.7 | |
Health facilities | | 2,635 | | 3,053 | | 3,511 | | 3,936 | | 4,389 | | 4,895 | | 5,317 | | 5,864 | | 6,310 | | 6,771 | | 11.1 | |
Highways, ferries and public transit | | | | | | | | | | | | | | | | | | | | | | | |
BC Transportation Financing Authority | | 2,699 | | 3,237 | | 3,948 | | 4,586 | | 5,211 | | 5,785 | | 6,278 | | 7,074 | | 7,849 | | 8,807 | | 14.0 | |
SkyTrain extension | | 1,145 | | 1,153 | | 1,153 | | 1,154 | | 1,154 | | 1,155 | | 1,175 | | 1,175 | | 1,175 | | 1,175 | | 0.3 | |
Public transit | | 959 | | 950 | | 958 | | 997 | | 997 | | 997 | | 999 | | 999 | | 999 | | 999 | | 0.5 | |
BC Transit | | 80 | | 96 | | 84 | | 94 | | 140 | | 158 | | 181 | | 176 | | 189 | | 214 | | 11.6 | |
| | 4,883 | | 5,436 | | 6,143 | | 6,831 | | 7,502 | | 8,095 | | 8,633 | | 9,424 | | 10,212 | | 11,195 | | 9.7 | |
Other | | | | | | | | | | | | | | | | | | | | | | | |
Social Housing | | 189 | | 216 | | 218 | | 286 | | 305 | | 511 | | 668 | | 660 | | 706 | | 707 | | 15.8 | |
Provincial government general capital | | — | | — | | — | | — | | 294 | | 570 | | 838 | | 1,277 | | 1,760 | | 2,217 | | n/a | |
BC Immigrant Investment Fund | | 148 | | 167 | | 256 | | 287 | | 289 | | 347 | | 400 | | 395 | | 475 | | 490 | | n/a | |
Homeowner Protection Office | | 110 | | 110 | | 136 | | 150 | | 144 | | — | | — | | — | | — | | — | | -100.0 | |
BC Pavilion Corporation | | — | | — | | — | | — | | 49 | | 250 | | 378 | | 378 | | 376 | | 374 | | n/a | |
BC Buildings | | 246 | | — | | — | | — | | — | | — | | — | | — | | — | | — | | n/a | |
Other | | 65 | | 60 | | 68 | | 64 | | 70 | | 115 | | 116 | | 118 | | 115 | | 115 | | 6.5 | |
| | 758 | | 553 | | 678 | | 787 | | 1,151 | | 1,793 | | 2,400 | | 2,828 | | 3,432 | | 3,903 | | 20.0 | |
Total other taxpayer-supported debt | | 15,908 | | 17,079 | | 18,985 | | 20,702 | | 22,662 | | 24,891 | | 27,096 | | 29,450 | | 31,889 | | 34,427 | | 9.0 | |
Total taxpayer-supported debt | | 27,251 | | 25,968 | | 26,589 | | 26,446 | | 30,021 | | 31,855 | | 34,786 | | 38,736 | | 41,656 | | 43,702 | | 5.4 | |
Self-supported debt: | | | | | | | | | | | | | | | | | | | | | | | |
Commercial Crown corporations and agencies | | | | | | | | | | | | | | | | | | | | | | | |
BC Hydro | | 6,892 | | 7,144 | | 7,633 | | 9,054 | | 10,792 | | 11,710 | | 13,466 | | 15,336 | | 16,943 | | 18,335 | | 11.5 | |
Transportation Invest. Corp. (Port Mann) | | — | | — | | — | | 20 | | 544 | | 1,148 | | 1,930 | | 2,554 | | 3,083 | | 3,187 | | n/a | |
Post-secondary institutions’ subsidiaries | | 32 | | 58 | | 115 | | 134 | | 201 | | 173 | | 173 | | 173 | | 173 | | 173 | | 20.6 | |
Columbia River power projects | | 247 | | 236 | | 219 | | 208 | | 196 | | 183 | | 482 | | 476 | | 471 | | 464 | | 7.3 | |
BC Transmission Corporation | | 30 | | 30 | | 79 | | 70 | | 70 | | — | | — | | — | | — | | — | | n/a | |
BC Lotteries | | — | | — | | — | | — | | 60 | | 85 | | 98 | | 128 | | 138 | | 143 | | n/a | |
Liquor Distribution Branch | | 5 | | 3 | | 2 | | 1 | | 1 | | — | | — | | — | | — | | — | | -100.0 | |
| | 7,206 | | 7,471 | | 8,048 | | 9,487 | | 11,864 | | 13,299 | | 16,149 | | 18,667 | | 20,808 | | 22,302 | | 13.4 | |
Warehouse borrowing program | | — | | — | | — | | 2,081 | | — | | — | | — | | — | | — | | — | | n/a | |
Total self-supported debt | | 7,206 | | 7,471 | | 8,048 | | 11,568 | | 11,864 | | 13,299 | | 16,149 | | 18,667 | | 20,808 | | 22,302 | | 13.4 | |
Forecast allowance | | — | | — | | — | | — | | — | | — | | 50 | | 200 | | 250 | | 350 | | | |
Total provincial debt | | 34,457 | | 33,439 | | 34,637 | | 38,014 | | 41,885 | | 45,154 | | 50,985 | | 57,603 | | 62,714 | | 66,354 | | 7.6 | |
Budget and Fiscal Plan – 2012/13 to 2014/15
150
Appendices
Table A18 Provincial Debt Supplementary Information — 2005/06 to 2014/15
| | | | | | | | | | | | | | Updated | | Budget | | | | | | Average | |
| | Actual | | Actual | | Actual | | Actual | | Actual | | Actual | | Forecast | | Estimate | | Plan | | Plan | | annual | |
($ millions) | | 2005/06 | | 2006/07 | | 2007/08 | | 2008/09 | | 2009/10 | | 2010/11 | | 2011/12 | | 2012/13 | | 2013/14 | | 2014/15 | | change | |
| | | | | | | | | | | | | | | | | | | | | | (per cent) | |
Per cent of nominal GDP: (1) | | | | | | | | | | | | | | | | | | | | | | | |
Taxpayer-supported debt: | | | | | | | | | | | | | | | | | | | | | | | |
Provincial government direct operating | | 6.7 | | 4.9 | | 4.0 | | 2.9 | | 3.8 | | 3.4 | | 3.6 | | 4.2 | | 4.3 | | 3.9 | | -5.9 | |
Education facilities | | 4.5 | | 4.4 | | 4.5 | | 4.6 | | 5.0 | | 5.0 | | 5.1 | | 5.2 | | 5.2 | | 5.3 | | 1.8 | |
Health facilities | | 1.6 | | 1.7 | | 1.8 | | 2.0 | | 2.3 | | 2.4 | | 2.5 | | 2.7 | | 2.8 | | 2.8 | | 6.9 | |
Highways, ferries and public transit | | 2.9 | | 3.0 | | 3.2 | | 3.4 | | 3.9 | | 4.0 | | 4.1 | | 4.3 | | 4.5 | | 4.7 | | 5.6 | |
Other | | 0.4 | | 0.3 | | 0.4 | | 0.4 | | 0.6 | | 0.9 | | 1.1 | | 1.3 | | 1.5 | | 1.6 | | 15.5 | |
Total taxpayer-supported debt | | 16.1 | | 14.2 | | 13.8 | | 13.3 | | 15.6 | | 15.7 | | 16.4 | | 17.6 | | 18.2 | | 18.3 | | 1.5 | |
Self-supported debt: | | | | | | | | | | | | | | | | | | | | | | | |
Commercial Crown corporations & agencies | | 4.2 | | 4.1 | | 4.2 | | 4.8 | | 6.2 | | 6.5 | | 7.6 | | 8.5 | | 9.1 | | 9.3 | | 9.2 | |
Warehouse borrowing program | | — | | — | | — | | 1.0 | | — | | — | | — | | — | | — | | — | | n/a | |
Total self-supported debt | | 4.2 | | 4.1 | | 4.2 | | 5.8 | | 6.2 | | 6.5 | | 7.6 | | 8.5 | | 9.1 | | 9.3 | | 9.2 | |
Total provincial debt | | 20.3 | | 18.3 | | 18.0 | | 19.1 | | 21.8 | | 22.2 | | 24.1 | | 26.2 | | 27.4 | | 27.8 | | 3.6 | |
Growth rates: | | | | | | | | | | | | | | | | | | | | | | | |
Taxpayer-supported debt: | | | | | | | | | | | | | | | | | | | | | | | |
Provincial government direct operating | | -18.8 | | -21.6 | | -14.5 | | -24.5 | | 28.1 | | -5.4 | | 10.4 | | 20.8 | | 5.2 | | -5.0 | | -2.5 | |
Education facilities | | 7.0 | | 5.3 | | 7.7 | | 5.7 | | 5.2 | | 5.1 | | 6.3 | | 5.5 | | 5.3 | | 5.2 | | 5.8 | |
Health facilities | | 17.0 | | 15.9 | | 15.0 | | 12.1 | | 11.5 | | 11.5 | | 8.6 | | 10.3 | | 7.6 | | 7.3 | | 11.7 | |
Highways, ferries and public transit | | 5.1 | | 11.3 | | 13.0 | | 11.2 | | 9.8 | | 7.9 | | 6.6 | | 9.2 | | 8.4 | | 9.6 | | 9.2 | |
Other | | 13.6 | | -27.0 | | 22.6 | | 16.1 | | 46.3 | | 55.8 | | 33.9 | | 17.8 | | 21.4 | | 13.7 | | 21.4 | |
Total taxpayer-supported debt | | -4.9 | | -4.7 | | 2.4 | | -0.5 | | 13.5 | | 6.1 | | 9.2 | | 11.4 | | 7.5 | | 4.9 | | 4.5 | |
Self-supported debt: | | | | | | | | | | | | | | | | | | | | | | | |
Commercial Crown corporations & agencies | | 0.1 | | 3.7 | | 7.7 | | 17.9 | | 25.1 | | 12.1 | | 21.4 | | 15.6 | | 11.5 | | 7.2 | | 12.2 | |
Warehouse borrowing program | | — | | — | | — | | — | | -100.0 | | — | | — | | — | | — | | — | | n/a | |
Total self-supported debt | | 0.1 | | 3.7 | | 7.7 | | 43.7 | | 2.6 | | 12.1 | | 21.4 | | 15.6 | | 11.5 | | 7.2 | | 12.6 | |
Total provincial debt | | -3.9 | | -3.0 | | 3.6 | | 9.7 | | 10.2 | | 7.8 | | 12.9 | | 13.0 | | 8.9 | | 5.8 | | 6.5 | |
Per capita: (2) | | | | | | | | | | | | | | | | | | | | | | | |
Taxpayer-supported debt: | | | | | | | | | | | | | | | | | | | | | | | |
Provincial government direct operating | | 2,703 | | 2,095 | | 1,764 | | 1,310 | | 1,650 | | 1,537 | | 1,681 | | 2,009 | | 2,086 | | 1,956 | | -3.5 | |
Education facilities | | 1,819 | | 1,894 | | 2,008 | | 2,087 | | 2,157 | | 2,232 | | 2,350 | | 2,452 | | 2,550 | | 2,648 | | 4.3 | |
Health facilities | | 628 | | 719 | | 815 | | 898 | | 984 | | 1,081 | | 1,163 | | 1,269 | | 1,348 | | 1,428 | | 9.6 | |
Highways, ferries and public transit | | 1,164 | | 1,281 | | 1,425 | | 1,558 | | 1,682 | | 1,787 | | 1,888 | | 2,039 | | 2,182 | | 2,361 | | 8.2 | |
Other | | 181 | | 130 | | 157 | | 180 | | 258 | | 396 | | 525 | | 612 | | 733 | | 823 | | 18.3 | |
Total taxpayer-supported debt | | 6,493 | | 6,119 | | 6,170 | | 6,032 | | 6,731 | | 7,033 | | 7,606 | | 8,379 | | 8,899 | | 9,215 | | 4.0 | |
Self-supported debt: | | | | | | | | | | | | | | | | | | | | | | | |
Commercial Crown corporations & agencies | | 1,717 | | 1,761 | | 1,867 | | 2,164 | | 2,660 | | 2,936 | | 3,531 | | 4,038 | | 4,445 | | 4,703 | | 11.8 | |
Warehouse borrowing program | | — | | — | | — | | 475 | | — | | — | | — | | — | | — | | — | | n/a | |
Total self-supported debt | | 1,717 | | 1,761 | | 1,867 | | 2,639 | | 2,660 | | 2,936 | | 3,531 | | 4,038 | | 4,445 | | 4,703 | | 11.8 | |
Total provincial debt | | 8,210 | | 7,880 | | 8,037 | | 8,671 | | 9,391 | | 9,968 | | 11,148 | | 12,461 | | 13,397 | | 13,991 | | 6.1 | |
Real Per Capita Provincial Debt (2014$)(3) | | 9,492 | | 8,959 | | 8,980 | | 9,489 | | 10,278 | | 10,766 | | 11,761 | | 12,891 | | 13,664 | | 13,991 | | 4.4 | |
Growth rate (per cent) | | -6.8 | | -5.6 | | 0.2 | | 5.7 | | 8.3 | | 4.7 | | 9.2 | | 9.6 | | 6.0 | | 2.4 | | 3.4 | |
(1) Debt as a per cent of GDP is calculated using nominal GDP for the calendar year ending in the fiscal year (e.g. 2012/13 debt divided by nominal GDP for the 2012 calendar year). Totals may not add due to rounding.
(2) Per capita debt is calculated using July 1 population (e.g. 2012/13 debt divided by population on July 1, 2012). Totals may not add due to rounding.
(3) Debt is converted to real (inflation-adjusted) terms using the consumer price index (CPI) for the corresponding calendar year (e.g. 2012 CPI for 2012/13 debt).
Budget and Fiscal Plan – 2012/13 to 2014/15
151
Appendices
Table A19 Key Provincial Debt Indicators — 2005/06 to 2014/15(1)
| | | | | | | | | | | | | | Updated | | Budget | | | | | | Average | |
| | Actual | | Actual | | Actual | | Actual | | Actual | | Actual | | Forecast | | Estimate | | Plan | | Plan | | annual | |
| | 2005/06 | | 2006/07 | | 2007/08 | | 2008/09 | | 2009/10 | | 2010/11 | | 2011/12 | | 2012/13 | | 2013/14 | | 2014/15 | | change | |
| | | | | | | | | | | | | | | | | | | | | | (per cent) | |
Debt to revenue (per cent) | | | | | | | | | | | | | | | | | | | | | | | |
Total provincial | | 74.8 | | 69.2 | | 69.3 | | 77.9 | | 87.5 | | 89.8 | | 96.0 | | 105.1 | | 109.9 | | 112.1 | | 4.6 | |
Taxpayer-supported | | 77.9 | | 69.8 | | 69.6 | | 71.9 | | 84.0 | | 80.6 | | 85.5 | | 92.5 | | 96.2 | | 98.6 | | 2.7 | |
Debt per capita ($) (2) | | | | | | | | | | | | | | | | | | | | | | | |
Total provincial | | 8,210 | | 7,880 | | 8,037 | | 8,671 | | 9,391 | | 9,968 | | 11,148 | | 12,461 | | 13,397 | | 13,991 | | 6.1 | |
Taxpayer-supported | | 6,493 | | 6,119 | | 6,170 | | 6,032 | | 6,731 | | 7,033 | | 7,606 | | 8,379 | | 8,899 | | 9,215 | | 4.0 | |
Debt to nominal GDP (per cent) (3) | | | | | | | | | | | | | | | | | | | | | | | |
Total provincial | | 20.3 | | 18.3 | | 18.0 | | 19.1 | | 21.8 | | 22.2 | | 24.1 | | 26.2 | | 27.4 | | 27.8 | | 3.6 | |
Taxpayer-supported | | 16.1 | | 14.2 | | 13.8 | | 13.3 | | 15.6 | | 15.7 | | 16.4 | | 17.6 | | 18.2 | | 18.3 | | 1.5 | |
Interest bite (cents per dollar of revenue) (4) | | | | | | | | | | | | | | | | | | | | | | | |
Total provincial | | 4.4 | | 4.3 | | 4.0 | | 4.4 | | 4.6 | | 4.3 | | 4.4 | | 4.5 | | 4.5 | | 4.7 | | 0.8 | |
Taxpayer-supported | | 4.4 | | 4.2 | | 3.9 | | 4.3 | | 4.3 | | 4.0 | | 4.1 | | 4.1 | | 4.2 | | 4.4 | | 0.0 | |
Interest costs ($ millions) | | | | | | | | | | | | | | | | | | | | | | | |
Total provincial | | 2,007 | | 2,069 | | 2,009 | | 2,138 | | 2,212 | | 2,164 | | 2,320 | | 2,455 | | 2,589 | | 2,775 | | 3.7 | |
Taxpayer-supported | | 1,524 | | 1,570 | | 1,487 | | 1,570 | | 1,541 | | 1,597 | | 1,658 | | 1,722 | | 1,824 | | 1,932 | | 2.7 | |
Interest rate (per cent) (5) | | | | | | | | | | | | | | | | | | | | | | | |
Taxpayer-supported | | 5.5 | | 5.9 | | 5.7 | | 5.9 | | 5.5 | | 5.2 | | 5.0 | | 4.7 | | 4.5 | | 4.5 | | -2.0 | |
| | | | | | | | | | | | | | | | | | | | | | | |
Background Information: | | | | | | | | | | | | | | | | | | | | | | | |
Revenue ($ millions) | | | | | | | | | | | | | | | | | | | | | | | |
Total provincial (6) | | 46,054 | | 48,346 | | 49,946 | | 48,808 | | 47,876 | | 50,295 | | 53,089 | | 54,831 | | 57,079 | | 59,191 | | 2.8 | |
Taxpayer-supported (7) | | 34,985 | | 37,208 | | 38,198 | | 36,788 | | 35,758 | | 39,544 | | 40,676 | | 41,892 | | 43,310 | | 44,328 | | 2.7 | |
Debt ($ millions) | | | | | | | | | | | | | | | | | | | | | | | |
Total provincial | | 34,457 | | 33,439 | | 34,637 | | 38,014 | | 41,885 | | 45,154 | | 50,985 | | 57,603 | | 62,714 | | 66,354 | | 7.6 | |
Taxpayer-supported (8) | | 27,251 | | 25,968 | | 26,589 | | 26,446 | | 30,021 | | 31,855 | | 34,786 | | 38,736 | | 41,656 | | 43,702 | | 5.4 | |
Provincial nominal GDP ($ millions) (9) | | 169,664 | | 182,251 | | 192,117 | | 199,441 | | 191,863 | | 203,147 | | 211,977 | | 219,759 | | 228,693 | | 238,648 | | 3.9 | |
Population (thousands at July 1) (10) | | 4,197 | | 4,244 | | 4,310 | | 4,384 | | 4,460 | | 4,530 | | 4,573 | | 4,623 | | 4,681 | | 4,743 | | 1.4 | |
(1) Includes fiscal data of school districts, post-secondary institutions and regional health authorities/societies (SUCH).
(2) The ratio of debt to population (e.g. 2012/13 debt divided by population at July 1, 2012).
(3) The ratio of debt outstanding at fiscal year end to provincial nominal gross domestic product (GDP) for the calendar year ending in the fiscal year (e.g. 2012/13 debt divided by 2012 nominal GDP).
(4) The ratio of interest costs (less sinking fund interest) to revenue. Figures include capitalized interest expense in order to provide a more comparable measure to outstanding debt.
(5) Weighted average of all outstanding debt issues.
(6) Includes revenue of the consolidated revenue fund (excluding dividends from enterprises) plus revenue of all government organizations and enterprises.
(7) Excludes revenue of government enterprises, but includes dividends from enterprises paid to the consolidated revenue fund.
(8) Excludes debt of commercial Crown corporations and agencies and funds held under the province’s warehouse borrowing program.
(9) Nominal GDP for the calendar year ending in the fiscal year (e.g. Nominal GDP for 2012 is used for the fiscal year ended March 31, 2013).
(10) Population at July 1st within the fiscal year (e.g. population at July 1, 2012 is used for the fiscal year ended March 31, 2013).
Budget and Fiscal Plan – 2012/13 to 2014/15
152
Visit our website at: www.bcbudget.ca

| | Ministry of Finance |