Exhibit 99.6

First Quarterly Report
Fiscal Plan Update
2012/13 — 2014/15,
2012/13 Economic Outlook and
Financial Forecast
&
Three Month Results
April — June 2012

British Columbia Cataloguing in Publication Data
British Columbia. Ministry of Finance.
Quarterly report on the economy, fiscal situation and Crown corporations. — ongoing—
Quarterly.
Title on cover: Quarterly report.
Continues: British Columbia. Ministry of Finance.
Quarterly financial report. ISSN 0833-1375.
ISSN 1192-2176 — Quarterly Report on the economy, fiscal situation and Crown corporations.
1. Finance, Public — British Columbia — Accounting — Periodicals. 2. British Columbia — Economic conditions — 1945— — Periodicals.*
3. Corporations, Government — British Columbia — Accounting — Periodicals. I. Title.
HJ13.B77 | 354.711’007231’05 |
TABLE OF CONTENTS | | |
| | |
2012/13 First Quarterly Report | | September 13, 2012 |
Part One — Updated Fiscal Plan | |
Introduction | 3 |
Changes since Budget 2012 | 4 |
Managing the natural gas royalty impacts | 5 |
Keeping debt affordable | 5 |
Other challenges | 7 |
Economic risks | 7 |
Revenue growth trends | 7 |
Expenditure management | 8 |
Infrastucture spending | 9 |
Tables: | |
1.1 | Fiscal Plan Update | 3 |
1.2 | Fiscal Plan | 5 |
1.3 | Taxpayer-supported Debt | 6 |
1.4 | Notional Allocation to Contingencies | 9 |
1.5 | Taxpayer-supported Capital Spending | 9 |
| |
Part Two — Economic Review and Outlook | |
Summary | 11 |
British Columbia Economic Activity and Outlook | 12 |
The Labour Market | 12 |
Consumer Spending and Housing | 13 |
Business and Government | 15 |
External Trade and Commodity Markets | 15 |
Demographics | 17 |
Inflation | 17 |
Risks to the Economic Outlook | 18 |
External Outlook | 18 |
United States | 18 |
Canada | 21 |
Other economies | 22 |
Financial Markets | 24 |
Exchange Rate | 25 |
Tables: | |
2.1 | British Columbia Economic Indicators | 12 |
2.2 | US real GDP forecast: Consensus vs Ministry of Finance | 20 |
2.3 | Canadian real GDP forecast: Consensus vs Ministry of Finance | 22 |
2.4 | Private Sector Canadian Interest Rate Forecasts | 25 |
2.5 | Private Sector Exchange Rate Forecasts | 26 |
2.6.1 | Gross Domestic Product: British Columbia | 27 |
2.6.2 | Components of Nominal Income and Expenditure | 28 |
2.6.3 | Labour Market Indicators | 28 |
2.6.4 | Major Economic Assumptions | 29 |
| | | |
First Quarterly Report 2012/13
Table of Contents
Part Three — First Quarterly Report | |
Introduction | 31 |
Revenue | 32 |
Expense | 34 |
Consolidated Revenue Fund spending | 34 |
Contingencies | 34 |
Spending recovered from third parties | 34 |
Operating transfers to service delivery agencies | 35 |
Service delivery agency spending | 35 |
Managing the natural gas royalty impacts | 35 |
Government employment (FTEs) | 35 |
Provincial capital spending | 36 |
Provincial debt | 36 |
Risks to the Fiscal Forecast | 37 |
Tables: | |
3.1 | 2012/13 Forecast Update | 31 |
3.2 | 2012/13 Forecast – Changes from Budget 2012 | 32 |
3.3 | 2012/13 Notional Allocations to Contingencies | 34 |
3.4 | 2012/13 Capital Spending Update | 36 |
3.5 | 2012/13 Provincial Debt Update | 37 |
3.6 | 2012/13 Operating Statement | 38 |
3.7 | 2012/13 Revenue by Source | 39 |
3.8 | 2012/13 Expense by Ministry, Program and Agency | 40 |
3.9 | 2012/13 Expense by Function | 41 |
3.10 | 2012/13 Capital Spending | 42 |
3.11 | Capital Expenditure Projects Greater Than $50 million | 43 |
3.12 | 2012/13 Provincial Debt | 45 |
3.13 | 2012/13 Statement of Financial Position | 46 |
| |
Appendix | |
Tables: | |
A1 | Material Assumptions – Revenue | 47 |
A2 | Natural Gas Price Forecasts – 2012/13 to 2014/15 | 52 |
A3 | Material Assumptions – Expense | 53 |
A4 | Operating Statement – 2005/06 to 2014/15 | 55 |
A5 | Revenue by Source – 2005/06 to 2014/15 | 56 |
A6 | Revenue by Source Supplementary Information – 2005/06 to 2014/15 | 57 |
A7 | Expense by Function – 2005/06 to 2014/15 | 58 |
A8 | Expense by Function Supplementary Information – 2005/06 to 2014/15 | 59 |
A9 | Full-Time Equivalents (FTEs) – 2005/06 to 2014/15 | 60 |
A10 | Capital Spending – 2005/06 to 2014/15 | 61 |
A11 | Statement of Financial Position – 2005/06 to 2014/15 | 62 |
A12 | Changes in Financial Position – 2005/06 to 2014/15 | 63 |
A13 | Provincial Debt – 2005/06 to 2014/15 | 64 |
A14 | Provincial Debt Supplementary Information – 2005/06 to 2014/15 | 65 |
A15 | Key Provincial Debt Indicators – 2005/06 to 2014/15 | 66 |
First Quarterly Report 2012/13
2
PART ONE — UPDATED FISCAL PLAN
2012/13 First Quarterly Report | September 13, 2012 |
Introduction
Government’s updated fiscal plan reflects its ongoing commitment to balance the budget by 2013/14 despite significant reductions in natural resource revenue. While the deficit for 2012/13 has increased to $1.1 billion, 2013/14 is projected to have a surplus of $30 million, and 2014/15 a surplus of $235 million.
Table 1.1 Fiscal Plan Update
($ millions) | | 2012/13 | | 2013/14 | | 2014/15 | |
Budget 2012 Fiscal Plan | | (968 | ) | 154 | | 250 | |
Fiscal plan updates: | | | | | | | |
Market impact on natural gas royalties | | (241 | ) | (389 | ) | (483 | ) |
Other revenue decreases | | (136 | ) | (157 | ) | (212 | ) |
Expense adjustments (increases) decreases | | (87 | ) | (17 | ) | 147 | |
Reduction in forecast allowance | | 50 | | 50 | | 50 | |
Fiscal plan before mitigation of natural gas royalty reductions | | (1,382 | ) | (359 | ) | (248 | ) |
Manage impact of natural gas royalty reductions | | 241 | | 389 | | 483 | |
Updated fiscal plan | | (1,141 | ) | 30 | | 235 | |
| | | | | | | |
Prudence included in fiscal plan: | | | | | | | |
Contingencies | | (300 | ) | (250 | ) | (250 | ) |
Forecast allowance | | (150 | ) | (200 | ) | (300 | ) |
| | | | | | | |
Capital spending: | | | | | | | |
Taxpayer-supported capital spending | | 3,715 | | 3,572 | | 3,185 | |
Self-supported capital spending | | 3,194 | | 2,850 | | 2,767 | |
| | 6,909 | | 6,422 | | 5,952 | |
Provincial Debt: | | | | | | | |
Taxpayer-supported debt | | 38,679 | | 41,764 | | 43,808 | |
Self-supported debt | | 17,907 | | 20,279 | | 22,085 | |
Total debt (including forecast allowance) | | 56,736 | | 62,243 | | 66,193 | |
| | | | | | | |
Taxpayer-supported debt-to-GDP ratio | | 17.4 | % | 18.1 | % | 18.3 | % |
| | | | | | | |
| | 2012 | | 2013 | | 2014 | |
Economic Forecast: | | | | | | | |
Real GDP growth | | 2.0 | % | 1.8 | % | 2.3 | % |
Nominal GDP growth | | 3.9 | % | 3.6 | % | 4.2 | % |
In order to achieve a balanced budget by 2013/14, government intends to introduce measures to manage the natural gas market impacts on royalty revenue.
Over the next few months, government will be consulting with British Columbians on their views on how to address this fiscal challenge.
First Quarterly Report 2012/13
Updated Fiscal Plan
Changes since Budget 2012
The commodity markets and their impact on natural resource revenue continue to pose challenges for government in meeting its fiscal plan objectives. This is especially true of natural gas prices, which in the past have fluctuated by up to 25 per cent from the private sector forecasts used in preparing budget projections.
Chart 1.1 Three-year cumulative changes in the fiscal plan
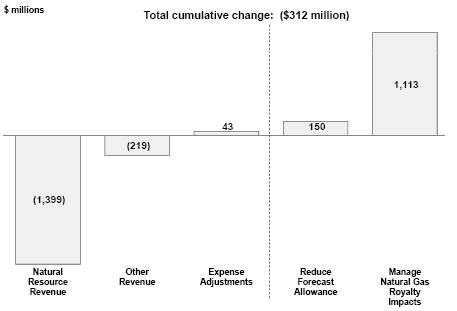
Based on current price and volume projections, natural resource revenue is down by $1.4 billion over the fiscal plan period compared to the Budget 2012 forecast. Almost 80 percent, or $1.1 billion, of this deterioration is the result of declining natural gas prices and volumes.
The remainder of the fiscal plan is basically on track, with relatively minor declines in other revenue sources and a slight adjustment to overall expense. Expenses have increased in 2012/13 due to statutory flood-related spending and direct firefighting costs. Expenses are virtually unchanged in 2013/14, and are lower in 2014/15 due to a reduction in federal government funded programs delivered by the province.
These adjustments have resulted in an increase to the projected deficit for 2012/13 ($173 million higher) and reductions to the projected surpluses in 2013/14 ($124 million lower) and 2014/15 ($15 million lower) compared to the Budget 2012 fiscal plan. Government anticipates making further adjustments to the projected surpluses in these years as forecasts and corresponding mitigation strategies are finalized and implemented.
Government has adjusted the forecast allowance downward by $50 million in each year of the fiscal plan as a significant portion of the downside risks are now reflected in the fiscal plan projections.
First Quarterly Report 2012/13
4
Updated Fiscal Plan
Table 1.2 Fiscal Plan
($ millions) | | 2012/13 | | 2013/14 | | 2014/15 | |
Revenue: | | | | | | | |
Taxation | | 21,073 | | 21,434 | | 22,365 | |
Natural resources | | 2,653 | | 2,847 | | 2,938 | |
Other | | 9,089 | | 9,479 | | 9,472 | |
Contributions from the federal government | | 7,248 | | 7,545 | | 7,373 | |
Commercial Crown corporation net income | | 2,661 | | 2,752 | | 2,868 | |
| | 42,724 | | 44,057 | | 45,016 | |
Expense: | | | | | | | |
Health | | 17,999 | | 18,634 | | 19,127 | |
Education | | 11,814 | | 11,879 | | 11,787 | |
Social services | | 3,935 | | 3,686 | | 3,691 | |
Other expenses | | 7,786 | | 7,468 | | 7,598 | |
Debt servicing | | 2,422 | | 2,549 | | 2,761 | |
| | 43,956 | | 44,216 | | 44,964 | |
Subtotal | | (1,232 | ) | (159 | ) | 52 | |
Manage natural gas market impact on royalties | | 241 | | 389 | | 483 | |
Forecast allowance | | (150 | ) | (200 | ) | (300 | ) |
Updated fiscal plan | | (1,141 | ) | 30 | | 235 | |
Managing the natural gas royalty impacts
The deterioration in natural gas royalty revenue is the main issue that needs to be managed in order to balance the budget. Currently, the impact on the fiscal plan totals $1,113 million. However, given the volatility in the natural gas market, this impact could change significantly between now and Budget 2013.
Government will need to adopt revenue and/or expense measures as part of its management strategy. Measures to balance will always be taken in the context of government’s stated commitment to maintaining and protecting core government services, retaining competitiveness and putting families first.
Immediate measures include a freeze on hiring across the BC Public Service and a salary freeze for all public sector excluded management staff, including those in Crown corporations and the SUCH sector (schools, universities, colleges and health organizations). Other measures will be introduced as needed. Only those measures needed to achieve government’s fiscal plan objectives will be implemented.
The Budget Consultation Paper will provide British Columbians with the opportunity to express their views on how to address this fiscal challenge.
Keeping debt affordable
The natural gas market situation — i.e. declining natural gas prices and volumes — has also resulted in lower levels of natural gas exploration. Consequently, cash proceeds from sales of Crown land tenures for natural gas exploration (i.e. bonus bids) have declined by 78 per cent over the fiscal plan period. While only a portion of the bonus bid impact is reflected in the fiscal plan operating results (bonus bid cash proceeds are allocated to revenue over a nine year period), the debt impact from the loss in cash flow is immediate.
First Quarterly Report 2012/13
5
Updated Fiscal Plan
Table 1.3 Taxpayer-supported Debt
($ millions) | | 2012/13 | | 2013/14 | | 2014/15 | | Total | |
Budget 2012 Fiscal Plan | | 38,736 | | 41,656 | | 43,702 | | | |
Fiscal plan updates: | | | | | | | | | |
Impact of prior year changes | | — | | (57 | ) | 108 | | | |
Operating debt changes: | | | | | | | | | |
Natural gas royalty impacts | | 241 | | 389 | | 483 | | 1,113 | |
less: measures to manage impacts | | (241 | ) | (389 | ) | (483 | ) | (1,113 | ) |
Other CRF operating results | | (44 | ) | 79 | | 31 | | 66 | |
Lower bonus bid cash proceeds | | 233 | | 253 | | 258 | | 744 | |
Capital debt changes: | | | | | | | | | |
Lower spending in 2011/12 | | (217 | ) | — | | — | | (217 | ) |
Other capital spending impacts | | 235 | | 44 | | 67 | | 346 | |
Capital planning adjustments | | (264 | ) | (211 | ) | (358 | ) | (833 | ) |
| | (57 | ) | 108 | | 106 | | 106 | |
Updated fiscal plan | | 38,679 | | 41,764 | | 43,808 | | | |
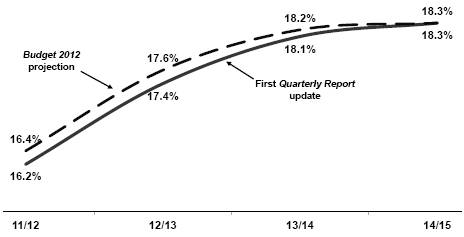
The $1.1 billion three year debt impact from lower natural gas royalties will be almost entirely offset by the measures government intends to take to manage this impact in combination with other CRF operating results. However, the loss of cash flow from bonus bids would add $744 million to taxpayer-supported debt by 2014/15 if not managed. This has significant implications for debt affordability as measured by the taxpayer-supported debt to GDP ratio.
Taxpayer-supported debt is impacted by both operating results and government’s capital plan (approximately three-fourths of taxpayer-supported debt results from capital spending). In order to maintain debt affordability, government will introduce capital planning adjustments that will seek to reduce debt by $833 million over the three year fiscal plan period in order to offset the impacts of the reduced cash flow from bonus bids.
As is the case with measures to balance the budget, only those adjustments that are required to keep the taxpayer-supported debt burden on track will be implemented.
Chart 1.2 Taxpayer debt burden unchanged
First Quarterly Report 2012/13
6
Updated Fiscal Plan
Other Challenges
Economic risks
There continue to be substantial downside risks to BC’s economic growth, including:
· a return to recession in the US economy (characterized by weaker consumer spending, further deleveraging causing slower investment, continued weakness in the housing sector, a very slow job market recovery and further fiscal restraint by federal, state and local governments);
· the European sovereign debt crisis — now posing significant problems in large economies like Italy and Spain — threatening the stability of global financial markets;
· slower than anticipated Asian demand resulting in weaker demand for BC’s exports;
· further appreciation of the Canadian dollar; and
· further weakening of the US dollar resulting in significant disruptions to global financial and commodity markets.
Revenue growth trends
Excluding the updated forecast for natural gas royalties, overall revenue is expected to average 2.8 per cent annual growth over the three year fiscal plan period (2012/13 to 2014/15), down slightly from 3.1 per cent assumed in the Budget 2012 outlook.
Taxation revenue is expected to average 3.5 per cent growth, unchanged from the Budget 2012 forecast, based on the updated BC economic forecast, a revised federal government outlook affecting corporate income tax instalments and actual results for 2011/12. Nominal GDP is expected to average 3.9 per cent annual growth over the fiscal plan period compared to 4.0 per cent at budget.
Chart 1.3 Three year average annual revenue growth excluding natural gas royalties

* Excludes $580-million HST transition payment in 2011/12
First Quarterly Report 2012/13
7
Updated Fiscal Plan
Natural resource revenue, excluding natural gas royalties, is expected to average 1.4 per cent growth per year, down from 2.5 per cent assumed at budget. The change from budget is mainly due to weaker sales and leases of Crown land tenures for gas and oil exploration and drilling, which are now expected to decline 5.3 per cent annually on average over the fiscal plan period, compared to a 2.1 per cent annual decline assumed at budget.
Other revenue sources, which include fees, licenses, investment earnings, and asset sales, is forecast to grow 3.2 per cent annually compared to the Budget 2012 outlook of 3.5 per cent average annual growth. The reduction mainly reflects the impact of lower population growth and revised revenue submissions from taxpayer supported agencies.
Revenue from federal government contributions is expected to grow 1.1 per cent per year on average over the fiscal plan period compared to the 1.9 per cent growth in Budget 2012, and reflects the change to per capita funding entitlement for the Canada Health Transfer in 2014/15. Lower population growth beginning in 2012, updated forecasts prepared by taxpayer-supported agencies and the impacts of the federal government’s budget decision to assume management responsibility for immigration programs in 2014/15 are contributing to weaker average annual growth compared to budget.
The updated outlook assumes net income from commercial Crown corporations averages 2.3 per cent annual growth, based on forecasts provided by the individual Crown corporations. The forecast reflects BC Hydro’s revenue requirements driven by its capital plan and includes the assumption that tolls on the Port Mann Bridge will be phased in.
Expenditure management
Any expense measures proposed to manage the natural gas royalty impacts will be considered within the context that average annual spending growth has already been restricted to 2.0 per cent over the next two years of the fiscal plan, (which is below actual historic spending growth).
As well, government continues to face pressures on its expenditure management regimen that include increasing demand for government programs such as health care, K—12 and post-secondary education, and community social services, and statutory program cost pressures such as floods, fires and litigation.
In Budget 2012, government outlined a Cooperative Gains public sector compensation bargaining mandate which allows public sector employers to negotiate modest wage increases provided they are funded from a combination of productivity increases, efficiencies and savings to be found within existing budgets. Given the current fiscal situation, government may need to review this bargaining mandate.
The Contingencies Vote is a prudent budgeting measure that protects the fiscal plan from unforeseen and unbudgeted costs that may arise.
First Quarterly Report 2012/13
8
Updated Fiscal Plan
Table 1.4 Notional Allocations to Contingencies
($ millions) | | 2012/13 | | 2013/14 | | 2014/15 | |
2010 Sports and Arts Legacy | | 20 | | — | | — | |
Climate action and clean energy initiatives | | 40 | | — | | — | |
Community Living BC anticipated caseload increases | | 12 | | 12 | | 12 | |
Elections BC event-related funding | | 15 | | — | | — | |
Subtotal notional allocations | | 87 | | 12 | | 12 | |
Reserved for unforeseen pressures related to litigation, caseload, natural disasters, and other contingent items | | 213 | | 238 | | 238 | |
Total contingencies | | 300 | | 250 | | 250 | |
Infrastructure spending
Taxpayer-supported infrastructure spending on hospitals, schools, post-secondary facilities, transit and roads over the three year fiscal plan period is projected to total $10.5 billion. This spending incorporates a number of changes since Budget 2012, including:
· $193 million in new capital spending to meet the needs for delivering essential services and to maintain existing highway infrastructure;
· $257 million in additional capital spending funded from external sources, which has no impact on the debt projections in Budget 2012; and
· $336 million in increases during the fiscal plan period due to project scheduling changes primarily as a result of capital spending being carried forward from 2011/12.
Table 1.5 Taxpayer-supported Capital Spending
($ millions) | | 2012/13 | | 2013/14 | | 2014/15 | | Total | |
Budget 2012 Fiscal Plan | | 3,757 | | 3,477 | | 3,429 | | | |
Fiscal plan updates: | | | | | | | | | |
Project approvals since budget | | 91 | | 65 | | 37 | | 193 | |
Additional externally-funded capital spending by post-secondary institutions | | 53 | | 59 | | 145 | | 257 | |
Project scheduling changes | | 222 | | 182 | | (68 | ) | 336 | |
Capital planning adjustments | | (408 | ) | (211 | ) | (358 | ) | (977 | ) |
| | (42 | ) | 95 | | (244 | ) | (191 | ) |
Updated fiscal plan | | 3,715 | | 3,572 | | 3,185 | | | |
In order to maintain debt affordability, government will have to reduce capital spending by $977 million over the three year fiscal plan period, resulting in a $191 million reduction to the capital plan forecast over the fiscal plan period compared to the Budget 2012 projection. Projects that are underway or have been approved and announced will be exempt from this process.
As some of the capital planning adjustments will involve co-funded projects in the healthcare and transportation sectors, the capital spending reduction is higher than the eventual debt impact. Externally funded capital spending and project scheduling changes have no impact on the debt projections in Budget 2012.
Most of government’s capital spending is for new facilities. Government is facing a growing demand to modernize and extend the life of existing facilities. Any capital planning adjustments will need to balance this demand against proposed allocations for new facilities.
First Quarterly Report 2012/13
9
PART TWO — ECONOMIC REVIEW AND OUTLOOK (1)
2012/13 First Quarterly Report | September 13, 2012 |
Summary
· The Ministry of Finance forecasts BC’s real GDP to grow by 2.0 per cent in 2012, 1.8 per cent in 2013 and about 2.4 per cent per year in the medium-term.
· The forecast for relatively slow near-term growth in the BC economy is mainly due to continued weakness in Europe, the sluggish US recovery and the potential for further slowing of global economic activity.
Chart 2.1 Ministry forecast prudent relative to private sector
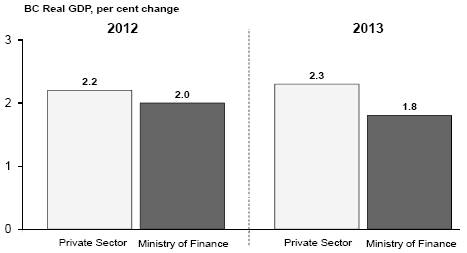
Source: BC Ministry of Finance and average private sector forecast (BMO, CIBC, Global Insight, RBC, Scotiabank and TD as of August 29, 2012)
In recognition of the significant downside risks to the outlook, the Ministry’s forecast incorporates a degree of prudence compared to the private sector. Relative to the average of six private sector forecasters (a subset of the Economic Forecast Council), the Ministry’s outlook for BC’s real GDP growth is 0.2 percentage points lower than the private sector in 2012 and 0.5 percentage points lower in 2013.
The prudence instilled is based on the following substantial downside risks:
· a return to recession in the US economy (characterized by weaker consumer spending, further deleveraging causing slower investment, continued weakness in the housing sector, a very slow job market recovery and further fiscal restraint by federal, state and local governments);
· the European sovereign debt crisis — now posing significant problems in large economies like Italy and Spain — threatening the stability of global financial markets;
· slower than anticipated Asian demand resulting in weaker demand for BC’s exports;
· further appreciation of the Canadian dollar; and
· further weakening of the US dollar resulting in significant disruptions to global financial and commodity markets.
(1) Reflects information available as of August 29, 2012.
First Quarterly Report 2012/13
Economic Review and Outlook
British Columbia Economic Activity and Outlook
The Ministry’s forecast for BC’s real GDP growth in 2012 is slightly higher than the 1.8 per cent projected in Budget 2012, as year-to-date data now points to stronger domestic economic activity than anticipated earlier in the year. Overall through the first half of 2012, the BC indicators listed in Table 2.1 show improvement compared to the same period in 2011. However, while domestic activity improved in recent quarters, external activity has been relatively weak during the same period.
Table 2.1 British Columbia Economic Indicators
All data seasonally adjusted | | Jan. to Mar. 2012
change from
Oct. to Dec. 2011 | | Apr. to Jun 2012
change from
Jan. to Mar. 2012 | | Year-to-Date
Jan. to Jun 2012
change from
Jan. to Jun 2011 | |
| | | | Per cent change | | | |
Employment | | +0.4 | | +1.0 | | +1.9 | |
Manufacturing shipments | | 0.0 | | +0.6 | | +1.1 | |
Exports | | -2.4 | | -2.6 | | +0.4 | |
Retail sales | | +0.4 | | -0.4 | | +4.0 | |
Housing starts | | +2.1 | | +7.3 | | +12.5 | |
Non-residential building permits | | +25.1 | | +5.9 | | +31.6 | |
For BC’s economic growth in 2013, the Ministry’s forecast has been lowered to 1.8 per cent from the 2.2 per cent projected in Budget 2012. This downgrade to the 2013 forecast from Budget 2012 is largely due to the expectation of a significant slowdown in global demand for BC products next year. This, in turn, will add substantial downward pressure on BC’s exports, resulting in lower 2013 economic growth than anticipated earlier this year.
The Labour Market
BC’s labour market saw improvement through the first seven months of 2012, as year-to-date employment increased by 1.9 per cent compared to the same period of 2011. This translates into 41,900 more jobs in 2012, with a decline of 12,300 part-time jobs more than offset by an increase of 54,300 full-time jobs compared to the first seven months of 2011.
Chart 2.2 BC employment recovering
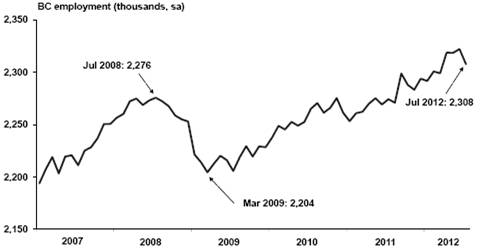
Source: Statistics Canada
First Quarterly Report 2012/13
12
Economic Review and Outlook
Major year-to-date employment gains in 2012 were observed in manufacturing (+13.1 per cent); health care and social assistance (+9.2 per cent); forestry, fishing, mining, oil and gas (+9.1 per cent); and information, culture and recreation (+5.8 per cent). These increases worked to offset significant year-to-date job losses in other industries, such as public administration (-12.4 per cent, driven by substantial losses in the federal and local components), accommodation and food service (-6.6 per cent) and construction (-3.4 per cent).
Year-to-date to July, the provincial unemployment rate averaged 6.9 per cent, 1.0 percentage points lower than the same period in 2011. Meanwhile, BC’s labour force expanded by 0.8 per cent compared to the first seven months of 2011.
Outlook
The Ministry forecasts employment in BC to increase by 1.4 per cent in 2012, or approximately 32,000 jobs. The pace of employment growth is projected to hold fairly steady in 2013, with an expected increase of 1.3 per cent, or 30,000 jobs. BC’s labour force is forecast to increase by 1.0 per cent in 2012, leading to a decrease in the annual unemployment rate (which is expected to average of 7.1 per cent on the year). The provincial unemployment rate is then projected to drop again to average 7.0 per cent in 2013.
Consumer Spending and Housing
Retail sales advanced 4.0 per cent year-to-date to June 2012, primarily due to gains in sales at clothing and accessories stores, motor vehicle and parts dealers, and health and personal care stores. BC’s rate of retail sales growth through the first six months of 2012 placed it fourth among Canadian provinces and higher than the national average rate of 3.4 per cent.
Chart 2.3 BC retail sales
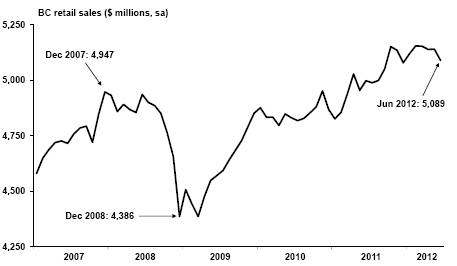
Source: Statistics Canada
First Quarterly Report 2012/13
13
Economic Review and Outlook
Chart 2.4 BC housing starts trending flat
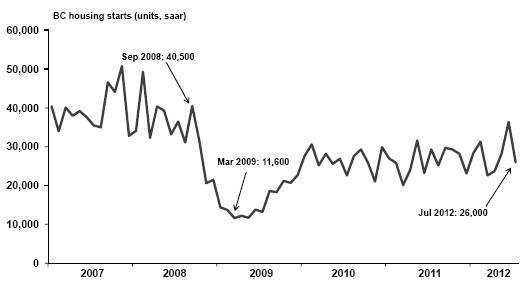
Source: Canada Mortgage and Housing Corporation
After trending flat in 2011, housing starts in the province increased through the first seven months of 2012. Year-to-date to July, BC housing starts averaged around 28,100 annualized units, an increase of 8.6 per cent over the same period in 2011, with an improvement in multiple unit starts more than offsetting a decline in single unit starts.
Residential building permits (a leading indicator of new housing activity) jumped by 12.4 per cent year-to-date to June. Meanwhile, the value of non-residential building permits increased by 31.6 per cent compared to the first six months of 2011.
MLS home sales in BC through the seven months of 2012 are down compared to the same period last year. Year-to-date to July, home sales declined by 8.0 per cent compared to the first seven months of 2011. At the same time, home prices in BC averaged $521,500 — a drop of 8.9 per cent relative to the first seven months of last year. Tighter mortgage rules recently introduced by the federal government are likely adding some downward pressure to current housing sales and prices in BC.
Outlook
The Ministry forecasts real consumption of goods and services to increase by 2.5 per cent in 2012, following estimated growth of 2.0 per cent in 2011. Real consumer spending is projected to grow by 2.4 per cent in 2013.
In current dollars, retail sales are expected to grow by 3.4 per cent this year, following the 3.1 per cent increase experienced in 2011. Sales are forecast to expand again in 2013, with a 3.4 per cent increase projected.
Housing starts are expected to remain lower than the elevated levels observed during the pre-recession boom. The Ministry forecasts housing starts to total approximately 26,000 units in 2012 — a slight decrease from the 26,400 starts observed in 2011. Housing starts are then projected to reach about 24,900 units in 2013.
First Quarterly Report 2012/13
14
Economic Review and Outlook
Business and Government
Real business investment (including residential) is estimated to have grown by 2.9 per cent in 2011, following a strong gain of 13.9 per cent in 2010. The improvement in investment last year is attributable to steady increases in the residential and non-residential construction components, as well as the machinery and equipment component.
Total real dollar expenditures by federal, provincial and municipal governments are estimated to have grown by 0.3 per cent in 2011. This follows government spending growth of 1.6 per cent in 2010.
Business activity has offered mixed signals so far in 2012, with bankruptcies rising 20.8 per cent year-to-date to May while incorporations advanced by 2.5 per cent year-to-date to July compared to their respective periods in 2011. In addition, non-residential building permits in BC jumped 31.6 per cent year-to-date to June 2012.
Outlook
Real business investment (including residential) is forecast to rise by 3.6 per cent in 2012, supported by healthy investment gains in non-residential construction and machinery and equipment along with an increase in residential construction investment. Growth in business investment of 4.2 per cent is expected for 2013.
Combined real spending by the three levels of government (federal, provincial and municipal) on goods and services is forecast to increase by 2.5 per cent in 2012. Government spending growth is then projected to fall by 0.7 per cent in 2013.
The Ministry projects corporate pre-tax profits to rise by 4.4 per cent in 2012, following a sizeable estimated increase of 13.4 per cent in 2011. Corporate profits are then expected to advance by just 1.8 per cent in 2013, with the slowdown due to weaker expected foreign demand for BC exports pushing down profits next year.
External Trade and Commodity Markets
Despite a strong export performance in 2011, slowing global demand dampened BC’s international trade through the first half of 2012. As such, the value of BC’s merchandise exports increased by just 0.4 per cent through the first six months of 2012 compared to the same period the previous year. Gains in exports of machinery and equipment (+13.7 per cent), agriculture and fish (+5.4 per cent) and forestry products (+0.3 per cent) were offset by declines in industrial and consumer goods (-5.2 per cent) and energy products (-1.1 per cent).
Shipments of manufactured goods from BC were also modest through the first six months of 2012. Year-to-date to June, BC’s manufacturing shipments have grown 1.1 per cent compared to the same period in 2011. Notable gains were recorded in shipments of transportation equipment (+37.7 per cent), machinery (+12.6 per cent) and non-metallic mineral products (+5.8 per cent) while major losses occurred in shipments of paper (-11.0 per cent) and primary metals (-4.1 per cent).
First Quarterly Report 2012/13
15
Economic Review and Outlook
Chart 2.5 BC merchandise exports

Source: BC Stats
While most commodity prices have recovered since the 2008/09 recession, they are expected to remain volatile in the near-term due to ongoing global economic uncertainty (especially due to the potential slowdown in Chinese demand for BC products).
Metal and mineral prices have seen significant declines through the first half of 2012, as slowing global demand has lowered these prices relative to the first half of 2011. Year-to-date to June, substantial price decreases have occurred in molybdenum (-23.6 per cent), lead (-21.3 per cent), aluminum (-18.7 per cent), silver (-11.2 per cent), copper (-14.0 per cent) and magnesium (-9.0 per cent). However, the price of gold increased compared to 2011, climbing 14.3 per cent year-to-date to June.
The monthly price of lumber started the year at $254 US/000 board feet in January and increased steadily to reach $305 US/000 board feet in May. The price stalled somewhat in recent months, however, arriving at $293 US/000 board feet in July. The lumber price averaged $282 US/000 board feet year-to-date to July, representing an increase of 6.1 per cent over the first seven months of 2011.
In contrast, the price of pulp has fallen since reaching the record high observed in June and July of last year ($1,016 US per tonne). Pulp averaged $835 US per tonne through the first seven months of this year and fell to a monthly value of $812 US per tonne in July 2012.
The price of natural gas has hovered around historically low levels since early-2010. Plant Inlet prices averaged just $1.13 C/GJ year-to-date to July, a sizable 56.8 per cent drop from the $2.61 C/GJ observed during the same period in 2011.
Oil prices were fairly high through the first seven months of 2012, with the West Texas Intermediate daily oil price averaging $96.63 US/barrel year-to-date to July. This represents a 1.4 per cent decrease relative to the same period in 2011. The daily oil price reached as high as $109.39 US/barrel in February but has retreated in recent months, dipping as low as $77.72 US/barrel in June.
First Quarterly Report 2012/13
16
Economic Review and Outlook
Outlook
Real exports of goods and services are forecast to grow by 1.6 per cent in 2012, significantly slower than the estimated annual gain of 5.5 per cent in 2011. The pace of real export growth is forecast to remain modest in 2013, reaching 2.4 per cent on the year. Near-term weakness in BC’s exports is due to the expectation of much slower international demand for BC products in 2012 and 2013 compared to previous years.
Weakness in the US housing market is expected to continue to weigh on Western SPF lumber prices, which are forecast to average $284 US/000 board feet in 2012. As the US housing market slowly recovers, moderate price increases are expected to follow. Prices are anticipated to average $294 US/000 board feet in 2013.
The price of natural gas is forecast to remain at a historically low level in the near-term due to an abundance of shale gas in North America and the expected slowing of the global economy. Based on private sector forecasts, the price of natural gas is projected to average $1.41 C/GJ in fiscal year 2012/13 and then rise slightly to $2.12 C/GJ in 2013/14.
Demographics
BC’s population grew 1.0 per cent in the January to March quarter of 2012 compared to the same period of 2011. During this quarter, BC saw a net inflow of 6,465 people, as the province welcomed 9,019 people from other countries but lost 2,554 people to other provinces — registering BC’s fifth consecutive quarterly interprovincial outflow dating back to the first quarter of 2011.
Outlook
The forecast calls for BC’s July 1st population to increase by 0.7 per cent in 2012, to reach a total of 4.61 million people, and by a further 1.2 per cent in 2013, to reach 4.66 million.
Total net migration is forecast to improve in 2012, reaching a net inflow of 40,400 persons on the year. This follows a net inflow of 34,000 persons in 2011 and is due to strong international migration (+41,000 persons) offsetting an outflow to other provinces (-600 persons). In 2013, total net migration is projected to increase again, resulting in a greater net inflow of 46,800 persons to BC.
Inflation
Consumer price inflation in BC grew 1.5 per cent year-to-date to July 2012 compared to the first seven months of 2011, as increases in the prices of non-durables, semi-durables and services offset price deflation in durable goods. Increases in prices for food, gasoline and electricity drove the overall rise in the non-durable component while higher prices for food purchased in restaurants added upward pressure to services. Prices for durables eased in response to lower prices for furniture, while higher prices for clothing and footwear pushed up to the overall increase in the semi-durables component.
Outlook
Consumer price inflation in BC is forecast to be 1.9 per cent in 2012 and 1.5 per cent in 2013. By contrast, the Canadian rate of inflation is assumed to be 2.1 per cent in 2012 and then expected to moderate slightly to 2.0 per cent in 2013.
First Quarterly Report 2012/13
17
Economic Review and Outlook
Risks to the Economic Outlook
The Ministry’s forecast is more prudent than the private sector outlook in recognition of the following substantial downside risks:
· a return to recession in the US economy (characterized by weaker consumer spending, further deleveraging causing slower investment, continued weakness in the housing sector, a very slow job market recovery and further fiscal restraint by federal, state and local governments);
· the European sovereign debt crisis — now posing significant problems in larger economies like Italy and Spain — threatening the stability of global financial markets;
· slower than anticipated Asian demand resulting in weaker demand for BC’s exports;
· further appreciation of the Canadian dollar; and
· further weakening of the US dollar resulting in significant disruptions to global financial and commodity markets.
External Outlook
United States
The sluggish pace of the US economic recovery continued through the first half of 2012, as the weak labour market, slow housing activity and high debt levels dampened the pace of real GDP growth. This long recovery period, following the housing collapse and ensuing financial crisis that began in late 2008, is likely to continue for several years. This is consistent with economic behaviour in a balance sheet recession — where the collapse of a large asset bubble is followed by at least a decade of weak activity and high unemployment.
Chart 2.6 Slowing pace of US real GDP growth
US real GDP (Second Estimate, annualized q/q per cent change)
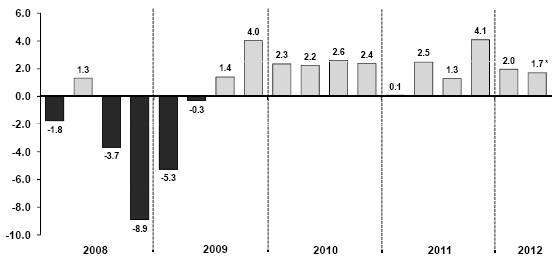
Source: US Bureau of Economic Analysis | * Second estimate, subject to revision |
First Quarterly Report 2012/13
18
Economic Review and Outlook
The pace of US real GDP growth slowed through the first two quarters of 2012, expanding at a 2.0 per cent annualized rate in the January to March quarter followed by a 1.7 per cent annualized rate in the April to June quarter. Weaker consumption was the primary driver behind the slowdown in the most recent quarter, while slowing investment and stronger imports also contributed. Consumer and business confidence were suppressed in the second quarter by several factors, including: elevated fuel prices; growing uncertainty over the ongoing European debt crisis; a mild winter that moved spring economic activity ahead to the winter months; and the looming “fiscal cliff” (where current federal legislation dictates that large tax increases and spending cuts will take effect at the start of 2013, unless a stalled US Congress takes action to halt these changes).
The US employment situation remains deeply troubled, with 4.8 million jobs lost since the January 2008 peak (a decline of 3.5 per cent). Although the monthly unemployment rate has gradually fallen since peaking at 10.0 per cent in October 2009, the rate still sits at a relatively high 8.3 per cent as of July 2012. Positive monthly job gains were observed through the first seven months of 2012, at a pace of about 151,300 jobs per month. The majority of year-to-date job gains occurred in service industries, which added 1.5 million jobs compared to the same period in 2011. Employment in the goods-producing industries improved by about 347,000 jobs year-to-date to July relative to the first seven months of last year.
Chart 2.7 US housing starts trending flat
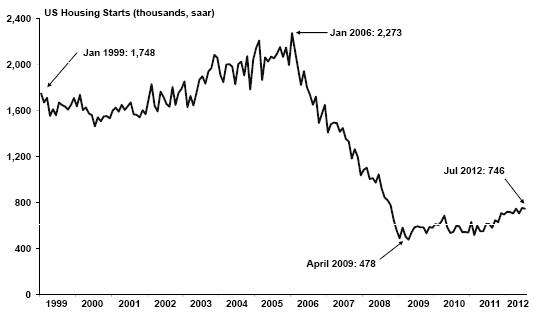
Source: US Census Bureau
The slumping American housing market continued to be a source of weakness for the US economy through the first seven months of 2012. Despite positive gains compared to a very weak 2011, housing starts averaged just 728,100 units year-to-date to July 2012. This represents a 24.9 per cent increase compared to the first seven months of 2011, but is about one third of the level observed during the height of the housing boom in early 2006. Existing home sales are also suffering in the US, remaining at very low levels through the first half of 2012. Despite a 7.4 per cent gain year-to-date to July, existing home sales averaged just 4.5 million annualized units during this period (significantly
First Quarterly Report 2012/13
19
Economic Review and Outlook
lower than the peak of 7.3 million annualized units reached in September 2005). The weak US job situation and negative home equity (where the amount of money owed on a home is greater than the home’s value) are likely to put downward pressure on the US housing market for the duration of 2012 and into next year.
Outlook
Forecasts for US economic growth in 2012 have held fairly steady since the beginning of this year. The August 2012 Consensus Economics survey projects modest growth of 2.2 per cent for 2012, the same rate of increase expected in January of this year. However, Consensus forecasters highlight slowing consumer spending and weakness in the labour market as major concerns going forward. The August Consensus expects US real GDP growth to be slightly slower in 2013 than in 2012, calling for an annual increase of 2.1 percent next year.
Chart 2.8 US consensus projects modest growth in 2012
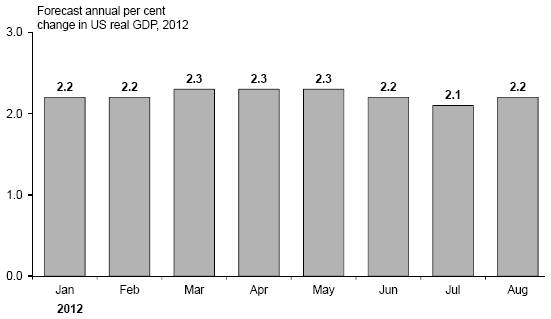
Source: Consensus Economics
The chart above represents forecasts for real GDP growth in 2012 as polled on specific dates. For example, forecasters surveyed on August 13, 2012 had an average 2012 US growth forecast of 2.2 per cent, while on March 12, 2012 they forecast 2012 US growth at 2.3 per cent.
The Ministry acknowledges the significant likelihood of lower US economic growth in 2012 and 2013, characterized by slower consumer spending, the weak job market recovery and ongoing troubles in the housing market. In acknowledgement of these risks, the Ministry’s growth assumptions are lower than the August 2012 Consensus, with the Ministry assuming that the US economy will expand by 1.9 per cent in 2012. The Ministry expects 1.9 per cent US real GDP growth again in 2013.
Table 2.2 US real GDP forecast: Consensus vs Ministry of Finance
| | 2012 | | 2013 | |
| | Per cent change in real GDP | |
Ministry of Finance | | 1.9 | | 1.9 | |
Consensus Economics (August 2012) | | 2.2 | | 2.1 | |
First Quarterly Report 2012/13
20
Economic Review and Outlook
Canada
Despite strong headwinds from the international outlook, the Canadian economy has recorded increases in several major indicators relative to 2011. Overall, Canada’s real GDP increased by 1.9 per cent in the January to March quarter (the latest quarter of available data) compared to the final quarter of 2011. Strong gains in business investment during the first quarter of 2012 offset slower consumption and net exports for the period.
Although growing at a slower pace than in 2011, Canadian employment improved by 169,200 jobs (or 1.0 per cent) year-to-date to July 2012 compared to the same period a year ago. Through 2012, the national unemployment rate averaged 7.3 per cent, falling 0.2 percentage points compared to the first seven months of 2011. Also domestically, the national retail and housing markets showed solid gains compared to last year. Canadian retail sales advanced by 3.4 per cent year-to-date to June 2012, while housing starts climbed 14.9 per cent year-to-date to July to average 216,800 annualized units.
Despite a Canadian dollar valued close to parity through the first seven months of the year, Canada’s trade sector made significant gains during this period. The value of Canadian merchandise exports rose by 7.4 per cent year-to-date to June compared to the same period in 2011, boosted by significant gains in exports of energy (largely due to a 23.1 percent increase in oil exports), automotive goods and machinery and equipment. Shipments of manufactured goods also improved, as their total value climbed by 5.5 percent year-to-date to June.
The most immediate threats to Canadian economic growth stem from international markets: slowing demand from Asian nations, further weakness in the US and the looming threat of a global financial market shock being sparked by one or more sovereign debt defaults in Europe. If the European situation continues to deteriorate, the economies of the US and several Asian countries could face significant downward pressure due to their strong trade connections with Europe. As a result, Canada could see considerable weakening in its exports due its trade connections with the US and Asia.
Chart 2.9 Consensus outlook stable for Canada in 2012
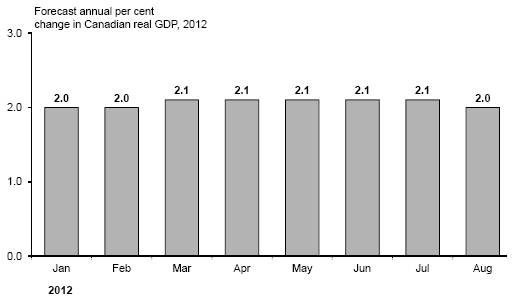
Source: Consensus Economics
The chart above represents forecasts for real GDP growth in 2012 as polled on specific dates. For example, forecasters surveyed on August 13, 2012 had an average 2012 Canadian real GDP growth forecast of 2.0 per cent, while on March 12, 2012 they forecast 2012 Canadian real GDP to grow by 2.1 per cent.
First Quarterly Report 2012/13
21
Economic Review and Outlook
Outlook
Private sector forecasters have held their near-term projections for the Canadian economy fairly steady throughout 2012, with the latest August 2012 Consensus projecting Canada’s real GDP to grow by a modest 2.0 per cent this year. However, the Consensus forecast for 2012 has fallen slightly in August, with forecasters noting concerns over slowing foreign demand for Canadian exports. For 2013, the August Consensus projects Canadian real GDP growth of 2.1 per cent on the year.
Acknowledging the potential for further weakness in the US and global economies (and their possible negative effects on Canada), particularly over the near-term, the Ministry assumes that the Canadian economy will experience 1.9 per cent growth in 2012, followed by a 1.9 per cent expansion again in 2013.
Table 2.3 Canadian real GDP forecast: Consensus vs Ministry of Finance
| | 2012 | | 2013 | |
| | Per cent change in real GDP | |
Ministry of Finance | | 1.9 | | 1.9 | |
Consensus Economics (August 2012) | | 2.0 | | 2.1 | |
Other economies
Europe
The intensifying European sovereign debt crisis presents the largest and most immediate threat to the global economic outlook. In the April to June quarter, euro zone GDP contracted by 0.4 per cent compared to the same quarter in 2011. The economies of member nations Greece, Italy, Spain and Portugal contracted sharply during the second quarter, as upticks in Germany and France were unable to offset losses in other countries.
Greece’s economy was hit the hardest of all euro zone members in the April to June quarter, shrinking by 6.2 per cent compared to the same quarter a year ago. This large decline in Greece followed a year-over-year contraction of 6.5 per cent in the first quarter of 2012, as the country entered an unprecedented fifth year of recession. Greece is due to receive yet another multi-billion euro bailout package in September from other European nations, but rumblings have surfaced recently from some German leaders suggesting that Greece should exit the euro zone if it is unable to get its debt problems under control soon.
Significant debt troubles have emerged in larger European nations outside of Greece, most recently in Spain. The Spanish government is currently struggling to convince investors it can control its finances and meet strict deficit guidelines by cutting taxes and raising spending, while also pulling itself out of a prolonged recession. In recent weeks, European leaders provided up to €100 billion in aid to Spanish banks, which are attempting to stay solvent after realizing enormous losses in Spain’s deeply troubled housing market. As a result, Spanish ten-year sovereign bond yields reached 7.75 per cent in July, higher than the 7.0 per cent level that triggered bailouts of Greece, Ireland and Portugal. Prospects for the Spanish economy remain very grim, as many economists now forecast annual recessions in both 2012 and 2013.
Since early this year, forecasters have gradually lowered their projections for euro zone economic performance in 2012, with most now anticipating a collective recession among euro zone nations. The August 2012 Consensus projects a European recession in 2012, as
First Quarterly Report 2012/13
22
Economic Review and Outlook
Chart 2.10 Consensus forecasts European recession in 2012
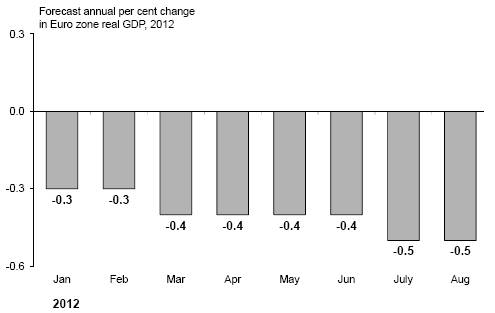
Source: Consensus Economics
The chart above represents forecasts for real GDP growth in 2012 as polled on specific dates. For example, forecasters surveyed on January 9, 2012 forecast an average 2012 Euro zone real GDP contraction of 0.3 per cent, while on August 13, 2012 they forecast 2012 Euro zone real GDP to shrink by 0.5 per cent.
euro zone real GDP is forecast to contract by 0.5 per cent this year. Very slow growth is anticipated the following year, with the August Consensus projecting European growth at just 0.3 per cent in 2013. With the expectation for further forecast downgrades in coming months, the Ministry assumes a contraction in the euro zone of 1.5 per cent in 2012 and a decline of 0.5 per cent in 2013.
China
With the US economy struggling to gain traction and Europe likely in recession, China now stands as the world’s most important engine of growth. However, the rapidly expanding Chinese economy has shown signs of cooling in recent months. China’s real GDP increased by an annualized rate of 7.6 per cent in the April to June quarter of 2012, the slowest quarterly growth rate in three years. Other indicators of economic activity have also suggested weakening, as year-over-year growth in both industrial output and retail sales slowed in recent months. Further, exports were up just 1.0 per cent in July 2012 compared to July 2011, a six-month low and a vast drop from the 11.3 per cent year-over-year pace observed in June. The main driver of this weakening in July was a major slowdown in exports to Europe, which fell by 16.2 per cent compared to July 2011. Waning demand from several struggling European economies is beginning to take its toll on China’s industrial production, which could soon prompt the Chinese government to deploy both monetary easing and fiscal spending to prop up economic growth.
The August 2012 Consensus projects that China’s real GDP will expand by 7.9 per cent this year, following growth of 9.2 per cent in 2011 and 10.4 per cent in 2010. As the Chinese economy is slowing somewhat from the rapid expansion it experienced in recent years, whether or not a soft landing occurs after the slowdown will have significant implications for the stability of world financial markets and for the economic well-being of China’s trading partners.
First Quarterly Report 2012/13
23
Economic Review and Outlook
With the rising potential for further slowing of the Chinese economy, the Ministry assumes that China’s real GDP will expand by 7.5 per cent in 2012 and by 7.7 per cent in 2013.
Financial Markets
Interest rates
At its most recent meeting in July 2012, the Bank of Canada announced that it will continue to hold its target for the overnight rate at 1.00 per cent (where it has remained since September 2010). Bank officials cited the slow US recovery, weaker than expected Chinese economic performance and the European debt crisis as reasons for maintaining the rate at 1.00 per cent.
The US Federal Reserve has held its intended federal funds rate in the 0.00 to 0.25 per cent range since December 2008. At its August 2012 meeting, the Fed cited decelerating economic activity over the first half of the year as a major reason for maintaining the rate at this level. In particular, it highlighted slow employment growth, an elevated unemployment rate and sluggish housing activity (despite some recent improvement in the housing market). The Fed announced earlier this year that it will keep the fed funds rate at its current level until late 2014.
Chart 2.11 Private sector interest rate outlook
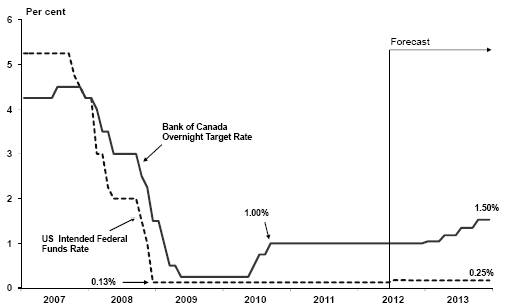
Sources: Bank of Canada, US Federal Reserve and BC Ministry of Finance forecasts.
Outlook
Based on the average of six private sector forecasts as of July 23, 2012, the Ministry’s interest rate outlook assumes that the Bank of Canada will hold the overnight target rate at 1.00 per cent until it lifts the rate to 1.25 per cent in the second quarter of 2013. On average, these six forecasters expect the rate will rise again to 1.50 per cent in the second half of 2013. They project the overnight target rate to average around 1.0 per cent in 2012 and 1.3 per cent in 2013.
First Quarterly Report 2012/13
24
Economic Review and Outlook
For the US, the same six forecasters expect the Fed to keep to its commitment of holding the federal funds rate in the 0.00 per cent to 0.25 per cent range until the end of 2014. As such, they project the rate to average 0.00 to 0.25 per cent annually in both 2012 and 2013.
The average of private sector forecasters’ views on Canadian short-term interest rates (three-month Treasury bills) as of July 23, 2012 indicates that three-month rates will average 0.9 per cent in 2012 and 1.3 per cent in 2013. The same forecasters project ten-year Government of Canada bonds to average 1.9 per cent in 2012 and 2.4 per cent in 2013.
Table 2.4 Private Sector Canadian Interest Rate Forecasts
| | 3-month Treasury Bill | | 10-year Government Bond | |
Average annual interest rate (per cent) | | 2012 | | 2013 | | 2012 | | 2013 | |
IHS Global Insight | | 0.9 | | 1.5 | | 1.9 | | 2.4 | |
CIBC | | 0.9 | | 1.0 | | 2.0 | | 2.5 | |
Bank of Montreal | | 0.9 | | 1.1 | | 1.9 | | 2.5 | |
Scotiabank | | 0.9 | | 1.3 | | 1.9 | | 2.3 | |
TD Economics | | 0.9 | | 1.4 | | 1.9 | | 2.6 | |
RBC Capital Markets | | 0.9 | | 1.5 | | 1.9 | | 2.4 | |
Average (as of July 23, 2012) | | 0.9 | | 1.3 | | 1.9 | | 2.4 | |
Exchange Rate
The Canadian dollar began 2012 just below parity with the US dollar and remained near parity through the first eight months of the year. The loonie reached as high as 102.0 US cents in April 2012, fuelled by strong commodity prices and a weak US dollar. As of August 29, 2012, the loonie was valued slightly above parity with the US dollar, at 101.3 US cents.
Chart 2.12 Private sector expects dollar to remain elevated in near-term
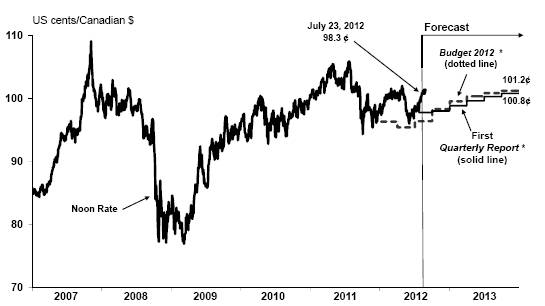
Sources: Bank of Canada and BC Ministry of Finance forecasts
*The average of 6 private sector forecasters: BMO, CIBC, IHS Global Insight, RBC, Scotiabank and TD. First Quarterly Report 2012 as of July 23, 2012 and Budget 2012 as of January 5, 2012.
First Quarterly Report 2012/13
25
Economic Review and Outlook
While Canadian consumers are benefiting from increased purchasing power, manufacturers already threatened by a weak export environment may face further difficulty selling goods to the US due to a high Canadian dollar.
Outlook
An average of six private sector forecasts as of July 23, 2012 calls for the Canadian dollar to average 98.7 US cents in 2012 and 99.9 US cents in 2013. The Ministry’s exchange rate outlook is based on these private sector averages.
Table 2.5 Private Sector Exchange Rate Forecasts
Average annual exchange rate (US cents/Can $) | | 2012 | | 2013 | |
IHS Global Insight | | 98.5 | | 96.2 | |
CIBC | | 98.5 | | 99.1 | |
Bank of Montreal | | 98.5 | | 99.1 | |
Scotiabank | | 99.1 | | 102.6 | |
TD Economics | | 98.3 | | 98.2 | |
RBC Capital Markets | | 99.0 | | 104.0 | |
Average (as of July 23, 2012) | | 98.7 | | 99.9 | |
First Quarterly Report 2012/13
26
Economic Review and Outlook
Table 2.6.1 Gross Domestic Product: British Columbia
| | | | | | Forecast | |
| | 2010 | | 2011 (e) | | 2012 | | 2013 | | 2014 | | 2015 | | 2016 | |
BRITISH COLUMBIA: | | | | | | | | | | | | | | | |
Gross Domestic Product at Market Prices: | | | | | | | | | | | | | | | |
— Real (2002 $ billion; chain-weighted) | | 167.1 | | 171.6 | | 175.1 | | 178.2 | | 182.3 | | 186.8 | | 191.6 | |
(% change) | | 3.0 | | 2.7 | | 2.0 | | 1.8 | | 2.3 | | 2.5 | | 2.5 | |
— Current dollar ($ billion) | | 203.1 | | 213.8 | | 222.1 | | 230.1 | | 239.7 | | 250.4 | | 261.7 | |
(% change) | | 5.9 | | 5.2 | | 3.9 | | 3.6 | | 4.2 | | 4.5 | | 4.6 | |
— GDP price deflator (2002 = 100) | | 121.5 | | 124.5 | | 126.8 | | 129.0 | | 131.4 | | 134.0 | | 136.6 | |
(% change) | | 2.7 | | 2.5 | | 1.8 | | 1.7 | | 1.8 | | 2.0 | | 2.0 | |
Real GDP per person | | | | | | | | | | | | | | | |
(2002 $; chain-weighted) | | 36,899 | | 37,516 | | 38,013 | | 38,244 | | 38,650 | | 39,099 | | 39,572 | |
(% change) | | 1.4 | | 1.7 | | 1.3 | | 0.6 | | 1.1 | | 1.2 | | 1.2 | |
Real GDP per employed person | | | | | | | | | | | | | | | |
(% change) | | 1.3 | | 1.8 | | 0.6 | | 0.5 | | 0.9 | | 1.0 | | 1.0 | |
Unit labour cost(1) (% change) | | 0.9 | | 2.2 | | 1.2 | | 2.2 | | 1.9 | | 1.8 | | 1.8 | |
Components of British Columbia Real GDP at Market Prices ($2002 billions; chain-weighted)
Personal expenditure on | | | | | | | | | | | | | | | |
Goods and services | | 119.2 | | 121.6 | | 124.5 | | 127.5 | | 131.1 | | 134.7 | | 138.5 | |
(% change) | | 3.8 | | 2.0 | | 2.5 | | 2.4 | | 2.8 | | 2.8 | | 2.8 | |
— Goods | | 47.5 | | 48.0 | | 48.7 | | 49.6 | | 50.9 | | 52.2 | | 53.5 | |
(% change) | | 3.1 | | 0.9 | | 1.6 | | 1.8 | | 2.6 | | 2.5 | | 2.5 | |
— Services | | 71.5 | | 73.4 | | 75.6 | | 77.7 | | 79.9 | | 82.3 | | 84.7 | |
(% change) | | 4.2 | | 2.6 | | 3.0 | | 2.8 | | 2.9 | | 2.9 | | 2.9 | |
Government current expenditures on Goods and services | | 33.4 | | 33.5 | | 34.4 | | 34.1 | | 34.5 | | 34.6 | | 35.1 | |
(% change) | | 1.6 | | 0.3 | | 2.5 | | -0.7 | | 1.0 | | 0.5 | | 1.2 | |
Investment in fixed capital | | 39.4 | | 40.0 | | 41.3 | | 42.4 | | 43.6 | | 44.9 | | 46.5 | |
(% change) | | 13.4 | | 1.5 | | 3.4 | | 2.6 | | 2.7 | | 3.1 | | 3.5 | |
Final domestic demand | | 191.8 | | 194.8 | | 200.0 | | 203.8 | | 208.8 | | 214.0 | | 219.7 | |
(% change) | | 5.3 | | 1.6 | | 2.7 | | 1.9 | | 2.5 | | 2.5 | | 2.7 | |
Exports goods and services | | 70.4 | | 74.2 | | 75.4 | | 77.2 | | 79.4 | | 81.8 | | 84.1 | |
(% change) | | 6.0 | | 5.5 | | 1.6 | | 2.4 | | 2.8 | | 3.0 | | 2.9 | |
Imports goods and services | | 94.8 | | 98.5 | | 101.5 | | 104.7 | | 108.0 | | 111.4 | | 114.8 | |
(% change) | | 9.9 | | 3.9 | | 3.1 | | 3.1 | | 3.2 | | 3.1 | | 3.1 | |
Inventory change | | -1.7 | | -0.5 | | -0.3 | | 0.4 | | 0.7 | | 0.9 | | 1.0 | |
Statistical discrepancy | | 0.1 | | 0.1 | | 0.1 | | 0.1 | | 0.1 | | 0.1 | | 0.1 | |
Real GDP at market prices | | 167.1 | | 171.6 | | 175.1 | | 178.2 | | 182.3 | | 186.8 | | 191.6 | |
(% change) | | 3.0 | | 2.7 | | 2.0 | | 1.8 | | 2.3 | | 2.5 | | 2.5 | |
(1) Unit labour cost is the nominal cost of labour incurred to produce one unit of real output.
(e) Ministry of Finance estimate.
First Quarterly Report 2012/13
27
Economic Review and Outlook
Table 2.6.2 Components of Nominal Income and Expenditure
| | | | | | Forecast | |
| | 2010 | | 2011 | | 2012 | | 2013 | | 2014 | | 2015 | | 2016 | |
Labour income(1) ($ million) | | 104,630 | | 109,742 | (e) | 113,275 | | 117,836 | | 122,817 | | 128,113 | | 133,722 | |
(% change) | | 4.0 | | 4.9 | | 3.2 | | 4.0 | | 4.2 | | 4.3 | | 4.4 | |
Personal income ($ million) | | 163,953 | | 170,664 | (e) | 176,709 | | 183,071 | | 190,312 | | 198,090 | | 206,266 | |
(% change) | | 4.0 | | 4.1 | | 3.5 | | 3.6 | | 4.0 | | 4.1 | | 4.1 | |
Corporate profits before taxes ($ million) | | 21,608 | | 24,498 | (e) | 25,570 | | 26,031 | | 27,282 | | 29,159 | | 31,139 | |
(% change) | | 21.5 | | 13.4 | | 4.4 | | 1.8 | | 4.8 | | 6.9 | | 6.8 | |
Retail sales ($ million) | | 58,220 | | 60,005 | | 62,072 | | 64,213 | | 66,813 | | 69,504 | | 72,310 | |
(% change) | | 5.4 | | 3.1 | | 3.4 | | 3.4 | | 4.0 | | 4.0 | | 4.0 | |
Housing starts | | 26,479 | | 26,400 | | 26,000 | | 24,908 | | 26,422 | | 27,157 | | 27,665 | |
(% change) | | 64.7 | | -0.3 | | -1.5 | | -4.2 | | 6.1 | | 2.8 | | 1.9 | |
BC consumer price index (2002 = 100) | | 113.8 | | 116.5 | | 118.7 | | 120.5 | | 122.8 | | 125.4 | | 128.1 | |
(% change) | | 1.3 | | 2.4 | | 1.9 | | 1.5 | | 1.9 | | 2.1 | | 2.1 | |
(1) Domestic basis; wages, salaries and supplementary labour income.
(2) Includes renovations and improvements.
(e) Ministry of Finance estimate.
Table 2.6.3 Labour Market Indicators
| | | | | | Forecast | |
| | 2010 | | 2011 | | 2012 | | 2013 | | 2014 | | 2015 | | 2016 | |
Population (on July 1) (000’s) | | 4,530 | | 4,573 | | 4,606 | | 4,661 | | 4,718 | | 4,778 | | 4,841 | |
(% change) | | 1.6 | | 1.0 | | 0.7 | | 1.2 | | 1.2 | | 1.3 | | 1.3 | |
Labour force population, 15+ Years (000’s) | | 3,729 | | 3,779 | | 3,813 | | 3,860 | | 3,910 | | 3,961 | | 4,014 | |
(% change) | | 1.8 | | 1.3 | | 0.9 | | 1.2 | | 1.3 | | 1.3 | | 1.3 | |
Net in-migration (000’s) | | | | | | | | | | | | | | | |
— International(1),(3) | | 37.3 | | 35.9 | | 41.0 | | 41.1 | | 41.5 | | 44.4 | | 44.5 | |
— Interprovincial(3) | | 4.7 | | -1.9 | | -0.6 | | 5.7 | | 9.0 | | 9.7 | | 11.7 | |
— Total | | 42.0 | | 34.0 | | 40.4 | | 46.8 | | 50.4 | | 54.1 | | 56.2 | |
Participation rate(2) (%) | | 65.5 | | 65.0 | | 65.1 | | 65.1 | | 65.1 | | 65.2 | | 65.3 | |
Labour force (000’s) | | 2,443 | | 2,458 | | 2,482 | | 2,513 | | 2,547 | | 2,585 | | 2,623 | |
(% change) | | 1.7 | | 0.6 | | 1.0 | | 1.3 | | 1.3 | | 1.5 | | 1.5 | |
Employment (000’s) | | 2,257 | | 2,275 | | 2,307 | | 2,337 | | 2,369 | | 2,405 | | 2,441 | |
(% change) | | 1.7 | | 0.8 | | 1.4 | | 1.3 | | 1.4 | | 1.5 | | 1.5 | |
Unemployment rate (%) | | 7.6 | | 7.5 | | 7.1 | | 7.0 | | 7.0 | | 7.0 | | 7.0 | |
(1) International migration includes net non-permanent residents and returning emigrants less net temporary residents abroad.
(2) Percentage of the population 15 years of age and over in the labour force.
(3) Components may not sum to total due to rounding.
First Quarterly Report 2012/13
28
Economic Review and Outlook
Table 2.6.4 Major Economic Assumptions
| | | | | | Forecast | |
| | 2010 | | 2011 | | 2012 | | 2013 | | 2014 | | 2015 | | 2016 | |
GDP (billions) | | | | | | | | | | | | | | | |
Canada real (2002 $; chain-weighted) | | 1,325 | | 1,357 | | 1,382 | | 1,409 | | 1,443 | | 1,480 | | 1,517 | |
(% change) | | 3.2 | | 2.4 | | 1.9 | | 1.9 | | 2.5 | | 2.5 | | 2.5 | |
US real (2005 US$; chain-weighted) | | 13,063 | | 13,299 | | 13,558 | | 13,809 | | 14,158 | | 14,524 | | 14,905 | |
(% change) | | 2.4 | | 1.8 | | 1.9 | | 1.9 | | 2.5 | | 2.6 | | 2.6 | |
Japan real (2005 Yen; chain-weighted) | | 511,319 | | 507,663 | | 515,240 | | 520,267 | | 525,601 | | 530,614 | | 536,071 | |
(% change) | | 4.5 | | -0.7 | | 1.5 | | 1.0 | | 1.0 | | 1.0 | | 1.0 | |
Europe real(1) (% change) | | 2.0 | | 1.5 | | -1.5 | | -0.5 | | 1.0 | | 1.5 | | 1.5 | |
China real (2000 US$) | | 3,246 | | 3,545 | (e) | 3,810 | | 4,104 | | 4,408 | | 4,725 | | 5,060 | |
(% change) | | 10.4 | | 9.2 | | 7.5 | | 7.7 | | 7.4 | | 7.2 | | 7.1 | |
Industrial production index | | | | | | | | | | | | | | | |
US (2007 = 100) | | 90.1 | | 93.7 | | 96.6 | | 98.5 | | 101.0 | | 103.6 | | 106.4 | |
(% change) | | 5.4 | | 4.1 | | 3.0 | | 2.0 | | 2.5 | | 2.6 | | 2.6 | |
Japan (2005 = 100) | | 94.9 | | 92.7 | | 95.2 | | 96.5 | | 97.4 | | 98.4 | | 99.4 | |
(% change) | | 16.1 | | -2.4 | | 2.8 | | 1.3 | | 1.0 | | 1.0 | | 1.0 | |
Europe(2) (2005 = 100) | | 97.1 | | 100.5 | | 97.7 | | 97.2 | | 98.2 | | 99.6 | | 101.1 | |
(% change) | | 7.3 | | 3.5 | | -2.8 | | -0.5 | | 1.0 | | 1.5 | | 1.5 | |
China (2005 = 100) | | 177.2 | | 201.8 | (e) | 220.0 | | 239.8 | | 263.8 | | 290.1 | | 319.2 | |
(% change) | | 12.4 | | 13.9 | | 9.0 | | 9.0 | | 10.0 | | 10.0 | | 10.0 | |
Housing starts(3) (000’s) | | | | | | | | | | | | | | | |
Canada | | 190 | | 194 | | 190 | | 170 | | 180 | | 180 | | 180 | |
(% change) | | 27.4 | | 2.1 | | -2.0 | | -10.5 | | 5.9 | | 0.0 | | 0.0 | |
US | | 587 | | 607 | | 680 | | 700 | | 800 | | 850 | | 900 | |
(% change) | | 5.9 | | 3.4 | | 12.0 | | 2.9 | | 14.3 | | 6.3 | | 5.9 | |
Japan | | 813 | | 834 | | 820 | | 850 | | 850 | | 850 | | 850 | |
(% change) | | 3.1 | | 2.6 | | -1.7 | | 3.7 | | 0.0 | | 0.0 | | 0.0 | |
Consumer price index | | | | | | | | | | | | | | | |
Canada (2002 = 100) | | 116.5 | | 119.9 | | 122.4 | | 124.8 | | 127.3 | | 129.9 | | 132.5 | |
(% change) | | 1.8 | | 2.9 | | 2.1 | | 2.0 | | 2.0 | | 2.0 | | 2.0 | |
Canadian interest rates (%) | | | | | | | | | | | | | | | |
3-Month treasury bills | | 0.6 | | 0.9 | | 0.9 | | 1.3 | | 2.0 | | 2.6 | | 3.4 | |
10-year government bonds | | 3.2 | | 2.8 | | 1.9 | | 2.4 | | 3.3 | | 4.1 | | 5.1 | |
United States interest rates (%) | | | | | | | | | | | | | | | |
3-Month treasury bills | | 0.1 | | 0.1 | | 0.1 | | 0.1 | | 0.2 | | 0.9 | | 2.1 | |
10-year government bonds | | 3.2 | | 2.8 | | 1.8 | | 2.3 | | 3.3 | | 4.1 | | 5.1 | |
Exchange rate (US cents / Canadian $) | | 97.1 | | 101.1 | | 98.7 | | 99.9 | | 100.7 | | 99.1 | | 97.8 | |
British Columbia goods and services Export price deflator (% change) | | 1.7 | | 2.1 | (e) | 0.8 | | 1.5 | | 2.6 | | 2.2 | | 2.3 | |
(1) European Union (15) is Austria, Belgium, Denmark, Finland, France, Germany, Greece, Ireland, Italy, Luxembourg, Netherlands, Portugal, Spain, Sweden and the UK.
(2) Euro zone (17) is Austria, Belgium, Cyprus, Estonia, Finland, France, Germany, Greece, Ireland, Italy, Luxembourg, Malta, Netherlands, Portugal, Slovakia, Slovenia and Spain.
(3) British Columbia housing starts appear in Table 2.6.2.
(e) Ministry of Finance estimate.
First Quarterly Report 2012/13
29
PART THREE — FIRST QUARTERLY REPORT | |
For the Three Months Ended June 30, 2012 |
| |
2012/13 First Quarterly Report | September 13, 2012 |
Introduction
Table 3.1 2012/13 Forecast Update
| | | | First | |
| | Budget | | Quarterly | |
($ millions) | | 2012 | | Report | |
Revenue | | 43,101 | | 42,724 | |
Expense | | (43,869 | ) | (43,956 | ) |
Manage impact of natural gas royalty reductions | | — | | 241 | |
Deficit before forecast allowance | | (768 | ) | (991 | ) |
Forecast allowance | | (200 | ) | (150 | ) |
Deficit | | (968 | ) | (1,141 | ) |
Capital spending: | | | | | |
Taxpayer-supported capital spending | | 3,757 | | 3,715 | |
Self-supported capital spending | | 3,346 | | 3,194 | |
| | 7,103 | | 6,909 | |
Provincial Debt: | | | | | |
Taxpayer-supported debt | | 38,736 | | 38,679 | |
Self-supported debt | | 18,667 | | 17,907 | |
Total debt (including forecast allowance) | | 57,603 | | 56,736 | |
| | | | | |
Taxpayer-supported debt-to-GDP ratio | | 17.6 | % | 17.4 | % |
| | | | | |
| | 2012 | |
Economic Forecast: | | | | | |
Real GDP growth | | 1.8 | % | 2.0 | % |
Nominal GDP growth | | 3.7 | % | 3.9 | % |
The fiscal outlook for 2012/13 projects a revised deficit of $1.1 billion.
The $173 million deterioration since Budget 2012 reflects the following:
· Total revenues are down $377 million mainly due to lower revenue from taxation, natural resources, net income from commercial Crowns and reduced health and social transfers from the federal government.
· Total government spending is $87 million higher, primarily due to emergency flood and direct fire costs and higher spending funded by third party recoveries, partially offset by lower tax credit transfers and debt servicing costs.
· Government will introduce measures to mitigate the $241 million reduction in natural gas royalties.
· Government has reduced the forecast allowance by $50 million from Budget 2012 to $150 million to reflect the risks to the outlook in the remainder of the year.
· At $6.9 billion, total capital spending is $194 million lower than forecast in Budget 2012. The reduction mainly reflects the capital planning adjustments to be implemented by government in order to maintain debt affordability.
· Taxpayer-supported debt is virtually unchanged from budget — the current projection being only $57 million lower than the Budget 2012 projection — as the impact of the increased deficit is mostly offset by government’s capital planning adjustments. However, at 17.4 per cent, the projected taxpayer-supported debt to GDP ratio is 0.2 percentage points lower than budget due to an improved GDP outlook for 2012.
First Quarterly Report 2012/13
First Quarterly Report
· Self supported debt of government agencies is now forecast to be $18 billion, a reduction of $760 million, due to a lower debt balance at March 31, 2012 and lower capital spending.
Revenue
Revenue in 2012/13 is projected to be $377 million lower than the Budget 2012 forecast. Lower revenue from taxation, natural resources, federal government contributions and net income from Crown corporations is partly offset by higher revenue from miscellaneous sources.
Table 3.2 2012/13 Forecast — Changes from Budget 2012
($ millions) | | Q1 Update | | | |
2012/13 deficit — Budget 2012 Fiscal Plan (February 21, 2012) | | | | (968 | ) |
Revenue changes: | | | | | |
Personal income tax — mainly lower economic forecast | | (16 | ) | | |
Corporate income tax — mainly increased federal government installements | | 20 | | | |
Tobacco tax — weaker year-to-date results | | (10 | ) | | |
Other tax sources — mainly property and fuel taxes | | (9 | ) | | |
Natural gas royalties — reduced prices and volumes partly offset by savings from lower utilization of royatly and infrastructure programs | | (241 | ) | | |
Columbia River Treaty electricity sales — mainly lower electricity prices | | (33 | ) | | |
Coal, metals and minerals — mainly higher mining costs and lower prices | | (51 | ) | | |
Forests — mainly higher border tax collections and recoveries partly offset by lower stumpage revenue | | 10 | | | |
Other energy and natural resources — mainly lower Crown land tenures reflecting reduced average bid price and auctioned land base | | (18 | ) | | |
Fees, licenses, investment earnings and miscellaneous sources | | 36 | | | |
Health and social transfers — lower population share and national tax points reflecting lower national personal income tax base | | (65 | ) | | |
Other federal government transfers — mainly higher recoveries | | 56 | | | |
Commercial Crown agencies operating results: | | | | | |
BC Hydro — lower allowed return on deemed equity to refect the pre-tax return of the closest comparative utility regulated by the BC Utilities Commission | | (46 | ) | | |
ICBC — mainly higher investment income | | 14 | | | |
Transportation Investment Corporation — mainly revised tolling framework for the Port Mann Bridge | | (24 | ) | | |
Other commercial Crown agencies changes | | — | | | |
Total revenue changes | | | | (377 | ) |
Less: expense increases (decreases): | | | | | |
Consolidated Revenue Fund changes: | | | | | |
Emergency program flood-related costs | | 44 | | | |
Direct fire costs | | 62 | | | |
Tax credit transfers reduction | | (34 | ) | | |
Management of public debt (net) — reflects lower interest rates and revisions to scheduled borrowing | | (69 | ) | | |
Spending funded by third party recoveries | | 117 | | | |
(Increase) decrease in operating transfers to service delivery agencies | | (215 | ) | | |
Changes in spending profile of service delivery agencies: | | | | | |
School districts - higher repairs and maintenance costs | | 26 | | | |
Universities — increased salary and wages and grants to third parties | | 2 | | | |
Colleges — spending related to higher student enrolment | | 14 | | | |
Health authorities and hospital societies — increasing demand for healthcare services | | 93 | | | |
Other service delivery agencies | | 47 | | | |
Total expense increases (decreases) | | | | 87 | |
Subtotal | | | | (464 | ) |
Manage impact of natural gas royalty reductions | | | | 241 | |
Reduction in forecast allowance | | | | 50 | |
Total changes | | | | (173 | ) |
2012/13 deficit — first Quarterly Report | | | | (1,141 | ) |
First Quarterly Report 2012/13
32
First Quarterly Report
Detailed revenue projections are disclosed in Table 3.7, and key assumptions and sensitivities relating to revenue are provided in Appendix Table A1. Major changes from Budget 2012 include:
· Personal income tax revenue is down $16 million resulting from lower 2012 and 2013 personal income projections.
· Corporate income tax revenue is up $20 million due to higher instalments from the federal government resulting from an improved federal government outlook of the national tax base.
· Tobacco tax revenue is down by $10 million due to weaker year to date sales.
· Property tax revenue is down $15 million mainly reflecting lower 2011/12 results.
· Natural gas royalties are forecast to be down $241 million reflecting a 44 per cent decline in the average natural gas price and a 9.2 per cent decline in production volumes resulting from weak demand and increased supply in North America. This decline is partly offset by savings resulting from lower utilization of royalty programs and infrastructure credits.
· Coal, metals and mineral revenue is down $51 million mainly due to rising mining costs and lower metal prices. Revenue collected under the Columbia River Treaty is down $33 million reflecting lower electricity prices.
· Forests revenue is up $10 million as the higher recoveries and border taxes collected under the Softwood Lumber Agreement 2006, reflecting increased US softwood lumber exports is partly offset by lower stumpage revenue as the effects of the mountain pine beetle infestation and a higher Canadian dollar results in lower stumpage rates.
· Revenue from other natural resources is expected to be $18 million lower mainly due to the effects of weaker auctions including a reduced average bid price on Crown land tenures.
· Other revenue, comprised of revenue from fees and licenses, investment earnings and other miscellaneous sources, is up $36 million due to higher vote recoveries related to PharmaCare program and information technology services and improved forecasts from the SUCH sector.
· The Canada health and social transfers are down $65 million due to a reduced population share and lower national tax points reflecting a lower national personal income tax base projections by federal government.
· Other federal government contributions are expected to be up $56 million mainly due to higher vote recoveries associated with immigration initiatives and Labour Market Agreement programs.
· The outlook for commercial Crown corporation net income is $56 million lower than budget. The forecast mainly reflects a lower allowed return on deemed equity for BC Hydro (the corporation’s allowed return is based on the pre-tax return of the closest comparative utility regulated by the BC Utilities Commission) and implementation of a revised tolling framework for the Port Mann Bridge. Lower net income in 2012/13 from these sources is partially offset by improvements in ICBC mainly due to higher investment income.
First Quarterly Report 2012/13
33
First Quarterly Report
Expense
Government spending is projected to be $87 million higher than Budget 2012 and will now total $44.0 billion in 2012/13.
Consolidated Revenue Fund spending
Ministry spending increased by $106 million due to statutory spending on flood-related emergency programs and firefighting. This increase is almost entirely offset by a reduction in refundable tax credit transfers (down $34 million) and lower debt servicing costs (down $69 million).
Contingencies
The notional allocations to the Contingencies vote are unchanged from Budget 2012, with the exception of funding allocated to Elections BC which has decreased by $21 million in 12/13 due to the repeal of the Election Act requirement for a province-wide door-to-door enumeration.
Table 3.3 2012/13 Notional Allocations to Contingencies
| | | | First | | | |
| | Budget | | Quarterly | | | |
($ millions) | | 2012 | | Report | | Change | |
2010 Sports and Arts Legacy | | 20 | | 20 | | — | |
Climate Action and clean energy initiatives | | 40 | | 40 | | — | |
Community Living BC anticipated caseload increases | | 12 | | 12 | | — | |
Elections BC event-related funding | | 36 | | 15 | | (21 | ) |
Subtotal notional allocations | | 108 | | 87 | | (21 | ) |
Reserved for unforeseen pressures related to litigation, caseload, natural disasters, and other contingent items | | 192 | | 213 | | 21 | |
Total contingencies | | 300 | | 300 | | — | |
Government continues to face a variety of pressures which ministries and agencies will work to manage within existing budgets, with additional funding provided from the Contingencies vote as necessary.
Spending recovered from third parties
Spending funded by recoveries from third parties is projected to increase by $117 million in 2012/13 compared to Budget 2012. The changes reflect:
· increased healthcare related cost recoveries (up $47 million), mainly associated with the medical service plan and related collections costs, PharmaCare and other health regional services;
· higher spending on federally funded programs for immigration initiatives and labor market agreement programs (up $37 million);
· increased general government recoveries including direct fire and collections cost recoveries (up $45 million); and
· a net decrease to other recoveries (down $12 million).
The above spending changes are offset by an equal increase in revenue, and as a result have no net impact on the fiscal forecast.
First Quarterly Report 2012/13
34
First Quarterly Report
Operating transfers to service delivery agencies
Operating transfers to service delivery agencies are forecasted to be $215 million higher in 2012/13 compared to Budget 2012. The increase relates to higher grants to health organizations for increased service demand ($113 million), increased housing grants for low income housing ($61 million), and other grant increases ($41 million).
Service delivery agency spending
Service delivery agency spending is forecast to increase by $182 million in 2012/13 compared to Budget 2012.
· School district spending is forecast to be $26 million higher due to increased operating costs ($34 million) partially offset by lower salaries and benefits costs ($8 million).
· Post secondary institution spending is projected to increase by $16 million in 2012/13 due to increased salary and grants to third parties (total increase of $30 million) offset by reduced operating and capital depreciation costs (totaling $14 million).
· Health authority and hospital society spending is forecast to be up $93 million in 2012/13, reflecting the projected volume increases in the healthcare services delivered by these organizations on behalf of government. This spending increase is projected to be funded by additional provincial grants and own-source revenue.
· Other service delivery agency spending is projected to increase by $47 million in 2012/13 reflecting mostly higher spending on low income housing.
Detailed expense projections are disclosed in Table 3.8. Key spending assumptions and sensitivities are provided in Appendix Table A3.
Managing the natural gas royalty impacts
The deterioration in natural gas royalty revenue is the main issue that needs to be managed in 2012/13. Mitigation measures will be introduced to offset the impacts. Only those measures that are needed to ensure government meets its ongoing fiscal objectives will be implemented.
Government employment (FTEs)
The projection of government employment for 2012/13 is unchanged from Budget 2012. Further details on FTEs are provided in Appendix Table A9.
First Quarterly Report 2012/13
35
First Quarterly Report
Provincial capital spending
Total capital spending is projected to be $6.9 billion in 2012/13, a decrease of $194 million from Budget 2012.
Table 3.4 2012/13 Capital Spending Update
($ millions) | | Q1 Update | | | |
2012/13 capital spending — Budget 2012 Fiscal Plan (February 21, 2012) | | | | 7,103 | |
Taxpayer-supported changes: | | | | | |
Project approvals since Budget 2012 | | 91 | | | |
Additional externally-funded capital spending by post-secondary institutions | | 53 | | | |
Project scheduling changes | | 222 | | | |
Capital planning adjustments | | (408 | ) | | |
Total taxpayer-supported | | | | (42 | ) |
Self-supported changes: | | | | | |
BC Hydro — mainly scheduling shift on Dawson Creek/Chetwynd and Northwest transmission line projects, partially offset by smart meter expenditures carried over from 2011/12 | | (165 | ) | | |
Transportation Investment Corporation — timing of capital spending for Port Mann Bridge/Highway 1 | | 20 | | | |
Other | | (7 | ) | | |
Total self-supported | | | | (152 | ) |
Total changes | | | | (194 | ) |
2012/13 capital spending — first Quarterly Report | | | | 6,909 | |
Taxpayer-supported capital spending is projected to be $3.7 billion, $42 million lower than the Budget 2012 forecast. This change is primarily due to additional allocations for school district and health facility maintenance programs, additional investments in highway rehabilitation programs, higher than expected spending on self-funded university projects, and project scheduling changes, partially offset by capital planning adjustments to meet fiscal targets.
Self-supported capital spending is projected to be $3.2 billion, $152 million lower than the Budget 2012 forecast. The change in self-supported capital spending mainly reflects a shift in scheduling capital spending on transmission line projects in the Northwest and in the Dawson Creek/Chetwynd area, partially offset by smart meter expenditures carried over from 2011/12 (BC Hydro), and the timing of capital spending on the Port Mann Bridge/Highway 1 project.
Details on capital spending are shown in Table 3.10, and capital spending projects with provincial contributions greater than $50 million are presented in Table 3.11.
Provincial debt
The provincial debt, including a $150 million forecast allowance, is projected to total $56.7 billion at March 31, 2013 — $867 million lower than the projection in Budget 2012.
Taxpayer-supported debt is projected at $38.7 billion — a $57 million decrease compared to the Budget 2012 projection. The reduction reflects lower anticipated capital spending partially offset by increased operating impacts. The taxpayer-supported debt to GDP ratio forecast is projected to be 17.4 per cent — a 0.2 percentage point improvement from Budget 2012, mainly due to an improved GDP outlook for 2012.
First Quarterly Report 2012/13
36
First Quarterly Report
Table 3.5 2012/13 Provincial Debt Update
($ millions) | | Q1 Update | | | |
2012/13 provincial debt — Budget 2012 Fiscal Plan (February 21, 2012) | | | | 57,603 | |
Taxpayer-supported changes: | | | | | |
Government operating: | | | | | |
– bonus bid cash proceeds | | 233 | | | |
– other CRF operating results | | (44 | ) | | |
Total operating debt changes | | 189 | | | |
Capital debt: | | | | | |
– lower spending in 2011/12 | | (217 | ) | | |
– reduced provincial financing from capital planning adjustments | | (264 | ) | | |
– other capital spending impacts | | 235 | | | |
Total capital debt changes | | (246 | ) | | |
Total taxpayer-supported | | | | (57 | ) |
Self-supported changes: | | | | | |
BC Hydro — mainly impact of improved working capital and lower capital spending projections | | (663 | ) | | |
Transportation Investment Corporation — impact of working capital changes | | (77 | ) | | |
Other changes | | (20 | ) | | |
Total self-supported | | | | (760 | ) |
Forecast allowance changes: | | | | | |
Adjustment to forecast allowance | | | | (50 | ) |
Total changes | | | | (867 | ) |
2012/13 provincial debt — first Quarterly Report | | | | 56,736 | |
The projected self-supported debt balance of $17.9 billion at March 31, 2013 is $760 million lower than the projection in Budget 2012 mainly due to a lower debt balance at March 31, 2012 and lower capital spending.
Details on provincial debt are shown in Table 3.12.
Risks to the Fiscal Forecast
There are a number of risks and pressures to the fiscal plan, including slower than expected economic growth in our trading partners resulting in lower demand for BC’s exports and continuing instability in financial markets brought about by the European sovereign debt crisis.
Revenues in British Columbia can be volatile, largely due to the influence of the cyclical nature of the natural resource sector in the economy. Changes in energy or commodity prices, such as natural gas and lumber, may have a significant effect on revenue and the fiscal forecast.
The spending forecast contained in the fiscal plan is based on ministry and service delivery agency plans and strategies. Changes to planning assumptions, such as utilization or demand rates for government services in the health care, education, or community social services sectors, represent the main spending risks.
These risks are covered by the $300 million Contingencies vote and the $150 million forecast allowance.
First Quarterly Report 2012/13
37
First Quarterly Report
Table 3.6 2012/13 Operating Statement
| | Year-to-Date to June 30 | | Full Year | |
| | 2012/13 | | Actual | | 2012/13 | | Actual | |
($ millions) | | Budget | | Actual | | Variance | | 2011/12 | | Budget | | Forecast | | Variance | | 2011/12 | |
Revenue | | 10,132 | | 9,873 | | (259 | ) | 9,755 | | 43,101 | | 42,724 | | (377 | ) | 41,967 | |
Expense | | (10,785 | ) | (10,337 | ) | 448 | | (10,162 | ) | (43,869 | ) | (43,956 | ) | (87 | ) | (43,807 | ) |
Manage impacts of natural gas royalty reductions | | — | | — | | — | | — | | — | | 241 | | 241 | | — | |
Surplus (deficit) before forecast allowance | | (653 | ) | (464 | ) | 189 | | (407 | ) | (768 | ) | (991 | ) | (223 | ) | (1,840 | ) |
Forecast allowance | | — | | — | | — | | — | | (200 | ) | (150 | ) | 50 | | — | |
Surplus (deficit) | | (653 | ) | (464 | ) | 189 | | (407 | ) | (968 | ) | (1,141 | ) | (173 | ) | (1,840 | ) |
Accumulated surplus beginning of the year | | 2,016 | | 2,500 | | 484 | | 4,316 | | 2,016 | | 2,434 | | 418 | | 4,274 | |
Accumulated surplus before comprehensive income | | 1,363 | | 2,036 | | 673 | | 3,909 | | 1,048 | | 1,293 | | 245 | | 2,434 | |
Accumulated other comprehensive income from self-supported Crown agencies | | 13 | | (120 | ) | (133 | ) | 246 | | 52 | | (35 | ) | (87 | ) | 23 | |
Accumulated surplus end of period | | 1,376 | | 1,916 | | 540 | | 4,155 | | 1,100 | | 1,258 | | 158 | | 2,457 | |
First Quarterly Report 2012/13
38
First Quarterly Report
Table 3.7 2012/13 Revenue by Source
| | Year-to-Date to June 30 | | Full Year | |
| | 2012/13 | | Actual | | 2012/13 | | Actual | |
($ millions) | | Budget | | Actual | | Variance | | 2011/12 | | Budget | | Forecast | | Variance | | 2011/12 | |
Taxation | | | | | | | | | | | | | | | | | |
Personal income | | 1,628 | | 1,628 | | — | | 1,557 | | 6,630 | | 6,614 | | (16 | ) | 6,427 | |
Corporate income | | 464 | | 468 | | 4 | | 470 | | 2,266 | | 2,286 | | 20 | | 2,022 | |
Harmonized sales | | 1,502 | | 1,460 | | (42 | ) | 1,416 | | 6,003 | | 6,003 | | — | | 5,779 | |
Other sales (1) | | 25 | | 42 | | 17 | | 14 | | 98 | | 101 | | 3 | | 150 | |
Fuel | | 228 | | 217 | | (11 | ) | 224 | | 937 | | 932 | | (5 | ) | 928 | |
Carbon | | 225 | | 230 | | 5 | | 211 | | 1,172 | | 1,180 | | 8 | | 959 | |
Tobacco | | 169 | | 163 | | (6 | ) | 157 | | 652 | | 642 | | (10 | ) | 637 | |
Property | | 499 | | 496 | | (3 | ) | 464 | | 2,013 | | 1,998 | | (15 | ) | 1,913 | |
Property transfer | | 255 | | 255 | | — | | 289 | | 893 | | 893 | | — | | 944 | |
Other (2) | | 111 | | 118 | | 7 | | 132 | | 424 | | 424 | | — | | 406 | |
| | 5,106 | | 5,077 | | (29 | ) | 4,934 | | 21,088 | | 21,073 | | (15 | ) | 20,165 | |
Natural resources | | | | | | | | | | | | | | | | | |
Natural gas royalties | | 97 | | 17 | | (80 | ) | 113 | | 398 | | 157 | | (241 | ) | 339 | |
Forests | | 95 | | 86 | | (9 | ) | 75 | | 533 | | 543 | | 10 | | 482 | |
Other natural resource (3) | | 495 | | 452 | | (43 | ) | 489 | | 2,055 | | 1,953 | | (102 | ) | 1,991 | |
| | 687 | | 555 | | (132 | ) | 677 | | 2,986 | | 2,653 | | (333 | ) | 2,812 | |
Other revenue | | | | | | | | | | | | | | | | | |
Medical Services Plan premiums | | 507 | | 516 | | 9 | | 480 | | 2,047 | | 2,043 | | (4 | ) | 1,919 | |
Other fees (4) | | 605 | | 572 | | (33 | ) | 574 | | 2,876 | | 2,884 | | 8 | | 2,809 | |
Investment earnings | | 286 | | 221 | | (65 | ) | 252 | | 1,083 | | 1,081 | | (2 | ) | 1,042 | |
Miscellaneous (5) | | 611 | | 651 | | 40 | | 614 | | 3,047 | | 3,081 | | 34 | | 2,833 | |
| | 2,009 | | 1,960 | | (49 | ) | 1,920 | | 9,053 | | 9,089 | | 36 | | 8,603 | |
Contributions from the federal government | | | | | | | | | | | | | | | | | |
Health and social transfers | | 1,421 | | 1,421 | | — | | 1,352 | | 5,682 | | 5,617 | | (65 | ) | 5,384 | |
Harmonized sales tax transition payment | | — | | — | | — | | — | | — | | — | | — | | 580 | |
Other federal contributions (6) | | 341 | | 296 | | (45 | ) | 293 | | 1,575 | | 1,631 | | 56 | | 1,743 | |
| | 1,762 | | 1,717 | | (45 | ) | 1,645 | | 7,257 | | 7,248 | | (9 | ) | 7,707 | |
Commercial Crown corporation net income | | | | | | | | | | | | | | | | | |
BC Hydro | | 45 | | 53 | | 8 | | 92 | | 566 | | 520 | | (46 | ) | 558 | |
Liquor Distribution Branch | | 227 | | 229 | | 2 | | 225 | | 906 | | 906 | | — | | 909 | |
BC Lotteries (net of payments to the federal government) | | 274 | | 286 | | 12 | | 271 | | 1,115 | | 1,115 | | — | | 1,099 | |
ICBC | | 25 | | — | | (25 | ) | (7 | ) | 146 | | 160 | | 14 | | 102 | |
Transportation Investment Corporation (Port Mann) | | (9 | ) | (8 | ) | 1 | | (2 | ) | (48 | ) | (72 | ) | (24 | ) | (17 | ) |
Other | | 6 | | 4 | | (2 | ) | — | | 32 | | 32 | | — | | 29 | |
| | 568 | | 564 | | (4 | ) | 579 | | 2,717 | | 2,661 | | (56 | ) | 2,680 | |
Total revenue | | 10,132 | | 9,873 | | (259 | ) | 9,755 | | 43,101 | | 42,724 | | (377 | ) | 41,967 | |
(1) Includes social service tax, continuation of the tax on designated property and hotel room tax.
(2) Corporation capital and insurance premium taxes.
(3) Columbia River Treaty, other energy and minerals, water rental and other resources.
(4) Post-secondary, healthcare-related, motor vehicle, and other fees.
(5) Includes asset dispositions, reimbursements for health care and other services provided to external agencies, and other recoveries.
(6) Includes contributions for health, education, community development, housing and social service programs, and transportation projects.
First Quarterly Report 2012/13
39
First Quarterly Report
Table 3.8 2012/13 Expense by Ministry, Program and Agency (1)
| | Year-to-Date to June 30 | | Full Year | |
| | 2012/13 | | Actual | | 2012/13 | | Actual | |
($ millions) | | Budget | | Actual | | Variance | | 2011/12 (2) | | Budget | | Forecast | | Variance | | 2011/12 (2) | |
Office of the Premier | | 2 | | 2 | | — | | 2 | | 9 | | 9 | | — | | 9 | |
Aboriginal Relations and Reconciliation | | 20 | | 12 | | (8 | ) | 14 | | 80 | | 80 | | — | | 92 | |
Advanced Education | | 472 | | 469 | | (3 | ) | 474 | | 1,972 | | 1,972 | | — | | 1,977 | |
Agriculture | | 31 | | 31 | | — | | 10 | | 66 | | 66 | | — | | 74 | |
Children and Family Development | | 340 | | 328 | | (12 | ) | 336 | | 1,333 | | 1,333 | | — | | 1,332 | |
Community, Sport and Cultural Development | | 176 | | 157 | | (19 | ) | 148 | | 311 | | 311 | | — | | 404 | |
Education | | 1,546 | | 1,519 | | (27 | ) | 1,527 | | 5,315 | | 5,315 | | — | | 5,264 | |
Energy and Mines | | 109 | | 105 | | (4 | ) | 98 | | 439 | | 439 | | — | | 453 | |
Environment | | 27 | | 30 | | 3 | | 27 | | 129 | | 129 | | — | | 143 | |
Finance | | 60 | | 35 | | (25 | ) | 43 | | 173 | | 173 | | — | | 189 | |
Forests, Lands and Natural Resource Operations | | 136 | | 137 | | 1 | | 128 | | 602 | | 664 | | 62 | | 562 | |
Health | | 3,919 | | 3,774 | | (145 | ) | 3,720 | | 16,180 | | 16,180 | | — | | 15,567 | |
Jobs, Tourism and Innovation | | 49 | | 75 | | 26 | | 77 | | 235 | | 235 | | — | | 261 | |
Justice | | 277 | | 269 | | (8 | ) | 262 | | 1,110 | | 1,154 | | 44 | | 1,174 | |
Labour, Citizens’ Services and Open Government | | 140 | | 131 | | (9 | ) | 134 | | 549 | | 549 | | — | | 562 | |
Social Development | | 606 | | 611 | | 5 | | 599 | | 2,457 | | 2,457 | | — | | 2,427 | |
Transportation and Infrastructure | | 196 | | 196 | | — | | 183 | | 807 | | 807 | | — | | 807 | |
Total ministries and Office of the Premier | | 8,106 | | 7,881 | | (225 | ) | 7,782 | | 31,767 | | 31,873 | | 106 | | 31,297 | |
Management of public funds and debt | | 323 | | 296 | | (27 | ) | 314 | | 1,287 | | 1,218 | | (69 | ) | 1,238 | |
Contingencies | | 75 | | 2 | | (73 | ) | 1 | | 300 | | 300 | | — | | 22 | |
Funding for capital expenditures | | 117 | | 108 | | (9 | ) | 132 | | 1,062 | | 995 | | (67 | ) | 1,182 | |
Refundable tax credit transfers | | 263 | | 262 | | (1 | ) | 221 | | 1,091 | | 1,057 | | (34 | ) | 969 | |
Legislative and other appropriations | | 31 | | 28 | | (3 | ) | 31 | | 124 | | 124 | | — | | 132 | |
Subtotal | | 8,915 | | 8,577 | | (338 | ) | 8,481 | | 35,631 | | 35,567 | | (64 | ) | 34,840 | |
Liability for reimbursement of HST transition funding | | — | | — | | — | | — | | — | | — | | — | | 1,599 | |
Prior year liability adjustments | | — | | — | | — | | — | | — | | — | | — | | (99 | ) |
Consolidated revenue fund expense | | 8,915 | | 8,577 | | (338 | ) | 8,481 | | 35,631 | | 35,567 | | (64 | ) | 36,340 | |
Expenses recovered from external entities | | 545 | | 532 | | (13 | ) | 532 | | 2,756 | | 2,873 | | 117 | | 2,689 | |
Funding provided to service delivery agencies | | (5,441 | ) | (5,434 | ) | 7 | | (5,460 | ) | (21,127 | ) | (21,275 | ) | (148 | ) | (21,199 | ) |
Total direct program spending | | 4,019 | | 3,675 | | (344 | ) | 3,553 | | 17,260 | | 17,165 | | (95 | ) | 17,830 | |
Service delivery agency expense | | | | | | | | | | | | | | | | | |
School districts | | 1,639 | | 1,617 | | (22 | ) | 1,619 | | 5,569 | | 5,595 | | 26 | | 5,500 | |
Universities | | 935 | | 925 | | (10 | ) | 879 | | 4,050 | | 4,052 | | 2 | | 3,807 | |
Colleges and institutes | | 254 | | 260 | | 6 | | 254 | | 1,095 | | 1,109 | | 14 | | 1,095 | |
Health authorities and hospital societies | | 3,149 | | 3,026 | | (123 | ) | 3,069 | | 12,431 | | 12,524 | | 93 | | 12,116 | |
Other service delivery agencies | | 789 | | 834 | | 45 | | 788 | | 3,464 | | 3,511 | | 47 | | 3,459 | |
| | 6,766 | | 6,662 | | (104 | ) | 6,609 | | 26,609 | | 26,791 | | 182 | | 25,977 | |
Total expense | | 10,785 | | 10,337 | | (448 | ) | 10,162 | | 43,869 | | 43,956 | | 87 | | 43,807 | |
(1) Reflects government’s organization that was in effect at June 30, 2012.
(2) Restated to reflect government’s current accounting policies.
First Quarterly Report 2012/13
40
First Quarterly Report
Table 3.9 2012/13 Expense By Function
| | Year-to-Date to June 30 | | Full Year | |
| | 2012/13 | | Actual | | 2012/13 | | Actual | |
($ millions) | | Budget | | Actual | | Variance | | 2011/12 (1) | | Budget | | Forecast | | Variance | | 2011/12 (1) | |
Health: | | | | | | | | | | | | | | | | | |
Medical Services Plan | | 967 | | 979 | | 12 | | 950 | | 4,162 | | 4,190 | | 28 | | 4,004 | |
Pharmacare | | 280 | | 270 | | (10 | ) | 273 | | 1,210 | | 1,190 | | (20 | ) | 1,147 | |
Regional services | | 2,845 | | 2,653 | | (192 | ) | 2,666 | | 11,840 | | 11,819 | | (21 | ) | 11,255 | |
Other healthcare expenses (2) | | 178 | | 155 | | (23 | ) | 144 | | 758 | | 800 | | 42 | | 642 | |
| | 4,270 | | 4,057 | | (213 | ) | 4,033 | | 17,970 | | 17,999 | | 29 | | 17,048 | |
Education: | | | | | | | | | | | | | | | | | |
Elementary and secondary | | 1,760 | | 1,711 | | (49 | ) | 1,708 | | 5,973 | | 5,982 | | 9 | | 5,885 | |
Post-secondary | | 1,150 | | 1,138 | | (12 | ) | 1,089 | | 5,204 | | 5,245 | | 41 | | 4,917 | |
Other education expenses (3) | | 115 | | 86 | | (29 | ) | 93 | | 584 | | 587 | | 3 | | 436 | |
| | 3,025 | | 2,935 | | (90 | ) | 2,890 | | 11,761 | | 11,814 | | 53 | | 11,238 | |
Social services: | | | | | | | | | | | | | | | | | |
Social assistance (2),(3) | | 389 | | 394 | | 5 | | 395 | | 1,545 | | 1,544 | | (1 | ) | 1,550 | |
Child welfare (2) | | 262 | | 274 | | 12 | | 284 | | 1,060 | | 1,064 | | 4 | | 1,112 | |
Low income tax credit transfers | | 120 | | 128 | | 8 | | 117 | | 523 | | 523 | | — | | 509 | |
Community living and other services | | 199 | | 182 | | (17 | ) | 172 | | 800 | | 804 | | 4 | | 769 | |
| | 970 | | 978 | | 8 | | 968 | | 3,928 | | 3,935 | | 7 | | 3,940 | |
Protection of persons and property | | 338 | | 331 | | (7 | ) | 350 | | 1,380 | | 1,430 | | 50 | | 1,512 | |
Transportation | | 395 | | 380 | | (15 | ) | 353 | | 1,655 | | 1,655 | | — | | 1,544 | |
Natural resources and economic development | | 422 | | 403 | | (19 | ) | 369 | | 1,792 | | 1,808 | | 16 | | 1,881 | |
Other | | 392 | | 372 | | (20 | ) | 329 | | 1,360 | | 1,344 | | (16 | ) | 1,394 | |
Contingencies | | 75 | | 2 | | (73 | ) | 1 | | 300 | | 300 | | — | | 22 | |
General government | | 288 | | 295 | | 7 | | 291 | | 1,207 | | 1,249 | | 42 | | 2,845 | |
Debt servicing | | 610 | | 584 | | (26 | ) | 578 | | 2,516 | | 2,422 | | (94 | ) | 2,383 | |
Total expense | | 10,785 | | 10,337 | | (448 | ) | 10,162 | | 43,869 | | 43,956 | | 87 | | 43,807 | |
(1) Restated to reflect government’s current organization and accounting policies.
(2) Payments for healthcare services by the Ministry of Social Development and the Ministry of Children and Family Development made on behalf of their clients are reported in the Health function.
(3) Payments for training costs by the Ministry of Social Development made on behalf of its clients are reported in the Education function.
First Quarterly Report 2012/13
41
First Quarterly Report
Table 3.10 2012/13 Capital Spending
| | Year-to-Date to June 30 | | Full Year | |
| | 2012/13 | | Actual | | 2012/13 | | Actual | |
($ millions) | | Budget | | Actual | | Variance | | 2011/12 | | Budget | | Forecast | | Variance | | 2011/12 | |
Taxpayer-supported | | | | | | | | | | | | | | | | | |
Education | | | | | | | | | | | | | | | | | |
School districts | | 83 | | 123 | | 40 | | 166 | | 486 | | 530 | | 44 | | 560 | |
Post-secondary institutions | | 172 | | 75 | | (97 | ) | 85 | | 688 | | 781 | | 93 | | 662 | |
Health | | 220 | | 127 | | (93 | ) | 129 | | 879 | | 965 | | 86 | | 732 | |
BC Transportation Financing Authority | | 267 | | 228 | | (39 | ) | 297 | | 1,069 | | 1,185 | | 116 | | 921 | |
BC Transit | | 23 | | 4 | | (19 | ) | 7 | | 90 | | 66 | | (24 | ) | 37 | |
BC Place redevelopment | | — | | — | | — | | 74 | | — | | 8 | | 8 | | 194 | |
Government operating (ministries) | | 79 | | 24 | | (55 | ) | 43 | | 454 | | 455 | | 1 | | 245 | |
Other (1) | | 23 | | 24 | | 1 | | 53 | | 91 | | 133 | | 42 | | 221 | |
Capital planning adjustment | | — | | — | | — | | — | | — | | (408 | ) | (408 | ) | — | |
Total taxpayer-supported | | 867 | | 605 | | (262 | ) | 854 | | 3,757 | | 3,715 | | (42 | ) | 3,572 | |
| | | | | | | | | | | | | | | | | |
Self-supported | | | | | | | | | | | | | | | | | |
BC Hydro | | 547 | | 435 | | (112 | ) | 397 | | 2,361 | | 2,196 | | (165 | ) | 1,917 | |
Columbia River power projects (2) | | 28 | | 27 | | (1 | ) | 39 | | 122 | | 122 | | — | | 108 | |
Transportation Investment Corporation (Port Mann) | | 207 | | 195 | | (12 | ) | 183 | | 606 | | 626 | | 20 | | 735 | |
BC Rail | | 3 | | — | | (3 | ) | 1 | | 13 | | 15 | | 2 | | 9 | |
ICBC | | 19 | | 23 | | 4 | | 21 | | 101 | | 97 | | (4 | ) | 92 | |
BC Lotteries | | 29 | | 23 | | (6 | ) | 15 | | 116 | | 116 | | — | | 74 | |
Liquor Distribution Branch | | 7 | | 1 | | (6 | ) | 3 | | 27 | | 22 | | (5 | ) | 19 | |
Total self-supported | | 840 | | 704 | | (136 | ) | 659 | | 3,346 | | 3,194 | | (152 | ) | 2,954 | |
Total capital spending | | 1,707 | | 1,309 | | (398 | ) | 1,513 | | 7,103 | | 6,909 | | (194 | ) | 6,526 | |
(1) Includes BC Housing Management Commission, Provincial Rental Housing Corporation and other service delivery agencies.
(2) Joint ventures of the Columbia Power Corporation and Columbia Basin Trust.
First Quarterly Report 2012/13
42
First Quarterly Report
Table 3.11 Capital Expenditure Projects Greater Than $50 million (1)
Note: Information in bold type denotes changes from Budget 2012 tabled on February 21, 2012.
| | Projected | | Total Costs | | Projected | | Total | | Project Financing | |
| | Completion | | to | | Costs to | | Capital | | Internal/ | | P3 | | Federal | | Other | |
($ millions) | | Date | | June 30, 2012 | | Complete | | Costs | | Borrowing | | Liability | | Gov’t | | Contrib’ns | |
Taxpayer-supported | | | | | | | | | | | | | | | | | |
School districts | | | | | | | | | | | | | | | | | |
Revelstoke Elementary and Secondary | | Fall 2012 | | 46 | | 14 | | 60 | | 58 | | — | | — | | 2 | |
Chilliwack Secondary | | Fall 2013 | | 16 | | 42 | | 58 | | 58 | | — | | — | | — | |
Burnaby Central Secondary | | Fall 2012 | | 50 | | 10 | | 60 | | 60 | | — | | — | | — | |
Centennial Secondary | | Spring 2015 | | 1 | | 61 | | 62 | | 62 | | — | | — | | — | |
Alberni District Secondary | | Fall 2012 | | 42 | | 16 | | 58 | | 54 | | — | | — | | 4 | |
Southern Okanagan Secondary | | Fall 2013 | | 32 | | 22 | | 54 | | 52 | | — | | — | | 2 | |
Oak Bay Secondary | | Fall 2015 | | — | | 50 | | 50 | | 48 | | — | | — | | 2 | |
Kitsilano Secondary | | Fall 2015 | | 1 | | 57 | | 58 | | 58 | | — | | — | | — | |
Seismic mitigation program | | Spring 2021 | | — | | 1,300 | | 1,300 | | 1,300 | | — | | — | | — | |
Full-day kindergarten | | Winter 2012 | | 118 | | 16 | | 134 | | 134 | | — | | — | | — | |
Total school districts | | | | 306 | | 1,588 | | 1,894 | | 1,884 | | — | | — | | 10 | |
Post-secondary institutions | | | | | | | | | | | | | | | | | |
University of British Columbia | | | | | | | | | | | | | | | | | |
– Pharmaceutical Sciences and Centre for Drug | | | | | | | | | | | | | | | | | |
Research & Development | | Fall 2012 | | 93 | | 40 | | 133 | | 86 | | — | | 3 | | 44 | |
Health facilities | | | | | | | | | | | | | | | | | |
Jim Pattison Outpatient Care and Surgery Centre (2), (3) | | | | | | | | | | | | | | | | | |
– Direct procurement | | Fall 2012 | | 59 | | 1 | | 60 | | 60 | | — | | — | | — | |
– P3 contract | | Spring 2011 | | 172 | | — | | 172 | | — | | 172 | | — | | — | |
Victoria Royal Jubilee Hospital — Patient Care Centre | | | | | | | | | | | | | | | | | |
– Direct procurement | | Spring 2013 | | 48 | | 21 | | 69 | | 23 | | — | | — | | 46 | |
– P3 contract | | Spring 2011 | | 280 | | — | | 280 | | — | | 199 | | — | | 81 | |
Fort St. John Hospital and Residential Care | | | | | | | | | | | | | | | | | |
– Direct procurement | | Spring 2012 | | 47 | | 6 | | 53 | | 52 | | — | | — | | 1 | |
– P3 contract | | Spring 2012 | | 249 | | — | | 249 | | 121 | | 33 | | — | | 95 | |
Expansions to Kelowna General and Vernon Jubilee Hospitals | | | | | | | | | | | | | | | | | |
– Direct procurement | | Spring 2012 | | 37 | | 12 | | 49 | | 25 | | — | | — | | 24 | |
– P3 contract | | Spring 2012 | | 386 | | — | | 386 | | 3 | | 158 | | — | | 225 | |
Northern Cancer Control Strategy | | | | | | | | | | | | | | | | | |
– Direct procurement | | Summer 2013 | | 24 | | 11 | | 35 | | 32 | | — | | — | | 3 | |
– P3 contract | | Summer 2012 | | 67 | | 4 | | 71 | | 54 | | 17 | | — | | — | |
Lions Gate Hospital (Mental Health) Redevelopment (4) | | Fall 2013 | | 2 | | 60 | | 62 | | 38 | | — | | — | | 24 | |
Surrey Emergency/Critical Care Tower (5) | | | | | | | | | | | | | | | | | |
– Direct procurement | | Summer 2014 | | 43 | | 151 | | 194 | | 174 | | — | | — | | 20 | |
– P3 contract | | Summer 2014 | | 132 | | 186 | | 318 | | 139 | | 179 | | — | | — | |
North Island Hospitals | | Early 2017 | | — | | 601 | | 601 | | 365 | | — | | — | | 236 | |
Interior Heart and Surgical Centre (6) | | Spring 2017 | | 74 | | 293 | | 367 | | 217 | | 79 | | — | | 71 | |
Children’s and Women’s Hospital (7) | | Spring 2018 | | 22 | | 660 | | 682 | | 532 | | — | | — | | 150 | |
Lakes District Hospital | | Summer 2015 | | — | | 55 | | 55 | | 46 | | — | | — | | 9 | |
Queen Charlotte/Haida Gwaii Hospital | | Summer 2015 | | — | | 50 | | 50 | | 31 | | — | | — | | 19 | |
Total health facilities | | | | 1,642 | | 2,111 | | 3,753 | | 1,912 | | 837 | | — | | 1,004 | |
Transportation | | | | | | | | | | | | | | | | | |
South Fraser Perimeter Road | | | | | | | | | | | | | | | | | |
– Direct procurement | | Summer 2014 | | 876 | | 186 | | 1,062 | | 714 | | — | | 348 | | — | |
– P3 contract | | Summer 2014 | | 143 | | 59 | | 202 | | — | | 202 | | — | | — | |
Sierra Yoyo-Desan Road upgrade (8) | | Fall 2014 | | 82 | | 55 | | 137 | | 137 | | — | | — | | — | |
Total transportation | | | | 1,101 | | 300 | | 1,401 | | 851 | | 202 | | 348 | | — | |
Other | | | | | | | | | | | | | | | | | |
Integrated case management system | | Fall 2014 | | 106 | | 76 | | 182 | | 179 | | — | | 3 | | — | |
Surrey Pretrial Service Centre expansion (9) | | | | | | | | | | — | | | | | | | |
– Direct procurement | | Fall 2013 | | 7 | | 7 | | 14 | | 14 | | — | | — | | — | |
– P3 contract | | Fall 2013 | | 20 | | 79 | | 99 | | 56 | | 43 | | — | | — | |
e-Health initiative (10) | | Spring 2013 | | 249 | | 13 | | 262 | | 145 | | — | | 117 | | — | |
Total other | | | | 382 | | 175 | | 557 | | 394 | | 43 | | 120 | | — | |
Total taxpayer-supported | | | | 3,524 | | 4,214 | | 7,738 | | 5,127 | | 1,082 | | 471 | | 1,058 | |
First Quarterly Report 2012/13
43
First Quarterly Report
Table 3.11 Capital Expenditure Projects Greater Than $50 million (1) (continued)
Note: Information in bold type denotes changes from Budget 2012 tabled on February 21, 2012.
| | Projected | | Total Costs | | Projected | | Total | | Project Financing | |
| | Completion | | to | | Costs to | | Capital | | Internal/ | | P3 | | Federal | | Other | |
($ millions) | | Date | | June 30, 2012 | | Complete | | Costs | | Borrowing | | Liability | | Gov’t | | Contrib’ns | |
Self-supported | | | | | | | | | | | | | | | | | |
Transportation | | | | | | | | | | | | | | | | | |
Port Mann Bridge / Highway 1 | | Winter 2013 | | 2,653 | | 666 | | 3,319 | | 3,319 | | — | | — | | — | |
Power generation and transmission | | | | | | | | | | | | | | | | | |
BC Hydro (11) | | | | | | | | | | | | | | | | | |
– Revelstoke Unit 5 generation | | Fall 2010 | (3) | 243 | | 2 | | 245 | | 245 | | — | | — | | — | |
– Cheakamus spillway gate reliability upgrade | | Summer 2011 | (3) | 62 | | 1 | | 63 | | 63 | | — | | — | | — | |
– Fort Nelson generating station upgrade | | Winter 2012 | (3) | 161 | | 3 | | 164 | | 164 | | — | | — | | — | |
– Columbia Valley transmission | | Fall 2012 | | 93 | | 40 | | 133 | | 133 | | — | | — | | — | |
– Stave Falls spillway gate reliability upgrade (12) | | Winter 2013 | | 37 | | 27 | | 64 | | 64 | | — | | — | | — | |
– Seymour Arm series capacitor (12) | | Winter 2013 | | 2 | | 83 | | 85 | | 85 | | — | | — | | — | |
– Vancouver City Central transmission | | Spring 2013 | | 107 | | 66 | | 173 | | 173 | | — | | — | | — | |
– Smart metering and infrastructure program | | Summer 2013 | | 407 | | 523 | | 930 | | 930 | | — | | — | | — | |
– Mica gas insulated switchgear replacement (12) | | Winter 2014 | | 117 | | 82 | | 199 | | 199 | | — | | — | | — | |
– Dawson Creek/Chetwynd area transmission (12) | | Spring 2014 | | 14 | | 286 | | 300 | | 300 | | — | | — | | — | |
– Northwest transmission line | | Spring 2014 | | 128 | | 433 | | 561 | | 234 | | — | | 130 | | 197 | |
– Hugh Keenleyside spillway gate reliability upgrade (12) | | Spring 2014 | | 30 | | 64 | | 94 | | 94 | | — | | — | | — | |
– Interior to Lower Mainland transmission line | | Winter 2015 | | 131 | | 578 | | 709 | | 709 | | — | | — | | — | |
– GM Shrum units 1 to 5 turbine upgrade (12) | | Spring 2015 | | 37 | | 251 | | 288 | | 288 | | — | | — | | — | |
– Mica units 5 and 6 project (12) | | Fall 2015 | | 186 | | 553 | | 739 | | 739 | | — | | — | | — | |
– Ruskin Dam safety and powerhouse upgrade (12) | | Winter 2018 | | 86 | | 694 | | 780 | | 780 | | — | | — | | — | |
– John Hart replacement (12) | | TBD | | 66 | | 1,083 | | 1,149 | | 1,149 | | — | | — | | — | |
Columbia River power projects (13) | | | | | | | | | | | | | | | | | |
– Waneta Dam power expansion | | Spring 2015 | | 184 | | 166 | | 350 | | 350 | | — | | — | | — | |
Total power generation and transmission | | | | 2,091 | | 4,935 | | 7,026 | | 6,699 | | — | | 130 | | 197 | |
Other | | | | | | | | | | | | | | | | | |
British Columbia Lottery Corporation | | | | | | | | | | | | | | | | | |
– Gaming management system | | Winter 2015 | | 19 | | 85 | | 104 | | 104 | | — | | — | | — | |
Insurance Corporation of British Columbia | | | | | | | | | | | | | | | | | |
– Business transformation program | | Fall 2016 | | 76 | | 134 | | 210 | | 210 | | — | | — | | — | |
Total other | | | | 95 | | 219 | | 314 | | 314 | | — | | — | | — | |
Total self-supported | | | | 4,839 | | 5,820 | | 10,659 | | 10,332 | | — | | 130 | | 197 | |
Total $50 million projects | | | | 8,363 | | 10,034 | | 18,397 | | 15,459 | | 1,082 | | 601 | | 1,255 | |
(1) Only projects that receive provincial funding and have been approved by Treasury Board and/or Crown corporation boards are included in this table. Ministry service plans may include projects that still require final approval. Capital costs reflect current government accounting policy.
(2) Figures shown do not include an additional $2 million to establish an offsite access road to the facility.
(3) Assets have been put into service and only trailing costs remain.
(4) Figures shown have been revised to include an approved provincial project reserve of $4 million.
(5) Figures shown have been revised to include an approved provincial project reserve of $25 million. The Emergency Department is expected to be operational by summer 2013.
(6) Figures shown have been revised to include an approved provincial project reserve of $23 million.
(7) Figures shown are based on preliminary Treasury Board approvals. These amounts will change after P3 contracts are finalized.
(8) Figures shown do not include a $50 million capital reserve for future oil and gas access road development in the Northern Rockies area.
(9) Figures shown have been revised to include an approved project reserve of $9 million.
(10) The e-Health initiative is comprised of 7 distinct projects. Figures shown reflect the total costs of the Ministry of Health’s 7 provincially co-ordinated e-Health projects. The federal government portion is an estimate based on a signed agreement with Canada Health Infoway and the actual amount may vary, depending on eligible project costs incurred.
(11) BC Hydro has restated the capital cost of a number of its projects to conform with the move to International Financial Reporting Standards. For further details, please see Appendix I of the F2012-F2014 Amended Revenue Requirements Application currently before the BC Utilities Commission.
(12) Total costs and completion dates for these projects vary depending on the final scope. Information shown represents current assumptions.
(13) Joint ventures of the Columbia Power Corporation and Columbia Basin Trust. In October 2010, CPC/CBT reached an agreement for a partnership with Fortis Inc. to develop an electricity generating facility at the Waneta Dam south of Trail. Capital spending information reflects 49 per cent of the total project — CPC’s 32.5 per cent share combined with CBT’s 16.5 per cent share.
First Quarterly Report 2012/13
44
First Quarterly Report
Table 3.12 2012/13 Provincial Debt (1)
| | Year-to-Date to June 30 | | Full Year | |
| | 2012/13 | | Actual | | 2012/13 | | Actual | |
($ millions) | | Budget | | Actual | | Variance | | 2011/12 | | Budget | | Forecast | | Variance | | 2011/12 | |
Taxpayer-supported debt | | | | | | | | | | | | | | | | | |
Provincial government operating | | 5,393 | | 6,643 | | 1,250 | | 5,779 | | 6,590 | | 7,020 | | 430 | | 5,117 | |
Provincial government general capital | | 2,696 | | 2,696 | | — | | 2,696 | | 2,696 | | 2,696 | | — | | 2,696 | |
Manage natural gas royalty impacts | | — | | — | | — | | — | | — | | (241 | ) | (241 | ) | — | |
Provincial government operating | | 8,089 | | 9,339 | | 1,250 | | 8,475 | | 9,286 | | 9,475 | | 189 | | 7,813 | |
Other taxpayer-supported debt (mainly capital) | | | | | | | | | | | | | | | | | |
Education (2) | | | | | | | | | | | | | | | | | |
School districts | | 6,645 | | 6,384 | | (261 | ) | 5,934 | | 6,985 | | 6,908 | | (77 | ) | 6,407 | |
Post-secondary institutions | | 4,247 | | 4,124 | | (123 | ) | 4,033 | | 4,349 | | 4,318 | | (31 | ) | 4,185 | |
| | 10,892 | | 10,508 | | (384 | ) | 9,967 | | 11,334 | | 11,226 | | (108 | ) | 10,592 | |
Health (2), (3) | | 5,454 | | 5,344 | | (110 | ) | 4,870 | | 5,864 | | 5,825 | | (39 | ) | 5,293 | |
Highways and public transit | | | | | | | | | | | | | | | | | |
BC Transportation Financing Authority (4) | | 6,281 | | 6,395 | | 114 | | 5,742 | | 7,074 | | 7,172 | | 98 | | 6,287 | |
Public transit | | 1,000 | | 1,000 | | — | | 999 | | 999 | | 1,000 | | 1 | | 1,000 | |
SkyTrain extension | | 1,174 | | 1,174 | | — | | 1,175 | | 1,175 | | 1,174 | | (1 | ) | 1,174 | |
BC Transit | | 191 | | 177 | | (14 | ) | 152 | | 176 | | 163 | | (13 | ) | 183 | |
| | 8,646 | | 8,746 | | 100 | | 8,068 | | 9,424 | | 9,509 | | 85 | | 8,644 | |
Other | | | | | | | | | | | | | | | | | |
Social housing (5) | | 666 | | 690 | | 24 | | 552 | | 660 | | 769 | | 109 | | 674 | |
Provincial government general capital | | 947 | | 906 | | (41 | ) | 599 | | 1,277 | | 1,263 | | (14 | ) | 808 | |
BC Pavilion Corporation | | 378 | | 383 | | 5 | | 257 | | 378 | | 397 | | 19 | | 383 | |
BC Immigrant Investment Fund | | 400 | | 400 | | — | | 356 | | 395 | | 395 | | — | | 398 | |
Other (6) | | 117 | | 99 | | (18 | ) | 114 | | 118 | | 84 | | (34 | ) | 87 | |
Impact of capital planning adjustments | | — | | — | | — | | — | | — | | (264 | ) | (264 | ) | — | |
| | 2,508 | | 2,478 | | (30 | ) | 1,878 | | 2,828 | | 2,644 | | (184 | ) | 2,350 | |
Total other taxpayer-supported | | 27,500 | | 27,076 | | (424 | ) | 24,783 | | 29,450 | | 29,204 | | (246 | ) | 26,879 | |
Total taxpayer-supported debt | | 35,589 | | 36,415 | | 826 | | 33,258 | | 38,736 | | 38,679 | | (57 | ) | 34,692 | |
Self-supported debt | | | | | | | | | | | | | | | | | |
Commercial Crown corporations | | | | | | | | | | | | | | | | | |
BC Hydro | | 14,249 | | 13,535 | | (714 | ) | 12,472 | | 15,336 | | 14,673 | | (663 | ) | 12,978 | |
Columbia River power projects (7) | | 481 | | 478 | | (3 | ) | 483 | | 476 | | 475 | | (1 | ) | 481 | |
BC Lotteries | | 105 | | 110 | | 5 | | 90 | | 128 | | 109 | | (19 | ) | 90 | |
Transportation Investment Corporation (Port Mann) | | 2,011 | | 2,300 | | 289 | | 1,600 | | 2,554 | | 2,477 | | (77 | ) | 1,779 | |
Post-secondary institutions’ subsidiaries | | 173 | | 173 | | — | | 173 | | 173 | | 173 | | — | | 173 | |
| | 17,019 | | 16,596 | | (423 | ) | 14,818 | | 18,667 | | 17,907 | | (760 | ) | 15,501 | |
Warehouse borrowing program | | — | | 746 | | 746 | | 481 | | — | | — | | — | | — | |
Total self-supported debt | | 17,019 | | 17,342 | | 323 | | 15,299 | | 18,667 | | 17,907 | | (760 | ) | 15,501 | |
Forecast allowance | | — | | — | | — | | — | | 200 | | 150 | | (50 | ) | — | |
Total provincial debt | | 52,608 | | 53,757 | | 1,149 | | 48,557 | | 57,603 | | 56,736 | | (867 | ) | 50,193 | |
(1) Debt is after deduction of sinking funds and unamortized discounts, and excludes accrued interest. Government direct and fiscal agency accrued interest is reported in the government’s accounts as an accounts payable.
(2) Includes debt and guarantees incurred by the government on behalf of school districts, universities, colleges and health authorities/hospital societies (SUCH), and debt directly incurred by these entities.
(3) Health facilities’ debt includes public-private partnership obligations of $941 million for the three months ended June 30, 2011, $988 million for the three months ended June 30, 2012, $995 million for fiscal 2011/12 and $1,106 million for fiscal 2012/13.
(4) BC Transportation Financing Authority debt includes public-private partnership obligations of $850 million for the three months ended June 30, 2011, $906 million for the three months ended June 30, 2012, $890 million for fiscal 2011/12 and $926 million for fiscal 2012/13.
(5) Includes the BC Housing Management Commission and the Provincial Rental Housing Corporation.
(6) Includes service delivery agencies, student loan guarantees, loan guarantees to agricultural producers, guarantees issued under economic development and home mortgage assistance programs and loan guarantee provisions.
(7) Joint ventures of the Columbia Power Corporation and Columbia Basin Trust.
First Quarterly Report 2012/13
45
First Quarterly Report
Table 3.13 2012/13 Statement of Financial Position
| | Actual | | Year-to-Date | | Forecast | |
| | March 31, | | June 30, | | March 31, | |
($ millions) | | 2012 | | 2012 | | 2013 | |
Financial assets | | | | | | | |
Cash and temporary investments | | 3,239 | | 3,649 | | 3,430 | |
Other financial assets | | 8,133 | | 7,606 | | 8,524 | |
Sinking funds | | 1,491 | | 1,609 | | 1,796 | |
Investments in commercial Crown corporations: | | | | | | | |
Retained earnings | | 6,676 | | 6,582 | | 6,960 | |
Recoverable capital loans | | 14,846 | | 15,944 | | 17,258 | |
| | 21,522 | | 22,526 | | 24,218 | |
Warehouse borrowing program assets | | — | | 746 | | — | |
| | 34,385 | | 36,136 | | 37,968 | |
Liabilities | | | | | | | |
Accounts payable and accrued liabilities | | 8,833 | | 7,974 | | 8,976 | |
Deferred revenue | | 10,571 | | 10,371 | | 10,012 | |
Debt: | | | | | | | |
Taxpayer-supported debt | | 34,692 | | 36,415 | | 38,679 | |
Self-supported debt | | 15,501 | | 17,342 | | 17,907 | |
Forecast allowance | | — | | — | | 150 | |
Total provincial debt | | 50,193 | | 53,757 | | 56,736 | |
Add: debt offset by sinking funds | | 1,491 | | 1,609 | | 1,796 | |
Less : guarantees and non-guaranteed debt | | (730 | ) | (728 | ) | (687 | ) |
Financial statement debt | | 50,954 | | 54,638 | | 57,845 | |
| | 70,358 | | 72,983 | | 76,833 | |
Net liabilities | | (35,973 | ) | (36,847 | ) | (38,865 | ) |
Capital and other non-financial assets | | | | | | | |
Tangible capital assets | | 35,763 | | 35,859 | | 37,363 | |
Other non-financial assets | | 2,667 | | 2,904 | | 2,760 | |
| | 38,430 | | 38,763 | | 40,123 | |
Accumulated surplus (deficit) | | 2,457 | | 1,916 | | 1,258 | |
Changes in Financial Position
| | | | Year-to-Date | | Forecast | |
| | | | June 30, | | March 31, | |
($ millions) | | | | 2012 | | 2013 | |
(Surplus) deficit for the period | | | | 464 | | 1,141 | |
Comprehensive income (increase) decrease | | | | 77 | | 58 | |
(Increase) decrease in accumulated surplus | | | | 541 | | 1,199 | |
Capital and other non-financial asset changes: | | | | | | | |
Increase in taxpayer-supported capital investments | | | | 605 | | 3,715 | |
Less: amortization and other accounting changes | | | | (509 | ) | (2,115 | ) |
Change in net capital assets | | | | 96 | | 1,600 | |
Increase (decrease) in other non-financial assets | | | | 237 | | 93 | |
| | | | 333 | | 1,693 | |
Increase (decrease) in net liabilities | | | | 874 | | 2,892 | |
Investment and working capital changes: | | | | | | | |
Increase (reduction) in cash and temporary investments | | | | 410 | | 191 | |
Increase in total investment in commercial Crown corporations: | | | | | | | |
Increase (decrease) in retained earnings | | | | (94 | ) | 284 | |
Self-supported capital investments | | | | 704 | | 3,194 | |
Less: loan repayments and other accounting changes | | | | 394 | | (782 | ) |
| | | | 1,004 | | 2,696 | |
Other working capital changes | | | | 1,396 | | 1,112 | |
| | | | 2,810 | | 3,999 | |
Increase (decrease) in financial statement debt | | | | 3,684 | | 6,891 | |
(Increase) decrease in sinking fund debt | | | | (118 | ) | (305 | ) |
Increase (decrease) in guarantees and non-guaranteed debt | | | | (2 | ) | (43 | ) |
Increase (decrease) in total provincial debt | | | | 3,564 | | 6,543 | |
First Quarterly Report 2012/13
46
APPENDIX
2012/13 First Quarterly Report | September 13, 2012 |
Table A1 Material Assumptions – Revenue
| | Budget | | Updated | | | | | | | |
Revenue Source and Assumptions | | 2012 | | Forecast | | Plan | | Plan | | | |
($ millions unless otherwise specified) | | 2012/13 | | 2013/14 | | 2014/15 | | 2012/13 Sensitivities | |
Personal income tax | | $ | 6,630 | | $ | 6,614 | | $ | 7,112 | | $ | 7,496 | | | |
Current calendar year assumptions | | | | | | | | | | | |
Personal income growth | | 3.7 | % | 3.5 | % | 3.6 | % | 4.0 | % | +/- 1% change in 2012 BC personal income growth equals +/- $50 to $100 million | |
Labour income growth | | 3.6 | % | 3.2 | % | 4.0 | % | 4.2 | % | |
Tax base growth | | 3.7 | % | 3.5 | % | 4.2 | % | 4.8 | % | |
Average tax yield | | 4.88 | % | 4.88 | % | 5.06 | % | 5.10 | % | |
Current-year tax | | $ | 6,273 | | $ | 6,264 | | $ | 6,721 | | $ | 7,146 | | +/- 1% change in 2011 BC personal or taxable income growth equals +/- $50 to $100 million one-time effect (prior-year adjustment) and could result in an additional +/-$55 to $75 million base change in 2012/13 | |
BC Tax Reduction | | $ | -111 | | $ | -111 | | $ | -113 | | $ | -115 | | |
Non-Refundable BC tax credits | | $ | -47 | | $ | -47 | | $ | -47 | | $ | -47 | | |
Policy neutral elasticity * | | 1.2 | | 1.2 | | 1.4 | | 1.4 | | |
Fiscal year assumptions | | | | | | | | | | |
Prior-year adjustment | | | | | | | | | | |
| | | | | | | | | | |
| | | | | | | | | | | |
| | 2011 Assumptions | | | | | | | |
2011 Tax-year | | | | | | | | | | | |
Personal income growth | | 3.7 | % | 4.1 | % | | | | | | |
Tax base growth | | 3.0 | % | 3.0 | % | | | | | | |
Average 2011 tax yield | | 4.84 | % | 4.84 | % | | | | | | |
2011 tax | | $ | 6,006 | | $ | 6,006 | | | | | | | |
BC Tax Reduction | | $ | -109 | | $ | -109 | | | | | | | |
Non-Refundable BC tax credits | | $ | -43 | | $ | -43 | | | | | | | |
Policy neutral elasticity * | | 1.0 | | 0.9 | | | | | | | |
* Ratio of annual per cent change in current-year revenue to annual per cent change in personal income (calendar year).
Corporate income tax | | $ | 2,266 | | $ | 2,286 | | $ | 2,039 | | $ | 2,223 | | | |
Components of revenue (fiscal year) | | | | | | | | | | | |
Advance instalments | | $ | 2,305 | | $ | 2,325 | | $ | 2,182 | | $ | 2,352 | | | |
International Business Activity Act refunds | | $ | -20 | | $ | -20 | | $ | -20 | | $ | -15 | | | |
Prior-year adjustment | | $ | -19 | | $ | -19 | | $ | -123 | | $ | -114 | | | |
Current calendar year assumptions | | | | | | | | | | | |
National tax base ($ billions) | | $ | 245.9 | | $ | 249.1 | | $ | 266.1 | | $ | 281.3 | | +/- 1% change in the 2012 national tax base equals +/- $20 to $30 million | |
BC instalment share of national tax base | | 11.8 | % | 11.8 | % | 11.2 | % | 11.1 | % | |
Effective tax rates (general/small business) | | 10.0 / 2.5 | | 10.0 / 2.5 | | 10.0 / 2.5 | | 10.75 / 2.5 | | |
BC tax base growth (post federal measures) | | 4.8 | % | 4.5 | % | 2.0 | % | 5.0 | % | | |
BC corporate profits growth | | 3.5 | % | 4.4 | % | 1.8 | % | 4.8 | % | +/- 1% change in the 2011 BC tax base equals +/- $20 to $30 million in 2012/13 | |
Non-Refundable BC tax credits | | $ | -76 | | $ | -76 | | $ | -80 | | $ | -85 | | |
| | | | | | | | | | |
| | | | | | | | | | | | | |
| | 2011 Assumptions | | | | | | | |
2011 Tax-year | | | | | | | | | | | |
BC tax base growth | | 10.5 | % | 10.7 | % | | | | | | |
BC corporate profits growth | | 10.6 | % | 13.4 | % | | | | | | |
Gross 2011 tax | | $ | 1,939 | | $ | 1,939 | | | | | | | |
Prior-year adjustments | | $ | -19 | | $ | -19 | | | | | | | |
Prior years losses/gains (included in above) | | $ | 0 | | $ | 0 | | | | | | | |
Non-Refundable BC tax credits | | $ | -71 | | $ | -71 | | | | | | | |
Revenue is recorded on a cash basis. Due to lags in the federal collection and instalment systems, changes to the BC corporate profits and tax base forecasts affect revenue in the succeeding year. The 2012/13 instalments from the federal government reflect 9 months of payments related to the 2012 tax year (paid during Apr-Sept 2012) and one-third of 2013 payments as reflected in the Tax Collection Agreement amended in Summer 2012. Instalments for the 2012 (2013) tax year are based on BC’s share of the national tax base for the 2010 (2011) tax year and a forecast of the 2012 (2013) national tax base. BC’s share of the 2010 national tax base was 11.8%, based on tax assessments as of December 31, 2011. Cash adjustments for any under/over payments from the federal government in respect of 2011 will be received/paid on March 28, 2013.
First Quarterly Report 2012/13
Appendix
Table A1 Material Assumptions – Revenue (continued)
| | Budget | | Updated | | | | | | | |
Revenue Source and Assumptions | | 2012 | | Forecast | | Plan | | Plan | | | |
($ millions unless otherwise specified) | | 2012/13 | | 2013/14 | | 2014/15 | | 2012/13 Sensitivities | |
Harmonized sales tax | | $ | 6,003 | | $ | 6,003 | | $ | 0 | | $ | 0 | | | |
Calendar Year | | | | | | | | | | +/- 1% change in consumer expenditure growth equals up to +/- $35 million | |
Nominal consumer expenditure | | 4.3 | % | 4.3 | % | | | | | |
Nominal residential investment | | 2.8 | % | 4.4 | % | | | | | |
Above two bases represent about 84% of the total base | | | | | | | | | | |
HST Rebates (% rebate of the provincial portion of the HST paid) | | | | | | | | | | +/- 1% change in residential construction growth equals up to +/- $15 million | |
Municipalities | | 75 | % | 75 | % | | | | | |
Charities and non-profit organizations | | 57 | % | 57 | % | | | | | |
New housing (up to $42,500) | | 71.43 | % | 71.43 | % | | | | | |
School authorities | | 87 | % | 87 | % | | | | | |
Universities and public colleges | | 75 | % | 75 | % | | | | | |
Hospital authorities | | 58 | % | 58 | % | | | | | | |
Components of revenue | | | | | | | | | | | |
Gross | | $ | 7,527 | | $ | 7,527 | | | | | | | |
Input tax credit denial (temporary) | | $ | 145 | | $ | 119 | | | | | | | |
Rebates: | | | | | | | | | | | |
· Point of sale | | $ | (372 | ) | $ | (366 | ) | | | | | | |
· Municipalities, charities & non profit organizations | | $ | (315 | ) | $ | (322 | ) | | | | | | |
· SUCH sector | | $ | (218 | ) | $ | (222 | ) | | | | | | |
· New housing | | $ | (552 | ) | $ | (516 | ) | | | | | | |
· Residential energy use | | $ | (212 | ) | $ | (217 | ) | | | | | | |
Other sales taxes | | $ | 98 | | $ | 101 | | $ | 5,984 | | $ | 6,178 | | | |
Social service tax base growth (fiscal year) | | | | | | 3.6 | % | 4.1 | % | | |
Calendar Year | | | | | | | | | | | |
Nominal consumer expenditure | | | | | | 3.8 | % | 4.6 | % | | |
Nominal business investment | | | | | | 7.3 | % | 4.5 | % | | |
Components of Provincial sales tax revenue | | | | | | | | | | | |
Consolidated Revenue Fund | | $ | 0 | | $ | 0 | | $ | 5,867 | | $ | 6,059 | | | |
BC Transportation Financing Authority | | $ | 0 | | $ | 0 | | $ | 14 | | $ | 14 | | | |
Tax on designated property (12% rate) | | $ | 98 | | $ | 101 | | $ | 103 | | $ | 105 | | | |
Fuel and carbon taxes | | $ | 2,109 | | $ | 2,112 | | $ | 2,190 | | $ | 2,219 | | | |
Calendar Year | | | | | | | | | | | |
Real GDP | | 1.8 | % | 2.0 | % | 1.8 | % | 2.3 | % | | |
Gasoline volumes | | 0.0 | % | 0.0 | % | 0.0 | % | 0.0 | % | | |
Diesel volumes | | 2.0 | % | 2.0 | % | 2.0 | % | 2.0 | % | | |
Natural gas volumes | | 2.0 | % | 2.0 | % | 2.0 | % | 2.0 | % | | |
Carbon tax rates (July 1) | | | | | | | | | | | |
Carbon dioxide equivalent emissions ($/tonne) | | $ | 30 | | $ | 30 | | $ | 30 | | $ | 30 | | | |
Natural gas (cents/gigajoule) | | 148.98¢ | | 148.98¢ | | 148.98¢ | | 148.98¢ | | | |
Gasoline (cents/litre) | | 6.67¢ | | 6.67¢ | | 6.67¢ | | 6.67¢ | | | |
Light fuel oil (cents/litre) | | 7.67¢ | | 7.67¢ | | 7.67¢ | | 7.67¢ | | | |
Carbon tax revenue | | $ | 1,172 | | $ | 1,180 | | $ | 1,247 | | $ | 1,266 | | | |
Carbon tax rates change on July 1 | | | | | | | | | | | |
Components of fuel tax revenue | | | | | | | | | | | |
Consolidated Revenue Fund | | $ | 491 | | $ | 486 | | $ | 493 | | $ | 500 | | | |
BC Transit | | $ | 11 | | $ | 11 | | $ | 11 | | $ | 11 | | | |
BC Transportation Financing Authority | | $ | 435 | | $ | 435 | | $ | 439 | | $ | 442 | | | |
| | $ | 937 | | $ | 932 | | $ | 943 | | $ | 953 | | | |
Property taxes | | $ | 2,013 | | $ | 1,998 | | $ | 2,082 | | $ | 2,167 | | | |
Calendar Year | | | | | | | | | | +/- 1% change in new construction and inflation equals up to +/- $5 million in residential property taxation revenue | |
BC Consumer Price Index | | 1.9 | % | 1.9 | % | 1.5 | % | 1.9 | % | |
Housing starts | | 24,978 | | 26,000 | | 24,908 | | 26,422 | | |
Home owner grants (fiscal year) | | $ | -799 | | $ | -804 | | $ | -825 | | $ | -845 | | |
Components of revenue | | | | | | | | | | |
Residential (net of home owner grants) | | $ | 704 | | $ | 696 | | $ | 727 | | $ | 756 | | | |
Non-residential | | $ | 1,030 | | $ | 1,026 | | $ | 1,062 | | $ | 1,095 | | +/- 1% change in new construction and inflation equals up to +/- $5 million in non-residential property taxation revenue | |
Rural area | | $ | 92 | | $ | 91 | | $ | 93 | | $ | 95 | | |
Police | | $ | 30 | | $ | 30 | | $ | 31 | | $ | 32 | | |
BC Assessment Authority | | $ | 79 | | $ | 79 | | $ | 82 | | $ | 84 | | |
BC Transit | | $ | 78 | | $ | 76 | | $ | 87 | | $ | 105 | | |
First Quarterly Report 2012/13
48
Appendix
Table A1 Material Assumptions – Revenue (continued)
| | Budget | | Updated | | | | | | | |
Revenue Source and Assumptions | | 2012 | | Forecast | | Plan | | Plan | | | |
($ millions unless otherwise specified) | | 2012/13 | | 2013/14 | | 2014/15 | | 2012/13 Sensitivities | |
Other taxes | | $ | 1,969 | | $ | 1,959 | | $ | 2,027 | | $ | 2,082 | | | |
Calendar Year | | | | | | | | | | | |
Population | | 1.1 | % | 0.7 | % | 1.2 | % | 1.2 | % | | |
BC Consumer Price Index | | 1.9 | % | 1.9 | % | 1.5 | % | 1.9 | % | | |
BC housing starts | | -5.4 | % | -1.5 | % | -4.2 | % | 6.1 | % | | |
Real GDP | | 1.8 | % | 2.0 | % | 1.8 | % | 2.3 | % | | |
Nominal GDP | | 3.7 | % | 3.9 | % | 3.6 | % | 4.2 | % | | |
Components of revenue | | | | | | | | | | | |
Property transfer | | $ | 893 | | $ | 893 | | $ | 880 | | $ | 930 | | | |
Tobacco | | $ | 652 | | $ | 642 | | $ | 717 | | $ | 717 | | | |
Corporation capital | | $ | 0 | | $ | 0 | | $ | 0 | | $ | 0 | | | |
Insurance premium | | $ | 424 | | $ | 424 | | $ | 430 | | $ | 435 | | | |
Energy, sales of Crown land tenures, metals, minerals and other | | $ | 1,973 | | $ | 1,629 | | $ | 1,775 | | $ | 1,846 | | | |
Natural gas price | | | | | | | | | | +/- $0.50 change in the natural gas price equals +/- $72 to $110 million. | |
Plant inlet, $Cdn/gigajoule | | $ | 2.52 | | $ | 1.41 | | $ | 2.12 | | $ | 2.65 | | |
Sumas, $US/ MMBtu | | $ | 3.88 | | $ | 2.99 | | $ | 3.80 | | $ | 4.37 | | |
Natural gas production volumes (petajoules) | | 1,648 | | 1,496 | | 1,620 | | 1,732 | | Sensitivities can vary significantly especially at lower prices. | |
Annual per cent change | | 12.8 | % | 4.0 | % | 8.3 | % | 6.9 | % | |
| | | | | | | | | | |
Oil price ($US/bbl at Cushing, Ok) | | $ | 97.07 | | $ | 93.99 | | $ | 93.69 | | $ | 96.90 | | +/- 1% change in natural gas volumes equals +/- $2 million on natural gas royalties +/- 1 cent change in the exchange rate equals +/- $2 million on natural gas royalties | |
| | | | | | | | | | |
Auctioned land base (000 hectares) | | 245 | | 94 | | 100 | | 110 | | |
Average bid price/hectare ($) | | $ | 1,200 | | $ | 650 | | $ | 700 | | $ | 750 | | |
Cash sales of Crown land tenures | | $ | 294 | | $ | 61 | | $ | 70 | | $ | 83 | | |
Metallurgical coal price ($US/tonne, fob west coast) | | $ | 218 | | $ | 218 | | $ | 217 | | $ | 210 | | |
Copper price ($US/lb) | | $ | 3.68 | | $ | 3.49 | | $ | 3.40 | | $ | 3.08 | | |
Annual electricity volumes set by treaty (million mega-watt hours) | | 4.3 | | 4.3 | | 4.3 | | 4.1 | | | |
Mid-Columbia electricity price ($US/mega-watt hour) | | $ | 32 | | $ | 25 | | $ | 34 | | $ | 39 | | +/- 10% change in the average Mid-Columbia electricity price equals +/- $10 million | |
Exchange rate (US¢/ Cdn$, calendar year) | | 96.6 | | 98.7 | | 99.9 | | 100.7 | | |
Components of revenue | | | | | | | | | | |
Natural gas royalties | | $ | 398 | | $ | 157 | | $ | 263 | | $ | 363 | | | |
Bonus bids, fees and rentals | | $ | 882 | | $ | 865 | | $ | 841 | | $ | 789 | | Based on a recommendation from the Auditor General to be consistent with generally accepted accounting principles, bonus bid revenue recognition reflects nine-year deferral of cash receipts from the sale of Crown land tenures | |
Petroleum royalties | | $ | 105 | | $ | 108 | | $ | 118 | | $ | 120 | | |
Columbia River Treaty electricity sales | | $ | 125 | | $ | 92 | | $ | 130 | | $ | 145 | | |
Coal | | $ | 341 | | $ | 309 | | $ | 307 | | $ | 297 | | |
Minerals, metals and other | | $ | 74 | | $ | 55 | | $ | 70 | | $ | 83 | | |
Oil and Gas Commission fees and levies | | $ | 48 | | $ | 43 | | $ | 46 | | $ | 49 | | |
Royalty programs and infrastructure credits | | | | | | | | | | |
Summer drilling | | $ | -25 | | $ | -17 | | $ | -25 | | $ | -28 | | |
Deep drilling | | $ | -122 | | $ | -101 | | $ | -226 | | $ | -399 | | |
Road and pipeline infrastructure | | $ | -188 | | $ | -42 | | $ | -86 | | $ | -107 | | |
Total | | $ | -335 | | $ | -160 | | $ | -337 | | $ | -534 | | |
Implicit average natural gas royalty rate | | 9.5 | % | 7.4 | % | 7.6 | % | 7.9 | % | |
Royalty program (marginal, low productivity and ultra marginal drilling) adjustments reflect reduced royalty rates.
Natural gas royalties incorporate royalty programs and Treasury Board approved infrastructure credits.
First Quarterly Report 2012/13
49
Appendix
Table A1 Material Assumptions – Revenue (continued)
| | Budget | | Updated | | | | | | | |
Revenue Source and Assumptions | | 2012 | | Forecast | | Plan | | Plan | | | |
($ millions unless otherwise specified) | | 2012/13 | | 2013/14 | | 2014/15 | | 2012/13 Sensitivities | |
Forests | | $ | 533 | | $ | 543 | | $ | 564 | | $ | 597 | | | |
Prices (calendar year average) | | | | | | | | | | | | | | +/- US$50 change in SPF price equals +/- $25 to $50 million | |
SPF 2x4 ($US/1000 bd ft) | | $ | 260 | | $ | 284 | | $ | 294 | | $ | 300 | | |
Random Lengths Composite ($US/thousand board feet) | | $ | 295 | | $ | 319 | | $ | 329 | | $ | 335 | | |
Pulp ($US/tonne) | | $ | 838 | | $ | 832 | | $ | 800 | | $ | 800 | | +/- US$50 change in pulp price equals +/-$5 to $10 million +/- Cdn$10 change in average log price equals +/-$10 to $20 million | |
Coastal log ($Cdn/cubic metre) | | | | | | | | | | | | | | |
(Vancouver Log Market, fiscal year) | | $ | 73 | | $ | 78 | | $ | 78 | | $ | 80 | | |
| | | | | | | | | | | | | | |
Fiscal Year Trade Assumptions | | | | | | | | | | | | | | |
Export tax rate (effective rate) | | | 11.3 | % | | 10.4 | % | | 6.3 | % | | 5.0 | % | |
Lumber shipments and consumption (billion board feet) | | | | | | | | | | | | | | +/- 1 cent change in exchange rate equals +/- $5 to $10 million on stumpage revenue +/- 10% change in Interior harvest volumes equals +/- $10 to $15 million +/- 10% change in Coastal harvest volumes equals +/- $3 to $6 million | |
U.S. lumber consumption | | | 33.1 | | | 34.1 | | | 34.1 | | | 34.9 | | |
BC surge trigger volumes | | | 7.0 | | | 7.2 | | | 7.2 | | | 7.4 | | |
BC lumber exports to US | | | 5.1 | | | 5.4 | | | 6.3 | | | 7.4 | | |
| | | | | | | | | | | | | | |
Crown harvest volumes (million cubic metres) | | | | | | | | | | | | | | |
Interior | | | 50.8 | | | 50.8 | | | 50.8 | | | 51.8 | | |
Coast | | | 14.2 | | | 14.2 | | | 14.2 | | | 14.2 | | |
Total | | | 65.0 | | | 65.0 | | | 65.0 | | | 66.0 | | |
BC Timber Sales (included in above) | | | 11.8 | | | 10.5 | | | 11.8 | | | 11.9 | | |
Components of revenue | | | | | | | | | | | | | | The above sensitivities relate to stumpage revenue only. Depending on market conditions, changes in stumpage revenues may be offset by changes in border tax revenues. | |
Tenures | | $ | 186 | | $ | 179 | | $ | 234 | | $ | 270 | | |
BC Timber Sales | | $ | 178 | | $ | 178 | | $ | 187 | | $ | 191 | | |
Federal border tax (SLA 2006) | | $ | 128 | | $ | 139 | | $ | 96 | | $ | 88 | | |
Logging tax | | $ | 15 | | $ | 15 | | $ | 20 | | $ | 20 | | |
Other CRF revenue | | $ | 16 | | $ | 15 | | $ | 15 | | $ | 15 | | |
Recoveries | | $ | 10 | | $ | 17 | | $ | 12 | | $ | 13 | | |
| | | | | | | | | | | | | | |
Other natural resources | | $ | 480 | | $ | 481 | | $ | 508 | | $ | 495 | | | |
Components of revenue | | | | | | | | | | | | | | | |
Water rental and licences* | | $ | 411 | | $ | 412 | | $ | 438 | | $ | 427 | | | |
Recoveries | | $ | 49 | | $ | 49 | | $ | 50 | | $ | 48 | | | |
Angling and hunting permits and licences | | $ | 13 | | $ | 13 | | $ | 13 | | $ | 13 | | | |
Recoveries | | $ | 7 | | $ | 7 | | $ | 7 | | $ | 7 | | | |
* BC Hydro rate increases are indexed to Consumer Price Index.
Other revenue | | $ | 9,053 | | $ | 9,089 | | $ | 9,479 | | $ | 9,472 | | | |
Components of revenue | | | | | | | | | | | | | | | |
Fees and licences | | | | | | | | | | | | | | | |
Consolidated Revenue Fund | | $ | 2,811 | | $ | 2,776 | | $ | 2,904 | | $ | 3,005 | | | |
Medical Services Plan premiums | | $ | 1,991 | | $ | 1,956 | | $ | 2,056 | | $ | 2,169 | | | |
Motor vehicle licences and permits | | $ | 485 | | $ | 487 | | $ | 492 | | $ | 498 | | | |
Other Consolidated revenue fund | | $ | 335 | | $ | 333 | | $ | 356 | | $ | 338 | | | |
Recoveries | | $ | 223 | | $ | 235 | | $ | 210 | | $ | 204 | | | |
MSP recoveries | | $ | 56 | | $ | 87 | | $ | 96 | | $ | 98 | | | |
Other recoveries | | $ | 167 | | $ | 148 | | $ | 114 | | $ | 106 | | | |
Crown corporations and agencies | | $ | 105 | | $ | 104 | | $ | 106 | | $ | 109 | | | |
Other service delivery agencies | | $ | 1,784 | | $ | 1,812 | | $ | 1,856 | | $ | 1,899 | | | |
Post-secondary education fees | | $ | 1,318 | | $ | 1,332 | | $ | 1,376 | | $ | 1,417 | | | |
Other health-care related fees | | $ | 318 | | $ | 326 | | $ | 326 | | $ | 328 | | | |
School Districts | | $ | 148 | | $ | 154 | | $ | 154 | | $ | 154 | | | |
Investment earnings | | | | | | | | | | | | | | | |
Consolidated Revenue Fund | | $ | 65 | | $ | 65 | | $ | 72 | | $ | 80 | | | |
Fiscal agency loans & sinking funds earnings | | $ | 854 | | $ | 838 | | $ | 862 | | $ | 952 | | | |
Crown corporations and agencies | | $ | 36 | | $ | 33 | | $ | 38 | | $ | 43 | | | |
Other service delivery agencies | | $ | 128 | | $ | 145 | | $ | 142 | | $ | 145 | | | |
Sales of goods and services | | $ | 889 | | $ | 926 | | $ | 946 | | $ | 960 | | | |
Miscellaneous | | | | | | | | | | | | | | | |
Consolidated Revenue Fund | | $ | 203 | | $ | 212 | | $ | 205 | | $ | 211 | | | |
Recoveries | | $ | 501 | | $ | 556 | | $ | 543 | | $ | 525 | | | |
Crown corporations and agencies | | $ | 371 | | $ | 362 | | $ | 62 | | $ | 41 | | | |
Other service delivery agencies | | $ | 1,083 | | $ | 1,025 | | $ | 1,058 | | $ | 1,067 | | | |
Asset Sales | | | | | | | | $ | 475 | | $ | 231 | | | |
First Quarterly Report 2012/13
50
Appendix
Table A1 Material Assumptions – Revenue (continued)
| | Budget | | Updated | | | | | | | |
Revenue Source and Assumptions | | 2012 | | Forecast | | Plan | | Plan | | | |
($ millions unless otherwise specified) | | 2012/13 | | 2013/14 | | 2014/15 | | 2012/13 Sensitivities | |
Health and social transfers | | $ | 5,682 | | $ | 5,617 | | $ | 5,938 | | $ | 5,952 | | | |
National Cash Transfers | | | | | | | | | | | |
Canada Health Transfer (CHT) | | $ | 28,569 | | $ | 28,569 | | $ | 30,283 | | $ | 32,100 | | | |
Wait Times Reduction Transfer (WTRT) | | $ | 250 | | $ | 250 | | $ | 250 | | — | | +/- 0.1% change in BC’s | |
Canada Social Transfer (CST) | | $ | 11,859 | | $ | 11,859 | | $ | 12,215 | | $ | 12,582 | | population share equals | |
BC share of national population (June 1) | | 13.28 | % | 13.22 | % | 13.24 | % | 13.26 | % | +/- $50 to $55 million | |
BC health and social transfers revenue | | | | | | | | | | | |
CHT | | $ | 4,051 | | $ | 4,002 | | $ | 4,266 | | $ | 4,267 | | | |
WTRT | | $ | 33 | | $ | 33 | | $ | 33 | | — | | | |
CST | | $ | 1,575 | | $ | 1,568 | | $ | 1,617 | | $ | 1,668 | | | |
Prior-year adjustments | | | | $ | -9 | | | | | | | |
Health deferral | | | | | | | | | | | |
Diagnostic and Medical Equipment | | $ | 16 | | $ | 16 | | $ | 15 | | $ | 10 | | | |
Medical Equipment Trust | | $ | 7 | | $ | 7 | | $ | 7 | | $ | 7 | | | |
Other federal contributions | | $ | 1,575 | | $ | 1,631 | | $ | 1,607 | | $ | 1,421 | | | |
Components of revenue | | | | | | | | | | | |
Other Consolidated Revenue Fund | | $ | 150 | | $ | 149 | | $ | 163 | | $ | 190 | | | |
Labour Market Development Agreement | | $ | 285 | | $ | 286 | | $ | 285 | | $ | 285 | | | |
Local Government Services and Transfers | | $ | 33 | | $ | 32 | | $ | 20 | | — | | | |
Canada-BC Co-operation on Immigration | | $ | 120 | | $ | 120 | | $ | 122 | | — | | | |
Labour Market Agreement | | $ | 66 | | $ | 105 | | $ | 99 | | $ | 66 | | | |
Other recoveries | | $ | 199 | | $ | 210 | | $ | 177 | | $ | 157 | | | |
Crown corporations and agencies | | $ | 213 | | $ | 211 | | $ | 220 | | $ | 196 | | | |
Other service delivery agencies | | $ | 509 | | $ | 518 | | $ | 521 | | $ | 527 | | | |
Service delivery agency direct revenue | | $ | 5,769 | | $ | 5,780 | | $ | 5,818 | | $ | 5,707 | | | |
School districts | | $ | 481 | | $ | 496 | | $ | 496 | | $ | 496 | | | |
Post-secondary institutions | | $ | 2,873 | | $ | 2,896 | | $ | 2,969 | | $ | 3,032 | | | |
Health authorities and hospital societies | | $ | 801 | | $ | 792 | | $ | 804 | | $ | 813 | | | |
BC Transportation Financing Authority | | $ | 465 | | $ | 471 | | $ | 636 | | $ | 497 | | | |
Other service delivery agencies | | $ | 1,149 | | $ | 1,125 | | $ | 913 | | $ | 869 | | | |
Commercial Crown corporation net income | | $ | 2,717 | | $ | 2,661 | | $ | 2,752 | | $ | 2,868 | | | |
BC Hydro | | $ | ��566 | | $ | 520 | | $ | 556 | | $ | 610 | | | |
reservoir water inflows | | 100 | % | 110 | % | 100 | % | 100 | % | +/-1% in hydro generation | |
| | | | | | | | | | = +/-$10 million | |
mean gas price | | 4.77 | | 2.72 | | 3.59 | | 3.95 | | +/-10% = -/+$5 million | |
(Sumas, $US/MMbtu – BC Hydro forecast based on NYMEX forward selling prices) | | | | |
electricity prices | | 36.67 | | 20.81 | | 29.56 | | 33.48 | | +/-$1/MWh in electricity trade | |
(Mid-C, $US/MWh) | | | | | | | | | | margins = +/-$35 million | |
allowed return on deemed equity | | 12.75 | % | 11.73 | % | 11.84 | % | 11.84 | % | +/-1% = +/-$44 to 49 million | |
ICBC | | $ | 146 | | $ | 160 | | $ | 230 | | $ | 229 | | | |
vehicle growth | | + 1.3 | % | + 1.4 | % | + 1.5 | % | + 1.9 | % | +/-1% = +/-$38 million | |
current claims cost percentage change | | + 1.4 | % | + 4.6 | % | + 0.5 | % | + 2.5 | % | +/-1% = -/+$30 million | |
investment return | | 3.4 | % | 3.5 | % | 3.6 | % | 3.7 | % | +/-1% return = +/-$115 million | |
loss ratio | | 86.4 | % | 86.6 | % | 85.8 | % | 85.9 | % | | |
First Quarterly Report 2012/13
51
Appendix
Table A2 Natural Gas Price Forecasts — 2012/13 to 2014/15
| | | | | | | | Adjusted to fiscal years and | |
| | | | | | | | $C/gigajoule at plant inlet | |
Private sector forecasts (calendar year) | | 2012 | | 2013 | | 2014 | | 2012/13 | | 2013/14 | | 2014/15 | |
GLJ Henry Hub US$/MMBtu (Jul 1,12) | | 2.79 | | 3.75 | | 4.25 | | 1.63 | | 2.16 | | 2.64 | |
Sproule Henry Hub US$/MMBtu (Jun 30, 12) | | 2.59 | | 3.44 | | 3.83 | | 1.34 | | 1.84 | | 2.42 | |
McDaniel Henry Hub US$/MMBtu (Jul 1,12) | | 3.43 | | 3.80 | | 4.35 | | 1.97 | | 2.22 | | 2.77 | |
AJM Henry Hub US$/Mcf (Jun 30,12) | | 2.57 | | 3.55 | | 4.15 | | 1.34 | | 1.87 | | 2.38 | |
GLJ Alberta AECO-C Spot CDN$/MMBtu (Jul 1,12) | | 2.47 | | 3.44 | | 3.90 | | 1.95 | | 2.63 | | 3.06 | |
Sproule Alberta AECO-C Spot CDN$/MMBtu (Jun 30, 12) | | 2.31 | | 3.13 | | 3.53 | | 1.64 | | 2.32 | | 2.90 | |
McDaniel AECO-C Spot C$/MMBtu (Jul 1,12) | | 3.13 | | 3.50 | | 4.00 | | 2.26 | | 2.69 | | 3.19 | |
AJM AECO-C Spot C$/Mcf (Jun 30, 12) | | 2.16 | | 3.25 | | 3.85 | | 1.56 | | 2.37 | | 2.87 | |
GLJ Sumas Spot US$/MMBtu (Jul 1,12) | | 2.65 | | 3.45 | | 3.95 | | 1.43 | | 1.92 | | 2.39 | |
Sproule Sumas Spot CDN$/MMBtu (Jun 30, 12) | | 2.67 | | 3.62 | | 4.02 | | 1.46 | | 2.06 | | 2.65 | |
GLJ BC Spot Plant Gate CDN$/MMBtu (Jul 1,12) | | 2.25 | | 3.07 | | 3.53 | | 1.56 | | 2.12 | | 2.56 | |
Sproule BC Plant Inlet CDN$/MMBtu (Jun 30, 12) | | 2.24 | | 3.07 | | 3.47 | | 1.40 | | 1.99 | | 2.58 | |
McDaniel BC Spot Plant Gate C$MMBtu (Jul 1,12) | | 2.25 | | 3.20 | | 3.70 | | 1.57 | | 2.26 | | 2.76 | |
AJM BC Spot Plant Gate C$/Mcf (Jun 30, 12) | | 2.35 | | 2.95 | | 3.55 | | 1.23 | | 1.94 | | 2.44 | |
GLJ Midwest Chicago US$/MMBtu (Jul 1,12) | | 2.92 | | 3.85 | | 4.35 | | 1.43 | | 1.89 | | 2.37 | |
Sproule Alliance Plant Gate CDN$/MMBtu (Jun 30, 12) | | 1.53 | | 2.49 | | 2.94 | | 1.12 | | 1.72 | | 2.35 | |
EIA Henry Hub US$/MMBtu (Jul 10, 12) | | 2.58 | | 3.22 | | n/a | | 1.11 | | n/a | | n/a | |
TD Economics Henry Hub FuturesUS$/MMBtu (Jul 9, 12) | | 2.59 | | 3.05 | | 3.50 | | 1.11 | | 1.75 | | 2.48 | |
Scotiabank Group Henry Hub US$/MMBtu (Jul 6,12) | | 2.75 | | 3.00 | | n/a | | 1.21 | | n/a | | n/a | |
BMO Alberta Empress US$/MMBtu (Jun 22, 12) | | 1.75 | | 2.85 | | n/a | | 0.70 | | n/a | | n/a | |
RBC Financial Henry Hub US$/Mcf (Jul 6, 12) | | 2.50 | | 3.75 | | n/a | | 0.82 | | n/a | | n/a | |
CIBC World Marktes Inc. Henry Hub US$/MMBtu (May 8, 12) | | 2.50 | | 3.75 | | n/a | | 0.88 | | n/a | | n/a | |
Fekete AECO-C Spot CDN$/MMBtu (Jun 29, 12) | | 2.27 | | 3.25 | | 4.00 | | 1.72 | | 2.52 | | 3.17 | |
NYMEX Forward Market converted to Plant Inlet CDN$/GJ (Jul 16, 12) | | | | | | | | 1.22 | | 1.45 | | 1.99 | |
Average all minus high/low | | | | | | | | 1.41 | | 2.12 | | 2.65 | |
Average one forecast per consultant minus high/low | | | | | | | | 1.21 | | 2.01 | | 2.56 | |
Natural gas royalty price forecast | | | | | | | | 1.41 | | 2.12 | | 2.65 | |
GLJ: Gilbert Laustsen Jung Petroleum Consultants Ltd
AJM: Ashton Jenkins Mann Petroleum Consultants
US EIA: US Energy Information Administration
McDaniel: McDaniel & Associates Consultants Ltd
AECO: Alberta Energy Company
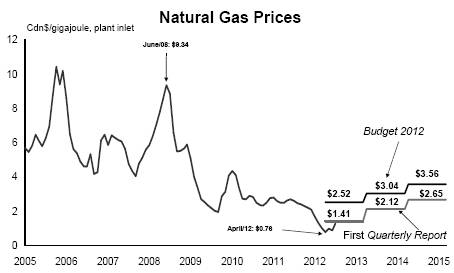
· High storage levels and lower North American demand have contributed to the reduction in the private sector natural gas price outlook.
First Quarterly Report 2012/13
52
Appendix
Table A3 Material Assumptions – Expense
| | | | Updated | | Updated | | Updated | | | |
Ministry Programs and Assumptions | | Budget | | Forecast | | Plan | | Plan | | | |
($ millions unless otherwise specified) | | 2012/13 | | 2013/14 | | 2014/15 | | Sensitivities 2012/13 | |
Advanced Education | | 1,972 | | 1,972 | | 1,952 | | 1,922 | | | |
Student spaces in public institutions (# FTEs) | | 201,307 | | 201,307 | | 201,467 | | 201,605 | | The number of student spaces may vary depending on the financial and other policies of post-secondary institutions. | |
| | | | | | | | | | |
| | | | | | | | | | |
Children and Family Development | | 1,333 | | 1,333 | | 1,333 | | 1,333 | | | |
Average children-in-care caseload (#) | | 8,070 | | 8,070 | | 7,905 | | 7,905 | | Caseload is expected to decline. The child population (age 0 to 18) is projected to start increasing in 2013, potentially decelerating the downward trend. A 1% increase in the cost per case or a 1% increase in the average caseload will affect expenditures by approximately $2.8 million. | |
Average annual residential cost per child in care ($) | | 35,200 | | 35,200 | | 35,900 | | 35,900 | | |
| | | | | | | | | | |
| | | | | | | | | | |
| | | | | | | | | | |
| | | | | | | | | | |
| | | | | | | | | | |
| | | | | | | | | | |
| | | | | | | | | | |
Education | | 5,315 | | 5,315 | | 5,321 | | 5,342 | | | |
Enrolment (# of FTEs) | | 556,660 | | 556,660 | | 557,004 | | 558,168 | | Enrolment figures are based on BC Stats enrolment trends, to which the Ministry has added forecasts for distributed learning, adult education, and summer learning. | |
School age (K–12) | | 530,220 | | 530,220 | | 530,564 | | 531,728 | | |
Distributed Learning (online) | | 12,329 | | 12,329 | | 12,329 | | 12,329 | | |
Summer | | 6,117 | | 6,117 | | 6,117 | | 6,117 | | |
Adults | | 7,994 | | 7,994 | | 7,994 | | 7,994 | | |
| | | | | | | | | | | |
Forests, Lands and Natural Resource Operations | | 602 | | 664 | | 555 | | 592 | | | |
BC Timber Sales | | 160 | | 160 | | 157 | | 164 | | Targets can be impacted by changes to actual inventory costs incurred. There is a lag of approximately 2 years between when inventory costs are incurred and when they are expensed. Volume harvested can also impact targets. For example, if volume harvested is less than projected in any year then capitalized expenses will also be reduced in that year. | |
| | | | | | | | | | |
| | | | | | | | | | |
| | | | | | | | | | |
| | | | | | | | | | |
| | | | | | | | | | |
| | | | | | | | | | |
| | | | | | | | | | |
| | | | | | | | | | |
| | | | | | | | | | |
| | | | | | | | | | |
Direct Fire Fighting | | 63 | | 125 | | 63 | | 63 | | Over the past several years, Direct fire fighting costs have ranged from a low of $19 million in 1997 to $382 million in 2009. | |
| | | | | | | | | | |
| | | | | | | | | | |
| | | | | | | | | | |
Health | | 16,180 | | 16,180 | | 16,785 | | 17,281 | | | |
Pharmacare | | 1,185 | | 1,144 | | 1,229 | | 1,266 | | A 1% change in utilization or drug prices affects costs by approximately $10 million. | |
|
Medical Services Plan (MSP) | | 3,895 | | 3,909 | | 4,027 | | 4,120 | | A 1% increase in volume of services provided by fee-for-service physicians affects costs by approximately $25 million. | |
| | | | | | | | | | |
| | | | | | | | | | |
Regional Services | | 10,859 | | 10,859 | | 11,287 | | 11,652 | | | |
Justice | | 1,110 | | 1,154 | | 1,123 | | 1,126 | | | |
New cases filed/processed (# for all courts) | | 295,000 | | 295,000 | | 295,000 | | 295,000 | | The number of criminal cases proceeded on by the provincial and federal Crown (including appeals to higher courts in BC), the number of civil and family litigation cases, the number of violation tickets disputed, and the number of municipal bylaw tickets disputed which would go to court for resolution. | |
| | | | | | | | | | |
| | | | | | | | | | |
| | | | | | | | | | |
| | | | | | | | | | |
| | | | | | | | | | |
| | | | | | | | | | |
| | | | | | | | | | |
| | | | | | | | | | |
| | | | | | | | | | |
| | | | | | | | | | | |
Crown Proceedings Act (CPA) | | 25 | | 25 | | 25 | | 25 | | The number and size of litigation brought against the province, as well as the effectiveness of mitigation strategies and legal defence. | |
| | | | | | | | | | |
| | | | | | | | | | |
| | | | | | | | | | |
| | | | | | | | | | |
Policing, Victim Services and Corrections | | 569 | | 569 | | 582 | | 586 | | The volume and severity of criminal activity, the number of inmate beds occupied and the number of offenders under community supervision. | |
| | | | | | | | | | |
| | | | | | | | | | |
| | | | | | | | | | |
| | | | | | | | | | |
Emergency Program Act (EPA) | | 15 | | 59 | | 15 | | 15 | | The number and severity of natural disasters. | |
First Quarterly Report 2012/13
53
Appendix
Table A3 Material Assumptions – Expense (continued)
| | | | Updated | | Updated | | Updated | | | |
Ministry Programs and Assumptions | | Budget | | Forecast | | Plan | | Plan | | | |
($ millions unless otherwise specified) | | 2012/13 | | 2013/14 | | 2014/15 | | Sensitivities 2012/13 | |
Social Development | | 2,457 | | 2,457 | | 2,498 | | 2,505 | | | |
Temporary Assistance annual average caseload (#) | | 55,000 | | 55,000 | | 54,500 | | 54,000 | | The expected to work caseload is sensitive to fluctuations in economic and employment trends in the service sector. A 1% change in the Temporary Assistance annual average caseload or average cost per case will affect expenditures by approximately $4.5 million annually. | |
| | | | | | | | | | |
| | | | | | | | | | |
| | | | | | | | | | |
| | | | | | | | | | |
| | | | | | | | | | |
| | | | | | | | | | |
| | | | | | | | | | |
| | | | | | | | | | |
Disability Assistance annual average caseload (#) | | 83,000 | | 83,000 | | 86,300 | | 86,300 | | The caseload for persons with disabilities is sensitive to the aging of the population and longer life expectancy for individuals with disabilities and significant health issues. A 1% change in the Disability Assistance annual average caseload or average cost per case will affect expenditures by approximately $7.5 million annually. | |
| | | | | | | | | | |
| | | | | | | | | | |
| | | | | | | | | | |
| | | | | | | | | | |
| | | | | | | | | | |
| | | | | | | | | | |
| | | | | | | | | | |
| | | | | | | | | | |
| | | | | | | | | | |
| | | | | | | | | | |
Total annual average caseload (#) | | 138,000 | | 138,000 | | 140,800 | | 140,300 | | The average cost per case is sensitive to the composition of the caseload, and reported income. | |
| | | | | | | | | | |
| | | | | | | | | | |
Adult Community Living: | | | | | | | | | | | |
Residential Services: | | | | | | | | | | | |
Average caseload (#) | | 5,536 | | 5,536 | | 5,808 | | 6,077 | | The adult community living caseload is sensitive to the pressures of an aging population. A 1% increase in the adult caseload will increase expenditures by approximately $2.4 million. | |
Average cost per client ($) | | 74,800 | | 74,800 | | 72,650 | | 70,450 | | |
Day Programs: | | | | | | | | | | |
Average caseload (#) | | 14,570 | | 14,570 | | 15,286 | | 15,992 | | |
Average cost per client ($) | | 18,150 | | 18,150 | | 17,150 | | 16,650 | | |
Personal Supports Initiative | | | | | | | | | | |
Average caseload (#) | | 419 | | 419 | | 609 | | 805 | | | |
Average cost per client ($) | | 23,700 | | 23,700 | | 16,300 | | 12,350 | | | |
Tax Transfers | | 1,091 | | 1,057 | | 748 | | 764 | | | |
Personal Income | | 632.3 | | 632.3 | | 331.1 | | 331.6 | | | |
| | | | | | | | | | These tax transfers are now expensed as required under generally accepted accounting principles. Previously for the family bonus was split 50/50 between expense program and as reduction to revenue while all other refundable credits were recorded as reduction to revenue. | |
Family Bonus Program | | 4.5 | | 4.5 | | 2.6 | | 2.6 | | |
Low Income Climate Action | | 190.0 | | 190.0 | | 190.0 | | 190.0 | | |
Sales Tax / BC HST | | 328.3 | | 328.3 | | 53.0 | | 53.0 | | |
Small Business Venture Capital | | 28.0 | | 28.0 | | 28.0 | | 28.0 | | |
Other Personal income | | 81.5 | | 81.5 | | 57.5 | | 58.0 | | |
Corporate Income | | 459.2 | | 424.8 | | 417.1 | | 432.6 | | |
Film and Television | | 70.0 | | 65.0 | | 60.0 | | 60.0 | | |
Production Services | | 217.4 | | 201.5 | | 194.3 | | 204.3 | | |
Scientific Research & Experimental Development | | 79.2 | | 72.3 | | 83.8 | | 89.3 | | | |
Interactive Digital Media | | 37.9 | | 35.0 | | 35.0 | | 35.0 | | | |
Other Corporate income | | 54.7 | | 51.0 | | 44.0 | | 44.0 | | | |
Management of Public Funds and Debt | | 1,287 | | 1,218 | | 1,288 | | 1,345 | | | |
Interest rates for new provincial borrowing: | | | | | | | | | | Full year impact on MoPD on interest costs of a 1% change in interest rates equals $55.6 million; $100 million increase in debt level equals $1.8 million. | |
Short-term | | 1.11 | % | 1.05 | % | 1.58 | % | 2.23 | % | |
Long-term | | 3.47 | % | 2.86 | % | 3.59 | % | 4.36 | % | |
CDN/US exchange rate (cents) | | 102.7 | | 101.6 | | 99.7 | | 99.7 | | |
Service delivery agency net spending | | 5,482 | | 5,516 | | 5,874 | | 6,132 | | |
School districts | | 204 | | 228 | | 217 | | 273 | | | |
Post-secondary institutions | | 2,834 | | 2,855 | | 2,986 | | 3,023 | | | |
Health authorities and hospital societies | | 646 | | 705 | | 753 | | 782 | | | |
BC Transportation Financing Authority | | 946 | | 898 | | 998 | | 1,090 | | | |
Other service delivery agencies | | 852 | | 830 | | 920 | | 964 | | | |
First Quarterly Report 2012/13
54
Appendix
Table A4 Operating Statement – 2005/06 to 2014/15
| | | | | | | | | | | | | | | | Updated | | Updated | | Updated | | Average | |
| | Actual | | Actual | | Actual | | Actual | | Actual | | Actual | | Actual | | Forecast | | Plan | | Plan | | annual | |
($ millions) | | 2005/06 | | 2006/07 | | 2007/08 | | 2008/09 | | 2009/10 | | 2010/11 | | 2011/12 | | 2012/13 | | 2013/14 | | 2014/15 | | change | |
| | | | | | | | | | | | | | | | | | | | | | (per cent) | |
Revenue | | 36,229 | | 38,778 | | 40,122 | | 38,817 | | 38,073 | | 40,776 | | 41,967 | | 42,724 | | 44,057 | | 45,016 | | 2.4 | |
Expense | | (32,556 | ) | (34,541 | ) | (36,937 | ) | (38,752 | ) | (39,900 | ) | (41,025 | ) | (42,208 | ) | (43,956 | ) | (44,216 | ) | (44,964 | ) | 3.7 | |
Manage natural gas royalty impacts | | — | | — | | — | | — | | — | | — | | — | | 241 | | 389 | | 483 | | | |
Surplus (deficit) before unusual items | | 3,673 | | 4,237 | | 3,185 | | 65 | | (1,827 | ) | (249 | ) | (241 | ) | (991 | ) | 230 | | 535 | | | |
Forecast allowance | | — | | — | | — | | — | | — | | — | | — | | (150 | ) | (200 | ) | (300 | ) | | |
Negotiating Framework incentive payments | | (710 | ) | (264 | ) | (4 | ) | (2 | ) | — | | — | | — | | — | | — | | — | | | |
Climate Action Dividend | | — | | — | | (440 | ) | 20 | | — | | — | | — | | — | | — | | — | | | |
Liability for HST transition funding repayment | | — | | — | | — | | — | | — | | — | | (1,599 | ) | — | | — | | — | | | |
Surplus (deficit) | | 2,963 | | 3,973 | | 2,741 | | 83 | | (1,827 | ) | (249 | ) | (1,840 | ) | (1,141 | ) | 30 | | 235 | | | |
| | | | | | | | | | | | | | | | | | | | | | | |
Per cent of GDP: (1) | | | | | | | | | | | | | | | | | | | | | | | |
Surplus (deficit) | | 1.7 | | 2.2 | | 1.4 | | 0.0 | | -1.0 | | -0.1 | | -0.9 | | -0.5 | | 0.0 | | 0.1 | | | |
Per cent of revenue: | | | | | | | | | | | | | | | | | | | | | | | |
Surplus (deficit) | | 8.2 | | 10.2 | | 6.8 | | 0.2 | | -4.8 | | -0.6 | | -4.4 | | -2.7 | | 0.1 | | 0.5 | | | |
Per capita: (2) | | | | | | | | | | | | | | | | | | | | | | | |
Surplus (deficit) | | 706 | | 936 | | 636 | | 19 | | (410 | ) | (55 | ) | (402 | ) | (248 | ) | 6 | | 50 | | | |
(1) Surplus (deficit) as a per cent of GDP is calculated using GDP for the calendar year ending in the fiscal year (e.g. 2012/13 amounts divided by GDP for the 2012 calendar year).
(2) Per capita revenue and expense is calculated using July 1 population (e.g. 2012/13 amounts divided by population on July 1, 2012).
First Quarterly Report 2012/13
55
Appendix
Table A5 Revenue by Source — 2005/06 to 2014/15
| | | | | | | | | | | | | | | | Updated | | Updated | | Updated | | Average | |
| | Actual | | Actual | | Actual | | Actual | | Actual | | Actual | | Actual | | Forecast | | Plan | | Plan | | annual | |
($ millions) | | 2005/06 | | 2006/07 | | 2007/08 | | 2008/09 | | 2009/10 | | 2010/11 | | 2011/12 | | 2012/13 | | 2013/14 | | 2014/15 | | change | |
| | | | | | | | | | | | | | | | | | | | | | (per cent) | |
Taxation revenue: | | | | | | | | | | | | | | | | | | | | | | | |
Personal income | | 5,960 | | 7,020 | | 7,074 | | 6,309 | | 5,769 | | 5,810 | | 6,427 | | 6,614 | | 7,112 | | 7,496 | | 2.6 | |
Corporate income | | 1,587 | | 1,732 | | 2,477 | | 2,294 | | 1,625 | | 2,004 | | 2,022 | | 2,286 | | 2,039 | | 2,223 | | 3.8 | |
Sales | | 4,507 | | 4,886 | | 5,248 | | 5,137 | | 4,945 | | 5,614 | | 5,929 | | 6,104 | | 5,984 | | 6,178 | | n/a | |
Fuel | | 911 | | 901 | | 935 | | 891 | | 884 | | 940 | | 928 | | 932 | | 943 | | 953 | | 0.5 | |
Carbon | | — | | — | | — | | 306 | | 541 | | 741 | | 959 | | 1,180 | | 1,247 | | 1,266 | | n/a | |
Tobacco | | 702 | | 727 | | 693 | | 709 | | 683 | | 735 | | 637 | | 642 | | 717 | | 717 | | 0.2 | |
Property | | 1,719 | | 1,734 | | 1,797 | | 1,850 | | 1,887 | | 1,920 | | 1,913 | | 1,998 | | 2,082 | | 2,167 | | 2.6 | |
Property transfer | | 843 | | 914 | | 1,068 | | 715 | | 887 | | 855 | | 944 | | 893 | | 880 | | 930 | | 1.1 | |
Corporation capital | | 162 | | 91 | | 117 | | 108 | | 95 | | (3 | ) | (5 | ) | — | | — | | — | | n/a | |
Insurance premium | | 330 | | 353 | | 373 | | 389 | | 389 | | 399 | | 411 | | 424 | | 430 | | 435 | | 3.1 | |
| | 16,721 | | 18,358 | | 19,782 | | 18,708 | | 17,705 | | 19,015 | | 20,165 | | 21,073 | | 21,434 | | 22,365 | | 3.3 | |
Natural resource revenue: | | | | | | | | | | | | | | | | | | | | | | | |
Natural gas royalties | | 1,921 | | 1,207 | | 1,132 | | 1,314 | | 406 | | 312 | | 339 | | 157 | | 263 | | 363 | | -16.9 | |
Crown land tenures | | 386 | | 441 | | 569 | | 814 | | 867 | | 923 | | 928 | | 865 | | 841 | | 789 | | 8.3 | |
Columbia River Treaty | | 319 | | 223 | | 246 | | 231 | | 168 | | 136 | | 110 | | 92 | | 130 | | 145 | | -8.4 | |
Other energy and minerals | | 392 | | 456 | | 367 | | 479 | | 421 | | 514 | | 529 | | 515 | | 541 | | 549 | | 3.8 | |
Forests | | 1,214 | | 1,276 | | 1,087 | | 557 | | 387 | | 436 | | 482 | | 543 | | 564 | | 597 | | -7.6 | |
Other resources | | 317 | | 342 | | 341 | | 413 | | 398 | | 407 | | 424 | | 481 | | 508 | | 495 | | 5.1 | |
| | 4,549 | | 3,945 | | 3,742 | | 3,808 | | 2,647 | | 2,728 | | 2,812 | | 2,653 | | 2,847 | | 2,938 | | -4.7 | |
Other revenue: | | | | | | | | | | | | | | | | | | | | | | | |
Medical Services Plan premiums | | 1,482 | | 1,524 | | 1,557 | | 1,595 | | 1,666 | | 1,787 | | 1,919 | | 2,043 | | 2,152 | | 2,267 | | 4.8 | |
Post-secondary education fees | | 892 | | 928 | | 979 | | 1,039 | | 1,126 | | 1,237 | | 1,294 | | 1,332 | | 1,376 | | 1,417 | | 5.3 | |
Other health-care related fees | | 225 | | 237 | | 248 | | 257 | | 267 | | 308 | | 324 | | 326 | | 326 | | 328 | | 4.3 | |
Motor vehicle licences and permits | | 405 | | 427 | | 445 | | 450 | | 450 | | 468 | | 482 | | 487 | | 492 | | 498 | | 2.3 | |
Other fees and licences | | 682 | | 692 | | 751 | | 670 | | 615 | | 636 | | 709 | | 739 | | 730 | | 707 | | 0.4 | |
Investment earnings | | 954 | | 1,040 | | 1,153 | | 821 | | 954 | | 867 | | 1,042 | | 1,081 | | 1,114 | | 1,220 | | 2.8 | |
Sales of goods and services | | 719 | | 678 | | 637 | | 694 | | 728 | | 759 | | 930 | | 926 | | 946 | | 960 | | 3.3 | |
Miscellaneous | | 1,552 | | 1,874 | | 1,920 | | 1,927 | | 1,983 | | 2,047 | | 1,903 | | 2,155 | | 1,868 | | 1,844 | | 1.9 | |
Release of surplus assets | | — | | — | | — | | — | | — | | — | | — | | — | | 475 | | 231 | | n/a | |
| | 6,911 | | 7,400 | | 7,690 | | 7,453 | | 7,789 | | 8,109 | | 8,603 | | 9,089 | | 9,479 | | 9,472 | | 3.6 | |
Contributions from the federal government: | | | | | | | | | | | | | | | | | | | | | | | |
Health and social transfers | | 4,220 | | 4,473 | | 4,614 | | 4,743 | | 4,883 | | 5,176 | | 5,384 | | 5,617 | | 5,938 | | 5,952 | | 3.9 | |
Harmonized sales tax transition payments | | — | | — | | — | | — | | 250 | | 769 | | 580 | | — | | — | | — | | n/a | |
Equalization | | 590 | | 459 | | — | | — | | — | | — | | — | | | | | | | | n/a | |
Other cost shared agreements | | 1,015 | | 1,455 | | 1,318 | | 1,242 | | 1,784 | | 2,052 | | 1,743 | | 1,631 | | 1,607 | | 1,421 | | 3.8 | |
| | 5,825 | | 6,387 | | 5,932 | | 5,985 | | 6,917 | | 7,997 | | 7,707 | | 7,248 | | 7,545 | | 7,373 | | 2.7 | |
Commercial Crown corporation net income: | | | | | | | | | | | | | | | | | | | | | | | |
BC Hydro | | 266 | | 407 | | 369 | | 365 | | 447 | | 591 | | 558 | | 520 | | 556 | | 610 | | 9.7 | |
Liquor Distribution Branch | | 800 | | 840 | | 857 | | 891 | | 877 | | 890 | | 909 | | 906 | | 844 | | 851 | | 0.7 | |
BC Lotteries (net of payments to federal gov’t) | | 914 | | 1,011 | | 1,080 | | 1,082 | | 1,070 | | 1,096 | | 1,099 | | 1,115 | | 1,190 | | 1,200 | | 3.1 | |
ICBC | | 191 | | 381 | | 633 | | 512 | | 601 | | 326 | | 102 | | 160 | | 230 | | 229 | | 2.0 | |
BC Railway Company | | 33 | | 30 | | 13 | | 36 | | 2 | | 14 | | 14 | | 14 | | 19 | | 15 | | -8.4 | |
Transportation Invest. Corp. (Port Mann) | | — | | — | | — | | (47 | ) | (4 | ) | (7 | ) | (17 | ) | (72 | ) | (105 | ) | (56 | ) | n/a | |
Other | | 19 | | 19 | | 24 | | 24 | | 22 | | 17 | | 15 | | 18 | | 18 | | 19 | | 0.0 | |
| | 2,223 | | 2,688 | | 2,976 | | 2,863 | | 3,015 | | 2,927 | | 2,680 | | 2,661 | | 2,752 | | 2,868 | | 2.9 | |
Total revenue | | 36,229 | | 38,778 | | 40,122 | | 38,817 | | 38,073 | | 40,776 | | 41,967 | | 42,724 | | 44,057 | | 45,016 | | 2.4 | |
First Quarterly Report 2012/13
56
Appendix
Table A6 Revenue by Source Supplementary Information — 2005/06 to 2014/15
| | | | | | | | | | | | | | | | Updated | | Updated | | Updated | | Average | |
| | Actual | | Actual | | Actual | | Actual | | Actual | | Actual | | Actual | | Forecast | | Plan | | Plan | | annual | |
($ millions) | | 2005/06 | | 2006/07 | | 2007/08 | | 2008/09 | | 2009/10 | | 2010/11 | | 2011/12 | | 2012/13 | | 2013/14 | | 2014/15 | | change | |
| | | | | | | | | | | | | | | | | | | | | | (per cent) | |
Per cent of nominal GDP: (1) | | | | | | | | | | | | | | | | | | | | | | | |
Taxation | | 9.9 | | 10.1 | | 10.3 | | 9.4 | | 9.2 | | 9.4 | | 9.4 | | 9.5 | | 9.3 | | 9.3 | | -0.6 | |
Natural resources | | 2.7 | | 2.2 | | 1.9 | | 1.9 | | 1.4 | | 1.3 | | 1.3 | | 1.2 | | 1.2 | | 1.2 | | -8.3 | |
Other | | 4.1 | | 4.1 | | 4.0 | | 3.7 | | 4.1 | | 4.0 | | 4.0 | | 4.1 | | 4.1 | | 4.0 | | -0.3 | |
Contributions from the federal government | | 3.4 | | 3.5 | | 3.1 | | 3.0 | | 3.6 | | 3.9 | | 3.6 | | 3.3 | | 3.3 | | 3.1 | | -1.2 | |
Commercial Crown corporation net income | | 1.3 | | 1.5 | | 1.5 | | 1.4 | | 1.6 | | 1.4 | | 1.3 | | 1.2 | | 1.2 | | 1.2 | | -1.0 | |
Total revenue | | 21.4 | | 21.3 | | 20.9 | | 19.5 | | 19.8 | | 20.1 | | 19.6 | | 19.2 | | 19.1 | | 18.8 | | -1.4 | |
Growth rates: | | | | | | | | | | | | | | | | | | | | | | | |
Taxation | | 12.1 | | 9.8 | | 7.8 | | -5.4 | | -5.4 | | 7.4 | | 6.0 | | 4.5 | | 1.7 | | 4.3 | | n/a | |
Natural resources | | 14.9 | | -13.3 | | -5.1 | | 1.8 | | -30.5 | | 3.1 | | 3.1 | | -5.7 | | 7.3 | | 3.2 | | n/a | |
Other | | 3.5 | | 7.1 | | 3.9 | | -3.1 | | 4.5 | | 4.1 | | 6.1 | | 5.6 | | 4.3 | | -0.1 | | n/a | |
Contributions from the federal government | | 11.5 | | 9.6 | | -7.1 | | 0.9 | | 15.6 | | 15.6 | | -3.6 | | -6.0 | | 4.1 | | -2.3 | | n/a | |
Commercial Crown corporation net income | | -13.3 | | 20.9 | | 10.7 | | -3.8 | | 5.3 | | -2.9 | | -8.4 | | -0.7 | | 3.4 | | 4.2 | | n/a | |
Total revenue | | 8.7 | | 7.0 | | 3.5 | | -3.3 | | -1.9 | | 7.1 | | 2.9 | | 1.8 | | 3.1 | | 2.2 | | n/a | |
Per capita: (2) | | | | | | | | | | | | | | | | | | | | | | | |
Taxation | | 3,984 | | 4,326 | | 4,590 | | 4,267 | | 3,970 | | 4,198 | | 4,409 | | 4,575 | | 4,599 | | 4,741 | | 2.0 | |
Natural resources | | 1,084 | | 930 | | 868 | | 869 | | 594 | | 602 | | 615 | | 576 | | 611 | | 623 | | -6.0 | |
Other | | 1,647 | | 1,744 | | 1,784 | | 1,700 | | 1,746 | | 1,790 | | 1,881 | | 1,973 | | 2,034 | | 2,008 | | 2.2 | |
Contributions from the federal government | | 1,388 | | 1,505 | | 1,376 | | 1,365 | | 1,551 | | 1,765 | | 1,685 | | 1,574 | | 1,619 | | 1,563 | | 1.3 | |
Commercial Crown corporation net income | | 530 | | 633 | | 691 | | 653 | | 676 | | 646 | | 586 | | 578 | | 590 | | 608 | | 1.5 | |
Total revenue | | 8,633 | | 9,138 | | 9,310 | | 8,854 | | 8,537 | | 9,002 | | 9,176 | | 9,276 | | 9,453 | | 9,542 | | 1.1 | |
Real Per Capita Revenue (2014 $) (3) | | 9,973 | | 720 | | 771 | | 714 | | 739 | | 697 | | 618 | | 9,597 | | 9,633 | | 9,542 | | -0.5 | |
Growth rate (per cent) | | 5.5 | | -92.8 | | 7.1 | | -7.4 | | 3.5 | | -5.7 | | -11.4 | | 1453.6 | | 0.4 | | -0.9 | | 135.2 | |
(1) Revenue as a per cent of GDP is calculated using nominal GDP for the calendar year ending in the fiscal year (e.g. 2012/13 revenue divided by nominal GDP for the 2012 calendar year). Totals may not add due to rounding.
(2) Per capita revenue is calculated using July 1 population (e.g. 2012/13 revenue divided by population on July 1, 2012). Totals may not add due to rounding.
(3) Revenue is converted to real (inflation-adjusted) terms using the consumer price index (CPI) for the corresponding calendar year (e.g. 2012 CPI for 2012/13 revenue).
First Quarterly Report 2012/13
57
Appendix
Table A7 Expense by Function — 2005/06 to 2014/15
| | | | | | | | | | | | | | | | Updated | | Updated | | Updated | | Average | |
| | Actual | | Actual | | Actual | | Actual | | Actual | | Actual | | Actual | | Forecast | | Plan | | Plan | | annual | |
($ millions) | | 2005/06 | | 2006/07 | | 2007/08 | | 2008/09 | | 2009/10 | | 2010/11 | | 2011/12 | | 2012/13 | | 2013/14 | | 2014/15 | | change | |
| | | | | | | | | | | | | | | | | | | | | | (per cent) | |
Function: | | | | | | | | | | | | | | | | | | | | | | | |
Health: | | | | | | | | | | | | | | | | | | | | | | | |
Medical Services Plan | | 2,696 | | 2,964 | | 3,263 | | 3,391 | | 3,504 | | 3,763 | | 4,004 | | 4,190 | | 4,326 | | 4,428 | | 5.7 | |
Pharmacare | | 868 | | 914 | | 955 | | 1,010 | | 1,053 | | 1,129 | | 1,147 | | 1,190 | | 1,275 | | 1,312 | | 4.7 | |
Regional services | | 8,346 | | 8,751 | | 9,321 | | 10,030 | | 10,273 | | 10,597 | | 11,255 | | 11,819 | | 12,259 | | 12,613 | | 4.7 | |
Other healthcare expenses | | 469 | | 565 | | 667 | | 601 | | 597 | | 625 | | 642 | | 800 | | 774 | | 774 | | 5.7 | |
| | 12,379 | | 13,194 | | 14,206 | | 15,032 | | 15,427 | | 16,114 | | 17,048 | | 17,999 | | 18,634 | | 19,127 | | 5.0 | |
Education: | | | | | | | | | | | | | | | | | | | | | | | |
Elementary and secondary | | 4,829 | | 5,272 | | 5,521 | | 5,740 | | 5,778 | | 5,802 | | 5,885 | | 5,982 | | 6,011 | | 6,052 | | 2.5 | |
Post-secondary | | 3,914 | | 4,072 | | 4,314 | | 4,554 | | 4,740 | | 4,865 | | 4,917 | | 5,245 | | 5,281 | | 5,269 | | 3.4 | |
Other education expenses | | 171 | | 147 | | 152 | | 158 | | 528 | | 504 | | 436 | | 587 | | 587 | | 466 | | 11.8 | |
| | 8,914 | | 9,491 | | 9,987 | | 10,452 | | 11,046 | | 11,171 | | 11,238 | | 11,814 | | 11,879 | | 11,787 | | 3.2 | |
Social services: | | | | | | | | | | | | | | | | | | | | | | | |
Social assistance | | 1,089 | | 1,231 | | 1,255 | | 1,339 | | 1,454 | | 1,506 | | 1,550 | | 1,544 | | 1,577 | | 1,574 | | 4.2 | |
Child welfare | | 832 | | 964 | | 925 | | 1,073 | | 1,077 | | 1,118 | | 1,112 | | 1,064 | | 1,059 | | 1,058 | | 2.7 | |
Low income tax credit transfers | | 134 | | 101 | | 85 | | 188 | | 216 | | 408 | | 509 | | 523 | | 246 | | 245 | | 6.9 | |
Community living and other services | | 682 | | 586 | | 756 | | 723 | | 729 | | 754 | | 769 | | 804 | | 804 | | 814 | | 2.0 | |
| | 2,737 | | 2,882 | | 3,021 | | 3,323 | | 3,476 | | 3,786 | | 3,940 | | 3,935 | | 3,686 | | 3,691 | | 3.4 | |
Protection of persons and property | | 1,245 | | 1,184 | | 1,429 | | 1,429 | | 1,380 | | 1,448 | | 1,512 | | 1,430 | | 1,393 | | 1,400 | | 1.3 | |
Transportation | | 1,197 | | 1,251 | | 1,378 | | 1,401 | | 1,453 | | 1,580 | | 1,544 | | 1,655 | | 1,719 | | 1,782 | | 4.5 | |
Natural resources & economic development | | 1,652 | | 1,783 | | 2,072 | | 1,878 | | 2,162 | | 2,315 | | 1,881 | | 1,808 | | 1,630 | | 1,681 | | 0.2 | |
Other | | 1,082 | | 1,235 | | 1,389 | | 1,652 | | 1,385 | | 1,211 | | 1,394 | | 1,344 | | 1,191 | | 1,197 | | 1.1 | |
Contingencies | | — | | — | | — | | — | | — | | — | | 22 | | 300 | | 250 | | 250 | | n/a | |
General government | | 1,152 | | 1,251 | | 1,218 | | 1,427 | | 1,374 | | 1,148 | | 1,246 | | 1,249 | | 1,285 | | 1,288 | | 1.2 | |
Debt servicing | | 2,198 | | 2,270 | | 2,237 | | 2,158 | | 2,197 | | 2,252 | | 2,383 | | 2,422 | | 2,549 | | 2,761 | | 2.6 | |
Operating expense | | 32,556 | | 34,541 | | 36,937 | | 38,752 | | 39,900 | | 41,025 | | 42,208 | | 43,956 | | 44,216 | | 44,964 | | 3.7 | |
Unusual items: | | | | | | | | | | | | | | | | | | | | | | | |
Negotiating Framework incentive payments | | 710 | | 264 | | 4 | | 2 | | — | | — | | — | | — | | — | | — | | | |
Climate Action Dividend | | — | | — | | 440 | | (20 | ) | — | | — | | — | | — | | — | | — | | | |
HST transition funding repayment | | — | | — | | — | | — | | — | | — | | 1,599 | | — | | — | | — | | | |
Total expense | | 33,266 | | 34,805 | | 37,381 | | 38,734 | | 39,900 | | 41,025 | | 43,807 | | 43,956 | | 44,216 | | 44,964 | | | |
Per cent of operating expense: | | | | | | | | | | | | | | | | | | | | | | | |
Health | | 38.0 | | 38.2 | | 38.5 | | 38.8 | | 38.7 | | 39.3 | | 40.4 | | 40.9 | | 42.1 | | 42.5 | | 1.3 | |
Education | | 27.4 | | 27.5 | | 27.0 | | 27.0 | | 27.7 | | 27.2 | | 26.6 | | 26.9 | | 26.9 | | 26.2 | | -0.5 | |
Social services and housing | | 8.4 | | 8.3 | | 8.2 | | 8.6 | | 8.7 | | 9.2 | | 9.3 | | 9.0 | | 8.3 | | 8.2 | | -0.3 | |
Protection of persons and property | | 3.8 | | 3.4 | | 3.9 | | 3.7 | | 3.5 | | 3.5 | | 3.6 | | 3.3 | | 3.2 | | 3.1 | | -2.3 | |
Transportation | | 3.7 | | 3.6 | | 3.7 | | 3.6 | | 3.6 | | 3.9 | | 3.7 | | 3.8 | | 3.9 | | 4.0 | | 0.8 | |
Natural resources & economic development | | 5.1 | | 5.2 | | 5.6 | | 4.8 | | 5.4 | | 5.6 | | 4.5 | | 4.1 | | 3.7 | | 3.7 | | -3.3 | |
Other | | 3.3 | | 3.6 | | 3.8 | | 4.3 | | 3.5 | | 3.0 | | 3.3 | | 3.1 | | 2.7 | | 2.7 | | -2.4 | |
Contingencies | | — | | — | | — | | — | | — | | — | | 0.1 | | 0.7 | | 0.6 | | 0.6 | | n/a | |
General government | | 3.5 | | 3.6 | | 3.3 | | 3.7 | | 3.4 | | 2.8 | | 3.0 | | 2.8 | | 2.9 | | 2.9 | | -2.3 | |
Debt servicing | | 6.8 | | 6.6 | | 6.1 | | 5.6 | | 5.5 | | 5.5 | | 5.6 | | 5.5 | | 5.8 | | 6.1 | | -1.0 | |
| | 100.0 | | 100.0 | | 100.0 | | 100.0 | | 100.0 | | 100.0 | | 100.0 | | 100.0 | | 100.0 | | 100.0 | | | |
First Quarterly Report 2012/13
58
Appendix
Table A8 Expense by Function Supplementary Information — 2005/06 to 2014/15
| | | | | | | | | | | | | | | | Updated | | Updated | | Updated | | Average | |
| | Actual | | Actual | | Actual | | Actual | | Actual | | Actual | | Actual | | Forecast | | Plan | | Plan | | annual | |
($ millions) | | 2005/06 | | 2006/07 | | 2007/08 | | 2008/09 | | 2009/10 | | 2010/11 | | 2011/12 | | 2012/13 | | 2013/14 | | 2014/15 | | change | |
| | | | | | | | | | | | | | | | | | | | | | (per cent) | |
Per cent of nominal GDP: (1) | | | | | | | | | | | | | | | | | | | | | | | |
Health | | 7.3 | | 7.2 | | 7.4 | | 7.5 | | 8.0 | | 7.9 | | 8.0 | | 8.1 | | 8.1 | | 8.0 | | 1.0 | |
Education | | 5.3 | | 5.2 | | 5.2 | | 5.2 | | 5.8 | | 5.5 | | 5.3 | | 5.3 | | 5.2 | | 4.9 | | -0.7 | |
Social services | | 1.6 | | 1.6 | | 1.6 | | 1.7 | | 1.8 | | 1.9 | | 1.8 | | 1.8 | | 1.6 | | 1.5 | | -0.5 | |
Protection of persons and property | | 0.7 | | 0.7 | | 0.7 | | 0.7 | | 0.7 | | 0.7 | | 0.7 | | 0.6 | | 0.6 | | 0.6 | | -2.5 | |
Transportation | | 0.7 | | 0.7 | | 0.7 | | 0.7 | | 0.8 | | 0.8 | | 0.7 | | 0.7 | | 0.7 | | 0.7 | | 0.6 | |
Natural resources & economic development | | 1.0 | | 1.0 | | 1.1 | | 0.9 | | 1.1 | | 1.1 | | 0.9 | | 0.8 | | 0.7 | | 0.7 | | -3.6 | |
Other | | 0.6 | | 0.7 | | 0.7 | | 0.8 | | 0.7 | | 0.6 | | 0.7 | | 0.6 | | 0.5 | | 0.5 | | -2.7 | |
Contingencies | | — | | — | | — | | — | | — | | — | | 0.0 | | 0.1 | | 0.1 | | 0.1 | | n/a | |
General government | | 0.7 | | 0.7 | | 0.6 | | 0.7 | | 0.7 | | 0.6 | | 0.6 | | 0.6 | | 0.6 | | 0.5 | | -2.6 | |
Debt servicing | | 1.3 | | 1.2 | | 1.2 | | 1.1 | | 1.1 | | 1.1 | | 1.1 | | 1.1 | | 1.1 | | 1.2 | | -1.3 | |
Operating expense | | 19.2 | | 19.0 | | 19.2 | | 19.4 | | 20.8 | | 20.2 | | 19.7 | | 19.8 | | 19.2 | | 18.8 | | -0.3 | |
Growth rates: | | | | | | | | | | | | | | | | | | | | | | | |
Health | | 7.8 | | 6.6 | | 7.7 | | 5.8 | | 2.6 | | 4.5 | | 5.8 | | 5.6 | | 3.5 | | 2.6 | | n/a | |
Education | | 5.0 | | 6.5 | | 5.2 | | 4.7 | | 5.7 | | 1.1 | | 0.6 | | 5.1 | | 0.6 | | -0.8 | | n/a | |
Social services | | 8.9 | | 5.3 | | 4.8 | | 10.0 | | 4.6 | | 8.9 | | 4.1 | | -0.1 | | -6.3 | | 0.1 | | n/a | |
Protection of persons and property | | 16.6 | | -4.9 | | 20.7 | | 0.0 | | -3.4 | | 4.9 | | 4.4 | | -5.4 | | -2.6 | | 0.5 | | n/a | |
Transportation | | -8.6 | | 4.5 | | 10.2 | | 1.7 | | 3.7 | | 8.7 | | -2.3 | | 7.2 | | 3.9 | | 3.7 | | n/a | |
Natural resources & economic development | | 4.6 | | 7.9 | | 16.2 | | -9.4 | | 15.1 | | 7.1 | | -18.7 | | -3.9 | | -9.8 | | 3.1 | | n/a | |
Other | | 6.0 | | 14.1 | | 12.5 | | 18.9 | | -16.2 | | -12.6 | | 15.1 | | -3.6 | | -11.4 | | 0.5 | | n/a | |
General government | | 28.1 | | 8.6 | | -2.6 | | 17.2 | | -3.7 | | -16.4 | | 8.5 | | 0.2 | | 2.9 | | 0.2 | | n/a | |
Debt servicing | | -4.6 | | 3.3 | | -1.5 | | -3.5 | | 1.8 | | 2.5 | | 5.8 | | 1.6 | | 5.2 | | 8.3 | | n/a | |
Operating expense | | 6.2 | | 6.1 | | 6.9 | | 4.9 | | 3.0 | | 2.8 | | 2.9 | | 4.1 | | 0.6 | | 1.7 | | n/a | |
Per capita: (2) | | | | | | | | | | | | | | | | | | | | | | | |
Health | | 2,950 | | 3,109 | | 3,296 | | 3,429 | | 3,459 | | 3,557 | | 3,728 | | 3,908 | | 3,998 | | 4,054 | | 3.6 | |
Education | | 2,124 | | 2,237 | | 2,317 | | 2,384 | | 2,477 | | 2,466 | | 2,457 | | 2,565 | | 2,549 | | 2,498 | | 1.8 | |
Social services | | 652 | | 679 | | 701 | | 758 | | 779 | | 836 | | 862 | | 854 | | 791 | | 782 | | 2.0 | |
Protection of persons and property | | 297 | | 279 | | 332 | | 326 | | 309 | | 320 | | 331 | | 310 | | 299 | | 297 | | 0.0 | |
Transportation | | 285 | | 295 | | 320 | | 320 | | 326 | | 349 | | 338 | | 359 | | 369 | | 378 | | 3.2 | |
Natural resources & economic development | | 394 | | 420 | | 481 | | 428 | | 485 | | 511 | | 411 | | 393 | | 350 | | 356 | | -1.1 | |
Other | | 258 | | 291 | | 322 | | 377 | | 311 | | 267 | | 305 | | 292 | | 256 | | 254 | | -0.2 | |
Contingencies | | — | | — | | — | | — | | — | | — | | 5 | | 65 | | 54 | | 53 | | n/a | |
General government | | 274 | | 295 | | 283 | | 325 | | 308 | | 253 | | 272 | | 271 | | 276 | | 273 | | 0.0 | |
Debt servicing | | 524 | | 535 | | 519 | | 492 | | 493 | | 497 | | 521 | | 526 | | 547 | | 585 | | 1.2 | |
Operating expense | | 7,758 | | 8,140 | | 8,571 | | 8,839 | | 8,947 | | 9,056 | | 9,230 | | 9,543 | | 9,489 | | 9,530 | | 2.3 | |
Real Per Capita Operating Expense (2014 $)(3) | | 8,961 | | 9,246 | | 9,568 | | 9,666 | | 9,783 | | 9,773 | | 9,728 | | 9,873 | | 9,668 | | 9,531 | | 0.7 | |
Growth rate (per cent) | | 2.7 | | 3.2 | | 3.5 | | 1.0 | | 1.2 | | -0.1 | | -0.5 | | 1.5 | | -2.1 | | -1.4 | | 0.9 | |
(1) | Expense as a per cent of GDP is calculated using nominal GDP for the calendar year ending in the fiscal year (e.g. 2012/13 expense divided by nominal GDP for the 2012 calendar year). Totals may not add due to rounding. |
(2) | Per capita expense is calculated using July 1 population (e.g. 2012/13 expense divided by population on July 1, 2012). Totals may not add due to rounding. |
(3) | Expense is converted to real (inflation-adjusted) terms using the consumer price index (CPI) for the corresponding calendar year (e.g. 2012 CPI for 2012/13 expense). |
First Quarterly Report 2012/13
59
Appendix
Table A9 Full-Time Equivalents (FTEs) — 2005/06 to 2014/15 (1)
| | | | | | | | | | | | | | | | Updated | | Updated | | Updated | | Average | |
| | Actual | | Actual | | Actual | | Actual | | Actual | | Actual | | Actual | | Forecast | | Plan | | Plan | | annual | |
| | 2005/06 | | 2006/07 | | 2007/08 | | 2008/09 | | 2009/10 | | 2010/11 | | 2011/12 (2) | | 2012/13 | | 2013/14 | | 2014/15 | | change | |
| | | | | | | | | | | | | | | | | | | | | | (per cent) | |
Taxpayer-supported programs and agencies: | | | | | | | | | | | | | | | | | | | | | | | |
Ministries and special offices (CRF) | | 27,129 | | 28,647 | | 30,224 | | 31,874 | | 31,353 | | 30,221 | | 27,228 | | 26,891 | | 25,957 | | 25,061 | | -0.4 | |
Service delivery agencies (3) | | 3,992 | | 3,917 | | 4,128 | | 4,403 | | 4,508 | | 4,295 | | 4,346 | | 4,568 | | 4,577 | | 4,616 | | 0.8 | |
Total FTEs | | 31,121 | | 32,564 | | 34,352 | | 36,277 | | 35,861 | | 34,516 | | 31,574 | | 31,459 | | 30,534 | | 29,677 | | -0.2 | |
Growth rates: | | | | | | | | | | | | | | | | | | | | | | | |
Ministries and special offices (CRF) | | -0.5 | | 5.6 | | 5.5 | | 5.5 | | -1.6 | | -3.6 | | -9.9 | | -1.2 | | -3.5 | | -3.5 | | -0.7 | |
Service delivery agencies | | 4.4 | | -1.9 | | 5.4 | | 6.7 | | 2.4 | | -4.7 | | 1.2 | | 5.1 | | 0.2 | | 0.9 | | 2.0 | |
Population per FTE: (4) | | | | | | | | | | | | | | | | | | | | | | | |
Total FTEs | | 134.9 | | 130.3 | | 125.5 | | 120.8 | | 124.4 | | 131.2 | | 144.8 | | 146.4 | | 152.6 | | 159.0 | | 0.9 | |
(1) | Full-time equivalents (FTEs) are a measure of staff employment. FTEs are calculated by dividing the total hours of employment paid for in a given period by the number of hours an individual, full-time person would normally work in that period. This does not equate to the physical number of employees. For example, two half-time employees would equal one FTE, or alternatively, three FTEs may represent two full-time employees who have worked sufficient overtime hours to equal an additional FTE. |
(2) | The ministry 2011/12 FTE total includes a reduction of about 3,200 FTEs reflecting the shift of BC Ambulance Service oversight from the Ministry of Health to the Provincial Health Services Authority. |
(3) | Service delivery agency FTE amounts do not include SUCH sector staff employment. |
(4) | Population per FTE is calculated using July 1 population (e.g. population on July 1, 2012 divided by 2012/13 FTEs). |
First Quarterly Report 2012/13
60
Appendix
Table A10 Capital Spending — 2005/06 to 2014/15
| | | | | | | | | | | | | | | | Updated | | Updated | | Updated | | Average | |
| | Actual | | Actual | | Actual | | Actual | | Actual | | Actual | | Actual | | Forecast | | Plan | | Plan | | annual | |
($ millions) | | 2005/06 | | 2006/07 | | 2007/08 | | 2008/09 | | 2009/10 | | 2010/11 | | 2011/12 | | 2012/13 | | 2013/14 | | 2014/15 | | change | |
| | | | | | | | | | | | | | | | | | | | | | (per cent) | |
Taxpayer-supported: | | | | | | | | | | | | | | | | | | | | | | | |
Education | | | | | | | | | | | | | | | | | | | | | | | |
Schools districts | | 286 | | 322 | | 380 | | 413 | | 449 | | 433 | | 560 | | 530 | | 518 | | 500 | | 6.4 | |
Post-secondary institutions | | 790 | | 874 | | 782 | | 658 | | 672 | | 925 | | 662 | | 781 | | 615 | | 699 | | -1.4 | |
Health | | 848 | | 760 | | 881 | | 892 | | 927 | | 916 | | 732 | | 965 | | 792 | | 731 | | -1.6 | |
BC Transportation Financing Authority | | 713 | | 821 | | 884 | | 881 | | 918 | | 1,080 | | 921 | | 1,185 | | 1,193 | | 946 | | 3.2 | |
BC Transit | | 24 | | 13 | | 37 | | 77 | | 150 | | 39 | | 37 | | 66 | | 116 | | 99 | | 17.1 | |
Rapid Transit Project 2000 | | 16 | | 15 | | — | | — | | — | | — | | — | | — | | — | | — | | n/a | |
Vancouver Convention Centre expansion | | 85 | | 105 | | 251 | | 242 | | 41 | | 10 | | 1 | | 2 | | — | | — | | n/a | |
BC Place redevelopment | | — | | — | | — | | 45 | | 75 | | 197 | | 194 | | 8 | | 12 | | — | | n/a | |
Government direct (ministries) | | 320 | | 355 | | 335 | | 430 | | 306 | | 261 | | 245 | | 455 | | 439 | | 482 | | 4.7 | |
Other | | 60 | | 139 | | 117 | | 133 | | 184 | | 250 | | 220 | | 131 | | 98 | | 86 | | 4.1 | |
Capital planning adjustments | | — | | — | | — | | — | | — | | — | | — | | (408 | ) | (211 | ) | (358 | ) | | |
| | 3,142 | | 3,404 | | 3,667 | | 3,771 | | 3,722 | | 4,111 | | 3,572 | | 3,715 | | 3,572 | | 3,185 | | 0.2 | |
Self-supported: | | | | | | | | | | | | | | | | | | | | | | | |
BC Hydro | | 610 | | 807 | | 1,076 | | 1,397 | | 2,406 | | 1,519 | | 1,917 | | 2,196 | | 2,440 | | 2,405 | | 16.5 | |
BC Transmission Corporation | | 21 | | 50 | | 70 | | 19 | | 12 | | — | | — | | — | | — | | — | | n/a | |
Columbia River power projects | | 30 | | 19 | | 29 | | 32 | | 16 | | 67 | | 108 | | 122 | | 64 | | 26 | | -1.6 | |
Transportation Invest. Corp. (Port Mann) | | — | | — | | — | | 215 | | 778 | | 730 | | 735 | | 626 | | 114 | | 121 | | n/a | |
BC Railway Company | | 15 | | 19 | | 20 | | 10 | | 14 | | 6 | | 9 | | 15 | | 11 | | 1 | | -26.0 | |
ICBC | | 27 | | 22 | | 23 | | 22 | | 22 | | 48 | | 92 | | 97 | | 87 | | 73 | | 11.7 | |
BC Lotteries | | 83 | | 44 | | 60 | | 97 | | 92 | | 81 | | 74 | | 116 | | 110 | | 105 | | 2.6 | |
Liquor Distribution Branch | | 19 | | 22 | | 18 | | 17 | | 19 | | 18 | | 19 | | 22 | | 24 | | 36 | | 7.4 | |
| | 805 | | 983 | | 1,296 | | 1,809 | | 3,359 | | 2,469 | | 2,954 | | 3,194 | | 2,850 | | 2,767 | | 14.7 | |
Total capital spending | | 3,947 | | 4,387 | | 4,963 | | 5,580 | | 7,081 | | 6,580 | | 6,526 | | 6,909 | | 6,422 | | 5,952 | | 4.7 | |
| | | | | | | | | | | | | | | | | | | | | | | |
Per cent of nominal GDP: (1) | | | | | | | | | | | | | | | | | | | | | | | |
Taxpayer-supported | | 1.9 | | 1.9 | | 1.9 | | 1.9 | | 1.9 | | 2.0 | | 1.7 | | 1.7 | | 1.6 | | 1.3 | | -3.6 | |
Self-supported | | 0.5 | | 0.5 | | 0.7 | | 0.9 | | 1.8 | | 1.2 | | 1.4 | | 1.4 | | 1.2 | | 1.2 | | 10.4 | |
Total | | 2.3 | | 2.4 | | 2.6 | | 2.8 | | 3.7 | | 3.2 | | 3.1 | | 3.1 | | 2.8 | | 2.5 | | 0.7 | |
Growth rates: | | | | | | | | | | | | | | | | | | | | | | | |
Taxpayer-supported | | 33.2 | | 8.3 | | 7.7 | | 2.8 | | -1.3 | | 10.5 | | -13.1 | | 4.0 | | -3.8 | | -10.8 | | 3.8 | |
Self-supported | | 3.7 | | 22.1 | | 31.8 | | 39.6 | | 85.7 | | -26.5 | | 19.6 | | 8.1 | | -10.8 | | -2.9 | | 17.1 | |
Total | | 25.9 | | 11.1 | | 13.1 | | 12.4 | | 26.9 | | -7.1 | | -0.8 | | 5.9 | | -7.0 | | -7.3 | | 7.3 | |
Per capita: (2) | | | | | | | | | | | | | | | | | | | | | | | |
Taxpayer-supported | | 749 | | 802 | | 851 | | 860 | | 835 | | 908 | | 781 | | 807 | | 766 | | 675 | | -1.1 | |
Self-supported | | 192 | | 232 | | 301 | | 413 | | 753 | | 545 | | 646 | | 693 | | 611 | | 587 | | 13.2 | |
Total | | 940 | | 1,034 | | 1,152 | | 1,273 | | 1,588 | | 1,453 | | 1,427 | | 1,500 | | 1,378 | | 1,262 | | 3.3 | |
| | | | | | | | | | | | | | | | | | | | | | | |
Real Per Capita Capital Spending (2014 $) (3) | | 1,086 | | 1,174 | | 1,286 | | 1,392 | | 1,736 | | 1,568 | | 1,504 | | 1,552 | | 1,404 | | 1,262 | | 1.7 | |
Growth rate (per cent) | | 21.7 | | 8.1 | | 9.5 | | 8.3 | | 24.7 | | -9.7 | | -4.0 | | 3.2 | | -9.5 | | -10.2 | | 4.2 | |
(1) Capital spending as a per cent of GDP is calculated using nominal GDP for the calendar year ending in the fiscal year (e.g. 2012/13 amounts divided by nominal GDP for the 2012 calendar year). Totals may not add due to rounding.
(2) Per capita capital spending is calculated using July 1 population (e.g. 2012/13 amounts divided by population on July 1, 2012). Totals may not add due to rounding.
(3) Capital spending is converted to real (inflation-adjusted) terms using the consumer price index (CPI) for the corresponding calendar year (e.g. 2012 CPI for 2012/13 capital spending).
First Quarterly Report 2012/13
61
Appendix
Table A11 Statement of Financial Position — 2005/06 to 2014/15
| | | | | | | | | | | | | | | | Updated | | Updated | | Updated | | Average | |
| | Actual | | Actual | | Actual | | Actual | | Actual | | Actual | | Actual | | Forecast | | Plan | | Plan | | annual | |
($ millions) | | 2005/06 | | 2006/07 | | 2007/08 | | 2008/09 | | 2009/10 | | 2010/11 | | 2011/12 | | 2012/13 | | 2013/14 | | 2014/15 | | change | |
| | | | | | | | | | | | | | | | | | | | | | (per cent) | |
Financial assets: | | | | | | | | | | | | | | | | | | | | | | | |
Cash and temporary investments | | 3,864 | | 3,434 | | 5,936 | | 5,168 | | 2,901 | | 3,052 | | 3,239 | | 3,430 | | 3,175 | | 3,126 | | -1.9 | |
Other financial assets | | 6,220 | | 7,064 | | 7,188 | | 6,205 | | 7,511 | | 8,323 | | 8,133 | | 8,524 | | 9,200 | | 9,412 | | 3.8 | |
Sinking funds | | 4,059 | | 3,798 | | 2,649 | | 2,134 | | 1,329 | | 1,410 | | 1,491 | | 1,796 | | 427 | | 376 | | -19.4 | |
Investments in commercial Crown corporations: | | | | | | | | | | | | | | | | | | | | | | | |
Retained earnings | | 3,308 | | 4,307 | | 4,972 | | 5,579 | | 7,075 | | 6,695 | | 6,676 | | 6,960 | | 7,384 | | 7,804 | | 8.1 | |
Recoverable capital loans | | 6,916 | | 7,170 | | 7,719 | | 9,149 | | 11,471 | | 12,947 | | 14,846 | | 17,258 | | 19,636 | | 21,448 | | 10.8 | |
| | 10,224 | | 11,477 | | 12,691 | | 14,728 | | 18,546 | | 19,642 | | 21,522 | | 24,218 | | 27,020 | | 29,252 | | 10.0 | |
Warehouse borrowing program assets | | — | | — | | — | | 2,081 | | — | | — | | — | | — | | — | | — | | n/a | |
| | 24,367 | | 25,773 | | 28,464 | | 30,316 | | 30,287 | | 32,427 | | 34,385 | | 37,968 | | 39,822 | | 42,166 | | 5.1 | |
Liabilities: | | | | | | | | | | | | | | | | | | | | | | | |
Accounts payable & accrued liabilities | | 7,454 | | 7,236 | | 8,087 | | 7,420 | | 7,013 | | 7,628 | | 8,833 | | 8,976 | | 8,529 | | 8,280 | | 1.0 | |
Deferred revenue | | 5,912 | | 6,249 | | 7,475 | | 9,496 | | 10,083 | | 10,852 | | 10,571 | | 10,012 | | 9,569 | | 9,059 | | 4.0 | |
Debt: | | | | | | | | | | | | | | | | | | | | | | | |
Taxpayer-supported debt | | 27,251 | | 25,968 | | 26,589 | | 26,446 | | 30,021 | | 31,855 | | 34,692 | | 38,679 | | 41,764 | | 43,808 | | 4.4 | |
Self-supported debt | | 7,206 | | 7,471 | | 8,048 | | 11,568 | | 11,864 | | 13,299 | | 15,501 | | 17,907 | | 20,279 | | 22,085 | | 10.7 | |
Forecast allowance | | — | | — | | — | | — | | — | | — | | — | | 150 | | 200 | | 300 | | n/a | |
Total provincial debt | | 34,457 | | 33,439 | | 34,637 | | 38,014 | | 41,885 | | 45,154 | | 50,193 | | 56,736 | | 62,243 | | 66,193 | | 6.1 | |
Add: debt offset by sinking funds | | 4,059 | | 3,798 | | 2,649 | | 2,134 | | 1,329 | | 1,410 | | 1,491 | | 1,796 | | 427 | | 376 | | -19.4 | |
Less: guarantees and non-guaranteed debt | | (475 | ) | (436 | ) | (477 | ) | (480 | ) | (527 | ) | (455 | ) | (730 | ) | (687 | ) | (681 | ) | (674 | ) | 3.2 | |
Financial statement debt | | 38,041 | | 36,801 | | 36,809 | | 39,668 | | 42,687 | | 46,109 | | 50,954 | | 57,845 | | 61,989 | | 65,895 | | 5.1 | |
| | 51,407 | | 50,286 | | 52,371 | | 56,584 | | 59,783 | | 64,589 | | 70,358 | | 76,833 | | 80,087 | | 83,234 | | 4.5 | |
Net liabilities | | (27,040 | ) | (24,513 | ) | (23,907 | ) | (26,268 | ) | (29,496 | ) | (32,162 | ) | (35,973 | ) | (38,865 | ) | (40,265 | ) | (41,068 | ) | 3.9 | |
Capital and other assets: | | | | | | | | | | | | | | | | | | | | | | | |
Tangible capital assets | | 24,926 | | 26,767 | | 28,698 | | 30,612 | | 32,291 | | 34,337 | | 35,763 | | 37,363 | | 38,765 | | 39,737 | | 4.3 | |
Restricted assets | | 937 | | 1,012 | | 1,180 | | 1,228 | | 1,291 | | 1,362 | | 1,452 | | 1,451 | | 1,451 | | 1,451 | | | |
Other assets | | 730 | | 754 | | 708 | | 758 | | 896 | | 1,086 | | 1,215 | | 1,309 | | 1,341 | | 1,380 | | 6.0 | |
| | 26,593 | | 28,533 | | 30,586 | | 32,598 | | 34,478 | | 36,785 | | 38,430 | | 40,123 | | 41,557 | | 42,568 | | 4.4 | |
Accumulated surplus (deficit) | | (447 | ) | 4,020 | | 6,679 | | 6,330 | | 4,982 | | 4,623 | | 2,457 | | 1,258 | | 1,292 | | 1,500 | | n/a | |
Per cent of Nominal GDP: (1) | | | | | | | | | | | | | | | | | | | | | | | |
Net liabilities | | 15.9 | | 13.5 | | 12.4 | | 13.2 | | 15.4 | | 15.8 | | 16.8 | | 17.5 | | 17.5 | | 17.1 | | 0.7 | |
Capital and other assets | | 15.7 | | 15.7 | | 15.9 | | 16.3 | | 18.0 | | 18.1 | | 18.0 | | 18.1 | | 18.1 | | 17.8 | | 1.1 | |
Growth rates: | | | | | | | | | | | | | | | | | | | | | | | |
Net liabilities | | -3.9 | | -9.3 | | -2.5 | | 9.9 | | 12.3 | | 9.0 | | 11.8 | | 8.0 | | 3.6 | | 2.0 | | 5.0 | |
Capital and other assets | | 7.5 | | 7.3 | | 7.2 | | 6.6 | | 5.8 | | 6.7 | | 4.5 | | 4.4 | | 3.6 | | 2.4 | | 5.4 | |
Per capita: (2) | | | | | | | | | | | | | | | | | | | | | | | |
Net liabilities | | 6,443 | | 5,776 | | 5,547 | | 5,992 | | 6,614 | | 7,100 | | 7,866 | | 8,438 | | 8,639 | | 8,705 | | 2.8 | |
Capital and other assets | | 6,337 | | 6,724 | | 7,097 | | 7,436 | | 7,731 | | 8,121 | | 8,403 | | 8,711 | | 8,916 | | 9,023 | | 3.3 | |
(1) Net liabilities as a per cent of GDP is calculated using GDP for the calendar year ending in the fiscal year (e.g. 2012/13 amount divided by GDP for the 2012 calendar year).
(2) Per capita net liabilities is calculated using July 1 population (e.g. 2012/13 amount divided by population on July 1, 2012).
First Quarterly Report 2012/13
62
Appendix
Table A12 Changes in Financial Position — 2005/06 to 2014/15
| | | | | | | | | | | | | | | | Updated | | Updated | | Updated | | | |
| | Actual | | Actual | | Actual | | Actual | | Actual | | Actual | | Actual | | Forecast | | Plan | | Plan | | 10-Year | |
($ millions) | | 2005/06 | | 2006/07 | | 2007/08 | | 2008/09 | | 2009/10 | | 2010/11 | | 2011/12 | | 2012/13 | | 2013/14 | | 2014/15 | | Total | |
(Surplus) deficit for the year | | (2,963 | ) | (3,973 | ) | (2,741 | ) | (83 | ) | 1,827 | | 249 | | 1,840 | | 1,141 | | (30 | ) | (235 | ) | (4,968 | ) |
Comprehensive income (increase) decrease | | — | | (494 | ) | 82 | | 432 | | (479 | ) | 110 | | 326 | | 58 | | (4 | ) | 27 | | 58 | |
Change in accumulated (surplus) deficit | | (2,963 | ) | (4,467 | ) | (2,659 | ) | 349 | | 1,348 | | 359 | | 2,166 | | 1,199 | | (34 | ) | (208 | ) | (4,910 | ) |
Capital and other asset changes: | | | | | | | | | | | | | | | | | | | | | | | |
Taxpayer-supported capital investments | | 3,142 | | 3,404 | | 3,667 | | 3,771 | | 3,722 | | 4,111 | | 3,572 | | 3,715 | | 3,572 | | 3,185 | | 35,861 | |
Less: amortization and other accounting changes | | (1,613 | ) | (1,563 | ) | (1,736 | ) | (1,857 | ) | (2,043 | ) | (2,065 | ) | (2,146 | ) | (2,115 | ) | (2,170 | ) | (2,213 | ) | (19,521 | ) |
Increase in net capital assets | | 1,529 | | 1,841 | | 1,931 | | 1,914 | | 1,679 | | 2,046 | | 1,426 | | 1,600 | | 1,402 | | 972 | | 16,340 | |
Increase (decrease) in restricted assets | | 107 | | 75 | | 168 | | 48 | | 63 | | 71 | | 90 | | (1 | ) | — | | — | | | |
Increase (decrease) in other assets | | 220 | | 24 | | (46 | ) | 50 | | 138 | | 190 | | 129 | | 94 | | 32 | | 39 | | 870 | |
| | 1,856 | | 1,940 | | 2,053 | | 2,012 | | 1,880 | | 2,307 | | 1,645 | | 1,693 | | 1,434 | | 1,011 | | 17,831 | |
Increase (decrease) in net liabilities | | (1,107 | ) | (2,527 | ) | (606 | ) | 2,361 | | 3,228 | | 2,666 | | 3,811 | | 2,892 | | 1,400 | | 803 | | 12,921 | |
Investment and working capital changes: | | | | | | | | | | | | | | | | | | | | | | | |
Increase (reduction) in cash and temporary investments | | 241 | | (430 | ) | 2,502 | | (768 | ) | (2,267 | ) | 151 | | 187 | | 191 | | (255 | ) | (49 | ) | (497 | ) |
Increase (decrease) in warehouse borrowing investments | | — | | — | | — | | 2,081 | | (2,081 | ) | — | | — | | — | | — | | — | | — | |
Investment in commercial Crown corporations: | | | | | | | | | | | | | | | | | | | | | | | |
Increase (decrease) in retained earnings | | 283 | | 999 | | 665 | | 607 | | 1,496 | | (380 | ) | (19 | ) | 284 | | 424 | | 420 | | 4,779 | |
Self-supported capital investments | | 805 | | 983 | | 1,296 | | 1,809 | | 3,359 | | 2,469 | | 2,954 | | 3,194 | | 2,850 | | 2,767 | | 22,486 | |
Less: loan repayments and other accounting changes | | (790 | ) | (729 | ) | (747 | ) | (379 | ) | (1,037 | ) | (993 | ) | (1,055 | ) | (782 | ) | (472 | ) | (955 | ) | (7,939 | ) |
| | 298 | | 1,253 | | 1,214 | | 2,037 | | 3,818 | | 1,096 | | 1,880 | | 2,696 | | 2,802 | | 2,232 | | 19,326 | |
Other working capital changes | | (1,296 | ) | 464 | | (3,102 | ) | (2,852 | ) | 321 | | (491 | ) | (1,033 | ) | 1,112 | | 197 | | 920 | | (5,760 | ) |
| | (757 | ) | 1,287 | | 614 | | 498 | | (209 | ) | 756 | | 1,034 | | 3,999 | | 2,744 | | 3,103 | | 13,069 | |
Increase (decrease) in financial statement debt | | (1,864 | ) | (1,240 | ) | 8 | | 2,859 | | 3,019 | | 3,422 | | 4,845 | | 6,891 | | 4,144 | | 3,906 | | 25,990 | |
(Increase) decrease in sinking fund debt | | 456 | | 261 | | 1,149 | | 515 | | 805 | | (81 | ) | (81 | ) | (305 | ) | 1,369 | | 51 | | 4,139 | |
Increase (decrease) in guarantees and non-guaranteed debt | | (4 | ) | (39 | ) | 41 | | 3 | | 47 | | (72 | ) | 275 | | (43 | ) | (6 | ) | (7 | ) | 195 | |
Increase (decrease) in total provincial debt | | (1,412 | ) | (1,018 | ) | 1,198 | | 3,377 | | 3,871 | | 3,269 | | 5,039 | | 6,543 | | 5,507 | | 3,950 | | 30,324 | |
Represented by increase (decrease) in: | | | | | | | | | | | | | | | | | | | | | | | |
Taxpayer-supported debt | | (1,417 | ) | (1,283 | ) | 621 | | (143 | ) | 3,575 | | 1,834 | | 2,837 | | 3,987 | | 3,085 | | 2,044 | | 15,140 | |
Self-supported debt | | 5 | | 265 | | 577 | | 3,520 | | 296 | | 1,435 | | 2,202 | | 2,406 | | 2,372 | | 1,806 | | 14,884 | |
Forecast allowance | | — | | — | | — | | — | | — | | — | | — | | 150 | | 50 | | 100 | | 300 | |
Total provincial debt | | (1,412 | ) | (1,018 | ) | 1,198 | | 3,377 | | 3,871 | | 3,269 | | 5,039 | | 6,543 | | 5,507 | | 3,950 | | 30,324 | |
First Quarterly Report 2012/13
63
Appendix
Table A13 Provincial Debt — 2005/06 to 2014/15
| | | | | | | | | | | | | | | | Updated | | Updated | | Updated | | Average | |
| | Actual | | Actual | | Actual | | Actual | | Actual | | Actual | | Actual | | Forecast | | Plan | | Plan | | annual | |
($ millions) | | 2005/06 | | 2006/07 | | 2007/08 | | 2008/09 | | 2009/10 | | 2010/11 | | 2011/12 | | 2012/13 | | 2013/14 | | 2014/15 | | change | |
| | | | | | | | | | | | | | | | | | | | | | (per cent) | |
Taxpayer-supported debt: | | | | | | | | | | | | | | | | | | | | | | | |
Provincial government operating | | 9,952 | | 6,928 | | 5,330 | | 3,048 | | 4,663 | | 4,268 | | 5,117 | | 7,020 | | 8,222 | | 8,502 | | -1.7 | |
Provincial government general capital | | 1,391 | | 1,961 | | 2,274 | | 2,696 | | 2,696 | | 2,696 | | 2,696 | | 2,696 | | 2,696 | | 2,696 | | 7.6 | |
Manage natural gas royalty impacts | | — | | — | | — | | — | | — | | — | | — | | (241 | ) | (630 | ) | (1,113 | ) | n/a | |
Provincial government direct operating | | 11,343 | | 8,889 | | 7,604 | | 5,744 | | 7,359 | | 6,964 | | 7,813 | | 9,475 | | 10,288 | | 10,085 | | -1.3 | |
Other taxpayer-supported debt (mainly capital): | | | | | | | | | | | | | | | | | | | | | | | |
Education facilities | | | | | | | | | | | | | | | | | | | | | | | |
School districts | | 4,860 | | 5,013 | | 5,216 | | 5,522 | | 5,777 | | 6,016 | | 6,407 | | 6,908 | | 7,434 | | 7,916 | | 5.6 | |
Post-secondary institutions | | 2,772 | | 3,024 | | 3,437 | | 3,626 | | 3,843 | | 4,092 | | 4,185 | | 4,318 | | 4,442 | | 4,622 | | 5.8 | |
| | 7,632 | | 8,037 | | 8,653 | | 9,148 | | 9,620 | | 10,108 | | 10,592 | | 11,226 | | 11,876 | | 12,538 | | 5.7 | |
Health facilities | | 2,635 | | 3,053 | | 3,511 | | 3,936 | | 4,389 | | 4,895 | | 5,293 | | 5,825 | | 6,290 | | 6,748 | | 11.0 | |
Highways, ferries and public transit | | | | | | | | | | | | | | | | | | | | | | | |
BC Transportation Financing Authority | | 2,699 | | 3,237 | | 3,948 | | 4,586 | | 5,211 | | 5,785 | | 6,287 | | 7,172 | | 7,975 | | 8,904 | | 14.2 | |
SkyTrain extension | | 1,145 | | 1,153 | | 1,153 | | 1,154 | | 1,154 | | 1,155 | | 1,174 | | 1,174 | | 1,174 | | 1,174 | | 0.3 | |
Public transit | | 959 | | 950 | | 958 | | 997 | | 997 | | 997 | | 1,000 | | 1,000 | | 1,000 | | 1,000 | | 0.5 | |
BC Transit | | 80 | | 96 | | 84 | | 94 | | 140 | | 158 | | 183 | | 163 | | 180 | | 205 | | 11.0 | |
| | 4,883 | | 5,436 | | 6,143 | | 6,831 | | 7,502 | | 8,095 | | 8,644 | | 9,509 | | 10,329 | | 11,283 | | 9.8 | |
Other | | | | | | | | | | | | | | | | | | | | | | | |
Social Housing | | 189 | | 216 | | 218 | | 286 | | 305 | | 511 | | 674 | | 769 | | 803 | | 841 | | 18.0 | |
Provincial government general capital | | — | | — | | — | | — | | 294 | | 570 | | 808 | | 1,263 | | 1,701 | | 2,183 | | n/a | |
BC Immigrant Investment Fund | | 148 | | 167 | | 256 | | 287 | | 289 | | 347 | | 398 | | 395 | | 475 | | 490 | | n/a | |
Homeowner Protection Office | | 110 | | 110 | | 136 | | 150 | | 144 | | — | | — | | — | | — | | — | | n/a | |
BC Pavilion Corporation | | — | | — | | — | | — | | 49 | | 250 | | 383 | | 397 | | 395 | | 393 | | n/a | |
BC Buildings | | 246 | | — | | — | | — | | — | | — | | — | | — | | — | | — | | n/a | |
Other | | 65 | | 60 | | 68 | | 64 | | 70 | | 115 | | 87 | | 84 | | 82 | | 80 | | 2.3 | |
Impact of capital planning adjustments | | — | | — | | — | | — | | — | | — | | — | | (264 | ) | (475 | ) | (833 | ) | n/a | |
| | 758 | | 553 | | 678 | | 787 | | 1,151 | | 1,793 | | 2,350 | | 2,644 | | 2,981 | | 3,154 | | 17.2 | |
Total other taxpayer-supported debt | | 15,908 | | 17,079 | | 18,985 | | 20,702 | | 22,662 | | 24,891 | | 26,879 | | 29,204 | | 31,476 | | 33,723 | | 8.7 | |
Total taxpayer-supported debt | | 27,251 | | 25,968 | | 26,589 | | 26,446 | | 30,021 | | 31,855 | | 34,692 | | 38,679 | | 41,764 | | 43,808 | | 5.4 | |
Self-supported debt: | | | | | | | | | | | | | | | | | | | | | | | |
Commercial Crown corporations and agencies | | | | | | | | | | | | | | | | | | | | | | | |
BC Hydro | | 6,892 | | 7,144 | | 7,633 | | 9,054 | | 10,792 | | 11,710 | | 12,978 | | 14,673 | | 16,408 | | 18,057 | | 11.3 | |
Transportation Invest. Corp. (Port Mann) | | — | | — | | — | | 20 | | 544 | | 1,148 | | 1,779 | | 2,477 | | 3,104 | | 3,254 | | n/a | |
Post-secondary institutions’ subsidiaries | | 32 | | 58 | | 115 | | 134 | | 201 | | 173 | | 173 | | 173 | | 173 | | 173 | | 20.6 | |
Columbia River power projects | | 247 | | 236 | | 219 | | 208 | | 196 | | 183 | | 481 | | 475 | | 469 | | 463 | | 7.2 | |
BC Transmission Corporation | | 30 | | 30 | | 79 | | 70 | | 70 | | — | | — | | — | | — | | — | | n/a | |
BC Lotteries | | — | | — | | — | | — | | 60 | | 85 | | 90 | | 109 | | 125 | | 138 | | n/a | |
Liquor Distribution Branch | | 5 | | 3 | | 2 | | 1 | | 1 | | — | | — | | — | | — | | — | | n/a | |
| | 7,206 | | 7,471 | | 8,048 | | 9,487 | | 11,864 | | 13,299 | | 15,501 | | 17,907 | | 20,279 | | 22,085 | | 13.3 | |
Warehouse borrowing program | | — | | — | | — | | 2,081 | | — | | — | | — | | — | | — | | — | | n/a | |
Total self-supported debt | | 7,206 | | 7,471 | | 8,048 | | 11,568 | | 11,864 | | 13,299 | | 15,501 | | 17,907 | | 20,279 | | 22,085 | | 13.3 | |
Forecast allowance | | — | | — | | — | | — | | — | | — | | — | | 150 | | 200 | | 300 | | n/a | |
Total provincial debt | | 34,457 | | 33,439 | | 34,637 | | 38,014 | | 41,885 | | 45,154 | | 50,193 | | 56,736 | | 62,243 | | 66,193 | | 7.5 | |
First Quarterly Report 2012/13
64
Appendix
Table A14 Provincial Debt Supplementary Information — 2005/06 to 2014/15
| | | | | | | | | | | | | | | | Updated | | Updated | | Updated | | Average | |
| | Actual | | Actual | | Actual | | Actual | | Actual | | Actual | | Actual | | Forecast | | Plan | | Plan | | annual | |
($ millions) | | 2005/06 | | 2006/07 | | 2007/08 | | 2008/09 | | 2009/10 | | 2010/11 | | 2011/12 | | 2012/13 | | 2013/14 | | 2014/15 | | change | |
| | | | | | | | | | | | | | | | | | | | | | (per cent) | |
Per cent of nominal GDP: (1) | | | | | | | | | | | | | | | | | | | | | | | |
Taxpayer-supported debt: | | | | | | | | | | | | | | | | | | | | | | | |
Provincial government direct operating | | 6.7 | | 4.9 | | 4.0 | | 2.9 | | 3.8 | | 3.4 | | 3.7 | | 4.3 | | 4.5 | | 4.2 | | -5.0 | |
Education facilities | | 4.5 | | 4.4 | | 4.5 | | 4.6 | | 5.0 | | 5.0 | | 5.0 | | 5.1 | | 5.2 | | 5.2 | | 1.7 | |
Health facilities | | 1.6 | | 1.7 | | 1.8 | | 2.0 | | 2.3 | | 2.4 | | 2.5 | | 2.6 | | 2.7 | | 2.8 | | 6.8 | |
Highways, ferries and public transit | | 2.9 | | 3.0 | | 3.2 | | 3.4 | | 3.9 | | 4.0 | | 4.0 | | 4.3 | | 4.5 | | 4.7 | | 5.6 | |
Other | | 0.4 | | 0.3 | | 0.4 | | 0.4 | | 0.6 | | 0.9 | | 1.1 | | 1.2 | | 1.3 | | 1.3 | | 12.7 | |
Total taxpayer-supported debt | | 16.1 | | 14.2 | | 13.8 | | 13.3 | | 15.6 | | 15.7 | | 16.2 | | 17.4 | | 18.1 | | 18.3 | | 1.4 | |
Self-supported debt: | | | | | | | | | | | | | | | | | | | | | | | |
Commercial Crown corporations & agencies | | 4.2 | | 4.1 | | 4.2 | | 4.8 | | 6.2 | | 6.5 | | 7.3 | | 8.1 | | 8.8 | | 9.2 | | 9.0 | |
Warehouse borrowing program | | — | | — | | — | | 1.0 | | — | | — | | — | | — | | — | | — | | n/a | |
Total self-supported debt | | 4.2 | | 4.1 | | 4.2 | | 5.8 | | 6.2 | | 6.5 | | 7.3 | | 8.1 | | 8.8 | | 9.2 | | 9.0 | |
Total provincial debt | | 20.3 | | 18.3 | | 18.0 | | 19.1 | | 21.8 | | 22.2 | | 23.5 | | 25.5 | | 27.1 | | 27.6 | | 3.5 | |
Growth rates: | | | | | | | | | | | | | | | | | | | | | | | |
Taxpayer-supported debt: | | | | | | | | | | | | | | | | | | | | | | | |
Provincial government direct operating | | -24.6 | | -21.6 | | -14.5 | | -24.5 | | 28.1 | | -5.4 | | 12.2 | | 21.3 | | 8.6 | | -2.0 | | -2.2 | |
Education facilities | | 7.0 | | 5.3 | | 7.7 | | 5.7 | | 5.2 | | 5.1 | | 4.8 | | 6.0 | | 5.8 | | 5.6 | | 5.8 | |
Health facilities | | 17.0 | | 15.9 | | 15.0 | | 12.1 | | 11.5 | | 11.5 | | 8.1 | | 10.1 | | 8.0 | | 7.3 | | 11.6 | |
Highways, ferries and public transit | | 5.1 | | 11.3 | | 13.0 | | 11.2 | | 9.8 | | 7.9 | | 6.8 | | 10.0 | | 8.6 | | 9.2 | | 9.3 | |
Other | | 2.2 | | -27.0 | | 22.6 | | 16.1 | | 46.3 | | 55.8 | | 31.1 | | 12.5 | | 12.7 | | 5.8 | | 17.8 | |
Total taxpayer-supported debt | | -8.6 | | -4.7 | | 2.4 | | -0.5 | | 13.5 | | 6.1 | | 8.9 | | 11.5 | | 8.0 | | 4.9 | | 4.1 | |
Self-supported debt: | | | | | | | | | | | | | | | | | | | | | | | |
Commercial Crown corporations & agencies | | 0.1 | | 3.7 | | 7.7 | | 17.9 | | 25.1 | | 12.1 | | 16.6 | | 15.5 | | 13.2 | | 8.9 | | 12.1 | |
Warehouse borrowing program | | — | | — | | — | | — | | -100.0 | | — | | — | | — | | — | | — | | n/a | |
Total self-supported debt | | 0.1 | | 3.7 | | 7.7 | | 43.7 | | 2.6 | | 12.1 | | 16.6 | | 15.5 | | 13.2 | | 8.9 | | 12.4 | |
Total provincial debt | | -6.9 | | -3.0 | | 3.6 | | 9.7 | | 10.2 | | 7.8 | | 11.2 | | 13.0 | | 9.7 | | 6.3 | | 6.2 | |
Per capita: (2) | | | | | | | | | | | | | | | | | | | | | | | |
Taxpayer-supported debt: | | | | | | | | | | | | | | | | | | | | | | | |
Provincial government direct operating | | 2,703 | | 2,095 | | 1,764 | | 1,310 | | 1,650 | | 1,537 | | 1,708 | | 2,057 | | 2,207 | | 2,138 | | -2.6 | |
Education facilities | | 1,819 | | 1,894 | | 2,008 | | 2,087 | | 2,157 | | 2,232 | | 2,316 | | 2,437 | | 2,548 | | 2,658 | | 4.3 | |
Health facilities | | 628 | | 719 | | 815 | | 898 | | 984 | | 1,081 | | 1,157 | | 1,265 | | 1,350 | | 1,430 | | 9.6 | |
Highways, ferries and public transit | | 1,164 | | 1,281 | | 1,425 | | 1,558 | | 1,682 | | 1,787 | | 1,890 | | 2,065 | | 2,216 | | 2,392 | | 8.3 | |
Other | | 181 | | 130 | | 157 | | 180 | | 258 | | 396 | | 514 | | 574 | | 640 | | 669 | | 15.6 | |
Total taxpayer-supported debt | | 6,493 | | 6,119 | | 6,170 | | 6,032 | | 6,731 | | 7,033 | | 7,586 | | 8,398 | | 8,961 | | 9,286 | | 4.1 | |
Self-supported debt: | | | | | | | | | | | | | | | | | | | | | | | |
Commercial Crown corporations & agencies | | 1,717 | | 1,761 | | 1,867 | | 2,164 | | 2,660 | | 2,936 | | 3,389 | | 3,888 | | 4,351 | | 4,681 | | 11.8 | |
Warehouse borrowing program | | — | | — | | — | | 475 | | — | | — | | — | | — | | — | | — | | n/a | |
Total self-supported debt | | 1,717 | | 1,761 | | 1,867 | | 2,639 | | 2,660 | | 2,936 | | 3,389 | | 3,888 | | 4,351 | | 4,681 | | 11.8 | |
Total provincial debt | | 8,210 | | 7,880 | | 8,037 | | 8,671 | | 9,391 | | 9,968 | | 10,975 | | 12,318 | | 13,354 | | 14,031 | | 6.1 | |
Real Per Capita Provincial Debt (2013 $) (3) | | 9,485 | | 8,951 | | 8,972 | | 9,482 | | 10,269 | | 10,757 | | 11,569 | | 12,744 | | 13,609 | | 14,031 | | 4.4 | |
Growth rate (per cent) | | -9.7 | | -5.6 | | 0.2 | | 5.7 | | 8.3 | | 4.7 | | 7.5 | | 10.2 | | 6.8 | | 3.1 | | 3.1 | |
(1) Debt as a per cent of GDP is calculated using nominal GDP for the calendar year ending in the fiscal year (e.g. 2012/13 debt divided by nominal GDP for the 2012 calendar year). Totals may not add due to rounding.
(2) Per capita debt is calculated using July 1 population (e.g. 2012/13 debt divided by population on July 1, 2012). Totals may not add due to rounding.
(3) Debt is converted to real (inflation-adjusted) terms using the consumer price index (CPI) for the corresponding calendar year (e.g. 2012 CPI for 2012/13 debt).
First Quarterly Report 2012/13
65
Appendix
Table A15 Key Provincial Debt Indicators — 2005/06 to 2014/15 (1)
| | | | | | | | | | | | | | | | Updated | | Updated | | Updated | | Average | |
| | Actual | | Actual | | Actual | | Actual | | Actual | | Actual | | Actual | | Forecast | | Plan | | Plan | | annual | |
| | 2005/06 | | 2006/07 | | 2007/08 | | 2008/09 | | 2009/10 | | 2010/11 | | 2011/12 | | 2012/13 | | 2013/14 | | 2014/15 | | change | |
| | | | | | | | | | | | | | | | | | | | | | (per cent) | |
Debt to revenue (per cent) | | | | | | | | | | | | | | | | | | | | | | | |
Total provincial | | 74.9 | | 69.2 | | 69.4 | | 78.0 | | 87.5 | | 89.9 | | 96.5 | | 104.9 | | 111.4 | | 115.1 | | 4.9 | |
Taxpayer-supported | | 77.9 | | 69.8 | | 69.6 | | 71.9 | | 84.0 | | 80.4 | | 86.9 | | 93.0 | | 97.6 | | 100.4 | | 2.8 | |
Debt per capita ($) (2) | | | | | | | | | | | | | | | | | | | | | | | |
Total provincial | | 8,210 | | 7,880 | | 8,037 | | 8,671 | | 9,391 | | 9,968 | | 10,975 | | 12,318 | | 13,354 | | 14,031 | | 6.1 | |
Taxpayer-supported | | 6,493 | | 6,119 | | 6,170 | | 6,032 | | 6,731 | | 7,033 | | 7,586 | | 8,398 | | 8,961 | | 9,286 | | 4.1 | |
Debt to nominal GDP (per cent) (3) | | | | | | | | | | | | | | | | | | | | | | | |
Total provincial | | 20.3 | | 18.3 | | 18.0 | | 19.1 | | 21.8 | | 22.2 | | 23.5 | | 25.5 | | 27.0 | | 27.6 | | 3.5 | |
Taxpayer-supported | | 16.1 | | 14.2 | | 13.8 | | 13.3 | | 15.6 | | 15.7 | | 16.2 | | 17.4 | | 18.1 | | 18.3 | | 1.4 | |
Interest bite (cents per dollar of revenue) (4) | | | | | | | | | | | | | | | | | | | | | | | |
Total provincial | | 4.4 | | 4.3 | | 4.0 | | 4.4 | | 4.6 | | 4.3 | | 4.4 | | 4.4 | | 4.7 | | 5.0 | | 1.5 | |
Taxpayer-supported | | 4.4 | | 4.2 | | 3.9 | | 4.3 | | 4.3 | | 4.0 | | 4.1 | | 3.9 | | 4.1 | | 4.3 | | -0.4 | |
Interest costs ($ millions) | | | | | | | | | | | | | | | | | | | | | | | |
Total provincial | | 2,007 | | 2,069 | | 2,010 | | 2,138 | | 2,205 | | 2,155 | | 2,291 | | 2,358 | | 2,631 | | 2,877 | | 4.1 | |
Taxpayer-supported | | 1,542 | | 1,570 | | 1,488 | | 1,570 | | 1,534 | | 1,596 | | 1,625 | | 1,639 | | 1,752 | | 1,864 | | 2.1 | |
Interest rate (per cent) (5) | | | | | | | | | | | | | | | | | | | | | | | |
Taxpayer-supported | | 5.5 | | 5.9 | | 5.7 | | 5.9 | | 5.4 | | 5.2 | | 4.9 | | 4.5 | | 4.4 | | 4.4 | | -2.6 | |
Background Information: | | | | | | | | | | | | | | | | | | | | | | | |
Revenue ($ millions) | | | | | | | | | | | | | | | | | | | | | | | |
Total provincial (6) | | 46,029 | | 48,340 | | 49,938 | | 48,761 | | 47,858 | | 50,235 | | 52,018 | | 54,106 | | 55,895 | | 57,497 | | 2.5 | |
Taxpayer-supported (7) | | 34,961 | | 37,203 | | 38,192 | | 36,784 | | 35,748 | | 39,639 | | 39,903 | | 41,573 | | 42,803 | | 43,646 | | 2.5 | |
Debt ($ millions) | | | | | | | | | | | | | | | | | | | | | | | |
Total provincial | | 34,457 | | 33,439 | | 34,637 | | 38,014 | | 41,885 | | 45,154 | | 50,193 | | 56,736 | | 62,243 | | 66,193 | | 7.5 | |
Taxpayer-supported (8) | | 27,251 | | 25,968 | | 26,589 | | 26,446 | | 30,021 | | 31,855 | | 34,692 | | 38,679 | | 41,764 | | 43,808 | | 5.4 | |
Provincial nominal GDP ($ millions) (9) | | 169,664 | | 182,251 | | 192,117 | | 199,441 | | 191,863 | | 203,147 | | 213,760 | | 222,134 | | 230,105 | | 239,660 | | 3.9 | |
Population (thousands at July 1) (10) | | 4,197 | | 4,244 | | 4,310 | | 4,384 | | 4,460 | | 4,530 | | 4,573 | | 4,606 | | 4,661 | | 4,718 | | 1.3 | |
(1) Includes fiscal data of school districts, post-secondary institutions and regional health authorities/societies (SUCH).
(2) The ratio of debt to population (e.g. 2012/13 debt divided by population at July 1, 2012).
(3) The ratio of debt outstanding at fiscal year end to provincial nominal gross domestic product (GDP) for the calendar year ending in the fiscal year (e.g. 2012/13 debt divided by 2012 nominal GDP).
(4) The ratio of interest costs (less sinking fund interest) to revenue. Figures include capitalized interest expense in order to provide a more comparable measure to outstanding debt.
(5) Weighted average of all outstanding debt issues.
(6) Includes revenue of the consolidated revenue fund (excluding dividends from enterprises) plus revenue of all government organizations and enterprises.
(7) Excludes revenue of government enterprises, but includes dividends from enterprises paid to the consolidated revenue fund.
(8) Excludes debt of commercial Crown corporations and agencies and funds held under the province’s warehouse borrowing program.
(9) Nominal GDP for the calendar year ending in the fiscal year (e.g. Nominal GDP for 2012 is used for the fiscal year ended March 31, 2013).
(10) Population at July 1st within the fiscal year (e.g. population at July 1, 2012 is used for the fiscal year ended March 31, 2013).
First Quarterly Report 2012/13
66
