Exhibit 99.8
Second Quarterly Report
Economic Outlook,
2012/13 Financial Update
&
Six Month Results
April — September 2012

National Library of Canada Cataloguing in Publication Data
British Columbia.
Budget and fiscal plan. — 2002/03/2004/05-
Annual.
Also available on the Internet.
Continues: British Columbia. Ministry of Finance and Corporate Relations. Budget ... reports. ISSN 1207-5841.
ISSN 1705-6071 = Budget and fiscal plan — British Columbia.
1. Budget — British Columbia — Periodicals. 2. British Columbia — Appropriations and expenditures — Periodicals.
I. British Columbia. Ministry of Finance. II. Title.
HJ12.B742 352.48’09711’05 C2003-960048-3
TABLE OF CONTENTS
2012/13 Second Quarterly Report | November 28, 2012 |
| |
Part One: Updated Financial Forecast | |
Introduction | 1 |
Revenue | 2 |
Expense | 4 |
Consolidated Revenue Fund spending | 4 |
Contingencies | 4 |
Spending recovered from third parties | 5 |
Operating transfers to service delivery agencies | 5 |
Service delivery agency spending | 5 |
Government employment (FTEs) | 5 |
Provincial capital spending | 6 |
Provincial debt | 7 |
Risks to the fiscal forecast | 8 |
Supplementary schedules | 8 |
Tables: | |
1.1 | 2012/13 Forecast Update | 1 |
1.2 | 2012/13 Notional Allocations to Contingencies | 4 |
1.3 | 2012/13 Capital Spending Update | 6 |
1.4 | 2012/13 Provincial Debt Update | 7 |
| |
Financial results for the six months Ended September 30, 2012, and 2012/13 full-year forecast | |
1.5 | Operating Statement | 8 |
1.6 | 2012/13 Forecast — Changes from Budget 2012 | 9 |
1.7 | Revenue by Source | 10 |
1.8 | Expense by Ministry, Program and Agency | 11 |
1.9 | Expense by Function | 12 |
1.10 | Material Assumptions — Revenue | 13 |
1.11 | Material Assumptions — Expense | 18 |
1.12 | Full-Time Equivalents | 20 |
1.13 | Capital Spending | 20 |
1.14 | Capital Spending Projects Greater Than $50 Million | 21 |
1.15 | Provincial Debt | 23 |
1.16 | Statement of Financial Position | 24 |
| | | |
Second Quarterly Report 2012/13
Table of Contents
Part Two: Economic Review and Outlook | |
Summary | 25 |
BC Outlook — Economic Forecast Council projections | 25 |
British Columbia economic activity | 26 |
Labour market | 26 |
Consumer spending and housing | 27 |
External trade and commodity markets | 28 |
Risks to the outlook | 29 |
External environment | 30 |
United States | 30 |
Canada | 32 |
Europe | 34 |
China | 35 |
Financial markets | 35 |
| |
Tables: | |
2.1 | British Columbia Economic Indicators | 26 |
2.2 | Private Sector Canadian Interest Rate Forecasts | 36 |
2.3 | Private Sector Exchange Rate Forecasts | 37 |
| |
Topic Box: | |
Provincial Economic Accounts Update | 38 |
Second Quarterly Report 2012/13
ii
PART ONE — UPDATED FINANCIAL FORECAST
2012/13 Second Quarterly Report | November 28, 2012 |
Introduction
Table 1.1 2012/13 Forecast Update
| | | | First | | Second | |
| | Budget | | Quarterly | | Quarterly | |
($ millions) | | 2012 | | Report | | Report | |
Revenue | | 43,101 | | 42,724 | | 42,522 | |
Expense | | (43,869 | ) | (43,956 | ) | (43,956 | ) |
Manage impact of natural gas royalty reductions | | — | | 241 | | 65 | |
Deficit before forecast allowance | | (768 | ) | (991 | ) | (1,369 | ) |
Forecast allowance | | (200 | ) | (150 | ) | (100 | ) |
Deficit | | (968 | ) | (1,141 | ) | (1,469 | ) |
Capital spending: | | | | | | | |
Taxpayer-supported capital spending | | 3,757 | | 3,715 | | 3,744 | |
Self-supported capital spending | | 3,346 | | 3,194 | | 3,207 | |
| | 7,103 | | 6,909 | | 6,951 | |
Provincial Debt: | | | | | | | |
Taxpayer-supported debt | | 38,736 | | 38,679 | | 38,474 | |
Self-supported debt | | 18,667 | | 17,907 | | 17,782 | |
Total debt (including forecast allowance) | | 57,603 | | 56,736 | | 56,356 | |
Taxpayer-supported debt-to-GDP ratio: | | | | | | | |
As previously forecast | | 17.6 | % | 17.4 | % | | |
Impact of Statistics Canada methodology change (1) | | -0.4 | % | -0.3 | % | | |
Restated and second quarter projections | | 17.2 | % | 17.1 | % | 17.0 | % |
| | 2012 | |
Economic Forecast: | | | | | | | |
Real GDP growth | | 1.8 | % | 2.0 | % | 2.0 | % |
Nominal GDP growth | | 3.7 | % | 3.9 | % | 3.9 | % |
(1) See Provincial Accounts topic box on page 38.
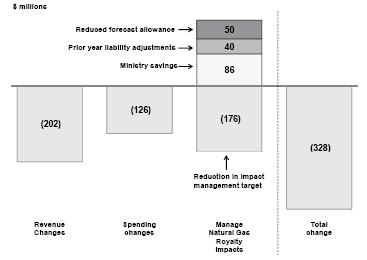
The second quarter fiscal outlook for 2012/13 projects a revised deficit of $1.5 billion. The $328 million deterioration since the first Quarterly Report is primarily due to the delay in the sale of the Little Mountain property.
Overall revenue is down $202 million. The impact of the Little Mountain sale delay plus lower income from property transfer tax, natural resources and commercial Crown corporations is partially offset by higher personal and corporate income tax revenue.
Chart 1.1 Operating changes from the first Quarterly Report
Second Quarterly Report 2012/13
Updated Financial Forecast
Expenditure management results, including ministry savings and prior year liability adjustments, were offset by higher tax credit transfers, additional spending associated with third party funding and other expense increases. As a result, projected overall government spending for 2012/13 is unchanged since the first Quarterly Report.
The $126 million in expenditure management savings plus a $50 million reduction in the forecast allowance enabled government to achieve $176 million of the $241 million needed to manage the impact of natural gas royalty reductions, leaving $65 million to be found in the remainder of the fiscal year.
Capital spending has increased slightly due to new project approvals and accelerations. Elsewhere in the capital plan, government has achieved $262 million in reduced spending against the capital plan adjustments identified in the first Quarterly Report, leaving $146 million remaining to be found.
Taxpayer-supported debt is down $205 million since the first Quarterly Report, reflecting lower borrowing for operating purposes. As a result the taxpayer-supported debt to GDP ratio is now 17.0 per cent — a 0.1 percentage point reduction from the previous forecast.
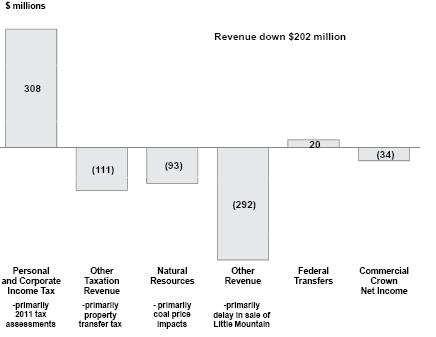
Revenue
The 2012/13 revised revenue forecast incorporates year-to-date results for the first six months, updated personal and corporate income tax assessment information from the federal government for 2011 and prior years, and revised forecasts from ministries, the federal government, service delivery agencies and commercial Crown corporations.
Chart 1.2 Main revenue changes from the first Quarterly Report
Second Quarterly Report 2012/13
2
Updated Financial Forecast
Revenue in 2012/13 is projected to be $42.5 billion — $202 million lower than the first Quarterly Report and $579 million below the Budget 2012 forecast. The changes from the first Quarterly Report reflect lower revenue from natural resources, miscellaneous sources and net income from Crown corporations, partly offset by higher revenue from taxation sources and federal government contributions.
Detailed revenue projections are disclosed in Table 1.7, and key assumptions and sensitivities relating to revenue are provided in Table 1.10. Major changes from the first Quarterly Report include:
· Personal income tax revenue is up $283 million including a $151 million prior-year adjustment due to higher 2011 tax assessment reports. Higher 2011 tax assessments result in an improved 2012/13 tax base, increasing the forecast by a further $132 million.
· Corporate income tax revenue is up $25 million mainly due to stronger 2011 tax assessment results.
· Property tax revenue is down $13 million mainly reflecting lower 2012 property assessment results.
· Property transfer tax is down $95 million reflecting the weak housing market in the second quarter. Year to date results indicate annual declines in the average property sale price and the number of transactions.
· Revenue from coal, metals and minerals is down $93 million mainly due to rising mining costs and weaker coal sales reflecting lower coal prices and shipments.
· Forests revenue is up $3 million as higher recoveries and stumpage revenue resulting from improved interior stumpage rates and Crown harvest volumes, are partly offset by reduced border taxes collected under the Softwood Lumber Agreement 2006 and the effects of a higher Canadian dollar.
· Other revenue, comprised of revenue from fees, licenses, investment earnings and other miscellaneous sources, is down $292 million mainly due to the delay in the completion date of the sale of the Little Mountain property.
· Total federal government contributions are expected to be up $20 million mainly due to higher direct transfers to taxpayer supported Crown corporations and the SUCH sector.
· The outlook for commercial Crown corporation net income is $34 million lower than the first Quarterly Report and $90 million lower than budget. The changes from the first Quarterly Report mainly reflect a lower allowed return on deemed equity for BC Hydro (the corporation’s allowed return is based on the pre-tax return of the closest comparative utility regulated by the BC Utilities Commission), higher claims costs incurred by ICBC, and lower gains from the sale of BC Rail assets.
Second Quarterly Report 2012/13
3
Updated Financial Forecast
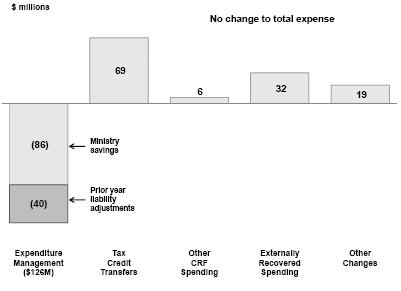
Expense
There is no change to overall projected government spending in 2012/13 compared to the forecast in the first Quarterly Report, as savings from government’s expenditure management initiative were offset by spending increases in other areas.
Chart 1.3 Main expense changes from the first Quarterly Report
Consolidated Revenue Fund spending
Government’s expenditure management initiative has yielded $86 million in projected ministry savings. As well, a review of accrued liabilities resulted in a $40 million positive adjustment, mainly due to reduction in insurance liabilities in the Insurance and Risk Management Account.
Tax credit transfers were up $69 million as a consequence of the improvement in 2011 personal income tax assessments. Other CRF spending changes reflect higher emergency program flood-related and direct fire costs, partially offset by a reduction in debt servicing costs.
Contingencies
The notional allocations to the Contingencies vote are unchanged from the first Quarterly Report.
Table 1.2 2012/13 Notional Allocations to Contingencies
| | | | | | | | Q2 | |
| | | | First | | Second | | change | |
| | Budget | | Quarterly | | Quarterly | | from | |
($ millions) | | 2012 | | Report | | Report | | budget | |
2010 Sports and Arts Legacy | | 20 | | 20 | | 20 | | — | |
Climate Action and clean energy initiatives | | 40 | | 40 | | 40 | | — | |
Community Living BC anticipated caseload increases | | 12 | | 12 | | 12 | | — | |
Elections BC event-related funding | | 36 | | 15 | | 15 | | (21 | ) |
Subtotal notional allocations | | 108 | | 87 | | 87 | | (21 | ) |
Reserved for unforeseen pressures related to litigation, caseload, natural disasters, and other contingent items | | 192 | | 213 | | 213 | | 21 | |
Total contingencies | | 300 | | 300 | | 300 | | — | |
Second Quarterly Report 2012/13
4
Updated Financial Forecast
Government continues to face a variety of pressures over the three years of the plan which ministries and agencies will work to manage within existing budgets, with additional funding provided from the Contingencies vote as necessary.
Spending recovered from third parties
Spending funded by recoveries from third parties is projected to increase by $32 million in 2012/13 compared to the first Quarterly Report. The changes reflect:
· increased healthcare related cost recoveries (up $22 million), mainly associated with the medical service plan premiums collections;
· increased spending of gaming proceeds from the BC Lottery Corporation (up $6 million); and
· increased general government recoveries, including direct fire fighting (up $4 million).
The above spending changes are offset by an equal increase in revenue, and as a result have no net impact on the fiscal forecast.
Operating transfers to service delivery agencies
Operating transfers to service delivery agencies are forecasted to be $11 million higher in 2012/13 compared to the first Quarterly Report.
Service delivery agency spending
Service delivery agency spending is forecast to increase by $30 million in 2012/13 compared to the first Quarterly Report.
· School district spending is forecast to be $4 million higher due to an upward adjustment to estimated salary and benefit costs.
· Post secondary institution spending projections are unchanged from the first Quarterly Report.
· Health authority and hospital society spending is forecast to be up $24 million in 2012/13, reflecting the projected volume increases in the healthcare services delivered by these organizations on behalf of government. This spending increase is projected to be funded by additional provincial grants and own-source revenue.
· Other service delivery agency spending is projected to increase by $2 million in 2012/13 reflecting mostly higher spending on low income housing.
Detailed expense projections are disclosed in Table 1.8. Key spending assumptions and sensitivities are provided in Table 1.11.
Government employment (FTEs)
The projection of government employment for 2012/13 is unchanged from the first Quarterly Report. Further details on FTEs are provided in Appendix Table 1.12.
Second Quarterly Report 2012/13
5
Updated Financial Forecast
Provincial capital spending
Total capital spending is projected to be $7.0 billion in 2012/13 — $42 million higher than the first Quarterly Report but $152 million lower than budget.
Table 1.3 2012/13 Capital Spending Update
| | ($ millions) | |
2012/13 capital spending — Budget 2012 Fiscal Plan (February 21, 2012) | | 7,103 | | | | 7,103 | |
2012/13 capital spending — first Quarterly Report (September 13, 2012) | | | | 6,909 | | | |
| | Q1 | | Q2 | | Total | |
| | Update | | Update | | Changes | |
Taxpayer-supported changes: | | | | | | | |
Project approvals since Budget 2012 | | 91 | | 22 | | 113 | |
Additional externally funded capital spending by post-secondary institutions | | 53 | | 7 | | 60 | |
Project scheduling changes | | 222 | | (262 | ) | (40 | ) |
Capital planning adjustments | | (408 | ) | 262 | | (146 | ) |
Total taxpayer-supported | | (42 | ) | 29 | | (13 | ) |
Self-supported changes: | | | | | | | |
BC Hydro — mainly scheduling shift on Dawson Creek/Chetwynd and Northwest transmission line projects | | (165 | ) | — | | (165 | ) |
Transportation Investment Corp. — timing of capital spending for Port Mann Bridge/Highway 1 | | 20 | | 15 | | 35 | |
Other | | (7 | ) | (2 | ) | (9 | ) |
Total self-supported | | (152 | ) | 13 | | (139 | ) |
Total changes | | (194 | ) | 42 | | (152 | ) |
2012/13 capital spending — first Quarterly Report | | 6,909 | | | | | |
2012/13 capital spending — second Quarterly Report | | | | 6,951 | | 6,951 | |
Taxpayer-supported capital spending is projected to be $3.7 billion — $29 million higher than the first Quarterly Report. The changes include additional allocations for school district and health facility maintenance programs, additional investments in highway rehabilitation programs, and higher than expected spending on self-funded university projects.
The updated forecast also reflects $262 million in project scheduling changes to meet government’s capital planning adjustment target of $408 million, leaving $146 million to be realized over the remainder of the fiscal year.
Self-supported capital spending is projected to be $3.2 billion — $13 million higher than the first Quarterly Report but $139 million lower than budget. The changes from the first Quarterly Report mainly reflects the timing of capital spending on the Port Mann Bridge/Highway 1 project.
Details on capital spending are shown in Table 1.13, and capital spending projects with provincial contributions greater than $50 million are presented in Table 1.14.
Second Quarterly Report 2012/13
6
Updated Financial Forecast
Provincial debt
The provincial debt, including a $100 million forecast allowance, is projected to total $56.4 billion at March 31, 2013 — $380 million lower than the projection in the first Quarterly Report.
Table 1.4 2012/13 Provincial Debt Update
| | ($ millions) | |
2012/13 provincial debt — Budget 2012 Fiscal Plan (February 21, 2012) | | 57,603 | | | | 57,603 | |
2012/13 provincial debt — first Quarterly Report (September 13, 2012) | | | | 56,736 | | | |
| | Q1 | | Q2 | | Total | |
| | Update | | Update | | Changes | |
Taxpayer-supported changes: | | | | | | | |
Government operating: | | | | | | | |
– bonus bid cash proceeds | | 233 | | (9 | ) | 224 | |
– other CRF operating results | | (44 | ) | (196 | ) | (240 | ) |
Total operating debt changes | | 189 | | (205 | ) | (16 | ) |
Capital debt: | | | | | | | |
– lower spending in 2011/12 | | (217 | ) | — | | (217 | ) |
– other capital spending impacts | | 235 | | (171 | ) | 64 | |
– reduced provincial financing from capital planning adjustments | | (264 | ) | 171 | | (93 | ) |
Total capital debt changes | | (246 | ) | — | | (246 | ) |
Total taxpayer-supported | | (57 | ) | (205 | ) | (262 | ) |
Self-supported changes: | | | | | | | |
BC Hydro – mainly impact of working capital and lower capital spending projections | | (663 | ) | (196 | ) | (859 | ) |
Transportation Investment Corporation – impact of working capital changes | | (77 | ) | 18 | | (59 | ) |
Other changes | | (20 | ) | 53 | | 33 | |
Total self-supported | | (760 | ) | (125 | ) | (885 | ) |
Forecast allowance changes: | | | | | | | |
Adjustment to forecast allowance | | (50 | ) | (50 | ) | (100 | ) |
Total changes | | (867 | ) | (380 | ) | (1,247 | ) |
2012/13 provincial debt – first Quarterly Report | | 56,736 | | | | | |
2012/13 provincial debt – second Quarterly Report | | | | 56,356 | | 56,356 | |
Taxpayer-supported debt is projected at $38.5 billion — a $205 million decrease compared to the first Quarterly Report projection. The reduction is mainly due to an improved CRF cash position (related to bonus bid proceeds) and lower working capital requirements. The taxpayer-supported debt to GDP ratio forecast is projected to be 17.0 per cent — a 0.1 percentage point improvement from the first Quarterly Report.
The projected self-supported debt balance of $17.8 billion at March 31, 2013 is $125 million lower than the projection in the first Quarterly Report. Increased funding from internal sources has lowered financing requirements for capital infrastructure investments.
Total provincial debt includes a $100 million borrowing allowance to mirror the operating statement forecast allowance. This allowance is down $50 million from the first Quarterly Report as the risks to the forecast will have a reduced impact midway through the fiscal year.
Details on provincial debt are shown in Table 1.15.
Second Quarterly Report 2012/13
7
Updated Financial Forecast
Risks to the fiscal forecast
There are a number of risks and pressures to the fiscal plan, including slower than expected economic growth in our trading partners resulting in lower demand for BC’s exports, and continuing instability in financial markets brought about by the European sovereign debt crisis.
Revenues in British Columbia can be volatile, largely due to the influence of the cyclical nature of the natural resource sector in the economy. Changes in energy or commodity prices, such as natural gas and lumber, may have a significant effect on revenue and the fiscal forecast.
The spending forecast contained in the fiscal plan is based on ministry and service delivery agency plans and strategies. Changes to planning assumptions, such as utilization or demand rates for government services in the health care, education, or community social services sectors, represent the main spending risks.
These risks are covered by the $300 million Contingencies vote and the $100 million forecast allowance.
Supplementary schedules
The following tables provide the financial results for the six months ended September 30, 2012, and the 2012/13 full-year forecast.
Table 1.5 2012/13 Operating Statement
| | Year-to-Date to September 30 | | Full Year | |
| | 2012/13 | | Actual | | 2012/13 | | Actual | |
($ millions) | | Budget | | Actual | | Variance | | 2011/12 | | Budget | | Forecast | | Variance | | 2011/12 | |
Revenue | | 20,680 | | 20,959 | | 279 | | 20,591 | | 43,101 | | 42,522 | | (579 | ) | 41,967 | |
Expense | | (20,896 | ) | (20,311 | ) | 585 | | (21,406 | ) | (43,869 | ) | (43,956 | ) | (87 | ) | (43,807 | ) |
Manage impacts of natural gas royalty reductions | | — | | — | | — | | — | | — | | 65 | | 65 | | — | |
Surplus (deficit) before forecast allowance | | (216 | ) | 648 | | 864 | | (815 | ) | (768 | ) | (1,369 | ) | (601 | ) | (1,840 | ) |
Forecast allowance | | — | | — | | — | | — | | (200 | ) | (100 | ) | 100 | | — | |
Surplus (deficit) | | (216 | ) | 648 | | 864 | | (815 | ) | (968 | ) | (1,469 | ) | (501 | ) | (1,840 | ) |
Accumulated surplus beginning of the year | | 2,016 | | 2,476 | | 460 | | 4,293 | | 2,016 | | 2,434 | | 418 | | 4,274 | |
Accumulated surplus before comprehensive income | | 1,800 | | 3,124 | | 1,324 | | 3,478 | | 1,048 | | 965 | | (83 | ) | 2,434 | |
Accumulated other comprehensive income from self-supported Crown agencies | | 26 | | (29 | ) | (55 | ) | (61 | ) | 52 | | 153 | | 101 | | 23 | |
Accumulated surplus end of period | | 1,826 | | 3,095 | | 1,269 | | 3,417 | | 1,100 | | 1,118 | | 18 | | 2,457 | |
Second Quarterly Report 2012/13
8
Updated Financial Forecast
Table 1.6 2012/13 Forecast — Changes from Budget 2012
| | ($ millions) | |
2012/13 deficit — Budget 2012 Fiscal Plan (February 21, 2012) | | (968 | ) | | | (968 | ) |
2012/13 deficit — first Quarterly Report (September 13, 2012) | | | | (1,141 | ) | | |
| | Q1 | | Q2 | | Total | |
| | Update | | Update | | Changes | |
Revenue changes: | | | | | | | |
Personal income tax – mainly higher 2011 tax assessments | | (16 | ) | 283 | | 267 | |
Corporate income tax – increased federal government installments and higher 2011 tax assessments | | 20 | | 25 | | 45 | |
Property transfer tax – weaker year-to-date results | | — | | (95 | ) | (95 | ) |
Tobacco tax – weaker year-to-date results | | (10 | ) | — | | (10 | ) |
Other tax sources – mainly property and fuel taxes | | (9 | ) | (16 | ) | (25 | ) |
Natural gas royalties – reduced prices and volumes partly offset by savings from lower utilization of royatly and infrastructure programs | | (241 | ) | — | | (241 | ) |
Columbia River Treaty electricity sales – changes in electricity prices | | (33 | ) | 4 | | (29 | ) |
Coal, metals and minerals – mainly higher mining costs and lower prices | | (51 | ) | (93 | ) | (144 | ) |
Forests – mainly changes in stumpage revenue, border tax collections and recoveries | | 10 | | 3 | | 13 | |
Other natural resources – mainly lower Crown land tenures reflecting reduced average bid price and auctioned land base | | (18 | ) | (7 | ) | (25 | ) |
Fees, licenses, investment earnings and miscellaneous sources — mainly due to the delay in the completion date of the sale of the Little Mountain property | | 36 | | (292 | ) | (256 | ) |
Health and social transfers – changes in population share and lower national tax points reflecting lower national personal income tax base | | (65 | ) | (1 | ) | (66 | ) |
Other federal government transfers – mainly higher recoveries and SUCH sector income | | 56 | | 21 | | 77 | |
Commercial Crown agencies operating results: | | | | | | | |
BC Hydro – lower allowed return on deemed equity set by the BC Utilities Commission | | (46 | ) | (8 | ) | (54 | ) |
ICBC – mainly higher claims costs partially offset by higher revenue from premiums and investments | | 14 | | (19 | ) | (5 | ) |
Transportation Investment Corporation – mainly revised tolling framework for the Port Mann Bridge | | (24 | ) | — | | (24 | ) |
Other commercial Crown agencies changes | | — | | (7 | ) | (7 | ) |
Total revenue changes | | (377 | ) | (202 | ) | (579 | ) |
Less: expense increases (decreases): | | | | | | | |
Consolidated Revenue Fund changes: | | | | | | | |
Emergency program flood related costs | | 44 | | (1 | ) | 43 | |
Direct forest fire related costs | | 62 | | 13 | | 75 | |
Ministry savings due to expenditure management | | — | | (86 | ) | (86 | ) |
Prior year liability adjustments | | — | | (40 | ) | (40 | ) |
Management of public debt (net) – reflects lower interest rates and revisions to scheduled borrowing | | (69 | ) | (6 | ) | (75 | ) |
Tax credit transfers changes | | (34 | ) | 69 | | 35 | |
Spending funded by third party recoveries | | 117 | | 32 | | 149 | |
(Increase) decrease in operating transfers to service delivery agencies | | (215 | ) | (11 | ) | (226 | ) |
Changes in spending profile of service delivery agencies: | | | | | | | |
School districts – higher salaries and benefits costs | | 26 | | 4 | | 30 | |
Universities – lower salaries and benefits costs | | 2 | | (9 | ) | (7 | ) |
Colleges – spending related to higher student enrolment | | 14 | | 9 | | 23 | |
Health authorities and hospital societies – increasing demand for healthcare services | | 93 | | 24 | | 117 | |
Other service delivery agencies | | 47 | | 2 | | 49 | |
Total expense increases (decreases) | | 87 | | — | | 87 | |
Subtotal | | (464 | ) | (202 | ) | (666 | ) |
Manage impact of natural gas royalty reductions | | 241 | | (176 | ) | 65 | |
Reduction in forecast allowance | | 50 | | 50 | | 100 | |
Total changes | | (173 | ) | (328 | ) | (501 | ) |
2012/13 deficit – first Quarterly Report | | (1,141 | ) | | | | |
2012/13 deficit – second Quarterly Report | | | | (1,469 | ) | (1,469 | ) |
Second Quarterly Report 2012/13
9
Updated Financial Forecast
Table 1.7 2012/13 Revenue by Source
| | Year-to-Date to September 30 | | Full Year | |
| | 2012/13 | | Actual | | 2012/13 | | Actual | |
($ millions) | | Budget | | Actual | | Variance | | 2011/12 | | Budget | | Forecast | | Variance | | 2011/12 | |
Taxation | | | | | | | | | | | | | | | | | |
Personal income | | 3,255 | | 3,251 | | (4 | ) | 3,123 | | 6,630 | | 6,897 | | 267 | | 6,427 | |
Corporate income | | 976 | | 1,614 | | 638 | | 992 | | 2,266 | | 2,311 | | 45 | | 2,022 | |
Harmonized sales | | 3,021 | | 3,007 | | (14 | ) | 2,886 | | 6,003 | | 6,003 | | — | | 5,779 | |
Other sales (1) | | 49 | | 73 | | 24 | | 91 | | 98 | | 101 | | 3 | | 150 | |
Fuel | | 469 | | 475 | | 6 | | 475 | | 937 | | 929 | | (8 | ) | 928 | |
Carbon | | 501 | | 506 | | 5 | | 419 | | 1,172 | | 1,180 | | 8 | | 959 | |
Tobacco | | 347 | | 329 | | (18 | ) | 336 | | 652 | | 642 | | (10 | ) | 637 | |
Property | | 998 | | 987 | | (11 | ) | 941 | | 2,013 | | 1,985 | | (28 | ) | 1,913 | |
Property transfer | | 512 | | 467 | | (45 | ) | 562 | | 893 | | 798 | | (95 | ) | 944 | |
Other (2) | | 217 | | 221 | | 4 | | 204 | | 424 | | 424 | | — | | 406 | |
| | 10,345 | | 10,930 | | 585 | | 10,029 | | 21,088 | | 21,270 | | 182 | | 20,165 | |
Natural resources | | | | | | | | | | | | | | | | | |
Natural gas royalties | | 187 | | 45 | | (142 | ) | 196 | | 398 | | 157 | | (241 | ) | 339 | |
Forests | | 221 | | 234 | | 13 | | 196 | | 533 | | 546 | | 13 | | 482 | |
Other natural resource (3) | | 1,000 | | 931 | | (69 | ) | 997 | | 2,055 | | 1,857 | | (198 | ) | 1,991 | |
| | 1,408 | | 1,210 | | (198 | ) | 1,389 | | 2,986 | | 2,560 | | (426 | ) | 2,812 | |
Other revenue | | | | | | | | | | | | | | | | | |
Medical Services Plan premiums | | 1,012 | | 1,015 | | 3 | | 951 | | 2,047 | | 2,042 | | (5 | ) | 1,919 | |
Other fees (4) | | 1,288 | | 1,266 | | (22 | ) | 1,271 | | 2,876 | | 2,891 | | 15 | | 2,809 | |
Investment earnings | | 599 | | 519 | | (80 | ) | 585 | | 1,083 | | 1,069 | | (14 | ) | 1,042 | |
Miscellaneous (5) | | 1,301 | | 1,337 | | 36 | | 1,267 | | 3,047 | | 2,795 | | (252 | ) | 2,833 | |
| | 4,200 | | 4,137 | | (63 | ) | 4,074 | | 9,053 | | 8,797 | | (256 | ) | 8,603 | |
Contributions from the federal government | | | | | | | | | | | | | | | | | |
Health and social transfers | | 2,841 | | 2,825 | | (16 | ) | 2,699 | | 5,682 | | 5,616 | | (66 | ) | 5,384 | |
Harmonized sales tax transition payment | | — | | — | | — | | 580 | | — | | — | | — | | 580 | |
Other federal contributions (6) | | 690 | | 658 | | (32 | ) | 693 | | 1,575 | | 1,652 | | 77 | | 1,743 | |
| | 3,531 | | 3,483 | | (48 | ) | 3,972 | | 7,257 | | 7,268 | | 11 | | 7,707 | |
Commercial Crown corporation net income | | | | | | | | | | | | | | | | | |
BC Hydro | | 101 | | 128 | | 27 | | 155 | | 566 | | 512 | | (54 | ) | 558 | |
Liquor Distribution Branch | | 479 | | 486 | | 7 | | 475 | | 906 | | 906 | | — | | 909 | |
BC Lotteries (net of payments to the federal government) | | 556 | | 561 | | 5 | | 547 | | 1,115 | | 1,115 | | — | | 1,099 | |
ICBC | | 63 | | 24 | | (39 | ) | (57 | ) | 146 | | 141 | | (5 | ) | 102 | |
Transportation Investment Corporation (Port Mann) | | (19 | ) | (15 | ) | 4 | | (4 | ) | (48 | ) | (72 | ) | (24 | ) | (17 | ) |
Other | | 16 | | 15 | | (1 | ) | 11 | | 32 | | 25 | | (7 | ) | 29 | |
| | 1,196 | | 1,199 | | 3 | | 1,127 | | 2,717 | | 2,627 | | (90 | ) | 2,680 | |
Total revenue | | 20,680 | | 20,959 | | 279 | | 20,591 | | 43,101 | | 42,522 | | (579 | ) | 41,967 | |
(1) Includes social service tax, continuation of the tax on designated property and hotel room tax.
(2) Corporation capital and insurance premium taxes.
(3) Columbia River Treaty, other energy and minerals, water rental and other resources.
(4) Post-secondary, healthcare-related, motor vehicle, and other fees.
(5) Includes asset dispositions, reimbursements for health care and other services provided to external agencies, and other recoveries.
(6) Includes contributions for health, education, community development, housing and social service programs, and transportation projects.
Second Quarterly Report 2012/13
10
Updated Financial Forecast
Table 1.8 2012/13 Expense by Ministry, Program and Agency (1)
| | Year-to-Date to September 30 | | Full Year | |
| | 2012/13 | | Actual | | 2012/13 | | Actual | |
($ millions) | | Budget | | Actual | | Variance | | 2011/12 (2) | | Budget | | Forecast | | Variance | | 2011/12 (2) | |
Office of the Premier | | 4 | | 4 | | — | | 5 | | 9 | | 9 | | — | | 9 | |
Aboriginal Relations and Reconciliation | | 40 | | 36 | | (4 | ) | 40 | | 80 | | 80 | | — | | 92 | |
Advanced Education, Innovation and Technology | | 964 | | 955 | | (9 | ) | 961 | | 1,981 | | 1,981 | | — | | 1,977 | |
Agriculture | | 40 | | 42 | | 2 | | 43 | | 66 | | 66 | | — | | 74 | |
Children and Family Development | | 656 | | 644 | | (12 | ) | 652 | | 1,333 | | 1,331 | | (2 | ) | 1,332 | |
Citizens’ Services and Open Government | | 276 | | 243 | | (33 | ) | 266 | | 533 | | 532 | | (1 | ) | 562 | |
Community, Sport and Cultural Development | | 202 | | 184 | | (18 | ) | 182 | | 311 | | 311 | | — | | 404 | |
Education | | 2,723 | | 2,681 | | (42 | ) | 2,694 | | 5,315 | | 5,315 | | — | | 5,264 | |
Energy, Mines and Natural Gas | | 219 | | 250 | | 31 | | 205 | | 449 | | 449 | | — | | 453 | |
Environment | | 59 | | 60 | | 1 | | 60 | | 129 | | 128 | | (1 | ) | 143 | |
Finance | | 97 | | 73 | | (24 | ) | 53 | | 173 | | 172 | | (1 | ) | 189 | |
Forests, Lands and Natural Resource Operations | | 304 | | 326 | | 22 | | 289 | | 602 | | 671 | | 69 | | 562 | |
Health | | 7,971 | | 7,835 | | (136 | ) | 7,555 | | 16,180 | | 16,115 | | (65 | ) | 15,567 | |
Jobs, Tourism and Skills Training | | 109 | | 122 | | 13 | | 91 | | 232 | | 230 | | (2 | ) | 261 | |
Justice | | 552 | | 553 | | 1 | | 536 | | 1,110 | | 1,149 | | 39 | | 1,174 | |
Social Development | | 1,218 | | 1,190 | | (28 | ) | 1,207 | | 2,457 | | 2,456 | | (1 | ) | 2,427 | |
Transportation and Infrastructure | | 400 | | 398 | | (2 | ) | 371 | | 807 | | 804 | | (3 | ) | 807 | |
Total ministries and Office of the Premier | | 15,834 | | 15,596 | | (238 | ) | 15,210 | | 31,767 | | 31,799 | | 32 | | 31,297 | |
Management of public funds and debt | | 645 | | 594 | | (51 | ) | 632 | | 1,287 | | 1,212 | | (75 | ) | 1,238 | |
Contingencies | | 150 | | 2 | | (148 | ) | — | | 300 | | 300 | | — | | 22 | |
Funding for capital expenditures | | 340 | | 299 | | (41 | ) | 497 | | 1,062 | | 1,070 | | 8 | | 1,182 | |
Refundable tax credit transfers | | 527 | | 527 | | — | | 436 | | 1,091 | | 1,126 | | 35 | | 969 | |
Legislative and other appropriations | | 62 | | 54 | | (8 | ) | 62 | | 124 | | 124 | | — | | 132 | |
Subtotal | | 17,558 | | 17,072 | | (486 | ) | 16,837 | | 35,631 | | 35,631 | | — | | 34,840 | |
Liability for reimbursement of HST transition funding | | — | | — | | — | | 1,599 | | — | | — | | — | | 1,599 | |
Prior year liability adjustments | | — | | — | | — | | — | | — | | (40 | ) | (40 | ) | (99 | ) |
Consolidated revenue fund expense | | 17,558 | | 17,072 | | (486 | ) | 18,436 | | 35,631 | | 35,591 | | (40 | ) | 36,340 | |
Expenses recovered from external entities | | 1,256 | | 1,231 | | (25 | ) | 1,225 | | 2,756 | | 2,905 | | 149 | | 2,689 | |
Funding provided to service delivery agencies | | (10,424 | ) | (10,484 | ) | (60 | ) | (10,460 | ) | (21,127 | ) | (21,361 | ) | (234 | ) | (21,199 | ) |
Total direct program spending | | 8,389 | | 7,819 | | (570 | ) | 9,201 | | 17,260 | | 17,135 | | (125 | ) | 17,830 | |
Service delivery agency expense | | | | | | | | | | | | | | | | | |
School districts | | 2,457 | | 2,428 | | (29 | ) | 2,427 | | 5,569 | | 5,599 | | 30 | | 5,500 | |
Universities | | 1,963 | | 1,881 | | (82 | ) | 1,845 | | 4,050 | | 4,043 | | (7 | ) | 3,807 | |
Colleges and institutes | | 516 | | 519 | | 3 | | 516 | | 1,095 | | 1,118 | | 23 | | 1,095 | |
Health authorities and hospital societies | | 5,961 | | 6,042 | | 81 | | 5,810 | | 12,431 | | 12,548 | | 117 | | 12,116 | |
Other service delivery agencies | | 1,609 | | 1,622 | | 13 | | 1,607 | | 3,464 | | 3,513 | | 49 | | 3,459 | |
| | 12,507 | | 12,492 | | (15 | ) | 12,205 | | 26,609 | | 26,821 | | 212 | | 25,977 | |
Total expense | | 20,896 | | 20,311 | | (585 | ) | 21,406 | | 43,869 | | 43,956 | | 87 | | 43,807 | |
(1) Reflects government’s organization that was in effect at September 30, 2012.
(2) Restated to reflect government’s current accounting policies.
Second Quarterly Report 2012/13
11
Updated Financial Forecast
Table 1.9 2012/13 Expense By Function
| | Year-to-Date to September 30 | | Full Year | |
| | 2012/13 | | Actual | | 2012/13 | | Actual | |
($ millions) | | Budget | | Actual | | Variance | | 2011/12 (1) | | Budget | | Forecast | | Variance | | 2011/12 (1) | |
Health: | | | | | | | | | | | | | | | | | |
Medical Services Plan | | 1,991 | | 1,970 | | (21 | ) | 1,930 | | 4,162 | | 4,181 | | 19 | | 4,004 | |
Pharmacare | | 592 | | 570 | | (22 | ) | 571 | | 1,210 | | 1,162 | | (48 | ) | 1,147 | |
Regional services | | 5,740 | | 5,635 | | (105 | ) | 5,434 | | 11,840 | | 11,839 | | (1 | ) | 11,255 | |
Other healthcare expenses (2) | | 344 | | 341 | | (3 | ) | 304 | | 758 | | 799 | | 41 | | 642 | |
| | 8,667 | | 8,516 | | (151 | ) | 8,239 | | 17,970 | | 17,981 | | 11 | | 17,048 | |
Education: | | | | | | | | | | | | | | | | | |
Elementary and secondary | | 2,560 | | 2,538 | | (22 | ) | 2,530 | | 5,973 | | 5,983 | | 10 | | 5,885 | |
Post-secondary | | 2,437 | | 2,372 | | (65 | ) | 2,303 | | 5,204 | | 5,239 | | 35 | | 4,917 | |
Other education expenses (3) | | 281 | | 174 | | (107 | ) | 225 | | 584 | | 574 | | (10 | ) | 436 | |
| | 5,278 | | 5,084 | | (194 | ) | 5,058 | | 11,761 | | 11,796 | | 35 | | 11,238 | |
Social services: | | | | | | | | | | | | | | | | | |
Social assistance (2),(3) | | 877 | | 774 | | (103 | ) | 880 | | 1,545 | | 1,563 | | 18 | | 1,550 | |
Child welfare (2) | | 522 | | 534 | | 12 | | 548 | | 1,060 | | 1,062 | | 2 | | 1,112 | |
Low income tax credit transfers | | 239 | | 255 | | 16 | | 233 | | 523 | | 533 | | 10 | | 509 | |
Community living and other services | | 315 | | 373 | | 58 | | 255 | | 800 | | 785 | | (15 | ) | 769 | |
| | 1,953 | | 1,936 | | (17 | ) | 1,916 | | 3,928 | | 3,943 | | 15 | | 3,940 | |
Protection of persons and property | | 619 | | 686 | | 67 | | 678 | | 1,380 | | 1,425 | | 45 | | 1,512 | |
Transportation | | 773 | | 763 | | (10 | ) | 721 | | 1,655 | | 1,663 | | 8 | | 1,544 | |
Natural resources and economic development | | 877 | | 893 | | 16 | | 921 | | 1,792 | | 1,891 | | 99 | | 1,881 | |
Other | | 633 | | 663 | | 30 | | 649 | | 1,360 | | 1,355 | | (5 | ) | 1,394 | |
Contingencies | | 150 | | 2 | | (148 | ) | — | | 300 | | 300 | | — | | 22 | |
General government | | 716 | | 589 | | (127 | ) | 2,050 | | 1,207 | | 1,173 | | (34 | ) | 2,845 | |
Debt servicing | | 1,230 | | 1,179 | | (51 | ) | 1,174 | | 2,516 | | 2,429 | | (87 | ) | 2,383 | |
Total expense | | 20,896 | | 20,311 | | (585 | ) | 21,406 | | 43,869 | | 43,956 | | 87 | | 43,807 | |
(1) Restated to reflect government’s current organization and accounting policies.
(2) Payments for healthcare services by the Ministry of Social Development and the Ministry of Children and Family Development made on behalf of their clients are reported in the Health function.
(3) Payments for training costs by the Ministry of Social Development made on behalf of its clients are reported in the Education function.
Second Quarterly Report 2012/13
12
Updated Financial Forecast
Table 1.10 2012/13 Material Assumptions – Revenue
| | | | 1st | | 2nd | | | |
Revenue Source and Assumptions | | Budget | | Quarter | | Quarter | | | |
($ millions unless otherwise specified) | | 2012 | | Forecast | | Forecast | | 2012/13 Sensitivities | |
Personal income tax | | $ | 6,630 | | $ | 6,614 | | $ | 6,897 | | | |
Current calendar year assumptions | | | | | | | | | |
Personal income growth | | 3.7 | % | 3.5 | % | 3.5 | % | +/- 1% change in 2012 BC personal income growth equals +/- $50 to $100 million | |
Labour income growth | | 3.6 | % | 3.2 | % | 3.2 | % | |
Tax base growth | | 3.7 | % | 3.5 | % | 3.5 | % | |
Average tax yield | | 4.88 | % | 4.88 | % | 4.92 | % | |
Current-year tax | | $ | 6,273 | | $ | 6,264 | | $ | 6,418 | | +/- 1% change in 2011 BC personal or taxable income growth equals +/- $50 to $100 million one-time effect (prior-year adjustment) and could result in an additional +/-$55 to $75 million base change in 2012/13 | |
BC Tax Reduction | | $ | -111 | | $ | -111 | | $ | -107 | | |
Non-Refundable BC tax credits | | $ | -47 | | $ | -47 | | $ | -48 | | |
Policy neutral elasticity * | | 1.2 | | 1.2 | | 1.2 | | |
Fiscal year assumptions | | | | | | | | |
Prior-year adjustment | | | | | | $ | 151 | | |
| | | | | | | | | |
| | 2011 Assumptions | | | |
2011 Tax-year | | | | | | | | | |
Personal income growth | | 3.7 | % | 4.1 | % | 4.1 | % | | |
Tax base growth | | 3.0 | % | 3.0 | % | 4.7 | % | | |
Average 2011 tax yield | | 4.84 | % | 4.84 | % | 4.88 | % | | |
2011 tax | | $ | 6,006 | | $ | 6,006 | | $ | 6,155 | | | |
BC Tax Reduction | | $ | -109 | | $ | -109 | | $ | -105 | | | |
Non-Refundable BC tax credits | | $ | -43 | | $ | -43 | | $ | -51 | | | |
Policy neutral elasticity * | | 1.0 | | 0.9 | | 1.5 | | | |
* Ratio of annual per cent change in current-year revenue to annual per cent change in personal income (calendar year).
Corporate income tax | | $ | 2,266 | | $ | 2,286 | | $ | 2,311 | | | |
Components of revenue (fiscal year) | | | | | | | | | |
Advance instalments | | $ | 2,305 | | $ | 2,325 | | $ | 2,339 | | | |
International Business Activity Act refunds | | $ | -20 | | $ | -20 | | $ | -20 | | | |
Prior-year adjustment | | $ | -19 | | $ | -19 | | $ | -8 | | | |
Current calendar year assumptions | | | | | | | | | |
National tax base ($ billions) | | $ | 245.9 | | $ | 249.1 | | $ | 248.8 | | +/ - 1% change in the 2012 national tax base equals +/- $20 to $30 million | |
BC instalment share of national tax base | | 11.8 | % | 11.8 | % | 11.8 | % | |
Effective tax rates (general/small business) | | 10.0 / 2.5 | | 10.0 / 2.5 | | 10.0 / 2.5 | | |
BC tax base growth (post federal measures) | | 4.8 | % | 4.5 | % | 4.5 | % | | |
BC corporate profits growth | | 3.5 | % | 4.4 | % | 4.4 | % | +/ - 1% change in the 2011 BC tax base equals +/- $20 to $30 million in 2012/13 | |
Non-Refundable BC tax credits | | $ | -76 | | $ | -76 | | $ | -77 | | |
| | | | | | | | |
| | | | | | | | | |
| | 2011 Assumptions | | | |
2011 Tax-year | | | | | | | | | |
BC tax base growth | | 10.5 | % | 10.7 | % | 12.1 | % | | |
BC corporate profits growth | | 10.6 | % | 13.4 | % | 13.4 | % | | |
Gross 2011 tax | | $ | 1,939 | | $ | 1,939 | | $ | 1,963 | | | |
Prior-year adjustments | | $ | -19 | | $ | -19 | | $ | -8 | | | |
Prior years losses/gains (included in above) | | $ | 0 | | $ | 0 | | $ | -25 | | | |
Non-Refundable BC tax credits | | $ | -71 | | $ | -71 | | $ | -58 | | | |
Revenue is recorded on a cash basis. Due to lags in the federal collection and instalment systems, changes to the BC corporate profits and tax base forecasts affect revenue in the succeeding year. The 2012/13 instalments from the federal government reflect 9 months of payments related to the 2012 tax year (paid during Apr-Sept 2012) and one-third of 2013 payments as reflected in the Tax Collection Agreement amended in Summer 2012. Instalments for the 2012 (2013) tax year are based on BC’s share of the national tax base for the 2010 (2011) tax year and a forecast of the 2012 (2013) national tax base. BC’s share of the 2010 national tax base was 11.8%, based on tax assessments as of December 31, 2011. Cash adjustments for any under/over payments from the federal government in respect of 2011 will be received/paid on March 28, 2013.
Second Quarterly Report 2012/13
13
Updated Financial Forecast
Table 1.10 2012/13 Material Assumptions – Revenue (continued)
| | | | 1st | | 2nd | | | |
Revenue Source and Assumptions | | Budget | | Quarter | | Quarter | | | |
($ millions unless otherwise specified) | | 2012 | | Forecast | | Forecast | | 2012/13 Sensitivities | |
Harmonized sales tax | | $ | 6,003 | | $ | 6,003 | | $ | 6,003 | | | |
Calendar Year | | | | | | | | +/- 1% change in consumer expenditure growth equals up to +/- $35 million | |
Nominal consumer expenditure | | 4.3 | % | 4.3 | % | 4.3 | % | |
Nominal residential investment | | 2.8 | % | 4.4 | % | 4.4 | % | |
Above two bases represent about 84% of the total base | | | | | | | | |
HST Rebates (% rebate of the provincial portion of the HST paid) | | | | | | | | +/- 1% change in residential construction growth equals up to +/- $15 million | |
Municipalities | | 75 | % | 75 | % | 75 | % | |
Charities and non-profit organizations | | 57 | % | 57 | % | 57 | % | |
New housing (up to $42,500) | | 71.43 | % | 71.43 | % | 71.43 | % | |
School authorities | | 87 | % | 87 | % | 87 | % | |
Universities and public colleges | | 75 | % | 75 | % | 75 | % | |
Hospital authorities | | 58 | % | 58 | % | 58 | % | | |
Components of revenue | | | | | | | | | |
Gross | | $ | 7,527 | | $ | 7,527 | | $ | 7,535 | | | |
Input tax credit denial (temporary) | | $ | 145 | | $ | 119 | | $ | 119 | | | |
Rebates: | | | | | | | | | |
· Point of sale | | $ | (372 | ) | $ | (366 | ) | $ | (374 | ) | | |
· Municipalities, charities & non profit organizations | | $ | (315 | ) | $ | (322 | ) | $ | (322 | ) | | |
· SUCH sector | | $ | (218 | ) | $ | (222 | ) | $ | (222 | ) | | |
· New housing | | $ | (552 | ) | $ | (516 | ) | $ | (516 | ) | | |
· Residential energy use | | $ | (212 | ) | $ | (217 | ) | $ | (217 | ) | | |
Other sales taxes | | $ | 98 | | $ | 101 | | $ | 101 | | | |
Tax on designated property (12% rate) | | $ | 98 | | $ | 101 | | $ | 101 | | | |
Fuel and carbon taxes | | $ | 2,109 | | $ | 2,112 | | $ | 2,109 | | | |
Calendar Year | | | | | | | | | |
Real GDP | | 1.8 | % | 2.0 | % | 2.0 | % | | |
Gasoline volumes | | 0.0 | % | 0.0 | % | 0.0 | % | | |
Diesel volumes | | 2.0 | % | 2.0 | % | 2.0 | % | | |
Natural gas volumes | | 2.0 | % | 2.0 | % | 2.0 | % | | |
Carbon tax rates (July 1) | | | | | | | | | |
Carbon dioxide equivalent emissions ($/tonne) | | $ | 30 | | $ | 30 | | $ | 30 | | | |
Natural gas (cents/gigajoule) | | 148.98¢ | | 148.98¢ | | 148.98¢ | | | |
Gasoline (cents/litre) | | 6.67¢ | | 6.67¢ | | 6.67¢ | | | |
Light fuel oil (cents/litre) | | 7.67¢ | | 7.67¢ | | 7.67¢ | | | |
Carbon tax revenue | | $ | 1,172 | | $ | 1,180 | | $ | 1,180 | | | |
Carbon tax rates change on July 1 | | | | | | | | | |
Components of fuel tax revenue | | | | | | | | | |
Consolidated Revenue Fund | | $ | 491 | | $ | 486 | | $ | 486 | | | |
BC Transit | | $ | 11 | | $ | 11 | | $ | 11 | | | |
BC Transportation Financing Authority | | $ | 435 | | $ | 435 | | $ | 432 | | | |
| | $ | 937 | | $ | 932 | | $ | 929 | | | |
| | | | | | | | | |
Property taxes | | $ | 2,013 | | $ | 1,998 | | $ | 1,985 | | | |
Calendar Year | | | | | | | | | |
BC Consumer Price Index | | 1.9 | % | 1.9 | % | 1.9 | % | +/- 1% change in new construction and inflation equals up to +/- $5 million in residential property taxation revenue | |
Housing starts | | 24,978 | | 26,000 | | 26,000 | | |
Home owner grants (fiscal year) | | $ | -799 | | $ | -804 | | $ | -804 | | |
Components of revenue | | | | | | | | |
Residential (net of home owner grants) | | $ | 704 | | $ | 696 | | $ | 689 | | | |
Non-residential | | $ | 1,030 | | $ | 1,026 | | $ | 1,025 | | +/- 1% change in new construction and inflation equals up to +/- $5 million in non-residential property taxation revenue | |
Rural area | | $ | 92 | | $ | 91 | | $ | 91 | |
Police | | $ | 30 | | $ | 30 | | $ | 30 | |
BC Assessment Authority | | $ | 79 | | $ | 79 | | $ | 79 | |
BC Transit | | $ | 78 | | $ | 76 | | $ | 71 | |
Second Quarterly Report 2012/13
14
Updated Financial Forecast
Table 1.10 2012/13 Material Assumptions – Revenue (continued)
| | | | 1st | | 2nd | | | |
Revenue Source and Assumptions | | Budget | | Quarter | | Quarter | | | |
($ millions unless otherwise specified) | | 2012 | | Forecast | | Forecast | | 2012/13 Sensitivities | |
Other taxes | | $ | 1,969 | | $ | 1,959 | | $ | 1,864 | | | |
Calendar Year | | | | | | | | | |
Population | | 1.1 | % | 0.7 | % | 0.7 | % | | |
BC Consumer Price Index | | 1.9 | % | 1.9 | % | 1.9 | % | | |
BC housing starts | | -5.4 | % | -1.5 | % | -1.5 | % | | |
Real GDP | | 1.8 | % | 2.0 | % | 2.0 | % | | |
Nominal GDP | | 3.7 | % | 3.9 | % | 3.9 | % | | |
Components of revenue | | | | | | | | | |
Property transfer | | $ | 893 | | $ | 893 | | $ | 798 | | | |
Tobacco | | $ | 652 | | $ | 642 | | $ | 642 | | | |
Insurance premium | | $ | 424 | | $ | 424 | | $ | 424 | | | |
Energy, sales of Crown land tenures, metals, minerals and other | | $ | 1,973 | | $ | 1,629 | | $ | 1,532 | | | |
Natural gas price | | | | | | | | +/- $0.50 change in the natural gas price equals +/- $72 to $110 million. | |
Plant inlet, $Cdn/gigajoule | | $ | 2.52 | | $ | 1.41 | | $ | 1.42 | | |
Sumas, $US/ MMBtu | | $ | 3.88 | | $ | 2.99 | | $ | 3.10 | | |
Natural gas production volumes (petajoules) | | 1,648 | | 1,496 | | 1,468 | | Sensitivities can vary significantly especially at lower prices. | |
Annual per cent change | | 12.8 | % | 4.0 | % | 2.0 | % | |
| | | | | | | | | | | | |
Oil price ($US/bbl at Cushing, Ok) | | $ | 97.07 | | $ | 93.99 | | $ | 92.70 | | +/- 1% change in natural gas volumes equals +/- $2 million on natural gas royalties +/- 1 cent change in the exchange rate equals +/- $2 million on natural gas royalties | |
| | | | | | | | |
Auctioned land base (000 hectares) | | 245 | | 94 | | 124 | | |
Average bid price/hectare ($) | | $ | 1,200 | | $ | 650 | | $ | 563 | | |
Cash sales of Crown land tenures | | $ | 294 | | $ | 61 | | $ | 70 | | |
Metallurgical coal price ($US/tonne, fob west coast) | | $ | 218 | | $ | 218 | | $ | 183 | | |
Copper price ($US/lb) | | $ | 3.68 | | $ | 3.49 | | $ | 3.54 | | |
Annual electricity volumes set by treaty (million mega-watt hours) | | 4.3 | | 4.3 | | 4.3 | | | |
Mid-Columbia electricity price ($US/mega-watt hour) | | $ | 32 | | $ | 25 | | $ | 26 | | +/- 10% change in the average Mid- | |
Exchange rate (US¢/ Cdn$, calendar year) | | 96.6 | | 98.7 | | 100.4 | | Columbia electricity price equals +/- $10 million | |
Components of revenue | | | | | | | | | |
Natural gas royalties | | $ | 398 | | $ | 157 | | $ | 157 | | | |
Bonus bids, fees and rentals | | $ | 882 | | $ | 865 | | $ | 866 | | Based on a recommendation from the Auditor General to be consistent with generally accepted accounting principles, bonus bid revenue recognition reflects nine-year deferral of cash receipts from the sale of Crown land tenures |
Petroleum royalties | | $ | 105 | | $ | 108 | | $ | 103 | |
Columbia River Treaty electricity sales | | $ | 125 | | $ | 92 | | $ | 96 | |
Coal | | $ | 341 | | $ | 309 | | $ | 215 | |
Minerals, metals and other | | $ | 74 | | $ | 55 | | $ | 56 | |
Oil and Gas Commission fees and levies | | $ | 48 | | $ | 43 | | $ | 39 | |
Royalty programs and infrastructure credits | | | | | | | |
Summer drilling | | $ | -25 | | $ | -17 | | $ | -29 | |
Deep drilling | | $ | -122 | | $ | -101 | | $ | -123 | |
Road and pipeline infrastructure | | $ | -188 | | $ | -42 | | $ | -31 | |
Total | | $ | -335 | | $ | -160 | | $ | -183 | |
Implicit average natural gas royalty rate | | 9.5 | % | 7.4 | % | 7.5 | % |
Royalty program (marginal, low productivity and ultra marginal drilling) adjustments reflect reduced royalty rates.
Natural gas royalties incorporate royalty programs and Treasury Board approved infrastructure credits.
Second Quarterly Report 2012/13
15
Updated Financial Forecast
Table 1.10 2012/13 Material Assumptions – Revenue (continued)
| | | | 1st | | 2nd | | | |
Revenue Source and Assumptions | | Budget | | Quarter | | Quarter | | | |
($ millions unless otherwise specified) | | 2012 | | Forecast | | Forecast | | 2012/13 Sensitivities | |
Forests | | $ | 533 | | $ | 543 | | $ | 546 | | | |
Prices (calendar year average) | | | | | | | | +/- US$50 change in SPF price equals +/- $25 to $50 million | |
SPF 2x4 ($US/1000 bd ft) | | $ | 260 | | $ | 284 | | | 289 | | |
Random Lengths Composite ($US/thousand board feet) | | $ | 295 | | $ | 319 | | $ | 316 | | | |
Pulp ($US/tonne) | | $ | 838 | | $ | 832 | | $ | 816 | | +/- US$50 change in pulp price equals +/-$5 to $10 million +/- Cdn$10 change in average log price equals +/-$10 to $20 million | |
Coastal log ($Cdn/cubic metre) | | | | | | | | |
(Vancouver Log Market, fiscal year) | | $ | 73 | | $ | 78 | | $ | 79 | | |
| | | | | | | | |
Fiscal Year Trade Assumptions | | | | | | | | |
Export tax rate (effective rate) | | 11.3 | % | 10.4 | % | 10.0 | % | |
Lumber shipments and consumption (billion board feet) | | | | | | | | +/- 1 cent change in exchange rate equals +/- $5 to $10 million on stumpage revenue +/- 10% change in Interior harvest volumes equals | |
U.S. lumber consumption | | 33.1 | | 34.1 | | 35.9 | | |
BC surge trigger volumes | | 7.0 | | 7.2 | | 7.6 | | |
BC lumber exports to US | | 5.1 | | 5.4 | | 5.6 | | |
| | | | | | | | |
Crown harvest volumes (million cubic metres) | | | | | | | | |
Interior | | 50.8 | | 50.8 | | 51.7 | | +/- $10 to $15 million | |
Coast | | 14.2 | | 14.2 | | 14.3 | | +/- 10% change in Coastal harvest volumes equals +/- $3 to $6 million | |
Total | | 65.0 | | 65.0 | | 66.0 | | |
BC Timber Sales (included in above) | | 11.8 | | 10.5 | | 10.5 | | |
Components of revenue | | | | | | | | The above sensitivities relate to stumpage revenue only. Depending on market conditions, changes in stumpage revenues may be offset by changes in border tax revenues. | |
Tenures | | $ | 186 | | $ | 179 | | $ | 196 | | |
BC Timber Sales | | $ | 178 | | $ | 178 | | $ | 178 | | |
Federal border tax (SLA 2006) | | $ | 128 | | $ | 139 | | $ | 123 | | |
Logging tax | | $ | 15 | | $ | 15 | | $ | 15 | | |
Other CRF revenue | | $ | 16 | | $ | 15 | | $ | 15 | | |
Recoveries | | $ | 10 | | $ | 17 | | $ | 19 | | |
Other natural resources | | $ | 480 | | $ | 481 | | $ | 482 | | | |
Components of revenue | | | | | | | | | |
Water rental and licences* | | $ | 411 | | $ | 412 | | $ | 412 | | | |
Recoveries | | $ | 49 | | $ | 49 | | $ | 49 | | | |
Angling and hunting permits and licences | | $ | 13 | | $ | 13 | | $ | 13 | | | |
Recoveries | | $ | 7 | | $ | 7 | | $ | 8 | | | |
* BC Hydro rate increases are indexed to Consumer Price Index.
| | | | | | | | | |
Other revenue | | $ | 9,053 | | $ | 9,089 | | $ | 8,797 | | | |
Components of revenue | | | | | | | | | |
Fees and licences | | | | | | | | | |
Consolidated Revenue Fund | | $ | 2,811 | | $ | 2,776 | | $ | 2,789 | | | |
Medical Services Plan premiums | | $ | 1,991 | | $ | 1,956 | | $ | 1,966 | | | |
Motor vehicle licences and permits | | $ | 485 | | $ | 487 | | $ | 485 | | | |
Other Consolidated revenue fund | | $ | 335 | | $ | 333 | | $ | 338 | | | |
Recoveries | | $ | 223 | | $ | 235 | | $ | 225 | | | |
MSP recoveries | | $ | 56 | | $ | 87 | | $ | 76 | | | |
Other recoveries | | $ | 167 | | $ | 148 | | $ | 149 | | | |
Crown corporations and agencies | | $ | 105 | | $ | 104 | | $ | 101 | | | |
Other service delivery agencies | | $ | 1,784 | | $ | 1,812 | | $ | 1,818 | | | |
Post-secondary education fees | | $ | 1,318 | | $ | 1,332 | | $ | 1,336 | | | |
Other health-care related fees | | $ | 318 | | $ | 326 | | $ | 328 | | | |
School Districts | | $ | 148 | | $ | 154 | | $ | 154 | | | |
Investment earnings | | | | | | | | | |
Consolidated Revenue Fund | | $ | 65 | | $ | 65 | | $ | 65 | | | |
Fiscal agency loans & sinking funds earnings | | $ | 854 | | $ | 838 | | $ | 839 | | | |
Crown corporations and agencies | | $ | 36 | | $ | 33 | | $ | 33 | | | |
Other service delivery agencies | | $ | 128 | | $ | 145 | | $ | 132 | | | |
Sales of goods and services | | $ | 889 | | $ | 926 | | $ | 930 | | | |
Miscellaneous | | | | | | | | | |
Consolidated Revenue Fund | | $ | 203 | | $ | 212 | | $ | 221 | | | |
Recoveries | | $ | 501 | | $ | 556 | | $ | 571 | | | |
Crown corporations and agencies | | $ | 371 | | $ | 362 | | $ | 51 | | | |
Other service delivery agencies | | $ | 1,083 | | $ | 1,025 | | $ | 1,022 | | | |
Second Quarterly Report 2012/13
16
Updated Financial Forecast
Table 1.10 2012/13 Material Assumptions – Revenue (continued)
| | | | 1st | | 2nd | | | |
Revenue Source and Assumptions | | Budget | | Quarter | | Quarter | | | |
($ millions unless otherwise specified) | | 2012 | | Forecast | | Forecast | | 2012/13 Sensitivities | |
Health and social transfers | | $ | 5,682 | | $ | 5,617 | | $ | 5,616 | | | |
National Cash Transfers | | | | | | | | | |
Canada Health Transfer (CHT) | | $ | 28,569 | | $ | 28,569 | | $ | 28,569 | | | |
Wait Times Reduction Transfer (WTRT) | | $ | 250 | | $ | 250 | | $ | 250 | | +/- 0.1% change in BC’s | |
Canada Social Transfer (CST) | | $ | 11,859 | | $ | 11,859 | | $ | 11,859 | | population share equals | |
BC share of national population (June 1) | | 13.28 | % | 13.22 | % | 13.26 | % | +/- $50 to $55 million | |
BC health and social transfers revenue | | | | | | | | | |
CHT | | $ | 4,051 | | $ | 4,002 | | $ | 4,007 | | | |
WTRT | | $ | 33 | | $ | 33 | | $ | 33 | | | |
CST | | $ | 1,575 | | $ | 1,568 | | $ | 1,572 | | | |
Prior-year adjustments | | | | $ | -9 | | $ | -19 | | | |
Health deferral | | | | | | | | | |
Diagnostic and Medical Equipment | | $ | 16 | | $ | 16 | | $ | 16 | | | |
Medical Equipment Trust | | $ | 7 | | $ | 7 | | $ | 7 | | | |
Other federal contributions | | $ | 1,575 | | $ | 1,631 | | $ | 1,652 | | | |
Components of revenue | | | | | | | | | |
Other Consolidated Revenue Fund | | $ | 150 | | $ | 149 | | $ | 149 | | | |
Labour Market Development Agreement | | $ | 285 | | $ | 286 | | $ | 285 | | | |
Local Government Services and Transfers | | $ | 33 | | $ | 32 | | $ | 32 | | | |
Canada-BC Co-operation on Immigration | | $ | 120 | | $ | 120 | | $ | 120 | | | |
Labour Market Agreement | | $ | 66 | | $ | 105 | | $ | 105 | | | |
Other recoveries | | $ | 199 | | $ | 210 | | $ | 207 | | | |
Crown corporations and agencies | | $ | 213 | | $ | 211 | | $ | 222 | | | |
Other service delivery agencies | | $ | 509 | | $ | 518 | | $ | 532 | | | |
| | | | | | | | | |
Service delivery agency direct revenue | | $ | 5,769 | | $ | 5,780 | | $ | 5,473 | | | |
School districts | | $ | 481 | | $ | 496 | | $ | 496 | | | |
Post-secondary institutions | | $ | 2,873 | | $ | 2,896 | | $ | 2,881 | | | |
Health authorities and hospital societies | | $ | 801 | | $ | 792 | | $ | 815 | | | |
BC Transportation Financing Authority | | $ | 465 | | $ | 471 | | $ | 467 | | | |
Other service delivery agencies | | $ | 1,149 | | $ | 1,125 | | $ | 814 | | | |
Commercial Crown corporation net income | | $ | 2,717 | | $ | 2,661 | | $ | 2,627 | | | |
BC Hydro | | $ | 566 | | $ | 520 | | $ | 512 | | | |
reservoir water inflows | | 100 | % | 110 | % | 109 | % | +/-1% in hydro generation | |
| | | | | | | | = +/-$5 million | |
mean gas price | | 4.77 | | 2.72 | | 2.85 | | +/-10% = -/+$5 million | |
(Sumas, $US/MMbtu – BC Hydro forecast based on NYMEX forward selling prices) | | | |
electricity prices | | 36.67 | | 20.81 | | 20.65 | | +/-10% change in electricity trade | |
(Mid-C, $US/MWh) | | | | | | | | margins = +/-$20 million | |
allowed return on deemed equity | | 12.75 | % | 11.73 | % | 11.73 | % | +/-1% = +/-$47 to $53 million | |
| | | | | | | | | |
ICBC | | $ | 146 | | $ | 160 | | $ | 141 | | | |
vehicle growth | | + 1.3 | % | + 1.4 | % | + 1.4 | % | +/-1% = +/-$38 million | |
current claims cost percentage change | | + 1.4 | % | + 4.6 | % | + 5.3 | % | +/-1% = -/+$30 million | |
investment return | | 3.4 | % | 3.5 | % | 3.6 | % | +/-1% return = +/-$115 million | |
loss ratio | | 86.4 | % | 86.6 | % | 87.8 | % | | |
Second Quarterly Report 2012/13
17
Updated Financial Forecast
Table 1.11 2012/13 Material Assumptions – Expense
| | | | 1st | | 2nd | | | |
Ministry Programs and Assumptions | | Budget | | Quarter | | Quarter | | | |
($ millions unless otherwise specified) | | 2012 | | Forecast | | Forecast | | Sensitivities 2012/13 | |
Advanced Education, Innovation and Technology | | 1,981 | | 1,981 | | 1,981 | | | |
Student spaces in public institutions (# FTEs) | | 201,307 | | 201,307 | | 201,983 | | The number of student spaces may vary depending on the financial and other policies of post-secondary institutions. | |
Children and Family Development | | 1,333 | | 1,333 | | 1,331 | | | |
Average children-in-care caseload (#) | | 8,070 | | 8,070 | | 8,150 | | Caseload is expected to decline. The child population (age 0 to 18) is projected to start increasing in 2013, potentially decelerating the downward trend. A 1% increase in the cost per case or a 1% increase in the average caseload will affect expenditures by approximately $2.8 million. | |
Average annual residential cost per child in care ($) | | 35,200 | | 35,200 | | 35,200 | | |
| | | | | | | | |
| | | | | | | | |
| | | | | | | | |
| | | | | | | | |
| | | | | | | | |
| | | | | | | | |
| | | | | | | | |
Education | | 5,315 | | 5,315 | | 5,315 | | | |
Enrolment (# of FTEs) | | 556,660 | | 556,660 | | 555,195 | | Enrolment figures are based on BC Stats enrolment trends, to which the Ministry has added forecasts for distributed learning, adult education, and summer learning. | |
School age (K–12) | | 530,220 | | 530,220 | | 530,879 | | |
Distributed Learning (online) | | 12,329 | | 12,329 | | 11,907 | | |
Summer | | 6,117 | | 6,117 | | 6,117 | | |
Adults | | 7,994 | | 7,994 | | 6,292 | | |
| | | | | | | | |
Forests, Lands and Natural Resource Operations | | 602 | | 664 | | 671 | | | |
BC Timber Sales | | 160 | | 160 | | 160 | | Targets can be impacted by changes to actual inventory costs incurred. There is a lag of approximately 2 years between when inventory costs are incurred and when they are expensed. Volume harvested can also impact targets. For example, if volume harvested is less than projected in any year then capitalized expenses will also be reduced in that year. | |
| | | | | | | | |
| | | | | | | | |
| | | | | | | | |
| | | | | | | | |
| | | | | | | | |
| | | | | | | | |
| | | | | | | | |
| | | | | | | | |
| | | | | | | | |
| | | | | | | | |
| | | | | | | | |
Direct Fire Fighting | | 63 | | 125 | | 138 | | Over the past several years, Direct fire fighting costs have ranged from a low of $19 million in 1997 to $382 million in 2009. | |
| | | | | | | | |
| | | | | | | | |
| | | | | | | | |
Health | | 16,180 | | 16,180 | | 16,115 | | | |
Pharmacare | | 1,185 | | 1,144 | | 1,115 | | A 1% change in utilization or drug prices affects costs by approximately $10 million. | |
| | | | | | | | |
| | | | | | | | |
Medical Services Plan (MSP) | | 3,895 | | 3,909 | | 3,885 | | A 1% increase in volume of services provided by fee-for-service physicians affects costs by approximately $25 million. | |
| | | | | | | | |
| | | | | | | | |
| | | | | | | | |
Regional Services | | 10,859 | | 10,859 | | 10,846 | | | |
Justice | | 1,110 | | 1,154 | | 1,149 | | | |
New cases filed/processed (# for all courts) | | 295,000 | | 295,000 | | 295,000 | | The number of criminal cases proceeded on by the provincial and federal Crown (including appeals to higher courts in BC), the number of civil and family litigation cases, the number of violation tickets disputed, and the number of municipal bylaw tickets disputed which would go to court for resolution. | |
| | | | | | | | |
| | | | | | | | |
| | | | | | | | |
| | | | | | | | |
| | | | | | | | |
| | | | | | | | |
| | | | | | | | |
| | | | | | | | |
| | | | | | | | |
| | | | | | | | | |
Crown Proceedings Act (CPA) | | 25 | | 25 | | 25 | | The number and size of litigation brought against the province, as well as the effectiveness of mitigation strategies and legal defence. | |
| | | | | | | | |
| | | | | | | | |
| | | | | | | | |
| | | | | | | | |
| | | | | | | | | |
Policing, Victim Services and Corrections | | 569 | | 569 | | 582 | | The volume and severity of criminal activity, the number of inmate beds occupied and the number of offenders under community supervision. | |
| | | | | | | | |
| | | | | | | | |
| | | | | | | | |
| | | | | | | | |
| | | | | | | | | |
Emergency Program Act (EPA) | | 15 | | 59 | | 58 | | The number and severity of natural disasters. | |
Second Quarterly Report 2012/13
18
Updated Financial Forecast
Table 1.11 2012/13 Material Assumptions – Expense (continued )
| | | | 1st | | 2nd | | | |
Ministry Programs and Assumptions | | Budget | | Quarter | | Quarter | | | |
($ millions unless otherwise specified) | | 2012 | | Forecast | | Forecast | | Sensitivities 2012/13 | |
Social Development | | 2,457 | | 2,457 | | 2,456 | | | |
Temporary Assistance annual average caseload (#) | | 55,000 | | 55,000 | | 51,896 | | The expected to work caseload is sensitive to fluctuations in economic and employment trends in the service sector. A 1% change in the Temporary Assistance annual average caseload or average cost per case will affect expenditures by approximately $4.5 million annually. | |
| | | | | | | | |
| | | | | | | | |
| | | | | | | | |
| | | | | | | | |
| | | | | | | | |
| | | | | | | | |
| | | | | | | | |
| | | | | | | | |
| | | | | | | | |
Disability Assistance annual average caseload (#) | | 83,000 | | 83,000 | | 84,279 | | The caseload for persons with disabilities is sensitive to the aging of the population and longer life expectancy for individuals with disabilities and significant health issues. A 1% change in the Disability Assistance annual average caseload or average cost per case will affect expenditures by approximately $7.5 million annually. | |
| | | | | | | | |
| | | | | | | | |
| | | | | | | | |
| | | | | | | | |
| | | | | | | | |
| | | | | | | | |
| | | | | | | | |
| | | | | | | | |
| | | | | | | | |
| | | | | | | | |
| | | | | | | | |
Total annual average caseload (#) | | 138,000 | | 138,000 | | 136,175 | | The average cost per case is sensitive to the composition of the caseload, and reported income. | |
| | | | | | | | |
| | | | | | | | |
| | | | | | | | |
Adult Community Living: | | | | | | | | | |
Residential Services: | | | | | | | | | |
Average caseload (#) | | 5,536 | | 5,536 | | 5,754 | | The adult community living caseload is sensitive to the pressures of an aging population. A 1% increase in the adult caseload will increase expenditures by approximately $2.4 million. | |
Average cost per client ($) | | 74,800 | | 74,800 | | 70,838 | | |
Day Programs: | | | | | | | | |
Average caseload (#) | | 14,570 | | 14,570 | | 14,661 | | |
Average cost per client ($) | | 18,150 | | 18,150 | | 17,775 | | |
Personal Supports Initiative | | | | | | | | |
Average caseload (#) | | 419 | | 419 | | 415 | | |
Average cost per client ($) | | 23,700 | | 23,700 | | 25,306 | | | |
Tax Transfers | | 1,091 | | 1,057 | | 1,127 | | | |
Personl Income | | 632.3 | | 632.3 | | 622.7 | | | |
| | | | | | | | These tax transfers are now expensed as required under generally accepted accounting principles. Previously for the family bonus was split 50/50 between expense program and as reduction to revenue while all other refundable credits were recorded as reduction to revenue. | |
Family Bonus Program | | 4.5 | | 4.5 | | 4.5 | | |
Low Income Climate Action | | 190.0 | | 190.0 | | 195.0 | | |
Sales Tax / BC HST | | 328.3 | | 328.3 | | 333.3 | | |
Small Business Venture Capital | | 28.0 | | 28.0 | | 23.5 | | |
Other Personal income | | 81.5 | | 81.5 | | 66.4 | | |
Corporate Income | | 459.2 | | 424.8 | | 504.1 | | |
Film and Television | | 70.0 | | 65.0 | | 97.0 | | |
Production Services | | 217.4 | | 201.5 | | 259.5 | | |
Scientific Research & Experimental Development | | 79.2 | | 72.3 | | 72.3 | | | |
Interactive Digital Media | | 37.9 | | 35.0 | | 30.0 | | | |
Other Corporate income | | 54.7 | | 51.0 | | 45.3 | | | |
Management of Public Funds and Debt | | 1,287 | | 1,218 | | 1,212 | | | |
Interest rates for new provincial borrowing: | | | | | | | | Full year impact on MoPD on interest costs of a 1% change in interest rates equals $35.1 million; $100 million increase in debt level equals $1.1 million. | |
Short-term | | 1.11 | % | 1.05 | % | 1.08 | % | |
Long-term | | 3.47 | % | 2.86 | % | 2.76 | % | |
CDN/US exchange rate (cents) | | 102.7 | | 101.6 | | 99.3 | | |
| | | | | | | | |
Service delivery agency net spending | | 5,482 | | 5,516 | | 5,460 | | | |
School districts | | 204 | | 228 | | 194 | | | |
Post-secondary institutions | | 2,834 | | 2,855 | | 2,822 | | | |
Health authorities and hospital societies | | 646 | | 705 | | 705 | | | |
BC Transportation Financing Authority | | 946 | | 898 | | 898 | | | |
Other service delivery agencies | | 852 | | 830 | | 841 | | | |
Second Quarterly Report 2012/13
19
Updated Financial Forecast
Table 1.12 2012/13 Full-Time Equivalents (FTEs) (1)
| | 2012/13 | | Actual | |
FTEs | | Budget | | Forecast | | Variance | | 2011/12 (2) | |
Ministries and special offices (consolidated revenue fund) | | 26,891 | | 26,891 | | — | | 27,228 | |
Service delivery agencies (3) | | 4,568 | | 4,568 | | — | | 4,346 | |
Total FTEs | | 31,459 | | 31,459 | | — | | 31,574 | |
(1) Full-time equivalents (FTEs) are a measure of staff employment. FTEs are calculated by dividing the total hours of employment paid for in a given period by the number of hours an individual, full-time person would normally work in that period. This does not equate to the physical number of employees. For example, two half-time employees would equal one FTE, or alternatively, three FTEs may represent two full-time employees who have worked sufficient overtime hours to equal an additional FTE.
(2) The ministry 2011/12 FTE total includes a reduction of about 3,200 FTEs reflecting the shift of BC Ambulance Service oversight from the Ministry of Health to the Provincial Health Services Authority.
(3) Service delivery agency FTE amounts do not include SUCH sector staff employment.
Table 1.13 2012/13 Capital Spending
| | Year-to-Date to September 30 | | Full Year | |
| | 2012/13 | | Actual | | 2012/13 | | Actual | |
($ millions) | | Budget | | Actual | | Variance | | 2011/12 | | Budget | | Forecast | | Variance | | 2011/12 | |
Taxpayer-supported | | | | | | | | | | | | | | | | | |
Education | | | | | | | | | | | | | | | | | |
School districts | | 243 | | 286 | | 43 | | 319 | | 486 | | 517 | | 31 | | 560 | |
Post-secondary institutions | | 344 | | 222 | | (122 | ) | 265 | | 688 | | 791 | | 103 | | 662 | |
Health | | 440 | | 273 | | (167 | ) | 272 | | 879 | | 887 | | 8 | | 732 | |
BC Transportation Financing Authority | | 535 | | 583 | | 49 | | 635 | | 1,069 | | 1,088 | | 19 | | 921 | |
BC Transit | | 45 | | 14 | | (31 | ) | 19 | | 90 | | 61 | | (29 | ) | 37 | |
BC Place redevelopment | | — | | — | | — | | 159 | | — | | 8 | | 8 | | 194 | |
Government operating (ministries) | | 227 | | 68 | | (159 | ) | 86 | | 454 | | 416 | | (38 | ) | 245 | |
Other (1) | | 46 | | 41 | | (5 | ) | 116 | | 91 | | 122 | | 31 | | 221 | |
Capital planning adjustment | | — | | — | | — | | — | | — | | (146 | ) | (146 | ) | — | |
Total taxpayer-supported | | 1,879 | | 1,487 | | (392 | ) | 1,871 | | 3,757 | | 3,744 | | (13 | ) | 3,572 | |
Self-supported | | | | | | | | | | | | | | | | | |
BC Hydro | | 1,132 | | 953 | | (179 | ) | 884 | | 2,361 | | 2,196 | | (165 | ) | 1,917 | |
Columbia River power projects (2) | | 57 | | 56 | | (1 | ) | 61 | | 122 | | 122 | | — | | 108 | |
Transportation Investment Corporation | | | | | | | | | | | | | | | | | |
(Port Mann) | | 362 | | 384 | | 22 | | 417 | | 606 | | 641 | | 35 | | 735 | |
BC Rail | | 7 | | 4 | | (3 | ) | 4 | | 13 | | 11 | | (2 | ) | 9 | |
ICBC | | 39 | | 40 | | 1 | | 47 | | 101 | | 97 | | (4 | ) | 92 | |
BC Lottery Corporation | | 58 | | 43 | | (15 | ) | 38 | | 116 | | 118 | | 2 | | 74 | |
Liquor Distribution Branch | | 13 | | 2 | | (11 | ) | 6 | | 27 | | 22 | | (5 | ) | 19 | |
Total self-supported | | 1,668 | | 1,482 | | (186 | ) | 1,457 | | 3,346 | | 3,207 | | (139 | ) | 2,954 | |
Total capital spending | | 3,547 | | 2,969 | | (578 | ) | 3,328 | | 7,103 | | 6,951 | | (152 | ) | 6,526 | |
(1) Includes BC Housing Management Commission, Provincial Rental Housing Corporation and other service delivery agencies.
(2) Joint ventures of the Columbia Power Corporation and Columbia Basin Trust.
Second Quarterly Report 2012/13
20
Updated Financial Forecast
Table 1.14 Capital Expenditure Projects Greater Than $50 million (1)
Note: Information in bold type denotes changes from the 2012/13 first Quarterly Report released on September 13, 2012.
| | Projected | | Total Costs | | Projected | | Total | | Project Financing | |
| | Completion | | to | | Costs to | | Capital | | Internal/ | | P3 | | Federal | | Other | |
($ millions) | | Date | | Sept 30, 2012 | | Complete | | Costs | | Borrowing | | Liability | | Gov’t | | Contrib’ns | |
Taxpayer-supported | | | | | | | | | | | | | | | | | |
School districts | | | | | | | | | | | | | | | | | |
Revelstoke Elementary and Secondary | | Fall 2012 | | 55 | | 5 | | 60 | | 58 | | — | | — | | 2 | |
Burnaby Central Secondary | | Fall 2012 | | 52 | | 8 | | 60 | | 60 | | — | | — | | — | |
Alberni District Secondary | | Fall 2012 | | 50 | | 8 | | 58 | | 54 | | — | | — | | 4 | |
Southern Okanagan Secondary | | Fall 2013 | | 34 | | 20 | | 54 | | 52 | | — | | — | | 2 | |
Chilliwack Secondary | | Fall 2013 | | 19 | | 39 | | 58 | | 58 | | — | | — | | — | |
Centennial Secondary | | Spring 2015 | | 3 | | 59 | | 62 | | 62 | | — | | — | | — | |
Oak Bay Secondary | | Fall 2015 | | 1 | | 49 | | 50 | | 48 | | — | | — | | 2 | |
Kitsilano Secondary | | Fall 2015 | | 2 | | 56 | | 58 | | 58 | | — | | — | | — | |
Seismic mitigation program | | Spring 2021 | | — | | 1,300 | | 1,300 | | 1,300 | | — | | — | | — | |
Full-day kindergarten | | Winter 2012 | | 121 | | 13 | | 134 | | 134 | | — | | — | | — | |
Total school districts | | | | 337 | | 1,557 | | 1,894 | | 1,884 | | — | | — | | 10 | |
Post-secondary institutions | | | | | | | | | | | | | | | | | |
University of British Columbia | | | | | | | | | | | | | | | | | |
— Pharmaceutical Sciences and Centre for Drug | | | | | | | | | | | | | | | | | |
Research & Development | | Fall 2012 | | 133 | | — | | 133 | | 86 | | — | | 3 | | 44 | |
Health facilities | | | | | | | | | | | | | | | | | |
Victoria Royal Jubilee Hospital — Patient Care Centre | | | | | | | | | | | | | | | | | |
— Direct procurement | | Spring 2013 | | 48 | | 21 | | 69 | | 23 | | — | | — | | 46 | |
— P3 contract | | Spring 2011 | | 280 | | — | | 280 | | — | | 199 | | — | | 81 | |
Fort St. John Hospital and Residential Care (2) | | | | | | | | | | | | | | | | | |
— Direct procurement | | Spring 2012 | | 48 | | 5 | | 53 | | 52 | | — | | — | | 1 | |
— P3 contract | | Spring 2012 | | 249 | | — | | 249 | | 121 | | 33 | | — | | 95 | |
Expansions to Kelowna General and | | | | | | | | | | | | | | | | | |
Vernon Jubilee Hospitals (2) | | | | | | | | | | | | | | | | | |
— Direct procurement | | Spring 2012 | | 38 | | 11 | | 49 | | 25 | | — | | — | | 24 | |
— P3 contract | | Spring 2012 | | 386 | | — | | 386 | | 3 | | 158 | | — | | 225 | |
Northern Cancer Control Strategy | | | | | | | | | | | | | | | | | |
— Direct procurement | | Summer 2013 | | 25 | | 10 | | 35 | | 32 | | — | | — | | 3 | |
— P3 contract | | Summer 2012 | | 67 | | 4 | | 71 | | 54 | | 17 | | — | | — | |
Lions Gate Hospital (Mental Health) | | | | | | | | | | | | | | | | | |
Redevelopment | | Fall 2013 | | 5 | | 57 | | 62 | | 38 | | — | | — | | 24 | |
Surrey Emergency/Critical Care Tower | | | | | | | | | | | | | | | | | |
— Direct procurement | | Summer 2014 | | 47 | | 147 | | 194 | | 174 | | — | | — | | 20 | |
— P3 contract | | Summer 2014 | | 173 | | 145 | | 318 | | 139 | | 179 | | — | | — | |
Lakes District Hospital | | Summer 2015 | | — | | 55 | | 55 | | 46 | | — | | — | | 9 | |
Queen Charlotte/Haida Gwaii Hospital | | Summer 2015 | | — | | 50 | | 50 | | 31 | | — | | — | | 19 | |
North Island Hospitals | | Summer 2017 | | — | | 601 | | 601 | | 365 | | — | | — | | 236 | |
Interior Heart and Surgical Centre | | Spring 2017 | | 79 | | 288 | | 367 | | 217 | | 79 | | — | | 71 | |
Children’s and Women’s Hospital (3) | | Spring 2018 | | 23 | | 657 | | 680 | | 532 | | — | | — | | 148 | |
Total health facilities | | | | 1,468 | | 2,051 | | 3,519 | | 1,852 | | 665 | | — | | 1,002 | |
Transportation | | | | | | | | | | | | | | | | | |
South Fraser Perimeter Road | | | | | | | | | | | | | | | | | |
— Direct procurement | | Summer 2014 | | 934 | | 128 | | 1,062 | | 714 | | — | | 348 | | — | |
— P3 contract | | Summer 2014 | | 168 | | 34 | | 202 | | — | | 202 | | — | | — | |
Sierra Yoyo-Desan Road upgrade (4) | | Fall 2014 | | 82 | | 55 | | 137 | | 137 | | — | | — | | — | |
Total transportation | | | | 1,184 | | 217 | | 1,401 | | 851 | | 202 | | 348 | | — | |
Other | | | | | | | | | | | | | | | | | |
Integrated case management system | | Fall 2014 | | 109 | | 73 | | 182 | | 179 | | — | | 3 | | — | |
Surrey Pretrial Service Centre expansion | | | | | | | | | | — | | | | | | | |
— Direct procurement | | Fall 2013 | | 7 | | 7 | | 14 | | 14 | | — | | — | | — | |
— P3 contract | | Fall 2013 | | 34 | | 65 | | 99 | | 56 | | 43 | | — | | — | |
e-Health initiative (5) | | Spring 2013 | | 251 | | 11 | | 262 | | 145 | | — | | 117 | | — | |
Total other | | | | 401 | | 156 | | 557 | | 394 | | 43 | | 120 | | — | |
Total taxpayer-supported | | | | 3,523 | | 3,981 | | 7,504 | | 5,067 | | 910 | | 471 | | 1,056 | |
Second Quarterly Report 2012/13
21
Updated Financial Forecast
Table 1.14 Capital Expenditure Projects Greater Than $50 million (1)(continued)
Note: Information in bold type denotes changes from the 2012/13 first Quarterly Report released on September 13, 2012.
| | Projected | | Total Costs | | Projected | | Total | | Project Financing | |
| | Completion | | to | | Costs to | | Capital | | Internal/ | | P3 | | Federal | | Other | |
($ millions) | | Date | | Sept 30, 2012 | | Complete | | Costs | | Borrowing | | Liability | | Gov’t | | Contrib’ns | |
Self-supported | | | | | | | | | | | | | | | | | |
Transportation | | | | | | | | | | | | | | | | | |
Port Mann Bridge / Highway 1 | | Winter 2013 | | 2,842 | | 477 | | 3,319 | | 3,319 | | — | | — | | — | |
Power generation and transmission | | | | | | | | | | | | | | | | | |
BC Hydro (6) | | | | | | | | | | | | | | | | | |
— Fort Nelson generating station upgrade | | Winter 2012 | (2) | 165 | | 1 | | 166 | | 166 | | — | | — | | — | |
— Columbia Valley transmission | | Fall 2012 | (2) | 107 | | 6 | | 113 | | 113 | | — | | — | | — | |
— Stave Falls spillway gate reliability upgrade (7) | | Winter 2013 | | 39 | | 25 | | 64 | | 64 | | — | | — | | — | |
— Vancouver City Central transmission | | Winter 2014 | | 119 | | 82 | | 201 | | 201 | | — | | — | | — | |
— Smart metering and infrastructure program | | Winter 2014 | | 487 | | 443 | | 930 | | 930 | | — | | — | | — | |
— Mica gas insulated switchgear replacement (7) | | Winter 2014 | | 126 | | 73 | | 199 | | 199 | | — | | — | | — | |
— Seymour Arm series capacitor (8) | | Spring 2014 | | 5 | | 76 | | 81 | | 81 | | — | | — | | — | |
— Dawson Creek/Chetwynd area transmission (7) | | Spring 2014 | | 17 | | 238 | | 255 | | 255 | | — | | — | | — | |
— Northwest transmission line | | Spring 2014 | | 196 | | 421 | | 617 | | 290 | | — | | 130 | | 197 | |
— Hugh Keenleyside spillway gate reliability | | | | | | | | | | | | | | | | | |
upgrade (7) | | Spring 2014 | | 34 | | 56 | | 90 | | 90 | | — | | — | | — | |
— Interior to Lower Mainland transmission line | | Winter 2015 | | 158 | | 567 | | 725 | | 725 | | — | | — | | — | |
— GM Shrum units 1 to 5 turbine upgrade (7) | | Spring 2015 | | 44 | | 228 | | 272 | | 272 | | — | | — | | — | |
— Mica units 5 and 6 project (7) | | Fall 2015 | | 221 | | 493 | | 714 | | 714 | | — | | — | | — | |
— Ruskin Dam safety and powerhouse upgrade (7) | | Winter 2018 | | 105 | | 643 | | 748 | | 748 | | — | | — | | — | |
— John Hart replacement (7) | | TBD | | 70 | | 1,079 | | 1,149 | | 1,149 | | — | | — | | — | |
Columbia River power projects (8) | | | | | | | | | | | | | | | | | |
— Waneta Dam power expansion | | Spring 2015 | | 197 | | 153 | | 350 | | 350 | | — | | — | | — | |
Total power generation and transmission | | | | 2,090 | | 4,584 | | 6,674 | | 6,347 | | — | | 130 | | 197 | |
Other | | | | | | | | | | | | | | | | | |
British Columbia Lottery Corporation | | | | | | | | | | | | | | | | | |
— Gaming management system | | Winter 2015 | | 22 | | 82 | | 104 | | 104 | | — | | — | | — | |
Insurance Corporation of British Columbia | | | | | | | | | | | | | | | | | |
— Business transformation program | | Fall 2016 | | 90 | | 120 | | 210 | | 210 | | — | | — | | — | |
Total other | | | | 112 | | 202 | | 314 | | 314 | | — | | — | | — | |
Total self-supported | | | | 5,044 | | 5,263 | | 10,307 | | 9,980 | | — | | 130 | | 197 | |
Total $50 million projects | | | | 8,567 | | 9,244 | | 17,811 | | 15,047 | | 910 | | 601 | | 1,253 | |
(1) Only projects that receive provincial funding and have been approved by Treasury Board and/or Crown corporation boards are included in this table. Ministry service plans may include projects that still require final approval. Capital costs reflect current government accounting policy.
(2) Assets have been put into service and only trailing costs remain.
(3) Figures shown are based on preliminary Treasury Board approvals. These amounts will change after P3 contracts are finalized.
(4) Figures shown do not include a $50 million capital reserve for future oil and gas access road development in the Northern Rockies area.
(5) The e-Health initiative is comprised of 7 distinct projects. Figures shown reflect the total costs of the Ministry of Health’s 7 provincially co-ordinated e-Health projects. The federal government portion is an estimate based on a signed agreement with Canada Health Infoway and the actual amount may vary, depending on eligible project costs incurred.
(6) BC Hydro has revised total capital costs for projects to conform with International Financial Reporting Standards.
(7) Total costs and completion dates for these projects vary depending on the final scope. Information shown represents current assumptions.
(8) Joint ventures of the Columbia Power Corporation and Columbia Basin Trust. In October 2010, CPC/CBT reached an agreement for a partnership with Fortis Inc. to develop an electricity generating facility at the Waneta Dam south of Trail. Capital spending information reflects 49 per cent of the total project – CPC’s 32.5 per cent share combined with CBT’s 16.5 per cent share.
Second Quarterly Report 2012/13
22
Updated Financial Forecast
Table 1.15 2012/13 Provincial Debt (1)
| | Year-to-Date to September 30 | | Full Year | |
| | 2012/13 | | Actual | | 2012/13 | | Actual | |
($ millions) | | Budget | | Actual | | Variance | | 2011/12 | | Budget | | Forecast | | Variance | | 2011/12 | |
Taxpayer-supported debt | | | | | | | | | | | | | | | | | |
Provincial government operating | | 5,792 | | 4,561 | | (1,231 | ) | 3,849 | | 6,590 | | 6,639 | | 49 | | 5,117 | |
Provincial government general capital | | 2,696 | | 2,696 | | — | | 2,696 | | 2,696 | | 2,696 | | — | | 2,696 | |
Manage natural gas royalty impacts | | — | | — | | — | | — | | — | | (65 | ) | (65 | ) | — | |
Provincial government operating | | 8,488 | | 7,257 | | (1,231 | ) | 6,545 | | 9,286 | | 9,270 | | (16 | ) | 7,813 | |
Other taxpayer-supported debt (mainly capital) | | | | | | | | | | | | | | | | | |
Education (2) | | | | | | | | | | | | | | | | | |
School districts | | 6,758 | | 6,444 | | (314 | ) | 5,981 | | 6,985 | | 6,897 | | (88 | ) | 6,407 | |
Post-secondary institutions | | 4,282 | | 4,122 | | (160 | ) | 4,050 | | 4,349 | | 4,317 | | (32 | ) | 4,185 | |
| | 11,040 | | 10,566 | | (474 | ) | 10,031 | | 11,334 | | 11,214 | | (120 | ) | 10,592 | |
Health (2),(3) | | 5,590 | | 5,368 | | (222 | ) | 4,916 | | 5,864 | | 5,806 | | (58 | ) | 5,293 | |
Highways and public transit | | | | | | | | | | | | | | | | | |
BC Transportation Financing Authority (4) | | 6,567 | | 6,602 | | 35 | | 5,921 | | 7,074 | | 7,172 | | 98 | | 6,287 | |
Public transit | | 1,000 | | 1,000 | | — | | 1,000 | | 999 | | 1,000 | | 1 | | 1,000 | |
SkyTrain extension | | 1,175 | | 1,174 | | (1 | ) | 1,175 | | 1,175 | | 1,174 | | (1 | ) | 1,174 | |
BC Transit | | 186 | | 172 | | (14 | ) | 193 | | 176 | | 161 | | (15 | ) | 183 | |
| | 8,928 | | 8,948 | | 20 | | 8,289 | | 9,424 | | 9,507 | | 83 | | 8,644 | |
Other | | | | | | | | | | | | | | | | | |
Social housing (5) | | 664 | | 660 | | (4 | ) | 596 | | 660 | | 709 | | 49 | | 674 | |
Provincial government general capital | | 1,057 | | 906 | | (151 | ) | 647 | | 1,277 | | 1,224 | | (53 | ) | 808 | |
BC Pavilion Corporation | | 378 | | 383 | | 5 | | 337 | | 378 | | 398 | | 20 | | 383 | |
BC Immigrant Investment Fund | | 400 | | 381 | | (19 | ) | 366 | | 395 | | 369 | | (26 | ) | 398 | |
Other (6) | | 116 | | 78 | | (38 | ) | 95 | | 118 | | 70 | | (48 | ) | 87 | |
Impact of capital planning adjustments | | — | | — | | — | | — | | — | | (93 | ) | (93 | ) | — | |
| | 2,615 | | 2,408 | | (207 | ) | 2,041 | | 2,828 | | 2,677 | | (151 | ) | 2,350 | |
Total other taxpayer-supported | | 28,173 | | 27,290 | | (883 | ) | 25,277 | | 29,450 | | 29,204 | | (246 | ) | 26,879 | |
Total taxpayer-supported debt | | 36,661 | | 34,547 | | (2,114 | ) | 31,822 | | 38,736 | | 38,474 | | (262 | ) | 34,692 | |
Self-supported debt | | | | | | | | | | | | | | | | | |
Commercial Crown corporations | | | | | | | | | | | | | | | | | |
BC Hydro | | 15,032 | | 13,920 | | (1,112 | ) | 12,636 | | 15,336 | | 14,477 | | (859 | ) | 12,978 | |
Columbia River power projects (7) | | 480 | | 478 | | (2 | ) | 483 | | 476 | | 475 | | (1 | ) | 481 | |
BC Lotteries | | 113 | | 135 | | 22 | | 110 | | 128 | | 133 | | 5 | | 90 | |
Transportation Investment Corporation (Port Mann) | | 2,092 | | 2,505 | | 413 | | 1,631 | | 2,554 | | 2,495 | | (59 | ) | 1,779 | |
Post-secondary institutions’ subsidiaries | | 173 | | 202 | | 29 | | 173 | | 173 | | 202 | | 29 | | 173 | |
| | 17,890 | | 17,240 | | (650 | ) | 15,033 | | 18,667 | | 17,782 | | (885 | ) | 15,501 | |
Warehouse borrowing program | | — | | 299 | | 299 | | 1,522 | | — | | — | | — | | — | |
Total self-supported debt | | 17,890 | | 17,539 | | (351 | ) | 16,555 | | 18,667 | | 17,782 | | (885 | ) | 15,501 | |
Forecast allowance | | — | | — | | — | | — | | 200 | | 100 | | (100 | ) | — | |
Total provincial debt | | 54,551 | | 52,086 | | (2,465 | ) | 48,377 | | 57,603 | | 56,356 | | (1,247 | ) | 50,193 | |
(1) Debt is after deduction of sinking funds and unamortized discounts, and excludes accrued interest. Government direct and fiscal agency accrued interest is reported in the government’s accounts as an accounts payable.
(2) Includes debt and guarantees incurred by the government on behalf of school districts, universities, colleges and health authorities/hospital societies (SUCH), and debt directly incurred by these entities.
(3) Health facilities’ debt includes public-private partnership obligations of $952 million for the six months ended September 30, 2011, $1,011 million for the six months ended September 30, 2012, $995 million for fiscal 2011/12 and $1,117 million for fiscal 2012/13.
(4) BC Transportation Financing Authority debt includes public-private partnership obligations of $863 million for the six months ended September 30, 2011, $926 million for the six months ended September 30, 2012, $890 million for fiscal 2011/12 and $956 million for fiscal 2012/13.
(5) Includes the BC Housing Management Commission and the Provincial Rental Housing Corporation.
(6) Includes service delivery agencies, student loan guarantees, loan guarantees to agricultural producers, guarantees issued under economic development and home mortgage assistance programs and loan guarantee provisions.
(7) Joint ventures of the Columbia Power Corporation and Columbia Basin Trust.
Second Quarterly Report 2012/13
23
Updated Financial Forecast
Table 1.16 2012/13 Statement of Financial Position
| | Actual | | Year-to-Date | | Forecast | |
| | March 31, | | September 30, | | March 31, | |
($ millions) | | 2012 | | 2012 | | 2013 | |
Financial assets | | | | | | | |
Cash and temporary investments | | 3,239 | | 3,673 | | 3,262 | |
Other financial assets | | 8,133 | | 7,471 | | 8,334 | |
Sinking funds | | 1,491 | | 1,649 | | 1,802 | |
Investments in commercial Crown corporations: | | | | | | | |
Retained earnings | | 6,676 | | 6,776 | | 6,999 | |
Recoverable capital loans | | 14,846 | | 16,559 | | 17,104 | |
| | 21,522 | | 23,335 | | 24,103 | |
Warehouse borrowing program assets | | — | | 299 | | — | |
| | 34,385 | | 36,427 | | 37,501 | |
Liabilities | | | | | | | |
Accounts payable and accrued liabilities | | 8,833 | | 8,132 | | 9,078 | |
Deferred revenue | | 10,571 | | 11,088 | | 9,983 | |
Debt: | | | | | | | |
Taxpayer-supported debt | | 34,692 | | 34,547 | | 38,474 | |
Self-supported debt | | 15,501 | | 17,539 | | 17,782 | |
Forecast allowance | | — | | — | | 100 | |
Total provincial debt | | 50,193 | | 52,086 | | 56,356 | |
Add: debt offset by sinking funds | | 1,491 | | 1,649 | | 1,802 | |
Less : guarantees and non-guaranteed debt | | (730 | ) | (748 | ) | (712 | ) |
Financial statement debt | | 50,954 | | 52,987 | | 57,446 | |
| | 70,358 | | 72,207 | | 76,507 | |
Net liabilities | | (35,973 | ) | (35,780 | ) | (39,006 | ) |
Capital and other non-financial assets | | | | | | | |
Tangible capital assets | | 35,763 | | 36,229 | | 37,392 | |
Other non-financial assets | | 2,667 | | 2,646 | | 2,732 | |
| | 38,430 | | 38,875 | | 40,124 | |
Accumulated surplus (deficit) | | 2,457 | | 3,095 | | 1,118 | |
| | | | | | | |
Changes in Financial Position | | | | | | | |
| | | | | | | |
| | | | Year-to-Date | | Forecast | |
| | | | September 30, | | March 31, | |
($ millions) | | | | 2012 | | 2013 | |
| | | | | | | |
(Surplus) deficit for the period | | | | (648 | ) | 1,469 | |
Comprehensive income (increase) decrease | | | | 10 | | (130 | ) |
(Increase) decrease in accumulated surplus | | | | (638 | ) | 1,339 | |
Capital and other non-financial asset changes: | | | | | | | |
Increase in taxpayer-supported capital investments | | | | 1,487 | | 3,744 | |
Less: amortization and other accounting changes | | | | (1,021 | ) | (2,115 | ) |
Change in net capital assets | | | | 466 | | 1,629 | |
Increase (decrease) in other non-financial assets | | | | (21 | ) | 65 | |
| | | | 445 | | 1,694 | |
Increase (decrease) in net liabilities | | | | (193 | ) | 3,033 | |
Investment and working capital changes: | | | | | | | |
Increase (reduction) in cash and temporary investments | | | | 434 | | 23 | |
Increase in total investment in commercial Crown corporations: | | | | | | | |
Increase (decrease) in retained earnings | | | | 100 | | 323 | |
Self-supported capital investments | | | | 1,482 | | 3,207 | |
Less: loan repayments and other accounting changes | | | | 231 | | (949 | ) |
| | | | 1,813 | | 2,581 | |
Other working capital changes | | | | (21 | ) | 855 | |
| | | | 2,226 | | 3,459 | |
Increase (decrease) in financial statement debt | | | | 2,033 | | 6,492 | |
(Increase) decrease in sinking fund debt | | | | (158 | ) | (311 | ) |
Increase (decrease) in guarantees and non-guaranteed debt | | | | 18 | | (18 | ) |
Increase (decrease) in total provincial debt | | | | 1,893 | | 6,163 | |
Second Quarterly Report 2012/13
24
PART TWO — ECONOMIC REVIEW AND OUTLOOK (1)
2012/13 Second Quarterly Report | November 28, 2012 |
Summary
· Since Budget 2012, the Economic Forecast Council has lowered its outlook for British Columbia in both 2012 and 2013. The Council now pegs BC’s annual real GDP growth at 2.1 per cent in 2012 and 2.2 per cent in 2013, lower than its Budget 2012 projections of 2.2 per cent in 2012 and 2.5 per cent in 2013.
· In the first Quarterly Report, the Ministry of Finance forecast BC’s real GDP to grow by 2.0 per cent in 2012 and 1.8 per cent in 2013. These projections remain prudent relative to the recent Economic Forecast Council outlook for BC in 2012 and 2013.
· Data for the current year indicate improvement on several of BC’s economic indicators compared to 2011, but activity on some indicators has slowed in recent months.
· Downside risks to BC’s economic outlook include a return to recession in the US economy, slowing Asian demand and the ongoing sovereign debt crisis in Europe. Additional risks include a fluctuating Canadian dollar and continued volatility in global financial and commodity markets.
BC Outlook — Economic Forecast Council Projections
Chart 2.1 Economic Forecast Council downgrades BC forecast
BC real GDP (annual per cent change)
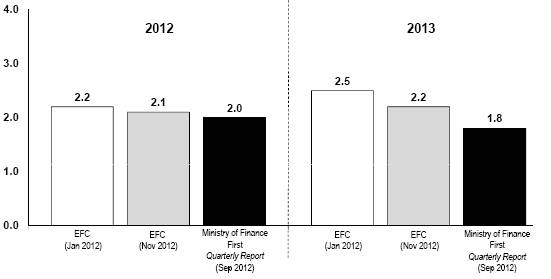
Sources: Ministry of Finance and Economic Forecast Council
In preparation for Budget 2013, the Minister of Finance met with members of the independent Economic Forecast Council in November 2012 to obtain their views on the economic outlook. The Council downgraded its forecast for BC’s economic growth since it was last surveyed in January 2012. The Council now estimates BC’s real GDP growth at 2.1 per cent in 2012 and 2.2 per cent in 2013. This is lower than its January forecast of 2.2 per cent in 2012 and 2.5 per cent in 2013. This downward revision reflects increased risks to the economic outlook, mainly due to external factors such as the weak US recovery, the European debt crisis and slowing Asian demand. The Ministry
(1) Reflects information available as of November 22, 2012.
Second Quarterly Report 2012/13
25
Economic Review and Outlook
will consider advice received from the Council when preparing its updated economic forecast, which will be presented in Budget 2013 along with a full report on the results of the annual Economic Forecast Council meeting.
The Ministry’s most recent forecast occurred in the first Quarterly Report, released September 13, 2012. In the report, the Ministry forecast BC’s real GDP to grow by 2.0 per cent in 2012 and 1.8 per cent in 2013. These projections remain prudent relative to the recent Economic Forecast Council projections for BC in 2012 and 2013.
British Columbia Economic Activity
Indicators of BC’s economic performance so far in 2012 reveal improvement in provincial economic activity compared to the same period in 2011. However, Table 2.1 shows quarterly declines in several key sectors of the provincial economy during the most recent quarter of this year.
Table 2.1 British Columbia Economic Indicators
| | | | | | Year-to-Date | |
| | Apr. to Jun. 2012 | | Jul. to Sep. 2012 | | Jan. to Sep. 2012 | |
| | change from | | change from | | change from | |
All data seasonally adjusted | | Jan. to Mar. 2012 | | Apr. to Jun. 2012 | | Jan. to Sep. 2011 | |
| | | | Per cent change | | | |
Employment | | +1.0 | | 0.0 | | +1.8 | |
Manufacturing shipments | | +0.3 | | +0.5 | | +0.8 | |
Exports | | -2.0 | | -1.9 | | -2.7 | |
Retail sales | | -0.4 | | -0.7 | | +3.2 | |
Housing starts | | +7.4 | | -2.8 | | +8.8 | |
Non-residential building permits | | +5.4 | | +9.4 | | +37.4 | |
Labour market
Employment in BC improved through the first ten months of 2012, as year-to-date data show a 1.8 per cent gain relative to the same period last year. This increase translates to 40,400 more jobs, with a gain of 52,800 in full-time employment offsetting a loss of 12,300 part-time jobs.
Chart 2.2 BC employment recovery continues
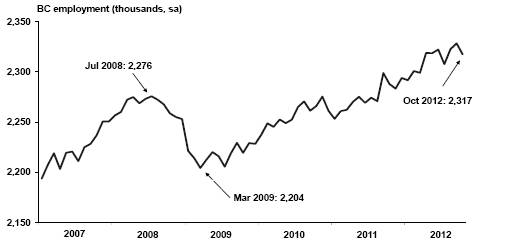
Source: statistics Canada
Second Quarterly Report 2012/13
26
Economic Review and Outlook
Significant year-to-date job gains were observed in manufacturing (+11.8 per cent), health care and social assistance (+7.5 per cent) and educational services (+5.0 per cent). Improvements in these industries helped to offset major job losses in public administration (-7.9 per cent), accommodation and food services (-6.5 per cent) and construction (-5.8 per cent).
The provincial unemployment rate averaged 6.8 per cent year-to-date to October, 0.8 percentage points below its average during the same period in 2011. Meanwhile, BC’s labour force grew by 1.0 per cent relative to the first ten months of last year.
Consumer spending and housing
Retail sales advanced 3.2 per cent year-to-date to September 2012, due to significant increases in sales at clothing and accessories stores and at auto dealerships. BC’s rate of retail sales growth through the first nine months of this year placed it fifth among provinces and slightly higher than the national average rate of 3.1 per cent.
Chart 2.3 BC retail sales slow in recent months
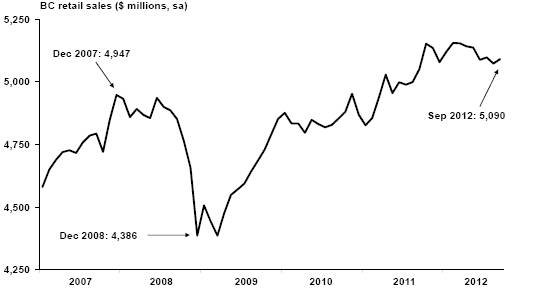
Source: Statistics Canada
Housing starts in BC were fairly strong through the first ten months of 2012, after trending flat in 2011. Despite losing some momentum in the most recent quarter, housing starts improved by 7.7 per cent year-to-date to October. Further, residential building permits (a precursor of new housing activity) rose by 15.2 per cent year-to-date to September.
MLS home sales in BC softened through the first ten months of 2012, falling by 10.4 per cent compared to the same period last year. At the same time, the average MLS home price in BC was around $518,700, a drop of 8.2 per cent year-to-date to October compared to the same period in 2011. The moderation in prices among BC homes comes after a hefty annual average price increase of 11.1 per cent in 2011 (with last year’s price jump partly due to a small number of very expensive home sales in tony areas of Vancouver). However, stricter mortgage rules recently introduced by the federal government have likely added some downward pressure to housing activity in the province.
Second Quarterly Report 2012/13
27
Economic Review and Outlook
Chart 2.4 BC housing starts
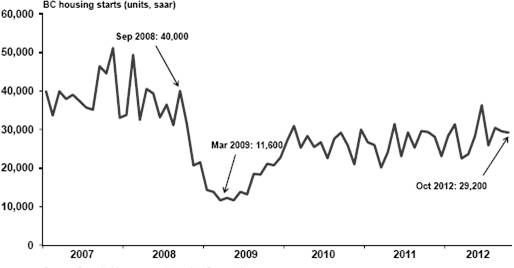
Source: Canada Mortgage and Housing Corporation
The value of total non-residential building permits rose 37.4 per cent through the first nine months of 2012 relative to the same period last year. Sizeable gains were observed in all categories of permits, including industrial (+160.7 per cent), institutional and government (+34.3 per cent) and commercial (+19.0 per cent).
External trade and commodity markets
The value of BC’s merchandise exports fell by 2.7 per cent year-to-date to September 2012 compared to the same period last year. Substantial declines were fuelled by losses in exports of energy products (-13.7 per cent) and metallic and non-metallic mineral products (-12.9 per cent). The substantial decrease in energy exports was due to year-to-date declines in the values of natural gas exports (-26.6 per cent), coal exports (-14.7 per cent) and electricity exports (-12.5 per cent). These losses offset year-to-date export gains in such sectors as industrial machinery, equipment and parts (+19.9 per cent) and farm, fishing and intermediate food products (+6.3 per cent).
Chart 2.5 BC exports slow in recent months
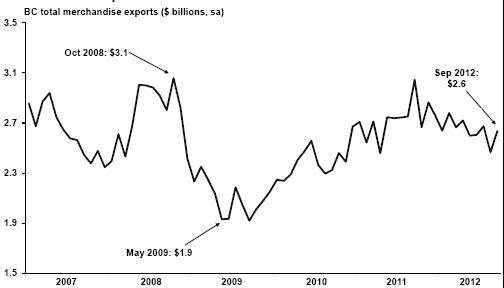
Source: BC Stats
Second Quarterly Report 2012/13
28
Economic Review and Outlook
Shipments of manufactured goods from BC were modest through the first nine months of 2012, up 0.8 per cent compared to the same period a year ago. Notable gains were recorded in shipments of transportation equipment (+33.5 per cent), machinery (+10.5 per cent) and non-metallic mineral products (+7.1 per cent), which worked to offset losses in sectors such as paper (-12.3 per cent) and primary metals (-6.5 per cent).
Although prices for most commodities have recovered since falling sharply in the 2008/09 recession, they are expected to remain volatile in the near-term due to ongoing global economic uncertainty (and the potential for further slowing of the Chinese economy).
The monthly lumber price began 2012 at $254 US/000 board feet in January and improved fairly steadily through the year to reach $310 US/000 board feet in August. The price fell slightly over the last two months, reaching $299 US/000 board feet in October. Year-to-date to October, the price of lumber averaged $289 US/000 board feet—an increase of 11.8 per cent compared to the first ten months of 2011. Recent positive data from the US housing market is likely having an upward effect on the lumber price, as more new homes are now under construction in the US than a year ago.
In contrast, the monthly price of pulp fell fairly steadily since reaching a record high in mid-2011 ($1,016 US per tonne), and arrived at $774 US per tonne in October 2012. Year-to-date to October, the price of pulp averaged $817 US per tonne, which is a sizeable drop of 16.5 per cent compared to the same period last year.
The price of oil was fairly high through the first ten months of this year, with the West Texas Intermediate (WTI) daily oil price averaging $95.39 US per barrel year-to-date to October. This represents a slight increase of 1.2 per cent compared to the same period in 2011. The daily oil price reached as high as $109.39 in February, retreating as low as $77.72 in June, and climbing again up to $98.94 in September. Meanwhile, the price of natural gas has hovered around historically low levels since early-2010. Plant Inlet prices averaged just $1.21 C/GJ year-to-date to October — a considerable drop from $2.54 C/GJ observed over the same period a year ago.
Risks to the Outlook
Risks to British Columbia’s economic outlook are largely weighted to the downside. The most significant risks to the current outlook include:
· a return to recession in the US economy (characterized by weaker consumer spending; further deleveraging causing slower investment; continued weakness in the housing sector; a very slow job market recovery; further fiscal restraint by federal, state and local governments; and potential fallout from the looming fiscal cliff);
· the European sovereign debt crisis — now posing significant problems in large economies like Italy and Spain — threatening the stability of global financial markets;
· slower than anticipated Asian demand resulting in weaker demand for BC’s exports;
· further appreciation of the Canadian dollar; and
· further weakening of the US dollar resulting in significant disruptions to global financial and commodity markets.
Second Quarterly Report 2012/13
29
Economic Review and Outlook
External Environment
United States
The slow pace of the US economic recovery continued through the first three quarters of 2012, as the weak labour market, sluggish business investment and concerns over the upcoming federal fiscal cliff (where current federal legislation dictates that large tax increases and spending cuts will take effect at the start of 2013, unless a stalled US Congress takes action to halt these changes) continued to dampen the pace of real GDP growth.
This long recovery period, following the housing collapse and ensuing financial crisis that began in late 2008, is likely to continue for several years. This is consistent with economic behaviour in a balance sheet recession — where the collapse of a large asset bubble is followed by at least a decade of weak activity and high unemployment.
Chart 2.6 Slow US economic growth in 2012
US real GDP (annualized q/q per cent change)
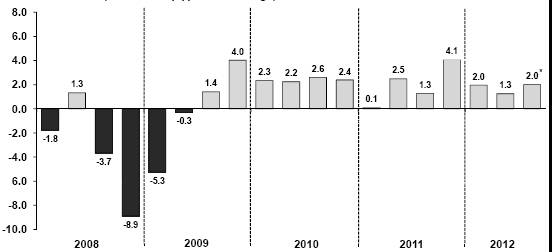
Source: US Bureau of Economic Analysis | *Advance estimate, subject to revision |
US real GDP grew modestly through the first three quarters of 2012, expanding at a 2.0 per cent annualized rate in the January to March quarter, followed by a 1.3 per cent increase in the April to June quarter and then a 2.0 per cent gain in the July to September period. Growth in the most recent quarter was led by government and consumer spending, residential investment and a slight drop in imports. These improvements helped to offset slower non-residential investment and exports. Private sector analysts point out that US businesses remain reluctant to hire and invest due to several factors including elevated fuel prices, growing uncertainty over the ongoing European economic crisis, and the looming federal fiscal cliff.
The US employment situation remains deeply troubled, with 4.3 million jobs lost since the January 2008 peak (a decline of 3.1 per cent). Although the monthly unemployment rate has gradually fallen since peaking at 10.0 per cent in October 2009, the rate still sat at a relatively high 7.9 per cent as of October 2012. Positive monthly job gains were
Second Quarterly Report 2012/13
30
Economic Review and Outlook
observed through the first ten months of 2012, at a pace of about 156,900 jobs per month. Year-to-date to October, US employment increased by 1.4 per cent, or 1.9 million jobs, compared to the same period in 2011. The majority of these year-to-date gains occurred in service industries, which added 1.6 million jobs, while goods-producing industries improved by about 310,000 jobs.
The American housing market showed signs of a nascent recovery through the first ten months of 2012. After a very weak 2011, US housing starts averaged 758,600 annualized units year-to-date to October 2012 and reached a monthly average of 894,000 annualized units in October (a four-year high). This represents a 27.7 per cent increase compared to the same period last year, but is still less than half of the level observed during the height of the housing boom in early 2006. Private sector economists explain that the stabilization of housing prices, historically low mortgage rates and demographic factors such as growing household formation will likely continue to support increases in residential construction.
At the same time, existing home sales in the US have improved by 8.2 per cent year-to-date to October compared to the same period in 2011. Sales reached 4.79 million annualized units in October 2012, down slightly from the two-year high of 4.83 million recorded in August. However, private sector analysts point out that the foreclosure inventory still looms large in many US states. This, in combination with modest job creation and a legacy of bad credit history for many Americans could work to provide a protracted recovery for the US housing market.
Chart 2.7 US housing starts improving
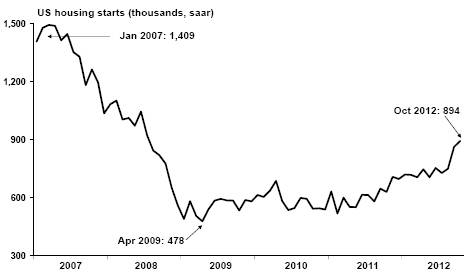
Source: U.S. Census Bureau
Forecasts for US economic growth in 2012 have held steady since the beginning of this year. The November 2012 Consensus Economics survey projects modest growth of 2.2 per cent for 2012, the same rate of increase expected in January of this year. However, Consensus forecasters have downgraded their average US forecast for 2013
Second Quarterly Report 2012/13
31
Economic Review and Outlook
considerably since January 2012. The November Consensus projects US real GDP growth to be 1.9 per cent next year, down from the 2.5 per cent increase forecast in January 2012. As reasons for lowering their outlooks, Consensus analysts cite waning global economic growth, shaky domestic demand, the severity of the recent drought in several US states and concerns over the upcoming fiscal cliff.
Chart 2.8 US Consensus outlook for 2013 downgraded in recent months
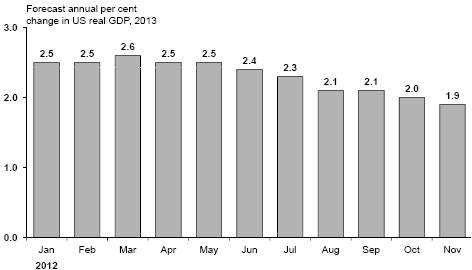
Source: Consensus Economics
The chart above represents forecasts for real GDP growth in 2013 as polled on specific dates. For example, forecasters surveyed on January 9, 2012 had an average 2013 US growth forecast of 2.5 per cent, while on November 12, 2012 they forecast 2013 US growth at 1.9 per cent.
Canada
Facing strong headwinds from a slowing global economy, the Canadian economy recorded modest increases in several major indicators relative to 2011. Overall, Canada’s real GDP increased by an annualized rate of 1.8 per cent in both the January to March and April to June quarters of this year. Gains in business investment and personal consumption during the April to June quarter worked to offset declines in government spending and net exports during this period.
After a 1.6 per cent annual gain in 2011, Canadian employment improved by 176,400 jobs (or 1.0 per cent) year-to-date to October 2012 compared to the same period a year ago. Through the first ten months of 2012, the national unemployment rate averaged 7.3 per cent, falling 0.1 percentage points compared to same period in 2011. Also domestically, the national retail and housing markets showed solid gains compared to last year. Canadian retail sales increased by 3.1 per cent year-to-date to September 2012, while housing starts advanced 12.8 per cent year-to-date to October to average 218,100 annualized units.
Despite slowing global demand and a high currency, Canada’s trade sector made significant gains year-to-date to September compared to the same period in 2011. The value of Canadian merchandise exports rose by 3.8 per cent year-to-date to
Second Quarterly Report 2012/13
32
Economic Review and Outlook
September compared to the first nine months of last year, boosted by improvements in exports of energy (largely due to a 13.3 per cent increase in oil exports), automotive goods and machinery and equipment. Despite the strength in Canadian exports through 2012 relative to last year, sluggish demand from a slowing world economy resulted in a 4.5 per cent decline for this indicator during the July to September quarter compared to the April to June quarter. In addition, shipments of Canadian manufactured goods also improved over last year, as their total value climbed by 5.0 per cent year-to-date to September.
The most immediate threats to Canadian economic growth stem from international markets: slowing demand from Asian nations, further weakness in the US (including the upcoming fiscal cliff) and the looming threat of a global financial market shock being sparked by one or more sovereign debt defaults in Europe. If the European situation continues to deteriorate, the economies of the US and several Asian countries could face significant downward pressure due to their strong trade connections with Europe. As a result, Canada could see considerable weakening in its exports due its trade connections with the US and Asia.
Acknowledging the considerable risks to Canadian economic growth going forward, Federal Finance Minister Jim Flaherty recently lowered the federal government’s assumptions for Canada’s near-term GDP growth. This downgrade to federal nominal GDP growth projections in 2012 and 2013 resulted in larger than expected deficits in the coming years than were forecast earlier in 2012. As such, Minister Flaherty has pushed out his target fiscal year for returning to a budget surplus to 2016/17 from the previous target of 2015/16.
Private sector economists have held their average forecast fairly steady for the Canadian economy in 2012, with the November Consensus expecting Canada’s real GDP to grow by 2.0 per cent — the same rate forecast in January.
Chart 2.9 Consensus projects modest Canadian growth in 2013
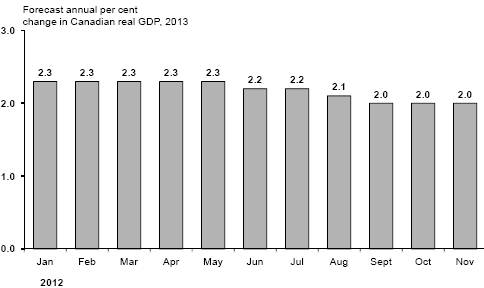
Source: Consensus Economics
The chart above represents forecasts for real GDP growth in 2013 as polled on specific dates. For example, forecasters surveyed on January 9, 2012 had an average 2013 Canadian growth forecast of 2.3 per cent, while on November 12, 2012 they forecast 2013 Canadian growth at 2.0 per cent.
Second Quarterly Report 2012/13
33
Economic Review and Outlook
However, Consensus expectations for the Canadian economy in 2013 have been lowered in recent months. The November Consensus now projects Canadian growth of 2.0 per cent next year, down from the 2.3 per cent forecast in January 2012. Consensus economists cite the upcoming US fiscal cliff as a major risk to Canadian economic growth in 2013.
Europe
The ongoing European sovereign debt crisis presents a large and immediate threat to the global economic outlook. In the July to September quarter, euro zone GDP shrank by 0.6 per cent compared to same quarter in 2011. The economies of member nations Greece, Italy, Spain and Portugal contracted sharply during the third quarter, while growth continued to slow in Germany. As several heavily indebted European nations now implement severe austerity measures to tackle massive deficits, violent protests and social unrest are becoming frequent occurrences within the populations of these struggling countries.
Greece’s economy had the most severe downturn of all euro zone members in the July to September quarter, shrinking by 7.2 per cent compared to the same quarter a year ago. This large decline followed year-over-year contractions of 6.3 per cent in the second quarter and 6.7 per cent in the first quarter. In early November, the Greek government passed a new austerity bill, which will further cut salaries and pensions and increase taxes. Greece’s leaders hope these measures will persuade the nation’s international creditors to release the next €31.5 billion installment of much needed bailout loans. Analysts suggest that with the Greek economy headed for a sixth straight year of contraction and more than one quarter of the country’s workers unemployed, additional austerity will likely worsen Greece’s economic situation and further impoverish the country.
Chart 2.10 Consensus lowers 2013 expectations for faltering Euro zone
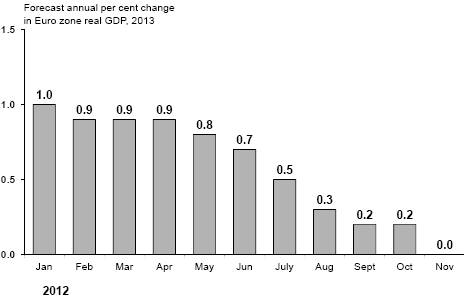
Source: Consensus Economics
The chart above represents forecasts for real GDP growth in 2013 as polled on specific dates. For example, forecasters surveyed on January 9, 2012 had an average 2013 Euro zone growth forecast of 1.0 per cent, while on November 12, 2012 they forecast 2013 Euro zone growth at 0.0 per cent (or no growth).
Second Quarterly Report 2012/13
34
Economic Review and Outlook
The deeply troubled Spanish economy continued to contract during the July to September period, falling 1.6 per cent compared to the same quarter in 2011. Meanwhile, the country’s employment situation continues to deteriorate (the unemployment rate reached 25.8 per cent in September) at a time when the Spanish government is debating whether to seek international aid to alleviate some of its massive debt troubles. The government recently introduced highly unpopular spending cuts and tax increases in an attempt to reduce the nation’s deficit, but critics argue that these measures will only result in higher unemployment and reduced economic activity.
With the euro zone now in recession, private sector forecasters have continued to lower their projections for euro zone real GDP growth in both 2012 and 2013. As such, the November Consensus pegs euro zone real GDP to contract by 0.5 per cent this year, followed by 0.0 per cent growth (or no growth) in 2013.
China
With Europe in recession and the US economy mired in a very slow recovery, China now stands as the world’s most important engine of growth. However, the rapidly expanding Chinese economy has shown signs of cooling in recent months. China’s real GDP increased by 7.4 per cent in the July to September quarter of 2012 compared to the same period in 2011. Although industrial output, retail sales, exports and fixed asset investments saw improvement in September, these monthly gains were insufficient to offset the loss of economic momentum observed in July and August. Waning demand from several struggling European economies is now taking its toll on China’s industrial production, which could soon prompt the Chinese government to deploy both monetary easing and fiscal spending to prop up economic growth.
The November 2012 Consensus forecasts China’s real GDP to expand by 7.7 per cent in 2012 and 8.1 per cent in 2013. As the Chinese economy is slowing somewhat from the rapid expansion it experienced in recent years, whether or not a soft landing occurs after the current slowdown will have significant implications for the stability of world financial markets and for the economic well-being of China’s trading partners.
Financial markets
Interest rates
At its most recent meeting in October 2012, the Bank of Canada announced that it will continue to hold its target for the overnight rate at 1.00 per cent (where the rate has remained since September 2010). Bank officials cited the gradual US recovery, the European recession and slowing economic growth in China and other emerging economies (despite recent signs of stabilization) as reasons for maintaining the rate at 1.00 per cent. Most private sector forecasters expect the Bank to postpone tightening monetary policy until the second half of 2013.
The US Federal Reserve has held its intended federal funds rate in the 0.00 to 0.25 per cent range since December 2008. At its October 2012 meeting, the Fed cited strained global financial markets and slow employment growth as factors behind its decision to hold the rate in this range. However, the Fed also noted that the US housing sector has recently shown signs of improvement, albeit from a depressed level. The Fed recently announced that it will keep the fed funds rate at its current level until mid-2015. As such, private sector economists anticipate that the rate will remain in the 0.00 to 0.25 per cent range for the next few years.
Second Quarterly Report 2012/13
35
Economic Review and Outlook
Chart 2.11 Interest rates expected to remain low in the near-term

Sources: Bank of Canada, US Federal Reserve and private sector forecasts.
The average of private sector forecasters’ views on Canadian short-term interest rates (three-month Treasury bills) as of October 22, 2012 indicates that three-month rates will average 1.0 per cent in 2012 and 1.2 per cent in 2013. The same forecasters project ten-year Government of Canada bonds to average 1.9 per cent in 2012 and 2.1 per cent in 2013.
Table 2.2 Private Sector Canadian Interest Rate Forecasts
| | 3-month Treasury Bill | | 10-year Government Bond | |
Average annual interest rate (per cent) | | 2012 | | 2013 | | 2012 | | 2013 | |
IHS Global Insight | | 1.0 | | 1.2 | | 1.9 | | 2.3 | |
CIBC | | 1.0 | | 1.0 | | 1.9 | | 2.3 | |
Bank of Montreal | | 1.0 | | 1.1 | | 1.8 | | 1.9 | |
Scotiabank | | 1.0 | | 1.0 | | 1.9 | | 2.0 | |
TD Economics | | 1.0 | | 1.3 | | 1.9 | | 2.2 | |
RBC Capital Markets | | 1.0 | | 1.5 | | 1.9 | | 2.2 | |
Average (as of October 22, 2012) | | 1.0 | | 1.2 | | 1.9 | | 2.1 | |
Second Quarterly Report 2012/13
36
Economic Review and Outlook
Exchange rate
The Canadian dollar began 2012 just below parity with the US dollar and remained near parity through the first ten months of the year. The loonie reached as high as 103.0 US cents in September, largely due to weakness in the US dollar. As of November 22, 2012, the loonie was valued slightly above parity with the US dollar, at 100.3 US cents.
Chart 2.12 Private sector expects Canadian dollar near parity in the near-term
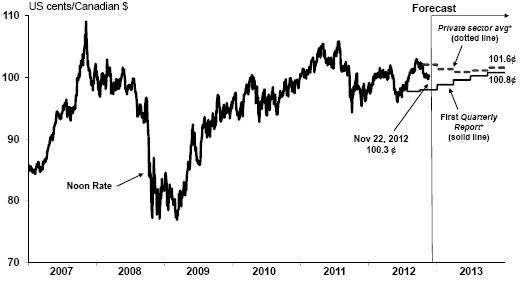
Sources: Bank of Canada and private sector forecasts
* Private sector average as of October 22, 2012 (BMO, CIBC, IHS Global Insight, RBC, Scotiabank and TD). First Quarterly Report 2012 as of July 23, 2012.
An average of six private sector forecasts as of October 22, 2012 calls for the Canadian dollar to average 100.4 US cents in 2012 and 101.2 US cents in 2013.
Table 2.3 Private Sector Exchange Rate Forecasts
Average annual exchange rate (US cents/Can $) | | 2012 | | 2013 | |
IHS Global Insight | | 100.1 | | 97.3 | |
CIBC | | 100.5 | | 101.3 | |
Bank of Montreal | | 100.5 | | 101.1 | |
Scotiabank | | 100.6 | | 103.8 | |
TD Economics | | 100.1 | | 99.0 | |
RBC Capital Markets | | 100.3 | | 104.9 | |
Average (as of October 22, 2012) | | 100.4 | | 101.2 | |
Second Quarterly Report 2012/13
37
Economic Review and Outlook
Provincial Economic Accounts Update
Statistics Canada released its estimates of provincial GDP for 2011 on November 19, 2012.
Periodically, the provincial and territorial economic accounts undergo historical revisions, which are much broader in scope than the regular revisions undertaken on an annual basis. These historical revisions are reserved for incorporating updated international accounting standards, as well as conceptual, classification, presentational and major statistical changes. The November 19 revision includes major changes to the provincial and territorial expenditure and income accounts. The latest revisions date back to 2007; revisions dating back to 1981 will be released in 2013.
Some of these conceptual changes involve providing more disaggregation of existing information, while other changes involve the inclusion of new categories that were not previously being captured in the data. For example:
· familiar terms such as corporate profits, labour income and personal expenditures, will no longer appear in Statistics Canada text or tables, and instead, the revisions will add new variables and concepts, such as compensation of employees, gross operating surplus, gross mixed income and household final consumption expenditure.
· the corporate sector will be split so that transactions of non-financial corporations will be identified separately from those of financial corporations.
· non-profit institutions serving households and Aboriginal general governments will be articulated as separate sectors.
· an additional investment category called intellectual property products is being added that includes investment made by businesses in the area of research and development, software and mineral exploration.
Full details on these revisions are available on the Statistics Canada website http://www.statcan.gc.ca/ nea-cen/hr2012-rh2012/start-debut-eng.htm
Latest BC Data
British Columbia’s real GDP expanded by 2.8 per cent in 2011, following a 3.2 per cent increase the previous year. BC registered the fourth strongest growth rate among provinces last year, behind Alberta (5.1 per cent), Saskatchewan (4.9 per cent) and Newfoundland and Labrador (3.0 per cent). Overall, Canadian real GDP rose 2.6 per cent in 2011.
Chart 1 – Real GDP in Canadian provinces
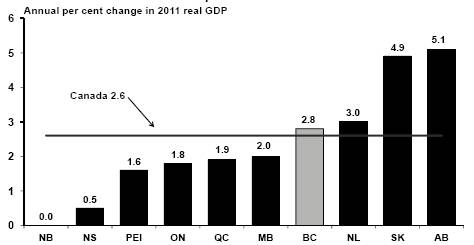
Source: Statistics Canada
Second Quarterly Report 2012/13
38
Economic Review and Outlook
Contributing to BC’s 2.8 per cent increase in real GDP was a 9.3 per cent increase in business investment, driven by strong gains in the non-residential structures and machinery and equipment categories. Meanwhile, the pace of consumer spending slowed last year to reach 2.2 per cent, after a 3.3 per cent gain in 2010. In 2011, the volume of BC’s exports of goods and services to other countries and provinces advanced 4.9 per cent due to notable gains in exports of commodities such as lumber, pulp, copper and coal. At the same time, government spending (federal, provincial, local and Aboriginal) on goods and services grew by 1.2 per cent (down from 2.2 per cent growth in 2010). Meanwhile, real imports of goods and services rose by 6.6 per cent (following a 9.7 per cent gain in 2010).
Real GDP
Chart 2 shows the annual growth in BC’s real GDP from 2008 to 2011. The most recent year saw the pace of BC’s economic growth slow somewhat, after registering a 3.2 per cent increase in 2010.
Nominal GDP
The level of BC’s nominal GDP in 2008, 2009, 2010 and 2011 are presented in Chart 3. The recently released data reveal a nominal GDP increase of $9.5 billion (or 4.5 per cent) in 2011, following a $12.6 billion (or 6.5 per cent) gain during in the previous year. Following the latest revisions to nominal GDP, the BC government’s debt to GDP ratio is now 15.9 per cent in 2011/12, lower than the 16.2 per cent noted in the first Quarterly Report.
Chart 2 — BC real GDP
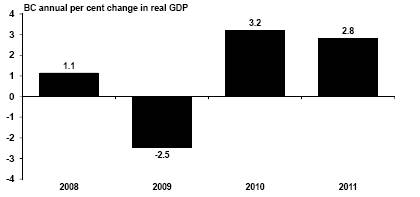
Source: Statistics Canada
Chart 3 — BC nominal GDP
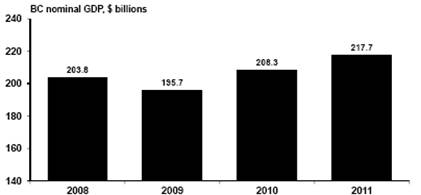
Source: Statistics Canada
Second Quarterly Report 2012/13
39