Exhibit 99.7
Second Quarterly Report
2014/15 Financial Update,
Economic Outlook
&
Six Month Financial Results
April — September 2014

British Columbia Cataloguing in Publication Data British Columbia. Ministry of Finance. Quarterly report on the economy, fiscal situation and Crown corporations. — ongoing— Quarterly. Title on cover: Quarterly report. Continues: British Columbia. Ministry of Finance. Quarterly financial report. ISSN 0833-1375. ISSN 1192-2176 — Quarterly Report on the economy, fiscal situation and Crown corporations. 1. Finance, Public — British Columbia — Accounting — Periodicals. 2. British Columbia — Economic conditions — 1945— — Periodicals.* 3. Corporations, Government — British Columbia — Accounting — Periodicals. I. Title. HJ13.B77 354.711’007231’05 |
TABLE OF CONTENTS | | |
| | |
2014/15 Second Quarterly Report | | November 26, 2014 |
Part One — Updated Financial Forecast | |
Introduction | 1 |
Revenue | 3 |
Expense | 5 |
Consolidated Revenue Fund spending | 5 |
Contingencies | 6 |
Spending recovered from third parties | 6 |
Operating transfers to service delivery agencies | 6 |
Service delivery agency spending | 6 |
Government employment (FTEs) | 6 |
Provincial capital spending | 7 |
Projects over $50 million | 7 |
Provincial debt | 8 |
Risks to the fiscal forecast | 9 |
Supplementary schedules | 10 |
| |
Tables: | |
1.1 | 2014/15 Forecast Update | 1 |
1.2 | 2014/15 Financial Forecast Changes | 2 |
1.3 | 2014/15 Capital Spending Update | 7 |
1.4 | 2014/15 Provincial Debt Update | 8 |
| |
Supplementary schedules | |
1.5 | Operating Statement | 10 |
1.6 | Revenue by Source | 11 |
1.7 | Expense by Ministry, Program and Agency | 12 |
1.8 | Expense by Function | 13 |
1.9 | Material Assumptions — Revenue | 14 |
1.10 | Material Assumptions — Expense | 19 |
1.11 | Full-Time Equivalents | 21 |
1.12 | Capital Spending | 21 |
1.13 | Capital Expenditure Projects Greater Than $50 million | 22 |
1.14 | Provincial Debt | 24 |
1.15 | Statement of Financial Position | 25 |
| |
Part Two — Economic Review and Outlook | |
Summary | 27 |
British Columbia outlook — comparison to private sector forecasts | 27 |
Second Quarterly Report 2014/15
British Columbia economic activity | 28 |
Labour market | 28 |
Consumer spending and housing | 29 |
External trade and commodity markets | 30 |
Risks to the economic outlook | 32 |
External environment | 32 |
United States | 32 |
Canada | 35 |
Europe | 36 |
China | 37 |
Financial markets | 38 |
Exchange rate | 39 |
| |
Tables: | |
| | |
2.1 | British Columbia Economic Indicators | 28 |
2.2 | Private Sector Canadian Interest Rate Forecasts | 39 |
2.3 | Private Sector Exchange Rate Forecasts | 39 |
| | |
Topic Box: | |
| |
Provincial Economic Accounts Update | 40 |
Second Quarterly Report 2014/15
ii
PART ONE — UPDATED FINANCIAL FORECAST
2014/15 Second Quarterly Report | November 26, 2014 |
Introduction
Table 1.1 2014/15 Forecast Update
($ millions) | | Budget
2014 | | First
Quarterly
Report | | Second
Quarterly
Report | |
Revenue | | 44,800 | | 45,315 | | 45,509 | |
Expense | | (44,416 | ) | (44,849 | ) | (44,865 | ) |
Surplus before forecast allowance | | 384 | | 466 | | 644 | |
Forecast allowance | | (200 | ) | (200 | ) | (200 | ) |
Surplus | | 184 | | 266 | | 444 | |
Capital spending: | | | | | | | |
Taxpayer-supported capital spending | | 4,030 | | 4,198 | | 4,012 | |
Self-supported capital spending | | 2,590 | | 2,651 | | 2,651 | |
| | 6,620 | | 6,849 | | 6,663 | |
Provincial Debt: | | | | | | | |
Taxpayer-supported debt | | 43,075 | | 42,290 | | 41,990 | |
Self-supported debt | | 21,463 | | 21,257 | | 21,253 | |
Total debt (including forecast allowance) | | 64,738 | | 63,747 | | 63,443 | |
Taxpayer-supported debt-to-GDP ratio: | | | | | | | |
As previously forecast | | 18.4 | % | 18.1 | % | | |
Impact of Statistics Canada update 1 | | -0.3 | % | -0.3 | % | | |
Restated and second quarter projections | | 18.1 | % | 17.8 | % | 17.7 | % |
1 See Provincial Economic Accounts Update topic box on page 40.
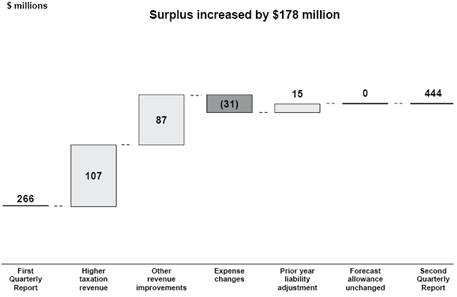
The second quarter fiscal outlook for 2014/15 forecasts a surplus of $444 million — $178 million higher than the projection in the first Quarterly Report. The outlook reflects a $194 million increase in revenue due to higher taxation revenue as well as improvement in other revenue sources. The revenue improvements were partially offset by a $16 million net increase in expenses and prior year liability adjustments.
Chart 1.1 Operating changes from the first Quarterly Report
Second Quarterly Report 2014/15
| Updated Financial Forecast |
Table 1.2 2014/15 Financial Forecast Changes
| | ($ millions) | |
2014/15 surplus — Budget 2014 (February 18, 2014) | | 184 | | | | 184 | |
2014/15 surplus — first Quarterly Report (September 9, 2014) | | | | 266 | | | |
| | Q1
Update | | Q2
Update | | Total
Changes | |
Revenue changes: | | | | | | | |
Personal income tax — mainly higher 2013 tax assessments | | 337 | | — | | 337 | |
Corporate income tax — increased federal government instalments and prior-year adjustment, reflecting higher 2013 tax assessments | | 119 | | 18 | | 137 | |
Provincial sales tax — carryforward impact of lower 2013/14 sales revenue results | | (218 | ) | — | | (218 | ) |
Property transfer tax — stronger year-to-date sales results | | 50 | | 100 | | 150 | |
Other taxation sources | | (13 | ) | (11 | ) | (24 | ) |
Natural gas royalties — mainly higher prices and changes in volumes partially offset by higher utilization of royalty programs | | 202 | | 12 | | 214 | |
Forests — mainly changes in stumpage rates and harvest volumes | | 46 | | (31 | ) | 15 | |
Coal, metals and minerals — lower coal prices and and higher mining costs | | (98 | ) | (8 | ) | (106 | ) |
Other natural resources | | 6 | | (11 | ) | (5 | ) |
Fees, investment earnings and miscellaneous sources — mainly changes in revenue from SUCH sector entities | | (51 | ) | 47 | | (4 | ) |
Health and social transfers — lower entitlement for prior years and changes in 2014 population share | | (30 | ) | 4 | | (26 | ) |
Other federal government transfers — mainly higher revenue from SUCH sector entities | | 44 | | 5 | | 49 | |
Commercial Crown agencies operating results: | | | | | | | |
ICBC — mainly claims cost savings and higher investment income | | 111 | | 71 | | 182 | |
Other commercial Crown agencies changes | | 10 | | (2 | ) | 8 | |
Total revenue changes | | 515 | | 194 | | 709 | |
Less : expense increases (decreases): | | | | | | | |
Consolidated Revenue Fund changes: | | | | | | | |
Statutory spending: | | | | | | | |
Direct fire costs | | 287 | | (50 | ) | 237 | |
Emergency program flood-related costs | | 14 | | 1 | | 15 | |
Teachers’ Pension Plan liability adjustment | | 66 | | — | | 66 | |
BC Training and Education Savings Program — higher eligibilty volumes | | 8 | | — | | 8 | |
Elections BC | | 3 | | — | | 3 | |
BC Timber Sales | | — | | 3 | | 3 | |
Refundable tax credit transfers | | (6 | ) | 46 | | 40 | |
Prior year liability adjustments | | — | | (15 | ) | (15 | ) |
Management of public debt (net) — reflects lower interest rates and revisions to scheduled borrowing | | (15 | ) | (14 | ) | (29 | ) |
Spending funded by third party recoveries | | 8 | | 13 | | 21 | |
(Increase) decrease in operating transfers to service delivery agencies | | 34 | | 91 | | 125 | |
Changes in spending profile of service delivery agencies: | | | | | | | |
School districts — lower operating expenses due to job action | | (163 | ) | (97 | ) | (260 | ) |
Universities — higher amortization and grants to third parties | | 14 | | (1 | ) | 13 | |
Colleges — primarily higher amortization costs | | (10 | ) | 20 | | 10 | |
Health authorities and hospital societies — increasing demand for healthcare services | | 110 | | 26 | | 136 | |
Other service delivery agencies | | 7 | | (7 | ) | — | |
Removal of expenditure management targets from fiscal plan | | 76 | | — | | 76 | |
Total expense increases | | 433 | | 16 | | 449 | |
Total changes | | 82 | | 178 | | 260 | |
2014/15 surplus — first Quarterly Report | | 266 | | | | | |
2014/15 surplus — second Quarterly Report | | | | 444 | | 444 | |
Second Quarterly Report 2014/15
2
Updated Financial Forecast | |
Projected taxpayer-supported capital spending has decreased by $186 million, reflecting lower spending on health facilities, post secondary infrastructure and transportation projects mainly due to updated project scheduling.
The taxpayer-supported debt forecast is $300 million lower compared to the projection in the first Quarterly Report mainly due to better than expected results in government’s cash management initiative and reductions in capital financing requirements. Self-supported debt is virtually unchanged, reflecting a $4 million reduction.
Taxpayer-supported debt to GDP is now projected to be 17.7 per cent. The debt to GDP ratio reflects a 0.1 percentage point reduction since the first Quarterly Report as a result of the lower debt forecast. A further 0.3 percentage point reduction in the ratio is due to the carry forward impact of Statistics Canada’s revision of historical nominal GDP numbers.
The forecast allowance has been left unchanged at $200 million, reflecting continuing volatility in some revenue sources (e.g. sales tax, natural gas royalties, and mineral levies).
Revenue
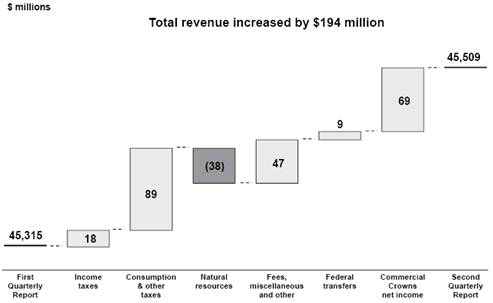
Revenue for 2014/15 is forecast to be $45.5 billion – $194 million higher than the projection in the first Quarterly Report. The improvement reflects additional revenue from taxation sources, federal transfers, commercial Crown corporations and other taxpayer-supported sources, partially offset by a reduction in natural resources revenue.
Detailed revenue projections are disclosed in Table 1.6, and key assumptions and sensitivities relating to revenue are provided in Table 1.9. Major changes from the first Quarterly Report include the following:
Chart 1.2 Revenue changes from the first Quarterly Report
Second Quarterly Report 2014/15
3
| Updated Financial Forecast |
Income tax revenue
Personal income tax revenue is unchanged from first Quarterly Report.
Corporate income tax revenue is up $18 million mainly due to higher federal government instalments, reflecting 2013 tax assessment results.
Consumption and other tax revenue
Property transfer tax revenue is up $100 million reflecting higher than expected results in the housing market. Other taxation revenues are down $11 million.
Natural resources revenue
Revenue from natural gas royalties is up $12 million mainly due to a 1.8 per cent increase in natural gas production volumes, partially offset by higher utilization of royalty programs and infrastructure credits.
Forests revenue is down $31 million due to lower stumpage revenue resulting from lower stumpage rates and a decline in harvest volumes.
Other natural resource revenues are projected to have a net decline of $19 million:
· Revenue from sales of Crown land tenures is up $16 million mainly due to the effects of stronger bid prices and auctioned land volumes.
· Columbia River Treaty electricity sales revenue is down $12 million due to lower electricity prices.
· Revenue from coal, metals and minerals is down $8 million reflecting the effects of higher mining cost and lower metal prices.
· Other natural resource revenue is down $15 million mainly due to lower proceeds from water rentals and licenses, and the effects of lower petroleum prices.
Other revenue
Revenue from fees, licenses, investment earnings and other miscellaneous sources is up $47 million mainly due to higher forecasts of own-source revenue provided by SUCH sector entities and improved investment earnings predominately reflecting increased recoveries through the Fiscal Agency Loan program.
Federal government transfers
Canada Health and Social Transfers are up $4 million mainly reflecting $9 million increase due to a higher BC population share of the national total partly offset by $5 million reduction related to prior years (2012/13 and 2013/14). Other federal government contributions are expected to be up $5 million mainly due to increased transfers to taxpayer-supported Crown agencies.
Second Quarterly Report 2014/15
4
Updated Financial Forecast | |
Commercial Crown corporations
The outlook for commercial Crown corporation net income is up $69 million mainly reflecting improvements in the forecasts from ICBC and the BC Lottery Corporation.
· ICBC’s net income projections (adjusted to government’s fiscal year) are up $71 million mainly due to higher investment income and premium revenues, and lower insurance operating costs.
· BCLC’s forecast is up $15 million, mainly due to higher net win (revenue less prizes and other direct costs), lower operating costs, and a reduction in capital amortization expense.
The above improvements were partially offset by a combined $17 million reduction in the net income projections of other commercial Crown corporations.
Expense
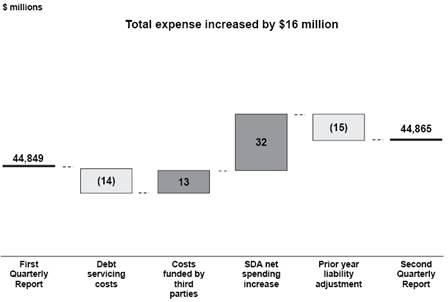
At $44.9 billion, the government spending forecast for 2014/15 is $16 million higher compared to the projection in the first Quarterly Report, reflecting higher costs funded by third parties and increased service delivery agency spending, partially offset by lower debt servicing costs and the impact of a prior year liability adjustment.
Chart 1.3 Expense changes from the first Quarterly Report
Consolidated Revenue Fund spending
Ministry spending is forecasted to be down $29 million compared to the first Quarterly Report projection due to reduced debt servicing costs resulting from lower debt levels ($14 million) and adjustments to prior year liabilities ($15 million).
There is no change in overall statutory spending, with an increase in refundable tax credit payments resulting from higher tax assessments ($46 million) and other increases ($4 million) offset by lower forecasted direct fire costs ($50 million) due to favorable late season conditions.
Second Quarterly Report 2014/15
5
| Updated Financial Forecast |
Contingencies
Budget 2014 included a Contingencies vote allocation of $300 million in 2014/15 to help manage unexpected costs and pressures as well as fund priority initiatives, including the 2014 public sector compensation mandate and LNG development. This allocation is unchanged in the second Quarterly Report forecast.
Spending recovered from third parties
Spending funded by third parties is forecasted to increase by $13 million primarily due to the impact of currency exchange rates on sinking funds for foreign currency denominated debt.
Operating transfers to service delivery agencies
Operating transfers to service delivery agencies are forecast to be $91 million lower mainly due to reduced grants to school districts as a result of the teachers’ job action, offset by adjustments to projected health organization allocations in response to spending forecast changes noted below.
Service delivery agency spending
Service delivery agency spending forecast is $59 million lower than the projection in the first Quarterly Report:
· School district spending is forecast to be $97 million lower than the first Quarterly Report due to further reduced teacher compensation costs as a result of continuing job action in the summer and fall, partially offset by estimated settlement costs.
· Post secondary sector spending is $19 million higher due to higher estimates for asset amortization and grants to third parties (e.g. student bursaries).
· Health authority and hospital society spending is forecast to be up $26 million mainly due to revised estimates for operating costs incurred in support of the increasing demand for healthcare services delivered by these organizations.
· Other service delivery agency spending is projected to decrease by $7 million mainly reflecting lower transportation costs partially offset by increased spending on housing initiatives.
Detailed expense projections are disclosed in Table 1.7. Key spending assumptions and sensitivities are provided in Table 1.10.
Government employment (FTEs)
The projection of government employment for 2014/15 has been decreased by 130 full time equivalents since the first Quarterly Report due to lower than expected staffing requirements to fight forest fires. Further details on FTEs are provided in Table 1.11.
Second Quarterly Report 2014/15
6
Updated Financial Forecast | |
Provincial capital spending
Capital spending is projected to total $6.7 billion in 2014/15 — $186 million lower than the forecast in the first Quarterly Report (see Tables 1.3 and 1.12).
Table 1.3 2014/15 Capital Spending Update
| | ($ millions) | |
2014/15 capital spending — Budget 2014 (February 18, 2014) | | 6,620 | | | | 6,620 | |
2014/15 capital spending — first Quarterly Report (September 9, 2014) | | | | 6,849 | | | |
| | Q1 | | Q2 | | Total | |
| | Update | | Update | | Changes | |
Taxpayer-supported changes: | | | | | | | |
Health project approvals since Budget 2014 | | 94 | | — | | 94 | |
Changes in internally-financed spending: | | | | | | | |
– health authorities | | 129 | | (27 | ) | 102 | |
– post secondary institutions | | (9 | ) | (57 | ) | (66 | ) |
Project scheduling changes: | | | | | | | |
– health facilities | | — | | (7 | ) | (7 | ) |
– school projects | | (5 | ) | — | | (5 | ) |
– transportation projects | | (29 | ) | (68 | ) | (97 | ) |
– other | | (12 | ) | (27 | ) | (39 | ) |
Total taxpayer-supported | | 168 | | (186 | ) | (18 | ) |
Self-supported changes: | | | | | | | |
Carry-over of prior year budgeted spending: | | | | | | | |
– Port Mann Bridge/Highway 1 | | 37 | | — | | 37 | |
– Columbia River power projects — Waneta Dam expansion | | 26 | | — | | 26 | |
Other | | (2 | ) | — | | (2 | ) |
Total self-supported | | 61 | | — | | 61 | |
Total changes | | 229 | | (186 | ) | 43 | |
2014/15 capital spending — first Quarterly Report | | 6,849 | | | | | |
2014/15 capital spending — second Quarterly Report | | | | 6,663 | | 6,663 | |
Taxpayer-supported capital spending is projected at $4.0 billion. The $186 million decrease since the first Quarterly Report mainly reflects lower forecast spending due to construction schedule adjustments (mainly in the areas of health facilities and transportation projects) and lower forecast spending on self-funded health and post secondary institution projects.
At $2.7 billion, projected self-supported capital spending is unchanged from the first Quarterly Report forecast.
Projects over $50 million
Capital spending projects with provincial contributions greater than $50 million are presented in Table 1.13. Since the first Quarterly Report the following changes have occurred:
· The $325 million Penticton Regional Hospital patient care tower project has been added.
· The overall cost for the North Island Hospitals project is unchanged; however, with financial close completed, the allocation of capital cost between direct procurement and P3 contract components has been finalized.
· Anticipated costs for the Sierra Yoyo Desan road upgrade have increased $13 million.
Second Quarterly Report 2014/15
7
| Updated Financial Forecast |
· The overall cost for the Evergreen Line rapid transit project is unchanged; however, the allocation of capital cost between direct procurement and P3 contract components has been revised.
· The Okanagan Correctional Centre anticipated costs for direct procurement have been adjusted by $4 million, reflecting the acquisition of specialized equipment and vehicles for the facility.
· BC Hydro’s Big Bend substation project is now expected to be completed in 2017 rather than 2016.
· BC Lotteries’ gaming management system project forecast decreased by $1 million reflecting lower costs to date.
· Anticipated spending for the capital portion of ICBC’s business transformation program increased $33 million mainly due to additional complexities in systems integration and testing as determined by an external consultant review.
Provincial debt
The provincial debt, including the $200 million forecast allowance, is projected to total $63.4 billion by the end of the fiscal year — $304 million lower than the projection in the first Quarterly Report.
Table 1.4 2014/15 Provincial Debt Update
| | ($ millions) | |
2014/15 provincial debt — Budget 2014 (February 18, 2014) | | 64,738 | | | | | |
Change in 2013/14 actual results from Budget 2014 forecast 1 | | (950 | ) | | | | |
Updated Budget 2014 projection 2 | | 63,788 | | | | 63,788 | |
2014/15 provincial debt — first Quarterly Report (September 9, 2014) | | | | 63,747 | | | |
| | Q1
Update | | Q2
Update | | Total
Changes | |
Taxpayer-supported changes: | | | | | | | |
Government operating: | | | | | | | |
– cash management strategy target adjustment | | 307 | | (100 | ) | 207 | |
– higher revenue cash receipts | | (321 | ) | (102 | ) | (423 | ) |
– other changes | | (87 | ) | 21 | | (66 | ) |
Total operating debt changes | | (101 | ) | (181 | ) | (282 | ) |
Capital debt: | | | | | | | |
– change in capital spending | | 168 | | (186 | ) | (18 | ) |
– change in contributions from external parties | | (25 | ) | 11 | | (14 | ) |
– change in internal financing | | (20 | ) | 56 | | 36 | |
Total capital debt changes | | 123 | | (119 | ) | 4 | |
Total taxpayer-supported | | 22 | | (300 | ) | (278 | ) |
Self-supported changes: | | | | | | | |
– higher capital spending | | 61 | | — | | 61 | |
– increase in internal financing | | (124 | ) | (4 | ) | (128 | ) |
Total self-supported | | (63 | ) | (4 | ) | (67 | ) |
Total changes | | (41 | ) | (304 | ) | (345 | ) |
2014/15 provincial debt — first Quarterly Report | | 63,747 | | | | | |
2014/15 provincial debt — second Quarterly Report | | | | 63,443 | | 63,443 | |
1 Excludes unused portion of the forecast allowance.
2 The Budget 2014 projection is based on an increase in debt for 2014/15 over a forecasted result for 2013/14. The revised projection reflects the same projected increase over the actual results for 2013/14.
Second Quarterly Report 2014/15
8
Updated Financial Forecast | |
Taxpayer-supported debt is projected to be $42.0 billion — $300 million lower than the projection in the first Quarterly Report. The reduction reflects lower direct operating debt (down $181 million), primarily due to anticipated improvement in both CRF revenue and government’s cash management strategy targets for the year.
The decrease in taxpayer-supported capital debt (down $119 million) is mainly due to reduced capital financing requirements — i.e. lower capital spending net of changes to contributions from external parties and internal financing of capital.
The lower taxpayer-supported debt projections resulted in a 0.1 percentage point reduction in the ratio taxpayer-supported debt to GDP ratio projected in first Quarterly Report. As well, Statistics Canada recently revised its historical nominal GDP data. The carry forward impact of the revision further reduced the debt to GDP ratio by 0.3 percentage points. As a result, the debt to GDP ratio for 2014/15 is now projected to be 17.7 per cent.
Self-supported debt is projected to be $21.3 billion — $4 million lower than the projection in the first Quarterly Report mainly due to further improvements in operating cash flows.
Details on provincial debt are shown in Table 1.14.
Risks to the fiscal forecast
There are a number of risks and pressures to the fiscal plan — in some instances reflecting risks to the BC economic outlook, which are largely due to the continued uncertainty surrounding global economic activity.
Revenues in British Columbia can be volatile, largely due to the influence of the cyclical nature of the natural resource sector in the economy. Changes in energy or commodity prices, such as natural gas and lumber, may have a significant effect on revenue and the fiscal forecast.
Personal and corporate income tax assessments for the 2013 tax year will not be finalized until March 2015 and could result in further revenue and tax credit transfer spending adjustments.
The spending forecast contained in the fiscal plan is based on ministry and service delivery agency plans and strategies. Changes to planning assumptions, such as utilization or demand rates for government services in the health care, education, or community social services sectors, and costs associated with natural disaster response represent the main spending risks.
The potential fiscal impact from these risks is covered by the $300 million Contingencies vote and the $200 million forecast allowance.
Second Quarterly Report 2014/15
9
| Updated Financial Forecast |
Supplementary schedules
The following tables provide the financial results for the six months ended September 30, 2014 and the 2014/15 full-year forecast.
Table 1.5 2014/15 Operating Statement
| | Year-to-Date to September 30 | | Full Year | |
| | 2014/15 | | Actual | | 2014/15 | | Actual | |
($ millions) | | Budget | | Actual | | Variance | | 2013/14 | | Budget | | Forecast | | Variance | | 2013/14 | |
Revenue | | 22,123 | | 22,815 | | 692 | | 22,172 | | 44,800 | | 45,509 | | 709 | | 43,728 | |
Expense | | (20,990 | ) | (20,872 | ) | 118 | | (20,773 | ) | (44,416 | ) | (44,865 | ) | (449 | ) | (43,375 | ) |
Surplus before forecast allowance | | 1,133 | | 1,943 | | 810 | | 1,399 | | 384 | | 644 | | 260 | | 353 | |
Forecast allowance | | — | | — | | — | | — | | (200 | ) | (200 | ) | — | | — | |
Surplus | | 1,133 | | 1,943 | | 810 | | 1,399 | | 184 | | 444 | | 260 | | 353 | |
Accumulated surplus beginning of the year . | | 1,748 | | 1,654 | | (94 | ) | 1,301 | | 1,748 | | 2,135 | | 387 | | 1,301 | |
Accumulated surplus before comprehensive income | | 2,881 | | 3,597 | | 716 | | 2,700 | | 1,932 | | 2,579 | | 647 | | 1,654 | |
Accumulated other comprehensive income from self-supported Crown agencies | | (88 | ) | 289 | | 377 | | 81 | | (175 | ) | (272 | ) | (97 | ) | 481 | |
Accumulated surplus end of period | | 2,793 | | 3,886 | | 1,093 | | 2,781 | | 1,757 | | 2,307 | | 550 | | 2,135 | |
Second Quarterly Report 2014/15
10
Updated Financial Forecast | |
Table 1.6 2014/15 Revenue by Source
| | Year-to-Date to September 30 | | Full Year | |
| | 2014/15 | | Actual | | 2014/15 | | Actual | |
($ millions) | | Budget | | Actual | | Variance | | 2013/14 | | Budget | | Forecast | | Variance | | 2013/14 | |
Taxation | | | | | | | | | | | | | | | | | |
Personal income | | 3,702 | | 3,820 | | 118 | | 3,443 | | 7,491 | | 7,828 | | 337 | | 6,862 | |
Corporate income | | 1,565 | | 1,663 | | 98 | | 1,586 | | 2,348 | | 2,485 | | 137 | | 2,427 | |
Sales 1 | | 3,078 | | 2,961 | | (117 | ) | 2,862 | | 5,964 | | 5,746 | | (218 | ) | 5,303 | |
Fuel | | 488 | | 479 | | (9 | ) | 486 | | 936 | | 927 | | (9 | ) | 917 | |
Carbon | | 540 | | 558 | | 18 | | 562 | | 1,228 | | 1,240 | | 12 | | 1,222 | |
Tobacco | | 410 | | 401 | | (9 | ) | 380 | | 780 | | 780 | | — | | 724 | |
Property | | 1,064 | | 1,053 | | (11 | ) | 1,021 | | 2,156 | | 2,125 | | (31 | ) | 2,080 | |
Property transfer | | 467 | | 580 | | 113 | | 490 | | 804 | | 954 | | 150 | | 937 | |
Insurance premium | | 236 | | 229 | | (7 | ) | 236 | | 450 | | 454 | | 4 | | 458 | |
| | 11,550 | | 11,744 | | 194 | | 11,066 | | 22,157 | | 22,539 | | 382 | | 20,930 | |
Natural resources | | | | | | | | | | | | | | | | | |
Natural gas royalties | | 182 | | 335 | | 153 | | 150 | | 441 | | 655 | | 214 | | 445 | |
Forests | | 286 | | 303 | | 17 | | 287 | | 785 | | 800 | | 15 | | 719 | |
Other natural resource 2 | | 891 | | 831 | | (60 | ) | 882 | | 1,784 | | 1,673 | | (111 | ) | 1,791 | |
| | 1,359 | | 1,469 | | 110 | | 1,319 | | 3,010 | | 3,128 | | 118 | | 2,955 | |
Other revenue | | | | | | | | | | | | | | | | | |
Medical Services Plan premiums | | 1,124 | | 1,123 | | (1 | ) | 1,061 | | 2,271 | | 2,260 | | (11 | ) | 2,158 | |
Other fees 3 | | 1,231 | | 1,394 | | 163 | | 1,364 | | 3,065 | | 3,128 | | 63 | | 3,052 | |
Investment earnings | | 606 | | 575 | | (31 | ) | 674 | | 1,091 | | 1,118 | | 27 | | 1,113 | |
Miscellaneous 4 | | 1,269 | | 1,216 | | (53 | ) | 1,485 | | 2,758 | | 2,675 | | (83 | ) | 2,884 | |
Release of surplus assets | | 67 | | 11 | | (56 | ) | 144 | | 200 | | 200 | | — | | 433 | |
| | 4,297 | | 4,319 | | 22 | | 4,728 | | 9,385 | | 9,381 | | (4 | ) | 9,640 | |
Contributions from the federal government | | | | | | | | | | | | | | | | | |
Health and social transfers | | 2,920 | | 2,912 | | (8 | ) | 2,930 | | 5,840 | | 5,814 | | (26 | ) | 5,869 | |
Other federal contributions 5 | | 669 | | 638 | | (31 | ) | 670 | | 1,523 | | 1,572 | | 49 | | 1,633 | |
| | 3,589 | | 3,550 | | (39 | ) | 3,600 | | 7,363 | | 7,386 | | 23 | | 7,502 | |
Commercial Crown corporation net income | | | | | | | | | | | | | | | | | |
BC Hydro | | 129 | | 165 | | 36 | | 146 | | 582 | | 588 | | 6 | | 549 | |
Liquor Distribution Branch | | 458 | | 478 | | 20 | | 463 | | 862 | | 871 | | 9 | | 877 | |
BC Lotteries (net of payments to the federal government) | | 603 | | 622 | | 19 | | 592 | | 1,183 | | 1,198 | | 15 | | 1,165 | |
ICBC | | 150 | | 445 | | 295 | | 258 | | 252 | | 434 | | 182 | | 136 | |
Transportation Investment Corporation (Port Mann) | | (37 | ) | (38 | ) | (1 | ) | (28 | ) | (79 | ) | (89 | ) | (10 | ) | (88 | ) |
Other 6 | | 25 | | 61 | | 36 | | 28 | | 85 | | 73 | | (12 | ) | 62 | |
| | 1,328 | | 1,733 | | 405 | | 1,459 | | 2,885 | | 3,075 | | 190 | | 2,701 | |
Total revenue | | 22,123 | | 22,815 | | 692 | | 22,172 | | 44,800 | | 45,509 | | 709 | | 43,728 | |
1 Includes provincial sales tax and social services tax/hotel room tax related to prior years.
2 Columbia River Treaty, other energy and minerals, water rental and other resources.
3 Post secondary, healthcare-related, motor vehicle, and other fees.
4 Includes reimbursements for health care and other services provided to external agencies, and other recoveries.
5 Includes contributions for health, education, community development, housing and social service programs, and transportation projects.
6 Includes Columbia Power Corporation, BC Railway Company, Columbia Basin Trust power projects, and post secondary institutions self-supported subsidiaries. Also includes gain on the sale of LDB’s liquor distribution warehouse (budget $34 million, actual $37 million).
Second Quarterly Report 2014/15
11
Updated Financial Forecast |
Table 1.7 2014/15 Expense by Ministry, Program and Agency1
| | Year-to-Date to September 30 | | Full Year | |
| | 2014/15 | | Actual | | 2014/15 | | Actual | |
($ millions) | | Budget | | Actual | | Variance | | 2013/14 2 | | Budget | | Forecast | | Variance | | 2013/14 2 | |
Office of the Premier | | 5 | | 5 | | — | | 4 | | 9 | | 9 | | — | | 9 | |
Aboriginal Relations and Reconciliation | | 40 | | 44 | | 4 | | 38 | | 82 | | 82 | | — | | 105 | |
Advanced Education | | 939 | | 944 | | 5 | | 950 | | 1,936 | | 1,936 | | — | | 1,950 | |
Agriculture | | 50 | | 46 | | (4 | ) | 46 | | 80 | | 80 | | — | | 76 | |
Children and Family Development | | 657 | | 661 | | 4 | | 645 | | 1,356 | | 1,356 | | — | | 1,343 | |
Community, Sport and Cultural Development | | 173 | | 166 | | (7 | ) | 96 | | 221 | | 221 | | — | | 181 | |
Education | | 2,735 | | 2,556 | | (179 | ) | 2,703 | | 5,387 | | 5,395 | | 8 | | 5,412 | |
Energy and Mines | | 10 | | 13 | | 3 | | 14 | | 21 | | 21 | | — | | 39 | |
Environment | | 63 | | 63 | | — | | 61 | | 134 | | 134 | | — | | 131 | |
Finance | | 106 | | 100 | | (6 | ) | 94 | | 202 | | 268 | | 66 | | 242 | |
Forests, Lands and Natural Resource Operations | | 296 | | 442 | | 146 | | 330 | | 593 | | 833 | | 240 | | 621 | |
Health | | 8,331 | | 8,167 | | (164 | ) | 7,992 | | 16,936 | | 16,936 | | — | | 16,387 | |
International Trade | | 17 | | 25 | | 8 | | 22 | | 34 | | 34 | | — | | 48 | |
Jobs, Tourism and Skills Training | | 93 | | 95 | | 2 | | 92 | | 199 | | 199 | | — | | 207 | |
Justice | | 579 | | 560 | | (19 | ) | 546 | | 1,155 | | 1,170 | | 15 | | 1,170 | |
Natural Gas Development | | 200 | | 197 | | (3 | ) | 185 | | 401 | | 401 | | — | | 371 | |
Social Development and Social Innovation | | 1,260 | | 1,266 | | 6 | | 1,222 | | 2,530 | | 2,530 | | — | | 2,509 | |
Technology, Innovation and Citizens’ Services | | 258 | | 250 | | (8 | ) | 244 | | 527 | | 527 | | — | | 525 | |
Transportation and Infrastructure | | 401 | | 402 | | 1 | | 404 | | 812 | | 812 | | — | | 806 | |
Total ministries and Office of the Premier | | 16,213 | | 16,002 | | (211 | ) | 15,688 | | 32,615 | | 32,944 | | 329 | | 32,132 | |
Management of public funds and debt | | 661 | | 604 | | (57 | ) | 637 | | 1,286 | | 1,257 | | (29 | ) | 1,237 | |
Contingencies | | — | | — | | — | | — | | 300 | | 300 | | — | | 60 | |
Funding for capital expenditures | | 322 | | 278 | | (44 | ) | 216 | | 1,048 | | 1,006 | | (42 | ) | 740 | |
Refundable tax credit transfers | | 387 | | 388 | | 1 | | 414 | | 778 | | 818 | | 40 | | 730 | |
Legislative and other appropriations | | 64 | | 57 | | (7 | ) | 87 | | 130 | | 133 | | 3 | | 153 | |
Subtotal | | 17,647 | | 17,329 | | (318 | ) | 17,042 | | 36,157 | | 36,458 | | 301 | | 35,052 | |
Elimination of transactions between appropriations 3 | | (8 | ) | (8 | ) | — | | — | | (17 | ) | (17 | ) | — | | (2 | ) |
Prior year liability adjustments | | — | | (6 | ) | (6 | ) | (3 | ) | — | | (15 | ) | (15 | ) | (159 | ) |
Consolidated revenue fund expense | | 17,639 | | 17,315 | | (324 | ) | 17,039 | | 36,140 | | 36,426 | | 286 | | 34,891 | |
Expenses recovered from external entities | | 1,085 | | 1,211 | | 126 | | 1,484 | | 2,599 | | 2,620 | | 21 | | 2,760 | |
Funding provided to service delivery agencies | | (10,807 | ) | (10,428 | ) | 379 | | (10,555 | ) | (22,016 | ) | (21,849 | ) | 167 | | (21,503 | ) |
Total direct program spending | | 7,917 | | 8,098 | | 181 | | 7,968 | | 16,723 | | 17,197 | | 474 | | 16,148 | |
Service delivery agency expense | | | | | | | | | | | | | | | | | |
School districts | | 2,491 | | 2,074 | | (417 | ) | 2,488 | | 5,667 | | 5,407 | | (260 | ) | 5,661 | |
Universities | | 1,967 | | 1,970 | | 3 | | 1,932 | | 4,152 | | 4,165 | | 13 | | 4,079 | |
Colleges and institutes | | 534 | | 538 | | 4 | | 540 | | 1,125 | | 1,135 | | 10 | | 1,137 | |
Health authorities and hospital societies | | 6,448 | | 6,450 | | 2 | | 6,297 | | 13,108 | | 13,244 | | 136 | | 12,802 | |
Other service delivery agencies | | 1,633 | | 1,742 | | 109 | | 1,548 | | 3,743 | | 3,743 | | — | | 3,548 | |
Total service delivery agency expense | | 13,073 | | 12,774 | | (299 | ) | 12,805 | | 27,795 | | 27,694 | | (101 | ) | 27,227 | |
Subtotal expense | | 20,990 | | 20,872 | | (118 | ) | 20,773 | | 44,518 | | 44,891 | | 373 | | 43,375 | |
Expenditure management | | — | | — | | — | | — | | (76 | ) | — | | 76 | | — | |
Core Review | | — | | — | | — | | — | | (26 | ) | (26 | ) | — | | — | |
Total expense | | 20,990 | | 20,872 | | (118 | ) | 20,773 | | 44,416 | | 44,865 | | 449 | | 43,375 | |
1 Reflects government’s organization that was in effect at September 30, 2014.
2 Restated to reflect government’s current accounting policies.
3 Reflects payments made under an agreement where an expense from a voted appropriation is recorded as revenue by a special account.
Second Quarterly Report 2014/15
12
Updated Financial Forecast |
Table 1.8 2014/15 Expense By Function
| | Year-to-Date to September 30 | | Full Year | |
| | 2014/15 | | Actual | | 2014/15 | | Actual | |
($ millions) | | Budget | | Actual | | Variance | | 2013/14 1 | | Budget | | Forecast | | Variance | | 2013/14 1 | |
Health: | | | | | | | | | | | | | | | | | |
Medical Services Plan | | 1,958 | | 1,968 | | 10 | | 1,977 | | 4,220 | | 4,206 | | (14 | ) | 4,114 | |
Pharmacare | | 544 | | 563 | | 19 | | 568 | | 1,120 | | 1,119 | | (1 | ) | 1,130 | |
Regional services | | 6,276 | | 6,152 | | (124 | ) | 5,849 | | 12,483 | | 12,428 | | (55 | ) | 11,960 | |
Other healthcare expenses 2 | | 376 | | 341 | | (35 | ) | 332 | | 860 | | 851 | | (9 | ) | 658 | |
| | 9,154 | | 9,024 | | (130 | ) | 8,726 | | 18,683 | | 18,604 | | (79 | ) | 17,862 | |
Education: | | | | | | | | | | | | | | | | | |
Elementary and secondary | | 2,610 | | 2,336 | | (274 | ) | 2,617 | | 6,125 | | 6,110 | | (15 | ) | 6,133 | |
Post secondary | | 2,486 | | 2,513 | | 27 | | 2,461 | | 5,317 | | 5,377 | | 60 | | 5,284 | |
Other education expenses 3 | | 176 | | 154 | | (22 | ) | 168 | | 457 | | 463 | | 6 | | 410 | |
| | 5,272 | | 5,003 | | (269 | ) | 5,246 | | 11,899 | | 11,950 | | 51 | | 11,827 | |
Social services: | | | | | | | | | | | | | | | | | |
Social assistance 2,3 | | 778 | | 803 | | 25 | | 792 | | 1,576 | | 1,576 | | — | | 1,572 | |
Child welfare 2 | | 522 | | 543 | | 21 | | 532 | | 1,015 | | 1,015 | | — | | 1,097 | |
Low income tax credit transfers | | 124 | | 124 | | — | | 125 | | 247 | | 245 | | (2 | ) | 279 | |
Community living and other services | | 410 | | 421 | | 11 | | 393 | | 865 | | 889 | | 24 | | 857 | |
| | 1,834 | | 1,891 | | 57 | | 1,842 | | 3,703 | | 3,725 | | 22 | | 3,805 | |
Protection of persons and property | | 671 | | 686 | | 15 | | 694 | | 1,393 | | 1,420 | | 27 | | 1,520 | |
Transportation | | 745 | | 766 | | 21 | | 751 | | 1,629 | | 1,622 | | (7 | ) | 1,554 | |
Natural resources and economic development | | 900 | | 1,026 | | 126 | | 927 | | 1,757 | | 1,977 | | 220 | | 1,755 | |
Other | | 577 | | 592 | | 15 | | 548 | | 1,294 | | 1,317 | | 23 | | 1,184 | |
Contingencies | | — | | — | | — | | — | | 300 | | 300 | | — | | — | |
General government | | 611 | | 640 | | 29 | | 659 | | 1,180 | | 1,395 | | 215 | | 1,386 | |
Debt servicing | | 1,225 | | 1,244 | | 19 | | 1,380 | | 2,578 | | 2,555 | | (23 | ) | 2,482 | |
Total expense | | 20,990 | | 20,872 | | (118 | ) | 20,773 | | 44,416 | | 44,865 | | 449 | | 43,375 | |
1 Restated to reflect government’s current organization and accounting policies.
2 Payments for healthcare services by the Ministry of Social Development and Social Innovation and the Ministry of Children and Family Development made on behalf of their clients are reported in the Health function.
3 Payments for training costs by the Ministry of Social Development and Social Innovation made on behalf of its clients are reported in the Education function.
Second Quarterly Report 2014/15
13
Updated Financial Forecast |
Table 1.9 2014/15 Material Assumptions — Revenue
| | Budget | | First | | Second | | | |
Revenue Source and Assumptions | | 2014 | | Quarter | | Quarter | | | |
($ millions unless otherwise specified) | | Estimate | | Forecast | | Forecast | | 2014/15 Sensitivities | |
Personal income tax | | $ | 7,491 | | $ | 7,828 | | $ | 7,828 | | | |
Current calendar year assumptions | | | | | | | | | |
Household income growth | | 3.3 | % | 3.2 | % | 3.2 | % | +/- 1% change in 2014 BC household income growth equals +/- $70 to $100 million | |
Compensation of employees growth | | 3.5 | % | 3.5 | % | 3.5 | % | |
Tax base growth | | 2.6 | % | 2.6 | % | 2.6 | % | |
Average tax yield | | 5.09 | % | 5.18 | % | 5.18 | % | |
Current-year tax | | $ | 7,175 | | $ | 7,341 | | $ | 7,341 | | | |
Prior year’s tax assessments | | $ | 305 | | $ | 295 | | $ | 295 | | | |
Unapplied taxes | | $ | 90 | | $ | 90 | | $ | 90 | | | |
BC Tax Reduction | | $ | -110 | | $ | -132 | | $ | -132 | | | |
Non-Refundable BC tax credits | | $ | -56 | | $ | -56 | | $ | -56 | | | |
Policy neutral elasticity * | | 1.2 | | 1.2 | | 1.2 | | | |
Fiscal year assumptions | | | | | | | | | |
Prior-year adjustment | | $ | 0 | | $ | 201 | | $ | 201 | | | |
2013 Tax-year | | 2013 Assumptions | | |
Household income growth | | 3.0 | % | 3.2 | % | 4.6 | % | +/- 1% change in 2013 BC household or taxable income growth equals +/- $80 to $100 million one-time effect (prior-year adjustment) and could result in an additional +/-$65 to $75 million base change in 2014/15 |
Tax base growth | | 5.4 | % | 6.0 | % | 6.0 | % |
Average 2013 tax yield | | 4.84 | % | 4.95 | % | 4.95 | % |
2013 tax | | $ | 6,650 | | $ | 6,850 | | $ | 6,850 | |
2012 & prior year’s tax assessments | | $ | 295 | | $ | 285 | | $ | 285 | |
Unapplied taxes | | $ | 90 | | $ | 90 | | $ | 90 | |
BC Tax Reduction | | $ | -108 | | $ | -130 | | $ | -130 | |
Non-Refundable BC tax credits | | $ | -56 | | $ | -57 | | $ | -57 | |
Policy neutral elasticity * | | 1.2 | | 2.1 | | 1.5 | |
* Ratio of annual per cent change in current-year revenue to annual per cent change in personal income (calendar year).
Corporate income tax | | $ | 2,348 | | $ | 2,467 | | $ | 2,485 | | | |
Components of revenue (fiscal year) | | | | | | | | | |
Advance instalments | | $ | 2,384 | | $ | 2,426 | | $ | 2,442 | | | |
International Business Activity Act refunds | | $ | -15 | | $ | -20 | | $ | -20 | | | |
Prior-year adjustment | | $ | -21 | | $ | 61 | | $ | 63 | | | |
Current calendar year assumptions | | | | | | | | | |
National tax base ($ billions) | | $ | 269.2 | | $ | 270.2 | | $ | 269.6 | | +/- 1% change in the 2014 national tax base equals +/- $15 to $25 million | |
BC instalment share of national tax base | | 11.4 | % | 11.4 | % | 11.4 | % |
Effective tax rates (general/small business) | | 11.0 / 2.5 | | 11.0 / 2.5 | | 11.0 / 2.5 | | |
BC tax base growth (post federal measures) | | 1.9 | % | 1.8 | % | 1.8 | % | | |
BC net operating surplus growth | | 1.8 | % | 1.4 | % | 1.4 | % | | |
Non-Refundable BC tax credits | | $ | -106 | | $ | -106 | | $ | -104 | | | |
2013 Tax-year | | 2013 Assumptions | | | |
BC tax base growth (post federal measures) | | 1.7 | % | 5.2 | % | 5.2 | % | +/- 1% change in the 2013 BC tax base equals +/- $30 to $40 million in 2014/15 | |
BC net operating surplus growth | | -4.8 | % | -4.9 | % | -5.4 | % |
Gross 2013 tax | | $ | 2,351 | | $ | 2,431 | | $ | 2,431 | | |
Prior-year adjustments | | $ | -21 | | $ | 61 | | $ | 63 | | |
Prior years losses/gains (included in above) | | $ | -20 | | $ | -30 | | $ | -30 | | | |
Non-Refundable BC tax credits | | $ | -98 | | $ | -86 | | $ | -83 | | | |
Revenue is recorded on a cash basis. Due to lags in the federal collection and instalment systems, changes to the BC corporate profits and tax base forecasts affect revenue in the succeeding year. The 2014/15 instalments from the federal government reflects two-third of payments related to the 2014 tax year (paid during Apr-July 2014 and adjusted in Sept and Dec) and one-third of 2015 payments. Instalments for the 2014 (2015) tax year are based on BC’s share of the national tax base for the 2012 (2013) tax year and a forecast of the 2014 (2015) national tax base. BC’s share of the 2012 national tax base was 11.41%, based on tax assessments as of December 31, 2013. Cash adjustments for any under/over payments from the federal government in respect of 2013 will be received/paid on March 31, 2015.

Second Quarterly Report 2014/15
14
Updated Financial Forecast |
Table 1.9 2014/15 Material Assumptions — Revenue (continued)
| | Budget | | First | | Second | | | |
Revenue Source and Assumptions | | 2014 | | Quarter | | Quarter | | | |
($ millions unless otherwise specified) | | Estimate | | Forecast | | Forecast | | 2014/15 Sensitivities | |
Provincial sales tax | | $ | 5,964 | | $ | 5,746 | | $ | 5,746 | | | |
Provincial sales tax base growth (fiscal year) | | 3.9 | % | 4.3 | % | 4.3 | % | +/- 1% change in the 2014 consumer expenditure growth equals up to +/- $20 million | |
Calendar Year | | | | | | | |
Nominal consumer expenditure | | 4.2 | % | 4.0 | % | 4.0 | % |
Nominal business investment | | 4.4 | % | 4.7 | % | 4.7 | % | | |
Other expenditures | | 4.6 | % | 6.0 | % | 6.0 | % | | |
Components of Provincial sales tax revenue | | | | | | | | +/- 1% change in the 2014 business investment growth equals up to +/- $10 million | |
Consolidated Revenue Fund | | $ | 5,950 | | $ | 5,732 | | $ | 5,732 | |
BC Transportation Financing Authority | | $ | 14 | | $ | 14 | | $ | 14 | |
Fuel and carbon taxes | | $ | 2,164 | | $ | 2,176 | | $ | 2,167 | | | |
Calendar Year | | | | | | | | | |
Real GDP | | 2.0 | % | 1.9 | % | 1.9 | % | | |
Gasoline volumes | | 0.0 | % | 0.0 | % | 0.0 | % | | |
Diesel volumes | | 2.0 | % | 2.0 | % | 2.0 | % | | |
Natural gas volumes | | 2.0 | % | 1.9 | % | 1.9 | % | | |
Carbon tax rates (July 1) | | | | | | | | | |
Carbon dioxide equivalent emissions ($/tonne) | | $ | 30 | | $ | 30 | | $ | 30 | | | |
Natural gas (cents/gigajoule) | | 148.98 | ¢ | 148.98 | ¢ | 148.98 | ¢ | | |
Gasoline (cents/litre) | | 6.67 | ¢ | 6.67 | ¢ | 6.67 | ¢ | | |
Light fuel oil (cents/litre) | | 7.67 | ¢ | 7.67 | ¢ | 7.67 | ¢ | | |
Carbon tax revenue | | $ | 1,228 | | $ | 1,240 | | $ | 1,240 | | | |
Components of fuel tax revenue | | | | | | | | | |
Consolidated Revenue Fund | | $ | 509 | | $ | 509 | | $ | 505 | | | |
BC Transit | | $ | 12 | | $ | 12 | | $ | 12 | | | |
BC Transportation Financing Authority | | $ | 415 | | $ | 415 | | $ | 410 | | | |
| | $ | 936 | | $ | 936 | | $ | 927 | | | |
Property taxes | | $ | 2,156 | | $ | 2,126 | | $ | 2,125 | | | |
Calendar Year | | | | | | | | +/- 1% change in new construction & inflation equals up to +/- $25 million in residential property taxation revenue | |
BC Consumer Price Index | | 1.5 | % | 1.3 | % | 1.3 | % | |
Housing starts | | 24,949 | | 25,900 | | 25,900 | |
Home owner grants (fiscal year) | | $ | 821 | | $ | 820 | | $ | 820 | |
Components of revenue | | | | | | | |
Residential (net of home owner grants) | | $ | 733 | | $ | 726 | | $ | 726 | | |
Non-residential | | $ | 1,124 | | $ | 1,114 | | $ | 1,114 | | +/- 1% change in 2014 new construction and inflation equals up to +/- $20 million in non-residential property taxation revenue | |
Rural area | | $ | 100 | | $ | 89 | | $ | 89 | |
Police | | $ | 32 | | $ | 33 | | $ | 33 | |
BC Assessment Authority | | $ | 83 | | $ | 84 | | $ | 84 | |
BC Transit | | $ | 84 | | $ | 80 | | $ | 79 | |
Other taxes | | $ | 2,034 | | $ | 2,089 | | $ | 2,094 | | | |
Calendar Year | | | | | | | | | |
Population | | 1.0 | % | 1.0 | % | 1.0 | % | | |
BC Consumer Price Index | | 1.5 | % | 1.3 | % | 1.3 | % | | |
BC housing starts | | -7.8 | % | -4.3 | % | -4.3 | % | | |
Real GDP | | 2.0 | % | 1.9 | % | 1.9 | % | | |
Nominal GDP | | 3.6 | % | 3.5 | % | 2.5 | % | | |
Components of revenue | | | | | | | | | |
Property transfer | | $ | 804 | | $ | 854 | | $ | 954 | | | |
Tobacco | | $ | 780 | | $ | 780 | | $ | 780 | | | |
Insurance premium and other | | $ | 450 | | $ | 455 | | $ | 454 | | | |
Second Quarterly Report 2014/15
15
Updated Financial Forecast |
Table 1.9 2014/15 Material Assumptions — Revenue (continued)
Revenue Source and Assumptions
($ millions unless otherwise specified) | | Budget
2014
Estimate | | First
Quarter
Forecast | | Second
Quarter
Forecast | | 2014/15 Sensitivities | |
Energy, sales of Crown land tenures, metals, minerals and other | | $ | 1,754 | | $ | 1,865 | | $ | 1,870 | | | |
Natural gas price | | | | | | | | +/- $0.50 change in the natural gas price equals +/- $125 million, including impacts on production volumes and royalty program credits, but excluding any changes from byproducts revenue (e.g. butane, ethane, propane) Sensitivities can also vary siginificantly at different price rice levels. | |
Plant inlet, $Cdn/gigajoule | | $ | 2.45 | | $ | 3.03 | | $ | 3.04 | | |
Sumas, $US/ MMBtu | | $ | 4.11 | | $ | 4.50 | | $ | 4.41 | | |
Natural gas production volumes | | | | | | | | |
Billions of cubic metres | | 42.8 | | 41.7 | | 42.5 | | |
Petajoules | | 1,696 | | 1,655 | | 1,685 | | |
Annual per cent change | | 8.2 | % | 5.5 | % | 8.5 | % | |
| | | | | | | | |
Oil price ($US/bbl at Cushing, Ok) | | $ | 95.12 | | $ | 98.86 | | $ | 87.94 | | |
Auctioned land base (000 hectares) | | 100 | | 100 | | 162 | | +/- 1% change in natural gas volumes equals +/- $2 million on natural gas royalties +/- 1 cent change in the exchange rate equals +/- $13 million on natural gas royalties | |
Average bid price/hectare ($) | | $ | 750 | | $ | 750 | | $ | 1,360 | | |
Cash sales of Crown land tenures | | $ | 75 | | $ | 75 | | $ | 220 | | |
Metallurgical coal price ($US/tonne, fob west coast) | | $ | 176 | | $ | 121 | | $ | 121 | | |
Copper price ($US/1b) | | $ | 3.16 | | $ | 3.16 | | $ | 3.14 | | |
Annual electricity volumes set by treaty | | 4.1 | | 4.1 | | 4.1 | | +/- $10 change in the average Metallurgical coal price equals +/- $30 to $40 million on mineral tax revenue | |
(million mega-watt hours) | | | | | | | | |
Mid-Columbia electricity price | | $ | 40 | | $ | 42 | | $ | 37 | | |
($US/mega-watt hour) | | | | | | | | |
Exchange rate (US¢/ Cdn$, calendar year) | | 93.2 | | 91.3 | | 91.1 | | | |
Components of revenue | | | | | | | | +/- 10% change in the average Mid-Columbia electricity price equals +/- $14 million on electricity sales revenue | |
Natural gas royalties | | $ | 441 | | $ | 643 | | $ | 655 | | |
Bonus bids, fees and rentals | | $ | 806 | | $ | 806 | | $ | 822 | | |
Petroleum royalties | | $ | 97 | | $ | 101 | | $ | 98 | | |
Columbia River Treaty electricity sales | | $ | 160 | | $ | 163 | | $ | 151 | | | |
Coal | | $ | 154 | | $ | 63 | | $ | 57 | | Based on a recommendation from the Auditor General to be consistent with generally accepted accounting principles, bonus bid revenue recognition reflects nine-year deferral of cash receipts from the sales of Crown land tentures | |
Minerals, metals and other | | $ | 47 | | $ | 40 | | $ | 38 | | |
Oil and Gas Commission fees and levies | | $ | 49 | | $ | 49 | | $ | 49 | | |
| | | | | | | | |
Royalty programs and infrastructure credits | | | | | | | | |
Deep drilling | | $ | -323 | | $ | -493 | | $ | -523 | | |
Road and pipeline infrastructure | | $ | -60 | | $ | -53 | | $ | -65 | | |
Total | | $ | -383 | | $ | -546 | | $ | -588 | | |
Implicit average natural gas royalty rate | | 10.6 | % | 12.8 | % | 12.7 | % | | |
Royalty program (marginal, low productivity and ultra marginal drilling) adjusments reflect reduced royalty rates. Natural gas royalties incorporate royalty programs and Treasury Board approved infrastructure credits.

Second Quarterly Report 2014/15
16
Updated Financial Forecast |
Table 1.9 2014/15 Material Assumptions — Revenue (continued)
Revenue Source and Assumptions
($ millions unless otherwise specified) | | Budget
2014
Estimate | | First
Quarter
Forecast | | Second
Quarter
Forecast | | 2014/15 Sensitivities | |
Forests | | $ | 785 | | $ | 831 | | $ | 800 | | | |
Prices (calendar year average) | | | | | | | | +/- US$50 change in SPF price equals +/- $75 to $100 million | |
SPF 2x4 ($US/1000 bd ft) | | $ | 345 | | $ | 346 | | $ | 355 | | |
Random Lengths Composite | | | | | | | | |
($US/thousand board feet) | | $ | 370 | | $ | 372 | | $ | 382 | | | |
Pulp ($US/tonne) | | $ | 838 | | $ | 904 | | $ | 923 | | +/- US$50 change in pulp price equals +/-$5 to $10 million +/- Cdn$10 change in average log price equals +/-$10 to $20 million | |
Coastal log ($Cdn/cubic metre) | | | | | | | | |
(Vancouver Log Market) | | $ | 86 | | $ | 93 | | $ | 94 | | |
Fiscal Year Trade Assumptions | | | | | | | | |
Export tax rate (effective rate) | | 0.8 | % | 0.8 | % | 0.4 | % | | |
Lumber shipments and consumption (billion board feet) | | | | | | | | +/- 1 cent change in exchange rate equals +/- $15 to $20 million on stumpage revenue +/- 10% change in Interior harvest volumes equals +/- $40 to $50 million +/- 10% change in Coastal harvest volumes equals +/- $5 to $7 million | |
U.S. lumber consumption | | 40.4 | | 40.4 | | 40.3 | | |
BC surge trigger volumes | | 8.6 | | 8.6 | | 8.5 | | |
BC lumber exports to US | | 6.9 | | 6.9 | | 6.9 | | |
| | | | | | | | |
Crown harvest volumes (million cubic metres) | | | | | | | | |
Interior | | 50.8 | | 49.7 | | 48.2 | | |
Coast | | 14.2 | | 14.3 | | 14.3 | | |
Total | | 65.0 | | 64.0 | | 62.5 | | |
BC Timber Sales (included in above) | | 11.7 | | 11.7 | | 11.5 | | |
| | | | | | | | | |
Components of revenue | | | | | | | | The above sensitivities relate to stumpage revenue only. Depending on market conditions, changes in stumpage revenues may be offset by changes in softwood lumber border tax revenues | |
Tenures | | $ | 513 | | $ | 519 | | $ | 484 | | |
BC Timber Sales | | $ | 209 | | $ | 242 | | $ | 254 | | |
Federal border tax (SLA 2006) | | $ | 7 | | $ | 8 | | $ | 0 | | |
Logging tax | | $ | 20 | | $ | 25 | | $ | 25 | | |
Other CRF revenue | | $ | 21 | | $ | 22 | | $ | 22 | | |
Recoveries | | $ | 15 | | $ | 15 | | $ | 15 | | |
Other natural resources | | $ | 471 | | $ | 470 | | $ | 458 | | | |
Components of revenue | | $ | 401 | | $ | 400 | | $ | 388 | | | |
Water rental and licences* | | | | | | | | | |
Recoveries | | $ | 50 | | $ | 50 | | $ | 50 | | | |
Angling and hunting permits and licences | | $ | 13 | | $ | 13 | | $ | 13 | | | |
Recoveries | | $ | 7 | | $ | 7 | | $ | 7 | | | |
|
|
* Water rentals for power purposes are indexed to Consumer Price Index. |
| | | | | | | | | | | | |
Other revenue | | $ | 9,385 | | $ | 9,334 | | $ | 9,381 | | | |
Components of revenue | | | | | | | | | |
Fees and licences | | | | | | | | | |
Consolidated Revenue Fund | | $ | 3,025 | | $ | 3,012 | | $ | 3,014 | | | |
Medical Services Plan premiums | | $ | 2,176 | | $ | 2,166 | | $ | 2,165 | | +/- 1% change in BC’s population growth equals +/- $10 to $20 million on MSP premium revenue | |
Motor vehicle licences and permits | | $ | 522 | | $ | 520 | | $ | 519 | | |
Other Consolidated Revenue Fund | | $ | 327 | | $ | 326 | | $ | 330 | | |
Recoveries | | $ | 208 | | $ | 208 | | $ | 208 | | |
MSP recoveries | | $ | 95 | | $ | 95 | | $ | 95 | | | |
Other recoveries | | $ | 113 | | $ | 113 | | $ | 113 | | | |
Crown corporations and agencies | | $ | 111 | | $ | 107 | | $ | 106 | | | |
Other service delivery agencies | | $ | 1,992 | | $ | 2,053 | | $ | 2,060 | | | |
Post-secondary education fees | | $ | 1,489 | | $ | 1,531 | | $ | 1,534 | | | |
Other health-care related fees | | $ | 332 | | $ | 342 | | $ | 346 | | | |
School Districts | | $ | 171 | | $ | 180 | | $ | 180 | | | |
Investment earnings | | | | | | | | | |
Consolidated Revenue Fund | | $ | 80 | | $ | 74 | | $ | 79 | | | |
Fiscal agency loans & sinking funds earnings | | $ | 870 | | $ | 869 | | $ | 881 | | | |
Elimination of transactions between appropriations | | $ | -17 | | $ | -17 | | $ | -17 | | | |
Crown corporations and agencies | | $ | 18 | | $ | 30 | | $ | 30 | | | |
Other service delivery agencies | | $ | 140 | | $ | 140 | | $ | 145 | | | |
Sales of goods and services | | $ | 905 | | $ | 934 | | $ | 929 | | | |
Miscellaneous | | $ | 1,853 | | $ | 1,724 | | $ | 1,746 | | | |
Asset sales | | $ | 200 | | $ | 200 | | $ | 200 | | | |
Second Quarterly Report 2014/15
17
Updated Financial Forecast |
Table 1.9 2014/15 Material Assumptions — Revenue (continued)
Revenue Source and Assumptions
($ millions unless otherwise specified) | | Budget
2014
Estimate | | First
Quarter
Forecast | | Second
Quarter
Forecast | | 2014/15 Sensitivities | |
Health and social transfers | | $ | 5,840 | | $ | 5,810 | | $ | 5,814 | | | |
National Cash Transfers | | | | | | | | | |
Canada Health Transfer (CHT) | | $ | 32,100 | | $ | 32,100 | | $ | 32,100 | | +/- 0.1% change in BC’s population share equals +/- $45 to $50 million on CHST | |
Canada Social Transfer (CST) | | $ | 12,582 | | $ | 12,582 | | $ | 12,582 | |
BC share of national population (June 1) | | 13.03 | % | 13.01 | % | 13.04 | % |
BC health and social transfers revenue | | | | | | | | | |
CHT | | $ | 4,183 | | $ | 4,178 | | $ | 4,184 | | | |
CST | | $ | 1,640 | | $ | 1,637 | | $ | 1,640 | | | |
Prior-year adjustments | | — | | $ | -22 | | $ | -27 | | | |
Health deferral | | | | | | | | | |
Diagnostic and Medical Equipment | | $ | 10 | | $ | 10 | | $ | 10 | | | |
Medical Equipment Trust | | $ | 7 | | $ | 7 | | $ | 7 | | | |
Other federal contributions | | $ | 1,523 | | $ | 1,567 | | $ | 1,572 | | | |
Components of revenue | | | | | | | | | |
Disaster Financial Assistance | | $ | 44 | | $ | 43 | | $ | 43 | | | |
Other Consolidated Revenue Fund | | $ | 148 | | $ | 149 | | $ | 149 | | | |
Labour Market Development Agreement | | $ | 301 | | $ | 301 | | $ | 301 | | | |
Labour Market Agreement | | $ | 66 | | $ | 66 | | $ | 66 | | | |
Family Support and Children in Care | | $ | 49 | | $ | 49 | | $ | 49 | | | |
Local Government Services and Transfers | | $ | 8 | | $ | 8 | | $ | 8 | | | |
Other recoveries | | $ | 116 | | $ | 116 | | $ | 116 | | | |
Crown corporations and agencies | | $ | 243 | | $ | 243 | | $ | 247 | | | |
Post secondary institutions | | $ | 463 | | $ | 504 | | $ | 504 | | | |
Other SUCH sector agencies | | $ | 85 | | $ | 88 | | $ | 89 | | | |
Service delivery agency direct revenue | | $ | 5,883 | | $ | 5,892 | | $ | 5,991 | | | |
School districts | | $ | 536 | | $ | 527 | | $ | 527 | | | |
Post secondary institutions | | $ | 3,048 | | $ | 3,036 | | $ | 3,045 | | | |
Health authorities and hospital societies | | $ | 799 | | $ | 814 | | $ | 903 | | | |
BC Transportation Financing Authority | | $ | 511 | | $ | 516 | | $ | 511 | | | |
Other service delivery agencies | | $ | 989 | | $ | 999 | | $ | 1,005 | | | |
Commercial Crown corporation net income | | $ | 2,885 | | $ | 3,006 | | $ | 3,075 | | | |
BC Hydro | | $ | 582 | | $ | 588 | | $ | 588 | | | |
reservoir water inflows | | 100 | % | 100 | % | 94 | % | +/-1% in hydro generation = +/-$15 million | |
| | | | | | | | |
mean gas price | | 3.90 | | 4.79 | | 4.23 | | +/-10% = -/+$5 million | |
(Sumas, $US/MMbtu — BC Hydro forecast based on NYMEX forward selling prices) | | | |
electricity prices | | 31.85 | | 38.37 | | 34.00 | | +/-10% change in electricity trade margins = +/-$15 million | |
(Mid-C, $US/MWh) | | | | | | | | |
ICBC | | $ | 252 | | $ | 363 | | $ | 434 | | | |
vehicle growth | | +1.7 | % | +1.7 | % | +1.8 | % | +/-1% = +/-$41 million
+/-1% = -/+$34 million
+/-1% = -/+$75 to $81 million
+/-1% return = +/-$135 to $140 million | |
current claims cost percentage change | | +5.5 | % | +6.3 | % | +6.5 | % | |
unpaid claims balance | | $ | 8.0 billion | | $ | 8.2 billion | | $ | 8.1 billion | | |
investment return | | 4.5 | % | 4.9 | % | 5.2 | % | |
loss ratio | | 89.8 | % | 89.0 | % | 89.0 | % | | |
Second Quarterly Report 2014/15
18
Updated Financial Forecast |
Table 1.10 2014/15 Material Assumptions - Expense
Ministry Programs and Assumptions
($ millions unless otherwise specified) | | Budget
2014
Estimate | | First
Quarter
Forecast | | Second
Quarter
Forecast | | Sensitivities 2014/15 | |
Advanced Education | | 1,936 | | 1,936 | | 1,936 | | | |
Student spaces in public institutions | | 201,220 | | 201,220 | | 201,220 | | The number of student spaces may vary depending on the financial and other policies of post secondary institutions. | |
| | | | | | | | |
(# FTEs) | | | | | | | | |
Children and Family Development | | 1,356 | | 1,356 | | 1,356 | | | |
Average children-in-care | | 8,100 | | 8,100 | | 8,100 | | A 1% increase in the cost per case or a 1% increase in the average caseload will affect expenditures by approximately $2 million (excluding Delegated Aboriginal Agencies). | |
caseload (#) | | | | | | | | |
Average annual residential | | 37,200 | | 37,200 | | 37,200 | | |
cost per child in care ($) | | | | | | | | |
| | | | | | | | |
| | | | | | | | |
Education | | 5,387 | | 5,395 | | 5,395 | | | |
Enrolment (# of FTEs) | | 544,095 | | 534,213 | | 534,213 | | Enrolment figures are based on BC Stats and school district enrolment trends, to which the ministry has added forecasts for distributed and summer learning and adult education. The 2014/15 summer learning forecast decrease is due to the teachers’ job action, which limited enrolment to students needing courses to graduate and enter post secondary education as per a BC Labour Relations Board essential service ruling. | |
School age (K-12) | | 521,064 | | 518,368 | | 518,368 | | |
Distributed Learning (online) | | 11,842 | | 11,824 | | 11,824 | | |
Summer | | 6,658 | | 6 | | 6 | | |
Adults | | 4,531 | | 4,015 | | 4,015 | | |
| | | | | | | | |
| | | | | | | | |
| | | | | | | | |
| | | | | | | | |
| | | | | | | | |
| | | | | | | | |
| | | | | | | | |
| | | | | | | | |
Forests, Lands and Natural Resource Operations | | 593 | | 880 | | 833 | | | |
BC Timber Sales | | 156 | | 156 | | 159 | | Targets can be impacted by changes to actual inventory costs incurred. There is a lag of approximately 1.5 years between when inventory costs are incurred and when they are expensed. Volume harvested can also impact targets. For example, if volume harvested is less than projected in any year then capitalized expenses will also be reduced in that year. | |
Direct Fire Fighting | | 63 | | 350 | | 300 | | Over the past several years, Direct fire fighting costs have ranged from a low of $19 million in 1997 to $382 million in 2009. | |
Health | | 16,936 | | 16,936 | | 16,936 | | | |
Pharmacare | | 1,079 | | 1,079 | | 1,079 | | A 1% change in utilization or drug prices affects costs by approximately $10 million. | |
Medical Services Plan (MSP) | | 4,062 | | 4,062 | | 4,062 | | A 1% increase in volume of services provided by fee-for-service physicians affects costs by approximately $25 million. | |
| | | | | | | | |
Regional Services | | 11,524 | | 11,524 | | 11,524 | | | |
Justice | | 1,155 | | 1,169 | | 1,170 | | | |
New cases filed/processed | | 270,000 | | 270,000 | | 270,000 | | The number of criminal cases proceeded on by the provincial and federal Crown (including appeals to higher courts in BC), the number of civil and family litigation cases, the number of violation tickets disputed, and the number of municipal bylaw tickets disputed which would go to court for resolution. | |
(# for all courts) | | | | | | | | |
| | | | | | | | |
Crown Proceedings Act (CPA) | | 25 | | 25 | | 25 | | The number and size of litigation brought against the province, as well as the effectiveness of mitigation strategies and legal defence. | |
| | | | | | | | |
Policing, Victim Services and Corrections | | 609 | | 609 | | 609 | | The volume and severity of criminal activity, the number of inmate beds occupied and the number of offenders under community supervision. | |
| | | | | | | | |
Emergency Program Act (EPA) | | 15 | | 29 | | 30 | | The number and severity of natural disasters. | |

Second Quarterly Report 2014/15
19
| Updated Financial Forecast | |
Table 1.10 2014/15 Material Assumptions — Expense (continued)
Ministry Programs and Assumptions
($ millions unless otherwise specified) | | Budget
2014
Estimate | | First
Quarter
Forecast | | Second
Quarter
Forecast | | Sensitivities 2014/15 | |
Social Development and Social Innovation | | 2,530 | | 2,530 | | 2,530 | | | |
Temporary Assistance
annual average caseload (#) | | 44,800 | | 44,800 | | 44,800 | | The expected to work caseload is sensitive to fluctuations in economic and employment trends in the service sector. A 1% change in the Temporary Assistance annual average caseload or average cost per case will affect expenditures by approximately $4 million annually. | |
Disability Assistance
annual average caseload (#) | | 91,200 | | 91,200 | | 91,200 | | The caseload for persons with disabilities is sensitive to the aging of the population and longer life expectancy for individuals with disabilities and significant health issues. A 1% change in the Disability Assistance annual average caseload or average cost per case will affect expenditures by approximately $9 million annually. | |
Adult Community Living: | | | | | | | | The adult community living caseload is sensitive to an aging population and to the level of service offered. For example, residential care is significantly more costly than day programs. A 1% change in the average annual caseload will affect expenditures by approximately $7 million annually. | |
Developmental Disabilities Programs | | | | | | | | |
Average caseload (#) | | 16,260 | | 16,360 | | 16,360 | | |
Average cost per client ($) | | 46,100 | | 45,800 | | 45,800 | | |
Personal Supports Initiative | | | | | | | | |
Average caseload (#) | | 780 | | 800 | | 800 | | |
Average cost per client ($) | | 23,950 | | 23,260 | | 23,260 | | |
| | | | | | | | |
Tax Transfers | | 778 | | 772 | | 818 | | | |
Individuals | | 307.0 | | 317.0 | | 308.0 | | These tax transfers are now expensed as required under generally accepted accounting principles. Previously the family bonus was split 50/50 between expense program and as reduction to revenue while all other refundable credits were recorded as reduction to revenue. | |
Low Income Climate Action | | 194.0 | | 194.0 | | 194.0 | | |
Early Childhood Tax Benefit | | | | | | | | |
Sales Tax | | 53.0 | | 53.0 | | 50.5 | | |
Small Business Venture Capital | | 25.0 | | 25.0 | | 22.0 | | |
BC Senior’s Home Renovation | | 4.0 | | 4.0 | | 1.0 | | |
Other tax transfers to individuals | | 30.7 | | 40.7 | | 40.2 | | |
Family Bonus Program | | 0.3 | | 0.3 | | 0.3 | | |
| | | | | | | | |
Corporations | | 471.0 | | 455.0 | | 510.0 | | |
Film and Television | | 80.0 | | 80.0 | | 80.0 | | |
Production Services | | 197.5 | | 182.5 | | 193.8 | | |
Scientific Research & Experimental | | | | | | | | |
Development | | 74.0 | | 71.0 | | 67.2 | | |
Interactive Digital Media | | 50.0 | | 45.0 | | 40.0 | | |
Mining Exploration | | 55.0 | | 65.0 | | 120.0 | | |
Other tax transfers to corporations | | 14.5 | | 11.5 | | 9.0 | | |
2014/15 tax transfer forecasts incorporates adjustments relating to prior years | | | |
Management of Public Funds and Debt | | 1,286 | | 1,271 | | 1,257 | | | |
Interest rates for new provincial borrowing: | | | | | | | | Full year impact on MoPD on interest costs of a 1% change in interest rates equals $40.9 million; $100 million increase in debt level equals $2.6 million. | |
Short-term | | 1.09 | % | 1.07 | % | 1.00 | % |
Long-term | | 3.93 | % | 3.35 | % | 3.07 | % |
CDN/US exchange rate (cents) | | 107.6 | | 109.8 | | 110.2 | |
Service delivery agency net spending | | 5,792 | | 5,797 | | 5,870 | | | |
School districts | | 279 | | 256 | | 256 | | | |
Post secondary institutions | | 2,985 | | 2,973 | | 3,011 | | | |
Health authorities and hospital societies | | 645 | | 654 | | 688 | | | |
BC Transportation Financing Authority | | 1,038 | | 1,035 | | 1,023 | | | |
Other service delivery agencies | | 845 | | 879 | | 892 | | | |
Second Quarterly Report 2014/15
20
| Updated Financial Forecast | |
Table 1.11 2014/15 Full-Time Equivalents (FTEs) 1
| | 2014/15 | | Actual | |
FTEs | | Budget | | Forecast | | Variance | | 2013/14 | |
Ministries and special offices (consolidated revenue fund) | | 26,300 | | 26,420 | | 120 | | 26,526 | |
Service delivery agencies 2 | | 4,680 | | 4,680 | | — | | 4,640 | |
Total FTEs | | 30,980 | | 31,100 | | 120 | | 31,166 | |
1 Full-time equivalents (FTEs) are a measure of staff employment. FTEs are calculated by dividing the total hours of employment paid for in a given period by the number of hours an individual, full-time person would normally work in that period. This does not equate to the physical number of employees. For example, two half-time employees would equal one FTE, or alternatively, three FTEs may represent two full-time employees who have worked sufficient overtime hours to equal an additional FTE.
2 Service delivery agency FTE amounts do not include SUCH sector staff employment.
Table 1.12 2014/15 Capital Spending
| | Year-to-Date to September 30 | | Full Year | |
| | 2014/15 | | Actual | | 2014/15 | | Actual | |
($ millions) | | Budget | | Actual | | Variance | | 2013/14 | | Budget | | Forecast | | Variance | | 2013/14 | |
Taxpayer-supported | | | | | | | | | | | | | | | | | |
Education | | | | | | | | | | | | | | | | | |
School districts | | 255 | | 230 | | (25 | ) | 235 | | 511 | | 506 | | (5 | ) | 466 | |
Post secondary institutions | | 441 | | 248 | | (193 | ) | 161 | | 883 | | 818 | | (65 | ) | 507 | |
Health | | 423 | | 309 | | (114 | ) | 227 | | 847 | | 1,033 | | 186 | | 690 | |
BC Transportation Financing Authority | | 522 | | 547 | | 25 | | 584 | | 1,044 | | 982 | | (62 | ) | 1,017 | |
BC Transit | | 68 | | 31 | | (37 | ) | 23 | | 136 | | 101 | | (35 | ) | 80 | |
Government operating (ministries) | | 191 | | 107 | | (84 | ) | 110 | | 432 | | 422 | | (10 | ) | 298 | |
Other 1 | | 82 | | 63 | | (19 | ) | 32 | | 177 | | 150 | | (27 | ) | 93 | |
Total taxpayer-supported | | 1,982 | | 1,535 | | (447 | ) | 1,372 | | 4,030 | | 4,012 | | (18 | ) | 3,151 | |
| | | | | | | | | | | | | | | | | |
Self-supported | | | | | | | | | | | | | | | | | |
BC Hydro | | 1,249 | | 960 | | (289 | ) | 957 | | 2,262 | | 2,262 | | — | | 2,036 | |
Columbia River power projects 2 | | 13 | | 11 | | (2 | ) | 13 | | 26 | | 52 | | 26 | | 52 | |
Transportation Investment Corporation (Port Mann) | | 49 | | 49 | | — | | 138 | | 83 | | 120 | | 37 | | 202 | |
BC Rail | | 4 | | 2 | | (2 | ) | 4 | | 8 | | 6 | | (2 | ) | 8 | |
ICBC | | 33 | | 40 | | 7 | | 32 | | 91 | | 91 | | — | | 82 | |
BC Lottery Corporation | | 46 | | 31 | | (15 | ) | 35 | | 90 | | 90 | | — | | 100 | |
Liquor Distribution Branch | | 15 | | 7 | | (8 | ) | 1 | | 30 | | 30 | | — | | 13 | |
Other 3 | | — | | — | | — | | — | | — | | — | | — | | 26 | |
Total self-supported | | 1,409 | | 1,100 | | (309 | ) | 1,180 | | 2,590 | | 2,651 | | 61 | | 2,519 | |
Total capital spending | | 3,391 | | 2,635 | | (756 | ) | 2,552 | | 6,620 | | 6,663 | | 43 | | 5,670 | |
1 Includes BC Housing Management Commission, Provincial Rental Housing Corporation and other service delivery agencies.
2 Joint ventures of the Columbia Power Corporation and Columbia Basin Trust.
3 Includes post secondary institutions self-supported subsidiaries.
Second Quarterly Report 2014/15
21
| Updated Financial Forecast | |
Table 1.13 Capital Expenditure Projects Greater Than $50 million 1
Note: Information in bold type denotes changes from the 2014/15 first Quarterly Report released on September 9, 2014.
| | | | Project | | Estimated | | Anticipated | | Project Financing | |
($ millions) | | Year of
Completion | | Cost to
Sept 30, 2014 | | Cost to
Complete | | Total
Cost | | Internal/
Borrowing | | P3
Liability | | Federal
Gov’t | | Other
Contrib’ns | |
| | Taxpayer-supported | | | | | | | | | |
School districts | | | | | | | | | | | | | | | | | |
Southern Okanagan Secondary 2 | | 2013 | | 50 | | 4 | | 54 | | 52 | | — | | — | | 2 | |
Chilliwack Secondary 2 | | 2013 | | 53 | | 5 | | 58 | | 58 | | — | | — | | — | |
Centennial Secondary | | 2015 | | 12 | | 49 | | 61 | | 61 | | — | | — | | — | |
Oak Bay Secondary | | 2015 | | 29 | | 23 | | 52 | | 50 | | — | | — | | 2 | |
Kitsilano Secondary | | 2015 | | 12 | | 52 | | 64 | | 60 | | — | | — | | 4 | |
Belmont Secondary | | 2015 | | 24 | | 32 | | 56 | | 30 | | — | | — | | 26 | |
Seismic mitigation program | | 2023 | | 28 | | 1,272 | | 1,300 | | 1,300 | | — | | — | | — | |
Total school districts | | | | 208 | | 1,437 | | 1,645 | | 1,611 | | — | | — | | 34 | |
Post secondary institutions | | | | | | | | | | | | | | | | | |
Emily Carr University of Art and Design | | | | | | | | | | | | | | | | | |
– Campus redevelopment at Great | | | | | | | | | | | | | | | | | |
Northern Way | | 2017 | | 4 | | 130 | | 134 | | 113 | | — | | — | | 21 | |
Total post secondary institutions | | | | 4 | | 130 | | 134 | | 113 | | — | | — | | 21 | |
Health facilities | | | | | | | | | | | | | | | | | |
Northern Cancer Control Strategy 2 | | | | | | | | | | | | | | | | | |
– Direct procurement | | 2014 | | 27 | | 8 | | 35 | | 32 | | — | | — | | 3 | |
– P3 contract | | 2012 | | 71 | | — | | 71 | | 54 | | 17 | | — | | — | |
Lions Gate Hospital (Mental Health) Redevelopment | | 2014 | | 44 | | 18 | | 62 | | 38 | | — | | — | | 24 | |
Lakes District Hospital | | 2015 | | 29 | | 26 | | 55 | | 46 | | — | | — | | 9 | |
Queen Charlotte/Haida Gwaii Hospital | | 2015 | | 9 | | 41 | | 50 | | 31 | | — | | — | | 19 | |
Surrey Emergency/Critical Care Tower | | | | | | | | | | | | | | | | | |
– Direct procurement | | 2016 | | 117 | | 77 | | 194 | | 174 | | — | | — | | 20 | |
– P3 contract | | 2014 | | 318 | | — | | 318 | | 139 | | 179 | | — | | — | |
Royal Inland Hospital | | 2016 | | 4 | | 76 | | 80 | | 47 | | — | | — | | 33 | |
North Island Hospitals | | | | | | | | | | | | | | | | | |
– Direct procurement | | 2017 | | 15 | | 111 | | 126 | | 73 | | — | | — | | 53 | |
– P3 contract | | 2017 | | 21 | | 459 | | 480 | | 60 | | 232 | | — | | 188 | |
Interior Heart and Surgical Centre | | | | | | | | | | | | | | | | | |
– Direct procurement | | 2017 | | 106 | | 147 | | 253 | | 213 | | — | | — | | 40 | |
– P3 contract | | 2015 | | 92 | | 36 | | 128 | | 4 | | 79 | | — | | 45 | |
Vancouver General Hospital — Joseph and Rosalie Segal Family Health Centre | | 2017 | | 5 | | 77 | | 82 | | 57 | | — | | — | | 25 | |
Children’s and Women’s Hospital | | | | | | | | | | | | | | | | | |
– Direct procurement | | 2019 | | 71 | | 238 | | 309 | | 177 | | — | | — | | 132 | |
– P3 contract | | 2017 | | 40 | | 329 | | 369 | | 168 | | 187 | | — | | 14 | |
Penticton Regional Hospital — Patient Care Tower | | 2019 | | — | | 325 | | 325 | | 168 | | — | | — | | 157 | |
Clinical and systems transformation | | 2023 | | 74 | | 406 | | 480 | | 480 | | — | | — | | - | |
Total health facilities | | | | 1,043 | | 2,374 | | 3,417 | | 1,961 | | 694 | | — | | 762 | |
Transportation | | | | | | | | | | | | | | | | | |
South Fraser Perimeter Road | | | | | | | | | | | | | | | | | |
– Direct procurement | | 2014 | | 1,070 | | 6 | | 1,076 | | 728 | | — | | 348 | | — | |
– P3 contract | | 2014 | | 188 | | — | | 188 | | — | | 188 | | — | | — | |
Sierra Yoyo Desan Road upgrade | | 2014 | | 134 | | 16 | | 150 | | 150 | | — | | — | | — | |
Evergreen Line Rapid Transit | | | | | | | | | | | | | | | | | |
– Direct procurement | | 2016 | | 248 | | 288 | | 536 | | 321 | | — | | 74 | | 141 | |
– P3 contract | | 2016 | | 496 | | 399 | | 895 | | — | | 265 | | 350 | | 280 | |
Total transportation | | | | 2,136 | | 709 | | 2,845 | | 1,199 | | 453 | | 772 | | 421 | |

Second Quarterly Report 2014/15
22
| Updated Financial Forecast | |
Table 1.13 Capital Expenditure Projects Greater Than $50 million 1 (continued)
Note: Information in bold type denotes changes from the 2014/15 first Quarterly Report released on September 9, 2014.
| | | | Project | | Estimated | | Anticipated | | Project Financing | |
($ millions) | | Year of
Completion | | Cost to
Sept 30, 2014 | | Cost to
Complete | | Total
Cost | | Internal/
Borrowing | | P3
Liability | | Federal
Gov’t | | Other
Contrib’ns | |
Other taxpayer-supported | | | | | | | | | | | | | | | | | |
Integrated Case Management system | | 2014 | | 175 | | 7 | | 182 | | 179 | | — | | 3 | | — | |
Single Room Occupancy Hotel renewal initiative | | | | | | | | | | | | | | | | | |
– Direct procurement | | 2016 | | 10 | | 15 | | 25 | | 23 | | — | | 2 | | — | |
– P3 contract | | 2016 | | 63 | | 55 | | 118 | | — | | 91 | | 27 | | — | |
Okanagan Correctional Centre | | | | | | | | | | | | | | | | | |
– Direct procurement | | 2016 | | 21 | | 70 | | 91 | | 91 | | — | | — | | — | |
– P3 contract | | 2016 | | 22 | | 107 | | 129 | | 8 | | 121 | | — | | — | |
Total other | | | | 291 | | 254 | | 545 | | 301 | | 212 | | 32 | | — | |
Total taxpayer-supported | | | | 3,682 | | 4,904 | | 8,586 | | 5,185 | | 1,359 | | 804 | | 1,238 | |
| | | | | | | | | | | |
Self-supported |
Transportation | | | | | | | | | | | | | | | | | |
Port Mann Bridge / Highway 1 | | 2015 | | 3,248 | | 71 | | 3,319 | | 3,319 | | — | | — | | — | |
Power generation and transmission | | | | | | | | | | | | | | | | | |
BC Hydro | | 2014 | | 48 | | 1 | | 49 | | 49 | | — | | — | | — | |
– Seymour Arm series capacitor 2 | | | | | | | | | | | | | | | | | |
– Vancouver City Central transmission 2 | | 2014 | | 171 | | — | | 171 | | 171 | | — | | — | | — | |
– Mica gas insulated switchgear replacement 2 | | 2014 | | 174 | | 25 | | 199 | | 199 | | — | | — | | — | |
– Northwest transmission line 2 | | 2014 | | 657 | | 89 | | 746 | | 359 | | — | | 130 | | 257 | |
– Merritt area transmission | | 2014 | | 33 | | 32 | | 65 | | 65 | | — | | — | | — | |
– Smart metering and infrastructure program | | 2015 | | 708 | | 222 | | 930 | | 930 | | — | | — | | — | |
– Dawson Creek/Chetwynd area transmission | | 2015 | | 134 | | 162 | | 296 | | 296 | | — | | — | | — | |
– Interior to Lower Mainland transmission line | | 2015 | | 511 | | 214 | | 725 | | 725 | | — | | — | | — | |
– GM Shrum units 1 to 5 turbine upgrade | | 2015 | | 138 | | 134 | | 272 | | 272 | | — | | — | | — | |
– Iskut extension project | | 2015 | | 44 | | 136 | | 180 | | 140 | | — | | — | | 40 | |
– Surrey area substation project | | 2015 | | 29 | | 65 | | 94 | | 94 | | — | | — | | — | |
– Hugh Keenleyside spillway gate reliability upgrade | | 2015 | | 82 | | 41 | | 123 | | 123 | | — | | — | | — | |
– Mica units 5 and 6 project | | 2015 | | 462 | | 252 | | 714 | | 714 | | — | | — | | — | |
– Long Beach reinforcement | | 2015 | | 15 | | 41 | | 56 | | 56 | | — | | — | | — | |
– Big Bend substation | | 2017 | | 17 | | 39 | | 56 | | 56 | | — | | — | | — | |
– Ruskin Dam safety and powerhouse upgrade | | 2017 | | 262 | | 486 | | 748 | | 748 | | — | | — | | — | |
– John Hart replacement | | 2019 | | 197 | | 896 | | 1,093 | | 1,093 | | — | | — | | — | |
– Cheakamus units 1 and 2 generator replacement | | 2019 | | 4 | | 70 | | 74 | | 74 | | — | | — | | — | |
Columbia River power projects | | | | | | | | | | | | | | | | | |
– Waneta Dam power expansion 3 | | 2015 | | 302 | | 48 | | 350 | | 350 | | — | | — | | — | |
Total power generation and transmission | | | | 3,988 | | 2,953 | | 6,941 | | 6,514 | | — | | 130 | | 297 | |
Other | | | | | | | | | | | | | | | | | |
British Columbia Lottery Corporation | | | | | | | | | | | | | | | | | |
– Gaming management system | | 2015 | | 80 | | 18 | | 98 | | 98 | | — | | — | | — | |
Insurance Corporation of British Columbia | | | | | | | | | | | | | | | | | |
– Business transformation program | | 2016 | | 207 | | 90 | | 297 | | 297 | | — | | — | | — | |
Total other | | | | 287 | | 108 | | 395 | | 395 | | — | | — | | — | |
Total self-supported | | | | 7,523 | | 3,132 | | 10,655 | | 10,228 | | — | | 130 | | 297 | |
Total $50 million projects | | | | 11,205 | | 8,036 | | 19,241 | | 15,413 | | 1,359 | | 934 | | 1,535 | |
1 Only projects that receive provincial funding and have been approved by Treasury Board and/or Crown corporation boards are included in this table. Ministry service plans may include projects that still require final approval. Capital costs reflect current government accounting policy.
2 Assets have been put into service and only trailing costs remain.
3 Reflects the combined shares of Columbia Power Corporation (32.5 per cent) and Columbia Basin Trust (16.5 per cent) in their partnership with Fortis Inc. for the development of an electricity generating facility at the Waneta Dam south of Trail.
Second Quarterly Report 2014/15
23
| Updated Financial Forecast | |
Table 1.14 2014/15 Provincial Debt 1
| | Year-to-Date to September 30 | | Full Year | |
| | 2014/15 | | Actual | | 2014/15 | | Actual | |
($ millions) | | Budget | | Actual | | Variance | | 2013/14 | | Budget | | Forecast | | Variance | | 2013/14 | |
Taxpayer-supported debt | | | | | | | | | | | | | | | | | |
Provincial government operating | | 9,820 | | 7,348 | | (2,472 | ) | 10,116 | | 9,828 | | 8,843 | | (985 | ) | 10,223 | |
Other taxpayer-supported debt (mainly capital) | | | | | | | | | | | | | | | | | |
Education 2 | | | | | | | | | | | | | | | | | |
School districts | | 7,529 | | 7,383 | | (146 | ) | 6,271 | | 7,756 | | 7,699 | | (57 | ) | 7,245 | |
Post secondary institutions | | 4,443 | | 4,433 | | (10 | ) | 4,124 | | 4,509 | | 4,523 | | 14 | | 4,386 | |
| | 11,972 | | 11,816 | | (156 | ) | 10,395 | | 12,265 | | 12,222 | | (43 | ) | 11,631 | |
Health 2,3 | | 6,279 | | 6,192 | | (87 | ) | 5,381 | | 6,516 | | 6,562 | | 46 | | 6,038 | |
Highways and public transit BC Transportation Financing Authority 4 | | 8,296 | | 8,079 | | (217 | ) | 7,919 | | 8,711 | | 8,638 | | (73 | ) | 7,912 | |
Public transit | | 1,000 | | 1,000 | | — | | 1,000 | | 1,000 | | 1,000 | | — | | 1,000 | |
SkyTrain extension | | 1,174 | | 1,174 | | — | | 1,174 | | 1,174 | | 1,174 | | — | | 1,174 | |
BC Transit | | 157 | | 132 | | (25 | ) | 152 | | 163 | | 158 | | (5 | ) | 143 | |
| | 10,627 | | 10,385 | | (242 | ) | 10,245 | | 11,048 | | 10,970 | | (78 | ) | 10,229 | |
Other | | | | | | | | | | | | | | | | | |
Social housing 5 | | 772 | | 721 | | (51 | ) | 661 | | 796 | | 797 | | 1 | | 719 | |
Provincial government general capital | | 1,575 | | 1,473 | | (102 | ) | 1,171 | | 1,766 | | 1,743 | | (23 | ) | 1,371 | |
BC Pavilion Corporation | | 382 | | 382 | | — | | 383 | | 380 | | 381 | | 1 | | 383 | |
BC Immigrant Investment Fund | | 444 | | 449 | | 5 | | 394 | | 441 | | 441 | | — | | 440 | |
Other 6 | | 35 | | 31 | | (4 | ) | 36 | | 35 | | 31 | | (4 | ) | 34 | |
| | 3,208 | | 3,056 | | (152 | ) | 2,645 | | 3,418 | | 3,393 | | (25 | ) | 2,947 | |
Total other taxpayer-supported | | 32,086 | | 31,449 | | (637 | ) | 28,666 | | 33,247 | | 33,147 | | (100 | ) | 30,845 | |
Total taxpayer-supported debt | | 41,906 | | 38,797 | | (3,109 | ) | 38,782 | | 43,075 | | 41,990 | | (1,085 | ) | 41,068 | |
Self-supported debt | | | | | | | | | | | | | | | | | |
Commercial Crown corporations | | | | | | | | | | | | | | | | | |
BC Hydro | | 16,172 | | 16,446 | | 274 | | 15,196 | | 16,856 | | 16,744 | | (112 | ) | 15,559 | |
Columbia Power Corporation | | 300 | | 300 | | — | | — | | 300 | | 299 | | (1 | ) | — | |
Columbia River power projects 7 | | 470 | | 467 | | (3 | ) | 473 | | 464 | | 464 | | — | | 470 | |
BC Lotteries | | 167 | | 165 | | (2 | ) | 140 | | 182 | | 155 | | (27 | ) | 155 | |
Transportation Investment Corporation (Port Mann) | | 3,345 | | 3,271 | | (74 | ) | 3,061 | | 3,420 | | 3,351 | | (69 | ) | 3,209 | |
Post secondary institutions’ subsidiaries | | 208 | | 200 | | (8 | ) | 209 | | 208 | | 198 | | (10 | ) | 198 | |
Other | | 34 | | 44 | | 10 | | 34 | | 33 | | 42 | | 9 | | 34 | |
| | 20,696 | | 20,893 | | 197 | | 19,113 | | 21,463 | | 21,253 | | (210 | ) | 19,625 | |
Warehouse borrowing program | | — | | — | | — | | — | | — | | — | | — | | — | |
Total self-supported debt | | 20,696 | | 20,893 | | 197 | | 19,113 | | 21,463 | | 21,253 | | (210 | ) | 19,625 | |
Forecast allowance | | — | | — | | — | | — | | 200 | | 200 | | — | | — | |
Total provincial debt | | 62,602 | | 59,690 | | (2,912 | ) | 57,895 | | 64,738 | | 63,443 | | (1,295 | ) | 60,693 | |
1 Debt is after deduction of sinking funds and unamortized discounts, and excludes accrued interest. Government direct and fiscal agency accrued interest is reported in the government’s accounts as an accounts payable.
2 Includes debt and guarantees incurred by the government on behalf of school districts, universities, colleges and health authorities/hospital societies (SUCH), and debt directly incurred by these entities.
3 Health facilities’ debt includes public-private partnership obligations of $1,137 million for the six months ended September 30, 2013, $1,190 million for the six months ended September 30, 2014, $1,158 million for fiscal 2013/14 and $1,271 million for fiscal 2014/15.
4 BC Transportation Financing Authority debt includes public-private partnership obligations of $987 million for the six months ended September 30, 2013, $1,079 million for the six months ended September 30, 2014, $1,041 million for fiscal 2013/14 and $1,156 million for fiscal 2014/15.
5 Includes the BC Housing Management Commission and the Provincial Rental Housing Corporation. Social housing debt includes public-private partnership obligations of $23 million for the six months ended Sepember 30, 2013, $63 million for the six months ended September 30, 2014, $45 million for fiscal 2013/14 and $87 million for fiscal 2014/15.
6 Includes service delivery agencies, student loan guarantees, loan guarantees to agricultural producers, guarantees issued under economic development and home mortgage assistance programs and loan guarantee provisions.
7 Joint ventures of the Columbia Power Corporation and Columbia Basin Trust.
Second Quarterly Report 2014/15
24
| Updated Financial Forecast | |
Table 1.15 2014/15 Statement of Financial Position
| | Actual
March 31, | | Year-to-Date
September 30, | | Forecast
March 31, | |
($ millions) | | 2014 | | 2014 | | 2015 | |
Financial assets | | | | | | | |
Cash and temporary investments | | 2,802 | | 3,547 | | 2,041 | |
Other financial assets | | 9,336 | | 8,244 | | 9,256 | |
Sinking funds | | 835 | | 803 | | 902 | |
Investments in commercial Crown corporations: | | | | | | | |
Retained earnings | | 7,839 | | 8,237 | | 8,163 | |
Recoverable capital loans | | 18,921 | | 20,181 | | 20,547 | |
| | 26,760 | | 28,418 | | 28,710 | |
| | 39,733 | | 41,012 | | 40,909 | |
Liabilities | | | | | | | |
Accounts payable and accrued liabilities | | 8,024 | | 7,709 | | 8,182 | |
Deferred revenue | | 9,684 | | 10,652 | | 9,531 | |
Debt: | | | | | | | |
Taxpayer-supported debt | | 41,068 | | 38,797 | | 41,990 | |
Self-supported debt | | 19,625 | | 20,893 | | 21,253 | |
Forecast allowance | | — | | — | | 200 | |
Total provincial debt | | 60,693 | | 59,690 | | 63,443 | |
Add: debt offset by sinking funds | | 835 | | 803 | | 902 | |
Less: guarantees and non-guaranteed debt | | (726 | ) | (351 | ) | (725 | ) |
Financial statement debt | | 60,802 | | 60,142 | | 63,620 | |
| | 78,510 | | 78,503 | | 81,333 | |
Net liabilities | | (38,777 | ) | (37,491 | ) | (40,424 | ) |
Capital and other non-financial assets | | | | | | | |
Tangible capital assets | | 37,778 | | 38,294 | | 39,643 | |
Other non-financial assets | | 3,134 | | 3,083 | | 3,088 | |
| | 40,912 | | 41,377 | | 42,731 | |
Accumulated surplus | | 2,135 | | 3,886 | | 2,307 | |
Changes in Financial Position
| | Year-to-Date
September 30, | | Forecast
March 31, | |
($ millions) | | 2014 | | 2015 | |
| | | | | |
(Surplus) deficit for the period | | (1,943 | ) | (444 | ) |
Comprehensive income (increase) decrease | | 192 | | 272 | |
(Increase) decrease in accumulated surplus | | (1,751 | ) | (172 | ) |
Capital and other non-financial asset changes: | | | | | |
Increase in taxpayer-supported capital investments | | 1,535 | | 4,012 | |
Less: amortization and other accounting changes | | (1,019 | ) | (2,147 | ) |
Change in net capital assets | | 516 | | 1,865 | |
Increase (decrease) in other non-financial assets | | (51 | ) | (46 | ) |
| | 465 | | 1,819 | |
Increase (decrease) in net liabilities | | (1,286 | ) | 1,647 | |
Investment and working capital changes: | | | | | |
Increase (reduction) in cash and temporary investments | | 745 | | (761 | ) |
Increase in total investment in commercial Crown corporations: | | | | | |
Increase (decrease) in retained earnings | | 398 | | 324 | |
Self-supported capital investments | | 1,100 | | 2,651 | |
Less: loan repayments and other accounting changes | | 160 | | (1,025 | ) |
| | 1,658 | | 1,950 | |
Other working capital changes | | (1,777 | ) | (18 | ) |
| | 626 | | 1,171 | |
Increase (decrease) in financial statement debt | | (660 | ) | 2,818 | |
(Increase) decrease in sinking fund debt | | 32 | | (67 | ) |
Increase (decrease) in guarantees and non-guaranteed debt | | (375 | ) | (1 | ) |
Increase (decrease) in total provincial debt | | (1,003 | ) | 2,750 | |
Second Quarterly Report 2014/15
25
PART TWO — ECONOMIC REVIEW AND OUTLOOK 1
2014/15 Second Quarterly Report | | November 26, 2014 |
Summary
· In the first Quarterly Report, the Ministry of Finance forecast BC’s real GDP to grow by 1.9 per cent in 2014 and 2.3 per cent in 2015. The private sector outlook for 2014 has increased slightly since that time and the Ministry’s forecast for BC in both years remains prudent compared to the average private sector projection.
· BC’s economy has experienced steady growth so far in 2014 in some of its key sectors, including exports, retail sales and housing. However, employment gains and inflation in BC have been modest.
· Downside risks to BC’s economic outlook include the potential for slowing domestic activity, weakness in the US economic recovery and slowing Asian demand. Additional risks include the ongoing sovereign debt situation in Europe, a fluctuating Canadian dollar and weak inflation.
British Columbia outlook — comparison to private sector forecasts
Chart 2.1 Ministry forecast for BC remains prudent
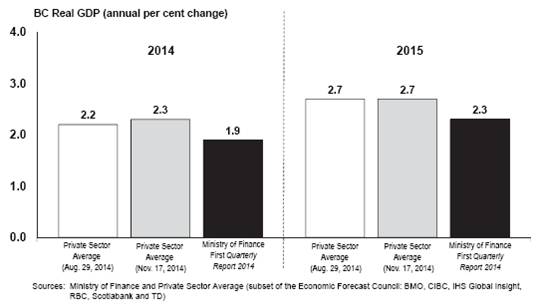
Private sector projections for BC’s economic growth have changed slightly over the last several months. At the time of the first Quarterly Report, the private sector anticipated that BC’s real GDP would expand by 2.2 per cent in 2014 and 2.7 per cent in 2015. As of November 17, 2014, this average forecast increased 0.1 percentage points in 2014 and remained unchanged in 2015, ranking BC second among provinces for growth in both years (behind only Alberta). The Ministry of Finance forecast of 1.9 per cent in 2014 and 2.3 per cent in 2015 for BC economic growth remains prudent compared to the current average private sector outlook.
1 Reflects information available as of November 17, 2014, unless otherwise indicated.
Second Quarterly Report 2014/15
| Economic Review and Outlook | |
British Columbia economic activity
Indicators of BC’s economic performance so far in 2014 generally reveal steady growth in domestic activity relative to the same period of 2013 (as illustrated in Table 2.1), with the exception of employment and non-residential building permits.
Table 2.1 British Columbia Economic Indicators
All data seasonally adjusted | | Apr. to Jun. 2014
change from
Jan. to Mar. 2014 | | Jul. to Sep. 2014
change from
Apr. to Jun. 2014 | | Year-to-Date
Jan. to Sep. 2014
change from
Jan. to Sep. 2013 | |
| | Per cent change | |
Employment | | +0.3 | | +0.4 | | +0.6 | |
Manufacturing shipments | | +3.6 | | +1.6 | | +7.0 | |
Exports | | +6.3 | | -4.5 | | +8.0 | |
Retail sales1 | | +3.3 | | +0.9 | | +5.7 | |
Housing starts | | +10.7 | | +10.5 | | +6.6 | |
Non-residential building permits | | -1.1 | | -5.4 | | -0.2 | |
1 Data to August
Labour market
Employment growth in BC has been modest during the first ten months of 2014, with a gain of 0.7 per cent (or 15,800 jobs) year-to-date to October compared to the same period last year. This increase in employment is the result of around 3,900 more full-time and 11,900 more part-time jobs so far this year.
Chart 2.2 BC employment
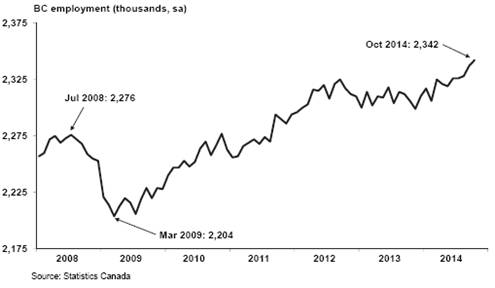
Year-to-date employment gains occurred primarily in transportation and warehousing (+22,100 jobs), health care and social assistance (+21,300 jobs) and manufacturing (+12,000 jobs). These gains were partially offset by declines in trade (-19,500 jobs), finance, insurance, real estate and leasing (-6,600 jobs) and construction (-6,100 jobs).
Second Quarterly Report 2014/15
28
| Economic Review and Outlook | |
BC’s monthly unemployment rate sat at 6.1 per cent in October 2014, unchanged from the previous month. The rate averaged 6.1 per cent year-to-date to October. Although this represents a 0.5 percentage point drop relative to the first ten months in 2013, this decline was partly due to slower-than-anticipated labour force growth (up only 0.2 per cent).
Consumer spending and housing
Despite modest job creation, retail sales have been a source of strength in BC’s economy so far this year. During the first eight months of 2014, sales increased by a robust 5.7 per cent compared to the same period last year. Gains over this period were broad based, with notable increases observed at motor vehicle and parts dealers, general merchandise stores, and food and beverage stores. Meanwhile, the only retail segment to lose sales year-to-date to August was building material and garden equipment and supply dealers. Though it may be too soon to fully understand the divergence between employment and retail sales growth in recent quarters, possible explanations may include increased tourist traffic to BC and the return to positive net interprovincial migration into the province year-to-date to June (after two years of annual net outflows to other provinces). However, the current pace of retail spending is not expected to continue given the modest employment situation, particularly for purchases of expensive discretionary products such as automobiles.
Chart 2.3 BC retail sales
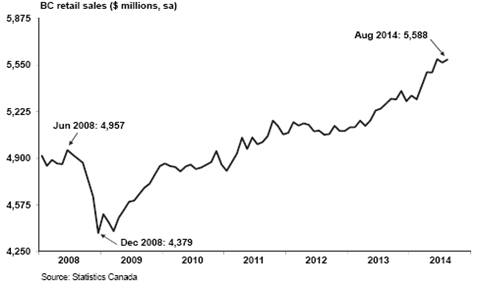
Annual inflation in BC registered above 1.0 per cent for the sixth consecutive month in September, after remaining below that rate for nineteen months in a row. The extended period of weak price growth prior to April 2014 was partially the result of the return to the PST sales tax system in April 2013. Overall, consumer prices in BC increased by 1.0 per cent through the first nine months of 2014 compared to January through September 2013. Over this period, inflation was relatively strong for energy products (such as gasoline) and food purchased from stores, while prices fell for food purchased from restaurants and home entertainment equipment, parts and services.
Second Quarterly Report 2014/15
29
| Economic Review and Outlook | |
BC housing starts averaged about 27,900 annualized units through the first ten months of 2014. The level is in line with the historical trend (with home construction averaging around 28,900 units from January 1990 to December 2013) and represents a 5.8 per cent gain compared to the same period in 2013. Meanwhile, residential building permits (a leading indicator of new housing activity) advanced by 4.9 per cent year-to-date to September 2014 compared to the same period last year, suggesting that strength may continue in BC homebuilding in the near future.
Chart 2.4 BC housing starts
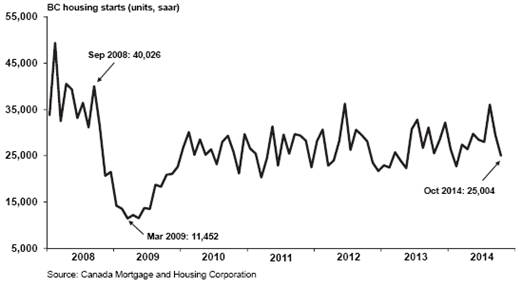
Home sales in BC advanced through the first ten months of 2014, climbing 15.1 per cent year-to-date to October compared to the same period of last year. At the same time, the average home price during this period was around $566,700, a gain of 6.8 per cent. Low mortgage rates and improving economic conditions are partly responsible for the strong housing market activity this year; however, momentum may wane as interest rates are expected to increase in the latter half of 2015.
The value of total non-residential building permits fell by 0.2 per cent year-to-date to September relative to the same period last year. Gains in commercial permits (+8.2 per cent) were outweighed by declines in industrial (-21.4 per cent) and institutional and government permits (-6.4 per cent) over the period.
External trade and commodity markets
BC businesses have enjoyed solid growth in export sales through the first nine months of 2014, with the value of BC international merchandise exports increasing by 8.0 per cent compared to the same period last year. In particular, substantial gains occurred in exports of metal ores and non-metallic minerals (+25.9 per cent), industrial machinery, equipment and parts (+17.8 per cent), and forestry products and building and packaging materials (+7.6 per cent). Exporters have benefited from increased economic activity in the US, with American exports up 15.4 per cent year-to-date to September. However, BC exports to China increased only 1.2 per cent over this period after eight consecutive years of double-digit growth, as slowing growth in the Chinese economy has restrained demand for BC products (in particular coal, which is down 22.3 per cent year-to-date to September).
Second Quarterly Report 2014/15
30
| Economic Review and Outlook | |
Chart 2.5 BC exports

Like total goods exports, decent gains were also observed in shipments of manufactured goods in BC from January through September 2014, up 7.0 per cent compared to the first nine months of 2013. Notable growth was recorded in sectors such as shipments of paper products (+12.4 per cent), machinery (+12.1 per cent) and food (+5.7 per cent), which offset losses in electrical equipment, appliance and computer products (-7.4 per cent) and primary metal (-5.4 per cent).
Although prices for several forestry and energy products have increased in the first ten months of 2014 compared to last year, global commodity prices in general are expected to fluctuate in the near-term due to ongoing global economic uncertainty and slowing growth of the Chinese economy.
The price of spruce-pine-fir (SPF) lumber started 2014 at $375 US/000 board feet in January and dropped to a low of $325 US/000 board feet in June. Since then, the price climbed steadily to reach $363 US/000 board feet in September then slipped to $350 US/000 board feet in October. Altogether, the price has increased 0.3 per cent year-to-date to October.
The average price of pulp has increased every month for the past two years, with the exception of August 2013. It began 2014 at $910 US per tonne and resided at $932 per tonne as of October, registering a 9.0 per cent increase compared to the first ten months of 2013.
After reaching $105.79 US per barrel in June 2014, the daily West Texas Intermediate (WTI) oil price dropped dramatically in recent months, landing at $84.40 US per barrel in October. The decline was due to a number of factors, such as increased oil production in the US, slower growth in global demand and appreciation of the US dollar. Overall, the average price over the first ten months of 2014 ($98.27 US per barrel) was almost unchanged from the same period in 2013. Meanwhile, the price of natural gas shot up 78.0 per cent month-over-month to $5.19 C/GJ in February 2014 alongside surging
Second Quarterly Report 2014/15
31
| Economic Review and Outlook | |
heating demands due to abnormally cold weather, but has since moderated back to levels more consistent with recent trends (registering at $2.40 C/GJ in October 2014). Overall, the price of natural gas averaged $3.28 C/GJ through the first ten months of the year, up from an average price of $1.96 C/GJ observed over the same period in 2013.
Risks to the economic outlook
Risks to the BC economic outlook continue to be weighted to the downside. The main risks to the current outlook include the following:
· potential for a slowdown in domestic economic activity, including weakness in employment and retail sales;
· weakness in the US economy (characterized by slower consumer spending, a protracted job market recovery and recurring federal fiscal issues);
· the ongoing European sovereign debt situation;
· slower than anticipated economic activity in Asia, particularly in China, resulting in weaker demand for BC’s exports and downward pressure on global commodity prices;
· weaker than expected inflation, and
· exchange rate volatility.
External environment
United States
According to the advance estimate, US real GDP grew by an annualized 3.5 per cent in the July to September quarter of 2014. This growth rate is lower than the 4.6 per cent gain observed in the previous quarter when the US economy was rebounding from a weather-related contraction in the January to March quarter. The gain in the July to September period reflected broad-based growth among components, with consumption and net exports leading the way. Government spending also registered its strongest contribution to GDP since 2009, though most of this strength came from military expenditures, which tend to fluctuate. Meanwhile, inventory growth was weak in the quarter. Analysts note that recent economic performance in the US has been strong
Chart 2.6 US economic growth
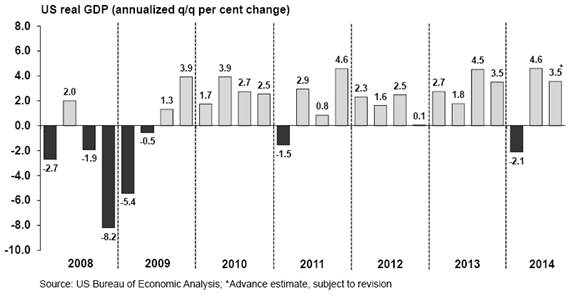
Second Quarterly Report 2014/15
32
| Economic Review and Outlook | |
relative to other countries, but remains underwhelming compared to the US’s own historical economic recoveries. There is also concern that the strength in net exports may not be as robust in the coming quarters given recent weakness in the global outlook.
US employment grew steadily through 2014, though weakness in the labour market persists. Year-to-date to October, the US economy created an average of 228,500 jobs each month, with the level of employment up 1.8 per cent compared to the same period in 2013. Further, the US unemployment rate trended downward through the first ten months of 2014, arriving at 5.8 per cent in October. However, considerable room for improvement remains. The US labour force participation rate (the proportion of working-age civilians that are employed or seeking work) has deteriorated steadily since the latter part of 2008 and currently resides at historically depressed levels. In addition, wage growth in the US has been trending barely above inflation and, as of October 2014, the number of long-term unemployed Americans (those who have been jobless for 27 weeks or more) was still more than double the annual average observed in 2007.
Chart 2.7 US employment
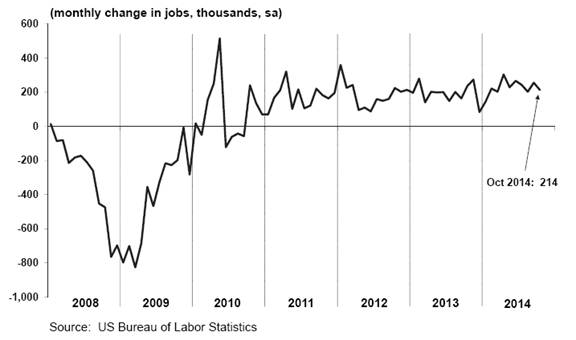
The monthly pace of US residential construction was uneven through the first nine months of 2014, as the protracted and bumpy recovery in the US housing market continued in its sixth year since the 2008/09 recession. Even so, homebuilding climbed upward through the year, resulting in a gain of 8.9 per cent year-to-date to September over the same period in 2013. While this rate of growth is robust, it is more modest than the annual pace observed in 2012 and 2013 (at 28.2 per cent and 18.5 per cent, respectively). Single-unit homes accounted for around 65 per cent of the total housing starts year-to-date to September 2014 (with the other 35 per cent being multiple-unit dwellings such as apartment buildings), similar to the ratio observed in recent years. In contrast, this ratio averaged around 80 per cent from the early 1990s through to the mid-2000s prior to the housing market crash. This shift towards multiple-unit dwellings may in part reflect changing attitudes towards homeownership in the US.
Second Quarterly Report 2014/15
33
| Economic Review and Outlook | |
Chart 2.8 US housing starts
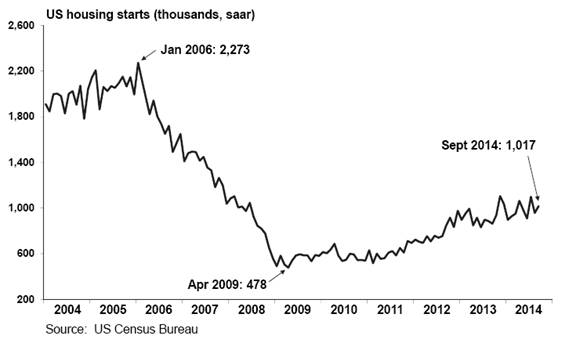
Sales of new and existing homes in the US have been weak so far in 2014. Existing home sales averaged 4.9 million annualized units year-to-date to September, a decrease of 5.0 per cent relative to the same period of 2013. New home sales fared better over this time, averaging around 434,300 annualized units through the first nine months of 2014 and registering a slight year-to-date gain of 2.1 per cent compared to the previous year. Meanwhile, US home prices were still about 9 per cent below their pre-recession peak in August 2014, and around 11 per cent of homes with a mortgage were underwater (where the home value is lower than the mortgage amount owing) as of the second quarter of 2014. Though the continued recovery in the US labour market is expected to support housing sales and construction going forward, US realtors and homebuilders continue to face headwinds, such as shortages of skilled construction workers and ongoing weakness in household balance sheets.
US retail activity trended upward from January to October 2014, with gains in eight out of ten months. Overall, retail sales were up 3.9 per cent over this period compared to the first ten months of 2013. Retail spending has likely been supported by rising consumer confidence, which reached its highest level in seven years in October after increasing in five out of the six previous months. In particular, a notable increase in American consumers’ expectations in October is a good sign for US retail activity through the remainder of 2014.
Consensus Economics forecasters have increased their average US real GDP forecast for 2014 slightly since the first Quarterly Report. The November Consensus survey projects growth of 2.2 per cent for 2014, 0.1 percentage points higher than the August forecast. On the other hand, the outlook for US real GDP growth in 2015 was downgraded by 0.1 percentage point to 3.0 per cent from August to November.
Second Quarterly Report 2014/15
34
| Economic Review and Outlook | |
Chart 2.9 Consensus outlook for US up slightly since August
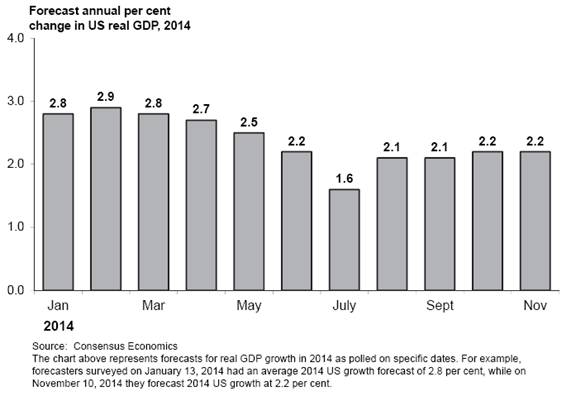
Canada
Canadian real GDP advanced at an annualized rate of 2.3 per cent from January through June 2014 compared to the same period in 2013. In the January to March quarter, Canadian real GDP grew just 1.0 per cent quarter-on-quarter, with economic activity likely held back by adverse weather conditions. The national economy then rebounded somewhat with 3.6 per cent growth in the April to June quarter of 2014, led by double- digit gains in exports. However, recent indications of renewed weakness in the global economy (stemming largely from slower activity in Europe, China and Japan) suggest that growth in Canada’s exports and overall economy may moderate in the coming quarters.
Canada’s domestic economic activity has been moderate in 2014. Canada’s economy created an average of around 20,100 jobs per month year-to-date to October, increasing the level of employment by 0.7 per cent compared to the same period last year. The unemployment rate averaged 6.9 per cent so far this year, down 0.2 percentage points compared to the first ten months of 2013. Meanwhile, Canadian homebuilding has regained momentum after posting an annual decline in 2013, with housing starts increasing 1.4 per cent year-to-date to October 2014. National home sales and average home prices have increased year-to-date to October as well, with sales up 4.5 per cent (due in part to substantial gains observed in the April to June quarter of 2014) and prices increasing 7.0 per cent compared to the first ten months of 2013. Also domestically, retail sales saw a healthy gain of 4.7 per cent year-to-date to August compared to the first eight months of 2013. Going forward, some analysts anticipate that Canadian retail sales may be constrained by household debt loads and reduced equity returns.
Canadian merchandise exports grew by 11.1 per cent year-to-date to September relative to the same period of 2013. Notable gains during the first nine months of this year occurred in exports of energy products, consumer goods and motor vehicles and parts. These increases more than outweighed a minor year-to-date decline in exports of metal ores and non-metallic minerals. The value of manufacturing shipments in Canada also posted steady gains so far in 2014, up 5.6 per cent year-to-date to September compared to the same period of last year.
Second Quarterly Report 2014/15
35
| Economic Review and Outlook | |
Since the first Quarterly Report, private sector economists have revised their average forecast up 0.1 percentage points for the Canadian economy in 2014, with the November Consensus expecting Canada’s real GDP to grow by 2.3 per cent. Meanwhile, Consensus forecasts for the Canadian economy in 2015 have been maintained since January at 2.5 per cent growth for next year.
Chart 2.10 Consensus maintains relatively steady forecasts for Canadian growth in 2014

Europe
After registering only 0.1 per cent growth in real GDP in the April to June quarter of 2014, early estimates out of the euro zone peg growth at just 0.2 per cent in the July to September quarter. Germany, Europe’s largest economy, continues to experience weak economic growth following a contraction in its real GDP in the April to June quarter. Furthermore, industrial production in the euro zone fell 0.4 per cent in the most recent quarter after posting zero growth the previous quarter, and the region’s unemployment rate remained at 11.5 per cent in September. Annual inflation in the euro area has been below one per cent for thirteen months through October (and registered just 0.4 per cent in October) and some analysts are concerned that there is a risk that the current very low inflation could turn into deflation. Also in October, a regulatory review of banks in the euro zone determined that 25 of the 130 largest banks in the region had insufficient capital, raising questions about the health of the European banking system.
According to Mario Draghi, President of the European Central Bank (ECB), risks facing the euro zone’s economic outlook remain tilted to the downside, given heightened geopolitical risks, recent weakening in the region’s growth momentum, and the potential for insufficient progress in structural reforms of some troubled member states. In light of this weakness, the ECB embarked on a new asset-backed securities and covered bond purchase program in October, with purchases expected to span at least two years. This new stimulus program is designed to return inflation toward the central bank’s target near 2.0 per cent, though some analysts believe that more action may be required.
Second Quarterly Report 2014/15
36
| Economic Review and Outlook | |
Consensus forecasts for the euro zone economy have fallen in recent months, both for 2014 and for 2015. In its November publication, Consensus called for just 0.8 per cent growth in 2014 and 1.1 per cent the following year. Alongside these forecasts, Consensus analysts highlighted concerns about deflation and suggested that the ECB may embark on a full-scale quantitative easing program to combat the continuing economic stagnation in the euro zone.
Chart 2.11 Consensus forecast for euro zone downgraded in recent months
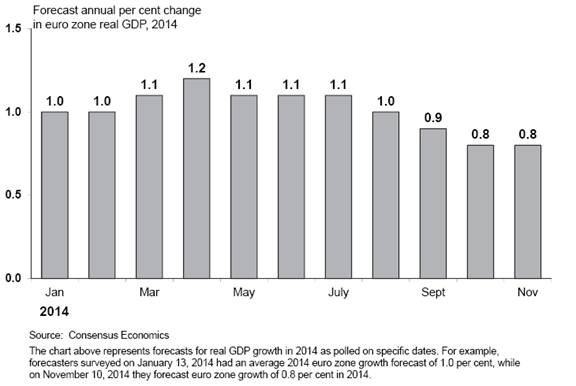
China
Recent economic data out of China has been mixed. While exports beat expectations in October, annual inflation remained at its lowest rate since 2010 and year-over-year growth in retail sales slowed for a fifth consecutive month. In addition, China’s property market has cooled markedly this year which, along with the sign of slowing in the broader economy, has prompted officials to implement a series of small targeted stimulus measures throughout the year. Such measures include investments in infrastructure, expanded credit to private businesses and the injection of billions of dollars into the banking system to enhance liquidity.
Altogether, China’s economy grew 7.3 per cent in the July to September quarter of 2014 compared to the same period in 2013. This marks the slowest year-over-year growth of the Chinese economy since the beginning of 2009, during the height of the global financial crisis. Though economic growth is running below the Chinese government’s official target of 7.5 per cent, China’s Prime Minister Li Keqiang announced in September that the government would be comfortable with slower growth as long as job creation remains steady.
From August to November, the Consensus forecast for China’s real GDP growth held steady at 7.4 per cent for 2014, but decreased by 0.1 percentage points to 7.1 per cent for 2015. In the November publication, Consensus analysts stated that industrial overcapacity and moderation in the real estate sector are putting downward pressure on prices, and that China’s economic activity is showing softness at the beginning of the October to December quarter of 2014.
Second Quarterly Report 2014/15
37
| Economic Review and Outlook | |
Financial markets
Interest rates
During its meeting in October, the Bank of Canada announced that it will continue to hold its target for the overnight rate at 1.00 per cent (where the rate has remained since September 2010). In its accompanying Monetary Policy Report, the Bank increased its forecast slightly for the Canadian economy in 2014, but downgraded its global outlook for 2015 and 2016. In a separate speech, Bank of Canada governor Stephen Poloz stated that the single largest headwind facing the global economic recovery is lingering uncertainty about the future due to geopolitical tensions, market volatility and legacy effects from the recent recession. To help counteract these headwinds, Mr. Poloz indicated that interest rates will remain low. Most private sector forecasters expect the Bank to postpone increasing interest rates until the second half of 2015.
Chart 2.12 Interest rates expected to remain low in the near-term
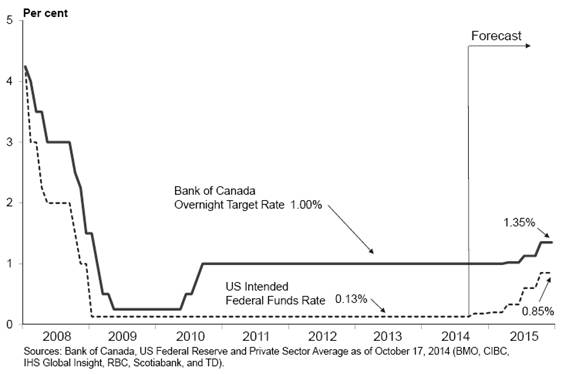
As widely expected, the US Federal Reserve held its intended federal funds rate in the 0.00 to 0.25 per cent range at its most recent meeting in October, and announced the end of its asset purchase program. Despite the completion of the program, the Fed noted that it will maintain a large balance sheet by continuing to reinvest maturing securities. Furthermore, Federal Reserve policymakers stated that the federal funds rate will likely remain at its current highly accommodative level for a considerable amount of time. As with Canadian rates, most private sector analysts do not expect the Fed to raise rates until mid-2015 or later.
The average of private sector forecasters’ views on Canadian short-term interest rates (three-month Treasury bills) as of October 17, 2014 indicates that three-month rates will average 0.9 per cent in 2014 and 1.1 per cent in 2015. The same forecasters project ten-year Government of Canada bonds to average 2.3 per cent in 2014 and 2.9 per cent the following year.
Second Quarterly Report 2014/15
38
| Economic Review and Outlook | |
Table 2.2 Private Sector Canadian Interest Rate Forecasts
| | 3-month Treasury Bill | | 10-year Government Bond | |
Average annual interest rate (per cent) | | 2014 | | 2015 | | 2014 | | 2015 | |
IHS Global Insight | | 0.9 | | 1.1 | | 2.4 | | 3.2 | |
CIBC | | 0.9 | | 1.1 | | 2.3 | | 2.8 | |
Bank of Montreal | | 0.9 | | 1.0 | | 2.2 | | 2.4 | |
Scotiabank | | 0.9 | | 1.1 | | 2.3 | | 3.0 | |
TD Economics | | 0.9 | | 1.1 | | 2.3 | | 2.8 | |
RBC Capital Markets | | 0.9 | | 1.4 | | 2.3 | | 3.0 | |
Average (as of October 17, 2014) | | 0.9 | | 1.1 | | 2.3 | | 2.9 | |
Exchange rate
After beginning the year at 94.0 US cents, the Canadian dollar dropped to as low as 88.9 US cents in March, then rebounded back to 94.0 US cents in July. The loonie has softened again, registering at 88.4 US cents as of November 17, 2014. The depreciation of the Canadian dollar over the past few months continued a trend underway since 2012 when the dollar was near parity with its US counterpart. The gradual recovery of the US economy (and, more recently, falling prices for oil) has contributed to the depreciation of the Canadian dollar.
Chart 2.13 Private sector expects Canadian dollar below parity
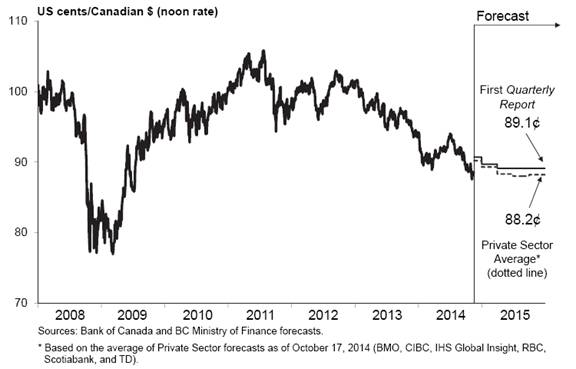
As of October 17, 2014, an average of six private sector forecasts calls for the Canadian dollar to average 91.1 US cents in 2014 and 88.4 per cent in 2015.
Table 2.3 Private Sector Exchange Rate Forecasts
Average annual exchange rate (US cents/Can $) | | 2014 | | 2015 | |
IHS Global Insight | | 91.3 | | 91.3 | |
CIBC | | 91.6 | | 87.1 | |
Bank of Montreal | | 91.0 | | 88.0 | |
Scotiabank | | 91.1 | | 89.8 | |
TD Economics | | 91.0 | | 88.6 | |
RBC Capital Markets | | 90.6 | | 85.8 | |
Average (as of October 17, 2014) | | 91.1 | | 88.4 | |
Second Quarterly Report 2014/15
39
| Economic Review and Outlook | |
Provincial Economic Accounts Update
Statistics Canada released its estimates of provincial GDP for 2013 on November 5, 2014.
British Columbia’s real GDP increased by 1.9 per cent in 2013, following a gain of 2.4 per cent the previous year. BC registered the sixth strongest growth rate among provinces last year, behind Newfoundland and Labrador (7.2 per cent), Saskatchewan (5.0 per cent), Alberta (3.8 per cent), Manitoba (2.2 per cent) and Prince Edward Island (2.0 per cent). Overall, the Canadian economy grew by 2.0 per cent in 2013.
Chart 1 – Real GDP in Canadian provinces
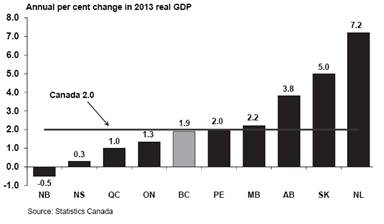
BC’s main real GDP expenditure categories all experienced positive growth in 2013, with the exception of gross fixed capital formation, which fell by 1.2 per cent on the year following an increase of 8.1 per cent the year before. Household final consumption expenditures advanced by 2.5 per cent in 2013 after increasing 2.1 per cent in 2012, while government spending (federal, provincial, local and Aboriginal) registered a 0.6 per cent gain on the year following growth of 1.8 per cent in 2012. The pace of growth also slowed for imports of goods and services, which increased by just 0.8 per cent in 2013 following a gain of 3.9 per cent the previous year. Meanwhile, exports of goods and services advanced 2.5 per cent last year after increasing 1.0 per cent in 2012.
Real GDP
Annual growth in BC’s real GDP from 2010 to 2013 is illustrated in Chart 2. The latest data incorporate historical revisions to real GDP back to 2011, which result in a significant increase in the estimated growth of BC’s economy in 2012, from 1.5 per cent to 2.4 per cent. The data now reveal that growth in BC’s economy has slowed each year since 2010.
Chart 2 – BC real GDP
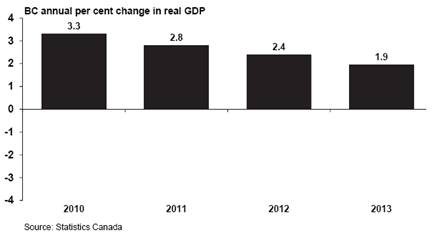
Nominal GDP
Chart 3 depicts BC’s nominal GDP in recent years (in levels). Nominal GDP increased by $7.1 billion (or 3.2 per cent) in 2013, after growing by $5.1 billion (or 2.3 per cent) the previous year. Statistics Canada’s latest release also incorporated historical revisions to nominal GDP, with a notable upward revision in 2011 nominal GDP from $215.1 billion (an increase of 4.4 per cent over the 2010 level) to $217.5 billion (an annual increase of 5.6 per cent).
Chart 3 – BC nominal GDP
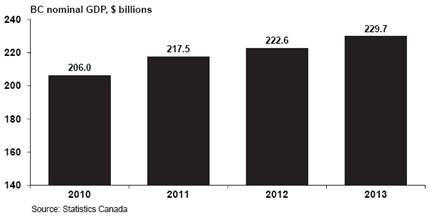
Second Quarterly Report 2014/15
40