Exhibit 99.8
Budget and Fiscal Plan
2015/16 — 2017/18
February 17, 2015

National Library of Canada Cataloguing in Publication Data
British Columbia.
Budget and fiscal plan. — 2002/03/2004/05-
Annual
Also available on the Internet.
Continues: British Columbia. Ministry of Finance and
Corporate Relations. Budget … reports. ISSN 1207-5841
ISSN 1705-6071 = Budget and fiscal plan — British Columbia.
1. Budget — British Columbia — Periodicals. 2. British
Columbia — Appropriations and expenditures — Periodicals.
I. British Columbia. Ministry of Finance. II. Title.
HJ12.B742 352.48’09711’05 C2003-960048-3
TABLE OF CONTENTS
Budget and Fiscal Plan 2015/16 — 2017/18 | February 17, 2015 |
Attestation by the Secretary to Treasury Board | | |
| | |
Summary | | 1 |
| | |
Part 1: | Three Year Fiscal Plan | | |
Introduction | | 5 |
Revenue | | 8 |
| Major Revenue Sources | | 10 |
Expense | | 18 |
| Consolidated Revenue Fund Spending | | 18 |
| Management of the BC Public Service | | 24 |
| Recovered Expenses | | 24 |
| Operating Transfers | | 25 |
| Service Delivery Agency Spending | | 25 |
Capital Spending | | 26 |
| Taxpayer-supported Capital Spending | | 26 |
| Self-supported Capital Spending | | 30 |
| Projects over $50 million | | 31 |
Provincial Debt | | 35 |
Risks to the Fiscal Plan | | 37 |
Tables: | | |
| 1.1 | Three Year Fiscal Plan | | 5 |
| 1.2 | Comparison of Major Factors Underlying Revenue | | 9 |
| 1.3 | Personal Income Tax Revenue | | 10 |
| 1.4 | Corporate Income Tax Revenue | | 11 |
| 1.5 | Sales Taxes Revenue | | 11 |
| 1.6 | Federal Government Contributions | | 13 |
| 1.7 | Revenue by Source | | 16 |
| 1.8 | Expense by Ministry, Program and Agency | | 17 |
| 1.9 | Health Per Capita Costs and Outcomes: Canadian Comparisons | | 19 |
| 1.10 | Increased Funding for K—12 Education | | 20 |
| 1.11 | Supporting Economic Development | | 21 |
| 1.12 | Benefiting the Environment | | 22 |
| 1.13 | Supporting Families and Individuals in Need | | 22 |
| 1.14 | Capital Spending | | 26 |
| 1.15 | Provincial Transportation Investments | | 29 |
| 1.16 | Capital Expenditure Projects Greater Than $50 million | | 32 |
| 1.17 | Provincial Debt Summary | | 35 |
| 1.18 | Provincial Borrowing Requirements | | 36 |
| 1.19 | Reconciliation of Summary Results to Provincial Debt Changes | | 36 |
| 1.20 | Key Fiscal Sensitivities | | 37 |
Budget and Fiscal Plan — 2015/16 to 2017/18
Table of Contents
Topic Boxes: | | |
| Managing Fair and Affordable Public Sector Compensation | | 41 |
| Strengthening Our Relationship with First Nations: BC’s Response to the Tsilhqot’in Decision | | 44 |
| A Pan-Canadian “Renminbi Hub” | | 46 |
| Opportunities for British Columbia Liquefied Natural Gas — Update | | 48 |
| Strategic Debt Management | | 50 |
| | | |
Part 2: | Tax Measures | | |
Tax Measures — Supplementary Information | | 54 |
Tables: | | |
| 2.1 | Summary of Tax Measures | | 53 |
| | | | |
Topic Box: | | |
| Carbon Tax Report and Plan | | 60 |
| | | | |
Part 3: | British Columbia Economic Review and Outlook | | |
Summary | | 63 |
British Columbia Economic Activity and Outlook | | 63 |
| The Labour Market | | 64 |
| Consumer Spending and Housing | | 65 |
| Business and Government | | 67 |
| External Trade and Commodity Markets | | 67 |
| Demographics | | 69 |
| Inflation | | 69 |
Risks to the Economic Outlook | | 70 |
External Outlook | | 70 |
| United States | | 70 |
| Canada | | 73 |
| Europe | | 74 |
| China | | 76 |
Financial Markets | | 76 |
| Interest Rates | | 76 |
| Exchange Rate | | 77 |
Tables: | | |
| 3.1 | British Columbia Economic Indicators | | 64 |
| 3.2 | US real GDP forecast: Consensus vs Ministry of Finance | | 73 |
| 3.3 | Canadian real GDP forecast: Consensus vs Ministry of Finance | | 74 |
| 3.4 | Private Sector Canadian Interest Rate Forecasts | | 77 |
| 3.5 | Private Sector Exchange Rate Forecasts | | 78 |
| 3.6.1 | Gross Domestic Product: British Columbia | | 79 |
| 3.6.2 | Components of Nominal Income and Expenditure | | 80 |
| 3.6.3 | Labour Market Indicators | | 80 |
| 3.6.4 | Major Economic Assumptions | | 81 |
Topic Box: | | |
| The Economic Forecast Council, 2015 | | 82 |
Budget and Fiscal Plan — 2015/16 to 2017/18
ii
Table of Contents
Part 4: 2014/15 Updated Financial Forecast (Third Quarterly Report) | | |
Introduction | | 87 |
Revenue | | 89 |
Expense | | 89 |
| Contingencies | | 89 |
Government Employment (FTEs) | | 90 |
Provincial Capital Spending | | 90 |
Provincial Debt | | 91 |
Risks to the Fiscal Forecast | | 92 |
Supplementary Schedules | | 92 |
Tables: | | |
| 4.1 | 2014/15 Forecast Update | | 87 |
| 4.2 | 2014/15 Financial Forecast Changes | | 88 |
| 4.3 | 2014/15 Capital Spending Update | | 90 |
| 4.4 | 2014/15 Provincial Debt Update | | 91 |
| 4.5 | 2014/15 Operating Statement | | 92 |
| 4.6 | 2014/15 Revenue by Source | | 93 |
| 4.7 | 2014/15 Expense by Ministry, Program and Agency | | 94 |
| 4.8 | 2014/15 Expense by Function | | 95 |
| 4.9 | 2014/15 Capital Spending | | 96 |
| 4.10 | 2014/15 Provincial Debt | | 97 |
| 4.11 | 2014/15 Statement of Financial Position | | 98 |
| | | | |
Appendix | | 99 |
Budget and Fiscal Plan — 2015/16 to 2017/18
iii

| February 17, 2015 |
As required by Section 7(d) of the Budget Transparency and Accountability Act (BTAA), and Section 4a(v) of the Carbon Tax Act, I confirm that Budget 2015 contains the following elements:
· Fiscal forecasts for 2015/16 to 2017/18 (provided in Part 1) and economic forecasts for 2015 to 2019 (provided in Part 3).
· A report on the advice received from the Economic Forecast Council (EFC) in early December 2014 (updated January 2015) on the economic growth outlook for British Columbia, including a range of forecasts for 2015 and 2016 (see Part 3, page 82).
· Material economic, demographic, fiscal, accounting policy and other assumptions and risks underlying Budget 2015 economic and fiscal forecasts In particular:
· The economic forecast reflects stable economic growth for British Columbia in an environment where the global economic situation remains mixed. While the US economy is improving, Europe’s outlook is uncertain, growth in China is slowing, and the Canadian economy is being impacted by low oil prices. Accordingly, the economic projections assumed in Budget 2015 are more prudent relative to the average of the forecasts provided by the Economic Forecast Council
· Personal and corporate income tax revenue forecasts include the final 2013 assessments and the latest projections for these taxation revenue sources received from the federal government.
· Natural gas forecasts continue to reflect the recommendations of an independent consultant on the natural gas price forecast methodology (see Budget 2013) in order to maintain prudence against volatility, but do not reflect any incremental revenue from liquefied natural gas development.
· Ministry budgets include base increases for the costs of collective agreements signed under government’s current wage mandate, including the recent teachers settlement; however any costs arising from the Economic Stability Dividend portion of the mandate will be addressed in the fiscal plan at such time they are triggered. Any costs arising from the outcome of the appeal regarding the BC Supreme Court decision on the teachers’ contract will be addressed in future fiscal plans
· Forecast prudence totals $600 million in 2015/16 and $750 million in each of 2016/17 and 2017/18, being the sum of the Contingencies vote and the forecast allowance in each fiscal year.
· The capital plan includes spending projections for the Site C dam project and initial funding for site preparation costs for the Massey Tunnel replacement project.
· Revenue and spending forecasts include three-year financial projections for school districts, post-secondary institutions and health authorities, as provided by the Ministries of Education, Advanced Education and Health, respectively, based on plans submitted to the ministries by those entities, and for the other service delivery agencies and the commercial Crown corporations, as submitted directly to the Ministry of Finance by those organizations.
· A Revenue Neutral Carbon Tax Report for 2013/14 and 2014/15, and the Revenue Neutral Carbon Tax Plan for 2015/16 to 2017/18 (see Part 2: Tax Measures, page 60).
To the best of my knowledge, the three-year fiscal plan contained in Budget 2015 conforms to the standards and guidelines of generally accepted accounting principles for senior government as outlined in Note 1 of the 2013/14 Public Accounts.
| /s/ Peter Milburn |
| Peter Milburn |
| Deputy Minister and |
| Secretary to Treasury Board |
Budget and Fiscal Plan — 2015/16 to 2017/18
Summary: BUDGET AND FISCAL PLAN — 2015/16 to 2017/18
| | Updated | | Budget | | | | | |
| | Forecast | | Estimate | | Plan | | Plan | |
($ millions) | | 2014/15 | | 2015/16 | | 2016/17 | | 2017/18 | |
Revenue | | 45,772 | | 46,365 | | 47,646 | | 48,617 | |
Expense | | (44,793 | ) | (45,831 | ) | (46,920 | ) | (47,868 | ) |
Surplus before forecast allowance | | 979 | | 534 | | 726 | | 749 | |
Forecast allowance | | (100 | ) | (250 | ) | (350 | ) | (350 | ) |
Surplus | | 879 | | 284 | | 376 | | 399 | |
Capital spending: | | | | | | | | | |
Taxpayer-supported capital spending | | 3,637 | | 3,731 | | 3,726 | | 3,199 | |
Self-supported capital spending | | 2,604 | | 2,518 | | 2,527 | | 2,944 | |
| | 6,241 | | 6,249 | | 6,253 | | 6,143 | |
Provincial Debt: | | | | | | | | | |
Taxpayer-supported debt | | 42,302 | | 43,182 | | 44,126 | | 44,733 | |
Self-supported debt | | 21,428 | | 22,528 | | 23,769 | | 25,321 | |
Total debt (including forecast allowance) | | 63,830 | | 65,960 | | 68,245 | | 70,404 | |
Taxpayer-supported debt-to-GDP ratio | | 17.7 | % | 17.4 | % | 17.1 | % | 16.6 | % |
Taxpayer-supported debt-to-revenue ratio | | 95.8 | % | 95.4 | % | 95.1 | % | 94.7 | % |
Economic Forecast: | | 2014 | | 2015 | | 2016 | | 2017 | |
Real GDP growth | | 2.2 | % | 2.3 | % | 2.4 | % | 2.3 | % |
Nominal GDP growth | | 3.9 | % | 3.8 | % | 4.3 | % | 4.3 | % |
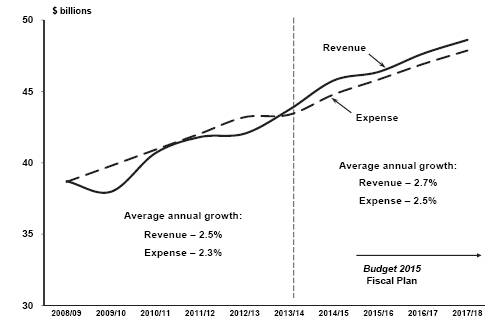
Disciplined Fiscal Planning
Budget 2015 continues government’s commitment to fiscal prudence by projecting balanced budgets throughout the fiscal plan period. While economic growth remains modest, improving revenue growth has enabled government to provide funding for long term public sector wage settlements and key priorities such as core service caseload pressures.
Revenue is expected to grow by 2.7 per cent annually over the four-year forecast period, while expenses are projected to increase 2.5 per cent annually over the same period. Keeping expense growth below revenue growth ensures the budget remains balanced in the future, which will enable government to continue to support important social and economic outcomes.
In addition to growing its Ministry of Health budget by 2.9 per cent annually, over the next three years government will provide budget increases for some limited key priorities, such as
· funding the 2014 Economic Stability Mandate compensation increases;
· measures to support economic and resource development; and
· additional support for families and individuals in need, including funding for Community
Disciplined fiscal planning
Living BC and the exemption of child support payments from the calculation of income and disability assistance.
Overall, ministry program funding is increasing by $2.3 billion.
In order to achieve social policy and economic development objectives, government will initiate a number of tax policy measures in Budget 2015, including:
· enhancements to the BC tax reduction credit, effective January 1, 2015;
· the introduction of a new children’s fitness equipment tax credit, effective January 1, 2015;
Budget and Fiscal Plan — 2015/16 to 2017/18
Summary
· extension of the BC training tax credits until the end of 2017;
· extension of the new mine allowance for four years to December 31, 2019; and
· extension of the BC interactive digital media tax credit for an additional three years to August 31, 2018.
Modest Economic Growth
Following an estimated increase of 2.2 per cent in 2014, the Ministry of Finance forecasts British Columbia’s economy to grow by 2.3 per cent in 2015, 2.4 per cent in 2016 and 2.3 per cent per year in the medium-term.
Ministry forecast more prudent than private sector

The Ministry’s outlook for BC’s real GDP growth is 0.3 percentage points lower in 2015 and 0.4 percentage points lower in 2016 than the outlook provided by the Economic Forecast Council. This prudence acknowledges the downside risks to the economic forecast and is one of the levels of prudence built into the fiscal plan.
Indicators of BC’s economic performance in 2014 reveal increased domestic activity relative to the same period of 2013, and the Ministry’s outlook for 2015 and 2016 is relatively unchanged from Budget 2014.
The outlook for the medium-term is lower than last year due to softer business investment expectations and dampened demand for BC exports as the evolution of the external economic situation has been mixed. While the US outlook is relatively unchanged, expectations for other countries (in particular Canada and China) have worsened.
Downside risks to BC’s economic outlook include:
· potential for a slowdown in domestic economic activity, including weakness in employment and retail sales;
· renewed weakness in the US economy, particularly as interest rates increase;
· fragility in Europe as governments and the financial system deal with elevated sovereign debt amidst a weak economic recovery;
· slower than anticipated economic activity in Asia, particularly in China, resulting in weaker demand for BC’s exports and downward pressure on global commodity prices;
· weaker than expected inflation caused in part by lower oil prices; and
· exchange rate volatility.
Capital Spending
Taxpayer-supported infrastructure spending on hospitals, schools, post-secondary facilities, transit, and roads will total $10.7 billion over the fiscal plan period, and will be financed by $7.6 billion in borrowing with the remainder funded by third parties, such as the federal government, and from internal cash flows.
Self-supported spending on power projects, transportation infrastructure, and other capital assets will total $8.0 billion over the fiscal plan period, and will be financed by $3.9 billion in borrowing, with the remainder funded internally.
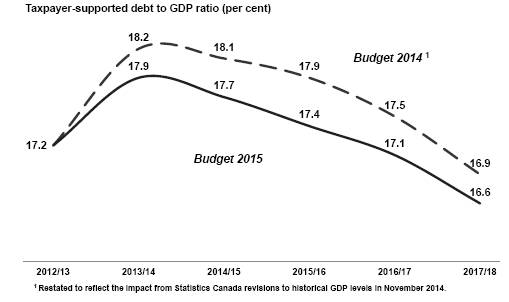
Strategic Debt Management
Due to government’s debt management strategy, the taxpayer-supported debt to GDP ratio peaked at17.9 per cent in 2013/14, and is projected to progressively decline to 16.6 per cent by 2017/18.
Debt to GDP trend improved
On average, the debt to GDP ratio track in Budget 2015 is 0.4 percentage points lower in each year compared to the same track in Budget 2014.
Budget and Fiscal Plan — 2015/16 to 2017/18
2
Summary
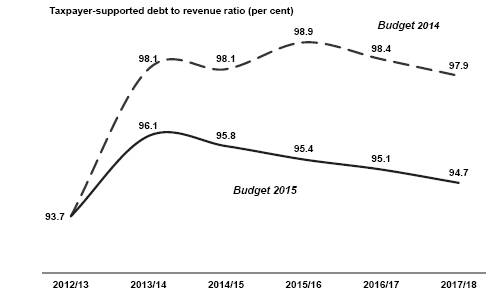
Just as significant, the debt to revenue track — a debt metric government has recently added to its debt management strategy — also has assumed a downward trend, with 2013/14 being the pivot year for both ratios.
Debt to revenue trend also improved
The 3.2 percentage point decrease in the debt to revenue ratio in 2017/18 compared to Budget 2014 represents a $1.5 billion improvement in this metric, primarily due to reductions in projected borrowing.
Over the next three years, government will borrow $14.0 billion and retire $7.6 billion in maturing debt. Overall, total provincial debt is projected to increase to $70.4 billion by 2017/18. However, direct operating debt is projected to decline to $4.8 billion, the lowest level since 1990/91.
Risks to the Fiscal Plan
The main risks to the government’s fiscal plan include:
· risks to the BC economic outlook, largely due to the continued uncertainty surrounding global economic activity;
· assumptions underlying revenue, including Crown corporation income forecasts, such as economic factors, commodity prices and weather conditions;
· potential changes to federal government allocations for health and social transfers and cost-sharing agreements, as well as impacts on the provincial income tax bases arising from federal government tax policy changes;
· utilization rates for government services such as health care, children and family services, and income assistance; and
· the outcome of litigation, arbitrations, and negotiations with third parties, including the appeal of the BC Supreme Court decision on the teachers’ contract issue.
Government incorporates four main levels of prudence in its projections to mitigate the risks to the fiscal plan:
· The Ministry outlook for BC’s real GDP growth is lower than the outlook provided by the Economic Forecast Council (0.3 percentage points lower in 2015 and 0.4 percentage points lower in 2016).
· The natural gas revenue forecast incorporates additional prudence by using a price forecast that is within the lowest 20th percentile of the private sector forecasts.
· Government has included a forecast allowance of $250 million in 2015/16, and $350 million in each of 2016/17 and 2017/18, to guard against revenue volatility.
· The fiscal plan includes a Contingencies vote allocation of $350 million in 2015/16, increasing to $400 million in each of 2016/17 and 2017/18, to help manage unexpected pressures and fund priority initiatives.
Conclusion
In summary, Budget 2015:
· provides a sustainable balanced budget framework built on modest economic growth and disciplined fiscal planning;
· augments priority program funding in health care, education, social services and economic development;
· introduces tax measures targeted towards achieving social policy objectives and supporting government’s balanced budget commitment;
· continues government’s infrastructure program in support of government initiatives and to create jobs over the next three years; and
· continues strategic debt management in order to achieve lower costs, maintain debt affordability and support a AAA credit rating.
Budget and Fiscal Plan — 2015/16 to 2017/18
3
Part 1: THREE YEAR FISCAL PLAN
Table 1.1 Three Year Fiscal Plan
| | Updated | | Budget | | | | | |
| | Forecast | | Estimate | | Plan | | Plan | |
($ millions) | | 2014/15 | | 2015/16 | | 2016/17 | | 2017/18 | |
Revenue | | 45,772 | | 46,365 | | 47,646 | | 48,617 | |
Expense | | (44,793 | ) | (45,831 | ) | (46,920 | ) | (47,868 | ) |
Surplus before forecast allowance | | 979 | | 534 | | 726 | | 749 | |
Forecast allowance | | (100 | ) | (250 | ) | (350 | ) | (350 | ) |
Surplus | | 879 | | 284 | | 376 | | 399 | |
Capital spending: | | | | | | | | | |
Taxpayer-supported capital spending | | 3,637 | | 3,731 | | 3,726 | | 3,199 | |
Self-supported capital spending | | 2,604 | | 2,518 | | 2,527 | | 2,944 | |
| | 6,241 | | 6,249 | | 6,253 | | 6,143 | |
Provincial Debt: | | | | | | | | | |
Taxpayer-supported debt | | 42,302 | | 43,182 | | 44,126 | | 44,733 | |
Self-supported debt | | 21,428 | | 22,528 | | 23,769 | | 25,321 | |
Total debt (including forecast allowance) | | 63,830 | | 65,960 | | 68,245 | | 70,404 | |
Taxpayer-supported debt-to-GDP ratio | | 17.7 | % | 17.4 | % | 17.1 | % | 16.6 | % |
Taxpayer-supported debt-to-revenue ratio | | 95.8 | % | 95.4 | % | 95.1 | % | 94.7 | % |
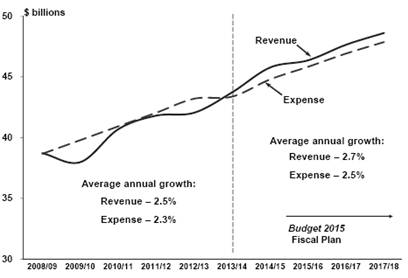
Introduction
Budget 2015 continues government’s commitment to fiscal prudence by projecting balanced budgets throughout the fiscal plan period. While economic growth remains modest, improving revenue growth has enabled government to provide funding for long term public sector wage settlements and key priorities such as core service caseload pressures. Government also is continuing the debt management strategy outlined in Budget 2014.
Chart 1.1 Disciplined fiscal planning
Budget and Fiscal Plan — 2015/16 to 2017/18
Three Year Fiscal Plan
Revenue is expected to grow by an average 2.7 per cent annually over the four-year forecast period, while expenses are projected to grow an average 2.5 per cent annually over the same period. Keeping expense growth below revenue growth ensures the budget remains balanced in the future, which will enable government to continue to support important social and economic outcomes.
Included in the expense growth are average annual increases of 2.9 per cent in health funding; increases that reflect government’s commitment to fund collective agreements negotiated under the Economic Stability Mandate; measures to support economic and resource development, diversification, and development of new market opportunities; and an additional $150 million to support families and individuals in need, including funding for Community Living BC and exemption of child support payments from the calculation of income and disability assistance.
Government’s disciplined fiscal planning enables continuing investments in important infrastructure projects while keeping debt affordable. Taxpayer-supported infrastructure spending on hospitals, schools, post-secondary facilities, transit, and roads will total $10.7 billion over the fiscal plan period, and will be financed by $7.6 billion in borrowing with the remainder funded by third parties, such as the federal government, and from internal cash flows.
Self-supported spending on power projects, transportation infrastructure and other capital assets will total $8.0 billion over the fiscal plan period, and will be financed by $3.9 billion in borrowing, with the remainder funded internally. More information on the three year capital spending plan is found on page 26.
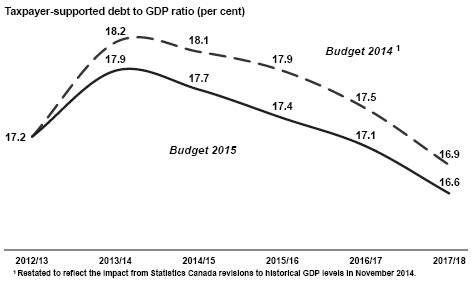
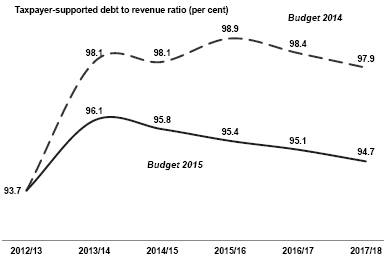
Government’s debt management strategy has proven successful. On average, the debt to GDP ratio track in Budget 2015 is 0.4 percentage points lower in each year compared to the same track in Budget 2014. Just as significant, the debt to revenue track — a new metric of debt affordability being monitored by government — also has assumed a downward trend, with 2013/14 being the pivot year for both ratios.
Chart 1.2 Debt to GDP trend improved
Budget and Fiscal Plan — 2015/16 to 2017/18
6
Three Year Fiscal Plan
The 3.2 percentage point decrease in the debt to revenue ratio in 2017/18 compared to Budget 2014 represents a $1.5 billion improvement in this metric, primarily due to reductions in projected borrowing. See the Strategic Debt Management topic box on page 50.
Chart 1.3 Debt to revenue trend also improved
Government borrowing projections include both the support of its operating and capital requirements and the retirement of existing debt that will mature during the fiscal plan period. Over the next three years, government will borrow $14.0 billion and retire $7.6 billion in maturing debt. Overall, total provincial debt is projected to increase to $70.4 billion by 2017/18. However, direct operating debt is projected to decline to $4.8 billion, the lowest level since 1990/91. Additional information on the debt outlook can be found beginning on page 35.
The major risks to the fiscal plan stem from changes in factors that government does not directly control. These include:
· risks to the BC economic outlook, largely due to the continued uncertainty surrounding global economic activity;
· assumptions underlying revenue, including commercial Crown corporation forecasts, such as economic factors, commodity prices and weather conditions;
· potential changes to federal transfer allocations, cost-sharing agreements with the federal government and impacts on the provincial income tax bases arising from federal tax policy and budget changes;
· utilization rates for government services such as health care, children and family services, and income assistance; and
· the outcome of litigation, arbitrations, and negotiations with third parties, including the appeal of the BC Supreme Court decision on the teachers’ contract issue.
Government incorporates four main levels of prudence in its projections to mitigate the risks to the fiscal plan:
· The Ministry outlook for BC’s real GDP growth is lower than the outlook provided by the Economic Forecast Council (0.3 percentage points lower in 2015 and 0.4 percentage points lower in 2016).
Budget and Fiscal Plan — 2015/16 to 2017/18
7
Three Year Fiscal Plan
· The natural gas revenue forecast incorporates additional prudence by using a price forecast that is within the lowest 20th percentile of the private sector forecasts.
· Government has included a forecast allowance of $250 million in 2015/16, and $350 million in each of 2016/17 and 2017/18, to guard against revenue volatility.
· The fiscal plan includes a Contingencies vote allocation of $350 million in 2015/16, increasing to $400 million in each of 2016/17 and 2017/18, to help manage unexpected pressures and fund priority initiatives.
A complete discussion of the risks to the fiscal plan can be found beginning on page 37. Economic risks are discussed in Part 3: British Columbia Economic Review and Outlook.
Revenue
Chart 1.4 Revenue trends
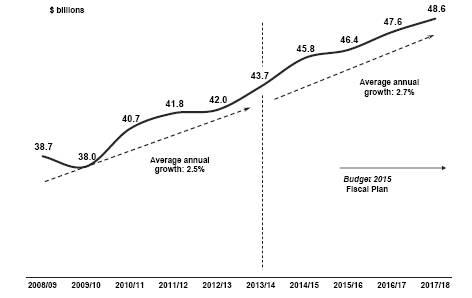
Total revenue growth is expected to average 2.7 per cent annually over the four-year period to 2017/18. This reflects the impacts of 4.1 per cent average annual nominal GDP growth on taxation revenues and projected increases in fees revenues, federal government contributions and commercial Crown net income. These improving revenue sources are partly offset by forecasted declining natural resource revenues mainly due to falling Crown land lease revenue.
In 2014/15, strong projected annual revenue growth of 4.7 per cent is due in part to the impact of recording one-time taxation revenues and ICBC net income results in the year. As a result, annual growth in 2015/16 is forecast to be only 1.3 per cent as the effects of 3.8 per cent nominal GDP growth in 2015 are partly offset by the impacts of lower energy prices and one-time revenues recorded in 2014/15. Over the next two years, average growth is expected to be 2.4 per cent annually reflecting strengthening economic conditions, rising energy prices and increasing federal government transfers and commercial Crown corporation net income.
In 2015/16, taxation revenue is forecast to grow only 0.8 per cent as the impacts of 3.8 per cent nominal GDP growth are partly offset by the effects of one-time income and property transfer tax revenues recorded in 2014/15 that are not expected to carry forward. Taxation revenue is expected to average 3.2 per cent annual growth over the last
Budget and Fiscal Plan — 2015/16 to 2017/18
8
Three Year Fiscal Plan
Chart 1.5 Revenue forecast

two years of the fiscal plan, consistent with the Ministry of Finance economic projections for growth in nominal GDP, household income, net operating surplus, consumer expenditures and housing starts. The forecast also includes the impacts of tax measures detailed in Part 2: Tax Measures.
Natural resource revenue is forecast to decline 6.9 per cent in 2015/16 due to lower revenue from natural gas and other energy sources, reflecting lower natural gas, oil and electricity price projections. Over the next two years, natural resource revenue is expected to average a 1.3 per cent annual decline mainly due to falling revenue from Crown land tenures.
Table 1.2 Comparison of Major Factors Underlying Revenue
Calendar Year | | February 17, 2015 | | February 18, 2014 | |
Per cent growth unless otherwise indicated | | 2014 | | 2015 | | 2016 | | 2017 | | 2014 | | 2015 | | 2016 | | 2017 | |
Real GDP | | 2.2 | | 2.3 | | 2.4 | | 2.3 | | 2.0 | | 2.3 | | 2.5 | | 2.5 | |
Nominal GDP | | 3.9 | | 3.8 | | 4.3 | | 4.3 | | 3.6 | | 4.3 | | 4.4 | | 4.5 | |
Household income | | 3.0 | | 3.5 | | 3.8 | | 4.0 | | 3.3 | | 3.9 | | 4.0 | | 4.1 | |
Net operating surplus | | 5.3 | | 3.3 | | 6.3 | | 5.8 | | 1.8 | | 6.1 | | 6.7 | | 6.7 | |
Consumer expenditures | | 4.7 | | 4.3 | | 4.5 | | 4.5 | | 4.2 | | 4.7 | | 4.6 | | 4.7 | |
Consumer expenditures on durable goods | | 8.3 | | 1.3 | | 1.6 | | 1.5 | | 1.2 | | 1.5 | | 1.6 | | 1.6 | |
Business investment | | 5.6 | | 3.9 | | 4.5 | | 4.6 | | 4.4 | | 4.0 | | 4.7 | | 4.9 | |
Residential investment | | 6.0 | | 3.4 | | 4.7 | | 4.9 | | 3.4 | | 3.3 | | 4.7 | | 4.8 | |
Retail sales | | 5.4 | | 3.3 | | 3.7 | | 3.6 | | 3.0 | | 3.5 | | 3.7 | | 3.7 | |
Employment | | 0.6 | | 1.0 | | 1.2 | | 1.2 | | 1.0 | | 1.3 | | 1.4 | | 1.4 | |
BC Housing starts | | 4.8 | | -2.7 | | -0.2 | | -1.9 | | -7.8 | | 2.0 | | 2.2 | | 0.1 | |
US Housing starts | | 8.7 | | -0.6 | | 2.5 | | 2.4 | | 2.9 | | 5.3 | | 2.5 | | 2.4 | |
| | | | | | | | | | | | | | | | | |
SPF 2x4 price ($US/thousand board feet) | | $ | 353 | | $ | 344 | | $ | 340 | | $ | 340 | | $ | 345 | | $ | 335 | | $ | 335 | | $ | 335 | |
Pulp ($US/tonne) | | $ | 925 | | $ | 888 | | $ | 838 | | $ | 825 | | $ | 838 | | $ | 825 | | $ | 825 | | $ | 825 | |
Exchange rate (US cents/Canadian dollar) | | 90.5 | | 85.3 | | 85.5 | | 87.0 | | 93.2 | | 92.7 | | 91.7 | | 91.0 | |
Fiscal Year | | 2014/15 | | 2015/16 | | 2016/17 | | 2017/18 | | 2014/15 | | 2015/16 | | 2016/17 | | 2017/18 | |
Natural gas price ($Cdn/GJ at plant inlet) | | $ | 2.69 | | $ | 2.09 | | $ | 2.32 | | $ | 2.54 | | $ | 2.45 | | $ | 2.65 | | $ | 2.90 | | $ | 3.28 | |
Bonus bid average bid price per hectare ($) | | $ | 2,404 | | $ | 1,000 | | $ | 1,025 | | $ | 1,100 | | $ | 750 | | $ | 750 | | $ | 800 | | $ | 850 | |
Electricity price ($US/mega-watt hour, Mid-C) | | $ | 33 | | $ | 28 | | $ | 31 | | $ | 35 | | $ | 40 | | $ | 38 | | $ | 39 | | $ | 40 | |
Metallurgical coal price ($US/tonne, fob west coast) | | $ | 119 | | $ | 128 | | $ | 138 | | $ | 138 | | $ | 176 | | $ | 210 | | $ | 216 | | $ | 222 | |
Copper price ($US/lb) | | $ | 3.10 | | $ | 3.02 | | $ | 3.05 | | $ | 3.04 | | $ | 3.16 | | $ | 3.10 | | $ | 3.05 | | $ | 2.99 | |
Crown harvest volumes (million cubic metres) | | 61.0 | | 63.0 | | 63.0 | | 64.0 | | 65.0 | | 66.0 | | 66.0 | | 66.0 | |
Budget and Fiscal Plan — 2015/16 to 2017/18
9
Three Year Fiscal Plan
Excluding Crown land tenures, natural resource revenue is expected to average 7.6 per cent annual growth over the next two years, in line with expected rising commodity prices and forest harvest stumpage rates.
Revenue from fees, investment earnings and other miscellaneous sources is expected to average 2.6 per cent growth annually over the next three years, mainly due to projected Medical Services Plan premium rate increases, higher projections for post-secondary fee revenues and incorporating forecasts provided by ministries and taxpayer-supported service delivery agencies.
Federal government contributions are expected to average 3.6 per cent annual growth over the next three years mainly due to expected increases in the Canada Health Transfer (CHT) and Canada Social Transfer (CST) programs, partly offset by lower transfers in support of other programs.
Commercial Crown net income is expected to decline by 10.4 per cent in 2015/16 from the previous year due to one-time gains in ICBC’s net income in 2014/15. This decline is followed by projected average annual growth of 3.3 per cent in the subsequent two years (2016/17 and 2017/18). More details on Crown corporation net income are provided beginning on page 14.
Major Revenue Sources
Key assumptions and sensitivities relating to revenue are provided in Appendix Table A5. The major revenue components are:
Taxation revenue
Personal income tax base revenue is forecast to average 4.2 per cent annual growth over the next three years, consistent with Budget 2015 projections of household and employee compensation income growth.
Due to the effect of prior-year adjustments in 2014/15, personal income tax revenue is expected to decrease 1.4 per cent in 2015/16, followed by more normalized growth of 2.0 per cent and 4.3 per cent, respectively, in the next two years.
Table 1.3 Personal Income tax Revenue
($ millions) | | 2014/15 | | 2015/16 | | 2016/17 | | 2017/18 | |
Base personal income tax revenue | | 7,459 | | 7,753 | | 8,080 | | 8,432 | |
Annual growth | | 2.5 | % | 3.9 | % | 4.2 | % | 4.4 | % |
Measures: | | | | | | | | | |
– personal income tax rate for income over $150,000 with a 2 year limit | | 227 | | 176 | | — | | — | |
– Budget 2015 tax mesasures - various credits | | (3 | ) | (13 | ) | (10 | ) | (13 | ) |
– Federal tax measures | | 8 | | 32 | | 34 | | 36 | |
Prior-Year adjustment | | 372 | | — | | — | | — | |
Budget 2014 revenue | | 8,063 | | 7,948 | | 8,104 | | 8,455 | |
Annual growth | | 17.5 | % | -1.4 | % | 2.0 | % | 4.3 | % |
| | | | | | | | | |
Household income growth (calendar year) | | 3.0 | % | 3.5 | % | 3.8 | % | 4.0 | % |
Employee compensation income growth (calendar year) | | 3.4 | % | 3.7 | % | 4.0 | % | 4.1 | % |
Elasticity1 (calendar year basis, policy neutral) | | 0.9 | | 1.1 | | 1.1 | | 1.1 | |
1 Per cent growth in current year tax relative to per cent growth in personal income.
Budget and Fiscal Plan — 2015/16 to 2017/18
10
Three Year Fiscal Plan
The forecast includes the effects of eliminating the temporary personal income tax rate of 16.8 per cent on individuals with incomes over $150,000, effective January 2016 as well as the federal tax measure enhancing the Universal Child Care benefit, announced in November 2014.
Corporate income tax revenue is recorded on a cash basis and annual estimates reflect BC’s payment share, instalments from the federal government and adjustments for the prior year. The revenue falls slightly in 2015/16 as the increase in instalments is offset by a reduction in the prior-year adjustment settlement payment. Average annual growth over the next two years is forecast at 5.2 per cent reflecting increases in instalments, the payment share and prior-year adjustments. The revenue forecast incorporates the general corporate income tax rate and the small business income tax rate remaining at 11.0 per cent and 2.5 per cent, respectively and calendar-year entitlement is forecast to rise in line with projected growth in the net operating surplus.
Table 1.4 Corporate Income Tax Revenue
($ millions) | | 2014/15 | | 2015/16 | | 2016/17 | | 2017/18 | |
Advance instalments from the federal government: | | | | | | | | | |
– Payment share | | 11.4 | % | 11.5 | % | 11.5 | % | 11.8 | % |
– Advances | | 2,562 | | 2,616 | | 2,760 | | 2,849 | |
International Business Activity Act refunds | | (20 | ) | (20 | ) | (20 | ) | (20 | ) |
Prior-year adjustment | | 94 | | 34 | | 49 | | 79 | |
Corporate income tax revenue | | 2,636 | | 2,630 | | 2,789 | | 2,908 | |
| | | | | | | | | |
Annual per cent growth | | 8.6 | % | -0.2 | % | 6.0 | % | 4.3 | % |
Sales tax revenue growth is expected to average 3.9 per cent annually over the next three years (excluding the impact on growth rates from a one-time $94 million HST repayment in 2014/15), in line with the nominal consumer expenditure and the nominal business investment growth.
Table 1.5 Sales Taxes Revenue
($ millions) | | 2014/15 | | 2015/16 | | 2016/17 | | 2017/18 | |
Provincial sales taxes | | 5,672 | 1 | 5,970 | | 6,212 | | 6,468 | |
Annual per cent change (calendar year) | | 2014 | | 2015 | | 2016 | | 2017 | |
Consumer expenditures | | 4.7 | % | 4.3 | % | 4.5 | % | 4.5 | % |
Residential investment | | 6.0 | % | 3.4 | % | 4.7 | % | 4.9 | % |
Government expenditures | | 3.1 | % | 2.7 | % | 2.7 | % | 2.4 | % |
Nominal GDP | | 3.9 | % | 3.8 | % | 4.3 | % | 4.3 | % |
Retail sales | | 5.4 | % | 3.3 | % | 3.7 | % | 3.6 | % |
1 2014/15 includes —$94 million Harmonized Sales Tax related to prior years.
Carbon tax revenue is forecast to increase on average at 1.8 per cent over the next three years. The forecast assumes that purchased volumes of natural gas will grow in line with real GDP and that consumption of gasoline is expected to remain constant. Carbon tax revenue is fully returned to taxpayers through tax reductions and credits. For more details on carbon tax recycling, see the Carbon Tax Report and Plan topic box on page 60.
Property tax revenue is expected to grow by an average of 4.1 per cent annually over the three year plan, in line with the outlook for BC housing starts and the inflation rate and reflects maintaining the threshold for the home owner grant phase-out at $1,100,000 for the 2015 tax year.
Budget and Fiscal Plan — 2015/16 to 2017/18
11
Three Year Fiscal Plan
Property transfer tax revenue is forecast to decline 10.7 per cent in 2015/16 reflecting an anticipated slowing of market activity as a portion of the strong revenues received in 2014/15 are not assumed to carry forward. This decline is expected to be followed by an average annual decline of 1.0 per cent over the next two years in line with the outlook for BC housing starts.
Details on the tax measures discussed above are in Part 2: Tax Measures.
Natural resource revenue
Natural gas royalties are expected to decline 36.5 per cent in 2015/16 mainly due to lower natural gas prices. The royalties are forecast to increase at a 19.6 per cent average annual rate over the next two years, reflecting higher prices and production volumes partially offset by increased utilization of royalty programs and credits.
The forecast assumes a price of $2.09 ($Cdn/gigajoule, plant inlet) in 2015/16, down from $2.69 in 2014/15. The 2015/16 assumption is within the 20th percentile of the private sector forecasters, continuing the prudence incorporated in recent budgets. Prices are expected to rise in the next two years, averaging $2.32 in 2016/17 and $2.54 in 2017/18, in line with the growth of the average of the private sector forecasters. Natural gas royalty rates are sensitive to price when the prices are between $1.25 and $2.75/gigajoule, therefore, the net effective royalty rate is expected to increase as natural gas prices increase.
See Appendix Table A6 for more details regarding natural gas price forecasts.
Chart 1.6 Revenue from energy, metals and minerals

Other energy, metals and minerals: Over the next three years, revenue from the sale of Crown land tenures is forecast to decline 52 per cent from $835 million in 2014/15 to $400 million in 2017/18. This revenue source consists of bonus bid cash receipts amortized over nine years as well as annual fees. Revenues decline over the forecast period as the amortization of strong cash sales in the 2006/07 to 2008/09 period are replaced with lower cash deferrals over the 2015/16 to 2017/18 period. Revenue from metals and minerals are expected to grow by an average of 14.9 per cent annually over the three years of the fiscal plan mainly due to rising coal prices. Revenue from other energy sources
Budget and Fiscal Plan — 2015/16 to 2017/18
12
Three Year Fiscal Plan
is expected to fall 9.3 per cent in 2015/16 due to a lower outlook for oil and Mid-C electricity prices, followed by an average annual increase of 8.9 per cent over the next two years as prices are forecast to rise.
Forests revenue is forecast to increase at a 6.2 per cent average annual rate over the three years of the fiscal plan mainly due to the impacts of higher stumpage rates.
Other revenue
Fees and licenses: Revenue growth is expected to average 3.4 per cent annually over the three year fiscal plan, mainly due to projected increases to Medical Services Plan premium rates in support of rising healthcare expenditures and increases in post-secondary fees.
Investment earnings are projected to grow at a 3.7 per cent annual rate over the three year fiscal plan, mainly due to increased earnings from fiscal agency loans and sinking funds. Investment income from fiscal agency loans and sinking funds has offsetting expenses resulting in no impact to the bottom line.
Miscellaneous revenue is forecast to average 0.4 per cent annual growth over the next three years. Over the fiscal plan, miscellaneous revenue includes the projected gains on sales of surplus properties, such as the Dogwood-Pearson redevelopment in Vancouver. As well, the transfer of selected lands and buildings to non-profit societies in support of building housing capacity in the non-profit sector and ensuring its long term sustainability will result in the net value of the properties being reported as gains when transferred.
Federal government transfers
Health and social transfers are expected to average 5.1 per cent annual growth over the three years of the fiscal plan, mainly reflecting increasing national cash transfers and a rising BC population share. The plan assumes the national CHT cash transfer increases 6 per cent per year in the first two years of the plan and rises 4.4 per cent in 2017/18. The national CHT cash transfer in 2017/18 is linked to a three year average (2015 to 2017) of Canada’s nominal GDP growth forecast. The national CST cash transfer increases 3 per cent annually, consistent with the federal government forecast.
Table 1.6 Federal Government Contributions
($ millions) | | 2014/15 | | 2015/16 | | 2016/17 | | 2017/18 | |
Canada Health Transfer (CHT) | | 4,154 | | 4,443 | | 4,720 | | 4,941 | |
Deferred health equipment grants | | 17 | | 7 | | 3 | | — | |
Canada Social Transfer (CST) | | 1,641 | | 1,692 | | 1,747 | | 1,804 | |
Total health and social transfers | | 5,812 | | 6,142 | | 6,470 | | 6,745 | |
Ministry cost recoveries | | 540 | | 541 | | 528 | | 524 | |
Transfers to post-secondary institutions | | 502 | | 506 | | 509 | | 506 | |
Transfers to taxpayer-supported Crown corporations | | 247 | | 230 | | 214 | | 207 | |
Transfers to other SUCH sector agencies | | 88 | | 83 | | 83 | | 83 | |
Disaster financial assistance contributions | | 43 | | 8 | | 8 | | 8 | |
Other transfers | | 147 | | 136 | | 137 | | 137 | |
Total other contributions | | 1,567 | | 1,504 | | 1,479 | | 1,465 | |
Total Federal Government Contributions | | 7,379 | | 7,646 | | 7,949 | | 8,210 | |
Budget and Fiscal Plan — 2015/16 to 2017/18
13
Three Year Fiscal Plan
Other federal contributions are expected to decline 2.2 per cent annually, on average, over the next three years. Reduced funding includes projected claims for disaster financial assistance, healthcare services for persons infected with Hepatitis C, contributions to the BC Housing Management Commission and ministry vote recoveries.
Commercial Crown corporations
British Columbia Hydro and Power Authority: For 2015/16 and 2016/17, BC Hydro’s net income is projected to be $653 million and $693 million, respectively, reflecting BC Hydro’s 11.84 per cent allowed return on deemed equity in each of those years. After 2016/17, net income will increase at the rate of inflation (for 2017/18, 2 per cent inflation yielding net income of $707 million.) BC Hydro forecasts annual rate increases of 6 per cent, 4 per cent and 3.5 per cent from 2015/16 to 2017/18, in each respective year.
Until 2016/17, BC Hydro will provide an annual dividend to the province of up to 85 per cent of its net income, within the requirement of maintaining at least an 80:20 debt to equity ratio. Beginning in 2017/18, BC Hydro will decrease dividends by $100 million per year over a four year period until they are eliminated in anticipation of the financing requirements for Site C. Over the next three years, BC Hydro’s dividends will be approximately 52 per cent of its net income.
British Columbia Liquor Distribution Branch: LDB’s net income is projected at $881 million in 2015/16, increasing to $910 million by 2017/18. The increase reflects average annual growth of 1.8 per cent in net sales revenue over the fiscal plan period.
British Columbia Lottery Corporation: BCLC’s net income is forecast to average $1.2 billion annually over the fiscal plan period. The projection reflects the moderate compounded annual net income growth in the lottery and casino/community gaming channels (0.2 per cent and 1.2 per cent respectively) and strong growth in eGaming income (19.3 per cent). Net income growth is mainly due to continuing product development (primarily in PlayNow internet gaming), distribution enhancements, and facility improvements to casinos and community gaming centres.
The government will distribute over 20 per cent (on average, $250 million annually) of its gaming income to charities and local governments over the next three years. As well, $147 million of the gaming income retained by government will be allocated each year to the Health Special Account in support of health services.
Insurance Corporation of British Columbia: ICBC’s net income is forecast to average $226 million annually over the fiscal plan period. The outlook assumes average annual growth of 1.7 per cent in the number of insured vehicles and a 2.9 per cent average annual increase in current claims costs. Over the fiscal plan period, ICBC is projected to remit $160 million annually from its Optional insurance earnings to the consolidated revenue fund to support core government services. The annual amount remitted by ICBC is limited by Optional insurance capital requirements.
Budget and Fiscal Plan — 2015/16 to 2017/18
14
Three Year Fiscal Plan
ICBC is in its fifth year of a multi-year $400 million Transformation Program that is designed to promote a fairer, customer-based risk pricing model, resulting in better rates for safer drivers; simplified systems and processes to facilitate better support for customers and business partners with less paperwork; and more efficient business practices. The Transformation Program, forecast to be complete in the fall of 2016, is being funded entirely from Optional insurance capital and therefore does not impact Basic insurance rates.
Transportation Investment Corporation: TI Corp manages the construction of the Port Mann/Highway 1 improvement project, which includes the new Port Mann Bridge, highway widening, and interchange improvements between Langley and Vancouver. Construction is nearing completion with finishing work along the corridor continuing through 2015/16. Off-corridor work will continue into 2016/17.
TI Corp also manages the tolling operation for the Port Mann Bridge. While TI Corp’s projections in the fiscal plan reflect net losses in the initial stages of implementing the tolling system, the corporation is projected to turn an annual net profit as traffic volumes mature. Debt accumulated for the project is expected to be fully re-paid by 2050.
Budget and Fiscal Plan — 2015/16 to 2017/18
15
Three Year Fiscal Plan
Table 1.7 Revenue by Source
| | Updated | | Budget | | | | | |
| | Forecast | | Estimate | | Plan | | Plan | |
($ millions) | | 2014/15 | | 2015/16 | | 2016/17 | | 2017/18 | |
Taxation revenue | | | | | | | | | |
Personal income | | 8,063 | | 7,948 | | 8,104 | | 8,455 | |
Corporate income | | 2,636 | | 2,630 | | 2,789 | | 2,908 | |
Sales 1 | | 5,672 | | 5,970 | | 6,212 | | 6,468 | |
Fuel | | 927 | | 934 | | 942 | | 949 | |
Carbon | | 1,240 | | 1,261 | | 1,284 | | 1,307 | |
Tobacco | | 770 | | 770 | | 770 | | 770 | |
Property | | 2,137 | | 2,225 | | 2,312 | | 2,408 | |
Property transfer | | 1,039 | | 928 | | 923 | | 909 | |
Insurance premium | | 454 | | 460 | | 465 | | 470 | |
| | 22,938 | | 23,126 | | 23,801 | | 24,644 | |
Natural resource revenue | | | | | | | | | |
Natural gas royalties | | 542 | | 344 | | 402 | | 492 | |
Forests | | 757 | | 835 | | 866 | | 907 | |
Other resource 2 | | 1,663 | | 1,578 | | 1,538 | | 1,285 | |
| | 2,962 | | 2,757 | | 2,806 | | 2,684 | |
Other revenue | | | | | | | | | |
Medical Services Plan premiums | | 2,277 | | 2,399 | | 2,529 | | 2,666 | |
Other fees 3 | | 3,131 | | 3,235 | | 3,268 | | 3,307 | |
Investment earnings | | 1,127 | | 1,137 | | 1,190 | | 1,257 | |
Miscellaneous 4 | | 2,716 | | 3,161 | | 3,053 | | 2,748 | |
| | 9,251 | | 9,932 | | 10,040 | | 9,978 | |
Contributions from the federal government | | | | | | | | | |
Health and social transfers | | 5,812 | | 6,142 | | 6,470 | | 6,745 | |
Other federal contributions 5 | | 1,567 | | 1,504 | | 1,479 | | 1,465 | |
| | 7,379 | | 7,646 | | 7,949 | | 8,210 | |
Commercial Crown corporation net income | | | | | | | | | |
BC Hydro | | 588 | | 653 | | 693 | | 707 | |
Liquor Distribution Branch | | 871 | | 881 | | 896 | | 910 | |
BC Lottery Corporation (net of payments to federal government) | | 1,198 | | 1,206 | | 1,233 | | 1,250 | |
ICBC 6 | | 600 | | 210 | | 231 | | 237 | |
Transportation Investment Corporation (Port Mann) | | (89 | ) | (101 | ) | (102 | ) | (106 | ) |
Other 7 | | 74 | | 55 | | 99 | | 103 | |
| | 3,242 | | 2,904 | | 3,050 | | 3,101 | |
Total revenue | | 45,772 | | 46,365 | | 47,646 | | 48,617 | |
1 Includes provincial sales tax, tax on designated property, HST/PST housing transition tax and harmonized sales tax related to prior years.
2 Columbia River Treaty, Crown land tenures, other energy and minerals, water rental and other resources.
3 Post-secondary, healthcare-related, motor vehicle, and other fees.
4 Includes reimbursements for healthcare and other services provided to external agencies, and other recoveries.
5 Includes contributions for health, education, community development, housing and social service programs, and transportation projects.
6 The 2014/15 amount represents ICBC’s projected earnings during government’s fiscal year. On ICBC’s fiscal year basis (December), the forecast for 2014 is $373 million. For 2015/16 to 2017/18, the fiscal year and calendar year projections are assumed to be the same.
7 Includes Columbia Power Corporation, BC Railway Company, Columbia Basin Trust power projects, and post-secondary institutions self-supported subsidiaries. Also includes gain on the sale of LDB’s liquor distribution warehouse (budget $34 million, actual $37 million).
Budget and Fiscal Plan — 2015/16 to 2017/18
16
Three Year Fiscal Plan
Table 1.8 Expense by Ministry, Program and Agency
| | Updated | | Budget | | | | | |
| | Forecast | | Estimate | | Plan | | Plan | |
($ millions) | | 2014/15 1 | | 2015/16 | | 2016/17 | | 2017/18 | |
Office of the Premier | | 9 | | 9 | | 9 | | 9 | |
Aboriginal Relations and Reconciliation | | 84 | | 87 | | 86 | | 88 | |
Advanced Education | | 1,972 | | 1,961 | | 1,975 | | 2,002 | |
Agriculture | | 80 | | 80 | | 80 | | 81 | |
Children and Family Development | | 1,339 | | 1,379 | | 1,385 | | 1,396 | |
Community, Sport and Cultural Development | | 221 | | 228 | | 259 | | 264 | |
Education | | 5,397 | | 5,498 | | 5,591 | | 5,648 | |
Energy and Mines | | 30 | | 28 | | 28 | | 28 | |
Environment | | 134 | | 150 | | 149 | | 148 | |
Finance | | 268 | | 220 | | 221 | | 222 | |
Forests, Lands and Natural Resource Operations | | 835 | | 608 | | 631 | | 637 | |
Health | | 16,928 | | 17,444 | | 17,934 | | 18,471 | |
International Trade | | 34 | | 49 | | 49 | | 49 | |
Jobs, Tourism and Skills Training | | 199 | | 199 | | 199 | | 199 | |
Justice | | 1,169 | | 1,172 | | 1,178 | | 1,184 | |
Natural Gas Development | | 401 | | 444 | | 449 | | 455 | |
Social Development and Social Innovation | | 2,530 | | 2,594 | | 2,646 | | 2,659 | |
Technology, Innovation and Citizens’ Services | | 491 | | 493 | | 493 | | 495 | |
Transportation and Infrastructure | | 812 | | 814 | | 814 | | 816 | |
Total ministries and Office of the Premier | | 32,933 | | 33,457 | | 34,176 | | 34,851 | |
Management of public funds and debt | | 1,221 | | 1,267 | | 1,338 | | 1,385 | |
Contingencies | | 300 | | 350 | | 400 | | 400 | |
Funding for capital expenditures | | 897 | | 1,001 | | 1,394 | | 1,219 | |
Refundable tax credit transfers | | 848 | | 975 | | 989 | | 1,003 | |
Legislative and other appropriations | | 133 | | 133 | | 130 | | 136 | |
Total appropriations | | 36,332 | | 37,183 | | 38,427 | | 38,994 | |
Elimination of transactions between appropriations 2 | | (17 | ) | (20 | ) | (24 | ) | (29 | ) |
Prior year liability adjustments | | (65 | ) | — | | — | | — | |
Consolidated revenue fund expense | | 36,250 | | 37,163 | | 38,403 | | 38,965 | |
Expenses recovered from external entities | | 2,618 | | 2,675 | | 2,750 | | 2,799 | |
Funding provided to service delivery agencies | | (21,746 | ) | (22,477 | ) | (23,186 | ) | (23,239 | ) |
Ministry and special office direct program spending | | 17,122 | | 17,361 | | 17,967 | | 18,525 | |
Service delivery agency expense: | | | | | | | | | |
School districts | | 5,407 | | 5,786 | | 5,806 | | 5,853 | |
Universities | | 4,177 | | 4,252 | | 4,344 | | 4,484 | |
Colleges and institutes | | 1,138 | | 1,130 | | 1,147 | | 1,156 | |
Health authorities and hospital societies | | 13,242 | | 13,446 | | 13,704 | | 13,885 | |
Other service delivery agencies | | 3,707 | | 3,856 | | 3,952 | | 3,965 | |
Total service delivery agency expense | | 27,671 | | 28,470 | | 28,953 | | 29,343 | |
Total expense | | 44,793 | | 45,831 | | 46,920 | | 47,868 | |
1 Restated to reflect government’s current organization and accounting policies.
2 Reflects payments made under an agreement where an expense from a voted appropriation is recorded as revenue by a special account.
Budget and Fiscal Plan — 2015/16 to 2017/18
17
Three Year Fiscal Plan
Expense
Budget 2015 demonstrates government’s continued commitment to deliver the core services of health care, education, and social services within a prudent fiscal framework. This commitment is managed within an affordable spending growth rate averaging 2.5 per cent per year over the four-year forecast period, with total government expense reaching $47.9 billion by 2017/18.
Chart 1.7 Expense trends

In deficit years, government kept expense growth to 2.3 per cent in order to be able to balance the budget by 2013/14. Since then, revenue growth improvements have allowed government to modestly increase spending growth to accommodate important initiatives, including labour settlements reached under the 2014 bargaining mandate (see topic box on page 41) and core service caseload pressures.
Ongoing expenditure discipline will continue throughout a period of forecasted operating surpluses as a means to manage the impact of revenue volatility and support government’s strategic debt management objectives (see topic box on page 50).
Consolidated Revenue Fund Spending
Budget increases have been targeted to key priorities, such as funding the 2014 Economic Stability Mandate compensation increases, managing growing caseload pressures in health and social services, and supporting economic development. As noted below, the three year average growth rate for the Ministry of Health’s spending is 2.9 per cent, which compares to an average of 1.5 per cent annually for the remaining ministries. Overall, ministry program funding is growing from $32.6 billion to $34.9 billion over the fiscal plan period.
Budget and Fiscal Plan — 2015/16 to 2017/18
18
Three Year Fiscal Plan
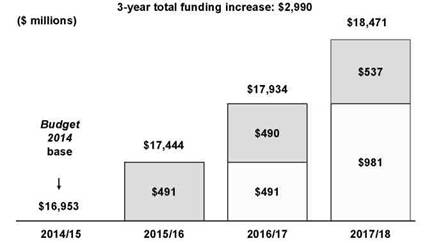
Health Care — Increasing Funding to Accommodate Growing Needs
Incremental to the current 2014/15 base budget for the Ministry of Health of $16,953 million, its annual budget will increase by a further $491 million in 2015/16, and is targeted to reach $18,471 million by 2017/18. The average rate of growth over the three years will be 2.9 per cent, an increase over both the 2.6 per cent three-year average growth estimate in Budget 2014, as well as the 2.3 per cent single-year growth rates in 2013/14 and 2014/15.
Chart 1.8 Ministry of Health budget increases
BC still leads the nation in important health outcomes while maintaining control over cost escalation. BC continues to be only one of three provinces with healthcare costs under $4,000 annually per capita, while again ranking best in terms of Life Expectancy, Cancer Mortality, and Mortality related to Diseases of the Heart and second best for Infant Mortality.
Table 1.9 Health Per Capita Costs and Outcomes: Canadian Comparisons
| | 2014 Per | | Life | | Infant Mortality | | Cancer Mortality Rate | | Diseases of the Heart | |
| | Capita Health | | Expectancy at | | per 1000 Live | | per 100,000 | | Mortality Rate per | |
Province | | Care Costs ($) | | Birth (Years) | | Births | | Population | | 100,000 Population | |
| | | | | | | | | | | |
Quebec | | 3,660 | | 81.2 | | 4.3 | | 170.3 | | 83.6 | |
Ontario | | 3,768 | | 81.5 | | 4.6 | | 149.0 | | 88.3 | |
British Columbia | | 3,807 | | 81.7 | | 3.8 | | 138.7 | | 81.9 | |
New Brunswick | | 4,094 | | 80.2 | | 3.5 | | 155.8 | | 102.0 | |
Prince Edward Island | | 4,307 | | 80.2 | | 4.2 | | 150.4 | | 106.7 | |
Nova Scotia | | 4,345 | | 80.1 | | 4.9 | | 179.6 | | 100.7 | |
Manitoba | | 4,430 | | 79.5 | | 7.7 | | 157.8 | | 108.6 | |
Saskatchewan | | 4,461 | | 79.6 | | 6.7 | | 154.2 | | 110.8 | |
Alberta | | 4,699 | | 80.7 | | 5.3 | | 139.8 | | 110.8 | |
Newfoundland | | 5,087 | | 78.9 | | 6.3 | | 177.8 | | 122.5 | |
Sources: Canadian Institute for Health Information, 2014 (cost data) and Statistics Canada (outcomes data).
Note: Outcomes data for Life Expectancy is of 2009; all other outcome data are as of 2011, which is the most recent data available.
Budget and Fiscal Plan — 2015/16 to 2017/18
19
Three Year Fiscal Plan
Post-secondary Education — Continuing Efforts to find Efficiencies
Budget 2012 included a fiscal target of $50 million in cost reductions and administrative effciencies in the public post-secondary system over three years, which were not to be found through reductions in education or research programming. The sector has taken a number of measures to meet this target, including joint procurement for some goods/ services, negotiating lower banking and credit card fees, efficiencies in information technology, and cost reductions in other ancillary services. The sector is well on its way to meeting the target.
The Ministry of Advanced Education’s three-year allocations in Budget 2015 have also increased by $92 million over the amounts in Budget 2014, reflecting new funding for the 2014 Economic Stability Mandate compensation lifts within the post-secondary sector.
K–12 Education — Additional Funding and Labour Stability
The Ministry of Education has received a significant increase to its budget — $564 million over the three year fiscal plan — in order to provide increased funding for school districts, as shown in Table 1.10.
Table 1.10 Increased Funding for K–12 Education
($ millions) | | 2015/16 | | 2016/17 | | 2017/18 | |
Public schools instruction | | 126 | | 161 | | 198 | |
Public schools administration | | (29 | ) | (54 | ) | (54 | ) |
Learning Improvement Fund | | 23 | | 25 | | 25 | |
Other budget adjustments including ministry efficiencies | | (14 | ) | 68 | | 89 | |
Total | | 106 | | 200 | | 258 | |
During fiscal year 2014/15, labour settlements were reached with the public school teachers and support workers. The agreements reached in both cases expire on June 30, 2019, providing four years of certainty to students and parents, as well as to K–12 employees. The compensation increases in both agreements are affordable to the fiscal plan and are consistent with other provincial public sector groups bargaining under government’s 2014 Economic Stability Mandate.
In addition to general wage increases for teachers, this additional funding will also pay for seniority improvements to teachers on call (substitute teachers) and additional preparation time for elementary school teachers. Over three years, the increase in public school instruction funding for labour settlements totals $485 million.
In addition to the public schools instruction increase, $73 million over three years is being added to the Learning Improvement Fund (LIF), which by 2016/17 will reach $100 million annually, up from the current $75 million allocated in Budget 2014. The LIF was established as part of Budget 2012 to provide additional resources for complex classroom needs. The additional funding will be used to hire more teachers (or enhance teaching in other ways) and to increase the resources allocated to educational assistants (or for other classroom supports).
Budget and Fiscal Plan — 2015/16 to 2017/18
20
Three Year Fiscal Plan
In Budget 2012, the SUCH sector (school districts, universities, colleges and healthcare organizations) was tasked with identifying administrative and related efficiencies as part of government’s overall plan of expenditure management. The healthcare sector has achieved over $200 million in savings and as noted above, the post-secondary sector has a target of $50 million that was established as part of Budget 2012.
In Budget 2015, the K–12 sector will also be tasked with finding similar efficiencies. In 2015/16, $29 million in savings are targeted, along with a further $25 million in 2016/17 and future years. These savings are to be found in administrative and related areas of school district budgets, and will be similar in nature to the work that school districts already have been doing as part of the 2012 Cooperative Gains Mandate for collective bargaining.
Ministry of Education staff will work closely with district officials to support their efforts, similar to what has occurred in the Ministries of Health and Advanced Education. School Districts will have considerable flexibility in developing their savings plans, with the expectation that savings are to be confined to non-instructional budgets and will not impact the classroom.
Supporting Economic Development
Budget 2015 provides $31 million over three years to support mining and the ongoing development of a liquefied natural gas (LNG) industry in British Columbia, as detailed in Table 1.11.
Table 1.11 Supporting Economic Development
($ millions) | | 2015/16 | | 2016/17 | | 2017/18 | |
Mining | | 9 | | 9 | | 9 | |
Liquefied natural gas | | 2 | | 1 | | 1 | |
Total | | 11 | | 10 | | 10 | |
Incremental funding to the Ministry of Energy and Mines will maintain improved turnaround times for notice of work permits, support the major mines permitting process by creating a Major Mines Permitting Office, and provide additional staff resources to increase mines inspections and other compliance and enforcement activities. The ministry’s base budget increases by $6.3 million annually. In addition, new Mines Act fees are expected to generate $3 million annually, which will be retained by the ministry.
Budget 2014 provided $35 million over four years to ensure the appropriate management of the province’s LNG strategy and to foster the successful development and growth of the industry. Budget 2015 provides an incremental $4 million over three years to support ongoing activities as oil and gas companies from around the world continue to pursue LNG investment opportunities in British Columbia and work towards making final investment decisions.
Budget and Fiscal Plan — 2015/16 to 2017/18
21
Three Year Fiscal Plan
Benefiting the Environment
Overall, Budget 2015 provides $47 million over three years for initiatives benefiting the environment, as detailed in Table 1.12.
Table 1.12 Benefiting the Environment
($ millions) | | 2015/16 | | 2016/17 | | 2017/18 | |
Water Sustainability Act — Ministry of Forests, Lands and Natural Resource Operations | | 4 | | 8 | | 10 | |
Water Sustainability Act — Ministry of Environment | | 1 | | 1 | | 1 | |
Temporary incentives for the cement industry | | 9 | | 7 | | 6 | |
Total | | 14 | | 16 | | 17 | |
The Water Sustainability Act delivers on government’s commitments to modernize British Columbia’s water laws, regulate groundwater use and strengthen provincial water management in light of growing demands for water and a changing climate. Budget 2015 provides $25 million over three years to support the implementation of the Water Sustainability Act, which will come into effect in January 2016, in a phased approach.
Budget 2015 provides $22 million over three years for an incentive program for the cement industry to produce cement in a cleaner manner. Over the five year life of the program, the Province will offer up to $27 million in conditional incentives to encourage cement producers to meet or beat new emissions intensity benchmarks.
Budget 2015 delivers on government’s commitment to direct all revenues from freshwater fishing licenses to the Freshwater Fisheries Society for conservation activities. This will provide $10 million over three years in incremental funding to the society.
In addition, Budget 2015 reintroduces the Clean Energy Vehicle Incentive Program and a fuelling/charging infrastructure program which will provide British Columbians incentives when considering the variety of clean and green choices for their transportation needs. Additional energy efficiency and conservation initiatives will also be implemented.
Supporting Families and Individuals in Need
Budget 2015 provides an additional $150 million over the next three years to support families and individuals most in need as detailed in Table 1.13.
Table 1.13 Supporting Families and Individuals in Need
($ millions) | | 2015/16 | | 2016/17 | | 2017/18 | |
Increased contribution provided to Community Living BC | | 18 | | 29 | | 59 | |
Child support payments fully exempted from income assistance payments | | 6 | | 9 | | 9 | |
Income Assistance supports for those in need | | — | | 20 | | — | |
Total | | 24 | | 58 | | 68 | |
Budget and Fiscal Plan — 2015/16 to 2017/18
22
Three Year Fiscal Plan
Community Living British Columbia
In Budget 2015 government’s contribution to Community Living British Columbia will increase by $106 million over the next three years. An additional $69 million over the next three years is provided to maintain support services for individuals with developmental disabilities and their families, and to address continued caseload growth and demand for services. An additional $37 million over the next three years is provided for general wage increases recently negotiated for front line social services workers under the 2014 Economic Stability Mandate.
Child Support Payments Fully Exempted from Income Assistance
Based on ongoing consultations with families on income and disability assistance as well as interested stakeholders, effective September 1, 2015 government will no longer deduct child support payments from income and disability assistance calculations. Income and disability assistance clients will be able to keep every dollar they receive in child support payments over and above what they receive in income and disability assistance. Approximately 3,200 families and 5,400 children who are currently receiving income and disability assistance will benefit from this change.
Fully exempting child support payments will increase income and disability assistance costs by $13 million annually. This increase will be partially offset by savings of $4 million currently spent on administering the Family Maintenance Program. Government will continue to provide resources to assist income and disability assistance clients in pursuing support orders from non-custodial parents, if they wish to do so. Budget 2015 provides $6 million in additional funding in 2015/16 to implement the change effective September 1, 2015 and an additional $9 million starting in 2016/17 and ongoing.
Income Assistance
Budget 2015 provides net additional funding of $20 million for individuals and families in need of income assistance to address caseload growth in disability income assistance, supplementary assistance and program delivery costs, partially offset by an anticipated reduction in temporary income assistance caseloads.
Policing and Community Safety
In Budget 2015, government will invest an additional $15 million over the next three years to fund increased RCMP costs in support of government’s continued commitment to a strong provincial police force to keep communities safe. In 2015/16, government will provide over $365 million to fund RCMP costs, an increase of almost $5 million from 2014/15.
Strategic Investments to Non-Government Partners
While BC’s budget remains balanced, the margin of the projected surplus continues to be narrow and there remains uncertainty in the future economic situation. Therefore Budget 2015 is accelerating $107 million of grants and other payments to local governments, public libraries, and other non-government agencies into 2014/15, so as to provide more funding certainty to those entities. As a result, there will be reduced requirements for providing such payments through ministry budgets in 2015/16 and 2016/17.
Budget and Fiscal Plan — 2015/16 to 2017/18
23
Three Year Fiscal Plan
Management of the BC Public Service
Full-time equivalent (FTE) staff utilization is projected to decrease from 26,600 FTEs in 2014/15 to 26,500 FTEs in 2015/16 due mainly to the expectation that the additional seasonal wildfire FTEs required in 2014/15 will not be required in 2015/16.
Chart 1.9 Managing FTEs
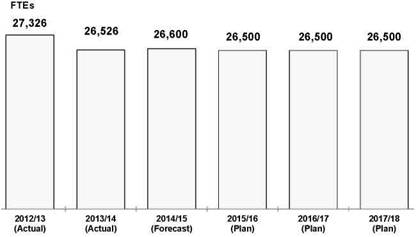
Going forward, FTE utilization is projected to remain flat in 2016/17 and 2017/18.
2014 Economic Stability Mandate for Public Sector Compensation
Of the approximately 313,000 unionized employees covered by over 180 collective agreements, over two-thirds have ratified or achieved tentative settlements under the 2014 Economic Stability Mandate (2014 Mandate). For planning purposes, Budget 2014 provided funding for the 2014 Mandate within the Contingencies vote allocations. In Budget 2015, funding has been reallocated from the Contingencies vote to ministry budgets in order to provide for modest wage increases under the 2014 Mandate.
The remaining employees who have yet to conclude new agreements include a significant number of post-secondary staff, nurses, and workers in some of the other service delivery agencies. There is adequate funding in the fiscal plan to accommodate the anticipated settlements for these groups. As well, current allocations to ministries are only for the base increase portion of the settlements; any Economic Stability Dividends will be funded from the Contingencies vote. See the topic box on page 41 for more information on the 2014 Mandate.
Recovered Expenses
Over the fiscal plan period (2015/16 to 2017/18), government projects it will incur $8.2 billion in program spending whose costs will be recovered from third parties.
Recovered costs include an estimated $3.0 billion in interest payments from commercial Crown corporations through the fiscal agency loan program and from sinking fund investment returns.
A total of $1.6 billion will be spent delivering programs on behalf of the federal government, such as the Labour Market Development Agreement, the Canada Jobs Fund, integrated workplace solutions, and child and family support programs.
Budget and Fiscal Plan — 2015/16 to 2017/18
24
Three Year Fiscal Plan
$1.2 billion in government spending is supported by other miscellaneous sources. For example, these include hospital expansion costs recovered from regional health boards, MSP and PharmaCare costs paid by agencies and other jurisdictions, and employee health benefits costs collected from participating government agencies.
The remaining $2.4 billion in recovered costs are incurred by a variety of programs, including industry-funded regulatory programs recovered through fees, fees recovered for collections services rendered, and distribution of free Crown grants recovered through the revaluation of the land being distributed.
The offsetting nature of the amounts recovered for the underlying expenses incurred, results in no net impact to government’s fiscal plan.
Operating Transfers
Transfers to service delivery agencies will total $68.9 billion over the fiscal plan period (2015/16 to 2017/18) in support of education, health care, social services, housing, and transportation programs delivered by the agencies on behalf of government. These service delivery agencies include the SUCH sector (schools, universities, colleges and health organizations), Community Living BC, BC Housing Management Commission, BC Transit, and the BC Transportation Financing Authority. Transfers to these organizations comprise over 60 per cent of ministry spending.
Service Delivery Agency Spending
Service delivery agency spending is projected to total $29.3 billion by 2017/18, reflecting an increase of $1.7 billion over the fiscal plan period.
School district spending is projected at $5.8 billion in 2017/18, an increase of $446 million (8.2 per cent) over the three year period. The increase is due to salary and benefits cost increases relating to the recent agreements reached under government’s negotiating mandates, partially offset by savings anticipated in administration.
Spending by the post-secondary institutions sector is forecast to increase by $325 million (6.1 per cent) over the three year period, to a total of $5.6 billion by 2017/18. The increase is largely due to increased salary costs relating to anticipated Economic Stability Mandate agreements, higher amortization costs in line with ongoing capital asset investments, and inflationary pressure on operating costs.
Health authority and hospital society spending is projected to rise from $13.2 billion in 2014/15 to $13.9 billion by 2017/18 — an increase of $643 million, or 4.9 per cent over the three year period. This spending increase is mainly due to additional staffing and operating costs incurred to meet the projected volume growth in healthcare services delivered by these organizations. The staffing cost increase does not reflect the impact of total wage/benefit cost adjustments for the ongoing contract negotiations. The Ministry of Health will be addressing this issue with the health authorities in the coming months.
Projected spending by other service delivery agencies is forecast to increase by $258 million by 2017/18. This 7.0 per cent increase is largely due to increased transportation sector spending and related interest costs.
Budget and Fiscal Plan — 2015/16 to 2017/18
25
Three Year Fiscal Plan
Capital Spending
In Budget 2015 capital spending on schools, hospitals, roads, bridges, hydro-electric projects and other infrastructure across the province is expected to total $18.7 billion over the fiscal plan period. These investments will support the ongoing implementation of the BC Jobs Plan, and key infrastructure needs in communities across the province.
Table 1.14 Capital Spending
| | Updated | | Budget | | | | | |
| | Forecast | | Estimate | | Plan | | Plan | |
($ millions) | | 2014/15 | | 2015/16 | | 2016/17 | | 2017/18 | |
Taxpayer-supported | | | | | | | | | |
Education | | | | | | | | | |
Schools (K–12) | | 405 | | 481 | | 541 | | 627 | |
Post-secondary institutions | | 781 | | 691 | | 739 | | 626 | |
Health | | 1,004 | | 983 | | 1,084 | | 678 | |
BC Transportation Financing Authority | | 828 | | 941 | | 706 | | 678 | |
BC Transit | | 88 | | 119 | | 137 | | 53 | |
Government ministries | | 392 | | 392 | | 431 | | 383 | |
Other 1 | | 139 | | 124 | | 88 | | 154 | |
Total taxpayer-supported | | 3,637 | | 3,731 | | 3,726 | | 3,199 | |
Self-supported | | | | | | | | | |
BC Hydro | | 2,268 | | 2,234 | | 2,277 | | 2,718 | |
Columbia River power projects 2 | | 36 | | 24 | | 14 | | 16 | |
Transportation Investment Corporation (Port Mann) | | 95 | | 16 | | 9 | | — | |
BC Railway Company | | 4 | | 5 | | 2 | | 1 | |
ICBC | | 81 | | 115 | | 50 | | 40 | |
BC Lotteries | | 90 | | 90 | | 110 | | 110 | |
Liquor Distribution Branch | | 30 | | 34 | | 65 | | 59 | |
Total self-supported commercial | | 2,604 | | 2,518 | | 2,527 | | 2,944 | |
Total capital spending | | 6,241 | | 6,249 | | 6,253 | | 6,143 | |
1 Includes BC Housing Management Commission, Provincial Rental Housing Corporation, and other service delivery agencies.
2 Joint ventures of the Columbia Power Corporation and Columbia Basin Trust.
Taxpayer-supported Capital Spending
Taxpayer-supported capital spending over the next three years will total $10.7 billion, and includes completion of existing approved projects along with new investments to expand and sustain provincial infrastructure including schools, universities and hospitals.
Investments in Schools
Over the three years of the capital plan, $1.6 billion will be invested to maintain, replace, renovate or expand K—12 facilities, including continued investment in new school space to accommodate increasing enrolment in growth districts, and continued investment in the program to seismically upgrade or replace schools.
Budget and Fiscal Plan — 2015/16 to 2017/18
26
Three Year Fiscal Plan
Current and planned capital investments in Budget 2015 include:
· A new Clayton North Secondary School in Surrey, which will provide 1,500 student spaces and will be complete in 2017. Enrolment in this part of Surrey School District has grown substantially and the new school will alleviate pressures at other district secondary schools, particularly Lord Tweedsmuir which is operating over its capacity.
· A replacement of Oak Bay High School in Victoria with a 1,300-student-capacity school on the current site, which includes district-funded space for 100 international students. The new school is scheduled to open in September 2015 and includes a theatre, as well as a Neighbourhood Learning Centre with a daycare and programs provided in partnership with Oak Bay Parks and Recreation.
· A seismic upgrade to Lord Strathcona Elementary will bring Vancouver’s oldest school up to modern day structural seismic standards while preserving the integrity of the original school. It is expected that the project will be completed in 2017.
Spending to Support Post-secondary Education
Budget 2015 includes $2.1 billion in capital spending over the next three years by post-secondary institutions across the province. Projects include the replacement and renewal of existing infrastructure to address deferred maintenance and protect the province’s investment in capital assets.
In addition, investments in priority projects will build capacity and help meet the province’s future workforce needs in key sectors, as outlined in BC’s Skills for Jobs Blueprint. A significant portion of this capital investment is funded through other sources, including foundations, donations, cash balances, federal funding and revenues generated from services.
Current and planned investments in the post-secondary sector include:
· Renewal and expansion of Camosun College’s Interurban Campus Trades Facilities in Victoria, which will create an efficient, modern learning environment for key Trades disciplines, with a capacity for 370 new and 400 existing students.
· Expansion and renovation of the existing Trades Campus at Okanagan College in Kelowna, creating fully modernized and retrofitted Trades facilities with a capacity for 128 new and 2,280 existing students.
· A new campus for Emily Carr University at Great Northern Way in Vancouver, which will include a state-of-the-art visual, media and design art facility with a capacity for 1,800 students.
· Support for research infrastructure through the British Columbia Knowledge Development Fund, with external funding leveraged from the federal Canada Foundation for Innovation and non-provincial government partners. Key research investments include:
· Procurement of computational infrastructure at the BC Cancer Research Centre to expand and accelerate data analysis. The research is expected to lead to the development of innovative computational approaches to identify and characterize mutations in cancer, and to improve detection and treatment for a variety of cancers.
Budget and Fiscal Plan — 2015/16 to 2017/18
27
Three Year Fiscal Plan
· Procurement of critical equipment for the Prometheus Project, a province-wide research and commercialization hub for materials science and engineering innovation. The project brings together Simon Fraser University, the University of Victoria, the University of British Columbia and the British Columbia Institute of Technology, with the goal of translating innovative ideas into prototypes and engineered devices that will be commercialized to support economic growth in British Columbia.
Expanding and Upgrading Health Facilities
Capital spending on infrastructure in the health sector will total $2.7 billion over the next three years. These investments support new major construction projects and upgrading of health facilities, medical and diagnostic equipment, and information management/ technology systems. These investments are supported by funding from the province as well as other sources, such as regional hospital districts and foundations.
Key capital investments in the health sector include:
· Redevelopment of Children’s and Women’s Hospital including the new Teck Acute Care Centre to replace 179 acute care beds and expand service to 221 beds, plus expand the emergency department, maternity, pediatric operating rooms and diagnostic imaging and procedures areas. Construction of the Teck Acute Care Centre is underway with completion planned for summer 2017.
· Construction of two new hospitals (one located in Courtenay/Comox and one in Campbell River) to replace existing North Island hospitals and provide a total of 248 patient beds, an increase of 62 beds on the North Island. Construction of both hospitals commenced in August 2014 and is scheduled for completion in 2017.
· A new clinical services building for Royal Inland Hospital in Kamloops, which will include outpatient services and teaching space for medical students along with improved parking and access to the hospital. Opening of the new clinical services building is planned for spring 2016.
· Construction of the new Joseph and Rosalie Segal Family Health Centre to replace and consolidate specialized mental health services at Vancouver General Hospital.
Supporting the Transportation Investment Plan
Budget 2015 includes continued investments in government’s transportation investment plan. The province has secured federal cost sharing on projects and has also leveraged investments through partnerships with private partners. The public and private sector will provide a total of $2.9 billion for transportation investments over the next three years, including:
· $2.5 billion of provincial investment in transportation infrastructure; and
· $0.4 billion of investment leveraged through federal cost sharing and partnerships with private partners, local governments and other agencies.
Further information is provided in Table 1.15.
Budget and Fiscal Plan — 2015/16 to 2017/18
28
Three Year Fiscal Plan
Table 1.15 Provincial Transportation Investments
| | Updated | | | | | | | | | |
| | Forecast | | | | | | | | 3-Year | |
($ millions) | | 2014/15 | | 2015/16 | | 2016/17 | | 2017/18 | | Total | |
Provincial investments: | | | | | | | | | | | |
– Highway rehabilitation | | 193 | | 213 | | 213 | | 213 | | 639 | |
– Side road improvement program | | 92 | | 90 | | 90 | | 90 | | 270 | |
– Natural gas road upgrade program | | 21 | | 20 | | 20 | | 20 | | 60 | |
– Highway 1 (Kamloops to Alberta border) | | 29 | | 45 | | 46 | | 60 | | 151 | |
– George Massey Tunnel replacement project 1 | | 18 | | 24 | | 29 | | — | | 53 | |
– Okanagan Valley corridor | | 32 | | 39 | | 29 | | 43 | | 111 | |
– Cariboo connector program | | 18 | | 36 | | 28 | | 38 | | 102 | |
– Major highway corridors and roads | | 97 | | 119 | | 103 | | 204 | | 426 | |
– Other transportation programs | | 27 | | 53 | | 50 | | 58 | | 161 | |
– Transit infrastructure | | 163 | | 221 | | 200 | | 74 | | 495 | |
Total provincial investment 2 | | 690 | | 860 | | 808 | | 800 | | 2,468 | |
Investments funded through contributions from other partners | | 279 | | 298 | | 108 | | 9 | | 415 | |
Total investment in transportation infrastructure | | 969 | | 1,158 | | 916 | | 809 | | 2,883 | |
Transportation Investment Corporation | | | | | | | | | | | |
– Port Mann Bridge/Highway 1 project | | 95 | | 16 | | 9 | | — | | 25 | |
Total investment in transportation infrastructure including the Port Mann Bridge/Highway 1 project | | 1,064 | | 1,174 | | 925 | | 809 | | 2,908 | |
1 Subject to Treasury Board approved business plan and funding strategy.
2 Total provincial investment includes operating and capital spending.
Ministry Capital Spending
Budget 2015 includes $1.2 billion in capital spending by government ministries over the plan period. This will support investments in maintaining, upgrading or expanding infrastructure such as courthouses, correctional centres, office buildings, industrial roads, and information systems.
Capital investments made by government ministries include development of the new Okanagan Correctional Centre near Oliver. This facility is expected to be completed in late 2016 and will more than double correctional centre capacity in British Columbia’s Interior.
Capital Project Reserves
The province has included $235 million in project reserves in its three year capital plan as a prudent planning measure. In addition to covering risks from higher than expected costs, the reserves will be used to fund emerging government priorities.
Budget and Fiscal Plan — 2015/16 to 2017/18
29
Three Year Fiscal Plan
Financing Capital Projects
Provincial capital infrastructure spending is financed through a combination of sources:
· cash balances within the organizations;
· partnerships with the private sector (public-private partnerships, or P3s);
· cost sharing with partners (e.g. federal government, regional hospital districts); and
· debt.
The sale of BC Transportation Financing Authority sinking funds in 2013/14 provided significant levels cash as a source of capital financing in 2014/15 and 2015/16. The increase in debt financing in 2016/17 reflects the utilization of this resource and the return to historical levels of capital financing from each source.
Chart 1.10 Financing government’s capital plan
Self-supported Capital Spending
Self-supported capital spending is projected to total $8.0 billion over the fiscal plan period. Over the three year period:
· $7.3 billion (91 per cent) of total self-supported capital spending will be used for electrical generation, transmission and distribution projects to meet growing customer demand and to enhance reliability. Included in this total is initial construction of a third power facility at Site C on the Peace River.
Built between the late 1960s and early 1980s, BC Hydro’s hydroelectric system provides over 95 per cent of the total electricity generated by the corporation. This vast system is ageing and requires a broad range of investments to maintain reliability — from seismic and safety improvements at dams, to expanding and strengthening the transmission system, to upgrading the metering system. Roughly half of power project capital spending represents measures to address ageing infrastructure.
· $25 million will be used to complete the Port Mann Bridge replacement and Highway 1 improvement project.
Budget and Fiscal Plan — 2015/16 to 2017/18
30
Three Year Fiscal Plan
· $290 million will be used for BC Lottery Corporation projects including the modernization of business systems, expansion of the lottery distribution network, and acquisition of gaming equipment to support lottery, PlayNow internet gaming, casino and community gaming activities.
· $205 million will be used for ICBC projects including reinvestment in critical business systems as part of its Transformation Program.
· $158 million will be used to modernize LDB’s operations including updates and improvements to stores, technology-related upgrades, and ongoing equipment replacement.
Table 1.16 provides information on major capital projects, and further details on provincial capital investments are shown in the service plans of ministries and Crown agencies.
Projects Over $50 Million
Approved major capital projects with multi-year budgets from provincial sources totaling $50 million or more are shown in Table 1.16. Annual allocations of the full budget for these projects are included as part of the provincial government’s capital investment spending shown in Table 1.14.
In addition to financing through provincial sources, major projects may be cost shared with the federal government, municipalities and regional districts, and/or the private sector. Total capital spending for these major projects is $28.0 billion, refecting provincial financing of $25.5 billion including internal sources and P3 liabilities, as well as $2.5 billion in contributions from the federal government and other sources including private donations.
Major capital investments include:
· $1.7 billion for school replacement projects including Centennial Secondary, Kitsilano Secondary, Oak Bay Secondary, Belmont Secondary, Clayton North Secondary, and continuation of the seismic mitigation program;
· $123 million for the Emily Carr University of Art and Design campus redevelopment project at Great Northern Way;
· $3.4 billion for health facilities including the Northern Cancer Control Strategy, Lions Gate Hospital redevelopment, the Surrey Memorial Hospital — Emergency Department/Critical Care Tower, the Lakes District Hospital in Burns Lake, the Queen Charlotte/Haida Gwaii Hospital, the North Islands hospitals, Royal Inland Hospital redevelopment, the Interior Heart and Surgical Centre in Kelowna, the Joseph and Rosalie Segal Family Health Centre at Vancouver General Hospital, the Children’s and Women’s Hospital, the Penticton Regional Hospital patient care tower, and the clinical and systems transformation project;
· $6.2 billion for major transportation capital infrastructure including the South Fraser Perimeter Road, the Evergreen Line Rapid Transit project, the Sierra Yoyo Desan (SYD) Road upgrade, and the Port Mann Bridge/Highway 1 project;
· $545 million for projects in other sectors including the Integrated Case Management system, the upgrade of 13 Single Room Occupancy hotels in Vancouver’s Downtown Eastside, and the new Okanagan Correctional Centre;
Budget and Fiscal Plan — 2015/16 to 2017/18
31
Three Year Fiscal Plan
Table 1.16 Capital Expenditure Projects Greater Than $50 million 1
Note: Information in bold type denotes changes from the 2014/15 second Quarterly Report released on November 26, 2014.
| | | | Project | | Estimated | | Anticipated | | Project Financing | |
| | Year of | | Cost to | | Cost to | | Total | | Internal/ | | P3 | | Federal | | Other | |
($ millions) | | Completion | | Dec 31, 2014 | | Complete | | Cost | | Borrowing | | Liability | | Gov’t | | Contrib’ns | |
Taxpayer-supported | |
School districts | | | | | | | | | | | | | | | | | |
Southern Okanagan Secondary 2 | | 2013 | | 50 | | — | | 50 | | 48 | | — | | — | | 2 | |
Chilliwack Secondary 2 | | 2013 | | 53 | | — | | 53 | | 53 | | — | | — | | — | |
Centennial Secondary | | 2015 | | 16 | | 45 | | 61 | | 61 | | — | | — | | — | |
Oak Bay Secondary | | 2015 | | 36 | | 16 | | 52 | | 50 | | — | | — | | 2 | |
Kitsilano Secondary | | 2015 | | 17 | | 47 | | 64 | | 60 | | — | | — | | 4 | |
Belmont Secondary | | 2015 | | 30 | | 26 | | 56 | | 30 | | — | | — | | 26 | |
Clayton North Secondary | | 2017 | | — | | 55 | | 55 | | 45 | | — | | — | | 10 | |
Seismic mitigation program | | 2023 | | 35 | | 1,265 | | 1,300 | | 1,300 | | — | | — | | — | |
Total school districts | | | | 237 | | 1,454 | | 1,691 | | 1,647 | | — | | — | | 44 | |
Post-secondary institutions | | | | | | | | | | | | | | | | | |
Emily Carr University of Art and Design | | | | | | | | | | | | | | | | | |
– Campus redevelopment at Great Northern Way | | 2017 | | 5 | | 118 | | 123 | | 102 | | — | | — | | 21 | |
Health facilities | | | | | | | | | | | | | | | | | |
Northern Cancer Control Strategy 2 | | | | | | | | | | | | | | | | | |
– Direct procurement | | 2014 | | 28 | | 7 | | 35 | | 32 | | — | | — | | 3 | |
– P3 contract | | 2012 | | 71 | | — | | 71 | | 54 | | 17 | | — | | — | |
Lions Gate Hospital (Mental Health) | | | | | | | | | | | | | | | | | |
Redevelopment | | 2014 | | 45 | | 17 | | 62 | | 38 | | — | | — | | 24 | |
Lakes District Hospital | | 2015 | | 40 | | 15 | | 55 | | 46 | | — | | — | | 9 | |
Queen Charlotte/Haida Gwaii Hospital | | 2015 | | 11 | | 39 | | 50 | | 31 | | — | | — | | 19 | |
Surrey Emergency/Critical Care Tower | | | | | | | | | | | | | | | | | |
– Direct procurement | | 2016 | | 121 | | 73 | | 194 | | 174 | | — | | — | | 20 | |
– P3 contract | | 2014 | | 318 | | — | | 318 | | 139 | | 179 | | — | | — | |
Royal Inland Hospital | | 2016 | | 7 | | 73 | | 80 | | 47 | | — | | — | | 33 | |
North Island Hospitals | | | | | | | | | | | | | | | | | |
– Direct procurement | | 2017 | | 26 | | 100 | | 126 | | 73 | | — | | — | | 53 | |
– P3 contract | | 2017 | | 27 | | 453 | | 480 | | 60 | | 232 | | — | | 188 | |
Interior Heart and Surgical Centre | | | | | | | | | | | | | | | | | |
– Direct procurement | | 2017 | | 108 | | 140 | | 248 | | 213 | | — | | — | | 35 | |
– P3 contract | | 2015 | | 105 | | 28 | | 133 | | 4 | | 79 | | — | | 50 | |
Vancouver General Hospital — Joseph and Rosalie Segal Family Health Centre Children’s and Women’s Hospital | | 2017 | | 9 | | 73 | | 82 | | 57 | | — | | — | | 25 | |
– Direct procurement | | 2019 | | 75 | | 234 | | 309 | | 177 | | — | | — | | 132 | |
– P3 contract | | 2017 | | 62 | | 307 | | 369 | | 168 | | 187 | | — | | 14 | |
Penticton Regional Hospital — Patient Care Tower | | 2019 | | — | | 325 | | 325 | | 168 | | — | | — | | 157 | |
Clinical and systems transformation | | 2023 | | 90 | | 390 | | 480 | | 480 | | — | | — | | — | |
Total health facilities | | | | 1,143 | | 2,274 | | 3,417 | | 1,961 | | 694 | | — | | 762 | |
Transportation | | | | | | | | | | | | | | | | | |
South Fraser Perimeter Road 2 | | | | | | | | | | | | | | | | | |
– Direct procurement | | 2014 | | 1,071 | | 5 | | 1,076 | | 728 | | — | | 348 | | — | |
– P3 contract | | 2014 | | 188 | | — | | 188 | | — | | 188 | | — | | — | |
Sierra Yoyo Desan Road upgrade | | 2015 | | 140 | | 10 | | 150 | | 150 | | — | | — | | — | |
Evergreen Line Rapid Transit | | | | | | | | | | | | | | | | | |
– Direct procurement | | 2016 | | 253 | | 283 | | 536 | | 321 | | — | | 74 | | 141 | |
– P3 contract | | 2016 | | 571 | | 324 | | 895 | | — | | 265 | | 350 | | 280 | |
Total transportation | | | | 2,223 | | 622 | | 2,845 | | 1,199 | | 453 | | 772 | | 421 | |
Budget and Fiscal Plan — 2015/16 to 2017/18
32
Three Year Fiscal Plan
Table 1.16 Capital Expenditure Projects Greater Than $50 million 1 (continued)
Note: Information in bold type denotes changes from the 2014/15 second Quarterly Report released on November 26, 2014.
| | | | Project | | Estimated | | Anticipated | | Project Financing | |
| | Year of | | Cost to | | Cost to | | Total | | Internal/ | | P3 | | Federal | | Other | |
($ millions) | | Completion | | Dec 31, 2014 | | Complete | | Cost | | Borrowing | | Liability | | Gov’t | | Contrib’ns | |
Other taxpayer-supported | | | | | | | | | | | | | | | | | |
Integrated Case Management system 2 | | 2014 | | 180 | | 2 | | 182 | | 179 | | — | | 3 | | — | |
Single Room Occupancy Hotel renewal initiative | | | | | | | | | | | | | | | | | |
– Direct procurement | | 2016 | | 11 | | 14 | | 25 | | 23 | | — | | 2 | | — | |
– P3 contract | | 2016 | | 68 | | 50 | | 118 | | — | | 91 | | 27 | | — | |
Okanagan Correctional Centre | | | | | | | | | | | | | | | | | |
– Direct procurement | | 2016 | | 28 | | 63 | | 91 | | 91 | | — | | — | | — | |
– P3 contract | | 2016 | | 31 | | 98 | | 129 | | 8 | | 121 | | — | | — | |
Total other | | | | 318 | | 227 | | 545 | | 301 | | 212 | | 32 | | — | |
Total taxpayer-supported | | | | 3,926 | | 4,695 | | 8,621 | | 5,210 | | 1,359 | | 804 | | 1,248 | |
Self-supported | |
| | | | | | | | | | | | | | | | | |
Transportation | | | | | | | | | | | | | | | | | |
Port Mann Bridge / Highway 1 | | 2017 | | 3,265 | | 54 | | 3,319 | | 3,319 | | — | | — | | — | |
Power generation and transmission | | | | | | | | | | | | | | | | | |
BC Hydro | | | | | | | | | | | | | | | | | |
– Vancouver City Central transmission 2 | | 2014 | | 171 | | — | | 171 | | 171 | | — | | — | | — | |
– Mica SF6 gas insulated switchgear replacement 2 | | 2014 | | 175 | | 24 | | 199 | | 199 | | — | | — | | — | |
– Northwest transmission line 2 | | 2014 | | 664 | | 52 | | 716 | | 329 | | — | | 130 | | 257 | |
– Iskut extension project 2 | | 2014 | | 167 | | 42 | | 209 | | 140 | | — | | — | | 69 | |
– Merritt area transmission | | 2015 | | 42 | | 23 | | 65 | | 65 | | — | | — | | — | |
– Smart metering and infrastructure program | | 2015 | | 721 | | 209 | | 930 | | 930 | | — | | — | | — | |
– Dawson Creek/Chetwynd area transmission | | 2015 | | 183 | | 113 | | 296 | | 296 | | — | | — | | — | |
– Interior to Lower Mainland transmission line | | 2015 | | 574 | | 151 | | 725 | | 725 | | — | | — | | — | |
– GM Shrum units 1 to 5 turbine replacement | | 2015 | | 144 | | 128 | | 272 | | 272 | | — | | — | | — | |
– Surrey area substation project | | 2015 | | 39 | | 55 | | 94 | | 94 | | — | | — | | — | |
– Hugh Keenleyside spillway gate reliability upgrade | | 2015 | | 87 | | 36 | | 123 | | 123 | | — | | — | | — | |
– Upper Columbia capacity additions at Mica units 5 and 6 project | | 2015 | | 486 | | 228 | | 714 | | 714 | | — | | — | | — | |
– Long Beach area reinforcement | | 2015 | | 22 | | 34 | | 56 | | 56 | | — | | — | | — | |
– Big Bend substation | | 2017 | | 18 | | 38 | | 56 | | 56 | | — | | — | | — | |
– Ruskin Dam safety and powerhouse upgrade | | 2017 | | 283 | | 465 | | 748 | | 748 | | — | | — | | — | |
– John Hart generating station replacement | | 2019 | | 239 | | 854 | | 1,093 | | 1,093 | | — | | — | | — | |
– Cheakamus Unit 1 and Unit 2 generator replacement | | 2019 | | 4 | | 70 | | 74 | | 74 | | — | | — | | — | |
– Peace River Site C clean energy project | | 2024 | | 415 | | 8,360 | | 8,775 | | 8,775 | | — | | — | | — | |
Columbia River power projects | | | | | | | | | | | | | | | | | |
– Waneta Dam power expansion 3 | | 2015 | | 311 | | 39 | | 350 | | 350 | | — | | — | | — | |
Total power generation and transmission | | | | 4,745 | | 10,921 | | 15,666 | | 15,210 | | — | | 130 | | 326 | |
Other | | | | | | | | | | | | | | | | | |
British Columbia Lottery Corporation | | | | | | | | | | | | | | | | | |
– Gaming management system | | 2015 | | 88 | | 10 | | 98 | | 98 | | — | | — | | — | |
Insurance Corporation of British Columbia | | | | | | | | | | | | | | | | | |
– Business transformation program | | 2016 | | 216 | | 55 | | 271 | | 271 | | — | | — | | — | |
Total other | | | | 304 | | 65 | | 369 | | 369 | | — | | — | | — | |
Total self-supported | | | | 8,314 | | 11,040 | | 19,354 | | 18,898 | | — | | 130 | | 326 | |
Total $50 million projects | | | | 12,240 | | 15,735 | | 27,975 | | 24,108 | | 1,359 | | 934 | | 1,574 | |
1 Only projects that receive provincial funding and have been approved by Treasury Board and/or Crown corporation boards are included in this table. Ministry service plans may highlight projects that still require final approval. Capital costs reflect current government accounting policy.
2 Assets have been put into service and only trailing costs remain.
3 Reflects the combined shares of Columbia Power Corporation (32.5 per cent) and Columbia Basin Trust (16.5 per cent) in their partnership with Fortis Inc. for the development of an electricity generating facility at the Waneta Dam south of Trail.
Budget and Fiscal Plan — 2015/16 to 2017/18
33
Three Year Fiscal Plan
· $15.7 billion primarily for power generation and transmission capital projects by BC Hydro and for Columbia River power projects including construction of a dam and generating facilities at Site C on the Peace River and a 49 per cent share in the expansion of the Waneta Dam (a public-private partnership with Fortis Inc.);
· $98 million for the replacement of the BC Lottery Corporation gaming management system that supports the generation of over $1.6 billion in annual revenue from 35 casinos and community gaming centres operating more than 12,000 slot machines and 500 table games; and
· $271 million for the capital component of ICBC’s $400 million business transformation program that will completely overhaul its claims, insurance, customer, and business processes and technologies.
The following changes have occurred since the second Quarterly Report:
· Southern Okanagan Secondary and Chilliwack Secondary were completed under the approved project budgets. The changes represent savings of $4 million and $5 million respectively.
· The $55 million Clayton North Secondary project has been added in the Education sector.
· Anticipated costs for the Emily Carr University of Art and Design campus redevelopment have been reduced by $11 million to reflect savings realized during the procurement process.
· Interior Heart and Surgical Centre spending has been reallocated between direct procurement and P3 components.
· Completion of the Port Mann Bridge/Highway 1 project has been revised to 2017, reflecting the completion date for the remaining highway infrastructure.
· The Seymour Arms series capacitor project was completed; the $8.8 billion Site C Peace River dam project has been added; total anticipated spending for the Northwest transmission line has declined $30 million; total spending for the Iskut extension project has increased $29 million (with a corresponding increase in the customer contribution to the project) and the completion date has been advanced to 2014; and the Merritt area transmission project completion date is now 2015.
· Anticipated spending for the capital portion of ICBC’s business transformation program decreased $26 million reflecting revised cost estimates. The overall program budget which includes both capital and operating components remains unchanged at $400 million.
Budget and Fiscal Plan — 2015/16 to 2017/18
34
Three Year Fiscal Plan
Provincial Debt
Table 1.17 Provincial Debt Summary 1
| | Updated | | Budget | | | | | |
| | Forecast | | Estimate | | Plan | | Plan | |
($ millions unless otherwise indicated) | | 2014/15 | | 2015/16 | | 2016/17 | | 2017/18 | |
Taxpayer-supported debt | | | | | | | | | |
Provincial government direct operating | | 9,441 | | 8,420 | | 6,718 | | 4,767 | |
Other taxpayer-supported debt (mainly capital) | | | | | | | | | |
Education | | 12,135 | | 12,642 | | 13,437 | | 14,331 | |
Health 2 | | 6,545 | | 7,036 | | 7,721 | | 8,166 | |
Highways and public transit 3 | | 10,809 | | 11,654 | | 12,517 | | 13,461 | |
Other 4 | | 3,372 | | 3,430 | | 3,733 | | 4,008 | |
Total other taxpayer-supported debt | | 32,861 | | 34,762 | | 37,408 | | 39,966 | |
Total taxpayer-supported debt | | 42,302 | | 43,182 | | 44,126 | | 44,733 | |
Self-supported debt | | 21,428 | | 22,528 | | 23,769 | | 25,321 | |
Total debt before forecast allowance | | 63,730 | | 65,710 | | 67,895 | | 70,054 | |
Forecast allowance 5 | | 100 | | 250 | | 350 | | 350 | |
Total provincial debt | | 63,830 | | 65,960 | | 68,245 | | 70,404 | |
Debt as a per cent of GDP | | | | | | | | | |
Provincial government direct operating | | 4.0 | % | 3.4 | % | 2.6 | % | 1.8 | % |
Taxpayer-supported | | 17.7 | % | 17.4 | % | 17.1 | % | 16.6 | % |
Total provincial | | 26.7 | % | 26.6 | % | 26.4 | % | 26.1 | % |
Taxpayer-supported debt per capita ($) | | 9,134 | | 9,212 | | 9,294 | | 9,301 | |
Taxpayer-supported interest bite (cents per dollar of revenue) | | 3.8 | | 3.9 | | 4.1 | | 4.3 | |
1 Debt is after deduction of sinking funds and unamortized discounts, and excludes accrued interest. Government direct and fiscal agency accrued interest is reported in the government’s accounts as an accounts payable.
2 Health facilities’ debt includes public-private partnership obligations of $1,271 million for fiscal 2014/15, $1,439 million for fiscal 2015/16, $1,590 million for fiscal 2016/17, and $1,632 million for fiscal 2017/18.
3 BC Transportation Financing Authority’s debt includes public-private partnership obligations of $1,132 million for fiscal 2014/15, $1,161 million for fiscal 2015/16, $824 million for fiscal 2016/17, and $783 million for fiscal 2017/18.
4 Social housing’s debt includes public-private partnership obligations of $80 million for fiscal 2014/15, $101 million for fiscal 2015/16, $91 million for fiscal 2016/17, and $82 million for fiscal 2017/18.
5 Reflects the operating statement forecast allowance for each year (amounts are not cumulative). Since it is unknown as to which agency would require this debt, the forecast allowance is shown as a separate item over the plan.
Total provincial debt will reach $70.4 billion by 2017/18; however, as a result of strategic debt management, the rate of annual debt growth will decline from 5.2 per cent in 2014/15 to 3.2 per cent in 2017/18.
Government’s borrowing requirement for the next three years totals $14.0 billion, and includes $2.5 billion to retire maturing debt in addition to the $11.5 billion in capital borrowing. A further $5.1 billion in maturing debt will be retired by a combination of government’s debt management strategy and the reduction of P3 liabilities through annual service payments (see Table 1.18).
Taxpayer-supported debt is forecast to increase to $44.7 billion by 2017/18, up $2.4 billion from 2014/15, reflecting the significant investment in capital assets planned over the next three years. This includes a $3.8 billion increase due to capital spending on education and health facilities, a $2.7 billion increase in support of transportation projects, and a $0.6 billion increase for other initiatives. These increases are partially offset by a $4.7 billion reduction in government direct operating debt over the same period, and which by 2017/18 will be at its lowest point since 1990/91.
Budget and Fiscal Plan — 2015/16 to 2017/18
35
Three Year Fiscal Plan
Table 1.18 Provincial Borrowing Requirements
| | Updated | | Budget | | | | | |
| | Forecast | | Estimate | | Plan | | Plan | |
($ millions) | | 2014/15 | | 2015/16 | | 2016/17 | | 2017/18 | |
| | | | | | | | | |
Total provincial debt 1 at beginning of year | | 60,693 | | 63,830 | | 65,960 | | 68,245 | |
New borrowing 2 | | 5,168 | | 4,613 | | 4,299 | | 4,497 | |
Direct borrowing by Crown corporations and agencies | | 381 | | 285 | | 178 | | 88 | |
Retirement provision 3 requiring refinancing | | (772 | ) | (1,843 | ) | (228 | ) | (390 | ) |
Retirement provision 3 funded internally | | (1,740 | ) | (1,075 | ) | (2,064 | ) | (2,036 | ) |
Change in forecast allowance | | 100 | | 150 | | 100 | | — | |
Net change in total debt | | 3,137 | | 2,130 | | 2,285 | | 2,159 | |
Total provincial debt 1 at year end | | 63,830 | | 65,960 | | 68,245 | | 70,404 | |
Annual growth in debt (per cent) | | 5.2 | | 3.3 | | 3.5 | | 3.2 | |
1 Debt is after deduction of sinking funds and unamortized discounts, and excludes accrued interest which is reported in the financial statements as an accounts payable.
2 New long-term borrowing plus net change in short-term debt.
3 Sinking fund contributions, sinking fund earnings and net maturities of long-term debt (after deduction of sinking fund balances for maturing issues).
The self-supported debt of commercial Crown corporations is forecast to increase to $25.3 billion by 2017/18, up $3.9 billion from 2014/15. The increase is primarily due to the additional investment in improving and expanding British Columbia’s hydro generation assets ($3.8 billion) and capital spending and operating requirements for other self-supported Crown corporations ($0.1 billion).
Additional details on government’s outstanding debt are provided in Appendix Tables A17 to A19.
Relationship between surplus and debt
In addition to operating results, the change in debt is impacted by reductions in cash and other working capital changes as well as the debt financing requirements of government’s capital plan. Table 1.19 reconciles the forecast surpluses with changes in debt.
Table 1.19 Reconciliation of Summary Results to Provincial Debt Changes
| | Updated | | Budget | | | | | |
| | Forecast | | Estimate | | Plan | | Plan | |
($ millions) | | 2014/15 | | 2015/16 | | 2016/17 | | 2017/18 | |
| | | | | | | | | |
Taxpayer-supported debt: | | | | | | | | | |
Annual surplus (before forecast allowance) | | (979 | ) | (534 | ) | (726 | ) | (749 | ) |
Reduction in cash balances | | (9 | ) | (955 | ) | (188 | ) | (193 | ) |
Other working capital changes | | 748 | | 784 | | 262 | | 501 | |
Net increase in capital and other assets | | 1,474 | | 1,585 | | 1,596 | | 1,048 | |
| | 1,234 | | 880 | | 944 | | 607 | |
Self-supported debt: | | | | | | | | | |
Commercial Crown corporation capital financing | | 1,802 | | 1,107 | | 1,256 | | 1,570 | |
Other commercial debt | | 1 | | (7 | ) | (15 | ) | (18 | ) |
| | 1,803 | | 1,100 | | 1,241 | | 1,552 | |
Annual change in forecast allowance | | 100 | | 150 | | 100 | | — | |
Annual increase in total provincial debt | | 3,137 | | 2,130 | | 2,285 | | 2,159 | |
Budget and Fiscal Plan — 2015/16 to 2017/18
36
Three Year Fiscal Plan
Risks to the Fiscal Plan
Table 1.20 provides the estimated fiscal impacts of the identified sensitivities for some of the key variables in the fiscal plan projections on an individual basis. However, interrelationships between the variables may cause the actual variances to be higher or lower than the estimates shown in the table. For example, an increase in the US/CDN dollar exchange rate may be offset by higher commodity prices.
Table 1.20 Key Fiscal Sensitivities
| | | | Annual Fiscal Impact | |
Variable | | Increases of | | ($ millions) | |
Nominal GDP | | 1% | | $150 – $250 | |
Lumber prices (US$/thousand board feet) | | $50 | | $100 – $1201 | |
Natural gas prices (Cdn$/gigajoule) | | 50 cents | | $1752 | |
US exchange rate (US cent/Cdn $) | | 1 cent | | -$25 to -$50 | |
Interest rates | | 1 percentage point | | -$114 | |
Debt | | $500 million | | -$15 | |
1 Sensitivity relates to stumpage revenue only. Depending on market conditions, changes in stumpage revenues may be offset by changes in border tax revenues.
2 Sensitivities can vary significantly especially at lower prices.
The assumptions and risk sensitivities for individual revenue sources and major program areas can be found in Appendix Tables A5 and A6, beginning on page 109.
Own Source Revenue
The main areas that may affect own source revenue forecasts are BC’s overall economic performance, the relative health of its major trading partners, the exchange rate and commodity prices.
Revenues are sensitive to economic performance. For example, taxation and other revenue sources are driven by economic factors such as household income, retail sales, employment, population growth and the exchange rate. The revenue forecast contained in the fiscal plan is based on the economic forecast detailed in Part 3: British Columbia Economic Review and Outlook. As well, it incorporates commodity price forecasts developed by the Ministry of Forests, Lands and Natural Resource Operations, the Ministry of Energy and Mines, and the Ministry of Natural Gas Development based on private sector information.
Income tax revenue forecasts are based on projections of household income and net operating surplus. The forecasts are updated from reports on tax assessments provided by the Canada Revenue Agency. As a result, revenue estimates can be affected by timing lags in the reporting of current and prior year tax assessments by the Canada Revenue Agency.
Adjustments to the harmonized sales tax entitlements for the years 2010/11 to 2012/13 will continue until 2019/20. These changes, determined by the federal government could affect the revenue forecast over the three-year plan, however it is expected that the size of changes will diminish over time.
Budget and Fiscal Plan — 2015/16 to 2017/18
37
Three Year Fiscal Plan
Revenues in British Columbia can also be volatile, largely due to the influence of the cyclical natural resource sector in the economy and the importance of natural resource revenues in the province’s revenue base. Changes in commodity prices such as natural gas, lumber or coal may have a significant effect on natural resource revenues.
Details on major assumptions and sensitivities resulting from changes to those assumptions are outlined in Appendix Table A5.
Softwood Lumber Agreement
The fiscal plan assumes the continuation of the Softwood Lumber Agreement (SLA 2006) beyond its current expiry date of October 2015 and assumes a full-year entitlement of SLA 2006 border tax revenue in 2015/16 and 2016/17. The outcome relating to the future of the agreement may pose a risk to the plan.
Federal Government Contributions
Potential policy changes regarding federal government allocations, including health and social transfers and cost-sharing agreements, could affect the revenue forecast.
Crown Corporations
Crown corporations have provided their own forecasts. These forecasts, as well as their statements of assumptions, were used to prepare the fiscal plan. The boards of those corporations and agencies have also included these forecasts, along with further details on assumptions and risks, in the service plans being released with the budget.
SUCH Sector
Health authorities have submitted balanced financial plans for 2015/16 to 2017/18 based on policy assumptions provided by the Ministry of Health. These plans have been signed off by the board chairs of the respective health authorities. The Ministry of Health will continue to work with the health authorities to manage any emerging revenue and spending risks and spending pressures.
Forecasts for the universities, colleges, and institutions have been signed off by chairs of the board or audit committee and lead financial officers.
Forecasts for the combined school districts have been compiled by the Ministry of Education based on the requirements of the School Act, the current year plans developed by the school districts, and ministry policy assumptions respecting future funding allocations. Variances from these assumptions could impact the fiscal plan.
Spending
Government funds a number of demand-driven programs, including those delivered through third party delivery agencies, such as health care, K-12 and post-secondary education, income assistance, and community social services. The budgets for these programs reflect reasonable estimates of demand and other factors such as price inflation. If demand is higher than estimated, this will result in a spending pressure to be managed.
Budget and Fiscal Plan — 2015/16 to 2017/18
38
Three Year Fiscal Plan
The spending plans for the Ministry of Forests, Lands and Natural Resource Operations and the Ministry of Justice include base amounts to fight wildfires and deal with other emergencies such as floods. Unanticipated or unpredictable occurrences may affect expenses in these ministries.
Details on major assumptions and sensitivities resulting from changes to those assumptions are shown in Appendix Table A7 and in ministry service plans.
Contingencies Vote
The Contingencies vote is a prudent budgeting measure that protects the fiscal plan from unforeseen and unbudgeted costs that may arise as well as pressures for costs that are currently budgeted based on estimates whose final values are impacted by external events or prices.
Budget 2015 includes a Contingencies vote allocation of $350 million in 2015/16, increasing to $400 million in each of 2016/17 and 2017/18, respectively, to help manage unexpected costs and pressures and to fund priority initiatives.
Treaty Negotiations and the New Relationship
BC continues to negotiate treaties and incremental treaty agreements with a number of First Nations. While implementation and settlement costs associated with existing Final Agreements have been accounted for in the fiscal plan, the outcomes of other treaty negotiations and their ratification process would need to be managed within the fiscal plan.
Government is also committed to negotiating new revenue-sharing agreements and other reconciliation agreements with First Nations to streamline consultation on natural resource decisions, provide increased certainty for investors, and provide new economic opportunities to First Nations communities. Where agreements have been concluded, the costs of those agreements have been accounted for in the fiscal plan. Any future agreements will need to be accommodated within the fiscal plan.
The province is also involved in litigation with First Nations relating to aboriginal rights. Settlement of these issues, either in or out of court, may result in additional costs to government.
Capital Risks
The capital spending forecasts included in the fiscal plan may be affected by subsequent planning (i.e. design development) and procurement activities (i.e. receipt/review of bids) resulting in project costs that are higher than the initial approved budgets. For large projects, government will review the budget and scope risks, and the strategies to mitigate these risks.
Other risks impacting capital spending forecasts include:
· weather and geotechnical conditions, including the outcome of environmental impact studies, causing project delays and/or unexpected costs;
Budget and Fiscal Plan — 2015/16 to 2017/18
39
Three Year Fiscal Plan
· changes in market conditions, including service demand, the impact of inflation on building material costs, the availability of and wage rates for skilled workers, and borrowing costs;
· the accuracy of capital project budget and construction schedule forecasts;
· the successful negotiation/timing of cost-sharing agreements with the federal government and other funding partners; and
· the timing and outcomes of public-private sector partnership negotiations.
Pending Litigation
The spending plan for the Ministry of Justice contains provisions for payments under the Crown Proceeding Act based on estimates of expected claims, judgments, and related costs of settlements likely to be incurred. Litigation developments may occur that are beyond the assumptions used in the plan (for example, higher-than-expected volumes, or size of claim amounts and timing of judgments and settlements). These developments may affect government revenues and/or expenditures in other ministries.
There is a risk to the fiscal plan from the January 27, 2014 BC Supreme Court decision regarding government’s response, as per the Education Improvement Act, 2012, to a previous court ruling which had concluded that government had infringed on the freedom of association of BC Teachers Federation members when it legislated specific provisions out of the teachers’ contract back in 2002. The government is appealing the decision.
Write-downs and Other Adjustments
Ministry budgets provide for anticipated levels of asset or loan write-downs where estimates can be reasonably predicted. The overall spending forecast does not make allowance for extraordinary items other than the amount provided in the Contingencies vote.
Budget and Fiscal Plan — 2015/16 to 2017/18
40
Three Year Fiscal Plan
Managing Fair and Affordable Public Sector Compensation
The BC public sector employs approximately 388,000 people across seven sectors and spends about $25.7 billion on compensation, or over 57 per cent of the Province’s annual budget. Managing public sector compensation remains a key priority in sustaining the Province’s balanced budget and high credit rating.
Chart 1 Composition of public sector workforce

Update on 2014 Compensation Bargaining Mandate
In late 2013, the government established a 2014 Economic Stability Mandate (2014 Mandate), which applies to all provincial public sector employees whose collective agreements expired on or after December 31, 2013. Key elements of the 2014 Mandate include:
· 5-year agreements;
· modest 5.5 per cent total wage increase over the five-year term; and
· a potential for additional increases if growth in the B.C. economy exceeds the annual forecasts set by the Economic Forecast Council during the last four years of the agreement.
To date, the 2014 Mandate has remained on track and over 200,000 organized public sector employees are now covered by new tentative or ratified agreements under the mandate. This represents over two thirds of all provincial public sector unionized employees. Significant agreements reached in 2014 include:
· Public service — almost 25,000 employees working in core government ministries and agencies;
· Teachers — in September 2014, the British Columbia Public School Employers’ Association and the BC Teachers Federation reached a negotiated agreement that ended weeks of strike activity and nearly 43,000 teachers returned to classrooms;
· Doctors — approximately 10,000 doctors in BC have ratified a five-year agreement that respects the government’s compensation mandate and improves healthcare services for British Columbians;
· Colleges and universities — 14 colleges and universities in BC have reached agreements with nearly 11,000 unionized employees;
· Healthcare and social services employees — more than 90,000 healthcare and social services employees in various unions are now covered under ratified agreements;
· Education support staff — more than 33,000 support staff (approximately 97 per cent of the total education support staff workers in BC) have fully ratified agreements in place; and
· Crown corporations — more than 3,500 employees at six Crown corporations are now covered by ratified or tentative agreements.
Budget 2015 reflects government’s commitment to fund the 2014 Mandate and funding has been added to agency budgets as appropriate to implement required compensation changes. Additionally, the 2014 Mandate provides the
Budget and Fiscal Plan — 2015/16 to 2017/18
41
Three Year Fiscal Plan
potential for four additional general wage increases based on the performance of BC’s economy. The results of BC’s 2014 real GDP growth will be known in late 2015 and will determine the potential for the first Economic Stability Dividend being awarded in 2016. All collective agreements negotiated so far contain these opportunities.
Taxpayer Accountability Principles Guide Public Sector Compensation
In June 2014, government issued the new Taxpayer Accountability Principles. These principles strengthen accountability, promote cost control through appropriate compensation oversight, and help ensure that provincial public sector organizations operate in the best interest of taxpayers. They set standards for cost-consciousness, accountability, appropriate compensation, service, respect and integrity.
Government is providing additional information on accountability and executive compensation disclosure for all provincial public sector employers, board chairs and board members, and human resources staff. It will also work with provincial public sector organizations to build these principles into ongoing operations to help ensure the decisions they make reflect the priorities and values of government and its shareholders — the public.
Managing Compensation in the Public Sector
In July 2012, the government revised its policy on executive compensation in Crown corporations. Compensation for all Crown corporation executives is currently frozen. Where there were bonuses, they are being phased out and replaced with a non-pensionable holdback of up to 20 per cent tied to financial and business results.
In September 2012, government froze compensation for excluded management in the provincial public sector. However, the government recognizes that many of these employees have not had a wage increase since 2009, as well as the challenge public sector employers face in hiring or retaining staff.
In March 2014, excluded management employees in the core public service — except senior executives — received a one-time, three per cent wage increase. Although the increase was less than the increases provided to unionized public service employees, it recognized the past five years of no wage increases. This one-time increase was consistent with the findings of the BC Public Sector Compensation Review report which showed that comparable jobs in the broader public sector are generally paid higher than those in the core public service.
While the current compensation freeze remains in effect, the Public Sector Employers’ Council Secretariat is consulting with broader provincial public sector employers’ associations, individual employers and responsible ministries to further evaluate the effect of the freeze.
Since 2012, government has implemented a managed staffing approach to hiring in the core government public service. Prior to filling positions, each position is closely scrutinized to determine its necessity and to ensure it fits within allocated budgets for staffing. The effect of this measure is being managed by finding and implementing new ways to do business while maintaining or improving public services.
While these more disciplined staffing practices have only been put in place for core government, the broader provincial public sector — Crown corporations, schools, universities, colleges and health sector — is also expected to align with the principle of cost-consciousness in its staffing practices.
BC Public Sector Compensation Review
In September 2014, the government released the BC Public Sector Compensation Review. This report identified different compensation models across the BC public sector and showed a lack of alignment in compensation among government entities and between levels of government.
Budget and Fiscal Plan — 2015/16 to 2017/18
42
Three Year Fiscal Plan
The report shows that while both core government and the broader public sector have effectively held the line on compensation since 2009, there is considerable variability in compensation levels. As a result, this creates unnecessary competition between public sector employers and only drives costs up for public entities, and risks placing additional burdens on taxpayers and ratepayers.
Chart 2 Cumulative wage increases
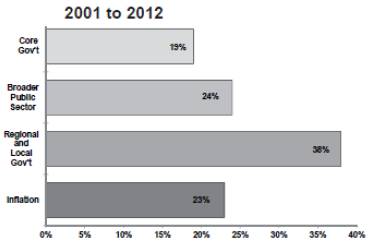
Source: BC Public Sector Compensation Review, 2014
The BC Public Sector Compensation Review report recommended the development of a more standardized compensation philosophy across the broader provincial public sector. Accordingly, the Public Sector Employers’ Council Secretariat is undertaking consultations that focus on collaborative ways government and public sector employers can share information to achieve the report’s recommendations. Before government and public sector boards and employers can consider general raises for their management staff, all need to ensure that the report recommendations are appropriately addressed and that such changes remain consistent with government’s broader commitment to manage public sector compensation costs in a way that balances fair and equitable compensation that is affordable to provincial taxpayers and ratepayers.
Collaboration with Local Government — A One-Taxpayer Approach to Affordability
The BC Public Sector Compensation Review indicated that local government compensation is generally not well aligned with the rest of the public sector.
With only one taxpayer funding multiple levels of government and important public services, the Province and local governments must collaborate to help ensure that public services remain affordable.
The provincial government is pursuing opportunities to work with the Union of BC Municipalities to address the principle of appropriate compensation in a local government context within the broader public sector, promote best practices, and help local government to deliver efficient, effective services for citizens.
The initial focus is on building reliable data to assist local governments to set appropriate compensation levels, and to make existing reporting of local government information more useful, transparent and accessible.
Budget and Fiscal Plan — 2015/16 to 2017/18
43
Three Year Fiscal Plan
Strengthening Our Relationship with First Nations:
British Columbia’s Response to the Tsilhqot’in Decision
A key priority of the Province is to foster economic development opportunities and create new jobs by continuing to support resource-based industries such as liquefied natural gas development, mining and forestry. First Nations, more than ever before, want to participate in BC’s growing economy and build healthy, prosperous communities. The Province and First Nations are working together to develop new, innovative strategies for lasting reconciliation aimed at supporting investment in BC while limiting environmental impacts.
Tsilhqot’in Nation versus BC
On June 26, 2014, the Supreme Court of Canada (SCC) awarded Aboriginal title to the Tsilhqot’in Nation for over 1,700 square kilometres of land in the Cariboo-Chilcotin region. The unanimous ruling is the first in Canada to recognize Aboriginal title. The legal process to arrive at a definitive ruling took many years of patience and commitment from the Tsilhqot’in, a nation of six Aboriginal communities comprised of 3,000 people. What makes the SCC decision significant is its rejection of the definition of Aboriginal title as being only site specific. Instead, the court considered how generations of semi-nomadic people used lands and resources through broad tracts of land.
The SCC’s interpretation of Aboriginal title has given the Tsilhqot’in the right to control the land within their title area. This decision has clarified the nature of Aboriginal title, including the First Nations’ ‘ownership’ rights within title areas. The ruling reminds us of the need for the Province and First Nations to work together to negotiate and reach consensus when possible on matters involving Aboriginal rights and title rather than go through the courts. Working through the legal system for decisions on Aboriginal rights and title can be very slow and expensive for both parties; therefore the Province encourages negotiations rather than litigation whenever possible.
Next Steps with the Tsilhqot’in Nation
The Tsilhqot’in people want what all British Columbians want — a prosperous economy and healthy environment that help our communities and families thrive. The Province is working in partnership with the Tsilhqot’in on a framework for reconciliation following the decision. In September 2014, the provincial government and the Tsilhqot’in National Government signed a Letter of Understanding to develop a lasting Protocol Agreement between the two governments. This agreement will outline how the parties will work together to create a shared vision for the future. The process will take time but the intent is to bring the many aspects of the SCC decision to life in a meaningful and mutually-beneficial way.
Although there is still much work to be done, there have been some important successes. For instance, part of our commitment included a long awaited apology to the Tsilhqot’in people for the wrongful hangings of six Tsilhqot’in chiefs following the Chilcotin War; it also included attending the 150th commemoration of the war and meeting with the Tsilhqot’in community members on their new title lands. Success takes time but an early measure is the new level of trust that has been built between the Tsilhqot’in and the Province during these important conversations.
British Columbia’s All Chief’s Meeting
On September 11, 2014, the Premier, Cabinet and First Nations leaders across the province held an historic meeting — the All Chiefs Gathering, which allowed direct discussion among key decision makers. The tone of the meeting was positive and it achieved momentum in moving forward the dialogue on a number of important topics such as land and resource management, resource revenue sharing, social policy, and continuing to build strong business partnerships with First Nations. At the meeting, the province affirmed that the Tsilhqot’in decision offers a new opportunity for First Nations and government to come
Budget and Fiscal Plan — 2015/16 to 2017/18
44
Three Year Fiscal Plan
together with a common vision that will bring economic prosperity to First Nations and all British Columbians. There was also a commitment to hold regular annual meetings. The next meeting will likely be held in the fall of 2015.
Benefits Sharing with First Nations
Reconciliation requires government to listen and respond to the particular priorities of specific First Nations, government agencies and the business community. A broad range of agreement types contribute to achieving reconciliation and creating economic opportunities for First Nations. These include: treaties, strategic engagement agreements, economic and community development agreements, reconciliation agreements, revenue-sharing agreements, atmospheric benefit-sharing agreements, amongst others.
The Province and First Nations understand benefit-sharing is our path to partnership. The agreements the Province reaches with First Nations also provide industry with the certainty needed to make investment decisions. British Columbia is the first province in Canada to share provincial revenue from mining, forestry and clean energy projects with First Nations. In the past four years, government has signed more than 200 revenue-sharing agreements with First Nations. In the last few months, we have also signed 11 pipeline benefit agreements with 19 First Nations related to LNG development.
Mining Revenue Sharing
Economic and Community Development Agreements share revenue from new mines and major mine expansions. In 2014/15 alone, $12 million in mining revenue flowed to 19 First Nations through mineral royalties. The agreements cover 13 out of the 18 productive metals and coal mines in BC.
Forestry Revenue Sharing
Forest Consultation and Revenue Sharing Agreements (FCRSA) provide First Nations with economic benefits that return directly to their communities based on harvest activities in their traditional territory. Since 2003, 177 First Nations (87 per cent of the 203 First Nations in BC) have signed forestry agreements with BC. The agreements have provided $369 million in revenue sharing and access to 130 million m3 of timber. As of September 2014, 138 First Nations have an active FCRSA, representing 76 per cent of First Nations eligible for an agreement under the program.
Revenue Sharing on BC’s emerging Liquefied Natural Gas (LNG) Sector
The Province’s priority is to provide the certainty required to create a new LNG industry — and ensure First Nations can share in the benefits. The Province is actively engaged in negotiations with First Nations and has already announced 11 natural gas pipeline agreements which provide initial one-time payments totaling close to $5.1 million for local First Nations on projects such as TransCanada’s proposed Prince Rupert Gas Transmission, Coastal GasLink pipeline projects, and Spectra Energy’s Westcoast Connector Gas Transmission pipeline.
In addition to these pipeline agreements, the Province has signed revenue-sharing agreements with the Lax Kw’alaams and Metlakatla First Nations to share a portion of provincial government revenues from Sole Proponent Agreements related to the Grassy Point lands, and proponents Aurora LNG and Woodside.
What next?
BC wants to take the opportunity presented by the Supreme Court of Canada decision on Tsilhqot’in to advance a fresh approach to achieving reconciliation and enhancing relationships with First Nations. The Province is open to new, innovative ideas with respect to how land and resource decisions are made and First Nations’ rights and title are accommodated. This reconciliation process is a profound opportunity to build a stronger relationship and develop a renewed vision of First Nations as partners in the economic, political and social future of British Columbia. The Province has taken the SCC decision seriously with the goal to ensure First Nations become full, willing partners in BC’s economy.
Budget and Fiscal Plan — 2015/16 to 2017/18
45
Three Year Fiscal Plan
A Pan-Canadian “Renminbi Hub”
The Importance of the Renminbi (RMB)
China is now the second largest economy in the world and the largest trading nation. As well, China’s currency — the Renminbi — is now the fifth-largest global -currency in terms of value of payments.
When businesses trade internationally, the currencies involved must be converted to execute the transactions.
Traditionally, the RMB has not been easily or freely convertible to other currencies. For Canadian businesses trading with China, currency conversions have generally been made into US dollars, and then from US dollars into RMB — doubling exchange rate commission costs.
British Columbia has seen the value of its exports to China rise to represent almost 18 per cent of BC’s total exports — a significant increase from 4 per cent only a decade ago. That is why measures to reduce transaction costs will facilitate and improve Canadian and BC trade with China.
BC’s entry into the RMB currency market
Governments and corporations often borrow money by issuing bonds. In November 2013, British Columbia was the first foreign government to issue a bond denominated in China’s Renminbi — the bond raised RMB 2.5 billion (Cdn $428 million equivalent). A second BC issue was launched in late 2014, raising RMB 3 billion (Cdn $559 million equivalent). BC is now the largest foreign government issuer in this market along with the United Kingdom.
In addition to expanding our market for borrowed funds, the bond issues raise the Province’s profile in Asia Pacific financial markets, recognize the internationalization of the RMB, and enhance the trade linkages and relationships between BC and China.
The Significance of RMB Transactions for Business and Investment
The advantages of RMB denominated-trade for BC and Canadian businesses trading with China are significant. A recent study by the Canadian Chamber of Commerce estimated that allowing direct trade in RMB could save Canadian firms up to $6.2 billion over 10 years by reducing transaction costs, and increase exports in the range of $21—$32 billion, and BC would share significantly in these gains.
Significant advantages to the forest industry in particular are likely because it is an industry with highly competitive prices in which the use of RMB could make a significant cost difference in a competitive bid situation. Moreover, Chinese firms express a strong preference for use of their local currency.
To illustrate, consider a significant representative forest company in BC that would export to China, for example, $250 million per year in wood products. Applying HSBC Bank’s expectation that, on average, exporters who trade in RMB derive benefits in the order of 3 per cent, there is potential for additional revenues to this forest company of about $8 million, plus the benefits that can be afforded from a stronger business relationship.
A 3 per cent benefit on the $1.8 billion of wood product sales to China in 2014 would equal $54 million, money that can be usefully put to work by industry to be more productive and competitive.
The Next Step: An RMB Hub in Canada
A currency “hub” is essentially a clearing house for the exchange or conversions of foreign currencies into one another. A modern hub is not necessarily conceived of as a physical location, but more as a computerized trading platform which is managed by private sector financial institutions and which facilitates such transactions quickly and efficiently.
Budget and Fiscal Plan — 2015/16 to 2017/18
46
Three Year Fiscal Plan
This past fall, Canada was designated as an international RMB trading hub — one of only 10 in the world and the first in North America. The BC government collaborated extensively with the federal and Ontario governments, as well as the private sector, to support the designation.
Creation of the hub recognizes the international importance of the RMB and its increasing use in international trade. Designation of Canada as an international RMB trading hub plays to BC’s strength as the Canadian province that trades most with China.
Since early 2014, the governments of BC and Ontario, with the support of the Canadian government along with private sector partners such as Advantage BC and the Toronto Financial Services Alliance, have been working to bring an RMB hub to this country — now we have succeeded.
On November 8, 2014, a memorandum of understanding between the Bank of Canada and the People’s Bank of China was signed, which will establish Canada as North America’s first offshore RMB hub. The agreement has the full support of the governments of BC and Ontario. The Hub will offer opportunities for businesses across Canada to undertake RMB-denominated trade, investment and banking. It will also allow Canadian asset managers to purchase, on behalf of their clients, RMB-denominated bonds and equities from Mainland China.
The government intends to coordinate and actively work to promote the use of the hub by the business community over the coming year, and will collaborate with the federal and Ontario governments, as well as industry. The first priority will be to promote the benefits which can flow to Canadian business from RMB-denominated trade and investment. This will require active marketing and education, and the government has set aside a modest budget to support these efforts in British Columbia including sponsorship of key business forums and workshops on how to recognize the economic opportunity and realize it through contractual arrangements with Chinese firms.
Budget and Fiscal Plan — 2015/16 to 2017/18
47
Three Year Fiscal Plan
Opportunities for British Columbia
Liquefied Natural Gas — Update
British Columbia continues to meet its commitment to realize the potential for liquefied natural gas development. In the fall of 2014 British Columbia met its commitment to put in place a competitive liquefied natural gas (LNG) income tax as well as world leading greenhouse gas requirements for LNG facilities. Over the last year, the Province has also advanced agreements with First Nations and granted multiple provincial environmental assessment certificates that will help to bring a nascent LNG industry to British Columbia.
LNG Income Tax
In Budget 2014, the Province committed to develop and implement all elements of a competitive tax and policy environment to assist with LNG development in the Province and to introduce an income tax applicable to the LNG industry in the fall of 2014.
As part of Budget 2014, government also committed to introduce the key components of the legislation in the fall of 2014 while other components of the legislation such as the administrative and enforcement provisions were planned for introduction in spring of 2015.
At that time, the LNG Income Tax was intended to be a two rate income tax with a lower rate of 1.5 per cent and a higher rate of up to 7 per cent. The Province committed to review the higher tax rate and specific tax features based on global and local economic conditions to ensure that British Columbia remained competitive.
Based on changing economic conditions and consultation with industry, the Province made the decision to set the higher tax rate at 3.5 per cent (rising to 5 per cent in 2037) and to introduce a Natural Gas Tax Credit under the Income Tax Act.
On October 21, 2014, the Liquefied Natural Gas Income Tax Act (which included an amendment to the British Columbia Income Tax Act to create the Natural Gas Tax Credit) was introduced in the Legislature.
At that time the industry indicated that it was pleased to have certainty on a final British Columbia LNG tax framework.
The LNG Income Tax, which received Royal Assent on November 27, 2014, is effective for taxation years starting in 2017. It imposes a 3.5 per cent tax on net income from liquefaction activities at an LNG facility in British Columbia. This rate rises to 5 per cent in 2037. While a taxpayer is recovering its operating losses and capital investments, the tax rate on net income does not apply. Instead, a 1.5 per cent tax applies to net operating income. Tax at the 1.5 per cent rate is creditable against tax at the higher rate.
The Natural Gas Tax Credit applies to a corporation that is an LNG taxpayer with a permanent establishment in British Columbia. The non-refundable credit is based on the cost under the LNG Income Tax Act of natural gas at the LNG facility inlet. Unused credits earned in a taxation year can be carried forward.
Legislation setting out other components of the legislation including the administration and enforcement provisions of the LNG Income Tax will be introduced in the spring of 2015.
While government continues to meet its LNG commitments and has set the foundation to provide industry with the certainty it needs in evaluating the provincial LNG tax framework, deteriorating global economic conditions in the oil and gas sector may affect the timing of final investment decisions.
Budget and Fiscal Plan — 2015/16 to 2017/18
48
Three Year Fiscal Plan
Greenhouse Gas
The Greenhouse Gas Industrial Reporting and Control Act received Royal Assent on November 27, 2014 creating a benchmark that will establish British Columbia’s LNG facilities as the cleanest in the world. As well, an LNG Environmental Incentive Program was introduced to provide a pro-rated incentive to facilities as they work toward achieving the established benchmark.
First Nations
The Province is also continuing its consultations with First Nations and local governments as well as with the federal government, as each of them have an important role in the province’s LNG future. Multiple agreements have now been signed ensuring that First Nations communities along pipeline routes will benefit economically.
Environmental Assessment
The Province has high expectations that industrial projects must be responsibly developed and safely operated in this province. This is addressed within the BC Environmental Assessment and permitting processes. To date provincial environmental assessment certificates have been issued for six LNG projects — two export facilities and four natural gas pipelines — with others under review. This is a clear sign of progress in this emerging industry for British Columbia.
Budget and Fiscal Plan — 2015/16 to 2017/18
49
Three Year Fiscal Plan
Strategic Debt Management
Introduction
In Budget 2014, government outlined its strategy for debt management with the intent of maintaining its AAA credit rating. The strategy’s goals were a continuing decline in the taxpayer-supported debt to GDP ratio and an overall reduction in the level of borrowing, and combined a comprehensive borrowing program with balance sheet management.
Integral to the comprehensive borrowing strategy is the diversification of borrowing sources among the internal capital markets, and in particular, expansion of the number of available capital markets through the establishment of a renminbi trading hub in British Columbia. More information on the renminbi hub can be found in the topic box on page 46.
Balance sheet management involves the review of existing cash balances across all government organizations to identify amounts not required for ongoing operational needs. Government organizations holding surplus cash balances placed them on deposit with the Provincial Treasury rather than their local bank, thereby enabling government to use the cash for debt management purposes until needed by the agencies.
In addition to the surplus cash strategy, government looked at its investment portfolio to identify areas where it made more sense for government to invest in its own bonds rather than the external financial markets, or where a return of equity to government was warranted. Balance sheet management, operating surpluses and capital spending constraints ensure debt affordability, especially in relation to taxpayer-supported debt.
Developments during 2014/15
Since Budget 2014, government has achieved considerable success with its debt management strategy. Taxpayer-supported debt at the end of 2013/14 was $703 million lower than the projection for that year in Budget 2014, almost entirely due to reductions in direct operating debt resulting from balance sheet management. The lower debt resulted in a 0.3 percentage point reduction in the debt to GDP ratio.
The 2013/14 debt improvement carried forward into 2014/15, and was augmented by the cash impacts from the projected higher surplus and lower than anticipated capital spending in 2014/15. These improvements will be partially offset by borrowing in late March for early April financing requirements; nonetheless, overall taxpayer-supported debt is projected to be $773 million lower by the end of 2014/15 than the projection in Budget 2014.
While the above improvements in taxpayer-supported debt levels and debt to GDP ratio support government maintaining its AAA credit rating, rating agencies also monitor another metric — debt to revenue — when determining credit ratings. During 2014/15, government began monitoring its taxpayer-supported debt to revenue ratios more closely and has adopted a declining trend in this ratio as a second metric for gauging the affordability of its debt.
As well, while the current forecast for direct operating debt at the end of 2014/15 is lower than the projection in Budget 2014, at $9.4 billion it is still considerably higher than the $5.7 billion balance at the end of 2008/09. The series of four deficits from 2009/10 to 2012/13 increased direct operating debt by $4.5 billion. Improvements in 2014/15 will repay a portion of this borrowing, but government is committed to repaying the remainder of this increase and resuming its program of eliminating this type of debt.
Budget 2015 Debt Management Initiatives
Balance sheet management continues to be an important facet of strategic debt management. In addition to the $2.6 billion impact identified in Budget 2014, government has identified a further $800 million of cash resources that will be applied to debt reduction.
Budget and Fiscal Plan — 2015/16 to 2017/18
50
Three Year Fiscal Plan
Change in taxpayer-supported debt
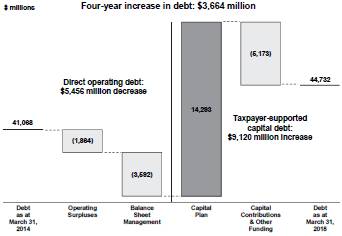
Operating surpluses from 2014/15 to 2017/18 are projected to total $1.9 billion, even after allocations to operating expense for wage settlements and caseload increases. These surpluses combined with balance sheet management are projected to reduce direct operating debt to $4.8 billion, well below 2008/09 levels, eliminating the impact of the deficits incurred as a result of the economic downturn.
As well, government has maintained its taxpayer-supported capital plan at $14.3 billion over the four year period by revisiting existing project schedules and planned spending as necessary to ensure the capital program remains affordable. Overall, government has limited the projected four-year increase in taxpayer-supported debt to $3.7 billion.
Debt to GDP Budget 2015 to Budget 2014 comparison
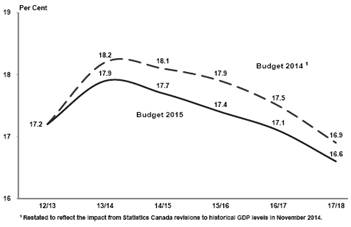
On average, the debt to GDP ratio track in Budget 2015 is 0.4 percentage points lower in each year compared to the same track in Budget 2014. Just as significant, the debt to revenue track also has assumed a downward trend, with 2013/14 being the pivot year for both ratios. The 3.2 percentage point decrease in the debt to revenue ratio in 2017/18 compared to Budget 2014 represents a $1.5 billion improvement in this metric, primarily due to reductions in projected borrowing.
Debt to Revenue Budget 2015 to Budget 2014 comparison
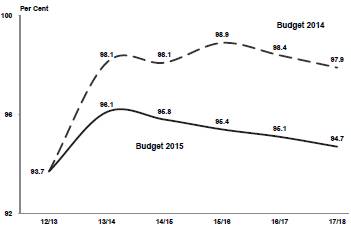
Summary
Government’s debt management strategy, combining balance sheet management with applying operating surpluses to the reduction of direct operating debt and controlling capital spending, has resulted in significant improvement in its debt metrics. However, more remains to be done.
A third metric to be addressed in future debt management is the level of taxpayer-supported debt itself. Ultimately, government’s intent is to halt the growth of debt and begin paying it down. Realization of this goal is dependent on a number of factors, including the impact of future economic growth on existing revenue sources, ongoing management of future operating cost increases, and further development of an affordable capital plan.
Budget and Fiscal Plan — 2015/16 to 2017/18
51
Part 2: TAX MEASURES
Table 2.1 Summary of Tax Measures
| | | | Taxpayer Impacts | |
| | Effective Date | | 2015/16 | | 2016/17 | |
| | | | ($ millions) | |
Income Tax Act | | | | | | | |
· Enhance BC tax reduction credit | | January 1, 2015 | | (5 | ) | (5 | ) |
· Introduce children’s fitness equipment credit | | January 1, 2015 | | (3 | ) | (3 | ) |
· Introduce BC education coaching tax credit | | January 1, 2015 | | * | | * | |
· Extend BC training tax credit | | January 1, 2015 | | (31 | ) | (31 | ) |
· Extend BC mining flow-through share tax credit | | January 1, 2015 | | (4 | ) | (1 | ) |
· Extend BC interactive digital media tax credit | | Royal Assent | | (50 | ) | (50 | ) |
· Expand digital animation or visual effects tax credit | | March 1, 2015 | | (2 | ) | (2 | ) |
Medicare Protection Act | | | | | | | |
· Increase Medical Services Plan premiums and enhance premium assistance | | January 1, 2016 | | 24 | | 96 | |
Mineral Tax Act | | | | | | | |
· Extend new mine allowance | | Regulation | | — | | — | |
Small Business Venture Capital Act | | | | | | | |
· Increase equity tax credit budget | | Regulation | | (3 | ) | — | |
Carbon Tax Act and Motor Fuel Tax Act | | | | | | | |
· Further streamline obligations related to fuel imported by ship | | Royal Assent | | * | | * | |
Motor Fuel Tax Act | | | | | | | |
· Extend due date for natural gas returns | | Regulation | | * | | * | |
· Expand authorized use of coloured fuel | | July 1, 2015 | | * | | * | |
· Enhance obligations related to coloured fuel | | July 1, 2015 | | * | | * | |
· Impose additional penalty for the unauthorized use of coloured fuel | | Regulation | | * | | * | |
Provincial Sales Tax Act | | | | | | | |
· Clarify taxation of tangible personal property used to make other tangible personal property | | February 18, 2015 | | * | | * | |
· Provide exemption for lift chairs sold on prescription | | February 18, 2015 | | * | | * | |
· Clarify multijurisdictional vehicle tax | | January 1, 2015 | | * | | * | |
· Extend registration obligations | | September 1, 2015 | | * | | * | |
· Increase maximum tax rate for Municipal and Regional District Tax Program 1 | | Royal Assent | | — | | — | |
Tobacco Tax Act | | | | | | | |
· Clarify security scheme | | Various | | * | | * | |
Home Owner Grant Act | | | | | | | |
· Maintain threshold for home owner grant phase-out | | 2015 tax year | | 6 | | 6 | |
School Act | | | | | | | |
· Set provincial residential school property tax rates | | 2015 tax year | | * | | * | |
· Set provincial non-residential school property tax rates | | 2015 tax year | | * | | * | |
Taxation (Rural Area) Act | | | | | | | |
· Set provincial rural area property tax rates | | 2015 tax year | | * | | * | |
Total | | | | (68 | ) | 10 | |
* Denotes measures that have no material impact on taxpayers.
1 There is no provincial impact. The Municipal and Regional District Tax Program is a tax payable to municipalities, regional districts and eligible entities on the purchase of accommodation in designated accommodation areas; the Province acts as agent.
Budget and Fiscal Plan — 2015/16 to 2017/18
Tax Measures
Tax Measures — Supplementary Information
For more details on tax changes see:
www.gov.bc.ca/budgettaxchanges
Income Tax Act
BC Tax Reduction Credit Enhanced
Effective for the 2015 tax year, the BC tax reduction credit is increased from $412 to $432 and the credit phase-out threshold is increased from $18,327 to $19,000. The credit phase-out rate is also increased from 3.2 per cent to 3.5 per cent of net income.
The enhancement increases the amount of income an individual can earn before they start paying provincial income tax, benefiting about 500,000 taxpayers.
Children’s Fitness Equipment Credit Introduced
Effective for the 2015 tax year, a new non-refundable children’s fitness equipment credit is introduced.
Parents can already claim the BC children’s fitness credit in respect of registration fees paid for a child’s participation in an eligible program of physical activity. With this budget, a parent can now claim an additional credit in respect of fitness equipment purchased for the child. The new credit is calculated as 50 per cent of the existing BC children’s fitness credit amount claimed. Parents are not required to keep receipts for equipment purchases. The credit provides a benefit of up to $12.65 per child.
BC Education Coaching Tax Credit Introduced
Effective for the 2015 tax year, a new non-refundable BC education coaching tax credit is introduced. The tax credit is available to teachers and teaching assistants who carry out at least ten hours of extracurricular coaching activity in the tax year.
The credit amount is $500, providing a tax benefit of up to $25.30 per eligible taxpayer. The credit is available for the 2015, 2016 and 2017 tax years, at which time the credit will be reviewed.
BC Training Tax Credits Extended
As announced on December 30, 2014, the BC training tax credits are extended for an additional three years to the end of 2017.
BC Mining Flow-Through Share Tax Credit Extended
The BC mining flow-through share tax credit is extended to the end of 2015.
BC Interactive Digital Media Tax Credit Extended
The BC interactive digital media tax credit is extended for an additional three years to August 31, 2018.
Budget and Fiscal Plan — 2015/16 to 2017/18
54
Tax Measures
Digital Animation or Visual Effects Tax Credit Expanded
The digital animation or visual effects (DAVE) tax credit is expanded to include eligible post-production activities. The credit will apply to eligible post-production expenditures and will be available for productions where principal photography begins on or after March 1, 2015.
Medicare Protection Act
Medical Services Plan Premiums Increased and Premium Assistance Enhanced
Effective January 1, 2016, Medical Services Plan premiums are increased to help fund health care for British Columbians.
Maximum monthly premium rates will increase by about four per cent or by $3.00 per month to a total of $75.00 for single persons, $5.50 per month to a total of $136.00 for two person families and $6.00 per month to a total of $150.00 for families of three or more persons.
Also effective January 1, 2016, premium assistance is enhanced to ensure those receiving assistance will not be affected by the increase. Further details on the premium assistance enhancement will be available later in 2015.
Mineral Tax Act
New Mine Allowance Extended
The new mine allowance is extended for four years to December 31, 2019.
Small Business Venture Capital Act
Equity Tax Credit Budget Increased
The budget for the small business venture capital tax credit is increased by $3 million for direct investments in eligible new corporations, allowing for up to $10 million in additional equity financing for qualifying new corporations in 2015.
This effectively continues the $3 million budget for eligible new corporations, which expired at the end of 2014.
Carbon Tax Act and Motor Fuel Tax Act
Obligations Related to Fuel Imported by Ship Further Streamlined
Building on the amendments made in Budget 2012, the obligations of collectors, retail dealers and purchasers for fuel imported by ship into British Columbia are amended to further streamline the compliance burden on importers.
Budget and Fiscal Plan — 2015/16 to 2017/18
55
Tax Measures
Motor Fuel Tax Act
Due Date for Natural Gas Returns Extended
The due date for natural gas returns in respect of tax payable on natural gas used in a stationary internal combustion engine during a month is moved from the 15th day of the following month to the last day of the following month.
Authorized Use of Coloured Fuel Expanded
Coloured fuel may only be purchased and used for a specifically authorized purpose. Effective July 1, 2015, use of coloured fuel to operate a locomotive is an authorized coloured fuel purpose.
Obligations Related to Coloured Fuel Enhanced
Effective July 1, 2015, a purchaser of coloured fuel in certain circumstances who fails to provide a declaration, at or before the time of the sale, that the fuel will be used for an authorized coloured fuel purpose, is required to pay the tax that would have been payable on the fuel if it had not been coloured fuel.
A purchaser may be eligible for a refund of the difference between the tax paid and the tax payable on coloured fuel, if they demonstrate the fuel was used for an authorized coloured fuel purpose.
Refunds of security for deputy collectors and retail dealers in respect of coloured fuel are also clarified.
Additional Penalty for the Unauthorized Use of Coloured Fuel Imposed
A person who purchases or uses coloured fuel for an unauthorized purpose may be subject to a penalty equal to the greater of the current penalty of three times the tax that would have been payable on the fuel if it had not been coloured, or a new fixed amount penalty not to exceed $1,000.
Provincial Sales Tax Act
Taxation of Tangible Personal Property Used to Make Other Tangible Personal Property Clarified
Effective February 18, 2015, the use of tangible personal property includes using tangible personal property that is brought, sent or delivered into British Columbia to make other tangible personal property that is then transported outside of British Columbia for the purpose of fulfilling a contract for improvements to real property situated outside of British Columbia. This ensures the same tax treatment for tangible personal property used to make other tangible personal property that is used for the purpose of fulfilling a contract for improvements to real property regardless of whether the tangible personal property is purchased in British Columbia or brought, sent or delivered into British Columbia.
Budget and Fiscal Plan — 2015/16 to 2017/18
56
Tax Measures
A refund of tax will be provided for tax paid on tangible personal property purchased in British Columbia or brought, sent or delivered into British Columbia that is used to make other tangible personal property that is then transported outside of British Columbia for the purpose of fulfilling a contract for improvements to real property situated outside of British Columbia, if sales tax is paid under the laws of another jurisdiction in respect of the other tangible personal property and there is no eligibility for a refund, credit or rebate.
Exemption for Lift Chairs Sold on Prescription Provided
Effective February 18, 2015, lift chairs designed to facilitate standing up or sitting down are exempt from provincial sales tax if the lift chair is sold on the prescription of a practitioner.
Multijurisdictional Vehicle Tax Clarified
Consistent with full reciprocity under the International Registration Plan, the tax payable on multijurisdictional vehicles licensed on or after January 1, 2015, will be calculated using a set travel ratio for each jurisdiction for new fleets and the actual travel ratio for existing fleets.
Registration Obligations Extended
Effective September 1, 2015, a person located outside of British Columbia that in the ordinary course of business:
· accepts orders for tangible personal property from a location in British Columbia;
· sells or provides tangible personal property to a person in British Columbia; and
· holds that tangible personal property in inventory in British Columbia at the time it is sold;
must be registered for the purposes of levying, collecting and remitting provincial sales tax at the time of the sale.
Voluntary registrations will be accepted before September 1, 2015, and a person may be subject to failure-to-register penalties if they are not registered as required on or after September 1, 2015.
Maximum Tax Rate for Municipal and Regional District Tax Program Increased
The Municipal and Regional District Tax Program imposes tax on the purchase of accommodation in designated accommodation areas to raise revenue for municipalities, regional districts and eligible entities primarily for local tourism marketing, programs and projects.
The maximum tax rate on the purchase of accommodation under the Municipal and Regional District Tax Program that may be imposed in a designated accommodation area is increased from two per cent to three per cent of the purchase price of accommodation.
Budget and Fiscal Plan — 2015/16 to 2017/18
57
Tax Measures
Municipalities, regional districts and eligible entities will be required to request the government increase the tax rate in their designated accommodation area and details of the application requirements will be made available later in 2015.
Purchasers of accommodation in a designated accommodation area who have received written confirmation of reservation, entered into a written contract for accommodation or paid a deposit, for a specified number of days of accommodation before the effective date of a tax rate increase, may be entitled to a refund of the difference between the tax paid and the tax that would have been payable if the tax rate had not increased.
Tobacco Tax Act
Security Scheme Clarified
Effective February 18, 2015, security is payable on tobacco that a wholesale dealer has brought or sent into British Columbia.
The Tobacco Tax Act is further amended to clarify the application of the security scheme for wholesale and retail dealers.
Home Owner Grant Act
Threshold for Home Owner Grant Phase-out Maintained
The threshold for the phase-out of the home owner grant is maintained at $1,100,000 for the 2015 tax year. For properties valued above the threshold, the grant is reduced by $5 for every $1,000 of assessed value in excess of the threshold.
This year, 93 per cent of homes are below the threshold.
School Act
Provincial Residential School Property Tax Rates Set
The longstanding rate-setting policy is that average residential school property taxes, before application of the home owner grant, increase by the previous year’s provincial inflation rate. This rate-setting policy has been in place since 2003 and will continue in 2015. The rates will be set when revised assessment roll data are available in the spring.
Provincial Non-Residential School Property Tax Rates Set
A single province-wide school tax rate is set for each of the non-residential property classes. Consistent with longstanding policy, the rates for 2015, except the rate for the industrial property classes, will be set so that non-residential school tax revenue will increase by inflation plus new construction. This general approach to setting non-residential school tax rates has been in place since 2005. The rates will be set when revised assessment roll data are available in the spring.
The major industry class tax rate and the light industry class tax rate will be set at the same rate as the business class tax rate, consistent with the policy announced in Budget 2008.
Budget and Fiscal Plan — 2015/16 to 2017/18
58
Tax Measures
Taxation (Rural Area) Act
Provincial Rural Area Property Tax Rates Set
A single rural area residential property tax rate applies province-wide. The longstanding rate-setting policy that average residential rural property taxes increase by the previous year’s provincial inflation rate will continue for 2015.
Consistent with longstanding policy, non-residential rural area property tax rates will be set so that total non-residential rural area tax revenue will increase by inflation plus new construction. The rates will be set when revised assessment roll data are available in the spring.
Budget and Fiscal Plan — 2015/16 to 2017/18
59
Tax Measures
Carbon Tax Report and Plan
As required under Part 2 of the Carbon Tax Act, the following tables show the Revenue Neutral Carbon Tax Report for 2013/14 and 2014/15 and the Revenue Neutral Carbon Tax Plan for 2015/16 to 2017/18.
Material Assumptions and Policy Decisions
In the Report and the Plan the estimates and forecasts of carbon tax revenue and the cost of tax reductions to return revenues to taxpayers are consistent with, and have the same material assumptions and policy decisions underlying them, as the revenue estimates and forecasts prepared for Budget 2015. The only material assumption specific to the Revenue Neutral Carbon Tax Report and Plan is that the cost of the revenue reductions due to personal income tax rate cuts increase with increases in personal income tax revenues for each year.
Revenue Neutral Carbon Tax Report
Revenue neutrality means that tax reductions must be provided that fully return the estimated revenue from the carbon tax to taxpayers in each fiscal year. Table 1, Revenue Neutral Carbon Tax Report for 2013/14 and 2014/15, reports the carbon tax revenues
Table 1 Revenue Neutral Carbon Tax Report 2013/14 and 2014/15
| | | | Revised | |
| | | | Forecast | |
| | 2013/14 1 | | 2014/15 | |
| | $ millions | |
Carbon tax revenue 2 | | 1,222 | | 1,240 | |
Reduction in provincial revenues due to designated measures 3 | | | | | |
Personal tax measures: | | | | | |
· Low income climate action tax credit of $115.50 per adult plus $34.50 per child effective July 1, 2011 | | (194 | ) | (193 | ) |
· Reduction of 5% in the first two personal income tax rates | | (237 | ) | (269 | ) |
· Northern and rural home owner benefit of $200 4 | | (69 | ) | (71 | ) |
· BC seniors’ home renovation tax credit | | — | | — | |
· Children’s fitness credit and children’s arts credit | | (8 | ) | (8 | ) |
· Small business venture capital tax credit budget increased | | (3 | ) | (3 | ) |
· Training tax credit extended - individuals | | (11 | ) | (9 | ) |
Total personal tax measures | | (522 | ) | (553 | ) |
Business tax measures: | | | | | |
· General corporate income tax rate reduced from 12% to 11% effective July 1, 2008, to 10.5% effective January 1, 2010, to 10% effective January 1, 2011 and increased to 11% effective April 1, 2013 | | (200 | ) | (229 | ) |
· Small business corporate income tax rate reduced from 4.5% to 3.5% effective July 1, 2008 and to 2.5% effective December 1, 2008 | | (220 | ) | (216 | ) |
· Corporate income tax small business threshold increased from $400,000 to $500,000 | | (20 | ) | (21 | ) |
· Industrial property tax credit of 60% of school property taxes payable by major industry | | (23 | ) | (23 | ) |
· Industrial property tax credit for school property taxes payable by light industry partially phased out effective January 1, 2013 and eliminated effective January 1, 2014 | | (20 | ) | — | |
· School property taxes reduced by 50% for land classified as “farm” | | (2 | ) | (2 | ) |
· Interactive digital media tax credit | | (63 | ) | (37 | ) |
· Training tax credit extended - businesses | | (8 | ) | (6 | ) |
· Scientific research and experimental development tax credit extended in 2014 | | — | | (82 | ) |
· Film incentive BC tax credit extended in 2009 and enhanced in 2010 | | (88 | ) | (78 | ) |
· Production services tax credit extended in 2009 and enhanced in 2010 5 | | (66 | ) | (198 | ) |
Total business tax measures | | (710 | ) | (892 | ) |
Total designated revenue measures | | (1,232 | ) | (1,445 | ) |
1 Based on 2013/14 Public Accounts.
2 The carbon tax applies to fuels and combustibles at rates based on the CO2 equivalent emission of each particular fuel or combustible at $30 per tonne.
3 Designated measures are measures designated to return carbon tax to taxpayers. Designated measures for 2013/14 are set out in the Carbon Tax Plan presented with June Budget Update 2013 and designated measures for 2014/15 are set out in the Carbon Tax Plan presented with Budget 2014.
4 Eligible homeowners are those in areas outside the Capital, Greater Vancouver and Fraser Valley regional districts.
5 For 2013/14, the cost of the extension and enhancement to the production services tax credit is about $79 million. In the table, only a portion of the 2013/14 cost is designated.
Budget and Fiscal Plan — 2015/16 to 2017/18
60
Tax Measures
and the cost of the tax reductions for the 2013/14 and 2014/15 fiscal years. For the 2013/14 fiscal year, this report is based on the 2013/14 Public Accounts. For the 2014/15 fiscal year, this report is based on preliminary actuals for the fiscal year.
Carbon tax revenues for 2013/14 are $1,222 million. The tax reductions for 2013/14 are those that were designated in the Revenue Neutral Carbon Tax Plan presented with June Update 2013. The personal tax measures are the BC Low Income Climate Action Tax Credit, the five per cent reductions in rates for the first two tax brackets, the Northern and Rural Home Owner Benefit, the BC Seniors’ Home Renovation Tax Credit, the Children’s Fitness Credit and Children’s Arts Credit, the increase in the small business venture capital tax credit, and the extension of the training tax credits for individuals. The business tax measures are the reductions in each of the general and small business corporate income tax rates, the corporate income tax small business threshold increase from $400,000 to $500,000, the industrial school property tax credit, the 50 per cent reduction in school property tax for land classified as “farm,” the interactive digital media tax credit, the extension of the training tax credit for businesses, the 2009 extension and 2010 enhancement of the Film Incentive BC tax credit, and a portion of the 2009 extension and 2010 enhancement of the Production Services tax credit.
The estimated reduction in provincial revenues for 2013/14 as a result of the designated revenue measures is $522 million for the personal tax measures and $710 million for the business tax measures, for a total reduction of $1,232 million. Based on these revenue and tax reduction estimates, revenue neutrality has been met for 2013/14. In fact, the reduction in provincial revenue exceeds the $1,222 million in carbon tax revenue by $10 million.
Carbon tax revenues for 2014/15 are estimated to be $1,240 million.
The tax reductions shown for the 2014/15 fiscal year are those that were designated in the Revenue Neutral Carbon Tax Plan presented with Budget 2014. The personal tax measures are the BC Low Income Climate Action Tax Credit, the five per cent reductions in rates for the first two tax brackets, the Northern and Rural Home Owner Benefit, the Children’s Fitness Credit and Children’s Arts Credit, the increase in the small business venture capital tax credit, and the extension of the training tax credits for individuals. The business tax measures are the reductions in each of the general and small business corporate income tax rates, the corporate income tax small business threshold increase from $400,000 to $500,000, the industrial school property tax credit for major industry, the 50 per cent reduction in school property tax for land classified as “farm,” the interactive digital media tax credit, the extension of the training tax credit for businesses, the Scientific Research and Experimental Development Tax Credit, the 2009 extension and 2010 enhancement of the Film Incentive BC tax credit, and the 2009 extension and 2010 enhancement of the Production Services tax credit.
The estimated reduction in provincial revenues for 2014/15 as a result of the designated revenue measures is $553 million for the personal tax measures and $892 million for the business tax measures, for a total reduction of $1,445 million. Based on these revenue and tax reduction estimates, revenue neutrality has been met for 2014/15. In fact, the reduction in provincial revenue exceeds the $1,240 million in carbon tax revenue by $205 million. The Budget 2016 Revenue Neutral Carbon Tax Report for 2014/15 will be based on actual carbon tax revenues for 2014/15 as reported in the 2014/15 Public Accounts.
Revenue Neutral Carbon Tax Plan
Table 2, the Revenue Neutral Carbon Tax Plan 2015/16 to 2017/18, shows carbon tax revenue and tax reduction cost estimates for the revenue measures designated as those that return the carbon tax revenues to taxpayers for 2015/16 to 2017/18.
Budget and Fiscal Plan — 2015/16 to 2017/18
61
Tax Measures
Carbon tax revenues for 2015/16 to 2017/18 are now forecast to be slightly higher than estimated when Budget 2014 was prepared.
The three-year fiscal plan for Budget 2015 assumes the cost of tax measures with sunset dates continue, for purposes of the plan, beyond their expiry dates. The Carbon Tax Plan presented in Table 2 reflects this assumption.
As shown in Table 2, revenue from the carbon tax and the cost of the tax reductions are now estimated to be $1,261 million and $1,621 million, respectively, for 2015/16. Carbon tax revenues are now estimated at $1,285 million in 2016/17 and $1,309 million in 2017/18. This means the Carbon Tax Plan is revenue neutral for all years, with the tax cuts in 2016/17 and 2017/18 exceeding the carbon tax revenues by $406 million and $431 million, respectively.
Table 2 Revenue Neutral Carbon Tax Plan 2015/16 to 2017/18
| | Forecast | |
| | 2015/16 | | 2016/17 | | 2017/18 | |
| | | | $ millions | | | |
Carbon tax revenue 1 | | 1,261 | | 1,285 | | 1,309 | |
Designated revenue measures:2 | | | | | | | |
Personal tax measures: | | | | | | | |
· Low income climate action tax credit of $115.50 per adult plus $34.50 per child effective July 1, 2011 | | (195 | ) | (195 | ) | (195 | ) |
· Reduction of 5% in the first two personal income tax rates | | (278 | ) | (283 | ) | (296 | ) |
· Northern and rural home owner benefit of up to $200 3 | | (73 | ) | (74 | ) | (74 | ) |
· BC seniors’ home renovation tax credit | | (2 | ) | (2 | ) | (2 | ) |
· Children’s fitness credit and children’s arts credit | | (8 | ) | (8 | ) | (8 | ) |
· Small business venture capital tax credit budget increased 2 | | (3 | ) | (3 | ) | (3 | ) |
· Training tax credit extended - individuals 2 | | (20 | ) | (20 | ) | (20 | ) |
Total personal tax measures | | (579 | ) | (585 | ) | (598 | ) |
Business tax measures: | | | | | | | |
· General corporate income tax rate reduced from 12% to 11% effective July 1, 2008, to 10.5% effective January 1, 2010, to 10% effective January 1, 2011 and increased to 11% effective April 1, 2013 | | (214 | ) | (246 | ) | (253 | ) |
· Small business corporate income tax rate reduced from 4.5% to 3.5% effective July 1, 2008 and to 2.5% effective December 1, 2008 | | (227 | ) | (239 | ) | (248 | ) |
· Corporate income tax small business threshold increased from $400,000 to $500,000 | | (21 | ) | (21 | ) | (21 | ) |
· Industrial property tax credit of 60% of school property taxes payable by major industry | | (24 | ) | (24 | ) | (24 | ) |
· School property taxes reduced by 50% for land classified as “farm” | | (2 | ) | (2 | ) | (2 | ) |
· Interactive digital media tax credit | | (50 | ) | (50 | ) | (50 | ) |
· Training tax credit extended — businesses 2 | | (11 | ) | (11 | ) | (11 | ) |
· Scientific research and experimental development tax credit extended in 20142 | | (160 | ) | (170 | ) | (180 | ) |
· Film incentive BC tax credit extended in 2009 and enhanced in 2010 | | (80 | ) | (80 | ) | (80 | ) |
· Production services tax credit extended in 2009 and enhanced in 2010 | | (253 | ) | (263 | ) | (273 | ) |
Total business tax measures | | (1,042 | ) | (1,106 | ) | (1,142 | ) |
Total revenue measures | | (1,621 | ) | (1,691 | ) | (1,740 | ) |
1 The carbon tax applies to fuels and combustibles at rates based on the CO2 equivalent emission of each particular fuel or combustible at $30 per tonne.
2 The Plan assumes that the cost of tax measures with sunset dates continue beyond their expiry dates.
3 Eligible homeowners are those in areas outside the Capital, Greater Vancouver and Fraser Valley regional districts.
Budget and Fiscal Plan — 2015/16 to 2017/18
62
Part 3: BRITISH COLUMBIA ECONOMIC REVIEW AND OUTLOOK1
Summary
Following an estimated increase of 2.2 per cent in 2014, the Ministry of Finance forecasts British Columbia’s economy to grow by 2.3 per cent in 2015, 2.4 per cent in 2016 and 2.3 per cent per year in the medium-term.
The Ministry’s outlook for BC’s real GDP growth in 2015 is 0.3 percentage points lower than the outlook provided by the Economic Forecast Council. For 2016, the Ministry’s forecast is 0.4 percentage points below the Council’s projection. This prudence acknowledges the downside risks to the economic forecast and is one of the levels of prudence built into the fiscal plan.
Chart 3.1 British Columbia’s economic outlook
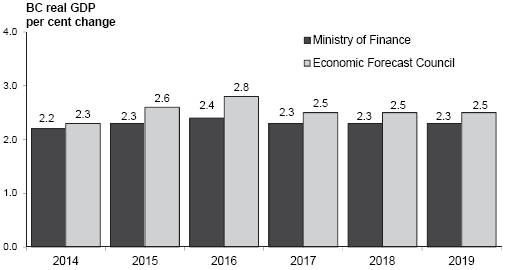
Downside risks to BC’s economic outlook include the potential for a slowdown in domestic and US activity, ongoing fragility in Europe, and slower than anticipated Asian demand, particularly in China. Additional risks include a fluctuating Canadian dollar and weak inflation, in part due to lower oil prices.
British Columbia Economic Activity and Outlook
Indicators of BC’s economic performance in 2014 reveal increased domestic activity relative to the same period of 2013 (see Table 3.1). Most indicators show that BC performed well compared to other provinces in 2014 and, as such, an average of six private sector forecasters2 estimate that BC experienced the second strongest growth in real GDP among provinces last year. The same private sector forecasters expect BC’s economic growth to rank second among provinces again in 2015, and then first in 2016 (tied with Ontario). However, provincial outlooks are modest across the country and relative prospects are uncertain, depending in part on the future path and effects of oil prices.
1 Reflects information available as of February 6, 2015, unless otherwise indicated.
2 A subset of the Economic Forecast Council that regularly forecasts economic performance in all provinces (Bank of Montreal, RBC, CIBC, TD, Scotiabank, IHS Global Insight), as of February 6, 2015.
Budget and Fiscal Plan — 2015/16 to 2017/18
British Columbia Economic Review and Outlook
Table 3.1 British Columbia economic indicators
| | Third Quarter | | Fourth Quarter | | Annual | |
| | Jul. to Sep. 2014 | | Oct. to Dec. 2014 | | Jan. to Dec. 2014 | |
Data seasonally adjusted unless | | change from | | change from | | change from | |
otherwise noted | | Apr. to Jun. 2014 | | Jul. to Sep. 2014 | | Jan. to Dec. 2013 | |
| | | | Per cent change | | | |
Employment | | -0.3 | | 0.4 | | 0.6 | * |
Manufacturing shipments1 | | 1.3 | | 0.9 | | 6.5 | |
Exports | | -3.9 | | -1.4 | | 6.3 | * |
Retail sales1 | | 1.2 | | 1.7 | | 5.9 | |
Housing starts | | 10.3 | | -9.2 | | 4.8 | * |
Non-residential building permits | | -5.0 | | 72.1 | | 19.4 | * |
* annual non-seasonally adjusted data 1data to November
The Labour Market
Employment activity in BC continued to grow modestly in 2014 after a 0.1 per cent gain in 2013. BC’s economy created 12,800 jobs in 2014 (an annual increase of 0.6 per cent), with gains of 6,100 full-time jobs and 6,800 part-time jobs. Notable job growth in 2014 was observed in manufacturing (+9,700 jobs), transportation and warehousing (+6,500 jobs), and accommodation and food services (+5,800 jobs), while losses were concentrated in business, building and other support services (-10,900 jobs) and construction (-3,900 jobs).
BC’s unemployment rate averaged 6.1 per cent in 2014, down from 6.6 per cent in 2013. This decline was partly due to slower-than-anticipated labour force growth, which remained relatively flat on the year.
In January 2015, BC employment grew by 6,700 jobs (or 0.3 per cent) compared to the previous month, while the monthly unemployment rate ticked up 0.1 percentage points to 5.6 per cent. BC’s labour force increased by 8,400 persons compared to December 2014.
Chart 3.2 BC employment
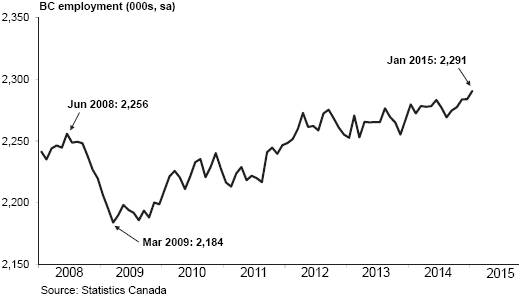
Budget and Fiscal Plan — 2015/16 to 2017/18
64
British Columbia Economic Review and Outlook
Outlook
The Ministry forecasts employment in BC to increase by 1.0 per cent in 2015, or approximately 22,300 jobs. Employment growth is expected to improve in 2016, with a projected gain of 1.2 per cent, or about 28,400 jobs. In the medium-term, employment is forecast to continue increasing by 1.2 per cent each year from 2017 to 2019. The province’s unemployment rate is expected to reach 6.2 per cent in 2015 and 6.4 per cent in 2016. The rate is then forecast to level of at 6.6 per cent over the medium-term.
Consumer Spending and Housing
Retail sales in BC saw solid gains year-to-date to November 2014, with sales increasing by 5.9 per cent during the first eleven months of 2014 compared to the same period of 2013. Growth was widespread across the entire retail sector, with the largest increases occurring in sales at motor vehicle and parts dealers, food and beverage stores and general merchandise stores. Despite modest employment growth last year, consumer spending was relatively strong partly due to increased tourism and interprovincial migration to the province during the year, and a release of pent up demand following annual BC retail sales growth of just 2.4 per cent in 2013.
Chart 3.3 BC retail sales

After contracting 1.5 per cent in 2013, BC housing starts advanced 4.8 per cent in 2014 to reach about 28,400 units, roughly in line with the average rate of construction observed over the past couple of decades. Annual growth was largely driven by single-detached houses, while starts of multiple-unit dwellings (such as condominiums) experienced smaller gains compared to 2013. Residential building permits, a leading indicator of future home construction, improved by 6.8 per cent on the year.
Budget and Fiscal Plan — 2015/16 to 2017/18
65
British Columbia Economic Review and Outlook
Chart 3.4 BC housing starts
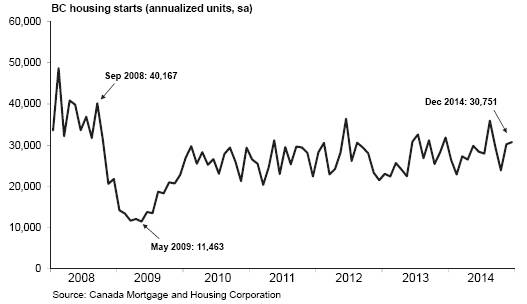
Like new home construction, home sales in BC benefitted from a low interest rate environment in 2014. Home sales grew by 15.2 per cent in 2014 after registering a 7.8 per cent annual increase in 2013. Meanwhile, home prices averaged about $568,400 in 2014, an increase of 5.8 per cent over the average annual price of about $537,400 the previous year. Home price increases were widespread across the province in 2014, with the largest gains recorded in the Northern region (+7.6 per cent), Okanagan-Mainline (+5.9 per cent), Greater Vancouver (+5.8 per cent) and the Fraser Valley (+5.6 per cent). Though improving housing activity has helped support the provincial economy over the past year, momentum is expected to ease when interest rates eventually rise.
The value of non-residential building permits, which tends to be volatile, increased 19.4 per cent in 2014 compared to 2013. The largest contributor to this increase was the institutional and government category, which jumped 47.6 per cent on the year, while commercial permits increased 16.1 per cent and industrial permits fell 17.7 per cent.
Outlook
The Ministry forecasts real household consumption of goods and services to increase by 2.7 per cent in 2015 after growing by an estimated 3.7 per cent in 2014. A 2.6 per cent increase in real household spending is expected for 2016, followed by further annual gains of around 2.6 per cent over the medium-term.
Following an estimated 5.4 per cent annual increase in BC retail sales last year, a gain of 3.3 per cent is forecast for 2015. Retail sales are then expected to grow by 3.7 per cent in 2016 and by 3.6 per cent per year from 2017 to 2019.
A slight moderation in residential construction activity is projected this year, as the Ministry forecasts housing starts to total about 27,600 units in 2015 — a decrease of 2.7 per cent from 2014. Starts are expected to slow further in 2016, reaching about 27,500 units, and then average around 27,000 units per year from 2017 to 2019.
Budget and Fiscal Plan — 2015/16 to 2017/18
66
British Columbia Economic Review and Outlook
Business and Government
Real business investment is estimated to have grown by 2.5 per cent in 2014, due to steady gains in residential, non-residential and machinery and equipment investment and a small increase in intellectual property investment.
Total real expenditures by federal, provincial and municipal governments are estimated to have increased by 1.7 per cent in 2014, following a gain of 0.6 per cent in 2013.
Outlook
Real business investment is projected to rise by 2.4 per cent in 2015, supported by gains in all investment categories: residential, non-residential, machinery and equipment, and intellectual property. Total business investment is forecast to increase by 3.4 per cent in 2016, followed by similar annual gains in the medium-term.
The Ministry expects the net operating surplus of corporations to grow by 3.3 per cent in 2015, after an estimated increase of 5.3 per cent in 2014. Stronger annual growth of 6.3 per cent is forecast in 2016, followed by 5.8 per cent growth each year from 2017 to 2019.
Combined real spending by the three levels of government (federal, provincial and municipal) on goods and services is expected to increase by 1.3 per cent in 2015, followed by a gain of 1.1 per cent in 2016. Government spending is then projected to grow on average by about 0.9 per cent annually in the medium-term.
External Trade and Commodity Markets
Despite unbalanced global demand, the value of BC international merchandise exports grew 6.3 per cent in 2014 compared to 2013. This increase was driven by exports to the US, as exports to several of BC’s other major trading partners (such as China and Japan) declined over the same period. The annual contrast between the US and the rest of the world was particularly visible for energy exports, which were up 33.5 per cent to the US but down 23.6 per cent to other countries. Altogether, energy products experienced the largest decline among BC’s export commodities on the year (largely due to falling coal exports), while metallic mineral products led the province’s export growth. Going forward, the lower Canadian dollar is expected to support BC exports in the near-term.
Chart 3.5 BC exports
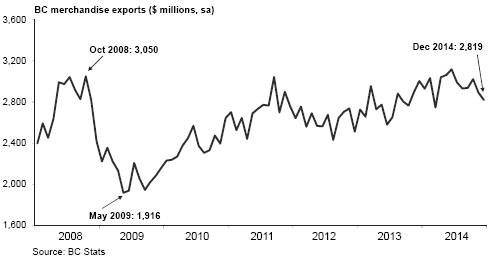
Budget and Fiscal Plan — 2015/16 to 2017/18
67
British Columbia Economic Review and Outlook
Shipments of manufactured goods from BC increased 6.5 per cent through the first eleven months of 2014 compared to the same period of 2013. Notable year-to-date gains were recorded in shipments of paper products (+10.1 per cent) and food (+6.0 per cent). During the same period, year-to-date losses occurred in electrical equipment, appliance and components (-7.5 per cent) and primary metal products (-6.0 per cent).
On average, lumber prices moderated slightly in 2014 compared to 2013, with Western spruce-pine-fir (SPF) 2×4 prices averaging $353 US/000 board feet (a decline of 1.5 per cent). Prices began the year at $375 US/000 board feet, fell to $325 US/000 board feet in June and finished the year at $338 US/000 board feet in December.
The price of pulp rose steadily through 2014, starting at $910 US per tonne in January and reaching $933 US per tonne in December. Overall, the pulp price averaged $925 US per tonne in 2014, an increase of 8.0 per cent over 2013.
Oil prices dropped more than 50 per cent from mid-June 2014 through early 2015, due to a surging supply of oil in the global market alongside slowing energy demand. While a lower price for oil decreases energy costs for BC businesses and households, it may also put downward pressure on interprovincial exports to Alberta and Saskatchewan (where investment plans in the energy sector have been curtailed in recent months). On average, the daily West Texas Intermediate crude oil price averaged $93.17 US/barrel in 2014, a decrease of $4.81 US/barrel compared to 2013. As of February 2, 2015, the price of oil was $49.25 US/barrel.
The Plant Inlet price of natural gas averaged $3.10 C/GJ in 2014, up $1.07 compared to 2013. Natural gas prices spiked during the cold winter months of early 2014 and then dropped fairly steadily through the course of the year. Meanwhile, the prices of most metals and minerals fell in 2014 compared to 2013. Annual declines were observed in prices for silver (-19.6 per cent), gold (-10.1 per cent), aluminum (-9.3 per cent), copper (-5.1 per cent), and lead (-2.0 per cent). However, prices increased for zinc (+13.5 per cent) and molybdenum (+10.3 per cent) on the year.
Outlook
Real exports of goods and services are forecast to rise by 3.3 per cent in 2015, following an estimated increase of 2.1 per cent in 2014. Real exports are then expected to grow by 2.7 per cent in 2016 and around 2.8 per cent per year over the medium-term.
Commodity prices may be volatile in the near-term due to ongoing global economic uncertainty, the potential for further slowing of the Chinese economy, and fluctuations in petroleum markets.
The lumber price is projected to decrease in 2015, averaging $344 US/000 board feet for the year. The price is then forecast to average $340 US/000 board feet per year from 2016 to 2019.
The price of natural gas is expected to drop to $2.09 C/GJ this fiscal year and then rise gradually over the rest of the forecast horizon, reaching $3.11 C/GJ in 2019/20.
Budget and Fiscal Plan — 2015/16 to 2017/18
68
British Columbia Economic Review and Outlook
Demographics
BC’s population on July 1, 2014 was 4.63 million people, 1.1 per cent higher than the 4.58 million people counted on the same date in 2013. In the first three quarters of 2014, BC saw a net inflow of 44,521 people, as the province welcomed 37,035 individuals from other countries and 7,486 individuals from other provinces. Prior to this net interprovincial inflow, BC experienced annual net outflows of people to other provinces for two consecutive years.
Outlook
The Ministry forecast calls for BC’s July 1st population to increase by 1.2 per cent in 2015, to reach a total of 4.69 million people, and by a further 1.3 per cent each year from 2016 to 2019.
Total net migration is expected to rise in 2015 to reach a net inflow of about 46,600 persons. Net entry of about 10,000 people from other provinces is forecast in 2015, along with an anticipated net gain of about 36,600 people from other countries. In 2016, the Ministry forecasts a total net inflow of around 50,800 individuals, followed by net inflows of around 52,200 individuals per year over the medium term.
Inflation
Consumer prices in BC rose by 1.0 per cent in 2014 compared to the previous year, as prices increased for non-durables, semi-durables and services but remained fat for durable goods. Rising furniture and clothing prices drove the increase in semi-durables, while higher prices for traveller accommodations and education provided upward inflationary pressure on the services side. The aggregate price for non-durables also increased in 2014, as rising prices for items such as food and electricity offset falling gasoline prices (which declined steadily in the latter half of the year and experienced a particularly steep 9.9 per cent drop in December due to falling oil prices). At the same time, prices for durables remained unchanged in 2014 as lower prices for items such as household appliances offset higher prices for items such as passenger vehicles.
Chart 3.6 BC inflation

Budget and Fiscal Plan — 2015/16 to 2017/18
69
British Columbia Economic Review and Outlook
Outlook
While the lower price of oil is dampening inflation heading into 2015, BC’s rate of inflation is expected to increase going forward. Consumer price inflation in BC is forecast to be 1.6 per cent in 2015, 1.9 per cent in 2016 and 2.0 per cent per year in the medium-term. The Canadian rate of inflation is assumed to match BC’s rate in 2015, then increase to 2.0 per cent annually from 2016 to 2019 (in line with the Bank of Canada’s inflation target).
Risks to the Economic Outlook
Risks to the BC economic outlook continue to be weighted to the downside. The main risks to the current outlook include the following:
· potential for a slowdown in domestic economic activity, including weakness in employment and retail sales;
· renewed weakness in the US economy, particularly as interest rates increase;
· fragility in Europe as governments and the financial system deal with elevated sovereign debt amidst a weak economic recovery;
· slower than anticipated economic activity in Asia, particularly in China, resulting in weaker demand for BC’s exports and downward pressure on global commodity prices;
· weaker than expected inflation caused in part by lower oil prices; and
· exchange rate volatility.
External Outlook
United States
US economic growth fluctuated significantly in 2014, with a weather-related contraction of 2.1 per cent in the January to March quarter followed by an outsized 5.0 per cent expansion two quarters later. Most recently, US real GDP grew by an annualized 2.6 per cent in the October to December quarter of 2014, with a strong gain in consumer spending and an uptick in inventory accumulation. However, net exports subtracted from growth during the period, likely due to sluggish external demand and a strong currency (which may continue to put downward pressure on US growth going forward). For 2014 as a whole, US real GDP grew by 2.4 per cent, up slightly from the 2.2 per cent annual gain observed in 2013.
Budget and Fiscal Plan — 2015/16 to 2017/18
70
British Columbia Economic Review and Outlook
Chart 3.7 US economic growth

US employment grew steadily last year as the economy finally regained all of the jobs that were lost during the 2008/09 recession. About 260,000 jobs were created on average each month in 2014, resulting in a 1.9 per cent increase in annual employment over 2013 levels. In addition, public sector employment (the total number of federal, state and local government jobs) registered the first annual increase since 2009. However, although the annual unemployment rate fell 1.2 percentage points to 6.2 per cent in 2014, the participation rate also fell to its lowest rate since 1977, with only 62.9 per cent of Americans who were eligible to work choosing to participate in the labour market. Furthermore, wage growth has been moderate in recent months and barely kept pace with consumer price inflation through 2014, an indication of ongoing slack in the US economy.
Chart 3.8 US housing starts
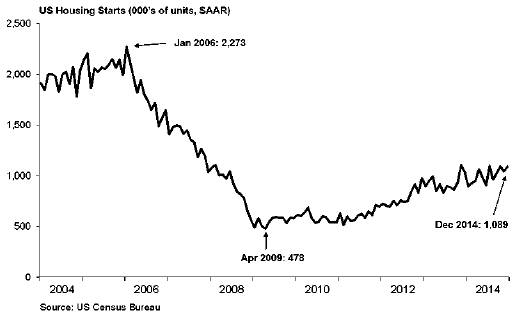
Budget and Fiscal Plan — 2015/16 to 2017/18
71
British Columbia Economic Review and Outlook
The American housing market continued its slow recovery in 2014. Builders broke ground on 1.01 million new homes in 2014, a gain of 8.7 per cent over 2013. However, the monthly pace of homebuilding was relatively flat from late 2013 through the end of 2014 and housing market activity remained very low by historical standards. In addition, the number of residential building permits issued in the US decreased month-over-month in both November and December 2014, suggesting the potential for a slowdown in homebuilding going into 2015.
US home sales struggled in 2014, with little or no growth in both the new home and resale markets. New home sales averaged 435,000 units on the year, a slight 1.2 per cent increase from 2013, while sales of existing homes fell by 3.1 per cent. Despite soft sales, home prices grew 6.8 per cent year-to-date to November 2014 compared to the same period in 2013 and the share of mortgages with negative equity (where the value of a home is lower than the amount owed on a mortgage) continued to retreat towards normal levels.
US retail activity gained ground in 2014, advancing 4.0 per cent compared to 2013. After being hit hard by the recession, motor vehicle and parts dealers led US retail sales growth in 2014, while sales at gasoline stations fell for a second straight year in part due to lower prices at the pump. Confidence among American consumers also improved in 2014 alongside firming labour market conditions.
Chart 3.9 US Consensus outlook for 2015
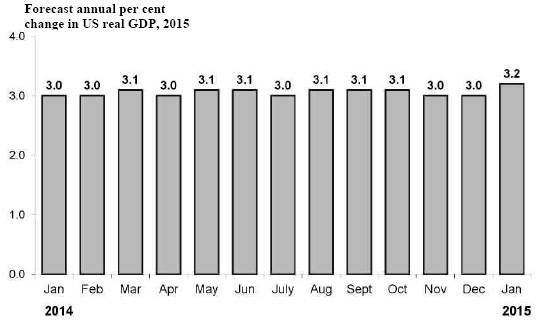
Source: Consensus Economics
The chart above represents forecasts for real GDP growth in 2015 as polled on specific dates. For example, forecasters surveyed on January 13, 2014 had an average 2015 US growth forecast of 3.0 per cent, while on January 12, 2015 they forecast 2015 US growth at 3.2 per cent.
Budget and Fiscal Plan — 2015/16 to 2017/18
72
British Columbia Economic Review and Outlook
Outlook
The January 2015 Consensus forecasts the US economy to grow by 3.2 per cent this year, a slight increase from previous forecasts due in part to positive data revisions, an improving labour market, and the anticipated benefits from lower oil prices. For 2016, Consensus pegs US growth at 2.8 per cent.
In recognition of global risks, the Ministry’s assumptions for US growth are prudent compared to the January 2015 Consensus. The Ministry assumes that US real GDP will expand by 2.5 per cent per year throughout the forecast horizon.
Table 3.2 US real GDP forecast: Consensus vs Ministry of Finance
| | 2015 | | 2016 | |
| | Per cent change in real GDP | |
Ministry of Finance | | 2.5 | | 2.5 | |
Consensus Economics (January 2015) | | 3.2 | | 2.8 | |
Canada
On an annualized basis, the Canadian economy grew by 2.8 per cent in the July to September quarter of 2014, following 3.6 per cent growth the prior quarter. In both periods, healthy gains in exports and investment in residential structures supported real GDP growth, in part a reflection of the ongoing US economic recovery and accommodative interest rates, respectively. At the same time, government spending and business investment in non-residential structures were among the weakest components of Canadian real GDP growth.
Canada’s domestic economy grew modestly in 2014. Employment increased by 111,100 jobs (or 0.6 per cent) in 2014 compared to 2013, making 2014 the slowest year for Canadian job creation since 2009, while the national unemployment rate fell to 6.9 per cent in 2014 from 7.1 per cent in 2013. In January 2015, Canadian employment improved by 35,400 jobs compared to the previous month and the monthly unemployment rate fell 0.1 percentage points to 6.6 per cent. Retail sales were up 4.7 per cent year-to-date to November 2014 compared to the same period in 2013, after increasing 3.2 per cent the year before. Meanwhile, builders began construction on around 189,400 new homes in Canada in 2014, a slight increase of 0.8 per cent compared to 2013. Canadian resale activity also advanced in 2014 despite monthly declines in November and December, with annual home sales up 5.1 per cent and prices up 6.7 per cent compared to the previous year.
Improving demand south of the border and a reduced exchange rate helped lift Canadian exports in 2014, with total Canadian merchandise exports growing by 10.8 per cent compared the previous year. This increase was led by advances in exports of energy products (+16.4 per cent), consumer goods (+12.8 per cent) and motor vehicles and parts (+8.8 per cent), while slower growth was observed for exports of metal ores and non-metallic minerals (+1.2 per cent). Canadian manufacturing shipments increased 5.2 per cent year-to-date to November compared to the same period of 2013, partly due to sizeable gains in shipments of primary metals (+10.0 per cent) and transportation equipment (+8.1 per cent).
Budget and Fiscal Plan — 2015/16 to 2017/18
73
British Columbia Economic Review and Outlook
Chart 3.10 Consensus outlook for Canada in 2015
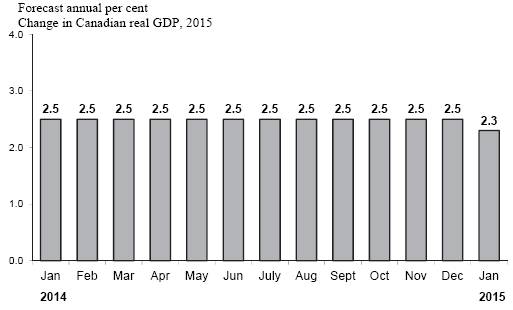
Source: Consensus Economics
The chart above represents forecasts for real GDP growth in 2015 as polled on specific dates. For example, forecasters surveyed on January 13, 2014 had an average 2015 Canadian real GDP growth forecast of 2.5 per cent, while on January 12, 2015 they forecast 2015 Canadian real GDP to grow by 2.3 per cent.
Outlook
Consensus forecasts for Canadian real GDP growth in 2015 were steady throughout 2014 at 2.5 per cent. However, in January 2015, the forecast dropped to 2.3 per cent due to the anticipated effect of lower oil prices on Canadian economic activity. Also in January 2015, Consensus released its first forecasts for 2016 and pegged Canadian real GDP growth at 2.2 per cent for the year.
Due to the potential for greater than anticipated near-term weakness, the Ministry assumes that the Canadian economy will expand by 2.0 per cent in both 2015 and 2016, and then by 2.2 per cent per year over the medium-term.
Table 3.3 Canadian real GDP forecast: Consensus vs Ministry of Finance
| | 2015 | | 2016 | |
| | Per cent change in real GDP | |
Ministry of Finance | | 2.0 | | 2.0 | |
Consensus Economics (January 2015) | | 2.3 | | 2.2 | |
Europe
Ongoing troubles in Europe weighed on global economic growth and confidence throughout 2014. After growing by just 0.1 per cent in the April to June quarter, real GDP in the euro zone advanced 0.2 per cent the following quarter. Italy and France showed particular weakness over this period, with the Italian economy in recession and the French economy barely growing, amid concerns about the slow pace of structural reform in both countries. Furthermore, growth in Germany’s economy also faltered in recent quarters (despite the country’s relatively sound fiscal and competitive position) due to its close economic ties across the region.
Budget and Fiscal Plan — 2015/16 to 2017/18
74
British Columbia Economic Review and Outlook
With an economy weakened by falling oil prices and international sanctions, Russian officials aggressively hiked interest rates in December to stem capital flight then announced targeted spending measures and a slight interest rate cut in January to stimulate the economy. Despite these actions, their sovereign debt was downgraded by Standard and Poor’s credit rating agency near the end of the month. Also in January, early elections in Greece brought to power the Syriza party which has pledged to renegotiate the country’s 240 billion euro bailout, a sign of further uncertainty in the region. Meanwhile, euro zone unemployment remained near record highs throughout 2014 and the region slipped into deflation in December.
In response to worsening economic conditions in Europe, the European Central Bank introduced a quantitative easing program in late January. The program, combined with previous stimulus measures, involves the purchase of 60 billion euros worth of European assets each month until at least September 2016, with an aim to revive the region’s ailing economy and ward off a prolonged period of deflation.
Chart 3.11 Consensus outlook for euro zone in 2015

Source: Consensus Economics
The chart above represents forecasts for real GDP growth in 2015 as polled on specific dates. For example, forecasters surveyed on January 13, 2014 had an average 2015 euro zone growth forecast of 1.4 per cent, while on January 12, 2015 they forecast euro zone growth of 1.1 per cent in 2015.
Outlook
Consensus expected euro zone economic growth of around 1.5 per cent in 2015 throughout most of last year, but revised its outlook down considerably in recent months as conditions weakened. The January 2015 Consensus expects euro zone real GDP to grow by 1.1 per cent in 2015 and 1.6 per cent in 2016. In light of the ongoing uncertainty and risks surrounding the euro zone outlook, the Ministry assumes euro zone real GDP growth of 0.7 per cent in 2015, followed by 1.2 per cent growth the following year.
Budget and Fiscal Plan — 2015/16 to 2017/18
75
British Columbia Economic Review and Outlook
China
The Chinese economy cooled somewhat in 2014 yet continued to grow at an enviable pace compared to other major economies. Chinese real GDP advanced by 7.4 per cent on the year (slightly below the official target of around 7.5 per cent) after growing by 7.7 per cent in 2013. In the October to December quarter, real GDP grew by 7.3 per cent relative to the same period in 2013, supported by strong retail sales and industrial production towards the end of the year. However, China’s real estate sector continued to moderate over this period and annual growth in property investment dropped to a five-year low. Some analysts expect that the Chinese government may follow up the stimulus measures introduced in 2014 and early 2015 (including an interest rate cut in November) with further monetary policy initiatives in 2015 to help boost the slowing economy.
Outlook
The January 2015 Consensus forecasts China’s real GDP to grow by 7.0 per cent in 2015 and 6.9 per cent in 2016. Meanwhile, the Ministry prudently assumes that China’s real GDP will expand by 6.7 per cent in 2015 and then 6.6 per cent the following year.
Financial Markets
Interest rates
On January 21, 2015, the Bank of Canada unexpectedly lowered its target for the overnight rate to 0.75 per cent from 1.00 per cent (where the rate had remained since September 2010). The steep drop in oil prices, with its negative impacts on Canadian economic growth and inflation, was the predominant factor behind this decision. The Bank stated that the country exhibited solid growth in the latter half of 2014 but cautioned that the oil shock has created considerable uncertainty in the outlook. The Bank of Canada now expects inflation to slow to 0.3 per cent in the April to June quarter of 2015 before accelerating in the second half of the year and finally returning to its target rate of 2.0 per cent by the end of 2016.
The US Federal Reserve (the Fed) has held its intended federal funds rate in the 0.00 to 0.25 per cent range since December 2008. At its January 2015 meeting, the Fed noted strengthening labour conditions, positive effects of lower energy prices on American households’ purchasing power, and advancing business investment. However, declining inflation, the slow pace of the housing market recovery, and the need to assess international developments were also discussed. As such, the Fed reiterated its intent to take a balanced and patient approach when making future monetary policy decisions.
Outlook
The Ministry assumes that the Bank of Canada’s overnight target rate will average 1.1 per cent in 2015 and 1.7 per cent in 2016. These assumptions are based on the average of six private sector forecasts as of January 2, 2015 and do not reflect the Bank of Canada’s rate cut on January 21, 2015.
Budget and Fiscal Plan — 2015/16 to 2017/18
76
British Columbia Economic Review and Outlook
Chart 3.12 Interest rate forecasts
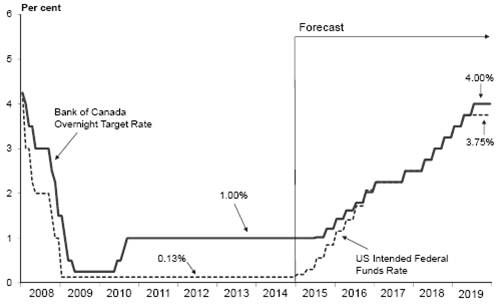
Sources: Bank of Canada, US Federal Reserve and BC Ministry of Finance forecasts.
The same six private sector forecasters anticipate that the federal funds rate will remain in the 0.00 to 0.25 per cent range until the April to June quarter of 2015. They forecast the federal funds rate to average 0.5 per cent in 2015 and 1.6 per cent in 2016.
Canadian three month Treasury bill interest rates are expected to average 1.1 per cent in 2015 and 1.8 per cent in 2016, according to the same six private sector forecasters. Meanwhile, ten-year Government of Canada bond rates are pegged at 2.5 per cent in 2015 and 3.1 per cent in 2016 on average.
Table 3.4 Private sector Canadian interest rate forecasts
| | 3-month Treasury Bill | | 10-year Government Bond | |
Average annual interest rate (per cent) | | 2015 | | 2016 | | 2015 | | 2016 | |
IHS Global Insight | | 1.0 | | 1.9 | | 3.1 | | 3.7 | |
CIBC | | 1.0 | | 1.4 | | 2.3 | | 2.7 | |
Bank of Montreal | | 1.0 | | na | | 2.2 | | na | |
Scotiabank | | 1.1 | | 2.0 | | 2.5 | | 3.0 | |
TD Economics | | 1.0 | | 1.6 | | 2.3 | | 3.2 | |
RBC Capital Markets | | 1.2 | | 2.2 | | 2.5 | | 3.3 | |
Average (as of January 2, 2015) | | 1.1 | | 1.8 | | 2.5 | | 3.1 | |
Exchange rate
The Canadian dollar averaged 90.5 US cents in 2014, down 6.6 US cents from 2013 (the largest annual drop since the late 1970s). This depreciation continued a trend underway since late 2012 when the dollar was near parity with its US counterpart, but intensified in the final months of 2014 alongside slumping oil prices. More recently, the loonie experienced its largest single-day decline in over three years after the Bank of Canada announced its interest rate cut on January 21, 2015, with the currency landing at 80.8 US cents. Since that time, the loonie has fallen slightly further to reach 79.9 US cents as of February 6, 2015.
Budget and Fiscal Plan — 2015/16 to 2017/18
77
British Columbia Economic Review and Outlook
Chart 3.13 Private sector expectations for the Canadian dollar

Sources: Bank of Canada and BC Ministry of Finance forecasts
* Based on the average of private sector forecasts. Budget 2015 as of January 2, 2015 and First Quarterly Report 2014 as of July 21, 2014.
Outlook
On average, six private sector forecasters as of January 2, 2015 expect the Canadian dollar to average 85.3 US cents in 2015 and 85.5 US cents in 2016. The Ministry’s exchange rate outlook is based on these private sector forecasts.
Table 3.5 Private sector exchange rate forecasts
Average annual exchange rate (US cents/Can $) | | 2015 | | 2016 | |
IHS Global Insight | | 85.7 | | 86.8 | |
CIBC | | 83.6 | | 84.6 | |
Bank of Montreal | | 85.3 | | 85.6 | |
Scotiabank | | 86.0 | | 84.4 | |
TD Economics | | 85.4 | | 87.9 | |
RBC Capital Markets | | 85.8 | | 83.7 | |
Average (as of January 2, 2015) | | 85.3 | | 85.5 | |
Budget and Fiscal Plan — 2015/16 to 2017/18
78
British Columbia Economic Review and Outlook
Table 3.6.1 Gross Domestic Product: British Columbia
| | | | | | Forecast | |
| | 2013 | | 2014 e | | 2015 | | 2016 | | 2017 | | 2018 | | 2019 | |
BRITISH COLUMBIA: | | | | | | | | | | | | | | | |
Gross Domestic Product at Market Prices: | | | | | | | | | | | | | | | |
– Real (2007 $ billion; chain-weighted) | | 215.2 | | 220.0 | | 225.2 | | 230.5 | | 235.9 | | 241.5 | | 247.1 | |
(% change) | | 1.9 | | 2.2 | | 2.3 | | 2.4 | | 2.3 | | 2.3 | | 2.3 | |
| | | | | | | | | | | | | | | |
– Current dollar ($ billion) | | 229.7 | | 238.7 | | 247.9 | | 258.5 | | 269.7 | | 281.4 | | 293.7 | |
(% change) | | 3.2 | | 3.9 | | 3.8 | | 4.3 | | 4.3 | | 4.3 | | 4.3 | |
| | | | | | | | | | | | | | | |
– GDP price deflator (2007 = 100) | | 106.7 | | 108.5 | | 110.1 | | 112.1 | | 114.3 | | 116.6 | | 118.8 | |
(% change) | | 1.2 | | 1.7 | | 1.5 | | 1.9 | | 2.0 | | 2.0 | | 2.0 | |
| | | | | | | | | | | | | | | |
Real GDP per person | | | | | | | | | | | | | | | |
(2007 $; chain-weighted) | | 46,964 | | 47,510 | | 48,034 | | 48,554 | | 49,054 | | 49,567 | | 50,089 | |
(% change) | | 1.0 | | 1.2 | | 1.1 | | 1.1 | | 1.0 | | 1.0 | | 1.1 | |
| | | | | | | | | | | | | | | |
Real GDP per employed person | | | | | | | | | | | | | | | |
(% change) | | 1.8 | | 1.7 | | 1.3 | | 1.1 | | 1.1 | | 1.1 | | 1.1 | |
| | | | | | | | | | | | | | | |
Unit labour cost1 (% change) | | 2.0 | | 1.1 | | 1.3 | | 1.6 | | 1.7 | | 1.7 | | 1.7 | |
Components of British Columbia Real GDP at Market Prices ($2007 billions; chain-weighted) | | | | | | | | | | | | | | | |
Household expenditure on Goods and services | | 134.6 | | 139.7 | | 143.5 | | 147.2 | | 150.9 | | 154.8 | | 158.8 | |
(% change) | | 2.5 | | 3.7 | | 2.7 | | 2.6 | | 2.5 | | 2.6 | | 2.6 | |
| | | | | | | | | | | | | | | |
– Goods | | 54.3 | | 56.6 | | 57.8 | | 59.2 | | 60.4 | | 61.7 | | 63.0 | |
(% change) | | 2.2 | | 4.2 | | 2.2 | | 2.4 | | 2.1 | | 2.1 | | 2.1 | |
| | | | | | | | | | | | | | | |
– Services | | 80.2 | | 83.0 | | 85.5 | | 87.9 | | 90.3 | | 92.9 | | 95.6 | |
(% change) | | 2.7 | | 3.4 | | 3.1 | | 2.8 | | 2.8 | | 2.9 | | 2.9 | |
| | | | | | | | | | | | | | | |
NPISH2 expenditure on | | | | | | | | | | | | | | | |
Goods and services | | 3.4 | | 3.4 | | 3.4 | | 3.5 | | 3.5 | | 3.5 | | 3.6 | |
(% change) | | 2.4 | | -0.9 | | 0.7 | | 0.8 | | 0.9 | | 0.9 | | 0.9 | |
| | | | | | | | | | | | | | | |
Government current expenditures on Goods and services | | 40.4 | | 41.1 | | 41.6 | | 42.0 | | 42.3 | | 42.7 | | 43.1 | |
(% change) | | 0.6 | | 1.7 | | 1.3 | | 1.1 | | 0.7 | | 1.0 | | 1.0 | |
| | | | | | | | | | | | | | | |
Investment in fixed capital | | 51.3 | | 52.8 | | 53.7 | | 55.0 | | 56.7 | | 58.3 | | 60.0 | |
(% change) | | -1.2 | | 3.0 | | 1.7 | | 2.3 | | 3.1 | | 2.9 | | 2.9 | |
| | | | | | | | | | | | | | | |
Final domestic demand | | 229.7 | | 236.8 | | 242.1 | | 247.5 | | 253.1 | | 259.1 | | 265.1 | |
(% change) | | 1.3 | | 3.1 | | 2.2 | | 2.2 | | 2.3 | | 2.4 | | 2.3 | |
| | | | | | | | | | | | | | | |
Exports goods and services | | 84.9 | | 86.6 | | 89.5 | | 92.0 | | 94.5 | | 97.2 | | 100.0 | |
(% change) | | 2.5 | | 2.1 | | 3.3 | | 2.7 | | 2.8 | | 2.8 | | 2.9 | |
| | | | | | | | | | | | | | | |
Imports goods and services | | 99.4 | | 102.8 | | 105.8 | | 108.5 | | 111.3 | | 114.4 | | 117.7 | |
(% change) | | 0.8 | | 3.4 | | 2.9 | | 2.6 | | 2.6 | | 2.8 | | 2.9 | |
| | | | | | | | | | | | | | | |
Inventory change | | 0.7 | | -0.1 | | -0.2 | | 0.0 | | 0.0 | | 0.0 | | 0.0 | |
| | | | | | | | | | | | | | | |
Statistical discrepancy | | 0.1 | | 0.1 | | 0.1 | | 0.1 | | 0.1 | | 0.1 | | 0.1 | |
| | | | | | | | | | | | | | | |
Real GDP at market prices | | 215.2 | | 220.0 | | 225.2 | | 230.5 | | 235.9 | | 241.5 | | 247.1 | |
(% change) | | 1.9 | | 2.2 | | 2.3 | | 2.4 | | 2.3 | | 2.3 | | 2.3 | |
1 Unit labour cost is the nominal cost of labour incurred to produce one unit of real output.
2 Non-profit institutions serving households
e Ministry of Finance estimate.
Budget and Fiscal Plan — 2015/16 to 2017/18
79
British Columbia Economic Review and Outlook
Table 3.6.2 Components of Nominal Income and Expenditure
| | | | | | Forecast | |
| | 2013 | | 2014 | | 2015 | | 2016 | | 2017 | | 2018 | | 2019 | |
Compensation of employees1 ($ million) | | 114,898 | | 118,820 | e | 123,190 | | 128,080 | | 133,284 | | 138,720 | | 144,408 | |
(% change) | | 4.0 | | 3.4 | | 3.7 | | 4.0 | | 4.1 | | 4.1 | | 4.1 | |
| | | | | | | | | | | | | | | |
Household income ($ million) | | 195,457 | | 201,243 | e | 208,192 | | 216,044 | | 224,580 | | 233,463 | | 242,690 | |
(% change) | | 4.6 | | 3.0 | | 3.5 | | 3.8 | | 4.0 | | 4.0 | | 4.0 | |
| | | | | | | | | | | | | | | |
Net operating surplus ($ million) | | 21,849 | | 23,010 | e | 23,777 | | 25,287 | | 26,746 | | 28,306 | | 29,947 | |
(% change) | | -5.4 | | 5.3 | | 3.3 | | 6.3 | | 5.8 | | 5.8 | | 5.8 | |
| | | | | | | | | | | | | | | |
Retail sales ($ million) | | 62,734 | | 66,149 | e | 68,303 | | 70,841 | | 73,366 | | 75,989 | | 78,720 | |
(% change) | | 2.4 | | 5.4 | | 3.3 | | 3.7 | | 3.6 | | 3.6 | | 3.6 | |
| | | | | | | | | | | | | | | |
Housing starts | | 27,054 | | 28,356 | | 27,598 | | 27,543 | | 27,008 | | 27,007 | | 27,005 | |
(% change) | | -1.5 | | 4.8 | | -2.7 | | -0.2 | | -1.9 | | 0.0 | | 0.0 | |
| | | | | | | | | | | | | | | |
BC consumer price index (2002 = 100) | | 117.7 | | 118.9 | | 120.9 | | 123.1 | | 125.6 | | 128.1 | | 130.7 | |
(% change) | | -0.1 | | 1.0 | | 1.6 | | 1.9 | | 2.0 | | 2.0 | | 2.0 | |
1 Domestic basis; wages, salaries and employers’ social contributions.
e Ministry of Finance estimate.
Table 3.6.3 Labour Marker Indicators
| | | | | | Forecast | |
| | 2013 | | 2014 | | 2015 | | 2016 | | 2017 | | 2018 | | 2019 | |
Population (on July 1) (000’s) | | 4,583 | | 4,631 | | 4,688 | | 4,748 | | 4,809 | | 4,871 | | 4,933 | |
(% change) | | 0.9 | | 1.1 | | 1.2 | | 1.3 | | 1.3 | | 1.3 | | 1.3 | |
Labour force population, 15+ Years (000’s) | | 3,787 | | 3,830 | | 3,879 | | 3,931 | | 3,984 | | 4,037 | | 4,089 | |
(% change) | | 1.1 | | 1.1 | | 1.3 | | 1.4 | | 1.3 | | 1.3 | | 1.3 | |
| | | | | | | | | | | | | | | |
Net in-migration (000’s) | | | | | | | | | | | | | | | |
| | | | | | | | | | | | | | | |
– International1,3 | | 34.5 | | 33.5 | e | 36.6 | | 40.3 | | 40.7 | | 40.9 | | 41.1 | |
– Interprovincial3 | | -0.8 | | 9.5 | e | 10.0 | | 10.5 | | 11.0 | | 11.5 | | 11.5 | |
– Total | | 33.6 | | 43.0 | e | 46.6 | | 50.8 | | 51.7 | | 52.4 | | 52.6 | |
| | | | | | | | | | | | | | | |
Participation rate2 (%) | | 64.0 | | 63.3 | | 63.2 | | 63.3 | | 63.3 | | 63.3 | | 63.2 | |
| | | | | | | | | | | | | | | |
Labour force (000’s) | | 2,425 | | 2,425 | | 2,453 | | 2,488 | | 2,523 | | 2,555 | | 2,585 | |
(% change) | | -0.1 | | 0.0 | | 1.2 | | 1.4 | | 1.4 | | 1.3 | | 1.2 | |
| | | | | | | | | | | | | | | |
Employment (000’s) | | 2,266 | | 2,278 | | 2,301 | | 2,329 | | 2,357 | | 2,386 | | 2,415 | |
(% change) | | 0.1 | | 0.6 | | 1.0 | | 1.2 | | 1.2 | | 1.2 | | 1.2 | |
| | | | | | | | | | | | | | | |
Unemployment rate (%) | | 6.6 | | 6.1 | | 6.2 | | 6.4 | | 6.6 | | 6.6 | | 6.6 | |
1 International migration includes net non-permanent residents and returning emigrants less net temporary residents abroad.
2 Percentage of the population 15 years of age and over in the labour force.
3 Components may not sum to total due to rounding.
e BC Stats estimate.
Budget and Fiscal Plan — 2015/16 to 2017/18
80
British Columbia Economic Review and Outlook
Table 3.6.4 Major Economic Assumptions
| | | | | | Forecast | |
| | 2013 | | 2014 | | 2015 | | 2016 | | 2017 | | 2018 | | 2019 | |
GDP (billions) | | | | | | | | | | | | | | | |
Canada real (2007 $; chain-weighted) | | 1,706 | | 1,746 | e | 1,781 | | 1,816 | | 1,856 | | 1,897 | | 1,939 | |
(% change) | | 2.0 | | 2.3 | | 2.0 | | 2.0 | | 2.2 | | 2.2 | | 2.2 | |
US real (2009 US$; chain-weighted) | | 15,710 | | 16,090 | | 16,499 | | 16,903 | | 17,326 | | 17,759 | | 18,203 | |
(% change) | | 2.2 | | 2.4 | | 2.5 | | 2.5 | | 2.5 | | 2.5 | | 2.5 | |
Japan real (2005 Yen; chain-weighted) | | 527,397 | | 527,651 | e | 531,633 | | 535,886 | | 541,245 | | 546,657 | | 552,124 | |
(% change) | | 1.6 | | 0.0 | | 0.8 | | 0.8 | | 1.0 | | 1.0 | | 1.0 | |
Europe real1 (% change) | | -0.4 | | 0.7 | e | 0.7 | | 1.2 | | 1.4 | | 1.4 | | 1.4 | |
China real (2005 US$) | | 4,864 | | 5,224 | | 5,574 | | 5,942 | | 6,334 | | 6,752 | | 7,198 | |
(% change) | | 7.7 | | 7.4 | | 6.7 | | 6.6 | | 6.6 | | 6.6 | | 6.6 | |
| | | | | | | | | | | | | | | |
Industrial production index | | | | | | | | | | | | | | | |
US (2007 = 100) | | 99.9 | | 104.2 | | 106.9 | | 109.7 | | 112.5 | | 115.5 | | 118.5 | |
(% change) | | 2.9 | | 4.3 | | 2.6 | | 2.6 | | 2.6 | | 2.6 | | 2.6 | |
Japan (2010 = 100) | | 96.9 | | 98.7 | | 99.6 | | 100.6 | | 101.6 | | 102.6 | | 103.6 | |
(% change) | | -0.6 | | 1.9 | | 0.9 | | 1.0 | | 1.0 | | 1.0 | | 1.0 | |
Europe1 (2010 = 100) | | 100.2 | | 100.8 | e | 101.5 | | 102.7 | | 104.2 | | 105.6 | | 107.1 | |
(% change) | | -0.7 | | 0.6 | | 0.7 | | 1.2 | | 1.4 | | 1.4 | | 1.4 | |
China (% change) | | 9.7 | | 8.3 | | 7.5 | | 7.5 | | 7.5 | | 7.5 | | 7.5 | |
| | | | | | | | | | | | | | | |
Housing starts2 (000’s) | | | | | | | | | | | | | | | |
Canada | | 188 | | 189 | | 175 | | 175 | | 180 | | 180 | | 180 | |
(% change) | | -12.5 | | 0.8 | | -7.6 | | 0.0 | | 2.9 | | 0.0 | | 0.0 | |
US | | 925 | | 1,006 | | 1,000 | | 1,025 | | 1,050 | | 1,050 | | 1,050 | |
(% change) | | 18.5 | | 8.7 | | -0.6 | | 2.5 | | 2.4 | | 0.0 | | 0.0 | |
Japan | | 980 | | 892 | | 850 | | 850 | | 850 | | 850 | | 850 | |
(% change) | | 11.0 | | -9.0 | | -4.7 | | 0.0 | | 0.0 | | 0.0 | | 0.0 | |
| | | | | | | | | | | | | | | |
Consumer price index | | | | | | | | | | | | | | | |
Canada (2002 = 100) | | 122.8 | | 125.2 | | 127.2 | | 129.7 | | 132.3 | | 135.0 | | 137.7 | |
(% change) | | 0.9 | | 2.0 | | 1.6 | | 2.0 | | 2.0 | | 2.0 | | 2.0 | |
| | | | | | | | | | | | | | | |
Canadian interest rates (%) | | | | | | | | | | | | | | | |
3-Month treasury bills | | 1.0 | | 0.9 | | 1.1 | | 1.8 | | 2.3 | | 3.1 | | 3.9 | |
10-year government bonds | | 2.3 | | 2.2 | | 2.5 | | 3.1 | | 3.8 | | 4.4 | | 5.0 | |
| | | | | | | | | | | | | | | |
United States interest rates (%) | | | | | | | | | | | | | | | |
3-Month treasury bills | | 0.1 | | 0.0 | | 0.4 | | 1.6 | | 2.3 | | 2.9 | | 3.6 | |
10-year government bonds | | 2.4 | | 2.5 | | 2.8 | | 3.4 | | 3.8 | | 4.4 | | 5.0 | |
| | | | | | | | | | | | | | | |
Exchange rate (US cents / Canadian $) | | 97.1 | | 90.5 | | 85.3 | | 85.5 | | 87.0 | | 87.2 | | 87.3 | |
| | | | | | | | | | | | | | | |
British Columbia goods and services | | | | | | | | | | | | | | | |
Export price deflator (% change) | | 2.3 | | 4.8 | e | 3.5 | | 3.5 | | 3.0 | | 2.8 | | 2.6 | |
1 Euro zone (18) is Austria, Belgium, Cyprus, Estonia, Finland, France, Germany, Greece, Ireland, Italy, Latvia, Luxembourg, Malta, Netherlands, Portugal, Slovakia, Slovenia and Spain.
2 British Columbia housing starts appear in Table 3.6.2.
e Ministry of Finance estimate.
Budget and Fiscal Plan — 2015/16 to 2017/18
81
British Columbia Economic Review and Outlook
The Economic Forecast Council, 2015
Introduction
The Budget Transparency and Accountability Act requires the Minister of Finance, in preparing each year’s provincial budget, to consult the Economic Forecast Council (the Council) on British Columbia’s economic outlook. The Council is comprised of 14 leading economists from several of Canada’s major banks and private research institutions.
The most recent meeting between the Minister and Council occurred on December 5, 2014, with forecasters presenting their estimates for economic performance in 2014 as well as their forecasts for 2015 and beyond. The main issues discussed by the Council included BC’s labour and housing markets, the critical role of migration in the provincial economy, BC’s prospective liquefied natural gas (LNG) industry as well as broader resource development in the province, the effects of lower oil prices, and the uneven performance of external economies.
Subsequent to December’s meeting, participants were permitted to submit revised forecasts until January 7, 2015 (9 of the 14 members chose to revise). Forecast details from the Council surveys are summarized in the table at the end of this topic box.
British Columbia Outlook
Council members’ estimates for BC’s economic growth in 2014 averaged 2.3 per cent, while forecasts for future expansion averaged 2.6 per cent in 2015, 2.8 per cent in 2016, and 2.5 per cent per year from 2017 to 2019. In the previous survey from one year ago, the Council projected average increases of 2.3 per cent in 2014, 2.7 per cent in 2015 and 2.7 per cent annually from 2016 to 2018 (see Chart 1). Some members indicated that the decline in their medium-term expectations reflected an anticipated reduction in potential output (or productive capacity) of the BC economy in those years, in part due to aging demographics.
Chart 1 — EFC Outlook for the BC Economy
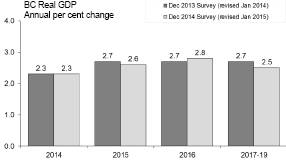
Source: Average of Economic Forecast Council forecasts
NOTE: Forecast from December 2013 EFC for 2016 and 2017-2019 is average growth for the years 2016-2018.
Council members, on average, expect BC’s annual economic growth to equal Canada’s in 2014, and then exceed Canada’s in 2015, 2016, and on average over the medium-term (see Chart 2).
Chart 2 — EFC Outlook for BC and Canada

Source: Average of Economic Forecast Council forecasts
BC’s labour market was discussed at length by the Council. While some members acknowledged that job growth has been modest in the province over the past couple of years, most indicated that the employment situation may be stronger than headline job numbers from the Labour Force Survey suggest. Many members noted that data from the Survey of Employment, Payroll and Hours reveal stable job growth in BC over the past two years and align better with trends observed in retail sales and housing construction in the province over this period.
Participants cited potential labour shortages as an ongoing issue in the economic outlook. Members explained that the province’s aging
Budget and Fiscal Plan — 2015/16 to 2017/18
82
British Columbia Economic Review and Outlook
workforce and anticipated skill shortages arising from major projects (such as LNG facilities) may impede BC businesses’ ability to meet their labour needs. As such, BC’s skills training initiatives and interprovincial and international migration were identified as critical components to the ongoing success of the province’s resource industries and overall economy.
As in previous years, Council members assessed BC’s housing market as being reasonably healthy. Most members expected the BC and Canadian housing markets to moderate slightly in the coming years, while a couple of members stated that this “soft landing” has already materialized and that the outlook for housing activity remains firm. However, several members noted that household debt levels in the province remain an issue and that British Columbians may be more sensitive than other Canadians to eventual interest rate increases due to comparatively larger mortgages in the province (a result of higher home prices).
The Council identified LNG prospects as a key source of optimism and uncertainty in BC’s economic outlook. Council members noted various possible benefits to the province if LNG facilities are developed, including increased exports, employment, natural gas exploration and government tax revenues. However, some members cautioned that the economic benefits to BC in the short term could be dampened depending on the import content of LNG plants (as imports of goods and services from other jurisdictions subtract from domestic GDP). Risks of delays and competition from other natural gas suppliers in countries such as Russia, the US and Australia were also discussed. Nevertheless, the Council was generally encouraged about LNG prospects in the province.
A timely topic of discussion at the meeting was the recent fall in oil prices. Some members noted that weakness in oil prices has been largely caused by increased supply as opposed to reduced demand. The Council agreed that, though lower oil prices hurt major oil-producing economies such as Alberta and Canada as a whole, they generally have a positive impact on global economic growth and particularly on economies that are net importers of oil (such as BC and the US).
Other pertinent topics raised by the Council included risks to BC’s mining industry given recent commodity price volatility as well as future fiber supply constraints in BC’s forestry industry. In addition, some members
British Columbia Economic Forecast Council:
Summary of BC real GDP Forecasts, annual per cent change
| | | | | | | | | | Average | |
Participant | | Organization | | 2014 | | 2015 | | 2016 | | 2017-2019 | |
Doug Porter | | Bank of Montreal1 | | 2.3 | | 2.4 | | 2.4 | | 2.0 | |
Cameron Muir | | BC Real Estate Association1 | | 2.3 | | 2.7 | | 2.7 | | 2.9 | |
Ken Peacock | | Business Council of BC | | 2.3 | | 2.6 | | 3.1 | | 2.9 | |
Helmut Pastrick | | Central 1 Credit Union1 | | 2.5 | | 2.7 | | 3.8 | | 3.1 | |
Avery Shenfeld | | CIBC1 | | 2.4 | | 2.5 | | 2.7 | | 2.5 | |
Marie-Christine Bernard | | Conference Board | | 2.2 | | 2.6 | | 2.5 | | 2.6 | |
Arlene Kish | | IHS Global Insight | | 2.3 | | 2.7 | | 2.6 | | 2.4 | |
Sébastien Lavoie | | Laurentian Bank Securities1 | | 2.2 | | 2.5 | | 2.5 | | 2.9 | |
Stéfane Marion | | National Bank1 | | 2.3 | | 2.5 | | 2.5 | | na | |
Craig Wright | | RBC1 | | 2.8 | | 2.9 | | 2.5 | | 2.1 | |
Warren Jestin | | Scotiabank1 | | 2.1 | | 2.5 | | 2.7 | | 2.9 | |
Ernie Stokes | | Stokes Economic Consulting | | 2.2 | | 2.9 | | 4.0 | | 2.3 | |
Derek Burleton | | TD1 | | 2.3 | | 2.5 | | 2.4 | | 1.9 | |
David Baxter | | Urban Futures Institute | | 2.3 | | 2.2 | | 2.6 | | 2.5 | |
Average | | | | 2.3 | | 2.6 | | 2.8 | | 2.5 | |
Standard Deviation | | | | 0.2 | | 0.2 | | 0.5 | | 0.4 | |
1 Updated subsequent to the December 5, 2014 meeting.
Budget and Fiscal Plan — 2015/16 to 2017/18
83
British Columbia Economic Review and Outlook
mentioned the need to manage rising healthcare costs, address consultation and accommodation issues with First Nations, and maintain a competitive tax system in the province.
Canadian Outlook
The Council estimates, on average, that Canada’s economy grew by 2.3 per cent in 2014, and expects Canadian real GDP growth to be 2.3 per cent per year in both 2015 and 2016, and 2.2 per cent on average during the 2017 to 2019 period.
Members identified a number of reasons why Canada’s economic performance is expected to lag behind BC’s over the forecast horizon. Some members expected fiscal policy to be a drag on economic growth in several Canadian provinces and commended the BC government’s relative fiscal strength. Members also discussed the net negative impact of lower oil prices on the overall Canadian economy (with several members revising down their near-term Canadian forecasts between December 2014 and January 2015 as oil prices continued to slide). Furthermore, some Council members mentioned an ongoing trend towards the western provinces as main destinations for migrants and drivers of national economic growth.
International Outlook
On average, Council members estimate that US real GDP increased by 2.3 per cent in 2014 and forecast growth of 3.1 per cent for 2015, 2.8 per cent for 2016 and 2.6 per cent annually from 2017 to 2019.
The Council agreed that US economic growth seems to have finally gained traction after the financial crisis and severe recession in 2008/09. As evidence of this apparent turnaround, members pointed to substantial job gains over the past year, strengthening household balance sheets, and ongoing improvements in the US housing market. A couple of members also noted that the economic drag from fiscal restraint by federal, state and local governments over the past several years has now largely dissipated. Risks remain, however, as some members questioned the underlying resiliency of the US economy going forward, particularly as interest rates begin to rise. Regardless, the current strength in the US economy was characterized as an anomaly in the international landscape and a welcome offset to widespread weakness in other major economies.
Participants noted that the recent slowdown in China has negatively impacted BC businesses, both through reduced exports and increased commodity price volatility. Most expected the slowdown to continue, but agreed that substantial opportunities remain for BC (including for service industries such as tourism) as the Chinese economy evolves towards consumer driven growth.
Members also noted the enduring problems in Europe and significant political and economic risks surrounding Russia. At the conclusion of the meeting, various participants warned that substantial uncertainty continues to cloud the global and domestic economic outlook and stressed the need for continued prudence in BC’s fiscal planning.
Canadian Dollar
As usual, participants produced divergent forecasts for the value of the Canadian dollar in 2015, with estimates ranging from 83.0 US cents to 90.5 US cents. For 2016, projections ranged from 81.3 US cents to 92.0 US cents, and from 80.6 US cents to 95.0 US cents over the 2017 to 2019 period.
Chart 3 — EFC Outlook for the Dollar
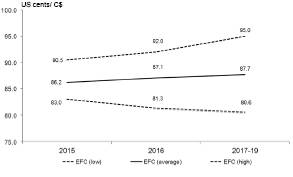
Budget and Fiscal Plan — 2015/16 to 2017/18
84
British Columbia Economic Review and Outlook
Forecast Survey — Participants’ Opinions
All figures are based | | 2014 | | 2015 | | 2016 | | 2017 to 2019 | |
on annual averages | | Range | | Average 1 | | Range | | Average 1 | | Range | | Average 1 | | Range | | Average 2 | |
| | | | | | | | | | | | | | | | | |
British Columbia | | | | | | | | | | | | | | | | | |
| | | | | | | | | | | | | | | | | |
Real GDP (% change) | | 2.1 – 2.8 | | 2.3 (14) | 3 | 2.2 – 2.9 | | 2.6 (14) | | 2.4 – 4.0 | | 2.8 (14) | | 1.9 – 3.1 | | 2.5 (13) | |
Nominal GDP (% change) | | 3.5 – 4.8 | | 4.1 (13) | | 3.4 – 5.2 | | 4.1 (13) | | 4.1 – 6.0 | | 4.8 (13) | | 3.9 – 5.2 | | 4.6 (12) | |
GDP Deflator (% change) | | 1.0 – 2.6 | | 1.8 (13) | | 1.0 – 2.5 | | 1.5 (13) | | 1.6 – 2.5 | | 2.0 (13) | | 1.9 – 2.7 | | 2.1 (12) | |
Real business non-residential | | | | | | | | | | | | | | | | | |
investment (% change) | | -8.0 – 5.3 | | -0.9 (8) | | 1.1 – 13.0 | | 4.1 (8) | | 2.4 – 26.7 | | 9.3 (8) | | -1.2 – 8.0 | | 4.1 (8) | |
Real business machinery and | | | | | | | | | | | | | | | | | |
equipment investment (%change) | | -3.9 – 7.0 | | 1.3 (7) | | -0.1 – 13.0 | | 4.1 (7) | | 3.0 – 27.7 | | 11.1 (7) | | 3.5 – 10.5 | | 6.2 (7) | |
Household Income (% change) | | 3.0 – 4.1 | | 3.6 (9) | | 3.6 – 4.6 | | 4.1 (9) | | 3.7 – 6.0 | | 4.6 (9) | | 3.9 – 4.9 | | 4.3 (9) | |
Net Migration (thousand | | | | | | | | | | | | | | | | | |
persons) | | 37.9 – 45.2 | | 40.6 (11) | | 34.7 – 50.9 | | 42.1 (11) | | 40.0 – 50.0 | | 45.2 (11) | | 42.7 – 54.2 | | 48.0 (11) | |
Employment (% change) | | 0.7 – 1.5 | | 0.9 (14) | | 1.1 – 1.8 | | 1.4 (14) | | 1.0 – 2.5 | | 1.5 (14) | | 0.7 – 1.8 | | 1.3 (13) | |
Unemployment rate (%) | | 6.0 – 6.1 | | 6.1 (14) | | 5.6 – 6.2 | | 5.9 (14) | | 5.2 – 6.2 | | 5.8 (14) | | 5.0 – 6.1 | | 5.6 (13) | |
Net operating surplus | | | | | | | | | | | | | | | | | |
of corporations (% change) | | -2.1 – 20.9 | | 8.1 (8) | | 1.4 – 8.5 | | 5.1 (8) | | 1.3 – 7.5 | | 4.6 (8) | | -1.5 – 6.5 | | 4.0 (8) | |
Housing starts (thousand | | | | | | | | | | | | | | | | | |
units) | | 27.0 – 28.9 | | 28.2 (14) | | 26.0 – 29.3 | | 28.1 (14) | | 25.0 – 30.6 | | 27.9 (14) | | 24.0 – 32.1 | | 27.7 (13) | |
Retail sales (% change) | | 4.9 – 5.8 | | 5.5 (12) | | 3.3 – 4.6 | | 3.9 (12) | | 3.0 – 7.3 | | 4.4 (12) | | 3.2 – 5.9 | | 4.2 (12) | |
Consumer price index (% chg) | | 1.0 – 1.3 | | 1.1 (14) | | 0.9 – 2.1 | | 1.4 (14) | | 1.6 – 2.2 | | 1.9 (14) | | 1.8 – 2.2 | | 2.0 (13) | |
| | | | | | | | | | | | | | | | | |
United States | | | | | | | | | | | | | | | | | |
| | | | | | | | | | | | | | | | | |
Real GDP (% change) | | 2.0 – 2.8 | | 2.3 (14) | | 2.2 – 3.5 | | 3.1 (14) | | 2.3 - 3.2 | | 2.8 (14) | | 2.2 - 3.1 | | 2.6 (13) | |
Intended Federal Funds | | | | | | | | | | | | | | | | | |
rate (%) | | 0.09 – 0.25 | | 0.16 (13) | | 0.25 – 0.75 | | 0.47 (13) | | 0.50 – 2.00 | | 1.40 (13) | | 1.00 – 3.61 | | 2.68 (12) | |
Housing starts (million units) | | 0.98 – 1.04 | | 1.00 (12) | | 1.10 – 1.36 | | 1.21 (12) | | 1.10 – 1.67 | | 1.36 (12) | | 1.10 – 1.80 | | 1.48 (12) | |
Canada | | | | | | | | | | | | | | | | | |
| | | | | | | | | | | | | | | | | |
Real GDP (% change) | | 2.1 – 2.5 | | 2.3 (14) | | 2.0 - 2.7 | | 2.3 (14) | | 2.0 - 2.7 | | 2.3 (14) | | 1.8 - 2.6 | | 2.2 (13) | |
Bank of Canada overnight target rate (%) | | 0.92 – 1.00 | | 0.99 (13) | | 1.00 – 1.25 | | 1.09 (13) | | 1.40 – 2.10 | | 1.71 (13) | | 1.75 – 3.39 | | 2.76 (12) | |
Exchange rate (US cents/C$) | | 90.0 – 91.1 | | 90.7 (14) | | 83.0 – 90.5 | | 86.2 (14) | | 81.3 – 92.0 | | 87.1 (14) | | 80.6 – 95.0 | | 87.7 (13) | |
Housing starts (million units) | | 0.19 – 0.19 | | 0.19 (14) | | 0.18 – 0.20 | | 0.19 (14) | | 0.18 – 0.22 | | 0.19 (14) | | 0.18 – 0.22 | | 0.19 (13) | |
Consumer price index (% chg) | | 1.9 – 2.1 | | 1.9 (13) | | 0.6 – 2.2 | | 1.5 (13) | | 2.0 – 2.5 | | 2.1 (13) | | 1.9 – 2.2 | | 2.1 (12) | |
1 Based on responses from participants providing forecasts.
2 Participants provided an average forecast for 2017 to 2019.
3 Number of respondents shown in parenthesis.
Budget and Fiscal Plan — 2015/16 to 2017/18
85
Part 4: 2014/15 UPDATED FINANCIAL FORECAST (THIRD QUARTERLY REPORT)
Introduction
Table 4.1 2014/15 Forecast Update
| | | | First | | Second | | Third | |
| | Budget | | Quarterly | | Quarterly | | Quarterly | |
($ millions) | | 2014 | | Report | | Report | | Report | |
Revenue | | 44,800 | | 45,315 | | 45,509 | | 45,772 | |
Expense | | (44,416 | ) | (44,849 | ) | (44,865 | ) | (44,793 | ) |
Surplus before forecast allowance | | 384 | | 466 | | 644 | | 979 | |
Forecast allowance | | (200 | ) | (200 | ) | (200 | ) | (100 | ) |
Surplus | | 184 | | 266 | | 444 | | 879 | |
Capital spending: | | | | | | | | | |
Taxpayer-supported capital spending | | 4,030 | | 4,198 | | 4,012 | | 3,637 | |
Self-supported capital spending | | 2,590 | | 2,651 | | 2,651 | | 2,604 | |
| | 6,620 | | 6,849 | | 6,663 | | 6,241 | |
Provincial Debt: | | | | | | | | | |
Taxpayer-supported debt | | 43,075 | | 42,290 | | 41,990 | | 42,302 | |
Self-supported debt | | 21,463 | | 21,257 | | 21,253 | | 21,428 | |
Total debt (including forecast allowance) | | 64,738 | | 63,747 | | 63,443 | | 63,830 | |
Taxpayer-supported debt-to-GDP ratio: | | | | | | | | | |
As previously forecast | | 18.4 | % | 18.1 | % | | | | |
Impact of Statistics Canada update 1 | | -0.3 | % | -0.3 | % | | | | |
Restated and quarterly projections | | 18.1 | % | 17.8 | % | 17.7 | % | 17.7 | % |
1 See Provincial Economic Accounts Update topic box on page 40 of the second Quarterly Report.
The third quarter fiscal outlook for 2014/15 forecasts a surplus of $879 million — $435 million higher than the projection in the second Quarterly Report. The improved outlook is largely due to increased forecasted taxation revenue and commercial Crown corporations net income. Offsetting impacts include lower natural resource revenues as well as a small overall increase in government’s spending for the year.
Chart 4.1 2014/15 operating results — changes from second Quarterly Report
$ millions
Surplus increased by $435 million
Budget and Fiscal Plan — 2015/16 to 2017/18
2014/15 Updated Financial Forecast (Third Quarterly Report)
Table 4.2 2014/15 Financial Forecast Changes
| | ($ millions) | |
2014/15 surplus — Budget 2014 (February 18, 2014) | | 184 | | | | | | 184 | |
2014/15 surplus — first Quarterly Report (September 9, 2014) | | | | 266 | | | | | |
2014/15 surplus — second Quarterly Report (November 26, 2014) | | | | | | 444 | | | |
| | Q1 | | Q2 | | Q3 | | Total | |
| | Update | | Update | | Update | | Changes | |
Revenue changes: | | | | | | | | | |
Personal income tax — mainly higher 2013 tax assessments | | 337 | | — | | 235 | | 572 | |
Corporate income tax — increased federal government instalments and prior-year adjustment, reflecting higher 2013 tax assessments | | 119 | | 18 | | 151 | | 288 | |
Provincial sales tax — carry forward impact of lower 2013/14 results | | (218 | ) | — | | 20 | | (198 | ) |
Harmonized sales tax — prior year results | | — | | — | | (94 | ) | (94 | ) |
Property transfer tax — stronger year-to-date sales results | | 50 | | 100 | | 85 | | 235 | |
Other taxation sources | | (13 | ) | (11 | ) | 2 | | (22 | ) |
Natural gas royalties — mainly higher prices, partially offset by lower production volumes and higher utilization of royalty programs | | 202 | | 12 | | (113 | ) | 101 | |
Forests — mainly reduced harvest volumes | | 46 | | (31 | ) | (43 | ) | (28 | ) |
Coal, metals and minerals — lower coal prices and mining profits | | (98 | ) | (8 | ) | (12 | ) | (118 | ) |
Other natural resources | | 6 | | (11 | ) | 2 | | (3 | ) |
Fees — mainly improved SUCH sector projections | | 44 | | 8 | | 20 | | 72 | |
Investment earnings — higher SUCH and taxpayer supported Crown agencies’ forecasts | | 5 | | 22 | | 9 | | 36 | |
Miscellaneous — reduced SUCH sector outlook and reprofiling property transfers to non-profit societies to support building capacity in the non-profit sector | | (100 | ) | 17 | | (80 | ) | (163 | ) |
Release of surplus assets — reprofiling to 2015/16 | | — | | — | | (79 | ) | (79 | ) |
Federal government contributions — mainly higher revenue from SUCH sector agencies, partly offset by lower health and social transfers in respect of prior years | | 14 | | 9 | | (7 | ) | 16 | |
Commercial Crown agencies operating results: | | | | | | | | | |
ICBC — mainly claims cost savings and higher investment income | | 111 | | 71 | | 166 | | 348 | |
Other commercial Crown agencies changes | | 10 | | (2 | ) | 1 | | 9 | |
Total revenue changes | | 515 | | 194 | | 263 | | 972 | |
Less: expense increases (decreases): | | | | | | | | | |
Consolidated Revenue Fund changes: | | | | | | | | | |
Statutory spending: | | | | | | | | | |
Direct fire costs | | 287 | | (50 | ) | — | | 237 | |
Emergency program flood-related costs | | 14 | | 1 | | — | | 15 | |
Teachers’ Pension Plan liability adjustment | | 66 | | — | | — | | 66 | |
BC Training and Education Savings Program - higher eligibility volumes | | 8 | | — | | — | | 8 | |
Innovative Clean Energy Fund | | — | | — | | 9 | | 9 | |
Elections BC | | 3 | | — | | — | | 3 | |
BC Timber Sales | | — | | 3 | | 2 | | 5 | |
Other statutory spending | | — | | — | | 4 | | 4 | |
Refundable tax credit transfers | | (6 | ) | 46 | | 30 | | 70 | |
Prior year liability adjustments | | — | | (15 | ) | (50 | ) | (65 | ) |
Management of public debt (net) — reflects lower interest rates and revisions to scheduled borrowing | | (15 | ) | (14 | ) | (36 | ) | (65 | ) |
Spending funded by third party recoveries | | 8 | | 13 | | (2 | ) | 19 | |
(Increase) decrease in operating transfers to service delivery agencies | | 34 | | 91 | | (6 | ) | 119 | |
Changes in spending profile of service delivery agencies: | | | | | | | | | |
School districts — lower operating expenses due to job action | | (163 | ) | (97 | ) | — | | (260 | ) |
Universities — higher amortization, grants to third parties and wage settlements | | 14 | | (1 | ) | 12 | | 25 | |
Colleges — primarily higher amortization costs | | (10 | ) | 20 | | 3 | | 13 | |
Health authorities and hospital societies — increasing demand for healthcare services | | 110 | | 26 | | (2 | ) | 134 | |
Other service delivery agencies | | 7 | | (7 | ) | (36 | ) | (36 | ) |
Removal of expenditure management targets from fiscal plan | | 76 | | — | | — | | 76 | |
Total expense increases (decreases) | | 433 | | 16 | | (72 | ) | 377 | |
Subtotal | | 82 | | 178 | | 335 | | 595 | |
Reduction in forecast allowance | | — | | — | | 100 | | 100 | |
Total changes | | 82 | | 178 | | 435 | | 695 | |
2014/15 surplus — first Quarterly Report | | 266 | | | | | | | |
2014/15 surplus — second Quarterly Report | | | | 444 | | | | | |
2014/15 surplus — third Quarterly Report | | | | | | 879 | | 879 | |
Budget and Fiscal Plan — 2015/16 to 2017/18
88
2014/15 Updated Financial Forecast (Third Quarterly Report)
Other changes from the second Quarterly Report include capital spending reductions of $422 million, a $312 million increase in taxpayer-supported debt, and a $100 million reduction in the forecast allowance reflecting minimized risks for the remainder of the fiscal year.
Revenue
Total government revenue is now forecast to be $263 million higher than the second Quarterly Report. Major changes include:
· a $399 million improvement in taxation revenue, mainly in personal and corporate income tax revenue from finalization of the 2013 tax assessments and in property transfer tax due to stronger sales, partially offset by a reduced HST entitlement for prior years;
· a $166 million reduction in natural resource revenue, mainly for natural gas, but also lower for forests;
· a $137 million reduction in fees and other revenue, mainly due to re-profiling assets sales to 2015/16 to ensure maximum value for taxpayers is obtained; and
· a $167 million increase in commercial Crown corporations operating surplus, mainly due to improvements in ICBC’s investment income.
Table 4.2 provides a detailed breakdown of changes in the revenue by quarter from Budget 2014.
Expense
Total government spending is now forecast to be $72 million lower than the second Quarterly Report. Lower spending is due mainly to:
· $36 million reduction in debt servicing costs due to improved timing of borrowing;
· $50 million in prior year liability adjustments;
· $23 million in net reductions across government service delivery agencies, primarily in the transportation sector; and
· $8 million in other savings.
These reductions were partially offset by:
· $30 million increase in refundable tax credits; and
· $15 million higher statutory spending, mainly in relation to the Innovative Clean Energy Fund.
In addition to the changes above, the remaining Core Review saving target has been allocated to the Ministry of Health ($25 million) and Ministry of Advanced Education ($1 million) to reflect savings anticipated by the end of the fiscal year.
Table 4.2 provides a detailed breakdown of changes in the operating results by quarter from Budget 2014.
Contingencies
Budget 2014 included a Contingencies vote allocation of $300 million in 2014/15 to help manage unexpected costs and pressures as well as fund priority initiatives. This allocation is unchanged in the third Quarterly Report forecast.
Budget and Fiscal Plan — 2015/16 to 2017/18
89
2014/15 Updated Financial Forecast (Third Quarterly Report)
Government Employment (FTEs)
The projection of government employment for 2014/15 has been increased by 180 FTEs from 26,420 to 26,600 since the second Quarterly Report based on government’s commitment to filling positions which are critical to front line service delivery.
Provincial Capital Spending
Capital spending is projected to total $6.2 billion in 2014/15 — $422 million lower than the forecast in the second Quarterly Report (see Table 4.3).
The reduction mainly relates to construction schedule adjustments on taxpayer-supported projects (primarily in the areas of education and transportation projects) and lower forecast spending on self-funded health and post-secondary institution projects.
Self-supported capital spending is also down $47 million from the second Quarterly Report forecast mainly due to deferred spending for the Port Mann Bridge/Highway 1 and Waneta Dam expansion projects.
Table 4.3 2014/15 Capital Spending Update
| | ($ millions) | |
2014/15 capital spending — Budget 2014 (February 18, 2014) | | 6,620 | | | | | | 6,620 | |
2014/15 capital spending — first Quarterly Report (September 9, 2014) | | | | 6,849 | | | | | |
2014/15 capital spending — second Quarterly Report (November 26, 2014) | | | | | | 6,663 | | | |
| | Q1 | | Q2 | | Q3 | | Total | |
| | Update | | Update | | Update | | Changes | |
Taxpayer-supported changes: | | | | | | | | | |
Health project approvals since Budget 2014 | | 94 | | — | | — | | 94 | |
Changes in internally-financed spending: | | | | | | | | | |
– health authorities | | 129 | | (27 | ) | (18 | ) | 84 | |
– post-secondary institutions | | (9 | ) | (57 | ) | (37 | ) | (103 | ) |
Project scheduling changes: | | | | | | | | | |
– health facilities | | — | | (7 | ) | (11 | ) | (18 | ) |
– school projects | | (5 | ) | — | | (100 | ) | (105 | ) |
– transportation projects | | (29 | ) | (68 | ) | (168 | ) | (265 | ) |
– other | | (12 | ) | (27 | ) | (41 | ) | (80 | ) |
Total taxpayer-supported | | 168 | | (186 | ) | (375 | ) | (393 | ) |
| | | | | | | | | |
Self-supported changes: | | | | | | | | | |
Carry-over of prior year budgeted spending, partially offset by delayed spending: | | | | | | | | | |
– Port Mann Bridge/Highway 1 | | 37 | | — | | (25 | ) | 12 | |
– Columbia River power projects — Waneta Dam expansion | | 26 | | — | | (16 | ) | 10 | |
Other | | (2 | ) | — | | (6 | ) | (8 | ) |
Total self-supported | | 61 | | — | | (47 | ) | 14 | |
Total changes | | 229 | | (186 | ) | (422 | ) | (379 | ) |
2014/15 capital spending — first Quarterly Report | | 6,849 | | | | | | | |
2014/15 capital spending — second Quarterly Report | | | | 6,663 | | | | | |
2014/15 capital spending — third Quarterly Report | | | | | | 6,241 | | 6,241 | |
Budget and Fiscal Plan — 2015/16 to 2017/18
90
2014/15 Updated Financial Forecast (Third Quarterly Report)
Provincial Debt
The provincial debt, including the $100 million forecast allowance, is projected to total $63.8 billion by the end of the fiscal year — $387 million higher than the projection in the second Quarterly Report.
Table 4.4 2014/15 Provincial Debt Update
| | ($ millions) | |
2014/15 provincial debt — Budget 2014 (February 18, 2014) | | 64,738 | | | | | | | |
Change in 2013/14 actual results from Budget 2014 forecast 1 | | (950) | | | | | | | |
Updated Budget 2014 projection 2 | | 63,788 | | | | | | 63,788 | |
2014/15 provincial debt — first Quarterly Report (September 9, 2014) | | | | 63,747 | | | | | |
2014/15 provincial debt — second Quarterly Report (November 26, 2014) | | | | | | 63,443 | | | |
| | Q1 | | Q2 | | Q3 | | Total | |
| | Update | | Update | | Update | | Changes | |
Taxpayer-supported changes: | | | | | | | | | |
Government operating: | | | | | | | | | |
– cash management strategy target adjustment | | 307 | | (100 | ) | (93 | ) | 114 | |
– higher revenue cash receipts | | (321 | ) | (102 | ) | (277 | ) | (700 | ) |
– other changes | | (87 | ) | 21 | | 18 | | (48 | ) |
– financing requirements prior to year-end | | — | | — | | 950 | | 950 | |
| | (101 | ) | (181 | ) | 598 | | 316 | |
Capital debt: | | | | | | | | | |
– change in capital spending | | 168 | | (186 | ) | (375 | ) | (393 | ) |
– change in contributions from external parties | | (25 | ) | 11 | | (137 | ) | (151 | ) |
– change in internal financing | | (20 | ) | 56 | | 226 | | 262 | |
Total capital debt changes | | 123 | | (119 | ) | (286 | ) | (282 | ) |
Total taxpayer-supported | | 22 | | (300 | ) | 312 | | 34 | |
Self-supported changes: | | | | | | | | | |
– change in capital spending | | 61 | | — | | (47 | ) | 14 | |
– increase in internal financing | | (124 | ) | (4 | ) | 222 | | 94 | |
Total self-supported | | (63 | ) | (4 | ) | 175 | | 108 | |
Forecast allowance changes: | | | | | | | | | |
Adjustment for forecast allowance | | — | | — | | (100 | ) | (100 | ) |
Total changes | | (41 | ) | (304 | ) | 387 | | 42 | |
2014/15 provincial debt — first Quarterly Report | | 63,747 | | | | | | | |
2014/15 provincial debt — second Quarterly Report | | | | 63,443 | | | | | |
2014/15 provincial debt — third Quarterly Report | | | | | | 63,830 | | 63,830 | |
1 Excludes unused portion of the forecast allowance.
2 The Budget 2014 projection is based on an increase in debt for 2014/15 over a forecasted result for 2013/14. The revised projection reflects the same projected increase over the actual results for 2013/14.
Taxpayer-supported debt is projected to be $42.3 billion — $312 million higher than the projection in the second Quarterly Report. The increase reflects higher direct operating debt ($598 million increase), primarily due to anticipated financing prior to year-end in anticipation of early April requirements, partially offset by debt reductions resulting from the higher surplus and government’s cash management strategy.
The decrease in taxpayer-supported capital debt (down $286 million) is mainly due to reduced capital financing requirements — i.e. lower capital spending net of changes to contributions from external parties and internal financing of capital.
Budget and Fiscal Plan — 2015/16 to 2017/18
91
2014/15 Updated Financial Forecast (Third Quarterly Report)
Self-supported debt is projected to be $21.4 billion — $175 million higher than the projection in the second Quarterly Report mainly due to lower capital spending offset by increased borrowing requirements for operating cash flows.
The forecast allowance is down $100 million from the second Quarterly Report to mirror the operating statement forecast allowance.
Details on changes in provincial debt by quarter are shown in Table 4.4.
Risks to the Fiscal Forecast
There are a number of risks and pressures to the fiscal plan — in some instances reflecting risks to the BC economic outlook, which are largely due to the continued uncertainty surrounding global economic activity.
Revenues in British Columbia can be volatile, largely due to the influence of the cyclical nature of the natural resource sector in the economy. Changes in energy or commodity prices, such as natural gas and lumber, may have a significant effect on revenue and the fiscal forecast.
The spending forecast contained in the fiscal plan is based on ministry and service delivery agency plans and strategies. Changes to planning assumptions, such as utilization or demand rates for government services in the health care, education, or community social services sectors, and costs associated with natural disaster response represent the main spending risks.
The potential fiscal impact from these risks is covered by the $300 million Contingencies vote and the $100 million forecast allowance.
Supplementary Schedules
The following tables provide the financial results for the nine months ended December 31, 2014 and the 2014/15 full-year forecast.
Table 4.5 2014/15 Operating Statement
| | Year-to-Date to December 31 | | Full Year | |
| | 2014/15 | | Actual | | 2014/15 | | Actual | |
($ millions) | | Budget | | Actual | | Variance | | 2013/14 | | Budget | | Forecast | | Variance | | 2013/14 | |
Revenue | | 32,961 | | 33,749 | | 788 | | 32,363 | | 44,800 | | 45,772 | | 972 | | 43,728 | |
Expense | | (32,176 | ) | (32,017 | ) | 159 | | (31,668 | ) | (44,416 | ) | (44,793 | ) | (377 | ) | (43,375 | ) |
Surplus before forecast allowance | | 785 | | 1,732 | | 947 | | 695 | | 384 | | 979 | | 595 | | 353 | |
Forecast allowance | | — | | — | | — | | — | | (200 | ) | (100 | ) | 100 | | — | |
Surplus | | 785 | | 1,732 | | 947 | | 695 | | 184 | | 879 | | 695 | | 353 | |
Accumulated surplus beginning of the year | | 1,748 | | 1,654 | | (94 | ) | 1,301 | | 1,748 | | 2,135 | | 387 | | 1,301 | |
Accumulated surplus before comprehensive income | | 2,533 | | 3,386 | | 853 | | 1,996 | | 1,932 | | 3,014 | | 1,082 | | 1,654 | |
Accumulated other comprehensive income from self-supported Crown agencies | | 131 | | 62 | | (69 | ) | 279 | | (175 | ) | (412 | ) | (237 | ) | 481 | |
Accumulated surplus end of period | | 2,664 | | 3,448 | | 784 | | 2,275 | | 1,757 | | 2,602 | | 845 | | 2,135 | |
Budget and Fiscal Plan — 2015/16 to 2017/18
92
2014/15 Updated Financial Forecast (Third Quarterly Report)
Table 4.6 2014/15 Revenue by Source
| | Year-to-Date to December 31 | | Full Year | |
| | 2014/15 | | Actual | | 2014/15 | | Actual | |
($ millions) | | Budget | | Actual | | Variance | | 2013/14 | | Budget | | Forecast | | Variance | | 2013/14 | |
Taxation | | | | | | | | | | | | | | | | | |
Personal income | | 5,553 | | 5,900 | | 347 | | 4,995 | | 7,491 | | 8,063 | | 572 | | 6,862 | |
Corporate income | | 1,562 | | 1,698 | | 136 | | 1,570 | | 2,348 | | 2,636 | | 288 | | 2,427 | |
Sales 1 | | 4,636 | | 4,389 | | (247 | ) | 4,281 | | 5,964 | | 5,672 | | (292 | ) | 5,303 | |
Fuel | | 722 | | 714 | | (8 | ) | 718 | | 936 | | 927 | | (9 | ) | 917 | |
Carbon | | 870 | | 873 | | 3 | | 872 | | 1,228 | | 1,240 | | 12 | | 1,222 | |
Tobacco | | 599 | | 583 | | (16 | ) | 555 | | 780 | | 770 | | (10 | ) | 724 | |
Property | | 1,597 | | 1,577 | | (20 | ) | 1,526 | | 2,156 | | 2,137 | | (19 | ) | 2,080 | |
Property transfer | | 641 | | 847 | | 206 | | 737 | | 804 | | 1,039 | | 235 | | 937 | |
Insurance premium and other | | 344 | | 343 | | (1 | ) | 342 | | 450 | | 454 | | 4 | | 458 | |
| | 16,524 | | 16,924 | | 400 | | 15,596 | | 22,157 | | 22,938 | | 781 | | 20,930 | |
Natural resources | | | | | | | | | | | | | | | | | |
Natural gas royalties | | 309 | | 439 | | 130 | | 252 | | 441 | | 542 | | 101 | | 445 | |
Forests | | 524 | | 506 | | (18 | ) | 483 | | 785 | | 757 | | (28 | ) | 719 | |
Other natural resource 2 | | 1,323 | | 1,281 | | (42 | ) | 1,343 | | 1,784 | | 1,663 | | (121 | ) | 1,791 | |
| | 2,156 | | 2,226 | | 70 | | 2,078 | | 3,010 | | 2,962 | | (48 | ) | 2,955 | |
Other revenue | | | | | | | | | | | | | | | | | |
Medical Services Plan premiums | | 1,694 | | 1,691 | | (3 | ) | 1,606 | | 2,271 | | 2,277 | | 6 | | 2,158 | |
Other fees 3 | | 2,189 | | 2,236 | | 47 | | 2,209 | | 3,065 | | 3,131 | | 66 | | 3,052 | |
Investment earnings | | 910 | | 862 | | (48 | ) | 988 | | 1,091 | | 1,127 | | 36 | | 1,113 | |
Miscellaneous 4 | | 1,878 | | 1,858 | | (20 | ) | 2,055 | | 2,758 | | 2,595 | | (163 | ) | 2,884 | |
Release of surplus assets | | 146 | | 48 | | (98 | ) | 145 | | 200 | | 121 | | (79 | ) | 433 | |
| | 6,817 | | 6,695 | | (122 | ) | 7,003 | | 9,385 | | 9,251 | | (134 | ) | 9,640 | |
Contributions from the federal government | | | | | | | | | | | | | | | | | |
Health and social transfers | | 4,380 | | 4,366 | | (14 | ) | 4,385 | | 5,840 | | 5,812 | | (28 | ) | 5,869 | |
Other federal contributions 5 | | 1,025 | | 966 | | (59 | ) | 1,042 | | 1,523 | | 1,567 | | 44 | | 1,633 | |
| | 5,405 | | 5,332 | | (73 | ) | 5,427 | | 7,363 | | 7,379 | | 16 | | 7,502 | |
Commercial Crown corporation net income | | | | | | | | | | | | | | | | | |
BC Hydro | | 302 | | 368 | | 66 | | 373 | | 582 | | 588 | | 6 | | 549 | |
Liquor Distribution Branch | | 695 | | 725 | | 30 | | 695 | | 862 | | 871 | | 9 | | 877 | |
BC Lotteries (net of payments to the federal government) | | 898 | | 929 | | 31 | | 894 | | 1,183 | | 1,198 | | 15 | | 1,165 | |
ICBC 6 | | 149 | | 533 | | 384 | | 296 | | 252 | | 600 | | 348 | | 136 | |
Transportation Investment Corporation (Port Mann) | | (57 | ) | (59 | ) | (2 | ) | (49 | ) | (79 | ) | (89 | ) | (10 | ) | (88 | ) |
Other 7 | | 72 | | 76 | | 4 | | 50 | | 85 | | 74 | | (11 | ) | 62 | |
| | 2,059 | | 2,572 | | 513 | | 2,259 | | 2,885 | | 3,242 | | 357 | | 2,701 | |
Total revenue | | 32,961 | | 33,749 | | 788 | | 32,363 | | 44,800 | | 45,772 | | 972 | | 43,728 | |
1 Includes provincial sales tax and harmonised sales tax/social services tax/hotel room tax related to prior years.
2 Columbia River Treaty, other energy and minerals, water rental and other resources.
3 Post-secondary, healthcare-related, motor vehicle, and other fees.
4 Includes reimbursements for health care and other services provided to external agencies, and other recoveries.
5 Includes contributions for health, education, community development, housing and social service programs, and transportation projects.
6 The 2014/15 forecast amount represents ICBC’s projected earnings during government’s fiscal year. On ICBC’s fiscal year basis (December), the forecast for 2014 is $373 million.
7 Includes Columbia Power Corporation, BC Railway Company, Columbia Basin Trust power projects, and post secondary institutions self-supported subsidiaries. Also includes gain on the sale of LDB’s liquor distribution warehouse (budget $34 million, actual $37 million).
Budget and Fiscal Plan — 2015/16 to 2017/18
93
2014/15 Updated Financial Forecast (Third Quarterly Report)
Table 4.7 2014/15 Expense by Ministry, Program and Agency 1
| | Year-to-Date to December 31 | | Full Year | |
| | 2014/15 | | Actual | | 2014/15 | | Actual | |
($ millions) | | Budget | | Actual | | Variance | | 2013/14 2 | | Budget | | Forecast | | Variance | | 2013/14 2 | |
Office of the Premier | | 7 | | 7 | | — | | 7 | | 9 | | 9 | | — | | 9 | |
Aboriginal Relations and Reconciliation | | 56 | | 65 | | 9 | | 53 | | 82 | | 84 | | 2 | | 105 | |
Advanced Education | | 1,445 | | 1,443 | | (2 | ) | 1,458 | | 1,973 | | 1,972 | | (1 | ) | 1,950 | |
Agriculture | | 70 | | 65 | | (5 | ) | 64 | | 80 | | 80 | | — | | 76 | |
Children and Family Development | | 993 | | 991 | | (2 | ) | 974 | | 1,356 | | 1,356 | | — | | 1,343 | |
Community, Sport and Cultural Development | | 191 | | 189 | | (2 | ) | 131 | | 221 | | 221 | | — | | 181 | |
Education | | 4,018 | | 3,894 | | (124 | ) | 3,963 | | 5,387 | | 5,397 | | 10 | | 5,412 | |
Energy and Mines | | 16 | | 21 | | 5 | | 23 | | 21 | | 30 | | 9 | | 39 | |
Environment | | 98 | | 95 | | (3 | ) | 90 | | 134 | | 134 | | — | | 131 | |
Finance | | 144 | | 96 | | (48 | ) | 75 | | 202 | | 268 | | 66 | | 242 | |
Forests, Lands and Natural Resource Operations | | 455 | | 637 | | 182 | | 462 | | 593 | | 835 | | 242 | | 621 | |
Health | | 12,653 | | 12,462 | | (191 | ) | 12,177 | | 16,936 | | 16,911 | | (25 | ) | 16,387 | |
International Trade | | 25 | | 38 | | 13 | | 33 | | 34 | | 34 | | — | | 48 | |
Jobs, Tourism and Skills Training | | 142 | | 142 | | — | | 163 | | 199 | | 199 | | — | | 207 | |
Justice | | 872 | | 840 | | (32 | ) | 838 | | 1,155 | | 1,170 | | 15 | | 1,170 | |
Natural Gas Development | | 301 | | 299 | | (2 | ) | 282 | | 401 | | 401 | | — | | 371 | |
Social Development and Social Innovation | | 1,889 | | 1,898 | | 9 | | 1,851 | | 2,530 | | 2,530 | | — | | 2,509 | |
Technology, Innovation and Citizens’ Services | | 360 | | 351 | | (9 | ) | 345 | | 490 | | 490 | | — | | 525 | |
Transportation and Infrastructure | | 595 | | 594 | | (1 | ) | 594 | | 812 | | 812 | | — | | 806 | |
Total ministries and Office of the Premier | | 24,330 | | 24,127 | | (203 | ) | 23,583 | | 32,615 | | 32,933 | | 318 | | 32,132 | |
Management of public funds and debt | | 981 | | 924 | | (57 | ) | 937 | | 1,286 | | 1,221 | | (65 | ) | 1,237 | |
Contingencies | | — | | — | | — | | 12 | | 300 | | 300 | | — | | 60 | |
Funding for capital expenditures | | 578 | | 509 | | (69 | ) | 426 | | 1,048 | | 897 | | (151 | ) | 740 | |
Refundable tax credit transfers | | 581 | | 619 | | 38 | | 620 | | 778 | | 848 | | 70 | | 730 | |
Legislative and other appropriations | | 95 | | 87 | | (8 | ) | 118 | | 130 | | 133 | | 3 | | 153 | |
Subtotal | | 26,565 | | 26,266 | | (299 | ) | 25,696 | | 36,157 | | 36,332 | | 175 | | 35,052 | |
Elimination of transactions between appropriations 3 | | (10 | ) | (28 | ) | (18 | ) | — | | (17 | ) | (17 | ) | — | | (2 | ) |
Prior year liability adjustments | | — | | (17 | ) | (17 | ) | (7 | ) | — | | (65 | ) | (65 | ) | (159 | ) |
Consolidated revenue fund expense | | 26,555 | | 26,221 | | (334 | ) | 25,689 | | 36,140 | | 36,250 | | 110 | | 34,891 | |
Expenses recovered from external entities | | 1,806 | | 1,854 | | 48 | | 2,199 | | 2,599 | | 2,618 | | 19 | | 2,760 | |
Funding provided to service delivery agencies | | (16,225 | ) | (15,847 | ) | 378 | | (15,854 | ) | (22,016 | ) | (21,746 | ) | 270 | | (21,503 | ) |
Total direct program spending | | 12,136 | | 12,228 | | 92 | | 12,034 | | 16,723 | | 17,122 | | 399 | | 16,148 | |
Service delivery agency expense | | | | | | | | | | | | | | | | | |
School districts | | 4,062 | | 3,687 | | (375 | ) | 4,058 | | 5,667 | | 5,407 | | (260 | ) | 5,661 | |
Universities | | 2,952 | | 2,976 | | 24 | | 2,900 | | 4,152 | | 4,177 | | 25 | | 4,079 | |
Colleges and institutes | | 809 | | 821 | | 12 | | 818 | | 1,125 | | 1,138 | | 13 | | 1,137 | |
Health authorities and hospital societies | | 9,661 | | 9,670 | | 9 | | 9,435 | | 13,108 | | 13,242 | | 134 | | 12,802 | |
Other service delivery agencies | | 2,556 | | 2,635 | | 79 | | 2,423 | | 3,743 | | 3,707 | | (36 | ) | 3,548 | |
Total service delivery agency expense | | 20,040 | | 19,789 | | (251 | ) | 19,634 | | 27,795 | | 27,671 | | (124 | ) | 27,227 | |
Subtotal expense | | 32,176 | | 32,017 | | (159 | ) | 31,668 | | 44,518 | | 44,793 | | 275 | | 43,375 | |
Expenditure management | | — | | — | | — | | — | | (76 | ) | — | | 76 | | — | |
Core Review | | — | | — | | — | | — | | (26 | ) | — | | 26 | | — | |
Total expense | | 32,176 | | 32,017 | | (159 | ) | 31,668 | | 44,416 | | 44,793 | | 377 | | 43,375 | |
1 Reflects government’s organization that was in effect at December 31, 2014.
2 Restated to reflect government’s current accounting policies.
3 Reflects payments made under an agreement where an expense from a voted appropriation is recorded as revenue by a special account.
Budget and Fiscal Plan — 2015/16 to 2017/18
94
2014/15 Updated Financial Forecast (Third Quarterly Report)
Table 4.8 2014/15 Expense By Function
| | Year-to-Date to December 31 | | Full Year | |
| | 2014/15 | | Actual | | 2014/15 | | Actual | |
($ millions) | | Budget | | Actual | | Variance | | 2013/14 1 | | Budget | | Forecast | | Variance | | 2013/14 1 | |
Health: | | | | | | | | | | | | | | | | | |
Medical Services Plan | | 3,033 | | 3,013 | | (20 | ) | 3,007 | | 4,220 | | 4,177 | | (43 | ) | 4,114 | |
Pharmacare | | 904 | | 887 | | (17 | ) | 901 | | 1,120 | | 1,121 | | 1 | | 1,130 | |
Regional services | | 9,299 | | 9,158 | | (141 | ) | 8,862 | | 12,483 | | 12,394 | | (89 | ) | 11,960 | |
Other healthcare expenses 2 | | 553 | | 520 | | (33 | ) | 510 | | 860 | | 852 | | (8 | ) | 658 | |
| | 13,789 | | 13,578 | | (211 | ) | 13,280 | | 18,683 | | 18,544 | | (139 | ) | 17,862 | |
Education: | | | | | | | | | | | | | | | | | |
Elementary and secondary | | 4,224 | | 4,149 | | (75 | ) | 4,294 | | 6,125 | | 6,113 | | (12 | ) | 6,133 | |
Post-secondary | | 3,734 | | 3,729 | | (5 | ) | 3,714 | | 5,317 | | 5,384 | | 67 | | 5,284 | |
Other education expenses 3 | | 345 | | 291 | | (54 | ) | 244 | | 457 | | 464 | | 7 | | 410 | |
| | 8,303 | | 8,169 | | (134 | ) | 8,252 | | 11,899 | | 11,961 | | 62 | | 11,827 | |
Social services: | | | | | | | | | | | | | | | | | |
Social assistance 2,3 | | 1,193 | | 1,196 | | 3 | | 1,187 | | 1,576 | | 1,575 | | (1 | ) | 1,572 | |
Child welfare 2 | | 794 | | 814 | | 20 | | 807 | | 1,015 | | 1,013 | | (2 | ) | 1,097 | |
Low income tax credit transfers | | 185 | | 183 | | (2 | ) | 202 | | 247 | | 234 | | (13 | ) | 279 | |
Community living and other services | | 687 | | 649 | | (38 | ) | 603 | | 865 | | 888 | | 23 | | 857 | |
| | 2,859 | | 2,842 | | (17 | ) | 2,799 | | 3,703 | | 3,710 | | 7 | | 3,805 | |
Protection of persons and property | | 1,045 | | 1,034 | | (11 | ) | 1,065 | | 1,393 | | 1,419 | | 26 | | 1,520 | |
Transportation | | 1,137 | | 1,152 | | 15 | | 1,117 | | 1,629 | | 1,601 | | (28 | ) | 1,554 | |
Natural resources and economic development | | 1,526 | | 1,475 | | (51 | ) | 1,316 | | 1,757 | | 2,029 | | 272 | | 1,755 | |
Other | | 817 | | 912 | | 95 | | 821 | | 1,294 | | 1,309 | | 15 | | 1,184 | |
Contingencies | | — | | — | | — | | 12 | | 300 | | 300 | | — | | — | |
General government | | 818 | | 982 | | 164 | | 946 | | 1,180 | | 1,408 | | 228 | | 1,386 | |
Debt servicing | | 1,882 | | 1,873 | | (9 | ) | 2,060 | | 2,578 | | 2,512 | | (66 | ) | 2,482 | |
| | | | | | | | | | | | | | | | | |
Total expense | | 32,176 | | 32,017 | | (159 | ) | 31,668 | | 44,416 | | 44,793 | | 377 | | 43,375 | |
1 Restated to reflect government’s current organization and accounting policies.
2 Payments for healthcare services by the Ministry of Social Development and Social Innovation and the Ministry of Children and Family Development made on behalf of their clients are reported in the Health function.
3 Payments for training costs by the Ministry of Social Development and Social Innovation made on behalf of its clients are reported in the Education function.
Budget and Fiscal Plan — 2015/16 to 2017/18
95
2014/15 Updated Financial Forecast (Third Quarterly Report)
Table 4.9 2014/15 Capital Spending
| | Year-to-Date to December 31 | | Full Year | |
| | 2014/15 | | Actual | | 2014/15 | | Actual | |
($ millions) | | Budget | | Actual | | Variance | | 2013/14 | | Budget | | Forecast | | Variance | | 2013/14 | |
Taxpayer-supported | | | | | | | | | | | | | | | | | |
Education | | | | | | | | | | | | | | | | | |
School districts | | 383 | | 318 | | (65 | ) | 333 | | 511 | | 405 | | (106 | ) | 466 | |
Post-secondary institutions | | 662 | | 382 | | (280 | ) | 289 | | 883 | | 781 | | (102 | ) | 507 | |
Health | | 635 | | 471 | | (164 | ) | 328 | | 847 | | 1,004 | | 157 | | 690 | |
BC Transportation Financing Authority | | 783 | | 673 | | (110 | ) | 881 | | 1,044 | | 828 | | (216 | ) | 1,017 | |
BC Transit | | 102 | | 47 | | (55 | ) | 45 | | 136 | | 88 | | (48 | ) | 80 | |
Government operating (ministries) | | 287 | | 198 | | (89 | ) | 188 | | 432 | | 392 | | (40 | ) | 298 | |
Other 1 | | 124 | | 87 | | (37 | ) | 50 | | 177 | | 139 | | (38 | ) | 93 | |
Total taxpayer-supported | | 2,976 | | 2,176 | | (800 | ) | 2,114 | | 4,030 | | 3,637 | | (393 | ) | 3,151 | |
| | | | | | | | | | | | | | | | | |
Self-supported | | | | | | | | | | | | | | | | | |
BC Hydro | | 1,753 | | 1,589 | | (164 | ) | 1,510 | | 2,262 | | 2,268 | | 6 | | 2,036 | |
Columbia River power projects 2 | | 20 | | 26 | | 6 | | 38 | | 26 | | 36 | | 10 | | 52 | |
Transportation Investment Corporation (Port Mann) | | 63 | | 66 | | 3 | | 187 | | 83 | | 95 | | 12 | | 202 | |
BC Rail | | 6 | | 3 | | (3 | ) | 3 | | 8 | | 4 | | (4 | ) | 8 | |
ICBC | | 90 | | 66 | | (24 | ) | 66 | | 91 | | 81 | | (10 | ) | 82 | |
BC Lottery Corporation | | 69 | | 47 | | (22 | ) | 58 | | 90 | | 90 | | — | | 100 | |
Liquor Distribution Branch | | 22 | | 13 | | (9 | ) | 6 | | 30 | | 30 | | — | | 13 | |
Other 3 | | — | | — | | — | | — | | — | | — | | — | | 26 | |
| | | | | | | | | | | | | | | | | |
Total self-supported | | 2,023 | | 1,810 | | (213 | ) | 1,868 | | 2,590 | | 2,604 | | 14 | | 2,519 | |
| | | | | | | | | | | | | | | | | |
Total capital spending | | 4,999 | | 3,986 | | (1,013 | ) | 3,982 | | 6,620 | | 6,241 | | (379 | ) | 5,670 | |
1 Includes BC Housing Management Commission, Provincial Rental Housing Corporation and other service delivery agencies.
2 Joint ventures of the Columbia Power Corporation and Columbia Basin Trust.
3 Includes post-secondary institutions self-supported subsidiaries.
Budget and Fiscal Plan — 2015/16 to 2017/18
96
2014/15 Updated Financial Forecast (Third Quarterly Report)
Table 4.10 2014/15 Provincial Debt 1
| | Year-to-Date to December 31 | | Full Year | |
| | 2014/15 | | Actual | | 2014/15 | | Actual | |
($ millions) | | Budget | | Actual | | Variance | | 2013/14 | | Budget | | Forecast | | Variance | | 2013/14 | |
Taxpayer-supported debt | | | | | | | | | | | | | | | | | |
Provincial government operating | | 9,628 | | 8,055 | | (1,573 | ) | 10,214 | | 9,828 | | 9,441 | | (387 | ) | 10,223 | |
Other taxpayer-supported debt (mainly capital) | | | | | | | | | | | | | | | | | |
Education 2 | | | | | | | | | | | | | | | | | |
School districts | | 7,643 | | 7,497 | | (146 | ) | 7,157 | | 7,756 | | 7,612 | | (144 | ) | 7,245 | |
Post-secondary institutions | | 4,476 | | 4,445 | | (31 | ) | 4,354 | | 4,509 | | 4,523 | | 14 | | 4,386 | |
| | 12,119 | | 11,942 | | (177 | ) | 11,511 | | 12,265 | | 12,135 | | (130 | ) | 11,631 | |
Health 2,3 | | 6,396 | | 6,312 | | (84 | ) | 5,872 | | 6,516 | | 6,545 | | 29 | | 6,038 | |
Highways and public transit | | | | | | | | | | | | | | | | | |
BC Transportation Financing Authority | | 8,491 | | 8,393 | | (98 | ) | 7,878 | | 8,711 | | 8,512 | | (199 | ) | 7,912 | |
Public transit | | 1,000 | | 1,000 | | — | | 1,000 | | 1,000 | | 1,000 | | — | | 1,000 | |
SkyTrain extension | | 1,174 | | 1,174 | | — | | 1,174 | | 1,174 | | 1,174 | | — | | 1,174 | |
BC Transit | | 160 | | 126 | | (34 | ) | 145 | | 163 | | 123 | | (40 | ) | 143 | |
| | 10,825 | | 10,693 | | (132 | ) | 10,197 | | 11,048 | | 10,809 | | (239 | ) | 10,229 | |
Other | | | | | | | | | | | | | | | | | |
Social housing 5 | | 784 | | 774 | | (10 | ) | 664 | | 796 | | 786 | | (10 | ) | 719 | |
Provincial government general capital | | 1,671 | | 1,564 | | (107 | ) | 1,235 | | 1,766 | | 1,743 | | (23 | ) | 1,371 | |
BC Pavilion Corporation | | 382 | | 381 | | (1 | ) | 382 | | 380 | | 380 | | — | | 383 | |
BC Immigrant Investment Fund | | 444 | | 433 | | (11 | ) | 429 | | 441 | | 433 | | (8 | ) | 440 | |
Other 6 | | 33 | | 30 | | (3 | ) | 36 | | 35 | | 30 | | (5 | ) | 34 | |
| | 3,314 | | 3,182 | | (132 | ) | 2,746 | | 3,418 | | 3,372 | | (46 | ) | 2,947 | |
Total other taxpayer-supported | | 32,654 | | 32,129 | | (525 | ) | 30,326 | | 33,247 | | 32,861 | | (386 | ) | 30,845 | |
Total taxpayer-supported debt | | 42,282 | | 40,184 | | (2,098 | ) | 40,540 | | 43,075 | | 42,302 | | (773 | ) | 41,068 | |
Self-supported debt | | | | | | | | | | | | | | | | | |
Commercial Crown corporations | | | | | | | | | | | | | | | | | |
BC Hydro | | 16,439 | | 16,599 | | 160 | | 15,681 | | 16,856 | | 16,940 | | 84 | | 15,559 | |
Columbia Power Corporation | | 300 | | 300 | | — | | — | | 300 | | 299 | | (1 | ) | — | |
Columbia River power projects 7 | | 464 | | 464 | | — | | 470 | | 464 | | 464 | | — | | 470 | |
BC Lotteries | | 174 | | 156 | | (18 | ) | 180 | | 182 | | 155 | | (27 | ) | 155 | |
Transportation Investment Corporation (Port Mann) | | 3,384 | | 3,328 | | (56 | ) | 3,216 | | 3,420 | | 3,329 | | (91 | ) | 3,209 | |
Post secondary institutions’ subsidiaries | | 208 | | 200 | | (8 | ) | 208 | | 208 | | 198 | | (10 | ) | 198 | |
Other | | 34 | | 44 | | 10 | | 34 | | 33 | | 43 | | 10 | | 34 | |
| | 21,003 | | 21,091 | | 88 | | 19,789 | | 21,463 | | 21,428 | | (35 | ) | 19,625 | |
Warehouse borrowing program | | — | | — | | — | | — | | — | | — | | — | | — | |
Total self-supported debt | | 21,003 | | 21,091 | | 88 | | 19,789 | | 21,463 | | 21,428 | | (35 | ) | 19,625 | |
Forecast allowance | | — | | — | | — | | — | | 200 | | 100 | | (100 | ) | — | |
| | | | | | | | | | | | | | | | | |
Total provincial debt | | 63,285 | | 61,275 | | (2,010 | ) | 60,329 | | 64,738 | | 63,830 | | (908 | ) | 60,693 | |
1 Debt is after deduction of sinking funds and unamortized discounts, and excludes accrued interest. Government direct and fiscal agency accrued interest is reported in the government’s accounts as an accounts payable.
2 Includes debt and guarantees incurred by the government on behalf of school districts, universities, colleges and health authorities/hospital societies (SUCH), and debt directly incurred by these entities.
3 Health facilities’ debt includes public-private partnership obligations of $1,144 million for the nine months ended December 31, 2013, $1,233 million for the nine months ended December 31, 2014, $1,158 million for fiscal 2013/14 and $1,271 million for fiscal 2014/15.
4 BC Transportation Financing Authority debt includes public-private partnership obligations of $1,005 million for the nine months ended December 31, 2013, $1,104 million for the nine months ended December 31, 2014, $1,041 million for fiscal 2013/14 and $1,132 million for fiscal 2014/15.
5 Includes the BC Housing Management Commission and the Provincial Rental Housing Corporation. Social housing debt includes public-private partnership obligations of $29 million for the nine months ended December 31, 2013, $61 million for the nine months ended December 31, 2014, $45 million for fiscal 2013/14 and $80 million for fiscal 2014/15.
6 Includes service delivery agencies, student loan guarantees, loan guarantees to agricultural producers, guarantees issued under economic development and home mortgage assistance programs and loan guarantee provisions.
7 Joint ventures of the Columbia Power Corporation and Columbia Basin Trust.
Budget and Fiscal Plan — 2015/16 to 2017/18
97
2014/15 Updated Financial Forecast (Third Quarterly Report)
Table 4.11 2014/15 Statement of Financial Position
| | Actual | | Year-to-Date | | Forecast | |
| | March 31, | | December 31, | | March 31, | |
($ millions) | | 2014 | | 2014 | | 2015 | |
Financial assets | | | | | | | |
Cash and temporary investments | | 2,802 | | 2,536 | | 2,793 | |
Other financial assets | | 9,336 | | 8,621 | | 9,372 | |
Sinking funds | | 835 | | 912 | | 911 | |
Investments in commercial Crown corporations: | | | | | | | |
Retained earnings | | 7,839 | | 8,079 | | 8,195 | |
Recoverable capital loans | | 18,921 | | 20,382 | | 20,723 | |
| | 26,760 | | 28,461 | | 28,918 | |
| | 39,733 | | 40,530 | | 41,994 | |
Liabilities | | | | | | | |
Accounts payable and accrued liabilities | | 8,024 | | 7,149 | | 7,938 | |
Deferred revenue | | 9,684 | | 9,998 | | 9,824 | |
Debt: | | | | | | | |
Taxpayer-supported debt | | 41,068 | | 40,184 | | 42,302 | |
Self-supported debt | | 19,625 | | 21,091 | | 21,428 | |
Forecast allowance | | — | | — | | 100 | |
Total provincial debt | | 60,693 | | 61,275 | | 63,830 | |
Add: debt offset by sinking funds | | 835 | | 912 | | 911 | |
Less : guarantees and non-guaranteed debt | | (726 | ) | (728 | ) | (725 | ) |
Financial statement debt | | 60,802 | | 61,459 | | 64,016 | |
| | 78,510 | | 78,606 | | 81,778 | |
Net liabilities | | (38,777 | ) | (38,076 | ) | (39,784 | ) |
Capital and other non-financial assets | | | | | | | |
Tangible capital assets | | 37,778 | | 38,463 | | 39,308 | |
Other non-financial assets | | 3,134 | | 3,061 | | 3,078 | |
| | 40,912 | | 41,524 | | 42,386 | |
Accumulated surplus | | 2,135 | | 3,448 | | 2,602 | |
Changes in Financial Position
| | Year-to-Date | | Forecast | |
| | December 31, | | March 31, | |
($ millions) | | 2014 | | 2015 | |
| | | | | |
(Surplus) deficit for the period | | (1,732 | ) | (879 | ) |
Comprehensive income (increase) decrease | | 419 | | 412 | |
(Increase) decrease in accumulated surplus | | (1,313 | ) | (467 | ) |
Capital and other non-financial asset changes: | | | | | |
Increase in taxpayer-supported capital investments | | 2,176 | | 3,637 | |
Less: amortization and other accounting changes | | (1,491 | ) | (2,107 | ) |
Change in net capital assets | | 685 | | 1,530 | |
Increase (decrease) in other non-financial assets | | (73 | ) | (56 | ) |
| | 612 | | 1,474 | |
Increase (decrease) in net liabilities | | (701 | ) | 1,007 | |
Investment and working capital changes: | | | | | |
Increase (reduction) in cash and temporary investments | | (266 | ) | (9 | ) |
Increase in total investment in commercial Crown corporations: | | | | | |
Increase (decrease) in retained earnings | | 240 | | 356 | |
Self-supported capital investments | | 1,810 | | 2,604 | |
Less: loan repayments and other accounting changes | | (349 | ) | (802 | ) |
| | 1,701 | | 2,158 | |
Other working capital changes | | (77 | ) | 58 | |
| | 1,358 | | 2,207 | |
Increase (decrease) in financial statement debt | | 657 | | 3,214 | |
(Increase) decrease in sinking fund debt | | (77 | ) | (76 | ) |
Increase (decrease) in guarantees and non-guaranteed debt | | 2 | | (1 | ) |
Increase (decrease) in total provincial debt | | 582 | | 3,137 | |
Budget and Fiscal Plan — 2015/16 to 2017/18
98
APPENDIX
A1 | Tax Expenditures | 100 |
A1.1 | Personal Income Tax — Tax Expenditures | 102 |
A1.2 | Corporate Income Tax — Tax Expenditures | 103 |
A1.3 | Property Taxes — Tax Expenditures | 103 |
A1.4 | Consumption Taxes — Tax Expenditures | 104 |
A2 | Interprovincial Comparisons of Tax Rates — 2015 | 105 |
A3 | Comparison of Provincial and Federal Taxes by Province — 2015 | 106 |
A4 | Interprovincial Comparisons of Provincial Personal Income Taxes Payable — 2015 | 108 |
A5 | Material Assumptions — Revenue | 109 |
A6 | Natural Gas Price Forecasts: 2015/16 to 2017/18 | 114 |
A7 | Material Assumptions — Expense | 115 |
A8 | Operating Statement — 2008/09 to 2017/18 | 117 |
A9 | Revenue by Source — 2008/09 to 2017/18 | 118 |
A10 | Revenue by Source Supplementary Information — 2008/09 to 2017/18 | 119 |
A11 | Expense by Function — 2008/09 to 2017/18 | 120 |
A12 | Expense by Function Supplementary Information — 2008/09 to 2017/18 | 121 |
A13 | Full-Time Equivalents (FTEs) 2008/09 to 2017/18 | 122 |
A14 | Capital Spending — 2008/09 to 2017/18 | 123 |
A15 | Statement of Financial Position — 2008/09 to 2017/18 | 124 |
A16 | Changes in Financial Position — 2008/09 to 2017/18 | 125 |
A17 | Provincial Debt — 2008/09 to 2017/18 | 126 |
A18 | Provincial Debt Supplementary Information — 2008/09 to 2017/18 | 127 |
A19 | Key Provincial Debt Indicators — 2008/09 to 2017/18 | 128 |
Budget and Fiscal Plan — 2015/16 to 2017/18
Appendix
A1: Tax Expenditures
Introduction
A tax expenditure is the reduction in revenues from delivering government programs or benefits through the tax system. Tax expenditures are usually made by offering special tax rates, exemptions, or tax credits. Governments introduce tax expenditures primarily to achieve social policy objectives such as transfers to lower-income families or to promote economic development and job creation.
Reporting tax expenditures improves government accountability by providing a more complete picture of government activities. The tax expenditure appendix does not include tax expenditures introduced or expanded in Budget 2015. These are described in Part 2: Tax Measures. Beginning with Budget 2012, refundable tax transfers are accounted for in a voted appropriation. This change does not affect the reporting of tax expenditure costs in the following tables.
The Role of Tax Expenditure Programs
Using the tax system to deliver programs can reduce administration costs and compliance costs for recipients. In certain situations, the tax system allows intended beneficiaries to be readily identified from information that is already collected. In these cases, setting up a separate expenditure program would result in costly overlap and duplication of effort. An example is the BC low income climate action tax credit, which is delivered through the income tax system. If this were a direct provincial expenditure program, a provincial agency or office would have to be established to duplicate much of the work already done by the Canada Revenue Agency. In addition, it would require individuals to undertake a separate, time-consuming application process to qualify for the benefit.
There are, however, several potential drawbacks to tax expenditure programs. First, their overall cost often receives less public scrutiny than is the case for spending programs because annual budget appropriations by the legislature are not typically required. Second, tax expenditure programs do not always effectively target those who are intended to benefit from them. Some tax expenditure programs that are intended to provide tax relief for low-income earners may, in reality, confer the greatest benefit on high-income earners who pay the most taxes. Finally, costs are often more difficult to control under a tax expenditure program because the benefits tend to be more open-ended and enforcement is often more difficult than for spending programs.
Tax Expenditure Reporting
Not all tax reductions, credits and exemptions are classed as tax expenditures.
The emphasis is on tax reductions, exemptions and refunds that are close equivalents to spending programs. By implication, the list does not include tax measures designed to meet broad tax policy objectives such as improving fairness in the tax system, or measures designed to simplify the administration of the tax. The list also does not include anything that is not intended to be part of a tax base.
Tax expenditures that cost less than $2 million are generally not included. Where practical, smaller items have been presented together as an aggregate figure.
Budget and Fiscal Plan — 2015/16 to 2017/18
100
Appendix
British Columbia Tax Expenditures
The following tables report tax expenditure estimates.
The cost of individual tax expenditures cannot be added together to reach a total tax expenditure figure for two reasons:
· in some cases the programs interact with one another so that eliminating one program could increase or decrease the cost of another; and
· eliminating certain tax expenditure programs could change the choices taxpayers make, which in turn would affect the cost estimates.
The estimates for each tax expenditure are based on a static analysis of the costs and do not take into account any behavioural changes, which could change the costs over time. In addition, estimates are generally recalculated each year using current data sources and using refinements to the methods of estimation that can result in significant changes to the value of a given tax expenditure from prior years’ reports.
In Table A1.1, Personal Income Tax — Tax Expenditures, the list of tax expenditures delivered through the income tax system has been separated into two sub-categories.
· Provincial Measures: This includes all major tax expenditures that are under provincial policy control.
· Federal Measures: British Columbia shares the cost of some federal income tax expenditure programs because, under the tax collection agreement between British Columbia and the federal government, the province has agreed to maintain a consistent income tax base with the federal government in the interest of reducing administration and compliance costs.
Budget and Fiscal Plan — 2015/16 to 2017/18
101
Appendix
Table A1.1 Personal Income Tax — Tax Expenditures
| | | | 2014/15 | |
| | | | Estimated Cost | |
| | | | ($ millions) | |
Personal Income Tax | | | | | |
Provincial Measures | | | | | |
BC low income climate action tax credit | | | | 193 | |
Sales tax credit | | | | 41 | |
Training tax credit | | | | 9 | |
Venture capital tax credit | | | | 23 | |
Employee venture capital tax credit | | | | 1 | |
BC mining flow-through share tax credit | | | | 10 | |
Political contributions tax credit | | | | 4 | |
BC seniors’ home renovation tax credit | | | | 2 | |
Provincial non-refundable credits: 1 | | | | | |
· Charitable donations tax credit | | | | 187 | |
· Tax credits for tuition and education | | | | 4 | |
· Tax credits for persons with disability and medical expenses | | | | 72 | |
· Pension income tax credit | | | | 24 | |
· Credit for persons older than 65 years | | | | 65 | |
· Married and equivalent-to-married credits | | | | 98 | |
· Tax credit for Canada Pension Plan contributions | | | | 154 | |
· Tax credit for Employment Insurance premiums paid | | | | 52 | |
· Children’s fitness and arts tax credits | | | | 8 | |
Federal Measures 2 | | | | | |
· Pension income splitting. | | | | 60 | |
· Child care expense deduction | | | | 45 | |
· Exemption from capital gains up to $750,000 for small businesses and family farms | | | | 69 | |
· Deduction for residents of northern and isolated areas | | | | 9 | |
· Non-taxation of business-paid health and dental benefits | | | | 97 | |
· Tax-Free Savings Accounts | | | | 23 | |
· Registered Retirement Savings Plans: 3 | | | | | |
· exemption for | – contributions | | 377 | | | |
| – investment earnings | | 481 | | | |
· taxation of | – withdrawals | | (252 | ) | | |
| Total | | | | 616 | |
· Registered Pension Plans: 3 | | | | | |
· exemption for | – contributions | | 648 | | | |
| – investment earnings | | 644 | | | |
· taxation of | – withdrawals | | (392 | ) | | |
| Total | | | | 900 | |
1 Provincial non-refundable credits are generally based on estimates of credit claims by British Columbia residents.
2 These measures are federal measures but the estimates show only the provincial revenue loss. Each measure is calculated from the 2013 federal costs as reported in Government of Canada: Tax Expenditures and Evaluations, 2013, by applying British Columbia residents’ share of the measure and the relevant tax rates, and increasing by projected household income growth. Certain tax expenditure items have been excluded where no data were available or the amounts were immaterial.
3 Registered retirement savings plans and registered pension plans are treated in the same way as in the federal tax expenditure report. The tax expenditure associated with these plans is presented as the amount of tax that would otherwise be paid in the year of deferral, were the deferral not available. However, this type of estimate overstates the true costs of these preferences because taxes are eventually paid, including tax on investment earnings. An estimate that does not overstate these costs would, however, be difficult to develop and would require some largely speculative assumptions.
Budget and Fiscal Plan — 2015/16 to 2017/18
102
Appendix
Table A1.2 Corporate Income Tax — Tax Expenditures
| | | | 2014/15 | |
| | | | Estimated Cost | |
| | | | ($ millions) | |
Corporate Income Tax * | | | | | |
Charitable donations deduction 1 | | | | 44 | |
Training tax credit | | | | 6 | |
Film and television tax credits | | | | | |
· Film and video tax credit 2 | | 78 | | | |
· Production services tax credit 3 | | 265 | | | |
Total | | | | 343 | |
International business activities tax refund 4 | | | | 20 | |
Scientific research and experimental development tax credit | | | | 140 | |
Mining exploration tax credit | | | | 104 | |
Interactive digital media tax credit | | | | 37 | |
* Includes prior year adjustments for refundable tax credits.
1 The deduction offered for corporate charitable donations is a federal measure, but the estimate shows only the provincial revenue loss. This is calculated from the 2013 federal cost as reported in Government of Canada: Tax Expenditures and Evaluations, 2013 by applying British Columbia’s share of corporate taxable income and the relevant tax rates to the federal estimate and increasing it by corporate income tax revenue growth.
2 Includes prior year adjustment of -$2 million.
3 Includes prior year adjustment of +$30 million.
4 Includes employee income tax refunds.
Table A1.3 Property Taxes — Tax Expenditures
| | 2014/15 | |
| | Estimated Cost | |
| | ($ millions) | |
School and Rural Area Property Tax | | | |
Assessment exemption of $10,000 for industrial and business properties 1 | | 8 | |
Overnight tourist accommodation assessment relief 1 | | 4 | |
Home owner grant 2 | | 814 | |
| | | |
Property Transfer Tax | | | |
Exemption for first-time home buyers | | 80 | |
Exemptions for the following: | | | |
· Property transfers between related individuals | | 85 | |
· Property transfers to municipalities, regional districts, hospital districts, library boards, school boards, water districts and educational institutions | | 8 | |
· Property transfers to charities registered under the Income Tax Act (Canada) | | 5 | |
1 Estimates are for the 2014 calendar year and include only school and rural area property taxes levied by the Province.
2 The home owner grant includes the northern and rural home owner benefit. The cost shown is for the 2014/15 fiscal year.
Budget and Fiscal Plan — 2015/16 to 2017/18
103
Appendix
Table A1.4 Consumption Taxes — Tax Expenditures
| | 2014/15 | |
| | Estimated Cost | |
| | ($ millions) | |
Fuel Tax 1 | | | |
Tax exemption for alternative fuels | | 15 | |
Tax exemption for international flights (jet fuel) | | 20 | |
Tax exemption for farmers | | 9 | |
Provincial Sales Tax 1 | | | |
Exemptions for the following items: | | | |
· Food (basic groceries, snack foods, candies, soft drinks and restaurant meals) | | 1,085 | |
· Residential fuels (electricity, natural gas, fuel oil, etc.) | | 235 | |
· Prescription and non-prescription drugs, vitamins and certain other health care products | | 195 | |
· Children’s clothing and footwear | | 42 | |
· Clothing patterns, fabrics and notions | | 8 | |
· Specified school supplies | | 24 | |
· Books, magazines and newspapers | | 38 | |
· Basic telephone and cable service | | 75 | |
· “1-800” and equivalent telephone services | | 10 | |
· Specified safety equipment | | 15 | |
· Labour to repair major household appliances, clothing and footwear | | 8 | |
· Livestock for human consumption and feed, seed and fertilizer | | 53 | |
· Specified energy conservation equipment | | 13 | |
· Bicycles | | 11 | |
1 Estimates are based on Statistics Canada data and/or administrative data.
Budget and Fiscal Plan — 2015/16 to 2017/18
104
Appendix
Table A2 Interprovincial Comparisons of Tax Rates — 2015
(Rates known and in effect of February 1, 2015)
| | | | | | | | | | | | | | | | | | Prince | | Newfound- | |
| | British | | | | Saskat- | | | | | | | | New | | Nova | | Edward | | land and | |
Tax | | Columbia | | Alberta | | chewan | | Manitoba | | Ontario | | Quebec | | Brunswick | | Scotia | | Island | | Labrador | |
Corporation income tax (per cent of taxable income) | | | | | | | | | | | | | | | | | | | | | |
General rate | | 11 | | 10 | | 12 | | 12 | | 11.5 | | 11.9 | | 12 | | 16 | | 16 | | 14 | |
Manufacturing rate 1 | | 11 | | 10 | | 10 | | 12 | | 10 | | 11.9 | | 12 | | 16 | | 16 | | 5 | |
Small business rate | | 2.5 | | 3 | | 2 | | 0 | | 4.5 | | 8 | | 4 | | 3 | | 4.5 | | 3 | |
Small business threshold ($000s) | | 500 | | 500 | | 500 | | 425 | | 500 | | 500 | | 500 | | 350 | | 500 | | 500 | |
Corporation capital tax | | | | | | | | | | | | | | | | | | | | | |
Non-financial | | Nil | | Nil | | Nil | | Nil | | Nil | | Nil | | Nil | | Nil | | Nil | | Nil | |
Financial | | Nil | | Nil | | .7/3.25 | | 5 | | Nil | | Nil | | 4 | | 4 | | 5 | | 4 | |
Health care premiums/month 2 | | | | | | | | | | | | | | | | | | | | | |
Individual/family | | 72/144 | | Nil | | Nil | | Nil | | Nil | | up to | | Nil | | Nil | | Nil | | Nil | |
| | | | | | | | | | | | 83/167 | | | | | | | | | |
Payroll tax (per cent) 3 | | Nil | | Nil | | Nil | | 2.15 | | 1.95 | | 4.26 | | Nil | | Nil | | Nil | | 2.0 | |
Insurance premium tax (per cent) 4 | | 2-4.4 | | 2-3 | | 3-4 | | 2-3 | | 2-3.5 | | 2.3-3.3 | | 2-3 | | 3-4 | | 3.5 | | 4 | |
Fuel tax (cents per litre) 5 | | | | | | | | | | | | | | | | | | | | | |
Gasoline | | 21.17 | | 9.0 | | 15.0 | | 14.0 | | 21.1 | | 27.9 | | 20.0 | | 23.5 | | 20.4 | | 23.5 | |
Diesel | | 22.67 | | 9.0 | | 15.0 | | 14.0 | | 22.2 | | 30.7 | | 27.3 | | 24.7 | | 28.6 | | 24.8 | |
Sales tax (per cent) 6 | | | | | | | | | | | | | | | | | | | | | |
General rate | | 7 | | Nil | | 5 | | 8 | | 8 | | 9.975 | | 8 | | 10 | | 9 | | 8 | |
Tobacco tax (dollars per carton of 200 cigarettes) 7 | | 47.80 | | 40.00 | | 55.00 | | 66.64 | | 34.19 | | 29.80 | | 45.04 | | 56.75 | | 53.55 | | 54.76 | |
1 In British Columbia (and some other provinces) the general rate applies to income from manufacturing and processing. In Quebec, the rate for manufacturing corporations eligible for the small business rate is 6%; the rate for other manufacturing corporations is 11.9%.
2 British Columbia has a two-person rate of $130.50; rates will increase effective January 1, 2016 to $75.00 per month for single persons, $136.00 for two-person families, and $150.00 for families of three or more persons. British Columbia provides premium assistance in the form of lower rates or an exemption from premiums for lower income individuals and families. Quebec levies a health contribution that varies with income and is capped at a maximum of $1,000 annually per adult for high income earners. Ontario levies a health premium as part of its provincial personal income tax system.
3 Provinces with payroll taxes provide payroll tax relief for small businesses. Quebec also levies a compensation tax of up to 4.48 per cent on salaries and wages paid by financial institutions.
4 The lower rate applies to premiums for life, sickness and accident insurance; the higher rate applies to premiums for property insurance including automobile insurance. In Ontario, Quebec and Newfoundland and Labrador, specific sales taxes also apply to insurance premiums, except those related to individual life and health.
5 Tax rate is for regular fuel used on highways and includes all provincial taxes payable by consumers at the pump. The British Columbia rate includes 6.75 cents per litre dedicated to the BC Transportation Financing Authority and the carbon tax rates of 6.67 cents per litre for gasoline and 7.67 cents per litre for diesel. The British Columbia rates do not include regional taxes that effectively increase the gasoline and diesel tax rates by 11 cents per litre in the South Coast British Columbia transportation service region and by 3.5 cents per litre in the Capital Regional District. The tax rates for Ontario, Quebec, New Brunswick, Nova Scotia, Newfoundland and Labrador, and Prince Edward Island include provincial sales tax based on average pump prices as of January 2014. Quebec’s tax rates do not include increased or reduced regional tax rates, such as an additional tax of 3 cents per litre on gasoline for the Montreal area.
6 The rates shown are statutory rates. Ontario, Quebec, Nova Scotia, New Brunswick, Newfoundland and Labrador, and Prince Edward Island have harmonized their sales taxes with the federal GST. Alberta imposes a four per cent tax on short-term rental accomodation.
7 Includes estimated provincial sales tax in all provinces except Alberta, British Columbia and Quebec.
Budget and Fiscal Plan — 2015/16 to 2017/18
105
Appendix
Table A3 Comparison of Provincial and Federal Taxes by Province — 2015
| | | | | | | | | | | | | | | | | | | | New- | |
| | | | | | | | | | | | | | | | | | Prince | | foundland | |
| | | | | | Saskat- | | | | | | | | New | | Nova | | Edward | | and | |
Tax | | British Columbia | | Alberta | | chewan | | Manitoba | | Ontario | | Quebec | | Brunswick | | Scotia | | Island | | Labrador | |
| | ($) | |
Two Income Family of Four - $90,000 | | | | | | | | | | | | | | | | | | | | | |
1. Provincial Income Tax | | 3,288 | | 4,332 | | 4,070 | | 6,731 | | 3,896 | | 7,683 | | 6,175 | | 6,911 | | 6,909 | | 5,536 | |
Net Child Benefits | | -495 | | 140 | | 0 | | — | | 0 | | -2,163 | | 0 | | 0 | | — | | 0 | |
2. Property Tax - Gross | | 3,917 | | 3,215 | | 4,673 | | 3,676 | | 5,203 | | 5,272 | | 5,147 | | 4,281 | | 3,620 | | 3,028 | |
- Net | | 3,347 | | 3,215 | | 4,673 | | 2,976 | | 5,203 | | 5,272 | | 5,147 | | 4,281 | | 3,620 | | 3,028 | |
3. Sales Tax | | 1,458 | | 0 | | 1,161 | | 1,740 | | 2,064 | | 2,604 | | 2,077 | | 2,513 | | 2,038 | | 2,027 | |
4. Fuel Tax | | 218 | | 135 | | 225 | | 210 | | 317 | | 419 | | 300 | | 353 | | 306 | | 353 | |
5. Net Carbon Tax | | 236 | | — | | — | | — | | — | | — | | — | | — | | — | | — | |
6. Provincial Direct Taxes | | 8,051 | | 7,822 | | 10,129 | | 11,657 | | 11,480 | | 13,814 | | 13,699 | | 14,057 | | 12,872 | | 10,943 | |
7. Health Care Premiums/Payroll Tax | | 1,728 | | — | | — | | 1,935 | | 1,755 | | 4,134 | | — | | — | | — | | 1,800 | |
8. Total Provincial Tax | | 9,779 | | 7,822 | | 10,129 | | 13,592 | | 13,235 | | 17,948 | | 13,699 | | 14,057 | | 12,872 | | 12,743 | |
9. Federal Income Tax | | 8,325 | | 8,325 | | 8,325 | | 8,325 | | 8,325 | | 8,296 | | 8,325 | | 8,325 | | 8,325 | | 8,325 | |
10. Net Federal GST | | 1,374 | | 1,456 | | 1,413 | | 1,257 | | 1,324 | | 1,242 | | 1,308 | | 1,266 | | 1,302 | | 1,277 | |
11. Total Tax | | 19,478 | | 17,603 | | 19,867 | | 23,174 | | 22,884 | | 27,485 | | 23,332 | | 23,648 | | 22,500 | | 22,345 | |
Two Income Family of Four - $60,000 | | | | | | | | | | | | | | | | | | | | | |
1. Provincial Income Tax | | 1,434 | | 1,836 | | 1,097 | | 3,584 | | 1,226 | | 3,617 | | 3,439 | | 3,531 | | 3,788 | | 2,950 | |
Net Child Benefits | | -495 | | -500 | | 0 | | — | | 0 | | -3,263 | | 0 | | 0 | | — | | 0 | |
2. Property Tax - Gross | | 2,851 | | 2,609 | | 3,113 | | 2,972 | | 3,733 | | 3,625 | | 2,862 | | 2,686 | | 2,879 | | 2,084 | |
- Net | | 2,281 | | 2,609 | | 3,113 | | 2,272 | | 3,733 | | 3,625 | | 2,862 | | 2,686 | | 2,879 | | 2,084 | |
3. Sales Tax | | 1,159 | | 0 | | 953 | | 1,420 | | 1,685 | | 2,244 | | 1,673 | | 2,050 | | 1,572 | | 1,641 | |
4. Fuel Tax | | 218 | | 135 | | 225 | | 210 | | 317 | | 419 | | 300 | | 353 | | 306 | | 353 | |
5. Net Carbon Tax | | 208 | | — | | — | | — | | — | | — | | — | | — | | — | | — | |
6. Provincial Direct Taxes | | 4,804 | | 4,080 | | 5,388 | | 7,486 | | 6,960 | | 6,641 | | 8,273 | | 8,619 | | 8,546 | | 7,027 | |
7. Health Care Premiums/Payroll Tax | | 1,728 | | — | | — | | 1,290 | | 1,170 | | 2,703 | | — | | — | | — | | 1,200 | |
8. Total Provincial Tax | | 6,532 | | 4,080 | | 5,388 | | 8,776 | | 8,130 | | 9,343 | | 8,273 | | 8,619 | | 8,546 | | 8,227 | |
9. Federal Income Tax | | 4,476 | | 4,476 | | 4,476 | | 4,476 | | 4,476 | | 4,457 | | 4,476 | | 4,476 | | 4,476 | | 4,476 | |
10. Net Federal GST | | 1,092 | | 1,197 | | 1,160 | | 1,026 | | 1,085 | | 1,075 | | 1,054 | | 1,033 | | 1,057 | | 1,033 | |
11. Total Tax | | 12,101 | | 9,754 | | 11,024 | | 14,279 | | 13,691 | | 14,876 | | 13,803 | | 14,129 | | 14,079 | | 13,737 | |
Two Income Family of Four - $30,000 | | | | | | | | | | | | | | | | | | | | | |
1. Provincial Income Tax | | 0 | | 0 | | -670 | | 251 | | -621 | | -2,804 | | 247 | | 430 | | 1,090 | | 114 | |
Net Child Benefits | | -495 | | -1,282 | | 0 | | — | | -1,945 | | -3,548 | | -52 | | 0 | | — | | 0 | |
2. Property Tax - Gross | | 2,851 | | 2,609 | | 3,113 | | 2,972 | | 3,733 | | 3,625 | | 2,862 | | 2,686 | | 2,879 | | 2,084 | |
- Net | | 2,281 | | 2,609 | | 3,113 | | 2,272 | | 3,733 | | 3,625 | | 2,862 | | 2,686 | | 2,879 | | 2,084 | |
3. Sales Tax | | 928 | | 0 | | 744 | | 1,165 | | 404 | | 2,047 | | 1,351 | | 1,646 | | 1,161 | | 1,327 | |
4. Fuel Tax | | 145 | | 90 | | 150 | | 140 | | 211 | | 279 | | 200 | | 235 | | 204 | | 235 | |
5. Net Carbon Tax | | -126 | | — | | — | | — | | — | | — | | — | | — | | — | | — | |
6. Provincial Direct Taxes | | 2,734 | | 1,417 | | 3,338 | | 3,828 | | 1,780 | | -401 | | 4,607 | | 4,997 | | 5,335 | | 3,760 | |
7. Health Care Premiums/Payroll Tax | | 307 | | — | | — | | 645 | | 585 | | 1,278 | | — | | — | | — | | 600 | |
8. Total Provincial Tax | | 3,041 | | 1,417 | | 3,338 | | 4,473 | | 2,365 | | 877 | | 4,607 | | 4,997 | | 5,335 | | 4,360 | |
9. Federal Income Tax | | 743 | | 743 | | 743 | | 743 | | 743 | | 733 | | 743 | | 743 | | 743 | | 743 | |
10. Net Federal GST | | 51 | | 136 | | 82 | | 18 | | 121 | | 165 | | 27 | | 5 | | 14 | | 12 | |
11. Total Tax | | 3,834 | | 2,296 | | 4,162 | | 5,233 | | 3,229 | | 1,774 | | 5,376 | | 5,745 | | 6,092 | | 5,114 | |
Unattached Individual - $25,000 | | | | | | | | | | | | | | | | | | | | | |
1. Provincial Income Tax | | 347 | | 390 | | 471 | | 702 | | 296 | | -123 | | 698 | | 943 | | 1,412 | | 1,028 | |
2. Property Tax | | — | | — | | — | | — | | — | | — | | — | | — | | — | | — | |
3. Sales Tax | | 467 | | 0 | | 386 | | 595 | | 513 | | 923 | | 727 | | 880 | | 587 | | 688 | |
4. Fuel Tax | | 145 | | 90 | | 150 | | 140 | | 211 | | 279 | | 200 | | 235 | | 204 | | 235 | |
5. Net Carbon Tax | | -49 | | — | | — | | — | | — | | — | | — | | — | | — | | — | |
6. Provincial Direct Taxes | | 910 | | 480 | | 1,008 | | 1,437 | | 1,020 | | 1,079 | | 1,625 | | 2,058 | | 2,203 | | 1,951 | |
7. Health Care Premiums/Payroll Tax | | 154 | | — | | — | | 538 | | 488 | | 1,165 | | — | | — | | — | | 500 | |
8. Total Provincial Tax | | 1,064 | | 480 | | 1,008 | | 1,974 | | 1,507 | | 2,244 | | 1,625 | | 2,058 | | 2,203 | | 2,451 | |
9. Federal Income Tax | | 1,446 | | 1,446 | | 1,446 | | 1,446 | | 1,446 | | 1,438 | | 1,446 | | 1,446 | | 1,446 | | 1,446 | |
10. Net Federal GST | | 61 | | 92 | | 71 | | 38 | | 52 | | 39 | | 47 | | 32 | | 32 | | 23 | |
11. Total Tax | | 2,571 | | 2,018 | | 2,525 | | 3,459 | | 3,005 | | 3,721 | | 3,119 | | 3,537 | | 3,682 | | 3,920 | |

Budget and Fiscal Plan — 2015/16 to 2017/18
106
Appendix
Table A3 Comparison of Provincial and Federal Taxes by Province — 2015 (continued)
| | | | | | | | | | | | | | | | | | | | New- | |
| | | | | | | | | | | | | | | | | | Prince | | foundland | |
| | | | | | Saskat- | | | | | | | | New | | Nova | | Edward | | and | |
Tax | | British Columbia | | Alberta | | chewan | | Manitoba | | Ontario | | Quebec | | Brunswick | | Scotia | | Island | | Labrador | |
| | ($) | |
Unattached Individual - $80,000 | | | | | | | | | | | | | | | | | | | | | |
1. Provincial Income Tax | | 4,000 | | 5,208 | | 6,605 | | 7,749 | | 5,145 | | 8,960 | | 7,605 | | 8,400 | | 8,084 | | 6,624 | |
2. Property Tax - Gross | | 1,951 | | 2,582 | | 3,378 | | 4,390 | | 3,617 | | 4,811 | | 2,327 | | 3,529 | | 2,653 | | 2,139 | |
- Net | | 1,381 | | 2,582 | | 3,378 | | 3,690 | | 3,617 | | 4,811 | | 2,327 | | 3,529 | | 2,653 | | 2,139 | |
3. Sales Tax | | 1,103 | | 0 | | 869 | | 1,299 | | 1,636 | | 1,920 | | 1,617 | | 1,942 | | 1,569 | | 1,589 | |
4. Fuel Tax | | 218 | | 135 | | 225 | | 210 | | 317 | | 419 | | 300 | | 353 | | 306 | | 353 | |
5. Net Carbon Tax | | 186 | | — | | — | | — | | — | | — | | — | | — | | — | | — | |
6. Provincial Direct Taxes | | 6,886 | | 7,925 | | 11,077 | | 12,948 | | 10,716 | | 16,109 | | 11,848 | | 14,223 | | 12,613 | | 10,704 | |
7. Health Care Premiums/Payroll Tax | | 864 | | — | | — | | 1,720 | | 1,560 | | 3,608 | | — | | — | | — | | 1,600 | |
8. Total Provincial Tax | | 7,750 | | 7,925 | | 11,077 | | 14,668 | | 12,276 | | 19,717 | | 11,848 | | 14,223 | | 12,613 | | 12,304 | |
9. Federal Income Tax | | 10,702 | | 10,702 | | 10,702 | | 10,702 | | 10,702 | | 10,669 | | 10,702 | | 10,702 | | 10,702 | | 10,702 | |
10. Net Federal GST | | 1,116 | | 1,170 | | 1,087 | | 983 | | 1,048 | | 923 | | 1,021 | | 982 | | 1,014 | | 1,003 | |
11. Total Tax | | 19,569 | | 19,797 | | 22,866 | | 26,354 | | 24,026 | | 31,309 | | 23,572 | | 25,907 | | 24,329 | | 24,010 | |
Senior Couple with Equal Pension Incomes - $30,000 | | | | | | | | | | | | | | | | | | | | | |
1. Provincial Income Tax | | 0 | | 0 | | (482 | ) | (316 | ) | (1,563 | ) | (1,210 | ) | 0 | | (255 | ) | 0 | | 0 | |
2. Property Tax — Gross | | 2,851 | | 2,609 | | 3,113 | | 2,972 | | 3,733 | | 3,625 | | 2,862 | | 2,686 | | 2,879 | | 2,084 | |
- Net | | 2,006 | | 2,609 | | 3,113 | | 2,272 | | 3,733 | | 3,625 | | 2,862 | | 2,686 | | 2,879 | | 2,084 | |
3. Sales Tax | | 860 | | 0 | | 678 | | 1,140 | | 893 | | 1,679 | | 1,316 | | 1,642 | | 1,140 | | 1,353 | |
4. Fuel Tax | | 145 | | 90 | | 150 | | 140 | | 211 | | 279 | | 200 | | 235 | | 204 | | 235 | |
5. Net Carbon Tax | | (57 | ) | — | | — | | — | | — | | — | | — | | — | | — | | — | |
6. Provincial Direct Taxes | | 2,954 | | 2,699 | | 3,459 | | 3,236 | | 3,273 | | 4,372 | | 4,378 | | 4,308 | | 4,223 | | 3,672 | |
7. Health Care Premiums/Payroll Tax | | 0 | | — | | — | | — | | — | | — | | — | | — | | — | | — | |
8. Total Provincial Tax | | 2,954 | | 2,699 | | 3,459 | | 3,236 | | 3,273 | | 4,372 | | 4,378 | | 4,308 | | 4,223 | | 3,672 | |
9. Federal Income Tax | | 0 | | 0 | | 0 | | 0 | | 0 | | 0 | | 0 | | 0 | | 0 | | 0 | |
10. Net Federal GST | | 331 | | 361 | | 329 | | 333 | | 327 | | 290 | | 292 | | 290 | | 302 | | 315 | |
11. Total Tax | | 3,286 | | 3,061 | | 3,788 | | 3,569 | | 3,600 | | 4,662 | | 4,669 | | 4,598 | | 4,525 | | 3,987 | |
Personal Income Tax
· Income tax is based on basic personal credits, applicable credits and typical major deductions at each income level. Quebec residents pay federal income tax less an abatement of 16.5 per cent of basic federal tax. This abatement has been used to reduce Quebec provincial tax rather than federal tax, for comparative purposes. The two income family of four with $60,000 annual income is assumed to have one spouse earning $40,000 and the other $20,000, the family with $90,000 income is assumed to have one spouse earning $50,000 and the other $40,000, the family with $30,000 is assumed to have each spouse earning $15,000 and each senior is assumed to receive $15,000. All representative families are assumed to have employment income except the senior couple.
Net Child Benefits
· Net child benefits are provincial measures affecting payments to families with children. Provincial child benefit measures are available in British Columbia (BC Family Bonus), Alberta (Family Employment Credit), Saskatchewan (Child Benefit), Ontario (Child Benefit), Quebec (Child Assistance Payments), New Brunswick (Child Tax Benefit), Nova Scotia (Child Benefit) and Newfoundland and Labrador (Child Benefit). In addition, the Alberta government has chosen to vary the amount of the basic federal child tax benefit that its residents receive (shown as a net amount).
Property Tax
· It is assumed that the individual at $25,000 rents accommodation; the family at $30,000 and at $60,000 and the senior couple own bungalows; the family at $90,000 owns a two-story executive style home; and the single at $80,000 owns a luxury condominium, in a major city for each province. Net local and provincial property taxes are estimated as taxes owing after credits provided through the property tax system are subtracted.
Sales, Fuel and Carbon Tax Estimates
· Includes sales tax on meals, liquor and accommodation. Estimates are based on the Survey of Household Spending. In estimating individual and family taxable consumption, disposable income is reduced by 20 per cent to reflect housing (mortgage and property taxes or rent) costs. The senior couple is assumed to own their home and have no mortgage costs. For each province, disposable income is further reduced by estimated federal income taxes, estimated provincial income taxes and health care premiums if applicable. In addition, the single individual with $80,000 annual income and the family with $90,000 annual income are assumed to have savings equal to 5 per cent of their disposable income. For each family, disposable income is distributed among expenditures using the consumption pattern of a typical family with the relevant characteristics as estimated by the Survey of Household Spending and the relevant sales tax component is extracted. Sales tax includes provincial retail sales taxes in British Columbia, Saskatchewan and Manitoba, Quebec’s value added tax, the provincial component of the HST in Ontario, New Brunswick, Nova Scotia, Newfoundland and Labrador, and Prince Edward Island, Alberta’s Tourism Levy and the federal GST. Sales tax estimates have been reduced by sales tax credits where applicable.
· Fuel tax is based on annual consumption: 1,000 litres of unleaded gasoline for the single at $25,000, the family at $30,000 and the senior couple; others are assumed to consume 1,500 litres.
· Carbon tax applies in British Columbia to household consumption of gasoline, natural gas and home heating fuel. Estimated carbon tax liabilities are based on natural gas and home heating fuel consumption amounts from the Survey of Household Spending and the assumed fuel consumption noted above. Net carbon tax is estimated as carbon tax liabilities less the BC low income climate action tax credit where applicable. In previous years, the five per cent personal income tax cut in the first two tax bracket rates was shown as a reduction in carbon tax.
Health Care Premiums/Payroll Tax
· A health care premium is levied in British Columbia and Quebec only. Approximately 50 per cent of British Columbia premiums are paid by employers on behalf of their employees with the remainder paid by individuals, either by employees or by residents who are not employed. Payroll taxes, in the four provinces that levy them (Manitoba, Ontario, Quebec, and Newfoundland and Labrador), are paid by the employer. Employer-paid payroll taxes and health care premiums are generally reflected in reduced wages.
Effective Tax Rates
· British Columbia taxes have been calculated using rates in effect for 2015. Taxes for other provinces were calculated using rates that were announced prior to February 1, 2015, and that come into effect during 2015.
Budget and Fiscal Plan — 2015/16 to 2017/18
107
Appendix
Table A4 Interprovincial Comparisons of Provincial Personal Income Taxes Payable 1 — 2015
(Rates known as of February 1, 2015)
| | | | | | | | | | | | | | | | | | Prince | | New-
foundland | |
Taxable income | | British
Columbia | | Alberta | | Saskat-
chewan | | Manitoba | | Ontario | | Quebec2 | | New
Brunswick | | Nova
Scotia | | Edward
Island | | and
Labrador | |
| | Annual provincial taxes payable3 ($) | |
$ | 10,000 | | 0 | | 0 | | 0 | | 0 | | 0 | | 0 | | 0 | | 0 | | 0 | | 0 | |
$ | 20,000 | | 52 | | 59 | | 349 | | 1,016 | | 447 | | 311 | | 382 | | 858 | | 1,088 | | 242 | |
$ | 30,000 | | 873 | | 991 | | 1,373 | | 2,051 | | 1,222 | | 1,680 | | 1,584 | | 1,752 | | 2,001 | | 1,491 | |
$ | 40,000 | | 1,448 | | 1,923 | | 2,398 | | 3,233 | | 1,843 | | 3,222 | | 2,693 | | 3,187 | | 3,234 | | 2,448 | |
$ | 50,000 | | 2,184 | | 2,855 | | 3,544 | | 4,435 | | 2,836 | | 4,904 | | 4,110 | | 4,623 | | 4,548 | | 3,646 | |
$ | 60,000 | | 2,945 | | 3,838 | | 4,824 | | 5,691 | | 3,742 | | 6,545 | | 5,575 | | 6,116 | | 5,911 | | 4,882 | |
$ | 70,000 | | 3,715 | | 4,838 | | 6,124 | | 7,105 | | 4,657 | | 8,182 | | 7,057 | | 7,783 | | 7,466 | | 6,132 | |
$ | 80,000 | | 4,604 | | 5,838 | | 7,424 | | 8,845 | | 5,833 | | 9,819 | | 8,540 | | 9,450 | | 9,136 | | 7,462 | |
$ | 100,000 | | 6,938 | | 7,838 | | 10,024 | | 12,325 | | 9,011 | | 13,624 | | 11,844 | | 12,842 | | 12,476 | | 10,122 | |
$ | 125,000 | | 10,478 | | 10,338 | | 13,274 | | 16,675 | | 13,364 | | 18,933 | | 15,974 | | 17,217 | | 17,066 | | 13,447 | |
$ | 150,000 | | 14,153 | | 12,838 | | 17,008 | | 21,025 | | 17,716 | | 24,242 | | 20,368 | | 21,592 | | 21,659 | | 16,772 | |
| | | |
| | Provincial personal income taxes as a per cent of taxable income (%) | |
$ | 10,000 | | 0.0 | | 0.0 | | 0.0 | | 0.0 | | 0.0 | | 0.0 | | 0.0 | | 0.0 | | 0.0 | | 0.0 | |
$ | 20,000 | | 0.3 | | 0.3 | | 1.7 | | 5.1 | | 2.2 | | 1.6 | | 1.9 | | 4.3 | | 5.4 | | 1.2 | |
$ | 30,000 | | 2.9 | | 3.3 | | 4.6 | | 6.8 | | 4.1 | | 5.6 | | 5.3 | | 5.8 | | 6.7 | | 5.0 | |
$ | 40,000 | | 3.6 | | 4.8 | | 6.0 | | 8.1 | | 4.6 | | 8.1 | | 6.7 | | 8.0 | | 8.1 | | 6.1 | |
$ | 50,000 | | 4.4 | | 5.7 | | 7.1 | | 8.9 | | 5.7 | | 9.8 | | 8.2 | | 9.2 | | 9.1 | | 7.3 | |
$ | 60,000 | | 4.9 | | 6.4 | | 8.0 | | 9.5 | | 6.2 | | 10.9 | | 9.3 | | 10.2 | | 9.9 | | 8.1 | |
$ | 70,000 | | 5.3 | | 6.9 | | 8.7 | | 10.2 | | 6.7 | | 11.7 | | 10.1 | | 11.1 | | 10.7 | | 8.8 | |
$ | 80,000 | | 5.8 | | 7.3 | | 9.3 | | 11.1 | | 7.3 | | 12.3 | | 10.7 | | 11.8 | | 11.4 | | 9.3 | |
$ | 100,000 | | 6.9 | | 7.8 | | 10.0 | | 12.3 | | 9.0 | | 13.6 | | 11.8 | | 12.8 | | 12.5 | | 10.1 | |
$ | 125,000 | | 8.4 | | 8.3 | | 10.6 | | 13.3 | | 10.7 | | 15.1 | | 12.8 | | 13.8 | | 13.7 | | 10.8 | |
$ | 150,000 | | 9.4 | | 8.6 | | 11.3 | | 14.0 | | 11.8 | | 16.2 | | 13.6 | | 14.4 | | 14.4 | | 11.2 | |
1 Calculated for a single individual with wage income and claiming credits for Canada Pension Plan and Quebec Pension Plan contributions, Employment Insurance premiums, Quebec Parental Insurance Plan premiums, and the basic personal amount.
2 Quebec residents pay federal tax less an abatement of 16.5 per cent of federal tax. In the table, the Quebec abatement has been used to reduce Quebec provincial personal income tax for comparative purposes.
3 Includes provincial low income reductions, surtaxes payable in Ontario and Prince Edward Island, and the Ontario Health Premium tax. Excludes sales and property tax credits.
Budget and Fiscal Plan — 2015/16 to 2017/18
108
Appendix
Table A5 Material Assumptions — Revenue
| | Updated | | Budget | | | | | | | |
Revenue Source and Assumptions | | Forecast | | Estimate | | Plan | | Plan | | | |
($ millions unless otherwise specified) | | 2014/15 | | 2015/16 | | 2016/17 | | 2017/18 | | 2015/16 Sensitivities | |
Personal income tax | | $ | 8,063 | | $ | 7,948 | | $ | 8,104 | | $ | 8,455 | | | |
Current calendar year assumptions | | | | | | | | | | | |
Household income growth | | 3.0 | % | 3.5 | % | 3.8 | % | 4.0 | % | +/- 1% point change in 2015 BC household income growth equals +/- $70 to $100 million | |
Compensation of employees growth | | 3.4 | % | 3.7 | % | 4.0 | % | 4.1 | % | |
Tax base growth | | 1.6 | % | 3.4 | % | 3.4 | % | 3.6 | % | |
Average tax yield | | 5.25 | % | 5.29 | % | 5.17 | % | 5.21 | % | | |
Current-year tax | | $ | 7,399 | | $ | 7,713 | | $ | 7,794 | | $ | 8,133 | | | |
Prior year’s tax assessments | | $ | 317 | | $ | 327 | | $ | 337 | | $ | 347 | | | |
Unapplied taxes | | $ | 90 | | $ | 90 | | $ | 90 | | $ | 90 | | | |
BC Tax Reduction | | $ | -133 | | $ | -140 | | $ | -143 | | $ | -146 | | | |
Non-refundable BC tax credits | | $ | -66 | | $ | -66 | | $ | -61 | | $ | -61 | | | |
Policy neutral elasticity * | | 0.9 | | 1.1 | | 1.1 | | 1.1 | | +/- 0.5 change in 2015 BC policy neutral elasticity equals +/- $120 to $130 million | |
Fiscal year assumptions | | | | | | | | | | |
Prior-year adjustment | | $ | 372 | | | | | | | | |
| | | | | | | | | | | | |
2013 Tax-year | | 2013 Assumptions | | | | | | | |
Household income growth | | | | 4.6 | % | | | | | +/- 1% point change in 2014 BC household or taxable income growth equals +/- $90 to $100 million one-time effect (prior-year adjustment) and could result in an additional +/-$70 to $80 million base change in 2015/16 | |
Tax base growth | | | | 6.1 | % | | | | | |
Average 2013 tax yield | | | | 5.05 | % | | | | | |
2013 tax | | | | $ | 6,989 | | | | | | |
2012 & prior year’s tax assessments | | | | $ | 307 | | | | | | |
Unapplied taxes | | | | $ | 90 | | | | | | |
BC Tax Reduction | | | | $ | -131 | | | | | | |
Non-refundable BC tax credits | | | | $ | -62 | | | | | | |
Policy neutral elasticity * | | | | 1.9 | | | | | | |
* Ratio of annual per cent change in current-year revenue to annual per cent change in personal income (calendar year).
Corporate income tax | | $ | 2,636 | | $ | 2,630 | | $ | 2,789 | | $ | 2,908 | | | |
Components of revenue (fiscal year) | | | | | | | | | | | |
Instalments - subject to general rate | | $ | 2,378 | | $ | 2,436 | | $ | 2,572 | | $ | 2,658 | | | |
Instalments - subject to small business rate | | $ | 287 | | $ | 285 | | $ | 299 | | $ | 308 | | | |
Non-refundable BC tax credits | | $ | -103 | | $ | -105 | | $ | -111 | | $ | -117 | | | |
Advance instalments | | $ | 2,562 | | $ | 2,616 | | $ | 2,760 | | $ | 2,849 | | | |
International Business Activity Act refunds | | $ | -20 | | $ | -20 | | $ | -20 | | $ | -20 | | | |
Prior-year adjustment | | $ | 94 | | $ | 34 | | $ | 49 | | $ | 79 | | | |
Current calendar year assumptions | | | | | | | | | | | |
National tax base ($ billions) | | $ | 283.7 | | $ | 287.2 | | $ | 303.7 | | $ | 309.4 | | +/- 1% change in the 2015 national tax base equals +/- $20 to $30 million | |
BC instalment share of national tax base | | 11.4 | % | 11.5 | % | 11.5 | % | 11.8 | % | |
Effective tax rates (general/small business) | | 11.0 / 2.5 | | 11.0 / 2.5 | | 11.0 / 2.5 | | 11.0 / 2.5 | | |
Share of the BC tax base subject to small business rate | | 35.0 | % | 34.0 | % | 33.9 | % | 33.8 | % | +/- 1% point change in the 2015 small business share equals -/+ $20 to $30 million | |
BC tax base growth (post federal measures) | | 5.3 | % | 4.6 | % | 6.2 | % | 5.8 | % | |
BC net operating surplus growth | | 5.3 | % | 3.3 | % | 6.3 | % | 5.8 | % | |
| | | | | | | | | | | |
2013 Tax-year | | 2013 Assumptions | | | | | | | |
BC tax base growth (post federal measures) | | | | 6.2 | % | | | | | +/- 1% change in the 2014 BC tax base equals +/- $30 to $40 million in 2015/16 | |
BC net operating surplus growth | | | | -5.4 | % | | | | | |
Gross 2013 tax | | | | $ | 2,490 | | | | | | | |
Prior-year adjustments | | | | $ | 94 | | | | | | | |
Prior years losses/gains (included in above) | | | | $ | -55 | | | | | | | |
Non-refundable BC tax credits | | | | $ | -86 | | | | | | | |
Net cash received from the federal government and cash refunds under the International BusinessActivity Act are used as the basis for estimating revenue. Due to lags in the federal collection and instalment systems, changes to the BC net operating surplus and tax base forecasts affect revenue in the succeeding year. The 2015/16 instalments from the federal government reflects two-third of payments related to the 2015 tax year (paid during Apr-July 2015 and adjusted in Sept and Dec) and one-third of 2016 payments. Instalments for the 2015 (2016) tax year are based on BC’s share of the national tax base for the 2013 (2014) tax year and a forecast of the 2015 (2016) national tax base. BC’s share of the 2013 national tax base was 11.45%, based on tax assessments as of December 31, 2014. Cash adjustments for any under/over payments from the federal government in respect of 2014 will be received/paid on March 31, 2016.

Budget and Fiscal Plan — 2015/16 to 2017/18
109
Appendix
Table A5 Material Assumptions — Revenue (continued)
| | Updated | | Budget | | | | | | | |
Revenue Source and Assumptions | | Forecast | | Estimate | | Plan | | Plan | | | |
($ millions unless otherwise specified) | | 2014/15 | | 2015/16 | | 2016/17 | | 2017/18 | | 2015/16 Sensitivities | |
Provincial sales tax | | $ | 5,672 | | $ | 5,970 | | $ | 6,212 | | $ | 6,468 | | | |
Provincial sales tax base growth (fiscal year) | | 5.3 | % | 4.1 | % | 4.1 | % | 4.2 | % | +/- 1% point change in the 2015 | |
Calendar Year | | | | | | | | | | consumer expenditure growth | |
Nominal consumer expenditure | | 4.7 | % | 4.3 | % | 4.5 | % | 4.5 | % | equals up to +/- $30 million | |
Nominal business investment | | 5.6 | % | 3.9 | % | 4.5 | % | 4.6 | % | | |
Other expenditures | | 6.5 | % | 5.8 | % | 5.1 | % | 5.1 | % | | |
Components of Provincial sales tax revenue | | | | | | | | | | +/- 1% point change in the 2015 | |
Consolidated Revenue Fund | | $ | 5,658 | | $ | 5,963 | | $ | 6,205 | | $ | 6,461 | | busines investment growth equals up to +/- $10 million | |
BC Transportation Financing Authority | | $ | 14 | | $ | 7 | | $ | 7 | | $ | 7 | | | |
Fuel and carbon taxes | | $ | 2,167 | | $ | 2,195 | | $ | 2,226 | | $ | 2,256 | | | |
Calendar Year | | | | | | | | | | | |
Real GDP | | 2.2 | % | 2.3 | % | 2.4 | % | 2.3 | % | | |
Gasoline volumes | | 0.0 | % | 0.0 | % | 0.0 | % | 0.0 | % | | |
Diesel volumes | | 2.0 | % | 2.0 | % | 2.0 | % | 2.0 | % | | |
Natural gas volumes | | 2.2 | % | 2.3 | % | 2.4 | % | 2.3 | % | | |
Carbon tax rates (July 1) | | | | | | | | | | | |
Carbon dioxide equivalent emissions ($/tonne) | | $ | 30 | | $ | 30 | | $ | 30 | | $ | 30 | | | |
Natural gas (cents/gigajoule) | | 148.98 | ¢ | 148.98 | ¢ | 148.98 | ¢ | 148.98 | ¢ | | |
Gasoline (cents/litre) | | 6.67 | ¢ | 6.67 | ¢ | 6.67 | ¢ | 6.67 | ¢ | | |
Light fuel oil (cents/litre) | | 7.67 | ¢ | 7.67 | ¢ | 7.67 | ¢ | 7.67 | ¢ | | |
Carbon tax revenue | | $ | 1,240 | | $ | 1,261 | | $ | 1,284 | | $ | 1,307 | | | |
| | | | | | | | | | | |
Components of fuel tax revenue | | | | | | | | | | | |
Consolidated Revenue Fund | | $ | 505 | | $ | 509 | | $ | 514 | | $ | 518 | | | |
BC Transit | | $ | 12 | | $ | 12 | | $ | 12 | | $ | 12 | | | |
BC Transportation Financing Authority | | $ | 410 | | $ | 413 | | $ | 416 | | $ | 419 | | | |
| | $ | 927 | | $ | 934 | | $ | 942 | | $ | 949 | | | |
Property taxes | | $ | 2,137 | | $ | 2,225 | | $ | 2,312 | | $ | 2,408 | | | |
Calendar Year | | | | | | | | | | | |
BC Consumer Price Index | | 1.0 | % | 1.6 | % | 1.9 | % | 2.0 | % | +/- 1% point change in new | |
Housing starts | | 28,356 | | 27,598 | | 27,543 | | 27,008 | | construction & inflation growth | |
Home owner grants (fiscal year) | | $ | 814 | | $ | 825 | | $ | 842 | | $ | 859 | | equals up to +/- $35 million in | |
Components of revenue | | | | | | | | | | residential property taxation revenue | |
Residential (net of home owner grants) | | $ | 727 | | $ | 763 | | $ | 790 | | $ | 819 | | | |
Non-residential | | $ | 1,127 | | $ | 1,166 | | $ | 1,211 | | $ | 1,258 | | +/- 1% change in 2015 total | |
Rural area | | $ | 89 | | $ | 91 | | $ | 93 | | $ | 96 | | business property assessment | |
Police | | $ | 33 | | $ | 34 | | $ | 36 | | $ | 37 | | value equals up to +/- $20 | |
BC Assessment Authority | | $ | 84 | | $ | 85 | | $ | 88 | | $ | 91 | | million in non-residential | |
BC Transit | | $ | 77 | | $ | 86 | | $ | 94 | | $ | 107 | | property taxation revenue | |
Other taxes | | $ | 2,263 | | $ | 2,158 | | $ | 2,158 | | $ | 2,149 | | | |
Calendar Year | | | | | | | | | | | |
Population | | 1.1 | % | 1.2 | % | 1.3 | % | 1.3 | % | | |
BC Consumer Price Index | | 1.0 | % | 1.6 | % | 1.9 | % | 2.0 | % | | |
BC housing starts | | 4.8 | % | -2.7 | % | -0.2 | % | -1.9 | % | | |
Real GDP | | 2.2 | % | 2.3 | % | 2.4 | % | 2.3 | % | | |
Nominal GDP | | 3.9 | % | 3.8 | % | 4.3 | % | 4.3 | % | | |
Components of revenue | | | | | | | | | | | |
Property transfer | | $ | 1,039 | | $ | 928 | | $ | 923 | | $ | 909 | | | |
Tobacco | | $ | 770 | | $ | 770 | | $ | 770 | | $ | 770 | | | |
Insurance premium and other | | $ | 454 | | $ | 460 | | $ | 465 | | $ | 470 | | | |
Budget and Fiscal Plan — 2015/16 to 2017/18
110
Appendix
Table A5 Material Assumptions — Revenue (continued)
| | Updated | | Budget | | | | | | | |
Revenue Source and Assumptions | | Forecast | | Estimate | | Plan | | Plan | | | |
($ millions unless otherwise specified) | | 2014/15 | | 2015/16 | | 2016/17 | | 2017/18 | | 2015/16 Sensitivities | |
Energy, sales of Crown land tenures, metals, minerals and other | | $ | 1,742 | | $ | 1,456 | | $ | 1,433 | | $ | 1,279 | | | |
Natural gas price | | | | | | | | | | +/- $0.50 change in the natural gas price equals +/- $175 million, including impacts on production volumes and royalty program credits, but excluding any changes from byproducts revenue (e.g. butane, ethane, propane) Sensitivities can also vary significantly at different price levels. | |
Plant inlet, $Cdn/gigajoule | | $ | 2.69 | | $ | 2.09 | | $ | 2.32 | | $ | 2.54 | | |
Sumas, $US/ MMBtu | | $ | 3.94 | | $ | 3.20 | | $ | 3.46 | | $ | 3.70 | | |
Natural gas production volumes | | | | | | | | | | |
Billions of cubic metres | | 41.3 | | 44.4 | | 48.6 | | 53.2 | | |
Petajoules | | 1,641 | | 1,760 | | 1,928 | | 2,112 | | |
Annual per cent change | | 4.8 | % | 7.3 | % | 9.5 | % | 9.5 | % | |
| | | | | | | | | | |
Oil price ($US/bbl at Cushing, Ok) | | $ | 79.58 | | $ | 45.00 | | $ | 50.42 | | $ | 53.89 | | |
| | | | | | | | | | | |
Auctioned land base (000 hectares) | | 141 | | 150 | | 100 | | 80 | | | |
Average bid price/hectare ($) | | $ | 2,404 | | $ | 1,000 | | $ | 1,025 | | $ | 1,100 | | +/- 1% change in natural gas volumes equals +/- $3 million on natural gas royalties | |
Cash sales of Crown land tenures | | $ | 340 | | $ | 150 | | $ | 103 | | $ | 88 | | |
Metallurgical coal price ($US/tonne, fob west coast) | | $ | 119 | | $ | 128 | | $ | 138 | | $ | 138 | | |
Copper price ($US/lb) | | $ | 3.10 | | $ | 3.02 | | $ | 3.05 | | $ | 3.04 | | | |
Annual electricity volumes set by treaty | | 4.1 | | 4.1 | | 4.1 | | 4.0 | | +/- 1 cent change in the exchange rate equals +/- $30 million on natural gas royalties +/- 10% change in the average Mid-Columbia electricity price equals +/- $13 million | |
(million mega-watt hours) | | | | | | | | | | |
Mid-Columbia electricity price | | $ | 33 | | $ | 28 | | $ | 31 | | $ | 35 | | |
($US/mega-watt hour) | | | | | | | | | | |
Exchange rate (US¢/ Cdn$, calendar year) | | 90.5 | | 85.3 | | 85.5 | | 87.0 | | |
Components of revenue | | | | | | | | | | |
Natural gas royalties | | $ | 542 | | $ | 344 | | $ | 402 | | $ | 492 | | | |
Bonus bids, fees and rentals | | $ | 835 | | $ | 784 | | $ | 660 | | $ | 400 | | Based on a recommendation from the Auditor General to be consistent with generally accepted accounting principles, bonus bid revenue recognition reflects nine-year deferral of cash receipts from the sale of Crown land tenures | |
Petroleum royalties | | $ | 97 | | $ | 47 | | $ | 54 | | $ | 58 | | |
Columbia River Treaty electricity sales | | $ | 133 | | $ | 117 | | $ | 133 | | $ | 146 | | |
Coal | | $ | 46 | | $ | 67 | | $ | 82 | | $ | 78 | | |
Minerals, metals and other | | $ | 37 | | $ | 41 | | $ | 46 | | $ | 48 | | |
Oil and Gas Commission fees and levies | | $ | 52 | | $ | 56 | | $ | 56 | | $ | 57 | | |
| | | | | | | | | | |
Royalty programs and infrastructure credits | | | | | | | | | | |
Deep drilling | | $ | -406 | | $ | -273 | | $ | -411 | | $ | -594 | | | |
Road and pipeline infrastructure | | $ | -58 | | $ | -107 | | $ | -141 | | $ | -126 | | | |
Total | | $ | -464 | | $ | -380 | | $ | -552 | | $ | -720 | | | |
Implicit average natural gas royalty rate | | 12.3 | % | 9.4 | % | 9.0 | % | 9.2 | % | | |
Royalty program (marginal, low productivity and ultra marginal drilling) adjustments reflect reduced royalty rates. Natural gas royalties incorporate royalty programs and Treasury Board approved infrastructure credits.
Budget and Fiscal Plan — 2015/16 to 2017/18
111
Appendix
Table A5 Material Assumptions — Revenue (continued)
| | Updated | | Budget | | | | | | | |
Revenue Source and Assumptions | | Forecast | | Estimate | | Plan | | Plan | | | |
($ millions unless otherwise specified) | | 2014/15 | | 2015/16 | | 2016/17 | | 2017/18 | | 2015/16 Sensitivities | |
Forests | | $ | 757 | | $ | 835 | | $ | 866 | | $ | 907 | | | |
Prices (calendar year average) | | | | | | | | | | +/- US$50 change in SPF | |
SPF 2x4 ($US/1000 bd ft) | | $ | 353 | | $ | 344 | | $ | 340 | | $ | 340 | | price equals +/- $100 to | |
Random Lengths Composite ($US/thousand board feet) | | $ | 375 | | $ | 369 | | $ | 365 | | $ | 365 | | | |
Pulp ($US/tonne) | | $ | 925 | | $ | 888 | | $ | 838 | | $ | 825 | | +/- US$50 change in pulp price | |
Coastal log ($Cdn/cubic metre); | | | | | | | | | | equals +/-$5 to $10 million | |
Vancouver Log Market) | | $ | 97 | | $ | 94 | | $ | 92 | | $ | 90 | | +/- Cdn$10 change in average | |
| | | | | | | | | | log price equals +/-$10 to | |
Fiscal Year Trade Assumptions | | | | | | | | | | $20 million | |
Export tax rate (effective rate) Lumber shipments and consumption (billion board feet) | | 0.0 | % | 0.8 | % | 0.8 | % | 0.8 | % | +/- 1 cent change in | |
U.S. lumber consumption | | 41.0 | | 41.3 | | 41.9 | | 42.4 | | exchange rate equals | |
BC surge trigger volumes | | 8.7 | | 8.8 | | 8.9 | | 9.0 | | +/- $15 to $20 million on | |
BC lumber exports to US | | 6.7 | | 7.0 | | 7.3 | | 7.3 | | stumpage revenue | |
| | | | | | | | | | +/- 10% change in Interior | |
Crown harvest volumes (million cubic metres) | | | | | | | | | | harvest volumes equals | |
Interior | | 47.0 | | 48.9 | | 48.8 | | 49.8 | | +/- $50 to $60 million | |
Coast | | 14.0 | | 14.1 | | 14.2 | | 14.2 | | +/- 10% change in Coastal | |
Total | | 61.0 | | 63.0 | | 63.0 | | 64.0 | | harvest volumes equals | |
BC Timber Sales (included in above) | | 11.1 | | 11.4 | | 11.8 | | 11.8 | | +/- $8 to $12 million | |
| | | | | | | | | | | |
Stumpage rates ($Cdn/cubic metre) | | | | | | | | | | | |
Total stumpage rates | | $ | 10.99 | | $ | 11.80 | | $ | 12.33 | | $ | 12.79 | | | |
| | | | | | | | | | | |
Components of revenue | | | | | | | | | | The above sensitivities relate | |
Tenures | | $ | 437 | | $ | 517 | | $ | 543 | | $ | 585 | | to stumpage revenue only. | |
BC Timber Sales | | $ | 257 | | $ | 248 | | $ | 255 | | $ | 255 | | Depending on market | |
Federal border tax (SLA 2006) | | $ | 0 | | $ | 0 | | $ | 0 | | $ | 0 | | conditions, changes in | |
Logging tax | | $ | 25 | | $ | 25 | | $ | 25 | | $ | 25 | | stumpage revenues may be | |
Other CRF revenue | | $ | 23 | | $ | 20 | | $ | 19 | | $ | 19 | | offset by changes in softwood | |
Recoveries | | $ | 15 | | $ | 25 | | $ | 24 | | $ | 23 | | lumber border tax revenues | |
2015/16 and 2016/17 SLA 2006 border tax forecast assumes a continuation of the Softwood Lumber Agreement beyond its current October 2015 expiry date.
Other natural resources | | $ | 463 | | $ | 466 | | $ | 507 | | $ | 498 | | | |
Components of revenue | | | | | | | | | | | |
Water rental and licences* | | $ | 392 | | $ | 395 | | $ | 436 | | $ | 432 | | | |
Recoveries | | $ | 50 | | $ | 50 | | $ | 50 | | $ | 45 | | | |
Angling and hunting permits and licences | | $ | 14 | | $ | 10 | | $ | 10 | | $ | 10 | | | |
Recoveries | | $ | 7 | | $ | 11 | | $ | 11 | | $ | 11 | | | |
* Water rentals for power purposes are indexed to Consumer Price Index.
Other revenue | | $ | 9,251 | | $ | 9,932 | | $ | 10,040 | | $ | 9,978 | | | |
Components of revenue | | | | | | | | | | | |
Fees and licences | | | | | | | | | | +/- 1% point change in BC’s | |
Medical Services Plan (MSP) premium | | $ | 2,277 | | $ | 2,399 | | $ | 2,529 | | $ | 2,666 | | population growth equals +/- $10 to $20 million on MSP | |
Consolidated Revenue Fund | | $ | 2,173 | | $ | 2,315 | | $ | 2,445 | | $ | 2,582 | | premium revenue | |
MSP recoveries | | $ | 104 | | $ | 84 | | $ | 84 | | $ | 84 | | MSP rates are assumed to | |
Motor vehicle licences and permits | | $ | 509 | | $ | 516 | | $ | 523 | | $ | 530 | | increase 4 percent annually | |
Other Consolidated Revenue Fund | | $ | 333 | | $ | 381 | | $ | 374 | | $ | 349 | | | |
Summary consolidation eliminations | | — | | $ | -16 | | $ | -16 | | $ | -16 | | | |
Other recoveries | | $ | 113 | | $ | 105 | | $ | 99 | | $ | 100 | | | |
Crown corporations and agencies | | $ | 105 | | $ | 109 | | $ | 76 | | $ | 67 | | | |
Post-secondary education fees | | $ | 1,539 | | $ | 1,612 | | $ | 1,677 | | $ | 1,742 | | | |
Other health-care related fees | | $ | 352 | | $ | 348 | | $ | 355 | | $ | 355 | | | |
School Districts | | $ | 180 | | $ | 180 | | $ | 180 | | $ | 180 | | | |
Investment earnings | | | | | | | | | | | |
Consolidated Revenue Fund | | $ | 104 | | $ | 74 | | $ | 80 | | $ | 88 | | | |
Fiscal agency loans & sinking funds earnings | | $ | 875 | | $ | 944 | | $ | 995 | | $ | 1,060 | | | |
Summary consolidation eliminations | | $ | -45 | | $ | -53 | | $ | -63 | | $ | -76 | | | |
Crown corporations and agencies | | $ | 34 | | $ | 21 | | $ | 23 | | $ | 27 | | | |
SUCH sector agencies | | $ | 159 | | $ | 151 | | $ | 155 | | $ | 158 | | | |
Sales of goods and services | | $ | 927 | | $ | 935 | | $ | 948 | | $ | 973 | | | |
Miscellaneous | | $ | 1,789 | | $ | 2,226 | | $ | 2,105 | | $ | 1,775 | | | |
Budget and Fiscal Plan — 2015/16 to 2017/18
112
Appendix
Table A5 Material Assumptions — Revenue (continued)
| | Updated | | Budget | | | | | | | |
Revenue Source and Assumptions | | Forecast | | Estimate | | Plan | | Plan | | | |
($ millions unless otherwise specified) | | 2014/15 | | 2015/16 | | 2016/17 | | 2017/18 | | 2015/16 Sensitivities | |
Health and social transfers | | $ | 5,812 | | $ | 6,142 | | $ | 6,470 | | $ | 6,745 | | | |
National Cash Transfers | | | | | | | | | | | |
Canada Health Transfer (CHT) | | $ | 32,100 | | $ | 34,026 | | $ | 36,068 | | $ | 37,655 | | +/- 0.1% point change in BC’s | |
Canada Social Transfer (CST) | | $ | 12,582 | | $ | 12,959 | | $ | 13,348 | | $ | 13,748 | | population share equals | |
BC share of national population (June 1) | | 13.04 | % | 13.06 | % | 13.09 | % | 13.12 | % | +/- $45 to $50 million | |
BC health and social transfers revenue | | | | | | | | | | | |
CHT | | $ | 4,184 | | $ | 4,443 | | $ | 4,720 | | $ | 4,941 | | | |
CST | | $ | 1,640 | | $ | 1,692 | | $ | 1,747 | | $ | 1,804 | | | |
Prior-year adjustments | | $ | -29 | | | | | | | | | |
Health deferral | | | | | | | | | | | |
Diagnostic and Medical Equipment | | $ | 10 | | — | | — | | — | | | |
Medical Equipment Trust | | $ | 7 | | $ | 7 | | $ | 3 | | — | | | |
Other federal contributions | | $ | 1,567 | | $ | 1,504 | | $ | 1,479 | | $ | 1,465 | | | |
Components of revenue | | | | | | | | | | | |
Disaster Financial Assistance | | $ | 43 | | $ | 8 | | $ | 8 | | $ | 8 | | | |
Other Consolidated Revenue Fund | | $ | 147 | | $ | 136 | | $ | 137 | | $ | 137 | | | |
Labour Market Development Agreement | | $ | 301 | | $ | 300 | | $ | 300 | | $ | 300 | | | |
Labour Market and Skills Training Program | | $ | 66 | | $ | 77 | | $ | 69 | | $ | 65 | | | |
Family Support and Children in Care | | $ | 49 | | $ | 49 | | $ | 49 | | $ | 49 | | | |
Emergency Management | | $ | 5 | | $ | 5 | | $ | 1 | | $ | 1 | | | |
Local Government Services and Transfers | | $ | 8 | | — | | — | | — | | | |
Other recoveries | | $ | 111 | | $ | 110 | | $ | 109 | | $ | 109 | | | |
Crown corporations and agencies | | $ | 247 | | $ | 230 | | $ | 214 | | $ | 207 | | | |
Post-secondary institutions | | $ | 502 | | $ | 506 | | $ | 509 | | $ | 506 | | | |
Other SUCH sector agencies | | $ | 88 | | $ | 83 | | $ | 83 | | $ | 83 | | | |
Service delivery agency direct revenue | | $ | 5,828 | | $ | 6,311 | | $ | 6,041 | | $ | 6,079 | | | |
School districts | | $ | 527 | | $ | 527 | | $ | 527 | | $ | 527 | | | |
Post-secondary institutions | | $ | 3,065 | | $ | 3,144 | | $ | 3,238 | | $ | 3,336 | | | |
Health authorities and hospital societies | | $ | 839 | | $ | 1,091 | | $ | 825 | | $ | 827 | | | |
BC Transportation Financing Authority | | $ | 482 | | $ | 504 | | $ | 493 | | $ | 486 | | | |
Other service delivery agencies | | $ | 915 | | $ | 1,045 | | $ | 958 | | $ | 903 | | | |
Commercial Crown corporation net income | | $ | 3,242 | | $ | 2,904 | | $ | 3,050 | | $ | 3,101 | | | |
BC Hydro | | $ | 588 | | $ | 653 | | $ | 693 | | $ | 707 | | | |
reservoir water inflows | | 95 | % | 100 | % | 100 | % | 100% | | +/-1% in hydro generation = +/-$15 million | |
| | | | | | | | | | |
mean gas price | | 4.11 | | 3.82 | | 3.94 | | 4.13 | | +/-10% = -/+$5 million | |
(Sumas, $US/MMbtu — BC Hydro forecast based on NYMEX forward selling prices) | | | | | | | | | | | |
electricity prices | | 32.52 | | 32.22 | | 34.24 | | 36.89 | | +/-10% change in electricity trade | |
(Mid-C, $US/MWh) | | | | | | | | | | margins = +/-$15 million | |
ICBC | | $ | 600 | | $ | 210 | | $ | 231 | | $ | 237 | | | |
vehicle growth | | +1.9 | % | +1.7 | % | +1.7 | % | +1.7 | % | +/-1% = +/-$44 million | |
current claims cost percentage change | | +6.7 | % | +2.2 | % | +3.0 | % | +3.5% | | +/-1% = -/+$35 million | |
unpaid claims balance | | $ | 8.2 billion | | $ | 8.6 billion | | $ | 9.0 billion | | $ | 9.4 billion | | +/-1% = -/+$82 to $86 million | |
investment return | | 6.2 | % | 3.0 | % | 2.9 | % | 2.9 | % | +/-1% return = +/-$142 to $146 million | |
loss ratio | | 88.9 | % | 86.6 | % | 85.6 | % | 85.6 | % | | |
Budget and Fiscal Plan — 2015/16 to 2017/18
113
Appendix
Table A6 Natural Gas Price Forecasts — 2015/16 to 2017/18
| | | | | | | | Adjusted to fiscal years and | |
| | | | | | | | $C/gigajoule at plant inlet | |
Private sector forecasts (calendar year) | | 2015 | | 2016 | | 2017 | | 2015/16 | | 2016/17 | | 2017/18 | |
| | | | | | | | | | | | | |
GLJ Henry Hub US$/MMBtu (Jan 1, 2015) | | 3.31 | | 3.75 | | 4.00 | | 2.31 | | 2.68 | | 2.91 | |
Sproule Henry Hub US$/MMBtu (Dec 31, 2014) | | 3.25 | | 3.75 | | 4.00 | | 2.27 | | 2.68 | | 2.98 | |
McDaniel Henry Hub US$/MMBtu (Jan 1, 2015) | | 3.30 | | 3.80 | | 4.05 | | 2.32 | | 2.74 | | 2.96 | |
Deloitte Henry Hub US$/Mcf (Dec 31, 2014) | | 3.70 | | 4.00 | | 4.25 | | 2.56 | | 2.80 | | 3.01 | |
GLJ Alberta AECO-C Spot CDN$/MMBtu (Jan 1, 2015) | | 3.31 | | 3.77 | | 4.02 | | 2.09 | | 2.46 | | 2.70 | |
Sproule Alberta AECO-C Spot CDN$/MMBtu (Dec 31, 2014) | | 3.32 | | 3.71 | | 3.90 | | 2.08 | | 2.39 | | 2.67 | |
McDaniel AECO-C Spot C$/MMBtu (Jan 1, 2015) | | 3.50 | | 4.00 | | 4.25 | | 2.28 | | 2.68 | | 2.92 | |
Deloitte AECO-C Spot C$/Mcf (Dec 31, 2014) | | 3.85 | | 4.15 | | 4.45 | | 2.42 | | 2.70 | | 2.98 | |
GLJ Sumas Spot US$/MMBtu (Jan 1, 2015) | | 3.26 | | 3.70 | | 3.95 | | 2.30 | | 2.67 | | 2.89 | |
Sproule Sumas Spot CDN$/MMBtu (Dec 31, 2014) | | 3.77 | | 4.16 | | 4.35 | | 2.20 | | 2.51 | | 2.79 | |
GLJ BC Spot Plant Gate CDN$/MMBtu (Jan 1, 2015) | | 2.97 | | 3.43 | | 3.68 | | 1.98 | | 2.36 | | 2.60 | |
Sproule BC Station 2 CDN$/MMBtu (Dec 31, 2014) | | 3.27 | | 3.66 | | 3.85 | | 2.14 | | 2.45 | | 2.73 | |
McDaniel BC Avg Plant Gate C$MMBtu (Jan 1, 2015) | | 3.20 | | 3.70 | | 3.95 | | 2.21 | | 2.62 | | 2.85 | |
Deloitte BC Station 2 C$MMBtu (Dec 31, 2014) | | 3.75 | | 4.05 | | 4.35 | | 2.55 | | 2.82 | | 3.10 | |
GLJ Midwest Chicago US$/MMBtu (Jan 1, 2015) | | 3.41 | | 3.85 | | 4.10 | | 2.07 | | 2.44 | | 2.66 | |
Sproule Alliance Plant Gate CDN$/MMBtu (Dec 31, 2014) | | 3.02 | | 3.51 | | 3.80 | | 1.82 | | 2.23 | | 2.58 | |
EIA Henry Hub US$/MMBtu (Dec 9, 2014) | | 3.83 | | | | | | | | | | | |
TD Economics Henry Hub FuturesUS$/MMBtu (Dec 15, 2014) | | 3.60 | | 3.60 | | | | 2.52 | | | | | |
Scotiabank Group Henry Hub US$/MMBtu (Dec 19, 2014) | | 4.00 | | 4.00 | | | | 2.94 | | | | | |
BMO Alberta Empress US$/MMBtu (Dec 19, 2014) | | 4.20 | | | | | | | | | | | |
CIBC World Markets Inc. Henry Hub US$/MMBtu (Dec 16, 2014) | | 4.00 | | 4.10 | | | | 2.98 | | | | | |
InSite Petroleum Consultants Ltd Henry Hub US$/MMBtu (Dec 31, 2014) | | 3.50 | | 4.00 | | 4.25 | | 2.54 | | 2.96 | | 3.18 | |
Fekete AECO-C CDN$/MMBtu (Sep 30, 2014) | | 4.30 | | 4.55 | | 4.85 | | 2.97 | | 3.22 | | 3.49 | |
NYMEX Forward Market converted to Plant Inlet CDN$/GJ (Dec 15, 2014) | | | | | | | | 2.15 | | 2.47 | | 2.70 | |
Average all minus high/low | | | | | | | | 2.35 | | 2.62 | | 2.87 | |
Average one forecast per consultant minus high/low | | | | | | | | 2.55 | | 2.71 | | 2.97 | |
Natural gas royalty price forecast | | | | | | | | 2.09 | | 2.32 | | 2.54 | |
GLJ: Gilbert Laustsen Jung Petroleum Consultants Ltd US EIA: US Energy Information Administration AECO: Alberta Energy Company
Deloitte/AJM: Deloitte L.L.P acquired Ashton Jenkins Mann Petroleum Consultants McDaniel: McDaniel & Associates Consultants Ltd
Natural Gas Prices

Budget and Fiscal Plan — 2015/16 to 2017/18
114
Appendix
Table A7 Material Assumptions — Expense
| | Updated | | Budget | | | | | | | |
Ministry Programs and Assumptions | | Forecast | | Estimate | | Plan | | Plan | | | |
($ millions unless otherwise specified) | | 2014/15 | | 2015/16 | | 2016/17 | | 2017/18 | | Sensitivities 2015/16 | |
Advanced Education | | 1,972 | | 1,961 | | 1,975 | | 2,002 | | | |
Student spaces in public institutions (# FTEs) | | 204,250 | | 201,256 | | 201,274 | | 201,274 | | The number of student spaces may vary depending on the financial and other policies of post-secondary institutions. | |
Children and Family Development | | 1,339 | | 1,379 | | 1,385 | | 1,396 | | | |
Average children-in-care Caseload (#) | | 8,250 | | 8,250 | | 8,250 | | 8,250 | | Caseload is expected to remain stable between 15/16 and 17/18. A 1% increase in the cost per case or a 1% increase in the average | |
Average annual residential cost per child in care ($) | | 39,750 | | 40,500 | | 41,350 | | 42,200 | | caseload will affect expenditures by approximately $2 million (excluding Delegated Aboriginal Agencies). | |
Education | | 5,397 | | 5,498 | | 5,591 | | 5,648 | | | |
Public School Enrolment (# of FTEs) | | 531,574 | | 537,377 | | 538,225 | | 541,125 | | Enrolment figures are based on BC Stats and school district enrollment trends, to which the ministry has added forecasts for distributed learning, adult education and summer learning. Summer Learning was affected by the teachers’ job action in 2014/15, but is expected to resume full operation in 2015/16 and subsequent years. | |
School age (K—12) | | 516,463 | | 515,380 | | 516,460 | | 519,346 | | |
Distributed Learning (online) | | 11,433 | | 11,743 | | 11,511 | | 11,525 | | |
Summer | | 82 | | 6,658 | | 6,658 | | 6,658 | | |
Adults | | 3,596 | | 3,596 | | 3,596 | | 3,596 | | |
| | | | | | | | | | |
Forests, Lands and Natural Resource Operations | | 835 | | 608 | | 631 | | 637 | | | |
BC Timber Sales | | 161 | | 165 | | 171 | | 171 | | Targets can be impacted by changes to actual inventory costs incurred. There is a lag of approximately 1.5 years between when inventory costs are incurred and when they are expensed. Volume harvested can also impact targets. For example, if volume harvested is less than projected in any year, then capitalized expenses will also be reduced in that year. | |
Direct Fire Fighting | | 300 | | 63 | | 63 | | 63 | | Over the past several years, Direct Fire Fighting costs have ranged from a low of $19 million in 1997 to $382 million in 2009. | |
Health | | 16,928 | | 17,444 | | 17,934 | | 18,471 | | | |
Pharmacare | | 1,079 | | 1,103 | | 1,125 | | 1,148 | | A 1% change in utilization or prices affects costs by approximately $10 million. | |
Medical Services Plan (MSP) | | 4,061 | | 4,117 | | 4,285 | | 4,451 | | A 1% increase in volume of services provided by fee-for-service physicians affects costs by approximately $25 million. | |
Regional Services | | 11,516 | | 11,949 | | 12,245 | | 12,590 | | | |
Justice | | 1,169 | | 1,172 | | 1,178 | | 1,184 | | | |
New cases filed/processed (# for all courts) | | 270,000 | | 270,000 | | 270,000 | | 270,000 | | The number of criminal cases proceeded on by the provincial and federal Crown (including appeals to higher courts in BC), the number of civil and family litigation cases, the number of violation tickets disputed, and the number of municipal bylaw tickets disputes which would go to court for resolution. | |
Crown Proceeding Act (CPA) | | 25 | | 25 | | 25 | | 25 | | The number and size of litigation brought against the province, as well as the effectiveness of mitigation strategies and legal defence. | |
Policing, Victim Services and Corrections | | 609 | | 617 | | 619 | | 621 | | The volume and severity of criminal activity, the number of inmate beds occupied and the number of offenders under community supervision. | |
Emergency Program Act (EPA) | | 30 | | 15 | | 15 | | 15 | | The number and severity of natural disasters. | |
Budget and Fiscal Plan — 2015/16 to 2017/18
115
Appendix
Table A7 Assumptions — Expense (continued)
| | Updated | | Budget | | | | | | | |
Ministry Programs and Assumptions | | Forecast | | Estimate | | Plan | | Plan | | | |
($ millions unless otherwise specified) | | 2014/15 | | 2015/16 | | 2016/17 | | 2017/18 | | Sensitivities 2015/16 | |
Social Development and Social Innovation | | 2,530 | | 2,594 | | 2,646 | | 2,659 | | | |
| |
Temporary Assistance annual average caseload (#) | | 43,500 | | 40,700 | | 38,300 | | 35,700 | | The expected to work caseload is sensitive to fluctuations in economic and employment trends in the service sector. A 1% change in Temporary Assistance will affect expenditures by approximately $3.2 million annually. | |
Disability Assistance annual average caseload (#) | | 91,000 | | 94,500 | | 98,600 | | 98,600 | | The caseload for persons with disabilities is sensitive to the aging of the population and longer life expectancy for individuals with disabilities and significant health issues. A 1% change in Disability Assistance will affect expenditures by approximately $9.8 million annually | |
Adult Community Living: | | | | | | | | | | | |
Developmental Disabilities Programs | | | | | | | | | | The adult community living caseload is sensitive to an aging population and to the level of service required. For example, residential care is significantly more costly than day programs. A 1% increase in the caseload can increase expenditures by between $7.6 and $7.9 million annually. | |
Average caseload (#) | | 16,370 | | 17,200 | | 17,990 | | 18,760 | | |
Average cost per client ($) | | 45,500 | | 44,900 | | 44,210 | | 43,860 | | |
Personal Supports Initiative | | | | | | | | | | |
Average caseload (#) | | 810 | | 1,020 | | 1,230 | | 1,440 | | |
Average cost per client ($) | | 21,260 | | 20,890 | | 20,400 | | 20,330 | | |
Tax Transfers | | 848 | | 975 | | 989 | | 1,003 | | | |
Individuals | | 302.0 | | 459.0 | | 459.0 | | 459.0 | | | |
Low Income Climate Action | | 192.6 | | 195.0 | | 195.0 | | 195.0 | | These tax transfers are now expensed as required under generally accepted accounting principles. Previously the family bonus was split 50/50 between expense program and as reduction to revenue while all other refundable credits were recorded as reduction to revenue. | |
Early Childhood Tax Benefit | | | | 146.0 | | 146.0 | | 146.0 | | |
Sales Tax | | 40.8 | | 50.0 | | 50.0 | | 50.0 | | |
Small Business Venture Capital | | 22.5 | | 25.0 | | 25.0 | | 25.0 | | |
BC Senior’s Home Renovation | | -1.3 | | 2.0 | | 2.0 | | 2.0 | | |
Other tax transfers to individuals | | 46.8 | | 40.8 | | 40.8 | | 40.8 | | |
Family Bonus Program | | 0.6 | | 0.2 | | 0.2 | | 0.2 | | | |
Corporations | | 546.0 | | 516.0 | | 530.0 | | 544.0 | | | |
Film and Television | | 77.9 | | 80.0 | | 80.0 | | 80.0 | | | |
Production Services | | 265.2 | | 252.5 | | 262.5 | | 272.5 | | | |
Scientific Research & Experimental Development | | 51.1 | | 68.0 | | 72.0 | | 76.0 | | | |
| |
Interactive Digital Media | | 37.1 | | 50.0 | | 50.0 | | 50.0 | | | |
Mining Exploration | | 104.4 | | 50.0 | | 50.0 | | 50.0 | | | |
Other tax transfers to corporations | | 10.3 | | 15.5 | | 15.5 | | 15.5 | | | |
2014/15 tax transfer forecasts incorporates adjustments relating to prior years. | | | | | |
Management of Public Funds and Debt | | 1,221 | | 1,267 | | 1,338 | | 1,385 | | | |
Interest rates for new provincial borrowing: | | | | | | | | | | Full year impact on MoPD on interest costs of a 1% change in interest rates equals $83.8 million; $100 million increase in debt level equals $3.0 million. | |
Short-term | | 0.98 | % | 1.29 | % | 2.11 | % | 2.54 | % | |
Long-term | | 2.85 | % | 3.52 | % | 4.10 | % | 4.70 | % | |
CDN/US exchange rate (cents) | | 111.7 | | 117.8 | | 116.2 | | 114.9 | | |
Service delivery agency net spending | | 5,953 | | 6,042 | | 5,822 | | 6,167 | | | |
School districts | | 344 | | 325 | | 256 | | 183 | | | |
Post-secondary institutions | | 3,018 | | 3,017 | | 2,973 | | 3,152 | | | |
Health authorities and hospital societies | | 697 | | 709 | | 535 | | 748 | | | |
BC Transportation Financing Authority | | 996 | | 1,106 | | 1,224 | | 1,203 | | | |
Other service delivery agencies | | 898 | | 885 | | 834 | | 881 | | | |
Budget and Fiscal Plan — 2015/16 to 2017/18
116
Appendix
Table A8 Operating Statement - 2008/09 to 2017/18
| | | | | | | | | | | | | | Updated | | Budget | | | | | | Average | |
| | Actual | | Actual | | Actual | | Actual | | Actual | | Actual | | Forecast | | Estimate | | Plan | | Plan | | annual | |
($ millions) | | 2008/09 | | 2009/10 | | 2010/11 | | 2011/12 | | 2012/13 | | 2013/14 | | 2014/15 | | 2015/16 | | 2016/17 | | 2017/18 | | change | |
| | | | | | | | | | | | | | | | | | | | | | (per cent) | |
Revenue | | 38,720 | | 37,978 | | 40,688 | | 41,809 | | 42,049 | | 43,728 | | 45,772 | | 46,365 | | 47,646 | | 48,617 | | 2.6 | |
Expense | | (38,665 | ) | (39,790 | ) | (40,926 | ) | (42,047 | ) | (43,201 | ) | (43,375 | ) | (44,793 | ) | (45,831 | ) | (46,920 | ) | (47,868 | ) | 2.4 | |
Surplus (deficit) before unusual items | | 55 | | (1,812 | ) | (238 | ) | (238 | ) | (1,152 | ) | 353 | | 979 | | 534 | | 726 | | 749 | | | |
Forecast allowance | | — | | — | | — | | — | | — | | — | | (100 | ) | (250 | ) | (350 | ) | (350 | ) | | |
Negotiating Framework incentive payments | | (2 | ) | — | | — | | — | | — | | — | | — | | — | | — | | — | | | |
Climate Action Dividend | | 20 | | — | | — | | — | | — | | — | | — | | — | | — | | — | | | |
Liability for HST transition funding repayment | | — | | — | | — | | (1,599 | ) | — | | — | | — | | — | | — | | — | | | |
Surplus (deficit) | | 73 | | (1,812 | ) | (238 | ) | (1,837 | ) | (1,152 | ) | 353 | | 879 | | 284 | | 376 | | 399 | | | |
| | | | | | | | | | | | | | | | | | | | | | | |
Per cent of GDP: 1 | | | | | | | | | | | | | | | | | | | | | | | |
Surplus (deficit) | | 0.0 | | -0.9 | | -0.1 | | -0.8 | | -0.5 | | 0.2 | | 0.4 | | 0.1 | | 0.1 | | 0.1 | | | |
Per cent of revenue: | | | | | | | | | | | | | | | | | | | | | | | |
Surplus (deficit) | | 0.2 | | -4.8 | | -0.6 | | -4.4 | | -2.7 | | 0.8 | | 1.9 | | 0.6 | | 0.8 | | 0.8 | | | |
Per capita ($): 2 | | | | | | | | | | | | | | | | | | | | | | | |
Surplus (deficit) | | 17 | | (411 | ) | (53 | ) | (408 | ) | (254 | ) | 77 | | 190 | | 61 | | 79 | | 83 | | | |
1 Surplus (deficit) as a per cent of GDP is calculated using GDP for the calendar year ending in the fiscal year (e.g. 2015/16 amounts divided by GDP for the 2015 calendar year).
2 Per capita revenue and expense is calculated using July 1 population (e.g. 2015/16 amounts divided by population on July 1, 2015).
Budget and Fiscal Plan — 2015/16 to 2017/18
117
Appendix
Table A9 Revenue by Source - 2008/09 to 2017/18
| | | | | | | | | | | | | | Updated | | Budget | | | | | | Average | |
| | Actual | | Actual | | Actual | | Actual | | Actual | | Actual | | Forecast | | Estimate | | Plan | | Plan | | annual | |
($ millions) | | 2008/09 | | 2009/10 | | 2010/11 | | 2011/12 | | 2012/13 | | 2013/14 | | 2014/15 | | 2015/16 | | 2016/17 | | 2017/18 | | change | |
| | | | | | | | | | | | | | | | | | | | | | (per cent) | |
Taxation revenue: | | | | | | | | | | | | | | | | | | | | | | | |
Personal income | | 6,309 | | 5,769 | | 5,805 | | 6,427 | | 6,977 | | 6,862 | | 8,063 | | 7,948 | | 8,104 | | 8,455 | | 3.3 | |
Corporate income | | 2,294 | | 1,625 | | 2,026 | | 2,002 | | 2,204 | | 2,427 | | 2,636 | | 2,630 | | 2,789 | | 2,908 | | 2.7 | |
Sales | | 5,137 | | 4,945 | | 5,614 | | 5,930 | | 6,068 | | 5,303 | | 5,672 | | 5,970 | | 6,212 | | 6,468 | | 2.6 | |
Fuel | | 891 | | 884 | | 940 | | 928 | | 890 | | 917 | | 927 | | 934 | | 942 | | 949 | | 0.7 | |
Carbon | | 306 | | 541 | | 741 | | 959 | | 1,120 | | 1,222 | | 1,240 | | 1,261 | | 1,284 | | 1,307 | | n/a | |
Tobacco | | 709 | | 683 | | 735 | | 636 | | 614 | | 724 | | 770 | | 770 | | 770 | | 770 | | 0.9 | |
Property | | 1,850 | | 1,887 | | 1,920 | | 1,913 | | 1,985 | | 2,080 | | 2,137 | | 2,225 | | 2,312 | | 2,408 | | 3.0 | |
Property transfer | | 715 | | 887 | | 855 | | 944 | | 758 | | 937 | | 1,039 | | 928 | | 923 | | 909 | | 2.7 | |
Corporation capital | | 108 | | 95 | | (3 | ) | (5 | ) | 1 | | — | | (1 | ) | — | | — | | — | | n/a | |
Insurance premium | | 389 | | 389 | | 399 | | 411 | | 433 | | 458 | | 455 | | 460 | | 465 | | 470 | | 2.1 | |
| | 18,708 | | 17,705 | | 19,032 | | 20,145 | | 21,050 | | 20,930 | | 22,938 | | 23,126 | | 23,801 | | 24,644 | | 3.1 | |
Natural resource revenue: | | | | | | | | | | | | | | | | | | | | | | | |
Natural gas royalties | | 1,314 | | 406 | | 313 | | 339 | | 169 | | 445 | | 542 | | 344 | | 402 | | 492 | | -10.3 | |
Crown land tenures | | 814 | | 867 | | 923 | | 928 | | 868 | | 859 | | 835 | | 784 | | 660 | | 400 | | -7.6 | |
Columbia River Treaty | | 231 | | 168 | | 136 | | 110 | | 89 | | 170 | | 133 | | 117 | | 133 | | 146 | | -5.0 | |
Other energy and minerals | | 479 | | 421 | | 514 | | 529 | | 306 | | 269 | | 232 | | 211 | | 238 | | 241 | | -7.3 | |
Forests | | 557 | | 387 | | 436 | | 482 | | 562 | | 719 | | 757 | | 835 | | 866 | | 907 | | 5.6 | |
Other resources | | 413 | | 398 | | 406 | | 424 | | 479 | | 493 | | 463 | | 466 | | 507 | | 498 | | 2.1 | |
| | 3,808 | | 2,647 | | 2,728 | | 2,812 | | 2,473 | | 2,955 | | 2,962 | | 2,757 | | 2,806 | | 2,684 | | -3.8 | |
Other revenue: | | | | | | | | | | | | | | | | | | | | | | | |
Medical Services Plan premiums | | 1,595 | | 1,666 | | 1,787 | | 1,919 | | 2,047 | | 2,158 | | 2,277 | | 2,399 | | 2,529 | | 2,666 | | 5.9 | |
Post-secondary education fees | | 1,036 | | 1,123 | | 1,235 | | 1,291 | | 1,345 | | 1,445 | | 1,539 | | 1,612 | | 1,677 | | 1,742 | | 5.9 | |
Other healthcare-related fees | | 257 | | 267 | | 308 | | 324 | | 327 | | 333 | | 352 | | 348 | | 355 | | 355 | | 3.7 | |
Motor vehicle licences and permits | | 450 | | 449 | | 467 | | 479 | | 489 | | 504 | | 509 | | 516 | | 523 | | 530 | | 1.8 | |
Other fees and licences | | 670 | | 616 | | 643 | | 722 | | 699 | | 770 | | 731 | | 759 | | 713 | | 680 | | 0.2 | |
Investment earnings | | 818 | | 930 | | 843 | | 1,022 | | 1,173 | | 1,236 | | 1,127 | | 1,137 | | 1,190 | | 1,257 | | 4.9 | |
Sales of goods and services | | 694 | | 728 | | 759 | | 930 | | 942 | | 946 | | 927 | | 935 | | 948 | | 973 | | 3.8 | |
Miscellaneous | | 1,809 | | 1,887 | | 1,937 | | 1,755 | | 1,684 | | 2,248 | | 1,789 | | 2,226 | | 2,105 | | 1,775 | | -0.2 | |
| | 7,329 | | 7,666 | | 7,979 | | 8,442 | | 8,706 | | 9,640 | | 9,251 | | 9,932 | | 10,040 | | 9,978 | | 3.5 | |
Contributions from the federal government: | | | | | | | | | | | | | | | | | | | | | | | |
Health and social transfers | | 4,743 | | 4,883 | | 5,176 | | 5,384 | | 5,442 | | 5,869 | | 5,812 | | 6,142 | | 6,470 | | 6,745 | | 4.0 | |
Harmonized sales tax transition payments | | — | | 250 | | 769 | | 580 | | — | | — | | — | | — | | — | | — | | n/a | |
Other cost shared agreements | | 1,252 | | 1,794 | | 2,064 | | 1,755 | | 1,602 | | 1,633 | | 1,567 | | 1,504 | | 1,479 | | 1,465 | | 1.8 | |
| | 5,995 | | 6,927 | | 8,009 | | 7,719 | | 7,044 | | 7,502 | | 7,379 | | 7,646 | | 7,949 | | 8,210 | | 3.6 | |
Commercial Crown corporation net income: | | | | | | | | | | | | | | | | | | | | | | | |
BC Hydro | | 365 | | 447 | | 591 | | 558 | | 509 | | 549 | | 588 | | 653 | | 693 | | 707 | | 7.6 | |
Liquor Distribution Branch | | 891 | | 877 | | 891 | | 909 | | 930 | | 877 | | 871 | | 881 | | 896 | | 910 | | 0.2 | |
BC Lotteries (net of payments to federal gov’t) | | 1,082 | | 1,070 | | 1,097 | | 1,102 | | 1,116 | | 1,165 | | 1,198 | | 1,206 | | 1,233 | | 1,250 | | 1.6 | |
ICBC | | 512 | | 601 | | 315 | | 84 | | 231 | | 136 | | 600 | | 210 | | 231 | | 237 | | -8.2 | |
BC Railway Company | | 36 | | 2 | | 15 | | 14 | | 6 | | 13 | | 5 | | 5 | | 7 | | 7 | | -16.6 | |
Transportation Invest. Corp. (Port Mann) | | (47 | ) | (4 | ) | (7 | ) | (17 | ) | (60 | ) | (88 | ) | (89 | ) | (101 | ) | (102 | ) | (106 | ) | n/a | |
Other | | 41 | | 40 | | 38 | | 41 | | 44 | | 49 | | 69 | | 50 | | 92 | | 96 | | 9.9 | |
| | 2,880 | | 3,033 | | 2,940 | | 2,691 | | 2,776 | | 2,701 | | 3,242 | | 2,904 | | 3,050 | | 3,101 | | 0.8 | |
Total revenue | | 38,720 | | 37,978 | | 40,688 | | 41,809 | | 42,049 | | 43,728 | | 45,772 | | 46,365 | | 47,646 | | 48,617 | | 2.6 | |
Budget and Fiscal Plan — 2015/16 to 2017/18
118
Appendix
Table A10 Revenue by Source Supplementary Information — 2008/09 to 2017/18
| | | | | | | | | | | | | | Updated | | Budget | | | | | | Average | |
| | Actual | | Actual | | Actual | | Actual | | Actual | | Actual | | Forecast | | Estimate | | Plan | | Plan | | annual | |
| | 2008/09 | | 2009/10 | | 2010/11 | | 2011/12 | | 2012/13 | | 2013/14 | | 2014/15 | | 2015/16 | | 2016/17 | | 2017/18 | | change | |
| | | | | | | | | | | | | | | | | | | | | | (per cent) | |
Per cent of nominal GDP: 1 | | | | | | | | | | | | | | | | | | | | | | | |
Taxation | | 9.2 | | 9.0 | | 9.2 | | 9.3 | | 9.5 | | 9.1 | | 9.6 | | 9.3 | | 9.2 | | 9.1 | | 0.0 | |
Natural resources | | 1.9 | | 1.4 | | 1.3 | | 1.3 | | 1.1 | | 1.3 | | 1.2 | | 1.1 | | 1.1 | | 1.0 | | -6.8 | |
Other | | 3.6 | | 3.9 | | 3.9 | | 3.9 | | 3.9 | | 4.2 | | 3.9 | | 4.0 | | 3.9 | | 3.7 | | 0.3 | |
Contributions from the federal government | | 2.9 | | 3.5 | | 3.9 | | 3.6 | | 3.2 | | 3.3 | | 3.1 | | 3.1 | | 3.1 | | 3.0 | | 0.4 | |
Commercial Crown corporation net income | | 1.4 | | 1.5 | | 1.4 | | 1.2 | | 1.2 | | 1.2 | | 1.4 | | 1.2 | | 1.2 | | 1.2 | | -2.3 | |
Total revenue | | 19.0 | | 19.4 | | 19.8 | | 19.2 | | 18.9 | | 19.0 | | 19.2 | | 18.7 | | 18.4 | | 18.0 | | -0.6 | |
Growth rates (per cent): | | | | | | | | | | | | | | | | | | | | | | | |
Taxation | | -5.4 | | -5.4 | | 7.5 | | 5.8 | | 4.5 | | -0.6 | | 9.6 | | 0.8 | | 2.9 | | 3.5 | | n/a | |
Natural resources | | 1.8 | | -30.5 | | 3.1 | | 3.1 | | -12.1 | | 19.5 | | 0.2 | | -6.9 | | 1.8 | | -4.3 | | n/a | |
Other | | -3.1 | | 4.6 | | 4.1 | | 5.8 | | 3.1 | | 10.7 | | -4.0 | | 7.4 | | 1.1 | | -0.6 | | n/a | |
Contributions from the federal government | | 0.9 | | 15.5 | | 15.6 | | -3.6 | | -8.7 | | 6.5 | | -1.6 | | 3.6 | | 4.0 | | 3.3 | | n/a | |
Commercial Crown corporation net income | | -3.8 | | 5.3 | | -3.1 | | -8.5 | | 3.2 | | -2.7 | | 20.0 | | -10.4 | | 5.0 | | 1.7 | | n/a | |
Total revenue | | -3.3 | | -1.9 | | 7.1 | | 2.8 | | 0.6 | | 4.0 | | 4.7 | | 1.3 | | 2.8 | | 2.0 | | n/a | |
Per capita ($): 2 | | | | | | | | | | | | | | | | | | | | | | | |
Taxation | | 4,301 | | 4,014 | | 4,262 | | 4,478 | | 4,634 | | 4,567 | | 4,953 | | 4,933 | | 5,013 | | 5,124 | | 2.0 | |
Natural resources | | 876 | | 600 | | 611 | | 625 | | 544 | | 645 | | 640 | | 588 | | 591 | | 558 | | -4.9 | |
Other | | 1,685 | | 1,738 | | 1,787 | | 1,876 | | 1,917 | | 2,104 | | 1,997 | | 2,119 | | 2,115 | | 2,075 | | 2.3 | |
Contributions from the federal government | | 1,378 | | 1,571 | | 1,793 | | 1,716 | | 1,551 | | 1,637 | | 1,593 | | 1,631 | | 1,674 | | 1,707 | | 2.4 | |
Commercial Crown corporation net income | | 662 | | 688 | | 658 | | 598 | | 611 | | 589 | | 700 | | 619 | | 642 | | 645 | | -0.3 | |
Total revenue | | 8,902 | | 8,610 | | 9,111 | | 9,293 | | 9,257 | | 9,542 | | 9,883 | | 9,891 | | 10,036 | | 10,109 | | 1.4 | |
| | | | | | | | | | | | | | | | | | | | | | | |
Real Per Capita Revenue (2014 $) 3 | | 9,426 | | 9,117 | | 9,519 | | 9,484 | | 9,343 | | 9,639 | | 9,883 | | 9,727 | | 9,693 | | 9,569 | | 0.2 | |
Growth rate (per cent) | | -6.5 | | -3.3 | | 4.4 | | -0.4 | | -1.5 | | 3.2 | | 2.5 | | -1.6 | | -0.3 | | -1.3 | | -0.5 | |
1 Revenue as a per cent of GDP is calculated using nominal GDP for the calendar year ending in the fiscal year (e.g. 2015/16 revenue divided by nominal GDP for the 2015 calendar year).
2 Per capita revenue is calculated using July 1 population (e.g. 2015/16 revenue divided by population on July 1, 2015).
3 Revenue is converted to real (inflation-adjusted) terms using the consumer price index (CPI) for the corresponding calendar year (e.g. 2015 CPI for 2015/16 revenue).
Budget and Fiscal Plan — 2015/16 to 2017/18
119
Appendix
Table A11 Expense by Function — 2008/09 to 2017/18
| | | | | | | | | | | | | | Updated | | Budget | | | | | | Average | |
| | Actual | | Actual | | Actual | | Actual | | Actual | | Actual | | Forecast | | Estimate | | Plan | | Plan | | annual | |
($ millions) | | 2008/09 | | 2009/10 | | 2010/11 | | 2011/12 | | 2012/13 | | 2013/14 | | 2014/15 | | 2015/16 | | 2016/17 | | 2017/18 | | change | |
| | | | | | | | | | | | | | | | | | | | | | (per cent) | |
Function: | | | | | | | | | | | | | | | | | | | | | | | |
Health: | | | | | | | | | | | | | | | | | | | | | | | |
Medical Services Plan | | 3,282 | | 3,407 | | 3,641 | | 3,873 | | 3,906 | | 4,114 | | 4,176 | | 4,282 | | 4,458 | | 4,633 | | 3.9 | |
Pharmacare | | 1,010 | | 1,053 | | 1,129 | | 1,147 | | 1,122 | | 1,130 | | 1,121 | | 1,144 | | 1,166 | | 1,189 | | 1.8 | |
Regional services | | 10,030 | | 10,273 | | 10,597 | | 11,255 | | 11,784 | | 11,960 | | 12,415 | | 12,849 | | 13,152 | | 13,507 | | 3.4 | |
Other healthcare expenses | | 601 | | 597 | | 625 | | 642 | | 690 | | 658 | | 832 | | 786 | | 790 | | 795 | | 3.2 | |
| | 14,923 | | 15,330 | | 15,992 | | 16,917 | | 17,502 | | 17,862 | | 18,544 | | 19,061 | | 19,566 | | 20,124 | | 3.4 | |
Education: | | | | | | | | | | | | | | | | | | | | | | | |
Elementary and secondary | | 5,740 | | 5,778 | | 5,802 | | 5,885 | | 6,002 | | 6,133 | | 6,113 | | 6,259 | | 6,347 | | 6,413 | | 1.2 | |
Post-secondary | | 4,573 | | 4,732 | | 4,859 | | 4,907 | | 5,103 | | 5,284 | | 5,384 | | 5,454 | | 5,559 | | 5,712 | | 2.5 | |
Other education expenses | | 158 | | 528 | | 504 | | 436 | | 423 | | 410 | | 464 | | 477 | | 476 | | 472 | | 12.9 | |
| | 10,471 | | 11,038 | | 11,165 | | 11,228 | | 11,528 | | 11,827 | | 11,961 | | 12,190 | | 12,382 | | 12,597 | | 2.1 | |
Social services: | | | | | | | | | | | | | | | | | | | | | | | |
Social assistance | | 1,339 | | 1,454 | | 1,506 | | 1,550 | | 1,552 | | 1,572 | | 1,575 | | 1,605 | | 1,626 | | 1,608 | | 2.1 | |
Child welfare | | 1,073 | | 1,077 | | 1,118 | | 1,112 | | 1,098 | | 1,097 | | 1,013 | | 1,258 | | 1,263 | | 1,271 | | 1.9 | |
Low income tax credit transfers | | 188 | | 216 | | 408 | | 509 | | 534 | | 279 | | 234 | | 245 | | 245 | | 245 | | 3.0 | |
Community living and other services | | 723 | | 729 | | 754 | | 769 | | 806 | | 857 | | 888 | | 901 | | 929 | | 962 | | 3.2 | |
| | 3,323 | | 3,476 | | 3,786 | | 3,940 | | 3,990 | | 3,805 | | 3,710 | | 4,009 | | 4,063 | | 4,086 | | 2.3 | |
Protection of persons and property | | 1,429 | | 1,380 | | 1,448 | | 1,512 | | 1,539 | | 1,520 | | 1,419 | | 1,423 | | 1,369 | | 1,376 | | -0.4 | |
Transportation | | 1,401 | | 1,453 | | 1,580 | | 1,544 | | 1,552 | | 1,554 | | 1,601 | | 1,713 | | 1,783 | | 1,728 | | 2.4 | |
Natural resources & economic development | | 1,886 | | 2,159 | | 2,349 | | 1,873 | | 2,092 | | 1,755 | | 2,029 | | 1,867 | | 1,915 | | 1,932 | | 0.3 | |
Other | | 1,649 | | 1,382 | | 1,208 | | 1,415 | | 1,346 | | 1,184 | | 1,309 | | 1,290 | | 1,310 | | 1,320 | | -2.4 | |
Contingencies | | — | | — | | — | | — | | — | | — | | 300 | | 350 | | 400 | | 400 | | n/a | |
General government | | 1,425 | | 1,375 | | 1,146 | | 1,235 | | 1,262 | | 1,386 | | 1,408 | | 1,280 | | 1,279 | | 1,288 | | -1.1 | |
Debt servicing | | 2,158 | | 2,197 | | 2,252 | | 2,383 | | 2,390 | | 2,482 | | 2,512 | | 2,648 | | 2,853 | | 3,017 | | 3.8 | |
Operating expense | | 38,665 | | 39,790 | | 40,926 | | 42,047 | | 43,201 | | 43,375 | | 44,793 | | 45,831 | | 46,920 | | 47,868 | | 2.4 | |
Unusual items: | | | | | | | | | | | | | | | | | | | | | | | |
Negotiating Framework incentive payments | | 2 | | — | | — | | — | | — | | — | | — | | — | | — | | — | | | |
Climate Action Dividend | | (20 | ) | — | | — | | — | | — | | — | | — | | — | | — | | — | | | |
HST transition funding repayment | | — | | — | | — | | 1,599 | | — | | — | | — | | — | | — | | — | | | |
Total expense | | 38,647 | | 39,790 | | 40,926 | | 43,646 | | 43,201 | | 43,375 | | 44,793 | | 45,831 | | 46,920 | | 47,868 | | | |
Per cent of operating expense: | | | | | | | | | | | | | | | | | | | | | | | |
Health | | 38.6 | | 38.5 | | 39.1 | | 40.2 | | 40.5 | | 41.2 | | 41.4 | | 41.6 | | 41.7 | | 42.0 | | 1.0 | |
Education | | 27.1 | | 27.7 | | 27.3 | | 26.7 | | 26.7 | | 27.3 | | 26.7 | | 26.6 | | 26.4 | | 26.3 | | -0.3 | |
Social services and housing | | 8.6 | | 8.7 | | 9.3 | | 9.4 | | 9.2 | | 8.8 | | 8.3 | | 8.7 | | 8.7 | | 8.5 | | -0.1 | |
Protection of persons and property | | 3.7 | | 3.5 | | 3.5 | | 3.6 | | 3.6 | | 3.5 | | 3.2 | | 3.1 | | 2.9 | | 2.9 | | -2.8 | |
Transportation | | 3.6 | | 3.7 | | 3.9 | | 3.7 | | 3.6 | | 3.6 | | 3.6 | | 3.7 | | 3.8 | | 3.6 | | 0.0 | |
Natural resources & economic development | | 4.9 | | 5.4 | | 5.7 | | 4.5 | | 4.8 | | 4.0 | | 4.5 | | 4.1 | | 4.1 | | 4.0 | | -2.1 | |
Other | | 4.3 | | 3.5 | | 3.0 | | 3.4 | | 3.1 | | 2.7 | | 2.9 | | 2.8 | | 2.8 | | 2.8 | | -4.7 | |
Contingencies | | — | | — | | — | | — | | — | | — | | 0.7 | | 0.8 | | 0.9 | | 0.8 | | n/a | |
General government | | 3.7 | | 3.5 | | 2.8 | | 2.9 | | 2.9 | | 3.2 | | 3.1 | | 2.8 | | 2.7 | | 2.7 | | -3.4 | |
Debt servicing | | 5.6 | | 5.5 | | 5.5 | | 5.7 | | 5.5 | | 5.7 | | 5.6 | | 5.8 | | 6.1 | | 6.3 | | 1.4 | |
| | 100.0 | | 100.0 | | 100.0 | | 100.0 | | 100.0 | | 100.0 | | 100.0 | | 100.0 | | 100.0 | | 100.0 | | | |
Budget and Fiscal Plan — 2015/16 to 2017/18
120
Appendix
Table A12 Expense by Function Supplementary Information — 2008/09 to 2017/18
| | | | | | | | | | | | | | Updated | | Budget | | | | | | Average | |
| | Actual | | Actual | | Actual | | Actual | | Actual | | Actual | | Forecast | | Estimate | | Plan | | Plan | | annual | |
| | 2008/09 | | 2009/10 | | 2010/11 | | 2011/12 | | 2012/13 | | 2013/14 | | 2014/15 | | 2015/16 | | 2016/17 | | 2017/18 | | change | |
| | | | | | | | | | | | | | | | | | | | | | (per cent) | |
Per cent of nominal GDP: 1 | | | | | | | | | | | | | | | | | | | | | | | |
Health | | 7.3 | | 7.8 | | 7.8 | | 7.8 | | 7.9 | | 7.8 | | 7.8 | | 7.7 | | 7.6 | | 7.5 | | 0.2 | |
Education | | 5.1 | | 5.6 | | 5.4 | | 5.2 | | 5.2 | | 5.1 | | 5.0 | | 4.9 | | 4.8 | | 4.7 | | -1.0 | |
Social services | | 1.6 | | 1.8 | | 1.8 | | 1.8 | | 1.8 | | 1.7 | | 1.6 | | 1.6 | | 1.6 | | 1.5 | | -0.8 | |
Protection of persons and property | | 0.7 | | 0.7 | | 0.7 | | 0.7 | | 0.7 | | 0.7 | | 0.6 | | 0.6 | | 0.5 | | 0.5 | | -3.5 | |
Transportation | | 0.7 | | 0.7 | | 0.8 | | 0.7 | | 0.7 | | 0.7 | | 0.7 | | 0.7 | | 0.7 | | 0.6 | | -0.8 | |
Natural resources & economic development | | 0.9 | | 1.1 | | 1.1 | | 0.9 | | 0.9 | | 0.8 | | 0.9 | | 0.8 | | 0.7 | | 0.7 | | -2.8 | |
Other | | 0.8 | | 0.7 | | 0.6 | | 0.7 | | 0.6 | | 0.5 | | 0.5 | | 0.5 | | 0.5 | | 0.5 | | -5.4 | |
Contingencies | | — | | — | | — | | — | | — | | — | | 0.1 | | 0.1 | | 0.2 | | 0.1 | | n/a | |
General government | | 0.7 | | 0.7 | | 0.6 | | 0.6 | | 0.6 | | 0.6 | | 0.6 | | 0.5 | | 0.5 | | 0.5 | | -4.1 | |
Debt servicing | | 1.1 | | 1.1 | | 1.1 | | 1.1 | | 1.1 | | 1.1 | | 1.1 | | 1.1 | | 1.1 | | 1.1 | | 0.6 | |
Operating expense | | 19.0 | | 20.3 | | 19.9 | | 19.3 | | 19.4 | | 18.9 | | 18.8 | | 18.5 | | 18.2 | | 17.7 | | -0.7 | |
Growth rates (per cent): | | | | | | | | | | | | | | | | | | | | | | | |
Health | | 5.8 | | 2.7 | | 4.3 | | 5.8 | | 3.5 | | 2.1 | | 3.8 | | 2.8 | | 2.6 | | 2.9 | | n/a | |
Education | | 4.9 | | 5.4 | | 1.2 | | 0.6 | | 2.7 | | 2.6 | | 1.1 | | 1.9 | | 1.6 | | 1.7 | | n/a | |
Social services | | 10.0 | | 4.6 | | 8.9 | | 4.1 | | 1.3 | | -4.6 | | -2.5 | | 8.1 | | 1.3 | | 0.6 | | n/a | |
Protection of persons and property | | 0.0 | | -3.4 | | 4.9 | | 4.4 | | 1.8 | | -1.2 | | -6.6 | | 0.3 | | -3.8 | | 0.5 | | n/a | |
Transportation | | 1.7 | | 3.7 | | 8.7 | | -2.3 | | 0.5 | | 0.1 | | 3.0 | | 7.0 | | 4.1 | | -3.1 | | n/a | |
Natural resources & economic development | | -9.0 | | 14.5 | | 8.8 | | -20.3 | | 11.7 | | -16.1 | | 15.6 | | -8.0 | | 2.6 | | 0.9 | | n/a | |
Other | | 19.0 | | -16.2 | | -12.6 | | 17.1 | | -4.9 | | -12.0 | | 10.6 | | -1.5 | | 1.6 | | 0.8 | | n/a | |
General government | | 17.0 | | -3.5 | | -16.7 | | 7.8 | | 2.2 | | 9.8 | | 1.6 | | -9.1 | | -0.1 | | 0.7 | | n/a | |
Debt servicing | | -3.5 | | 1.8 | | 2.5 | | 5.8 | | 0.3 | | 3.8 | | 1.2 | | 5.4 | | 7.7 | | 5.7 | | n/a | |
Operating expense | | 5.0 | | 2.9 | | 2.9 | | 2.7 | | 2.7 | | 0.4 | | 3.3 | | 2.3 | | 2.4 | | 2.0 | | n/a | |
Per capita ($): 2 | | | | | | | | | | | | | | | | | | | | | | | |
Health | | 3,431 | | 3,476 | | 3,581 | | 3,760 | | 3,853 | | 3,898 | | 4,004 | | 4,066 | | 4,121 | | 4,184 | | 2.2 | |
Education | | 2,407 | | 2,503 | | 2,500 | | 2,496 | | 2,538 | | 2,581 | | 2,583 | | 2,600 | | 2,608 | | 2,619 | | 0.9 | |
Social services | | 764 | | 788 | | 848 | | 876 | | 878 | | 830 | | 801 | | 855 | | 856 | | 850 | | 1.2 | |
Protection of persons and property | | 329 | | 313 | | 324 | | 336 | | 339 | | 332 | | 306 | | 304 | | 288 | | 286 | | -1.5 | |
Transportation | | 322 | | 329 | | 354 | | 343 | | 342 | | 339 | | 346 | | 365 | | 376 | | 359 | | 1.2 | |
Natural resources & economic development | | 434 | | 489 | | 526 | | 416 | | 461 | | 383 | | 438 | | 398 | | 403 | | 402 | | -0.8 | |
Other | | 379 | | 313 | | 270 | | 315 | | 296 | | 258 | | 283 | | 275 | | 276 | | 274 | | -3.5 | |
Contingencies | | — | | — | | — | | — | | — | | — | | 65 | | 75 | | 84 | | 83 | | n/a | |
General government | | 328 | | 312 | | 257 | | 274 | | 278 | | 302 | | 304 | | 273 | | 269 | | 268 | | -2.2 | |
Debt servicing | | 496 | | 498 | | 504 | | 530 | | 526 | | 542 | | 542 | | 565 | | 601 | | 627 | | 2.6 | |
Operating expense | | 8,890 | | 9,021 | | 9,164 | | 9,346 | | 9,511 | | 9,465 | | 9,672 | | 9,776 | | 9,882 | | 9,952 | | 1.3 | |
Real Per Capita Operating Expense (2014 $) 3 | | 9,412 | | 9,551 | | 9,575 | | 9,538 | | 9,599 | | 9,562 | | 9,672 | | 9,615 | | 9,546 | | 9,422 | | 0.0 | |
Growth rate (per cent) | | 1.4 | | 1.5 | | 0.2 | | -0.4 | | 0.6 | | -0.4 | | 1.2 | | -0.6 | | -0.7 | | -1.3 | | 0.2 | |
1 Expense as a per cent of GDP is calculated using nominal GDP for the calendar year ending in the fiscal year (e.g. 2015/16 expense divided by nominal GDP for the 2015 calendar year).
2 Per capita expense is calculated using July 1 population (e.g. 2015/16 expense divided by population on July 1, 2015).
3 Expense is converted to real (inflation-adjusted) terms using the consumer price index (CPI) for the corresponding calendar year (e.g. 2015 CPI for 2015/16 expense).
Budget and Fiscal Plan — 2015/16 to 2017/18
121
Appendix
Table A13 Full-Time Equivalents (FTEs) — 2008/09 to 2017/18 1
| | | | | | | | | | | | | | Updated | | Budget | | | | | | Average | |
| | Actual | | Actual | | Actual | | Actual | | Actual | | Actual | | Forecast | | Estimate | | Plan | | Plan | | annual | |
| | 2008/09 | | 2009/10 | | 2010/11 | | 2011/12 | | 2012/13 | | 2013/14 | | 2014/15 | | 2015/16 | | 2016/17 | | 2017/18 | | change | |
| | | | | | | | | | | | | | | | | | | | | | (per cent) | |
Taxpayer-supported programs and agencies: | | | | | | | | | | | | | | | | | | | | | | | |
Ministries and special offices (CRF) 2 | | 31,874 | | 31,353 | | 30,221 | | 27,228 | | 27,326 | | 26,526 | | 26,600 | | 26,500 | | 26,500 | | 26,500 | | -1.0 | |
Service delivery agencies 3 | | 4,403 | | 4,508 | | 4,295 | | 4,346 | | 4,508 | | 4,640 | | 4,805 | | 4,821 | | 4,574 | | 4,580 | | 0.2 | |
Total FTEs | | 36,277 | | 35,861 | | 34,516 | | 31,574 | | 31,834 | | 31,166 | | 31,405 | | 31,321 | | 31,074 | | 31,080 | | -0.8 | |
Growth rates: | | | | | | | | | | | | | | | | | | | | | | | |
Ministries and special offices (CRF) | | 5.5 | | -1.6 | | -3.6 | | -9.9 | | 0.4 | | -2.9 | | 0.3 | | -0.4 | | 0.0 | | 0.0 | | -1.2 | |
Service delivery agencies | | 6.7 | | 2.4 | | -4.7 | | 1.2 | | 3.7 | | 2.9 | | 3.6 | | 0.3 | | -5.1 | | 0.1 | | 1.1 | |
Population per FTE: 4 | | | | | | | | | | | | | | | | | | | | | | | |
Total FTEs | | 119.9 | | 123.0 | | 129.4 | | 142.5 | | 142.7 | | 147.0 | | 147.5 | | 149.7 | | 152.8 | | 154.7 | | 1.4 | |
1 Full-time equivalents (FTEs) are a measure of staff employment. FTEs are calculated by dividing the total hours of employment paid for in a given period by the number of hours an individual, full-time person would normally work in that period. This does not equate to the physical number of employees. For example, two half-time employees would equal one FTE, or alternatively, three FTEs may represent two full-time employees who have worked sufficient overtime hours to equal an additional FTE.
2 The ministry 2011/12 FTE total includes a reduction of about 3,200 FTEs reflecting the shift of BC Ambulance Service oversight from the Ministry of Health to the Provincial Health Services Authority.
3 Service delivery agency FTE amounts do not include SUCH sector staff employment.
4 Population per FTE is calculated using July 1 population (e.g. population on July 1, 2015 divided by 2015/16 FTEs).
Budget and Fiscal Plan — 2015/16 to 2017/18
122
Appendix
Table A14 Capital Spending — 2008/09 to 2017/18
| | | | | | | | | | | | | | Updated | | Budget | | | | | | Average
annual | |
| | Actual | | Actual | | Actual | | Actual | | Actual | | Actual | | Forecast | | Estimate | | Plan | | Plan | | change | |
($ millions) | | 2008/09 | | 2009/10 | | 2010/11 | | 2011/12 | | 2012/13 | | 2013/14 | | 2014/15 | | 2015/16 | | 2016/17 | | 2017/18 | | (per cent) | |
Taxpayer-supported: | | | | | | | | | | | | | | | | | | | | | | | |
Education | | | | | | | | | | | | | | | | | | | | | | | |
Schools districts | | 413 | | 449 | | 433 | | 560 | | 509 | | 466 | | 405 | | 481 | | 541 | | 627 | | 4.7 | |
Post-secondary institutions | | 630 | | 669 | | 924 | | 655 | | 591 | | 507 | | 781 | | 691 | | 739 | | 626 | | -0.1 | |
Health | | 892 | | 927 | | 916 | | 732 | | 742 | | 690 | | 1,004 | | 983 | | 1,084 | | 678 | | -3.0 | |
BC Transportation Financing Authority | | 881 | | 918 | | 1,080 | | 921 | | 1,005 | | 1,017 | | 828 | | 941 | | 706 | | 678 | | -2.9 | |
BC Transit | | 77 | | 150 | | 39 | | 37 | | 48 | | 80 | | 88 | | 119 | | 137 | | 53 | | -4.1 | |
Vancouver Convention Centre expansion | | 242 | | 41 | | 10 | | 1 | | — | | — | | — | | — | | — | | — | | n/a | |
BC Place redevelopment | | 45 | | 75 | | 197 | | 194 | | 6 | | — | | — | | — | | — | | — | | n/a | |
Government direct (ministries) | | 430 | | 306 | | 261 | | 245 | | 267 | | 298 | | 392 | | 392 | | 431 | | 383 | | -1.3 | |
Other | | 133 | | 184 | | 250 | | 220 | | 111 | | 93 | | 139 | | 124 | | 88 | | 154 | | 1.6 | |
| | 3,743 | | 3,719 | | 4,110 | | 3,565 | | 3,279 | | 3,151 | | 3,637 | | 3,731 | | 3,726 | | 3,199 | | -1.7 | |
Self-supported: | | | | | | | | | | | | | | | | | | | | | | | |
BC Hydro | | 1,397 | | 2,406 | | 1,519 | | 1,703 | | 1,929 | | 2,036 | | 2,268 | | 2,234 | | 2,277 | | 2,718 | | 7.7 | |
BC Transmission Corporation | | 19 | | 12 | | — | | — | | — | | — | | — | | — | | — | | — | | n/a | |
Columbia River power projects | | 32 | | 16 | | 67 | | 108 | | 94 | | 52 | | 36 | | 24 | | 14 | | 16 | | -7.4 | |
Transportation Invest. Corp. (Port Mann) | | 215 | | 778 | | 730 | | 734 | | 540 | | 202 | | 95 | | 16 | | 9 | | — | | n/a | |
BC Railway Company | | 10 | | 14 | | 6 | | 9 | | 10 | | 8 | | 4 | | 5 | | 2 | | 1 | | -22.6 | |
ICBC | | 22 | | 22 | | 48 | | 92 | | 73 | | 82 | | 81 | | 115 | | 50 | | 40 | | 6.9 | |
BC Lotteries | | 97 | | 92 | | 81 | | 74 | | 97 | | 100 | | 90 | | 90 | | 110 | | 110 | | 1.4 | |
Liquor Distribution Branch | | 17 | | 19 | | 18 | | 19 | | 10 | | 13 | | 30 | | 34 | | 65 | | 59 | | 14.8 | |
Other 1 | | 1 | | 3 | | 1 | | 5 | | 12 | | 26 | | — | | — | | — | | — | | n/a | |
| | 1,810 | | 3,362 | | 2,470 | | 2,744 | | 2,765 | | 2,519 | | 2,604 | | 2,518 | | 2,527 | | 2,944 | | 5.6 | |
Total capital spending | | 5,553 | | 7,081 | | 6,580 | | 6,309 | | 6,044 | | 5,670 | | 6,241 | | 6,249 | | 6,253 | | 6,143 | | 1.1 | |
Per cent of nominal GDP: 2 | | | | | | | | | | | | | | | | | | | | | | | |
Taxpayer-supported | | 1.8 | | 1.9 | | 2.0 | | 1.6 | | 1.5 | | 1.4 | | 1.5 | | 1.5 | | 1.4 | | 1.2 | | -4.7 | |
Self-supported | | 0.9 | | 1.7 | | 1.2 | | 1.3 | | 1.2 | | 1.1 | | 1.1 | | 1.0 | | 1.0 | | 1.1 | | 2.3 | |
Total | | 2.7 | | 3.6 | | 3.2 | | 2.9 | | 2.7 | | 2.5 | | 2.6 | | 2.5 | | 2.4 | | 2.3 | | -2.0 | |
Growth rates: | | | | | | | | | | | | | | | | | | | | | | | |
Taxpayer-supported | | 2.2 | | -0.6 | | 10.5 | | -13.3 | | -8.0 | | -3.9 | | 15.4 | | 2.6 | | -0.1 | | -14.1 | | -0.9 | |
Self-supported | | 39.3 | | 85.7 | | -26.5 | | 11.1 | | 0.8 | | -8.9 | | 3.4 | | -3.3 | | 0.4 | | 16.5 | | 11.8 | |
Total | | 11.9 | | 27.5 | | -7.1 | | -4.1 | | -4.2 | | -6.2 | | 10.1 | | 0.1 | | 0.1 | | -1.8 | | 2.6 | |
Per capita: 3 | | | | | | | | | | | | | | | | | | | | | | | |
Taxpayer-supported | | 861 | | 843 | | 920 | | 792 | | 722 | | 688 | | 785 | | 796 | | 785 | | 665 | | -2.8 | |
Self-supported | | 416 | | 762 | | 553 | | 610 | | 609 | | 550 | | 562 | | 537 | | 532 | | 612 | | 4.4 | |
Total | | 1,277 | | 1,605 | | 1,473 | | 1,402 | | 1,331 | | 1,237 | | 1,348 | | 1,333 | | 1,317 | | 1,277 | | 0.0 | |
Real Per Capita Capital Spending (2014 $) 4 | | 1,352 | | 1,700 | | 1,539 | | 1,431 | | 1,343 | | 1,250 | | 1,348 | | 1,311 | | 1,272 | | 1,209 | | -1.2 | |
Growth rate (per cent) | | 8.1 | | 25.7 | | -9.4 | | -7.0 | | -6.2 | | -6.9 | | 7.8 | | -2.7 | | -3.0 | | -5.0 | | 0.1 | |
1 Includes post-secondary institutions self-supported subsidiaries.
2 Capital spending as a per cent of GDP is calculated using nominal GDP for the calendar year ending in the fiscal year (e.g. 2015/16 amounts divided by nominal GDP for the 2015 calendar year).
3 Per capita capital spending is calculated using July 1 population (e.g. 2015/16 amounts divided by population on July 1, 2015).
4 Capital spending is converted to real (inflation-adjusted) terms using the consumer price index (CPI) for the corresponding calendar year (e.g. 2015 CPI for 2015/16 capital spending).
Budget and Fiscal Plan — 2015/16 to 2017/18
123
Appendix
Table A15 Statement of Financial Position — 2008/09 to 2017/18
| | | | | | | | | | | | | | Updated | | Budget | | | | | | Average | |
| | Actual | | Actual | | Actual | | Actual | | Actual | | Actual | | Forecast | | Estimate | | Plan | | Plan | | annual | |
($ millions) | | 2008/09 | | 2009/10 | | 2010/11 | | 2011/12 | | 2012/13 | | 2013/14 | | 2014/15 | | 2015/16 | | 2016/17 | | 2017/18 | | change | |
Financial assets: | | | | | | | | | | | | | | | | | | | | | | (per cent) | |
Cash and temporary investments | | 5,185 | | 2,911 | | 3,060 | | 3,235 | | 3,174 | | 2,802 | | 2,793 | | 1,838 | | 1,650 | | 1,457 | | -10.9 | |
Other financial assets | | 5,875 | | 7,171 | | 7,990 | | 7,938 | | 8,186 | | 9,336 | | 9,372 | | 9,684 | | 9,590 | | 9,591 | | 4.6 | |
Sinking funds | | 2,134 | | 1,329 | | 1,410 | | 1,491 | | 1,778 | | 835 | | 911 | | 915 | | 934 | | 958 | | -7.0 | |
Investments in commercial Crown corporations: | | | | | | | | | | | | | | | | | | | | | | | |
Retained earnings | | 5,952 | | 7,458 | | 7,092 | | 6,998 | | 7,541 | | 7,839 | | 8,195 | | 8,442 | | 8,769 | | 9,191 | | 4.0 | |
Recoverable capital loans | | 9,149 | | 11,471 | | 12,947 | | 14,846 | | 16,907 | | 18,921 | | 20,723 | | 21,830 | | 23,086 | | 24,656 | | 9.4 | |
| | 15,101 | | 18,929 | | 20,039 | | 21,844 | | 24,448 | | 26,760 | | 28,918 | | 30,272 | | 31,855 | | 33,847 | | 7.6 | |
Warehouse borrowing program assets | | 2,081 | | — | | — | | — | | — | | — | | — | | — | | — | | — | | n/a | |
| | 30,376 | | 30,340 | | 32,499 | | 34,508 | | 37,586 | | 39,733 | | 41,994 | | 42,709 | | 44,029 | | 45,853 | | 3.8 | |
Liabilities: | | | | | | | | | | | | | | | | | | | | | | | |
Accounts payable & accrued liabilities | | 7,451 | | 7,042 | | 7,675 | | 8,874 | | 8,902 | | 8,024 | | 7,938 | | 7,915 | | 8,372 | | 8,773 | | 1.5 | |
Deferred revenue | | 9,433 | | 10,002 | | 10,741 | | 10,438 | | 9,861 | | 9,684 | | 9,824 | | 9,691 | | 9,414 | | 9,238 | | -0.2 | |
Debt: | | | | | | | | | | | | | | | | | | | | | | | |
Taxpayer-supported debt | | 26,402 | | 29,968 | | 31,821 | | 34,659 | | 38,182 | | 41,068 | | 42,302 | | 43,182 | | 44,126 | | 44,733 | | 4.9 | |
Self-supported debt | | 11,612 | | 11,917 | | 13,333 | | 15,534 | | 17,634 | | 19,625 | | 21,428 | | 22,528 | | 23,769 | | 25,321 | | 7.3 | |
Forecast allowance | | — | | — | | — | | — | | — | | — | | 100 | | 250 | | 350 | | 350 | | n/a | |
Total provincial debt | | 38,014 | | 41,885 | | 45,154 | | 50,193 | | 55,816 | | 60,693 | | 63,830 | | 65,960 | | 68,245 | | 70,404 | | 5.8 | |
Add: debt offset by sinking funds | | 2,134 | | 1,329 | | 1,410 | | 1,491 | | 1,778 | | 835 | | 911 | | 915 | | 934 | | 958 | | -7.0 | |
Less: guarantees and non-guaranteed debt | | (496 | ) | (546 | ) | (455 | ) | (730 | ) | (755 | ) | (726 | ) | (725 | ) | (717 | ) | (702 | ) | (685 | ) | 3.0 | |
Financial statement debt | | 39,652 | | 42,668 | | 46,109 | | 50,954 | | 56,839 | | 60,802 | | 64,016 | | 66,158 | | 68,477 | | 70,677 | | 5.4 | |
| | 56,536 | | 59,712 | | 64,525 | | 70,266 | | 75,602 | | 78,510 | | 81,778 | | 83,764 | | 86,263 | | 88,688 | | 4.2 | |
Net liabilities | | (26,160 | ) | (29,372 | ) | (32,026 | ) | (35,758 | ) | (38,016 | ) | (38,777 | ) | (39,784 | ) | (41,055 | ) | (42,234 | ) | (42,835 | ) | 4.6 | |
Capital and other assets: | | | | | | | | | | | | | | | | | | | | | | | |
Tangible capital assets | | 30,539 | | 32,219 | | 34,278 | | 35,692 | | 36,762 | | 37,778 | | 39,308 | | 40,930 | | 42,483 | | 43,483 | | 3.3 | |
Restricted assets | | 1,178 | | 1,241 | | 1,312 | | 1,377 | | 1,442 | | 1,493 | | 1,560 | | 1,614 | | 1,668 | | 1,722 | | | |
Other assets | | 758 | | 896 | | 1,086 | | 1,215 | | 1,267 | | 1,641 | | 1,518 | | 1,427 | | 1,416 | | 1,410 | | 5.8 | |
| | 32,475 | | 34,356 | | 36,676 | | 38,284 | | 39,471 | | 40,912 | | 42,386 | | 43,971 | | 45,567 | | 46,615 | | 3.3 | |
Accumulated surplus (deficit) | | 6,315 | | 4,984 | | 4,650 | | 2,526 | | 1,455 | | 2,135 | | 2,602 | | 2,916 | | 3,333 | | 3,780 | | n/a | |
Per cent of Nominal GDP: 1 | | | | | | | | | | | | | | | | | | | | | | | |
Net liabilities | | 12.8 | | 15.0 | | 15.5 | | 16.4 | | 17.1 | | 16.9 | | 16.7 | | 16.6 | | 16.3 | | 15.9 | | 2.0 | |
Capital and other assets | | 15.9 | | 17.5 | | 17.8 | | 17.6 | | 17.7 | | 17.8 | | 17.8 | | 17.7 | | 17.6 | | 17.3 | | 0.7 | |
Growth rates: | | | | | | | | | | | | | | | | | | | | | | | |
Net liabilities | | 9.9 | | 12.3 | | 9.0 | | 11.7 | | 6.3 | | 2.0 | | 2.6 | | 3.2 | | 2.9 | | 1.4 | | 5.7 | |
Capital and other assets | | 6.5 | | 5.8 | | 6.8 | | 4.4 | | 3.1 | | 3.7 | | 3.6 | | 3.7 | | 3.6 | | 2.3 | | 4.1 | |
Per capita: 2 | | | | | | | | | | | | | | | | | | | | | | | |
Net liabilities | | 6,015 | | 6,659 | | 7,171 | | 7,948 | | 8,369 | | 8,462 | | 8,590 | | 8,758 | | 8,896 | | 8,906 | | 3.6 | |
Capital and other assets | | 7,467 | | 7,789 | | 8,212 | | 8,509 | | 8,689 | | 8,928 | | 9,152 | | 9,380 | | 9,598 | | 9,692 | | 2.4 | |
1 Net liabilities as a per cent of GDP is calculated using GDP for the calendar year ending in the fiscal year (e.g. 2015/16 amount divided by GDP for the 2015 calendar year).
2 Per capita net liabilities is calculated using July 1 population (e.g. 2015/16 amount divided by population on July 1, 2015).
Budget and Fiscal Plan — 2015/16 to 2017/18
124
Appendix
Table A16 Changes in Financial Position — 2008/09 to 2017/18
| | | | | | | | | | | | | | Updated | | Budget | | | | | | | |
| | Actual | | Actual | | Actual | | Actual | | Actual | | Actual | | Forecast | | Estimate | | Plan | | Plan | | 10-Year | |
($ millions) | | 2008/09 | | 2009/10 | | 2010/11 | | 2011/12 | | 2012/13 | | 2013/14 | | 2014/15 | | 2015/16 | | 2016/17 | | 2017/18 | | Total | |
(Surplus) deficit for the year | | (73 | ) | 1,812 | | 238 | | 1,837 | | 1,152 | | (353 | ) | (879 | ) | (284 | ) | (376 | ) | (399 | ) | 2,675 | |
Comprehensive income (increase) decrease | | 437 | | (481 | ) | 96 | | 287 | | (81 | ) | (327 | ) | 412 | | (30 | ) | (41 | ) | (48 | ) | 224 | |
Change in accumulated (surplus) deficit | | 364 | | 1,331 | | 334 | | 2,124 | | 1,071 | | (680 | ) | (467 | ) | (314 | ) | (417 | ) | (447 | ) | 2,899 | |
Capital and other asset changes: | | | | | | | | | | | | | | | | | | | | | | | |
Taxpayer-supported capital investments | | 3,743 | | 3,719 | | 4,110 | | 3,565 | | 3,279 | | 3,151 | | 3,637 | | 3,731 | | 3,726 | | 3,199 | | 35,860 | |
Less: amortization and other accounting changes | | (1,856 | ) | (2,039 | ) | (2,051 | ) | (2,151 | ) | (2,209 | ) | (2,135 | ) | (2,107 | ) | (2,109 | ) | (2,173 | ) | (2,199 | ) | (21,029 | ) |
Increase in net capital assets | | 1,887 | | 1,680 | | 2,059 | | 1,414 | | 1,070 | | 1,016 | | 1,530 | | 1,622 | | 1,553 | | 1,000 | | 14,831 | |
Increase (decrease) in restricted assets | | 48 | | 63 | | 71 | | 65 | | 65 | | 51 | | 67 | | 54 | | 54 | | 54 | | 592 | |
Increase (decrease) in other assets | | 50 | | 138 | | 190 | | 129 | | 52 | | 374 | | (123 | ) | (91 | ) | (11 | ) | (6 | ) | 702 | |
| | 1,985 | | 1,881 | | 2,320 | | 1,608 | | 1,187 | | 1,441 | | 1,474 | | 1,585 | | 1,596 | | 1,048 | | 16,125 | |
Increase (decrease) in net liabilities | | 2,349 | | 3,212 | | 2,654 | | 3,732 | | 2,258 | | 761 | | 1,007 | | 1,271 | | 1,179 | | 601 | | 19,024 | |
Investment and working capital changes: | | | | | | | | | | | | | | | | | | | | | | | |
Increase (reduction) in cash and temporary investments | | (769 | ) | (2,274 | ) | 149 | | 175 | | (61 | ) | (372 | ) | (9 | ) | (955 | ) | (188 | ) | (193 | ) | (4,497 | ) |
Increase (decrease) in warehouse borrowing investments | | 2,081 | | (2,081 | ) | — | | — | | — | | — | | — | | — | | — | | — | | — | |
Investment in commercial Crown corporations: | | | | | | | | | | | | | | | | | | | | | | | |
Increase (decrease) in retained earnings | | 623 | | 1,506 | | (366 | ) | (94 | ) | 543 | | 298 | | 356 | | 247 | | 327 | | 422 | | 3,862 | |
Self-supported capital investments | | 1,810 | | 3,362 | | 2,470 | | 2,744 | | 2,765 | | 2,519 | | 2,604 | | 2,518 | | 2,527 | | 2,944 | | 26,263 | |
Less: loan repayments and other accounting changes | | (380 | ) | (1,040 | ) | (994 | ) | (845 | ) | (704 | ) | (505 | ) | (802 | ) | (1,411 | ) | (1,271 | ) | (1,374 | ) | (9,326 | ) |
| | 2,053 | | 3,828 | | 1,110 | | 1,805 | | 2,604 | | 2,312 | | 2,158 | | 1,354 | | 1,583 | | 1,992 | | 20,799 | |
Other working capital changes | | (2,856 | ) | 331 | | (472 | ) | (867 | ) | 1,084 | | 1,262 | | 58 | | 472 | | (255 | ) | (200 | ) | (1,443 | ) |
| | 509 | | (196 | ) | 787 | | 1,113 | | 3,627 | | 3,202 | | 2,207 | | 871 | | 1,140 | | 1,599 | | 14,859 | |
Increase (decrease) in financial statement debt | | 2,858 | | 3,016 | | 3,441 | | 4,845 | | 5,885 | | 3,963 | | 3,214 | | 2,142 | | 2,319 | | 2,200 | | 33,883 | |
(Increase) decrease in sinking fund debt | | 515 | | 805 | | (81 | ) | (81 | ) | (287 | ) | 943 | | (76 | ) | (4 | ) | (19 | ) | (24 | ) | 1,691 | |
Increase (decrease) in guarantees | | (9 | ) | (14 | ) | (31 | ) | (27 | ) | (14 | ) | (6 | ) | (2 | ) | (1 | ) | — | | 1 | | (103 | ) |
Increase (decrease) in non-guaranteed debt | | 13 | | 64 | | (60 | ) | 302 | | 39 | | (23 | ) | 1 | | (7 | ) | (15 | ) | (18 | ) | 296 | |
Increase (decrease) in total provincial debt | | 3,377 | | 3,871 | | 3,269 | | 5,039 | | 5,623 | | 4,877 | | 3,137 | | 2,130 | | 2,285 | | 2,159 | | 35,767 | |
Represented by increase (decrease) in: | | | | | | | | | | | | | | | | | | | | | | | |
Taxpayer-supported debt | | (147 | ) | 3,566 | | 1,853 | | 2,838 | | 3,523 | | 2,886 | | 1,234 | | 880 | | 944 | | 607 | | 18,184 | |
Self-supported debt | | 3,524 | | 305 | | 1,416 | | 2,201 | | 2,100 | | 1,991 | | 1,803 | | 1,100 | | 1,241 | | 1,552 | | 17,233 | |
Forecast allowance | | — | | — | | — | | — | | — | | — | | 100 | | 150 | | 100 | | — | | 350 | |
Total provincial debt | | 3,377 | | 3,871 | | 3,269 | | 5,039 | | 5,623 | | 4,877 | | 3,137 | | 2,130 | | 2,285 | | 2,159 | | 35,767 | |
Budget and Fiscal Plan — 2015/16 to 2017/18
125
Appendix
Table A17 Provincial Debt — 2008/09 to 2017/18
| | | | | | | | | | | | | | Updated | | Budget | | | | | | Average | |
| | Actual | | Actual | | Actual | | Actual | | Actual | | Actual | | Forecast | | Estimate | | Plan | | Plan | | annual | |
($ millions) | | 2008/09 | | 2009/10 | | 2010/11 | | 2011/12 | | 2012/13 | | 2013/14 | | 2014/15 | | 2015/16 | | 2016/17 | | 2017/18 | | change | |
Taxpayer-supported debt: | | | | | | | | | | | | | | | | | | | | | | (per cent) | |
Provincial government direct operating | | 5,744 | | 7,359 | | 6,964 | | 7,813 | | 9,408 | | 10,223 | | 9,441 | | 8,420 | | 6,718 | | 4,767 | | -2.1 | |
Other taxpayer-supported debt (mainly capital): | | | | | | | | | | | | | | | | | | | | | | | |
Education facilities | | | | | | | | | | | | | | | | | | | | | | | |
School districts | | 5,522 | | 5,777 | | 6,016 | | 6,407 | | 6,830 | | 7,245 | | 7,612 | | 7,956 | | 8,430 | | 8,991 | | 5.6 | |
Post-secondary institutions | | 3,611 | | 3,824 | | 4,092 | | 4,185 | | 4,315 | | 4,386 | | 4,523 | | 4,686 | | 5,007 | | 5,340 | | 4.4 | |
| | 9,133 | | 9,601 | | 10,108 | | 10,592 | | 11,145 | | 11,631 | | 12,135 | | 12,642 | | 13,437 | | 14,331 | | 5.1 | |
Health facilities | | 3,936 | | 4,389 | | 4,895 | | 5,293 | | 5,691 | | 6,038 | | 6,545 | | 7,036 | | 7,721 | | 8,166 | | 8.4 | |
Highways, ferries and public transit | | | | | | | | | | | | | | | | | | | | | | | |
BC Transportation Financing Authority | | 4,586 | | 5,211 | | 5,785 | | 6,287 | | 7,084 | | 7,912 | | 8,512 | | 9,312 | | 10,142 | | 11,085 | | 10.3 | |
SkyTrain extension | | 1,154 | | 1,154 | | 1,155 | | 1,174 | | 1,174 | | 1,174 | | 1,174 | | 1,174 | | 1,174 | | 1,174 | | 0.2 | |
Public transit | | 997 | | 997 | | 997 | | 1,000 | | 1,000 | | 1,000 | | 1,000 | | 1,000 | | 1,000 | | 1,000 | | 0.0 | |
BC Transit | | 94 | | 140 | | 158 | | 183 | | 163 | | 143 | | 123 | | 168 | | 201 | | 202 | | 8.9 | |
| | 6,831 | | 7,502 | | 8,095 | | 8,644 | | 9,421 | | 10,229 | | 10,809 | | 11,654 | | 12,517 | | 13,461 | | 7.8 | |
Other | | | | | | | | | | | | | | | | | | | | | | | |
Social Housing | | 286 | | 305 | | 511 | | 674 | | 658 | | 719 | | 786 | | 706 | | 708 | | 709 | | 10.6 | |
Provincial government general capital | | — | | 294 | | 570 | | 808 | | 1,073 | | 1,371 | | 1,743 | | 1,995 | | 2,377 | | 2,710 | | n/a | |
BC Immigrant Investment Fund | | 287 | | 289 | | 347 | | 398 | | 363 | | 440 | | 433 | | 311 | | 224 | | 156 | | -6.5 | |
Homeowner Protection Office | | 150 | | 144 | | — | | — | | — | | — | | — | | — | | — | | — | | n/a | |
BC Pavilion Corporation | | — | | 49 | | 250 | | 383 | | 383 | | 383 | | 380 | | 387 | | 396 | | 404 | | n/a | |
Other | | 35 | | 36 | | 81 | | 54 | | 40 | | 34 | | 30 | | 31 | | 28 | | 29 | | -2.1 | |
| | 758 | | 1,117 | | 1,759 | | 2,317 | | 2,517 | | 2,947 | | 3,372 | | 3,430 | | 3,733 | | 4,008 | | 20.3 | |
Total other taxpayer-supported debt | | 20,658 | | 22,609 | | 24,857 | | 26,846 | | 28,774 | | 30,845 | | 32,861 | | 34,762 | | 37,408 | | 39,966 | | 7.6 | |
Total taxpayer-supported debt | | 26,402 | | 29,968 | | 31,821 | | 34,659 | | 38,182 | | 41,068 | | 42,302 | | 43,182 | | 44,126 | | 44,733 | | 6.0 | |
| | | | | | | | | | | | | | | | | | | | | | | |
Self-supported debt: | | | | | | | | | | | | | | | | | | | | | | | |
Commercial Crown corporations and agencies | | | | | | | | | | | | | | | | | | | | | | | |
BC Hydro | | 9,054 | | 10,792 | | 11,710 | | 12,978 | | 14,167 | | 15,559 | | 16,940 | | 18,013 | | 19,215 | | 20,734 | | 9.6 | |
Transportation Invest. Corp. (Port Mann) | | 20 | | 544 | | 1,148 | | 1,779 | | 2,610 | | 3,209 | | 3,329 | | 3,371 | | 3,407 | | 3,439 | | n/a | |
Post-secondary institution subsidiaries | | 149 | | 220 | | 173 | | 173 | | 215 | | 198 | | 198 | | 198 | | 198 | | 198 | | 3.2 | |
Columbia Power Corporation | | — | | — | | — | | — | | — | | — | | 299 | | 293 | | 286 | | 278 | | | |
Columbia River power projects | | 208 | | 196 | | 183 | | 481 | | 475 | | 470 | | 464 | | 457 | | 443 | | 428 | | 8.3 | |
BC Transmission Corporation | | 70 | | 70 | | — | | — | | — | | — | | — | | — | | — | | — | | n/a | |
BC Lotteries | | — | | 60 | | 85 | | 90 | | 132 | | 155 | | 155 | | 155 | | 180 | | 206 | | n/a | |
Other | | 30 | | 35 | | 34 | | 33 | | 35 | | 34 | | 43 | | 41 | | 40 | | 38 | | 2.7 | |
| | 9,531 | | 11,917 | | 13,333 | | 15,534 | | 17,634 | | 19,625 | | 21,428 | | 22,528 | | 23,769 | | 25,321 | | 11.5 | |
Warehouse borrowing program | | 2,081 | | — | | — | | — | | — | | — | | — | | — | | — | | — | | n/a | |
Total self-supported debt | | 11,612 | | 11,917 | | 13,333 | | 15,534 | | 17,634 | | 19,625 | | 21,428 | | 22,528 | | 23,769 | | 25,321 | | 9.0 | |
Forecast allowance | | — | | — | | — | | — | | — | | — | | 100 | | 250 | | 350 | | 350 | | n/a | |
Total provincial debt | | 38,014 | | 41,885 | | 45,154 | | 50,193 | | 55,816 | | 60,693 | | 63,830 | | 65,960 | | 68,245 | | 70,404 | | 7.1 | |
Budget and Fiscal Plan — 2015/16 to 2017/18
126
Appendix
Table A18 Provincial Debt Supplementary Information — 2008/09 to 2017/18 1
| | | | | | | | | | | | | | Updated | | Budget | | | | | | Average | |
| | Actual | | Actual | | Actual | | Actual | | Actual | | Actual | | Forecast | | Estimate | | Plan | | Plan | | annual | |
($ millions) | | 2008/09 | | 2009/10 | | 2010/11 | | 2011/12 | | 2012/13 | | 2013/14 | | 2014/15 | | 2015/16 | | 2016/17 | | 2017/18 | | change | |
Per cent of nominal GDP: 2 | | | | | | | | | | | | | | | | | | | | | | (per cent) | |
Taxpayer-supported debt: | | | | | | | | | | | | | | | | | | | | | | | |
Provincial government direct operating | | 2.8 | | 3.8 | | 3.4 | | 3.6 | | 4.2 | | 4.5 | | 4.0 | | 3.4 | | 2.6 | | 1.8 | | -5.0 | |
Education facilities | | 4.5 | | 4.9 | | 4.9 | | 4.9 | | 5.0 | | 5.1 | | 5.1 | | 5.1 | | 5.2 | | 5.3 | | 1.9 | |
Health facilities | | 1.9 | | 2.2 | | 2.4 | | 2.4 | | 2.6 | | 2.6 | | 2.7 | | 2.8 | | 3.0 | | 3.0 | | 5.1 | |
Highways, ferries and public transit | | 3 3 | | 3 8 | | 3 9 | | 4 0 | | 4 2 | | 4 5 | | 4 5 | | 4 7 | | 4 8 | | 5 0 | | 4 5 | |
Other | | 0.4 | | 0.6 | | 0.9 | | 1.1 | | 1.1 | | 1.3 | | 1.4 | | 1.4 | | 1.4 | | 1.5 | | 16.6 | |
Total taxpayer-supported debt | | 12.9 | | 15.3 | | 15.4 | | 15.9 | | 17.2 | | 17.9 | | 17.7 | | 17.4 | | 17.1 | | 16.6 | | 2.8 | |
Self-supported debt: | | | | | | | | | | | | | | | | | | | | | | | |
Commercial Crown corporations & agencies | | 4.7 | | 6.1 | | 6.5 | | 7.1 | | 7.9 | | 8.5 | | 9.0 | | 9.1 | | 9.2 | | 9.4 | | 8.1 | |
Warehouse borrowing program | | 1.0 | | — | | — | | — | | — | | — | | — | | — | | — | | — | | n/a | |
Total self-supported debt | | 5.7 | | 6.1 | | 6.5 | | 7.1 | | 7.9 | | 8.5 | | 9.0 | | 9.1 | | 9.2 | | 9.4 | | 5.7 | |
Total provincial debt | | 18.6 | | 21.4 | | 21.9 | | 23.1 | | 25.1 | | 26.4 | | 26.7 | | 26.6 | | 26.4 | | 26.1 | | 3.8 | |
Growth rates: | | | | | | | | | | | | | | | | | | | | | | | |
Taxpayer-supported debt: | | | | | | | | | | | | | | | | | | | | | | | |
Provincial government direct operating | | -24.5 | | 28.1 | | -5.4 | | 12.2 | | 20.4 | | 8.7 | | -7.6 | | -10.8 | | -20.2 | | -29.0 | | -2.8 | |
Education facilities | | 5.7 | | 5.1 | | 5.3 | | 4.8 | | 5.2 | | 4.4 | | 4.3 | | 4.2 | | 6.3 | | 6.7 | | 5.2 | |
Health facilities | | 12.1 | | 11.5 | | 11.5 | | 8.1 | | 7.5 | | 6.1 | | 8.4 | | 7.5 | | 9.7 | | 5.8 | | 8.8 | |
Highways, ferries and public transit | | 11.2 | | 9.8 | | 7.9 | | 6.8 | | 9.0 | | 8.6 | | 5.7 | | 7.8 | | 7.4 | | 7.5 | | 8.2 | |
Other | | 16.1 | | 47.4 | | 57.5 | | 31.7 | | 8.6 | | 17.1 | | 14.4 | | 1.7 | | 8.8 | | 7.4 | | 21.1 | |
Total taxpayer-supported debt | | -0.6 | | 13.5 | | 6.2 | | 8.9 | | 10.2 | | 7.6 | | 3.0 | | 2.1 | | 2.2 | | 1.4 | | 5.4 | |
Self-supported debt: | | | | | | | | | | | | | | | | | | | | | | | |
Commercial Crown corporations & agencies | | 17.8 | | 25.0 | | 11.9 | | 16.5 | | 13.5 | | 11.3 | | 9.2 | | 5.1 | | 5.5 | | 6.5 | | 12.2 | |
Warehouse borrowing program | | — | | -100.0 | | — | | — | | — | | — | | — | | — | | — | | — | | n/a | |
Total self-supported debt | | 43.6 | | 2.6 | | 11.9 | | 16.5 | | 13.5 | | 11.3 | | 9.2 | | 5.1 | | 5.5 | | 6.5 | | 12.6 | |
Total provincial debt | | 9.7 | | 10.2 | | 7.8 | | 11.2 | | 11.2 | | 8.7 | | 5.2 | | 3.3 | | 3.5 | | 3.2 | | 7.4 | |
Per capita: 3 | | | | | | | | | | | | | | | | | | | | | | | |
Taxpayer-supported debt: | | | | | | | | | | | | | | | | | | | | | | | |
Provincial government direct operating | | 1,321 | | 1,668 | | 1,559 | | 1,737 | | 2,071 | | 2,231 | | 2,039 | | 1,796 | | 1,415 | | 991 | | -3.1 | |
Education facilities | | 2,100 | | 2,177 | | 2,263 | | 2,354 | | 2,453 | | 2,538 | | 2,620 | | 2,697 | | 2,830 | | 2,980 | | 4.0 | |
Health facilities | | 905 | | 995 | | 1,096 | | 1,176 | | 1,253 | | 1,318 | | 1,413 | | 1,501 | | 1,626 | | 1,698 | | 7.2 | |
Highways, ferries and public transit | | 1,571 | | 1,701 | | 1,813 | | 1,921 | | 2,074 | | 2,232 | | 2,334 | | 2,486 | | 2,636 | | 2,799 | | 6.6 | |
Other | | 174 | | 253 | | 394 | | 515 | | 554 | | 643 | | 728 | | 732 | | 786 | | 833 | | 19.0 | |
Total taxpayer-supported debt | | 6,070 | | 6,794 | | 7,125 | | 7,703 | | 8,405 | | 8,962 | | 9,134 | | 9,212 | | 9,294 | | 9,301 | | 4.9 | |
Self-supported debt: | | | | | | | | | | | | | | | | | | | | | | | |
Commercial Crown corporations & agencies | | 2,191 | | 2,702 | | 2,985 | | 3,453 | | 3,882 | | 4,282 | | 4,627 | | 4,806 | | 5,007 | | 5,265 | | 10.2 | |
Warehouse borrowing program | | 478 | | — | | — | | — | | — | | — | | — | | — | | — | | — | | n/a | |
Total self-supported debt | | 2,670 | | 2,702 | | 2,985 | | 3,453 | | 3,882 | | 4,282 | | 4,627 | | 4,806 | | 5,007 | | 5,265 | | 7.8 | |
Total provincial debt | | 8,740 | | 9,496 | | 10,111 | | 11,156 | | 12,287 | | 13,244 | | 13,782 | | 14,071 | | 14,375 | | 14,639 | | 5.9 | |
Real Per Capita Provincial Debt (2014 $) 4 | | 9,254 | | 10,054 | | 10,564 | | 11,386 | | 12,402 | | 13,379 | | 13,782 | | 13,838 | | 13,884 | | 13,858 | | 4.6 | |
Growth rate (per cent) | | 6.1 | | 8.7 | | 5.1 | | 7.8 | | 8.9 | | 7.9 | | 3.0 | | 0.4 | | 0.3 | | -0.2 | | 4.8 | |
1 Numbers may not add due to rounding.
2 Debt as a percent of GDP is calculated using nominal GDP for the calendar year ending in the fiscal year (e.g. 2015/16 debt divided by nominal GDP for the 2015 calendar year).
3 Per capita debt is calculated using July 1 population (e.g. 2015/16 debt divided by population on July 1, 2015).
4 Debt is converted to real (inflation-adjusted) terms using the consumer price index (CPI) for the corresponding calendar year (e.g. 2015 CPI for 2015/16 debt).
Budget and Fiscal Plan — 2015/16 to 2017/18
127
Appendix
Table A19 Key Provincial Debt Indicators — 2008/09 to 2017/18
| | | | | | | | | | | | | | Updated | | Budget | | | | | | Average | |
| | Actual | | Actual | | Actual | | Actual | | Actual | | Actual | | Forecast | | Estimate | | Plan | | Plan | | annual | |
| | 2008/09 | | 2009/10 | | 2010/11 | | 2011/12 | | 2012/13 | | 2013/14 | | 2014/15 | | 2015/16 | | 2016/17 | | 2017/18 | | change | |
Debt to revenue (per cent) | | | | | | | | | | | | | | | | | | | | | | (per cent) | |
Total provincial | | 77.2 | | 86.5 | | 88.5 | | 94.7 | | 104.1 | | 107.7 | | 108.4 | | 110.5 | | 111.1 | | 112.2 | | 4.2 | |
Taxpayer-supported | | 71.0 | | 82.6 | | 78.8 | | 85.1 | | 93.7 | | 96.1 | | 95.8 | | 95.4 | | 95.1 | | 94.7 | | 3.3 | |
Debt per capita ($) 1 | | | | | | | | | | | | | | | | | | | | | | | |
Total provincial | | 8,740 | | 9,496 | | 10,111 | | 11,156 | | 12,287 | | 13,244 | | 13,782 | | 14,071 | | 14,375 | | 14,639 | | 5.9 | |
Taxpayer-supported | | 6,070 | | 6,794 | | 7,125 | | 7,703 | | 8,405 | | 8,962 | | 9,134 | | 9,212 | | 9,294 | | 9,301 | | 4.9 | |
Debt to nominal GDP (per cent) 2 | | | | | | | | | | | | | | | | | | | | | | | |
Total provincial | | 18.6 | | 21.4 | | 21.9 | | 23.1 | | 25.1 | | 26.4 | | 26.7 | | 26.6 | | 26.4 | | 26.1 | | 3.8 | |
Taxpayer-supported | | 12.9 | | 15.3 | | 15.4 | | 15.9 | | 17.2 | | 17.9 | | 17.7 | | 17.4 | | 17.1 | | 16.6 | | 2.8 | |
Interest bite (cents per dollar of revenue) 3 | | | | | | | | | | | | | | | | | | | | | | | |
Total provincial | | 4.3 | | 4.6 | | 4.2 | | 4.3 | | 4.4 | | 4.5 | | 4.4 | | 4.7 | | 4.8 | | 5.1 | | 1.8 | |
Taxpayer-supported | | 4.2 | | 4.2 | | 4.0 | | 4.0 | | 3.9 | | 3.9 | | 3.8 | | 3.9 | | 4.1 | | 4.3 | | 0.1 | |
Interest costs ($ millions) | | | | | | | | | | | | | | | | | | | | | | | |
Total provincial | | 2,138 | | 2,205 | | 2,155 | | 2,300 | | 2,336 | | 2,547 | | 2,580 | | 2,827 | | 2,966 | | 3,193 | | 4.6 | |
Taxpayer-supported | | 1,570 | | 1,534 | | 1,596 | | 1,625 | | 1,590 | | 1,686 | | 1,679 | | 1,777 | | 1,913 | | 2,016 | | 2.8 | |
Interest rate (per cent) 4 | | | | | | | | | | | | | | | | | | | | | | | |
Taxpayer-supported | | 5.9 | | 5.4 | | 5.2 | | 4.9 | | 4.4 | | 4.3 | | 4.0 | | 4.2 | | 4.4 | | 4.5 | | -2.9 | |
Background Information: | | | | | | | | | | | | | | | | | | | | | | | |
Revenue ($ millions) | | | | | | | | | | | | | | | | | | | | | | | |
Total provincial 5 | | 49,224 | | 48,438 | | 51,044 | | 53,005 | | 53,626 | | 56,356 | | 58,885 | | 59,688 | | 61,436 | | 62,744 | | 2.7 | |
Taxpayer-supported 6 | | 37,205 | | 36,272 | | 40,394 | | 40,746 | | 40,757 | | 42,725 | | 44,166 | | 45,241 | | 46,402 | | 47,220 | | 2.7 | |
Debt ($ millions) | | | | | | | | | | | | | | | | | | | | | | | |
Total provincial | | 38,014 | | 41,885 | | 45,154 | | 50,193 | | 55,816 | | 60,693 | | 63,830 | | 65,960 | | 68,245 | | 70,404 | | 7.1 | |
Taxpayer-supported 7 | | 26,402 | | 29,968 | | 31,821 | | 34,659 | | 38,182 | | 41,068 | | 42,302 | | 43,182 | | 44,126 | | 44,733 | | 6.0 | |
Provincial nominal GDP ($ millions) 8 | | 203,951 | | 195,966 | | 205,996 | | 217,460 | | 222,565 | | 229,685 | | 238,726 | | 247,860 | | 258,484 | | 269,701 | | 3.2 | |
Population (thousands at July 1) 9 | | 4,349 | | 4,411 | | 4,466 | | 4,499 | | 4,543 | | 4,583 | | 4,631 | | 4,688 | | 4,748 | | 4,809 | | 1.1 | |
1 The ratio of debt to population (e.g. 2015/16 debt divided by population at July 1, 2015).
2 The ratio of debt outstanding at fiscal year end to provincial nominal gross domestic product (GDP) for the calendar year ending in the fiscal year (e.g. 2015/16 debt divided by 2015 nominal GDP).
3 The ratio of interest costs (less sinking fund interest) to revenue. Figures include capitalized interest expense in order to provide a more comparable measure to outstanding debt.
4 Weighted average of all outstanding debt issues.
5 Includes revenue of the consolidated revenue fund (excluding dividends from enterprises) plus revenue of all government organizations and enterprises.
6 Excludes revenue of government enterprises, but includes dividends from enterprises paid to the consolidated revenue fund.
7 Excludes debt of commercial Crown corporations and agencies and funds held under the province’s warehouse borrowing program.
8 Nominal GDP for the calendar year ending in the fiscal year (e.g. Nominal GDP for 2015 is used for the fiscal year ended March 31, 2016).
9 Population at July 1st within the fiscal year (e.g. population at July 1, 2015 is used for the fiscal year ended March 31, 2016).
Budget and Fiscal Plan — 2015/16 to 2017/18
128