Second Quarterly Report
2018/19 Financial Update,
Economic Outlook
&
Six Month Financial Results
April — September 2018

British Columbia Cataloguing in Publication Data
British Columbia. Ministry of Finance.
Quarterly report on the economy, fiscal situation and Crown corporations. — ongoing—
Quarterly.
Title on cover: Quarterly report.
Continues: British Columbia. Ministry of Finance.
Quarterly financial report. ISSN 0833-1375.
ISSN 1192-2176 — Quarterly Report on the economy, fiscal situation and Crown corporations.
1. Finance, Public — British Columbia — Accounting — Periodicals. 2. British Columbia — Economic conditions — 1945— — Periodicals.*
3. Corporations, Government — British Columbia — Accounting — Periodicals. I. Title.
HJ13.B77 354.711’007231’05
TABLE OF CONTENTS | | |
| | |
2018/19 Second Quarterly Report | | November 26, 2018 |
| | |
Part One — Updated Financial Forecast | | |
Introduction | | 1 |
Revenue | | 3 |
Expense | | 6 |
Consolidated Revenue Fund Spending | | 6 |
Contingencies | | 7 |
Spending Recovered from Third Parties | | 7 |
Operating Transfers to Service Delivery Agencies | | 7 |
Service Delivery Agency Spending | | 7 |
Government Employment (FTEs) | | 7 |
Provincial Capital Spending | | 7 |
Projects Over $50 Million | | 8 |
Provincial Debt | | 9 |
Risks to the Fiscal Forecast | | 10 |
Supplementary Schedules | | 11 |
| | |
Tables: | | |
1.1 2018/19 Forecast Update | | 1 |
1.2 2018/19 Financial Forecast Changes | | 2 |
1.3 2018/19 Capital Spending Update | | 8 |
1.4 2018/19 Provincial Debt Update | | 9 |
| | |
Tables: | | |
Supplementary Schedules | | |
1.5 Operating Statement | | 11 |
1.6 Revenue by Source | | 12 |
1.7 Expense by Ministry, Program and Agency | | 13 |
1.8 Expense by Function | | 14 |
1.9 Material Assumptions — Revenue | | 15 |
1.10 Material Assumptions — Expense | | 20 |
1.11 Full-Time Equivalents | | 23 |
1.12 Capital Spending | | 23 |
1.13 Capital Expenditure Projects Greater Than $50 Million | | 24 |
1.14 Provincial Debt | | 27 |
1.15 Statement of Financial Position | | 28 |
Second Quarterly Report 2018/19
Table of Contents
Part Two — Economic Review and Outlook | | |
Summary | | 29 |
British Columbia Outlook — Comparison to Private Sector Forecasts | | 29 |
British Columbia Economic Activity | | 30 |
Labour Market | | 30 |
Consumer Spending and Housing | | 31 |
External Trade and Commodity Markets | | 33 |
Demographics | | 34 |
Inflation | | 35 |
Risks to the Economic Outlook | | 35 |
External Outlook | | 36 |
United States | | 36 |
Canada | | 38 |
Asia | | 39 |
Europe | | 40 |
Financial Markets | | 40 |
Interest Rates | | 40 |
Exchange Rate | | 41 |
| | |
Tables: | | |
2.1 British Columbia Economic Indicators | | 30 |
2.2 Private Sector Canadian Interest Rate Forecasts | | 41 |
2.3 Private Sector Exchange Rate Forecasts | | 42 |
| | |
Topic Box: | | |
Provincial Economic Accounts Update | | 43 |
Second Quarterly Report 2018/19
ii
PART ONE — UPDATED FINANCIAL FORECAST
2018/19 Second Quarterly Report | November 26, 2018 |
Introduction
Table 1.1 2018/19 Forecast Update
| | | | First | | Second | |
| | Budget | | Quarterly | | Quarterly | |
($ millions) | | 2018 | | Report | | Report | |
Revenue | | 54,193 | | 55,815 | | 57,198 | |
Expense | | (53,624 | ) | (54,796 | ) | (54,898 | ) |
Forecast allowance | | (350 | ) | (350 | ) | (950 | ) |
Surplus | | 219 | | 669 | | 1,350 | |
Capital spending: | | | | | | | |
Taxpayer-supported capital spending | | 5,174 | | 5,579 | | 5,177 | |
Self-supported capital spending | | 4,061 | | 4,078 | | 4,061 | |
| | 9,235 | | 9,657 | | 9,238 | |
Provincial Debt: | | | | | | | |
Taxpayer-supported debt | | 45,198 | | 44,717 | | 42,431 | |
Self-supported debt | | 23,824 | | 23,447 | | 23,291 | |
Total debt (including forecast allowance) | | 69,372 | | 68,514 | | 66,672 | |
Taxpayer-supported debt to GDP ratio | | 15.5 | % | 15.3 | % | 14.4 | % |
Taxpayer-supported debt to revenue ratio | | 84.9 | % | 82.0 | % | 75.6 | % |
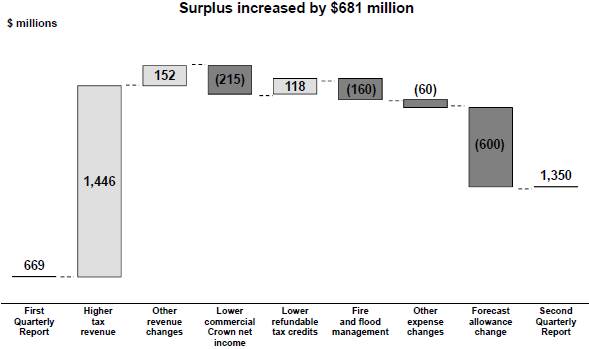
The second quarter outlook for 2018/19 forecasts an operating surplus of $1,350 million — $681 million higher than the projection in the First Quarterly Report. The revenue outlook is $1,383 million higher primarily due to the effects of improved 2017 preliminary personal and corporate income tax assessments, partially offset by lower property transfer tax and higher ICBC net loss. The updated expense forecast is $102 million higher than in the First Quarterly Report due to higher spending for fire and
Chart 1.1 Operating Changes from the First Quarterly Report
Second Quarterly Report 2018/19
Updated Financial Forecast
Table 1.2 2018/19 Financial Forecast Changes
| | ($ millions) | |
2018/19 surplus — Budget 2018 (February 20, 2018) | | 219 | | | | 219 | |
2018/19 surplus — First Quarterly Report (September 7, 2018) | | | | 669 | | | |
| | Q1 | | Q2 | | Total | |
| | Update | | Update | | Changes | |
| | | | | | | |
Revenue changes: | | | | | | | |
Personal income tax — mainly higher 2017 tax assessments | | 621 | | 813 | | 1,434 | |
Corporate income tax — increased prior-year adjustment, reflecting higher 2017 tax assessments, and higher federal government instalments | | 463 | | 842 | | 1,305 | |
Property transfer tax — lower year-to-date sales results | | (250 | ) | (150 | ) | (400 | ) |
Provincial sales tax — lower year-to-date results | | (48 | ) | (15 | ) | (63 | ) |
Other taxation sources | | 5 | | (44 | ) | (39 | ) |
Natural gas royalties — lower prices and increased utilization of royalty programs partially offset by higher natural gas liquids royalties and natural gas volumes | | (20 | ) | (24 | ) | (44 | ) |
Coal, metals and minerals — mainly higher coal prices | | 82 | | 69 | | 151 | |
Forests — changes in stumpage rates and lower volumes | | 380 | | (25 | ) | 355 | |
Other natural resources — mainly higher electricity prices | | 53 | | 31 | | 84 | |
Other revenue — mainly higher revenue from fees and miscellaneous sources and changes in investment earnings | | 82 | | 125 | | 207 | |
Health and social transfers — higher population share | | 176 | | 9 | | 185 | |
Other federal government transfers — mainly BC’s share of lower federal excise tax revenue on cannabis and payments under the Disaster Financial Assistance Arrangements | | 15 | | (33 | ) | (18 | ) |
Commercial Crown corporation net income: | | | | | | | |
BC Lottery Corporation — mainly stronger casino and community gaming revenue | | 65 | | (8 | ) | 57 | |
ICBC - mainly increased claims costs | | — | | (206 | ) | (206 | ) |
Other commercial Crown corporations | | (2 | ) | (1 | ) | (3 | ) |
Total revenue changes | | 1,622 | | 1,383 | | 3,005 | |
Less : expense increases (decreases): | | | | | | | |
Consolidated Revenue Fund changes: | | | | | | | |
Statutory spending: | | | | | | | |
Fire management costs | | 477 | | 31 | | 508 | |
Emergency Program Act — higher fire management and flood-related costs | | 162 | | 129 | | 291 | |
BC Training and Education Savings grant — higher projected uptake | | 11 | | 3 | | 14 | |
Elections BC — mainly for the referendum on electoral reform | | 21 | | — | | 21 | |
Refundable tax credits — mainly the impact of 2017 tax assessment results | | 379 | | (118 | ) | 261 | |
Prior year liability and other adjustments | | (3 | ) | (16 | ) | (19 | ) |
Management of public debt (net) — reflects revisions to scheduled borrowing | | (4 | ) | (12 | ) | (16 | ) |
Spending funded by third party recoveries | | (25 | ) | 3 | | (22 | ) |
Changes in spending profile of service delivery agencies: | | | | | | | |
School districts | | 31 | | — | | 31 | |
Universities | | 82 | | 26 | | 108 | |
Colleges | | 30 | | 6 | | 36 | |
Health authorities and hospital societies | | 132 | | 9 | | 141 | |
Other service delivery agencies | | 98 | | 8 | | 106 | |
(Increase) decrease in transfers to service delivery agencies (elimination) | | (219 | ) | 33 | | (186 | ) |
Total expense increases (decreases) | | 1,172 | | 102 | | 1,274 | |
Subtotal | | 450 | | 1,281 | | 1,731 | |
Increase in forecast allowance | | — | | (600 | ) | (600 | ) |
Total changes | | 450 | | 681 | | 1,131 | |
2018/19 surplus — First Quarterly Report | | 669 | | | | | |
2018/19 surplus — Second Quarterly Report | | | | 1,350 | | 1,350 | |
Second Quarterly Report 2018/19
2
Updated Financial Forecast
flood management, and higher spending by service delivery agencies, partially offset by lower refundable tax credits.
Projected taxpayer-supported capital spending has decreased by $402 million, mainly reflecting timing changes in the housing and transportation sectors. At $5.2 billion, the taxpayer-supported capital spending forecast for 2018/19 remains at a record level of annual investment. Self-supported capital spending is forecast to be $17 million lower, reflecting changes in timing of capital spending by the BC Lottery Corporation and the Liquor Distribution Branch.
The taxpayer-supported debt forecast is $2.3 billion lower compared to the projection in the First Quarterly Report mainly due to an increase in cash from higher revenues, and lower capital spending. The province’s operating debt has now been eliminated. Self-supported debt is $156 million lower mainly due to changes in timing of own-sourced financing.
Taxpayer-supported debt-to-GDP is now projected to end fiscal 2018/19 at 14.4 per cent, which is 0.9 percentage points lower than in the First Quarterly Report due to an improved forecast for taxpayer-supported debt. The debt-to-revenue ratio is forecast to end the year 6.4 percentage points lower at 75.6 per cent. Both these debt affordability metrics are now the lowest since fiscal 2008/09.
The forecast allowance has been increased by $600 million, reflecting continued uncertainty in ICBC’s net income forecast over the remainder of the fiscal year, and the potential of further slowdown in revenues impacted by housing activity.
Revenue
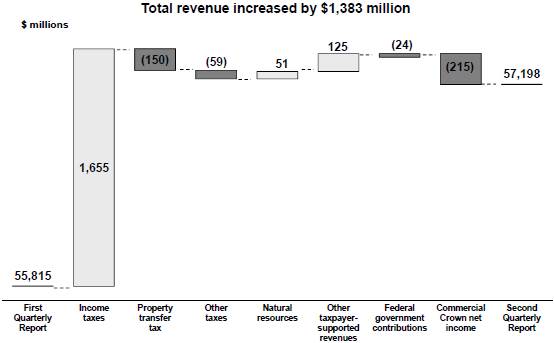
Revenue for 2018/19 is forecast to be $57.2 billion — $1.4 billion higher than the projection in the First Quarterly Report. Higher revenue from taxation, natural resources, fees, investment earnings and miscellaneous sources offset by lower federal government contributions and commercial Crown net income.
Chart 1.2 Revenue Changes from the First Quarterly Report
Second Quarterly Report 2018/19
3
Updated Financial Forecast
Detailed revenue projections are disclosed in Table 1.6 and key assumptions and sensitivities are provided in Table 1.9. An analysis of historical volatility of major economic variables related to revenue sources can be found on pages 14–15 in the 2018 British Columbia Financial and Economic Review. For 2018/19, major forecast changes from the projections in the First Quarterly Report include:
Income Tax Revenues
Personal income tax revenue forecast is up $813 million reflecting strong preliminary 2017 tax assessments. The change includes a one-time $434 million increase in the prior-year adjustment and a $379 million ongoing base impact beginning in 2018/19.
Corporate income tax revenue is up $842 million due to increased advance instalments from the federal government and a higher prior year settlement payment, reflecting stronger preliminary 2017 BC tax assessment information.
Other Tax Revenues
Property transfer tax revenue forecast is down $150 million due to slower housing market activity reflecting a lower number of transactions. The revised forecast of the additional 20 per cent property transfer tax is now $190 million, down from $227 million assumed in the First Quarterly Report.
Fuel and carbon tax revenues are $33 million lower due to weaker gasoline purchases based on year-to-date receipts.
All other taxation revenues are down $11 million mainly due to weaker tobacco product sales.
Natural Resource Revenues
Natural gas royalties are down $24 million mainly due to the effects of lower natural gas prices and increased utilization of royalty program credits, partially offset by an improved outlook of production volumes and increased royalties from natural gas liquids. The updated natural gas price forecast at $0.64 ($Cdn/gigajoule, plant inlet) is within the 20th percentile of the private sector forecasters and down 11 per cent from the First Quarterly Report estimate ($0.72).
Revenue from coal, metals, minerals and other mining related sources is up $69 million mainly reflecting higher expected coal prices due to continuing strong demand in Asia.
Forests revenue is down $25 million mainly due to lower stumpage revenue reflecting weaker harvest volumes and lumber prices. The revised forecast of the benchmark Western spruce-pine-fir 2X4 price is expected to average $500 US/thousand board feet, down from $551 US/thousand board feet assumed in the First Quarterly Report. The decline in stumpage revenue from the major tenures is partly offset by increased revenue from the BC Timber Sales program and logging taxes. Compared to the forecast at Budget 2018, forest revenue is forecast to be $355 million higher due to the high prices observed earlier in the year.
Revenue from sales of electricity under the Columbia River Treaty is up $17 million due to higher Mid-Columbia electricity prices, reflecting the recent disruption of the Pacific North West natural gas supplies.
Second Quarterly Report 2018/19
4
Updated Financial Forecast
Other natural resource revenues have increased $14 million mainly due to increased petroleum royalties reflecting higher projections of petroleum prices and production volumes.
Other Revenue
Revenue from fees, licences, investment earnings, fines, penalties and miscellaneous sources is up $125 million.
Medical Service Plan premiums are $26 million higher due to improved year-to-date results, relative to the forecast in the First Quarterly Report.
Fee revenue from the SUCH sector is projected to be up $44 million, mainly from post-secondary institutions.
Investment earnings are now forecast to be $44 million higher due to revised projections of accounting adjustments and ministry recoveries.
The revenue forecast from the remaining sources has improved by $11 million.
Federal Government Contributions
Canada Health Transfer and Canada Social Transfer entitlements are up $9 million mainly due to an improved BC population share of the national total.
Contributions through the Disaster Financial Assistance Arrangements are down $20 million reflecting a reprofiling of the recognition of entitlements in support of floods that occurred in June 2016.
Other federal government contributions are expected to be $13 million lower due to declines in direct transfers to taxpayer-supported Crown corporations and SUCH sector agencies.
Commercial Crown Net Income
The revised outlook for commercial Crown net income is down $215 million from the projection in the First Quarterly Report mainly due to weaker financial projections for the Insurance Corporation of BC (ICBC).
ICBC’s net income forecast has declined $206 million due to continuing increased claims costs including higher than expected large bodily injury claims from prior years and slower than expected settlements.
The updated net income projection for the BC Lottery Corporation is $8 million lower due to the effects of a labour relations dispute at five of the provincial casino locations, partly offset by strong performance at the slot machines and higher than expected lotteries results.
Second Quarterly Report 2018/19
5
Updated Financial Forecast
Expense
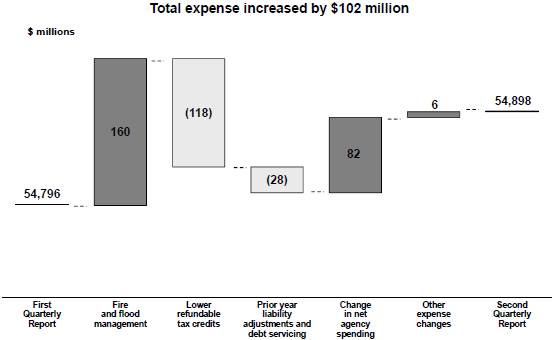
At $54.9 billion, the government spending forecast for 2018/19 is $102 million higher compared to the projection in the First Quarterly Report. The change is primarily due to higher fire and flood management spending, and higher spending by service delivery agencies, partly offset by lower refundable film tax credits.
Chart 1.3 Expense Changes from the First Quarterly Report
Detailed expense projections are disclosed in Table 1.7. Key spending assumptions and sensitivities are provided in Table 1.10.
Consolidated Revenue Fund Spending
Statutory spending is forecast to be $45 million higher than in the First Quarterly Report due to increased spending for fire and flood management ($160 million), and a higher uptake in the BC Training and Education Savings Grants program ($3 million), offset by lower refundable tax credits ($118 million).
The reduced forecast of refundable tax credits is mainly due to more detailed 2017 tax assessment information on foreign film productions available since the First Quarterly Report indicating that the majority of the 2017 tax credits were based on the higher tax rates before the reductions for productions with a principal photography date on or after October 1, 2016. Compared to Budget 2018, the total tax credit forecast for foreign and domestic productions is up $203 million (35.4 per cent).
Other consolidated revenue fund (CRF) spending is forecast to be down $28 million due to reduced debt servicing costs resulting from lower debt levels ($12 million) and favourable adjustments to prior year liabilities ($16 million).
On November 8, 2018, Statistics Canada reported that BC’s real GDP annual growth rate for 2017 was 3.8 per cent. This growth rate is 1.5 percentage points higher than the Economic Forecast Council’s (EFC) projection of 2.3 per cent that was included in the February Budget 2017. Consequently, under the Province’s Economic Stability Mandate (ESM), unionized public sector employees covered by ratified agreements
Second Quarterly Report 2018/19
6
Updated Financial Forecast
reached under the ESM will be entitled to a general wage increase under the Economic Stability Dividend that is equivalent to one-half of the positive difference (0.75 per cent) between the 2017 growth rate reported by Statistics Canada and the EFC forecast. Estimated costs of $14 million in 2018/19 are funded from within the fiscal plan, and ongoing costs in future years will be addressed as part of Budget 2019.
Contingencies
The contingencies vote allocation of $550 million for 2018/19 is unchanged from the First Quarterly Report. Contingencies are intended to help manage unexpected cost pressures and fund priority initiatives as they arise.
Spending Recovered from Third Parties
Spending funded by third parties is forecast to increase by $3 million, which is offset by corresponding higher recoveries, resulting in no impact on the operating surplus.
Operating Transfers to Service Delivery Agencies
Operating transfers to service delivery agencies are forecast to decrease by $33 million, which applies to various service delivery agencies.
Service Delivery Agency Spending
The service delivery agency spending forecast is $49 million higher than the projection in the First Quarterly Report mainly due to higher operating costs in the post-secondary sector as a result of higher enrolment, new programs, and increased research activity. The higher spending in the post-secondary sector is offset by increased tuition revenues and federal research grants.
Government Employment (FTEs)
The projection of full-time equivalent (FTE) staff utilization for 2018/19 has been increased by 400 FTEs to 29,900 since the First Quarterly Report primarily due to the continued implementation of new child care programming and wildfire-related staffing. Further details on FTEs are provided in Table 1.11.
Provincial Capital Spending
Capital spending is projected to total $9.2 billion in 2018/19 — $419 million lower than the forecast in the First Quarterly Report (see Tables 1.3 and 1.12).
Taxpayer-supported capital spending is projected at $5.2 billion in 2018/19. The $402 million decrease since the First Quarterly Report reflects changes to the timing of capital spending mainly in the social housing and transportation sectors, primarily the timing of land acquisition for the Broadway Subway project.
At $4.1 billion, projected self-supported capital spending is $17 million lower than the First Quarterly Report forecast due to changes in timing of capital spending by BC Lottery Corporation and the Liquor Distribution Branch.
Second Quarterly Report 2018/19
7
Updated Financial Forecast
Table 1.3 2018/19 Capital Spending Update
| | ($ millions) | |
2018/19 capital spending — Budget 2018 (February 20, 2018) | | 9,235 | | | | 9,235 | |
2018/19 capital spending — First Quarterly Report (September 7, 2018) | | | | 9,657 | | | |
| | Q1 | | Q2 | | Total | |
| | Update | | Update | | Changes | |
Taxpayer-supported changes: | | | | | | | |
Higher spending by health authorities | | 187 | | 16 | | 203 | |
Timing of social housing spending | | 83 | | (57 | ) | 26 | |
Timing of post-secondary institutions’ spending | | 56 | | 25 | | 81 | |
Timing of transportation sector spending | | 83 | | (355 | ) | (272 | ) |
Other net adjustments to capital schedules | | (4 | ) | (31 | ) | (35 | ) |
Total taxpayer-supported | | 405 | | (402 | ) | 3 | |
| | | | | | | |
Self-supported changes: | | | | | | | |
Liquor Distribution Branch | | 44 | | (2 | ) | 42 | |
BC Lotteries - timing of capital spending | | — | | (15 | ) | (15 | ) |
BC Hydro | | (27 | ) | — | | (27 | ) |
Total self-supported | | 17 | | (17 | ) | — | |
Total changes | | 422 | | (419 | ) | 3 | |
2018/19 capital spending — First Quarterly Report | | 9,657 | | | | | |
2018/19 capital spending — Second Quarterly Report | | | | 9,238 | | 9,238 | |
Projects Over $50 Million
Approved major capital projects with budgets greater than $50 million are presented in Table 1.13. Since the First Quarterly Report the following changes have occurred:
· The year of completion for the Centre for Mental Health and Addictions project has been changed to 2020, from 2019.
· BC Hydro’s W.A.C. Bennett Dam riprap upgrade project anticipated total cost has been reduced $51 million from $170 million to $119 million.
· The Waneta Dam and Generating Station project name has changed to Waneta 2/3 interest acquisition. The anticipated total cost has also decreased by $32 million, from $1.253 billion to $1.221 billion.
The following project has been completed since the First Quarterly Report and is no longer listed in the table:
· Emily Carr University of Art and Design - campus redevelopment at Great Northern Way.
In addition, the following projects were added:
· Burnaby North Secondary project for $79 million.
· South Side Area Elementary project, $54 million.
· Highway 1 Illecillewaet 4-laning project, $63 million.
· The Downtown Vancouver Electricity Supply: West End strategic property purchase for $81 million.
Second Quarterly Report 2018/19
8
Updated Financial Forecast
Provincial Debt
Provincial debt, including the $950 million forecast allowance, is projected to total $66.7 billion by the end of the fiscal year — $1.8 billion lower than the projection in the First Quarterly Report. The Province’s direct operating debt has now been eliminated.
Taxpayer-supported debt is projected to be $42.4 billion — $2.3 billion lower than the projection in the First Quarterly Report. The reduction reflects a $2.1 billion increase in surplus cash mainly due to higher operating surplus and lower capital spending ($0.4 billion), offset by lower contribution from external parties ($0.2 billion).
Lower taxpayer-supported debt projections have resulted in a 0.9 percentage point reduction in the taxpayer-supported debt-to-GDP ratio projected in the First Quarterly Report, now forecast to end the year at 14.4 per cent. The taxpayer-supported debt-to-revenue ratio is forecast to end the year 6.4 percentage points lower at 75.6 per cent, due to the lower taxpayer-supported debt forecast and higher anticipated revenue.
Self-supported debt is projected to be $23.3 billion at year end — $0.1 billion lower than the projection in the First Quarterly Report mainly due to changes in timing of own-sourced financing.
The provincial debt includes a $950 million borrowing allowance to mirror the operating statement forecast allowance.
Details on provincial debt are shown in Table 1.14.
Table 1.4 2018/19 Provincial Debt Update
| | ($ millions) | |
2018/19 provincial debt - Budget 2018 (February 20, 2018 ) | | 69,372 | | | | 69,372 | |
2018/19 provincial debt - First Quarterly Report (September 7, 2018 ) | | | | 68,514 | | | |
| | Q1 | | Q2 | | Total | |
| | Update | | Update | | Changes | |
| | | | | | | |
Taxpayer-supported changes: | | | | | | | |
Capital debt: | | | | | | | |
– lower debt level from 2017/18 | | (205 | ) | — | | (205 | ) |
– change in capital spending | | 405 | | (402 | ) | 3 | |
– change in contributions from external parties | | (149 | ) | 221 | | 72 | |
– increase in internal financing | | (532 | ) | (2,105 | ) | (2,637 | ) |
Total taxpayer-supported | | (481 | ) | (2,286 | ) | (2,767 | ) |
Self-supported changes: | | | | | | | |
– lower debt level from 2017/18 | | (172 | ) | — | | (172 | ) |
– change in capital spending | | 17 | | (17 | ) | — | |
– increase in internal financing | | (222 | ) | (139 | ) | (361 | ) |
Total self-supported | | (377 | ) | (156 | ) | (533 | ) |
Forecast allowance changes: | | | | | | | |
Adjustment for forecast allowance | | — | | 600 | | 600 | |
Total changes | | (858 | ) | (1,842 | ) | (2,700 | ) |
2018/19 provincial debt - First Quarterly Report | | 68,514 | | | | | |
2018/19 provincial debt - Second Quarterly Report | | | | 66,672 | | 66,672 | |
Second Quarterly Report 2018/19
9
Updated Financial Forecast
Risks to the Fiscal Forecast
There are a number of risks and pressures to the fiscal plan including risks to the BC economic outlook, which are largely due to uncertainty regarding global trade policy, the possibility of further monetary policy tightening and the potential of a slowdown in domestic activity.
The financial results of ICBC and outcomes that may arise from the comprehensive review of BC Hydro may impact 2018/19 results.
Consumption and property tax revenues could be affected by changes in consumption of goods and services and changes in the BC housing market. In addition, personal and corporate income tax assessments for the 2017 tax year by the Canada Revenue Agency will not be finalized until March 2019 and could result in further income tax revenue and tax credit transfer expense adjustments.
Natural resource revenues can be volatile due in part to the influence of the cyclical nature of this sector in the economy. Changes in energy or commodity prices, such as coal, natural gas and lumber, may have significant effects on the revenue forecast. The Western spruce-pine-fir 2X4 lumber price has been particularly volatile this year. Following strong growth in 2017, prices continued to rise this year to over $650 US/thousand board feet in late May, before rapidly declining to average $330 in the first half of November.
The spending forecast in the fiscal plan is based on plans and strategies prepared by ministries and service delivery agencies. The main risks are changes to planning assumptions, such as utilization or demand rates for government services in the health care, education or community social services sectors, in addition to potential additional costs associated with natural disaster responses and film tax credit uptake.
The potential fiscal impact from the above risks is expected to be accommodated by the Contingencies vote and the forecast allowance.
The forecasts of revenues, expenditures, capital spending and debt are estimates based on a number of economic, financial and external factors. In addition, capital spending and debt figures may be influenced by a number of other factors including design development, procurement activity, weather and geotechnical conditions. As a result, the actual operating surplus, capital expenditure and debt figures may differ from the current forecast. Variables will change throughout the year as new information becomes available, with potentially material impacts. Government will provide an update to the fiscal plan in Budget 2019.
Second Quarterly Report 2018/19
10
Updated Financial Forecast
Supplementary Schedules
The following tables provide the financial results for the six months ended September 30, 2018 and the 2018/19 full-year forecast, as well as material assumptions, and major capital projects.
Table 1.5 2018/19 Operating Statement
| | Year-to-Date to September 30 | | Full Year | |
| | 2018/19 | | Actual | | 2018/19 | | Actual | |
($ millions) | | Budget | | Actual | | Variance | | 2017/18 | | Budget | | Forecast | | Variance | | 2017/18 | |
Revenue | | 26,440 | | 27,115 | | 675 | | 26,059 | | 54,193 | | 57,198 | | 3,005 | | 52,020 | |
Expense | | (25,410 | ) | (25,718 | ) | (308 | ) | (24,317 | ) | (53,624 | ) | (54,898 | ) | (1,274 | ) | (51,719 | ) |
Surplus before forecast allowance | | 1,030 | | 1,397 | | 367 | | 1,742 | | 569 | | 2,300 | | 1,731 | | 301 | |
Forecast allowance | | — | | — | | — | | — | | (350 | ) | (950 | ) | (600 | ) | — | |
Surplus | | 1,030 | | 1,397 | | 367 | | 1,742 | | 219 | | 1,350 | | 1,131 | | 301 | |
Accumulated surplus beginning of the year | | 6,567 | | 6,746 | | 179 | | 6,597 | | 6,567 | | 6,746 | | 179 | | 6,597 | |
Accumulated surplus before comprehensive income | | 7,597 | | 8,143 | | 546 | | 8,339 | | 6,786 | | 8,096 | | 1,310 | | 6,898 | |
Accumulated other comprehensive income from self-supported Crown agencies | | 114 | | 137 | | 23 | | (176 | ) | 227 | | 198 | | (29 | ) | (152 | ) |
Accumulated surplus end of period | | 7,711 | | 8,280 | | 569 | | 8,163 | | 7,013 | | 8,294 | | 1,281 | | 6,746 | |
Second Quarterly Report 2018/19
11
Updated Financial Forecast
Table 1.6 2018/19 Revenue by Source
| | Year-to-Date to September 30 | | Full Year | |
| | 2018/19 | | Actual | | 2018/19 | | Actual | |
($ millions) | | Budget | | Actual | | Variance | | 2017/18 | | Budget | | Forecast | | Variance | | 2017/18 | |
Taxation | | | | | | | | | | | | | | | | | |
Personal income | | 4,870 | | 5,080 | | 210 | | 4,478 | | 9,836 | | 11,270 | | 1,434 | | 8,923 | |
Corporate income | | 2,466 | | 2,786 | | 320 | | 2,326 | | 4,096 | | 5,401 | | 1,305 | | 4,165 | |
Employer health | | — | | — | | — | | — | | 463 | | 463 | | — | | — | |
Sales 1 | | 3,852 | | 3,801 | | (51 | ) | 3,677 | | 7,428 | | 7,365 | | (63 | ) | 7,131 | |
Fuel | | 526 | | 527 | | 1 | | 560 | | 1,003 | | 1,014 | | 11 | | 1,010 | |
Carbon | | 717 | | 681 | | (36 | ) | 590 | | 1,488 | | 1,460 | | (28 | ) | 1,255 | |
Tobacco | | 449 | | 431 | | (18 | ) | 372 | | 822 | | 805 | | (17 | ) | 727 | |
Property | | 1,232 | | 1,227 | | (5 | ) | 1,170 | | 2,626 | | 2,606 | | (20 | ) | 2,367 | |
Property transfer | | 1,239 | | 1,081 | | (158 | ) | 1,175 | | 2,235 | | 1,835 | | (400 | ) | 2,141 | |
Insurance premium | | 298 | | 304 | | 6 | | 288 | | 595 | | 610 | | 15 | | 602 | |
| | 15,649 | | 15,918 | | 269 | | 14,636 | | 30,592 | | 32,829 | | 2,237 | | 28,321 | |
Natural resources | | | | | | | | | | | | | | | | | |
Natural gas royalties | | 114 | | 70 | | (44 | ) | 75 | | 229 | | 185 | | (44 | ) | 161 | |
Forests | | 437 | | 600 | | 163 | | 410 | | 992 | | 1,347 | | 355 | | 1,065 | |
Other natural resources2 | | 594 | | 682 | | 88 | | 732 | | 1,192 | | 1,427 | | 235 | | 1,469 | |
| | 1,145 | | 1,352 | | 207 | | 1,217 | | 2,413 | | 2,959 | | 546 | | 2,695 | |
Other revenue | | | | | | | | | | | | | | | | | |
Medical Services Plan premiums | | 681 | | 667 | | (14 | ) | 1,289 | | 1,361 | | 1,340 | | (21 | ) | 2,266 | |
Other fees and licenses 3 | | 1,772 | | 1,854 | | 82 | | 1,731 | | 4,002 | | 4,153 | | 151 | | 3,983 | |
Investment earnings | | 584 | | 550 | | (34 | ) | 473 | | 1,179 | | 1,168 | | (11 | ) | 1,101 | |
Miscellaneous 4 | | 1,473 | | 1,645 | | 172 | | 1,530 | | 3,152 | | 3,240 | | 88 | | 3,543 | |
| | 4,510 | | 4,716 | | 206 | | 5,023 | | 9,694 | | 9,901 | | 207 | | 10,893 | |
Contributions from the federal government | | | | | | | | | | | | | | | | | |
Health and social transfers | | 3,461 | | 3,550 | | 89 | | 3,335 | | 6,921 | | 7,106 | | 185 | | 6,848 | |
Other federal government contributions 5 | | 889 | | 687 | | (202 | ) | 648 | | 2,009 | | 1,991 | | (18 | ) | 2,207 | |
| | 4,350 | | 4,237 | | (113 | ) | 3,983 | | 8,930 | | 9,097 | | 167 | | 9,055 | |
Commercial Crown corporation net income | | | | | | | | | | | | | | | | | |
BC Hydro | | 76 | | 114 | | 38 | | 124 | | 712 | | 712 | | — | | 683 | |
Liquor Distribution Branch | | 576 | | 576 | | — | | 585 | | 1,106 | | 1,107 | | 1 | | 1,119 | |
BC Lotteries (net of payments to the federal government) | | 653 | | 721 | | 68 | | 693 | | 1,300 | | 1,357 | | 57 | | 1,391 | |
ICBC | | (543 | ) | (582 | ) | (39 | ) | (237 | ) | (684 | ) | (890 | ) | (206 | ) | (1,327 | ) |
Transportation Investment Corporation | | — | | — | | — | | (29 | ) | — | | — | | — | | (29 | ) |
Other 6 | | 24 | | 63 | | 39 | | 64 | | 130 | | 126 | | (4 | ) | 169 | |
Accounting Adjustments 7 | | — | | — | | — | | — | | — | | — | | — | | (950 | ) |
| | 786 | | 892 | | 106 | | 1,200 | | 2,564 | | 2,412 | | (152 | ) | 1,056 | |
Total revenue | | 26,440 | | 27,115 | | 675 | | 26,059 | | 54,193 | | 57,198 | | 3,005 | | 52,020 | |
1 Includes provincial sales tax and social services tax/hotel room tax related to prior years.
2 Columbia River Treaty, other energy and minerals, water rental and other resources.
3 Post-secondary, healthcare-related, motor vehicle, and other fees.
4 Includes reimbursements for health care and other services provided to external agencies, and other recoveries.
5 Includes contributions for health, education, community development, housing and social service programs, and transportation projects.
6 Includes Columbia Power Corporation, BC Railway Company, Columbia Basin Trust power projects, and post-secondary institutions’ self-supported subsidiaries.
7 In 2017/18, total commercial Crown corporation net income included a $950 million summary level adjustment to address the Auditor General’s qualification in the 2016/17 Public Accounts with respect to BC Hydro’s deferred regulatory accounts.
Second Quarterly Report 2018/19
12
Updated Financial Forecast
Table 1.7 2018/19 Expense by Ministry, Program and Agency
| | Year-to-Date to September 30 | | Full Year | |
| | 2018/19 | | Actual | | 2018/19 | | Actual | |
($ millions) | | Budget 1 | | Actual | | Variance | | 2017/18 1 | | Budget 1 | | Forecast | | Variance | | 2017/18 1 | |
Office of the Premier | | 6 | | 6 | | — | | 5 | | 11 | | 11 | | — | | 10 | |
Advanced Education, Skills and Training | | 1,128 | | 1,145 | | 17 | | 1,056 | | 2,212 | | 2,212 | | — | | 2,155 | |
Agriculture | | 35 | | 32 | | (3 | ) | 38 | | 93 | | 93 | | — | | 91 | |
Attorney General | | 286 | | 297 | | 11 | | 268 | | 583 | | 583 | | — | | 560 | |
Children and Family Development | | 832 | | 849 | | 17 | | 728 | | 1,793 | | 1,793 | | — | | 1,585 | |
Citizens’ Services | | 249 | | 260 | | 11 | | 269 | | 530 | | 530 | | — | | 572 | |
Education | | 3,268 | | 3,234 | | (34 | ) | 3,106 | | 6,341 | | 6,355 | | 14 | | 6,158 | |
Energy, Mines and Petroleum Resources | | 29 | | 33 | | 4 | | 33 | | 60 | | 60 | | — | | 101 | |
Environment and Climate Change Strategy | | 84 | | 82 | | (2 | ) | 86 | | 179 | | 179 | | — | | 177 | |
Finance | | 260 | | 228 | | (32 | ) | 111 | | 579 | | 579 | | — | | 358 | |
Finance — extinguishment of Transportation Investment Corporation fiscal agency loan 2 | | — | | — | | — | | 3,721 | | — | | — | | — | | 3,690 | |
Forests, Lands, Natural Resource Operations and Rural Development | | 332 | | 641 | | 309 | | 601 | | 734 | | 1,242 | | 508 | | 1,338 | |
Health | | 9,666 | | 9,647 | | (19 | ) | 9,139 | | 19,754 | | 19,754 | | — | | 18,976 | |
Indigenous Relations and Reconciliation | | 90 | | 63 | | (27 | ) | 95 | | 100 | | 100 | | — | | 248 | |
Jobs, Trade and Technology | | 54 | | 44 | | (10 | ) | 47 | | 99 | | 99 | | — | | 111 | |
Labour | | 6 | | 5 | | (1 | ) | 5 | | 13 | | 13 | | — | | 11 | |
Mental Health and Addictions | | 5 | | 4 | | (1 | ) | — | | 10 | | 10 | | — | | 11 | |
Municipal Affairs and Housing | | 428 | | 427 | | (1 | ) | 411 | | 674 | | 674 | | — | | 689 | |
Public Safety and Solicitor General | | 384 | | 434 | | 50 | | 455 | | 787 | | 1,078 | | 291 | | 1,062 | |
Social Development and Poverty Reduction | | 1,671 | | 1,651 | | (20 | ) | 1,501 | | 3,364 | | 3,364 | | — | | 3,103 | |
Tourism, Arts and Culture | | 69 | | 77 | | 8 | | 66 | | 144 | | 144 | | — | | 177 | |
Transportation and Infrastructure | | 448 | | 444 | | (4 | ) | 418 | | 890 | | 890 | | — | | 843 | |
Total ministries and Office of the Premier | | 19,330 | | 19,603 | | 273 | | 22,159 | | 38,950 | | 39,763 | | 813 | | 42,026 | |
Management of public funds and debt | | 664 | | 624 | | (40 | ) | 582 | | 1,276 | | 1,260 | | (16 | ) | 1,205 | |
Contingencies | | — | | — | | — | | 1 | | 550 | | 550 | | — | | 17 | |
Funding for capital expenditures | | 481 | | 319 | | (162 | ) | 264 | | 1,772 | | 1,760 | | (12 | ) | 1,284 | |
Refundable tax credit transfers | | 620 | | 738 | | 118 | | 580 | | 1,246 | | 1,507 | | 261 | | 1,197 | |
Legislative Assembly and other appropriations | | 69 | | 69 | | — | | 96 | | 143 | | 164 | | 21 | | 170 | |
Total appropriations | | 21,164 | | 21,353 | | 189 | | 23,682 | | 43,937 | | 45,004 | | 1,067 | | 45,899 | |
Elimination of transactions between appropriations 3 | | (30 | ) | (13 | ) | 17 | | (8 | ) | (59 | ) | (60 | ) | (1 | ) | (16 | ) |
Prior year liability adjustments | | — | | — | | — | | — | | — | | (18 | ) | (18 | ) | (150 | ) |
Consolidated revenue fund expense | | 21,134 | | 21,340 | | 206 | | 23,674 | | 43,878 | | 44,926 | | 1,048 | | 45,733 | |
Expenses recovered from external entities | | 1,501 | | 1,346 | | (155 | ) | 1,353 | | 3,337 | | 3,315 | | (22 | ) | 3,131 | |
Elimination of funding provided to service delivery agencies | | (12,720 | ) | (12,673 | ) | 47 | | (11,797 | ) | (26,829 | ) | (27,003 | ) | (174 | ) | (25,159 | ) |
Extinguishment of Transportation Investment | | | | | | | | — | | | | | | | | — | |
Corporation fiscal agency loan 2 | | — | | — | | — | | (3,721 | ) | — | | — | | — | | (3,690 | ) |
Total direct program spending | | 9,915 | | 10,013 | | 98 | | 9,509 | | 20,386 | | 21,238 | | 852 | | 20,015 | |
Service delivery agency expense | | | | | | | | | | | | | | | | | |
School districts | | 2,846 | | 2,889 | | 43 | | 2,712 | | 6,651 | | 6,682 | | 31 | | 6,338 | |
Universities | | 2,313 | | 2,307 | | (6 | ) | 2,200 | | 4,837 | | 4,945 | | 108 | | 4,600 | |
Colleges and institutes | | 613 | | 629 | | 16 | | 597 | | 1,299 | | 1,335 | | 36 | | 1,266 | |
Health authorities and hospital societies | | 7,490 | | 7,622 | | 132 | | 7,301 | | 15,370 | | 15,511 | | 141 | | 14,983 | |
Other service delivery agencies | | 2,233 | | 2,258 | | 25 | | 1,998 | | 5,081 | | 5,187 | | 106 | | 4,517 | |
Total service delivery agency expense | | 15,495 | | 15,705 | | 210 | | 14,808 | | 33,238 | | 33,660 | | 422 | | 31,704 | |
Total expense | | 25,410 | | 25,718 | | 308 | | 24,317 | | 53,624 | | 54,898 | | 1,274 | | 51,719 | |
1 Restated to reflect government’s current organization and accounting policies.
2 Budget 2017 Update provided statutory authority to extinguish the fiscal agency loan agreement between government and the Transportation Investment Corporation in response to the decision to cancel tolls on the Port Mann bridge. As a related party transaction, the expense and the corporation’s debt reduction are eliminated on consolidation resulting in no impact to operating results.
3 Reflects payments made under an agreement where an expense from a voted appropriation is recorded as revenue by a special account.
Second Quarterly Report 2018/19
13
Updated Financial Forecast
Table 1.8 2018/19 Expense By Function
| | Year-to-Date to September 30 | | Full Year | |
| | 2018/19 | | Actual | | 2018/19 | | Actual | |
($ millions) | | Budget | | Actual | | Variance | | 2017/181 | | Budget | | Forecast | | Variance | | 2017/181 | |
Health: | | | | | | | | | | | | | | | | | |
Medical Services Plan | | 2,368 | | 2,354 | | (14 | ) | 2,274 | | 4,959 | | 4,959 | | — | | 4,623 | |
Pharmacare | | 655 | | 735 | | 80 | | 673 | | 1,393 | | 1,393 | | — | | 1,400 | |
Regional services | | 7,442 | | 7,263 | | (179 | ) | 6,958 | | 14,468 | | 14,551 | | 83 | | 13,747 | |
Other healthcare expenses2 | | 354 | | 389 | | 35 | | 304 | | 831 | | 828 | | (3 | ) | 1,184 | |
| | 10,819 | | 10,742 | | (77 | ) | 10,209 | | 21,651 | | 21,731 | | 80 | | 20,954 | |
Education: | | | | | | | | | | | | | | | | | |
Elementary and secondary | | 3,203 | | 3,152 | | (51 | ) | 2,963 | | 7,198 | | 7,271 | | 73 | | 6,921 | |
Post-secondary | | 2,995 | | 3,033 | | 38 | | 2,846 | | 6,343 | | 6,443 | | 100 | | 5,966 | |
Other education expenses3 | | 162 | | 53 | | (109 | ) | 112 | | 356 | | 355 | | (1 | ) | 204 | |
| | 6,360 | | 6,238 | | (122 | ) | 5,921 | | 13,897 | | 14,069 | | 172 | | 13,091 | |
Social services: | | | | | | | | | | | | | | | | | |
Social assistance 2,3 | | 1,079 | | 1,062 | | (17 | ) | 937 | | 2,180 | | 2,180 | | — | | 1,988 | |
Child welfare 2 | | 810 | | 816 | | 6 | | 685 | | 1,757 | | 1,757 | | — | | 1,507 | |
Low income tax credit transfers | | 143 | | 143 | | 0 | | 125 | | 287 | | 280 | | (7 | ) | 239 | |
Community living and other services | | 538 | | 531 | | (7 | ) | 496 | | 1,093 | | 1,093 | | — | | 1,003 | |
| | 2,570 | | 2,552 | | (18 | ) | 2,243 | | 5,317 | | 5,310 | | (7 | ) | 4,737 | |
Protection of persons and property | | 809 | | 849 | | 40 | | 841 | | 1,650 | | 1,940 | | 290 | | 1,903 | |
Transportation | | 941 | | 923 | | (18 | ) | 868 | | 2,134 | | 2,167 | | 33 | | 1,931 | |
Natural resources and economic development | | 1,130 | | 1,565 | | 435 | | 1,413 | | 2,433 | | 3,155 | | 722 | | 3,387 | |
Other | | 751 | | 813 | | 62 | | 754 | | 1,817 | | 1,799 | | (18 | ) | 1,536 | |
Contingencies | | — | | — | | — | | 1 | | 550 | | 550 | | — | | 17 | |
General government | | 715 | | 714 | | (1 | ) | 766 | | 1,436 | | 1,537 | | 101 | | 1,540 | |
Debt servicing | | 1,315 | | 1,322 | | 7 | | 1,301 | | 2,739 | | 2,640 | | (99 | ) | 2,623 | |
Total expense | | 25,410 | | 25,718 | | 308 | | 24,317 | | 53,624 | | 54,898 | | 1,274 | | 51,719 | |
1 Restated to reflect government’s current organization and accounting policies.
2 Payments for healthcare services by the Ministry of Social Development and Poverty Reduction and the Ministry of Children and Family Development made on behalf of their clients are reported in the Health function.
3 Payments for training costs by the Ministry of Social Development and Poverty Reduction made on behalf of its clients are reported in the Education function.
Second Quarterly Report 2018/19
14
Updated Financial Forecast
Table 1.9 2018/19 Material Assumptions — Revenue
| | Budget | | First | | Second | | | |
Revenue Source and Assumptions | | 2018 | | Quarter | | Quarter | | | |
($ millions unless otherwise specified) | | Estimate | | Forecast | | Forecast | | 2018/19 Sensitivities | |
Personal income tax * | | $ | 9,836 | | $ | 10,457 | | $ | 11,270 | | | |
Calendar year assumptions | | | | | | | | | |
Household income growth | | 4.1 | % | 4.6 | % | 4.6 | % | +/- 1 percentage point change in 2018 BC household income growth equals +/- $90 to $100 million | |
Compensation of employees growth | | 4.3 | % | 5.2 | % | 5.2 | % |
Tax base growth | | 3.7 | % | 3.7 | % | 3.7 | % |
Average tax yield | | 5.51 | % | 5.46 | % | 5.70 | % |
Current-year tax | | $ | 9,463 | | $ | 9,749 | | $ | 10,106 | | | |
Prior years’ tax assessments | | $ | 440 | | $ | 440 | | $ | 465 | | | |
Unapplied taxes | | $ | 90 | | $ | 100 | | $ | 100 | | | |
BC Tax Reduction | | $ | -163 | | $ | -164 | | $ | -161 | | | |
Non-refundable BC tax credits | | $ | -97 | | $ | -95 | | $ | -105 | | | |
Policy neutral elasticity ** | | 1.1 | | 1.0 | | 1.0 | | +/- 0.5 change in 2018 BC policy neutral elasticity equals +/- $180 to $200 million | |
| | | | | | | |
Fiscal year prior-year adjustment | | $ | 0 | | $ | 321 | | $ | 755 | |
| | | | | | | | | |
2017 Tax-year | | 2017 Assumptions | | | |
Household income growth | | 5.1 | % | 5.0 | % | 6.8 | % | +/- 1 percentage point change in 2017 BC household or taxable income growth equals +/- $100 to $120 million one-time effect (prior-year adjustment) and could result in an additional +/- $90 to $100 million base change in 2018/19 | |
Tax base growth | | 5.4 | % | 9.6 | % | 8.8 | % |
Average 2017 tax yield | | 5.29 | % | 5.24 | % | 5.47 | % |
2017 tax | | $ | 8,749 | | $ | 8,999 | | $ | 9,329 | |
2016 & prior years’ tax assessments | | $ | 430 | | $ | 430 | | $ | 455 | |
Unapplied taxes | | $ | 100 | | $ | 100 | | $ | 100 | |
BC Tax Reduction | | $ | -160 | | $ | -160 | | $ | -157 | |
Non-refundable BC tax credits | | $ | -90 | | $ | -90 | | $ | -108 | |
Policy neutral elasticity ** | | 1.3 | | 1.9 | | 2.0 | | | |
| | | | | | | | | |
* Reflects information as at November 8, 2018 ** Per cent growth in current year tax revenue (excluding policy measures) relative to per cent growth in household income (calendar year). |
Corporate income tax * | | $ | 4,096 | | $ | 4,559 | | $ | 5,401 | | | |
Components of revenue (fiscal year) | | | | | | | | | |
Instalments — subject to general rate | | $ | 3,570 | | $ | 3,936 | | $ | 4,341 | | | |
Instalments — subject to small business rate | | $ | 288 | | $ | 309 | | $ | 310 | | | |
Non-refundable BC tax credits | | $ | -112 | | $ | -123 | | $ | -109 | | | |
Advance instalments | | $ | 3,746 | | $ | 4,122 | | $ | 4,542 | | | |
International Business Activity Act refunds | | $ | -15 | | $ | -15 | | $ | -15 | | | |
Prior-year settlement payment | | $ | 365 | | $ | 452 | | $ | 874 | | | |
Calendar year assumptions | | | | | | | | | |
National tax base ($ billions) | | $ | 325.6 | | $ | 345.4 | | $ | 360.5 | | +/- 1% change in the 2018 national tax base equals +/- $40 to $60 million | |
BC instalment share of national tax base | | 13.5 | % | 13.5 | % | 13.5 | % | |
Effective tax rates (percent-general/small business) | | 12.0 / 2.0 | | 12.0 / 2.0 | | 12.0 / 2.0 | | |
Share of the BC tax base subject to small business rate | | 32.6 | % | 32.6 | % | 31.0 | % | +/- 1 percentage point change in the 2018 small business share equals -/+ $40 to $50 million | |
BC tax base growth (post federal measures) | | 4.6 | % | 4.9 | % | 3.5 | % | |
BC net operating surplus growth | | 5.5 | % | 5.0 | % | 5.0 | % | |
| | | | | | | | | |
2017 Tax-year | | 2017 Assumptions | | +/- 1% change in the 2017 BC tax base equals +/- $40 to $50 million in 2018/19 | |
BC tax base growth (post federal measures) | | 11.0 | % | 14.0 | % | 18.0 | % | |
BC net operating surplus growth | | 11.2 | % | 16.3 | % | 18.7 | % | |
Gross 2017 tax | | $ | 3,736 | | $ | 3,836 | | $ | 4,175 | | | |
Prior-year settlement payment | | $ | 365 | | $ | 452 | | $ | 874 | | | |
Prior years’ losses/gains (included in above) | | $ | -30 | | $ | -30 | | $ | 50 | | | |
Non-refundable BC tax credits | | $ | -104 | | $ | -117 | | $ | -114 | | | |
* Reflects information as at November 8, 2018
Net cash received from the federal government and cash refunds under the International Business Activity Act are used as the basis for estimating revenue. Due to lags in the federal collection and instalment systems, changes to the BC net operating surplus and tax base forecasts affect revenue in the succeeding year. The 2018/19 instalments from the federal government reflects two-third of payments related to the 2018 tax year (paid during Apr-July 2018 and adjusted in Sept and Dec) and one-third of 2019 payments. Instalments for the 2018 (2019) tax year are based on BC’s share of the national tax base for the 2016 (2017) tax year and a forecast of the 2018 (2019) national tax base. BC’s share of the 2016 national tax base was 13.45%, based on tax assessments as of December 31, 2017. Cash adjustments for any under/over payments from the federal government in respect of 2017 will be received/paid on March 29, 2019.

Second Quarterly Report 2018/19
15
Updated Financial Forecast
Table 1.9 2018/19 Material Assumptions — Revenue (continued)
| | Budget | | First | | Second | | | |
| | 2018 | | Quarter | | Quarter | | | |
| | Estimate | | Forecast | | Forecast | | 2018/19 Sensitivities | |
Provincial sales tax | | $ | 7,428 | | $ | 7,380 | | $ | 7,365 | | | |
Provincial sales tax base growth (fiscal year) | | 4.8 | % | 4.5 | % | 3.7 | % | +/- 1 percentage point change in the 2018 consumer expenditure growth equals up to +/- $30 million | |
Calendar Year nominal expenditure | | | | | | | | |
Consumer expenditures on durable goods | | 2.6 | % | 4.0 | % | 4.0 | % | |
Consumer expenditures on goods and services | | 5.0 | % | 5.5 | % | 5.5 | % | | |
Business investment | | 6.0 | % | 6.3 | % | 6.3 | % | | |
Other | | 5.0 | % | 4.6 | % | 4.6 | % | | |
Components of Provincial sales tax revenue | | | | | | | | +/- 1 percentage point change in the 2018 business investment growth equals up to +/- $10 million | |
Consolidated Revenue Fund | | $ | 7,419 | | $ | 7,371 | | $ | 7,356 | | |
BC Transportation Financing Authority | | $ | 9 | | $ | 9 | | $ | 9 | | |
Fuel and carbon taxes | | $ | 2,491 | | $ | 2,507 | | $ | 2,474 | | | |
Calendar Year | | | | | | | | | |
Real GDP | | 2.3 | % | 2.2 | % | 2.2 | % | | |
Gasoline volumes | | 0.0 | % | 0.0 | % | -5.3 | % | | |
Diesel volumes | | 2.0 | % | 2.0 | % | 2.7 | % | | |
Natural gas volumes | | 2.3 | % | 2.2 | % | 5.9 | % | | |
Carbon tax rates (April 1) | | | | | | | | | |
Carbon dioxide equivalent emissions ($/tonne) | | $ | 35 | | $ | 35 | | $ | 35 | | | |
Natural gas (cents/gigajoule) | | 173.81 | ¢ | 173.81 | ¢ | 173.81 | ¢ | | |
Gasoline (cents/litre) | | 7.78 | ¢ | 7.78 | ¢ | 7.78 | ¢ | | |
Light fuel oil (cents/litre) | | 8.95 | ¢ | 8.95 | ¢ | 8.95 | ¢ | | |
| | | | | | | | | |
Components of revenue | | | | | | | | | |
Consolidated Revenue Fund | | $ | 518 | | $ | 548 | | $ | 530 | | | |
BC Transit | | $ | 19 | | $ | 20 | | $ | 20 | | | |
BC Transportation Financing Authority | | $ | 466 | | $ | 464 | | $ | 464 | | | |
Fuel tax revenue | | $ | 1,003 | | $ | 1,032 | | $ | 1,014 | | | |
Carbon tax revenue | | $ | 1,488 | | $ | 1,475 | | $ | 1,460 | | | |
Property taxes | | $ | 2,626 | | $ | 2,607 | | $ | 2,606 | | | |
Calendar Year | | | | | | | | | |
Consumer Price Index | | 2.0 | % | 2.7 | % | 2.7 | % | +/- 1 percentage point change in 2018 new construction & inflation growth equals up to +/- $20 million in residential property taxation revenue | |
Housing starts (units) | | 31,965 | | 39,500 | | 39,500 | | |
Home owner grants (fiscal year) | | $ | 821 | | $ | 824 | | $ | 824 | | |
Components of revenue | | | | | | | | |
Residential (net of home owner grants) | | $ | 938 | | $ | 950 | | $ | 950 | | |
Speculation tax | | $ | 90 | | $ | 87 | | $ | 87 | | | |
Non-residential | | $ | 1,288 | | $ | 1,249 | | $ | 1,249 | | +/- 1% change in 2018 total business property assessment value equals up to +/- $15 million in non-residential property taxation revenue | |
Rural area | | $ | 99 | | $ | 118 | | $ | 118 | | |
Police | | $ | 32 | | $ | 33 | | $ | 33 | | |
BC Assessment Authority | | $ | 91 | | $ | 93 | | $ | 93 | | |
BC Transit | | $ | 88 | | $ | 77 | | $ | 76 | | |
Other taxes | | $ | 4,115 | | $ | 3,873 | | $ | 3,713 | | | |
Calendar Year | | | | | | | | | |
Population | | 1.1 | % | 1.0 | % | 1.0 | % | | |
Residential sales value | | -3.1 | % | -25.9 | % | -25.9 | % | | |
Real GDP | | 2.3 | % | 2.2 | % | 2.2 | % | | |
Nominal GDP | | 4.4 | % | 4.5 | % | 4.5 | % | | |
Components of revenue | | | | | | | | +/- 1% change to 2018 residential sales value equals +/- $20 million in property transfer revenue, depending on property values | |
Property transfer | | $ | 2,235 | | $ | 1,985 | | $ | 1,835 | | |
Additional Property Transfer Tax (included in above)* | | $ | 234 | | $ | 227 | | $ | 190 | | |
Tobacco | | $ | 822 | | $ | 815 | | $ | 805 | | |
Insurance premium | | $ | 595 | | $ | 610 | | $ | 610 | | | |
Employer health | | $ | 463 | | $ | 463 | | $ | 463 | | | |
*Additional tax is 20 per cent
Second Quarterly Report 2018/19
16
Updated Financial Forecast
Table 1.9 2018/19 Material Assumptions — Revenue (continued)
| | Budget | | First | | Second | | | |
Revenue Source and Assumptions | | 2018 | | Quarter | | Quarter | | | |
($ millions unless otherwise specified) | | Estimate | | Forecast | | Forecast | | 2018/19 Sensitivities | |
Energy, sales of Crown land tenures, metals, minerals and other * | | $ | 947 | | $ | 1,075 | | $ | 1,153 | | | |
Natural gas price | | | | | | | | +/- $0.25 change in the natural gas price equals +/- $30 to $50 million, including impacts on production volumes and royalty program credits, but excluding any changes from natural gas liquids revenue (e.g. butane, pentanes) Sensitivities can also vary significantly at different price levels +/- 1% change in natural gas volumes equals +/- $2 million in natural gas royalties +/- 1 cent change in the exchange rate equals +/- $2 million in natural gas royalties | |
Plant inlet, $C/gigajoule | | $ | 1.08 | | $ | 0.72 | | $ | 0.64 | | |
Sumas, $US/MMBtu | | $ | 2.01 | | $ | 1.84 | | $ | 1.68 | | |
Natural gas production volumes | | | | | | | | |
Billions of cubic metres | | 53.8 | | 54.8 | | 55.5 | | |
Petajoules | | 2,215 | | 2,264 | | 2,295 | | |
Annual per cent change | | 11.2 | % | 14.3 | % | 15.8 | % | |
| | | | | | | | |
Oil price ($US/bbl at Cushing, OK) | | $ | 56.74 | | $ | 66.78 | | $ | 68.85 | | |
| | | | | | | | |
Auctioned land base (000 hectares) | | 35 | | 33 | | 32 | | |
Average bid price/hectare ($) | | $ | 300 | | $ | 1,519 | | $ | 1,551 | | |
Cash sales of Crown land tenures | | $ | 11 | | $ | 51 | | $ | 50 | | |
Metallurgical coal price ($US/tonne, fob West Coast) | | $ | 144 | | $ | 173 | | $ | 184 | | |
Copper price ($US/lb) | | $ | 2.93 | | $ | 3.16 | | $ | 2.97 | | |
| | | | | | | | | |
Annual electricity volumes set by treaty | | 4.0 | | 4.0 | | 4.0 | | +/- US$20 change in the average metallurgical coal price equals +/- $50 to $70 million +/- 10% change in the average Mid-Columbia electricity price equals +/- $10 million | |
(million mega-watt hours) | | | | | | | | |
Mid-Columbia electricity price | | $ | 24.18 | | $ | 33.97 | | $ | 37.55 | | |
($US/mega-watt hour) | | | | | | | | |
| | | | | | | | |
Exchange rate (US¢/C$, calendar year) | | 78.3 | | 77.5 | | 77.7 | | |
Components of revenue | | | | | | | | | |
Bonus bid auctions: | | | | | | | | Based on a recommendation from the Auditor General to be consistent with generally accepted accounting principles, bonus bid revenue recognition reflects ten-year deferral of cash receipts from the sale of Crown land tenures | |
Deferred revenue | | $ | 224 | | $ | 219 | | $ | 219 | | |
Current-year cash (one-tenth) | | $ | 1 | | $ | 5 | | $ | 5 | | |
Fees and rentals | | $ | 52 | | $ | 52 | | $ | 52 | | |
Total bonus bids, fees and rentals | | $ | 277 | | $ | 276 | | $ | 276 | | |
Natural gas royalties | | $ | 229 | | $ | 209 | | $ | 185 | | |
Petroleum royalties | | $ | 66 | | $ | 78 | | $ | 91 | | |
Columbia River Treaty electricity sales | | $ | 105 | | $ | 158 | | $ | 175 | | |
Oil and Gas Commission fees and levies | | $ | 59 | | $ | 61 | | $ | 64 | | | |
Coal, metals and other minerals revenue: | | | | | | | | | |
Coal tenures | | $ | 8 | | $ | 7 | | $ | 7 | | | |
Coal mineral tax | | $ | 139 | | $ | 220 | | $ | 289 | | | |
Net metals and other minerals tax | | $ | 25 | | $ | 27 | | $ | 27 | | | |
Recoveries related to metal mines | | $ | 23 | | $ | 23 | | $ | 23 | | | |
Miscellaneous mining revenue | | $ | 16 | | $ | 16 | | $ | 16 | | | |
Total coal, metals and other minerals revenue | | $ | 211 | | $ | 293 | | $ | 362 | | | |
| | | | | | | | | |
Royalty programs and infrastructure credits | | | | | | | | | |
Deep drilling | | $ | -224 | | $ | -344 | | $ | -370 | | | |
Road and pipeline infrastructure | | $ | -40 | | $ | -35 | | $ | -40 | | | |
Total | | $ | -264 | | $ | -379 | | $ | -410 | | | |
Implicit average natural gas royalty rate | | 9.5 | % | 12.8 | % | 12.4 | % | | |
Royalty program (marginal, low productivity and ultra marginal drilling) adjustments reflect reduced royalty rates.
Natural gas royalties incorporate royalty programs and Treasury Board approved infrastructure credits.
* Reflects information as at October 25, 2018.
Second Quarterly Report 2018/19
17
Updated Financial Forecast
Table 1.9 2018/19 Material Assumptions — Revenue (continued)
| | Budget | | First | | Second | | | |
Revenue Source and Assumptions | | 2018 | | Quarter | | Quarter | | | |
($ millions unless otherwise specified) | | Estimate | | Forecast | | Forecast | | 2018/19 Sensitivities | |
Forests * | | $ | 992 | | $ | 1,372 | | $ | 1,347 | | | |
Prices (calendar year average) | | | | | | | | +/- US$50 change in SPF price equals +/- $150 to $200 million | |
SPF 2x4 ($US/thousand board feet) | | $ | 403 | | $ | 551 | | $ | 500 | | |
Pulp ($US/tonne) | | $ | 945 | | $ | 1,165 | | $ | 1,188 | | +/- US$50 change in pulp price equals +/-$5 to $10 million | |
Coastal log ($Cdn/cubic metre); | | | | | | | �� | | | | |
Vancouver Log Market | | $ | 135 | | $ | 144 | | $ | 141 | | +/- Cdn$10 change in average log price equals +/-$20 to $30 million | |
| | | | | | | | | | | |
Crown harvest volumes (million cubic metres) | | | | | | | | | |
Interior | | 45.4 | | 46.4 | | 45.2 | | +/- 10% change in Interior harvest volumes equals | |
Coast | | 12.6 | | 12.6 | | 11.8 | | |
Total | | 58.0 | | 59.0 | | 57.0 | | +/- $60 to $80 million | |
BC Timber Sales (included in above) | | 11.4 | | 11.4 | | 10.8 | | +/- 10% change in Coastal harvest volumes equals | |
| | | | | | | | |
Stumpage rates ($Cdn/cubic metre) | | | | | | | | +/- $15 to $25 million | |
Total stumpage rates | | $ | 15.38 | | $ | 21.18 | | $ | 21.14 | | +/- 1 cent change in exchange rate equals | |
Components of revenue | | | | | | | | | | | |
Tenures** | | $ | 568 | | $ | 925 | | $ | 840 | | +/- $25 to $35 million in stumpage revenue | |
Recoveries relating to revenue sharing payments to indigenous people** | | $ | -32 | | $ | -32 | | $ | -32 | | |
BC Timber Sales | | $ | 346 | | $ | 347 | | $ | 388 | | The above sensitivities relate to stumpage revenue only. | |
Logging tax | | $ | 35 | | $ | 55 | | $ | 75 | | |
Other CRF revenue | | $ | 21 | | $ | 23 | | $ | 22 | | | |
Recoveries** | | $ | 54 | | $ | 54 | | $ | 54 | | | |
* Reflects information as at October 25, 2018
** Commencing 2018/19, tenures stumpage revenue includes revenue sharing payments to indigenous people recorded as recovery.
Other natural resources | | $ | 474 | | $ | 461 | | $ | 459 | | | |
Components of revenue | | | | | | | | | |
Water rental and licences* | | $ | 401 | | $ | 388 | | $ | 386 | | | |
Recoveries | | $ | 50 | | $ | 50 | | $ | 50 | | | |
Angling and hunting permits and licences | | $ | 10 | | $ | 10 | | $ | 10 | | | |
Recoveries | | $ | 13 | | $ | 13 | | $ | 13 | | | |
* Water rentals for power purposes are indexed to Consumer Price Index.
Other revenue | | $ | 9,694 | | $ | 9,776 | | $ | 9,901 | | | |
Components of revenue | | | | | | | | | |
Fees and licences | | | | | | | | | |
Medical Services Plan (MSP) premiums | | $ | 1,361 | | $ | 1,314 | | $ | 1,340 | | +/- 1 percentage point change in BC’s population growth equals | |
Consolidated Revenue Fund | | $ | 1,297 | | $ | 1,250 | | $ | 1,276 | | |
MSP recoveries | | $ | 64 | | $ | 64 | | $ | 64 | | +/- $10 to $20 million in MSP premium revenue | |
Motor vehicle licences and permits | | $ | 570 | | $ | 570 | | $ | 567 | | |
Other Consolidated Revenue Fund | | $ | 438 | | $ | 450 | | $ | 433 | | | |
Summary consolidation eliminations | | $ | -15 | | $ | -15 | | $ | -15 | | | |
Other recoveries | | $ | 112 | | $ | 112 | | $ | 112 | | | |
Crown corporations and agencies | | $ | 128 | | $ | 134 | | $ | 134 | | | |
Post-secondary education fees | | $ | 2,078 | | $ | 2,172 | | $ | 2,209 | | | |
Other healthcare-related fees | | $ | 396 | | $ | 417 | | $ | 424 | | | |
School Districts | | $ | 295 | | $ | 289 | | $ | 289 | | | |
Investment earnings | | | | | | | | | |
Consolidated Revenue Fund | | $ | 131 | | $ | 100 | | $ | 140 | | | |
Fiscal agency loans & sinking funds earnings | | $ | 924 | | $ | 894 | | $ | 900 | | | |
Summary consolidation eliminations | | $ | -95 | | $ | -96 | | $ | -96 | | | |
Crown corporations and agencies | | $ | 25 | | $ | 26 | | $ | 27 | | | |
SUCH sector agencies | | $ | 194 | | $ | 200 | | $ | 197 | | | |
Sales of goods and services | | $ | 1,058 | | $ | 1,082 | | $ | 1,091 | | | |
Miscellaneous | | $ | 2,094 | | $ | 2,127 | | $ | 2,149 | | | |
Second Quarterly Report 2018/19
18
Updated Financial Forecast
Table 1.9 2018/19 Material Assumptions — Revenue (continued)
| | Budget | | First | | Second | | | |
Revenue Source and Assumptions | | 2018 | | Quarter | | Quarter | | | |
($ millions unless otherwise specified) | | Estimate | | Forecast | | Forecast | | 2018/19 Sensitivities | |
Health and social transfers | | $ | 6,921 | | $ | 7,097 | | $ | 7,106 | | | |
National Cash Transfers | | | | | | | | | |
Canada Health Transfer (CHT) | | $ | 38,584 | | $ | 38,584 | | $ | 38,584 | | | |
Annual growth | | 3.9 | % | 3.9 | % | 3.9 | % | | |
Canada Social Transfer (CST) | | $ | 14,161 | | $ | 14,161 | | $ | 14,161 | | | |
BC share of national population (June 1) | | 13.12 | % | 13.46 | % | 13.47 | % | +/- 0.1 percentage point change in BC’s population share equals | |
BC health and social transfers revenue | | | | | | | | +/- $53 million | |
CHT | | $ | 5,063 | | $ | 5,192 | | $ | 5,196 | | | |
CST | | $ | 1,858 | | $ | 1,905 | | $ | 1,907 | | | |
Prior-year adjustments | | — | | — | | $ | 3 | | | |
Other federal contributions | | $ | 2,009 | | $ | 2,024 | | $ | 1,991 | | | |
Components of revenue | | | | | | | | | |
Disaster Financial Assistance Arrangements | | $ | 20 | | $ | 20 | | — | | | |
BC share of federal duty on cannabis | | $ | 50 | | $ | 10 | | $ | 10 | | | |
Other Consolidated Revenue Fund | | $ | 139 | | $ | 143 | | $ | 143 | | | |
Vote Recoveries: | | | | | | | | | |
Labour Market Development Agreement | | $ | 323 | | $ | 323 | | $ | 323 | | | |
Labour Market and Skills Training Program | | $ | 105 | | $ | 105 | | $ | 105 | | | |
Home Care | | $ | 79 | | $ | 79 | | $ | 79 | | | |
Mental Health | | $ | 33 | | $ | 33 | | $ | 33 | | | |
Early Childhood Development and Child Care Services | | $ | 61 | | $ | 61 | | $ | 61 | | | |
Child Safety, Family Support, Children in Care and with special needs | | $ | 85 | | $ | 85 | | $ | 85 | | | |
Youth Justice Services | | $ | 18 | | $ | 18 | | $ | 18 | | | |
Public Transit | | $ | 129 | | $ | 129 | | $ | 129 | | | |
Local government services and transfers | | $ | 100 | | $ | 100 | | $ | 100 | | | |
Other recoveries | | $ | 103 | | $ | 103 | | $ | 103 | | | |
Crown corporations and agencies | | $ | 211 | | $ | 204 | | $ | 194 | | | |
Post-secondary institutions | | $ | 459 | | $ | 496 | | $ | 492 | | | |
Other SUCH sector agencies | | $ | 94 | | $ | 115 | | $ | 116 | | | |
Service delivery agency direct revenue | | $ | 7,001 | | $ | 7,176 | | $ | 7,227 | | | |
School districts | | $ | 688 | | $ | 704 | | $ | 678 | | | |
Post-secondary institutions | | $ | 3,830 | | $ | 3,964 | | $ | 4,010 | | | |
Health authorities and hospital societies | | $ | 915 | | $ | 965 | | $ | 974 | | | |
BC Transportation Financing Authority | | $ | 578 | | $ | 552 | | $ | 558 | | | |
Other service delivery agencies | | $ | 990 | | $ | 991 | | $ | 1,007 | | | |
Commercial Crown corporation net income | | $ | 2,564 | | $ | 2,627 | | $ | 2,412 | | | |
BC Hydro | | $ | 712 | | $ | 712 | | $ | 712 | | | |
Reservoir water inflows | | 100 | % | 97 | % | 94 | % | +/-1% in hydro generation = +/-$5 million | |
Mean gas price | | 2.32 | | 2.16 | | 2.29 | | +/-10% = +/-$1 million | |
(Sumas, $US/MMbtu — BC Hydro forecast based on NYMEX forward selling prices) | | | | | | | | | |
Electricity prices | | 21.43 | | 22.02 | | 31.55 | | +/-10% change in electricity trade margins = +/-$2 million | |
(Mid-C, $US/MWh) | | | | | | | | |
ICBC | | $ | (684 | ) | $ | (684 | ) | $ | (890 | ) | | |
Vehicle growth | | +2.7 | % | +2.7 | % | +1.9 | % | +/-1% = +/-$58 million | |
Current claims cost percentage change | | +19.2 | % | +19.2 | % | +8.0 | % | +/-1% = -/+$55 million | |
Unpaid claims balance ($ billions) | | $ | 13.3 | | $ | 13.3 | | $ | 13.3 | | +/-1% = -/+$119 to $133 million | |
Investment return | | 3.3 | % | 3.3 | % | 3.8 | % | +/-1% return = +/-$158 to $164 million | |
Loss ratio | | 109.3 | % | 109.3 | % | 112.6 | % | | |
| | | | | | | | | | | | | | | |
Second Quarterly Report 2018/19
19
Updated Financial Forecast
Table 1.10 2018/19 Material Assumptions — Expense
| | Budget | | First | | Second | | | |
Ministry Programs and Assumptions | | 2018 | | Quarter | | Quarter | | | |
($ millions unless otherwise specified) | | Estimate | | Forecast | | Forecast | | 2018/19 Sensitivities | |
Advanced Education, Skills and Training | | 2,212 | | 2,212 | | 2,212 | | | |
Student spaces in public institutions | | 200,752 | | 200,752 | | 200,752 | | Student enrollment may fluctuate due to a number of factors including economic changes and labour market needs. | |
Attorney General | | 583 | | 583 | | 583 | | | |
New cases filed/processed
(# for all courts) | | 240,000 | | 240,000 | | 240,000 | | The number of criminal cases proceeded on by the provincial and federal Crown (including appeals to higher courts in BC), the number of civil and family litigation cases, the number of violation tickets disputed, and the number of municipal bylaw tickets disputed which would go to court for resolution. | |
Crown Proceeding Act (CPA) | | 25 | | 25 | | 25 | | The number of new cases, and the difference between estimated settlements and actual settlements. | |
Children and Family Development | | 1,793 | | 1,793 | | 1,793 | | | |
Average children-in-care caseload (#) | | 6,771 | | 6,771 | | 6,771 | | A 1% change in either the caseload or average cost will affect expenditures by approximately $2 million (excluding Delegated Aboriginal Agencies). | |
Average annual residential cost per child in care ($) | | 55,600 | | 55,600 | | 55,600 | | |
Education | | 6,341 | | 6,352 | | 6,355 | | | |
Public School Enrolment (# of FTEs) | | 558,506 | | 558,506 | | 558,506 | | Enrolment figures for 2018/19 are consistent with Budget 2018 and will not be updated until the start of the next school year. | |
School age (K–12) | | 535,471 | | 535,471 | | 535,471 | | |
Continuing Education | | 1,165 | | 1,165 | | 1,165 | | |
Distributed Learning (online) | | 11,900 | | 11,900 | | 11,900 | | |
Summer | | 6,865 | | 6,865 | | 6,865 | | |
Adults | | 3,105 | | 3,105 | | 3,105 | | |
Forests, Lands, Natural Resource Operations and Rural Development | | 734 | | 1,211 | | 1,242 | | | |
BC Timber Sales | | 197 | | 197 | | 197 | | Targets can be impacted by changes to actual inventory costs incurred. There is a lag of approximately 1.5 years between when inventory costs are incurred and when they are expensed. Volume harvested can also impact targets. For example, if volume harvested is less than projected in any year, then capitalized expenses will also be reduced in that year. | |
Fire Management | | 64 | | 541 | | 572 | | Fire Management fire suppression costs have ranged from a low of $47 million in 2006 to a high of $650 million in 2017. | |
Health | | 19,754 | | 19,754 | | 19,754 | | | |
Pharmacare | | 1,272 | | 1,272 | | 1,272 | | A 1% change in utilization or prices affects costs by approximately $10 million. | |
Medical Services Plan (MSP) | | 4,812 | | 4,812 | | 4,812 | | A 1% increase in volume of services provided by fee-for-service physicians affects costs by approximately $25 million. | |
Regional Services | | 13,392 | | 13,392 | | 13,360 | | | |

Second Quarterly Report 2018/19
20
Updated Financial Forecast
Table 1.10 2018/19 Material Assumptions — Expense (continued)
| | Budget | | First | | Second | | | |
Ministry Programs and Assumptions | | 2018 | | Quarter | | Quarter | | | |
($ millions unless otherwise specified) | | Estimate | | Forecast | | Forecast | | 2018/19 Sensitivities | |
Public Safety and Solicitor General | | 787 | | 949 | | 1,078 | | | |
Policing, Victim Services and Corrections | | 685 | | 685 | | 685 | | Policing, Victim Services and Corrections costs are sensitive to the volume and severity of criminal activity, the number of inmate beds occupied and the number of offenders under community supervision. | |
Emergency Program Act (EPA) | | 15 | | 177 | | 306 | | For authorized expenditures under the EPA, including those for further disasters, and the difference between initial estimates for disaster response and recovery costs and final project costs. The projected EPA expenditures are based on the most recent quarterly forecast. | |
Social Development and Poverty Reduction | | 3,364 | | 3,364 | | 3,364 | | | |
Temporary Assistance annual average caseload (#) | | 42,500 | | 42,530 | | 42,900 | | The expected to work caseload is sensitive to fluctuations in economic and employment trends. Costs are driven by changes to cost per case and caseload. Cost per case fluctuations result from changes in the needed supports required by clients, as well as caseload composition. | |
Disability Assistance annual average caseload (#) | | 108,900 | | 106,200 | | 106,100 | | The caseload for persons with disabilities is sensitive to the aging of the population and longer life expectancy for individuals with disabilities. Cost per case fluctuations are driven primarily by earnings exemptions which is dependent on the level of income earned by clients. | |
Adult Community Living: | | | | | | | | | |
Developmental Disabilities Programs | | | | | | | | | |
Average caseload (#) | | 19,900 | | 19,880 | | 19,870 | | The adult community living caseload is sensitive to an aging population and to the level of service required. Cost per case fluctuations are driven by the proportion of clients receiving certain types of services at differing costs. For example, residential care services are significantly more costly than day programs. The average cost per client for PSI is projected to decrease to better reflect actual costs for the mix of services being provided. | |
Average cost per client ($) | | 46,200 | | 46,600 | | 46,800 | | |
Personal Supports Initiative (PSI) | | | | | | | | |
Average caseload (#) | | 1,860 | | 1,840 | | 1,830 | | |
Average cost per client ($) | | 15,400 | | 16,800 | | 16,600 | | |

Second Quarterly Report 2018/19
21
Updated Financial Forecast
Table 1.10 2018/19 Material Assumptions — Expense (continued)
| | Budget | | First | | Second | | | |
Ministry Programs and Assumptions | | 2018 | | Quarter | | Quarter | | | |
($ millions unless otherwise specified) | | Estimate | | Forecast | | Forecast | | 2018/19 Sensitivities | |
Tax Transfers | | 1,246 | | 1,625 | | 1,507 | | | |
Individuals | | 515.0 | | 515.0 | | 539.0 | | | |
Low Income Climate Action | | 235.0 | | 235.0 | | 235.0 | | These tax transfers are now expensed as required under generally accepted accounting principles. | |
Early Childhood Tax Benefit | | 140.0 | | 140.0 | | 140.0 | | |
Sales Tax | | 52.0 | | 52.0 | | 45.5 | | |
Small Business Venture Capital | | 30.0 | | 30.0 | | 25.0 | | | |
BC Senior’s Home Renovation | | 2.0 | | 2.0 | | 2.0 | | Changes in 2017 tax transfers will result in one-time effect (prior-year adjustment) and could result in an additional base change in 2018/19. Production services tax credit is the most volatile of all tax transfers and is influenced by several factors including delays in filing returns and assessment of claims, duration of projects, changes in scope and timing of productions and changes in the exchange rate. | |
Other tax transfers to individuals | | 55.9 | | 55.9 | | 91.4 | | |
Family Bonus Program | | 0.1 | | 0.1 | | 0.1 | | |
Corporations | | 731.0 | | 1,110.0 | | 968.0 | | |
Film and Television | | 86.0 | | 86.0 | | 103.5 | | |
Production Services | | 488.0 | | 867.0 | | 673.8 | | |
Scientific Research & Experimental Development | | 68.0 | | 68.0 | | 65.8 | | |
Interactive Digital Media | | 56.0 | | 56.0 | | 46.0 | | |
Mining Exploration | | 15.0 | | 15.0 | | 10.0 | | |
Other tax transfers to corporations | | 18.0 | | 18.0 | | 68.9 | | |
2018/19 tax transfer forecast incorporates adjustments relating to prior years. | | | | | | | | |
Management of Public Funds and Debt | | 1,276 | | 1,272 | | 1,260 | | | |
Interest rates for new provincial borrowing: | | | | | | | | Full year impact of MoPD on interest costs of a 1% change in interest rates equals $23.2 million; $100 million increase in debt level equals $2.8 million. | |
Short-term | | 1.58 | % | 1.65 | % | 1.72 | % | |
Long-term | | 3.62 | % | 3.32 | % | 3.19 | % | |
CDN/US exchange rate (cents) | | 127.1 | | 129.5 | | 128.9 | | |
Service delivery agency net spending | | 6,460 | | 6,621 | | 6,708 | | | |
School districts | | 360 | | 419 | | 419 | | | |
Post-secondary institutions | | 3,381 | | 3,492 | | 3,504 | | | |
Health authorities and hospital societies | | 571 | | 590 | | 610 | | | |
BC Transportation Financing Authority | | 1,293 | | 1,246 | | 1,258 | | | |
Other service delivery agencies | | 855 | | 874 | | 917 | | | |
Second Quarterly Report 2018/19
22
Updated Financial Forecast
Table 1.11 2018/19 Full-Time Equivalents (FTEs) 1
| | 2018/19 | | | |
| | Budget | | | | | | Actual | |
FTEs | | 2018 | | Forecast | | Variance | | 2017/18 | |
Ministries and special offices (consolidated revenue fund) | | 29,400 | | 29,900 | | 500 | | 29,291 | |
Service delivery agencies 2 | | 5,033 | | 5,065 | | 32 | | 5,076 | |
Total FTEs | | 34,433 | | 34,965 | | 532 | | 34,367 | |
1 Full-time equivalents (FTEs) are a measure of staff employment. FTEs are calculated by dividing the total hours of employment paid for in a given period by the number of hours an individual, full-time person would normally work in that period. This does not equate to the physical number of employees. For example, two half-time employees would equal one FTE, or alternatively, three FTEs may represent two full-time employees who have worked sufficient overtime hours to equal an additional FTE.
2 Service delivery agency FTE amounts do not include SUCH sector staff employment.
Table 1.12 2018/19 Capital Spending
| | Year-to-Date to September 30 | | Full Year | |
| | 2018/19 | | Actual | | 2018/19 | | Actual | |
($ millions) | | Budget | | Actual | | Variance | | 2017/18 | | Budget | | Forecast | | Variance | | 2017/18 | |
Taxpayer-supported | | | | | | | | | | | | | | | | | |
Education | | | | | | | | | | | | | | | | | |
School districts | | 258 | | 314 | | 56 | | 268 | | 557 | | 557 | | — | | 578 | |
Post-secondary institutions | | 283 | | 422 | | 139 | | 304 | | 902 | | 983 | | 81 | | 968 | |
Health | | 439 | | 266 | | (173 | ) | 353 | | 1,107 | | 1,310 | | 203 | | 890 | |
BC Transportation Financing Authority 1 | | 773 | | 475 | | (298 | ) | 404 | | 1,371 | | 1,135 | | (236 | ) | 717 | |
BC Transit | | 63 | | 42 | | (21 | ) | 46 | | 158 | | 122 | | (36 | ) | 115 | |
Government ministries | | 105 | | 104 | | (1 | ) | 82 | | 549 | | 522 | | (27 | ) | 430 | |
Housing 2 | | 178 | | 156 | | (22 | ) | 67 | | 450 | | 476 | | 26 | | 169 | |
Other 3 | | 29 | | 18 | | (11 | ) | 15 | | 80 | | 72 | | (8 | ) | 41 | |
Total taxpayer-supported | | 2,129 | | 1,797 | | (332 | ) | 1,539 | | 5,174 | | 5,177 | | 3 | | 3,908 | |
| | | | | | | | | | | | | | | | | |
Self-supported | | | | | | | | | | | | | | | | | |
BC Hydro | | 2,562 | | 2,524 | | (38 | ) | 1,135 | | 3,744 | | 3,717 | | (27 | ) | 2,473 | |
Columbia River power projects 4 | | 1 | | 1 | | — | | 1 | | 5 | | 5 | | — | | 1 | |
Transportation Investment Corporation 5 | | — | | — | | — | | 3 | | — | | — | | — | | 4 | |
BC Railway Company | | 14 | | 14 | | — | | 1 | | 42 | | 42 | | — | | 11 | |
ICBC | | 24 | | 21 | | (3 | ) | 25 | | 105 | | 105 | | — | | 54 | |
BC Lottery Corporation | | 51 | | 21 | | (30 | ) | 28 | | 105 | | 90 | | (15 | ) | 82 | |
Liquor Distribution Branch | | 31 | | 23 | | (8 | ) | 15 | | 60 | | 102 | | 42 | | 48 | |
Other6 | | — | | — | | — | | — | | — | | — | | — | | 56 | |
Total self-supported | | 2,683 | | 2,604 | | (79 | ) | 1,208 | | 4,061 | | 4,061 | | — | | 2,729 | |
Total capital spending | | 4,812 | | 4,401 | | (411 | ) | 2,747 | | 9,235 | | 9,238 | | 3 | | 6,637 | |
1 Includes Transportation Investment Plan and Transportation Investment Corporation, which is a subsidiary of BCTFA effective April 1, 2018.
2 Includes BC Housing Management Commission and Provincial Rental Housing Corporation.
3 Includes BC Pavilion Corporation and other service delivery agencies.
4 Joint ventures of the Columbia Power Corporation and Columbia Basin Trust.
5 Transportation Investment Corporation’s capital spending to August 31, 2017 is classified as self-supported.
6 Includes post-secondary institutions’ self-supported subsidiaries.
Second Quarterly Report 2018/19
23
Updated Financial Forecast
Table 1.13 Capital Expenditure Projects Greater Than $50 million 1
Note: Information in bold type denotes changes from the 2018/19 First Quarterly Report released on September 7, 2018.
| | | | Project | | Estimated | | Anticipated | | Project Financing | |
| | Year of | | Cost to | | Cost to | | Total | | Internal/ | | P3 | | Federal | | Other | |
($ millions) | | Completion | | Sept. 30, 2018 | | Complete | | Cost | | Borrowing | | Liability | | Gov’t | | Contrib’ns | |
Taxpayer-supported | |
School districts | | | | | | | | | | | | | | | | | |
Kitsilano Secondary | | 2018 | | 62 | | 3 | | 65 | | 61 | | — | | — | | 4 | |
Salish Secondary | | 2018 | | 54 | | 1 | | 55 | | 45 | | — | | — | | 10 | |
Centennial Secondary | | 2019 | | 57 | | 4 | | 61 | | 61 | | — | | — | | — | |
Willoughby Slope Secondary | | 2019 | | 26 | | 33 | | 59 | | 38 | | — | | — | | 21 | |
Argyle Secondary | | 2020 | | 3 | | 59 | | 62 | | 50 | | — | | — | | 12 | |
Grandview Heights Secondary | | 2020 | | 2 | | 59 | | 61 | | 46 | | — | | — | | 15 | |
Handsworth Secondary | | 2021 | | — | | 62 | | 62 | | 62 | | — | | — | | — | |
New Westminster Secondary | | 2021 | | 20 | | 87 | | 107 | | 107 | | — | | — | | — | |
Burnaby North Secondary | | 2022 | | — | | 79 | | 79 | | 79 | | — | | — | | — | |
Eric Hamber Secondary | | 2022 | | — | | 79 | | 79 | | 79 | | — | | — | | — | |
South Side Area Elementary | | 2023 | | — | | 54 | | 54 | | 49 | | — | | — | | 5 | |
Seismic mitigation program | | 2030 | | 288 | | 1,012 | | 1,300 | | 1,300 | | — | | — | | — | |
Total school districts | | | | 512 | | 1,532 | | 2,044 | | 1,977 | | — | | — | | 67 | |
Post-secondary institutions | | | | | | | | | | | | | | | | | |
University of British Columbia – Undergraduate Life Science Teaching Laboratories Redevelopment | | 2019 | | 69 | | 19 | | 88 | | 12 | | — | | 32 | | 44 | |
Simon Fraser University – Energy Systems Engineering Building 3 | | 2019 | | 99 | | 27 | | 126 | | 45 | | — | | 45 | | 36 | |
British Columbia Institute of Technology – Health Sciences Centre for Advanced Simulation | | 2021 | | — | | 78 | | 78 | | 66 | | — | | — | | 12 | |
Total post secondary institutions | | | | 168 | | 124 | | 292 | | 123 | | — | | 77 | | 92 | |
Health facilities | | | | | | | | | | | | | | | | | |
Queen Charlotte/Haida Gwaii Hospital 2 | | 2016 | | 48 | | 2 | | 50 | | 31 | | — | | — | | 19 | |
Surrey Emergency/Critical Care Tower | | | | | | | | | | | | | | | | | |
– Direct procurement | | 2018 | | 164 | | 30 | | 194 | | 174 | | — | | — | | 20 | |
– P3 contract | | 2014 | | 318 | | — | | 318 | | 139 | | 179 | | — | | — | |
Royal Inland Hospital Clinical Services Building 2 | | 2016 | | 60 | | 3 | | 63 | | 38 | | — | | — | | 25 | |
Royal Inland Hospital Patient Care Tower | | 2024 | | 4 | | 413 | | 417 | | 202 | | — | | — | | 215 | |
Vancouver General Hospital - Jim Pattison Pavilion Operating Rooms | | 2021 | | 6 | | 96 | | 102 | | 35 | | — | | — | | 67 | |
North Island Hospitals 2 | | | | | | | | | | | | | | | | | |
– Direct procurement | | 2017 | | 106 | | 20 | | 126 | | 73 | | — | | — | | 53 | |
– P3 contract | | 2017 | | 480 | | — | | 480 | | 60 | | 232 | | — | | 188 | |
Interior Heart and Surgical Centre | | | | | | | | | | | | | | | | | |
– Direct procurement | | 2018 | | 168 | | 80 | | 248 | | 213 | | — | | — | | 35 | |
– P3 contract | | 2015 | | 133 | | — | | 133 | | 4 | | 79 | | — | | 50 | |
Vancouver General Hospital – Joseph and Rosalie Segal Family Health Centre 2 | | 2017 | | 73 | | 9 | | 82 | | 57 | | — | | — | | 25 | |
Children’s and Women’s Hospital | | | | | | | | | | | | | | | | | |
– Direct procurement | | 2019 | | 214 | | 93 | | 307 | | 177 | | — | | — | | 130 | |
– P3 contract | | 2018 | | 368 | | 1 | | 369 | | 168 | | 187 | | — | | 14 | |
Penticton Regional Hospital – Patient Care Tower | | | | | | | | | | | | | | | | | |
– Direct procurement | | 2021 | | 74 | | 6 | | 80 | | 22 | | — | | — | | 58 | |
– P3 contract | | 2019 | | 162 | | 70 | | 232 | | — | | 139 | | — | | 93 | |
Royal Columbian Hospital – Phase 1 | | 2019 | | 103 | | 156 | | 259 | | 250 | | — | | — | | 9 | |
Royal Columbian Hospital – Phases 2 & 3 | | 2026 | | 7 | | 1,093 | | 1,100 | | 1,037 | | — | | — | | 63 | |
Peace Arch Hospital Renewal | | 2021 | | 2 | | 82 | | 84 | | 8 | | — | | — | | 76 | |
Centre for Mental Health and Addictions | | 2020 | | 17 | | 84 | | 101 | | 101 | | — | | — | | — | |
Dogwood Complex Residential Care | | 2021 | | — | | 51 | | 51 | | — | | — | | — | | 51 | |
Lions Gate Hospital - New Acute Care Facility | | 2023 | | — | | 166 | | 166 | | — | | — | | — | | 166 | |
Clinical and systems transformation4 | | 2023 | | 280 | | 200 | | 480 | | 480 | | — | | — | | — | |
iHealth Project – Vancouver Island Health Authority 4 | | 2020 | | 89 | | 11 | | 100 | | — | | — | | — | | 100 | |
Total health facilities | | | | 2,876 | | 2,666 | | 5,542 | | 3,269 | | 816 | | — | | 1,457 | |

Second Quarterly Report 2018/19
24
Updated Financial Forecast
Table 1.13 Capital Expenditure Projects Greater Than $50 million 1
Note: Information in bold type denotes changes from the 2018/19 First Quarterly Report released on September 7, 2018.
| | | | Project | | Estimated | | Anticipated | | Project Financing | |
| | Year of | | Cost to | | Cost to | | Total | | Internal/ | | P3 | | Federal | | Other | |
($ millions) | | Completion | | Sept. 30, 2018 | | Complete | | Cost | | Borrowing | | Liability | | Gov’t | | Contrib’ns | |
Transportation | | | | | | | | | | | | | | | | | |
Highway 97 widening from Highway 33 to Edwards Road | | 2018 | | 63 | | 4 | | 67 | | 49 | | — | | 18 | | — | |
Highway 1 — Admirals Road/McKenzie Avenue Interchange | | 2019 | | 60 | | 25 | | 85 | | 52 | | — | | 33 | | — | |
Highway 1 widening and 216th Street Interchange | | 2019 | | 28 | | 31 | | 59 | | 23 | | — | | 22 | | 14 | |
Highway 7 Corridor Improvements | | 2019 | | 23 | | 47 | | 70 | | 48 | | — | | 22 | | — | |
Highway 91 Alex Fraser Bridge Capacity Improvements | | 2019 | | 36 | | 34 | | 70 | | 36 | | — | | 34 | | — | |
Highway 99 10-Mile Slide | | 2020 | | 10 | | 50 | | 60 | | 60 | | — | | — | | — | |
Highway 1 Lower Lynn Corridor Improvements | | 2021 | | 92 | | 106 | | 198 | | 77 | | — | | 66 | | 55 | |
Highway 1 Illecillewaet 4-laning | | 2022 | | 3 | | 60 | | 63 | | 47 | | — | | 16 | | — | |
Highway 1 Hoffman’s Bluff to Jade Mountain | | 2023 | | 18 | | 181 | | 199 | | 144 | | — | | 55 | | — | |
Highway 91 to Highway 17 and Deltaport Way Corridor Improvements | | 2023 | | 19 | | 226 | | 245 | | 80 | | | | 82 | | 83 | |
Highway 1 Salmon Arm West | | 2023 | | 28 | | 135 | | 163 | | 115 | | — | | 48 | | — | |
Pattullo Bridge Replacement 5 | | 2023 | | 10 | | 1,367 | | 1,377 | | 1,377 | | — | | — | | — | |
Highway 1 Kicking Horse Canyon Phase 4 | | 2024 | | 14 | | 436 | | 450 | | 235 | | — | | 215 | | — | |
Broadway Subway | | 2025 | | 9 | | 2,818 | | 2,827 | | 1,830 | | — | | 897 | | 100 | |
Total transportation | | | | 413 | | 5,520 | | 5,933 | | 4,173 | | — | | 1,508 | | 252 | |
Other taxpayer-supported | | | | | | | | | | | | | | | | | |
Abbotsford courthouse | | | | | | | | | | | | | | | | | |
– Direct procurement | | 2021 | | 5 | | 13 | | 18 | | 18 | | — | | — | | — | |
– P3 contract | | 2021 | | 9 | | 125 | | 134 | | 48 | | 80 | | — | | 6 | |
Natural Resource Permitting Project 6 | | 2018 | | 78 | | — | | 78 | | 78 | | — | | | | — | |
Maples Adolescent Treatment Centre and Provincial Assessment Centre | | 2019 | | 58 | | 17 | | 75 | | 75 | | — | | — | | — | |
Total other | | | | 150 | | 155 | | 305 | | 219 | | 80 | | — | | 6 | |
Total taxpayer-supported | | | | 4,119 | | 9,997 | | 14,116 | | 9,761 | | 896 | | 1,585 | | 1,874 | |
Second Quarterly Report 2018/19
25
Updated Financial Forecast
Table 1.13 Capital Expenditure Projects Greater Than $50 million 1
Note: Information in bold type denotes changes from the 2018/19 First Quarterly Report released on September 7, 2018.
| | | | Project | | Estimated | | Anticipated | | Project Financing | |
| | Year of | | Cost to | | Cost to | | Total | | Internal/ | | P3 | | Federal | | Other | |
($ millions) | | Completion | | Sept. 30, 2018 | | Complete | | Cost | | Borrowing | | Liability | | Gov’t | | Contrib’ns | |
Power generation and transmission | | | | | | | | | | | | | | | | | |
BC Hydro | | | | | | | | | | | | | | | | | |
– Northwest transmission line 2 | | 2014 | | 699 | | — | | 699 | | 312 | | — | | 130 | | 257 | |
– G.M. Shrum units 1 to 5 turbine replacement 2 | | 2015 | | 181 | | 1 | | 182 | | 182 | | — | | — | | — | |
– Hugh Keenleyside spillway gate reliability upgrade 2 | | 2015 | | 113 | | 2 | | 115 | | 115 | | — | | — | | — | |
– Upper Columbia capacity additions at Mica units 5 and 6 project 2 | | 2015 | | 599 | | 6 | | 605 | | 605 | | — | | — | | — | |
– Dawson Creek/Chetwynd area transmission 2 | | 2015 | | 293 | | 3 | | 296 | | 296 | | — | | — | | — | |
– Surrey area substation project 2 | | 2016 | | 80 | | 14 | | 94 | | 94 | | — | | — | | — | |
– Big Bend substation 2 | | 2017 | | 68 | | 4 | | 72 | | 72 | | — | | — | | — | |
– Ruskin Dam safety and powerhouse upgrade 2 | | 2018 | | 615 | | 133 | | 748 | | 748 | | — | | — | | — | |
– Waneta 2/3 interest acquisition 2, 7 | | 2018 | | 1,220 | | 1 | | 1,221 | | 1,221 | | | | | | | |
– Horne Payne substation upgrade project | | 2018 | | 60 | | 33 | | 93 | | 93 | | — | | — | | — | |
– Kamloops substation | | 2018 | | 48 | | 8 | | 56 | | 56 | | — | | — | | — | |
– W.A.C. Bennett Dam riprap upgrade project 2, 8 | | 2018 | | 117 | | 2 | | 119 | | 119 | | — | | — | | — | |
– John Hart generating station replacement | | 2019 | | 941 | | 152 | | 1,093 | | 1,093 | | — | | — | | — | |
– Cheakamus unit 1 and 2 generator replacement | | 2019 | | 49 | | 25 | | 74 | | 74 | | — | | — | | — | |
– South Fraser transmission relocation project 4, 9 | | TBD | | 29 | | 47 | | 76 | | 76 | | — | | — | | — | |
– Bridge River 2 units 5 and 6 upgrade project | | 2019 | | 48 | | 38 | | 86 | | 86 | | — | | — | | — | |
– Downtown Vancouver Electricity Supply: West End strategic property purchase | | 2020 | | 66 | | 15 | | 81 | | 81 | | — | | — | | — | |
– Fort St. John and Taylor Electric Supply | | 2020 | | 24 | | 29 | | 53 | | 53 | | — | | — | | — | |
– UBC load increase stage 2 project | | 2021 | | 9 | | 46 | | 55 | | 55 | | — | | — | | — | |
– Peace Region Electricity Supply project | | 2021 | | 37 | | 248 | | 285 | | 285 | | — | | — | | — | |
– Mica replace units 1-4 transformers project | | 2022 | | 4 | | 78 | | 82 | | 82 | | — | | — | | — | |
– G.M. Shrum G1-G10 control system upgrade | | 2022 | | 29 | | 46 | | 75 | | 75 | | — | | — | | — | |
– Site C project | | 2024 | | 2,899 | | 7,801 | | 10,700 | | 10,700 | | — | | — | | — | |
Columbia River power projects | | | | | | | | | | | | | | | | | |
– Waneta Dam power expansion 2, 10 | | 2018 | | 331 | | 4 | | 335 | | 335 | | — | | — | | — | |
Total power generation and transmission | | | | 8,559 | | 8,736 | | 17,295 | | 16,908 | | — | | 130 | | 257 | |
Other self-supported | | | | | | | | | | | | | | | | | |
Liquor Distribution Branch Warehouse | | 2019 | | 41 | | 14 | | 55 | | 55 | | — | | — | | — | |
Total other | | | | 41 | | 14 | | 55 | | 55 | | — | | — | | — | |
| | | | | | | | | | | | | | | | | |
Total self-supported | | | | 8,600 | | 8,750 | | 17,350 | | 16,963 | | — | | 130 | | 257 | |
Total $50 million projects | | | | 12,719 | | 18,747 | | 31,466 | | 26,724 | | 896 | | 1,715 | | 2,131 | |
1 Only projects that receive provincial funding and have been approved by Treasury Board and/or Crown corporation boards are included in this table. Ministry service plans may highlight projects that still require final approval. Capital costs reflect current government accounting policy.
2 Assets have been put into service and only trailing costs remain.
3 Simon Fraser University and private donors will contribute $26 million toward the project, and the university is also contributing land valued at $10 million.
4 The project and estimated budget are currently under review.
5 Forecasted amount reflects total expenditures including capitalized and expensed items. This amount may change once contracts are finalized.
6 Reflects approved capital costs to date, subject to change if future scope components are approved by government.
7 Waneta 2/3 interest acquisition (previously Waneta Dam and Generating Station) total authorized cost of $1,253 million was reduced to the total project forecast amount of $1,221 million.
8 W.A.C. Bennett Dam riprap upgrade project total authorized cost of $170 million was reduced to the total project forecast amount of $119 million.
9 The project and estimated budget are currently under review. As of September 6, 2017, construction work on the South Fraser transmission relocation project has been suspended, pending a government review of the George Massey Tunnel Replacement project.
10 Reflects the combined shares of Columbia Power Corporation (32.5 per cent) and Columbia Basin Trust (16.5 per cent) in their partnership with Fortis Inc. for the development of an electricity generating expansion facility at the Waneta Dam south of Trail.
Second Quarterly Report 2018/19
26
Updated Financial Forecast
Table 1.14 2018/19 Provincial Debt 1
| | Year-to-Date to September 30 | | Full Year | |
| | 2018/19 | | | | 2018/19 | | | |
| | | | | | | | Actual | | | | | | | | Actual | |
($ millions) | | Budget | | Actual | | Variance | | 2017/18 | | Budget | | Forecast | | Variance | | 2017/18 | |
Taxpayer-supported debt | | | | | | | | | | | | | | | | | |
Provincial government operating | | — | | — | | — | | 1,450 | | — | | — | | — | | 1,156 | |
Other taxpayer-supported debt (mainly capital) | | | | | | | | | | | | | | | | | |
Education 2 | | | | | | | | | | | | | | | | | |
Post-secondary institutions 3 | | 5,458 | | 5,155 | | (303 | ) | 5,048 | | 5,577 | | 5,088 | | (489 | ) | 5,328 | |
School districts | | 9,057 | | 8,478 | | (579 | ) | 8,575 | | 9,005 | | 8,440 | | (565 | ) | 8,908 | |
| | 14,515 | | 13,633 | | (882 | ) | 13,623 | | 14,582 | | 13,528 | | (1,054 | ) | 14,236 | |
Health 2,4 | | 8,223 | | 7,639 | | (584 | ) | 7,657 | | 8,184 | | 7,471 | | (713 | ) | 7,903 | |
Highways and public transit | | | | | | | | | | | | | | | | | |
BC Transit | | 105 | | 78 | | (27 | ) | 88 | | 120 | | 120 | | — | | 84 | |
BC Transportation Financing Authority 5 | | 11,300 | | 10,823 | | (477 | ) | 10,173 | | 11,982 | | 11,496 | | (486 | ) | 10,388 | |
Port Mann Bridge | | 3,505 | | 3,509 | | 4 | | 3,505 | | 3,505 | | 3,508 | | 3 | | 3,508 | |
Public transit | | 1,000 | | 1,001 | | 1 | | 1,000 | | 1,000 | | 1,000 | | — | | 1,000 | |
SkyTrain extension | | 1,174 | | 1,174 | | — | | 1,174 | | 1,174 | | 1,174 | | — | | 1,174 | |
| | 17,084 | | 16,585 | | (499 | ) | 15,940 | | 17,781 | | 17,298 | | (483 | ) | 16,154 | |
Other | | | | | | | | | | | | | | | | | |
BC Immigrant Investment Fund | | 109 | | 100 | | (9 | ) | 190 | | 61 | | 67 | | 6 | | 161 | |
BC Pavilion Corporation | | 390 | | 372 | | (18 | ) | 375 | | 395 | | 383 | | (12 | ) | 374 | |
Provincial government general capital | | 2,897 | | 2,822 | | (75 | ) | 2,370 | | 3,125 | | 2,809 | | (316 | ) | 2,718 | |
Social housing 6 | | 958 | | 855 | | (103 | ) | 695 | | 1,043 | | 849 | | (194 | ) | 878 | |
Other 7 | | 27 | | 26 | | (1 | ) | 27 | | 27 | | 26 | | (1 | ) | 27 | |
| | 4,381 | | 4,175 | | (206 | ) | 3,657 | | 4,651 | | 4,134 | | (517 | ) | 4,158 | |
Total other taxpayer-supported | | 44,203 | | 42,032 | | (2,171 | ) | 40,877 | | 45,198 | | 42,431 | | (2,767 | ) | 42,451 | |
Total taxpayer-supported debt | | 44,203 | | 42,032 | | (2,171 | ) | 42,327 | | 45,198 | | 42,431 | | (2,767 | ) | 43,607 | |
Self-supported debt | | | | | | | | | | | | | | | | | |
Commercial Crown corporations | | | | | | | | | | | | | | | | | |
BC Hydro | | 21,312 | | 22,010 | | 698 | | 19,969 | | 22,541 | | 21,949 | | (592 | ) | 19,990 | |
BC Lotteries | | 158 | | 105 | | (53 | ) | 125 | | 170 | | 155 | | (15 | ) | 155 | |
Columbia Power Corporation | | 291 | | 281 | | (10 | ) | 286 | | 286 | | 281 | | (5 | ) | 286 | |
Columbia River power projects 8 | | 433 | | 426 | | (7 | ) | 440 | | 417 | | 418 | | 1 | | 433 | |
Post-secondary institutions’ subsidiaries | | 340 | | 417 | | 77 | | 340 | | 340 | | 417 | | 77 | | 418 | |
Other | | 56 | | 29 | | (27 | ) | 32 | | 70 | | 71 | | 1 | | 30 | |
Total self-supported debt | | 22,590 | | 23,268 | | 678 | | 21,192 | | 23,824 | | 23,291 | | (533 | ) | 21,312 | |
Forecast allowance | | — | | — | | — | | — | | 350 | | 950 | | 600 | | — | |
Total provincial debt | | 66,793 | | 65,300 | | (1,493 | ) | 63,519 | | 69,372 | | 66,672 | | (2,700 | ) | 64,919 | |
1 Provincial debt is prepared in accordance with Generally Accepted Accounting Principles and presented consistent with the Debt Summary Report included in the Public Accounts. Debt is shown net of sinking funds and unamortized discounts, excludes accrued interest, and includes non-guaranteed debt directly incurred by commercial Crown corporations and debt guaranteed by the Province.
2 Includes debt and guarantees incurred by the government on behalf of school districts, universities, colleges and health authorities/hospital societies (SUCH), and debt directly incurred by these entities.
3 Post-secondary institutions’ debt includes public-private partnership obligations of $58 million for the six months ended September 30, 2017 and $59 million for the six months ended September 30, 2018.
4 Health facilities’ debt includes public-private partnership obligations of $1,605 million for the six months ended September 30, 2017 and $1,659 million for the six months ended September 30, 2018.
5 BC Transportation Financing Authority debt includes public-private partnership obligations of $803 million for the six months ended September 30, 2017 and $769 million for the six months ended September 30, 2018.
6 Includes the BC Housing Management Commission and the Provincial Rental Housing Corporation. Social housing debt includes public-private partnership obligations of $82 million for the six months ended September 30, 2017 and $78 million for the six months ended September 30, 2018.
7 Includes service delivery agencies, student loan guarantees, loan guarantees to agricultural producers, guarantees issued under economic development and home mortgage assistance programs and loan guarantee provisions.
8 Joint ventures of the Columbia Power Corporation and Columbia Basin Trust.
Second Quarterly Report 2018/19
27
Updated Financial Forecast
Table 1.15 2018/19 Statement of Financial Position
| | Actual | | Year-to-Date | | Forecast | |
| | March 31, | | September 30, | | March 31, | |
($ millions) | | 2018 | | 2018 | | 2019 | |
Financial assets | | | | | | | |
Cash and temporary investments | | 3,440 | | 3,609 | | 2,386 | |
Other financial assets | | 11,650 | | 11,880 | | 12,453 | |
Sinking funds | | 1,348 | | 1,292 | | 724 | |
Investments in commercial Crown corporations: | | | | | | | |
Retained earnings | | 6,128 | | 5,777 | | 6,220 | |
Recoverable capital loans | | 20,534 | | 22,501 | | 22,425 | |
| | 26,662 | | 28,278 | | 28,645 | |
| | 43,100 | | 45,059 | | 44,208 | |
Liabilities | | | | | | | |
Accounts payable and accrued liabilities | | 9,670 | | 8,815 | | 10,103 | |
Deferred revenue | | 9,928 | | 11,544 | | 10,466 | |
Debt: | | | | | | | |
Taxpayer-supported debt | | 43,607 | | 42,032 | | 42,431 | |
Self-supported debt | | 21,312 | | 23,268 | | 23,291 | |
Forecast allowance | | — | | — | | 950 | |
Total provincial debt | | 64,919 | | 65,300 | | 66,672 | |
Add: debt offset by sinking funds | | 1,348 | | 1,292 | | 724 | |
Less: guarantees and non-guaranteed debt | | (896 | ) | (887 | ) | (873 | ) |
Financial statement debt | | 65,371 | | 65,705 | | 66,523 | |
| | 84,969 | | 86,064 | | 87,092 | |
Net liabilities | | (41,869 | ) | (41,005 | ) | (42,884 | ) |
Capital and other non-financial assets | | | | | | | |
Tangible capital assets | | 45,837 | | 46,514 | | 48,622 | |
Other non-financial assets | | 2,778 | | 2,771 | | 2,556 | |
| | 48,615 | | 49,285 | | 51,178 | |
Accumulated surplus | | 6,746 | | 8,280 | | 8,294 | |
Changes in Financial Position | | | | | | | |
| | | | | | | |
| | | | Year-to-Date | | Forecast | |
| | | | September 30, | | March 31, | |
($ millions) | | | | 2018 | | 2019 | |
| | | | | | | |
(Surplus) deficit for the period | | | | (1,397 | ) | (1,350 | ) |
Comprehensive income (increase) decrease | | | | (137 | ) | (198 | ) |
(Increase) decrease in accumulated surplus | | | | (1,534 | ) | (1,548 | ) |
Capital and other non-financial asset changes: | | | | | | | |
Increase in taxpayer-supported capital investments | | | | 1,797 | | 5,177 | |
Less: amortization and other accounting changes | | | | (1,120 | ) | (2,392 | ) |
Change in net capital assets | | | | 677 | | 2,785 | |
Increase (decrease) in other non-financial assets | | | | (7 | ) | (222 | ) |
| | | | 670 | | 2,563 | |
Increase (decrease) in net liabilities | | | | (864 | ) | 1,015 | |
Investment and working capital changes: | | | | | | | |
Increase (decrease) in cash and temporary investments | | | | 169 | | (1,054 | ) |
Increase in total investment in commercial Crown corporations: | | | | | | | |
Increase (decrease) in retained earnings | | | | (351 | ) | 92 | |
Self-supported capital investments | | | | 2,604 | | 4,061 | |
Less: loan repayments and other accounting changes | | | | (637 | ) | (2,170 | ) |
| | | | 1,616 | | 1,983 | |
Other working capital changes | | | | (587 | ) | (792 | ) |
| | | | 1,198 | | 137 | |
Increase (decrease) in financial statement debt | | | | 334 | | 1,152 | |
(Increase) decrease in sinking fund debt | | | | 56 | | 624 | |
Increase (decrease) in guarantees and non-guaranteed debt | | | | (9 | ) | (23 | ) |
Increase (decrease) in total provincial debt | | | | 381 | | 1,753 | |
Second Quarterly Report 2018/19
28
PART TWO — ECONOMIC REVIEW AND OUTLOOK 1 | | |
| | |
2018/19 Second Quarterly Report | | November 26, 2018 |
Summary
In the First Quarterly Report, the Ministry of Finance (Ministry) forecast British Columbia’s economy to grow by 2.2 per cent in 2018 and 1.8 per cent in 2019. The private sector outlook for 2018 has softened marginally and the outlook for 2019 has strengthened since that time. The Ministry’s forecast for BC remains prudent in both years compared to the current private sector outlook.
Risks to BC’s economic outlook are weighted on the downside and include uncertainty regarding global trade policy, as well as ongoing economic challenges in Asia and the euro zone. There are additional risks related to monetary policy tightening and the volatility associated with commodity prices and the exchange rate outlook.
British Columbia Outlook — Comparison to Private Sector Forecasts
Private sector projections for BC’s near-term economic growth have generally improved over the last few months. At the time of the First Quarterly Report, an average of six private sector forecasters (a subset of the Economic Forecast Council) anticipated that BC’s real GDP would expand by 2.4 per cent in 2018 and 2.0 per cent in 2019. Since that time, there have been developments regarding the United States-Mexico-Canada Agreement and the LNG Canada project. As of November 9, 2018, the private sector average forecast was 2.3 per cent for 2018 and 2.4 per cent for 2019. As such, BC is expected to rank third among provinces for real GDP growth in 2018, and first in 2019. The Ministry’s forecast from the First Quarterly Report for BC economic growth of 2.2 per cent in 2018 and 1.8 per cent in 2019 remains prudent compared to the current average private sector outlook.
Chart 2.1 Ministry’s Outlook for BC Prudent Compared to Private Sector
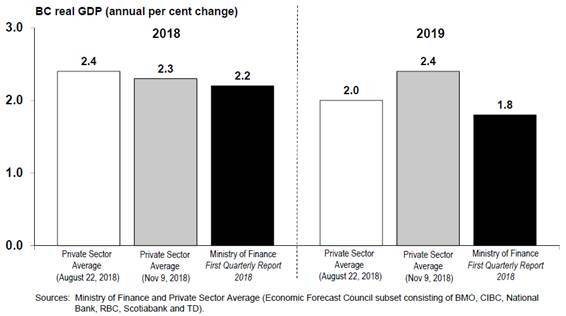
1 Reflects information available as of November 9, 2018, unless otherwise indicated.
Second Quarterly Report 2018/19
Economic Review and Outlook
British Columbia Economic Activity
Most indicators of BC’s economic performance in 2018 show positive growth in domestic activity relative to the levels seen in the same period of 2017 (as illustrated in Table 2.1).
Table 2.1 British Columbia Economic Indicators
| | | | | | Year-to-Date |
| | Apr. to Jun. 2018 | | Jul. to Sep. 2018 | | Jan. to Sep. 2018 |
| | change from | | change from | | change from |
All data seasonally adjusted | | Jan. to Mar. 2018 | | Apr. to Jun. 2018 | | Jan. to Sep. 2017 |
| | Per cent change | | Per cent change | | Per cent change |
Employment | | -0.5 | | +0.8 | | +0.8 |
Manufacturing shipments1 | | +5.4 | | +0.9 | | +9.7 |
Exports | | +5.4 | | +0.4 | | +7.4 |
Retail sales1 | | +1.5 | | -1.4 | | +3.3 |
Housing starts | | -4.8 | | -3.0 | | +0.0 |
Non-residential building permits | | -23.0 | | +56.5 | | +17.8 |
1 Data to August
Labour Market
Labour market activity in BC has eased somewhat from the very strong growth observed in recent years, partially reflecting constraints to labour supply. Overall, employment increased by 0.9 per cent (or around 22,600 net new jobs) year-to-date to October 2018, compared to the same period last year, as job gains were observed primarily in the public sector and among the self-employed. Meanwhile, a year-to-date gain of around 25,200 full-time jobs offset a loss of around 2,700 part-time jobs. Total employment in BC is currently close to an all-time high.
Chart 2.2 BC Employment
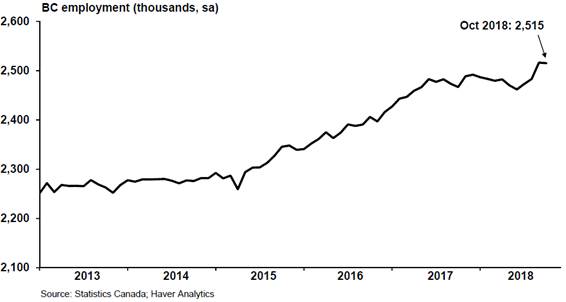
Second Quarterly Report 2018/19
30
Economic Review and Outlook
So far this year, notable employment gains were observed in the health care and social assistance sector (+22,900 jobs), the construction industry (+10,800 jobs) and the professional, scientific and technical services sector (+10,400 jobs). Meanwhile, the largest declines occurred in the information, culture and recreation sector (-9,900 jobs), the transportation and warehousing sector (-5,900 jobs) and the finance, insurance, real estate, rental and leasing sector (-5,100 jobs), compared to the January to October period of 2017.
BC’s monthly unemployment rate continues to trend below the national average and has ranked the lowest among provinces since August 2017. Year-to-date to October 2018, BC’s unemployment rate averaged 4.8 per cent, which is 0.4 percentage points below its average during the same period last year. This decline largely reflects constrained labour supply in the province this year. The size of BC’s labour force grew by just 0.5 per cent on a year-to-date basis, following strong gains from mid-2015 to mid-2017. The slow growth of BC’s labour force is contributing to hiring challenges, as BC’s job vacancy rate has consistently been one of the highest among provinces since the second quarter of 2015. Tight labour market conditions are supporting an acceleration of wage growth so far this year in BC, following two years of tepid growth.
Consumer Spending and Housing
BC retail sales rose 3.3 per cent during the first eight months of 2018 compared to the same period of 2017, building on the strong growth observed in recent years, albeit at a more gradual pace. Stable consumer demand and relatively low interest rates continued to support broad-based gains across sectors, led by year-to-date increases in sales at clothing and clothing accessories stores (+10.0 per cent), building material and garden equipment and supplies dealers (+7.9 per cent) and gasoline stations (+6.1 per cent). Among other factors, retail sales have been supported by an uptick in wage growth and improved consumer confidence. Consumer confidence in BC continues to trend above the national average, registering at 128.7 on average over the first nine months of 2018, up 4.1 points compared to the same period last year.
Chart 2.3 BC Retail Sales
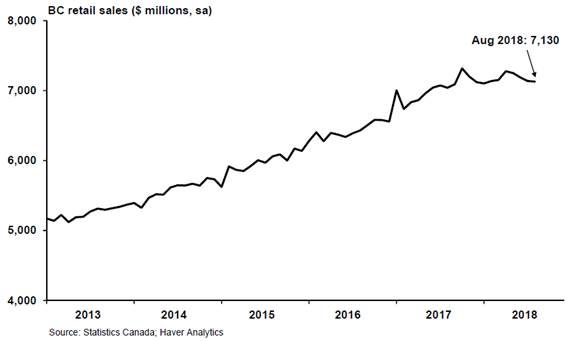
Second Quarterly Report 2018/19
31
Economic Review and Outlook
BC home building activity increased significantly over the past two years, supported by strong underlying fundamentals, as builders responded to the tight supply of housing stock. Notably in 2017, new home construction in the province reached its highest annual level on record dating back to 1955. On a year-to-date basis, the level of BC housing starts averaged 39,888 annualized units (well above the historical average), down 5.8 per cent compared to the elevated levels observed during the January to October period of 2017. Multiple-unit housing starts grew on a year-to-date basis, while single-unit housing starts decreased. The value of residential building permits, a leading indicator of new home construction, rose 16.6 per cent year-to-date to September 2018 due to strength in the multiple-unit segment of the market, while permits in the single-unit segment declined compared to the first nine months of 2017.
In comparison, the value of non-residential building permits increased by 17.8 per cent year-to-date to September compared to the same period in 2017. Permits issued for commercial (+32.1 per cent) and industrial (+10.5 per cent) buildings advanced year-to-date, while institutional and government permits (-9.0 per cent) declined relative to the same period last year.
Chart 2.4 BC Housing Starts

Following an extended period of elevated activity, BC’s home sales market is moderating in line with historical levels. Most regions across the province continue to trend toward balanced conditions, evidenced by stabilizing sales-to-active listings ratios. Several factors are contributing to this transition, including the implementation of provincial and federal policy measures alongside gradually increasing interest rates.
The number of BC home sales decreased in the first six months of 2018, starting with a 12.9 per cent decline in January and a 13.4 per cent decline in February. While the downward trend in home sales continued through the first half of this year, the rate of decline has eased and reversed slightly in recent months as housing markets across the province adjust to the various policy measures. Overall, year-to-date to September 2018, BC home sales declined across the province by 21.3 per cent compared to the same period of 2017.
Second Quarterly Report 2018/19
32
Economic Review and Outlook
Chart 2.5 BC Home Sales and Price
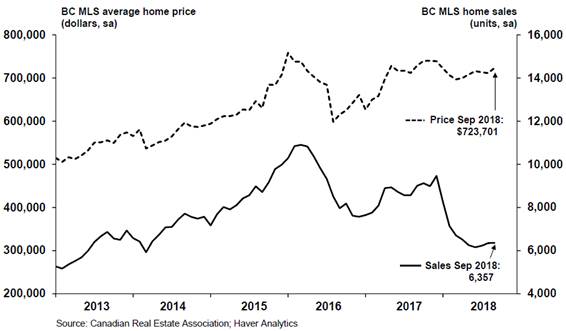
Tight inventory conditions continue to support home prices across most regions in the province. As such, the average home price in BC increased by 2.6 per cent year-to-date to September 2018 compared to the same period of 2017. There has been modest price growth year-to-date to September 2018, but recent data has shown signs of price declines for single family detached homes, townhomes and apartments in several markets, including Greater Vancouver and the Fraser Valley.
External Trade and Commodity Markets
Since mid-2016, BC exports have demonstrated resiliency despite ongoing global uncertainty and trade tensions, highlighting the province’s diverse range of exportable goods and expansive base of trading partners. Year-to-date to September 2018, the value of BC merchandise exports increased 7.4 per cent compared to the same period of 2017. Year-to-date gains were relatively broad-based, with notable advances in forestry products and building and packaging materials (+10.3 per cent) and metal and non-metallic mineral products (+14.5 per cent) compared to the January to September period of 2017. Meanwhile, energy exports fell 1.1 per cent, primarily due to weaker exports of natural gas (-19.0 per cent). The value of softwood lumber exports increased 3.5 per cent year-to-date to September, despite a recent steep decline in lumber prices.
Merchandise exports to non-US destinations grew by 10.7 per cent on a year-to-date basis and accounted for about half (50.1 per cent) of BC’s total goods exports. Total goods exports to the US increased by 4.2 per cent compared to the first nine months of 2017.
BC’s manufacturing shipments have been a source of strength so far this year, advancing by 9.7 per cent year-to-date to August 2018 compared to the same period of 2017. Gains were observed across most segments, with notable increases in the shipments of wood products (+10.0 per cent), paper (+25.1 per cent) and fabricated metal products (+42.4 per cent).
So far in 2018, steady global demand has supported overall increases in commodity prices with the exception of natural gas, silver and more recently lumber. The price of Western spruce-pine-fir (SPF) 2X4 lumber has decreased from the elevated price levels
Second Quarterly Report 2018/19
33
Economic Review and Outlook
Chart 2.6 BC Exports
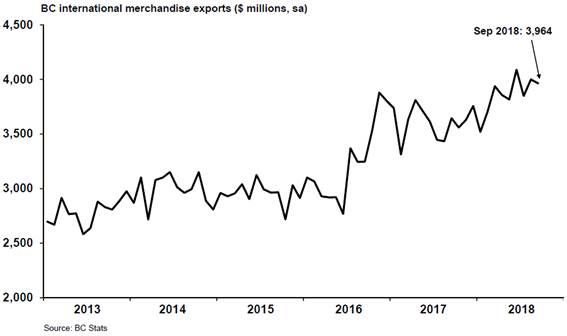
seen in the first half of 2018, declining from a high of $642 US/000 board feet in June to $358 US/000 board feet in October due to increases in supply and transportation capacity, as well as a moderation in US demand. Despite the steep decline, lumber prices have averaged $527 US/000 board feet during the January to October period of 2018, up 33.9 per cent from the same period of last year. The price of pulp averaged $1,178 US/tonne during the first ten months of 2018, an increase of 34.2 per cent compared to the same period of 2017.
The West Texas Intermediate (WTI) crude oil price has gradually increased since February 2016, supported by robust global demand alongside some supply constraints. So far this year, the WTI daily oil price averaged $67.35 US/barrel, up 36.0 per cent compared to the January to October period of 2017. In contrast, the plant inlet price of natural gas has continued to fall, weakened by a combination of oversupply and tepid demand. Plant inlet prices averaged just $0.64 C/GJ year-to-date to September 2018, down 49.0 per cent from the same period of 2017. After falling to near-record lows in mid-2018, the price of natural gas has increased to around $0.56 C/GJ at the end of the third quarter of 2018.
Metal prices have generally continued to strengthen, consistent with the broader upward trend in commodity prices. During the first ten months of 2018, prices for copper, zinc and molybdenum all increased compared to the same period of 2017, while the price of silver and lead declined. Over the same period, the price of metallurgical coal increased by 6.0 per cent.
Demographics
BC’s population on July 1, 2018 was 4.99 million people, up 1.4 per cent from the same date in 2017. On a net basis, during the January to June period of 2018, the province welcomed 35,570 new immigrants, an increase of 5.7 per cent compared to the same period of 2017. Over 80 per cent of these new migrants relocated to BC from other countries. Net interprovincial migration decreased 47.5 per cent in the first half of 2018 compared to the first half of 2017. However, BC’s net interprovincial migration picked up in the second quarter of 2018, following three consecutive quarters of tepid interprovincial migration.
Second Quarterly Report 2018/19
34
Economic Review and Outlook
Inflation
Since September 2015, the rate of inflation in BC has been above the national average, reflecting broad-based increases in consumer prices across segments. BC’s inflation rate was 2.5 per cent in September 2018 and has registered 2.5 per cent or higher in eight of nine months in 2018. Year-to-date to September 2018, consumer prices rose 2.7 per cent compared to the same period of 2017, boosted by notable increases in prices for energy (particularly gasoline), internet access services, and alcoholic beverages and tobacco products.
Chart 2.7 BC Inflation
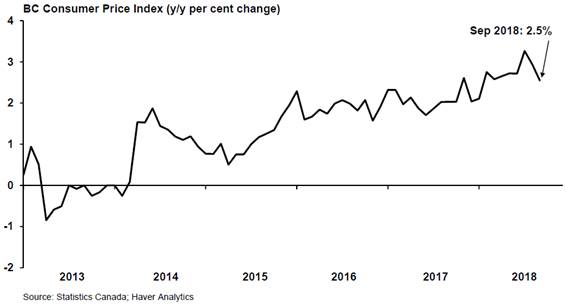
Risks to the Economic Outlook
The main downside risks to BC’s current economic outlook include the following:
· uncertainty regarding global trade policy, including tariffs and the softwood lumber dispute;
· potential for further monetary policy tightening to increase the cost of borrowing and dampen economic momentum;
· potential for a slowdown in domestic economic activity;
· potential for slower global economic activity, particularly in Asia, resulting in weaker demand for BC’s commodity exports;
· the risk of disruption to Europe’s economic growth as it faces the challenges of the UK exiting the European Union and elevated sovereign debt; and
· exchange rate and commodity price volatility.
Second Quarterly Report 2018/19
35
Economic Review and Outlook
External Outlook
United States
The US experienced strong economic growth of 4.2 per cent annualized in the April to June quarter of 2018, likely reflecting a temporary boost from substantial fiscal stimulus, as well as an increase in exports in advance of the implementation of tariffs in July 2018. Advance (i.e. first) estimates indicate that US economic growth slowed to 3.5 per cent in the third quarter of 2018. Growth in the July to September quarter reflects increased consumer spending and inventories. However, declines in residential investment, net exports and a slowdown in non-residential investment softened economic growth compared to the second quarter of 2018. Year-to-date through the first three quarters of 2018, US real GDP is 2.8 per cent higher than it was during the same period of 2017.
Chart 2.8 US Economic Growth
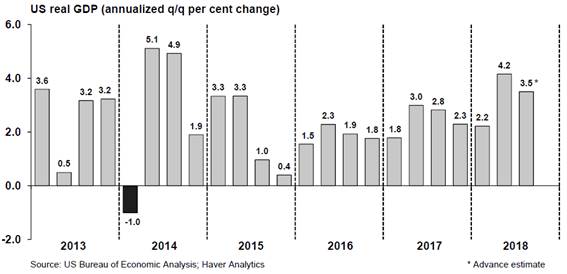
The US economy has added jobs every month for eight consecutive years, and in the first ten months of 2018, US employment increased, on average, by around 213,000 jobs each month. Year-to-date to October 2018, US employment rose 1.6 per cent compared to the same period of 2017. The US unemployment rate has trended downward since October 2009 and is currently near levels not observed since the late 1960s. The US unemployment rate averaged 3.9 per cent year-to-date to October, down 0.5 percentage points compared to the first ten months of last year.
US housing construction continued to increase through the first nine months of 2018, despite some moderation in recent months. Overall, US housing starts averaged 1.27 million annualized units year-to-date to September 2018 and are up 6.2 per cent compared to the same period of 2017. On a year-to-date basis, residential building permits rose 3.5 per cent compared to the January to September period of 2017. Home sales activity has been mixed so far this year as new home sales advanced by 3.4 per cent year-to-date, despite declines in five of the last six months, while existing home sales declined by 2.2 per cent compared to the first nine months of 2017. New home prices increased 1.7 per cent year-to-date to September 2018, while existing home prices are up 5.0 per cent compared to the first nine months of 2017.
Second Quarterly Report 2018/19
36
Economic Review and Outlook
Chart 2.9 US Housing Starts
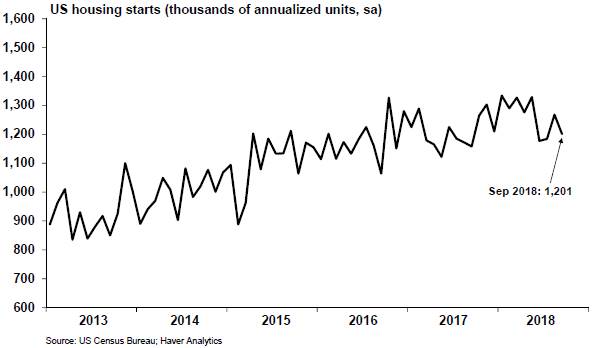
US retail sales increased by 5.4 per cent year-to-date to September 2018 compared to the same period last year. Meanwhile, a strong economy and robust job growth have pushed US consumer confidence to 137.9 in October 2018, its highest reading since September 2000. The Conference Board’s index of consumer confidence averaged 129.9 year-to-date to October 2018, improving upon last year’s average of 119.4 during the first ten months of 2017.
The October Consensus survey projects US economic growth of 2.9 per cent in 2018 and 2.6 per cent in 2019, unchanged from the August Consensus survey, which was cited in the First Quarterly Report.
Chart 2.10 Consensus Outlook for the US in 2018
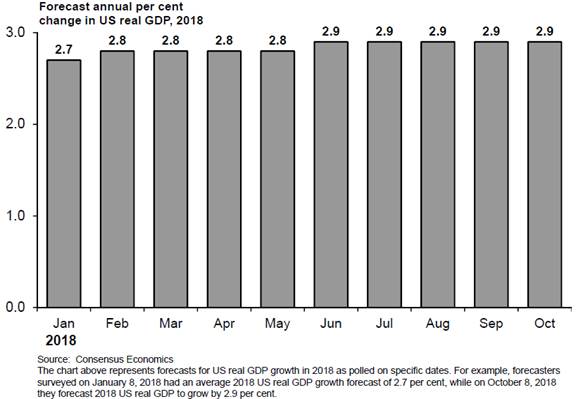
Second Quarterly Report 2018/19
37
Economic Review and Outlook
Canada
After losing momentum since mid-2017, Canadian real GDP growth accelerated to an annualized 2.9 per cent in the April to June period of 2018 following 1.4 per cent annualized growth in the first quarter of 2018. The primary driver of the second quarter expansion was a strong gain in export volumes, the largest since the second quarter of 2014, with energy products leading export growth. The pace of household consumption growth slowed through most of 2017 and into the first quarter of 2018 alongside rising interest rates and a moderation in the housing sector. Business investment and exports are expected to experience some support after the announcement of the United States-Mexico-Canada Agreement. On a year-to-date basis through the first two quarters of 2018, the Canadian economy grew 2.1 per cent compared to the same period of last year.
Chart 2.11 Canadian Economic Growth
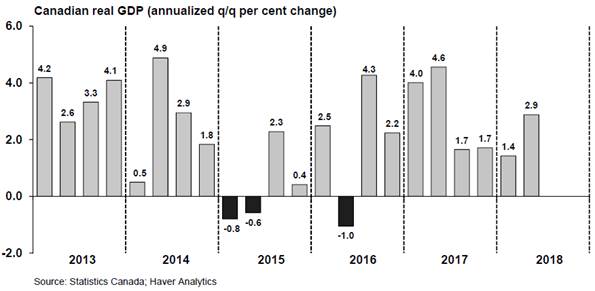
In general, domestic economic activity has been moderate this year. Employment increased by 1.3 per cent year-to-date to October 2018 alongside a persistently low unemployment rate, which averaged 5.9 per cent during the first ten months of this year. So far this year, Canadian housing starts have averaged about 212,700 annualized units to October, down 2.3 per cent compared to the first ten months of last year after seeing declines in six of the last eight months. National home sales fell by 10.5 per cent year-to-date to September 2018, following the implementation of provincial and federal policy measures alongside gradually increasing interest rates. Meanwhile, the average Canadian home price was $485,763 year-to-date to September 2018, a decline of 3.6 per cent compared to the same period of 2017. National retail sales increased by 3.3 per cent year-to-date to August 2018, slower than the pace observed over the past two years.
The value of Canadian merchandise exports increased 7.7 per cent year-to-date to September 2018. Notable year-to-date growth in exports was observed among energy products (+20.3 per cent) and forestry products and building and packaging materials (+11.3 per cent), which worked to offset year-to-date declines in motor vehicles and parts (-4.7 per cent). Meanwhile, shipments of Canadian manufactured goods advanced 6.0 per cent year-to-date to August 2018, led by notable gains in shipments of petroleum and coal products (+19.5 per cent), fabricated metal products (+12.3 per cent) and primary metal products (+8.6 per cent) compared to the same period of 2017.
Second Quarterly Report 2018/19
38
Economic Review and Outlook
Chart 2.12 Consensus Outlook for Canada in 2018

The Consensus outlook for the Canadian economy in 2018 has been relatively steady since January 2018. As of October 2018, the Consensus forecast for Canadian real GDP growth for 2018 remains unchanged from the August Consensus at 2.1 per cent, while the forecast for 2019 has increased 0.1 percentage point to 2.0 per cent.
Asia
After growing by 6.9 per cent in 2018, China’s economy has eased to 6.7 per cent growth in the first three quarters of 2018 compared to the same period in 2017. Fixed investment has been slowing since early 2013, reflecting the economy’s transition away from investment and toward consumer spending. However, in July 2018 policy makers announced a range of fiscal policy measures to address signs of slower economic growth and the risks associated with escalating trade tensions. In addition, the People’s Bank of China released over 500 billion yuan ($74 billion US) into the financial system, targeted to alleviate some funding pressures on the private sector. In late September 2018, the Chinese government commented on the ongoing trade dispute with the US, emphasizing the mutual benefits of trade and economic relations between the two countries.
Japan’s economy rebounded from a contraction in the first quarter of 2018 and expanded at an annualized pace of 3.0 per cent in the April to June quarter of 2018. Advances in private consumption supported the quarterly improvement, along with stronger growth in business investment. Meanwhile, export growth was outpaced by a rise in imports, weighing on real GDP growth. Escalating trade tensions with the US are a continued risk for the Japanese export sector. On the upside, Japan signed an agreement with the European Union in July 2018 to cut trade barriers. Furthermore, monetary policy in Japan remains highly accommodative in recognition of persistently low inflation, weak historical growth and ongoing risks to the economic outlook.
Second Quarterly Report 2018/19
39
Economic Review and Outlook
From August to October, the Consensus forecast for China’s real GDP growth remained unchanged for both 2018 and 2019 at 6.6 per cent and 6.3 per cent, respectively. Over the same period, the Consensus forecast for economic growth in Japan remained unchanged at 1.1 per cent this year and 1.2 per cent in the following year.
Europe
After experiencing stable, broad-based growth in the first two quarters of 2018, albeit at a slower pace than in 2017, euro zone real GDP growth slowed to an annualized 0.6 per cent in the third quarter of 2018. Concerns over global tariffs continues to weigh on business sentiment, which has softened since the beginning of this year. Additional economic headwind is caused by increasing oil prices, ongoing fiscal spending concerns, and dampened consumer confidence as the UK negotiates its exit from the European Union. Meanwhile, employment continued to strengthen in most euro zone countries, with increases across most industries.
Monetary policy in the euro zone remains highly accommodative. At its most recent meeting in October the European Central Bank left its key interest rates unchanged and reiterated that monetary policy stimulus is still needed to support domestic prices. Such support is expected to continue by way of net asset purchases under the asset purchase program until the end of 2018.
In its October publication, the Consensus forecast for real GDP growth in the euro zone was 2.0 per cent in 2018 and 1.8 per cent in 2019, down 0.1 percentage point in 2018 and unchanged in 2019 compared to the August publication.
Financial Markets
Interest Rates
On October 24, 2018, the Bank of Canada raised its target for the overnight interest rate to 1.75 per cent, noting that Canada’s economy continues to operate close to its capacity and the composition of growth is more balanced. The overnight target rate has increased five times starting in July 2017, moving up by 0.25 percentage point increments. Consumer interest rates have risen accordingly. Since July 2017, the benchmark posted rate on a five-year fixed mortgage from the chartered banks has gradually increased from 4.64 per cent to 5.34 per cent, the highest level since April 2012. The Bank of Canada outlined its expectation that the policy interest rate will need to rise to a neutral stance to achieve the inflation target of 2.0 per cent. The neutral range is currently estimated by the Bank of Canada to be between 2.5 per cent to 3.5 per cent.
Beginning in December 2016, the US Federal Reserve (Fed) has increased its federal funds rate seven times, to reach a target range of 2.00 per cent to 2.25 per cent on September 26, 2018. The Fed cited strong economic activity, job growth and a low unemployment rate as reasons for the September increase. In November 2018, the Fed chose to leave its key rate unchanged, but reiterated its expectation for further gradual interest rate hikes over the medium-term.
Second Quarterly Report 2018/19
40
Economic Review and Outlook
Chart 2.13 Interest Rate Forecasts
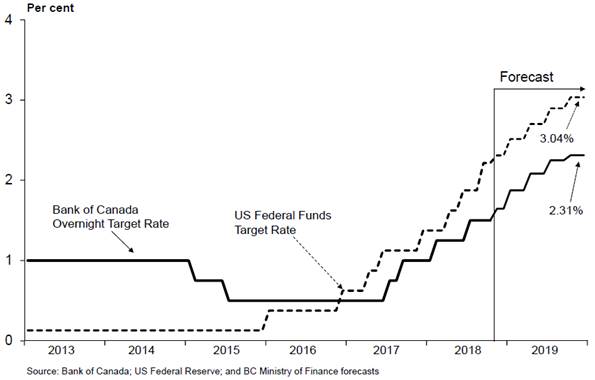
As of October 12, 2018, private sector forecasters project that the Canadian three-month treasury bill rate will average 1.4 per cent in 2018 and 2.1 per cent in 2019. The same forecasters project the ten-year Government of Canada bond rate to average 2.3 per cent in 2018 and 2.7 per cent in the following year.
Table 2.2 Private Sector Canadian Interest Rate Forecasts
| | 3-month Treasury Bill | | 10-year Government Bond | |
Average annual interest rate (per cent) | | 2018 | | 2019 | | 2018 | | 2019 | |
BMO | | 1.4 | | 2.3 | | 2.3 | | 2.7 | |
CIBC | | 1.4 | | 1.9 | | 2.3 | | 2.7 | |
National Bank | | 1.4 | | 2.3 | | 2.3 | | 2.9 | |
RBC | | 1.4 | | 2.0 | | 2.3 | | 2.8 | |
Scotiabank | | 1.4 | | 2.3 | | 2.3 | | 2.6 | |
TD | | 1.4 | | 2.0 | | 2.3 | | 2.6 | |
Average (as of October 12 , 2018) | | 1.4 | | 2.1 | | 2.3 | | 2.7 | |
Exchange Rate
After beginning the year at 79.9 US cents, the value of the Canadian dollar has depreciated somewhat relative to the US dollar since February, despite some support from the United States-Mexico-Canada Agreement announcement on September 30, 2018. The decline primarily reflects the broad-based appreciation of the US dollar alongside concerns associated with global trade tensions. Overall, the loonie averaged 77.6 US cents during the first ten months of 2018, up from the average of 76.8 US cents observed during the same period of 2017.
Second Quarterly Report 2018/19
41
Economic Review and Outlook
Chart 2.14 Private Sector Expectations for the Canadian Dollar
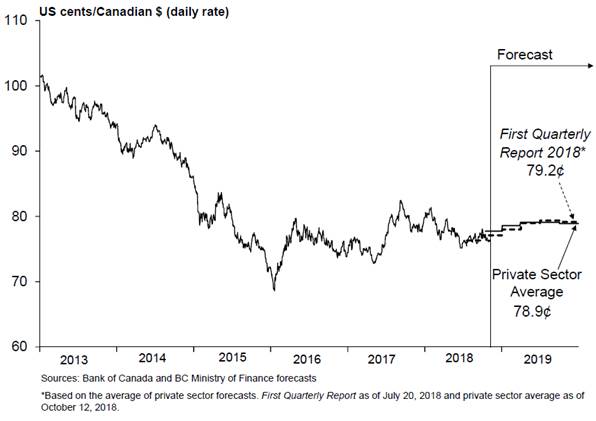
As of October 12, 2018, an average of six private sector forecasts calls for the Canadian dollar to average 77.7 US cents in 2018 and 78.9 US cents in 2019.
Table 2.3 Private Sector Exchange Rate Forecasts
Average annual exchange rate (US cents/Can $) | | 2018 | | 2019 | |
BMO | | 77.7 | | 79.3 | |
CIBC | | 77.7 | | 76.6 | |
National Bank | | 77.8 | | 79.4 | |
RBC | | 77.6 | | 78.2 | |
Scotiabank | | 77.7 | | 81.0 | |
TD | | 77.7 | | 78.8 | |
Average (as of October 12, 2018) | | 77.7 | | 78.9 | |
Second Quarterly Report 2018/19
42
Economic Review and Outlook
Provincial Economic Accounts Update
Statistics Canada released its estimates of provincial GDP for 2017 on November 8, 2018.
British Columbia’s real GDP increased by 3.8 per cent in 2017, a faster pace than the previous year. BC registered the second strongest growth rate among provinces last year, behind Alberta (4.4 per cent) but ahead of the third and fourth strongest provinces, Prince Edward Island (3.5 per cent) and Manitoba (3.2 per cent), respectively. Overall, the Canadian economy grew by 3.0 per cent in 2017.
Chart 1 — Real GDP in Canadian provinces
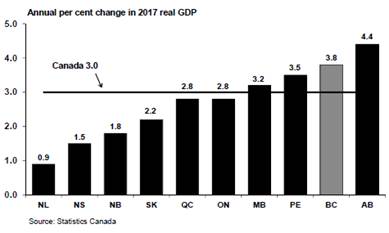
Most of BC’s main real GDP expenditure categories experienced positive growth in 2017, led by consumer spending. Household final consumption expenditures increased by 4.6 per cent in 2017, after rising 3.4 per cent in 2016. Investment in residential structures, on the other hand, edged down by 0.4 per cent after several years of strong growth. Overall gross fixed capital formation, however, still grew by 9.2 per cent primarily due to rising investment in non-residential structures (29.7 per cent) and general governments gross fixed capital formation (23.6 per cent). Government spending on goods and services (Federal, Provincial, Local and Aboriginal) rose 3.0 per cent in 2017, following an increase of 1.7 per cent in the previous year. Exports of goods and services increased by 3.4 per cent in 2017, following a gain of 3.8 per cent the previous year. Meanwhile, the pace of growth accelerated for imports of goods and services, which increased by 8.0 per cent last year, after rising 4.1 per cent in 2016.
Real GDP
Annual growth in BC’s real GDP from 2014 to 2017 is illustrated in Chart 2. The latest data incorporate historical revisions back to 2015 and a new base year of 2012 was adopted for volume estimates (replacing the previous 2007 base year). The level of BC’s 2016 real GDP is now estimated to be $247.4 billion, 2.7 per cent higher than the previous estimate of $240.8 billion, due to the cumulative effect of the revisions.
Chart 2 — BC real GDP

Nominal GDP
Chart 3 depicts BC’s nominal GDP in recent years (in levels). Nominal GDP increased by $18.2 billion (or 6.9 per cent) in 2017, after growing by $14.9 billion (or 6.0 per cent) the previous year. Statistics Canada’s latest release also incorporated historical revisions to nominal GDP, with the level of BC’s 2016 nominal GDP now estimated to be $264.0 billion, 0.1 per cent higher than the previous estimate of $263.7 billion, due to the cumulative effect of the revisions.
Chart 3 — BC nominal GDP
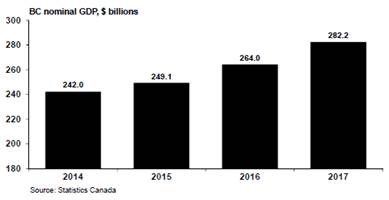
Second Quarterly Report 2018/19
43