BUDGET AND FISCAL PLAN
2019/20 – 2021/22
February 19, 2019

National Library of Canada Cataloguing in Publication Data
British Columbia.
Budget and fiscal plan. — 2002/03/2004/05-
Annual
Also available on the Internet.
Continues: British Columbia. Ministry of Finance and
Corporate Relations. Budget … reports. ISSN 1207-5841
ISSN 1705-6071 = Budget and fiscal plan — British Columbia.
1. Budget — British Columbia — Periodicals. 2. British
Columbia — Appropriations and expenditures — Periodicals.
I. British Columbia. Ministry of Finance. II. Title.
HJ12.B742 352.48’09711’05 C2003-960048-3
BUDGET AND FISCAL PLAN 2019/20 to 2021/22
February 19, 2019 | TABLE OF CONTENTS |
Attestation by the Secretary to Treasury Board | |
| |
Summary | 1 |
| |
Part 1: Three Year Fiscal Plan | |
Introduction | 7 |
Expense | 8 |
| Consolidated Revenue Fund Spending | 8 |
| | Making Life More Affordable | 8 |
| | Enhancing Services that People Count On | 13 |
| | Building a Strong and Sustainable Economy | 16 |
| Analysis for Equity and Fairness (GBA+) | 24 |
| BC Public Service | 24 |
| Recovered Expenses | 26 |
| Operating Transfers | 26 |
| Service Delivery Agency Spending | 27 |
Revenue | 30 |
| Major Revenue Sources | 32 |
Capital Spending | 38 |
| Taxpayer-Supported Capital Spending | 38 |
| Self-Supported Capital Spending | 45 |
| Projects Over $50 Million | 46 |
Provincial Debt | 51 |
Risks to the Fiscal Plan | 54 |
| |
Tables: | | | |
| 1.1 | Three Year Fiscal Plan | 7 |
| 1.2 | Creating More Opportunities for People to Get Ahead | 8 |
| 1.3 | BC Child Opportunity Benefit | 8 |
| 1.4 | Homes for B.C. | 11 |
| 1.5 | Investing in Health Care and Education | 14 |
| 1.6 | Enhancing Supports | 15 |
| 1.7 | Improving Access to Justice and Public Safety | 15 |
| 1.8 | CleanBC - Operating, Capital and Contingencies Allocations | 17 |
| 1.9 | Reconciliation with First Nations | 19 |
| 1.10 | Securing Resources for Tomorrow | 19 |
| 1.11 | Investing in Higher Education and the Workforce | 20 |
| 1.12 | Investing in Communities | 22 |
BUDGET AND FISCAL PLAN - 2019/20 to 2021/22
i
TABLE OF CONTENTS
| 1.13 | Sustainable Economic Development | 23 |
| 1.14 | Revenue by Source | 28 |
| 1.15 | Expense by Ministry, Program and Agency | 29 |
| 1.16 | Comparison of Major Factors Underlying Revenue | 31 |
| 1.17 | Personal Income Tax Revenue | 32 |
| 1.18 | Corporate Income Tax Revenue | 32 |
| 1.19 | Sales Tax Revenue | 33 |
| 1.20 | Federal Government Contributions | 36 |
| 1.21 | Capital Spending | 38 |
| 1.22 | Provincial Transportation Investments | 44 |
| 1.23 | Capital Expenditure Projects Greater Than $50 Million | 47 |
| 1.24 | Provincial Debt Summary | 52 |
| 1.25 | Provincial Borrowing Requirements | 53 |
| 1.26 | Reconciliation of Summary Results to Provincial Debt Changes | 53 |
| 1.27 | Key Fiscal Sensitivities | 54 |
| | | |
Part 2: Tax Measures | |
Tax Measures — Supplementary Information | 60 |
Tables: | |
| 2.1 | Summary of Tax Measures | 59 |
| | | |
Part 3: British Columbia Economic Review and Outlook | |
Summary | 67 |
British Columbia Economic Activity and Outlook | 67 |
| Labour Market | 68 |
| Consumer Spending and Housing | 69 |
| Business and Government | 71 |
| External Trade and Commodity Markets | 72 |
| Demographics | 74 |
| Inflation | 74 |
Risks to the Economic Outlook | 75 |
External Outlook | 75 |
| United States | 75 |
| Canada | 78 |
| Asia | 80 |
| Europe | 80 |
Financial Markets | 81 |
| Interest Rates | 81 |
| Exchange Rate | 83 |
| | | |
Tables: | |
| 3.1 | British Columbia Economic Indicators | 68 |
| 3.2 | U.S. Real GDP Forecast: Consensus versus Ministry of Finance | 77 |
| 3.3 | Canadian Real GDP Forecast: Consensus versus Ministry of Finance | 79 |
BUDGET AND FISCAL PLAN - 2019/20 to 2021/22
ii
TABLE OF CONTENTS
| 3.4 | Private Sector Canadian Interest Rate Forecasts | 82 |
| 3.5 | Private Sector Exchange Rate Forecasts | 83 |
| 3.6.1 | Gross Domestic Product (GDP): British Columbia | 84 |
| 3.6.2 | Selected Nominal Income and Other Indicators: British Columbia | 85 |
| 3.6.3 | Labour Market Indicators: British Columbia | 85 |
| 3.6.4 | Major Economic Assumptions | 86 |
| | | |
Topic Box: | |
| The Economic Forecast Council, Budget 2019 | 87 |
| | | |
Part 4: 2018/19 Updated Financial Forecast (Third Quarterly Report) | |
Introduction | 91 |
Revenue | 93 |
Expense | 93 |
2018/19 Supplementary Estimates | 94 |
Contingencies | 95 |
Government Employment (FTEs) | 95 |
Provincial Capital Spending | 95 |
Provincial Debt | 97 |
Risks to the Fiscal Forecast | 98 |
Supplementary Schedules | 98 |
Tables: | |
| 4.1 | 2018/19 Forecast Update | 91 |
| 4.2 | 2018/19 Financial Forecast Changes | 92 |
| 4.3 | 2018/19 Supplementary Estimates | 94 |
| 4.4 | 2018/19 Capital Spending Update | 96 |
| 4.5 | 2018/19 Provincial Debt Update | 97 |
| 4.6 | 2018/19 Operating Statement | 98 |
| 4.7 | 2018/19 Revenue by Source | 99 |
| 4.8 | 2018/19 Expense by Ministry, Program and Agency | 100 |
| 4.9 | 2018/19 Expense by Function | 101 |
| 4.10 | 2018/19 Capital Spending | 102 |
| 4.11 | 2018/19 Provincial Debt | 103 |
| 4.12 | 2018/19 Statement of Financial Position | 104 |
| | | |
Appendix | 105 |
BUDGET AND FISCAL PLAN - 2019/20 to 2021/22
iii

| February 19, 2019 |
As required by Section 7(1)(d) of the Budget Transparency and Accountability Act, I confirm that Budget 2019 contains the following elements:
· Fiscal forecasts for 2019/20 to 2021/22 (provided in Part 1) and economic forecasts for 2019 to 2023 (provided in Part 3).
· A report on the advice received from the Economic Forecast Council (EFC) in November 2018 (updated in January 2019) on the economic growth outlook for British Columbia, including a range of forecasts for 2019 and 2020 (see Part 3, page 87).
· Material economic, demographic, fiscal, accounting policy and other assumptions and risks underlying Budget 2019 economic and fiscal forecasts. In particular:
· The economic forecast reflects strong, stable economic growth for British Columbia amidst ongoing global economic uncertainty. In recognition of downside risks, the economic projections assumed in Budget 2019 are prudent relative to the average of the forecasts provided by the Economic Forecast Council.
· Consistent with past practice, the economic forecast does not incorporate fiscal policy measures announced in the current budget (Budget 2019), due to the timing of decisions. These budget policy measures will be incorporated into the economic outlook in the updated forecast included in the First Quarterly Report.
· Personal and corporate income tax revenue forecasts include the preliminary 2017 income tax assessments and the corporate income tax revenue forecast is based on projections for national corporate taxable income provided by the federal government.
· Natural gas royalty forecasts continue to adopt a lower natural gas price forecast compared to the private sector average in order to maintain prudence against volatility.
· Ministry budgets include base increases for the costs arising from the fourth and final Economic Stability Dividend payable under the current Economic Stability Mandate. Budget 2019 provides ministry base budget increases over the three-year fiscal plan period to fund all ratified collective agreements reached to date under the Sustainable Services Negotiating Mandate. Budget 2019 also includes centralized funding to assist with the anticipated costs of concluding the remaining agreements consistent with the Sustainable Services Negotiating Mandate.
· The fiscal plan includes three-year financial projections for school districts, post-secondary institutions and health authorities, based on plans submitted by those entities to the Ministries of Education, Advanced Education, Skills and Training, and Health, respectively, and for the other service delivery agencies and the commercial Crown corporations.
· The financial results of the Insurance Corporation of British Columbia are a key risk to government’s fiscal plan.
· Fiscal prudence totals $1.25 billion in 2019/20, $700 million in 2020/21, and $700 million in 2021/22, being the sum of the Contingencies vote and the forecast allowance in each fiscal year. Government’s economic and fiscal prudence measures generally have resulted in government exceeding its budget targets.
To the best of my knowledge, the three-year fiscal plan contained in Budget 2019 conforms to the standards and guidelines of generally accepted accounting principles for senior governments as outlined in Note 1 of the 2017/18 Public Accounts.
I would like to recognize staff in government ministries and agencies for their contribution to this document. I would especially like to acknowledge staff in the Ministry of Finance, whose professionalism, commitment and expertise were essential to the completion of this budget and fiscal plan.
| /s/ Heather Wood |
| Heather Wood |
| Associate Deputy Minister and Secretary to Treasury Board |
BUDGET AND FISCAL PLAN - 2019/20 to 2021/22
SUMMARY | BUDGET AND FISCAL PLAN - 2019/20 to 2021/22
| | Updated | | Budget | | | | | |
| | Forecast | | Estimate | | Plan | | Plan | |
($ millions) | | 2018/19 | | 2019/20 | | 2020/21 | | 2021/22 | |
Revenue | | 56,636 | | 59,047 | | 60,038 | | 62,458 | |
Expense | | (55,762 | ) | (58,273 | ) | (59,451 | ) | (61,573 | ) |
Forecast allowance | | (500 | ) | (500 | ) | (300 | ) | (300 | ) |
Surplus | | 374 | | 274 | | 287 | | 585 | |
| | | | | | | | | |
Capital spending: | | | | | | | | | |
Taxpayer-supported capital spending | | 4,771 | | 6,340 | | 6,837 | | 6,911 | |
Self-supported capital spending | | 4,192 | | 4,274 | | 3,333 | | 3,361 | |
| | 8,963 | | 10,614 | | 10,170 | | 10,272 | |
Provincial Debt: | | | | | | | | | |
Taxpayer-supported debt | | 43,957 | | 46,384 | | 50,454 | | 53,986 | |
Self-supported debt | | 23,459 | | 25,664 | | 26,905 | | 28,090 | |
Total debt (including forecast allowance) | | 67,916 | | 72,548 | | 77,659 | | 82,376 | |
Taxpayer-supported debt to GDP ratio | | 14.9 | % | 15.0 | % | 15.7 | % | 16.1 | % |
Taxpayer-supported debt to revenue ratio | | 78.4 | % | 81.5 | % | 87.0 | % | 89.6 | % |
| | 2018 | | 2019 | | 2020 | | 2021 | |
Economic Forecast: | | | | | | | | | |
Real GDP growth | | 2.2 | % | 2.4 | % | 2.3 | % | 2.1 | % |
Nominal GDP growth | | 4.6 | % | 4.4 | % | 4.3 | % | 4.0 | % |
Making Life Better
Budget 2019 takes action to make life better for British Columbians. It includes priority investments to meet government’s three commitments to British Columbians: making life more affordable, enhancing services that people count on, and building a strong and sustainable economy that works for everyone.
Budget 2019 fulfills government’s commitment to eliminate Medical Services Plan (MSP) premiums and makes investments in key priorities: creating more opportunities for people to get ahead, CleanBC, reconciliation with First Nations, child care, housing and homelessness, and mental health services. Each year of the fiscal plan is balanced, with surpluses of $274 million in 2019/20, $287 million in 2020/21, and $585 million in 2021/22.
Making Life More Affordable
Government is launching a comprehensive $860 million investment over the fiscal plan that lays the groundwork to make sure every
BUDGET AND FISCAL PLAN - 2019/20 to 2021/22
1
SUMMARY
person can reach their full potential, with another $263 million investment in 2018/19. Budget 2019 introduces the BC Child Opportunity Benefit, income and disability assistance increases, student loan interest elimination, and other initiatives to make life better for people in British Columbia. This is in addition to fulfilling government’s commitment to eliminate MSP premiums, and investments in housing and child care.
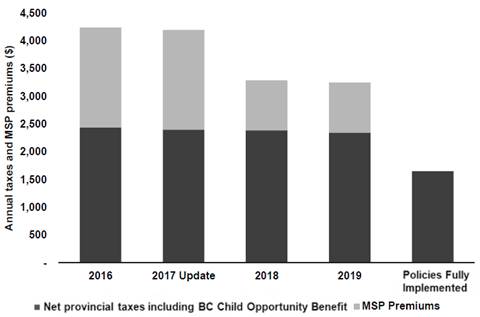
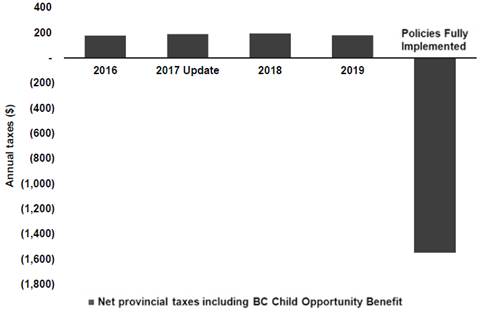
The new BC Child Opportunity Benefit will provide families with children under 18 with up to $1,600 per year for the first child, up to $2,600 per year for families with two children, and up to $3,400 per year for families with three children. In total, the benefit will provide $380 million a year for B.C. families. This new benefit, combined with the elimination of MSP premiums, will provide a significant reduction in the tax burden for lower- and middle-income families with children; a family of four earning $60,000 will see their net provincial taxes reduced by more than $2,500 per year.
Net Provincial Taxes Since Budget 2016
Family of Four Earning $60,000
Net Provincial Taxes Since Budget 2016
Family of Four Earning $30,000
Government is also eliminating interest on British Columbia student loans. This $318 million investment over fours years beginning in 2018/19 will help make post-secondary education more affordable. The typical undergraduate borrower graduates with $11,200 in British Columbia student loan debt, and will save an estimated $2,300 in interest over a 10-year repayment period.
In addition to the BC Child Opportunity Benefit, actions to address poverty include increases to income and disability assistance rates of $50 per month, for a total increase of $150 per month since Budget 2017 Update. Changes to the BC Employment Assistance Program will remove barriers to accessing assistance, such as helping clients obtain personal identification and removing restrictions on vehicle ownership.
Budget 2019 provides additional funding for housing affordability and a provincial homelessness action plan, building on the most significant provincial investment in housing ever in Budget 2018.
Services People Count On
To improve health care and patient outcomes, Budget 2019 invests $1.3 billion to enhance services for families, women and children, and coverage for additional drugs under PharmaCare. This investment also continues to support the initiatives introduced in Budget 2018, which increased access to team-based primary care and expanded seniors’ care services. To ensure British Columbians can continue to access quality health care services in the future, Budget 2019 provides $5 million to help train the health care professionals of tomorrow, including nurse practitioners, sonographers, health care assistants, and specialty nurses.
Budget 2019 also includes $74 million over three years to support new, integrated services that address mental health and addictions for children, youth and young adults, and improvements in access to quality care.
Budget 2019 invests over $550 million to ensure schools have the resources they need to support student learning. This investment will enable
BUDGET AND FISCAL PLAN - 2019/20 to 2021/22
2
SUMMARY
more teacher and education assistant hiring, which means more professionals in the classroom ensuring children have the support they need to succeed.
In addition to eliminating interest on provincial student loans, Budget 2019 invests $44 million more to help British Columbians develop the skills they need to succeed by removing barriers to access training. This investment also supports the B.C. labour force to meet the growing demands of employers and ensures that employment standards keep up with the changing needs of our labour force.
Building a Strong and Sustainable Economy
CleanBC
Through the CleanBC plan, government is reducing climate pollution by investing in cleaner transportation, energy efficient homes and buildings, clean energy strategies with Indigenous and remote communities, waste diversion and cleaner industry. Budget 2019 includes more than $679 million over the fiscal plan for CleanBC initiatives. This investment is supplemented by enhancements to the Climate Action Tax Credit totalling $223 million over three years, bringing government’s overall commitment to over $902 million.
Reconciliation with First Nations
To support Government’s commitment to reconciliation with First Nations, Budget 2019 commits to a historic revenue-sharing agreement with First Nations of B.C., with payments estimated at $297 million over three years and $3 billion over the next 25 years. This will enable First Nations to determine and invest in community priorities to support strong healthy communities and services to make life better for families.
Budget 2019 provides significant funding to support Indigenous families and children, by increasing support payments for the Extended Family Program and for foster parents caring for children.
Enhancing Business Competitiveness
B.C. is joining with the federal government to support business competitiveness in the face of ongoing global developments. B.C. will contribute over $800 million over the fiscal plan for investment incentives in capital assets, such as buildings, machinery and equipment. This will make it more attractive to invest in assets that drive business growth and free up capital that can be used to create more good, well-paying jobs for British Columbians.
Economic Outlook
An average of six private-sector forecasters expect B.C.’s economic growth to rank at the top of the provincial rankings in both 2019 and 2020.
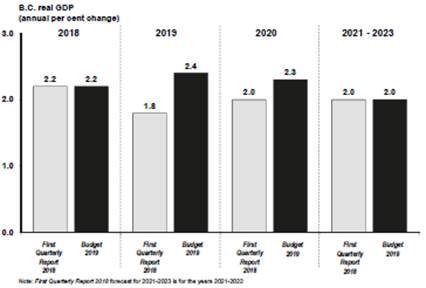
The Budget 2019 estimate for B.C. real GDP growth in 2018 remains unchanged from the projection in the First Quarterly Report 2018 at 2.2 per cent. Employment and exports performed better than expected and investment was positive, with some moderation in housing activity and consumer spending through the year. The Budget 2019 forecast for B.C. real GDP growth has increased from 1.8 per cent to 2.4 per cent in 2019 and from 2.0 per cent to 2.3 per cent in 2020, compared to the First Quarterly Report 2018. The changes partly reflect recent developments regarding the Canada-United States-Mexico Agreement (CUSMA) and the final investment decision on the LNG Canada project. The economic growth outlook for 2021 is 2.1 per cent, followed by 2.0 per cent in both 2022 and 2023, in line with previous expectations.
British Columbia’s Economic Outlook
BUDGET AND FISCAL PLAN - 2019/20 to 2021/22
3
SUMMARY
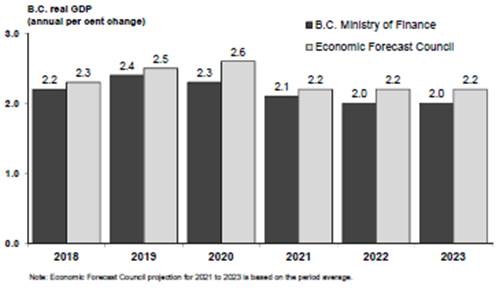
The Budget 2019 forecast for B.C. real GDP growth is below the outlook provided by the Economic Forecast Council. This is one of the levels of prudence built into the fiscal plan.
Prudent Economic Forecast
The main upside risks to the economic outlook include less domestic monetary policy tightening, a weaker Canadian dollar, and a more resilient US economy. The main downside risks include uncertainty regarding global trade policy, weakening global economic activity, lower commodity prices, as well as ongoing economic challenges in Asia and the euro zone.
Capital Investments
Budget 2019 makes new capital commitments in the health, transportation and education sectors. Taxpayer-supported infrastructure spending on hospitals, schools, post-secondary facilities, transit, and roads is forecast to be $20.1 billion, the highest level ever, over the three-year fiscal plan.
Self-supported capital spending is expected to total $11.0 billion over three years, relating primarily to power generation and transmission projects.
Debt Affordability
Debt affordability metrics have improved since Budget 2018 due to better operating results in 2017/18 and 2018/19. Capital debt requirements are partially mitigated by the elimination of the operating debt in 2018/19, which allows for government operating cash surplus to be directed towards funding capital spending.
Debt to GDP
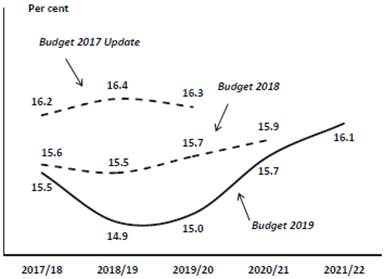
The taxpayer-supported debt-to-GDP ratio is forecast to be 16.1 per cent by 2021/22. Taxpayer-supported debt-to-revenue remains within a reasonable range over the fiscal plan period at below 90 per cent.
Debt to Revenue
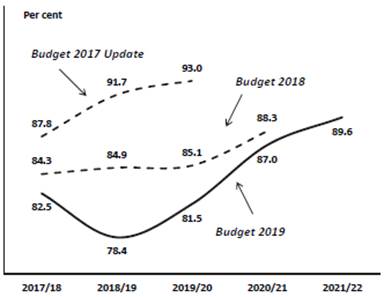
Total taxpayer-supported debt is projected to increase by $10 billion over the three-year period, reaching $54 billion by 2021/22.
Risks to the Fiscal Plan
In addition to the risks to the economic outlook, the main risks to the government’s fiscal plan include:
· financial results of the Insurance Corporation of British Columbia which may continue to reflect accident and claims cost trends observed in 2018/19;
BUDGET AND FISCAL PLAN - 2019/20 to 2021/22
4
SUMMARY
· potential changes to federal government allocations for health and social transfers and cost-sharing agreements, as well as impacts on provincial income taxes arising from federal government tax policy changes; and
· increased demands for government services, such as health care, children and family services, and income assistance.
In addition, changes in the timing of capital project spending may reduce borrowing requirements and debt needed to fund capital investments in the near term.
To mitigate the risks to the fiscal plan, government incorporates four main levels of prudence in its projections:
· government has included forecast allowances throughout the three-year period: $500 million in 2019/20, $300 million in 2020/21, and $300 million in 2021/22 to guard against volatility, including revenue changes;
· the fiscal plan includes a Contingencies vote allocation of $750 million in 2019/20, and $400 million per year in 2020/21 and 2021/22, to help manage unexpected pressures and fund priority initiatives;
· the Budget 2019 outlook for B.C.’s real GDP growth is lower than the outlook provided by the Economic Forecast Council (0.1 percentage point lower in 2019, 0.3 percentage points lower in 2020, 0.1 percentage point lower in 2021, and 0.2 percentage points lower in 2022 and 2023); and
· the natural gas revenue forecast incorporates additional prudence by using a price forecast that is lower than the average of private sector forecasts.
Conclusion
Budget 2019 takes action to make life better for British Columbians by fulfilling government’s commitment to eliminate Medical Services Plan premiums and making investments in initiatives that will create opportunities for people to get ahead, CleanBC, reconciliation with First Nations, child care and housing, and mental health services. Priority investments meet government’s three commitments to British Columbians: making life more affordable, enhancing services that people count on, and building a strong and sustainable economy that works for everyone.
Each year of the fiscal plan is balanced, with surpluses of $274 million in 2019/20, $287 million in 2020/21, and $585 million in 2021/22.
BUDGET AND FISCAL PLAN - 2019/20 to 2021/22
5
PART 1 | THREE YEAR FISCAL PLAN
Table 1.1 Three Year Fiscal Plan
| | Updated | | Budget | | | | | |
| | Forecast | | Estimate | | Plan | | Plan | |
($ millions) | | 2018/19 | | 2019/20 | | 2020/21 | | 2021/22 | |
Revenue | | 56,636 | | 59,047 | | 60,038 | | 62,458 | |
Expense | | (55,762 | ) | (58,273 | ) | (59,451 | ) | (61,573 | ) |
Forecast allowance | | (500 | ) | (500 | ) | (300 | ) | (300 | ) |
Surplus | | 374 | | 274 | | 287 | | 585 | |
Capital spending: | | | | | | | | | |
Taxpayer-supported capital spending | | 4,771 | | 6,340 | | 6,837 | | 6,911 | |
Self-supported capital spending | | 4,192 | | 4,274 | | 3,333 | | 3,361 | |
| | 8,963 | | 10,614 | | 10,170 | | 10,272 | |
Provincial Debt: | | | | | | | | | |
Taxpayer-supported debt | | 43,957 | | 46,384 | | 50,454 | | 53,986 | |
Self-supported debt | | 23,459 | | 25,664 | | 26,905 | | 28,090 | |
Total debt (including forecast allowance) | | 67,916 | | 72,548 | | 77,659 | | 82,376 | |
Taxpayer-supported debt to GDP ratio | | 14.9 | % | 15.0 | % | 15.7 | % | 16.1 | % |
Taxpayer-supported debt to revenue ratio | | 78.4 | % | 81.5 | % | 87.0 | % | 89.6 | % |
Introduction
Budget 2019 takes action to make life better for British Columbians. It includes priority investments to meet government’s three commitments to British Columbians: making life more affordable, enhancing services that people count on, and building a strong and sustainable economy that works for everyone. These measures are funded by improved revenues from existing sources. Each year of the fiscal plan is balanced, with surpluses of $274 million in 2019/20, $287 million in 2020/21, and $585 million in 2021/22.
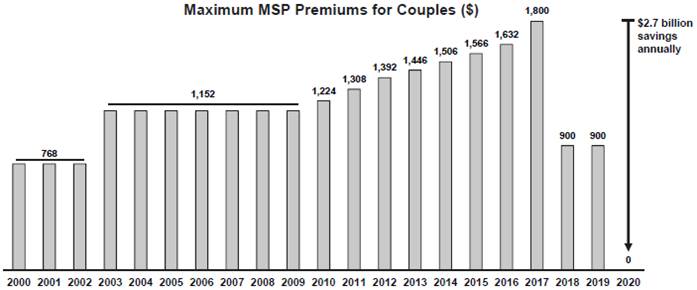
In Budget 2019, government is moving ahead with the full elimination of Medical Services Plan premiums, saving individuals up to $900 a year, and families up to $1,800 a year, for a total reduction of $2.7 billion. In addition, Budget 2019 introduces the new BC Child Opportunity Benefit, a historic investment that provides $380 million for B.C. families. This new benefit, combined with the elimination of MSP premiums, will provide a significant reduction in the tax burden for lower- and middle-income families with children.
The new operating funding initiatives are discussed in the Expense section starting on the next page. Details on the forecasts for the Province’s revenue sources are provided in the Revenue section, starting on page 30. The Capital investments section is on page 38, followed by the Debt section on page 51, and a discussion on the risks to the fiscal plan on page 54.
BUDGET AND FISCAL PLAN - 2019/20 to 2021/22
7
THREE YEAR FISCAL PLAN
Expense
Consolidated Revenue Fund Spending
Making Life More Affordable
Creating More Opportunities for People to Get Ahead
Budget 2019 introduces a range of measures to help make sure every British Columbian can reach their full potential. In addition to fulfilling government’s commitment to eliminate MSP premiums and building on previous commitments to improve housing affordability and affordable child care, Budget 2019 introduces several new initiatives.
Table 1.2 Creating More Opportunities for People to Get Ahead
($ millions) | | 2019/20 | | 2020/21 | | 2021/22 | | Total | |
BC Child Opportunity Benefit | | — | | 125 | | 250 | | 375 | |
Student Loan Interest Elimination | | 31 | | 31 | | 31 | | 93 | |
Increase to Income and Disability Assistance Rates and Enhancements | | 98 | | 103 | | 106 | | 307 | |
Increase Support Payments for Children in EFP/PAA | | 6 | | 6 | | 6 | | 18 | |
Increase Support Payments for Children of Foster Parents | | 16 | | 16 | | 16 | | 48 | |
Ensure Children in Care Benefit from Provincial Tax Benefits | | — | | 6 | | 13 | | 19 | |
Total in fiscal plan period | | 151 | | 287 | | 422 | | 860 | |
Student Loan Interest Elimination — Write-Down in 2018/19 | | | | | | | | 225 | |
BC Child Opportunity Benefit: The new BC Child Opportunity Benefit will provide families with children under 18 with up to $1,600 per year for the first child, up to $2,600 per year for families with two children, and up to $3,400 per year for families with three children. The BC Child Opportunity Benefit supports families with children under 18, whereas the early childhood tax benefit only applied to children under age 6. This means the new benefit will provide significantly more support for children over their entire childhood. The table below illustrates how the new benefit will provide more support for children.
Effective October 1, 2020, a new BC Child Opportunity Benefit will be combined with the early childhood tax benefit into a single new benefit. The new refundable tax credit provides $380 million annually to B.C. families with children under the age of 18. Budget 2019 includes incremental funding of $125 million in 2020/21 and $250 million in 2021/22 to support the transition from the early childhood tax benefit to the BC Child Opportunity Benefit. Further details of this new tax benefit are provided in Part 2: Tax Measures.
Table 1.3 - BC Child Opportunity Benefit
| | Maximum Annual Benefit | | Maximum Benefit over
Entire Childhood* | |
| | Existing
Benefit | | New
BC Child
Opportunity Benefit | | Existing
Benefit | | New
BC Child
Opportunity Benefit | |
One Child | | $ | 660 | | $ | 1,600 | | $ | 3,960 | | $ | 28,800 | |
Two Children | | $ | 1,320 | | $ | 2,600 | | $ | 7,920 | | $ | 48,000 | |
Three Children | | $ | 1,980 | | $ | 3,400 | | $ | 11,880 | | $ | 64,400 | |
* Calculation assumes each child is born two years apart.
BUDGET AND FISCAL PLAN - 2019/20 to 2021/22
8
THREE YEAR FISCAL PLAN
Chart 1.1 Net Provincial Taxes Since Budget 2016
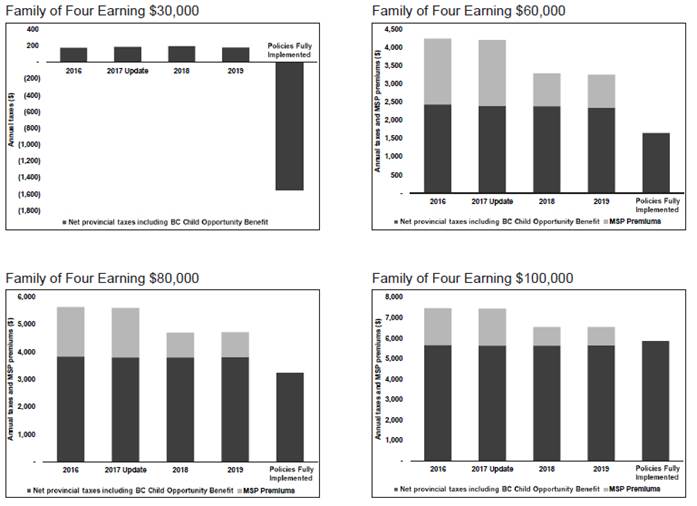
This new benefit, combined with the elimination of MSP premiums, will provide a significant reduction in the tax burden for lower- and middle-income families with children.
Student Loan Interest Elimination: To make education more affordable, Government is eliminating interest charges on B.C. student loans. As of February 19, 2019, interest will no longer accrue on new and existing student loans provided through the British Columbia Student Loan Program (previously, interest was charged at the prime rate). Government is investing a total of $318 million in 2018/19 and over the fiscal plan period to implement these changes. Borrowers will collectively save an estimated $22 million in interest payments on these loans in 2019/20.
The average undergraduate borrower has $11,200 in British Columbia student loan debt upon graduation and total federal and provincial student loan debt totaling $28,000. Eliminating interest on the provincial portion will save this borrower an estimated $2,300 over the 10-year repayment period.
Income Assistance and Disability Assistance Increases and Improvements: To help the province’s most vulnerable pay for essential needs, Budget 2019 provides $307 million over the fiscal plan to increase income assistance and disability assistance rates and enhance the BC Employment and Assistance Program. Effective April 1, 2019, income and disability assistance rates will increase by $50 per month. When taken together with
BUDGET AND FISCAL PLAN - 2019/20 to 2021/22
9
THREE YEAR FISCAL PLAN
an increase provided in Budget 2017 Update, the rate for a single individual on income assistance will have increased by a total of 25 per cent, and by 15 per cent for a single individual on disability assistance.
Enhancements to the BC Employment Assistance Program will remove barriers to accessing assistance, especially for youth, those with mental health and addictions issues, and persons with disabilities. These enhancements will include:
· removing requirements that make it harder for older adults, youth, and persons with mental health issues to access the program;
· helping clients obtain personal identification so they can access income assistance, essential services, and overcome personal barriers to securing housing and employment;
· aligning the definition of spouse to other benefit programs in order to ensure fairness in the level of support couples receive; and
· extending the shelter rate to those paying room and board to a family member.
Government has already doubled the crisis food supplement from $20 per person, per month to $40 per person, per month and increased the crisis utility supplement. Budget 2019 provides further enhancements to the BC Employment Assistance Program, which are part of the homelessness action plan (see page 11).
Supporting Children in Care: Importantly, Budget 2019 provides $18 million over three years to support children who are placed in the care of extended family caregivers and adoptive parents. Support payments for the Extended Family Program, which help to cover the cost of basic necessities such as food, clothing and shelter, will increase by approximately 75 per cent, and for the Post-Adoption Assistance program by 15 per cent, benefiting almost 2,500 children.
Support payments for foster parents, which are similarly intended to cover the cost of basic necessities, such as food, clothing, and shelter, were last increased in April 2009. These support payments will be increased by $179.09 per month, effective April 1, 2019. Budget 2019 provides $16 million annually for this purpose. This change will increase support payments by approximately 20 per cent, and will benefit more than 7,200 vulnerable children.
By providing more funding for Indigenous extended family caregivers, government is responding to recommendations from Indigenous communities and Grand Chief Ed John to keep more Indigenous children with their families rather than taking them into the care of the Province. By providing more funding to foster parents, government is recognizing the important work they do caring for children.
Furthermore, children in the care of the Province have not previously benefited from provincial child tax benefits. Budget 2019 addresses this inequity. To ensure children in care benefit from provincial child tax benefits, the Ministry of Children and Family Development will receive $6 million in 2020/21 and $13 million in 2021/22 for programming that will enrich the lives of these children.
Legal Clinics: To improve access to justice, government is providing funding to continue consultation and development of the Indigenous Justice Strategy and to pilot legal clinics in up to eight communities throughout the province. In partnership with
BUDGET AND FISCAL PLAN - 2019/20 to 2021/22
10
THREE YEAR FISCAL PLAN
the Law Foundation of British Columbia, legal clinics will provide access to justice community programs and increase access to legal advice and advocacy.
Homes for B.C.
Government is taking meaningful action to address the significant housing challenges facing British Columbians as a result of increasingly unaffordable house prices and a lack of affordable and market rental housing. Government has committed to building 114,000 units of affordable market rental, non-profit, co-op, supportive and owner-purchased housing in partnership with local governments, the federal government, Indigenous peoples, the non-profit and for-profit sectors, and faith groups.
Budget 2017 Update introduced the initial steps taken to address needed housing supply, which included capital investments of $499 million to help build 1,700 new units of affordable rental housing and 2,000 modular units for housing people who are homeless. Additional funding was also provided to improve landlord and tenant services.
Budget 2018 launched the most significant provincial investment ever made in housing — $7 billion over 10 years. The Province announced investments to build and maintain affordable rental housing, provide supportive housing for at-risk and vulnerable British Columbians, introduce a new student housing program for public post-secondary institutions, and increase support to low-income families and seniors who rent.
Budget 2019 continues to build on government’s historic Budget 2018 housing investments. In addition to Budget 2018 commitments, Budget 2019 provides additional operating funding of $24 million over three years.
To provide greater certainty to housing providers, government is accelerating the payment of $38 million in grants to housing providers in 2018/19. This funding will be used to reduce ongoing borrowing costs to improve the range of affordable market rents.
Table 1.4 Homes for B.C.
($ millions) | | 2018/19 | | 2019/20 | | 2020/21 | | 2021/22 | | Total | |
Incremental Housing Initiatives | | — | | 4 | | 6 | | 14 | | 24 | |
Deepening Affordability of Housing Projects | | 38 | | — | | — | | — | | 38 | |
Homelessness Action Plan | | — | | 5 | | 5 | | 5 | | 15 | |
Total | | 38 | | 9 | | 11 | | 19 | | 77 | |
Budget 2019 also launches a province-wide homelessness action plan. As part of the homelessness action plan, government will:
· Implement a supportive housing response strategy, including building 200 modular units and creating interim and permanent housing options to house people who are homeless or at risk of homelessness. This will bring the total to 2,200 modular units.
· Enhance the BC Employment Assistance program to better support people who are homeless or at risk of homelessness to find stable housing, including:
· increasing the maximum value of assets clients can have prior to receiving assistance;
· removing restrictions on vehicles a client can own to use for day-to-day transportation;
BUDGET AND FISCAL PLAN - 2019/20 to 2021/22
11
THREE YEAR FISCAL PLAN
· supporting clients to leave assistance for short-term opportunities by simplifying the re-application process;
· increasing the crisis supplement for shelter; and
· helping clients with security deposits in order to prevent homelessness.
The homelessness action plan will also:
· conduct a provincewide homelessness count in 2020; and
· establish a provincial homelessness co-ordination unit.
To support these initiatives, Budget 2019 provides $15 million in operating funding for the Ministry of Social Development and Poverty Reduction and the Ministry of Municipal Affairs and Housing, as well as $61 million in capital funding for the Ministry of Municipal Affairs and Housing.
To help combat poverty and homelessness, the Ministry of Social Development and Poverty Reduction is also contributing $10 million in 2018/19 for a provincial rent bank. This will provide access to loans for vulnerable families in need of immediate assistance to avoid eviction from their homes. Through this measure, families will be provided protection from falling into homelessness and deep poverty.
Child Care BC
Finding child care is a significant challenge for families in British Columbia. Budget 2018 made a historic $1 billion investment in Child Care BC — government’s plan to bring affordable, accessible, and quality child care to families across the province.
Budget 2018 provided $630 million over three years for two key affordability initiatives: the Affordable Child Care Benefit and Child Care Fee Reduction Initiative. Since September 2018, the new Affordable Child Care Benefit has been helping families by reducing the cost of child care by up to $1,250 per month, per child.
Since April 2018, the Child Care Fee Reduction Initiative has helped lower the cost of licensed child care for families with young children by providing increased funding to child care providers to reduce child care fees by up to $350 per month. The uptake of the fee reduction program by child care providers has been even more successful than anticipated, with an estimated 88 per cent of eligible child care spaces now participating. Budget 2019 provides an additional $9 million annually to support the Child Care Fee Reduction Initiative and associated Child Care Operating Fund program.
BUDGET AND FISCAL PLAN - 2019/20 to 2021/22
12
THREE YEAR FISCAL PLAN
Enhancing Services that People Count On
Budget 2019 makes critical investments in services and programs. Significant new investments will improve access to quality health care, support kids in the classroom and ensure our most vulnerable citizens have the supports they need. Budget 2019 provides just over $100 million annually to public-sector employers to support the transition to the Employer Health Tax. In addition, government is committed to ensuring fair and affordable compensation for public-sector employees through freely negotiated collective agreements. As such, Budget 2019 provides funding for the Sustainable Services Negotiating Mandate and the final Economic Stability Dividend.
Investing in Health Care
To improve health services and patient outcomes, Budget 2019 provides more than $1.3 billion over three years to the Ministry of Health. This investment includes supports for the BC Children’s and Women’s hospitals to provide services to women, children, newborns and families. This investment will also support the BC Cancer Agency and provide for new drugs to be covered under PharmaCare. This is in addition to the $3.8 billion that has been provided since Budget 2017 Update for services for seniors across the continuum of health care, expanding team-based care, improving the affordability of prescription drugs for low- and middle-income individuals and families, and addressing other needs in the health-care system.
Government is investing $89 million in 2018/19 in grants to health and life sciences research organizations to strengthen the Province’s competitiveness in attracting and retaining health researchers, and to support research, entrepreneurship and commercialization in life sciences. This provincial contribution is expected to attract over $200 million in external funding toward these research activities to improve health and other outcomes for British Columbians.
Improving Mental Health Services and Responding to the Opioid Overdose Emergency
Budget 2019 provides $74 million over three years to enhance mental health and addictions services for children, youth and young adults. This investment focuses on services to support the health and wellbeing of young children, enhance mental health for those at school age, and expand access for children and youth seeking mental health and addictions services.
Funding will be targeted to begin implementing a coordinated mental health and addictions system for children and youth that will link schools, community services and team-based primary care. This funding will support parent-child social and emotional development programs for young children, school based programs for mental wellness promotion, prevention and early intervention for students at risk or experiencing early signs of mental health or substance use challenges, and specialized service teams comprised of educators, counsellors, mental health practitioners, substance use workers and other professionals to support children, youth and their families.
BUDGET AND FISCAL PLAN - 2019/20 to 2021/22
13
THREE YEAR FISCAL PLAN
The investment will also expand the number of “one-stop shop” Foundry centres, which bring mental health, substance use and core health and social services together in a single location so that young people aged 12-25 can find the support they need - both online and in their community.
In addition, more than $30 million over the fiscal plan is provided to increase efforts in responding to the opioid overdose emergency. The funding will be directed to initiatives delivered by BC Emergency Health Services and the BC Centre for Disease Control. This investment will significantly expand programs to meet increased demand for paramedics in rural and remote areas and broaden distribution of life-saving naloxone kits. This new investment is in addition to the total $578 million provided since Budget 2017 Update for the opioid overdose emergency response and initiatives to address mental health and substance use.
These investments are guided by the Ministry of Mental Health and Addictions, and will be delivered by the Ministry of Health and the Ministry of Children and Family Development.
Table 1.5 Investing in Health Care and Education
($ millions) | | 2018/19 | | 2019/20 | | 2020/21 | | 2021/22 | | Total | |
Improving Access to Health Care Services | | — | | 60 | | 60 | | 699 | | 819 | |
Additional Drugs Available Under PharmaCare | | — | | 14 | | 14 | | 14 | | 42 | |
Research and Commercialization in Life Sciences | | 89 | | — | | — | | — | | 89 | |
Improving Mental Health and Addictions Services | | — | | 18 | | 26 | | 30 | | 74 | |
Responding to the Opioid Overdose Emergency | | — | | 10 | | 10 | | 10 | | 30 | |
K-12 Public Schools | | — | | 182 | | 184 | | 184 | | 550 | |
Total | | 89 | | 284 | | 294 | | 937 | | 1,604 | |
Investing in K-12 Education
As K-12 enrolment is projected to continue to grow, Budget 2019 provides an additional $550 million over three years to the Ministry of Education to support public education. Budget 2019 also provides $31 million over three years for independent schools, where enrolment is also growing.
Public school funding includes an additional $58 million over three years for the Classroom Enhancement Fund, to reflect the 2016 Supreme Court of Canada decision on class size and composition. A total of $423 million is now allocated annually which has already enabled the hiring of over 4,000 teachers, including 700 special education teachers and 160 more teacher psychologists and counsellors, since 2017.
Enhancing Supports
Income and Disability Assistance and Community Living BC: Budget 2019 ensures continued support for persons receiving income or disability assistance and/or support from Community Living BC. The Ministry of Social Development and Poverty Reduction will receive $44 million over three years to support growth in these programs. Community Living BC provides critical support to over 22,000 adults with developmental disabilities.
BUDGET AND FISCAL PLAN - 2019/20 to 2021/22
14
THREE YEAR FISCAL PLAN
Table 1.6 Enhancing Supports
($ millions) | | 2019/20 | | 2020/21 | | 2021/22 | | Total | |
Income and Disability Assistance and Community Living BC | | | | | | | | | |
Income and Disability Assistance | | 2 | | 6 | | 36 | | 44 | |
Increasing Payments for Community Living BC Home Share Provider | | 9 | | 18 | | 18 | | 45 | |
Vulnerable Children and Youth | | | | | | | | | |
Increasing the Benefit Rate and Reducing the Waitlist for Respite | | 6 | | 6 | | 6 | | 18 | |
Improving Residential Care for Children and Youth | | 31 | | 31 | | 31 | | 93 | |
Total | | 48 | | 61 | | 91 | | 200 | |
In addition, payments for Community Living BC home-share providers will increase for the first time since April 2009. These care providers play a vital role in ensuring adults with developmental disabilities are able to live as independently as possible. Budget 2019 provides $45 million over the fiscal plan to increase funding for the home sharing program by 15 per cent.
Supporting Vulnerable Children and Youth: Parents who care for children with special needs on a day-to-day basis will receive more rest and relief. An additional $6 million in annual funding for the Ministry of Children and Family Development will be used to increase the respite benefit amount by 10 per cent and significantly reduce the waitlist for respite services.
In addition, Budget 2019 directly supports children and youth with special needs and vulnerable children living in contracted residential care with $94 million over three years for the Ministry of Children and Family Development. Funding increases will support service levels in the ministry’s autism and medical benefits programs ($11 million annually) and ensure that residential care facilities are prepared to address the needs of individual children and youth ($20 million annually).
Improving Access to Justice and Public Safety
Government is providing funding for programming related to anti-money laundering, cannabis legalization, gun and gang violence, and road safety. Budget 2019 provides the Ministry of Attorney General with $6 million in base funding over the fiscal plan to update equipment, complete mandatory health and safety updates, and fund operating expenses related to capital investments. An additional $3 million is provided over the fiscal plan to support compensation and retention of court clerks, expand capacity at Justice Centres, and modernize IT infrastructure at the Independent Investigations Office.
To support the ongoing operations of the Intersection Safety Camera Red Light program, which targets and tickets unsafe drivers travelling through red lights in intersections across the province, Budget 2019 provides the Ministry of Public Safety and Solicitor General with $6 million over three years. An additional $6 million is provided over the fiscal plan period to maintain service levels in the Crime Victim Assistance Program, which supports victims of violent crime and their families by offsetting financial losses and assisting in recovery.
Table 1.7 Improving Access to Justice and Public Safety
($ millions) | | 2018/19 | | 2019/20 | | 2020/21 | | 2021/22 | | Total | |
Enhancing Capacity in the Justice System | | — | | 2 | | 3 | | 4 | | 9 | |
Intersection Safety Camera Red Light Program | | — | | 2 | | 2 | | 2 | | 6 | |
Crime Victim Assistance Program | | — | | 2 | | 2 | | 2 | | 6 | |
Civil Resolution Tribunal | | 8 | | 8 | | 8 | | 8 | | 32 | |
Total | | 8 | | 14 | | 15 | | 16 | | 53 | |
BUDGET AND FISCAL PLAN - 2019/20 to 2021/22
15
THREE YEAR FISCAL PLAN
Following through on government’s commitment to provide a more accessible, timely, and affordable alternative to the traditional court system, Budget 2019 commits $8 million annually to support the Civil Resolution Tribunal. The Civil Resolution Tribunal allows for 24/7 online access to information, early dispute resolution processes, and expedited adjudication by diverting disputes from arbitration and the courts.
These commitments build on funding since Budget 2017 Update. In Budget 2018, government made significant new investments in access to justice initiatives ($26 million over three years) and victim service and violence against women programs ($23 million over four years). In Budget 2017 Update, the Ministry of Public Safety and Solicitor General received $32 million over three years to respond to the fentanyl crisis.
Building a Strong and Sustainable Economy
CleanBC Plan
Budget 2019 includes over $679 million in funding for the CleanBC plan to reduce carbon pollution and promote the use of our clean energy to power B.C.’s economy. This includes $354 million in new program funding and $26 million in capital funding over three years for new initiatives.
In addition to the funding for the specific initiatives detailed below, $299 million is specifically allocated in Contingencies funding over the fiscal plan. This will ensure additional programs currently being developed are fully funded.
This investment is supplemented by enhancements to the Climate Action Tax Credit totalling $223 million over three years, bringing government’s overall commitment to over $902 million.
Cleaner transportation: Budget 2019 includes over $107 million in operating funding to help British Columbians switch to cleaner transportation options, including making zero-emission vehicles more affordable and investing in supporting infrastructure. This funding is allocated as follows:
· $90 million is being provided to the Ministry of Energy, Mines and Petroleum Resources to encourage and accelerate the adoption of zero-emission vehicles in the province. Funding will support a range of initiatives, including:
· $42 million to continue existing point-of-sale incentives for battery electric and hydrogen fuel cell vehicles. This will save British Columbians up to $6,000 on the purchase of a zero-emission vehicle and approximately $1,500 per year in fuel costs;
· $20 million to support the creation of new public fast-charging and hydrogen fueling stations to make it easier to fuel zero-emission vehicles;
· $10 million to offer more incentives for medium- and heavy-duty vehicles, including trucking, port and airport ground equipment, buses, and marine vessels;
· $6 million to support training programs for automotive technicians and electricians, as well as research and commercialization, in the zero-emission vehicle sector;
· $6 million to help light-duty vehicle fleets adopt zero-emission vehicles;
· $5 million for incentives for the installation of home and workplace charging stations; and
· $1 million to support implementation and public outreach.
BUDGET AND FISCAL PLAN - 2019/20 to 2021/22
16
THREE YEAR FISCAL PLAN
Table 1.8 CleanBC - Operating, Capital and Contingencies Allocations
($ millions) | | 2019/20 | | 2020/21 | | 2021/22 | | Total | |
CleanBC Operating Funding | | | | | | | | | |
Cleaner Transportation | | 96 | | 6 | | 5 | | 107 | |
Energy Efficient Buildings | | 10 | | 19 | | 29 | | 58 | |
Indigenous and Remote Communities | | 18 | | — | | — | | 18 | |
Climate Strategy Resourcing | | 1 | | 1 | | 1 | | 3 | |
CleanBC Program for Industry | | 56 | | 56 | | 56 | | 168 | |
Total Operating Funding | | 181 | | 82 | | 91 | | 354 | |
| | | | | | | | | |
CleanBC Capital Funding | | | | | | | | | |
Energy Efficient Buildings | | 8 | | 9 | | 9 | | 26 | |
Total Capital Funding | | 8 | | 9 | | 9 | | 26 | |
| | | | | | | | | |
CleanBC Contingencies Funding | | | | | | | | | |
CleanBC Programming Under Development | | 37 | | 87 | | 175 | | 299 | |
Total | | 37 | | 87 | | 175 | | 299 | |
Total Operating, Capital and Contingencies Allocated to CleanBC | | | | | | | | 679 | |
· The Ministry of Energy, Mines and Petroleum Resources will receive $3 million over three years to support the development and implementation of a Zero-Emission Vehicle (ZEV) standard. The standard will require automakers to meet an escalating annual percentage of new light-duty zero-emission vehicle sales, reaching 10 per cent by 2025, 30 per cent by 2030, and 100 per cent by 2040. Complemented by consumer incentive programs offered by the Province, the ZEV standard will help ensure cleaner vehicles are widely available and competitively priced.
· Government is investing over $5 million over three years for battery electric vehicle charging stations at highway rest areas and buildings owned by the Province. Expanding the Province’s charging station network will enable longer-range travel by cleaner vehicles.
· Government is providing $3 million over three years for a new heavy-duty vehicle efficiency program. This program will help businesses reduce their fuel consumption and support the Province in meeting its greenhouse gas (GHG) emission reduction targets.
· $6 million will be provided to initiatives supporting active transportation options, including walking and cycling, over a three-year period.
Energy Efficient Buildings: Budget 2019 provides over $58 million in operating funding in addition to capital funding to make homes and buildings in B.C. more energy efficient. Investments include:
· Expansion of energy-efficiency incentives delivered in partnership with BC Hydro, FortisBC, and BC Housing. These incentives are provided to households and businesses for the installation of high-efficiency heating equipment and building envelope improvements to reduce GHG emissions and reduce energy use. Additional funding of $41 million over three years will supplement the $24 million previously provided by the Province and the federal government, allowing incentives to reach significantly more homes and businesses.
· Energy efficiency upgrades and emissions reduction projects in more than 1,500 government owned and leased buildings. The Ministry of Citizens’ Services is allocated $14 million in operating funding and almost $26 million in capital funding
BUDGET AND FISCAL PLAN - 2019/20 to 2021/22
17
THREE YEAR FISCAL PLAN
to support these projects that will reduce energy costs. This investment will create opportunities throughout the province for local businesses, Indigenous peoples, professions and trades to develop building retrofit expertise that can be applied in their communities.
· Development of a net-zero building code applicable to all new buildings by 2032, new standards for alterations to existing buildings, and new energy efficiency standards. To support this work, the Ministry of Municipal Affairs and Housing and the Ministry of Energy, Mines and Petroleum Resources will receive $3 million over three years.
Indigenous and Remote Communities: Budget 2019 includes $18 million for two initiatives with Indigenous and remote communities:
· $15 million will support B.C.’s new Remote Community Clean Energy Strategy, which aims to reduce diesel consumption for electricity generation in remote communities by 80 per cent by 2030. The funding will help remote communities served by B.C.’s 22 largest diesel-powered electricity generation stations to reduce or eliminate diesel generation and replace it with energy from cleaner sources.
· Government is contributing $3 million to the BC Indigenous Clean Energy Initiative, with matching funding from the federal government. The funding supports both on-grid and off-grid Indigenous communities working to advance energy efficiency and clean energy projects for B.C.’s clean energy future.
Climate Strategy Resourcing: To support the implementation and monitoring of the CleanBC plan and the development of new initiatives, $3 million over three years is being provided to the Ministry of Environment and Climate Change Strategy.
Organics Collection and Processing Infrastructure: To reduce greenhouse gas emissions through waste diversion, an initial investment of $1 million over three years is provided to the Ministry of Environment and Climate Change Strategy to develop a program to increase organics collection and processing capacity in communities around the province.
CleanBC Program for Industry: Budget 2019 provides $168 million over three years for the CleanBC program for industry announced in Budget 2018. The program is designed to support large industrial operations, such as pulp and paper mills, natural gas operations and refineries, and large mines in reducing GHG emissions through targeted incentives.
This program will direct a portion of the carbon tax paid by industry to:
· an industrial incentive that reduces carbon-tax cost for operations meeting world leading emissions benchmarks; and,
· a clean industry fund that invests a portion of industrial carbon tax revenue directly into emissions reduction projects.
The fund and the incentive work together as the fund invests in GHG reducing projects, and industrial operations with lower emissions pay less carbon tax and receive larger incentives.
BUDGET AND FISCAL PLAN - 2019/20 to 2021/22
18
THREE YEAR FISCAL PLAN
Reconciliation with First Nations
Revenue Sharing: Supporting self-governance and self-determination is a cornerstone of government’s commitment to reconciliation with First Nations. Budget 2019 provides for gaming revenue-sharing payments of $297 million over the three years for First Nations communities. This revenue stream will provide stable, long-term funding estimated at over $3 billion over the next 25 years. First Nations will be able to invest in their community priorities ranging from health and wellness, housing, infrastructure, training, environmental protection and economic development. See page 37 for additional details.
Supporting Indigenous Families and Children: As already noted, Budget 2019 increases support payments for foster parents, ensures children and families in care benefit from provincial tax benefits, and increases support payments for extended family members caring for children. These changes begin to address some of the issues resulting from decades of Indigenous children being brought into the care of the Province. The changes are in support of recommendations from Indigenous communities and Grand Chief Ed John to keep more Indigenous children with their families.
Budget 2019 takes further action to support government’s commitment to reconciliation with Indigenous peoples. The Ministry of Indigenous Relations and Reconciliation is receiving $6 million in funding over three years for new staff to support continued work on treaties and other agreements, environmental stewardship initiatives, and socio-economic development. This builds on an initial investment made in Budget 2018.
Table 1.9 Reconciliation with First Nations
($ millions) | | 2019/20 | | 2020/21 | | 2021/22 | | Total | |
Revenue Sharing | | 197 | | — | | 100 | | 297 | |
Support for Indigenous Reconciliation Work | | 2 | | 2 | | 2 | | 6 | |
Total | | 199 | | 2 | | 102 | | 303 | |
Securing Our Resources for Tomorrow
Coast Forest Revitalization: Budget 2019 provides the Ministry of Forests, Lands, Natural Resource Operations and Rural Development with $10 million over three years to support the Coast Forest Sector Revitalization Initiative. Funding will support the objectives of diversifying forest tenures and manufacturing, increasing domestic timber processing and collaborating and consulting with Indigenous governments, industry committees, and other stakeholders.
Forest Carbon Initiative: Budget 2019 provides the Ministry of Forests, Lands, Natural Resource Operations and Rural Development with funding of $13 million over three years to support the Forest Carbon Initiative which is delivered in partnership with the Forest Enhancement Society of British Columbia and cost-shared with the Government of Canada. Funding targets the reduction of carbon emissions in the forest sector and the capture of carbon through the restoration of forests damaged by disease and wildfire.
Table 1.10 Securing Resources for Tomorrow
($ millions) | | 2018/19 | | 2019/20 | | 2020/21 | | 2021/22 | | Total | |
Coast Forest Sector Revitalization Initiative | | — | | 3 | | 3 | | 4 | | 10 | |
Forest Carbon Initiative | | — | | 3 | | 4 | | 6 | | 13 | |
Fire Management Vote | | — | | 37 | | 37 | | 37 | | 111 | |
Fire Management - Statutory Spending | | 551 | | — | | — | | — | | 551 | |
Total | | 551 | | 43 | | 44 | | 47 | | 685 | |
BUDGET AND FISCAL PLAN - 2019/20 to 2021/22
19
THREE YEAR FISCAL PLAN
Wildfire Resiliency: In addition to the $60 million provided in 2018/19 for the Community Resiliency Investment Program, Budget 2019 increases base funding for fire management from $64 million to $101 million per year in recognition of increased wildfire activity in recent years. This will provide for additional wildfire control capacity and increase communication resourcing for community engagement during the wildfire season. Costs above this base amount will continue to be funded through the statutory spending authority provided for under the Wildfire Act and managed within the prudence provided for in the fiscal plan. These investments are incremental to funding provided in Budget 2018 for wildfire resiliency and recovery activities.
Investing in Higher Education and Skills Training
Adult Basic Education and English Language Learning: Budget 2019 provides an additional $18 million over three years to support British Columbians who upgrade their education and skills. The additional funding will increase the total annual budget for these programs to $24 million annually, enabling more people to access basic education and develop skills used to improve their lives.
Increasing Participation in Trades: Budget 2019 provides an additional $3 million over three years to enable the Industry Training Authority to increase hands-on support for apprentices, employers and Indigenous communities to engage with and navigate through the trades training system. The funding will also support the development of a Performance Management Framework, including a system-wide reporting tool to inform and evaluate its initiatives and report on progress toward inclusion of Indigenous peoples as well as women and other equity-seeking groups in skilled trades.
Expanding Access to Health Training Programs: Budget 2019 provides $5 million over three years to train and graduate more health-care providers through public post-secondary institutions in urban, rural, remote and under-served communities. The expansion is targeted to a number of professions that are facing shortages that are impacting the delivery of health care. This funding continues government’s commitments to improve health outcomes and to deliver a patient-centered, integrated system of care across all regions of the province.
Expanding Access to Technology Training Programs: An additional $5 million in annual funding will be provided for post-secondary institution grants in 2021/22 to support technology programming, increasing total annual funding for this program to $41 million.
Table 1.11 Investing in Higher Education and the Workforce
($ millions) | | 2019/20 | | 2020/21 | | 2021/22 | | Total | |
Removing barriers to access skills training | | | | | | | | | |
Adult Basic Education and English Language Learning | | 6 | | 6 | | 6 | | 18 | |
Increasing Participation in Trades | | 1 | | 1 | | 1 | | 3 | |
Investing in the Workforce | | | | | | | | | |
Expanding Access to Health Training Programs | | 1 | | 2 | | 2 | | 5 | |
Expanding Access to Technology Training Programs | | — | | — | | 5 | | 5 | |
Employment Standards Branch Transformation | | 4 | | 5 | | 5 | | 14 | |
Total | | 12 | | 14 | | 19 | | 45 | |
BUDGET AND FISCAL PLAN - 2019/20 to 2021/22
20
THREE YEAR FISCAL PLAN
Improving B.C.’s Employment Standards
Budget 2019 provides $14 million over three years to support the transformation of the Employment Standards Branch in the Ministry of Labour, to update employment standards to reflect the changing nature of work and ensure standards are applied fairly and consistently. The funding will also be used to implement the Temporary Foreign Worker Protection Act, and create a registry of licensed foreign worker recruiters and employers seeking to hire temporary foreign workers, which will help protect vulnerable workers from exploitation. This funding is in addition to the $3 million provided in Budget 2018 to initiate planning and begin the transformation of the Employment Standards Branch.
Investing in Communities
Supporting Local Economies
Northern Capital and Planning Grant: Government will provide $100 million in 2018/19 to 26 local governments along the LNG corridor and near Kitimat to help meet their current and future infrastructure needs. The funding will benefit communities in northwest and north-central B.C. to assist with strategic planning and capital investments.
Connecting BC: Connectivity is foundational — it is essential for people, businesses, and government to operate and interact today. Government is investing $50 million in 2018/19 for the Connecting British Columbia program with the intent of leveraging funding from the Canadian Radio-television and Telecommunications Commission’s Broadband Fund. This will help close the gap in high-speed internet access between rural and urban areas. High-speed internet access will be expanded to more than 200 rural and Indigenous communities to enable them to participate in today’s economy.
Tourism, Arts and Culture: Budget 2019 provides a total of $57 million over three years to the Ministry of Tourism, Arts and Culture for the following initiatives:
· $39 million over three years for the Resort Municipality Initiative to fund infrastructure projects that will create jobs and build a strong economy in tourism-oriented communities.
· $3 million over three years for Destination BC to expand promotion of B.C. as a global tourism destination.
· $15 million over three years for the BC Arts Council to further support professional artists and community organizations, bringing the annual budget for BC Arts Council grants to $34 million. A component of this new funding will increase access to make arts more accessible to everyone. This $15 million investment is in addition to the initial $15 million fiscal plan increase for arts grants provided in Budget 2018.
In order to preserve, protect, and provide better access to the human and natural history collections of British Columbia, government is planning for a capital project to modernize and renew the Royal BC Museum.
Budget 2019 provides $18 million in 2019/20 for the Ministry of Municipal Affairs and Housing to facilitate the payments under the Peace River Agreement. Funding provided under this agreement supports planning, programs, asset management and infrastructure investments related to regional economic growth where intensive industrial activities occur outside the boundaries of the region’s municipalities.
BUDGET AND FISCAL PLAN - 2019/20 to 2021/22
21
THREE YEAR FISCAL PLAN
Budget 2019 also provides the Ministry of Municipal Affairs and Housing with an opportunity to advance the first grant payment of $62 million to the Capital Regional District in 2019/20 towards the completion of the Core Area Wastewater Treatment Project. The project will provide tertiary wastewater treatment to exceed regulatory standards by December 2020.
Table 1.12 Investing in Communities
($ millions) | | 2018/19 | | 2019/20 | | 2020/21 | | 2021/22 | | Total | |
Supporting Local Economies | | | | | | | | | | | |
Northern Capital and Planning Grant | | 100 | | — | | — | | — | | 100 | |
Connecting BC | | 50 | | — | | — | | — | | 50 | |
Resort Municipality Initiative | | — | | 13 | | 13 | | 13 | | 39 | |
Destination BC - Tourism Market Development | | — | | 1 | | 1 | | 1 | | 3 | |
BC Arts Council - Increased Funding | | — | | 5 | | 5 | | 5 | | 15 | |
Accessible and Safe Transportation Network | | | | | | | | | | | |
Transit Services | | — | | 3 | | 8 | | 10 | | 21 | |
Taxi Modernization and Ride Hailing | | — | | 3 | | 3 | | 3 | | 9 | |
BC Road Network Maintenance | | — | | 13 | | 13 | | 13 | | 39 | |
Commercial Vehicle Safety and Enforcement | | — | | 1 | | 1 | | 1 | | 3 | |
Total | | 150 | | 39 | | 44 | | 46 | | 279 | |
Accessible and Safe Transportation Network
To help individuals access transit services, Budget 2019 adds $21 million over three years to improve conventional bus services in over 30 communities around the province, including improvements to handyDART in both rural and urban settings.
Over three years, $9 million is provided to implement government’s commitments to modernize the taxi industry and enable ride-hailing in B.C. This funding will also enhance vehicle compliance and enforcement activities and support the Passenger Transportation Board in its new role as provincial regulator for passenger-directed vehicles.
Budget 2019 adds $39 million over three years for the maintenance of B.C.’s network of bridges and roads. Continued investment is important to ensuring roads are both safe and efficient at moving goods and people throughout the province, providing related economic benefits to all communities.
A further $3 million over three years is provided to enhance commercial vehicle safety and enforcement in B.C., increasing timely and consistent intervention with carriers.
Sustainable Economic Development
Regulatory Excellence in Mining: Budget 2019 provides the Ministry of Energy, Mines and Petroleum Resources with close to $20 million over three years to fulfill the government’s commitments to improve permitting and increase industry safety by establishing an independent oversight unit. This investment will allow the ministry to hire up to 65 new full-time employees over three years. The ministry will establish a new Mines Health, Safety and Enforcement Division, with an increased number of mines inspectors and a new auditing function; this new division will be separate and independent from a Mines Competitiveness and Authorizations Division. This funding will also provide for the creation of a standing committee to review and update the Health, Safety and Reclamation Code for Mines to ensure it meets current standards and continues to
BUDGET AND FISCAL PLAN - 2019/20 to 2021/22
22
THREE YEAR FISCAL PLAN
address the needs of workers, the environment, industry, Indigenous groups and the public. Additional resources are also provided to enhance Indigenous engagement and to improve the co-ordination and predictability of the permitting process to attract increased investment in the province’s mining sector.
Professional Reliance: The Office of the Superintendent of Professional Governance will be established through a nearly $2 million investment over three years. This Office will provide a centralized statutory authority for professional governance oversight to ensure consistency and best practices are applied to the work of natural resource professionals.
Increased Monitoring and Oversight Capacity: Budget 2019 also provides $7 million over three years to the Ministry of Environment and Climate Change Strategy for increased monitoring and oversight activities under the Environmental Management Act. This work will be funded through revenues collected by the Sustainable Environment Fund which receives money from waste discharge fees, provincial sales tax on diapers, pesticide license and permit fees, and other miscellaneous sources.
Environmental Assessment Revitalization: Funding of $9 million is provided in Budget 2019 for implementing the revitalized Environmental Assessment Act, which will focus on enhancing public confidence and participation in the Environmental Assessment process, pursuing reconciliation with Indigenous peoples, and protecting the environment while achieving sustainable project approvals. This funding will allow for new tools and approaches, such as early engagement, seeking consensus with Indigenous peoples, enhanced environmental, social, and economic assessment including gender-based analysis, and modernized compliance and enforcement.
Table 1.13 Sustainable Economic Development
($ millions) | | 2019/20 | | 2020/21 | | 2021/22 | | Total | |
Regulatory Excellence in Mining | | 5 | | 7 | | 8 | | 20 | |
Professional Reliance | | 0.6 | | 0.6 | | 0.6 | | 2 | |
Increased Monitoring and Oversight Capacity | | 2 | | 2 | | 3 | | 7 | |
Environmental Assessment Act Revitalization | | 3 | | 3 | | 3 | | 9 | |
Total | | 10 | | 13 | | 14 | | 37 | |
Strategic Investments with Our Partners
Budget 2019 is accelerating $175 million of grants and other payments to local governments, public libraries and other non-government agencies to provide more certainty for those entities. As a result, there will be corresponding reduced requirements for providing such payments through ministry budgets in 2019/20 and 2020/21.
BUDGET AND FISCAL PLAN - 2019/20 to 2021/22
23
THREE YEAR FISCAL PLAN
Analysis for Equity and Fairness (GBA+)
In February 2018, the government of British Columbia committed to advancing gender equality by establishing a Parliamentary Secretary for Gender Equity, reporting to the Minister of Finance. The mandate of the Parliamentary Secretary includes:
· Ensuring government’s commitment to gender equality is reflected in our budgets, policies and programs;
· Acting as the government’s liaison with organizations concerned with gender equality and the advancement of women;
· Co-ordinating cross-ministerial action on gender issues, including but not limited to gendered violence, advancing gender equality and women’s economic empowerment;
· Tracking progress on the National Inquiry into Missing and Murdered Indigenous Women and Girls;
· Promoting gender equity in leadership at senior levels in both the private and public sector.
The Gender Equity Office (GEO) was established in the Ministry of Finance to advance this work across government, including the introduction of Gender-Based Analysis Plus (GBA+) within the BC Public Service. GBA+ is an analytical tool used to assess how diverse groups of people may be impacted by policies, programs and budgets. The “plus” in GBA+ acknowledges that this goes beyond biological (sex) and socio-cultural (gender) differences. It also considers many other identifying factors like Indigeneity, ethnicity, religion, income, geography, age and mental or physical (dis)ability.
The BC Public Service is working to build capacity and understanding throughout government as GBA+ is integrated into policy, program and budget processes, with the goal of facilitating more comprehensive advice to decision-makers, advancing evidence-based policy-making and helping achieve better results for British Columbians.
BC Public Service
Full-time equivalent (FTE) staff utilization in core government ministries is projected to increase from a forecasted 30,750 in 2018/19 to 31,350 FTEs in 2019/20. This is due mainly to increased staffing requirements to implement CleanBC programming, Employment Standards and Temporary Foreign Worker Registry Transformation initiatives, mental health services, coast forest sector revitalization, and independent oversight of mining and other professions. The projected increase in FTEs is also due in part to continued implementation of road safety programs, the Civil Resolution Tribunal, cannabis legalization, commercial vehicle and safety enforcement, and staff to support reconciliation with First Nations.
FTE utilization is projected to increase slightly in 2020/21 due to the continued implementation of these initiatives, before stabilizing in 2021/22.
BUDGET AND FISCAL PLAN - 2019/20 to 2021/22
24
THREE YEAR FISCAL PLAN
Public Sector Compensation: The Economic Stability Mandate and the new Sustainable Services Negotiating Mandate
There are more than 326,000 members covered by 183 collective agreements across the B.C. public sector. The vast majority of these collective agreements expire between April 1 and June 30, 2019. Fiscal 2019/20 marks a transition between the province’s previous five-year (2014-2019) Economic Stability Mandate (ESM) and the new three-year (2019-2022) Sustainable Services Negotiating Mandate (SSNM). Budget 2019 supports the final compensation adjustments pursuant to the ESM as well as the new collective agreements reached under the SSNM.
The collective agreements reached under the ESM provided for potential additional wage increases in the last four years of the term if actual provincial real economic growth (GDP) exceeded the independent Economic Forecast Council’s forecasted growth for that year as published in the previous year’s provincial budget. Four Economic Stability Dividends (ESD) have since been awarded pursuant to the agreements, including 0.45 per cent in Budget 2016, 0.35 per cent in Budget 2017 and 0.4 per cent in Budget 2018. The fourth and final ESD is 0.75 per cent. Budget 2019 provides all ministries with budget increases totalling approximately $487 million over the three-year fiscal plan period to fund the fourth and final ESD.
The ESD is calculated based on one-half the difference between the Economic Forecast Council’s GDP forecast and real GDP growth as reported by Statistics Canada. Actual 2017 growth reported by Statistics Canada in November 2018 was 3.8 per cent, while the Council’s forecast in Budget 2017 was 2.3 per cent. As a result, all employees with collective agreements under the ESM are entitled to an additional general wage increase equivalent to one-half of the 1.5 percentage point difference, or a wage increase of 0.75 per cent. Collectively, the four ESDs have resulted in an ongoing wage increase of 1.95 per cent in addition to the ESM’s general wage increases of 5.5 per cent over the five years of the term, for a total of 7.45 per cent.
Budget 2019 provides funding to support new collective agreements consistent with the SSNM. The SSNM supports government’s commitment to improve the services people count on, make life more affordable and invest in sustainable economic growth. Agreements reached under the SSNM have included 2 per cent general wage increases in each of the three years of the term, and a focus on tangible changes that support the improvement of public services.
BUDGET AND FISCAL PLAN - 2019/20 to 2021/22
25
THREE YEAR FISCAL PLAN
Recovered Expenses
Government projects that, over the fiscal plan period, it will incur $10.1 billion in program spending which will be recovered from third parties.
Recovered costs include an estimated $2.8 billion in interest payments from commercial Crown corporations through the fiscal agency loan program and from sinking fund investment returns.
A total of $3.1 billion of programs will be delivered with funding from the federal government, such as the Labour Market Development Agreement, the Canada Job Grant, public transit, integrated workplace solutions, and child and family support programs.
$1.9 billion in government spending is supported by other miscellaneous sources, including hospital expansion costs recovered from regional hospital districts, Medical Services Plan and PharmaCare costs paid by agencies and other jurisdictions, and employee health benefits costs collected from participating government agencies.
$2.3 billion in remaining cost recoveries will be invested in a variety of programs, including industry-funded regulatory programs recovered through fees and fees recovered for collections services rendered.
Government reports the expenses incurred and the recoveries as revenue. The offsetting nature of these amounts results in no net impact to government’s fiscal plan.
Operating Transfers
Almost 60 per cent of ministry spending takes the form of transfers paid to service delivery agencies for the provision of services on behalf of government. These transfers will total $88.6 billion over the three-year fiscal plan period and will support education, health care, social services, housing, and transportation programs delivered by the agencies. These service delivery agencies include the SUCH sector (schools, universities, colleges and health organizations), Community Living BC, BC Housing Management Commission, BC Transit, and the BC Transportation Financing Authority.
BUDGET AND FISCAL PLAN - 2019/20 to 2021/22
26
THREE YEAR FISCAL PLAN
Service Delivery Agency Spending
Service delivery agency spending is projected to increase from $33.8 billion in 2018/19 to $36.6 billion by 2021/22, reflecting an increase of $2.8 billion.
School district spending is projected to rise from $6.7 billion in 2018/19 to $6.9 billion by 2021/22 — an increase of $249 million, or 3.7 per cent. This spending increase is primarily due to salary and benefits cost increases relating to higher projected student enrolment.
Post-secondary institution spending is projected to rise from $6.3 billion in 2018/19 to $6.8 billion by 2021/22 — an increase of $531 million, or 8.5 per cent. The spending increase is primarily due to increased salary and benefit costs relating to higher enrolment, and amortization costs in line with ongoing capital asset investments.
Health authority and hospital society spending is projected to rise from $15.7 billion in 2018/19 to $17.0 billion by 2021/22 — an increase of $1.3 billion, or 8.3 per cent. The spending increase is largely driven by an aging and growing population, resulting in an increasing usage of services, particularly increased spending related to seniors, primary care and mental health.
Projected spending by other service delivery agencies is forecast to increase from $5.1 billion in 2018/19 to $5.9 billion in 2021/22. This spending relates mainly to services in the transportation, social services, and housing sectors.
BUDGET AND FISCAL PLAN - 2019/20 to 2021/22
27
THREE YEAR FISCAL PLAN
Table 1.14 Revenue by Source
($ millions) | | Updated
Forecast
2018/19 | | Budget
Estimate
2019/20 | | Plan
2020/21 | | Plan
2021/22 | |
Taxation revenue | | | | | | | | | |
Personal income | | 11,348 | | 11,055 | | 11,583 | | 12,110 | |
Corporate income | | 5,132 | | 4,192 | | 4,284 | | 4,859 | |
Employer health | | 464 | | 1,854 | | 1,930 | | 2,007 | |
Sales 1 | | 7,318 | | 7,586 | | 7,937 | | 8,282 | |
Fuel | | 1,014 | | 1,021 | | 1,031 | | 1,037 | |
Carbon | | 1,460 | | 1,713 | | 1,969 | | 2,200 | |
Tobacco | | 780 | | 780 | | 780 | | 780 | |
Property | | 2,601 | | 2,996 | | 3,120 | | 3,250 | |
Property transfer | | 1,910 | | 1,910 | | 1,910 | | 1,910 | |
Insurance premium | | 610 | | 625 | | 635 | | 645 | |
| | 32,637 | | 33,732 | | 35,179 | | 37,080 | |
Natural resource revenue | | | | | | | | | |
Natural gas royalties | | 164 | | 275 | | 258 | | 234 | |
Forests | | 1,389 | | 1,155 | | 1,114 | | 1,063 | |
Other natural resources 2 | | 1,417 | | 1,193 | | 1,066 | | 1,083 | |
| | 2,970 | | 2,623 | | 2,438 | | 2,380 | |
Other revenue | | | | | | | | | |
Medical Services Plan premiums — eliminated January 1, 2020 3 | | 1,355 | | 1,015 | | 0 | | 0 | |
Other fees and licences 4 | | 4,210 | | 4,372 | | 4,557 | | 4,640 | |
Investment earnings | | 1,173 | | 1,196 | | 1,221 | | 1,217 | |
Miscellaneous 5 | | 3,258 | | 3,375 | | 3,375 | | 3,403 | |
| | 9,996 | | 9,958 | | 9,153 | | 9,260 | |
Contributions from the federal government | | | | | | | | | |
Health and social transfers | | 7,106 | | 7,404 | | 7,686 | | 7,971 | |
Other federal government contributions 6 | | 1,956 | | 2,019 | | 2,079 | | 2,147 | |
| | 9,062 | | 9,423 | | 9,765 | | 10,118 | |
Commercial Crown corporation net income | | | | | | | | | |
BC Hydro 7 | | (424 | ) | 712 | | 712 | | 712 | |
Accounting adjustment related to deferral accounts 7 | | 950 | | — | | — | | — | |
Liquor Distribution Branch | | 1,101 | | 1,120 | | 1,155 | | 1,195 | |
BC Lottery Corporation (net of payments to federal government) | | 1,396 | | 1,396 | | 1,416 | | 1,428 | |
ICBC | | (1,180 | ) | (50 | ) | 86 | | 148 | |
Other 8 | | 128 | | 133 | | 134 | | 137 | |
| | 1,971 | | 3,311 | | 3,503 | | 3,620 | |
Total revenue | | 56,636 | | 59,047 | | 60,038 | | 62,458 | |
1 Includes provincial sales tax, HST/PST housing transition tax and harmonized sales tax related to prior years.
2 Columbia River Treaty, Crown land tenures, other energy and minerals, water rental, and other resources.
3 After the elimination of MSP premiums, the revenue reduction is approximately $2.7 billion annually.
4 Post-secondary, health-care-related, motor vehicle, and other fees.
5 Includes reimbursements for health care and other services provided to external agencies, and other recoveries.
6 Includes contributions for health, education, community development, housing and social service programs, and transportation projects.
7 BC Hydro’s forecast loss for 2018/19 includes a write-off of a regulatory account. At the summary level, the Province recognized a $950 million adjustment in fiscal 2017/18 with respect to BC Hydro’s deferred regulatory accounts.
8 Includes Columbia Power Corporation, BC Railway Company, Columbia Basin Trust power projects, and other agencies’ self-supported subsidiaries.
BUDGET AND FISCAL PLAN - 2019/20 to 2021/22
28
THREE YEAR FISCAL PLAN
Table 1.15 Expense by Ministry, Program and Agency
($ millions) | | Updated
Forecast
2018/19 1 | | Budget
Estimate
2019/20 | | Plan
2020/21 | | Plan
2021/22 | |
Office of the Premier | | 11 | | 11 | | 11 | | 11 | |
Advanced Education, Skills and Training | | 2,212 | | 2,330 | | 2,341 | | 2,348 | |
Agriculture | | 93 | | 98 | | 99 | | 99 | |
Attorney General | | 584 | | 606 | | 604 | | 606 | |
Children and Family Development | | 1,793 | | 2,065 | | 2,184 | | 2,191 | |
Citizens’ Services | | 532 | | 552 | | 551 | | 551 | |
Education | | 6,355 | | 6,569 | | 6,536 | | 6,569 | |
Energy, Mines and Petroleum Resources | | 65 | | 180 | | 84 | | 94 | |
Environment and Climate Change Strategy | | 179 | | 243 | | 243 | | 244 | |
Finance | | 848 | | 878 | | 921 | | 896 | |
Forests, Lands, Natural Resource Operations and Rural Development | | 1,285 | | 823 | | 808 | | 819 | |
Health | | 19,754 | | 20,846 | | 21,518 | | 22,161 | |
Indigenous Relations and Reconciliation | | 101 | | 108 | | 107 | | 107 | |
Jobs, Trade and Technology | | 97 | | 97 | | 97 | | 97 | |
Labour | | 13 | | 16 | | 18 | | 18 | |
Mental Health and Addictions | | 10 | | 10 | | 10 | | 10 | |
Municipal Affairs and Housing | | 674 | | 828 | | 745 | | 882 | |
Public Safety and Solicitor General | | 1,095 | | 800 | | 803 | | 803 | |
Social Development and Poverty Reduction | | 3,364 | | 3,572 | | 3,628 | | 3,662 | |
Tourism, Arts and Culture | | 144 | | 164 | | 164 | | 164 | |
Transportation and Infrastructure | | 890 | | 926 | | 930 | | 932 | |
Total ministries and Office of the Premier | | 40,099 | | 41,722 | | 42,402 | | 43,264 | |
Management of public funds and debt | | 1,259 | | 1,278 | | 1,319 | | 1,382 | |
Contingencies | | 550 | | 750 | | 400 | | 400 | |
Contingencies - Sustainable Services Negotiating Mandate | | — | | 553 | | 1,183 | | 1,827 | |
Funding for capital expenditures | | 1,548 | | 2,134 | | 2,578 | | 2,947 | |
Refundable tax credit transfers | | 1,618 | | 1,489 | | 1,718 | | 1,954 | |
Legislative Assembly and other appropriations | | 164 | | 159 | | 156 | | 159 | |
Subtotal | | 45,238 | | 48,085 | | 49,756 | | 51,933 | |
Supplementary Estimates | | 375 | | — | | — | | — | |
Total appropriations | | 45,613 | | 48,085 | | 49,756 | | 51,933 | |
Elimination of transactions between appropriations 2 | | (60 | ) | (24 | ) | (26 | ) | (28 | ) |
Prior year liability adjustments | | (77 | ) | — | | — | | — | |
Consolidated revenue fund expense | | 45,476 | | 48,061 | | 49,730 | | 51,905 | |
Expenses recovered from external entities | | 3,304 | | 3,520 | | 3,225 | | 3,369 | |
Funding provided to service delivery agencies | | (26,805 | ) | (28,631 | ) | (29,685 | ) | (30,300 | ) |
Total direct program spending | | 21,975 | | 22,950 | | 23,270 | | 24,974 | |
Service delivery agency expense: | | | | | | | | | |
School districts | | 6,685 | | 6,912 | | 6,923 | | 6,934 | |
Universities | | 4,934 | | 5,128 | | 5,276 | | 5,404 | |
Colleges and institutes | | 1,346 | | 1,373 | | 1,388 | | 1,407 | |
Health authorities and hospital societies | | 15,682 | | 16,292 | | 16,681 | | 16,953 | |
Other service delivery agencies | | 5,140 | | 5,618 | | 5,913 | | 5,901 | |
Total service delivery agency expense | | 33,787 | | 35,323 | | 36,181 | | 36,599 | |
Total expense | | 55,762 | | 58,273 | | 59,451 | | 61,573 | |
1 Restated to reflect government’s current organization and accounting policies.
2 Reflects payments made under an agreement where an expense from a voted appropriation is recorded as revenue by a special account.
BUDGET AND FISCAL PLAN - 2019/20 to 2021/22
29
THREE YEAR FISCAL PLAN
Revenue
Total revenue growth is expected to average 3.3 per cent annually over the three year period to 2021/22, incorporating the elimination of Medical Services Plan (MSP) premiums. There are no new tax measures that increase provincial government revenues in Budget 2019. Stronger revenues from taxation, federal government contributions, other taxpayer-supported sources and the net income of commercial Crown corporations are partly offset by declining revenues from natural resources.
Chart 1.2 Revenue Forecast

With the elimination of MSP premiums on January 1, 2020, revenue growth in taxation sources and MSP premiums averages 2.9 per cent over the three-year fiscal plan period.
B.C. is joining with the federal government to support business competitiveness in the face of ongoing global developments. B.C. will contribute over $800 million over the fiscal plan for investment incentives in capital assets, such as buildings, machinery and equipment. This will make it more attractive to invest in assets that drive business growth and free up capital that can be used to create more good, well-paying jobs for British Columbians.
The effects of these changes, combined with the impacts of strong, stable economic growth and LNG Canada’s final investment decision to build a LNG facility in Kitimat, result in a 4.3 per cent average annual growth in the taxation revenue forecast.
Natural resource revenues are forecast to average a 7.1 per cent annual decline over the three years. This mainly reflects declining revenues from the mineral tax on coal mine operations, bonus bids and rents on drilling licences and leases, and forests. These declines in revenue are partly offset by higher natural gas royalties in the next three years compared to 2018/19.
BUDGET AND FISCAL PLAN - 2019/20 to 2021/22
30
THREE YEAR FISCAL PLAN
Table 1.16 Comparison of Major Factors Underlying Revenue
Calendar Year | | February 19, 2019 | | February 20, 2018 | |
Per cent growth unless otherwise indicated | | 2018 | | 2019 | | 2020 | | 2021 | | 2018 | | 2019 | | 2020 | | 2021 | |
Real GDP | | 2.2 | | 2.4 | | 2.3 | | 2.1 | | 2.3 | | 2.0 | | 2.0 | | 2.0 | |
Nominal GDP | | 4.6 | | 4.4 | | 4.3 | | 4.0 | | 4.4 | | 4.0 | | 3.9 | | 3.9 | |
Household income | | 4.8 | | 4.0 | | 3.9 | | 3.9 | | 4.1 | | 3.9 | | 3.8 | | 3.8 | |
Net operating surplus | | 4.2 | | 0.3 | | 4.3 | | 3.0 | | 5.5 | | 3.3 | | 3.3 | | 3.2 | |
Consumer expenditures on durable goods | | 0.6 | | 2.5 | | 2.7 | | 2.5 | | 2.6 | | 2.3 | | 2.2 | | 2.3 | |
Consumer expenditures on goods and services | | 5.0 | | 4.9 | | 4.9 | | 4.9 | | 5.0 | | 4.6 | | 4.7 | | 4.7 | |
Business investment | | 6.3 | | 5.9 | | 4.7 | | 5.5 | | 6.0 | | 5.2 | | 4.8 | | 4.8 | |
Residential investment | | 7.4 | | 3.8 | | 3.4 | | 5.6 | | 6.8 | | 5.7 | | 5.1 | | 5.1 | |
Retail sales | | 2.4 | | 3.9 | | 4.0 | | 3.9 | | 4.3 | | 3.8 | | 3.7 | | 3.7 | |
Employment | | 1.1 | | 1.1 | | 1.0 | | 1.0 | | 1.4 | | 1.1 | | 1.0 | | 1.0 | |
BC Housing starts | | -6.4 | | -16.7 | | -6.4 | | -4.2 | | -26.8 | | -6.1 | | -1.8 | | 0.1 | |
US Housing starts | | 5.2 | | 0.4 | | 2.4 | | 0.0 | | -0.2 | | 0.0 | | 0.0 | | 0.0 | |
SPF 2x4 price ($US/thousand board feet) | | $ | 496 | | $ | 380 | | $ | 375 | | $ | 350 | | $ | 403 | | $ | 373 | | $ | 340 | | $ | 330 | |
Pulp ($US/tonne) | | $ | 1,184 | | $ | 1,135 | | $ | 1,000 | | $ | 900 | | $ | 945 | | $ | 880 | | $ | 850 | | $ | 850 | |
Exchange rate (US cents/Canadian dollar) | | 77.2 | | 76.0 | | 77.3 | | 78.5 | | 78.3 | | 79.7 | | 79.6 | | 80.1 | |
Fiscal Year | | 2018/19 | | 2019/20 | | 2020/21 | | 2021/22 | | 2018/19 | | 2019/20 | | 2020/21 | | 2021/22 | |
Natural gas price ($Cdn/GJ at plant inlet) | | $ | 0.59 | | $ | 0.72 | | $ | 0.83 | | $ | 0.99 | | $ | 1.08 | | $ | 1.17 | | $ | 1.39 | | $ | 1.54 | |
Bonus bid average bid price per hectare ($) | | $ | 1,431 | | $ | 300 | | $ | 250 | | $ | 200 | | $ | 300 | | $ | 300 | | $ | 250 | | $ | 200 | |
Electricity price ($US/mega-watt hour, Mid-C) | | $ | 35 | | $ | 33 | | $ | 32 | | $ | 34 | | $ | 24 | | $ | 25 | | $ | 27 | | $ | 29 | |
Metallurgical coal price ($US/tonne, fob west coast) | | $ | 186 | | $ | 158 | | $ | 147 | | $ | 145 | | $ | 144 | | $ | 131 | | $ | 127 | | $ | 127 | |
Copper price ($US/lb) | | $ | 2.90 | | $ | 3.02 | | $ | 3.15 | | $ | 3.25 | | $ | 2.93 | | $ | 3.00 | | $ | 3.10 | | $ | 3.17 | |
Crown harvest volumes (million cubic metres) | | 58.0 | | 57.0 | | 57.0 | | 56.0 | | 58.0 | | 58.0 | | 57.0 | | 57.0 | |
Other revenue (excluding MSP premiums) consists of various fees, licences, investment earnings and other miscellaneous sources, incorporating estimates provided by ministries and taxpayer-supported agencies. Over the next three years, these revenues are projected to average 2.3 per cent annual growth, roughly in line with the Budget 2019 real GDP outlook.
Federal government contributions are forecast to average 3.7 per cent annual growth over the next three years mainly due to expected increases in the Canada Health Transfer (CHT) and the Canada Social Transfer (CST) disbursements. The combined CHT and CST contributions are forecast to average 3.9 per cent annual growth over the fiscal plan period and represent about 79 per cent of total federal government contributions. Other federal government transfers are projected to average 3.2 per cent growth annually over the three-year fiscal plan.
Excluding the Insurance Corporation of British Columbia (ICBC) and BC Hydro, commercial Crown net income is expected to average 1.7 per cent growth annually over the next three years, reflecting modest growth in the operations of the Liquor Distribution Branch and BC Lottery Corporation. The net income of ICBC is forecast to steadily rise from a $1.2 billion loss in 2018/19 to a positive $148 million in 2021/22. BC Hydro’s forecast loss in 2018/19 includes a one-time adjustment for the write-off of a regulatory account. More details on commercial Crown corporations net income are provided beginning on page 37.
BUDGET AND FISCAL PLAN - 2019/20 to 2021/22
31
THREE YEAR FISCAL PLAN
Major Revenue Sources
Key assumptions and sensitivities relating to revenue are provided in Appendix Table A5. The assumptions and factors that are the major drivers for preparing projections of individual revenue sources include sensitivities to provide the reader with a sense of potential impacts to revenue projections if there are changes to these underlying assumptions and factors. The following text references the forecasts of these assumptions and factors in explaining individual revenue sources. An analysis of historical volatility of the economic variables related to revenue sources can be found in the 2018 BC Financial and Economic Review (pages 14-15). The major revenue components are detailed below.
Taxation revenue
Personal income tax base revenue (excluding tax measures and adjustments for prior years) is forecast to average 4.7 per cent over the next three years, in line with projected increases in wages and salaries and household income.
Incorporating the prior year adjustments and measures, personal income tax revenue is expected to decrease 2.6 per cent in 2019/20. Over the following two years, revenue is projected to average 4.7 per cent annual growth.
Table 1.17 Personal Income Tax Revenue
($ millions) | | 2018/19 | | 2019/20 | | 2020/21 | | 2021/22 | |
Base personal income tax revenue1 | | 10,623 | | 11,130 | | 11,661 | | 12,187 | |
Incremental provincial and federal tax measures | | (21 | ) | (75 | ) | (78 | ) | (77 | ) |
Prior-year adjustment | | 746 | | — | | — | | — | |
Budget 2019 revenue | | 11,348 | | 11,055 | | 11,583 | | 12,110 | |
Annual growth | | 27.2 | % | -2.6 | % | 4.8 | % | 4.5 | % |
Household income growth (calendar year) | | 4.8 | % | 4.0 | % | 3.9 | % | 3.9 | % |
Employee compensation income growth (calendar year) | | 5.7 | % | 4.3 | % | 4.1 | % | 4.0 | % |
Elasticity2 (calendar year basis, policy neutral) | | 1.2 | | 1.2 | | 1.2 | | 1.2 | |
1 Revenue excluding the impacts of prior-year adjustments and tax policy measures.
2 Per cent growth in current year tax revenue (excluding policy measures) relative to per cent growth in household income.
Corporate income tax revenue is mainly based on cash instalments received from the federal government and settlement adjustments for prior years. Revenue is expected to decline 18.3 per cent in 2019/20 due to a decrease in the settlement payment for prior years. Average annual growth over the next two years is forecast to be 7.7 per cent mainly due to annual increases in instalments, reflecting the federal government projections of national corporate taxable income, a rising B.C. payment share and changes in settlement payments related to prior years.
Table 1.18 Corporate Income Tax Revenue
($ millions) | | 2018/19 | | 2019/20 | | 2020/21 | | 2021/22 | |
Advance instalments from the federal government: | | | | | | | | | |
– Payment share | | 13.5 | % | 14.5 | % | 14.1 | % | 14.6 | % |
– Instalments | | 4,273 | | 4,096 | | 4,192 | | 4,474 | |
International Business Activity Act refunds (phasing out) | | (15 | ) | (10 | ) | — | | — | |
Prior-years’ settlement payment | | 874 | | 106 | | 92 | | 385 | |
Corporate income tax revenue | | 5,132 | | 4,192 | | 4,284 | | 4,859 | |
Annual per cent growth | | 84.1 | % | -18.3 | % | 2.2 | % | 13.4 | % |
BUDGET AND FISCAL PLAN - 2019/20 to 2021/22
32
THREE YEAR FISCAL PLAN
B.C. is joining with the federal government to support business competitiveness in the face of ongoing global developments. Changes will allow businesses to immediately write off specific machinery and equipment, and accelerate the business capital cost allowance on capital investments. These measures are expected to provide savings of $146 million (2018/19), $443 million (2019/20), $150 million (2020/21), and $83 million in 2021/22 to B.C. businesses.
Provincial sales tax revenue is expected to average 4.2 per cent growth annually over the three year fiscal plan, in line with expected increases in nominal GDP and consumer and business expenditures on taxable goods and services.
Table 1.19 Sales Tax Revenue
($ millions) | | 2018/19 | | 2019/20 | | 2020/21 | | 2021/22 | |
Provincial sales taxes | | 7,318 | | 7,586 | | 7,937 | | 8,282 | |
Annual per cent change (calendar year) | | 2018 | | 2019 | | 2020 | | 2021 | |
Consumer expenditures on durable goods | | 0.6 | % | 2.5 | % | 2.7 | % | 2.5 | % |
Consumer expenditures on goods and services | | 5.0 | % | 4.9 | % | 4.9 | % | 4.9 | % |
Residential investment | | 7.4 | % | 3.8 | % | 3.4 | % | 5.6 | % |
Government expenditures | | 6.6 | % | 5.0 | % | 2.1 | % | 2.1 | % |
Nominal GDP | | 4.6 | % | 4.4 | % | 4.3 | % | 4.0 | % |
Retail sales | | 2.4 | % | 3.9 | % | 4.0 | % | 3.9 | % |
Motor fuel tax revenue growth is expected to average 0.8 per cent annually over the three-year plan. The forecast assumes that gasoline purchases are flat over the fiscal plan period, diesel volumes grow 2 per cent annually and other fuel volumes rise in line with real GDP growth.
Carbon tax revenue is forecast to grow over the three years, incorporating an increase in carbon tax rates of $5 per tonne of CO2 equivalent emissions each year beginning April 1, 2019. The forecast assumes that purchased volumes of natural gas will grow in line with real GDP and that consumption of gasoline will remain flat. In 2021/22, the carbon tax rate will be $50 per tonne of CO2 equivalent emissions, one year before the federal government mandated date. Budget 2019 enhances the climate action tax credit with annual increases in each of the next three years, in line with the carbon tax rate increases. By July 2021 the maximum annual climate action tax credit will have increased 70 per cent over the 2017 level as discussed on page 62.
Tobacco tax revenue is projected to be flat over the three-year fiscal plan.
Property tax revenue is forecast to increase in 2019/20 mainly reflecting the full-year implementation of policy initiatives announced in Budget 2018. Over the next two years, annual revenue growth averages 4.2 per cent, consistent with the outlook for B.C. housing starts and inflation.
Property transfer tax revenue is projected to be flat over the three-year fiscal plan at $1.9 billion.
Employer health tax revenue is projected to rise from $0.5 billion in 2018/19 to $1.9 billion in 2019/20 reflecting the full-year effect of the January 1, 2019 effective date. Over the next two years, revenue growth is expected to average 4.0 per cent annually, consistent with employee compensation income growth.
More information on tax measures is detailed in Part 2: Tax Measures.
BUDGET AND FISCAL PLAN - 2019/20 to 2021/22
33
THREE YEAR FISCAL PLAN
Natural resource revenue
Natural gas royalties are expected to increase 68 per cent in 2019/20 reflecting decreased utilization of royalty program credits and higher prices for natural gas partially offset by lower production volumes. Over the next two years, royalties are expected to decline at a 7.8 per cent average annual rate mainly due to increased utilization of royalty programs and infrastructure credits, partly offset by expected increases in production volumes and the effect of rising prices for natural gas and natural gas liquids.
The forecast assumes an average price of $0.72 ($Cdn/gigajoule, plant inlet) in 2019/20, up from $0.59 in 2018/19. This assumption is within the 20th percentile of the private sector forecasters, continuing the prudence incorporated since 2013/14. Prices are expected to increase over the next two years, averaging $0.83 in 2020/21 and $0.99 in 2021/22, consistent with the growth of the average of the private sector forecasts. Over the three-year fiscal plan period, the projected natural gas prices average 70 cents lower than the average of the private-sector forecasters. Natural gas royalty rates are most sensitive to prices in the $1.22 to $2.22 range. Hence the effective royalty rate is generally expected to rise as prices increase, depending on the take up of royalty program credits.
See Appendix Table A6 for more details regarding natural gas price forecasts.
Revenue from bonus bids and rents on drilling licences and leases is forecast to decline over the next three years, from $276 million in 2018/19 to $145 million in 2021/22. The decrease is due to declining deferred revenue and cash sales that are expected to average $10 million annually. More detail is provided in Appendix Table A5.
Mining and minerals: Revenue from mineral tax, fees and miscellaneous mining receipts is expected to decline an average of 25.5 per cent annually over the next three years mainly due to assumed weakening coal prices and increasing mine production costs, reflecting higher capital expenditures and transportation costs. Coal prices are forecast to decline over the three-year fiscal plan period due to a global surplus supply mainly reflecting expected lower demand from China.
Chart 1.3 Revenue from Energy, Metals, and Minerals
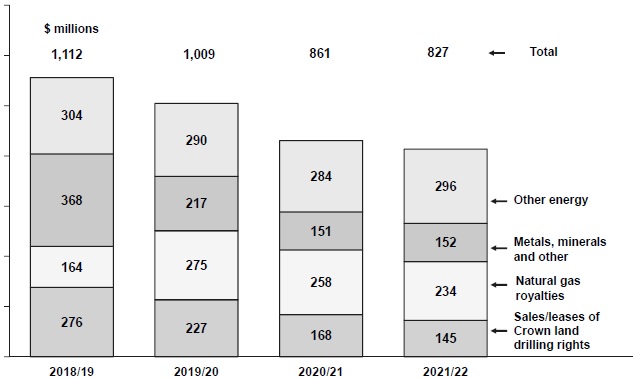
BUDGET AND FISCAL PLAN - 2019/20 to 2021/22
34
THREE YEAR FISCAL PLAN
Other energy: Other energy revenue is comprised of electricity sales under the Columbia River Treaty, petroleum royalties, and fees collected by the Oil and Gas Commission. These revenues are expected to decline by an average of 0.9 per cent annually over the three-year fiscal plan mainly due to lower oil production volumes and Mid-Columbia electricity prices partially offset by higher oil prices and fees collected by the Oil and Gas Commission.
Forest revenue is expected to fall 16.8 per cent in 2019/20 due to the impacts of lower lumber prices, stumpage rates, Crown harvest volumes and logging tax revenue. Forest revenue is expected to decline an average of 4.1 per cent annually over the following two years mainly due to lower overall stumpage rates and lumber prices, a higher Canadian dollar, and reduced harvest volumes. Total harvest levels on Crown land are projected to fall from 58 million cubic metres in 2018/19 to 56 million cubic metres in 2021/22. Over the fiscal plan period, the forecast assumes that the Ministry of Indigenous Relations and Reconciliation will recover $99 million of stumpage revenue in support of funding the Forest Consultation and Revenue Sharing Agreements with Indigenous peoples.
Other natural resource revenue is comprised of water rentals and fees for hunting and fishing licences collected under the Wildlife Act. These revenues are expected to increase an average of 1.5 per cent annually over the next three years mainly reflecting higher water rentals collected under the Water Sustainability Act.
Other revenue
Medical Services Plan premiums were reduced by 50 per cent effective January 1, 2018, and will be eliminated effective January 1, 2020, improving affordability for British Columbians. Over the seven-year period to 2016/17, MSP premium revenue rose at a 6.3 per cent average annual rate reflecting the annual premium increases paid by British Columbians during this period.
Chart 1.4 Revenue from MSP Premiums
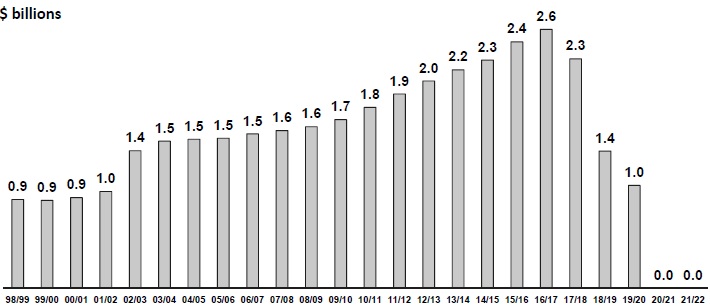
BUDGET AND FISCAL PLAN - 2019/20 to 2021/22
35
THREE YEAR FISCAL PLAN
Other fees and licences: Over the three-year fiscal plan, revenue from other fees and licences is expected to average 3.3 per cent annual growth mainly due to increasing revenue forecast by SUCH sector entities. Fee revenue from the SUCH sector accounts for over 70 per cent of other fee revenues.
Investment earnings are expected to average 1.2 per cent annual growth over the next three years mainly due to higher recoveries through the fiscal agency loan program. Higher revenue from these recoveries has an equal and offsetting higher expense resulting in no net impact on the projected annual surpluses. These recoveries are expected to comprise more than 70 per cent of total investment earnings.
Miscellaneous revenue is projected to average 1.5 per cent annual growth over the fiscal plan period.
Federal government transfers
Canada Health Transfer and Canada Social Transfer contributions are expected to average 3.9 per cent annual growth over the three years of the fiscal plan, mainly reflecting increasing national cash transfers and a rising B.C. population share of the national total. The plan assumes the national Canada Health Transfer (CHT) cash disbursement increases 4.6 per cent in 2019/20, followed by increases of 3.9 per cent and 3.7 per cent in the last two years of the plan. The national CHT cash disbursement in 2019/20 is based on a three-year average (2017 to 2019) of Canada’s nominal GDP growth, subject to a minimum annual growth rate of 3.0 per cent. The forecast adopts the most recent federal government outlook for national nominal GDP. The national CST cash disbursement is projected to increase 3.0 per cent annually, consistent with the federal government forecast.
Other federal contributions are expected to average 3.2 per cent growth annually over the fiscal plan. Increased contributions include B.C.’s share of the federally imposed cannabis duty and higher funding in support of housing initiatives, labour market development, homecare, mental health, public transit and other ministry programs (with an equal and offsetting expense).
The forecast also includes contributions under the Low Carbon Economy Leadership Fund Funding Agreement for provincial spending on low carbon initiatives by the Ministry of Forests, Lands, Natural Resource Operations and Rural Development, and the Forest Enhancement Society of BC. The fund supports objectives of reducing greenhouse gas emissions, transitioning to a low-carbon economy, and achieving clean growth outcomes.
Table 1.20 Federal Government Contributions
($ millions) | | 2018/19 | | 2019/20 | | 2020/21 | | 2021/22 | |
Canada Health Transfer | | 5,198 | | 5,439 | | 5,659 | | 5,879 | |
Canada Social Transfer | | 1,908 | | 1,965 | | 2,027 | | 2,092 | |
Total Health and Social Transfers | | 7,106 | | 7,404 | | 7,686 | | 7,971 | |
Low Carbon Economy Leadership Fund | | 11 | | 20 | | 16 | | 21 | |
BC Housing Management Commission | | 93 | | 161 | | 127 | | 123 | |
Ministry Vote Recoveries | | 1,036 | | 974 | | 1,028 | | 1,098 | |
Other Transfers to Ministries and Agencies | | 816 | | 864 | | 908 | | 905 | |
Total Other Contributions | | 1,956 | | 2,019 | | 2,079 | | 2,147 | |
Total Federal Government Contributions | | 9,062 | | 9,423 | | 9,765 | | 10,118 | |
BUDGET AND FISCAL PLAN - 2019/20 to 2021/22
36
THREE YEAR FISCAL PLAN
Commercial Crown Corporations
British Columbia Hydro and Power Authority (BC Hydro): As required by regulation, BC Hydro’s net income is set at $712 million in 2019/20 and 2020/21 and is not expected to change in 2021/22. As required by regulation, the payment of dividends by BC Hydro is being phased out to assist with stabilizing rate increases and improve BC Hydro’s capital structure to a 60:40 debt-to-equity ratio. No dividend payments are forecast during the fiscal plan period.
British Columbia Liquor Distribution Branch (LDB): LDB is projecting a modest net income growth from $1.12 billion in 2019/20 to $1.19 billion in 2021/22, with an average annual liquor sales growth of 2.0 per cent, and the introduction of the new line of business for non-medical cannabis. With the legalization of non-medical cannabis in Canada on October 17, 2018, the LDB has been appointed the Province’s wholesale distributor and is also responsible for opening government cannabis stores.
British Columbia Lottery Corporation (BCLC): BCLC’s net income is forecast at $1.4 billion in 2019/20, with a modest increase to $1.43 billion by 2021/22. For each year of the fiscal plan, government will distribute approximately $256 million (or approximately 18 per cent of the distribution paid to government) of its gaming income to charities and local governments. As well, $147 million of the gaming income retained by government will be allocated each year to the Health Special Account in support of health services. Starting in 2019/20, the government has committed to sharing seven per cent of its gaming income with BC First Nations.
Insurance Corporation of British Columbia (ICBC): The corporation’s forecast for 2019/20 and beyond reflects the impact of insurance product reform and other strategies intended to mitigate the effect of continuing increased accident claims cost trends that have resulted in significant net losses in 2017/18 and 2018/19. The combination of these measures is expected to help return ICBC to financial sustainability, with a moderate net loss forecast in 2019/20, followed by operating surpluses in 2020/21 and 2021/22.
For more information relating to commercial Crown corporations, please see Service Plans listed on the Budget 2019 website or the corporations’ respective websites.
BUDGET AND FISCAL PLAN - 2019/20 to 2021/22
37
THREE YEAR FISCAL PLAN
Capital Spending
In Budget 2019, capital spending on schools, hospitals, roads, bridges, hydro-electric projects and other infrastructure around the province is expected to total $31.1 billion over the three-year fiscal plan period. These investments will help ensure that the necessary infrastructure is in place to deliver the services that people count on in communities around the province and create jobs that support a strong and sustainable economy.
Taxpayer-supported Capital Spending
Taxpayer-supported capital spending over the next three years will total $20.1 billion, the highest level ever, and includes completion of existing approved projects along with new investments to expand and sustain provincial infrastructure including schools, post-secondary facilities, roads, bridges and hospitals. This three-year total is $4.3 billion higher than Budget 2018 mainly due to new capital spending in the areas of health, education and transportation, as well as revised timing for capital projects.
Table 1.21 Capital Spending
($ millions) | | Updated
Forecast
2018/19 | | Budget
Estimate
2019/20 | | Plan
2020/21 | | Plan
2021/22 | |
Taxpayer-supported | | | | | | | | | |
Education | | | | | | | | | |
Schools (K–12) | | 562 | | 843 | | 971 | | 862 | |
Post-secondary institutions | | 1,002 | | 1,034 | | 1,096 | | 1,187 | |
Health | | 1,147 | | 1,255 | | 1,406 | | 1,692 | |
BC Transportation Financing Authority 1 | | 974 | | 1,881 | | 2,097 | | 2,060 | |
BC Transit | | 96 | | 194 | | 181 | | 175 | |
Government ministries | | 492 | | 672 | | 497 | | 447 | |
Housing 2 | | 432 | | 393 | | 534 | | 378 | |
Other 3 | | 66 | | 68 | | 55 | | 110 | |
Total taxpayer-supported | | 4,771 | | 6,340 | | 6,837 | | 6,911 | |
Self-supported | | | | | | | | | |
BC Hydro | | 3,923 | | 2,999 | | 3,115 | | 3,153 | |
Columbia River power projects 4 5 | | 4 | | 1,001 | | 14 | | 18 | |
BC Railway Company | | 37 | | 8 | | 6 | | 2 | |
ICBC | | 72 | | 92 | | 40 | | 40 | |
BC Lotteries | | 80 | | 105 | | 105 | | 90 | |
Liquor Distribution Branch | | 76 | | 69 | | 53 | | 58 | |
Total self-supported commercial | | 4,192 | | 4,274 | | 3,333 | | 3,361 | |
Total capital spending | | 8,963 | | 10,614 | | 10,170 | | 10,272 | |
1 Includes Transportation Investment Plan and Transportation Investment Corporation, which is a subsidiary of BCTFA effective April 1, 2018.
2 Includes BC Housing Management Commission and Provincial Rental Housing Corporation.
3 Includes BC Pavilion Corporation, Royal BC Museum and other service delivery agencies.
4 Joint ventures of the Columbia Power Corporation and Columbia Basin Trust.
5 Columbia Basin Trust and Columbia Power Corporation purchase of the Waneta Expansion asset for $991 million.
BUDGET AND FISCAL PLAN - 2019/20 to 2021/22
38
THREE YEAR FISCAL PLAN
Investments in Schools
Over the three years of the fiscal plan, approximately $2.7 billion will be invested to maintain, replace, renovate or expand K—12 facilities, including continued investment in new school space to accommodate increasing enrolment in growth districts, and continued investment in the program to seismically upgrade or replace schools.
Examples of K—12 capital investments in Budget 2019 include:
· Burnaby North Secondary in Burnaby School District has been approved for up to $79.2 million to build a new, seismically safer school, which will include new space for child care, adult education and language development programs. The new, 1,800-seat school will be built on a different part of the current property, allowing students to remain in the existing school during construction. It is expected to be ready for students in September 2021.
· Mountainside Secondary in North Vancouver School District will receive $23.7 million for seismic upgrades. Mountainside was built in 1959 as Balmoral Junior Secondary school and was converted in 2014 to house a variety of alternative education programs for students throughout the district. Mountainside’s specific programs focus on inclusion and student mental health. Construction on the school is scheduled to be completed in fall 2021. Students will be able to remain in the school while the upgrades are underway.
· Walnut Park Elementary in Bulkley Valley School District will be replaced with a new two-storey school on the northwest area of the current site, with space for 440 elementary students. The replacement school will have space for the StrongStart program, and a neighbourhood learning centre. The $28.5 million replacement school is scheduled to open in fall 2020.
· A brand new Northeast Elementary School in Peace River North School District will accommodate the growing population in Fort St. John. The new school is scheduled to open in 2021, with 505 spaces for students in kindergarten to Grade 6. Plans for the two-storey facility include a neighbourhood learning centre with child care, before-and-after school care and multi-purpose spaces for community use.
· Royal Bay Secondary in the Sooke School District will receive an expansion to accommodate an additional 600 students, which will include 21 classrooms and a small gymnasium that will also be available for community use. The additional student spaces are expected to be ready for classes in fall 2020.
· A new South Side Area Elementary-Middle school will be built in Chilliwack School District. The $53.6 million, 930-seat K—8 school in south Chilliwack will have space for 80 kindergarten students, 250 elementary students and 600 middle school students. The school is expected to be ready for students in September 2022. It will feature a neighbourhood learning centre with space for child care programming.
· A new Lake Country Jr Middle School in Central Okanagan School District will provide 600 new spaces for students in grades 6 to 8. The school will be built on district-owned property south of George Elliot Secondary school, and will include a neighbourhood learning centre for the community. The new school is scheduled to open in September 2021.
BUDGET AND FISCAL PLAN - 2019/20 to 2021/22
39
THREE YEAR FISCAL PLAN
· Sullivan Heights Secondary in Surrey School District will receive a 700-seat addition. This $40 million, three-storey addition will create 29 new classrooms and, once complete, the school will have enough space for 1,700 students. In addition to the classrooms, the expansion will include a new gymnasium for school and community use. The new school is due to be open to students in fall 2021.
Spending to Support Post-Secondary Education
Budget 2019 includes $3.3 billion in total capital spending over the next three years by post-secondary institutions throughout the province. Investments in priority projects will build capacity and help meet the province’s future workforce needs in key sectors, including health, science, trades and technology. A significant portion of this capital investment is funded through other sources, including foundations, donations, internal sources, revenues generated from services, and federal funding.
Current and planned investments in the post-secondary sector include:
· A $450 million student housing loan program over six years to build approximately 5,000 new student housing beds at B.C.’s public post-secondary institutions. Projects approved to date as part of the loan program include:
· $201 million to construct two new student housing buildings at the University of Victoria. The new buildings include 620 net new beds, a new dining facility and multipurpose program space.
· A $37 million purchase and renovation of Upper College Heights apartment complex across the street from Thompson Rivers University. The renovations will add 142 beds for a total of 533 student housing beds.
· Construction of a new $126 million Sustainable Energy and Environmental Engineering Building at the Surrey campus of Simon Fraser University that will provide space for 515 students, expand research opportunities and foster innovation.
· Construction of a new $64 million health sciences centre at Camosun College to house 18 health science programs, including community mental health, nursing, as well as university-transfer health programs at the College’s Interurban campus.
· Construction of a new $78 million health science building at British Columbia Institute of Technology’s Burnaby campus. The new building will provide flexible space for health simulation education.
· Development of a new $19 million health sciences building at Okanagan College in Kelowna, which will house the health, science social development and engineering technology programs.
· A $6 million renewal and expansion at the Quesnel campus of College of New Caledonia. The project will provide new equipment and space for the power engineering and welding programs.
· A $48 million replacement of the Canada Way receiving substation and associated electrical infrastructure at the Burnaby campus of British Columbia Institute of Technology.
· A $18 million renewal and expansion of the Campbell River campus of North Island College that will allow trades training programs to be consolidated at one campus.
· A $23 million renewal and expansion of the trades training facilities and construction of new student commons space at Selkirk College in Nelson.
BUDGET AND FISCAL PLAN - 2019/20 to 2021/22
40
THREE YEAR FISCAL PLAN
· A $5 million renovation and fit-out project at the Vanderhoof campus of College of New Caledonia. The new facility will address trades program space demand, and provide modern functional space for the College in a permanent campus.
· Construction of a $38 million Nursing and Population Health Building at Thompson Rivers University.
· $23 million for specialized equipment to establish research facilities for drug discovery and clinical translation, leading to personalized treatments for prostate, bladder and kidney cancers. This BC Knowledge Development Fund project, led by the University of British Columbia in partnership with the Vancouver Prostate Centre, will be located at the UBC Vancouver campus, as well as at the Vancouver General Hospital and the BC Cancer Research Centre.
· $19 million for specialized equipment to develop the first quantum computer that will impact fields such as drug development, materials science, machine learning and cryptography. This BC Knowledge Development Fund project, led by Simon Fraser University, will be located at its Burnaby campus, as well as at the University of British Columbia’s Vancouver campus.
· $6 million for equipment for the Northern Cascadia Subduction Zone Observatory. The equipment, leveraging Ocean Networks Canada’s (ONC) NEPTUNE ocean observatory, will provide critical information on seismic and tsunami risks in B.C. that will impact provincial emergency management and resilience plans. The project is led by the University of Victoria, in partnership with Ocean Networks Canada.
Expanding and Upgrading Health Facilities
Capital spending on infrastructure in the health sector will total $4.4 billion over the next three years. These investments support new major construction projects and upgrading of health facilities, medical and diagnostic equipment, and information management/technology systems. These investments are supported by funding from the Province as well as other sources, such as regional hospital districts and foundations.
Key capital investments in the health sector include:
· Phase 1 of the Royal Columbian Hospital Redevelopment which includes a new 75-bed mental health and substance-use centre, a new energy centre, a multi-level underground parkade, associated tunnel and bridge connections to the existing hospital, an IT network perimeter pathway, and IT communications hub. Construction started in early 2017 and is expected to complete in late 2019.
· Phase 2 of the Royal Columbian Hospital Redevelopment which includes a new 348-bed acute care tower with six floors of inpatient beds including critical care and maternity, a new and expanded emergency department, new surgical/interventional suite with 18 operating rooms and an underground parkade. Procurement started in fall 2018, with construction planned to start in 2020 and expected to complete in 2024.
· Replacement of the Burnaby Centre for Mental Health and Addictions (CMHA) with a new purpose-built, 105-bed facility to be constructed on the Riverview Lands in Coquitlam. The CMHA provides highly specialized tertiary care assessments, diagnostic and treatment services to people with a complex substance use, mental illness, physical health, and behavioural and social issues. Construction is underway with completion planned for late 2020.
BUDGET AND FISCAL PLAN - 2019/20 to 2021/22
41
THREE YEAR FISCAL PLAN
· A new 107-bed patient care tower at the Royal Inland Hospital in Kamloops that will improve patient experience and outcomes by significantly increasing the number of single-patient rooms, providing new and larger operating rooms and expanding the existing emergency department. Construction on the new patient care tower started in fall 2018 and it is expected to open to patients in 2022. Internal renovations to the emergency department, pediatric unit and morgue are scheduled to begin in 2022 and be complete in 2024.
· A new patient care tower, including a surgical services centre, at the Penticton Regional Hospital that will improve patient experience and outcomes. Construction on the new patient care tower began in 2016 and is planned to open in April 2019. A second phase involving renovations to the existing emergency department and pharmacy is scheduled to begin in 2019 and complete in 2021.
· Vancouver General Hospital (VGH) Operating Room Renewal (Phase 1) includes 16 new operating rooms, a 40-bed perioperative care unit, new elevator, and infrastructure upgrades including electrical, mechanical, technology and equipment. Detailed design is underway; construction is expected to start in 2019 and complete in 2021.
· A new St. Paul’s Hospital at the Station Street site in Vancouver — a new core hospital (acute care centre and outpatient centre) including capacity for 548 inpatient beds, new and larger emergency department, surgical suite, consolidated specialty outpatient clinics, and underground parkade. Procurement is planned to start in fall 2019 with construction planned to start in fall 2020 and expected to complete in 2026.
Supporting the Transportation Investment Plan
Budget 2019 includes further investments in government’s Transportation Investment Plan. The Province has secured federal cost sharing on projects and has also leveraged investments through partnerships with private organizations. B.C. continues to work with the federal and municipal governments to identify priorities and confirm details around project criteria, timelines and cost-sharing arrangements for the new federal infrastructure funding.
Over the three years of the fiscal plan, transportation investments totalling $6.6 billion will maintain the flow of people and goods to support the B.C. economy. Timing of capital spending on these projects is subject to several factors, including funding from partners such as the federal government infrastructure programs and market conditions.
Examples of key capital investments in the transportation sector include:
· Replacing the Pattullo Bridge with a new four-lane bridge that meets current seismic and road design standards and the removal of the existing bridge. It will provide a safe and reliable crossing for vehicles, pedestrians and cyclists, and network connections in Surrey and New Westminster.
· Constructing the Broadway Subway, which will add 5.7 kilometres of SkyTrain line and six stations, to provide frequent and reliable access to one of the most congested transit corridors in Metro Vancouver, meet current and future transportation needs, reduce traffic congestion and air pollution, and improve livability.
BUDGET AND FISCAL PLAN - 2019/20 to 2021/22
42
THREE YEAR FISCAL PLAN
· Four-laning the final 4.8 kilometres of the 26 kilometre section of Highway 1 through the Kicking Horse Canyon between Highway 95 and the western boundary of Yoho National Park to improve safety and reliability, and facilitate the movement of goods.
· Replacing the RW Bruhn Bridge on Highway 1 in Sicamous with a five-lane structure, including four-laning the approaches, a new roadway under the bridge to increase connectivity, a multi-use path and intersection improvements to improve traffic flow and safety. It will provide a reliable crossing for residents, visitors and businesses.
· Implementing interim George Massey Tunnel safety and reliability improvements, including converting to LED lighting to improve visibility, upgrading life safety and electrical systems to current standards, resurfacing between Steveston Highway and Highway 17, enhanced lane markings and reflective signs, and tunnel drainage upgrades.
· Realigning 2 kilometres of Highway 16 and grade separating the CN 28 Mile level crossing, the last remaining level rail crossing on Highway 16. This will reduce delays, improve safety, and improve the flow of goods to and from the Port of Prince Rupert.
· Replacing the Parsnip River Bridge on Highway 97 near Mackenzie, a 63-year-old structure at the end of its service life, with a new bridge on an improved alignment. It will eliminate height restrictions and accommodate the heavy loads required to service resource industries.
· Realigning a 1.5-kilometres section of Highway 4 approximately 14 kilometres east of the Ucluelet-Tofino junction near Kennedy Lake that has a 30 km/h speed advisory, sharp curves and poor sight lines to improve safety and reliability.
· Improving the Mountain Highway, Lillooet/Mount Seymour Parkway and Main Street/Dollarton interchanges on Highway 1. Additionally it will include municipal improvements to Keith Road, a Collector-Distributor system and a new two-lane structure over Lynn Creek to improve traffic flow, safety and access across the highway.
· Five-laning of Highway 13 between Zero Avenue and 8th Avenue to improve access to and from the Aldergrove Border Crossing and mitigate the impact of border crossing activities on the local road system.
· Deployment of Smart Bus Technology in communities around the Province, including advanced fare technology to enable mobile fare payment and real-time technology to enable the use of mobile devices to see the exact location of a bus along its route, and support automatic voice announcements and interior passenger information displays.
· Construction of a new transit facility in Abbotsford, including a compressed natural gas fueling station, a bus wash and seven maintenance bays to provide for the storage and maintenance of about 100 buses.
BUDGET AND FISCAL PLAN - 2019/20 to 2021/22
43
THREE YEAR FISCAL PLAN
The public and private sector will provide about $6.7 billion for transportation operating and capital investments over the next three years, including:
· $5.0 billion of provincial investment in transportation infrastructure; and
· $1.7 billion of investment leveraged through federal cost sharing and partnerships with private organizations, local governments and other agencies.
Table 1.22 Provincial Transportation Investments
| | Updated
Forecast
2018/19 | | Budget
Estimate
2019/20 | | Plan
2020/21 | | Plan
2021/22 | | Fiscal Plan
Total | |
Provincial investments: | | | | | | | | | | | |
– Highway corridor rehabilitation | | 229 | | 214 | | 234 | | 203 | | 651 | |
– Side road improvements | | 108 | | 110 | | 110 | | 110 | | 330 | |
– Pattullo Bridge replacement | | 22 | | 186 | | 298 | | 280 | | 764 | |
– Highway 1 to Alberta border | | 44 | | 148 | | 244 | | 256 | | 648 | |
– Broadway Subway | | 15 | | 332 | | 400 | | 389 | | 1,121 | |
– Transit Infrastructure | | 138 | | 242 | | 188 | | 229 | | 659 | |
– Transportation and Trade Network Reliability | | 291 | | 337 | | 206 | | 123 | | 666 | |
– Safety improvements | | 58 | | 27 | | 30 | | 29 | | 86 | |
– Community and other programs | | 16 | | 37 | | 21 | | 19 | | 77 | |
Total provincial investments | | 921 | | 1,633 | | 1,731 | | 1,638 | | 5,002 | |
Investments funded through contributions from other partners | | 228 | | 498 | | 594 | | 600 | | 1,692 | |
Total investments in transportation infrastructure 1 | | 1,149 | | 2,131 | | 2,325 | | 2,238 | | 6,694 | |
1 Total investments include operating and capital spending.
Ministry Capital Spending
Budget 2019 includes $1.6 billion in capital spending by government ministries over the plan period. This will support investments in maintaining, upgrading and expanding infrastructure such as courthouses, correctional centres, office buildings, and information systems.
Current and planned capital investments made by government ministries include:
· In order to preserve, protect, and provide better access to the human and natural history collections of British Columbia, government is planning for a capital project to modernize and renew the Royal BC Museum.
· A new Abbotsford courthouse will double the number of courtrooms available in the current facility and increase courtroom capacity in the Lower Fraser Valley Region.
· A new building will also be constructed in Coquitlam to accommodate the Maples Adolescent Treatment Centre and the Provincial Assessment Centre.
Capital Project Reserves
The Province has included $223 million in project reserves in its three-year capital plan as a prudent planning measure. In addition to covering risks from unforeseen costs for ministry capital projects, the reserves may be used to fund emerging capital priorities of government ministries.
BUDGET AND FISCAL PLAN - 2019/20 to 2021/22
44
THREE YEAR FISCAL PLAN
Financing Capital Projects
Provincial capital infrastructure spending is financed through a combination of sources:
· cash balances within the organizations;
· partnerships with the private sector (public-private partnerships, or P3s);
· cost sharing with partners (e.g. federal government, regional hospital districts); and
· direct borrowing.
Chart 1.5 Financing Government’s Capital Plan

Self-supported Capital Spending
Self-supported capital spending is projected to total $11.0 billion over the fiscal plan period. Self-supported capital investments include:
· $10.3 billion (94 per cent) of total self-supported capital spending will be used for electrical generation, transmission and distribution projects to meet growing customer demand and to enhance reliability. Included in this total is construction of a third dam and hydroelectric generating station on the Peace River through the Site C Clean Energy project, and the purchase of Fortis Inc.’s partnership interest in the expansion facility at the Waneta Dam south of Trail.
· BC Hydro’s electricity system was largely built in the 1960s, 1970s, and 1980s and B.C.’s population and economy continue to grow. BC Hydro is upgrading and maintaining aging assets and building new infrastructure to meet the growing demand for electricity.
· $300 million will be used for BC Lottery Corporation projects including replacement of key legacy business systems, expansion of the lottery distribution network, and acquisition of gaming equipment to support lottery, PlayNow internet gaming, casino and community gaming activities.
BUDGET AND FISCAL PLAN - 2019/20 to 2021/22
45
THREE YEAR FISCAL PLAN
· $172 million will be used for ICBC projects including investment in information technology and facility maintenance and upgrades.
· $180 million will be invested by the Liquor Distribution Branch for costs related to the Liquor Distribution Branch Warehouse project, updates and improvements to liquor stores, expansion of cannabis stores, technology-related projects and ongoing operating equipment replacements.
Table 1.23 provides information on major capital projects, and further details on provincial capital investments are shown in the service plans of ministries and Crown agencies.
Projects Over $50 Million
Approved major capital projects with multi-year budgets totaling $50 million or more, including provincial funding, are shown in Table 1.23. Annual allocations of the budget for these projects are included as part of the provincial government’s capital investment spending shown in Table 1.21.
In addition to financing through provincial sources, major projects may be cost-shared with the federal government, municipalities and regional districts, and/or the private sector. Total capital spending for these major projects is $34.5 billion, reflecting provincial financing of $29.9 billion, including internal sources and P3 liabilities, as well as $4.6 billion in contributions from the federal government and other sources, including private donations.
Major capital investments include $2.3 billion for school replacement projects; $557 million for post-secondary institutions; $7.5 billion for health facilities; $6.3 billion for major transportation capital infrastructure; $303 million for projects in other sectors; $17.5 billion primarily for power generation and transmission capital projects by BC Hydro and for Columbia River power projects; and $55 million (plus leasing costs) for the Liquor Distribution Branch’s new Vancouver Distribution Centre warehouse.
Since the Second Quarterly Report nine projects have been added to the table:
· Camosun College Centre for Health Sciences ($64 million) in Victoria, expected to complete in 2019;
· University of Victoria Student Housing ($201 million) in Victoria, expected to complete in 2024;
· St. Paul’s Hospital ($1.9 billion) in Vancouver, expected to complete in 2026;
· Highway 97 Stone Creek to Williams Road ($65 million), expected to complete in 2019;
· Highway 7 Williams Lake Indian Reserve to Lexington Road ($57 million), expected to complete in 2019;
· Highway 1 RW Bruhn Bridge ($225 million), expected to complete in 2023;
· Supply Chain Applications project through BC Hydro ($68 million), expected to complete in 2020;
BUDGET AND FISCAL PLAN - 2019/20 to 2021/22
46
THREE YEAR FISCAL PLAN
Table 1.23 Capital Expenditure Projects Greater Than $50 million 1
Note: Information in bold type denotes changes from the 2018/19 Second Quarterly Report released on November 26, 2018.
| | | | Project | | Estimated | | Anticipated | | Project Financing | |
| | Year of | | Cost to | | Cost to | | Total | | Internal/ | | P3 | | Federal | | Other | |
($ millions) | | Completion | | Dec. 31, 2018 | | Complete | | Cost | | Borrowing | | Liability | | Gov’t | | Contrib’ns | |
Taxpayer-supported | |
Schools | | | | | | | | | | | | | | | | | |
Kitsilano Secondary2 | | 2018 | | 62 | | 3 | | 65 | | 61 | | — | | — | | 4 | |
Salish Secondary2 | | 2018 | | 54 | | 1 | | 55 | | 45 | | — | | — | | 10 | |
Centennial Secondary2 | | 2019 | | 57 | | 4 | | 61 | | 61 | | — | | — | | — | |
Willoughby Slope Secondary | | 2019 | | 32 | | 27 | | 59 | | 38 | | — | | — | | 21 | |
Argyle Secondary | | 2020 | | 4 | | 58 | | 62 | | 50 | | — | | — | | 12 | |
Grandview Heights Secondary | | 2021 | | 3 | | 90 | | 93 | | 71 | | — | | — | | 22 | |
Handsworth Secondary | | 2021 | | 1 | | 61 | | 62 | | 62 | | — | | — | | — | |
New Westminster Secondary | | 2021 | | 22 | | 85 | | 107 | | 107 | | — | | — | | — | |
Burnaby North Secondary | | 2021 | | — | | 79 | | 79 | | 79 | | — | | — | | — | |
Eric Hamber Secondary | | 2022 | | 1 | | 78 | | 79 | | 79 | | — | | — | | — | |
South Side Area Elementary | | 2022 | | 1 | | 53 | | 54 | | 49 | | — | | — | | 5 | |
Seismic mitigation program | | 2030 | | 318 | | 1,226 | | 1,544 | | 1,544 | | — | | — | | — | |
Total schools | | | | 555 | | 1,765 | | 2,320 | | 2,246 | | — | | — | | 74 | |
Post-secondary institutions | | | | | | | | | | | | | | | | | |
University of British Columbia — Undergraduate Life Science Teaching Laboratories Redevelopment | | 2019 | | 77 | | 11 | | 88 | | 12 | | — | | 32 | | 44 | |
Simon Fraser University — Energy Systems Engineering Building3 | | 2019 | | 113 | | 13 | | 126 | | 45 | | — | | 45 | | 36 | |
British Columbia Institute of Technology — Health Sciences Centre for Advanced Simulation | | 2021 | | 1 | | 77 | | 78 | | 66 | | — | | — | | 12 | |
Camosun College — Centre for Health Sciences | | 2019 | | 38 | | 26 | | 64 | | 40 | | — | | 13 | | 11 | |
University of Victoria — Student Housing | | 2024 | | — | | 201 | | 201 | | 123 | | — | | — | | 78 | |
Total post-secondary institutions | | | | 229 | | 328 | | 557 | | 286 | | — | | 90 | | 181 | |
Health facilities | | | | | | | | | | | | | | | | | |
Queen Charlotte/Haida Gwaii Hospital 2 | | 2016 | | 48 | | 2 | | 50 | | 31 | | — | | — | | 19 | |
Surrey Emergency/Critical Care Tower | | | | | | | | | | | | | | | | | |
– Direct procurement | | 2019 | | 164 | | 30 | | 194 | | 174 | | — | | — | | 20 | |
– P3 contract | | 2014 | | 318 | | — | | 318 | | 139 | | 179 | | — | | — | |
Royal Inland Hospital Clinical Services Building 2 | | 2016 | | 60 | | 3 | | 63 | | 38 | | — | | — | | 25 | |
Royal Inland Hospital Patient Care Tower | | | | | | | | | | | | | | | | | |
– Direct procurement | | 2024 | | 4 | | 125 | | 129 | | 38 | | — | | — | | 91 | |
– P3 contract | | 2022 | | — | | 288 | | 288 | | — | | 164 | | — | | 124 | |
Vancouver General Hospital - Jim Pattison Pavilion Operating Rooms | | 2021 | | 6 | | 96 | | 102 | | 35 | | — | | — | | 67 | |
North Island Hospitals 2 | | | | | | | | | | | | | | | | | |
– Direct procurement | | 2017 | | 109 | | 17 | | 126 | | 73 | | — | | — | | 53 | |
– P3 contract | | 2017 | | 480 | | — | | 480 | | 60 | | 232 | | — | | 188 | |
Interior Heart and Surgical Centre 2 | | | | | | | | | | | | | | | | | |
– Direct procurement | | 2018 | | 171 | | 77 | | 248 | | 213 | | — | | — | | 35 | |
– P3 contract | | 2015 | | 133 | | — | | 133 | | 4 | | 79 | | — | | 50 | |
Vancouver General Hospital — Joseph and Rosalie Segal Family Health Centre 2 | | 2017 | | 73 | | 9 | | 82 | | 57 | | — | | — | | 25 | |
Children’s and Women’s Hospital | | | | | | | | | | | | | | | | | |
– Direct procurement | | 2020 | | 219 | | 88 | | 307 | | 177 | | — | | — | | 130 | |
– P3 contract | | 2018 | | 368 | | 1 | | 369 | | 168 | | 187 | | — | | 14 | |
Penticton Regional Hospital — Patient Care Tower | | | | | | | | | | | | | | | | | |
– Direct procurement | | 2021 | | 77 | | 3 | | 80 | | 22 | | — | | — | | 58 | |
– P3 contract | | 2019 | | 167 | | 65 | | 232 | | — | | 139 | | — | | 93 | |
Health facilities continued on the next page

BUDGET AND FISCAL PLAN - 2019/20 to 2021/22
47
THREE YEAR FISCAL PLAN
Table 1.23 Capital Expenditure Projects Greater Than $50 million 1
Note: Information in bold type denotes changes from the 2018/19 Second Quarterly Report released on November 26, 2018.
| | | | Project | | Estimated | | Anticipated | | Project Financing | |
| | Year of | | Cost to | | Cost to | | Total | | Internal/ | | P3 | | Federal | | Other | |
($ millions) | | Completion | | Dec. 31, 2018 | | Complete | | Cost | | Borrowing | | Liability | | Gov’t | | Contrib’ns | |
Health facilities continued | | | | | | | | | | | | | | | | | |
Royal Columbian Hospital — Phase 1 | | 2019 | | 117 | | 142 | | 259 | | 250 | | — | | — | | 9 | |
Royal Columbian Hospital — Phases 2 & 3 | | 2026 | | 8 | | 1,092 | | 1,100 | | 1,037 | | — | | — | | 63 | |
Peace Arch Hospital Renewal | | 2021 | | 2 | | 82 | | 84 | | 8 | | — | | — | | 76 | |
Centre for Mental Health and Addictions | | 2020 | | 18 | | 83 | | 101 | | 101 | | — | | — | | — | |
Dogwood Complex Residential Care | | 2021 | | — | | 51 | | 51 | | — | | — | | — | | 51 | |
Lions Gate Hospital - New Acute Care Facility | | 2023 | | — | | 166 | | 166 | | — | | — | | — | | 166 | |
St Paul’s Hospital | | 2026 | | — | | 1,915 | | 1,915 | | 990 | | — | | — | | 925 | |
Clinical and systems transformation4 | | 2023 | | 294 | | 186 | | 480 | | 480 | | — | | — | | — | |
iHealth Project — Vancouver Island Health Authority 4 | | 2020 | | 91 | | 9 | | 100 | | — | | — | | — | | 100 | |
Total health facilities | | | | 2,927 | | 4,530 | | 7,457 | | 4,095 | | 980 | | — | | 2,382 | |
Transportation | | | | | | | | | | | | | | | | | |
Highway 97 widening from Highway 33 to Edwards Road 2 | | 2018 | | 63 | | 3 | | 66 | | 48 | | — | | 18 | | — | |
Highway 1 — Admirals Road/McKenzie Avenue Interchange | | 2019 | | 67 | | 18 | | 85 | | 52 | | — | | 33 | | — | |
Highway 1 widening and 216th Street Interchange | | 2019 | | 33 | | 26 | | 59 | | 23 | | — | | 22 | | 14 | |
Highway 91 Alex Fraser Bridge Capacity Improvements | | 2019 | | 41 | | 29 | | 70 | | 36 | | — | | 34 | | — | |
Highway 97 Stone Creek to Williams Road | | 2019 | | 50 | | 15 | | 65 | | 65 | | — | | — | | — | |
Highway 7 Williams Lake Indian Reserve to Lexington Road | | 2019 | | 48 | | 9 | | 57 | | 57 | | — | | | | — | |
Highway 7 Corridor Improvements | | 2020 | | 28 | | 42 | | 70 | | 48 | | — | | 22 | | — | |
Highway 99 10-Mile Slide | | 2020 | | 13 | | 47 | | 60 | | 60 | | — | | — | | — | |
Highway 1 Lower Lynn Corridor Improvements | | 2021 | | 100 | | 98 | | 198 | | 77 | | — | | 66 | | 55 | |
Highway 1 Illecillewaet 4-laning and Brake Check improvements | | 2022 | | 8 | | 55 | | 63 | | 47 | | — | | 16 | | — | |
Highway 1 Hoffman’s Bluff to Jade Mountain | | 2023 | | 20 | | 179 | | 199 | | 144 | | — | | 55 | | — | |
Highway 91 to Highway 17 and Deltaport Way Corridor Improvements | | 2023 | | 27 | | 218 | | 245 | | 80 | | | | 82 | | 83 | |
Highway 1 Salmon Arm West | | 2023 | | 28 | | 135 | | 163 | | 115 | | — | | 48 | | — | |
Highway 1 RW Bruhn Bridge | | 2023 | | 7 | | 218 | | 225 | | 134 | | — | | 91 | | — | |
Pattullo Bridge Replacement 5 | | 2023 | | 13 | | 1,364 | | 1,377 | | 1,377 | | — | | — | | — | |
Highway 1 Kicking Horse Canyon Phase 4 | | 2024 | | 16 | | 434 | | 450 | | 235 | | — | | 215 | | — | |
Broadway Subway | | 2025 | | 18 | | 2,809 | | 2,827 | | 1,830 | | — | | 897 | | 100 | |
Total transportation | | | | 580 | | 5,699 | | 6,279 | | 4,428 | | — | | 1,599 | | 252 | |
Other taxpayer-supported | | | | | | | | | | | | | | | | | |
Abbotsford courthouse | | | | | | | | | | | | | | | | | |
– Direct procurement | | 2021 | | 6 | | 12 | | 18 | | 18 | | — | | — | | — | |
– P3 contract | | 2021 | | 33 | | 101 | | 134 | | 48 | | 80 | | — | | 6 | |
Natural Resource Permitting Project 6 | | 2019 | | 82 | | 5 | | 87 | | 87 | | — | | | | — | |
Maples Adolescent Treatment Centre and Provincial Assessment Centre | | 2019 | | 62 | | 2 | | 64 | | 64 | | — | | — | | — | |
Total other | | | | 183 | | 120 | | 303 | | 217 | | 80 | | — | | 6 | |
Total taxpayer-supported | | | | 4,474 | | 12,442 | | 16,916 | | 11,272 | | 1,060 | | 1,689 | | 2,895 | |
BUDGET AND FISCAL PLAN - 2019/20 to 2021/22
48
THREE YEAR FISCAL PLAN
Table 1.23 Capital Expenditure Projects Greater Than $50 million 1
Note: Information in bold type denotes changes from the 2018/19 Second Quarterly Report released on November 26, 2018.
| | | | Project | | Estimated | | Anticipated | | Project Financing | |
| | Year of | | Cost to | | Cost to | | Total | | Internal/ | | P3 | | Federal | | Other | |
($ millions) | | Completion | | Dec. 31, 2018 | | Complete | | Cost | | Borrowing | | Liability | | Gov’t | | Contrib’ns | |
Power generation and transmission | | | | | | | | | | | | | | | | | |
BC Hydro | | | | | | | | | | | | | | | | | |
– G.M. Shrum unit 1 to 5 turbine replacement 2 | | 2015 | | 182 | | — | | 182 | | 182 | | — | | — | | — | |
– Hugh Keenleyside spillway gate reliability upgrade2 | | 2015 | | 113 | | 2 | | 115 | | 115 | | — | | — | | — | |
– Upper Columbia capacity additions at Mica units 5 and 6 project 2 | | 2015 | | 599 | | 6 | | 605 | | 605 | | — | | — | | — | |
– Dawson Creek/Chetwynd area transmission 2 | | 2015 | | 293 | | 3 | | 296 | | 296 | | — | | — | | — | |
– Surrey area substation project 2 | | 2016 | | 80 | | 14 | | 94 | | 94 | | — | | — | | — | |
– Big Bend substation 2 | | 2017 | | 68 | | 4 | | 72 | | 72 | | — | | — | | — | |
– Ruskin Dam safety and powerhouse upgrade 2 | | 2018 | | 621 | | 21 | | 642 | | 642 | | — | | — | | — | |
– Waneta 2/3 interest acquisition 2 | | 2018 | | 1,220 | | 1 | | 1,221 | | 1,221 | | — | | — | | — | |
– Horne Payne substation upgrade project | | 2019 | | 63 | | 30 | | 93 | | 93 | | — | | — | | — | |
– Kamloops substation 2 | | 2018 | | 50 | | 6 | | 56 | | 56 | | — | | — | | — | |
– W.A.C. Bennett Dam riprap upgrade project 2 | | 2018 | | 118 | | 1 | | 119 | | 119 | | — | | — | | — | |
– John Hart generating station replacement | | 2019 | | 954 | | 31 | | 985 | | 985 | | — | | — | | — | |
– Cheakamus unit 1 and 2 generator replacement | | 2019 | | 52 | | 22 | | 74 | | 74 | | — | | — | | — | |
– South Fraser transmission relocation project 7 | | TBD | | 32 | | 44 | | 76 | | 76 | | — | | — | | — | |
– Bridge River 2 units 5 and 6 upgrade project | | 2019 | | 53 | | 33 | | 86 | | 86 | | — | | — | | — | |
– Downtown Vancouver Electricity Supply: West End strategic property purchase | | 2020 | | 67 | | 14 | | 81 | | 81 | | — | | — | | — | |
– Fort St. John and Taylor Electric Supply | | 2020 | | 30 | | 23 | | 53 | | 53 | | — | | — | | — | |
– Supply Chain Applications project | | 2020 | | 27 | | 41 | | 68 | | 68 | | — | | — | | — | |
– UBC load increase stage 2 project | | 2021 | | 14 | | 41 | | 55 | | 55 | | — | | — | | — | |
– Peace Region Electricity Supply project | | 2021 | | 56 | | 229 | | 285 | | 285 | | — | | — | | — | |
– LNG Canada load interconnection project | | 2021 | | 4 | | 78 | | 82 | | 58 | | — | | — | | 24 | |
– Mica replace units 1-4 transformers project | | 2022 | | 4 | | 78 | | 82 | | 82 | | — | | — | | — | |
– G.M. Shrum G1-G10 control system upgrade | | 2022 | | 31 | | 44 | | 75 | | 75 | | — | | — | | — | |
– Site C project | | 2024 | | 3,206 | | 7,494 | | 10,700 | | 10,700 | | — | | — | | — | |
Columbia River power projects | | | | | | | | | | | | | | | | | |
– Waneta Dam power expansion 8 | | 2018 | | 331 | | 4 | | 335 | | 335 | | — | | — | | — | |
– Waneta Dam power expansion - purchase of 51% interest 9 | | 2019 | | — | | 991 | | 991 | | 991 | | — | | — | | — | |
Total power generation and transmission | | | | 8,268 | | 9,255 | | 17,523 | | 17,499 | | — | | — | | 24 | |
Other self-supported | | | | | | | | | | | | | | | | | |
Liquor Distribution Branch Warehouse | | 2019 | | 43 | | 12 | | 55 | | 55 | | — | | — | | — | |
Total other | | | | 43 | | 12 | | 55 | | 55 | | — | | — | | — | |
| | | | | | | | | | | | | | | | | |
Total self-supported | | | | 8,311 | | 9,267 | | 17,578 | | 17,554 | | — | | — | | 24 | |
Total $50 million projects | | | | 12,785 | | 21,709 | | 34,494 | | 28,826 | | 1,060 | | 1,689 | | 2,919 | |
1 Only projects that receive provincial funding and have been approved by Treasury Board and/or Crown corporation boards are included in this table. Ministry service plans may highlight projects that still require final approval. Capital costs reflect current government accounting policy.
2 Assets have been put into service and only trailing costs remain.
3 Simon Fraser University and private donors will contribute $26 million toward the project, and the university is also contributing land valued at $10 million.
4 The project and estimated budget are currently under review.
5 Pattullo Bridge forecasted to open to the public in 2023 with old bridge decommissioning to follow.
Forecasted amount reflects total expenditures including capitalized and expensed items. This amount may change once contracts are finalized.
6 Reflects approved capital costs to date, subject to change if future scope components are approved by government.
7 Construction work on the South Fraser transmission relocation project is currently suspended pending the government’s review of the George Massey Tunnel replacement.
8 Reflects the combined shares of Columbia Power Corporation (32.5 per cent) and Columbia Basin Trust (16.5 per cent) in their partnership with Fortis Inc. for the development of an electricity generating expansion facility at the Waneta Dam south of Trail.
9 Columbia Basin Trust and Columbia Power Corporation purchase of the Waneta Expansion asset for $991 million.
BUDGET AND FISCAL PLAN - 2019/20 to 2021/22
49
THREE YEAR FISCAL PLAN
· LNG Canada load interconnection project through BC Hydro ($82 million), expected to complete in 2021; and
· Waneta Dam power expansion - purchase of 51% interest ($991 million): Columbia Basin Trust and Columbia Power Corporation’s purchase of the Waneta Expansion asset.
One project has been completed since the Second Quarterly Report and is no longer listed in the table:
· Northwest Transmission Line (BC Hydro).
Changes since the Second Quarterly Report for existing projects include:
· Grandview Heights Secondary’s budget was amended from anticipated total costs of $61 million to $93 million to address budget pressures as a result of market conditions. As a result of delays during procurement, the completion date has been amended from 2020 to 2021.
· Burnaby North Secondary amended the year of completion from 2022 to 2021 to align with the project schedule;
· South Side Area Elementary-Middle amended the year of completion from 2023 to 2022 to align with the project schedule;
· The Seismic Mitigation program amended anticipated total costs of $1.3 billion to $1.54 billion to reflect additional funding provided in Budget 2019;
· Surrey Memorial Emergency/Critical Care Tower amended the year of completion from 2018 to 2019 for the direct procurement portion of the project;
· Royal Inland Hospital Patient Care Tower has updated financial information to reflect the split between direct procurement ($129 million) and P3 contract ($288 million). The direct procurement portion is set to complete in 2024 and the P3 contract will complete in 2022;
· Children’s and Women’s Hospital amended the year of completion from 2019 to 2020 for the direct procurement portion of the project;
· Highway 97 widening from Highway 33 to Edwards Road decreased anticipated total costs from $67 million to $66 million, with internal borrowing also decreasing from $49 million to $48 million;
· Highway 7 Corridor Improvements amended the year of completion from 2019 to 2020 due to negotiations and obtaining agreement on the Hanley Bypass section with the municipality;
· Highway 1 Illecillewaet Four-Laning amended its name to Highway 1 Illecillewaet Four-Laning and Brake Check Improvements;
· Natural Resource Permitting Project increased the project budget from $78 million to $87 million and extended Project Completion from 2018 to 2019 in order to complete existing project scope;
· Maples Adolescent Treatment Centre and Provincial Assessment Centre decreased anticipated total costs from $75 million to $64 million to reflect the final projected cost of the project;
· Ruskin Dam safety and powerhouse upgrade decreased total project costs from $748 million to $642 million to reflect the current forecast;
BUDGET AND FISCAL PLAN - 2019/20 to 2021/22
50
THREE YEAR FISCAL PLAN
· Horne Payne substation upgrade project extended project completion from 2018 to 2019; and
· John Hart generating station replacement decreased total project costs from $1.093 billion to $985 million to reflect the current forecast.
Provincial Debt
Debt affordability metrics have improved since Budget 2018 due to better than forecast operating results in 2017/18 and 2018/19. Despite increasing borrowing requirements for record level capital infrastructure investments, taxpayer-supported debt remains affordable with the taxpayer-supported debt-to-GDP ratio forecast to remain near 16 per cent over the fiscal plan period.
Chart 1.6 Debt to GDP
Total provincial debt is projected to increase by $14.5 billion over the fiscal plan period to reach $82.4 billion by 2021/22. The increase is due to borrowing requirements for capital infrastructure investments.
Taxpayer-supported debt is forecast to increase by $10.0 billion to $54.0 billion by 2021/22. This increase is due to funding for significant investments in capital infrastructure over the next three years. Debt increases associated with new investments include $5.9 billion for transportation sector projects, $1.7 billion for education and health facilities (after internal financing sources), and $2.4 billion for other initiatives.
Capital debt requirements are partially mitigated by the elimination of the operating debt in 2018/19, which allows for government operating cash surplus to be fully directed towards funding capital spending.
Changes in the timing of capital project spending may reduce borrowing requirements and debt needed to fund capital investments in the near term.
BUDGET AND FISCAL PLAN - 2019/20 to 2021/22
51
THREE YEAR FISCAL PLAN
Table 1.24 Provincial Debt Summary1
| | Updated | | Budget | | | | | |
| | Forecast | | Estimate | | Plan | | Plan | |
($ millions unless otherwise indicated) | | 2018/19 | | 2019/20 | | 2020/21 | | 2021/22 | |
Taxpayer-supported debt | | | | | | | | | |
Education2 | | 14,436 | | 14,228 | | 14,843 | | 14,623 | |
Health3 | | 7,990 | | 7,918 | | 8,476 | | 9,507 | |
Highways and public transit4 | | 17,097 | | 18,947 | | 21,040 | | 22,987 | |
Other5 | | 4,434 | | 5,291 | | 6,095 | | 6,869 | |
Total taxpayer-supported debt | | 43,957 | | 46,384 | | 50,454 | | 53,986 | |
Self-supported debt | | 23,459 | | 25,664 | | 26,905 | | 28,090 | |
Total debt before forecast allowance | | 67,416 | | 72,048 | | 77,359 | | 82,076 | |
Forecast allowance6 | | 500 | | 500 | | 300 | | 300 | |
Total provincial debt | | 67,916 | | 72,548 | | 77,659 | | 82,376 | |
Debt as a per cent of GDP | | | | | | | | | |
Taxpayer-supported | | 14.9 | % | 15.0 | % | 15.7 | % | 16.1 | % |
Total provincial | | 23.0 | % | 23.5 | % | 24.1 | % | 24.6 | % |
Taxpayer-supported debt per capita ($) | | 8,806 | | 9,172 | | 9,850 | | 10,401 | |
Taxpayer-supported interest bite (cents per dollar of revenue) | | 3.1 | | 3.3 | | 3.5 | | 3.7 | |
1 Provincial debt is prepared in accordance with Generally Accepted Accounting Principles and presented consistent with the Debt Summary Report included in the Public Accounts. Debt is shown net of sinking funds and unamortized discounts, excludes accrued interest, and includes non-guaranteed debt directly incurred by commercial Crown corporations and debt guaranteed by the Province.
2 Post-secondary institutions’ debt includes public-private partnership obligations of $58 million for fiscal 2018/19, $57 million for fiscal 2019/20, $56 million for fiscal 2020/21, and $55 million for fiscal 2021/22.
3 Health facilities’ debt includes public-private partnership obligations of $1,675 million for fiscal 2018/19, $1,685 million for fiscal 2019/20, $1,730 million for fiscal 2020/21, and $1,729 million for fiscal 2021/22.
4 BC Transportation Financing Authority’s’ debt includes public-private partnership obligations of $752 million for fiscal 2018/19, $725 million for fiscal 2019/20, $687 million for fiscal 2020/21, and $642 million for fiscal 2021/22.
5 Social housing’s debt includes public-private partnership obligations of $76 million for fiscal 2018/19, $71 million for fiscal 2019/20, $66 million for fiscal 2020/21, and $62 million for fiscal 2021/22.
6 Reflects the operating statement forecast allowance for each year (amounts are not cumulative). Since it is unknown as to which agency would require this debt, the forecast allowance is shown as a separate item over the plan.
The self-supported debt of commercial Crown corporations is forecast to increase by $4.6 billion over the fiscal plan period, ending at $28.1 billion. This increase is mainly for capital investments related to improving and expanding British Columbia’s hydro generation assets.
Government’s anticipated borrowing requirements over the fiscal plan period will total $24.6 billion. This total is required to finance government’s new taxpayer-supported ($10.1 billion) and self-supported ($9.6 billion) capital investments, and refinance existing debt maturities ($4.9 billion). These gross borrowing requirements are offset by $5.0 billion in maturing debt that will be retired (see Table 1.25).
Total provincial debt is presented consistent with the Debt Summary Report included in the Public Accounts. Debt is shown net of sinking fund investments and unamortized discounts, excludes accrued interest, and includes non-guaranteed debt directly incurred by commercial Crown corporations and debt guaranteed by the Province.
BUDGET AND FISCAL PLAN - 2019/20 to 2021/22
52
THREE YEAR FISCAL PLAN
Table 1.25 Provincial Borrowing Requirements
| | Updated | | Budget | | | | | |
| | Forecast | | Estimate | | Plan | | Plan | |
($ millions) | | 2018/19 | | 2019/20 | | 2020/21 | | 2021/22 | |
Total provincial debt1 at beginning of year | | 64,919 | | 67,916 | | 72,548 | | 77,659 | |
New borrowing2 | | 6,337 | | 7,454 | | 8,279 | | 8,596 | |
Direct borrowing by Crown corporations and agencies | | 75 | | 45 | | 114 | | 85 | |
Retirement provision3 requiring refinancing | | (2,745 | ) | (905 | ) | (1,928 | ) | (2,087 | ) |
Retirement provision3 funded internally | | (1,170 | ) | (1,962 | ) | (1,154 | ) | (1,877 | ) |
Change in forecast allowance | | 500 | | — | | (200 | ) | — | |
Net change in total debt | | 2,997 | | 4,632 | | 5,111 | | 4,717 | |
Total provincial debt1 at year end | | 67,916 | | 72,548 | | 77,659 | | 82,376 | |
Annual growth in debt (per cent) | | 4.6 | | 6.8 | | 7.0 | | 6.1 | |
1 Provincial debt is prepared in accordance with Generally Accepted Accounting Principles and presented consistent with the Debt Summary Report included in the Public Accounts. Debt is shown net of sinking funds and unamortized discounts, excludes accrued interest, and includes non-guaranteed debt directly incurred by commercial Crown corporations and debt guaranteed by the Province.
2 New long-term borrowing plus net change in short-term debt.
3 Sinking fund contributions, sinking fund earnings and net maturities of long-term debt (after deduction of sinking fund balances for maturing issues).
The reconciliation between provincial debt and the financial statement debt is shown in Appendix Table A16.
Additional details on government’s outstanding debt are provided in Appendix Tables A17 to A19.
Relationship Between Surplus and Debt
In addition to operating results, the change in debt is impacted by reductions in cash and other working capital changes as well as the debt financing requirements of government’s capital plan. Table 1.26 reconciles the forecast surpluses with changes in debt.
Table 1.26 Reconciliation of Summary Results to Provincial Debt Changes
| | Updated | | Budget | | | | | |
| | Forecast | | Estimate | | Plan | | Plan | |
($ millions) | | 2018/19 | | 2019/20 | | 2020/21 | | 2021/22 | |
Taxpayer-supported debt: | | | | | | | | | |
Annual surplus (before forecast allowance) | | (874 | ) | (774 | ) | (587 | ) | (885 | ) |
Reduction in cash balances | | (894 | ) | (280 | ) | 106 | | 123 | |
Other working capital changes | | 35 | | (410 | ) | 228 | | (18 | ) |
Net increase in capital and other assets | | 2,083 | | 3,891 | | 4,323 | | 4,311 | |
| | 350 | | 2,427 | | 4,070 | | 3,531 | |
Self-supported debt: | | | | | | | | | |
Commercial Crown corporation capital financing | | 2,059 | | 2,223 | | 1,261 | | 1,206 | |
Other commercial debt | | 88 | | (18 | ) | (20 | ) | (20 | ) |
| | 2,147 | | 2,205 | | 1,241 | | 1,186 | |
Annual change in forecast allowance | | 500 | | — | | (200 | ) | — | |
Annual increase in total provincial debt | | 2,997 | | 4,632 | | 5,111 | | 4,717 | |
BUDGET AND FISCAL PLAN - 2019/20 to 2021/22
53
THREE YEAR FISCAL PLAN
Risks to the Fiscal Plan
Table 1.27 provides the estimated fiscal impacts of the identified sensitivities for some of the key variables in the fiscal plan projections on an individual basis. However, inter-relationships between the variables may cause the actual variances to be higher or lower than the estimates shown in the table. For example, an increase in the US/CDN dollar exchange rate may be partly offset by higher commodity prices.
Table 1.27 Key Fiscal Sensitivities
| | | | Annual Fiscal Impact | |
Variable | | Increases of | | ($ millions) | |
Nominal GDP | | 1% | | $150 – $250 | |
Lumber prices (US$/thousand board feet) | | $50 | | $150 – $175 1 | |
Natural gas prices (Cdn$/gigajoule) | | 25 cents | | $10 – $40 2 | |
US exchange rate (US cent/Cdn $) | | 1 cent | | -$25 to -$50 | |
Interest rates | | 1 percentage point | | -$93 | |
Debt | | $500 million | | -$16 to -$17 | |
1 Sensitivity relates to stumpage revenue only.
2 Sensitivities can vary significantly especially at lower prices.
The assumptions and risk sensitivities for individual revenue sources and major program areas can be found in Appendix Tables A5 and A6, beginning on page 118.
Own Source Revenue
The main areas that may affect own source revenue forecasts are B.C.’s overall economic performance, the relative health of its major trading partners, the exchange rate and commodity prices.
Revenues are sensitive to economic performance. For example, taxation and other revenue sources are driven by economic factors such as household income, consumer expenditures, housing starts, employment, population growth and the exchange rate. The revenue forecast contained in the fiscal plan is based on the economic forecast detailed in Part 3: British Columbia Economic Review and Outlook. As well, it incorporates commodity price forecasts developed by the Ministry of Forests, Lands, Natural Resource Operations and Rural Development and the Ministry of Energy, Mines and Petroleum Resources based on private sector information.
The more than $800 million of investment incentives provided over the fiscal plan due to B.C. joining with the federal government to enhance competitiveness, assumes a behavioural response from businesses in its acquisition of capital assets. Changes in the timing or strength of the B.C. business response could result in different impacts. Income tax revenue forecasts are based on projections of household income and net operating surpluses of corporations. The forecasts are updated from reports on tax assessments provided by the Canada Revenue Agency. As a result, revenue estimates and tax credits, including film tax credits, can be affected by timing lags in the reporting of current and prior year tax assessments by the Canada Revenue Agency.
Adjustments to the harmonized sales tax entitlements for the years 2010/11 to 2012/13 will continue until 2019/20. These changes, determined by the federal government, could affect the revenue forecast over the three-year plan. However, it is expected that the size of these changes will diminish over time.
BUDGET AND FISCAL PLAN - 2019/20 to 2021/22
54
THREE YEAR FISCAL PLAN
Revenues in British Columbia can also be volatile, largely due to the influence of the cyclical natural resource sector in the economy and the importance of natural resource revenues in the Province’s revenue base. Changes in commodity prices such as natural gas, lumber or coal may have a significant effect on natural resource revenues and economic growth.
The economic and revenue forecasts could be impacted by trade related issues, including the ongoing US-Canada softwood lumber dispute and ratification and implementation of the Canada-United States-Mexico Agreement. The imposition of countervailing and anti-dumping duties by the U.S. on Canadian softwood lumber exports has the effects of increasing market uncertainty and volatility as well as increasing costs for Canadian producers. B.C. disagrees with the views that the lumber industry is subsidized or that it sells lumber into the U.S. at below costs or sales value in Canada and is supporting the federal government in its appeals of the application of duties to the World Trade Organization and under Chapter 19 of the North American Free Trade Agreement.
Over the fiscal plan period, the outlook for forest revenue incorporates declining stumpage rates as lumber prices are forecast to weaken from the current high level, interest rates are projected to rise and the Canadian dollar expected to appreciate against the U.S. dollar. In addition, lower prices and higher interest and exchange rates could result in Canadian producers having to bear more of the costs of the duties on their exports of softwood lumber products into the U.S. Although the recent high lumber prices have partially offset the negative impacts of duties on B.C. exporters, some B.C. communities and residents that are reliant on the forest sector may be adversely affected by the continuing uncertainty and volatility from the trade dispute. Actual results for a number of factors including assumptions for lumber prices, interest and exchange rates could pose risks to the fiscal plan.
Details on major assumptions and sensitivities resulting from changes to those assumptions are outlined in Appendix Table A5.
Federal Government Contributions
Potential policy changes regarding federal government allocations, including health and social transfers and cost-sharing agreements, could affect the revenue and the expenditure forecasts.
Crown Corporations
Crown corporations provided financial forecasts and statements of assumptions approved by their boards, which were used to prepare the fiscal plan. These forecasts, along with further details on assumptions and risks, are also included in the service plans of these corporations and agencies, being released with the budget. However, there is a particular risk that changes to claims cost trend within the Insurance Corporation of British Columbia, given recent volatility, will impact the corporation’s financial results.
SUCH Sector
Health authorities have submitted an overall balanced financial plan for 2019/20 to 2021/22. The individual plans have been signed off by the board chairs of the respective health authorities. The Ministry of Health will continue to work with the health authorities to manage any emerging revenue and spending risks and spending pressures including those associated with opioid emergency response.
BUDGET AND FISCAL PLAN - 2019/20 to 2021/22
55
THREE YEAR FISCAL PLAN
Forecasts for the universities, colleges, and institutions have been signed off by chairs of the board or audit committee and lead financial officers.
Forecasts for the combined school districts have been compiled by the Ministry of Education based on the requirements of the School Act, the current year plans developed by the school districts, and ministry policy assumptions respecting future funding allocations. Variances from these assumptions could impact the fiscal plan.
The fiscal plan incorporates three-year projections for school districts, post-secondary institutions, and health authorities, based on plans submitted by those entities.
Spending
Government funds several demand-driven programs, including those delivered through third-party delivery agencies, such as health care, K—12 and post-secondary education, income assistance, and community social services. The budgets for these programs reflect reasonable estimates of demand and other factors such as price inflation. If demand is higher than estimated, this will result in a spending pressure to be managed.
The spending plans for the Ministry of Forests, Lands, Natural Resource Operations and Rural Development and the Ministry of Public Safety and Solicitor General include base amounts to fight wildfires and deal with other emergencies such as floods. Unanticipated or unpredictable occurrences may affect expenses in these ministries.
Details on major assumptions and sensitivities resulting from changes to those assumptions are shown in Appendix Table A7 and in ministry service plans.
Capital Risks
The capital spending forecasts included in the fiscal plan may be affected by subsequent planning (i.e. design development) and procurement activities (i.e. receipt/review of construction bids) resulting in project costs that are higher than the initial approved budgets. For large capital projects, government will review the budget and scope risks, and the strategies to mitigate these risks.
Other risks impacting capital spending forecasts include:
· changes in the timing of capital project spending, which may reduce borrowing requirements and debt needed to fund capital investments in the near term;
· weather and geotechnical conditions, including the outcome of environmental impact studies, causing project delays and/or unexpected costs;
· changes in market conditions, including service demand, the impact of inflation on building material costs, the availability of and wage rates for skilled workers, and borrowing costs;
· the accuracy of capital project budget and construction schedule forecasts;
· the successful negotiation/timing of cost-sharing agreements with the federal government and other funding partners; and
· the timing and outcomes of public-private sector partnership negotiations.
BUDGET AND FISCAL PLAN - 2019/20 to 2021/22
56
THREE YEAR FISCAL PLAN
Pending Litigation
The spending plan for the Ministry of the Attorney General contains provisions for payments under the Crown Proceeding Act based on estimates of expected claims, judgments, and related costs of settlements likely to be incurred. Litigation developments may occur that are beyond the assumptions used in the plan (for example, higher-than-expected volumes, or size of claim amounts and timing of judgments and settlements). These developments may affect government revenues and/or expenditures in other ministries.
Write-downs and Other Adjustments
Ministry budgets provide for anticipated levels of asset or loan write-downs where estimates can be reasonably predicted. The overall spending forecast does not make allowance for extraordinary items other than the amount provided in the Contingencies vote.
Prudence and Risk
The economic, financial, and external variables and factors that impact the estimates of revenues, expenditures, capital spending and debt will change throughout the year as new information becomes available with potentially material impacts. As a result, the actual operating surplus, capital expenditure and debt figures may differ from the current forecast. Government will continue to update the fiscal plan throughout the year.
Government incorporates four main levels of prudence to help mitigate risks to the budget plan projections. These prudence measures generally have resulted in government positively exceeding its budget targets.
· The Budget 2019 economic outlook is lower than the average of the forecasts provided by the members of the Economic Forecast Council (EFC). The Budget 2019 plan assumes annual real GDP growth of 2.4 per cent in 2019, 2.3 per cent in 2020, 2.1 per cent in 2021 and 2.0 per cent in 2022 and 2023. This is lower than the EFC average by 0.1 percentage point in 2019, 0.3 percentage points in 2020, 0.1 percentage point in 2021 and 0.2 percentage points in 2022 and 2023. The prudent outlook compared to the private sector acknowledges the downside risks to the economic forecast over the forecast horizon.
· The Budget 2019 natural gas price forecast is lower than the private sector average over the next three years, reflecting the recommendation of Dr. Tim O’Neill in 2013 to adopt more caution in preparing the natural gas royalty forecast. Over the ensuing three years, the Budget 2019 natural gas price projection averages 70 cents lower than the average of the private sector forecasters (see Appendix Table A6 for details).
· Budget 2019 includes a forecast allowance of $500 million in 2019/20 and $300 million in each of the two subsequent years. The forecast allowance helps guard against unanticipated revenue volatility and statutory spending such as additional costs to fight wildfires, to deal with other emergencies such as floods, and for litigation developments under the Crown Proceeding Act.
· The Budget 2019 expense forecast also includes a Contingencies vote allocation of $750 million in 2019/20, $400 million per year in 2020/21, and $400 million per year in 2021/22. The Contingencies vote is a prudent measure to help protect the plan from unforeseen and unbudgeted costs that may arise, and to fund priority initiatives.
BUDGET AND FISCAL PLAN - 2019/20 to 2021/22
57
THREE YEAR FISCAL PLAN
· The Budget 2019 expense forecast also includes a Contingencies — Sustainable Services Negotiating Mandate vote allocations of $553 million in 2019/20, $1.183 billion in 2020/21 and $1.827 billion in 2021/22. This is to fund the anticipated costs of concluding the remaining agreements under the Sustainable Services Negotiating Mandate. Ministry base budgets include funding for all ratified agreements reached to date under this mandate.
The EFC provides advice to the Minister of Finance annually on issues facing the global economy and B.C.’s economic outlook including areas of concern, risks and opportunities for the B.C. economy. The Minister of Finance consults with staff and colleagues on the various levels of prudence incorporated in the fiscal plan, tax policy initiatives for consideration and the potential risks that could arise over the next three years. Since the risks could be ongoing or one-time in nature and could impact both revenues and expenditures, consideration is given to both the forecast allowance and Contingencies vote allocations. However, since a number of these risks are not readily quantifiable, there is no specific formulaic approach in the determination of the forecast allowance and Contingencies vote allocations. A discussion of fiscal risks is included in this section of the budget document and risks to the economic outlook are summarized on page 75. See Part 2: Tax Measures for a discussion on tax policy initiatives in Budget 2019.
BUDGET AND FISCAL PLAN - 2019/20 to 2021/22
58
PART 2 | TAX MEASURES
Table 2.1 Summary of Tax Measures
| | | | Taxpayer Impacts | |
| | Effective Date | | 2019/20 | | 2020/21 | |
| | | | ($ millions) | |
Income Tax Act | | | | | | | |
· Introduce a new BC Child Opportunity Benefit | | October 1, 2020 | | — | | (125 | )1 |
· Enhance climate action tax credit | | July 1, 2019 | | (32 | ) | (74 | ) |
· Extend training tax credits | | January 1, 2019 | | (22 | ) | (22 | ) |
· Extend farmers’ food donation tax credit | | January 1, 2020 | | * | | * | |
· Make mining flow-through share tax credit permanent | | January 1, 2019 | | (5 | ) | (6 | ) |
· Make mining exploration tax credit permanent | | Royal assent | | (4 | ) | (20 | ) |
· Extend shipbuilding and ship repair industry tax credit | | January 1, 2020 | | * | | * | |
· Expand pension tax credit | | 2015 tax year | | * | | * | |
· Adjust calculation of tax on split income | | 2018 tax year | | * | | * | |
· Adjust calculation of medical expense tax credit | | 2018 tax year | | * | | * | |
| | | | | | | |
Income Tax Act and Small Business Venture Capital Act | | | | | | | |
· Enhance small business venture capital tax credit program | | Various | | * | | * | |
| | | | | | | |
Mineral Tax Act | | | | | | | |
· Extend new mine allowance | | January 1, 2020 | | — | | — | |
| | | | | | | |
Motor Fuel Tax Act | | | | | | | |
· Enable a motor fuel tax increase of up to 1.5 cents per litre on gasoline and diesel purchased in the South Coast British Columbia Transportation Authority (TransLink) service region | | July 1, 2019 | | 23 | | 30 | |
| | | | | | | |
Provincial Sales Tax Act | | | | | | | |
· Authorize a designation to clarify tax collection, remittance and reporting obligations for sales and leases involving agency | | Royal assent | | — | | — | |
| | | | | | | |
School Act | | | | | | | |
· Set provincial residential class school property tax rates | | 2019 tax year | | * | | * | |
· Set provincial non-residential class school property tax rates | | 2019 tax year | | * | | * | |
| | | | | | | |
Taxation (Rural Area) Act | | | | | | | |
· Set rural area property tax rates | | 2019 tax year | | * | | * | |
| | | | | | | |
Various Acts | | | | | | | |
· Make various technical amendments | | Various | | * | | * | |
| | | | | | | |
Total | | | | (40 | ) | (217 | ) |
1 The BC Child Opportunity Benefit will provide BC families with approximately $380 million per year when fully implemented. The $125 million figure represents the half-year cost of the benefit from October 2020 through March 2021, which is in addition to the approximate annual cost of $130 million for the early childhood tax benefit.
* Denotes measures that have no material impact on taxpayers.
BUDGET AND FISCAL PLAN - 2019/20 to 2021/22
59
TAX MEASURES
Tax Measures — Supplementary Information
For more details on tax changes see:
www.gov.bc.ca/budgettaxchanges
Income Tax Act
New BC Child Opportunity Benefit Introduced
Effective October 1, 2020, a new BC Child Opportunity Benefit will be combined with the early childhood tax benefit into a single new benefit. The new refundable tax credit provides $380 million annually to B.C. families with children under the age of 18.
The maximum benefit is $1,600 for a family’s first child, $1,000 for a second child and $800 for each subsequent child under the age of 18. The new benefit is reduced by four per cent of family net income over $25,000 until it is equivalent to $700 for the first child, $680 for the second child and $660 for each subsequent child under the age of 18.
The new benefit is phased out at a rate of four per cent of family net income over $80,000. The $25,000 and $80,000 thresholds will be indexed to inflation in future years.
The income level at which the new benefit is fully phased out varies based on the number of children in a household. For example, a family with one child will have the new benefit fully phased out at $97,500 of family net income and a family with two children will have the new benefit fully phased out at $114,500 of family net income.
Chart 2.1 BC Child Opportunity Benefit
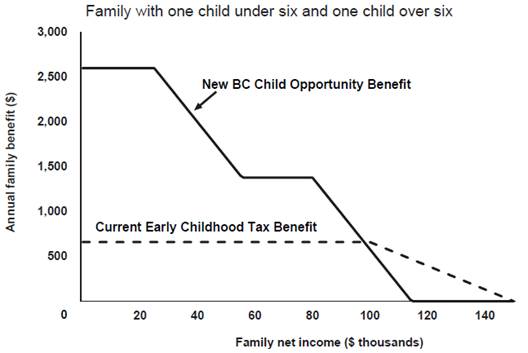
BUDGET AND FISCAL PLAN - 2019/20 to 2021/22
60
TAX MEASURES
The new BC Child Opportunity Benefit supports families with children under 18, whereas the early childhood tax benefit only applies to children under six. This means the new benefit will provide significantly more support for children over their entire childhood. Families earning up to $80,000 of family net income will receive more than three times the total benefit provided under the early childhood tax benefit. The majority of B.C. families with children will receive the new benefit.
Chart 2.2 Child Benefits Over Entire Childhood
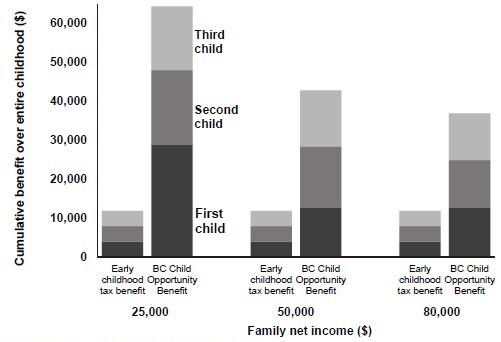
Calculation assumes each child is born two years apart.
This new benefit, combined with the elimination of Medical Services Plan premiums, will provide a significant reduction in the tax burden for lower- and middle-income families with children.
The BC Child Opportunity Benefit will go to 290,000 families. The majority of these families will receive larger benefits under the BC Child Opportunity Benefit than under the early childhood tax benefit.
The new benefit will be administered alongside the federal Canada Child Benefit. Parents who are already registered for the early childhood tax benefit or the Canada Child Benefit before September 30, 2020 will be automatically registered to receive the BC Child Opportunity Benefit. Parents of newborns will be automatically registered for the BC Child Opportunity Benefit if the parent consents on the newborn’s birth certificate application for the BC Vital Statistics Agency to securely share information with the Canada Revenue Agency. Parents of existing children who are not registered for the early childhood tax benefit or the Canada Child Benefit will need to apply to the Canada Revenue Agency for the Canada Child Benefit in order to receive the BC Child Opportunity Benefit.
BUDGET AND FISCAL PLAN - 2019/20 to 2021/22
61
TAX MEASURES
Climate Action Tax Credit Enhanced
Effective July 1, 2019, the maximum annual climate action tax credit is increased to $154.50 from $135 per adult and to $45.50 from $40 per child.
Effective July 1, 2020, the maximum annual climate action tax credit is increased to $174 per adult and to $51 per child.
Effective July 1, 2021, the maximum annual climate action tax credit is increased to $193.50 per adult and to $56.50 per child. As a result of the increases, the climate action tax credit amounts on July 1, 2021 will be almost 70 per cent higher than on July 1, 2017.
Single-parent families will continue to receive the adult amount for the first child in the family.
Training Tax Credits Extended
The training tax credits are extended for one year to the end of 2019.
Farmers’ Food Donation Tax Credit Extended
The farmers’ food donation tax credit is extended for one year to the end of 2020.
Mining Flow-Through Share Tax Credit Made Permanent
As announced on January 28, 2019, the mining flow-through share tax credit is made permanent, effective January 1, 2019.
Mining Exploration Tax Credit Made Permanent
As announced on January 28, 2019, the mining exploration tax credit is made permanent, effective on royal assent.
Shipbuilding and Ship Repair Industry Tax Credit Extended
The shipbuilding and ship repair industry tax credit is extended for three years to the end of 2022.
Pension Tax Credit Expanded
Effective for 2015 and subsequent tax years, the pension tax credit is expanded to apply in respect of certain retirement income security benefits paid to veterans.
Calculation of Tax on Split Income Adjusted
Effective for 2018 and subsequent tax years, the disability tax credit can be applied in calculating the tax on split income.
Calculation of Medical Expense Tax Credit Adjusted
Effective for 2018 and subsequent tax years, split income can be included in the income threshold for calculating the medical expense tax credit.
BUDGET AND FISCAL PLAN - 2019/20 to 2021/22
62
TAX MEASURES
Income Tax Act and Small Business Venture Capital Act
Small Business Venture Capital Tax Credit Program Enhanced
Budget 2019 introduces several changes to modernize and enhance the small business venture capital tax credit program:
· Effective for 2019 and subsequent tax years, the annual tax credit limit that an individual can claim for investments made after February 19, 2019, is increased to $120,000 from $60,000.
· Effective February 20, 2019, the maximum amount that eligible business corporations can raise through the tax credit program is increased to $10 million from $5 million.
· Effective February 20, 2019, advanced commercialization is added as an eligible business activity. The activity is limited to businesses outside the Metro Vancouver Regional District and Capital Regional District.
· Effective February 20, 2019, eligible small businesses and eligible business corporations can engage in activities related to scaling up their business after two years in the tax credit program.
· Effective February 20, 2019, companies are eligible for a reduction in the amount they are required to reimburse the government if they exit the tax credit program after two years, instead of after three years.
· Effective February 20, 2019, share transfers are permitted to a Tax-Free Savings Account and equity purchases within a Tax-Free Savings Account are eligible for tax credits.
· Effective March 2, 2019, investments in convertible equity issued by an eligible business corporation can qualify for a tax credit.
· Technical amendments are also made to clarify requirements to file a certificate with a tax credit return, and to update the name of a regional district.
Mineral Tax Act
New Mine Allowance Extended
The new mine allowance is extended for one year to the end of 2020.
Motor Fuel Tax Act
Motor Fuel Tax Increase of up to 1.5 Cents per Litre on Gasoline and Diesel Purchased in the South Coast British Columbia Transportation Authority (TransLink) Service Region Enabled
Effective July 1, 2019, the Motor Fuel Tax Act is amended to enable the TransLink service region to increase its motor fuel tax rates on clear gasoline and clear diesel from the current rate of 17 cents per litre to a maximum of 18.5 cents per litre.
An increase of 1.5 cents per litre is expected to raise $30 million annually to help the region finance its share of funding for TransLink’s 2018-2027 Investment Plan for transportation improvements.
BUDGET AND FISCAL PLAN - 2019/20 to 2021/22
63
TAX MEASURES
Provincial Sales Tax Act
Designation to Clarify Tax Collection, Remittance and Reporting Obligations for Sales and Leases Involving Agency Authorized
Effective on royal assent, the Provincial Sales Tax Act is amended to authorize a designation to streamline tax collection, reporting and remittance requirements for sales or leases involving agency. When a principal uses an agent to make a sale or lease, or when a billing agent is used to collect payments, the principal and agent can jointly designate a single party to be responsible for tax collection, reporting and remittance obligations. For sales made by auction, an auctioneer acting as agent is automatically designated as the party responsible for collecting, reporting and remitting tax unless the parties jointly elect to assign the obligations to the principal.
School Act
Provincial Residential Class School Tax Rates Set
The long-standing rate-setting policy is that average residential class school property taxes, before the application of the home owner grant, increase by the previous year’s provincial inflation rate. This rate-setting policy has been in place since 2003 and will continue in 2019. The rates will be set in the spring.
Provincial Non-Residential Class School Tax Rates Set
A single provincewide school tax rate is set for each of the non-residential property classes. Consistent with long-standing policy, the rates for 2019, except for the rate for the industrial property classes, will be set so that non-residential class school tax revenue increases by inflation plus new construction. This rate-setting policy has been in place since 2005 and the rates will be set in the spring.
The major industry class tax rate and the light industry class tax rate will be set at the same rate as the business class tax rate, consistent with the policy announced in Budget 2008.
Taxation (Rural Area) Act
Provincial Rural Area Property Tax Rates Set
A single rural area residential property tax rate applies provincewide. The long-standing rate-setting policy that average residential rural property taxes increase by the previous year’s provincial inflation rate will continue for 2019.
Consistent with long-standing policy, non-residential rural area property tax rates will be set so that total non-residential rural area tax revenue will increase by inflation plus new construction. The rates will be set in the spring.
BUDGET AND FISCAL PLAN - 2019/20 to 2021/22
64
TAX MEASURES
Various Acts
Various Technical Amendments Made
Budget 2019 introduces a number of technical amendments to the Income Tax Act, Property Transfer Tax Act, Taxation (Rural Area) Act, Carbon Tax Act, Motor Fuel Tax Act, Provincial Sales Tax Act, Speculation and Vacancy Tax Act, Community Charter and Vancouver Charter for clarity and certainty:
· Effective on royal assent, amendments to the Income Tax Act, Property Transfer Tax Act and Taxation (Rural Area) Act clarify provisions related to the sharing of information between these statutes.
· Effective on royal assent, amendments to the Income Tax Act also:
· allow taxpayer information to be shared to an official for the purposes of administering or enforcing the Workers Compensation Act; and
· clarify the Information and Privacy Commissioner’s ability to access taxpayer information as part of an investigation, audit or inquiry.
· Effective on royal assent, the Carbon Tax Act is amended to introduce a penalty for persons who sell natural gas at the retail level in British Columbia but are not registered as natural gas retail dealers.
· The amendments to the Motor Fuel Tax Act clarify:
· effective retroactive to January 1, 2018, refunds of motor fuel tax security related to sales of relabeled fuel;
· effective retroactive to February 20, 2015, allowance for motor fuel tax collectors; and
· effective on royal assent, appeal rights.
· The amendments to the Provincial Sales Tax Act clarify:
· effective retroactive to April 1, 2013, the tax treatment of vehicles brought into British Columbia to be immediately licensed as multi-jurisdictional vehicles;
· effective on a date to be specified by regulation, refunds for motor vehicles returned to manufacturers;
· effective on royal assent, suspensions and cancellations of collector registrations;
· effective on royal assent, conditions for small seller eligibility;
· effective retroactive to April 1, 2013, the obligation to pay tax when an exemption is not documented;
· effective on royal assent, the timing of tax payments by promotional distributors; and
· effective on royal assent, procedures regarding unspent municipal and regional district tax revenues held by dissolving societies.
· Effective retroactive to November 27, 2018, the amendments to the Speculation and Vacancy Tax Act include correcting typographical errors and:
BUDGET AND FISCAL PLAN - 2019/20 to 2021/22
65
TAX MEASURES
· the Speculation and Vacancy Tax Act provides an exemption for property that is uninhabitable due to a natural disaster or a hazardous condition. The exemption applies when the property is uninhabitable for at least 60 days in a calendar year. The Speculation and Vacancy Tax Act is amended to clarify the application of the exemption to property that is rendered uninhabitable at the end of a calendar year. This amendment will ensure the exemption operates as intended; and
· clarify that the tax due date of additional tax as a result of a Speculation and Vacancy Tax Act assessment due to a consequential assessment under another act is the later of 30 days after the Speculation and Vacancy Tax Act assessment or the annual tax due date.
· Effective for the 2019 and subsequent tax years, amendments to the Community Charter and Vancouver Charter clarify the application of the assessment averaging provisions.
BUDGET AND FISCAL PLAN - 2019/20 to 2021/22
66
PART 3 | BRITISH COLUMBIA ECONOMIC REVIEW AND OUTLOOK1
Summary
The B.C. Ministry of Finance (Ministry) estimates that British Columbia’s economy grew by 2.2 per cent in 2018. The Ministry forecasts economic growth of 2.4 per cent in 2019, 2.3 per cent in 2020, 2.1 per cent in 2021 and 2.0 per cent in 2022 and 2023.
An average of six private sector forecasters2 estimate that B.C. tied for the second strongest growth in real GDP among provinces in 2018. These forecasters expect B.C.’s economic growth to rank at the top of the provincial rankings in 2019 and 2020.
The Ministry’s forecast for B.C. real GDP growth is below the outlook provided by the Economic Forecast Council with 0.1 percentage point of prudence in 2019, 0.3 percentage points in 2020, 0.1 percentage point in 2021 and 0.2 percentage points in 2022 and 2023. This differential is one of the levels of prudence built into the fiscal plan.
Chart 3.1 British Columbia’s Economic Outlook
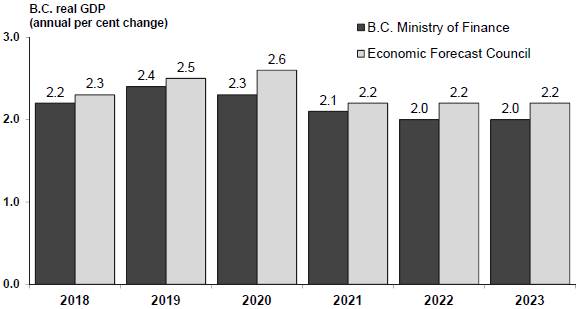
Note: Economic Forecast Council projection for 2021 to 2023 is based on the period average.
The main upside risks to the economic outlook include less domestic monetary policy tightening, a weaker Canadian dollar and a more resilient U.S. economy. The main downside risks include uncertainty regarding global trade policy, weakening global economic activity, lower commodity prices, as well as ongoing economic challenges in Asia and the euro zone.
British Columbia Economic Activity and Outlook
The Ministry’s estimate for B.C. real GDP growth in 2018 remains unchanged from the projection in the First Quarterly Report 2018 at 2.2 per cent. Employment and exports performed better than expected and investment was positive, with some moderation in housing activity and consumer spending through the year.
1 Reflects information available as of February 6, 2019, unless otherwise indicated.
2 A subset of the Economic Forecast Council that regularly forecasts economic performance in all provinces (BMO, CIBC, National Bank, RBC, Scotiabank and TD), as of February 6, 2019.
BUDGET AND FISCAL PLAN - 2019/20 to 2021/22
67
BRITISH COLUMBIA ECONOMIC REVIEW AND OUTLOOK
The Ministry’s forecast for B.C. real GDP growth has increased from 1.8 per cent to 2.4 per cent in 2019 and from 2.0 per cent to 2.3 per cent in 2020, compared to the last forecast, published in the First Quarterly Report 2018. The changes partly reflect recent developments regarding the Canada-United States-Mexico Agreement (CUSMA) and the final investment decision on the LNG Canada project. The economic growth outlook for 2021 is 2.1 per cent, followed by 2.0 per cent in both 2022 and 2023, in line with previous expectations.
Table 3.1 British Columbia Economic Indicators
| | Third Quarter | | Fourth Quarter | | Annual | |
| | Jul. to Sep. 2018 | | Oct. to Dec. 2018 | | Jan. to Dec. 2018 | |
Data seasonally adjusted unless | | change from | | change from | | change from | |
otherwise stated | | Apr. to Jun. 2018 | | Jul. to Sep. 2018 | | Jan. to Dec. 2017 | |
| | Per cent change | | Per cent change | | Per cent change | |
Employment | | +0.9 | | +1.4 | | +1.1* | |
Manufacturing shipments1 | | +0.9 | | -2.0 | | +8.7 | |
Exports1 | | +0.3 | | -1.5 | | +7.3 | |
Retail sales1 | | -1.3 | | +0.8 | | +2.3 | |
Housing starts | | -2.7 | | +4.9 | | -6.4* | |
Non-residential building permits | | +59.8 | | +29.9 | | +34.7* | |
* annual non-seasonally adjusted data | | 1 Data to November | | | |
Labour Market
In 2018, labour market conditions in B.C. remained tight, highlighted by the lowest unemployment rate in the country. Employment grew by 1.1 per cent in 2018, reaching a record high level in December. Of the total 26,800 net new jobs created in 2018, the majority were full-time (+24,700 jobs). The number of job gains last year were fairly evenly distributed among the private sector, public sector and the self-employed. Employment gains, seen in both the goods and the service producing sectors, were led by the health care and social assistance sector (+19,700 jobs), the professional, scientific and technical services sector (+11,300 jobs), and the construction sector (+9,800 jobs). Employment declines were mainly observed in the information, culture and recreation sector (-9,200 jobs), the wholesale and retail trade sector (-5,600 jobs), and the finance, insurance, real estate, rental and leasing sector (-5,400 jobs).
Chart 3.2 B.C. Employment
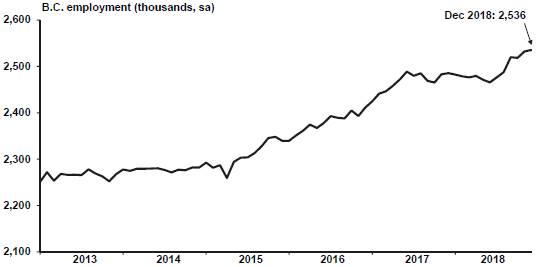
Source: Statistics Canada; Haver Analytics
BUDGET AND FISCAL PLAN - 2019/20 to 2021/22
68
BRITISH COLUMBIA ECONOMIC REVIEW AND OUTLOOK
B.C.’s unemployment rate fell to its lowest annual level since the 2008/09 recession, averaging 4.7 per cent in 2018, down from 5.1 per cent in 2017. The labour force grew by 0.6 per cent in 2018. A slowdown in labour force growth is contributing to hiring challenges as B.C.’s job vacancy rate has consistently been one of the highest among provinces since early 2015. Tight labour market conditions supported an acceleration of average weekly wage growth in B.C., which in 2018 grew at 4.1 per cent, the strongest rate in a decade.
Outlook
For 2019, the Ministry forecasts a 1.1 per cent increase in B.C.’s employment (approximately 27,100 jobs). Employment growth of 1.0 per cent is expected in 2020 and over the remainder of the forecast horizon. B.C.’s unemployment rate is expected to average 4.9 per cent in 2019 and 5.1 per cent in 2020, before gradually rising to average around 5.5 per cent over the medium-term.
Consumer Spending and Housing
B.C. nominal retail sales rose moderately in 2018, supported by employment gains, solid consumer confidence and increased tourism. Year-to-date to November 2018, retail sales rose by 2.3 per cent compared to the same period of 2017. Notable gains were observed at clothing and clothing accessories stores (+9.8 per cent), gasoline stations (+4.2 per cent) and food and beverage stores (+2.7 per cent). Declines were limited to motor vehicle and parts dealers (-0.5 per cent) and health and personal care stores (-0.4 per cent).
Chart 3.3 B.C. Retail Sales
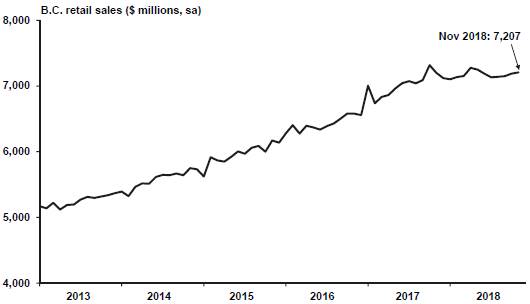
Source: Statistics Canada; Haver Analytics
Following years of worsening affordability, B.C.’s housing market is shifting toward more moderate conditions. Several factors are contributing to this transition, including the implementation of provincial and federal policy measures alongside gradually increasing interest rates.
Although housing starts declined from 43,664 units in 2017 to 40,857 units in 2018, they remained well above the historical average of almost 30,000 units.
BUDGET AND FISCAL PLAN - 2019/20 to 2021/22
69
BRITISH COLUMBIA ECONOMIC REVIEW AND OUTLOOK
Chart 3.4 B.C. Housing Starts

Source: Canada Mortgage and Housing Corporation; Haver Analytics
* Historical average from Jan. 1990 to Dec. 2017
Meanwhile, the value of residential building permits — a leading indicator of new home construction — increased 17.8 per cent in 2018 compared to 2017. An increase in the issuance of multiple-unit permits (+33.0 per cent) more than offset the decline of single-unit permits (-7.1 per cent).
The number of B.C. home sales decreased in 2018, starting with declines of 11.1 per cent in January and 14.0 per cent in February. The downward trend in home sales continued throughout the year, with home sales down by 24.5 per cent in 2018 compared to 2017.
Chart 3.5 B.C. Home Sales and Price

Source: Canadian Real Estate Association; Haver Analytics
The average home sale price in B.C. increased by 0.4 per cent in 2018, the smallest annual increase since 2012. Many regional markets have seen a moderation in price growth in recent months, including some price declines.In Greater Vancouver, the benchmark price for single family homes, townhouses and apartments were down 7.2 per cent, 5.3 per cent, and 6.4 per cent, respectively, between June and December 2018 (see Chart 3.6).
BUDGET AND FISCAL PLAN - 2019/20 to 2021/22
70
BRITISH COLUMBIA ECONOMIC REVIEW AND OUTLOOK
Chart 3.6 Greater Vancouver HPI Benchmark Price

Source: Canadian Real Estate Association; Haver Analytics
Outlook
The Ministry forecasts real household consumption of goods and services to increase by 2.7 per cent in 2019 and by 2.9 per cent in 2020, where it is expected to remain over the 2021 to 2023 period.
The Ministry expects nominal retail sales to rise by 3.9 per cent in 2019, 4.0 per cent in 2020, and average around 3.8 per cent growth annually over the medium-term.
The Ministry anticipates B.C.’s housing market to transition toward more sustainable levels and more balanced conditions. As such, the Ministry forecasts the total value of home sales to increase by a modest 3.0 per cent in 2019, 4.4 per cent in 2020, followed by annual growth of about 4.6 per cent in the medium-term. The average home sale price in B.C. is expected to increase moderately over the forecast horizon.
The Ministry continues to expect housing starts to trend towards B.C.’s historical long-run average over the forecast horizon. Housing starts are higher than previously forecast in the First Quarterly Report 2018. Housing starts are expected to total around 34,000 units in 2019, 31,800 units in 2020, and 30,500 units annually in the medium-term.
Business and Government
Total real investment in B.C. (business and government) increased by an estimated 7.2 per cent in 2018.
Real business investment increased by an estimated 5.8 per cent in 2018. For the second consecutive year, the growth in business investment was led by growth in non-residential structures. Gains were also observed in other investment categories.
On October 1, 2018, LNG Canada announced its final investment decision to build the LNG Canada facility in Kitimat, B.C. As such, the Ministry’s Budget 2019 economic forecast includes the LNG Canada project. The project is expected to generate a significant amount of economic activity which will support B.C.’s economy.
Real expenditure on goods and services by all levels of government is estimated to have increased by 2.9 per cent in 2018.
BUDGET AND FISCAL PLAN - 2019/20 to 2021/22
71
BRITISH COLUMBIA ECONOMIC REVIEW AND OUTLOOK
Outlook
Total real investment in B.C. (business and government) is forecast to grow by 8.2 per cent in 2019, 4.6 per cent in 2020 and average around 1.5 per cent annually over the medium-term.
Real business investment is projected to grow by 8.6 per cent in 2019, with gains expected in all categories (residential, non-residential, machinery and equipment, and intellectual property). Looking further ahead, business investment is forecast to grow by 5.2 per cent in 2020 and average around 1.9 per cent growth annually in the medium-term.
Real expenditure on goods and services by all levels of government is forecast to increase by 2.1 per cent in 2019, before remaining relatively flat over the medium-term.
Following estimated growth of 4.2 per cent in 2018, the Ministry expects the net operating surplus of corporations (an approximation of corporate profits) to grow by 0.3 per cent in 2019 and by 4.3 per cent in 2020, before averaging around 3.0 per cent growth annually in the medium-term.
External Trade and Commodity Markets
B.C.’s diverse range of exportable goods and expansive base of trading partners helped exports continue their strong performance in 2018. Despite mounting global uncertainty, escalating trade tensions and commodity price volatility, the value of B.C. merchandise exports increased 7.3 per cent year-to-date to November 2018 compared to the same period in the previous year. Exports performed particularly well in the first half of 2018. Softwood lumber prices and, to a lesser degree, metal prices fell during the second half of 2018, resulting in softening export growth through the latter part of the year.
Year-to-date, gains were relatively broad-based across most export categories, with notable advances in pulp and paper exports (+23.8 per cent), consumer goods (+11.9 per cent), and metal and non-metallic mineral products (+11.0 per cent). Despite elevated lumber prices in the first half of the year, the value of softwood lumber exports decreased by 1.0 per cent year-to-date to November 2018, reflecting lower prices in the second half of the year and declines in the volume of softwood lumber exported to B.C.’s two largest trading partners, the U.S. and China.
Merchandise exports to U.S. and non-U.S. destinations grew 2.8 and 12.1 per cent, respectively, year-to-date to November 2018 compared to the same period of 2017. While the U.S. remains B.C.’s primary goods export destination, year-to-date to November 2018, exports to Asian destinations accounted for over one third of the province’s total goods exports.
B.C.’s manufacturing shipments were a source of strength last year, advancing by 8.7 per cent year-to-date to November 2018 compared to the same period of 2017. Broad-based gains were observed across most segments, with notable increases in each of the three biggest categories: the shipment of wood products (+5.3 per cent), food products (+5.9 per cent), and paper products (+22.9 per cent).
In line with a slowing global economy, most commodity prices experienced declines in the second half of 2018. A major correction was observed in the price of lumber as supply and transportation capacity improved alongside moderating U.S. demand. Despite the price of Western spruce-pine-fir (SPF) 2x4 lumber falling from $642 US/000 board feet in June to $336 US/000 board feet in December, the price
BUDGET AND FISCAL PLAN - 2019/20 to 2021/22
72
BRITISH COLUMBIA ECONOMIC REVIEW AND OUTLOOK
Chart 3.7 B.C. Exports
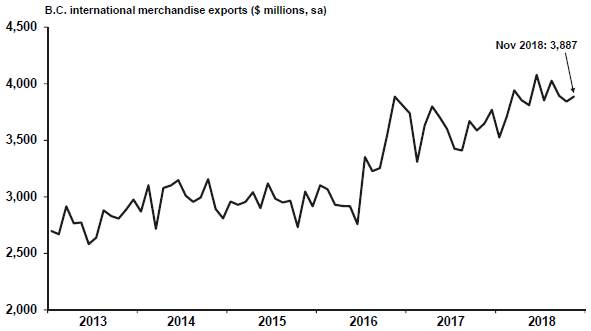
Source: BC Stats
of SPF lumber averaged $496 US/000 board feet in 2018, up 20.9 per cent from the previous year. The price of pulp remained above the $1,000 US/tonne mark through the year, a level not seen since July 2011, to average $1,184 US/tonne in 2018, an increase of 32.5 per cent compared to 2017.
After gradually rising since February 2016, the West Texas Intermediate (WTI) crude oil price fell from over $70 US/barrel to below $50 US/barrel through the fourth quarter of 2018. The price decline reflected concerns about additional supply, including from Iran, and a lower global demand outlook. Despite the price decline, the WTI daily oil price averaged $65.23 US/barrel in 2018, an increase of 28.4 per cent from the previous year. The plant inlet price of natural gas fell throughout last year, weakened by a combination of oversupply, transportation interruptions and tepid demand. The plant inlet price averaged just $0.65 C/GJ in 2018, down 42.8 per cent from 2017. Towards the end of 2018, the price of natural gas saw some support due to colder-than-expected weather.
Although metal prices have generally continued to strengthen, the second half of 2018 saw prices fall for most metals. On an annual basis prices for gold, copper, zinc and molybdenum all increased in 2018 compared to 2017, while the price of silver and lead declined. Over the same period, the price of metallurgical coal grew by 10.7 per cent.
Outlook
Following an estimated gain of 2.3 per cent in 2018, real exports of goods and services are forecast to increase by 1.2 per cent in 2019. The pace of export growth is projected to improve in 2020 and beyond, supported by gradual advancements in the global economy. The ratification and implementation of the CUSMA is expected to provide additional support for B.C. exports. As such, exports are forecast to grow by 1.6 per cent in 2020 and average 1.7 per cent annual growth over the medium-term.
The price of lumber is forecast to average $380 US/000 board feet in 2019 and $375 US/000 board feet in 2020, before gradually easing to average around $350 US/000 board feet over the medium-term. The plant inlet price for natural gas is expected to average $0.72 C/GJ in 2019/20, $0.83 C/GJ in 2020/21, and $0.99 C/GJ in 2021/22. The outlook is subject to considerable uncertainty, as commodity prices can be volatile.
BUDGET AND FISCAL PLAN - 2019/20 to 2021/22
73
BRITISH COLUMBIA ECONOMIC REVIEW AND OUTLOOK
Demographics
On July 1st, 2018, B.C. had a population of 4.99 million people, up 1.4 per cent from the same date in 2017. The most recent population figures show that B.C.’s population exceeded 5 million for the first time in the third quarter of 2018. On a net basis, during the first three quarters of 2018, the province welcomed 57,775 new residents from outside the province, an increase of 6.7 per cent compared to the same period of 2017. Over 90 per cent of these new migrants relocated to B.C. from other countries. As economic conditions improved in other provinces, net interprovincial migration to B.C. eased in recent quarters. In the third quarter of 2018, net migration from B.C. to other provinces totaled 1,217 people. The change in interprovincial migration primarily reflects weaker migration flows from Alberta and Ontario, historically the two biggest contributors to interprovincial migration to B.C.
Outlook
B.C.’s July 1st population is projected to increase by 1.3 per cent annually over the forecast horizon.
Total net migration of about 53,500 people is expected in 2019, with nearly 80 per cent coming from outside of Canada. Looking beyond, net migration is projected to be around 56,300 persons in 2020 and between 57,200 and 60,300 persons annually over the medium-term.
Inflation
B.C.’s annual CPI inflation rate was 2.7 per cent in 2018. Price growth increases were broad-based and included most components of the consumer price index such as transportation (+4.7 per cent), shelter (+3.2 per cent), and food (+1.7 per cent). Meanwhile, price growth weakened for energy (+7.4 per cent), recreation, education and reading (+1.6 per cent), and health and personal care (+1.4 per cent).
Chart 3.8 B.C. Inflation
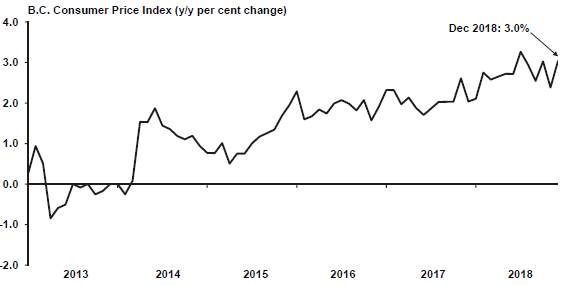
Source: Statistics Canada; Haver Analytics
BUDGET AND FISCAL PLAN - 2019/20 to 2021/22
74
BRITISH COLUMBIA ECONOMIC REVIEW AND OUTLOOK
Outlook
Consumer price inflation in B.C. is forecast to be 2.2 per cent in 2019 and 2.1 per cent in 2020, before slowing to average 2.0 per cent annually from 2021 to 2023. For Canada, the annual rate of inflation is also assumed to be 2.0 per cent (the Bank of Canada’s inflation target) over the medium-term.
Risks to the Economic Outlook
The main upside risks to B.C.’s economic outlook include less domestic monetary policy tightening, a weaker Canadian dollar, and a more resilient U.S. economy. The key downside risks include the following:
· uncertainty regarding global trade policy, including tariffs and the softwood lumber dispute;
· weakening global economic activity, with slowing growth in Asia and other regions, resulting in weaker demand for B.C.’s commodity exports;
· lower commodity prices, in particular, natural gas, lumber and coal;
· the risk of disruption to Europe’s economic growth as it faces the challenges of the U.K. exiting the European Union and elevated sovereign debt;
· timing of investment and hiring related to the LNG Canada project;
· stronger than expected impacts of past and future monetary policy tightening on interest rate sensitive sectors; and,
· exchange rate volatility.
External Outlook
Financial market volatility, increased global trade uncertainty and concerns over more moderate economic growth in China contributed to a gradual slowdown in global economic growth in the second half of 2018. The weaker handoff from the second half of 2018 is expected to weigh on global growth going forward. As the US Federal Reserve continues to normalize interest rates, some emerging markets could experience weaker economic growth caused by capital outflows. Additionally, commodity price volatility and increased costs of U.S. dollar-denominated debt could pose a challenge to economic growth in certain emerging markets.
United States
The U.S. economy grew by a 3.4 per cent annualized rate in the third quarter of 2018, down from 4.2 per cent in the second quarter. Third quarter growth was supported by increased consumer spending, a strong labour market and the buildup of inventories ahead of the implementation of tariffs. Weakness was observed in the housing market as affordability waned and in exports where trade tensions, especially between the U.S. and China, increased uncertainty. The recent U.S. government shutdown is expected to disrupt GDP growth in the fourth quarter of 2018 and subsequent quarters, temporarily.
The U.S. labour market performed particularly well in 2018 and continued its trend of job gains. On average, over 220,000 jobs were created each month and the unemployment rate averaged 3.9 per cent, a level not seen since 1969. Employment in both service producing and goods producing sectors increased in 2018, by 1.4 per cent and 3.1 per cent, respectively. Average weekly earnings increased 3.3 per cent compared
BUDGET AND FISCAL PLAN - 2019/20 to 2021/22
75
BRITISH COLUMBIA ECONOMIC REVIEW AND OUTLOOK
Chart 3.9 U.S. Economic Growth
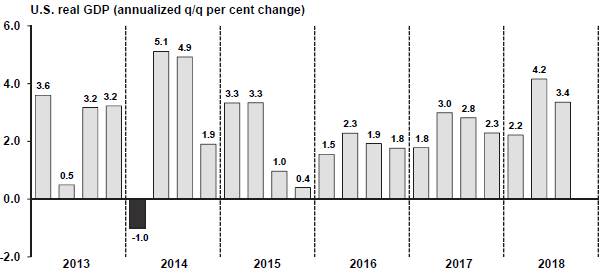
Source: U.S. Bureau of Economic Analysis; Haver Analytics
to 2017. In January 2019, the U.S. added 304,000 jobs and the unemployment rate rose marginally to 4.0 per cent.
U.S. housing starts increased 4.7 per cent year-to-date to November 2018 compared to the same period in the previous year. However, the monthly data suggest a slowdown in the second half of 2018 as increasing home sale prices and interest rates have put pressure on affordability. Year-to-date to November 2018, residential building permits rose 2.3 per cent compared to the first eleven months of 2017. Home sales activity was mixed in 2018 as new home sales advanced 2.3 per cent year-to-date to November compared to the same period in 2017, while existing home sales declined 3.0 per cent overall in 2018 compared to 2017. New home sale prices increased 0.7 per cent year-to-date to November, while sale prices for existing homes increased 4.6 per cent in 2018 compared to 2017.
Chart 3.10 U.S. Housing Starts
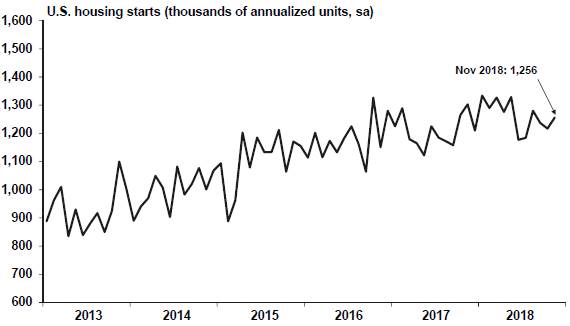
Source: U.S. Census Bureau; Haver Analytics
BUDGET AND FISCAL PLAN - 2019/20 to 2021/22
76
BRITISH COLUMBIA ECONOMIC REVIEW AND OUTLOOK
Year-to-date to November 2018, U.S. nominal retail sales increased by 5.2 per cent compared to the same period in 2017. Meanwhile, U.S. consumer confidence strengthened year-over-year, supported by strong employment and rising wages. However, recently declines have been observed in consumer expectations, suggesting potential concern over an economic slowdown.
Outlook
Consensus Economics (Consensus) forecasters have downgraded their near-term projections for U.S. economic growth. The January 2019 Consensus survey forecasts 2.5 per cent U.S. real GDP growth in 2019, down from previous projections (see Chart 3.11). For 2020, the Consensus forecasts the U.S. economy to grow by 1.8 per cent.
Chart 3.11 Consensus Outlook for the U.S. in 2019
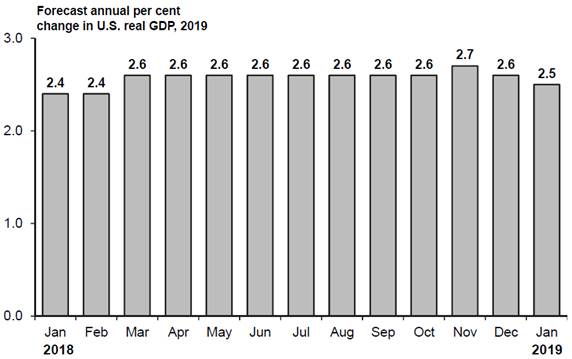
Source: Consensus Economics
The chart above represents forecasts for U.S. real GDP growth in 2019 as polled on specific dates. For example, forecasters surveyed on January 8, 2018 had an average 2019 U.S. real GDP growth forecast of 2.4 per cent, while on January 14, 2019 they forecast 2019 U.S. real GDP to grow by 2.5 per cent.
A combination of unresolved trade issues, rising interest rates curbing consumer spending and business investment, and the waning of U.S. fiscal stimulus are expected to soften U.S. GDP growth going forward. In recognition of uncertainty regarding the U.S. outlook, the Ministry’s assumptions for U.S. GDP growth are lower than the January 2019 Consensus. The Ministry assumes that U.S. real GDP will increase by 2.2 per cent in 2019 and by 1.7 per cent annually from 2020 to 2023.
Table 3.2 U.S. Real GDP Forecast: Consensus versus B.C. Ministry of Finance
| | 2019 | | 2020 | |
| | Per cent change in real GDP | |
B.C. Ministry of Finance | | 2.2 | | 1.7 | |
Consensus Economics (January 2019) | | 2.5 | | 1.8 | |
BUDGET AND FISCAL PLAN - 2019/20 to 2021/22
77
BRITISH COLUMBIA ECONOMIC REVIEW AND OUTLOOK
Canada
On a year-to-date basis through the first three quarters of 2018, the Canadian economy grew 2.1 per cent compared to the same period of 2017. Canadian real GDP growth slowed to an annualized rate of 2.0 per cent in the third quarter of 2018, down from 2.9 per cent in the second quarter. The pace of household consumption growth slowed over this time as households continued to adjust to increasing interest rates and a moderation in the housing sector. Export growth also slowed, while business investment in non-residential structures and machinery and equipment posted their first material quarter-over-quarter decline since the fourth quarter of 2016.
Chart 3.12 Canadian Economic Growth
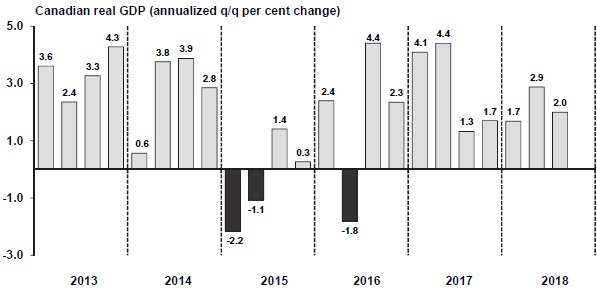
Source: Statistics Canada; Haver Analytics
The Canadian labour market continued to perform reasonably well in 2018. Canadian employment grew by 1.3 per cent in 2018, down from 1.9 per cent in 2017. However, the labour force grew by only 0.8 per cent, pushing the unemployment rate down 0.5 percentage points to 5.8 per cent, the lowest level on record, while average weekly earnings increased by 3.0 per cent, the highest growth rate since 2012. The Canadian housing market moderated through 2018, with housing starts declining 3.1 per cent compared to 2017, totaling just under 213,000 units. Home sales fell 11.1 per cent in 2018, while the average home sale price was $488,699 in 2018, down 4.1 per cent from 2017, the first annual decline since 2008 and the biggest annual decline since 1995. The moderation in Canadian housing market activity follows last year’s implementation of provincial and federal policy measures alongside rising interest rates.
National nominal retail sales increased by 2.8 per cent year-to-date to November 2018 compared to the first eleven months of 2017, slower than the annual pace observed in 2017 and 2016. Canadian household debt averaged 177.6 per cent of disposable income in the first three quarters of 2018, largely unchanged from the same period of 2017. The value of Canadian merchandise exports increased by 7.2 per cent year-to-date to November 2018. Meanwhile, shipments of Canadian manufactured goods advanced by 5.8 per cent year-to-date to November 2018, led by increases in the value of shipments of petroleum and coal products (+17.3 per cent).
BUDGET AND FISCAL PLAN - 2019/20 to 2021/22
78
BRITISH COLUMBIA ECONOMIC REVIEW AND OUTLOOK
On July 1st, 2018, Canada’s population was 1.4 per cent higher than on the same date the previous year, making it the highest population growth in Canada since July 1st,1990, and the highest among all G7 countries. Since the late 1990s, international migration has been the main source of population growth in Canada. From July 1st, 2017 to July 1st, 2018, international migration accounted for more than three quarters of the population growth, a share never observed before.
Outlook
The January 2019 Consensus forecasts Canadian real GDP to grow by 1.8 per cent in both 2019 and 2020. Over the last few months, the Consensus forecasts for the Canadian economy have gradually been revised down (see Chart 3.13).
Chart 3.13 Consensus Outlook for Canada in 2019
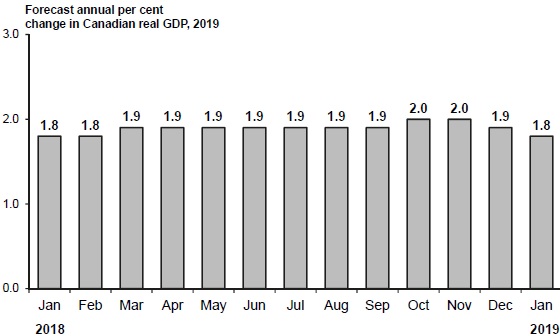
Source: Consensus Economics
The chart above represents forecasts for Canadian real GDP growth in 2019 as polled on specific dates. For example, forecasters surveyed on January 8, 2018 had an average 2019 Canadian real GDP growth forecast of 1.8 per cent and on January 14, 2019 they again forecast 2019 Canadian real GDP to grow by 1.8 per cent.
The Bank of Canada has recently noted expanding foreign demand, increased immigration targets, and high employment as support to the Canadian economy going forward. Meanwhile, the recent decline in oil prices and subsequent temporary curtailment of oil production in Alberta is expected to dampen Canadian GDP growth in the fourth quarter of 2018 and into 2019. The Canadian economic outlook is susceptible to the timing and details regarding the ratification and implementation of the CUSMA. In addition, less accommodating monetary policy and a continued slowdown of the housing market may weigh on economic growth. The Ministry’s outlook is lower than the Consensus and assumes that the Canadian economy will expand by 1.6 per cent annually over the forecast horizon.
Table 3.3 Canadian Real GDP Forecast: Consensus versus B.C. Ministry of Finance
| | 2019 | | 2020 | |
| | Per cent change in real GDP | |
B.C. Ministry of Finance | | 1.6 | | 1.6 | |
Consensus Economics (January 2019) | | 1.8 | | 1.8 | |
BUDGET AND FISCAL PLAN - 2019/20 to 2021/22
79
��
BRITISH COLUMBIA ECONOMIC REVIEW AND OUTLOOK
Asia
China’s economic growth is slowing in line with its maturing economy. In addition, the ongoing trade dispute between the U.S. and China, and the Chinese government’s fiscal policies aimed at increasing financial stability are weighing on economic growth. China’s economy grew 6.6 per cent in 2018, following 6.8 per cent growth in 2017. A lengthy or escalating trade dispute with the U.S. could negatively impact China and other countries in Asia, adding additional headwinds to global economic growth. Going forward, inflation in China is expected to remain low, allowing for more accommodating monetary policies and the People’s Bank of China has signalled its intentions to use various monetary policy tools aimed at promoting sustainable economic growth.
Japan’s economy contracted at a 2.5 per cent annualized rate in the third quarter of 2018 after expanding 2.8 per cent in the second quarter and contracting 1.3 per cent in the first quarter. Natural disasters disrupted private consumption and exports of goods and services, both of which contracted in the third quarter compared to the previous quarter. Despite a tight labour market and higher energy prices, inflation remains below the Bank of Japan’s 2 per cent target. As such, monetary policies in Japan remain highly accommodative. Looking ahead, a planned consumption tax increase in late 2019 could present challenges to near-term economic growth, while slower global economic growth and increased trade tensions could present additional challenges to the Japanese economy. The Japanese government has, with some success, increased the female labour force participation rate, retained older workers and increased the use of foreign labour.
Outlook
The January 2019 Consensus forecasts China’s real GDP to grow by 6.2 per cent in 2019 and 6.1 per cent in 2020. The Ministry assumes that China’s GDP will expand by 6.0 per cent in 2019, and by 5.8 per cent annually from 2020 to 2023.
The January 2019 Consensus forecasts Japan’s economy to expand by 1.0 per cent in 2019 and 0.4 per cent in 2020. The Ministry assumes that Japan’s real GDP will increase by 0.8 per cent in 2019 and 0.3 per cent in 2020. Over the medium-term, Japan’s economy is forecast to average 0.7 per cent growth annually.
Europe
Preliminary estimates indicate that euro zone real GDP grew 1.8 per cent in 2018, down from 2.5 per cent in 2017 and the slowest growth in four years. Concerns over global tariffs have weighed on business sentiment and exports, both of which have softened since the beginning of 2018. Meanwhile, the labour market has continued to strengthen, and the unemployment rate for the euro zone as a whole fell to a 10 year low in 2018. Unemployment rates vary greatly among the member countries, from 2.1 per cent in Czechia (December 2018) and 3.3 per cent in Germany (December 2018) to 14.3 per cent in Spain (December 2018) and 18.6 per cent in Greece (October 2018).
The monetary policy stimulus that was in place to support domestic prices ended in December 2018. However, the European Central Bank has reiterated its intentions to maintain favorable liquidity conditions. The European Central Bank is expecting the key interest rate, currently at 0.0 per cent, to remain at present levels at least through the summer of 2019.
BUDGET AND FISCAL PLAN - 2019/20 to 2021/22
80
BRITISH COLUMBIA ECONOMIC REVIEW AND OUTLOOK
Economic growth in the U.K. improved through the first three quarters of 2018. The economy expanded by 2.5 per cent annualized in the third quarter of 2018, after growing 0.3 per cent and 1.7 per cent annualized in the first two quarters of 2018, respectively. Business investment has been a source of weakness, falling in three consecutive quarters. The greatest downside risk to the U.K.’s economy is the increasing uncertainty regarding Brexit, which is weighing on financial markets.
Outlook
The January 2019 Consensus forecasts the euro zone economy to expand by 1.5 per cent in 2019 and 1.4 per cent in 2020. The euro zone economy still faces significant challenges, such as elevated sovereign debt, the U.K.’s exit from the European Union and weaker export markets due to the global economic slowdown. The Ministry therefore assumes that the euro zone’s economy will grow by 1.3 per cent annually over the forecast horizon.
Financial Markets
Interest Rates
On January 9, 2019, the Bank of Canada maintained its target for the overnight rate at 1.75 per cent, noting that global economic growth, particularly in the U.S., is expected to moderate through 2019. The overnight target rate has increased five times starting in July 2017, moving up by 0.25 percentage point increments. Consumer interest rates have risen accordingly. Over that same period, the benchmark posted rate on a five-year fixed mortgage from the chartered banks has gradually increased from 4.64 per cent to 5.34 per cent, the highest level since April 2012. With its latest policy announcement, the Bank of Canada reiterated its expectation that interest rates will continue to rise to a neutral range (estimated to be between 2.50 per cent and 3.50 per cent) in order to achieve the inflation target of 2 per cent.
Chart 3.14 Interest Rate Forecasts
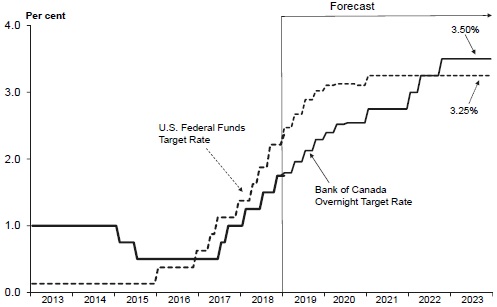
Source: Bank of Canada; US Federal Reserve; B.C. Ministry of Finance
BUDGET AND FISCAL PLAN - 2019/20 to 2021/22
81
BRITISH COLUMBIA ECONOMIC REVIEW AND OUTLOOK
Starting in December 2016, the US Federal Reserve has increased its federal funds rate by 0.25 percentage point increments eight times to reach a target range of 2.25-2.50 per cent. On January 30, 2019, the US Federal Reserve maintained this target for its key interest rate and noted that recent global economic and financial developments warrant a patient approach in determining future monetary policy adjustments.
Outlook
Both the Bank of Canada and the US Federal Reserve are expected to continue to tighten monetary policies over the forecast horizon, albeit gradually. The Bank of Canada emphasized concern over trade conflicts weighing on global demand. In addition, the recent volatility seen in the oil market and the softening of the domestic housing market will influence the timing of future increases to the overnight target rate. Similarly, the US Federal Reserve noted the need for continued assessment of economic conditions to determine the timing and frequency of future interest rate adjustments. Based on the average of six private sector forecasts as of January 3, 2019, the Ministry anticipates the Bank of Canada’s overnight target rate to average 2.04 per cent in 2019 and 2.50 per cent in 2020. By comparison, the U.S. federal funds rate is expected to average 2.76 per cent in 2019 and 3.12 per cent in 2020.
The Canadian three-month treasury bill interest rate is expected to average 2.05 per cent in 2019 and 2.45 per cent in 2020, according to the same six private sector forecasters. Meanwhile, the ten-year Government of Canada bond rate is forecast at 2.49 per cent in 2019 and 2.83 per cent in 2020 on average.
Table 3.4 Private Sector Canadian Interest Rate Forecasts
| | 3-month Treasury Bill | | 10-year Government Bond | |
Average annual interest rate (per cent) | | 2019 | | 2020 | | 2019 | | 2020 | |
BMO | | 1.94 | | 2.36 | | 2.33 | | 2.63 | |
CIBC | | 2.12 | | 2.06 | | 2.51 | | 2.39 | |
National Bank | | 2.14 | | 2.44 | | 2.46 | | 3.07 | |
RBC | | 1.92 | | 2.58 | | 2.63 | | 3.16 | |
Scotiabank | | 2.06 | | 2.77 | | 2.48 | | 2.87 | |
TD | | 2.10 | | 2.49 | | 2.51 | | 2.84 | |
Average (as of January 3, 2019) | | 2.05 | | 2.45 | | 2.49 | | 2.83 | |
BUDGET AND FISCAL PLAN - 2019/20 to 2021/22
82
BRITISH COLUMBIA ECONOMIC REVIEW AND OUTLOOK
Exchange Rate
The value of the Canadian dollar generally depreciated relative to the U.S. dollar through the course of 2018. The decline primarily reflects the broad-based appreciation of the U.S. dollar alongside concerns over global trade tensions and, in more recent months, declining oil prices. Overall, the loonie averaged 77.2 US cents in 2018, up from an average of 77.0 US cents in 2017.
Chart 3.15 Private Sector Expectations for the Canadian Dollar
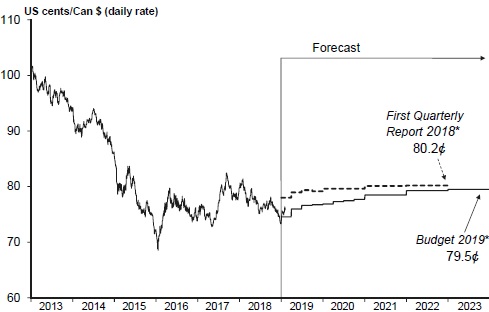
Source: Bank of Canada; B.C. Ministry of Finance
*Based on the average of private sector forecasts. First Quarterly Report as of July 20, 2018 and Budget 2019 as of January 3, 2019.
Outlook
Based on the average of six private sector forecasts as of January 3, 2019, the Ministry assumes the Canadian dollar will average 76.0 US cents in 2019 and 77.3 US cents in 2020.
Table 3.5 Private Sector Exchange Rate Forecasts
Average annual exchange rate (US cents/Can $) | | 2019 | | 2020 | |
BMO | | 74.4 | | 75.3 | |
CIBC | | 75.7 | | 75.8 | |
National | | 77.7 | | 76.8 | |
RBC | | 74.5 | | 76.1 | |
Scotiabank | | 76.8 | | 80.2 | |
TD | | 76.7 | | 78.9 | |
Average (as of January 3, 2019) | | 76.0 | | 77.3 | |
BUDGET AND FISCAL PLAN - 2019/20 to 2021/22
83
BRITISH COLUMBIA ECONOMIC REVIEW AND OUTLOOK
Table 3.6.1 Gross Domestic Product (GDP): British Columbia
| | | | | | Forecast | |
| | 2017 | | 2018 e | | 2019 | | 2020 | | 2021 | | 2022 | | 2023 | |
Gross Domestic Product at Market Prices: | | | | | | | | | | | | | | | |
– Real (chained 2012 $ billions) | | 256.9 | | 262.7 | | 269.1 | | 275.1 | | 280.8 | | 286.3 | | 291.9 | |
(% change) | | 3.8 | | 2.2 | | 2.4 | | 2.3 | | 2.1 | | 2.0 | | 2.0 | |
– Nominal (current prices, $ billions) | | 282.2 | | 295.3 | | 308.5 | | 321.8 | | 334.8 | | 348.1 | | 361.8 | |
(% change) | | 6.9 | | 4.6 | | 4.4 | | 4.3 | | 4.0 | | 3.9 | | 3.9 | |
– GDP price deflator (2012 = 100) | | 109.9 | | 112.5 | | 114.7 | | 117.0 | | 119.3 | | 121.6 | | 124.0 | |
(% change) | | 3.0 | | 2.3 | | 2.0 | | 2.0 | | 2.0 | | 2.0 | | 2.0 | |
Real GDP per person (chained 2012 $) | | 52,188 | | 52,618 | | 53,208 | | 53,712 | | 54,094 | | 54,419 | | 54,764 | |
(% change) | | 2.5 | | 0.8 | | 1.1 | | 0.9 | | 0.7 | | 0.6 | | 0.6 | |
Real GDP per employed person | | | | | | | | | | | | | | | |
(% change) | | 0.1 | | 1.2 | | 1.3 | | 1.2 | | 1.0 | | 0.9 | | 0.9 | |
Unit labour cost1 (% change) | | 2.2 | | 3.4 | | 1.8 | | 1.8 | | 1.9 | | 1.9 | | 1.9 | |
| |
Components of Real GDP at Market Prices (chained 2012 $ billions) | |
Household expenditure on goods and services | | 169.0 | | 172.9 | | 177.5 | | 182.7 | | 187.9 | | 193.3 | | 198.9 | |
(% change) | | 4.6 | | 2.3 | | 2.7 | | 2.9 | | 2.9 | | 2.9 | | 2.9 | |
– Goods | | 68.6 | | 68.8 | | 70.3 | | 72.0 | | 73.6 | | 75.3 | | 77.0 | |
(% change) | | 5.4 | | 0.4 | | 2.1 | | 2.4 | | 2.3 | | 2.3 | | 2.3 | |
– Services | | 100.5 | | 104.1 | | 107.2 | | 110.7 | | 114.3 | | 118.0 | | 121.8 | |
(% change) | | 4.1 | | 3.5 | | 3.0 | | 3.3 | | 3.2 | | 3.2 | | 3.2 | |
NPISH2 expenditure on goods and services | | 3.9 | | 4.0 | | 4.0 | | 4.0 | | 4.0 | | 4.1 | | 4.1 | |
(% change) | | -2.6 | | 1.5 | | 0.8 | | 0.6 | | 0.7 | | 0.7 | | 0.7 | |
Government expenditure on goods and services | | 45.5 | | 46.8 | | 47.8 | | 47.8 | | 47.9 | | 48.0 | | 48.0 | |
(% change) | | 3.0 | | 2.9 | | 2.1 | | 0.0 | | 0.2 | | 0.2 | | 0.2 | |
Investment in fixed capital | | 62.4 | | 66.8 | | 72.3 | | 75.6 | | 77.4 | | 78.2 | | 79.1 | |
(% change) | | 9.2 | | 7.2 | | 8.2 | | 4.6 | | 2.3 | | 1.1 | | 1.1 | |
Final domestic demand | | 280.8 | | 290.6 | | 301.8 | | 310.3 | | 317.3 | | 323.7 | | 330.1 | |
(% change) | | 5.3 | | 3.5 | | 3.8 | | 2.8 | | 2.3 | | 2.0 | | 2.0 | |
Exports of goods and services | | 97.5 | | 99.7 | | 100.9 | | 102.6 | | 104.3 | | 106.0 | | 107.9 | |
(% change) | | 3.4 | | 2.3 | | 1.2 | | 1.6 | | 1.7 | | 1.7 | | 1.7 | |
Imports of goods and services | | 123.1 | | 128.2 | | 133.9 | | 138.3 | | 141.4 | | 144.2 | | 147.1 | |
(% change) | | 8.0 | | 4.2 | | 4.4 | | 3.3 | | 2.3 | | 2.0 | | 2.0 | |
Inventory change | | 1.7 | | 0.3 | | 0.1 | | 0.3 | | 0.3 | | 0.4 | | 0.5 | |
Statistical discrepancy | | -0.2 | | -0.2 | | -0.2 | | -0.2 | | -0.2 | | -0.2 | | -0.2 | |
Real GDP at market prices | | 256.9 | | 262.7 | | 269.1 | | 275.1 | | 280.8 | | 286.3 | | 291.9 | |
(% change) | | 3.8 | | 2.2 | | 2.4 | | 2.3 | | 2.1 | | 2.0 | | 2.0 | |
1 Unit labour cost is the nominal cost of labour incurred to produce one unit of real output.
2 Non-profit institutions serving households.
e B.C. Ministry of Finance estimate.
BUDGET AND FISCAL PLAN - 2019/20 to 2021/22
84
BRITISH COLUMBIA ECONOMIC REVIEW AND OUTLOOK
Table 3.6.2 Selected Nominal Income and Other Indicators: British Columbia
| | | | | | Forecast | |
| | 2017 | | 2018 | | 2019 | | 2020 | | 2021 | | 2022 | | 2023 | |
Compensation of employees1 ($ millions) | | 135,668 | | 143,452 | e | 149,603 | | 155,775 | | 162,026 | | 168,398 | | 174,972 | |
(% change) | | 6.1 | | 5.7 | | 4.3 | | 4.1 | | 4.0 | | 3.9 | | 3.9 | |
Household income ($ millions) | | 245,089 | | 256,909 | e | 267,290 | | 277,846 | | 288,583 | | 299,687 | | 311,224 | |
(% change) | | 6.8 | | 4.8 | | 4.0 | | 3.9 | | 3.9 | | 3.8 | | 3.8 | |
Net operating surplus ($ millions) | | 35,742 | | 37,237 | e | 37,330 | | 38,922 | | 40,071 | | 41,267 | | 42,554 | |
(% change) | | 18.7 | | 4.2 | | 0.3 | | 4.3 | | 3.0 | | 3.0 | | 3.1 | |
Retail sales ($ millions) | | 84,291 | | 86,329 | e | 89,732 | | 93,352 | | 96,954 | | 100,650 | | 104,525 | |
(% change) | | 9.3 | | 2.4 | | 3.9 | | 4.0 | | 3.9 | | 3.8 | | 3.8 | |
Housing starts (units) | | 43,664 | | 40,857 | | 34,015 | | 31,846 | | 30,517 | | 30,519 | | 30,548 | |
(% change) | | 4.4 | | -6.4 | | -16.7 | | -6.4 | | -4.2 | | 0.0 | | 0.1 | |
Residential sales ($ millions) | | 73,627 | | 55,822 | | 57,494 | | 60,008 | | 62,744 | | 65,616 | | 68,587 | |
(% change) | | -5.1 | | -24.2 | | 3.0 | | 4.4 | | 4.6 | | 4.6 | | 4.5 | |
Consumer price index (2002 = 100) | | 125.0 | | 128.4 | | 131.3 | | 134.0 | | 136.7 | | 139.4 | | 142.3 | |
(% change) | | 2.1 | | 2.7 | | 2.2 | | 2.1 | | 2.0 | | 2.0 | | 2.0 | |
1 Domestic basis; wages, salaries and employers’ social contributions.
e B.C. Ministry of Finance estimate.
Table 3.6.3 Labour Market Indicators: British Columbia
| | | | | | Forecast | |
| | 2017 | | 2018 | | 2019 | | 2020 | | 2021 | | 2022 | | 2023 | |
Population (thousands at July 1) | | 4,922 | | 4,992 | | 5,057 | | 5,122 | | 5,190 | | 5,260 | | 5,329 | |
(% change) | | 1.3 | | 1.4 | | 1.3 | | 1.3 | | 1.3 | | 1.3 | | 1.3 | |
Net migration (thousands) | | | | | | | | | | | | | | | |
– International1,4 | | 48.6 | | 51.6 | e | 42.0 | | 44.3 | | 46.9 | | 48.3 | | 45.2 | |
– Interprovincial4 | | 12.7 | | 4.4 | e | 11.5 | | 12.0 | | 12.0 | | 12.0 | | 12.0 | |
– Total | | 61.3 | | 56.0 | e | 53.5 | | 56.3 | | 58.9 | | 60.3 | | 57.2 | |
Labour force population2 (thousands) | | 3,980 | | 4,032 | | 4,084 | | 4,138 | | 4,194 | | 4,251 | | 4,308 | |
(% change) | | 1.2 | | 1.3 | | 1.3 | | 1.3 | | 1.3 | | 1.4 | | 1.3 | |
Labour force (thousands) | | 2,601 | | 2,617 | | 2,650 | | 2,683 | | 2,717 | | 2,751 | | 2,780 | |
(% change) | | 2.7 | | 0.6 | | 1.3 | | 1.3 | | 1.3 | | 1.2 | | 1.1 | |
Participation rate3 (%) | | 65.3 | | 64.9 | | 64.9 | | 64.8 | | 64.8 | | 64.7 | | 64.5 | |
Employment (thousands) | | 2,467 | | 2,494 | | 2,521 | | 2,547 | | 2,574 | | 2,601 | | 2,627 | |
(% change) | | 3.7 | | 1.1 | | 1.1 | | 1.0 | | 1.0 | | 1.0 | | 1.0 | |
Unemployment rate (%) | | 5.1 | | 4.7 | | 4.9 | | 5.1 | | 5.3 | | 5.5 | | 5.5 | |
1 International migration includes net non-permanent residents and returning emigrants less net temporary residents abroad.
2 The civilian, non-institutionalized population 15 years of age and over.
3 Percentage of the labour force population in the labour force.
4 Components may not sum to total due to rounding.
e BC Stats estimate.
BUDGET AND FISCAL PLAN - 2019/20 to 2021/22
85
BRITISH COLUMBIA ECONOMIC REVIEW AND OUTLOOK
Table 3.6.4 Major Economic Assumptions
| | | | | | Forecast | |
| | 2017 | | 2018 | | 2019 | | 2020 | | 2021 | | 2022 | | 2023 | |
Real GDP | | | | | | | | | | | | | | | |
Canada (chained 2012 $ billions) | | 2,011 | | 2,051 | e | 2,084 | | 2,117 | | 2,151 | | 2,186 | | 2,221 | |
(% change) | | 3.0 | | 2.0 | | 1.6 | | 1.6 | | 1.6 | | 1.6 | | 1.6 | |
U.S. (chained 2012 US$ billions) | | 18,051 | | 18,556 | e | 18,964 | | 19,287 | | 19,615 | | 19,948 | | 20,287 | |
(% change) | | 2.2 | | 2.8 | | 2.2 | | 1.7 | | 1.7 | | 1.7 | | 1.7 | |
Japan (chained 2011 Yen trillions) | | 530 | | 534 | e | 538 | | 540 | | 543 | | 547 | | 551 | |
(% change) | | 1.9 | | 0.7 | | 0.8 | | 0.3 | | 0.7 | | 0.7 | | 0.7 | |
China (constant 2010 US$ billions) | | 10,131 | | 10,800 | | 11,448 | | 12,112 | | 12,814 | | 13,557 | | 14,344 | |
(% change) | | 6.8 | | 6.6 | | 6.0 | | 5.8 | | 5.8 | | 5.8 | | 5.8 | |
Euro zone1 (chained 2010 Euro billions) | | 10,380 | | 10,571 | | 10,708 | | 10,847 | | 10,988 | | 11,131 | | 11,276 | |
(% change) | | 2.5 | | 1.8 | | 1.3 | | 1.3 | | 1.3 | | 1.3 | | 1.3 | |
Industrial production index (% change) | | | | | | | | | | | | | | | |
U.S. | | 1.6 | | 4.0 | | 2.3 | | 1.6 | | 1.7 | | 1.7 | | 1.7 | |
Japan | | 2.6 | | 0.9 | | 1.2 | | 0.4 | | 0.7 | | 0.7 | | 0.7 | |
China | | 6.6 | | 6.3 | | 5.2 | | 5.0 | | 5.0 | | 5.0 | | 5.0 | |
Euro zone1 | | 3.0 | | 1.5 | e | 1.2 | | 1.3 | | 1.3 | | 1.3 | | 1.3 | |
Housing starts (thousands) | | | | | | | | | | | | | | | |
Canada | | 220 | | 213 | | 185 | | 180 | | 180 | | 180 | | 180 | |
(% change) | | 11.0 | | -3.1 | | -13.1 | | -2.7 | | 0.0 | | 0.0 | | 0.0 | |
U.S. | | 1,203 | | 1,265 | e | 1,270 | | 1,300 | | 1,300 | | 1,300 | | 1,300 | |
(% change) | | 2.5 | | 5.2 | | 0.4 | | 2.4 | | 0.0 | | 0.0 | | 0.0 | |
Japan | | 965 | | 942 | | 900 | | 880 | | 880 | | 880 | | 880 | |
(% change) | | -0.3 | | -2.3 | | -4.5 | | -2.2 | | 0.0 | | 0.0 | | 0.0 | |
Consumer price index | | | | | | | | | | | | | | | |
Canada (2002 = 100) | | 130.4 | | 133.4 | | 136.3 | | 139.2 | | 142.0 | | 144.8 | | 147.7 | |
(% change) | | 1.6 | | 2.3 | | 2.2 | | 2.1 | | 2.0 | | 2.0 | | 2.0 | |
Canadian interest rates (%) | | | | | | | | | | | | | | | |
3-month treasury bills | | 0.71 | | 1.40 | | 2.05 | | 2.45 | | 2.75 | | 3.25 | | 3.50 | |
10-year government bonds | | 1.79 | | 2.26 | | 2.49 | | 2.83 | | 3.38 | | 4.00 | | 4.25 | |
United States interest rates (%) | | | | | | | | | | | | | | | |
3-month treasury bills | | 0.95 | | 1.97 | | 2.77 | | 3.06 | | 3.20 | | 3.20 | | 3.20 | |
10-year government bonds | | 2.33 | | 2.91 | | 3.21 | | 3.40 | | 3.63 | | 4.06 | | 4.25 | |
Exchange rate (US cents / Canadian $) | | 77.0 | | 77.2 | | 76.0 | | 77.3 | | 78.5 | | 79.3 | | 79.5 | |
British Columbia goods and services | | | | | | | | | | | | | | | |
Export price deflator (% change) | | 5.2 | | 2.6 | e | 2.7 | | 2.8 | | 2.7 | | 2.9 | | 2.9 | |
1 Euro zone (19) is Austria, Belgium, Cyprus, Estonia, Finland, France, Germany, Greece, Ireland, Italy, Latvia, Lithuania, Luxembourg, Malta, Netherlands, Portugal, Slovakia, Slovenia and Spain.
e B.C. Ministry of Finance estimate.
BUDGET AND FISCAL PLAN - 2019/20 to 2021/22
86
BRITISH COLUMBIA ECONOMIC REVIEW AND OUTLOOK
The Economic Forecast Council, Budget 2019
Introduction
In accordance with the Budget Transparency and Accountability Act, the Minister of Finance, in preparing the provincial budget, consults the Economic Forecast Council (the Council or EFC) on British Columbia’s economic outlook. The 13-member Council is comprised of leading economists from several of Canada’s major banks and private research institutions.
The most recent meeting between the Minister and the EFC occurred on December 7, 2018, with Council members presenting their estimates for economic performance in 2018 as well as their forecasts for 2019 and beyond. Key topics discussed by participants included: B.C.’s labour and housing markets; opportunities for attracting and retaining talent; pace of monetary policy tightening; restrictive international trade policies; and slower global economic growth.
Subsequent to the December meeting, EFC members were invited to revisit their forecasts up to January 8, 2019 (eight of the thirteen members chose to resubmit). Forecast details from the Council’s surveys are summarized in the table at the end of this topic box.
British Columbia Outlook
On average, the Council estimates that B.C.’s economic growth in 2018 was 2.3 per cent, down 0.2 percentage points from the Council’s previous projection in January 2018. Members now forecast B.C.’s economy to grow by 2.5 per cent in 2019 and by 2.6 per cent in 2020. The EFC is calling for B.C.’s economy to
Chart 1 — EFC Outlook for B.C.
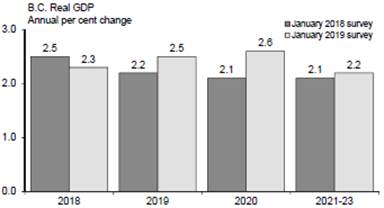
Source: Average of Economic Forecast Council forecasts
Note: Forecast from January 2018 survey for 2020 and 2021-2023 is average growth for the years 2020-2022
grow by 2.2 per cent annually over the 2021 to 2023 period. This represents upward revisions to the B.C. outlook for 2019 and beyond compared to the Council’s projections a year ago (see Chart 1). Changes to the near-term forecast primarily reflect an expectation for increased investment and non-residential construction activity in relation to liquefied natural gas (LNG) development.
All 13 forecasters have incorporated the LNG Canada project into their assumptions, with varied expectations for both the timing and extent of new economic activity.
On average, Council members estimate that B.C.’s economic growth outpaced Canada’s in 2018 and expect B.C.’s economy to continue to grow faster than the national average throughout the forecast horizon (see Chart 2).
Chart 2 — EFC Outlook for B.C. and Canada
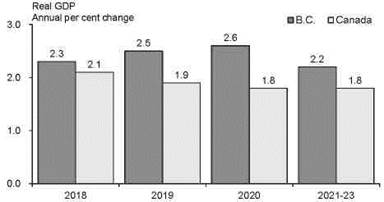
Source: Average of Economic Forecast Council forecasts
The Council acknowledged the resiliency of B.C.’s economy and remains optimistic about B.C.’s economic outlook. Overall, members generally anticipate drivers of B.C.’s economic growth to transition from consumer spending and housing activity toward business investment, in conjunction with LNG development and other major projects. Looking further ahead, the EFC expects B.C.’s economy to grow at a steady pace, supported by solid fundamentals, including employment and population growth.
Participants discussed B.C.’s housing market and the expectation that the combination of existing policy measures and rising interest rates will likely continue to temper activity in the near-term. Members remarked that
BUDGET AND FISCAL PLAN - 2019/20 to 2021/22
87
BRITISH COLUMBIA ECONOMIC REVIEW AND OUTLOOK
housing affordability remains a concern and may impede attracting new talent to the province. Furthermore, the Council highlighted the importance of further investments in commuting infrastructure and encouraged the B.C. government to continue working with local and federal governments to expand affordable housing stock. A few members cautioned that relatively high household debt levels in B.C. compared to other provinces may expose some homeowners to financial vulnerabilities as interest rates rise. Overall, there was a general consensus among members that B.C.’s housing market is undergoing a period of moderation from the elevated levels observed in recent years.
The EFC discussed the heightened uncertainty surrounding the export sector given the global environment of elevated trade tensions and volatility in some key commodity prices. However, some members noted that B.C. is well positioned to further expand its diversified export market compared to other provinces.
Other topics discussed by Council members included national competitiveness challenges, B.C.’s tight labour market and the importance of investing in areas such as child care and immigration to attract and retain labour force talent as well as B.C.’s strong fiscal position relative to other provinces.
Canadian Outlook
The EFC estimates that the Canadian economy expanded by 2.1 per cent in 2018 and forecasts Canadian real GDP growth to be 1.9 per cent in 2019. The Council is calling for the Canadian economy to steadily grow by 1.8 per cent annually during the 2020 to 2023 period.
Most members expect B.C.’s economic growth to outperform the national average over the forecast period, particularly given the final investment decision that was announced for the LNG Canada project. Other advantages noted by participants included the province’s diverse economic base and B.C.’s potential for steady population growth.
International Outlook
The Council estimates that U.S. real GDP increased by 2.9 per cent in 2018 and projects 2.4 per cent growth in 2019 before slowing to 1.8 per cent growth annually during the 2020 to 2023 period.
Participants discussed the significant degree of uncertainty surrounding the U.S. economy, with the combination of heightened trade tensions, fading fiscal stimulus and concerns over U.S. government finances clouding the outlook.
British Columbia Economic Forecast Council:
Summary of B.C. real GDP forecasts, annual per cent change
| | | | | | | | | | Average | |
Participant | | Organization | | 2018 | | 2019 | | 2020 | | 2021-23 | |
Douglas Porter | | Bank of Montreal1 | | 2.3 | | 2.5 | | 2.4 | | 2.0 | |
Cameron Muir | | BC Real Estate Association1 | | 2.8 | | 2.6 | | 3.2 | | 2.5 | |
Ken Peacock | | Business Council of BC1 | | 2.3 | | 2.4 | | 2.5 | | 2.8 | |
Helmut Pastrick | | Central 1 Credit Union1 | | 2.2 | | 2.6 | | 2.2 | | 2.9 | |
Avery Shenfeld | | CIBC1 | | 2.1 | | 2.3 | | 2.2 | | 2.0 | |
Marie-Christine Bernard | | Conference Board | | 2.1 | | 2.7 | | 2.3 | | 1.9 | |
Arlene Kish | | IHS Markit | | 2.2 | | 2.8 | | 2.5 | | 2.1 | |
Sébastien Lavoie | | Laurentian Bank Securities | | 2.5 | | 2.8 | | 2.4 | | 2.1 | |
Stéfane Marion | | National Bank | | 2.3 | | 2.6 | | 2.5 | | 2.0 | |
Craig Wright | | RBC1 | | 2.3 | | 2.6 | | 2.6 | | 2.0 | |
Jean-François Perrault | | Scotiabank1 | | 2.4 | | 2.7 | | 3.6 | | 1.4 | |
Aaron Stokes | | Stokes Economics | | 2.4 | | 2.1 | | 2.2 | | 2.2 | |
Derek Burleton | | TD1 | | 2.3 | | 2.0 | | 2.6 | | na | |
Average | | | | 2.3 | | 2.5 | | 2.6 | | 2.2 | |
Standard Deviation | | | | 0.2 | | 0.3 | | 0.4 | | 0.4 | |
1 Updated subsequent to the December 7, 2018 meeting.
BUDGET AND FISCAL PLAN - 2019/20 to 2021/22
88
BRITISH COLUMBIA ECONOMIC REVIEW AND OUTLOOK
Moreover, participants generally expect slower global economic growth going forward, partly due to the dampening effect of rising interest rates and tariffs.
Canadian Dollar
Council members’ outlooks for the value of the Canadian dollar varied, with projections for 2019 ranging from 74.4 US cents to 80.0 US cents. For 2020, forecasts ranged from 75.3 US cents to 81.0 US cents and from 75.0 US cents to 82.6 US cents over the 2021 to 2023 period.
Chart 3 — EFC Outlook for the Dollar
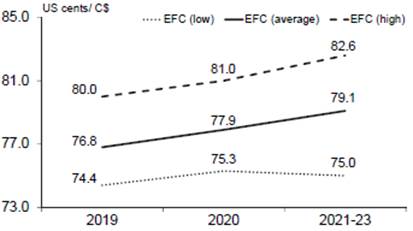
Source: Economic Forecast Council forecasts
Forecast Survey — Participants’ Opinions
All figures are based | | 2018 | | 2019 | | 2020 | | 2021 to 2023 | |
on annual averages | | Range | | Average 1 | | Range | | Average 1 | | Range | | Average 1 | | Range2 | | Average 1,2 | |
British Columbia | | | | | | | | | | | | | | | | | |
Real GDP (% change) | | 2.1 – 2.8 | | 2.3(13) | | 2.0 – 2.8 | | 2.5(13) | | 2.2 – 3.6 | | 2.6(13) | | 1.4 – 2.9 | | 2.2(12) | |
Nominal GDP (% change) | | 3.9 – 5.4 | | 4.5(13) | | 3.9 – 5.0 | | 4.6(13) | | 3.7 – 6.2 | | 4.7(13) | | 3.4 – 4.9 | | 4.1(12) | |
GDP Deflator (% change) | | 1.7 – 3.1 | | 2.1(13) | | 1.7 – 2.3 | | 2.0(13) | | 1.5 – 2.5 | | 2.1(13) | | 1.8 – 2.1 | | 2.0(12) | |
Real business non-residential investment (% change) | | -0.6 – 11.5 | | 5.1(7) | | 7.9 – 18.6 | | 12.1(7) | | 3.4 – 26.6 | | 10.0(7) | | -5.0 – 10.0 | | 2.4(7) | |
Real business machinery and equipment investment (% change) | | 1.9 – 17.4 | | 6.5(6) | | 3.5 – 15.7 | | 9.0(6) | | 4.0 – 28.3 | | 13.6(6) | | -5.5 – 12.0 | | 1.3(6) | |
Household Income (% change) | | 3.7 – 6.0 | | 4.8(9) | | 3.5 – 5.5 | | 4.4(9) | | 4.0 – 4.5 | | 4.3(9) | | 3.5 – 5.0 | | 4.2(9) | |
Net Migration (thousand persons) | | 52.0 – 65.0 | | 60.9(10) | | 44.5 – 70.0 | | 57.1(10) | | 47.4 – 72.0 | | 57.2(10) | | 46.0 – 65.0 | | 55.9(10) | |
Employment (% change) | | 0.8 – 1.1 | | 1.0(13) | | 1.0 – 2.0 | | 1.3(13) | | 0.5 – 1.9 | | 1.0(13) | | 0.7 – 1.5 | | 1.0(12) | |
Unemployment rate (%) | | 4.3 – 4.9 | | 4.7(13) | | 4.2 – 5.0 | | 4.6(13) | | 4.3 – 5.1 | | 4.6(13) | | 4.1 – 5.4 | | 4.8(12) | |
Net operating surplus of corporations (% change) | | -5.8 – 14.0 | | 4.1(7) | | -1.0 – 7.9 | | 4.5(7) | | -3.6 – 5.9 | | 3.0(7) | | -2.4 – 5.5 | | 2.9(7) | |
Housing starts (thousand units) | | 38.7 – 41.3 | | 39.9(13) | | 32.1 – 38.2 | | 36.0(13) | | 30.0 – 38.0 | | 34.2(13) | | 28.0 – 38.0 | | 32.4(11) | |
MLS residential unit sales (thousand units) | | 78.5 – 88.0 | | 80.3(9) | | 76.8 – 89.0 | | 81.6(9) | | 75.0 – 90.0 | | 84.4(9) | | 74.0 – 104.0 | | 90.4(9) | |
MLS residential average sale price ($ thousand) | | 706.6 – 715.0 | | 711.3(8) | | 689.8 – 735.0 | | 717.9(8) | | 690.0 – 762.0 | | 731.6(8) | | 712.0 – 790.0 | | 757.3(7) | |
Retail sales (% change) | | 2.2 – 3.8 | | 2.9(10) | | 2.5 – 5.5 | | 4.1(10) | | 2.2 – 6.2 | | 4.2(10) | | 2.4 – 5.2 | | 4.1(10) | |
Consumer price index (% change) | | 2.1 – 2.9 | | 2.6(13) | | 1.7– 2.5 | | 2.1(13) | | 1.8 – 2.6 | | 2.2(13) | | 1.8 – 2.2 | | 2.0(12) | |
United States | | | | | | | | | | | | | | | | | |
Real GDP (% change) | | 2.8 – 3.0 | | 2.9(13) | | 2.2 – 2.7 | | 2.4(13) | | 1.5 - 2.3 | | 1.8(13) | | 1.4 - 2.2 | | 1.8(13) | |
Intended Federal Funds rate (%) | | 1.80 – 2.15 | | 1.92(11) | | 2.50 – 3.10 | | 2.76(12) | | 2.47 – 3.37 | | 3.01(12) | | 2.25 – 3.38 | | 2.92(12) | |
Housing starts (million units) | | 1.21 – 1.29 | | 1.26(12) | | 1.24 – 1.34 | | 1.27(12) | | 1.19 – 1.42 | | 1.29(12) | | 1.20 – 1.48 | | 1.33(10) | |
Canada | | | | | | | | | | | | | | | | | |
Real GDP (% change) | | 2.0 – 2.2 | | 2.1(13) | | 1.7 - 2.3 | | 1.9(13) | | 1.5 - 2.2 | | 1.8(13) | | 1.5 - 2.0 | | 1.8(13) | |
Bank of Canada overnight target rate (%) | | 1.34 – 1.67 | | 1.46(11) | | 1.80 – 2.40 | | 2.12(12) | | 2.00 – 3.17 | | 2.55(12) | | 2.25 – 3.25 | | 2.62(12) | |
Exchange rate (US cents/C$) | | 76.3 – 77.6 | | 77.1(12) | | 74.4 – 80.0 | | 76.8(13) | | 75.3 – 81.0 | | 77.9(13) | | 75.0 – 82.6 | | 79.1(11) | |
Housing starts (thousand units) | | 208 – 219 | | 212(13) | | 186 – 210 | | 197(13) | | 176 – 205 | | 192(13) | | 171 – 200 | | 190(12) | |
Consumer price index (% change) | | 1.9 – 2.4 | | 2.2(13) | | 1.7 – 2.1 | | 1.9(13) | | 1.9 – 2.5 | | 2.1(13) | | 1.8 – 2.2 | | 2.0(13) | |
1 Based on responses from participants providing forecasts. Number of respondents shown in parentheses.
2 Participants provided an average forecast for 2021 to 2023.
BUDGET AND FISCAL PLAN - 2019/20 to 2021/22
89
PART 4 | 2018/19 UPDATED FINANCIAL FORECAST (THIRD QUARTERLY REPORT)
Table 4.1 2018/19 Forecast Update
| | | | First | | Second | | Third | |
| | Budget | | Quarterly | | Quarterly | | Quarterly | |
($ millions) | | 2018 | | Report | | Report | | Report | |
Revenue | | 54,193 | | 55,815 | | 57,198 | | 56,636 | |
Expense | | (53,624 | ) | (54,796 | ) | (54,898 | ) | (55,762 | ) |
Forecast allowance | | (350 | ) | (350 | ) | (950 | ) | (500 | ) |
Surplus | | 219 | | 669 | | 1,350 | | 374 | |
| | | | | | | | | |
Capital spending: | | | | | | | | | |
Taxpayer-supported capital spending | | 5,174 | | 5,579 | | 5,177 | | 4,771 | |
Self-supported capital spending | | 4,061 | | 4,078 | | 4,061 | | 4,192 | |
| | 9,235 | | 9,657 | | 9,238 | | 8,963 | |
Provincial Debt: | | | | | | | | | |
Taxpayer-supported debt | | 45,198 | | 44,717 | | 42,431 | | 43,957 | |
Self-supported debt | | 23,824 | | 23,447 | | 23,291 | | 23,459 | |
Total debt (including forecast allowance) | | 69,372 | | 68,514 | | 66,672 | | 67,916 | |
| | | | | | | | | |
Taxpayer-supported debt to GDP ratio | | 15.5 | % | 15.3 | % | 14.4 | % | 14.9 | % |
Taxpayer-supported debt to revenue ratio | | 84.9 | % | 82.0 | % | 75.6 | % | 78.4 | % |
Introduction
The third quarter fiscal outlook for 2018/19 forecasts a surplus of $374 million, an improvement of $155 million since Budget 2018. The Province’s debt metrics have also improved since Budget 2018 due to better operating results and lower capital spending.
The surplus is lower than forecast at the Second Quarterly Report due to Supplementary Estimates, a higher net loss for the Insurance Corporation of British Columbia (ICBC), the elimination of interest on student loans, an adjustment for BC Hydro’s deferred regulatory accounts, and lower revenue from taxation. This is partially offset by higher revenue forecast allowance.
Chart 4.1 2018/19 surplus — major changes from Second Quarterly Report
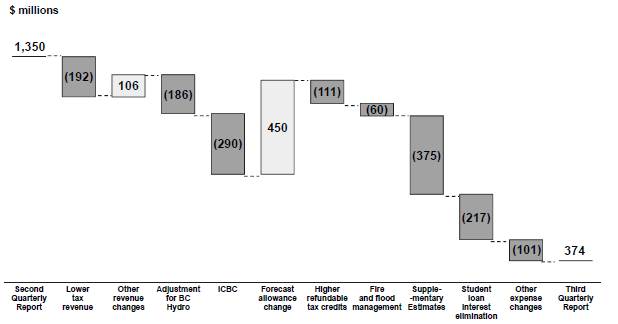
BUDGET AND FISCAL PLAN - 2019/20 to 2021/22
91
2018/19 UPDATED FINANCIAL FORECAST (THIRD QUARTERLY REPORT)
Table 4.2 2018/19 Financial Forecast Changes | | | | | | | | | |
| | ($ millions) | |
2018/19 surplus — Budget 2018 (February 20, 2018) | | 219 | | | | | | 219 | |
2018/19 surplus — First Quarterly Report (September 7, 2018) | | | | 669 | | | | | |
2018/19 surplus — Second Quarterly Report (November 26, 2018) | | | | | | 1,350 | | | |
| | Q1 | | Q2 | | Q3 | | Total | |
| | Update | | Update | | Update | | Changes | |
Revenue changes: | | | | | | | | | |
Personal income tax — mainly higher 2017 tax assessments | | 621 | | 813 | | 78 | | 1,512 | |
Corporate income tax — increased prior-year adjustment, reflecting higher 2017 tax assessments, and changes in federal government installments, including the impacts of tax measures announced in the federal 2018 Fall Economic Statement | | 463 | | 842 | | (269 | ) | 1,036 | |
Property transfer tax — lower year-to-date sales results | | (250 | ) | (150 | ) | 75 | | (325 | ) |
Provincial sales tax — lower year-to-date results | | (48 | ) | (15 | ) | (47 | ) | (110 | ) |
Other taxation sources | | 5 | | (44 | ) | (29 | ) | (68 | ) |
Natural gas royalties — lower prices and increased utilization of royalty programs and changes in natural gas liquids royalties and natural gas volumes | | (20 | ) | (24 | ) | (21 | ) | (65 | ) |
Coal, metals and minerals — mainly higher coal prices | | 82 | | 69 | | 6 | | 157 | |
Forests — changes in stumpage rates and lower volumes | | 380 | | (25 | ) | 42 | | 397 | |
Other natural resources — mainly higher electricity prices | | 53 | | 31 | | (16 | ) | 68 | |
Other revenue — mainly higher revenue from fees and miscellaneous sources and changes in investment earnings | | 82 | | 125 | | 95 | | 302 | |
Health and social transfers — higher population share | | 176 | | 9 | | — | | 185 | |
Other federal government transfers — mainly BC’s share of lower federal excise tax revenue on cannabis and payments under the Disaster Financial Assistance Arrangements | | 15 | | (33 | ) | (35 | ) | (53 | ) |
Commercial Crown corporation net income: | | | | | | | | | |
BC Lottery Corporation - mainly impact from casino and community gaming revenue | | 65 | | (8 | ) | 39 | | 96 | |
ICBC — mainly increased claims costs | | — | | (206 | ) | (290 | ) | (496 | ) |
BC Hydro — impact of adjustment to deferred regulatory accounts | | — | | — | | (1,136 | ) | (1,136 | ) |
Accounting adjustments — related to regulatory accounts | | — | | — | | 950 | | 950 | |
Other commercial Crown corporations | | (2 | ) | (1 | ) | (4 | ) | (7 | ) |
Total revenue changes | | 1,622 | | 1,383 | | (562 | ) | 2,443 | |
Less : expense increases (decreases): | | | | | | | | | |
Consolidated Revenue Fund changes: | | | | | | | | | |
Supplementary Estimates | | — | | — | | 375 | | 375 | |
Statutory spending: | | | | | | | | | |
Fire management costs | | 477 | | 31 | | 43 | | 551 | |
Emergency Program Act — higher fire management and flood-related costs | | 162 | | 129 | | 17 | | 308 | |
Student loan interest elimination | | — | | — | | 217 | | 217 | |
Affordable housing — acceleration of grants to deepen the affordability of existing projects | | — | | — | | 38 | | 38 | |
Other statutory spending | | 32 | | 3 | | 21 | | 56 | |
Refundable tax credits — mainly the impact of 2017 tax assessment results | | 379 | | (118 | ) | 111 | | 372 | |
Prior year liability and other adjustments | | (3 | ) | (16 | ) | (59 | ) | (78 | ) |
Management of public debt (net) — reflects revisions to scheduled borrowing | | (4 | ) | (12 | ) | (1 | ) | (17 | ) |
Spending funded by third party recoveries | | (25 | ) | 3 | | (11 | ) | (33 | ) |
Changes in spending profile of service delivery agencies: | | | | | | | | | |
School districts | | 31 | | — | | 3 | | 34 | |
Universities | | 82 | | 26 | | (11 | ) | 97 | |
Colleges | | 30 | | 6 | | 11 | | 47 | |
Health authorities and hospital societies | | 132 | | 9 | | 171 | | 312 | |
Other service delivery agencies | | 98 | | 8 | | (47 | ) | 59 | |
(Increase) decrease in transfers to service delivery agencies (elimination) | | (219 | ) | 33 | | (14 | ) | (200 | ) |
Total expense increases (decreases) | | 1,172 | | 102 | | 864 | | 2,138 | |
Subtotal | | 450 | | 1,281 | | (1,426 | ) | 305 | |
(Increase) / Reduction in forecast allowance | | | | (600 | ) | 450 | | (150 | ) |
Total changes | | 450 | | 681 | | (976 | ) | 155 | |
2018/19 surplus — First Quarterly Report | | 669 | | | | | | | |
2018/19 surplus — Second Quarterly Report | | | | 1,350 | | | | | |
2018/19 surplus — Third Quarterly Report | | | | | | 374 | | 374 | |
BUDGET AND FISCAL PLAN - 2019/20 to 2021/22
92
2018/19 UPDATED FINANCIAL FORECAST (THIRD QUARTERLY REPORT)
Revenue
Total government revenue is now forecast to be $562 million lower than the Second Quarterly Report. Major changes include:
· $441 million decrease in commercial Crown corporations’ net income, resulting from:
· $186 million net negative impact of a $1.136 billion regulatory account write-down on BC Hydro’s finances, partially offset by a $950 million adjustment1 that was recognized by government in 2017/18;
· $290 million further deterioration in ICBC’s net loss as a result of continuing increases in estimated claims costs;
· $35 million higher net income from other commercial Crown corporations, mainly from BC Lottery Corporation;
· $192 million decrease in taxation revenue, mainly reflecting lower corporate income tax revenue and year-to-date information in provincial sales taxes and other taxation sources;
· $11 million increase in natural resource revenue due to higher logging taxes included in forest revenue partly offset by lower natural gas prices and production volumes;
· $95 million increase in revenue from fees, licences, investment earnings, and miscellaneous sources mainly due to improvements in SUCH sector projections;
· $35 million decrease in federal government contributions mainly due to lower transfers to taxpayer-supported agencies.
Expense
Total government spending is now forecast to be $864 million higher than the Second Quarterly Report. Major changes include:
· $375 million in Supplementary Estimates (see Table 4.3);
· $217 million due to the elimination of student loan interest;
· $111 million for tax transfer expenses, mainly film tax credits (reflecting 2017 tax assessment results);
· $113 million in higher net spending by service delivery agencies;
· $60 million increase in fire management and food-related costs;
· $47 million increase in expenses in various other areas; and
· $59 million in favourable prior year liability adjustments.
Table 4.2 provides a detailed breakdown of changes in the operating results by quarter from Budget 2018.
1 In the 2017/18 Public Accounts, the government made a $950 million negative summary-level adjustment to the combined net income of commercial Crown corporations, in response to a 2016/17 Public Accounts qualification of the Auditor General regarding the government’s accounting of BC Hydro’s deferred regulatory accounts. In late 2018/19, as a result of Phase 1 of the joint Comprehensive Review of BC Hydro, government has accepted a recommendation that BC Hydro write off the balance of its Rate Smoothing Regulatory Account estimated at $1,136 million at year end. The net negative impact on government’s summary consolidated surplus in 2018/19 is $186 million, after adjusting for the $950 million negative adjustment already included in government’s 2017/18 Public Accounts to prevent double-counting.
BUDGET AND FISCAL PLAN - 2019/20 to 2021/22
93
2018/19 UPDATED FINANCIAL FORECAST (THIRD QUARTERLY REPORT)
2018/19 Supplementary Estimates
Government intends to introduce Supplementary Estimates to obtain the necessary legislative appropriation to fund the following initiatives:
Table 4.3 2018/19 Supplementary Estimates | | | |
($ millions) | | 2018/19 | |
Connecting BC | | 50.0 | |
Health and life sciences research grants | | 89.0 | |
Northern Capital and Planning Grant | | 100.0 | |
Child care initiatives | | 19.9 | |
Local government infrastructure programs | | 35.4 | |
Contaminated sites | | 30.0 | |
Clean Energy Vehicle Program | | 30.0 | |
Resort Municipality Initiative | | 5.0 | |
Adult Basic Education and English Language Learning Programs | | 5.5 | |
Civil Resolution Tribunal | | 7.9 | |
Mining Jobs Task Force | | 2.4 | |
Total | | 375.1 | |
Connecting BC will expand high-speed internet connectivity to more than 200 rural and Indigenous communities across the province, with the intent of leveraging funding from the Canadian Radio-television and Telecommunications Commission’s Broadband Fund. This will help close the gap in high-speed internet access between rural and urban areas. For further details see page 21.
Grants for health and life sciences research organizations will help to attract and retain researchers, and support research, entrepreneurship and commercialization. This provincial contribution is expected to attract over $200 million in external funding toward these research activities. For further details see page 13.
The Northern Capital and Planning Grant will support 26 local governments in strategic planning and capital investments. This will help North-West and North-Central communities in meeting their current and future infrastructure needs. For further details see page 21.
Child care initiatives funding will support the Child Care Fee Reduction Initiative, Child Care BC Maintenance Fund, and other services.
Local government infrastructure programs ($35.4 million) are grants to local governments for existing infrastructure investment programs:
· The Clean Water Wastewater Fund ($17 million) will facilitate the Province’s contribution toward local government investments for the rehabilitation of water, wastewater and storm water infrastructure, and the planning and design of future facilities and upgrades to existing systems.
· The New Building Canada Fund - Small Communities Fund ($10 million) will enable the Province’s contribution toward local government infrastructure investments in communities with a population of less than 100,000 people.
BUDGET AND FISCAL PLAN - 2019/20 to 2021/22
94
2018/19 UPDATED FINANCIAL FORECAST (THIRD QUARTERLY REPORT)
· Peace River Infrastructure ($8.4 million) funding, under the Peace River Agreement, facilitates infrastructure development in Peace River communities where industrial activity is largely located outside of the taxing jurisdiction of the local governments.
Contaminated sites funding will address the impact of an increase to the liability for high priority contaminated sites.
The Clean Energy Vehicle program funding supports strong demand for the program, which encourages and accelerates the adoption of clean energy vehicles in B.C.
The Resort Municipality Initiative assists small, tourism-oriented municipalities to invest in infrastructure projects that create jobs and build strong local economies through increased tourism visitation.
Adult Basic Education and English Language Learning programs improve learners’ literacy, numeracy, language and academic skills to continue into post-secondary education and find new or better employment. The funding will enable more students to access tuition-free adult education.
Funding for the Civil Resolution Tribunal (CRT) is for operating costs. The CRT is B.C.’s online tribunal, which resolves small claims disputes of $5,000 and under, and strata property (condominium) cases of any amount in British Columbia.
The Mining Jobs Task Force was established to review exploration and mining in the province. Funding will also support the implementation of the Task Force’s recommendations.
Contingencies
Budget 2018 included a Contingencies vote allocation of $550 million in 2018/19 to help manage unexpected costs and pressures including funding for increases in demand driven programs as well as fund priority initiatives. The forecast for Contingencies is unchanged.
Government Employment (FTEs)
Full-time equivalent (FTE) staff utilization in core government ministries for 2018/19 is forecast to be 30,750, an increase of 850 FTEs compared to the Second Quarterly Report forecast. Further details on FTEs are provided in Table A13 in the appendix.
Provincial Capital Spending
Capital spending is projected to total $9.0 billion in 2018/19 — $275 million lower than the forecast in the Second Quarterly Report (see Table 4.4).
BUDGET AND FISCAL PLAN - 2019/20 to 2021/22
95
2018/19 UPDATED FINANCIAL FORECAST (THIRD QUARTERLY REPORT)
Table 4.4 2018/19 Capital Spending Update
| | ($ millions) | |
2018/19 capital spending — Budget 2018 (February 20, 2018) | | 9,235 | | | | | | 9,235 | |
2018/19 capital spending — First Quarterly Report (September 7, 2018) | | | | 9,657 | | | | | |
2018/19 capital spending — Second Quarterly Report (November 26, 2018) | | | | | | 9,238 | | | |
| | Q1 | | Q2 | | Q3 | | Total | |
| | Update | | Update | | Update | | Changes | |
Taxpayer-supported changes: | | | | | | | | | |
Higher spending and timing from health authorities | | 187 | | 16 | | — | | 203 | |
Timing of health sector projects | | — | | — | | (163 | ) | (163 | ) |
Timing of social housing spending | | 83 | | (57 | ) | (44 | ) | (18 | ) |
Timing of post-secondary institutions’ spending | | 56 | | 25 | | 19 | | 100 | |
Timing of transportation sector spending | | 83 | | (355 | ) | (187 | ) | (459 | ) |
Other net adjustments to capital schedules | | (4 | ) | (31 | ) | (31 | ) | (66 | ) |
Total taxpayer-supported | | 405 | | (402 | ) | (406 | ) | (403 | ) |
Self-supported changes: | | | | | | | | | |
Liquor Distribution Branch | | 44 | | (2 | ) | (26 | ) | 16 | |
ICBC | | — | | — | | (33 | ) | (33 | ) |
BC Lottery Corporation - timing of capital spending | | — | | (15 | ) | (10 | ) | (25 | ) |
BC Hydro | | (27 | ) | — | | 206 | | 179 | |
Other | | — | | — | | (6 | ) | (6 | ) |
Total self-supported | | 17 | | (17 | ) | 131 | | 131 | |
Total changes | | 422 | | (419 | ) | (275 | ) | (272 | ) |
2018/19 capital spending — First Quarterly Report | | 9,657 | | | | | | | |
2018/19 capital spending — Second Quarterly Report | | | | 9,238 | | | | | |
2018/19 capital spending — Third Quarterly Report | | | | | | 8,963 | | 8,963 | |
The forecast for taxpayer-supported capital spending is $406 million lower than in the Second Quarterly Report, mainly due to changes in the timing of capital project spending in the health, transportation, and social housing sectors.
Self-supported capital spending is expected to be $131 million higher than the forecast in the Second Quarterly Report, mainly due to higher capital spending by BC Hydro partially offset by lower capital spending in the other commercial Crown corporations.
BUDGET AND FISCAL PLAN - 2019/20 to 2021/22
96
2018/19 UPDATED FINANCIAL FORECAST (THIRD QUARTERLY REPORT)
Table 4.5 2018/19 Provincial Debt Update
| | ($ millions) | |
2018/19 provincial debt - Budget 2018 (February 20, 2018 ) | | 69,372 | | | | | | 69,372 | |
2018/19 provincial debt - First Quarterly Report (September 7, 2018 ) | | | | 68,514 | | | | | |
2018/19 provincial debt - Second Quarterly Report (November 26, 2018 ) | | | | | | 66,672 | | | |
| | Q1 | | Q2 | | Q3 | | Total | |
| | Update | | Update | | Update | | Changes | |
Taxpayer-supported changes: | | | | | | | | | |
Capital debt: | | | | | | | | | |
– lower debt level from 2017/18 | | (205 | ) | — | | — | | (205 | ) |
– change in capital spending | | 405 | | (402 | ) | (406 | ) | (403 | ) |
– change in contributions from external parties | | (149 | ) | 221 | | 86 | | 158 | |
– change in internal financing | | (532 | ) | (2,105 | ) | 1,846 | | (791 | ) |
Total taxpayer-supported | | (481 | ) | (2,286 | ) | 1,526 | | (1,241 | ) |
Self-supported changes: | | | | | | | | | |
– lower debt level from 2017/18 | | (172 | ) | — | | — | | (172 | ) |
– change in capital spending | | 17 | | (17 | ) | 131 | | 131 | |
– change in internal financing | | (222 | ) | (139 | ) | 37 | | (324 | ) |
Total self-supported | | (377 | ) | (156 | ) | 168 | | (365 | ) |
Forecast allowance changes: | | | | | | | | | |
Adjustment for forecast allowance | | — | | 600 | | (450 | ) | 150 | |
Total changes | | (858 | ) | (1,842 | ) | 1,244 | | (1,456 | ) |
2018/19 provincial debt - First Quarterly Report | | 68,514 | | | | | | | |
2018/19 provincial debt - Second Quarterly Report | | | | 66,672 | | | | | |
2018/19 provincial debt - Third Quarterly Report | | | | | | 67,916 | | 67,916 | |
Provincial Debt
The provincial debt, including the $500 million forecast allowance, is projected to total $67.9 billion by the end of the fiscal year — $1.456 billion lower than the projection at Budget 2018 (higher than forecast in the Second Quarterly Report by $1.244 billion).
Taxpayer-supported debt is projected to be $44.0 billion — $1.241 billion lower than at Budget 2018 mainly due to a decrease in internal financing due to a lower operating result at CRF level and lower external contributions ($1.932 billion), partially offset by lower borrowing requirements ($406 million) for capital spending due to capital project scheduling changes. Taxpayer-supported debt is higher than the projection in the Second Quarterly Report.
Self-supported debt is projected to be $23.5 billion — $365 million lower than at Budget 2018, mainly due to changes in timing of own-sourced financing partially offset by higher capital spending. Self-supported debt is higher than the projection in the Second Quarterly Report.
The forecast allowance has been reduced by $450 million from the Second Quarterly Report to mirror the operating statement forecast allowance.
Details on changes in provincial debt by quarter are shown in Table 4.5.
BUDGET AND FISCAL PLAN - 2019/20 to 2021/22
97
2018/19 UPDATED FINANCIAL FORECAST (THIRD QUARTERLY REPORT)
Risks to the Fiscal Forecast
There are a number of risks to the fiscal forecast for 2018/19. The financial results of the Insurance Corporation of British Columbia continue to be a particular risk to the fiscal forecast.
The forecasts of revenues, expenditures, capital spending and debt are estimates based on multiple economic, financial and external factors. In addition, capital spending and debt figures may be influenced by several factors including design development, procurement activity, weather, geotechnical conditions and interest rates. As a result, the actual operating surplus, capital expenditure and debt figures may differ from the current forecast. Variables will change throughout the year as new information becomes available, with potentially material impacts.
Revenues can be volatile due in part to the influence of the cyclical nature of the natural resource sector in the economy. Changes in energy or commodity prices, such as natural gas and lumber, may have a significant effect on revenue and the fiscal forecast. Uncertainty and volatility in the B.C. housing market could impact property transfer tax revenue. In addition, personal and corporate income tax assessments for the 2017 tax year will not be finalized until March 2019 and could result in further revenue and tax credit transfer spending adjustments.
The spending forecast in the fiscal plan is based on ministry and service delivery agency plans and strategies. The main risks are changes to planning assumptions, such as utilization or demand rates for government services in the health care, education, or community social services sectors, and costs associated with natural disaster responses.
The potential fiscal impact from these risks is expected to be covered by the $550 million Contingencies vote and the $500 million forecast allowance.
Supplementary Schedules
The following tables provide the financial results for the nine months ended December 31, 2018 and the 2018/19 full-year forecast.
Table 4.6 2018/19 Operating Statement | | | | | | | |
| | Year-to-Date to December 31 | | Full Year | |
| | 2018/19 | | Actual | | 2018/19 | | Actual | |
($ millions) | | Budget | | Actual | | Variance | | 2017/18 | | Budget | | Forecast | | Variance | | 2017/18 | |
Revenue | | 39,048 | | 41,045 | | 1,997 | | 38,168 | | 54,193 | | 56,636 | | 2,443 | | 52,020 | |
Expense | | (38,466 | ) | (39,345 | ) | (879 | ) | (37,108 | ) | (53,624 | ) | (55,762 | ) | (2,138 | ) | (51,719 | ) |
Surplus before forecast allowance | | 582 | | 1,700 | | 1,118 | | 1,060 | | 569 | | 874 | | 305 | | 301 | |
Forecast allowance | | — | | — | | — | | — | | (350 | ) | (500 | ) | (150 | ) | — | |
Surplus | | 582 | | 1,700 | | 1,118 | | 1,060 | | 219 | | 374 | | 155 | | 301 | |
Accumulated surplus beginning of the year | | 6,567 | | 6,746 | | 179 | | 6,390 | | 6,567 | | 6,746 | | 179 | | 6,597 | |
Accumulated surplus before comprehensive income | | 7,149 | | 8,446 | | 1,297 | | 7,450 | | 6,786 | | 7,120 | | 334 | | 6,898 | |
Accumulated other comprehensive income from self-supported Crown agencies | | 170 | | (257 | ) | (427 | ) | (153 | ) | 227 | | (13 | ) | (240 | ) | (152 | ) |
Accumulated surplus end of period | | 7,319 | | 8,189 | | 870 | | 7,297 | | 7,013 | | 7,107 | | 94 | | 6,746 | |
BUDGET AND FISCAL PLAN - 2019/20 to 2021/22
98
2018/19 UPDATED FINANCIAL FORECAST (THIRD QUARTERLY REPORT)
Table 4.7 2018/19 Revenue by Source
| | Year-to-Date to December 31 | | Full Year | |
| | 2018/19 | | Actual | | 2018/19 | | Actual | |
($ millions) | | Budget | | Actual | | Variance | | 2017/18 | | Budget | | Forecast | | Variance | | 2017/18 | |
Taxation | | | | | | | | | | | | | | | | | |
Personal income | | 7,305 | | 8,539 | | 1,234 | | 6,382 | | 9,836 | | 11,348 | | 1,512 | | 8,923 | |
Corporate income | | 2,465 | | 2,905 | | 440 | | 2,276 | | 4,096 | | 5,132 | | 1,036 | | 4,165 | |
Employer health | | — | | — | | — | | — | | 463 | | 464 | | 1 | | — | |
Sales 1 | | 5,756 | | 5,681 | | (75 | ) | 5,519 | | 7,428 | | 7,318 | | (110 | ) | 7,131 | |
Fuel | | 789 | | 785 | | (4 | ) | 785 | | 1,003 | | 1,014 | | 11 | | 1,010 | |
Carbon | | 1,064 | | 1,038 | | (26 | ) | 891 | | 1,488 | | 1,460 | | (28 | ) | 1,255 | |
Tobacco | | 657 | | 609 | | (48 | ) | 567 | | 822 | | 780 | | (42 | ) | 727 | |
Property | | 1,848 | | 1,837 | | (11 | ) | 1,757 | | 2,626 | | 2,601 | | (25 | ) | 2,367 | |
Property transfer | | 1,759 | | 1,539 | | (220 | ) | 1,714 | | 2,235 | | 1,910 | | (325 | ) | 2,141 | |
Insurance premium | | 446 | | 458 | | 12 | | 433 | | 595 | | 610 | | 15 | | 602 | |
| | 22,089 | | 23,391 | | 1,302 | | 20,324 | | 30,592 | | 32,637 | | 2,045 | | 28,321 | |
Natural resources | | | | | | | | | | | | | | | | | |
Natural gas royalties | | 172 | | 102 | | (70 | ) | 103 | | 229 | | 164 | | (65 | ) | 161 | |
Forests | | 704 | | 1,023 | | 319 | | 682 | | 992 | | 1,389 | | 397 | | 1,065 | |
Other natural resources 2 | | 891 | | 1,060 | | 169 | | 1,150 | | 1,192 | | 1,417 | | 225 | | 1,469 | |
| | 1,767 | | 2,185 | | 418 | | 1,935 | | 2,413 | | 2,970 | | 557 | | 2,695 | |
Other revenue | | | | | | | | | | | | | | | | | |
Medical Services Plan premiums | | 1,021 | | 1,017 | | (4 | ) | 1,940 | | 1,361 | | 1,355 | | (6 | ) | 2,266 | |
Other fees and licenses 3 | | 2,895 | | 3,070 | | 175 | | 2,843 | | 4,002 | | 4,210 | | 208 | | 3,983 | |
Investment earnings | | 876 | | 918 | | 42 | | 911 | | 1,179 | | 1,173 | | (6 | ) | 1,101 | |
Miscellaneous 4 | | 2,198 | | 2,464 | | 266 | | 2,490 | | 3,152 | | 3,258 | | 106 | | 3,543 | |
| | 6,990 | | 7,469 | | 479 | | 8,184 | | 9,694 | | 9,996 | | 302 | | 10,893 | |
Contributions from the federal government | | | | | | | | | | | | | | | | | |
Health and social transfers | | 5,191 | | 5,329 | | 138 | | 5,017 | | 6,921 | | 7,106 | | 185 | | 6,848 | |
Other federal government contributions 5 | | 1,328 | | 1,208 | | (120 | ) | 1,258 | | 2,009 | | 1,956 | | (53 | ) | 2,207 | |
| | 6,519 | | 6,537 | | 18 | | 6,275 | | 8,930 | | 9,062 | | 132 | | 9,055 | |
Commercial Crown corporation net income | | | | | | | | | | | | | | | | | |
BC Hydro 6 | | 318 | | (700 | ) | (1,018 | ) | 362 | | 712 | | (424 | ) | (1,136 | ) | 683 | |
Adjustment for regulatory accounts 6 | | — | | 950 | | 950 | | — | | — | | 950 | | 950 | | (950 | ) |
Liquor Distribution Branch | | 884 | | 881 | | (3 | ) | 899 | | 1,106 | | 1,101 | | (5 | ) | 1,119 | |
BC Lotteries (net of payments to the federal government) | | 974 | | 1,094 | | 120 | | 1,056 | | 1,300 | | 1,396 | | 96 | | 1,391 | |
ICBC | | (590 | ) | (860 | ) | (270 | ) | (935 | ) | (684 | ) | (1,180 | ) | (496 | ) | (1,327 | ) |
Transportation Investment Corporation | | — | | — | | — | | (29 | ) | — | | — | | — | | (29 | ) |
Other 7 | | 97 | | 98 | | 1 | | 97 | | 130 | | 128 | | (2 | ) | 169 | |
| | 1,683 | | 1,463 | | (220 | ) | 1,450 | | 2,564 | | 1,971 | | (593 | ) | 1,056 | |
Total revenue | | 39,048 | | 41,045 | | 1,997 | | 38,168 | | 54,193 | | 56,636 | | 2,443 | | 52,020 | |
1 Includes provincial sales tax and social services tax/hotel room tax related to prior years.
2 Columbia River Treaty, other energy and minerals, water rental and other resources.
3 Post-secondary, healthcare-related, motor vehicle, and other fees.
4 Includes reimbursements for health care and other services provided to external agencies, and other recoveries.
5 Includes contributions for health, education, community development, housing and social service programs, and transportation projects.
6 BC Hydro’s forecast loss for 2018/19 includes a write-off of a regulatory account. At the summary level, the Province recognized a $950 million adjustment in fiscal 2017/18 with respect to BC Hydro’s deferred regulatory accounts.
7 Includes Columbia Power Corporation, BC Railway Company, Columbia Basin Trust power projects, and post-secondary institutions’ self-supported subsidiaries.
BUDGET AND FISCAL PLAN - 2019/20 to 2021/22
99
2018/19 UPDATED FINANCIAL FORECAST (THIRD QUARTERLY REPORT)
Table 4.8 2018/19 Expense by Ministry, Program and Agency
| | Year-to-Date to December 31 | | Full Year | |
| | 2018/19 | | Actual | | 2018/19 | | Actual | |
($ millions) | | Budget 1 | | Actual | | Variance | | 2017/18 1 | | Budget 1 | | Forecast | | Variance | | 2017/18 1 | |
Office of the Premier | | 9 | | 9 | | — | | 8 | | 11 | | 11 | | — | | 10 | |
Advanced Education, Skills and Training | | 1,639 | | 1,647 | | 8 | | 1,562 | | 2,212 | | 2,212 | | — | | 2,155 | |
Agriculture | | 49 | | 50 | | 1 | | 55 | | 93 | | 93 | | — | | 91 | |
Attorney General | | 443 | | 452 | | 9 | | 411 | | 583 | | 584 | | 1 | | 560 | |
Children and Family Development | | 1,277 | | 1,327 | | 50 | | 1,121 | | 1,793 | | 1,793 | | — | | 1,585 | |
Citizens’ Services | | 379 | | 401 | | 22 | | 398 | | 530 | | 532 | | 2 | | 572 | |
Education | | 4,721 | | 4,722 | | 1 | | 4,551 | | 6,341 | | 6,355 | | 14 | | 6,158 | |
Energy, Mines and Petroleum Resources | | 44 | | 48 | | 4 | | 52 | | 60 | | 65 | | 5 | | 101 | |
Environment and Climate Change Strategy | | 127 | | 119 | | (8 | ) | 128 | | 179 | | 179 | | — | | 177 | |
Finance | | 376 | | 273 | | (103 | ) | 164 | | 579 | | 848 | | 269 | | 358 | |
Finance — extinguishment of Transportation Investment Corporation fiscal agency loan 2 | | — | | — | | — | | 3,721 | | — | | — | | — | | 3,690 | |
Forests, Lands, Natural Resource Operations and Rural Development | | 503 | | 958 | | 455 | | 950 | | 734 | | 1,285 | | 551 | | 1,338 | |
Health | | 14,731 | | 14,484 | | (247 | ) | 13,947 | | 19,754 | | 19,754 | | — | | 18,976 | |
Indigenous Relations and Reconciliation | | 95 | | 114 | | 19 | | 113 | | 100 | | 101 | | 1 | | 248 | |
Jobs, Trade and Technology | | 80 | | 70 | | (10 | ) | 71 | | 99 | | 97 | | (2 | ) | 111 | |
Labour | | 9 | | 8 | | (1 | ) | 8 | | 13 | | 13 | | — | | 11 | |
Mental Health and Addictions | | 7 | | 6 | | (1 | ) | 1 | | 10 | | 10 | | — | | 11 | |
Municipal Affairs and Housing | | 554 | | 560 | | 6 | | 536 | | 674 | | 674 | | — | | 689 | |
Public Safety and Solicitor General | | 582 | | 702 | | 120 | | 688 | | 787 | | 1,095 | | 308 | | 1,062 | |
Social Development and Poverty Reduction | | 2,514 | | 2,477 | | (37 | ) | 2,282 | | 3,364 | | 3,364 | | — | | 3,103 | |
Tourism, Arts and Culture | | 105 | | 124 | | 19 | | 107 | | 144 | | 144 | | — | | 177 | |
Transportation and Infrastructure | | 664 | | 669 | | 5 | | 621 | | 890 | | 890 | | — | | 843 | |
Total ministries and Office of the Premier | | 28,908 | | 29,220 | | 312 | | 31,495 | | 38,950 | | 40,099 | | 1,149 | | 42,026 | |
Management of public funds and debt | | 959 | | 950 | | (9 | ) | 890 | | 1,276 | | 1,259 | | (17 | ) | 1,205 | |
Contingencies | | — | | 8 | | 8 | | 1 | | 550 | | 550 | | — | | 17 | |
Funding for capital expenditures | | 861 | | 644 | | (217 | ) | 699 | | 1,772 | | 1,548 | | (224 | ) | 1,284 | |
Refundable tax credit transfers | | 930 | | 1,099 | | 169 | | 845 | | 1,246 | | 1,618 | | 372 | | 1,197 | |
Legislative Assembly and other appropriations | | 105 | | 108 | | 3 | | 128 | | 143 | | 164 | | 21 | | 170 | |
Subtotal | | 31,763 | | 32,029 | | 266 | | 34,058 | | 43,937 | | 45,238 | | 1,301 | | 45,899 |
Supplementary Estimates | | — | | — | | — | | — | | — | | 375 | | 375 | | — | |
Total appropriations | | 31,763 | | 32,029 | | 266 | | 34,058 | | 43,937 | | 45,613 | | 1,676 | | 45,899 | |
Elimination of transactions between appropriations 3 | | (19 | ) | (13 | ) | 6 | | (5 | ) | (59 | ) | (60 | ) | (1 | ) | (16 | ) |
Prior year liability adjustments | | — | | — | | — | | — | | — | | (77 | ) | (77 | ) | (150 | ) |
Consolidated revenue fund expense | | 31,744 | | 32,016 | | 272 | | 34,053 | | 43,878 | | 45,476 | | 1,598 | | 45,733 | |
Expenses recovered from external entities | | 2,259 | | 2,265 | | 6 | | 2,103 | | 3,337 | | 3,304 | | (33 | ) | 3,131 | |
Elimination of funding provided to service delivery agencies | | (19,455 | ) | (19,239 | ) | 216 | | (18,179 | ) | (26,829 | ) | (26,805 | ) | 24 | | (25,159 | ) |
Extinguishment of Transportation Investment Corporation fiscal agency loan 2 | | — | | — | | — | | (3,721 | ) | — | | — | | — | | (3,690 | ) |
Total direct program spending | | 14,548 | | 15,042 | | 494 | | 14,256 | | 20,386 | | 21,975 | | 1,589 | | 20,015 | |
Service delivery agency expense | | | | | | | | | | | | | | | | | |
School districts | | 4,719 | | 4,735 | | 16 | | 4,497 | | 6,651 | | 6,685 | | 34 | | 6,338 | |
Universities | | 3,474 | | 3,507 | | 33 | | 3,304 | | 4,837 | | 4,934 | | 97 | | 4,600 | |
Colleges and institutes | | 924 | | 961 | | 37 | | 901 | | 1,299 | | 1,346 | | 47 | | 1,266 | |
Health authorities and hospital societies | | 11,314 | | 11,567 | | 253 | | 11,029 | | 15,370 | | 15,682 | | 312 | | 14,983 | |
Other service delivery agencies | | 3,487 | | 3,533 | | 46 | | 3,121 | | 5,081 | | 5,140 | | 59 | | 4,517 | |
Total service delivery agency expense | | 23,918 | | 24,303 | | 385 | | 22,852 | | 33,238 | | 33,787 | | 549 | | 31,704 | |
Total expense | | 38,466 | | 39,345 | | 879 | | 37,108 | | 53,624 | | 55,762 | | 2,138 | | 51,719 | |
1 Restated to reflect government’s current organization and accounting policies.
2 Budget 2017 Update provided statutory authority to extinguish the fiscal agency loan agreement between government and the Transportation Investment Corporation in response to the decision to cancel tolls on the Port Mann bridge. As a related party transaction, the expense and the corporation’s debt reduction are eliminated on consolidation resulting in no impact to operating results.
3 Reflects payments made under an agreement where an expense from a voted appropriation is recorded as revenue by a special account.
BUDGET AND FISCAL PLAN - 2019/20 to 2021/22
100
2018/19 UPDATED FINANCIAL FORECAST (THIRD QUARTERLY REPORT)
Table 4.9 2018/19 Expense By Function
| | Year-to-Date to December 31 | | Full Year | |
| | 2018/19 | | Actual | | 2018/19 | | Actual | |
($ millions) | | Budget | | Actual | | Variance | | 2017/181 | | Budget | | Forecast | | Variance | | 2017/181 | |
Health: | | | | | | | | | | | | | | | | | |
Medical Services Plan | | 3,558 | | 3,547 | | (11 | ) | 3,385 | | 4,959 | | 4,959 | | — | | 4,623 | |
Pharmacare | | 1,095 | | 1,150 | | 55 | | 1,086 | | 1,393 | | 1,393 | | — | | 1,400 | |
Regional services | | 11,073 | | 11,144 | | 71 | | 10,527 | | 14,468 | | 14,733 | | 265 | | 13,747 | |
Other healthcare expenses 2 | | 634 | | 382 | | (252 | ) | 450 | | 831 | | 911 | | 80 | | 1,184 | |
| | 16,360 | | 16,224 | | (136 | ) | 15,448 | | 21,651 | | 21,996 | | 345 | | 20,954 | |
Education: | | | | | | | | | | | | | | | | | |
Elementary and secondary | | 5,168 | | 5,124 | | (44 | ) | 4,871 | | 7,198 | | 7,271 | | 73 | | 6,921 | |
Post-secondary | | 4,437 | | 4,563 | | 126 | | 4,280 | | 6,343 | | 6,441 | | 98 | | 5,966 | |
Other education expenses 3 | | 279 | | 150 | | (129 | ) | 143 | | 356 | | 561 | | 205 | | 204 | |
| | 9,884 | | 9,837 | | (47 | ) | 9,294 | | 13,897 | | 14,273 | | 376 | | 13,091 | |
Social services: | | | | | | | | | | | | | | | | | |
Social assistance 2,3 | | 1,628 | | 1,598 | | (30 | ) | 1,448 | | 2,180 | | 2,180 | | — | | 1,988 | |
Child welfare 2 | | 1,246 | | 1,293 | | 47 | | 1,048 | | 1,757 | | 1,754 | | (3 | ) | 1,507 | |
Low income tax credit transfers | | 215 | | 209 | | (6 | ) | 182 | | 287 | | 294 | | 7 | | 239 | |
Community living and other services | | 830 | | 810 | | (20 | ) | 761 | | 1,093 | | 1,101 | | 8 | | 1,003 | |
| | 3,919 | | 3,910 | | (9 | ) | 3,440 | | 5,317 | | 5,329 | | 12 | | 4,737 | |
Protection of persons and property | | 1,234 | | 1,348 | | 114 | | 1,293 | | 1,650 | | 1,960 | | 310 | | 1,903 | |
Transportation | | 1,507 | | 1,420 | | (87 | ) | 1,370 | | 2,134 | | 2,158 | | 24 | | 1,931 | |
Natural resources and economic development | | 1,676 | | 2,296 | | 620 | | 2,177 | | 2,433 | | 3,378 | | 945 | | 3,387 | |
Other | | 1,225 | | 1,211 | | (14 | ) | 1,070 | | 1,817 | | 1,936 | | 119 | | 1,536 | |
Contingencies | | — | | 8 | | 8 | | 1 | | 550 | | 550 | | — | | 17 | |
General government | | 715 | | 1,092 | | 377 | | 1,058 | | 1,436 | | 1,567 | | 131 | | 1,540 | |
Debt servicing | | 1,946 | | 1,999 | | 53 | | 1,957 | | 2,739 | | 2,615 | | (124 | ) | 2,623 | |
Total expense | | 38,466 | | 39,345 | | 879 | | 37,108 | | 53,624 | | 55,762 | | 2,138 | | 51,719 | |
1 Restated to reflect government’s current organization and accounting policies.
2 Payments for healthcare services by the Ministry of Social Development and Poverty Reduction and the Ministry of Children and Family Development made on behalf of their clients are reported in the Health function.
3 Payments for training costs by the Ministry of Social Development and Poverty Reduction made on behalf of its clients are reported in the Education function.
BUDGET AND FISCAL PLAN - 2019/20 to 2021/22
101
2018/19 UPDATED FINANCIAL FORECAST (THIRD QUARTERLY REPORT)
Table 4.10 2018/19 Capital Spending
| | Year-to-Date to December 31 | | Full Year |
| | 2018/19 | | Actual | | 2018/19 | | Actual |
($ millions) | | Budget | | Actual | | Variance | | 2017/18 | | Budget | | Forecast | | Variance | | 2017/18 |
Taxpayer-supported | | | | | | | | | | | | | | | | |
Education | | | | | | | | | | | | | | | | |
School districts | | 368 | | 452 | | 84 | | 382 | | 557 | | 562 | | 5 | | 578 |
Post-secondary institutions | | 518 | | 652 | | 134 | | 556 | | 902 | | 1,002 | | 100 | | 968 |
Health | | 597 | | 440 | | (157 | ) | 480 | | 1,107 | | 1,147 | | 40 | | 890 |
BC Transportation Financing Authority 1 | | 1,075 | | 682 | | (393 | ) | 562 | | 1,371 | | 974 | | (397 | ) | 717 |
BC Transit | | 117 | | 65 | | (52 | ) | 85 | | 158 | | 96 | | (62 | ) | 115 |
Government ministries | | 214 | | 220 | | 6 | | 168 | | 549 | | 492 | | (57 | ) | 430 |
Housing 2 | | 258 | | 266 | | 8 | | 97 | | 450 | | 432 | | (18 | ) | 169 |
Other 3 | | 41 | | 29 | | (12 | ) | 21 | | 80 | | 66 | | (14 | ) | 41 |
Total taxpayer-supported | | 3,188 | | 2,806 | | (382 | ) | 2,351 | | 5,174 | | 4,771 | | (403 | ) | 3,908 |
| | | | | | | | | | | | | | | | |
Self-supported | | | | | | | | | | | | | | | | |
BC Hydro | | 3,134 | | 3,181 | | 47 | | 1,776 | | 3,744 | | 3,923 | | 179 | | 2,473 |
Columbia River power projects 4 | | 1 | | 1 | | — | | — | | 5 | | 4 | | (1 | ) | 1 |
Transportation Investment Corporation 5 | | — | | — | | — | | 3 | | — | | — | | — | | 4 |
BC Railway Company | | 32 | | 35 | | 4 | | 3 | | 42 | | 37 | | (5 | ) | 11 |
ICBC | | 45 | | 36 | | (9 | ) | 37 | | 105 | | 72 | | (33 | ) | 54 |
BC Lottery Corporation | | 79 | | 44 | | (35 | ) | 44 | | 105 | | 80 | | (25 | ) | 82 |
Liquor Distribution Branch | | 40 | | 35 | | (5 | ) | 24 | | 60 | | 76 | | 16 | | 48 |
Other6 | | — | | — | | — | | — | | — | | — | | — | | 56 |
Total self-supported | | 3,331 | | 3,332 | | 2 | | 1,887 | | 4,061 | | 4,192 | | 131 | | 2,729 |
Total capital spending | | 6,519 | | 6,138 | | (381 | ) | 4,238 | | 9,235 | | 8,963 | | (272 | ) | 6,637 |
1 Includes Transportation Investment Plan and Transportation Investment Corporation, which is a subsidiary of BCTFA effective April 1, 2018.
2 Includes BC Housing Management Commission and Provincial Rental Housing Corporation.
3 Includes BC Pavilion Corporation and other service delivery agencies.
4 Joint ventures of the Columbia Power Corporation and Columbia Basin Trust.
5 Transportation Investment Corporation’s capital spending to August 31, 2017 is classified as self-supported.
6 Includes post-secondary institutions’ self-supported subsidiaries.
BUDGET AND FISCAL PLAN - 2019/20 to 2021/22
102
2018/19 UPDATED FINANCIAL FORECAST (THIRD QUARTERLY REPORT)
Table 4.11 2018/19 Provincial Debt 1
| | Year-to-Date to December 31 | | Full Year | |
| | 2018/19 | | | | 2018/19 | | | |
| | Budget | | | | | | Actual | | Budget | | | | | | Actual | |
($ millions) | | 2018 | | Actual | | Variance | | 2017/18 | | 2018 | | Forecast | | Variance | | 2017/18 | |
Taxpayer-supported debt | | | | | | | | | | | | | | | | | |
Provincial government operating | | — | | — | | — | | 1,918 | | — | | — | | — | | 1,156 | |
Other taxpayer-supported debt (mainly capital) | | | | | | | | | | | | | | | | | |
Education 2 | | | | | | | | | | | | | | | | | |
Post-secondary institutions 3 | | 5,513 | | 5,370 | | (143 | ) | 5,134 | | 5,577 | | 5,472 | | (105 | ) | 5,328 | |
School districts | | 8,916 | | 8,910 | | (6 | ) | 8,710 | | 9,005 | | 8,964 | | (41 | ) | 8,908 | |
| | 14,429 | | 14,280 | | (149 | ) | 13,844 | | 14,582 | | 14,436 | | (146 | ) | 14,236 | |
Health 2,4 | | 8,059 | | 7,880 | | (179 | ) | 7,736 | | 8,184 | | 7,990 | | (194 | ) | 7,903 | |
Highways and public transit | | | | | | | | | | | | | | | | | |
BC Transit | | 115 | | 75 | | (40 | ) | 85 | | 120 | | 78 | | (42 | ) | 84 | |
BC Transportation Financing Authority 5 | | 11,636 | | 11,182 | | (454 | ) | 10,341 | | 11,982 | | 11,337 | | (645 | ) | 10,388 | |
Port Mann Bridge | | 3,505 | | 3,508 | | 3 | | 3,505 | | 3,505 | | 3,508 | | 3 | | 3,508 | |
Public transit | | 1,000 | | 1,000 | | — | | 1,000 | | 1,000 | | 1,000 | | — | | 1,000 | |
SkyTrain extension | | 1,174 | | 1,174 | | — | | 1,174 | | 1,174 | | 1,174 | | — | | 1,174 | |
| | 17,430 | | 16,939 | | (491 | ) | 16,105 | | 17,781 | | 17,097 | | (684 | ) | 16,154 | |
Other | | | | | | | | | | | | | | | | | |
BC Immigrant Investment Fund | | 85 | | 80 | | (5 | ) | 183 | | 61 | | 67 | | 6 | | 161 | |
BC Pavilion Corporation | | 392 | | 371 | | (21 | ) | 374 | | 395 | | 386 | | (9 | ) | 374 | |
Provincial government general capital | | 3,011 | | 2,937 | | (74 | ) | 2,455 | | 3,125 | | 3,106 | | (19 | ) | 2,718 | |
Social housing 6 | | 1,008 | | 851 | | (157 | ) | 851 | | 1,043 | | 849 | | (194 | ) | 878 | |
Other 7 | | 27 | | 27 | | — | | 27 | | 27 | | 26 | | (1 | ) | 27 | |
| | 4,523 | | 4,266 | | (257 | ) | 3,890 | | 4,651 | | 4,434 | | (217 | ) | 4,158 | |
Total other taxpayer-supported | | 44,441 | | 43,365 | | (1,076 | ) | 41,575 | | 45,198 | | 43,957 | | (1,241 | ) | 42,451 | |
Total taxpayer-supported debt | | 44,441 | | 43,365 | | (1,076 | ) | 43,493 | | 45,198 | | 43,957 | | (1,241 | ) | 43,607 | |
| | | | | | | | | | | | | | | | | |
Self-supported debt | | | | | | | | | | | | | | | | | |
Commercial Crown corporations | | | | | | | | | | | | | | | | | |
BC Hydro | | 21,848 | | 22,237 | | 389 | | 20,144 | | 22,541 | | 22,176 | | (365 | ) | 19,990 | |
BC Lotteries | | 164 | | 100 | | (64 | ) | 150 | | 170 | | 139 | | (31 | ) | 155 | |
Columbia Power Corporation | | 291 | | 281 | | (10 | ) | 286 | | 286 | | 281 | | (5 | ) | 286 | |
Columbia River power projects 8 | | 433 | | 418 | | (15 | ) | 433 | | 417 | | 417 | | — | | 433 | |
Post-secondary institutions’ subsidiaries | | 340 | | 418 | | 78 | | 340 | | 340 | | 418 | | 78 | | 418 | |
Other | | 65 | | 29 | | (36 | ) | 30 | | 70 | | 28 | | (42 | ) | 30 | |
Total self-supported debt | | 23,141 | | 23,483 | | 342 | | 21,383 | | 23,824 | | 23,459 | | (365 | ) | 21,312 | |
Forecast allowance | | — | | — | | — | | — | | 350 | | 500 | | 150 | | — | |
Total provincial debt | | 67,582 | | 66,848 | | (734 | ) | 64,876 | | 69,372 | | 67,916 | | (1,456 | ) | 64,919 | |
1 Provincial debt is prepared in accordance with Generally Accepted Accounting Principles and presented consistent with the Debt Summary Report included in the Public Accounts. Debt is shown net of sinking funds and unamortized discounts, excludes accrued interest, and includes non-guaranteed debt directly incurred by commercial Crown corporations and debt guaranteed by the Province.
2 Includes debt and guarantees incurred by the government on behalf of school districts, universities, colleges and health authorities/hospital societies (SUCH), and debt directly incurred by these entities.
3 Post-secondary institutions’ debt includes public-private partnership obligations of $59 million for the nine months ended December 31, 2017; $59 million for the nine months ended December 31, 2018; $59 million for fiscal 2017/18 and $58 million for fiscal 2018/19.
4 Health facilities’ debt includes public-private partnership obligations of $1,615 million for the nine months ended December 31, 2017; $1,661 million for the nine months ended December 31, 2018; $1,637 million for fiscal 2017/18 and $1,675 million for fiscal 2018/19.
5 BC Transportation Financing Authority debt includes public-private partnership obligations of $793 million for the nine months ended December 31, 2017; $765 million for the nine months ended December 31, 2018; $783 million for fiscal 2017/18 and $752 million for fiscal 2018/19.
6 Includes the BC Housing Management Commission and the Provincial Rental Housing Corporation. Social housing debt includes public-private partnership obligations of $81 million for the nine months ended December 31, 2017; $76 million for the nine months ended December 31, 2018; $80 million for fiscal 2017/18 and $76 million for fiscal 2018/19.
7 Includes service delivery agencies, student loan guarantees, loan guarantees to agricultural producers, guarantees issued under economic development and home mortgage assistance programs and loan guarantee provisions.
8 Joint ventures of the Columbia Power Corporation and Columbia Basin Trust.
BUDGET AND FISCAL PLAN - 2019/20 to 2021/22
103
2018/19 UPDATED FINANCIAL FORECAST (THIRD QUARTERLY REPORT)
Table 4.12 2018/19 Statement of Financial Position
($ millions) | | Actual
March 31,
2018 | | Year-to-Date
December 31,
2018 | | Forecast
March 31,
2019 | |
Financial assets | | | | | | | |
Cash and temporary investments | | 3,440 | | 4,318 | | 2,546 | |
Other financial assets | | 11,650 | | 11,432 | | 13,056 | |
Sinking funds | | 1,348 | | 1,345 | | 750 | |
Investments in commercial Crown corporations: | | | | | | | |
Retained earnings | | 6,128 | | 5,281 | | 5,519 | |
Recoverable capital loans | | 20,534 | | 22,721 | | 22,593 | |
| | 26,662 | | 28,002 | | 28,112 | |
| | 43,100 | | 45,097 | | 44,464 | |
Liabilities | | | | | | | |
Accounts payable and accrued liabilities | | 9,670 | | 8,784 | | 9,835 | |
Deferred revenue | | 9,928 | | 10,530 | | 10,427 | |
Debt: | | | | | | | |
Taxpayer-supported debt | | 43,607 | | 43,365 | | 43,957 | |
Self-supported debt | | 21,312 | | 23,483 | | 23,459 | |
Forecast allowance | | — | | — | | 500 | |
Total provincial debt | | 64,919 | | 66,848 | | 67,916 | |
Add: debt offset by sinking funds | | 1,348 | | 1,345 | | 750 | |
Less: guarantees and non-guaranteed debt | | (896 | ) | (879 | ) | (873 | ) |
Financial statement debt | | 65,371 | | 67,314 | | 67,793 | |
| | 84,969 | | 86,628 | | 88,055 | |
Net liabilities | | (41,869 | ) | (41,531 | ) | (43,591 | ) |
Capital and other non-financial assets | | | | | | | |
Tangible capital assets | | 45,837 | | 46,941 | | 48,176 | |
Other non-financial assets | | 2,778 | | 2,779 | | 2,522 | |
| | 48,615 | | 49,720 | | 50,698 | |
Accumulated surplus | | 6,746 | | 8,189 | | 7,107 | |
Changes in Financial Position | | |
| | Year-to-Date | | Forecast | |
| | December 31, | | March 31, | |
($ millions) | | 2018 | | 2019 | |
(Surplus) deficit for the period | | (1,700 | ) | (374 | ) |
Comprehensive income and others (increase) decrease | | 257 | | 13 | |
(Increase) decrease in accumulated surplus | | (1,443 | ) | (361 | ) |
Capital and other non-financial asset changes: | | | | | |
Increase in taxpayer-supported capital investments | | 2,806 | | 4,771 | |
Less: amortization and other accounting changes | | (1,702 | ) | (2,432 | ) |
Change in net capital assets | | 1,104 | | 2,339 | |
Increase (decrease) in other non-financial assets | | 1 | | (256 | ) |
| | 1,105 | | 2,083 | |
Increase (decrease) in net liabilities | | (338 | ) | 1,722 | |
Investment and working capital changes: | | | | | |
Increase (decrease) in cash and temporary investments | | 878 | | (894 | ) |
Increase in total investment in commercial Crown corporations: | | | | | |
Increase (decrease) in retained earnings | | (847 | ) | (609 | ) |
Self-supported capital investments | | 3,332 | | 4,192 | |
Less: loan repayments and other accounting changes | | (1,145 | ) | (2,133 | ) |
| | 1,340 | | 1,450 | |
Other working capital changes | | 63 | | 144 | |
| | 2,281 | | 700 | |
Increase (decrease) in financial statement debt | | 1,943 | | 2,422 | |
(Increase) decrease in sinking fund debt | | 3 | | 598 | |
Increase (decrease) in guarantees and non-guaranteed debt | | (17 | ) | (23 | ) |
Increase (decrease) in total provincial debt | | 1,929 | | 2,997 | |
BUDGET AND FISCAL PLAN - 2019/20 to 2021/22
104
APPENDIX
| | | | |
A1 | | Tax Expenditures | | 107 |
A1.1 | | Income Tax — Tax Expenditures (Refundable Tax Credits) | | 110 |
A1.2 | | Income Tax — Tax Expenditures (Deductions and Non-Refundable Tax Credits) | | 111 |
A1.3 | | Property Taxes — Tax Expenditures | | 112 |
A1.4 | | Consumption Taxes — Tax Expenditures | | 112 |
A2 | | Interprovincial Comparisons of Tax Rates — 2019 | | 113 |
A3 | | Comparison of Provincial and Federal Taxes by Province — 2019 | | 114 |
A4 | | Interprovincial Comparisons of Provincial Personal Income Taxes Payable — 2019 | | 116 |
A4.1 | | Net Provincial Taxes Since Budget 2016 | | 117 |
A5 | | Material Assumptions — Revenue | | 118 |
A6 | | Natural Gas Price Forecasts — 2019/20 to 2021/22 | | 123 |
A7 | | Material Assumptions — Expense | | 124 |
A8 | | Operating Statement — 2012/13 to 2021/22 | | 127 |
A9 | | Revenue by Source — 2012/13 to 2021/22 | | 128 |
A10 | | Revenue by Source Supplementary Information — 2012/13 to 2021/22 | | 129 |
A11 | | Expense by Function — 2012/13 to 2021/22 | | 130 |
A12 | | Expense by Function Supplementary Information — 2012/13 to 2021/22 | | 131 |
A13 | | Full-Time Equivalents (FTEs) 2012/13 to 2021/22 | | 132 |
A14 | | Capital Spending — 2012/13 to 2021/22 | | 133 |
A15 | | Statement of Financial Position — 2012/13 to 2021/22 | | 134 |
A16 | | Changes in Financial Position — 2012/13 to 2021/22 | | 135 |
A17 | | Provincial Debt — 2012/13 to 2021/22 | | 136 |
A18 | | Provincial Debt Supplementary Information — 2012/13 to 2021/22 | | 137 |
A19 | | Key Provincial Debt Indicators — 2012/13 to 2021/22 | | 138 |
BUDGET AND FISCAL PLAN - 2019/20 to 2021/22
105
APPENDIX
A1: Tax Expenditures
Introduction
Tax expenditures reduce the amount of tax a taxpayer pays and are used to deliver government programs or benefits through the tax system. Tax expenditures are usually made by offering special tax rates, exemptions or credits. Governments introduce tax expenditures primarily to achieve social policy objectives such as transfers to lower-income families or to promote economic development and job creation.
Reporting tax expenditures improves government accountability by providing a more complete picture of government activities. The tax expenditure appendix does not include tax expenditures introduced or expanded in Budget 2019; these are described in Part 2: Tax Measures. Beginning with Budget 2012, refundable tax transfers are accounted for in a voted appropriation. For transparency and consistency with previous tax expenditure reports, Table A1.1 also reports on these tax transfers.
In response to a research report from the Office of the Auditor General, Understanding Tax Expenditures, this tax expenditure report will be the subject of ongoing improvements with a focus on informing legislators and the public on tax expenditures. As a start, the tax expenditure report in Budget 2019 clearly identifies refundable tax credits and notes that these credits are already included in a voted appropriation.
The Role of Tax Expenditure Programs
Using the tax system to deliver programs can reduce administration costs and compliance costs for recipients. In certain situations, the tax system allows intended beneficiaries to be readily identified from information that is already collected. In these cases, setting up a separate expenditure program would result in costly overlap and duplication of effort. An example is the climate action tax credit, which is delivered through the income tax system by the Canada Revenue Agency. If this were a direct provincial expenditure program, a provincial agency or office would have to be established to duplicate much of the work already done by the Canada Revenue Agency. In addition, it would require individuals to undertake a separate, time-consuming application process to qualify for the benefit.
There are several potential drawbacks to tax expenditure programs. First, their overall cost often receives less public scrutiny than is the case for spending programs because annual budget appropriations by the legislature are not typically required. Second, tax expenditure programs do not always effectively target those who are intended to benefit from them. Some tax expenditure programs that are intended to provide tax relief for lower-income earners may, in reality, provide the greatest benefit to higher-income earners who pay the most taxes. Finally, costs are often more difficult to control under a tax expenditure program because the benefits tend to be more open-ended and enforcement is often more difficult than for spending programs.
BUDGET AND FISCAL PLAN - 2019/20 to 2021/22
107
APPENDIX
Tax Expenditure Reporting
Not all tax reductions, credits, exemptions and refunds are classed as tax expenditures.
The emphasis is on tax reductions, credits, exemptions and refunds that are close equivalents to spending programs. By implication, the list does not include tax measures designed to meet broad tax policy objectives such as improving fairness in the tax system or measures designed to simplify the administration of a tax. The list also does not include anything that is not intended to be part of a tax base.
Tax expenditures that cost less than $2 million annually are generally not included. Where practical, smaller items have been presented together as an aggregate figure.
British Columbia Tax Expenditures
Tables A1.1 to A1.4 report tax expenditure estimates.
The cost of individual tax expenditures cannot be added together to reach a total tax expenditure figure for two reasons: in some cases, the programs interact with one another so that eliminating one program could increase or decrease the cost of another; and eliminating certain tax expenditure programs could change the choices taxpayers make, which in turn would affect the cost estimates.
The estimates for each tax expenditure are based on a static analysis of the costs and do not consider any behavioural changes, which could change the costs over time. In addition, estimates are generally recalculated each year using current data sources and using refinements to the methods of estimation, which can result in significant changes to the value of a given tax expenditure from prior years’ reports.
Table A1.1 lists tax programs delivered through refundable personal and corporate income tax credits. Refundable credits can be used to reduce income tax liabilities with any remainder refunded to the taxpayer. These credits are reported in a voted appropriation.
Table A1.2 lists personal and corporate income tax expenditures that are deductions, exemptions or non-refundable credits. Deductions reduce taxable income, whereas non-refundable credits can only be used to reduce income taxes payable. The list includes both provincial measures and federal measures. Federal measures are deductions and exemptions that reduce British Columbia income tax. Under the tax collection agreement between British Columbia and the federal government, the federal government has sole responsibility for determining income subject to tax, including British Columbia tax.
Table A1.3 lists property tax exemptions and grants. Property tax exemptions can reduce the tax owing or remove a property from tax. Grants reduce the final tax owing and may be refunded after full payment has been received. Exemptions are used to define the tax base; estimates for property tax expenditures for government entities, municipalities, colleges, schools, hospitals and similar public facilities are not shown.
BUDGET AND FISCAL PLAN - 2019/20 to 2021/22
108
APPENDIX
Table A1.4 lists consumption tax exemptions. Fuel tax estimates include point-of-sale exemptions for certain individuals and businesses and refunds if fuel is purchased and then subsequently used for an exempt purpose. Provincial sales tax exemptions are typically point-of-sale exemptions and either apply to everyone at the point of sale or apply in certain circumstances with appropriate documentation.
More information on British Columbia tax expenditures in Tables A1.1 to A1.4 can be found at https://www2.gov.bc.ca/gov/content/taxes. Information on federal tax expenditures in Table A1.2 can be found at https://www.canada.ca/en/services/taxes/income-tax.html.
BUDGET AND FISCAL PLAN - 2019/20 to 2021/22
109
APPENDIX
Table A1.1 Income Tax — Tax Expenditures (Refundable Tax Credits)
| | | | 2018/19
Estimated Cost 1 | |
| | | | ($ millions) | |
Personal Income Tax | | | | | |
Climate action tax credit | | | | 234 | |
Early childhood tax benefit | | | | 135 | |
Home renovation tax credit for seniors and persons with disabilities | | | | 2 | |
Sales tax credit | | | | 45 | |
Small business venture capital tax credit 2 | | | | 24 | |
Training tax credits 3 | | | | 14 | |
| | | | | |
Corporate Income Tax | | | | | |
Book publishing tax credit | | | | 2 | |
Film and television tax credits: | | | | | |
· Film Incentive BC tax credit | | 129 | | | |
· Production services tax credit | | 759 | | | |
Total | | | | 888 | |
Interactive digital media tax credit | | | | 52 | |
International business activity program tax refunds 4 | | | | 15 | |
Mining exploration tax credit | | | | 10 | |
Scientific research and experimental development tax credit 5 | | | | 68 | |
Training tax credits 3 | | | | . 8 | |
1 Figures include prior year adjustments of -$1 million for the climate action tax credit, -$1 million for the early childhood tax benefit, -$6 million for the sales tax credit, -$6 million for the small business venture capital tax credit (personal income tax), $2 million for the training tax credits (personal income tax), -$1 million for the book publishing tax credit, $24 million for the Film Incentive BC tax credit, $150 million for the production services tax credit, -$3 million for the interactive digital media tax credit, -$5 million for the mining exploration tax credit and -$2 million for the training tax credits (corporate income tax).
2 The small business venture capital tax credit for corporations is not included in this table as tax expenditures that cost less than $2 million annually are generally not included.
3 Training tax credits for individuals and corporations are listed separately. The training tax credit for individuals includes tax credits for apprentices and unincorporated employers, whereas the training tax credit for corporations is only for incorporated employers.
4 The international business activity program was eliminated effective September 12, 2017. The cost represents refunds paid in 2018/19 in respect of eligible income earned on or before that date.
5 The scientific research and experimental development tax credit has a non-refundable component, which is reported in Table A1.2.
BUDGET AND FISCAL PLAN - 2019/20 to 2021/22
110
APPENDIX
Table A1.2 Income Tax — Tax Expenditures (Deductions and Non-Refundable Tax Credits)
| | 2018/19 | |
| | Estimated Cost | |
| | ($ millions) | |
Personal Income Tax | | | |
Provincial Measures | | | |
Age tax credit | | 84 | |
BC caregiver tax credit | | 5 | |
Canada Pension Plan tax credit | | 189 | |
Charitable donations tax credit | | 206 | |
Disability tax credit | | 33 | |
Employment insurance tax credit | | 65 | |
Medical expense tax credit | | 65 | |
Mining flow-through share tax credit | | 10 | |
Pension tax credit | | 28 | |
Political contributions tax credit | | 4 | |
Spousal and eligible dependant tax credits | | 81 | |
Tuition and education tax credits 1 | | 55 | |
| | | |
Federal Measures 2 | | | |
Child care expense deduction | | 70 | |
Non-taxation of business-paid health and dental benefits | | 143 | |
Northern residents deduction | | 17 | |
Pension income splitting | | 81 | |
Registered pension plans | | 1,514 | |
Registered retirement savings plans | | 919 | |
Tax-free savings accounts | | 82 | |
| | | |
Corporate Income Tax | | | |
Provincial Measures | | | |
Scientific research and experimental development tax credit 3 | | 81 | |
Small business corporate income tax rate | | 1,459 | |
Additional access to small business corporate income tax rate for credit unions | | 22 | |
| | | |
Federal Measure | | | |
Charitable donations deduction 4 | | 54 | |
1 The education tax credit is eliminated effective for the 2019 and subsequent tax years. Unused BC education amounts carried forward from years prior to 2019 remain available to be claimed in 2019 and subsequent tax years.
2 These measures are federal measures but the estimates show only the foregone provincial revenue. Each measure is calculated from the 2018 federal cost projections as reported in the Government of Canada’s Report on Federal Tax Expenditures 2018 by applying British Columbia residents’ share of the measure and the relevant tax rates. Certain tax expenditure items have been excluded where no data were available or the amounts were immaterial.
3 The scientific research and experimental development tax credit has a refundable component, which is reported in Table A1.1.
4 The deduction for corporate charitable donations is a federal measure but the estimate shows only the foregone provincial revenue. This is calculated from the 2018 federal cost projection as reported in the Government of Canada’s Report on Federal Tax Expenditures 2018 by applying British Columbia’s share of corporate taxable income and the relevant tax rates to the federal estimate.
BUDGET AND FISCAL PLAN - 2019/20 to 2021/22
111
APPENDIX
Table A1.3 Property Taxes — Tax Expenditures
| | 2018/19 | |
| | Estimated Cost | |
| | ($ millions) | |
School and Rural Area Property Tax | | | |
Assessment exemption of $10,000 for industrial and business properties 1 | | 7 | |
Overnight tourist accommodation assessment relief 1 | | 2 | |
Home owner grant 2 | | 824 | |
| | | |
Property Transfer Tax | | | |
Exemptions for the following: | | | |
· First-time home buyers | | 61 | |
· Newly built homes | | 72 | |
· Property transfers between related individuals | | 142 | |
· Property transfers to municipalities, regional districts, hospital districts, library boards, school boards, water districts and educational institutions | | 10 | |
· Property transfers to charities registered under the Income Tax Act (Canada) | | 6 | |
1 Estimates are for the 2018 calendar year and include only school and rural area property taxes levied by the Province.
2 The home owner grant includes the northern and rural area home owner benefit.
Table A1.4 Consumption Taxes — Tax Expenditures
| | 2018/19 | |
| | Estimated Cost | |
| | ($ millions) | |
Fuel Tax 1 | | | |
Tax exemption for alternative fuels | | 15 | |
Tax exemption for international flights (jet fuel) | | 23 | |
Tax exemptions for farmers 2 | | 9 | |
| | | |
Provincial Sales Tax 1 | | | |
Exemptions for the following items: | | | |
· Food (basic groceries, snack foods, candies, non-alcoholic beverages and restaurant meals) | | 1,310 | |
· Residential energy (e.g. electricity, natural gas, fuel oil) | | 248 | |
· Non-residential electricity | | 84 | |
· Prescription and non-prescription drugs, vitamins and certain other health care products | | 250 | |
· Children’s clothing and footwear | | 45 | |
· Clothing patterns, fabrics and notions | | 4 | |
· Specified school supplies | | 29 | |
· Books, magazines and newspapers | | 37 | |
· Basic land-line telephone and cable service | | 54 | |
· “1-800” and equivalent telephone services | | 4 | |
· Specified safety equipment | | 38 | |
· Labour to repair major household appliances, clothing and footwear | | 9 | |
· Livestock for human consumption, and feed, seed and fertilizer | | 60 | |
· Specified energy conservation equipment | | 20 | |
· Bicycles | | 19 | |
1 Estimates are based on Statistics Canada data and/or administrative data.
2 Estimate is for both motor fuel tax and carbon tax.
BUDGET AND FISCAL PLAN - 2019/20 to 2021/22
112
APPENDIX
Table A2 Interprovincial Comparisons of Tax Rates — 2019
(Rates known and in effect as of January 24, 2019)
Tax | | British
Columbia | | Alberta | | Saskat-
chewan | | Manitoba | | Ontario | | Quebec | | New
Brunswick | | Nova
Scotia | | Prince
Edward
Island | | Newfound-
land and
Labrador | |
| | | | | | | | | | | | | | | | | | | | | |
Corporate income tax (per cent of taxable income) | | | | | | | | | | | | | | | | | | | | | |
General rate | | 12 | | 12 | | 12 | | 12 | | 11.5 | | 11.6 | | 14 | | 16 | | 16 | | 15 | |
Manufacturing rate 1 | | 12 | | 12 | | 10 | | 12 | | 10 | | 11.6 | | 14 | | 16 | | 16 | | 15 | |
Small business rate | | 2 | | 2 | | 2 | | 0 | | 3.5 | | 8 | | 2.5 | | 3 | | 3.5 | | 3 | |
Small business threshold ($000s) | | 500 | | 500 | | 600 | | 500 | | 500 | | 500 | | 500 | | 500 | | 500 | | 500 | |
Corporation capital tax (per cent) | | | | | | | | | | | | | | | | | | | | | |
Financial 2 | | Nil | | Nil | | 0.7/4 | | 6 | | Nil | | 1.25 | | 4/5 | | 4 | | 5 | | 6 | |
Health care premiums/month ($) | | | | | | | | | | | | | | | | | | | | | |
Individual/family 3 | | 37.50/75 | | Nil | | Nil | | Nil | | Nil | | Nil | | Nil | | Nil | | Nil | | Nil | |
Payroll tax (per cent) 4 | | 1.95 | | Nil | | Nil | | 2.15 | | 1.95 | | 4.26 | | Nil | | Nil | | Nil | | 2 | |
Insurance premium tax (per cent) 5 | | 2-7 | | 3/4 | | 3/4 | | 2-4.25 | | 2-3.5 | | 3.48 | | 2/3 | | 3/4 | | 3.75/4 | | 5 | |
Fuel tax (cents per litre) 6 | | | | | | | | | | | | | | | | | | | | | |
Gasoline | | 22.28 | | 19.73 | | 15 | | 14 | | 22 | | 28.8 | | 24.7 | | 24.2 | | 22.1 | | 30.5 | |
Diesel | | 23.95 | | 21.03 | | 15 | | 14 | | 22.7 | | 31.5 | | 32.4 | | 25.3 | | 31.2 | | 33.4 | |
Sales tax (per cent) 7 | | | | | | | | | | | | | | | | | | | | | |
General rate | | 7 | | Nil | | 6 | | 8 | | 8 | | 9.975 | | 10 | | 10 | | 10 | | 10 | |
Tobacco tax ($ per carton of 200 cigarettes) 8 | | 55 | | 50 | | 61.16 | | 68.95 | | 45.13 | | 29.80 | | 62.68 | | 67.08 | | 61.54 | | 60.44 | |
1 In British Columbia (and some other provinces), the general rate applies to income from manufacturing and processing. In Quebec, the rate for manufacturing corporations eligible for the small business rate is 4 per cent; the rate for other manufacturing corporations is the general rate.
2 In Saskatchewan, small financial corporations pay the rate of 0.7 per cent on their capital. A small financial corporation has less than $1.5 billion in taxable capital. Large financial corporations are subject to the 4 per cent rate. Manitoba’s tax only applies to large financial corporations with taxable paid-up capital of at least $4 billion on taxable capital exceeding $10 million. Quebec’s tax only applies to life insurance companies. In New Brunswick, trust and loan companies are subject to the rate of 4 per cent, while banks are subject to the rate of 5 per cent. Financial institutions in Prince Edward Island pay tax on their paid-up capital exceeding $2 million.
3 British Columbia Medical Services Plan premiums will be eliminated effective January 1, 2020. Ontario levies a health premium, as part of its provincial personal income tax system, of up to $900 per year per person.
4 Provinces with payroll taxes provide payroll tax relief for small businesses. Quebec also levies a compensation tax of up to 4.29 per cent on salaries and wages paid by financial institutions.
5 Lower rates apply to premiums for life, sickness and accident insurance; higher rates apply to premiums for property insurance including automobile insurance. In British Columbia, the highest rate applies to unlicensed insurance. In Manitoba, Ontario, Quebec and Newfoundland and Labrador, sales taxes also apply to certain insurance premiums except, generally, those related to individual life and health.
6 Tax rates are for regular fuel used on highways and include all provincial taxes payable by consumers at the pump. The British Columbia rates include 6.75 cents per litre dedicated to the BC Transportation Financing Authority and the carbon tax rates of 7.78 cents per litre for gasoline and 8.95 cents per litre for diesel (carbon tax rates will increase to 8.89 cents per litre on gasoline and to 10.23 cents per litre on diesel effective April 1, 2019). The British Columbia rates do not include regional taxes that increase the gasoline and diesel rates by 11 cents per litre in the South Coast British Columbia Transportation Authority (TransLink) service region (British Columbia intends to enable an increase of up to 1.5 cents per litre in the TransLink service region, effective July 1, 2019) and by 5.5 cents per litre in the Capital Regional District. The Alberta rates include carbon levy rates of 6.73 cents per litre for gasoline and 8.03 cents per litre for diesel. The rates for Ontario, Quebec, New Brunswick, Nova Scotia, Prince Edward Island and Newfoundland and Labrador include provincial sales tax based on average pump prices as of January 2019. The rates for Newfoundland and Labrador include carbon tax rates of 4.42 cents per litre for gasoline and 5.37 cents per litre for diesel. The rates for Prince Edward Island do not include carbon tax rates of 4.42 cents per litre for gasoline and 5.37 cents per litre for diesel, which take effect on April 1, 2019. The rates for Saskatchewan, Manitoba, Ontario and New Brunswick do not include federal carbon pricing backstop rates of 4.42 cents per litre for gasoline and 5.37 cents per litre for diesel, which take effect on April 1, 2019. Quebec’s rates do not include increased or reduced regional tax rates, such as an additional 3 cents per litre on gasoline in the Montreal area.
7 Tax rates shown are statutory rates. Ontario, Quebec, New Brunswick, Nova Scotia, Prince Edward Island and Newfoundland and Labrador have harmonized their sales taxes with the federal GST. Alberta imposes a 4 per cent tax on short-term rental accommodation.
8 Includes estimated provincial sales tax in all provinces except British Columbia, Alberta and Quebec.
BUDGET AND FISCAL PLAN - 2019/20 to 2021/22
113
APPENDIX
Table A3 Comparison of Provincial and Federal Taxes by Province — 2019
Tax | | British Columbia | | Alberta | | Saskat-
chewan | | Manitoba | | Ontario | | Quebec | | New
Brunswick | | Nova
Scotia | | Prince
Edward
Island | | New-
foundland
and
Labrador | |
Two Income Family of Four - $90,000 | | ($) | |
1. Provincial Income Tax | | 2,971 | | 3,847 | | 3,473 | | 5,533 | | 3,152 | | 6,486 | | 5,672 | | 6,403 | | 6,528 | | 5,578 | |
Net Child Benefits | | (660 | ) | 0 | | 0 | | — | | 0 | | (2,900 | ) | 0 | | 0 | | — | | 0 | |
2. Property Tax - Gross | | 4,401 | | 3,781 | | 5,241 | | 4,186 | | 5,747 | | 5,697 | | 5,531 | | 4,662 | | 3,886 | | 3,444 | |
- Net | | 3,831 | | 3,781 | | 5,241 | | 4,186 | | 5,747 | | 5,697 | | 5,531 | | 4,662 | | 3,886 | | 3,444 | |
3. Sales Tax | | 1,327 | | 0 | | 1,188 | | 1,610 | | 1,777 | | 2,411 | | 2,087 | | 2,049 | | 1,831 | | 2,092 | |
4. Fuel Tax | | 218 | | 195 | | 225 | | 210 | | 221 | | 288 | | 233 | | 233 | | 197 | | 314 | |
5. Net Carbon Tax | | 348 | | (120 | ) | (317 | ) | (121 | ) | (75 | ) | — | | (93 | ) | — | | 147 | | 203 | |
6. Provincial Direct Taxes | | 8,034 | | 7,703 | | 9,811 | | 11,418 | | 10,822 | | 11,982 | | 13,429 | | 13,347 | | 12,590 | | 11,630 | |
7. Health Care Premiums | | 900 | | — | | — | | — | | — | | — | | — | | — | | — | | — | |
8. Total Provincial Tax | | 8,934 | | 7,703 | | 9,811 | | 11,418 | | 10,822 | | 11,982 | | 13,429 | | 13,347 | | 12,590 | | 11,630 | |
9. Federal Income Tax | | 7,594 | | 7,594 | | 7,594 | | 7,594 | | 7,594 | | 7,573 | | 7,594 | | 7,594 | | 7,594 | | 7,594 | |
10. Net Federal GST | | 1,175 | | 1,201 | | 1,155 | | 1,080 | | 1,136 | | 1,149 | | 1,049 | | 1,029 | | 1,049 | | 1,051 | |
11. Total Tax | | 17,702 | | 16,497 | | 18,560 | | 20,093 | | 19,552 | | 20,705 | | 22,072 | | 21,970 | | 21,233 | | 20,276 | |
| | | | | | | | | | | | | | | | | | | | | |
Two Income Family of Four - $60,000 | | | | | | | | | | | | | | | | | | | | | |
1. Provincial Income Tax | | 1,190 | | 1,465 | | 506 | | 2,443 | | 513 | | 2,582 | | 2,901 | | 3,072 | | 3,511 | | 2,906 | |
Net Child Benefits | | (660 | ) | (749 | ) | 0 | | — | | (97 | ) | (4,000 | ) | 0 | | 0 | | — | | 0 | |
2. Property Tax - Gross | | 3,204 | | 3,068 | | 3,492 | | 3,384 | | 4,123 | | 3,917 | | 3,075 | | 2,925 | | 3,091 | | 2,370 | |
- Net | | 2,634 | | 3,068 | | 3,492 | | 3,384 | | 4,123 | | 3,917 | | 3,075 | | 2,925 | | 3,091 | | 2,370 | |
3. Sales Tax | | 1,058 | | 0 | | 974 | | 1,306 | | 1,305 | | 2,056 | | 1,313 | | 1,665 | | 1,374 | | 1,674 | |
4. Fuel Tax | | 218 | | 195 | | 225 | | 210 | | 221 | | 288 | | 233 | | 233 | | 197 | | 314 | |
5. Net Carbon Tax | | 208 | | (216 | ) | (384 | ) | (171 | ) | (128 | ) | — | | (131 | ) | — | | 113 | | 156 | |
6. Provincial Direct Taxes | | 4,646 | | 3,763 | | 4,814 | | 7,172 | | 5,936 | | 4,843 | | 7,392 | | 7,894 | | 8,286 | | 7,419 | |
7. Health Care Premiums | | 900 | | — | | — | | — | | — | | — | | — | | — | | — | | — | |
8. Total Provincial Tax | | 5,546 | | 3,763 | | 4,814 | | 7,172 | | 5,936 | | 4,843 | | 7,392 | | 7,894 | | 8,286 | | 7,419 | |
9. Federal Income Tax | | 3,846 | | 3,846 | | 3,846 | | 3,846 | | 3,846 | | 3,832 | | 3,846 | | 3,846 | | 3,846 | | 3,846 | |
10. Net Federal GST | | 937 | | 987 | | 947 | | 877 | | 932 | | 987 | | 852 | | 836 | | 846 | | 841 | |
11. Total Tax | | 10,330 | | 8,597 | | 9,608 | | 11,895 | | 10,714 | | 9,663 | | 12,090 | | 12,577 | | 12,978 | | 12,107 | |
| | | | | | | | | | | | | | | | | | | | | |
Two Income Family of Four - $30,000 | | | | | | | | | | | | | | | | | | | | | |
1. Provincial Income Tax | | 0 | | 0 | | (964 | ) | (500 | ) | (648 | ) | (3,414 | ) | 0 | | (184 | ) | 178 | | 0 | |
Net Child Benefits | | (660 | ) | (1,560 | ) | 0 | | — | | (2,252 | ) | (4,207 | ) | (52 | ) | 0 | | — | | 0 | |
2. Property Tax | | — | | — | | — | | — | | — | | — | | — | | — | | — | | — | |
3. Sales Tax | | 881 | | 0 | | 696 | | 971 | | (45 | ) | 1,722 | | 483 | | 1,246 | | 943 | | 377 | |
4. Fuel Tax | | 145 | | 130 | | 150 | | 140 | | 147 | | 192 | | 155 | | 155 | | 131 | | 209 | |
5. Net Carbon Tax | | (150 | ) | (268 | ) | (420 | ) | (198 | ) | (157 | ) | — | | (151 | ) | — | | 95 | | 131 | |
6. Provincial Direct Taxes | | 216 | | (1,699 | ) | (538 | ) | 414 | | (2,955 | ) | (5,707 | ) | 436 | | 1,217 | | 1,347 | | 717 | |
7. Health Care Premiums | | 0 | | — | | — | | — | | — | | — | | — | | — | | — | | — | |
8. Total Provincial Tax | | 216 | | (1,699 | ) | (538 | ) | 414 | | (2,955 | ) | (5,707 | ) | 436 | | 1,217 | | 1,347 | | 717 | |
9. Federal Income Tax | | 6 | | 6 | | 6 | | 6 | | 6 | | 101 | | 6 | | 6 | | 6 | | 6 | |
10. Net Federal GST | | (216 | ) | (149 | ) | (200 | ) | (224 | ) | (127 | ) | (45 | ) | (232 | ) | (250 | ) | (241 | ) | (230 | ) |
11. Total Tax | | 6 | | (1,841 | ) | (732 | ) | 195 | | (3,076 | ) | (5,651 | ) | 210 | | 973 | | 1,112 | | 493 | |
| | | | | | | | | | | | | | | | | | | | | |
Unattached Individual - $25,000 | | | | | | | | | | | | | | | | | | | | | |
1. Provincial Income Tax | | 222 | | 278 | | 293 | | 652 | | 155 | | (377 | ) | 567 | | 683 | | 1,255 | | 784 | |
2. Property Tax | | — | | — | | — | | — | | — | | — | | — | | — | | — | | — | |
3. Sales Tax | | 365 | | 0 | | 346 | | 465 | | 249 | | 728 | | 353 | | 629 | | 420 | | 199 | |
4. Fuel Tax | | 145 | | 130 | | 150 | | 140 | | 147 | | 192 | | 155 | | 155 | | 131 | | 209 | |
5. Net Carbon Tax | | (59 | ) | (196 | ) | (233 | ) | (116 | ) | (97 | ) | — | | (88 | ) | — | | 36 | | 50 | |
6. Provincial Direct Taxes | | 674 | | 212 | | 556 | | 1,142 | | 455 | | 543 | | 988 | | 1,467 | | 1,842 | | 1,242 | |
7. Health Care Premiums | | 0 | | — | | — | | — | | — | | — | | — | | — | | — | | — | |
8. Total Provincial Tax | | 674 | | 212 | | 556 | | 1,142 | | 455 | | 543 | | 988 | | 1,467 | | 1,842 | | 1,242 | |
9. Federal Income Tax | | 1,329 | | 1,329 | | 1,329 | | 1,329 | | 1,329 | | 1,323 | | 1,329 | | 1,329 | | 1,329 | | 1,329 | |
10. Net Federal GST | | (96 | ) | (78 | ) | (94 | ) | (110 | ) | (90 | ) | (81 | ) | (108 | ) | (120 | ) | (127 | ) | (110 | ) |
11. Total Tax | | 1,907 | | 1,463 | | 1,791 | | 2,360 | | 1,693 | | 1,785 | | 2,208 | | 2,676 | | 3,044 | | 2,461 | |

BUDGET AND FISCAL PLAN - 2019/20 to 2021/22
114
APPENDIX
Table A3 Comparison of Provincial and Federal Taxes by Province — 2019
Tax | | British Columbia | | Alberta | | Saskat-chewan | | Manitoba | | Ontario | | Quebec | | New
Brunswick | | Nova
Scotia | | Prince
Edward
Island | | New-
foundland
and
Labrador | |
Unattached Individual - $80,000 | | | | | | | | | | | ($) | | | | | | | | | | |
1. Provincial Income Tax | | 3,877 | | 5,072 | | 6,242 | | 6,774 | | 4,977 | | 8,558 | | 7,390 | | 8,376 | | 7,922 | | 7,373 | |
2. Property Tax - Gross | | 2,191 | | 3,036 | | 3,789 | | 4,998 | | 3,996 | | 5,199 | | 2,500 | | 3,843 | | 2,849 | | 2,432 | |
- Net. | | 1,621 | | 3,036 | | 3,789 | | 4,998 | | 3,996 | | 5,199 | | 2,500 | | 3,843 | | 2,849 | | 2,432 | |
3. Sales Tax | | 1,074 | | 0 | | 956 | | 1,305 | | 1,501 | | 1,861 | | 1,737 | | 1,683 | | 1,501 | | 1,738 | |
4. Fuel Tax | | 218 | | 195 | | 225 | | 210 | | 221 | | 288 | | 233 | | 233 | | 197 | | 314 | |
5. Net Carbon Tax | | 283 | | 342 | | (67 | ) | 8 | | 35 | | — | | 5 | | — | | 120 | | 165 | |
6. Provincial Direct Taxes | | 7,073 | | 8,646 | | 11,145 | | 13,295 | | 10,729 | | 15,905 | | 11,864 | | 14,134 | | 12,587 | | 12,022 | |
7. Health Care Premiums | | 450 | | — | | — | | — | | — | | — | | — | | — | | — | | — | |
8. Total Provincial Tax | | 7,523 | | 8,646 | | 11,145 | | 13,295 | | 10,729 | | 15,905 | | 11,864 | | 14,134 | | 12,587 | | 12,022 | |
9. Federal Income Tax | | 9,954 | | 9,954 | | 9,954 | | 9,954 | | 9,954 | | 9,923 | | 9,954 | | 9,954 | | 9,954 | | 9,954 | |
10. Net Federal GST | | 1,007 | | 1,030 | | 949 | | 920 | | 961 | | 900 | | 878 | | 851 | | 883 | | 878 | |
11. Total Tax | | 18,483 | | 19,629 | | 22,048 | | 24,169 | | 21,644 | | 26,728 | | 22,696 | | 24,938 | | 23,424 | | 22,854 | |
| | | | | | | | | | | | | | | | | | | | | |
Senior Couple with Equal Pension Incomes - $30,000 | | | | | | | | | | | | | | | | | | | | | |
| | | | | | | | | | | | | | | | | | | | | |
1. Provincial Income Tax | | 0 | | 0 | | (692 | ) | (1,088 | ) | (1,622 | ) | (1,260 | ) | 0 | | (184 | ) | 0 | | (1,079 | ) |
2. Property Tax - Gross | | 3,204 | | 3,068 | | 3,492 | | 3,384 | | 4,123 | | 3,917 | | 3,075 | | 2,925 | | 3,091 | | 2,370 | |
- Net | | 2,359 | | 3,068 | | 3,492 | | 3,384 | | 4,123 | | 3,917 | | 3,075 | | 2,925 | | 3,091 | | 2,370 | |
3. Sales Tax | | 664 | | 0 | | 616 | | 882 | | 530 | | 1,298 | | 681 | | 1,266 | | 926 | | 870 | |
4. Fuel Tax | | 145 | | 130 | | 150 | | 140 | | 147 | | 192 | | 155 | | 155 | | 131 | | 209 | |
5. Net Carbon Tax | | (65 | ) | (178 | ) | (268 | ) | (114 | ) | (81 | ) | — | | (87 | ) | — | | 95 | | 131 | |
6. Provincial Direct Taxes | | 3,103 | | 3,020 | | 3,298 | | 3,205 | | 3,096 | | 4,147 | | 3,825 | | 4,162 | | 4,243 | | 2,502 | |
7. Health Care Premiums | | 0 | | — | | — | | — | | — | | — | | — | | — | | — | | — | |
8. Total Provincial Tax | | 3,103 | | 3,020 | | 3,298 | | 3,205 | | 3,096 | | 4,147 | | 3,825 | | 4,162 | | 4,243 | | 2,502 | |
9. Federal Income Tax | | 0 | | 0 | | 0 | | 0 | | 0 | | 0 | | 0 | | 0 | | 0 | | 0 | |
10. Net Federal GST | | 99 | | 114 | | 94 | | 101 | | 101 | | 67 | | 74 | | 66 | | 77 | | 124 | |
11. Total Tax | | 3,203 | | 3,135 | | 3,393 | | 3,306 | | 3,197 | | 4,215 | | 3,899 | | 4,228 | | 4,320 | | 2,626 | |
| | | | | | | | | | | | | | | | | | | | | | | | | | | | | | | | | | | | | |
Personal Income Tax
· Income tax is based on basic personal credits, applicable credits and typical major deductions at each income level. Quebec residents pay federal income tax less an abatement of 16.5 per cent of basic federal tax. This abatement has been used to reduce Quebec provincial tax rather than federal tax, for comparative purposes.
· The amounts noted for each family is their family total income. Total income is used for these tables as it provides a more accurate view of the taxes paid by a family at a particular level of earnings. The two income family of four with $60,000 annual income is assumed to have one spouse earning $40,000 and the other $20,000, the family with $90,000 income is assumed to have one spouse earning $50,000 and the other $40,000, the family with $30,000 is assumed to have each spouse earning $15,000 and each senior is assumed to receive $15,000. All representative families are assumed to have employment income except the senior couple.
Net Child Benefits
· Net child benefits are provincial measures affecting payments to families with children. Provincial child benefit measures are available in British Columbia (BC Early Childhood Tax Benefit), Alberta (Child Benefit, Family Employment Credit), Ontario (Child Benefit), Quebec (Child Assistance Payments), New Brunswick (Child Tax Benefit), Nova Scotia (Child Benefit) and Newfoundland and Labrador (Child Benefit). British Columbia intends to introduce the BC Child Opportunity Benefit effective October 1, 2020.
Property Tax
· It is assumed that the family at $30,000 and the individual at $25,000 rent accommodation, the family at $60,000 and the senior couple own bungalows, the family at $90,000 owns a two-storey executive-style home, and the individual at $80,000 owns a luxury condominium in a major city for each province. Net local and provincial property taxes are estimated as taxes owing, after credits provided through the property tax system are subtracted.
Sales, Fuel and Carbon Tax Estimates
· The methodology for estimating sales tax was revised from the prior year to better reflect consumption levels of taxable goods and services.
· Estimates are based on expenditure patterns from the Survey of Household Spending. In estimating individual and family taxable consumption, disposable income is reduced by 20 per cent to reflect housing (mortgage and property taxes or rent) costs. The senior couple is assumed to own their home and have no mortgage costs. For each province, disposable income is further reduced by estimated federal income taxes, estimated provincial income taxes and health care premiums, if applicable. In addition, the single individual with $80,000 annual income and the family with $90,000 annual income are assumed to have savings equal to 5 per cent of their disposable income. For each family, disposable income is distributed among expenditures using the consumption pattern of a typical family with the relevant characteristics as estimated using family expenditure data, and the relevant sales tax component is extracted. Sales tax includes: provincial retail sales taxes in British Columbia, Saskatchewan, and Manitoba; Quebec’s value added tax; the provincial component of the HST in Ontario, New Brunswick, Nova Scotia, Prince Edward Island and Newfoundland and Labrador; and Alberta’s Tourism Levy. Sales tax estimates have been reduced by sales tax credits where applicable.
· Fuel tax is based on annual consumption: 1,000 litres of unleaded fuel for the individual at $25,000, the family at $30,000 and the senior couple; others are assumed to consume 1,500 litres.
· The methodology for calculating carbon taxes was revised from the prior year to incorporate consumption data from all provinces.
· Net carbon tax is estimated as carbon tax liabilities minus rebates such as British Columbia’s climate action tax credit, where applicable. Carbon tax liabilities are based on direct fuel charges on gasoline, natural gas and home heating fuel where such charges apply (British Columbia and Alberta - fuel charges do not apply to home heating fuel in Prince Edward Island and Newfoundland and Labrador), or are scheduled to apply (the federal backstop provinces of Saskatchewan, Manitoba, Ontario and New Brunswick). Estimated carbon tax liabilities are based on natural gas and home heating fuel consumption amounts from household energy consumption data produced by Statistics Canada. Carbon tax liabilities do not include the effect of cap-and-trade or output-based pricing systems.
Health Care Premiums
· British Columbia MSP Premiums will be eliminated January 1, 2020.
Effective Tax Rates
· British Columbia taxes have been calculated using rates in effect for 2019. Taxes for other provinces were calculated using rates that were announced prior to February 1, 2019, and that come into effect during 2019.
BUDGET AND FISCAL PLAN - 2019/20 to 2021/22
115
APPENDIX
Table A4 Interprovincial Comparisons of Provincial Personal Income Taxes Payable 1 — 2019
(Rates known as of February 1, 2019)
Taxable income | | British
Columbia | | Alberta | | Saskat- chewan | | Manitoba | | Ontario | | Quebec 2 | | New
Brunswick | | Nova
Scotia | | Prince
Edward
Island | | New-
foundland
and
Labrador | |
| | Annual provincial taxes payable3 ($) | |
$ | 10,000 | | 0 | | 0 | | 0 | | 0 | | 0 | | 0 | | 0 | | 0 | | 0 | | 0 | |
$ | 20,000 | | 0 | | 0 | | 291 | | 966 | | 346 | | 134 | | 251 | | 596 | | 748 | | 0 | |
$ | 30,000 | | 753 | | 879 | | 1,270 | | 2,002 | | 1,188 | | 1,404 | | 1,454 | | 1,518 | | 1,862 | | 1,631 | |
$ | 40,000 | | 1,357 | | 1,812 | | 2,250 | | 3,152 | | 1,809 | | 2,768 | | 2,636 | | 3,007 | | 3,097 | | 2,582 | |
$ | 50,000 | | 2,074 | | 2,745 | | 3,325 | | 4,355 | | 2,680 | | 4,435 | | 3,919 | | 4,495 | | 4,411 | | 3,974 | |
$ | 60,000 | | 2,822 | | 3,702 | | 4,530 | | 5,584 | | 3,573 | | 6,107 | | 5,360 | | 6,020 | | 5,749 | | 5,387 | |
$ | 70,000 | | 3,592 | | 4,702 | | 5,780 | | 6,859 | | 4,488 | | 7,769 | | 6,842 | | 7,739 | | 7,304 | | 6,837 | |
$ | 80,000 | | 4,362 | | 5,702 | | 7,030 | | 8,570 | | 5,566 | | 9,431 | | 8,324 | | 9,433 | | 8,974 | | 8,349 | |
$ | 100,000 | | 6,539 | | 7,702 | | 9,530 | | 12,050 | | 8,348 | | 13,161 | | 11,540 | | 12,825 | | 12,314 | | 11,509 | |
$ | 125,000 | | 9,889 | | 10,202 | | 12,655 | | 16,400 | | 12,700 | | 18,391 | | 15,670 | | 17,200 | | 16,888 | | 15,459 | |
$ | 150,000 | | 13,564 | | 13,078 | | 16,195 | | 20,750 | | 17,053 | | 23,745 | | 19,952 | | 21,575 | | 21,481 | | 19,646 | |
| | Provincial personal income taxes as a per cent of taxable income (%) | |
$ | 10,000 | | 0.0 | | 0.0 | | 0.0 | | 0.0 | | 0.0 | | 0.0 | | 0.0 | | 0.0 | | 0.0 | | 0.0 | |
$ | 20,000 | | 0.0 | | 0.0 | | 1.5 | | 4.8 | | 1.7 | | 0.7 | | 1.3 | | 3.0 | | 3.7 | | 0.0 | |
$ | 30,000 | | 2.5 | | 2.9 | | 4.2 | | 6.7 | | 4.0 | | 4.7 | | 4.8 | | 5.1 | | 6.2 | | 5.4 | |
$ | 40,000 | | 3.4 | | 4.5 | | 5.6 | | 7.9 | | 4.5 | | 6.9 | | 6.6 | | 7.5 | | 7.7 | | 6.5 | |
$ | 50,000 | | 4.1 | | 5.5 | | 6.6 | | 8.7 | | 5.4 | | 8.9 | | 7.8 | | 9.0 | | 8.8 | | 7.9 | |
$ | 60,000 | | 4.7 | | 6.2 | | 7.5 | | 9.3 | | 6.0 | | 10.2 | | 8.9 | | 10.0 | | 9.6 | | 9.0 | |
$ | 70,000 | | 5.1 | | 6.7 | | 8.3 | | 9.8 | | 6.4 | | 11.1 | | 9.8 | | 11.1 | | 10.4 | | 9.8 | |
$ | 80,000 | | 5.5 | | 7.1 | | 8.8 | | 10.7 | | 7.0 | | 11.8 | | 10.4 | | 11.8 | | 11.2 | | 10.4 | |
$ | 100,000 | | 6.5 | | 7.7 | | 9.5 | | 12.1 | | 8.3 | | 13.2 | | 11.5 | | 12.8 | | 12.3 | | 11.5 | |
$ | 125,000 | | 7.9 | | 8.2 | | 10.1 | | 13.1 | | 10.2 | | 14.7 | | 12.5 | | 13.8 | | 13.5 | | 12.4 | |
$ | 150,000 | | 9.0 | | 8.7 | | 10.8 | | 13.8 | | 11.4 | | 15.8 | | 13.3 | | 14.4 | | 14.3 | | 13.1 | |
1 Calculated for a single individual with wage income and claiming credits for Canada Pension Plan and Quebec Pension Plan contributions, Employment Insurance premiums, Quebec Parental Insurance Plan premiums and the basic personal amount.
2 Quebec residents pay federal tax less an abatement of 16.5 per cent of federal tax. In the table, the Quebec abatement has been used to reduce Quebec provincial personal income tax for comparative purposes.
3 Includes provincial low income reductions, surtaxes payable in Ontario and Prince Edward Island and the Ontario Health Premium tax. Excludes credits for sales and property tax credits.
BUDGET AND FISCAL PLAN - 2019/20 to 2021/22
116
APPENDIX
Table A4.1 Net Provincial Taxes Since Budget 2016
Tax | | 2016 | | 2017 Update | | 2018 | | 2019 | | Policies Fully
Implemented 1 | |
$30,000 of Family Net Income | | ($) | |
1. MSP Premiums | | 0 | | 0 | | 0 | | 0 | | 0 | |
2. Provincial Income Tax | | 0 | | 0 | | 0 | | 0 | | 0 | |
3. Early Childhood Tax Benefit | | (660 | ) | (660 | ) | (660 | ) | (660 | ) | 0 | |
4. Child Opportunity Benefit | | 0 | | 0 | | 0 | | 0 | | (2,400 | ) |
5. Carbon Tax | | (126 | ) | (126 | ) | (129 | ) | (150 | ) | (210 | ) |
6. Sales Tax | | 818 | | 830 | | 839 | | 845 | | 917 | |
7. Fuel Tax | | 145 | | 145 | | 145 | | 145 | | 145 | |
8. Net Provincial Tax | | 177 | | 189 | | 195 | | 180 | | (1,548 | ) |
| | | | | | | | | | | |
$60,000 of Family Net Income | | | | | | | | | | | |
1. MSP Premiums | | 1,800 | | 1,800 | | 900 | | 900 | | 0 | |
2. Provincial Income Tax | | 1,714 | | 1,663 | | 1,595 | | 1,505 | | 1,505 | |
3. Early Childhood Tax Benefit | | (660 | ) | (660 | ) | (660 | ) | (660 | ) | 0 | |
4. Child Opportunity Benefit | | 0 | | 0 | | 0 | | 0 | | (1,380 | ) |
5. Carbon Tax | | 208 | | 208 | | 233 | | 261 | | 232 | |
6. Sales Tax | | 958 | | 969 | | 1,003 | | 1,025 | | 1,078 | |
7. Fuel Tax | | 218 | | 218 | | 218 | | 218 | | 218 | |
8. Net Provincial Tax | | 4,238 | | 4,198 | | 3,289 | | 3,249 | | 1,653 | |
| | | | | | | | | | | |
$80,000 of Family Net Income | | | | | | | | | | | |
1. MSP Premiums | | 1,800 | | 1,800 | | 900 | | 900 | | 0 | |
2. Provincial Income Tax | | 2,869 | | 2,824 | | 2,761 | | 2,713 | | 2,713 | |
3. Early Childhood Tax Benefit | | (660 | ) | (660 | ) | (660 | ) | (660 | ) | 0 | |
4. Child Opportunity Benefit | | 0 | | 0 | | 0 | | 0 | | (1,380 | ) |
5. Carbon Tax | | 236 | | 236 | | 265 | | 305 | | 393 | |
6. Sales Tax | | 1,174 | | 1,184 | | 1,215 | | 1,245 | | 1,295 | |
7. Fuel Tax | | 218 | | 218 | | 218 | | 218 | | 218 | |
8. Net Provincial Tax | | 5,637 | | 5,602 | | 4,699 | | 4,721 | | 3,239 | |
| | | | | | | | | | | |
$100,000 of Family Net Income | | | | | | | | | | | |
1. MSP Premiums | | 1,800 | | 1,800 | | 900 | | 900 | | 0 | |
2. Provincial Income Tax | | 4,340 | | 4,298 | | 4,234 | | 4,148 | | 4,148 | |
3. Early Childhood Tax Benefit | | (660 | ) | (660 | ) | (660 | ) | (660 | ) | 0 | |
4. Child Opportunity Benefit | | 0 | | 0 | | 0 | | 0 | | (580 | ) |
5. Carbon Tax | | 269 | | 269 | | 303 | | 348 | | 449 | |
6. Sales Tax | | 1,434 | | 1,447 | | 1,480 | | 1,527 | | 1,553 | |
7. Fuel Tax | | 290 | | 290 | | 290 | | 290 | | 290 | |
8. Net Provincial Tax | | 7,473 | | 7,444 | | 6,547 | | 6,553 | | 5,860 | |
1 This column includes taxes paid in 2019 plus the elimination of MSP Premiums in January 2020, introduction of the BC Child Opportunity Benefit in October 2020, increase in the carbon tax rate to $50 per tonne in April 2021 and the increase of the climate action tax credit to $193.50 for an adult and $56.50 for a child in July 2021.
Personal Income Tax
· For each family, the amount noted is the family net income. Net income forms the basis of many benefits provided through the tax system and, therefore, will provide a more accurate illustration on benefits received and premiums paid by a family at their respective family net income level. Income tax is calculated based on applicable tax rates and credits. All families are assumed to have each spouse earning an equal amount of employment income
· Families are assumed to have two children aged five and twelve.
Net Child Benefits
· Net child benefits are provincial measures affecting payments to families with children. The BC early childhood tax benefit is in effect until September 2020. British Columbia intends to introduce the BC Child Opportunity Benefit effective October 1, 2020.
Sales, Fuel and Carbon Tax Estimates
· Disposable income is estimated based on the total amounts received in 2016 adjusted for inflation. In estimating taxable consumption, disposable income is reduced by 20 per cent to reflect rent. Cost of groceries and utilities are estimated based on the Survey of Household Spending and subtracted, thereafter.
· For each family, income after rent, groceries and utilities is distributed among the remaining expenditures using the consumption pattern of a typical family with two children estimated based on expenditure patterns from the Survey of Household Spending. The relevant sales tax component is extracted based on the estimates.
· Fuel tax is based on annual consumption: 1,000 litres of unleaded fuel for the family at $30,000 family net income; 1,500 litres of unleaded fuel for the family at $60,000 and at $80,000 family net income; and 2,000 litres of unleaded fuel for the family at $100,000 family net income.
· Net carbon tax is estimated as carbon tax liabilities minus the BC climate action tax credit. Carbon tax liabilities are based on direct fuel charges on gasoline, natural gas and home heating fuel. Estimated carbon tax liabilities are based on natural gas and home heating fuel consumption amounts from household energy consumption data from Statistics Canada.
· The carbon tax rate will increase to $50 per tonne effective April 1, 2021. British Columbia intends to increase the BC climate action tax credit to $193.50 for an adult and $56.50 for a child effective July 1, 2021. A single parent will receive $193.50 for their first child.
Health Care Premiums
· British Columbia MSP Premiums will be eliminated January 1, 2020. This table assumes that the full MSP Premium is paid by the family and not paid by the employer.
BUDGET AND FISCAL PLAN - 2019/20 to 2021/22
117
APPENDIX
Table A5 Material Assumptions — Revenue
| | Updated | | Budget | | | | | | | |
Revenue Source and Assumptions | | Forecast | | Estimate | | Plan | | Plan | | | |
($ millions unless otherwise specified) | | 2018/19 | | 2019/20 | | 2020/21 | | 2021/22 | | 2019/20 Sensitivities | |
Personal income tax * | | $ | 11,348 | | $ | 11,055 | | $ | 11,583 | | $ | 12,110 | | | |
Current calendar year assumptions | | | | | | | | | | | |
Household income growth | | 4.8 | % | 4.0 | % | 3.9 | % | 3.9 | % | +/- 1 percentage point change in 2019 BC household income growth equals +/- $100 to $110 million | |
Compensation of employees growth | | 5.7 | % | 4.3 | % | 4.1 | % | 4.0 | % | |
Tax base growth | | 5.0 | % | 3.9 | % | 4.0 | % | 3.7 | % | |
Average tax yield | | 5.69 | % | 5.74 | % | 5.79 | % | 5.84 | % | | |
Current-year tax | | $ | 10,183 | | $ | 10,603 | | $ | 11,127 | | $ | 11,641 | | | |
Prior year’s tax assessments | | $ | 475 | | $ | 485 | | $ | 495 | | $ | 505 | | | |
Unapplied taxes | | $ | 100 | | $ | 100 | | $ | 100 | | $ | 100 | | | |
BC Tax Reduction | | $ | (161 | ) | $ | (165 | ) | $ | (168 | ) | $ | (171 | ) | | |
Non-refundable BC tax credits | | $ | (110 | ) | $ | (109 | ) | $ | (109 | ) | $ | (109 | ) | | |
Policy neutral elasticity ** | | 1.2 | | 1.2 | | 1.2 | | 1.2 | | +/- 0.5 change in 2019 BC policy neutral elasticity equals +/- $200 to $210 million | |
Fiscal year assumptions | | | | | | | | | | |
Prior-year adjustment | | $ | 746 | | | | | | | | |
| | | | | | | | | | | |
2017 Tax-year | | 2017 Assumptions | | | | | | | |
Household income growth | | 6.8 | % | | | | | | | +/- 1 percentage point change in 2018 BC household or taxable income growth equals +/- $120 to $130 million one-time effect (prior-year adjustment) and could result in an additional +/- $100 to $110 million base change in 2019/20 | |
Tax base growth | | 8.6 | % | | | | | | | |
Average 2017 tax yield | | 5.46 | % | | | | | | | |
2017 tax | | $ | 9,288 | | | | | | | | |
2016 & prior year’s tax assessments | | $ | 475 | | | | | | | | |
Unapplied taxes | | $ | 100 | | | | | | | | |
BC Tax Reduction | | $ | (157 | ) | | | | | | | |
Non-refundable BC tax credits | | $ | (114 | ) | | | | | | | |
Policy neutral elasticity ** | | 1.94 | | | | | | | | |
* Reflects information as at January 21, 2019
** Per cent growth in current year tax revenue (excluding policy measures) relative to per cent growth in household income (calendar year).
Corporate income tax * | | $ | 5,132 | | $ | 4,192 | | $ | 4,284 | | $ | 4,859 | | | |
Components of revenue (fiscal year) | | | | | | | | | | | |
Instalments — subject to general rate | | $ | 4,086 | | $ | 3,927 | | $ | 4,028 | | $ | 4,300 | | | |
Instalments — subject to small business rate | | $ | 295 | | $ | 281 | | $ | 282 | | $ | 298 | | | |
Non-refundable BC tax credits | | $ | (108 | ) | $ | (112 | ) | $ | (118 | ) | $ | (124 | ) | | |
Advance instalments | | $ | 4,273 | | $ | 4,096 | | $ | 4,192 | | $ | 4,474 | | | |
International Business Activity Act refunds | | $ | (15 | ) | $ | (10 | ) | — | | — | | | |
Prior-year settlement payment | | $ | 874 | | $ | 106 | | $ | 92 | | $ | 385 | | | |
| | | | | | | | | | | |
Current calendar year assumptions | | $ | 355.5 | | $ | 322.6 | | $ | 330.6 | | $ | 339.2 | | +/- 1% change in the 2019 national tax base equals +/- $40 to $50 million | |
National tax base ($ billions) | | 13.5 | % | 14.5 | % | 14.1 | % | 14.6 | % | |
BC instalment share of national tax base | | 12.0 / 2.0 | | 12.0 / 2.0 | | 12.0 / 2.0 | | 12.0 / 2.0 | | |
Effective tax rates (general/small business) | | | | | | | | | | |
| | | | | | | | | | | |
Share of the BC tax base subject to small business rate | | 31.0 | % | 30.2 | % | 29.7 | % | 29.4 | % | +/- 1 percentage point change in the 2019 small business share equals -/+ $30 to $40 million | |
BC tax base growth (post federal measures) | | 2.8 | % | -3.9 | % | 6.9 | % | 4.2 | % | |
BC net operating surplus growth | | 4.2 | % | 0.3 | % | 4.3 | % | 3.0 | % | |
| | | | | | | | | | | |
2017 Tax-year | | 2017 Assumptions | | | | | | +/- 1% change in the 2018 BC tax base equals +/- $60 to $70 million in 2019/20 | |
BC tax base growth (post federal measures) | | 16.2 | % | | | | | | | |
BC net operating surplus growth | | 18.7 | % | | | | | | | |
Gross 2017 tax | | $ | 4,118 | | | | | | | | | |
Prior-year settlement payment | | $ | 874 | | | | | | | | | |
Prior years losses/gains (included in above) | | $ | 103 | | | | | | | | | |
Non-refundable BC tax credits | | $ | (110 | ) | | | | | | | | |
| | | | | | | | | | | | | | | | |
* Reflects information as at January 21, 2019
Net cash received from the federal government and cash refunds under the International Business Activity Act are used as the basis for estimating revenue. Due to lags in the federal collection and instalment systems, changes to the BC net operating surplus and tax base forecasts affect revenue in the succeeding year. The 2019/20 instalments from the federal government reflects two-third of payments related to the 2019 tax year (paid during Apr-July 2019 and adjusted in Sept and Dec) and one-third of 2020 payments. Instalments for the 2019 (2020) tax year are based on BC’s share of the national tax base for the 2017 (2018) tax year and a forecast of the 2019 (2020) national tax base. BC’s share of the 2017 national tax base was 14.50%, based on tax assessments as of December 31, 2018. Cash adjustments for any under/over payments from the federal government in respect of 2018 will be received/paid on March 31, 2020.

BUDGET AND FISCAL PLAN - 2019/20 to 2021/22
118
APPENDIX
Table A5 Material Assumptions — Revenue (continued)
| | Updated | | Budget | | Plan
2020/21 | | Plan
2021/22 | | | |
Revenue Source and Assumptions | | Forecast | | Estimate | | | | | |
($ millions unless otherwise specified) | | 2018/19 | | 2019/20 | | | | 2019/20 Sensitivities | |
Employer health tax | | $ | 464 | | $ | 1,854 | | $ | 1,930 | | $ | 2,007 | | | |
Provincial sales tax | | $ | 7,318 | | $ | 7,586 | | $ | 7,937 | | $ | 8,282 | | | |
Provincial sales tax base growth (fiscal year) | | 3.0 | % | 4.7 | % | 4.4 | % | 4.4 | % | +/- 1 percentage point change in the 2019 consumer expenditure growth equals up to +/- $30 million | |
Calendar Year nominal expenditure | | | | | | | | | | |
Consumer expenditures on durable goods | | 0.6 | % | 2.5 | % | 2.7 | % | 2.5 | % | |
Consumer expenditures on goods and services | | 5.0 | % | 4.9 | % | 4.9 | % | 4.9 | % | | |
Business investment | | 6.3 | % | 5.9 | % | 4.7 | % | 5.5 | % | | |
Other | | 6.0 | % | 4.5 | % | 4.0 | % | 3.8 | % | | |
Components of Provincial sales tax revenue | | | | | | | | | | +/- 1 percentage point change in the 2019 business investment growth equals up to +/- $10 million | |
Consolidated Revenue Fund | | $ | 7,309 | | $ | 7,574 | | $ | 7,925 | | $ | 8,270 | |
BC Transportation Financing Authority | | $ | 9 | | $ | 12 | | $ | 12 | | $ | 12 | |
Fuel and carbon taxes | | $ | 2,474 | | $ | 2,734 | | $ | 3,000 | | $ | 3,237 | | | |
Calendar Year | | | | | | | | | | | |
Real GDP | | 2.2 | % | 2.4 | % | 2.3 | % | 2.1 | % | | |
Gasoline volumes | | -4.9 | % | 0.0 | % | 0.0 | % | 0.0 | % | | |
Diesel volumes | | 2.1 | % | 2.0 | % | 2.0 | % | 2.0 | % | | |
Natural gas volumes | | 16.0 | % | 2.4 | % | 2.3 | % | 2.1 | % | | |
Carbon tax rates (April 1) | | | | | | | | | | | |
Carbon dioxide equivalent emissions ($/tonne) | | $ | 35 | | $ | 40 | | $ | 45 | | $ | 50 | | | |
Natural gas (cents/gigajoule) | | 173.81 | ¢ | 198.64 | ¢ | 223.47 | ¢ | 248.30 | ¢ | | |
Gasoline (cents/litre) | | 7.78 | ¢ | 8.89 | ¢ | 10.01 | ¢ | 11.12 | ¢ | | |
Light fuel oil (cents/litre) | | 8.95 | ¢ | 10.23 | ¢ | 11.51 | ¢ | 12.78 | ¢ | | |
| | | | | | | | | | | |
Components of revenue | | | | | | | | | | | |
Consolidated Revenue Fund | | $ | 530 | | $ | 534 | | $ | 541 | | $ | 544 | | | |
BC Transit | | $ | 20 | | $ | 20 | | $ | 20 | | $ | 20 | | | |
BC Transportation Financing Authority | | $ | 464 | | $ | 467 | | $ | 470 | | $ | 473 | | | |
| | $ | 1,014 | | $ | 1,021 | | $ | 1,031 | | $ | 1,037 | | | |
Carbon tax revenue | | $ | 1,460 | | $ | 1,713 | | $ | 1,969 | | $ | 2,200 | | | |
Property taxes | | $ | 2,601 | | $ | 2,996 | | $ | 3,120 | | $ | 3,250 | | | |
Calendar Year | | | | | | | | | | | |
Consumer Price Index | | 2.7 | % | 2.2 | % | 2.1 | % | 2.0 | % | +/- 1 percentage point change in 2019 new construction & inflation growth equals up to +/- $20 million in residential property taxation revenue | |
Housing starts (units) | | 40,857 | | 34,015 | | 31,846 | | 30,517 | | |
Home owner grants (fiscal year) | | $ | 824 | | $ | 836 | | $ | 849 | | $ | 861 | | |
Components of revenue | | | | | | | | | | |
Residential (net of home owner grants) | | $ | 951 | | $ | 1,146 | | $ | 1,183 | | $ | 1,219 | | | |
Speculation and vacancy | | $ | 87 | | $ | 185 | | $ | 185 | | $ | 185 | | | |
Non-residential | | $ | 1,249 | | $ | 1,331 | | $ | 1,409 | | $ | 1,493 | | +/- 1% change in 2019 total business property assessment value equals up to +/- $15 million in non-residential property taxation revenue | |
Rural area | | $ | 118 | | $ | 124 | | $ | 128 | | $ | 131 | | |
Police | | $ | 33 | | $ | 36 | | $ | 37 | | $ | 38 | | |
BC Assessment Authority | | $ | 93 | | $ | 95 | | $ | 96 | | $ | 98 | | |
BC Transit | | $ | 70 | | $ | 79 | | $ | 82 | | $ | 86 | | |
Other taxes | | $ | 3,300 | | $ | 3,315 | | $ | 3,325 | | $ | 3,335 | | | |
Calendar Year | | | | | | | | | | | |
Population | | 1.4 | % | 1.3 | % | 1.3 | % | 1.3 | % | | |
Residential sales value | | -24.2 | % | 3.0 | % | 4.4 | % | 4.6 | % | | |
Real GDP | | 2.2 | % | 2.4 | % | 2.3 | % | 2.1 | % | | |
Nominal GDP | | 4.6 | % | 4.4 | % | 4.3 | % | 4.0 | % | | |
Components of revenue | | | | | | | | | | +/- 1% change to 2019 residential sales value equals +/- $20 million in property transfer revenue, depending on property values | |
Property transfer | | $ | 1,910 | | $ | 1,910 | | $ | 1,910 | | $ | 1,910 | | |
Additional Property Transfer Tax (included in above)* | | $ | 190 | | $ | 190 | | $ | 190 | | $ | 190 | | |
Tobacco | | $ | 780 | | $ | 780 | | $ | 780 | | $ | 780 | | |
Insurance premium | | $ | 610 | | $ | 625 | | $ | 635 | | $ | 645 | | | |
*Additional tax rate is 20%

BUDGET AND FISCAL PLAN - 2019/20 to 2021/22
119
APPENDIX
Table A5 Material Assumptions — Revenue (continued)
| | Updated | | Budget | | | | | | | |
Revenue Source and Assumptions | | Forecast | | Estimate | | Plan
2020/21 | | Plan
2021/22 | | | |
($ millions unless otherwise specified) | | 2018/19 | | 2019/20 | | | | 2019/20 Sensitivities | |
Energy, sales of Crown land tenures, | | | | | | | | | | | |
metals, minerals and other * | | $ | 1,112 | | $ | 1,009 | | $ | 861 | | $ | 827 | | | |
Natural gas price | | | | | | | | | | +/- $0.25 change in the natural gas price equals +/- $10 to $40 million, including impacts on production volumes and royalty program credits, but excluding any changes from natural gas liquids revenue (e.g. butane, pentanes) Sensitivities can also vary significantly at different price levels +/- 1% change in natural gas volumes equals +/- $2 million in natural gas royalties +/- 1 cent change in the exchange rate equals +/- $1 million in natural gas royalties | |
Plant inlet, $C/gigajoule | | $ | 0.59 | | $ | 0.72 | | $ | 0.83 | | $ | 0.99 | | |
Sumas, $US/MMBtu | | $ | 1.64 | | $ | 1.75 | | $ | 1.88 | | $ | 2.03 | | |
Natural gas production volumes | | | | | | | | | | |
Billions of cubic metres | | 53.4 | | 52.7 | | 56.5 | | 61.6 | | |
Petajoules | | 2,208 | | 2,182 | | 2,338 | | 2,551 | | |
Annual per cent change | | 11.4 | % | -1.2 | % | 7.1 | % | 9.1 | % | |
| | | | | | | | | | |
Oil price ($US/bbl at Cushing, OK) | | $ | 64.30 | | $ | 64.50 | | $ | 68.04 | | $ | 70.59 | | |
| | | | | | | | | | |
Auctioned land base (000 hectares) | | 36 | | 35 | | 35 | | 40 | | |
Average bid price/hectare ($) | | $ | 1,431 | | $ | 300 | | $ | 250 | | $ | 200 | | |
Cash sales of Crown land tenures | | $ | 51 | | $ | 11 | | $ | 9 | | $ | 8 | | |
Metallurgical coal price ($US/tonne, fob West Coast) | | $ | 186 | | $ | 158 | | $ | 147 | | $ | 145 | | |
Copper price ($US/lb) | | $ | 2.90 | | $ | 3.02 | | $ | 3.15 | | $ | 3.25 | | |
| | | | | | | | | | | |
Annual electricity volumes set by treaty (million mega-watt hours) | | 4.0 | | 3.9 | | 3.8 | | 3.8 | | +/- US$20 change in the average metallurgical coal price equals +/- $50 to $70 million +/- 10% change in the average Mid-Columbia electricity price equals +/- $15 million | |
Mid-Columbia electricity price ($US/mega-watt hour) | | $ | 34.86 | | $ | 32.48 | | $ | 31.75 | | $ | 34.16 | | |
| | | | | | | | | | |
Exchange rate (US¢/C$, calendar year) | | 77.2 | | 76.0 | | 77.3 | | 78.5 | | |
Components of revenue | | | | | | | | | | | |
Bonus bid auctions: | | | | | | | | | | Based on a recommendation from the Auditor General to be consistent with generally accepted accounting principles, bonus bid revenue recognition reflects ten-year deferral of cash receipts from the sale of Crown land tenures | |
Deferred revenue | | $ | 219 | | $ | 174 | | $ | 115 | | $ | 92 | | |
Current-year cash (one-ninth) | | $ | 5 | | $ | 1 | | $ | 1 | | $ | 1 | | |
Fees and rentals | | $ | 52 | | $ | 52 | | $ | 52 | | $ | 52 | | |
Total bonus bids, fees and rentals | | $ | 276 | | $ | 227 | | $ | 168 | | $ | 145 | | |
Natural gas royalties | | $ | 164 | | $ | 275 | | $ | 258 | | $ | 234 | | |
Petroleum royalties | | $ | 77 | | $ | 73 | | $ | 73 | | $ | 73 | | |
Columbia River Treaty electricity sales | | $ | 165 | | $ | 147 | | $ | 139 | | $ | 149 | | |
Oil and Gas Commission fees and levies | | $ | 62 | | $ | 70 | | $ | 72 | | $ | 74 | | | |
Coal, metals and other minerals revenue: | | | | | | | | | | | |
Coal tenures | | $ | 8 | | $ | 8 | | $ | 8 | | $ | 8 | | | |
Coal mineral tax | | $ | 294 | | $ | 165 | | $ | 85 | | $ | 67 | | | |
Net metals and other minerals tax | | $ | 28 | | | — | | $ | 10 | | $ | 29 | | | |
Recoveries related to metal mines | | $ | 23 | | $ | 28 | | $ | 31 | | $ | 31 | | | |
Miscellaneous mining revenue | | $ | 15 | | $ | 16 | | $ | 17 | | $ | 17 | | | |
Total coal, metals and other minerals revenue | | $ | 368 | | $ | 217 | | $ | 151 | | $ | 152 | | | |
| | | | | | | | | | | |
Royalty programs and infrastructure credits | | | | | | | | | | | |
Deep drilling | | $ | (383 | ) | $ | (273 | ) | $ | (275 | ) | $ | (327 | ) | | |
Road, pipeline and other infrastructure | | $ | (48 | ) | $ | (44 | ) | $ | (98 | ) | $ | (152 | ) | | |
Total | | $ | (431 | ) | $ | (317 | ) | $ | (373 | ) | $ | (479 | ) | | |
| | | | | | | | | | | |
Implicit average natural gas royalty rate | | 12.6 | % | 17.6 | % | 13.3 | % | 9.3 | % | | |
Royalty program (marginal, low productivity and ultra marginal drilling) adjustments reflect reduced royalty rates.
Natural gas royalties incorporate royalty programs and Treasury Board approved infrastructure credits.
* Reflects information as at January 17, 2019.
BUDGET AND FISCAL PLAN - 2019/20 to 2021/22
120
APPENDIX
Table A5 Material Assumptions — Revenue (continued)
| | Updated | | Budget | | | | | | | |
Revenue Source and Assumptions | | Forecast | | Estimate | | Plan | | Plan | | | |
($ millions unless otherwise specified) | | 2018/19 | | 2019/20 | | 2020/21 | | 2021/22 | | 2019/20 Sensitivities | |
Forests * | | $ | 1,389 | | $ | 1,155 | | $ | 1,114 | | $ | 1,063 | | | |
Prices (calendar year average) | | | | | | | | | | | | | | +/- US$50 change in SPF price equals +/- $150 to $175 million | |
SPF 2x4 ($US/thousand board feet) | | $ | 496 | | $ | 380 | | $ | 375 | | $ | 350 | | |
Pulp ($US/tonne) | | $ | 1,184 | | $ | 1,135 | | $ | 1,000 | | $ | 900 | | +/- US$50 change in pulp price equals +/-$5 to $10 million | |
Coastal log ($Cdn/cubic metre); | | | | | | | | | | |
Vancouver Log Market | | $ | 141 | | $ | 135 | | $ | 130 | | $ | 120 | | +/- Cdn$10 change in average log price equals +/-$25 to $35 million | |
Crown harvest volumes (million cubic metres) | | | | | | | | | | |
Interior | | 46.0 | | 45.0 | | 44.8 | | 43.6 | | +/- 10% change in Interior harvest volumes equals +/- $70 to $80 million | |
Coast | | 12.0 | | 12.0 | | 12.2 | | 12.4 | | |
Total | | 58.0 | | 57.0 | | 57.0 | | 56.0 | | |
BC Timber Sales (included in above) | | 10.8 | | 11.2 | | 11.2 | | 11.2 | | +/- 10% change in Coastal harvest volumes equals +/- $20 to $30 million | |
| | | | | | | | | | |
Stumpage rates ($Cdn/cubic metre) | | | | | | | | | | | |
Total stumpage rates | | $ | 20.84 | | $ | 18.25 | | $ | 17.70 | | $ | 17.14 | | +/- 1 cent change in exchange rate equals +/- $25 to $35 million in stumpage revenue | |
Components of revenue | | | | | | | | | | |
Tenures** | | $ | 842 | | $ | 695 | | $ | 683 | | $ | 653 | | | |
Recoveries relating to revenue sharing payments to indigenous people** | | $ | (32 | ) | $ | (33 | ) | $ | (33 | ) | $ | (33 | ) | |
BC Timber Sales | | $ | 388 | | $ | 366 | | $ | 347 | | $ | 327 | | The above sensitivities relate to stumpage revenue only. | |
Logging tax | | $ | 115 | | $ | 50 | | $ | 40 | | $ | 40 | |
Other CRF revenue | | $ | 22 | | $ | 23 | | $ | 23 | | $ | 22 | | | |
Recoveries** | | $ | 54 | | $ | 54 | | $ | 54 | | $ | 54 | | | |
| | | | | | | | | | | | | | | | |
* Reflects information as at January 18, 2019 | | | | | | | | |
** Commencing 2018/19, tenures stumpage revenue includes revenue sharing payments to indigenous people recorded as recovery. | |
| | | | | | | | | |
Other natural resources | | $ | 469 | | $ | 459 | | $ | 463 | | $ | 490 | | | |
Components of revenue | | | | | | | | | | | |
Water rental and licences* | | $ | 396 | | $ | 388 | | $ | 399 | | $ | 433 | | | |
Recoveries | | $ | 50 | | $ | 48 | | $ | 41 | | $ | 34 | | | |
Angling and hunting permits and licences | | $ | 10 | | $ | 10 | | $ | 10 | | $ | 10 | | | |
Recoveries | | $ | 13 | | $ | 13 | | $ | 13 | | $ | 13 | | | |
* Water rentals for power purposes are indexed to Consumer Price Index. |
Other revenue | | $ | 9,996 | | $ | 9,958 | | $ | 9,153 | | $ | 9,260 | | | |
Components of revenue | | | | | | | | | | | |
Fees and licences | | | | | | | | | | | |
Medical Services Plan (MSP) premiums | | $ | 1,355 | | $ | 1,015 | | — | | — | | +/- 1 percentage point change in BC’s population growth equals +/- $10 million in MSP premium revenue | |
Consolidated Revenue Fund | | $ | 1,291 | | $ | 951 | | — | | — | | |
MSP recoveries | | $ | 64 | | $ | 64 | | — | | — | | |
Motor vehicle licences and permits | | $ | 562 | | $ | 574 | | $ | 584 | | $ | 594 | | |
Other Consolidated Revenue Fund | | $ | 433 | | $ | 483 | | $ | 517 | | $ | 505 | | | |
Summary consolidation eliminations | | $ | (15 | ) | $ | (15 | ) | $ | (16 | ) | $ | (15 | ) | | |
Other recoveries | | $ | 112 | | $ | 122 | | $ | 116 | | $ | 114 | | | |
Crown corporations and agencies | | $ | 136 | | $ | 139 | | $ | 140 | | $ | 132 | | | |
Post-secondary education fees | | $ | 2,258 | | $ | 2,329 | | $ | 2,458 | | $ | 2,534 | | | |
Other healthcare-related fees | | $ | 435 | | $ | 434 | | $ | 434 | | $ | 434 | | | |
School Districts | | $ | 289 | | $ | 306 | | $ | 324 | | $ | 342 | | | |
Investment earnings | | | | | | | | | | | |
Consolidated Revenue Fund | | $ | 145 | | $ | 105 | | $ | 115 | | $ | 122 | | | |
Fiscal agency loans & sinking funds earnings | | $ | 883 | | $ | 922 | | $ | 935 | | $ | 920 | | | |
Summary consolidation eliminations | | $ | (96 | ) | $ | (56 | ) | $ | (57 | ) | $ | (57 | ) | | |
Crown corporations and agencies | | $ | 32 | | $ | 27 | | $ | 27 | | $ | 27 | | | |
SUCH sector agencies | | $ | 209 | | $ | 198 | | $ | 201 | | $ | 205 | | | |
Sales of goods and services | | $ | 1,102 | | $ | 1,127 | | $ | 1,194 | | $ | 1,213 | | | |
Miscellaneous | | $ | 2,156 | | $ | 2,248 | | $ | 2,181 | | $ | 2,190 | | | |
| | | | | | | | | | 
| |
BUDGET AND FISCAL PLAN - 2019/20 to 2021/22
121
APPENDIX
Table A5 Material Assumptions — Revenue (continued)
| | Updated | | Budget | | | | | | | |
Revenue Source and Assumptions | | Forecast | | Estimate | | Plan | | Plan | | | |
($ millions unless otherwise specified) | | 2018/19 | | 2019/20 | | 2020/21 | | 2021/22 | | 2019/20 Sensitivities | |
Health and social transfers | | $ | 7,106 | | $ | 7,404 | | $ | 7,686 | | $ | 7,971 | | | |
National Cash Transfers | | | | | | | | | | | |
Canada Health Transfer (CHT) | | $ | 38,584 | | $ | 40,373 | | $ | 41,935 | | $ | 43,485 | | | |
Annual growth | | 3.9 | % | 4.6 | % | 3.9 | % | 3.7 | % | | |
Canada Social Transfer (CST) | | $ | 14,161 | | $ | 14,586 | | $ | 15,023 | | $ | 15,474 | | | |
BC share of national population (June 1) | | 13.47 | % | 13.47 | % | 13.49 | % | 13.52 | % | +/- 0.1 percentage point change in BC’s population share equals +/- $55 million | |
| | | | | | | | | | |
BC health and social transfers revenue | | | | | | | | | | |
CHT | | $ | 5,196 | | $ | 5,439 | | $ | 5,659 | | $ | 5,879 | | | |
CST | | $ | 1,907 | | $ | 1,965 | | $ | 2,027 | | $ | 2,092 | | | |
Prior-year adjustments | | $ | 3 | | — | | | | | | | |
| | | | | | | | | | | |
Other federal contributions | | $ | 1,956 | | $ | 2,019 | | $ | 2,079 | | $ | 2,147 | | | |
Components of revenue | | | | | | | | | | | |
Low Carbon Economy Leadership Fund | | $ | 11 | | $ | 20 | | $ | 16 | | $ | 21 | | | |
Other Consolidated Revenue Fund | | $ | 154 | | $ | 180 | | $ | 212 | | $ | 213 | | | |
Vote Recoveries: | | | | | | | | | | | |
Labour Market Development Agreement | | $ | 323 | | $ | 321 | | $ | 333 | | $ | 332 | | | |
Labour Market and Skills Training Program | | $ | 105 | | $ | 114 | | $ | 120 | | $ | 120 | | | |
Home Care | | $ | 79 | | $ | 87 | | $ | 87 | | $ | 121 | | | |
Mental Health | | $ | 33 | | $ | 61 | | $ | 81 | | $ | 81 | | | |
Low Carbon Economy Leadership Fund | | — | | $ | 15 | | $ | 15 | | $ | 28 | | | |
Early Childhood Development and | | | | | | | | | | | |
Child Care Services | | $ | 61 | | $ | 41 | | $ | 41 | | $ | 41 | | | |
Child Safety, Family Support, Children in Care and with special needs | | $ | 85 | | $ | 75 | | $ | 75 | | $ | 75 | | | |
Policing and Security | | — | | $ | 5 | | $ | 9 | | $ | 8 | | | |
Public Transit | | $ | 129 | | $ | 136 | | $ | 148 | | $ | 174 | | | |
Local government services and transfers | | $ | 100 | | $ | 1 | | $ | 1 | | $ | 1 | | | |
Other recoveries | | $ | 121 | | $ | 118 | | $ | 118 | | $ | 117 | | | |
Crown corporations and agencies | | $ | 164 | | $ | 242 | | $ | 220 | | $ | 223 | | | |
Post-secondary institutions | | $ | 483 | | $ | 491 | | $ | 497 | | $ | 488 | | | |
Other SUCH sector agencies | | $ | 108 | | $ | 112 | | $ | 106 | | $ | 104 | | | |
Service delivery agency direct revenue | | $ | 7,247 | | $ | 7,461 | | $ | 7,641 | | $ | 7,768 | | | |
School districts | | $ | 678 | | $ | 709 | | $ | 708 | | $ | 726 | | | |
Post-secondary institutions | | $ | 4,048 | | $ | 4,139 | | $ | 4,305 | | $ | 4,410 | | | |
Health authorities and hospital societies | | $ | 1,008 | | $ | 977 | | $ | 976 | | $ | 978 | | | |
BC Transportation Financing Authority | | $ | 550 | | $ | 566 | | $ | 552 | | $ | 561 | | | |
Other service delivery agencies | | $ | 963 | | $ | 1,070 | | $ | 1,100 | | $ | 1,093 | | | |
Commercial Crown corporation net income | | $ | 1,971 | | $ | 3,311 | | $ | 3,503 | | $ | 3,620 | | | |
BC Hydro | | $ | (424 | ) | $ | 712 | | $ | 712 | | $ | 712 | | | |
reservoir water inflows | | 88 | % | 100 | % | 100 | % | 100 | % | +/-1% in hydro generation = +/-$10 million | |
| | | | | | | | | | |
mean gas price | | 3.14 | | 2.18 | | 2.01 | | 1.93 | | +/-10% = +/-$1 million | |
(Sumas, $US/MMbtu — BC Hydro forecast based on NYMEX forward selling prices) | | | | | | | | | | | |
electricity prices | | 33.40 | | 25.88 | | 24.97 | | 28.00 | | +/-10% change in electricity trade margins = +/-$20 million | |
(Mid-C, $US/MWh) | | | | | | | | | | |
ICBC | | $ | (1,180 | ) | $ | (50 | ) | $ | 86 | | $ | 148 | | | |
vehicle growth | | +1.9 | % | +1.9 | % | +1.9 | % | +1.9 | % | +/-1% = +/-$64 million | |
current claims cost percentage change | | +6.5 | % | +1.5 | % | +8.9 | % | +8.5 | % | +/-1% = -/+$55 million | |
unpaid claims balance ($ billions) | | $ | 13.8 | | $ | 14.5 | | $ | 14.9 | | $ | 15.4 | | +/-1% = -/+$138 to $145 million | |
investment return | | 3.4 | % | 3.5 | % | 4.2 | % | 4.3 | % | +/-1% return = +/-$162 to $172 million | |
loss ratio | | 117.8 | % | 93.7 | % | 92.8 | % | 92.0 | % | |
BUDGET AND FISCAL PLAN - 2019/20 to 2021/22
122
APPENDIX
Table A6 Natural Gas Price Forecasts — 2019/20 to 2021/22
| | | | | | | | Adjusted to fiscal years and | |
| | | | | | | | $C/gigajoule at plant inlet | |
Private sector forecasts (calendar year) | | 2019 | | 2020 | | 2021 | | 2019/20 | | 2020/21 | | 2021/22 | |
GLJ Henry Hub US$/MMBtu (Jan 1, 2019) | | 3.00 | | 3.15 | | 3.35 | | 1.77 | | 1.79 | | 1.97 | |
Sproule Henry Hub US$/MMBtu (Dec 31, 2018) | | 3.00 | | 3.25 | | 3.50 | | 1.69 | | 1.93 | | 2.12 | |
McDaniel Henry Hub US$/MMBtu (Jan 1, 2019) | | 3.00 | | 3.00 | | 3.15 | | 1.60 | | 1.59 | | 1.78 | |
Deloitte Henry Hub US$/Mcf (Sep 30, 2018) | | 2.95 | | 3.25 | | 3.50 | | 1.51 | | 1.79 | | 2.02 | |
GLJ Alberta AECO-C Spot CDN$/MMBtu (Jan 1, 2019) | | 1.85 | | 2.29 | | 2.67 | | 0.87 | | 1.20 | | 1.52 | |
Sproule Alberta AECO-C Spot CDN$/MMBtu (Dec 31, 2018) | | 1.95 | | 2.44 | | 3.00 | | 0.91 | | 1.39 | | 1.83 | |
McDaniel AECO-C Spot C$/MMBtu (Jan 1, 2019) | | 1.85 | | 2.20 | | 2.55 | | 0.78 | | 1.11 | | 1.48 | |
Deloitte AECO-C Spot C$/Mcf (Sep 30, 2018) | | 1.80 | | 2.40 | | 2.75 | | 0.73 | | 1.21 | | 1.48 | |
GLJ Sumas Spot US$/MMBtu (Jan 1, 2019) | | 2.73 | | 2.70 | | 2.90 | | 1.94 | | 1.90 | | 2.09 | |
Sproule Sumas Spot CDN$/MMBtu (Dec 31, 2018) | | 2.55 | | 3.14 | | 3.80 | | 1.12 | | 1.70 | | 2.20 | |
GLJ BC Spot Plant Gate CDN$/MMBtu (Jan 1, 2019) | | 1.32 | | 1.83 | | 2.21 | | 0.62 | | 1.00 | | 1.32 | |
Sproule BC Station 2 CDN$/MMBtu (Dec 31, 2018) | | 1.35 | | 1.94 | | 2.60 | | 0.45 | | 1.02 | | 1.53 | |
McDaniel BC Avg Plant Gate C$MMBtu (Jan 1, 2019) | | 1.25 | | 1.70 | | 2.05 | | 0.47 | | 0.87 | | 1.27 | |
Deloitte BC Station 2 C$MMBtu (Sep 30, 2018) | | 1.50 | | 2.10 | | 2.45 | | 0.69 | | 1.18 | | 1.44 | |
GLJ Midwest Chicago US$/MMBtu (Jan 1, 2019) | | 2.90 | | 3.05 | | 3.25 | | 2.12 | | 2.14 | | 2.32 | |
Sproule Alliance Plant Gate CDN$/MMBtu (Dec 31, 2018) | | 3.80 | | 3.96 | | 4.28 | | 2.57 | | 2.77 | | 3.01 | |
EIA Henry Hub US$/MMBtu (Dec 11, 2018) | | 3.12 | | | | | | | | | | | |
TD Economics Henry Hub FuturesUS$/MMBtu (Dec 13, 2018) | | 3.55 | | 3.33 | | | | 2.16 | | | | | |
Scotiabank Group Henry Hub US$/MMBtu (Dec 7, 2018) | | 2.93 | | 3.00 | | | | 1.54 | | | | | |
BMO Alberta Empress US$/MMBtu (Dec 18, 2018) | | 2.50 | | | | | | | | | | | |
CIBC World Markets Inc. Henry Hub US$/MMBtu (Dec 17, 2018) | | 2.90 | | | | | | | | | | | |
InSite Petroleum Consultants Ltd Henry Hub US$/MMBtu (Sep 30, 2018) | | 3.10 | | 3.30 | | 3.40 | | 1.79 | | 1.94 | | 2.03 | |
NYMEX Forward Market converted to Plant Inlet CDN$/GJ (Jan 2, 2019) | | | | | | | | 1.28 | | 1.05 | | 1.02 | |
Average all minus high/low | | | | | | | | 1.31 | | 1.53 | | 1.81 | |
Average one forecast per consultant minus high/low | | | | | | | | 1.02 | | 1.07 | | 1.43 | |
Natural gas royalty price forecast | | | | | | | | 0.72 | | 0.83 | | 0.99 | |
GLJ: Gilbert Laustsen Jung Petroleum Consultants Ltd US EIA: US Energy Information Administration AECO: Alberta Energy Company Deloitte/AJM: Deloitte L.L.P acquired Ashton Jenkins Mann Petroleum Consultants McDaniel: McDaniel & Associates Consultants Ltd
Natural Gas Prices
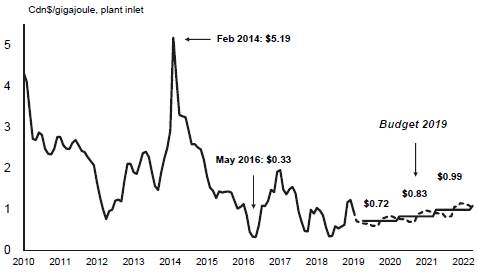
BUDGET AND FISCAL PLAN - 2019/20 to 2021/22
123
APPENDIX
Table A7 Material Assumptions — Expense
| | Updated | | Budget | | | | | | | |
Ministry Programs and Assumptions | | Forecast | | Estimate | | Plan | | Plan | | | |
($ millions unless otherwise specified) | | 2018/19 | | 2019/20 | | 2020/21 | | 2021/22 | | 2019/20 Sensitivities | |
Advanced Education, Skills and Training | | 2,212 | | 2,330 | | 2,341 | | 2,348 | | | |
Student spaces in public institutions | | 199,630 | | 202,426 | | 203,225 | | 203,909 | | Student enrollment may fluctuate due to a number of factors including economic changes and labour market needs. | |
Attorney General | | 584 | | 606 | | 604 | | 606 | | | |
New cases filed/processed (# for all courts) | | 240,000 | | 240,000 | | 240,000 | | 240,000 | | The number of criminal cases proceeded on by the provincial and federal Crown (including appeals to higher courts in BC), the number of civil and family litigation cases, the number of violation tickets disputed, and the number of municipal bylaw tickets disputed which would go to court for resolution. | |
| | | | | | | | | | |
| | |
Crown Proceeding Act (CPA) | | 25 | | 25 | | 25 | | 25 | | The number of new cases, and the difference between estimated settlements and actual settlements. | |
Children and Family Development | | 1,793 | | 2,065 | | 2,184 | | 2,191 | | | |
Average children-in-care caseload (#) | | 6,596 | | 6,397 | | 6,333 | | 6,289 | | The average number of children in care is decreasing as a result of ministry efforts to keep children in family settings where safe and feasible. The average cost per child in care is projected to increase based on the higher cost of contracted residential services and an increasing acuity of need for children in care. A 1% change in either the caseload or average cost will affect expenditures by approximately $2.5 million (excluding Delegated Aboriginal Agencies). | |
Average annual residential cost per child in care ($) | | 59,717 | | 63,000 | | 66,000 | | 69,000 | | |
| | |
| |
| |
| |
| |
Education | | 6,355 | | 6,569 | | 6,536 | | 6,569 | | | |
Public School Enrolment (# of FTEs) | | 559,368 | | 563,506 | | 568,371 | | 572,179 | | Updated forecast enrolment figures are based on submissions from school districts of their actual enrolment as at September 30 2018 for the 2018/19 school year and projected enrolment for February and May 2019 for Distributed Learning and Adults. Projections for 2019/20 to 2021/22 are based on the Ministry of Education’s enrolment forecasting model. | |
School age (K—12) | | 536,436 | | 540,457 | | 545,072 | | 548,880 | | |
Distributed Learning (online) | | 1,091 | | 1,091 | | 1,091 | | 1,091 | | |
Summer | | 11,743 | | 11,743 | | 11,743 | | 11,743 | | |
Adults | | 6,865 | | 6,865 | | 6,865 | | 6,865 | | |
| | |
| |
| |
| |
Forests, Lands, Natural Resource Operations and Rural Development | | 1,285 | | 823 | | 808 | | 819 | | | |
BC Timber Sales | | 210 | | 197 | | 195 | | 197 | | Targets can be impacted by changes to actual inventory costs incurred. There is a lag of approximately 1.5 years between when inventory costs are incurred and when they are expensed.Volume harvested can also impact targets. For example, if volume harvested is less than projected in any year, then capitalized expenses will also be reduced in that year. | |
| | |
| |
| |
| |
| |
| |
| |
Fire Management | | 615 | | 101 | | 101 | | 101 | | Fire Management fire suppression costs have ranged from a low of $47M in 2006 to a high of $650M in 2017. | |
| | |
| |
Health | | 19,754 | | 20,846 | | 21,518 | | 22,161 | | | |
Pharmacare | | 1,272 | | 1,350 | | 1,389 | | 1,445 | | A 1% change in utilization or prices affects costs by approximately $13 million. | |
| | |
| | | | | | | | | | | |
Medical Services Plan (MSP) | | 4,811 | | 4,969 | | 5,085 | | 5,197 | | A 1% increase in volume of services provided by fee-for-service physicians affects costs by approximately $30 million. | |
| | |
| |
| | | | | | | | | | | |
Regional Services | | 13,373 | | 14,216 | | 14,733 | | 15,206 | | | |

BUDGET AND FISCAL PLAN - 2019/20 to 2021/22
124
APPENDIX
Table A7 Material Assumptions — Expense (continued)
| | Updated | | Budget | | | | | | | |
Ministry Programs and Assumptions | | Forecast | | Estimate | | Plan | | Plan | | | |
($ millions unless otherwise specified) | | 2018/19 | | 2019/20 | | 2020/21 | | 2021/22 | | 2019/20 Sensitivities | |
Public Safety and Solicitor General | | 1,095 | | 800 | | 803 | | 803 | | | |
Policing, Victim Services and Corrections | | 689 | | 700 | | 702 | | 702 | | Policing, Victim Services and Corrections costs are sensitive to the volume and severity of criminal activity, the number of inmate beds occupied and the number of offenders under community supervision. | |
| | | | | | | | | | | |
Emergency Program Act (EPA) | | 323 | | 15 | | 15 | | 15 | | For authorized expenditures under the EPA , including those for further disasters, and the difference between initial estimates for disaster response and recovery costs and final projected costs. In 2018/19, the projected EPA expenditures are based on forecasts as of December 31, 2018. | |
Social Development and Poverty Reduction | | 3,364 | | 3,572 | | 3,628 | | 3,662 | | | |
Temporary Assistance
annual average caseload (#) | | 42,977 | | 43,000 | | 42,000 | | 41,700 | | The expected to work caseload is sensitive to fluctuations in economic and employment trends.Costs are driven by changes to cost per case and caseload. Cost per case fluctuations result from changes in the needed supports required by clients, as well as caseload composition. | |
Disability Assistance
annual average caseload (#) | | 105,772 | | 109,700 | | 112,000 | | 113,000 | | The caseload for persons with disabilities is sensitive to the aging of the population and longer life expectancy for individuals with disabilities. Cost per case fluctuations are driven primarily by earnings exemptions which is dependent on the level of income earned by clients. | |
| | | | | | | | | | | |
Adult Community Living: | | | | | | | | | | | |
Developmental Disabilities Programs | | | | | | | | | | | |
Average caseload (#) | | 19,870 | | 20,750 | | 21,590 | | 22,370 | | The adult community living caseload is sensitive to an aging population and to the level of service required. Cost per case fluctuations are driven by the proportion of clients receiving certain types of services at differing costs. For example, residential care services are significantly more costly than day programs. The average cost per client for PSI is projected to decrease to better reflect actual costs for the mix of services being provided. | |
Average cost per client ($) | | 46,500 | | 47,200 | | 46,600 | | 45,700 | | |
Personal Supports Initiative (PSI) | | | | | | | | | | |
Average caseload (#) | | 1,830 | | 2,090 | | 2,330 | | 2,580 | | |
Average cost per client ($) | | 16,400 | | 16,200 | | 15,000 | | 14,300 | | |
| | | | | | | | | | |
| | | | | | | | | | |
| | | | | | | | | | |
| | | | | | | | | | |
BUDGET AND FISCAL PLAN - 2019/20 to 2021/22
125
APPENDIX
Table A7 Material Assumptions — Expense (continued)
| | Updated | | Budget | | | | | | | |
Ministry Programs and Assumptions | | Forecast | | Estimate | | Plan | | Plan | | | |
($ millions unless otherwise specified) | | 2018/19 | | 2019/20 | | 2020/21 | | 2021/22 | | 2019/20 Sensitivities | |
Tax Transfers | | 1,618 | | 1,489 | | 1,718 | | 1,954 | | | |
Individuals | | 531.0 | | 554.0 | | 719.0 | | 887.0 | | These tax transfers are now expensed as required under generally accepted accounting principles. | |
Climate Action Tax Credit | | 233.9 | | 267.0 | | 309.0 | | 352.0 | | |
Early Childhood Tax Benefit and BC Child | | | | | | | | | | |
Opportunity Benefit * | | 135.2 | | 132.3 | | 255.0 | | 380.0 | | |
Sales Tax | | 44.5 | | 50.0 | | 50.0 | | 50.0 | | | |
Small Business Venture Capital | | 24.4 | | 30.0 | | 30.0 | | 30.0 | | | |
BC Senior’s Home Renovation | | 2.0 | | 2.0 | | 2.0 | | 2.0 | | Changes in 2018 tax transfers will result in one-time effect (prior-year adjustment) and could result in an additional base change in 2019/20. Production services tax credit is the most volatile of all tax transfers and is influenced by several factors including delay in filing returns and assessment of claims,length of projects and changes in the exchange rates. | |
Other tax transfers to individuals | | 90.9 | | 72.6 | | 72.9 | | 72.9 | | |
Family Bonus Program | | 0.1 | | 0.1 | | 0.1 | | 0.1 | | |
| | | | | | | | | | |
Corporations | | 1,087.0 | | 935.0 | | 999.0 | | 1,067.0 | | |
| | | | | | | | | | |
Film and Television | | 129.0 | | 105.0 | | 105.0 | | 105.0 | | |
Production Services | | 758.8 | | 664.8 | | 724.8 | | 789.3 | | |
Scientific Research & Experimental | | | | | | | | | | |
Development | | 67.9 | | 72.0 | | 76.0 | | 80.0 | | |
Interactive Digital Media | | 52.3 | | 55.0 | | 55.0 | | 55.0 | | |
Mining Exploration | | 9.8 | | 15.0 | | 15.0 | | 15.0 | | |
Other tax transfers to corporations | | 69.2 | | 23.2 | | 23.2 | | 22.7 | | |
* Effective October 1, 2020 the BC Child Opportunity Benefit will be combined with Early Childhood Tax Benefit into a single benefit.
2018/19 tax transfer forecast incorporates adjustments relating to prior years.
Management of Public Funds and Debt | | 1,259 | | 1,278 | | 1,319 | | 1,382 | | |
Interest rates for new provincial borrowing: | | | | | | | | | | Full year impact on MoPD on interest costs of a 1% change in interest rates equals $45.7 million; $100 million increase in debt level equals $3.2 million. |
Short-term | | 1.70 | % | 2.35 | % | 2.69 | % | 2.96 | % |
Long-term | | 3.07 | % | 3.46 | % | 3.76 | % | 4.32 | % |
CDN/US exchange rate (cents) | | 131.5 | | 130.6 | | 128.6 | | 127.1 | | |
Service delivery agency net spending | | 7,033 | | 6,739 | | 6,543 | | 6,342 | | |
School districts | | 419 | | 96 | | 41 | | 105 | | |
Post-secondary institutions | | 3,576 | | 3,697 | | 3,795 | | 3,893 | | |
Health authorities and hospital societies | | 912 | | 621 | | 417 | | (1 | ) | |
BC Transportation Financing Authority | | 1,245 | | 1,410 | | 1,442 | | 1,517 | | |
Other service delivery agencies | | 881 | | 915 | | 848 | | 828 | | |
BUDGET AND FISCAL PLAN - 2019/20 to 2021/22
126
APPENDIX
Table A8 Operating Statement — 2012/13 to 2021/22 | | | | | | | | | | | | | | | | | | | | |
| | | | | | | | | | | | | | Updated | | Budget | | | | | | Average | |
| | Actual | | Actual | | Actual | | Actual | | Actual | | Actual | | Forecast | | Estimate | | Plan | | Plan | | annual | |
($ millions) | | 2012/13 | | 2013/14 | | 2014/15 | | 2015/16 | | 2016/17 | | 2017/18 | | 2018/19 | | 2019/20 | | 2020/21 | | 2021/22 | | change | |
| | | | | | | | | | | | | | | | | | | | | | (per cent) | |
Revenue | | 42,057 | | 43,715 | | 46,099 | | 47,601 | | 51,449 | | 52,020 | | 56,636 | | 59,047 | | 60,038 | | 62,458 | | 4.5 | |
Expense | | (43,204 | ) | (43,401 | ) | (44,439 | ) | (46,791 | ) | (48,722 | ) | (51,719 | ) | (55,762 | ) | (58,273 | ) | (59,451 | ) | (61,573 | ) | 4.0 | |
Surplus (deficit) before unusual items | | (1,147 | ) | 314 | | 1,660 | | 810 | | 2,727 | | 301 | | 874 | | 774 | | 587 | | 885 | | | |
Forecast allowance | | — | | — | | — | | — | | — | | — | | (500 | ) | (500 | ) | (300 | ) | (300 | ) | | |
Surplus (deficit) | | (1,147 | ) | 314 | | 1,660 | | 810 | | 2,727 | | 301 | | 374 | | 274 | | 287 | | 585 | | | |
| | | | | | | | | | | | | | | | | | | | | | | |
Per cent of GDP: 1 | | | | | | | | | | | | | | | | | | | | | | | |
Surplus (deficit) | | -0.5 | | 0.1 | | 0.7 | | 0.3 | | 1.0 | | 0.1 | | 0.1 | | 0.1 | | 0.1 | | 0.2 | | | |
Per cent of revenue: | | | | | | | | | | | | | | | | | | | | | | | |
Surplus (deficit) | | -2.7 | | 0.7 | | 3.6 | | 1.7 | | 5.3 | | 0.6 | | 0.7 | | 0.5 | | 0.5 | | 0.9 | | | |
Per capita ($): 2 | | | | | | | | | | | | | | | | | | | | | | | |
Surplus (deficit) | | (251 | ) | 68 | | 353 | | 170 | | 561 | | 61 | | 75 | | 54 | | 56 | | 113 | | | |
1 Surplus (deficit) as a per cent of GDP is calculated using GDP for the calendar year ending in the fiscal year (e.g. 2019/20 amounts divided by GDP for the 2019 calendar year).
2 Per capita revenue and expense is calculated using July 1 population (e.g. 2019/20 amounts divided by population on July 1, 2019).
BUDGET AND FISCAL PLAN - 2019/20 to 2021/22
127
APPENDIX
Table A9 Revenue by Source — 2012/13 to 2021/22
| | | | | | | | | | | | | | Updated | | Budget | | | | | | Average | |
($ millions) | | Actual | | Actual | | Actual | | Actual | | Actual | | Actual | | Forecast | | Estimate | | Plan | | Plan | | annual | |
| 2012/13 | | 2013/14 | | 2014/15 | | 2015/16 | | 2016/17 | | 2017/18 | | 2018/19 | | 2019/20 | | 2020/21 | | 2021/22 | | change | |
| | | | | | | | | | | | | | | | | | | | | | (per cent) | |
Taxation revenue: | | | | | | | | | | | | | | | | | | | | | | | |
Personal income | | 6,977 | | 6,862 | | 8,076 | | 8,380 | | 9,704 | | 8,923 | | 11,348 | | 11,055 | | 11,583 | | 12,110 | | 6.3 | |
Corporate income | | 2,204 | | 2,427 | | 2,635 | | 2,787 | | 3,003 | | 4,165 | | 5,132 | | 4,192 | | 4,284 | | 4,859 | | 9.2 | |
Employer health | | — | | — | | — | | — | | — | | — | | 464 | | 1,854 | | 1,930 | | 2,007 | | n/a | |
Sales | | 6,068 | | 5,303 | | 5,762 | | 5,990 | | 6,606 | | 7,131 | | 7,318 | | 7,586 | | 7,937 | | 8,282 | | 3.5 | |
Fuel | | 890 | | 917 | | 932 | | 973 | | 969 | | 1,010 | | 1,014 | | 1,021 | | 1,031 | | 1,037 | | 1.7 | |
Carbon | | 1,120 | | 1,222 | | 1,198 | | 1,190 | | 1,220 | | 1,255 | | 1,460 | | 1,713 | | 1,969 | | 2,200 | | 7.8 | |
Tobacco | | 614 | | 724 | | 752 | | 734 | | 737 | | 727 | | 780 | | 780 | | 780 | | 780 | | 2.7 | |
Property | | 1,985 | | 2,080 | | 2,154 | | 2,219 | | 2,279 | | 2,367 | | 2,601 | | 2,996 | | 3,120 | | 3,250 | | 5.6 | |
Property transfer | | 758 | | 937 | | 1,065 | | 1,533 | | 2,026 | | 2,141 | | 1,910 | | 1,910 | | 1,910 | | 1,910 | | 10.8 | |
Corporation capital | | 1 | | — | | (1 | ) | — | | — | | — | | — | | — | | — | | — | | n/a | |
Insurance premium | | 433 | | 458 | | 483 | | 520 | | 549 | | 602 | | 610 | | 625 | | 635 | | 645 | | 4.5 | |
| | 21,050 | | 20,930 | | 23,056 | | 24,326 | | 27,093 | | 28,321 | | 32,637 | | 33,732 | | 35,179 | | 37,080 | | 6.5 | |
Natural resource revenue: | | | | | | | | | | | | | | | | | | | | | | | |
Natural gas royalties | | 169 | | 445 | | 493 | | 139 | | 152 | | 161 | | 164 | | 275 | | 258 | | 234 | | 3.7 | |
Bonus bids, rents on drilling rights and leases | | 868 | | 859 | | 834 | | 765 | | 633 | | 276 | | 276 | | 227 | | 168 | | 145 | | -18.0 | |
Columbia River Treaty | | 89 | | 170 | | 130 | | 116 | | 111 | | 111 | | 165 | | 147 | | 139 | | 149 | | 5.9 | |
Other energy and minerals | | 306 | | 269 | | 267 | | 226 | | 403 | | 619 | | 507 | | 360 | | 296 | | 299 | | -0.3 | |
Forests | | 562 | | 719 | | 754 | | 865 | | 913 | | 1,065 | | 1,389 | | 1,155 | | 1,114 | | 1,063 | | 7.3 | |
Other resources | | 479 | | 493 | | 459 | | 460 | | 499 | | 463 | | 469 | | 459 | | 463 | | 490 | | 0.3 | |
| | 2,473 | | 2,955 | | 2,937 | | 2,571 | | 2,711 | | 2,695 | | 2,970 | | 2,623 | | 2,438 | | 2,380 | | -0.4 | |
Other revenue: | | | | | | | | | | | | | | | | | | | | | | | |
Medical Services Plan premiums 1 | | 2,047 | | 2,158 | | 2,254 | | 2,434 | | 2,558 | | 2,266 | | 1,355 | | 1,015 | | — | | — | | -100.0 | |
Post-secondary education fees | | 1,345 | | 1,445 | | 1,544 | | 1,666 | | 1,828 | | 2,034 | | 2,258 | | 2,329 | | 2,458 | | 2,534 | | 7.3 | |
Other health-care related fees | | 327 | | 333 | | 358 | | 374 | | 404 | | 429 | | 435 | | 434 | | 434 | | 434 | | 3.2 | |
Motor vehicle licences and permits | | 489 | | 504 | | 499 | | 521 | | 529 | | 557 | | 562 | | 574 | | 584 | | 594 | | 2.2 | |
Other fees and licences | | 699 | | 770 | | 770 | | 841 | | 894 | | 963 | | 955 | | 1,035 | | 1,081 | | 1,078 | | 4.9 | |
Investment earnings | | 1,189 | | 1,203 | | 1,171 | | 1,213 | | 1,232 | | 1,101 | | 1,173 | | 1,196 | | 1,221 | | 1,217 | | 0.3 | |
Sales of goods and services | | 942 | | 946 | | 967 | | 1,011 | | 1,131 | | 1,133 | | 1,102 | | 1,127 | | 1,194 | | 1,213 | | 2.8 | |
Miscellaneous | | 1,673 | | 2,256 | | 1,893 | | 2,287 | | 2,377 | | 2,410 | | 2,156 | | 2,248 | | 2,181 | | 2,190 | | 3.0 | |
| | 8,711 | | 9,615 | | 9,456 | | 10,347 | | 10,953 | | 10,893 | | 9,996 | | 9,958 | | 9,153 | | 9,260 | | 0.7 | |
Contributions from the federal government: | | | | | | | | | | | | | | | | | | | | | | | |
Canada Health Transfer | | 3,887 | | 4,280 | | 4,186 | | 4,454 | | 4,744 | | 4,994 | | 5,198 | | 5,439 | | 5,659 | | 5,879 | | 4.7 | |
Canada Social Transfer | | 1,555 | | 1,589 | | 1,641 | | 1,695 | | 1,751 | | 1,854 | | 1,908 | | 1,965 | | 2,027 | | 2,092 | | 3.4 | |
Other cost shared agreements | | 1,605 | | 1,645 | | 1,452 | | 1,498 | | 1,672 | | 2,207 | | 1,956 | | 2,019 | | 2,079 | | 2,147 | | 3.3 | |
| | 7,047 | | 7,514 | | 7,279 | | 7,647 | | 8,167 | | 9,055 | | 9,062 | | 9,423 | | 9,765 | | 10,118 | | 4.1 | |
Commercial Crown corporation net income: | | | | | | | | | | | | | | | | | | | | | | | |
BC Hydro | | 509 | | 549 | | 581 | | 655 | | 684 | | 683 | | (424 | ) | 712 | | 712 | | 712 | | 3.8 | |
Accounting adjustment 2 | | — | | — | | — | | — | | — | | (950 | ) | 950 | | — | | — | | — | | n/a | |
Liquor Distribution Branch | | 930 | | 877 | | 935 | | 1,031 | | 1,083 | | 1,119 | | 1,101 | | 1,120 | | 1,155 | | 1,195 | | 2.8 | |
BC Lotteries (net of payments to federal gov’t) | | 1,116 | | 1,165 | | 1,245 | | 1,304 | | 1,329 | | 1,391 | | 1,396 | | 1,396 | | 1,416 | | 1,428 | | 2.8 | |
ICBC | | 231 | | 136 | | 657 | | (293 | ) | (612 | ) | (1,327 | ) | (1,180 | ) | (50 | ) | 86 | | 148 | | -4.8 | |
BC Railway Company | | 6 | | 13 | | 5 | | 6 | | 7 | | 53 | | 8 | | 10 | | 9 | | 9 | | 4.6 | |
Transportation Investment Corporation | | (60 | ) | (88 | ) | (89 | ) | (80 | ) | (81 | ) | (29 | ) | — | | — | | — | | — | | n/a | |
Other | | 44 | | 49 | | 37 | | 87 | | 115 | | 116 | | 120 | | 123 | | 125 | | 128 | | 12.6 | |
| | 2,776 | | 2,701 | | 3,371 | | 2,710 | | 2,525 | | 1,056 | | 1,971 | | 3,311 | | 3,503 | | 3,620 | | 3.0 | |
Total revenue | | 42,057 | | 43,715 | | 46,099 | | 47,601 | | 51,449 | | 52,020 | | 56,636 | | 59,047 | | 60,038 | | 62,458 | | 4.5 | |
1 After the elimination of MSP premiums, the revenue reduction is approximately $2.7 billion annually.
2 BC Hydro’s forecast loss for 2018/19 includes a write-down of deferred regulatory accounts; at the summary level, the Province recognized $950 million for this adjustment in fiscal 2017/18.
BUDGET AND FISCAL PLAN - 2019/20 to 2021/22
128
APPENDIX
Table A10 Revenue by Source Supplementary Information — 2012/13 to 2021/221
| | | | | | | | | | | | | | Updated | | Budget | | | | | | Average | |
| | Actual | | Actual | | Actual | | Actual | | Actual | | Actual | | Forecast | | Estimate | | Plan | | Plan | | annual | |
| | 2012/13 | | 2013/14 | | 2014/15 | | 2015/16 | | 2016/17 | | 2017/18 | | 2018/19 | | 2019/20 | | 2020/21 | | 2021/22 | | change | |
| | | | | | | | | | | | | | | | | | | | | | (per cent) | |
Per cent of nominal GDP: 2 | | | | | | | | | | | | | | | | | | | | | | | |
Taxation and Medical Services Plan premiums | | 10.4 | | 10.1 | | 10.5 | | 10.7 | | 11.2 | | 10.8 | | 11.5 | | 11.3 | | 10.9 | | 11.1 | | 0.7 | |
Taxation | | 9.5 | | 9.1 | | 9.5 | | 9.8 | | 10.3 | | 10.0 | | 11.1 | | 10.9 | | 10.9 | | 11.1 | | 1.7 | |
Medical Services Plan premiums | | 0.9 | | 0.9 | | 0.9 | | 1.0 | | 1.0 | | 0.8 | | 0.5 | | 0.3 | | 0 | | 0 | | -100.0 | |
Natural resources | | 1.1 | | 1.3 | | 1.2 | | 1.0 | | 1.0 | | 1.0 | | 1.0 | | 0.9 | | 0.8 | | 0.7 | | -4.9 | |
Other | | 3.9 | | 4.2 | | 3.9 | | 4.2 | | 4.1 | | 3.9 | | 3.4 | | 3.2 | | 2.8 | | 2.8 | | -3.8 | |
Other excluding Medical Services Plan premiums | | 3.0 | | 3.3 | | 3.0 | | 3.2 | | 3.2 | | 3.1 | | 2.9 | | 2.9 | | 2.8 | | 2.8 | | -0.9 | |
Contributions from the federal government | | 3.2 | | 3.3 | | 3.0 | | 3.1 | | 3.1 | | 3.2 | | 3.1 | | 3.1 | | 3.0 | | 3.0 | | -0.6 | |
Commercial Crown corporation net income | | 1.3 | | 1.2 | | 1.4 | | 1.1 | | 1.0 | | 0.4 | | 0.7 | | 1.1 | | 1.1 | | 1.1 | | -1.6 | |
Total revenue | | 19.0 | | 19.1 | | 19.0 | | 19.1 | | 19.5 | | 18.4 | | 19.2 | | 19.1 | | 18.7 | | 18.7 | | -0.2 | |
Growth rates (per cent): | | | | | | | | | | | | | | | | | | | | | | | |
Taxation and Medical Services Plan premiums | | 4.7 | | 0.0 | | 9.6 | | 5.7 | | 10.8 | | 3.2 | | 11.1 | | 2.2 | | 1.2 | | 5.4 | | n/a | |
Taxation | | 4.5 | | -0.6 | | 10.2 | | 5.5 | | 11.4 | | 4.5 | | 15.2 | | 3.4 | | 4.3 | | 5.4 | | n/a | |
Medical Services Plan premiums | | 6.7 | | 5.4 | | 4.4 | | 8.0 | | 5.1 | | -11.4 | | -40.2 | | -25.1 | | -100.0 | | n/a | | n/a | |
Natural resources | | -12.1 | | 19.5 | | -0.6 | | -12.5 | | 5.4 | | -0.6 | | 10.2 | | -11.7 | | -7.1 | | -2.4 | | n/a | |
Other | | 3.3 | | 10.4 | | -1.7 | | 9.4 | | 5.9 | | -0.5 | | -8.2 | | -0.4 | | -8.1 | | 1.2 | | n/a | |
Other excluding Medical Services Plan premiums | | 2.3 | | 11.9 | | -3.4 | | 9.9 | | 6.1 | | 2.8 | | 0.2 | | 3.5 | | 2.3 | | 1.2 | | n/a | |
Contributions from the federal government | | -8.8 | | 6.6 | | -3.1 | | 5.1 | | 6.8 | | 10.9 | | 0.1 | | 4.0 | | 3.6 | | 3.6 | | n/a | |
Commercial Crown corporation net income | | 3.2 | | -2.7 | | 24.8 | | -19.6 | | -6.8 | | -58.2 | | 86.6 | | 68.0 | | 5.8 | | 3.3 | | n/a | |
Total revenue | | 0.6 | | 3.9 | | 5.5 | | 3.3 | | 8.1 | | 1.1 | | 8.9 | | 4.3 | | 1.7 | | 4.0 | | n/a | |
Per capita ($): 3 | | | | | | | | | | | | | | | | | | | | | | | |
Taxation and Medical Services Plan premiums | | 5,058 | | 4,987 | | 5,377 | | 5,603 | | 6,102 | | 6,214 | | 6,810 | | 6,871 | | 6,868 | | 7,144 | | 3.9 | |
Taxation | | 4,609 | | 4,520 | | 4,898 | | 5,093 | | 5,576 | | 5,754 | | 6,538 | | 6,670 | | 6,868 | | 7,144 | | 5.0 | |
Medical Services Plan premiums | | 448 | | 466 | | 479 | | 510 | | 526 | | 460 | | 271 | | 201 | | 0 | | 0 | | -100.0 | |
Natural resources | | 542 | | 638 | | 624 | | 538 | | 558 | | 548 | | 595 | | 519 | | 476 | | 459 | | -1.8 | |
Other | | 1,907 | | 2,077 | | 2,009 | | 2,166 | | 2,254 | | 2,213 | | 2,003 | | 1,969 | | 1,787 | | 1,784 | | -0.7 | |
Other excluding Medical Services Plan premiums | | 1,459 | | 1,611 | | 1,530 | | 1,657 | | 1,728 | | 1,753 | | 1,731 | | 1,768 | | 1,787 | | 1,784 | | 2.3 | |
Contributions from the federal government | | 1,543 | | 1,623 | | 1,546 | | 1,601 | | 1,681 | | 1,840 | | 1,815 | | 1,863 | | 1,906 | | 1,949 | | 2.6 | |
Commercial Crown corporation net income | | 608 | | 583 | | 716 | | 567 | | 520 | | 215 | | 395 | | 655 | | 684 | | 697 | | 1.5 | |
Total revenue | | 9,209 | | 9,442 | | 9,793 | | 9,966 | | 10,588 | | 10,569 | | 11,346 | | 11,676 | | 11,721 | | 12,033 | | 3.0 | |
| | | | | | | | | | | | | | | | | | | | | | | |
Real Per Capita Revenue (2018 $) 4 | | 10,038 | | 10,300 | | 10,576 | | 10,646 | | 11,107 | | 10,856 | | 11,346 | | 11,421 | | 11,234 | | 11,305 | | 1.3 | |
Growth rate (per cent) | | 0.7 | | 2.6 | | 2.7 | | 0.7 | | 4.3 | | -2.3 | | 4.5 | | 5.2 | | -1.6 | | 0.6 | | -0.8 | |
1 | Numbers may not add due to rounding. |
2 | Revenue as a per cent of GDP is calculated using nominal GDP for the calendar year ending in the fiscal year (e.g. 2019/20 revenue divided by nominal GDP for the 2019 calendar year). |
3 | Per capita revenue is calculated using July 1 population (e.g. 2019/20 revenue divided by population on July 1, 2019). |
4 | Revenue is converted to real (inflation-adjusted) terms using the consumer price index (CPI) for the corresponding calendar year (e.g. 2019 CPI for 2019/20 revenue). |
BUDGET AND FISCAL PLAN - 2019/20 to 2021/22
129
APPENDIX
Table A11 Expense by Function — 2012/13 to 2021/22 1
| | | | | | | | | | | | | | Updated | | Budget | | | | | | Average | |
($ millions) | | Actual | | Actual | | Actual | | Actual | | Actual | | Actual | | Forecast | | Estimate | | Plan | | Plan | | annual | |
| 2012/13 | | 2013/14 | | 2014/15 | | 2015/16 | | 2016/17 | | 2017/18 | | 2018/19 | | 2019/20 | | 2020/21 | | 2021/22 | | change | |
| | | | | | | | | | | | | | | | | | | | | | (per cent) | |
Function: | | | | | | | | | | | | | | | | | | | | | | | |
Health: | | | | | | | | | | | | | | | | | | | | | | | |
Medical Services Plan | | 3,906 | | 4,114 | | 4,136 | | 4,345 | | 4,573 | | 4,623 | | 4,943 | | 5,092 | | 5,117 | | 5,229 | | 3.3 | |
Pharmacare | | 1,122 | | 1,130 | | 1,120 | | 1,335 | | 1,284 | | 1,400 | | 1,393 | | 1,471 | | 1,510 | | 1,566 | | 3.8 | |
Regional services | | 11,784 | | 11,960 | | 12,410 | | 12,811 | | 13,079 | | 14,094 | | 14,942 | | 15,520 | | 16,043 | | 16,566 | | 3.9 | |
Other healthcare expenses | | 690 | | 658 | | 704 | | 712 | | 753 | | 810 | | 718 | | 900 | | 902 | | 905 | | 3.1 | |
| | 17,502 | | 17,862 | | 18,370 | | 19,203 | | 19,689 | | 20,927 | | 21,996 | | 22,983 | | 23,572 | | 24,266 | | 3.7 | |
Education: | | | | | | | | | | | | | | | | | | | | | | | |
Elementary and secondary | | 6,002 | | 6,133 | | 6,064 | | 6,303 | | 6,422 | | 6,921 | | 7,271 | | 7,468 | | 7,456 | | 7,481 | | 2.5 | |
Post-secondary | | 5,103 | | 5,284 | | 5,349 | | 5,502 | | 5,672 | | 5,966 | | 6,441 | | 6,719 | | 6,891 | | 7,003 | | 3.6 | |
Other education expenses | | 423 | | 410 | | 414 | | 407 | | 374 | | 204 | | 561 | | 422 | | 434 | | 434 | | 0.3 | |
| | 11,528 | | 11,827 | | 11,827 | | 12,212 | | 12,468 | | 13,091 | | 14,273 | | 14,609 | | 14,781 | | 14,918 | | 2.9 | |
Social services: | | | | | | | | | | | | | | | | | | | | | | | |
Social assistance | | 1,552 | | 1,572 | | 1,589 | | 1,641 | | 1,692 | | 1,988 | | 2,180 | | 2,320 | | 2,350 | | 2,364 | | 4.8 | |
Child welfare | | 1,098 | | 1,097 | | 1,129 | | 1,301 | | 1,358 | | 1,507 | | 1,754 | | 1,965 | | 2,203 | | 2,335 | | 8.7 | |
Low income tax credit transfers | | 534 | | 279 | | 248 | | 247 | | 244 | | 239 | | 294 | | 317 | | 359 | | 402 | | -3.1 | |
Community living and other services | | 806 | | 857 | | 881 | | 917 | | 949 | | 1,003 | | 1,101 | | 1,158 | | 1,186 | | 1,206 | | 4.6 | |
| | 3,990 | | 3,805 | | 3,847 | | 4,106 | | 4,243 | | 4,737 | | 5,329 | | 5,760 | | 6,098 | | 6,307 | | 5.2 | |
Protection of persons and property | | 1,539 | | 1,520 | | 1,451 | | 1,572 | | 1,655 | | 1,930 | | 1,960 | | 1,706 | | 1,712 | | 1,716 | | 1.2 | |
Transportation | | 1,555 | | 1,580 | | 1,608 | | 1,670 | | 1,784 | | 1,931 | | 2,158 | | 2,300 | | 2,310 | | 2,275 | | 4.3 | |
Natural resources & economic development | | 2,092 | | 1,755 | | 2,191 | | 2,477 | | 2,504 | | 3,387 | | 3,378 | | 3,270 | | 3,042 | | 3,309 | | 5.2 | |
Other | | 1,346 | | 1,184 | | 1,288 | | 1,264 | | 2,260 | | 1,536 | | 1,936 | | 1,486 | | 780 | | 114 | | -24.0 | |
Contingencies | | — | | — | | — | | — | | — | | 17 | | 550 | | 750 | | 400 | | 400 | | n/a | |
Contingencies - Sustainable Services Negotiating Mandate | | — | | — | | — | | — | | — | | — | | — | | 553 | | 1,183 | | 1,827 | | n/a | |
General government | | 1,262 | | 1,386 | | 1,359 | | 1,501 | | 1,532 | | 1,540 | | 1,567 | | 2,059 | | 2,622 | | 3,325 | | 11.4 | |
Debt servicing | | 2,390 | | 2,482 | | 2,498 | | 2,786 | | 2,587 | | 2,623 | | 2,615 | | 2,797 | | 2,951 | | 3,116 | | 3.0 | |
Total expense | | 43,204 | | 43,401 | | 44,439 | | 46,791 | | 48,722 | | 51,719 | | 55,762 | | 58,273 | | 59,451 | | 61,573 | | 4.0 | |
Per cent of operating expense: | | | | | | | | | | | | | | | | | | | | | | | |
Health | | 40.5 | | 41.2 | | 41.3 | | 41.0 | | 40.4 | | 40.5 | | 39.4 | | 39.4 | | 39.6 | | 39.4 | | -0.3 | |
Education | | 26.7 | | 27.3 | | 26.6 | | 26.1 | | 25.6 | | 25.3 | | 25.6 | | 25.1 | | 24.9 | | 24.2 | | -1.1 | |
Social services and housing | | 9.2 | | 8.8 | | 8.7 | | 8.8 | | 8.7 | | 9.2 | | 9.6 | | 9.9 | | 10.3 | | 10.2 | | 1.2 | |
Protection of persons and property | | 3.6 | | 3.5 | | 3.3 | | 3.4 | | 3.4 | | 3.7 | | 3.5 | | 2.9 | | 2.9 | | 2.8 | | -2.7 | |
Transportation | | 3.6 | | 3.6 | | 3.6 | | 3.6 | | 3.7 | | 3.7 | | 3.9 | | 3.9 | | 3.9 | | 3.7 | | 0.3 | |
Natural resources & economic development | | 4.8 | | 4.0 | | 4.9 | | 5.3 | | 5.1 | | 6.5 | | 6.1 | | 5.6 | | 5.1 | | 5.4 | | 1.2 | |
Other | | 3.1 | | 2.7 | | 2.9 | | 2.7 | | 4.6 | | 3.0 | | 3.5 | | 2.6 | | 1.3 | | 0.2 | | -26.9 | |
Contingencies | | — | | — | | — | | — | | — | | 0.0 | | 1.0 | | 1.3 | | 0.7 | | 0.6 | | n/a | |
Contingencies - Sustainable Services Negotiating Mandate | | — | | — | | — | | — | | — | | — | | — | | 0.9 | | 2.0 | | 3.0 | | n/a | |
General government | | 2.9 | | 3.2 | | 3.1 | | 3.2 | | 3.1 | | 3.0 | | 2.8 | | 3.5 | | 4.4 | | 5.4 | | 7.1 | |
Debt servicing | | 5.5 | | 5.7 | | 5.6 | | 6.0 | | 5.3 | | 5.1 | | 4.7 | | 4.8 | | 5.0 | | 5.1 | | -1.0 | |
| | 100.0 | | 100.0 | | 100.0 | | 100.0 | | 100.0 | | 100.0 | | 100.0 | | 100.0 | | 100.0 | | 100.0 | | | |
1 Figures reflect government accounting policies used in the 2017/18 Public Accounts audited financial statements.
BUDGET AND FISCAL PLAN - 2019/20 to 2021/22
130
APPENDIX
Table A12 Expense by Function Supplementary Information — 2012/13 to 2021/22 1
| | | | | | | | | | | | | | Updated | | Budget | | | | | | Average | |
| | Actual | | Actual | | Actual | | Actual | | Actual | | Actual | | Forecast | | Estimate | | Plan | | Plan | | annual | |
| | 2012/13 | | 2013/14 | | 2014/15 | | 2015/16 | | 2016/17 | | 2017/18 | | 2018/19 | | 2019/20 | | 2020/21 | | 2021/22 | | change | |
| | | | | | | | | | | | | | | | | | | | | | (per cent) | |
Per cent of nominal GDP: 2 | | | | | | | | | | | | | | | | | | | | | | | |
Health | | 7.9 | | 7.8 | | 7.6 | | 7.7 | | 7.5 | | 7.4 | | 7.4 | | 7.5 | | 7.3 | | 7.2 | | -1.0 | |
Education | | 5.2 | | 5.2 | | 4.9 | | 4.9 | | 4.7 | | 4.6 | | 4.8 | | 4.7 | | 4.6 | | 4.5 | | -1.7 | |
Social services | | 1.8 | | 1.7 | | 1.6 | | 1.6 | | 1.6 | | 1.7 | | 1.8 | | 1.9 | | 1.9 | | 1.9 | | 0.5 | |
Protection of persons and property | | 0.7 | | 0.7 | | 0.6 | | 0.6 | | 0.6 | | 0.7 | | 0.7 | | 0.6 | | 0.5 | | 0.5 | | -3.3 | |
Transportation | | 0.7 | | 0.7 | | 0.7 | | 0.7 | | 0.7 | | 0.7 | | 0.7 | | 0.7 | | 0.7 | | 0.7 | | -0.4 | |
Natural resources & economic development | | 0.9 | | 0.8 | | 0.9 | | 1.0 | | 0.9 | | 1.2 | | 1.1 | | 1.1 | | 0.9 | | 1.0 | | 0.5 | |
Other | | 0.6 | | 0.5 | | 0.5 | | 0.5 | | 0.9 | | 0.5 | | 0.7 | | 0.5 | | 0.2 | | 0.0 | | -27.4 | |
Contingencies | | — | | — | | — | | — | | — | | 0.0 | | 0.2 | | 0.2 | | 0.1 | | 0.1 | | n/a | |
Contingencies - Sustainable Services Negotiating Mandate | | — | | — | | — | | — | | — | | — | | — | | 0.2 | | 0.4 | | 0.5 | | n/a | |
General government | | 0.6 | | 0.6 | | 0.6 | | 0.6 | | 0.6 | | 0.5 | | 0.5 | | 0.7 | | 0.8 | | 1.0 | | 6.4 | |
Debt servicing | | 1.1 | | 1.1 | | 1.0 | | 1.1 | | 1.0 | | 0.9 | | 0.9 | | 0.9 | | 0.9 | | 0.9 | | -1.6 | |
Operating expense | | 19.5 | | 19.0 | | 18.4 | | 18.8 | | 18.5 | | 18.3 | | 18.9 | | 18.9 | | 18.5 | | 18.4 | | -0.7 | |
Growth rates (per cent): | | | | | | | | | | | | | | | | | | | | | | | |
Health | | 3.5 | | 2.1 | | 2.8 | | 4.5 | | 2.5 | | 6.3 | | 5.1 | | 4.5 | | 2.6 | | 2.9 | | n/a | |
Education | | 2.7 | | 2.6 | | 0.0 | | 3.3 | | 2.1 | | 5.0 | | 9.0 | | 2.4 | | 1.2 | | 0.9 | | n/a | |
Social services | | 1.3 | | -4.6 | | 1.1 | | 6.7 | | 3.3 | | 11.6 | | 12.5 | | 8.1 | | 5.9 | | 3.4 | | n/a | |
Protection of persons and property | | 1.8 | | -1.2 | | -4.5 | | 8.3 | | 5.3 | | 16.6 | | 1.6 | | (13.0 | ) | 0.4 | | 0.2 | | n/a | |
Transportation | | 0.6 | | 1.6 | | 1.8 | | 3.9 | | 6.8 | | 8.2 | | 11.8 | | 6.6 | | 0.4 | | -1.5 | | n/a | |
Natural resources & economic development | | 11.7 | | -16.1 | | 24.8 | | 13.1 | | 1.1 | | 35.3 | | -0.3 | | (3.2 | ) | -7.0 | | 8.8 | | n/a | |
Other | | -4.8 | | -12.0 | | 8.8 | | -1.9 | | 78.8 | | -32.0 | | 26.0 | | (23.2 | ) | -47.5 | | -85.4 | | n/a | |
General government | | 2.2 | | 9.8 | | -1.9 | | 10.4 | | 2.1 | | 0.5 | | 1.8 | | 31.4 | | 27.3 | | 26.8 | | n/a | |
Debt servicing | | 0.3 | | 3.8 | | 0.6 | | 11.5 | | -7.1 | | 1.4 | | -0.3 | | 7.0 | | 5.5 | | 5.6 | | n/a | |
Operating expense | | 2.8 | | 0.5 | | 2.4 | | 5.3 | | 4.1 | | 6.2 | | 7.8 | | 4.5 | | 2.0 | | 3.6 | | n/a | |
Per capita ($): 3 | | | | | | | | | | | | | | | | | | | | | | | |
Health | | 3,832 | | 3,858 | | 3,903 | | 4,020 | | 4,052 | | 4,252 | | 4,407 | | 4,545 | | 4,602 | | 4,675 | | 2.2 | |
Education | | 2,524 | | 2,554 | | 2,513 | | 2,557 | | 2,566 | | 2,660 | | 2,859 | | 2,889 | | 2,886 | | 2,874 | | 1.5 | |
Social services | | 874 | | 822 | | 817 | | 860 | | 873 | | 962 | | 1,067 | | 1,139 | | 1,190 | | 1,215 | | 3.7 | |
Protection of persons and property | | 337 | | 328 | | 308 | | 329 | | 341 | | 392 | | 393 | | 337 | | 334 | | 331 | | -0.2 | |
Transportation | | 341 | | 341 | | 342 | | 350 | | 367 | | 392 | | 432 | | 455 | | 451 | | 438 | | 2.8 | |
Natural resources & economic development | | 458 | | 379 | | 465 | | 519 | | 515 | | 688 | | 677 | | 647 | | 594 | | 638 | | 3.8 | |
Other | | 295 | | 256 | | 274 | | 265 | | 465 | | 312 | | 388 | | 294 | | 152 | | 22 | | -25.1 | |
Contingencies | | — | | — | | — | | — | | — | | 3 | | 110 | | 148 | | 78 | | 77 | | n/a | |
Contingencies - Sustainable Services Negotiating Mandate | | — | | — | | — | | — | | — | | — | | — | | 109 | | 231 | | 352 | | n/a | |
General government | | 276 | | 299 | | 289 | | 314 | | 315 | | 313 | | 314 | | 407 | | 512 | | 641 | | 9.8 | |
Debt servicing | | 523 | | 536 | | 531 | | 583 | | 532 | | 533 | | 524 | | 553 | | 576 | | 600 | | 1.5 | |
Operating expense | | 9,460 | | 9,373 | | 9,442 | | 9,797 | | 10,026 | | 10,507 | | 11,171 | | 11,523 | | 11,606 | | 11,863 | | 2.5 | |
| | | | | | | | | | | | | | | | | | | | | | | |
Real Per Capita Operating Expense (2018 $) 4 | | 10,312 | | 10,226 | | 10,195 | | 10,465 | | 10,518 | | 10,793 | | 11,171 | | 11,272 | | 11,124 | | 11,145 | | 0.9 | |
Growth rate (per cent) | | 0.1 | | -0.8 | | -0.3 | | 2.6 | | 0.5 | | 2.6 | | 3.5 | | 0.9 | | -1.3 | | 0.2 | | 0.8 | |
1 Numbers may not add due to rounding.
2 Expense as a per cent of GDP is calculated using nominal GDP for the calendar year ending in the fiscal year (e.g. 2019/20 expense divided by nominal GDP for the 2019 calendar year).
3 Per capita expense is calculated using July 1 population (e.g. 2019/20 expense divided by population on July 1, 2019).
4 Expense is converted to real (inflation-adjusted) terms using the consumer price index (CPI) for the corresponding calendar year (e.g. 2019 CPI for 2019/20 expense).
BUDGET AND FISCAL PLAN - 2019/20 to 2021/22
131
APPENDIX
Table A13 Full-Time Equivalents (FTEs) — 2012/13 to 2021/2022 1 | | | | | | | | | | | | | | | |
| | | | | | | | | | | | | | Updated | | Budget | | | | | | Average | |
| | Actual | | Actual | | Actual | | Actual | | Actual | | Actual | | Forecast | | Estimate | | Plan | | Plan | | annual | |
| | 2012/13 | | 2013/14 | | 2014/15 | | 2015/16 | | 2016/17 | | 2017/18 | | 2018/19 | | 2019/20 | | 2020/21 | | 2021/22 | | change | |
| | | | | | | | | | | | | | | | | | | | | | (per cent) | |
Taxpayer-supported programs and agencies: | | | | | | | | | | | | | | | | | | | | | | | |
Ministries and special offices (CRF) | | 27,326 | | 26,526 | | 26,679 | | 27,192 | | 27,940 | | 29,291 | | 30,750 | | 31,350 | | 31,400 | | 31,400 | | 1.6 | |
Service delivery agencies 2 | | 4,508 | | 4,640 | | 4,798 | | 4,803 | | 4,850 | | 5,076 | | 5,171 | | 5,543 | | 5,926 | | 5,873 | | 3.0 | |
Total FTEs | | 31,834 | | 31,166 | | 31,477 | | 31,995 | | 32,790 | | 34,367 | | 35,921 | | 36,893 | | 37,326 | | 37,273 | | 1.8 | |
Growth rates (per cent): | | | | | | | | | | | | | | | | | | | | | | | |
Ministries and special offices (CRF) | | 0.4 | | -2.9 | | 0.6 | | 1.9 | | 2.8 | | 4.8 | | 5.0 | | 2.0 | | 0.2 | | 0.0 | | -100.0 | |
Service delivery agencies | | 3.7 | | 2.9 | | 3.4 | | 0.1 | | 1.0 | | 4.7 | | 1.9 | | 7.2 | | 6.9 | | -0.9 | | -185.3 | |
Population per FTE: 3 | | | | | | | | | | | | | | | | | | | | | | | |
Total FTEs | | 143.5 | | 148.6 | | 149.5 | | 149.3 | | 148.2 | | 143.2 | | 139.0 | | 137.1 | | 137.2 | | 139.3 | | -0.3 | |
1 Full-time equivalents (FTEs) are a measure of staff employment. FTEs are calculated by dividing the total hours of employment paid for in a given period by the number of hours an individual, full-time person would normally work in that period. This does not equate to the physical number of employees. For example, two half-time employees would equal one FTE, or alternatively, three FTEs may represent two full-time employees who have worked sufficient overtime hours to equal an additional FTE.
2 Service delivery agency FTE amounts do not include SUCH sector staff employment.
3 Population per FTE is calculated using July 1 population (e.g. population on July 1, 2019 divided by 2019/20 FTEs).
BUDGET AND FISCAL PLAN - 2019/20 to 2021/22
132
APPENDIX
Table A14 Capital Spending — 2012/13 to 2021/22
| | | | | | | | | | | | | | Updated | | Budget | | | | | | Average | |
| | Actual | | Actual | | Actual | | Actual | | Actual | | Actual | | Forecast | | Estimate | | Plan | | Plan | | annual | |
($ millions) | | 2012/13 | | 2013/14 | | 2014/15 | | 2015/16 | | 2016/17 | | 2017/18 | | 2018/19 | | 2019/20 | | 2020/21 | | 2021/22 | | change | |
| | | | | | | | | | | | | | | | | | | | | | (per cent) | |
Taxpayer-supported: | | | | | | | | | | | | | | | | | | | | | | | |
Education | | | | | | | | | | | | | | | | | | | | | | | |
Schools districts | | 509 | | 466 | | 420 | | 430 | | 474 | | 578 | | 562 | | 843 | | 971 | | 862 | | 6.0 | |
Post-secondary institutions | | 591 | | 507 | | 718 | | 746 | | 792 | | 968 | | 1,002 | | 1,034 | | 1,096 | | 1,187 | | 8.1 | |
Health | | 742 | | 690 | | 900 | | 923 | | 1,004 | | 890 | | 1,147 | | 1,255 | | 1,406 | | 1,692 | | 9.6 | |
BC Transportation Financing Authority 1 | | 1,005 | | 1,017 | | 822 | | 867 | | 823 | | 717 | | 974 | | 1,881 | | 2,097 | | 2,060 | | 8.3 | |
BC Transit | | 48 | | 80 | | 83 | | 51 | | 41 | | 115 | | 96 | | 194 | | 181 | | 175 | | 15.5 | |
BC Place redevelopment | | 6 | | — | | — | | — | | — | | — | | — | | — | | — | | — | | n/a | |
Government direct (ministries) | | 267 | | 298 | | 326 | | 290 | | 301 | | 430 | | 492 | | 672 | | 497 | | 447 | | 5.9 | |
Housing | | 92 | | 65 | | 107 | | 127 | | 184 | | 169 | | 432 | | 393 | | 534 | | 378 | | 17.0 | |
Other 2 | | 19 | | 28 | | 31 | | 25 | | 40 | | 41 | | 66 | | 68 | | 55 | | 110 | | 21.5 | |
| | 3,279 | | 3,151 | | 3,407 | | 3,459 | | 3,659 | | 3,908 | | 4,771 | | 6,340 | | 6,837 | | 6,911 | | 8.6 | |
Self-supported: | | | | | | | | | | | | | | | | | | | | | | | |
BC Hydro | | 1,929 | | 2,036 | | 2,169 | | 2,306 | | 2,444 | | 2,473 | | 3,923 | | 2,999 | | 3,115 | | 3,153 | | 5.6 | |
Columbia River power projects | | 94 | | 52 | | 28 | | 15 | | 2 | | 1 | | 4 | | 1,001 | | 14 | | 18 | | -16.8 | |
Transportation Investment Corporation 1 | | 540 | | 202 | | 76 | | 25 | | 38 | | 4 | | — | | — | | — | | — | | n/a | |
BC Railway Company | | 10 | | 8 | | 5 | | 23 | | 4 | | 11 | | 37 | | 8 | | 6 | | 2 | | -16.4 | |
ICBC | | 73 | | 82 | | 88 | | 90 | | 62 | | 54 | | 72 | | 92 | | 40 | | 40 | | -6.5 | |
BC Lottery Corporation | | 97 | | 100 | | 69 | | 68 | | 86 | | 82 | | 80 | | 105 | | 105 | | 90 | | -0.8 | |
Liquor Distribution Branch | | 10 | | 13 | | 25 | | 23 | | 27 | | 48 | | 76 | | 69 | | 53 | | 58 | | 21.6 | |
Other 3 | | 12 | | 26 | | 28 | | 23 | | 62 | | 56 | | — | | — | | — | | — | | n/a | |
| | 2,765 | | 2,519 | | 2,488 | | 2,573 | | 2,725 | | 2,729 | | 4,192 | | 4,274 | | 3,333 | | 3,361 | | 2.2 | |
Total capital spending | | 6,044 | | 5,670 | | 5,895 | | 6,032 | | 6,384 | | 6,637 | | 8,963 | | 10,614 | | 10,170 | | 10,272 | | 6.1 | |
Per cent of nominal GDP: 4 | | | | | | | | | | | | | | | | | | | | | | | |
Taxpayer-supported | | 1.5 | | 1.4 | | 1.4 | | 1.4 | | 1.4 | | 1.4 | | 1.6 | | 2.1 | | 2.1 | | 2.1 | | 3.8 | |
Self-supported | | 1.2 | | 1.1 | | 1.0 | | 1.0 | | 1.0 | | 1.0 | | 1.4 | | 1.4 | | 1.0 | | 1.0 | | -2.4 | |
Total | | 2.7 | | 2.5 | | 2.4 | | 2.4 | | 2.4 | | 2.4 | | 3.0 | | 3.4 | | 3.2 | | 3.1 | | 1.3 | |
Growth rates: | | | | | | | | | | | | | | | | | | | | | | | |
Taxpayer-supported | | -8.0 | | -3.9 | | 8.1 | | 1.5 | | 5.8 | | 6.8 | | 22.1 | | 32.9 | | 7.8 | | 1.1 | | -180.0 | |
Self-supported | | 0.8 | | -8.9 | | -1.2 | | 3.4 | | 5.9 | | 0.1 | | 53.6 | | 2.0 | | -22.0 | | 0.8 | | 1.0 | |
Total | | -4.2 | | -6.2 | | 4.0 | | 2.3 | | 5.8 | | 4.0 | | 35.0 | | 18.4 | | -4.2 | | 1.0 | | -185.3 | |
Per capita: 5 | | | | | | | | | | | | | | | | | | | | | | | |
Taxpayer-supported | | 718 | | 681 | | 724 | | 724 | | 753 | | 794 | | 956 | | 1,254 | | 1,335 | | 1,331 | | 7.1 | |
Self-supported | | 605 | | 544 | | 529 | | 539 | | 561 | | 554 | | 840 | | 845 | | 651 | | 648 | | 0.8 | |
Total | | 1,323 | | 1,225 | | 1,252 | | 1,263 | | 1,314 | | 1,348 | | 1,796 | | 2,099 | | 1,985 | | 1,979 | | 4.6 | |
Real Per Capita Capital Spending (2018 $) 6 | | 1,443 | | 1,336 | | 1,352 | | 1,349 | | 1,378 | | 1,385 | | 1,796 | | 2,053 | | 1,903 | | 1,859 | | 2.9 | |
Growth rate (per cent) | | -6.7 | | -7.4 | | 1.2 | | -0.3 | | 2.2 | | 0.5 | | 29.6 | | 14.3 | | -7.3 | | -2.3 | | -11.2 | |
1 Includes Transportation Investment Plan capital spending and, beginning in 2017/18, Transportation Investment Corporation rehabilitation costs for the Port Mann bridge due to reclassification from self-supported commercial Crown corporation to a taxpayer-supported agency in response to the cancellation of tolls. Effective April 1, 2018, Transportation Investment Corporation becomes a subsidiary of BCTFA.
2 Includes BC Pavilion Corporation, Royal BC Museum and other service delivery agencies.
3 Includes post-secondary institutions’ self-supported subsidiaries.
4 Capital spending as a per cent of GDP is calculated using nominal GDP for the calendar year ending in the fiscal year (e.g. 2019/20 amounts divided by nominal GDP for the 2019 calendar year).
5 Per capita capital spending is calculated using July 1 population (e.g. 2019/20 amounts divided by population on July 1, 2019).
6 Capital spending is converted to real (inflation-adjusted) terms using the consumer price index (CPI) for the corresponding calendar year (e.g. 2019 CPI for 2019/20 capital spending).
BUDGET AND FISCAL PLAN - 2019/20 to 2021/22
133
APPENDIX
Table A15 Statement of Financial Position — 2012/13 to 2021/22
| | | | | | | | | | | | | | Updated | | Budget | | | | | | Average | |
| | Actual | | Actual | | Actual | | Actual | | Actual | | Actual | | Forecast | | Estimate | | Plan | | Plan | | annual | |
($ millions) | | 2012/13 | | 2013/14 | | 2014/15 | | 2015/16 | | 2016/17 | | 2017/18 | | 2018/19 | | 2019/20 | | 2020/21 | | 2021/22 | | change | |
| | | | | | | | | | | | | | | | | | | | | | (per cent) | |
Financial assets: | | | | | | | | | | | | | | | | | | | | | | | |
Cash and temporary investments | | 3,173 | | 2,801 | | 3,675 | | 3,892 | | 4,232 | | 3,440 | | 2,546 | | 2,266 | | 2,372 | | 2,495 | | -2.6 | |
Other financial assets | | 8,186 | | 9,334 | | 9,115 | | 9,636 | | 10,143 | | 11,650 | | 13,056 | | 13,337 | | 13,841 | | 14,738 | | 6.8 | |
Sinking funds | | 1,778 | | 835 | | 977 | | 1,580 | | 1,087 | | 1,348 | | 750 | | 678 | | 493 | | 511 | | -12.9 | |
Investments in commercial Crown corporations: | | | | | | | | | | | | | | | | | | | | | | | |
Retained earnings | | 7,541 | | 7,839 | | 8,271 | | 7,531 | | 7,511 | | 6,128 | | 5,519 | | 7,426 | | 8,292 | | 9,167 | | 2.2 | |
Recoverable capital loans | | 17,208 | | 19,255 | | 20,624 | | 22,041 | | 23,809 | | 20,534 | | 22,593 | | 24,816 | | 26,077 | | 27,283 | | 5.3 | |
| | 24,749 | | 27,094 | | 28,895 | | 29,572 | | 31,320 | | 26,662 | | 28,112 | | 32,242 | | 34,369 | | 36,450 | | 4.4 | |
| | 37,886 | | 40,064 | | 42,662 | | 44,680 | | 46,782 | | 43,100 | | 44,464 | | 48,523 | | 51,075 | | 54,194 | | 4.1 | |
Liabilities: | | | | | | | | | | | | | | | | | | | | | | | |
Accounts payable & accrued liabilities | | 9,149 | | 8,298 | | 8,312 | | 8,486 | | 8,937 | | 9,670 | | 9,835 | | 11,371 | | 12,114 | | 13,365 | | 4.3 | |
Deferred revenue | | 9,828 | | 9,661 | | 9,771 | | 9,743 | | 9,525 | | 9,928 | | 10,427 | | 11,062 | | 11,916 | | 12,758 | | 2.9 | |
Debt: | | | | | | | | | | | | | | | | | | | | | | | |
Taxpayer-supported debt | | 38,182 | | 41,068 | | 41,880 | | 42,719 | | 41,499 | | 43,607 | | 43,957 | | 46,384 | | 50,454 | | 53,985 | | 3.9 | |
Self-supported debt | | 17,634 | | 19,625 | | 21,040 | | 22,532 | | 24,338 | | 21,312 | | 23,459 | | 25,664 | | 26,905 | | 28,091 | | 5.3 | |
Forecast allowance | | — | | — | | — | | — | | — | | — | | 500 | | 500 | | 300 | | 300 | | n/a | |
Total provincial debt | | 55,816 | | 60,693 | | 62,920 | | 65,251 | | 65,837 | | 64,919 | | 67,916 | | 72,548 | | 77,659 | | 82,376 | | 4.4 | |
Add: debt offset by sinking funds | | 1,778 | | 835 | | 977 | | 1,580 | | 1,087 | | 1,348 | | 750 | | 678 | | 493 | | 511 | | -12.9 | |
Less guarantees and non-guaranteed debt | | (755 | ) | (726 | ) | (739 | ) | (820 | ) | (835 | ) | (896 | ) | (873 | ) | (854 | ) | (835 | ) | (814 | ) | 0.8 | |
Financial statement debt | | 56,839 | | 60,802 | | 63,158 | | 66,011 | | 66,089 | | 65,371 | | 67,793 | | 72,372 | | 77,317 | | 82,073 | | 4.2 | |
| | 75,816 | | 78,761 | | 81,241 | | 84,240 | | 84,551 | | 84,969 | | 88,055 | | 94,805 | | 101,347 | | 108,196 | | 4.0 | |
Net liabilities | | (37,930 | ) | (38,697 | ) | (38,579 | ) | (39,560 | ) | (37,769 | ) | (41,869 | ) | (43,591 | ) | (46,282 | ) | (50,272 | ) | (54,002 | ) | 4.0 | |
Capital and other assets: | | | | | | | | | | | | | | | | | | | | | | | |
Tangible capital assets | | 36,762 | | 37,778 | | 39,028 | | 40,282 | | 41,303 | | 45,837 | | 48,176 | | 52,012 | | 56,281 | | 60,528 | | 5.7 | |
Restricted assets | | 1,442 | | 1,493 | | 1,553 | | 1,631 | | 1,695 | | 1,768 | | 1,828 | | 1,886 | | 1,944 | | 2,002 | | 3.7 | |
Other assets | | 966 | | 1,307 | | 1,281 | | 1,093 | | 1,180 | | 1,010 | | 694 | | 691 | | 687 | | 693 | | -3.6 | |
| | 39,170 | | 40,578 | | 41,862 | | 43,006 | | 44,178 | | 48,615 | | 50,698 | | 54,589 | | 58,912 | | 63,223 | | 5.5 | |
Accumulated surplus (deficit) | | 1,240 | | 1,881 | | 3,283 | | 3,446 | | 6,409 | | 6,746 | | 7,107 | | 8,307 | | 8,640 | | 9,221 | | 25.0 | |
Per cent of nominal GDP: 1 | | | | | | | | | | | | | | | | | | | | | | | |
Net liabilities | | 17.1 | | 16.9 | | 15.9 | | 15.9 | | 14.3 | | 14.8 | | 14.8 | | 15.0 | | 15.6 | | 16.1 | | -0.7 | |
Capital and other assets | | 17.7 | | 17.7 | | 17.3 | | 17.3 | | 16.7 | | 17.2 | | 17.2 | | 17.7 | | 18.3 | | 18.9 | | 0.7 | |
Growth rates (per cent): | | | | | | | | | | | | | | | | | | | | | | | |
Net liabilities | | 6.4 | | 2.0 | | -0.3 | | 2.5 | | -4.5 | | 10.9 | | 4.1 | | 6.2 | | 8.6 | | 7.4 | | 1.7 | |
Capital and other assets | | 3.2 | | 3.6 | | 3.2 | | 2.7 | | 2.7 | | 10.0 | | 4.3 | | 7.7 | | 7.9 | | 7.3 | | 9.7 | |
Per capita: 2 | | | | | | | | | | | | | | | | | | | | | | | |
Net liabilities | | 8,306 | | 8,358 | | 8,196 | | 8,282 | | 7,773 | | 8,506 | | 8,733 | | 9,152 | | 9,814 | | 10,404 | | 2.5 | |
Capital and other assets | | 8,577 | | 8,764 | | 8,893 | | 9,004 | | 9,092 | | 9,877 | | 10,156 | | 10,795 | | 11,501 | | 12,181 | | 4.0 | |
1 Net liabilities as a per cent of nominal GDP is calculated using nominal GDP for the calendar year ending in the fiscal year (e.g. 2019/20 amount divided by nominal GDP for the 2019 calendar year).
2 Per capita net liabilities is calculated using July 1 population (e.g. 2019/20 amount divided by population on July 1, 2019).
BUDGET AND FISCAL PLAN - 2019/20 to 2021/22
134
APPENDIX
Table A16 Changes in Financial Position — 2012/13 to 2021/22
| | | | | | | | | | | | | | Updated | | Budget | | | | | | | |
| | Actual | | Actual | | Actual | | Actual | | Actual | | Actual | | Forecast | | Estimate | | Plan | | Plan | | 10-Year | |
($ millions) | | 2012/13 | | 2013/14 | | 2014/15 | | 2015/16 | | 2016/17 | | 2017/18 | | 2018/19 | | 2019/20 | | 2020/21 | | 2021/22 | | Total | |
(Surplus) deficit for the year | | 1,147 | | (314 | ) | (1,660 | ) | (810 | ) | (2,727 | ) | (301 | ) | (374 | ) | (274 | ) | (287 | ) | (585 | ) | (6,185 | ) |
Comprehensive income and other (increase) decrease | | (81 | ) | (327 | ) | 258 | | 647 | | (236 | ) | (36 | ) | 13 | | (926 | ) | (46 | ) | 4 | | (730 | ) |
Change in accumulated (surplus) deficit | | 1,066 | | (641 | ) | (1,402 | ) | (163 | ) | (2,963 | ) | (337 | ) | (361 | ) | (1,200 | ) | (333 | ) | (581 | ) | (6,915 | ) |
Capital and other asset changes: | | | | | | | | | | | | | | | | | | | | | | | |
Taxpayer-supported capital investments | | 3,279 | | 3,151 | | 3,407 | | 3,459 | | 3,659 | | 3,908 | | 4,771 | | 6,340 | | 6,837 | | 6,911 | | 45,722 | |
Less amortization and other accounting changes | | (2,209 | ) | (2,135 | ) | (2,157 | ) | (2,205 | ) | (2,638 | ) | 626 | | (2,432 | ) | (2,504 | ) | (2,568 | ) | (2,664 | ) | (20,886 | ) |
Increase in net capital assets | | 1,070 | | 1,016 | | 1,250 | | 1,254 | | 1,021 | | 4,534 | | 2,339 | | 3,836 | | 4,269 | | 4,247 | | 24,836 | |
Increase (decrease) in restricted assets | | 65 | | 51 | | 60 | | 78 | | 64 | | 73 | | 60 | | 58 | | 58 | | 58 | | 625 | |
Increase (decrease) in other assets | | 72 | | 341 | | (26 | ) | (188 | ) | 87 | | (170 | ) | (316 | ) | (3 | ) | (4 | ) | 6 | | (201 | ) |
| | 1,207 | | 1,408 | | 1,284 | | 1,144 | | 1,172 | | 4,437 | | 2,083 | | 3,891 | | 4,323 | | 4,311 | | 25,260 | |
Increase (decrease) in net liabilities | | 2,273 | | 767 | | (118 | ) | 981 | | (1,791 | ) | 4,100 | | 1,722 | | 2,691 | | 3,990 | | 3,730 | | 18,345 | |
Investment and working capital changes: | | | | | | | | | | | | | | | | | | | | | | | |
Increase (decrease) in cash and temporary investments | | (62 | ) | (372 | ) | 874 | | 217 | | 340 | | (792 | ) | (894 | ) | (280 | ) | 106 | | 123 | | (740 | ) |
Investment in commercial Crown corporations: | | | | | | | | | | | | | | | | | | | | | | | |
Increase (decrease) in retained earnings | | 543 | | 298 | | 432 | | (740 | ) | (20 | ) | (1,383 | ) | (609 | ) | 1,907 | | 866 | | 875 | | 2,169 | |
Self-supported capital investments | | 2,765 | | 2,519 | | 2,488 | | 2,573 | | 2,725 | | 2,729 | | 4,192 | | 4,274 | | 3,333 | | 3,361 | | 30,959 | |
Less loan repayments and other accounting changes | | (724 | ) | (472 | ) | (1,119 | ) | (1,156 | ) | (957 | ) | (6,004 | ) | (2,133 | ) | (2,051 | ) | (2,072 | ) | (2,155 | ) | (18,843 | ) |
| | 2,584 | | 2,345 | | 1,801 | | 677 | | 1,748 | | (4,658 | ) | 1,450 | | 4,130 | | 2,127 | | 2,081 | | 14,285 | |
Other working capital changes | | 1,090 | | 1,223 | | (201 | ) | 978 | | (219 | ) | 632 | | 144 | | (1,962 | ) | (1,278 | ) | (1,178 | ) | (771 | ) |
| | 3,612 | | 3,196 | | 2,474 | | 1,872 | | 1,869 | | (4,818 | ) | 700 | | 1,888 | | 955 | | 1,026 | | 12,774 | |
Increase (decrease) in financial statement | | | | | | | | | | | | | | | | | | | | | | | |
debt | | 5,885 | | 3,963 | | 2,356 | | 2,853 | | 78 | | (718 | ) | 2,422 | | 4,579 | | 4,945 | | 4,756 | | 31,119 | |
(Increase) decrease in sinking fund debt | | (287 | ) | 943 | | (142 | ) | (603 | ) | 493 | | (261 | ) | 598 | | 72 | | 185 | | (18 | ) | 980 | |
Increase (decrease) in guarantees | | (34 | ) | 27 | | (33 | ) | 6 | | (23 | ) | (188 | ) | (111 | ) | (1 | ) | 1 | | (1 | ) | (357 | ) |
Increase (decrease) in non-guaranteed debt | | 59 | | (56 | ) | 46 | | 75 | | 38 | | 249 | | 88 | | (18 | ) | (20 | ) | (20 | ) | 441 | |
Increase (decrease) in total provincial debt | | 5,623 | | 4,877 | | 2,227 | | 2,331 | | 586 | | (918 | ) | 2,997 | | 4,632 | | 5,111 | | 4,717 | | 32,183 | |
Represented by increase (decrease) in: | | | | | | | | | | | | | | | | | | | | | | | |
Taxpayer-supported debt | | 3,523 | | 2,886 | | 812 | | 839 | | (1,220 | ) | 2,108 | | 350 | | 2,427 | | 4,070 | | 3,531 | | 19,326 | |
Self-supported debt | | 2,100 | | 1,991 | | 1,415 | | 1,492 | | 1,806 | | (3,026 | ) | 2,147 | | 2,205 | | 1,241 | | 1,186 | | 12,557 | |
Forecast allowance | | — | | — | | — | | — | | — | | — | | 500 | | — | | (200 | ) | — | | 300 | |
Total provincial debt | | 5,623 | | 4,877 | | 2,227 | | 2,331 | | 586 | | (918 | ) | 2,997 | | 4,632 | | 5,111 | | 4,717 | | 32,183 | |
BUDGET AND FISCAL PLAN - 2019/20 to 2021/22
135
APPENDIX
Table A17 Provincial Debt — 2012/13 to 2021/22
| | | | | | | | | | | | | | Updated | | Budget | | | | | | Average | |
| | Actual | | Actual | | Actual | | Actual | | Actual | | Actual | | Forecast | | Estimate | | Plan | | Plan | | annual | |
($ millions) | | 2012/13 | | 2013/14 | | 2014/15 | | 2015/16 | | 2016/17 | | 2017/18 | | 2018/19 | | 2019/20 | | 2020/21 | | 2021/22 | | change | |
| | | | | | | | | | | | | | | | | | | | | | (per cent) | |
Taxpayer-supported debt: | | | | | | | | | | | | | | | | | | | | | | | |
Provincial government direct operating | | 9,408 | | 10,223 | | 9,280 | | 8,034 | | 4,644 | | 1,156 | | — | | — | | — | | — | | -100.0 | |
Other taxpayer-supported debt (mainly capital): | | | | | | | | | | | | | | | | | | | | | | | |
Education facilities | | | | | | | | | | | | | | | | | | | | | | | |
Post-secondary institutions | | 4,315 | | 4,386 | | 4,518 | | 4,731 | | 4,984 | | 5,328 | | 5,472 | | 5,519 | | 5,714 | | 6,065 | | 3.9 | |
School districts | | 6,830 | | 7,245 | | 7,600 | | 8,033 | | 8,473 | | 8,908 | | 8,964 | | 8,709 | | 9,129 | | 8,558 | | 2.5 | |
| | 11,145 | | 11,631 | | 12,118 | | 12,764 | | 13,457 | | 14,236 | | 14,436 | | 14,228 | | 14,843 | | 14,623 | | 3.1 | |
Health facilities | | 5,691 | | 6,038 | | 6,522 | | 6,998 | | 7,552 | | 7,903 | | 7,990 | | 7,918 | | 8,476 | | 9,507 | | 5.9 | |
Highways, ferries and public transit | | | | | | | | | | | | | | | | | | | | | | | |
BC Transit | | 163 | | 143 | | 123 | | 106 | | 94 | | 84 | | 78 | | 122 | | 157 | | 175 | | 0.8 | |
BC Transportation Financing Authority | | 7,084 | | 7,912 | | 8,428 | | 9,177 | | 9,974 | | 10,388 | | 11,337 | | 13,143 | | 15,201 | | 17,130 | | 10.3 | |
Port Mann Bridge 1 | | — | | — | | — | | — | | — | | 3,508 | | 3,508 | | 3,508 | | 3,508 | | 3,508 | | n/a | |
Public transit | | 1,000 | | 1,000 | | 1,000 | | 1,000 | | 1,000 | | 1,000 | | 1,000 | | 1,000 | | 1,000 | | 1,000 | | 0.0 | |
SkyTrain extension | | 1,174 | | 1,174 | | 1,174 | | 1,174 | | 1,174 | | 1,174 | | 1,174 | | 1,174 | | 1,174 | | 1,174 | | 0.0 | |
| | 9,421 | | 10,229 | | 10,725 | | 11,457 | | 12,242 | | 16,154 | | 17,097 | | 18,947 | | 21,040 | | 22,987 | | 10.4 | |
Other | | | | | | | | | | | | | | | | | | | | | | | |
BC Immigrant Investment Fund | | 363 | | 440 | | 414 | | 304 | | 217 | | 161 | | 67 | | 36 | | 25 | | 10 | | -32.9 | |
BC Pavilion Corporation | | 383 | | 382 | | 381 | | 389 | | 376 | | 374 | | 386 | | 393 | | 400 | | 407 | | 0.7 | |
Provincial government general capital | | 1,073 | | 1,372 | | 1,698 | | 1,987 | | 2,288 | | 2,718 | | 3,106 | | 3,639 | | 4,076 | | 4,463 | | 17.2 | |
Social Housing | | 658 | | 719 | | 715 | | 760 | | 695 | | 878 | | 849 | | 1,196 | | 1,565 | | 1,901 | | 12.5 | |
Other | | 40 | | 34 | | 27 | | 26 | | 28 | | 27 | | 26 | | 27 | | 29 | | 88 | | 9.2 | |
| | 2,517 | | 2,947 | | 3,235 | | 3,466 | | 3,604 | | 4,158 | | 4,434 | | 5,291 | | 6,095 | | 6,869 | | 11.8 | |
Total other taxpayer-supported debt | | 28,774 | | 30,845 | | 32,600 | | 34,685 | | 36,855 | | 42,451 | | 43,957 | | 46,384 | | 50,454 | | 53,986 | | 7.2 | |
Total taxpayer-supported debt | | 38,182 | | 41,068 | | 41,880 | | 42,719 | | 41,499 | | 43,607 | | 43,957 | | 46,384 | | 50,454 | | 53,986 | | 3.9 | |
Self-supported debt: | | | | | | | | | | | | | | | | | | | | | | | |
Commercial Crown corporations and agencies | | | | | | | | | | | | | | | | | | | | | | | |
BC Hydro | | 14,167 | | 15,559 | | 16,544 | | 17,929 | | 19,685 | | 19,990 | | 22,176 | | 23,386 | | 24,632 | | 25,844 | | 6.9 | |
BC Lotteries | | 132 | | 155 | | 140 | | 150 | | 145 | | 155 | | 139 | | 167 | | 187 | | 187 | | 3.9 | |
Columbia Power Corporation | | — | | — | | 300 | | 296 | | 291 | | 286 | | 281 | | 276 | | 270 | | 264 | | n/a | |
Columbia River power projects | | 475 | | 470 | | 464 | | 459 | | 448 | | 433 | | 417 | | 1,391 | | 1,374 | | 1,354 | | 12.3 | |
Post-secondary institution subsidiaries | | 215 | | 198 | | 222 | | 310 | | 340 | | 418 | | 418 | | 418 | | 418 | | 418 | | 7.7 | |
Transportation Investment Corporation 1 | | 2,610 | | 3,209 | | 3,335 | | 3,355 | | 3,398 | | — | | — | | — | | — | | — | | -100.0 | |
Other | | 35 | | 34 | | 35 | | 33 | | 31 | | 30 | | 28 | | 26 | | 24 | | 23 | | -4.6 | |
Total self-supported debt | | 17,634 | | 19,625 | | 21,040 | | 22,532 | | 24,338 | | 21,312 | | 23,459 | | 25,664 | | 26,905 | | 28,090 | | 5.3 | |
Forecast allowance | | — | | — | | — | | — | | — | | — | | 500 | | 500 | | 300 | | 300 | | n/a | |
Total provincial debt | | 55,816 | | 60,693 | | 62,920 | | 65,251 | | 65,837 | | 64,919 | | 67,916 | | 72,548 | | 77,659 | | 82,376 | | 4.4 | |
1 Beginning in 2017/18, debt related to the Port Mann Bridge has been reclassified as taxpayer-supported due to the elimination of tolls effective September 1, 2017.
BUDGET AND FISCAL PLAN - 2019/20 to 2021/22
136
APPENDIX
Table A18 Provincial Debt Supplementary Information — 2012/13 to 2021/22 1
| | | | | | | | | | | | | | Updated | | Budget | | | | | | Average | |
| | Actual | | Actual | | Actual | | Actual | | Actual | | Actual | | Forecast | | Estimate | | Plan | | Plan | | annual | |
($ millions) | | 2012/13 | | 2013/14 | | 2014/15 | | 2015/16 | | 2016/17 | | 2017/18 | | 2018/19 | | 2019/20 | | 2020/21 | | 2021/22 | | change | |
| | | | | | | | | | | | | | | | | | | | | | (per cent) | |
Per cent of nominal GDP: 2 | | | | | | | | | | | | | | | | | | | | | | | |
Taxpayer-supported debt: | | | | | | | | | | | | | | | | | | | | | | | |
Provincial government direct operating | | 4.2 | | 4.5 | | 3.8 | | 3.2 | | 1.8 | | 0.4 | | — | | — | | — | | — | | -100.0 | |
Education facilities | | 5.0 | | 5.1 | | 5.0 | | 5.1 | | 5.1 | | 5.0 | | 4.9 | | 4.6 | | 4.6 | | 4.4 | | -1.6 | |
Health facilities | | 2.6 | | 2.6 | | 2.7 | | 2.8 | | 2.9 | | 2.8 | | 2.7 | | 2.6 | | 2.6 | | 2.8 | | 1.1 | |
Highways, ferries and public transit | | 4.3 | | 4.5 | | 4.4 | | 4.6 | | 4.6 | | 5.7 | | 5.8 | | 6.1 | | 6.5 | | 6.9 | | 5.5 | |
Other | | 1.1 | | 1.3 | | 1.3 | | 1.4 | | 1.4 | | 1.5 | | 1.5 | | 1.7 | | 1.9 | | 2.1 | | 6.8 | |
Total taxpayer-supported debt | | 17.2 | | 17.9 | | 17.3 | | 17.2 | | 15.7 | | 15.5 | | 14.9 | | 15.0 | | 15.7 | | 16.1 | | -0.7 | |
Self-supported debt: | | | | | | | | | | | | | | | | | | | | | | | |
Commercial Crown corporations & agencies | | 8.0 | | 8.6 | | 8.7 | | 9.0 | | 9.2 | | 7.6 | | 7.9 | | 8.3 | | 8.4 | | 8.4 | | 0.6 | |
Total provincial debt | | 25.2 | | 26.5 | | 26.0 | | 26.2 | | 24.9 | | 23.0 | | 23.0 | | 23.5 | | 24.1 | | 24.6 | | -0.3 | |
Growth rates (per cent): | | | | | | | | | | | | | | | | | | | | | | | |
Taxpayer-supported debt: | | | | | | | | | | | | | | | | | | | | | | | |
Provincial government direct operating | | 20.4 | | 8.7 | | -9.2 | | -13.4 | | -42.2 | | -75.1 | | -100.0 | | 0.0 | | 0.0 | | 0.0 | | -21.1 | |
Education facilities | | 5.2 | | 4.4 | | 4.2 | | 5.3 | | 5.4 | | 5.8 | | 1.4 | | -1.4 | | 4.3 | | -1.5 | | 3.3 | |
Health facilities | | 7.5 | | 6.1 | | 8.0 | | 7.3 | | 7.9 | | 4.6 | | 1.1 | | -0.9 | | 7.0 | | 12.2 | | 6.1 | |
Highways, ferries and public transit | | 9.0 | | 8.6 | | 4.8 | | 6.8 | | 6.9 | | 32.0 | | 5.8 | | 10.8 | | 11.0 | | 9.3 | | 10.5 | |
Other | | 8.6 | | 17.1 | | 9.8 | | 7.1 | | 4.0 | | 15.4 | | 6.6 | | 19.3 | | 15.2 | | 12.7 | | 11.6 | |
Total taxpayer-supported debt | | 10.2 | | 7.6 | | 2.0 | | 2.0 | | -2.9 | | 5.1 | | 0.8 | | 5.5 | | 8.8 | | 7.0 | | 4.6 | |
Self-supported debt: | | | | | | | | | | | | | | | | | | | | | | | |
Commercial Crown corporations & agencies | | 13.5 | | 11.3 | | 7.2 | | 7.1 | | 8.0 | | -12.4 | | 10.1 | | 9.4 | | 4.8 | | 4.4 | | 6.3 | |
Total provincial debt | | 11.2 | | 8.7 | | 3.7 | | 3.7 | | 0.9 | | -1.4 | | 4.6 | | 6.8 | | 7.0 | | 6.1 | | 5.1 | |
Per capita: 3 | | | | | | | | | | | | | | | | | | | | | | | |
Taxpayer-supported debt: | | | | | | | | | | | | | | | | | | | | | | | |
Provincial government direct operating | | 2,060 | | 2,208 | | 1,971 | | 1,682 | | 956 | | 235 | | — | | — | | — | | — | | -100.0 | |
Education facilities | | 2,440 | | 2,512 | | 2,574 | | 2,672 | | 2,769 | | 2,892 | | 2,892 | | 2,814 | | 2,898 | | 2,817 | | 1.6 | |
Health facilities | | 1,246 | | 1,304 | | 1,386 | | 1,465 | | 1,554 | | 1,606 | | 1,601 | | 1,566 | | 1,655 | | 1,832 | | 4.4 | |
Highways, ferries and public transit | | 2,063 | | 2,209 | | 2,278 | | 2,399 | | 2,519 | | 3,282 | | 3,425 | | 3,747 | | 4,107 | | 4,429 | | 8.9 | |
Other | | 551 | | 636 | | 687 | | 726 | | 742 | | 845 | | 888 | | 1,046 | | 1,190 | | 1,323 | | 10.2 | |
Total taxpayer-supported debt | | 8,361 | | 8,870 | | 8,897 | | 8,944 | | 8,540 | | 8,859 | | 8,806 | | 9,172 | | 9,850 | | 10,401 | | 2.5 | |
Self-supported debt: | | | | | | | | | | | | | | | | | | | | | | | |
Commercial Crown corporations & agencies | | 3,861 | | 4,239 | | 4,470 | | 4,717 | | 5,009 | | 4,330 | | 4,700 | | 5,075 | | 5,252 | | 5,412 | | 3.8 | |
Total provincial debt | | 12,222 | | 13,108 | | 13,367 | | 13,661 | | 13,549 | | 13,189 | | 13,606 | | 14,346 | | 15,161 | | 15,871 | | 2.9 | |
Real Per Capita Provincial Debt (2018 $) 4 | | 13,322 | | 14,300 | | 14,435 | | 14,593 | | 14,213 | | 13,548 | | 13,606 | | 14,033 | | 14,531 | | 14,910 | | 1.3 | |
Growth rate (per cent) | | 11.3 | | 7.3 | | 0.9 | | 1.1 | | -2.6 | | -4.7 | | 0.4 | | 3.1 | | 3.5 | | 2.6 | | 2.3 | |
1 Numbers may not add due to rounding.
2 Debt as a per cent of GDP is calculated using nominal GDP for the calendar year ending in the fiscal year (e.g. 2019/20 debt divided by nominal GDP for the 2019 calendar year).
3 Per capita debt is calculated using July 1 population (e.g. 2019/20 debt divided by population on July 1, 2019).
4 Debt is converted to real (inflation-adjusted) terms using the consumer price index (CPI) for the corresponding calendar year (e.g. 2019 CPI for 2019/20 debt).
BUDGET AND FISCAL PLAN - 2019/20 to 2021/22
137
APPENDIX
Table A19 Key Provincial Debt Indicators — 2012/13 to 2021/22
| | | | | | | | | | | | | | Updated | | Budget | | | | | | Average | |
| | Actual | | Actual | | Actual | | Actual | | Actual | | Actual | | Forecast | | Estimate | | Plan | | Plan | | annual | |
| | 2012/13 | | 2013/14 | | 2014/15 | | 2015/16 | | 2016/17 | | 2017/18 | | 2018/19 | | 2019/20 | | 2020/21 | | 2021/22 | | change | |
| | | | | | | | | | | | | | | | | | | | | | (per cent) | |
Debt to revenue (per cent) | | | | | | | | | | | | | | | | | | | | | | | |
Total provincial | | 104.1 | | 107.8 | | 106.7 | | 105.9 | | 99.3 | | 93.7 | | 93.2 | | 91.2 | | 100.6 | | 101.9 | | -0.2 | |
Taxpayer-supported | | 93.6 | | 96.4 | | 94.1 | | 91.3 | | 81.8 | | 82.5 | | 78.4 | | 81.5 | | 87.0 | | 89.6 | | -0.5 | |
Debt per capita ($) 1 | | | | | | | | | | | | | | | | | | | | | | | |
Total provincial | | 12,222 | | 13,108 | | 13,367 | | 13,661 | | 13,549 | | 13,189 | | 13,606 | | 14,346 | | 15,161 | | 15,871 | | 2.9 | |
Taxpayer-supported | | 8,361 | | 8,870 | | 8,897 | | 8,944 | | 8,540 | | 8,859 | | 8,806 | | 9,172 | | 9,850 | | 10,401 | | 2.5 | |
Debt to nominal GDP (per cent) 2 | | | | | | | | | | | | | | | | | | | | | | | |
Total provincial | | 25.2 | | 26.5 | | 26.0 | | 26.2 | | 24.9 | | 23.0 | | 23.0 | | 23.5 | | 24.1 | | 24.6 | | -0.3 | |
Taxpayer-supported | | 17.2 | | 17.9 | | 17.3 | | 17.2 | | 15.7 | | 15.5 | | 14.9 | | 15.0 | | 15.7 | | 16.1 | | -0.7 | |
Interest bite (cents per dollar of revenue) 3 | | | | | | | | | | | | | | | | | | | | | | | |
Total provincial | | 4.4 | | 4.3 | | 4.3 | | 4.7 | | 3.8 | | 3.8 | | 3.6 | | 3.7 | | 4.0 | | 4.1 | | -0.7 | |
Taxpayer-supported | | 3.9 | | 3.7 | | 3.7 | | 4.0 | | 3.2 | | 3.3 | | 3.1 | | 3.3 | | 3.5 | | 3.7 | | -0.6 | |
Interest costs ($ millions) | | | | | | | | | | | | | | | | | | | | | | | |
Total provincial | | 2,339 | | 2,444 | | 2,525 | | 2,879 | | 2,521 | | 2,608 | | 2,627 | | 2,929 | | 3,114 | | 3,325 | | 4.0 | |
Taxpayer-supported | | 1,600 | | 1,583 | | 1,651 | | 1,892 | | 1,644 | | 1,725 | | 1,753 | | 1,894 | | 2,039 | | 2,232 | | 3.8 | |
Interest rate (per cent) 4 | | | | | | | | | | | | | | | | | | | | | | | |
Taxpayer-supported | | 4.4 | | 4.0 | | 4.0 | | 4.5 | | 3.9 | | 4.1 | | 4.0 | | 4.2 | | 4.2 | | 4.3 | | -0.3 | |
Background Information: | | | | | | | | | | | | | | | | | | | | | | | |
Revenue ($ millions) | | | | | | | | | | | | | | | | | | | | | | | |
Total provincial 5 | | 53,637 | | 56,279 | | 58,952 | | 61,589 | | 66,334 | | 69,315 | | 72,909 | | 79,516 | | 77,234 | | 80,866 | | 4.7 | |
Taxpayer-supported 6 | | 40,775 | | 42,611 | | 44,514 | | 46,805 | | 50,726 | | 52,866 | | 56,034 | | 56,916 | | 57,964 | | 60,236 | | 4.4 | |
Debt ($ millions) | | | | | | | | | | | | | | | | | | | | | | | |
Total provincial | | 55,816 | | 60,693 | | 62,920 | | 65,251 | | 65,837 | | 64,919 | | 67,916 | | 72,548 | | 77,659 | | 82,376 | | 4.4 | |
Taxpayer-supported 7 | | 38,182 | | 41,068 | | 41,880 | | 42,719 | | 41,499 | | 43,607 | | 43,957 | | 46,384 | | 50,454 | | 53,986 | | 3.9 | |
Provincial nominal GDP ($ millions) 8 | | 221,413 | | 228,972 | | 242,044 | | 249,072 | | 263,978 | | 282,204 | | 295,316 | | 308,457 | | 321,819 | | 334,829 | | 4.7 | |
Population (thousands at July 1) 9 | | 4,567 | | 4,630 | | 4,707 | | 4,776 | | 4,859 | | 4,922 | | 4,992 | | 5,057 | | 5,122 | | 5,190 | | 1.4 | |
1 The ratio of debt to population (e.g. 2019/20 debt divided by population at July 1, 2019).
2 The ratio of debt outstanding at fiscal year end to provincial nominal gross domestic product (GDP) for the calendar year ending in the fiscal year (e.g. 2019/20 debt divided by 2019 nominal GDP).
3 The ratio of interest costs (less sinking fund interest) to revenue. Figures include capitalized interest expense in order to provide a more comparable measure to outstanding debt.
4 Weighted average of all outstanding debt issues.
5 Includes revenue of the consolidated revenue fund (excluding dividends from enterprises) plus revenue of all government organizations and enterprises.
6 Excludes revenue of government enterprises, but includes dividends from enterprises paid to the consolidated revenue fund.
7 Excludes debt of commercial Crown corporations and agencies and funds held under the province’s warehouse borrowing program.
8 Nominal GDP for the calendar year ending in the fiscal year (e.g. nominal GDP for 2019 is used for the fiscal year ended March 31, 2020).
9 Population at July 1st within the fiscal year (e.g. population at July 1, 2019 is used for the fiscal year ended March 31, 2020).
BUDGET AND FISCAL PLAN - 2019/20 to 2021/22
138