National Library of Canada Cataloguing in Publication Data
British Columbia. Office of the Comptroller General.
Public accounts for the year ended… – 2000/2001
Annual.
Report year ends Mar. 31.
Continues: British Columbia. Ministry of Finance.
Public accounts. ISSN 1187–8657.
ISSN 1499–1659 = Public accounts–British Columbia.
Office of the Comptroller General
1. British Columbia–Appropriations and
expenditures–Periodicals. 2. Revenue–British
Columbia–Periodicals.
3. Finance, Public–British Columbia–Periodicals. 1.
British Columbia. Ministry of Finance. 2. Title.
HJ13.B74 352.4’09711’05 C2001–960204–9
July 18, 2019
Victoria, British Columbia
Lieutenant Governor of the Province of British Columbia
MAY IT PLEASE YOUR HONOUR:
The undersigned has the honour to present the Public Accounts of the Government of the Province of British Columbia for the fiscal year ended March 31, 2019.
CAROLE JAMES
Minister of Finance
Ministry of Finance
Victoria, British Columbia
Honourable Carole James
Minister of Finance
I have the honour to submit herewith the Public Accounts of the Government of the Province of British Columbia for the fiscal year ended March 31, 2019.
Respectfully submitted,
CARL FISCHER
Comptroller General
British Columbia’s Public Accounts
The Public Accounts include the Summary Financial Statements of the provincial Government Reporting Entity which includes the financial results of all ministries and Crown agencies presented on a consolidated basis. The supporting notes and schedules define the accounting policies followed in preparing the province’s financial statements and form an integral part of the overall financial picture of the province’s financial activities in the fiscal year ending March 31, 2019.
Responsibility for the preparation of the government’s financial statements rests with the Office of the Comptroller General. The accounting standards followed by the province are established in section 23.1 of the Budget Transparency and Accountability Act. Although accounting policies are based on Public Sector Accounting Standards (PSAS), the application of standards to specific programs and transactions is the responsibility of the preparer who must use professional judgement to determine the treatment that is most representative of the underlying economic substance and best serves the information requirements of the users of government financial statements. To ensure due diligence in the application of accounting policies, decisions are based on comprehensive understanding of the substance of transactions, reference to existing and emerging accounting standards, and consultation with standard setters, other jurisdictions and the audit community.
In September 1999 the final report of the Budget Process Review Panel established clear principles for financial reporting based on user needs and led to the introduction of the Budget Transparency and Accountability Act which forms the basis of British Columbia’s legislated reporting framework. British Columbia is at the forefront of financial accountability by providing all financial reporting on a full accrual basis with direct comparability between budget and actual results. Conflicts can arise between the legislated requirement for comparable and consistent financial reporting and the national and international standards that guide accounting or the interpretation of those standards. Our obligation is to ensure financial reporting meets the accountability requirements of the public and stakeholders, within the framework established in legislation.
Despite the growing complexity of the reporting process, British Columbia remains committed to timely delivery of the Public Accounts each year and continues to focus on consistency in budgeting and financial reporting based on the comparability of its Estimates and Public Accounts, and the focus on “one bottom line”; that is, the Summary Financial Statements of the province.
Throughout the year, we work with the Office of the Auditor General to implement changes in accounting standards, address audit findings and recommendations, and improve the transparency of financial reporting. In doing so, we are mindful of the need to maintain consistency in the fundamental principles of accounting, and the comparability of financial information over a long period of time. This continuity allows the users of financial information to compare government’s financial performance against their fiscal plan, and to understand the province’s financial performance over longer periods of time. These objectives help demonstrate accountability for financial performance to the public, both in the current year and over the longer term.
The audit opinion on this year’s Public Accounts includes one point of reservation. The previous years reservation related to rate–regulated accounting has been resolved, though the Auditor General continues to monitor the implementation of governments policy direction.
A reservation remains in relation to the deferral of revenue, which has been a qualification since Public Accounts 2011/12. At that time government made the policy decision to maintain the longstanding accounting treatment of recognizing restricted contributions in the same period that programs and services are delivered. Adopting the auditors recommended approach of immediate recognition would result in:
· restricted contributions no longer being disclosed as a provincial obligation for future service delivery;
· budget and actual results no longer being directly comparable;
· future program spending being artificially constrained during economic downturns when services are most urgently needed.
We will continue to work with standard setters, other jurisdictions, the accounting community, and the Office of the Auditor General towards a resolution of the reservation identified in the audit opinion.
I would like to thank the Select Standing Committee on Public Accounts of the Legislative Assembly, government ministries, Crown corporations and agencies, and the Auditor General and her staff for their cooperation and support in preparing the Public Accounts.
Comments or questions regarding the Public Accounts document are encouraged and much appreciated. Please direct your comments or questions to me by mail at PO Box 9413 STN PROV GOVT, Victoria BC V8W 9V1; e–mail at: Carl.Fischer@gov.bc.ca; by telephone at 250–387–6692; or by fax at 250–356–2001.
Further information on the government’s financial performance is also provided through the Consolidated Revenue Fund Extracts (available on the Internet – website http://gov.bc.ca/publicaccounts). These extracts compare actual to planned spending of ministries on an appropriation basis, fulfilling ministries accountability back to the Legislative Assembly.
| CARL FISCHER |
| Comptroller General |
PROVINCE OF BRITISH COLUMBIA
PUBLIC ACCOUNTS 2018/19
Contents
Overview (Unaudited) | |
Public Accounts Content | 9 |
Legislative Compliance and Accounting Policy Report | 10 |
Financial Statement Discussion and Analysis Report | 11 |
Highlights | 11 |
Discussion and Analysis | 13 |
Economic Highlights | 28 |
| |
Summary Financial Statements | |
Statement of Responsibility for the Summary Financial Statements of the Government of the Province of British Columbia | 31 |
Report of the Auditor General of British Columbia | 32 |
Consolidated Statement of Financial Position | 39 |
Consolidated Statement of Operations | 40 |
Consolidated Statement of Change in Net Liabilities | 41 |
Consolidated Statement of Cash Flow | 42 |
Notes to Consolidated Summary Financial Statements | 44 |
Reporting Entity | 85 |
Consolidated Statement of Financial Position by Sector | 88 |
Consolidated Statement of Operations by Sector | 92 |
Statement of Financial Position for Self–supported Crown Corporations and Agencies | 96 |
Summary of Results of Operations and Statement of Equity for Self–supported Crown Corporations and Agencies | 98 |
Consolidated Statement of Tangible Capital Assets | 100 |
Consolidated Statement of Guaranteed Debt | 101 |
| |
Supplementary Information (Unaudited) | |
Adjusted Net Income of Crown Corporations, Agencies and the SUCH Sector | 105 |
SUCH Statement of Financial Position | 108 |
SUCH Statement of Operations | 110 |
Consolidated Staff Utilization | 111 |
| |
Consolidated Revenue Fund Extracts (Unaudited) | |
Statement of Financial Position | 115 |
Statement of Operations | 116 |
General Fund Statement of Financial Position | 117 |
General Fund Statement of Operations | 118 |
BC Prosperity Fund Statement of Financial Position | 119 |
BC Prosperity Fund Statement of Operations | 119 |
Statement of Cash Flow | 120 |
Schedule of Net Revenue by Source | 122 |
Schedule of Comparison of Estimated Expenses to Actual Expenses | 124 |
Schedule of Financing Transaction Disbursements | 126 |
Schedule of Write–offs, Extinguishments and Remissions | 127 |
| |
Provincial Debt Summary | |
Overview of Provincial Debt (Unaudited) | 131 |
Provincial Debt (Unaudited) | 132 |
Change in Provincial Debt (Unaudited) | 133 |
Reconciliation of Summary Financial Statements’ Deficit (Surplus) to Change in Taxpayer–supported Debt and Total Debt (Unaudited) | 134 |
Reconciliation of Total Debt to Summary Financial Statements’ Debt (Unaudited) | 134 |
Change in Provincial Debt, Comparison to Budget (Unaudited) | 135 |
Interprovincial Comparison of Taxpayer–supported Debt as a Percentage of Gross Domestic Product (Unaudited) | 136 |
Interprovincial Comparison of Taxpayer–supported Debt Service Costs as a Percentage of Revenue (Unaudited) | 137 |
Report of the Auditor General of British Columbia on the Summary of Provincial Debt, Key Indicators of Provincial Debt, and Summary of Performance Measures | 138 |
Summary of Provincial Debt | 143 |
Key Indicators of Provincial Debt | 145 |
Summary of Performance Measures | 146 |
PROVINCE OF BRITISH COLUMBIA
PUBLIC ACCOUNTS 2018/19
Contents — Continued
Definitions (Unaudited) | 147 |
Acronyms (Unaudited) | 150 |
PROVINCE OF BRITISH COLUMBIA
PUBLIC ACCOUNTS 2018/19
Public Accounts Content
Financial Statement Discussion and Analysis Unaudited)—this section provides a written commentary on the Summary Financial Statements plus additional information on the financial performance of the provincial government.
Summary Financial Statements—these audited statements have been prepared to disclose the financial impact of the government’s activities. They aggregate the Consolidated Revenue Fund (CRF) the taxpayer–supported Crown corporations and agencies (government organizations), the self–supported Crown corporations and agencies (government business enterprises) and the school districts, universities, colleges, institutes and health organizations (SUCH) sector.
Supplementary Information (Unaudited)—this section provides supplementary schedules containing detailed information on the results of those Crown corporations and agencies that are part of the government reporting entity and the impact of the SUCH sector on the province’s financial statements.
Consolidated Revenue Fund Extracts (Unaudited)—the CRF reflects the core operations of the province as represented by the operations of government ministries and legislative offices. Its statements are included in an abridged form. The CRF Extracts include a summary of the CRF Statement of Financial Position, the CRF Statement of Operating Results, the General Fund Statement of Financial Position, the General Fund Statement of Operations, the BC Prosperity Fund Statement of Financial Position, the BC Prosperity Fund Statement of Operations, the CRF Statement of Cash Flow, a CRF Schedule of Net Revenue by Source, a CRF Schedule of Expenses, a CRF Schedule of Financing Transactions, and a CRF Schedule of Write–offs, Extinguishments and Remissions, as required by statute.
Provincial Debt Summary—this section presents unaudited schedules and unaudited statements that provide further details on provincial debt and reconcile the Summary Financial Statements debt to the province’s total debt. Also included are the audited Summary of Provincial Debt, Key Indicators of Provincial Debt and Summary of Performance Measures.
This publication is available on the Internet at: http://gov.bc.ca/finance
Additional Information Available (Unaudited)
The following information is available only on the Internet at: http://gov.bc.ca/finance
Consolidated Revenue Fund Supplementary Schedules—this section contains schedules that provide details of financial activities of the CRF, including details of expenses by ministerial appropriations, an analysis of statutory appropriations, Special Accounts and Special Fund balances and operating statements, and financing transactions.
Consolidated Revenue Fund Detailed Schedules of Payments—this section contains detailed schedules of salaries, wages, travel expenses, grants and other payments.
Financial Statements of Government Organizations and Enterprises—this section contains links to the audited financial statements of those Crown corporations, agencies and SUCH sector entities that are included in the government reporting entity.
9
PROVINCE OF BRITISH COLUMBIA
PUBLIC ACCOUNTS 2018/19
Legislative Compliance and Accounting Policy Report
The focus of the province’s financial reporting is the Summary Financial Statements, which consolidate the operating and financial results of the province’s Crown corporations, agencies, school districts, universities, colleges, institutes and health organizations with the Consolidated Revenue Fund. These are general–purpose statements designed to meet, to the extent possible, the information needs of a variety of users.
The Public Accounts are prepared in accordance with the Financial Administration Act and the Budget Transparency and Accountability Act (BTAA).
The BTAA was amended in 2001 with the passing of Bill 5. Under section 20 of that Bill, the government has mandated that “all accounting policies and practices applicable to documents required to be made public under this Act for the government reporting entity must conform to generally accepted accounting principles.”
For senior governments, generally accepted accounting principles (GAAP) is generally considered to be the recommendations and guidelines of the Canadian Public Sector Accounting Board.
Section 4.1 of the BTAA established an Accounting Policy Advisory Committee (APAC) to advise Treasury Board on the implementation of GAAP for the government reporting entity (GRE). With the government’s transition to full GAAP for the 2004/05 year, the role of APAC changed to include the provision of advice on evolving developments in accounting standards by the accounting profession, as well as emerging issues within government.
10
PROVINCE OF BRITISH COLUMBIA
PUBLIC ACCOUNTS 2018/19
Financial Statement Discussion and Analysis Report
Highlights
The highlights section provides a summary of the key events affecting the financial statements based on information taken from the Summary Financial Statements and Provincial Debt Summary included in the Public Accounts. The budget figures are from pages 139, 145, 148 and 149 of the Budget and Fiscal Plan 2018/19–2020/21.
Budget and Actual Results 2018/19
| | In Millions | | Variance | |
| | | | 2018/19 | | | | | | 2018/19 | | 2018/19 | |
| | 2018/19 | | Updated | | 2018/19 | | 2017/18 | | Actual to | | vs | |
| | Budget | | Forecast | | Actual | | Actual | | Budget | | 2017/18 | |
| | $ | | $ | | $ | | $ | | $ | | $ | |
Revenue | | 54,193 | | 56,636 | | 57,128 | | 52,020 | | 2,935 | | 5,108 | |
Expense | | (53,624 | ) | (55,762 | ) | (55,593 | ) | (51,706 | ) | (1,969 | ) | (3,887 | ) |
Surplus(deficit) before forecast allowance | | 569 | | 874 | | 1,535 | | 314 | | 966 | | 1,221 | |
Forecast allowance | | (350 | ) | (500 | ) | | | | | 350 | | | |
Surplus (deficit) for the year | | 219 | | 374 | | 1,535 | | 314 | | 1,316 | | 1,221 | |
| | | | | | | | | | | | | |
Capital spending: | | | | | | | | | | | | | |
Taxpayer–supported capital spending | | 5,174 | | 4,771 | | 4,452 | | 3908 | | (722 | ) | 544 | |
Self–supported capital spending | | 4,061 | | 4,192 | | 4,106 | | 2,729 | | 45 | | 1,377 | |
Total capital spending | | 9,235 | | 8,963 | | 8,558 | | 6,637 | | (677 | ) | 1,921 | |
| | | | | | | | | | | | | |
Provincial debt: | | | | | | | | | | | | | |
Taxpayer–supported | | 45,198 | | 43,957 | | 42,681 | | 43,607 | | (2,517 | ) | (926 | ) |
Self–supported | | 23,824 | | 23,459 | | 23,281 | | 21,312 | | (543 | ) | 1,969 | |
Total provincial debt | | 69,022 | | 67,416 | | 65,962 | | 64,919 | | (3,060 | ) | 1,043 | |
| | | | | | | | | | | | | |
Taxpayer–supported debt to GDP ratio | | 15.5 | % | 14.9 | % | 14.5 | % | 15.6 | % | (1.0 | ) | (1.1 | ) |
Summary Accounts Surplus (Deficit)
The province ended the year with a surplus of $1,535 million, which was $1,316 million higher than the surplus forecast in the Budget and Fiscal Plan 2018/19–2020/21. The 2018/19 surplus of $1,535 million was $1,221 million greater than the surplus of $314 million in fiscal year 2017/18.
Revenue increased by $5,108 million over fiscal year 2017/18 and was $2,935 million higher than budget. The annual increase in revenue in the current year was mainly in taxation revenue reflecting economic growth, new tax policy measures and higher prior year income tax assessments.
Expense increased by $3,887 million over fiscal year 2017/18 and was higher than budget by $1,969 million. The increases in spending in the current year were mainly in the natural resources, health, protection of persons and property and education sectors for service delivery requirements and wildfire activities. Additional spending over budget was authorized through Supplementary Estimates and various statutory appropriations.
11
PROVINCE OF BRITISH COLUMBIA
PUBLIC ACCOUNTS 2018/19
Financial Statement Discussion and Analysis Report
Capital Spending
Taxpayer–supported infrastructure spending on hospitals, schools, post–secondary facilities, transit, and roads totaled $4,452 million in 2018/19, $722 million lower than budget mainly due to project scheduling changes. This spending has been deferred to future years.
Self–supported infrastructure spending on electrical generation, transmission and distribution projects and other capital assets totaled $4,106 million in 2018/19. Self–supported capital spending was $45 million higher than budget.
Provincial Debt
When calculating total provincial debt, the province adds to its financial statement debt, all debt guarantees and the debt directly incurred by self–supported Crown corporations, reduced by sinking fund assets. This balance is referred to as the total provincial debt.
Taxpayer–supported provincial debt decreased by $926 million in 2018/19 mainly due to the elimination of provincial government direct operating debt. Self–supported provincial debt increased by $1,969 million due to an increase in capital infrastructure related to power projects. The increase in total provincial debt of $1,043 million was $3,060 million less than the budgeted increase in total debt of $4,103 million. The key measure of taxpayer–supported debt to GDP ended the year at 14.5%, which is lower than the 15.5% forecasted in the budget.
12
PROVINCE OF BRITISH COLUMBIA
PUBLIC ACCOUNTS 2018/19
Financial Statement Discussion and Analysis Report
Discussion and Analysis
The detailed analysis section provides an overview of significant trends relating to the Statement of Operations, Statement of Financial Position and Provincial Debt.
Revenue Analysis
Revenue analysis helps users understand the government’s finances in terms of its revenue sources and allows them to evaluate the revenue producing capacity of the government.
Revenue by Source
Revenue by source provides an outline of the primary sources of provincial revenue and how results change between those sources over time. Revenues are broken down into separate components of taxation, contributions from the federal government, natural resources and other sources, which include fees and licenses, contributions from self–supported Crown corporations, and investment income.
| | In Millions | |
| | 2014/15 | | 2015/16 | | 2016/17 | | 2017/18 | | 2018/19 | |
| | Actual | | Actual | | Actual | | Actual | | Actual | |
| | $ | | $ | | $ | | $ | | $ | |
Taxation | | 23,056 | | 24,326 | | 27,093 | | 28,321 | | 32,714 | |
Contributions from federal government | | 7,279 | | 7,647 | | 8,167 | | 9,055 | | 9,052 | |
Fees and licences | | 5,425 | | 5,836 | | 6,213 | | 6,249 | | 5,593 | |
Miscellaneous | | 2,860 | | 3,298 | | 3,508 | | 3,543 | | 3,413 | |
Net earnings of self–supported Crown corporations | | 3,437 | | 2,710 | | 2,525 | | 1,056 | | 2,005 | |
Natural resources | | 2,937 | | 2,571 | | 2,711 | | 2,695 | | 3,108 | |
Investment income | | 1,171 | | 1,213 | | 1,232 | | 1,101 | | 1,243 | |
Total revenue | | 46,165 | | 47,601 | | 51,449 | | 52,020 | | 57,128 | |
Provincial revenues increased by $5,108 million in 2018/19. The improvement in provincial revenue was primarily due to increases in taxation revenue of $4,393 million, net earnings of self–supported Crown corporations of $949 million, natural resource revenue of $413 million and an increase in the other sources of revenue of $9 million. Increases in these significant sources of revenue were offset by a decrease in fees and licences of $656 million.
2014/15 to 2018/19

In 2018/19, tax revenue increased by $4,393 million (15.5%). Personal income tax revenue increased by $2,441 million (27.4%) mainly reflecting estimated household income growth, higher prior year tax assessments and new tax policy measures. Corporate income tax revenue increased by $1,015 million (24.4%) due to increased federal government installments and prior year settlements. Employer health tax, which came into effect in fiscal 2018/19, was $464 million. Property transfer tax revenue decreased by $315 million (14.7%) due to weaker housing sales. All other tax revenues increased by $788 million over the same period.
13
PROVINCE OF BRITISH COLUMBIA
PUBLIC ACCOUNTS 2018/19
Financial Statement Discussion and Analysis Report
The net earnings of self–supported Crown corporations were $949 million higher than 2017/18 due to an adjustment of $950 million to the regulatory assets reported by the British Columbia Hydro and Power Authority (BC Hydro) made in fiscal 2017/18. The net earnings in the Insurance Corporation of British Columbia (ICBC) were $173 million higher than the previous year and were offset by a decrease of $162 million in BC Hydro earnings and by decreased earnings in other self–supported Crown corporations of $12 million.
Natural resource revenues were $413 million higher than 2017/18, mainly the result of improvements in the forestry sector.
The decrease in fees and licences of $656 million was due to the reduction in Medical Service Plan premiums offset by increases in tuition revenues in post–secondary institutions.
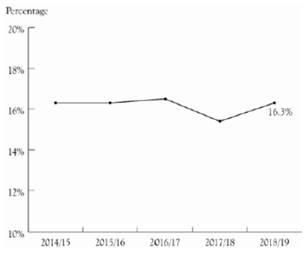
Own–source Revenue to GDP
The ratio of own–source revenue to GDP represents the amount of revenue the provincial government is taking from the provincial economy in the form of taxation, natural resource revenue, earnings of self–supported Crown corporations and user fees and licences (own–source revenue is all revenue except for federal transfers).
Own–source revenue to GDP has remained stable ending the year at 16.3%.
2014/15 to 2018/19
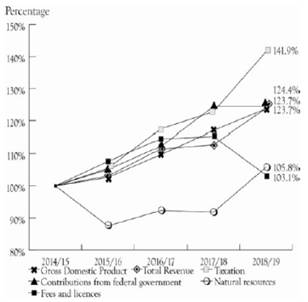
Percentage Change in Revenue
Trend analysis of revenue provides users with information about significant changes in revenue over time and between sources. This enables users to evaluate past performance and assess potential implications for the future.
Over the five years since 2014/15, total revenue has increased in relation with the increase in GDP. Taxation revenue has continued to exceed the growth in GDP. Natural resource revenues have increased by 14.0% over fiscal 2017/18 due to improvements in the forestry sector. Fees and licences revenue have declined due to the reduction in Medical Service Plan premiums.
2014/15 to 2018/19
14
PROVINCE OF BRITISH COLUMBIA
PUBLIC ACCOUNTS 2018/19
Financial Statement Discussion and Analysis Report
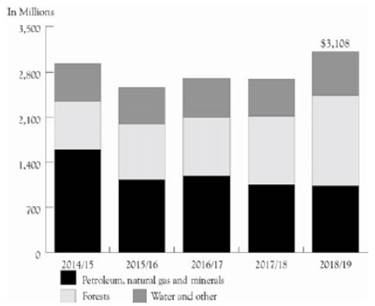
Natural Resource Revenue
The chart of natural resource revenue by source explains past trends of natural resource revenue in total and by major category.
Forestry revenue increased by $341 million in 2018/19. The proportion of natural resource revenue derived from forestry increased to 45.2% in 2018/19 from 39.5% in 2017/18.
Petroleum, natural gas and mineral revenues decreased slightly by $21 million from 2017/18. These categories of natural resource revenue account for 33.3% of natural resource revenue compared to 39.2% in 2017/18.
Water and other resource revenues increased by $93 million in the year. They comprise 21.5% of provincial natural resource revenue.
2014/15 to 2018/19
Government–to–Government Transfers to Total Revenue
The ratio of government–to–government transfers to total revenue is an indicator of how dependent the province is on transfers from the federal government. An increasing trend shows more reliance and a decreasing trend shows less.
Federal transfers decreased slightly in 2018/19, resulting in a stable ratio of 15.8%, indicating that there is no increase in dependence on federal transfers.
2014/15 to 2018/19

15
PROVINCE OF BRITISH COLUMBIA
PUBLIC ACCOUNTS 2018/19
Financial Statement Discussion and Analysis Report
Expense Analysis
The following analysis helps users to understand the impact of the government’s spending on the economy, the government’s allocation and use of resources, and the cost of government programs.
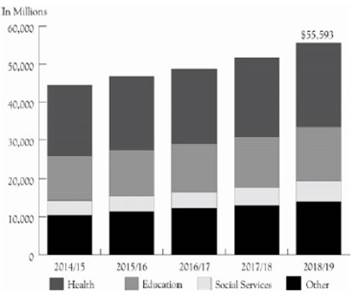
Expense by Function
Expense by function provides a summary of the major areas of government spending, and changes in spending over time. Functions, which indicate the purpose of expenditures, are defined by Statistics Canada’s Financial Management System of Government Statistics. The province uses the following functions: health, education, social services, interest, natural resources and economic development, other, transportation, protection of persons and property, and general government. The health, education and social services functions account for approximately three quarters of the province’s total operating costs.
| | In Millions | |
| | 2014/15 | | 2015/16 | | 2016/17 | | 2017/18 | | 2018/19 | |
| | Actual | | Actual | | Actual | | Actual | | Actual | |
| | $ | | $ | | $ | | $ | | $ | |
Health | | 18,370 | | 19,203 | | 19,689 | | 20,927 | | 22,151 | |
Education | | 11,827 | | 12,212 | | 12,468 | | 13,091 | | 14,085 | |
Social services | | 3,847 | | 4,106 | | 4,243 | | 4,737 | | 5,343 | |
Interest | | 2,498 | | 2,786 | | 2,587 | | 2,623 | | 2,684 | |
Natural resources and economic development | | 2,191 | | 2,477 | | 2,465 | | 3,374 | | 3,825 | |
Other | | 1,288 | | 1,264 | | 2,260 | | 1,553 | | 1,810 | |
Transportation | | 1,608 | | 1,670 | | 1,784 | | 1,931 | | 2,021 | |
Protection of persons and property | | 1,451 | | 1,572 | | 1,655 | | 1,930 | | 2,004 | |
General government | | 1,359 | | 1,501 | | 1,532 | | 1,540 | | 1,670 | |
Total expense | | 44,439 | | 46,791 | | 48,683 | | 51,706 | | 55,593 | |
Government spending on programs and services increased by $3,887 million in 2018/19.
The province increased spending on the health sector by $1,224 million (5.8%), the education sector by $994 million (7.6%), the social services sector by $606 million (12.8%), the natural resources and economic development sector by $451 million (13.4%), the other sector by $257 million (16.5%) and spending in all of the remaining sectors increased by $355 million over 2017/18.
2014/15 to 2018/19
16
PROVINCE OF BRITISH COLUMBIA
PUBLIC ACCOUNTS 2018/19
Financial Statement Discussion and Analysis Report
In 2018/19, provincial operating expenses were $55,593 million, a $3,887 million (7.5%) increase from 2017/18. Program spending has increased by $11,154 million (25.1%) since 2014/15. This is compared to increases in GDP of 23.7% over the same period.
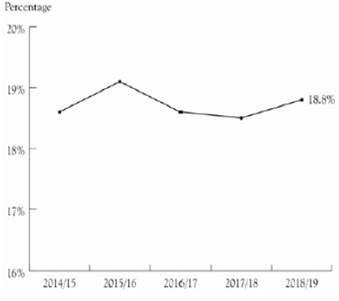
Expense to GDP
The ratio of expense to GDP represents the amount of government spending in relation to the overall provincial economy.
Government spending as a percentage of GDP increased slightly from 18.5% to 18.8% in 2018/19, indicating that government spending continues to grow moderately in relation to the provincial economy.
2014/15 to 2018/19
17
PROVINCE OF BRITISH COLUMBIA
PUBLIC ACCOUNTS 2018/19
Financial Statement Discussion and Analysis Report
Changes in Actual Results from 2017/18 to 2018/19
| | In Millions | |
| | Revenue | | Expense | | Surplus | |
| | $ | | $ | | $ | |
2017/18 Surplus | | 52,020 | | 51,706 | | 314 | |
Increase in taxation revenue | | 4,393 | | | | 4,393 | |
Increase in natural resources revenue | | 413 | | | | 413 | |
Increase in net earnings of self–supported Crown corporations | | 949 | | | | 949 | |
Decrease in fees and licences | | (656 | ) | | | (656 | ) |
Increase in other revenues | | 9 | | | | 9 | |
Increase in health spending | | | | 1,224 | | (1,224 | ) |
Increase in education spending | | | | 994 | | (994 | ) |
Increase in social services spending | | | | 606 | | (606 | ) |
Increase in natural resources and economic development spending | | | | 451 | | (451 | ) |
Increase in other sector spending | | | | 257 | | (257 | ) |
Increase in other program spending | | | | 355 | | (355 | ) |
Subtotal of changes in actual results | | 5,108 | | 3,887 | | 1,221 | |
| | 57,128 | | 55,593 | | | |
2018/19 Surplus | | | | | | 1,535 | |
| | | | | | | |
2017/18 Accumulated Surplus before Accumulated Other Comprehensive income | | | | | | 7,016 | |
2018/19 Accumulated Surplus before Accumulated Other Comprehensive income | | | | | | 8,551 | |
Accumulated other comprehensive income from self–supported Crown corporations and agencies | | | | | | 31 | |
2018/19 Accumulated Surplus | | | | | | 8,582 | |
The year over year increase in total revenue of $5,108 million, offset by the increase in total expense of $3,887 million, resulted in a surplus that was $1,221 million higher than 2017/18. Accumulated surplus, including accumulated other comprehensive income, increased from $6,781 million in 2017/18 to $8,582 million at the end of 2018/19.
18
PROVINCE OF BRITISH COLUMBIA
PUBLIC ACCOUNTS 2018/19
Financial Statement Discussion and Analysis Report
Changes from 2018/19 Budget
| | In Millions | |
| | | | | | Forecast | | | |
| | Revenue | | Expense | | Allowance | | Surplus | |
| | $ | | $ | | $ | | $ | |
Surplus per 2018/19 Budget | | 54,193 | | 53,624 | | (350 | ) | 219 | |
Increased taxation revenue | | 2,122 | | | | | | 2,122 | |
Increased natural resources revenue | | 695 | | | | | | 695 | |
Decreased net earnings of self–supported Crown corporations | | (559 | ) | | | | | (559 | ) |
Increased other revenues | | 677 | | | | | | 677 | |
Increased natural resources and economic development spending | | | | 1,392 | | | | (1,392 | ) |
Increased health spending | | | | 500 | | | | (500 | ) |
Increased protection of persons and property spending | | | | 354 | | | | (354 | ) |
Decreased other sector spending | | | | (557 | ) | | | 557 | |
Increased other program spending | | | | 280 | | | | (280 | ) |
Forecast allowance | | | | | | 350 | | 350 | |
Subtotal of changes in actual results compared to budget | | 2,935 | | 1,969 | | 350 | | 1,316 | |
Actual Results | | 57,128 | | 55,593 | | 0 | | 1,535 | |
Revenue was $2,935 million (5.4%) higher than the budgeted amount of $54,193 million and expenses were $1,969 million (3.7%) higher than the budgeted amount of $53,624 million. Additional spending over budget was authorized through Supplementary Estimates and various statutory appropriations.
Net Liabilities and Accumulated Surplus
In accordance with Canadian generally accepted accounting principles, the government’s Consolidated Statement of Financial Position is presented on a net liabilities basis. Net liabilities represent net future cash outflows resulting from past transactions and events. An analysis of net liabilities and accumulated surplus helps users to assess the government’s overall financial position and the future revenue required to pay for past transactions and events.
| | In Millions | | Variance | |
| | | | | | | | 2018/19 | | 2018/19 | |
| | 2018/19 | | 2018/19 | | 2017/18 | | Budget | | vs | |
| | Budget | | Actual | | Actual | | to Actual | | 2017/18 | |
| | $ | | $ | | $ | | $ | | $ | |
Financial assets | | 44,858 | | 44,569 | | 43,083 | | (289 | ) | 1,486 | |
Less: liabilities | | (89,601 | ) | (86,703 | ) | (84,917 | ) | 2,898 | | (1,786 | ) |
Net Liabilities | | (44,743 | ) | (42,134 | ) | (41,834 | ) | 2,609 | | (300 | ) |
Less: non–financial assets | | 51,756 | | 50,716 | | 48,615 | | (1,040 | ) | 2,101 | |
Accumulated surplus | | 7,013 | | 8,582 | | 6,781 | | 1,569 | | 1,801 | |
19
PROVINCE OF BRITISH COLUMBIA
PUBLIC ACCOUNTS 2018/19
Financial Statement Discussion and Analysis Report
The accumulated surplus represents the sum of the current and prior years’ operating results, and accumulated changes in other comprehensive income. At March 31, 2019, the accumulated surplus was $8,582 million, $1,569 million higher than budget.
Financial assets were $1,486 million higher than 2017/18 as the result of increases in loans for the purchase of assets, recoverable from agencies of $2,013 million and accounts receivable of $719 million. These increases were offset by decreases in cash, cash equivalents and temporary investments of $411 million, equity in self–supported Crown corporations and agencies of $394 million and $441 million in other financial assets.
Liabilities increased by $1,786 million from 2017/18. This increase was the result of an increase in self–supported debt of $2,036 million due to investment in government power projects and an increase of $1,293 million in other liabilities, including accounts payable and deferred revenue. These increases were offset by a decrease of $1,543 million in taxpayer–supported debt due to the elimination of government direct operating debt.
Non–financial assets typically represent resources, such as tangible capital assets, that the government can use in the future to provide services. Non–financial assets increased by $2,101 million over 2017/18 representing government’s investment in current year infrastructure spending.
Accumulated Surplus
The accumulated surplus represents current and all prior years’ operating results. In 2018/19, the province had an accumulated surplus of $8,582 million, $1,801 million higher than in 2017/18. The positive operating results of prior years and the current year provide the flexibility to sustain core public services.
2014/15 to 2018/19
20
PROVINCE OF BRITISH COLUMBIA
PUBLIC ACCOUNTS 2018/19
Financial Statement Discussion and Analysis Report
Components of Net Liabilities
Financial Assets
Trend analysis of financial assets provides users with information regarding the amount of resources available to the government that can be converted to cash to meet obligations or fund operations.
| | In Millions | |
| | 2014/15 | | 2015/16 | | 2016/17 | | 2017/18 | | 2018/19 | |
| | Actual | | Actual | | Actual | | Actual | | Actual | |
| | $ | | $ | | $ | | $ | | $ | |
Cash, cash equivalents, temporary investments | | 3,675 | | 3,892 | | 4,232 | | 3,440 | | 3,029 | |
Accounts receivable | | 3,489 | | 3,761 | | 4,163 | | 4,586 | | 5,305 | |
Equity in self–supported Crown corporations and agencies | | 8,254 | | 7,514 | | 7,494 | | 6,111 | | 5,717 | |
Loans for the purchase of assets, recoverable from agencies | | 20,624 | | 22,041 | | 23,809 | | 20,534 | | 22,547 | |
Other financial assets | | 6,603 | | 7,455 | | 7,067 | | 8,412 | | 7,971 | |
Total financial assets | | 42,645 | | 44,663 | | 46,765 | | 43,083 | | 44,569 | |
In 2018/19, financial assets increased by $1,486 million primarily due to an increase in capital loans to Crown corporations and agencies. Recoverable capital loans increased by $2,013 million due to investments in power projects. Equity in self–supported Crown corporations decreased by $394 million related to the loss in earnings recorded by ICBC. The remaining financial assets decreased by $133 million.
Liabilities
Trend analysis of liabilities provides users with information to understand and assess the demands on financial assets and the revenue raising capacity of government.
| | In Millions | |
| | 2014/15 | | 2015/16 | | 2016/17 | | 2017/18 | | 2018/19 | |
| | Actual | | Actual | | Actual | | Actual | | Actual | |
| | $ | | $ | | $ | | $ | | $ | |
Taxpayer–supported debt | | 42,693 | | 44,119 | | 42,390 | | 44,752 | | 43,209 | |
Self–supported debt | | 20,465 | | 21,892 | | 23,699 | | 20,619 | | 22,655 | |
Total financial statement debt | | 63,158 | | 66,011 | | 66,089 | | 65,371 | | 65,864 | |
Accounts payable and other liabilities | | 8,312 | | 8,486 | | 8,898 | | 9,618 | | 10,435 | |
Deferred revenue | | 9,771 | | 9,743 | | 9,525 | | 9,928 | | 10,404 | |
Total liabilities | | 81,241 | | 84,240 | | 84,512 | | 84,917 | | 86,703 | |
In 2018/19, total liabilities increased by $1,786 million. Liabilities are obligations that must be settled at a future date by the transfer or use of assets. Self–supported financial statement debt increased by $2,036 million, while taxpayer–supported financial statement debt decreased in 2018/19 by $1,543 million. Information relating to the government’s debt management can be found in more detail in the analysis of the total provincial debt on page 25. Deferred revenue increased by $476 million and accounts payable and other liabilities increased by $817 million. Deferred revenue represents unearned revenues and restricted contributions that will be recognized as revenue in future periods.
21
PROVINCE OF BRITISH COLUMBIA
PUBLIC ACCOUNTS 2018/19
Financial Statement Discussion and Analysis Report
Non–financial Assets
Trend analysis of non–financial assets provides users with information to assess the management of a government’s infrastructure and long–term non–financial assets.
| | In Millions | |
| | 2014/15 | | 2015/16 | | 2016/17 | | 2017/18 | | 2018/19 | |
| | Actual | | Actual | | Actual | | Actual | | Actual | |
| | $ | | $ | | $ | | $ | | $ | |
Tangible capital assets | | 39,028 | | 40,282 | | 41,303 | | 45,837 | | 47,830 | |
Other non–financial assets | | 2,834 | | 2,724 | | 2,875 | | 2,778 | | 2,886 | |
Total non–financial assets | | 41,862 | | 43,006 | | 44,178 | | 48,615 | | 50,716 | |
Management of non–financial assets has a direct impact on the level and quality of services a government is able to provide to the public. Non–financial assets typically represent resources that government can use in the future to provide services. At March 31, 2019, non–financial assets were $50,716 million which was $2,101 million higher than 2017/18 and $8,854 million higher than fiscal 2014/15. The majority of the province’s non–financial assets represent capital expenditures for tangible capital assets net of amortization. The government has increased its investment in infrastructure spending by $1,993 million, to ensure service potential is available to deliver programs and services in future periods. Capital expenditures are not included on the Consolidated Statement of Operations and have no effect on the current surplus. They reduce future surpluses in the form of amortization expense as the service potential of assets is used to deliver programs and services.
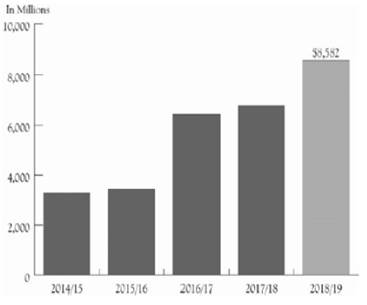
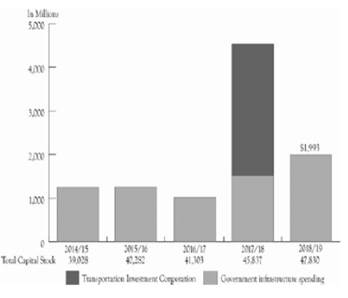
Change in Capital Stock
This measure shows the impact of net changes to the government’s stock of physical capital. Positive amounts demonstrate an investment in infrastructure to replace existing capital and provide service potential in future periods.
The net annual investment in capital was $1,993 million in 2018/19, and $10,052 million since the start of fiscal 2014/15 (including the Transportation Investment Corporation which was fully consolidated in fiscal 2017/18). Total capital stock has also increased steadily over that period which indicates that capital infrastructure is available to continue providing programs and services in future periods.
2014/15 to 2018/19
22
PROVINCE OF BRITISH COLUMBIA
PUBLIC ACCOUNTS 2018/19
Financial Statement Discussion and Analysis Report
Net Liabilities and Accumulated Surplus
| | In Millions | |
| | 2014/15 | | 2015/16 | | 2016/17 | | 2017/18 | | 2018/19 | |
| | Actual | | Actual | | Actual | | Actual | | Actual | |
| | $ | | $ | | $ | | $ | | $ | |
Financial assets | | 42,645 | | 44,663 | | 46,765 | | 43,083 | | 44,569 | |
Less: liabilities | | (81,241 | ) | (84,240 | ) | (84,512 | ) | (84,917 | ) | (86,703 | ) |
Net liabilities | | (38,596 | ) | (39,577 | ) | (37,747 | ) | (41,834 | ) | (42,134 | ) |
Less: non–financial assets | | 41,862 | | 43,006 | | 44,178 | | 48,615 | | 50,716 | |
Accumulated surplus | | 3,266 | | 3,429 | | 6,431 | | 6,781 | | 8,582 | |
Net liabilities increased by $300 million in 2018/19. Liabilities include deferred revenue of $10,404 million which represents unearned revenues and restricted contributions that will be recognized as revenue in future periods.
The financial measure of net liabilities has remained stable while investments in infrastructure have increased resulting in an increase in accumulated surplus. The accumulated surplus of the province was $8,582 million at the end of 2018/19, indicating that the cumulative result of all past annual surpluses and deficits is positive, or that the province remains in a positive net financial position.
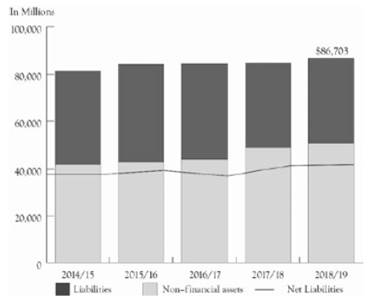
Non–financial Assets as a Portion of Liabilities
The chart provides an indication of what proportion of liabilities are used to fund capital infrastructure as opposed to funding working capital requirements including accounts payable and other operating liabilities, as well as revenue deferred to future periods. Over the past five years, non–financial assets have increased while the measure of net liabilities has remained stable.
2014/15 to 2018/19
23
PROVINCE OF BRITISH COLUMBIA
PUBLIC ACCOUNTS 2018/19
Financial Statement Discussion and Analysis Report
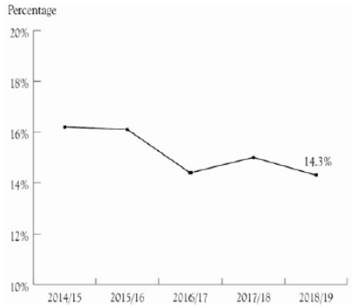
Net Liabilities to GDP
The net liabilities to GDP ratio provides an indication of the province’s ability to maintain existing programs and meet existing creditor requirements without increasing the debt burden on the economy as a whole.
The slight decrease in net liabilities to GDP is the result of net liabilities decreasing over and above the increase in economic growth as represented by GDP in 2018/19. Net liabilities include deferred revenue that will be recognized as revenue in future periods, and obligations to outside parties including accounts payable and debt.
2014/15 to 2018/19
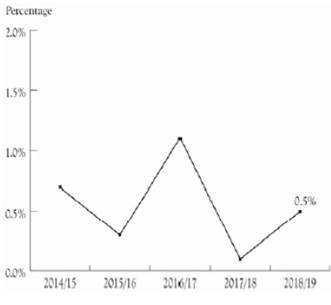
Surplus (Deficit) to GDP
The surplus (deficit) to GDP ratio is an indicator of sustainability that compares the province’s financial results to the overall results of the economy.
Results in the positive range of the chart indicate that the economy is growing faster than net government spending.
2014/15 to 2018/19
24
PROVINCE OF BRITISH COLUMBIA
PUBLIC ACCOUNTS 2018/19
Financial Statement Discussion and Analysis Report
Total Provincial Debt
Total provincial debt is calculated differently than financial statement debt. Analysis of total provincial debt helps users to assess the extent of long–term liabilities and the government’s ability to meet future debt obligations.
| | In Millions | |
| | 2014/15 | | 2015/16 | | 2016/17 | | 2017/18 | | 2018/19 | |
| | Actual | | Actual | | Actual | | Actual | | Actual | |
| | $ | | $ | | $ | | $ | | $ | |
Gross debt | | 63,158 | | 66,011 | | 66,089 | | 65,371 | | 65,864 | |
Less: sinking fund assets | | (977 | ) | (1,580 | ) | (1,087 | ) | (1,348 | ) | (752 | ) |
Third party guarantees and non–guaranteed debt | | 739 | | 820 | | 835 | | 896 | | 850 | |
Total provincial debt | | 62,920 | | 65,251 | | 65,837 | | 64,919 | | 65,962 | |
When reporting to rating agencies, the province adds to its financial statement debt, all debt guarantees and the debt directly incurred by self–supported Crown corporations, reduced by sinking fund assets. This balance is referred to as the total provincial debt.
Total provincial debt is $98 million higher than the amounts reported in the province’s financial statements after deducting sinking funds held to pay down the debt, and including guaranteed debt and the debt of self–supported Crown corporations.
Total provincial debt increased by $1,043 million in 2018/19 to fund capital projects. The debt of self–supported Crown corporations and agencies increased for investments in power projects. Taxpayer–supported debt decreased by $926 million as a result of the elimination of provincial government direct operating debt of $1,156 million and other decreases in taxpayer–supported debt of $778 million. These decreases were offset by increases in debt for BC Transportation Financing Authority of $905 million, health sector of $65 million, and education sector of $38 million.
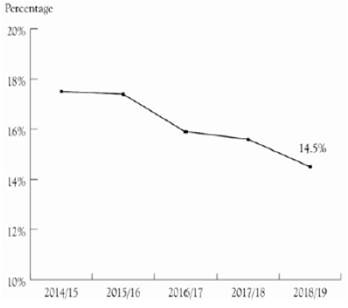
Taxpayer–supported debt to GDP
The ratio of taxpayer–supported debt to GDP is a key measure used by financial analysts and investors to assess a province’s ability to repay debt and is a key measure monitored by the bond rating agencies. A decreasing ratio means that debt is growing slower than the growth of the economy as measured by GDP.
At the end of 2018/19, taxpayer–supported debt to GDP was 14.5%, which was lower than the budgeted level of 15.5% and lower than the results for the past four years.
2014/15 to 2018/19
25
PROVINCE OF BRITISH COLUMBIA
PUBLIC ACCOUNTS 2018/19
Financial Statement Discussion and Analysis Report
Strong Credit Rating
Reflecting the province’s fiscal performance, British Columbia has maintained a strong and stable credit rating with all three credit rating agencies. In 2018/19, Moody’s Investors Service Inc. gave the province an Aaa credit rating (2018: Aaa); Standard and Poor’s gave the province an AAA credit rating (2018: AAA); and Dominion Bond Rating Service gave the province an AA(high) credit rating (2018: AA(high)).
Credit Ratings March 31, 2019
Rating Agency1
| | Moody’s Investors | | | | Dominion Bond | |
Jurisdiction | | Service Inc. | | Standard and Poor’s | | Rating Service | |
British Columbia | | Aaa | | AAA | | AA(high) | |
Alberta | | Aa1 | | A+ | | AA | |
Saskatchewan | | Aaa | | AA | | AA | |
Manitoba | | Aa2 | | A+ | | A(high) | |
Ontario | | Aa3 | | A+ | | AA(low) | |
Quebec | | Aa2 | | AA– | | A(high) | |
New Brunswick | | Aa2 | | A+ | | A(high) | |
Nova Scotia | | Aa2 | | AA– | | A(high) | |
Prince Edward Island | | Aa2 | | A | | A(low) | |
Newfoundland | | Aa3 | | A | | A(low) | |
Canada | | Aaa | | AAA | | AAA | |
1The rating agencies assign letter ratings to borrowers. The major categories, in descending order of credit quality, are: AAA/Aaa; AA/Aa; A; BBB/Baa; BB/Ba; and B. The “1”, “2”, “3”, “high”, “low”, “–”, and “+” modifiers show relative standing within the major categories. For example, AA+ exceeds AA.
A more comprehensive overview of provincial debt, including key debt indicators is located on pages 131–146.
Public Debt Charges to Revenue (the Interest Bite)
The public debt charges to revenue indicator is often referred to as the “interest bite”. This provides users with the percentage of the province’s revenue used to pay interest on debt. The ratio is sensitive to the cost of debt arising from either increasing interest rates or increasing debt, as well as decreases in revenue.
If an increasing proportion of provincial revenue is required to pay interest on provincial debt, less money is available to provide core public services. The interest bite has remained stable over the last five years. In 2018/19, the province spent 3.2 cents of each revenue dollar on interest on the provincial taxpayer–supported debt.
2014/15 to 2018/19

26
PROVINCE OF BRITISH COLUMBIA
PUBLIC ACCOUNTS 2018/19
Financial Statement Discussion and Analysis Report
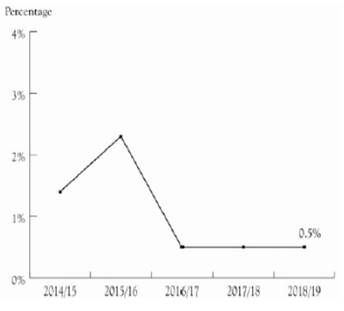
Non–Hedged Foreign Currency Debt to Total Provincial Debt
The ratio of non–hedged foreign currency debt to total provincial debt shows the degree of vulnerability of a government’s public debt position to swings in exchange rates.
Non–hedged foreign currency debt directly offset by instruments in the same foreign currency are considered “natural hedges”. These amounts are excluded from the ratio.
In 2018/19, the province had the equivalent of CAD$303 million in natural hedges.
2014/15 to 2018/19
27
PROVINCE OF BRITISH COLUMBIA
PUBLIC ACCOUNTS 2018/19
Financial Statement Discussion and Analysis Report
Economic Highlights
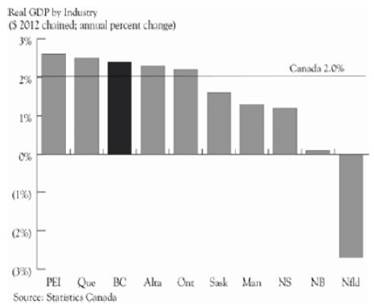
British Columbia’s economy grew by an estimated 2.4% in the 2018 calendar year, the third highest rate among the provinces, according to preliminary GDP by industry data from Statistics Canada. The estimated 2.4% growth for British Columbia in 2018 is higher than the government’s Budget 2019 estimate of 2.2%.
Real Gross Domestic Product in Calendar Year 2018
Growth was led by goods–producing industries (up 3.3%) with gains across most major industries in 2018 Notable increases were observed in mining, quarrying and oil and gas extraction (up 10.5%) largely due to increased natural gas extraction, construction (up 3.1%) and manufacturing (up 2.1%). Total construction expanded, although the pace of growth slowed from the pace observed in 2017. Growth was observed in both residential and non–residential building construction (up 3.7% and 13.2%, respectively), the latter experiencing growth after three consecutive annual declines.
Service–producing industries, which account for just over three–quarters of BC’s GDP, grew by 2.2%. Slower growth was broad–based across most industries. Transportation and warehousing (up 3.8%) and health care and social assistance (up 3.0%) were strong drivers of growth. Real estate and rental and leasing (up 1.5%) also contributed significantly, although growth in the industry has noticeably slowed.
Provincial Comparison
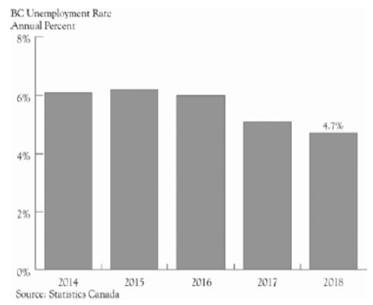
Unemployment Rate
British Columbia’s annual unemployment rate was 4.7% in 2018, a decrease from 5.1% observed in 2017. The unemployment rate in BC in 2018 was lower than the national unemployment rate of 5.8%. The average level of employment in BC increased by 1.1% in 2018, following a 3.7% increase in 2017.
2014 to 2018
28
PROVINCE OF BRITISH COLUMBIA
PUBLIC ACCOUNTS 2018/19
Financial Statement Discussion and Analysis Report
Risks and Uncertainties
The government’s main exposure to risks and uncertainties arises from variables, which the government does not directly control. These include:
· assumptions underlying revenue and Crown corporation forecasts such as economic factors, commodity prices and weather conditions;
· the outcome of litigation, arbitration, and negotiations with third parties;
· potential changes to federal transfer allocations, cost–sharing agreements with the federal government and impacts on the provincial income tax bases arising from federal tax policy and budget changes;
· utilization rates for government services such as health care, children and family services, and income assistance;
· exposure to interest rate fluctuations, foreign exchange rates and credit risk; and
· changes in Canadian generally accepted accounting principles.
The following are the approximate effect of changes in some of the key variables on the surplus:
Key Fiscal Sensitivities | | | | | |
| | | | Annual Fiscal Impact | |
Variable | | Increase Of | | ($ millions) | |
Nominal GDP | | 1% | | $150 to $250 | |
Lumber prices (US$/thousand board feet) | | $50 | | $150 to $1751 | |
Natural gas prices (Cdn$/gigajoule) | | 25 cents | | $10 to $402 | |
US exchange rate (US cents/Cdn$) | | 1 cent | | $(25) to $(50) | |
Interest rates | | 1 percentage point | | $(93) | |
Debt | | $500 million | | $(16) to $(17) | |
1Sensitivity relates to stumpage revenue only.
2Sensitivities can vary significantly, especially at lower prices.
Although the government is unable to directly control these variables, strategies have been implemented to mitigate these risks and uncertainties. The development of taxation, financial and corporate regulatory policy to reinforce British Columbia’s position as an attractive place to invest and create jobs will help offset the increase in competition for investment as a result of globalization of economic and financial markets. As in previous years, the government applied a forecast allowance in the budget to account for risks to revenue, expenditure, Crown corporations’, school districts’, universities’, colleges’, institutes’, and health organizations’ (SUCH sector) forecasts. The use of forecast allowances recognizes the uncertainties in predicting future economic developments.
Risk management in relation to debt is discussed in Note 20 on page 67 of the Notes to the Consolidated Summary Financial Statements.
29
Summary Financial Statements
Province of British Columbia
For the Fiscal Year Ended
March 31, 2019

BRITISH
COLUMBIA
Statement of Responsibility for the Summary Financial Statements of the Government of the Province of British Columbia
Responsibility for the integrity and objectivity of the Summary Financial Statements for the Government of the Province of British Columbia rests with the government. The Comptroller General prepares these financial statements in accordance with the Budget Transparency and Accountability Act (BTAA), which requires generally accepted accounting principles (GAAP) for senior governments in Canada, supported by regulations of Treasury Board under the BTAA. The fiscal year of the government is from April 1 to March 31 of the following year.
To fulfill its accounting and reporting responsibilities, the government maintains financial management and internal control systems. These systems give due consideration to costs, benefits and risks, and are designed to provide reasonable assurance that transactions are properly authorized by the Legislative Assembly, are executed in accordance with prescribed regulations and are properly recorded. This is done to maintain accountability of public money and safeguard the assets and properties of the Province of British Columbia under government administration. The Comptroller General of British Columbia maintains the accounts of British Columbia, a centralized record of the government’s financial transactions, and obtains additional information as required from ministries, Crown corporations, agencies, school districts, universities, colleges, institutes and health organizations to meet accounting and reporting requirements.
The Auditor General of British Columbia provides an independent opinion on the financial statements prepared by the government. The duties of the Auditor General in that respect are contained in section 11 of the Auditor General Act.
Annually, the financial statements are tabled in the legislature as part of the Public Accounts, and are referred to the Select Standing Committee on Public Accounts of the Legislative Assembly. The Select Standing Committee on Public Accounts reports to the Legislative Assembly with the results of its examination and any recommendations it may have with respect to the financial statements and accompanying audit opinions.
Approved on behalf of the Government of the Province of British Columbia:
| /s/ Carole James |
| CAROLE JAMES |
| Chair, Treasury Board |

INDEPENDENT AUDITOR’S REPORT
To the Legislative Assembly of the Province of British Columbia
Qualified Opinion
I have audited the summary financial statements of the Government of the Province of British Columbia (Government) using my staff and resources. The Engagement Leader, Peter Bourne, CPA, CA is responsible for this audit and its performance. The summary financial statements of Government comprise the consolidated statement of financial position at March 31, 2019, and the consolidated statements of operations, change in net liabilities and cash flow for the year then ended, and notes to the financial statements including a summary of significant accounting policies.
In my opinion, except for the effects of the matters described in the Basis for Qualified Opinion section of my report, the summary financial statements present fairly, in all material respects, the financial position of the Government as at March 31, 2019, and the results of its operations, change in its net liabilities, and its cash flows for the year then ended in accordance with Canadian Public Sector Accounting Standards.
Basis for Qualified Opinion
I believe that the audit evidence I have obtained is sufficient and appropriate to provide a basis for my qualified opinion.
I conducted my audit in accordance with Canadian generally accepted auditing standards. My responsibilities under those standards are further described in the Auditor’s Responsibilities for the Audit of the Financial Statements section of my report. I am independent of Government in accordance with the ethical requirements that are relevant to my audit of the summary financial statements in Canada, and I have fulfilled my other ethical responsibilities in accordance with these requirements.
Deferral of revenues
Government’s accounting treatment for funds received from other governments and for externally restricted funds received from non-government sources is to initially record them as deferred revenue (a liability) and then recognize revenue in the statement of operations either on the same basis as the related expenditures occur or, in the case of funds for the purchase or construction of capital assets, to recognize revenue on the same basis as the related assets are amortized.
Under Canadian Public Sector Accounting Standards, Government’s method of accounting for contributions is only appropriate in circumstances where the funding meets the definition of a
LEGISLATIVE ASSEMBLY OF THE PROVINCE OF BRITISH COLUMBIA
Independent Auditor’s Report
liability. Otherwise, the appropriate accounting treatment is to record contributions as revenue when they are received or receivable. In my opinion, certain contributions from others do not meet the definition of a liability, and as such Government’s method of accounting for those contributions represents a departure from Canadian Public Sector Accounting Standards.
This departure has existed since the inception of the standard, which applies to periods beginning on or after April 1, 2012. Had Government made an adjustment for this departure in the current year, the liability for deferred revenue as at March 31, 2019 would have been lower by $5,739 million, contribution revenue, surplus for the year and accumulated surplus would have been higher by $5,739 million, and net liabilities would have been lower by $5,739 million.
Use of rate-regulated accounting
As discussed in my previous year’s opinion on the March 31, 2018 summary financial statements, BC Hydro did not meet the requirements of a rate-regulated entity. Because the framework for the use of rate-regulated accounting was not in place, the accounting for BC Hydro’s results in the summary financial statements was incorrect, and this constituted a departure from Canadian Public Sector Accounting Standards. This caused me to modify my opinion on the summary financial statements for that year.
For the year ending March 31, 2019, BC Hydro has implemented International Financial Reporting Standards (IFRS), including IFRS 14 (Regulatory Deferral Accounts). Government has made a number of changes to the regulatory framework, giving the regulator the ability to influence costs and rates. I believe the changes made to the regulatory framework are sufficient to allow me to remove my qualification on the use of rate-regulated accounting for the year ending March 31, 2019. However, my opinion is modified as the regulatory assets and liabilities are incorrectly reflected in the summary financial statements in the comparative figures as at and for the year ended March 31, 2018.
Other Accompanying Information
Government is responsible for the information they reported in the annual Public Accounts report.
My opinion on the summary financial statements does not cover other information accompanying the financial statements and, except for my independent auditor’s opinion on the debt-related statements, I do not express any form of assurance conclusion thereon.
In connection with my audit of the summary financial statements, my responsibility is to read other information and, in doing so, consider whether the other information is materially inconsistent with the summary financial statements or my knowledge obtained during the audit or otherwise appears to be materially misstated.

LEGISLATIVE ASSEMBLY OF THE PROVINCE OF BRITISH COLUMBIA
Independent Auditor’s Report
If, based on the work I have performed on the other information, I conclude that there is a material misstatement therein, I am required to report that fact in this auditor’s report. As described in the Basis for Qualified Opinion section above, I believe there are material misstatements in Government’s accounting for the deferral of revenues. I have concluded that the other information is materially misstated for the same reason with respect to the amounts or other items in the annual report affected by this departure from Canadian Public Sector Accounting Standards.
Responsibilities of Treasury Board for the Summary Financial Statements
The Treasury Board of British Columbia is responsible for the oversight of the financial reporting process including the approval of significant accounting policies. The Comptroller General of British Columbia (Comptroller General) is responsible for the preparation and fair presentation of the summary financial statements in accordance with the Budget Transparency and Accountability Act (BTAA), and for such internal control as the Comptroller General determines is necessary to enable the preparation of the summary financial statements that are free from material misstatement, whether due to fraud or error.
In preparing the summary financial statements, the Comptroller General is responsible for assessing Government’s ability to continue as a going concern, disclosing, as applicable, matters related to going concern and using the going concern basis of accounting when the Government will continue its operations for the foreseeable future.
Auditor’s Responsibilities for the Audit of the Financial Statements
My objectives are to obtain reasonable assurance about whether the summary financial statements as a whole are free from material misstatement, whether due to fraud or error, and to issue an auditor’s report that includes my opinion in accordance with generally accepted accounting principles, being Public Sector Accounting Standards for senior governments in Canada. Reasonable assurance is a high level of assurance, but is not a guarantee that an audit conducted in accordance with Canadian generally accepted auditing standards will always detect a material misstatement, when it exists. Misstatements can arise from fraud or error and are considered material if, individually or in aggregate, they could reasonably be expected to influence the economic decision of users taken on the basis of these financial statements.
As part of an audit in accordance with Canadian generally accepted auditing standards, I exercise professional judgment and maintain professional skepticism throughout the audit. I also:
· Identify and assess the risks of material misstatement of the summary financial statements, whether due to fraud or error, design and perform audit procedures responsive to those risks, and obtain audit evidence that is sufficient and appropriate to provide a basis for my opinion. The risk of not detecting a material misstatement resulting from fraud is higher than one resulting from error, as fraud may involve collusion, forgery, intentional omissions, misrepresentations, or the override of internal control.

LEGISLATIVE ASSEMBLY OF THE PROVINCE OF BRITISH COLUMBIA
Independent Auditor’s Report
· Obtain an understanding of internal control relevant to the audit in order to design audit procedures that are appropriate in the circumstances, but not for the purpose of expressing an opinion on the effectiveness of Government’s internal control.
· Evaluate the appropriateness of accounting policies used and the reasonableness of accounting estimates and related disclosures made by the Comptroller General.
· Conclude on the appropriateness of the Comptroller General’s use of the going concern basis of accounting and, based on the audit evidence obtained, whether a material uncertainty exists related to events or conditions that may cast significant doubt on Government’s ability to continue as a going concern. If I conclude that a material uncertainty exists, I am required to draw attention in my auditor’s report to the related disclosures in the summary financial statements or, if such disclosures are inadequate, to modify my opinion. My conclusions are based on the audit evidence obtained up to the date of my auditor’s report. However, future events or conditions may cause Government to cease to continue as a going concern.
· Evaluate the overall presentation, structure and content of the summary financial statements, including the disclosures, and whether the summary financial statements represent the underlying transactions and events in a manner that achieves fair presentation.
The audit of the summary financial statements is a group audit engagement. As such I also obtain sufficient appropriate audit evidence regarding the financial information of the entities or business activities within the group to express an opinion on the summary financial statements. I am responsible for the direction, supervision and performance of the group audit and I remain solely responsible for my audit opinion.
I communicate with the Chair of Treasury Board regarding, among other matters, the planned scope and timing of the audit and significant audit findings, including any significant deficiencies in internal control that I identify during my audit.
I also provide the Chair of Treasury Board with a statement that I have complied with relevant ethical requirements regarding independence, and to communicate with them all relationships and other matters that may reasonably be thought to bear on my independence, and where applicable, related safeguards.
| /s/ Carol Bellringer |
Victoria, British Columbia, Canada | Carol Bellringer, FCPA, FCA |
June 28, 2019 | Auditor General |
PROVINCE OF BRITISH COLUMBIA
PUBLIC ACCOUNTS 2018/19
Summary Financial Statements
Consolidated Statement of Financial Position
as at March 31, 2019
| | | | In Millions | |
| | Note | | 2019 | | 2018 | |
| | | | $ | | $ | |
Financial Assets | | | | | | | |
Cash and cash equivalents | | | | 2,598 | | 2,969 | |
Temporary investments | | | | 431 | | 471 | |
Accounts receivable | | 3 | | 5,305 | | 4,586 | |
Inventories for resale | | 4 | | 77 | | 76 | |
Due from other governments | | 5 | | 1,273 | | 1,425 | |
Due from self-supported Crown corporations and agencies | | 6 | | 493 | | 514 | |
Equity in self-supported Crown corporations and agencies | | 7 | | 5,717 | | 6,111 | |
Loans, advances and mortgages receivable | | 8 | | 2,373 | | 2,318 | |
Other investments | | 9 | | 3,003 | | 2,731 | |
Sinking fund investments | | 10 | | 752 | | 1,348 | |
Loans for purchase of assets, recoverable from agencies | | 11 | | 22,547 | | 20,534 | |
| | | | 44,569 | | 43,083 | |
Liabilities | | | | | | | |
Accounts payable and accrued liabilities | | 12 | | 7,299 | | 6,486 | |
Employee future benefits | | 13 | | 2,449 | | 2,370 | |
Due to other governments | | 14 | | 544 | | 564 | |
Due to Crown corporations, agencies and trust funds | | 15 | | 78 | | 79 | |
Deferred revenue | | 16 | | 10,404 | | 9,928 | |
Employee pension plans | | 17 | | 65 | | 119 | |
Taxpayer-supported debt | | 18 | | 43,209 | | 44,752 | |
Self-supported debt | | 19 | | 22,655 | | 20,619 | |
| | | | 86,703 | | 84,917 | |
Net assets (liabilities) | | 21 | | (42,134 | ) | (41,834 | ) |
| | | | | | | |
Non–financial Assets | | | | | | | |
Tangible capital assets | | 22 | | 47,830 | | 45,837 | |
Restricted assets | | 23 | | 1,834 | | 1,768 | |
Prepaid program costs | | 24 | | 847 | | 768 | |
Other assets | | 25 | | 205 | | 242 | |
| | | | 50,716 | | 48,615 | |
Accumulated surplus (deficit) | | 26 | | 8,582 | | 6,781 | |
| | | | | | | |
Measurement uncertainty | | 2 | | | | | |
Contingent assets and contractual rights | | 27 | | | | | |
Contingent liabilities and contractual obligations | | 28 | | | | | |
Subsequent events | | 39 | | | | | |
The accompanying notes and supplementary statements are an integral part of these financial statements.
Prepared in accordance with Canadian generally accepted accounting principles.
| /s/ Carl Fischer |
| CARL FISCHER |
| Comptroller General |
39
PROVINCE OF BRITISH COLUMBIA
PUBLIC ACCOUNTS 2018/19
Summary Financial Statements
Consolidated Statement of Operations
for the Fiscal Year Ended March 31, 2019
| | In Millions | |
| | 2019 | | 2018 | |
| | Estimates | | | | | |
| | (Note 34) | | Actual | | Actual | |
| | $ | | $ | | $ | |
Revenue | | | | | | | |
Taxation (Note29) | | 30,592 | | 32,714 | | 28,321 | |
Contributions from the federal government | | 8,930 | | 9,052 | | 9,055 | |
Fees and licenses | | 5,363 | | 5,593 | | 6,249 | |
Miscellaneous | | 3,152 | | 3,413 | | 3,543 | |
Net earnings of self–supported Crown corporations and agencies (Note 7) | | 2,564 | | 2,005 | | 1,056 | |
Natural resources (Note 30) | | 2,413 | | 3,108 | | 2,695 | |
Investment income | | 1,179 | | 1,243 | | 1,101 | |
| | 54,193 | | 57,128 | | 52,020 | |
Expense (Note 31) | | | | | | | |
Health | | 21,651 | | 22,151 | | 20,927 | |
Education | | 13,897 | | 14,085 | | 13,091 | |
Social services | | 5,317 | | 5,343 | | 4,737 | |
Interest | | 2,739 | | 2,684 | | 2,623 | |
Natural resources and economic development | | 2,433 | | 3,825 | | 3,374 | |
Other | | 2,367 | | 1,810 | | 1,553 | |
Transportation | | 2,134 | | 2,021 | | 1,931 | |
Protection of persons and property | | 1,650 | | 2,004 | | 1,930 | |
General government | | 1,436 | | 1,670 | | 1,540 | |
| | 53,624 | | 55,593 | | 51,706 | |
Surplus (deficit) for the year before unusual items | | 569 | | 1,535 | | 314 | |
Forecast allowance | | (350 | ) | | | | |
Surplus (deficit) for the year | | 219 | | 1,535 | | 314 | |
| | | | | | | |
Accumulated surplus (deficit)—beginning of year as restated (Note 26) | | | | 7,016 | | 6,702 | |
Accumulated surplus (deficit)—before other comprehensive income | | | | 8,551 | | 7,016 | |
Accumulated other comprehensive income from self–supported Crown corporations and agencies (see page 99)—beginning of year | | | | (235 | ) | (271 | ) |
Other comprehensive income from self–supported Crown corporations and agencies (see page 99) | | | | 266 | | 36 | |
Accumulated other comprehensive income from self–supported Crown Corporation and agencies (see page 99)—end of year | | | | 31 | | (235 | ) |
Accumulated surplus(deficit)—end of year | | | | 8,582 | | 6,781 | |
The accompanying notes and supplementary statements are an integral part of these financial statements.
40
PROVINCE OF BRITISH COLUMBIA
PUBLIC ACCOUNTS 2018/19
Summary Financial Statements
Consolidated Statement of Change in Net Liabilities
for the Fiscal Year Ended March 31, 2019
| | In Millions | |
| | 2019 | | 2018 | |
| | Estimates | | Actual | | Actual | |
| | $ | | $ | | $ | |
Surplus (deficit) for the year | | 219 | | 1,535 | | 314 | |
Effect of change in tangible capital assets: | | | | | | | |
Acquisition of tangible capital assets | | (5,174 | ) | (4,452 | ) | (3,908 | ) |
(Gain) or loss on sale of tangible capital assets | | (94 | ) | (19 | ) | (286 | ) |
Amortization of tangible capital assets | | 2,380 | | 2,367 | | 2,250 | |
Disposals and valuation adjustments | | 57 | | 111 | | (2,590 | ) |
| | (2,831 | ) | (1,993 | ) | (4,534 | ) |
Effect of change in: | | | | | | | |
Restricted assets | | (54 | ) | (66 | ) | (73 | ) |
Prepaid program costs | | (1 | ) | (79 | ) | 213 | |
Other assets | | 21 | | 37 | | (43 | ) |
| | (34 | ) | (108 | ) | 97 | |
Effect of self–supported Crown corporations’ and agencies’ other comprehensive income | | 227 | | 266 | | 36 | |
(Increase) in net liabilities | | (2,419 | ) | (300 | ) | (4,087 | ) |
Net (liabilities)—beginning of year | | (42,324 | ) | (41,834 | ) | (37,747 | ) |
Net (liabilities)—end of year (Note 21) | | (44,743 | ) | (42,134 | ) | (41,834 | ) |
The accompanying notes and supplementary statements are an integral part of these financial statements.
41
PROVINCE OF BRITISH COLUMBIA
PUBLIC ACCOUNTS 2018/19
Summary Financial Statements
Consolidated Statement of Cash Flow
for the Fiscal Year Ended March 31, 2019
| | In Millions | |
| | 2019 | | 2018 | |
| | Receipts | | Disbursements | | Net | | Net | |
| | $ | | $ | | $ | | $ | |
Operating Transactions | | | | | | | | | |
Surplus (deficit) for the year1 | | | | | | 1,535 | | 314 | |
Non–cash items included in surplus (deficit): | | | | | | | | | |
Amortization of tangible capital assets | | | | | | 2,367 | | 2,250 | |
Amortization of public debt deferred revenue and deferred charges | | | | | | 31 | | 204 | |
Concessionary loan adjustments increase (decrease) | | | | | | 208 | | (1 | ) |
(Gain) or loss on sale of tangible capital assets | | | | | | (19 | ) | (286 | ) |
Valuation adjustment | | | | | | 207 | | 238 | |
Net earnings of self–supported Crown corporations and agencies | | | | | | (2,005 | ) | (1,056 | ) |
Unrealized gain on transfer of assets | | | | | | 65 | | | |
Reclassification of self–supported status | | | | | | | | 179 | |
Change in self–supported opening unremitted | | | | | | (93 | ) | | |
Temporary investments decrease (increase) | | | | | | 40 | | (47 | ) |
Accounts receivable (increase) | | | | | | (875 | ) | (552 | ) |
Due from other governments decrease (increase) | | | | | | 152 | | (416 | ) |
Due from self–supported Crown corporations and agencies decrease (increase) | | | | | | 21 | | (218 | ) |
Accounts payable and accrued liabilities increase | | | | | | 813 | | 391 | |
Employee future benefits increase | | | | | | 79 | | 298 | |
Due to other governments (decrease) increase | | | | | | (20 | ) | 78 | |
Due to Crown corporations, agencies and funds (decrease) | | | | | | (1 | ) | (6 | ) |
Employee pension plan (decrease) | | | | | | (54 | ) | (68 | ) |
Items applicable to future operations increase | | | | | | 436 | | 625 | |
Contributions from self–supported Crown corporations and agencies | | | | | | 2,694 | | 2,830 | |
Cash derived from operations | | | | | | 5,581 | | 4,757 | |
| | | | | | | | | |
Capital Transactions | | | | | | | | | |
Tangible capital assets dispositions (acquisitions) | | 73 | | (4,452 | ) | (4,379 | ) | (3,531 | ) |
Cash (used for) capital | | 73 | | (4,452 | ) | (4,379 | ) | (3,531 | ) |
| | | | | | | | | |
Investment Transactions | | | | | | | | | |
Investment in self–supported Crown corporations and agencies | | | | (1 | ) | (1 | ) | (1 | ) |
Loans, advances and mortgages receivable (issues) | | 225 | | (501 | ) | (276 | ) | (174 | ) |
Other investments—net (increase) | | | | (272 | ) | (272 | ) | (286 | ) |
Restricted assets—net (increase) | | | | (66 | ) | (66 | ) | (73 | ) |
Sinking fund investments—net decrease (increase) | | 593 | | (32 | ) | 561 | | (221 | ) |
Cash (used for) investments | | 818 | | (872 | ) | (54 | ) | (755 | ) |
Sub–total cash excess | | | | | | 1,148 | | 471 | |
42
PROVINCE OF BRITISH COLUMBIA
PUBLIC ACCOUNTS 2018/19
Summary Financial Statements
Consolidated Statement of Cash Flow—Continued
for the Fiscal Year Ended March 31, 2019
| | In Millions | |
| | 2019 | | 2018 | |
| | Receipts | | Disbursements | | Net | | Net | |
| | $ | | $ | | $ | | $ | |
| | | | | | | | | |
Sub–total cash excess carried forward from previous page | | | | | | 1,148 | | 471 | |
| | | | | | | | | |
Financing Transactions2 | | | | | | | | | |
Public debt increase (decrease) | | 22,345 | | (21,853 | ) | 492 | | (4,405 | ) |
(Used for) derived from purchase of assets, recoverable from agencies | | 9,497 | | (11,508 | ) | (2,011 | ) | 3,095 | |
Cash (used for) financing | | 31,842 | | (33,361 | ) | (1,519 | ) | (1,310 | ) |
(Decrease) in cash and cash equivalents | | | | | | (371 | ) | (839 | ) |
Cash and cash equivalents—beginning of year | | | | | | 2,969 | | 3,808 | |
Cash and cash equivalents—end of year | | | | | | 2,598 | | 2,969 | |
| | | | | | | | | |
Cash and cash equivalents are made up of: | | | | | | | | | |
Cash | | | | | | 1,997 | | 2,243 | |
Cash equivalents | | | | | | 601 | | 726 | |
| | | | | | 2,598 | | 2,969 | |
1Interest received during the year was $1,246 million (2018: $1,138 million). Interest paid during the year was $2,695 million (2018: $2,636 million). Interest received includes interest income from the Statement of Operations in the amount of $1,243 million (2018: $1,101 million) plus the change in accrued interest receivable in the amount of $3 million (2018: $37 million). Interest paid includes interest expense from the Statement of Operations in the amount of $2,684 million (2018: $2,623 million) plus the change in accrued interest payable in the amount of $11 million (2018: $13 million).
2Financing transaction receipts are from debt issues and disbursements are for debt repayments.
The accompanying notes and supplementary statements are an integral part of these financial statements.
43
PROVINCE OF BRITISH COLUMBIA
PUBLIC ACCOUNTS 2018/19
Notes to Consolidated Summary Financial Statements
for the Fiscal Year Ended March 31, 2019
1. Significant Accounting Policies
(a) BASIS OF ACCOUNTING
The government’s Summary Financial Statements are prepared in accordance with the Budget Transparency and Accountability Act (BTAA), which requires generally accepted accounting principles (GAAP) for senior governments in Canada, supported by regulations of Treasury Board under the BTAA.
(b) REPORTING ENTITY
These financial statements include the accounts of organizations that meet the criteria of control (by the province) as established under Canadian Public Sector Accounting Standards. The reporting entity also includes government partnerships.
A list of organizations included in these consolidated financial statements may be found on pages 85 – 87. Trusts administered by government or government organizations are excluded from the reporting entity.
(c) PRINCIPLES OF CONSOLIDATION
Taxpayer–supported Crown corporations, agencies, and the school districts, universities, colleges, institutes, health organizations (SUCH) and the Consolidated Revenue Fund (CRF) are consolidated using the full consolidation method. The government’s interests in government partnerships are recorded on a proportional consolidation basis. Self–supported Crown corporations, agencies, entities and government business partnerships are consolidated using the modified equity basis of consolidation.
Organizations are reviewed annually to determine whether they can be expected to meet the definition of self–supported over their normal course of operations. In determining whether organizations will be able to maintain their operations and meet their liabilities from revenues received from sources outside of the government reporting entity, the following factors are considered as they apply:
i) The organization’s history of maintaining its operations and meeting its liabilities;
ii) Whether the organization would continue to maintain its operations and meet its liabilities without relying on sales to, or subsidies in cash or kind from, the government reporting entity;
iii) Past, present and future economic conditions within which the organization operates; and
iv) Whether the organization has realistic and specific plans that show how it expects to be able to maintain its operations and meet its liabilities in the future.
The status of self–supported organizations is not changed in response to financial results which are reasonably expected to be temporary in nature. Organizations are classified as self–supported on establishment and during a start up period if they are reasonably expected to meet the definition of self–supported in their normal course of operations.
The definitions of these consolidation methods can be found on page 147.
Adjustments are made for Crown corporations, agencies and entities whose fiscal year ends are different from the government’s fiscal year end of March 31. These Crown corporations, agencies and entities consist of the British Columbia Assessment Authority (December 31) and all school districts (June 30).
44
PROVINCE OF BRITISH COLUMBIA
PUBLIC ACCOUNTS 2018/19
Notes to Consolidated Summary Financial Statements
for the Fiscal Year Ended March 31, 2019—Continued
1. Significant Accounting Policies—Continued
Statistics Canada’s Financial Management System for Government Statistics provides the guidance for establishing segment disclosure and function reporting. The Consolidated Statement of Financial Position by Sector and the Consolidated Statement of Operations by Sector are found on pages 88 – 95. These statements include the operations of the CRF, taxpayer–supported Crown corporations and agencies, and SUCH sector organizations. Each taxpayer–supported Crown corporation, agency and SUCH sector organization is assigned to a sector based on its major activity. Sectors are identified using functions. The nature of each function is described in greater detail under Note 1(d) Classification by Sector.
(d) SPECIFIC ACCOUNTING POLICIES
Classification by Sector
The province uses the following sectors: health, education, social services, natural resources and economic development, protection of persons and property, transportation, general government, debt servicing and other.
The health sector includes the provincial health care system. It includes providing medical, hospital and preventive care, and other health–related services such as laboratories and diagnostic facilities.
The education sector includes education services. It includes elementary, secondary, and post–secondary schools. It also includes other education services such as programs to upgrade the skills of individuals and to provide apprenticeship training.
The social services sector includes outlays that the province made to help disadvantaged individuals and families overcome obstacles and circumstances which threaten their well–being. It includes counselling and rehabilitation services, transfer payments to individuals who are unable to lead a normal life due to a physical or mental disability, and services and goods provided by the province to the elderly.
The natural resources and economic development sector includes the promotion and development of industries, as well as the development and conservation of the natural resources on which these industries depend. It includes regulating the various industrial activities that are carried on in the province, as well as research related to resource conservation.
The protection of persons and property sector includes the protection of persons and property from negligence, abuse and crime. It includes policing, operating and maintaining courts of law and correctional facilities. It includes services related to new immigrants. It also includes negotiations to resolve land, resources, governance and jurisdictional issues with First Nations.
The transportation sector includes the operation and maintenance of transportation systems. This includes highway infrastructure, other road systems and public transit.
The general government sector is composed of three sub–categories. These are general administration, executive and legislature, and other general government services. General administration includes central accounting, budgeting, tax administration and collection, and other centralized administrative services. Executive and legislature includes the political, law enactment and constitutional activities of the province.
The debt servicing sector represents the financial impacts of activities related to management of public debt.
The other sector consists of activities, such as housing and culture, which cannot be allocated to any of the specifically described sector classifications.
Revenue
All revenue is recorded on an accrual basis. For corporate income tax, the cash received from the federal government is used as the basis for estimating the tax revenue. Annual tax revenues also include adjustments between the estimated revenues of previous years and actual amounts, as well as revenues from reassessments relating to prior years. Revenues do not include estimates of unreported taxes, or the impact of future reassessments that cannot be reliably determined.
45
PROVINCE OF BRITISH COLUMBIA
PUBLIC ACCOUNTS 2018/19
Notes to Consolidated Summary Financial Statements
for the Fiscal Year Ended March 31, 2019—Continued
1. Significant Accounting Policies—Continued
Personal income tax revenue is accrued in the year earned based on estimates of household and taxable income. The revenue reported in the fiscal year is based on a proration of the calendar year estimates.
Direct taxes, such as sales, fuel, carbon and tobacco, are recorded during the period in which the taxable event occurs and when authorized by legislation. Property tax revenues are recorded based on a pro–ration of actual property tax billings for each of the calendar years that comprise the fiscal year.
Taxes payable by the province in the normal course of operations are reported on the gross basis, as are the related expenses.
Tax concessions are accrued on the same basis as the associated tax revenues and reduce gross taxation revenue, but are not considered valuation allowances.
Royalty revenue is reported net of allowable credits integral to determining the amount of royalty. Amounts are reported as revenue when received or receivable.
Government transfers are recognized as revenues in the period during which the transfer is authorized and any eligibility criteria are met. Government transfers are deferred if they are restricted through stipulations for specific programs such as health transfers.
Expense
The cost of all goods consumed and services received during the year is expensed. Interest expense includes debt servicing costs such as amortization of discounts and premiums, foreign exchange gains and losses, and issue costs.
Pension expense is calculated as the cost of pension benefits earned by employees during the year, interest on the pension benefits liability, net of pension plan assets, and amortization of the government’s share of any experience gains or losses, less contributions made by members. The estimated total cost of government’s share of plan amendments related to past service is expensed in the year the plan is amended.
Government transfers include grants, entitlements and transfers under agreements, as defined in the definitions on page 148. Government transfers are recognized as expenses in the period in which the events giving rise to the transfer occurred, as long as the transfer is authorized, eligibility criteria have been met and a reasonable estimate of the amount can be made.
Assets
Assets are recorded to the extent they represent cash and claims upon outside parties, items held for resale to outside parties, prepaid expenses, deferred charges or tangible capital assets acquired as a result of events and transactions prior to year end.
Financial Assets
Cash and cash equivalents include cash on hand, demand deposits and short–term highly liquid investments that are readily convertible to known amounts of cash. These are subject to an insignificant risk of changes in value. These short–term investments generally have a maturity of three months or less and are held for the purpose of meeting short–term cash commitments rather than for investing.
Temporary investments and Warehouse Program investments include short–term investments recorded at the lower of cost or market value. The fair values of short–term investments approximate their carrying values because of the short–term maturity of these instruments. Warehouse Program investments are short–term investments related to specific borrowings in advance of requirements under the Warehouse Borrowing Program.
Inventories for resale are expected to be sold within one year and include property that has been purchased, or for which development costs have been incurred, and that is held for ultimate resale or lease to outside parties. Inventories for resale are recorded at the lower of cost or net realizable value.
46
PROVINCE OF BRITISH COLUMBIA
PUBLIC ACCOUNTS 2018/19
Notes to Consolidated Summary Financial Statements
for the Fiscal Year Ended March 31, 2019—Continued
1. Significant Accounting Policies—Continued
Equity in self–supported Crown corporations and agencies represents the province’s investment (including long–term advances) in those self–supported Crown corporations and agencies at cost, increases/decreases in the investees’ net assets, and other comprehensive income.
Loans for purchase of assets recoverable from agencies are recorded at maturity value, less unamortized premium or discount, deferred foreign exchange gains or losses and sinking fund balances. Premium/discount is amortized on a constant yield basis.
Loans and advances are recorded at cost less adjustment for any prolonged impairment in value. Mortgages receivable are recorded at the principal amount less valuation allowance, are secured by real estate and are repayable over periods ranging up to thirty–five years. Concessionary loans and mortgages are recorded at net present value at issue, and related present value discounts are expensed. Valuation allowances are made when collectibility is considered doubtful. Interest is accrued on loans receivable only when collection is certain. Otherwise, it is recognized on the cash basis.
Other investments are recorded at the cost of acquisition, which may be adjusted by attributed income. Valuation adjustments are made when the value of investments is impaired.
Sinking fund investments are cash and marketable securities held specifically for the purpose of repaying outstanding debt at maturity. Sinking fund investments are recorded at the cost of acquisition.
Tangible Capital Assets
Tangible capital assets are recorded at historical cost, plus asset retirement obligations, less accumulated amortization. The recorded cost, less the residual value, is generally amortized over the estimated useful lives of the assets on a straight–line basis.
All significant tangible capital assets of government organizations and operations have been capitalized. Intangible assets and items inherited by right of the Crown, such as forest, water and mineral resources, are not recognized in these financial statements. Crown land is capitalized at a nominal value of one dollar.
The value of collections (e.g. artifacts, specimens and documents) has been excluded from the Statement of Financial Position. When collections are purchased, these items are expensed.
Liabilities
All liabilities are recorded to the extent they represent claims payable to outside parties as a result of events and transactions prior to year end. This includes probable losses on loan guarantees issued by the province, contingent liabilities (when it is likely a liability exists and the amount of the liability can be reasonably determined on an individual or portfolio basis) and unfunded pension liabilities. Liabilities are not recorded for tax concessions or royalty credits which are integral in determining the amount of revenue.
Guaranteed debt includes guarantees by the Minister of Finance, made through specific agreements or legislation, to repay promissory notes, bank loans, lines of credit, mortgages and other securities. Loss provisions on guaranteed debt are recorded when it is likely that a loss will occur. The amount of the loss provision represents the best estimate of future payments less recoveries. The loss provision is recorded as a liability and an expense in the year determined and is adjusted as necessary to ensure it equals the expected payout of the guarantee.
47
PROVINCE OF BRITISH COLUMBIA
PUBLIC ACCOUNTS 2018/19
Notes to Consolidated Summary Financial Statements
for the Fiscal Year Ended March 31, 2019—Continued
1. Significant Accounting Policies—Continued
Employee Pension Plans
The province accounts for employee pension plans by recognizing a liability and an expense in the reporting period in which the employee has provided service. The amount is calculated using the accrued benefit actuarial cost method. Where plans are in a net asset position and Joint Trusteeship Agreements restrict access to the assets, the province records the value of plan net assets as nil. The province records a liability for its share where plans are in a net obligation position. Changes in net liabilities/assets, which arise as a result of actuarial gains and losses, are amortized on a straight–line basis over the average remaining service period of employees active at the date of the adjustments. Past service costs from plan amendments are recognized in full in the year of the amendment.
Unfunded pension liabilities of the Members of the Legislative Assembly Superannuation Account represent the terminal funding that would be required from the province for the difference between the present value of the obligations for future benefit entitlements and the amount of funds available in the account.
Public Debt
Public debt represents the direct debt obligations of the Province of British Columbia, including borrowings incurred for government operating purposes, the acquisition of capital assets, re–lending to authorized government bodies and borrowings in advance of future requirements under the Warehouse Borrowing Program. Public debt consists of short–term promissory notes, notes, bonds and debentures, bank loans, capital leases and mortgages payable. These obligations are recorded at principal less unamortized premium or discount and unrealized foreign exchange gains or losses.
Public debt is reported under two categories:
(i) Taxpayer–supported debt—includes direct debt used for government operating and capital purposes, the debt of those Crown corporations, agencies and SUCH sector entities who require an operating or debt servicing subsidy from the provincial government, and the debt of an entity that is fully consolidated within these financial statements.
(ii) Self–supported debt—includes the portion of debt of self–supported organizations and entities that has been borrowed through the government’s fiscal agency loan program. It does not include all debt of self–supported organizations as these entities are consolidated on the modified equity basis. Self–supported organizations fully fund their operations and debt from revenue generated through the sale of goods and/or services at commercial rates to buyers that are outside the government reporting entity. Self–supported debt includes debt of the Warehouse Borrowing Program.
Debt premium/discount is amortized on a constant yield basis. Unamortized premium/discount on bonds called and refinanced is amortized over the remaining life of the old debt or the life of the new debt, whichever is shorter.
Foreign Currency Translation
Monetary assets and liabilities denominated in foreign currencies are translated to Canadian dollars at the exchange rate prevailing at year end. Foreign currency transactions are translated at the exchange rate prevailing at the date of the transaction unless hedged by forward contracts that specify the rate of exchange. Adjustments to revenue or expense transactions arising as a result of foreign currency translation are credited or charged to operations at the time the adjustments arise. Unrealized foreign currency gains and losses on long–term, fixed–term monetary assets and liabilities are reported as a component of sinking funds, public debt and loans for purchase of assets recoverable from agencies, and amortized over the remaining terms of the related items on a straight–line basis. Non–monetary assets and liabilities are translated at historical rates of exchange.
48
PROVINCE OF BRITISH COLUMBIA
PUBLIC ACCOUNTS 2018/19
Notes to Consolidated Summary Financial Statements
for the Fiscal Year Ended March 31, 2019—Continued
1. Significant Accounting Policies—Continued
Derivative Financial Instruments
The province is a party to financial instruments with off–balance sheet risk due to fluctuations in foreign currency exchange rates, interest rate fluctuations and counterparty default on financial obligations. The province does not use derivative financial instruments for speculative purposes. Off–balance sheet position data is given in the form of nominal principal amounts outstanding. Amounts earned and expenses incurred under swaps are recognized and offset against the related interest expense. Gains and losses on terminated derivative contracts are deferred and amortized over the remaining term of the contract or the term of the related debt.
Other Comprehensive Income
Any recognition of other comprehensive income for self–supported Crown corporations has been reflected in the equity in self–supported Crown corporations and agencies, and in the accumulated surplus (deficit).
Asset Retirement Obligations
The province recognizes asset retirement obligations where a reasonable estimate of the fair value of the obligation and the future settlement date of the retirement of the asset can be determined. The associated retirement costs are capitalized as part of the assets’ carrying value and amortized over the assets’ useful lives. Legal liabilities may exist for the removal and disposal of asbestos within buildings that will undergo major renovations or demolition. The fair value of the liability for asbestos removal or disposal will be recognized in the period in which it is incurred if a reasonable estimate of fair value can be made.
2. Measurement Uncertainty
The preparation of financial statements requires the province to make estimates and assumptions that affect the amounts of assets, liabilities, revenues and expenses during the reporting period. Uncertainty in the determination of these amounts is known as measurement uncertainty.
Some of the more significant estimates used in these financial statements affect the accrual of tax revenues, Canada Health Transfer and Canada Social Transfer entitlements, obligations for pension obligations and other employee future benefits, accruals for environmental obligations, future payments related to contingent liabilities, and valuation allowances for loans, investment and advances. Actual results could differ from estimates. For many common financial statement items, such as accounts payable and allowances for doubtful accounts, measurement uncertainty is inherent but inestimable.
A provision for environmental clean–up is included in accounts payable and accrued liabilities. The provision is subject to a high degree of measurement uncertainty because the existence and extent of contamination, the responsibility for clean–up, and the timing and cost of remediation cannot be reliably estimated in all circumstances. The degree of measurement uncertainty resulting from the estimation of the provision cannot be reasonably determined. Environmental clean–up disclosure is included in Note 28.
49
PROVINCE OF BRITISH COLUMBIA
PUBLIC ACCOUNTS 2018/19
Notes to Consolidated Summary Financial Statements
for the Fiscal Year Ended March 31, 2019—Continued
2. Measurement Uncertainty—Continued
The amount of corporate income tax attributable to the year can change as a result of reassessments in subsequent years. The variability of the final amounts attributable to the year cannot be reasonably determined.
Estimates are based on the best information available at the time of preparation of the financial statements and are reviewed annually to reflect new information as it becomes available. Measurement uncertainty exists in these financial statements, as identified in the table below, for items with a variability of over $10 million:
| | In Millions | |
| | Actual1 | | | | | | | | | |
| | Amount | | Measurement | | Uncertainty | | Range | |
Program Area | | Recorded | | Minimum | | Maximum | | Minimum | | Maximum | |
| | $ | | $ | | $ | | $ | | $ | |
Liabilities | | | | | | | | | | | |
| | | | | | | | | | | |
Accounts Payable and Accrued Liabilities | | | | | | | | | | | |
Litigation and Arbitration | | 160 | | 135 | | 210 | | (25 | ) | 50 | |
Crime Victim Assistance Program | | 169 | | 158 | | 180 | | (11 | ) | 11 | |
Silviculture Liability | | 146 | | 131 | | 160 | | (15 | ) | 14 | |
Employee Leave Entitlements | | 340 | | 329 | | 349 | | (11 | ) | 9 | |
Variability arises from uncertainty of the outcomes or the use of estimates. | |
Revenue | | | | | | | | | | | |
| | | | | | | | | | | |
Taxation | | | | | | | | | | | |
Personal Income Tax | | 11,364 | | 10,864 | | 11,864 | | (500 | ) | 500 | |
| | | | | | | | | | | |
Contributions from the Federal Government | | | | | | | | | | | |
Canada Health Transfer payments2 | | 5,196 | | 5,157 | | 5,235 | | (39 | ) | 39 | |
Canada Social Transfer payments2 | | 1,907 | | 1,893 | | 1,921 | | (14 | ) | 14 | |
| | | | | | | | | | | |
Expense (Note 31) | | | | | | | | | | | |
| | | | | | | | | | | |
Government Transfers | | | | | | | | | | | |
Tax Transfers | | 1,619 | | 1,419 | | 1,819 | | (200 | ) | 200 | |
Variability is based on the potential differences between the estimates for the economic factors used in calculating the accruals and actual economic results.
1Actual amount recorded for each program area may not represent the entire amount in the financial statement line item.
2Canada Health Transfer and Canada Social Transfer payments are transfers from the federal government based on the provincial share of national population figures.
50
PROVINCE OF BRITISH COLUMBIA
PUBLIC ACCOUNTS 2018/19
Notes to Consolidated Summary Financial Statements
for the Fiscal Year Ended March 31, 2019—Continued
3. Accounts Receivable
| | In Millions | |
| | 2019 | | 2018 | |
| | $ | | $ | |
Accounts receivable | | 3,265 | | 3,205 | |
Taxes receivable | | 2,595 | | 1,915 | |
Accrued interest | | 287 | | 289 | |
| | 6,147 | | 5,409 | |
Provision for doubtful accounts | | (842 | ) | (823 | ) |
| | 5,305 | | 4,586 | |
4. Inventories for Resale
| | In Millions | |
| | 2019 | | 2018 | |
| | $ | | $ | |
Properties | | 21 | | 23 | |
Miscellaneous | | 56 | | 53 | |
| | 77 | | 76 | |
Inventories for resale are charged to the statement of operations when sold. During the year, the total cost of sales was $152 million (2018: $173 million) including the effect of write–downs of $1 million (2018: $2 million). Write–downs occurred due to obsolete materials no longer used, damaged goods, and reductions in the market value of goods.
5. Due from Other Governments
| | In Millions | |
| | 2019 | | 2018 | |
| | $ | | $ | |
Government of Canada: | | | | | |
Current | | 1,202 | | 1,352 | |
Provincial governments: | | | | | |
Current | | 24 | | 33 | |
Local governments:1 | | | | | |
Current | | 44 | | 38 | |
Long–term | | 3 | | 2 | |
| | 1,273 | | 1,425 | |
1Local governments are municipal units established by the provincial government which include regional and metropolitan municipalities, cities, towns, townships, districts, rural municipalities and villages.
51
PROVINCE OF BRITISH COLUMBIA
PUBLIC ACCOUNTS 2018/19
Notes to Consolidated Summary Financial Statements
for the Fiscal Year Ended March 31, 2019—Continued
6. Due from Self–supported Crown Corporations and Agencies
| | In Millions | |
| | 2019 | | 2018 | |
| | $ | | $ | |
British Columbia Liquor Distribution Branch | | 154 | | 55 | |
British Columbia Lottery Corporation | | 122 | | 166 | |
British Columbia Hydro and Power Authority | | 81 | | 167 | |
Columbia Power Corporation | | 70 | | 53 | |
UBC Properties Investments Ltd | | 54 | | 40 | |
Vancouver Island Technology Park Trust | | 5 | | 4 | |
SFU Community Trust | | 3 | | 7 | |
Heritage Realty Properties Ltd | | 3 | | 2 | |
Great Northern Way Campus Trust | | 1 | | 20 | |
| | 493 | | 514 | |
See Statement of Financial Position for Self–supported Crown Corporations and Agencies on pages 96 – 97 for details.
7. Equity in Self–supported Crown Corporations and Agencies
| | In Millions | |
| | 2019 | | 2018 | |
| | | | | | Other | | | | | |
| | | | Unremitted | | Comprehensive | | | | | |
| | Investments | | Earnings | | Income | | Total | | Total | |
| | $ | | $ | | $ | | $ | | $ | |
British Columbia Hydro and Power Authority | | 20 | | 4,908 | | (47 | ) | 4,881 | | 4,496 | |
Columbia Power Corporation | | 26 | | 158 | | | | 184 | | 199 | |
Insurance Corporation of British Columbia | | | | (20 | ) | 125 | | 105 | | 972 | |
British Columbia Lottery Corporation | | | | (25 | ) | (40 | ) | (65 | ) | (58 | ) |
| | 46 | | 5,021 | | 38 | | 5,105 | | 5,609 | |
Self–Supported Subsidiaries1 | | | | | | | | | | | |
Columbia Basin Trust joint ventures2 | | 197 | | 28 | | | | 225 | | 219 | |
British Columbia Railway Company3 | | 106 | | 102 | | (8 | ) | 200 | | 192 | |
UBC Properties Investments Ltd | | | | 97 | | | | 97 | | 17 | |
Great Northern Way Campus Trust4 | | 70 | | (21 | ) | | | 49 | | 37 | |
Real Estate Errors and Omissions Insurance Corporation5 | | | | 23 | | 1 | | 24 | | 23 | |
SFU Community Trust | | | | 11 | | | | 11 | | 10 | |
Vancouver Island Technology Park Trust6 | | 1 | | 1 | | | | 2 | | 2 | |
Heritage Realty Properties Ltd6 | | | | 1 | | | | 1 | | 2 | |
Miscellaneous | | 1 | | 2 | | | | 3 | | | |
| | 375 | | 244 | | (7 | ) | 612 | | 502 | |
| | 421 | | 5,265 | | 31 | | 5,717 | | 6,111 | |
52
PROVINCE OF BRITISH COLUMBIA
PUBLIC ACCOUNTS 2018/19
Notes to Consolidated Summary Financial Statements
for the Fiscal Year Ended March 31, 2019—Continued
7. Equity in Self–supported Crown Corporations and Agencies—Continued
| | In Millions | |
| | 2019 | | 2018 | |
| | | | | | Other | | | | | |
| | | | Unremitted | | Comprehensive | | | | | |
| | Investments | | Earnings | | Income | | Total | | Total | |
| | $ | | $ | | $ | | $ | | $ | |
Change in Equity in Self–supported Crown Corporations and Agencies | | | | | | | | | | | |
Balance–beginning of year | | 46 | | 5,725 | | (145 | ) | 5,626 | | 7,022 | |
Prior period adjustments | | | | 66 | | (83 | ) | (17 | ) | (17 | ) |
Balance–beginning of year restated | | 46 | | 5,791 | | (228 | ) | 5,609 | | 7,005 | |
Increase (decrease) in other comprehensive income | | | | | | 266 | | 266 | | (105 | ) |
Net earnings of self–supported Crown corporations and agencies | | | | 1,933 | | | | 1,933 | | 937 | |
Dividends | | | | (2,382 | ) | | | (2,382 | ) | (2,462 | ) |
Adjustments to dividends | | | | (256 | ) | | | (256 | ) | (260 | ) |
Unremitted gain on transfer of asset | | | | (65 | ) | | | (65 | ) | | |
Reclassification of self–supported status7 | | | | | | | | | | 494 | |
Balance—end of year | | 46 | | 5,021 | | 38 | | 5,105 | | 5,609 | |
| | | | | | | | | | | |
Self–Supported Subsidiaries | | | | | | | | | | | |
Balance–beginning of year | | 374 | | 135 | | (7 | ) | 502 | | 489 | |
Prior period adjustments | | | | 93 | | | | 93 | | | |
Balance–beginning of year restated | | 374 | | 228 | | (7 | ) | 595 | | 489 | |
Increase (decrease) in investment | | 1 | | | | | | 1 | | 1 | |
Increase (decrease) in other comprehensive income | | | | | | | | | | 1 | |
Net earnings of self–supported Crown corporations and agencies | | | | 72 | | | | 72 | | 119 | |
Dividends | | | | (45 | ) | | | (45 | ) | (97 | ) |
Transfers (to) from deferred revenue | | | | (11 | ) | | | (11 | ) | (11 | ) |
Balance–end of year | | 375 | | 244 | | (7 | ) | 612 | | 502 | |
| | 421 | | 5,265 | | 31 | | 5,717 | | 6,111 | |
1Self–supported subsidiaries are non–core government business enterprises that are consolidated under the modified equity method by taxpayer–supported organizations.
2Brilliant Power Corporation, Brilliant Expansion Power Corporation, Arrow Lakes Power Corporation and Waneta Expansion Power Corporation are jointly controlled with Columbia Power Corporation. Columbia Power Corporation’s equity investment is included as an integral component of Columbia Power Corporation.
3A subsidiary of BC Transportation Financing Authority.
4Great Northern Way Campus Trust is owned 25% each by Emily Carr University of Art & Design, British Columbia Institute of Technology, The University of British Columbia, and Simon Fraser University.
5A subsidiary of the Real Estate Council of British Columbia.
6Subsidiaries of the University of Victoria.
7Transportation Investment Corporation is classified as a taxpayer–supported Crown corporation effective September 1, 2017.
See Statement of Financial Position for Self–supported Crown Corporations and Agencies and Summary of Results of Operations and Statement of Equity for Self–supported Crown Corporations and Agencies on pages 96 – 99 for details.
53
PROVINCE OF BRITISH COLUMBIA
PUBLIC ACCOUNTS 2018/19
Notes to Consolidated Summary Financial Statements
for the Fiscal Year Ended March 31, 2019—Continued
8. Loans, Advances and Mortgages Receivable
| | In Millions | |
| | 2019 | | 2018 | |
| | $ | | $ | |
Loans and Advances | | | | | |
Land tax deferment loans | | 1,168 | | 974 | |
BC student loans | | 1,029 | | 1,245 | |
Construction loans to social housing projects | | 319 | | 241 | |
Miscellaneous | | 129 | | 132 | |
| | 2,645 | | 2,592 | |
Provision for doubtful accounts | | (296 | ) | (302 | ) |
| | 2,349 | | 2,290 | |
Mortgages Receivable | | | | | |
| | | | | |
Reconstruction Program | | 25 | | 29 | |
Provision for doubtful accounts | | (1 | ) | (1 | ) |
| | 24 | | 28 | |
| | 2,373 | | 2,318 | |
The Land Tax Deferment Program allows eligible owners to defer payment of all, or a portion of, annual property taxes due on principal residences. Eligible individuals are either 55 years of age or older, a surviving spouse, a person with a disability, or an owner who is financially supporting, at the time of application, a dependent child. The program for individuals 55 years of age or older, a surviving spouse, or a person with a disability, requires 25% equity in the home. The program for families with dependent children requires 15% equity in the home. Simple interest is charged on the deferred taxes at a rate set by the minister of finance. This rate will not exceed the prime lending rate of the principal banker to the government and there is a different interest rate between the two programs. The deferred taxes, plus any administration fees or outstanding interest, must be repaid before the residence can be legally transferred to a new owner, other than directly to a surviving spouse or adding a current spouse to title. Land Tax Deferment Loans are secured by registered charge on title.
The BC Student Loan Program provides loans to borrowers for post–secondary education. Effective February 19, 2019 the province eliminated the interest charged on all provincially–issued student loans. Amortization of the loans is usually set at 114 months, but borrowers can extend that amortization to a maximum of 174 months if minimum payment requirements have been met. Defaulted loans are due on demand. The Ministry of Finance also administers defaulted student loans issued by financial institutions under a guaranteed or a risk sharing agreement with the province.
Construction loans are provided by British Columbia Housing Management Commission (BCHMC), a taxpayer–supported Crown corporation and an approved lender under the National Housing Act. BCHMC provides construction loans for societies that are building approved projects under social housing programs. Interest is payable at the province’s weighted average borrowing rate for short–term funds, plus administration costs. Loans are repaid at substantial completion of each project from financing arranged with private lenders.
Miscellaneous loans include commercial loans of $33 million (2018: $36 million) issued by Columbia Basin Trust bearing interest of 3.85% to 7.50% maturing by 2041, and loans of $22 million (2018: $22 million) issued by University of Victoria to subsidiary government business enterprises bearing interest of 5.13% to 8.95% maturing by 2030.
The Reconstruction Loan Program was established in 1998 under the Homeowner Protection Act to provide financial assistance to British Columbians who own homes damaged by premature building envelope failure and have limited ability to secure financing to pay for necessary remediation work. The financial assistance includes interest free loans as well as guarantees and interest subsidies of those loans provided by lenders outside of the government reporting entity. No new applicants under the program were being accepted after July 31, 2009. Financial assistance is secured by registered mortgages.
54
PROVINCE OF BRITISH COLUMBIA
PUBLIC ACCOUNTS 2018/19
Notes to Consolidated Summary Financial Statements
for the Fiscal Year Ended March 31, 2019—Continued
9. Other Investments
| | In Millions | |
| | 2019 | | 2018 | |
| | $ | | $ | |
Pooled investment portfolios | | 1,781 | | 1,448 | |
Equity investments | | 314 | | 369 | |
Municipal, corporate and other bonds | | 200 | | 240 | |
Commercial loans and investments | | 124 | | 118 | |
Provincial government bonds | | 84 | | 100 | |
British Columbia Ferry Service Inc. | | 75 | | 75 | |
Government of Canada bonds | | 17 | | 9 | |
Miscellaneous | | 408 | | 372 | |
| | 3,003 | | 2,731 | |
Pooled investment portfolios consist mainly of units in various funds of the British Columbia Investment Management Corporation. These funds’ investments consist primarily of debt and equity holdings of privately held companies. Pooled investment portfolios have a market value of $2,178 million (2018: $1,695 million).
Equity investments have a market value of $403 million (2018: $560 million). They include investments in Canadian, United States (U.S.) and international equity markets.
Municipal, corporate and other bonds have a market value of $209 million (2018: $242 million) with yields ranging from 0.50% to 9.92%. Maturity dates range from April 2, 2019 to September 27, 2077.
Commercial loans and investments are recorded at the lower of cost of acquisition adjusted by attributed income and market value. Commercial loans and investments include Columbia Basin Trust’s $124 million (2018: $118 million) investment in power developments and other investments.
Provincial bonds of various provinces have a market value of $88 million (2018: $106 million), with yields ranging from 1.32% to 7.60%. Maturity dates range from June 3, 2019 to December 1, 2045.
As part of a secured debenture amendment and preferred share surrender agreement dated May 23, 2003, the province exchanged its interest in British Columbia Ferry Corporation for 75,477 preferred shares in British Columbia Ferry Services Inc. These non–voting preferred shares are valued at $1,000 per share and entitle the province to a fixed cumulative dividend at a rate of 8% of the issue price.
Government of Canada bonds have a market value of $17 million (2018: $9 million), with yields ranging from 0.75% to 5.75%. Maturity dates range from September 19, 2019 to December 1, 2064.
Miscellaneous investments consist of other pooled funds as well as various forms of income securities, notes and treasury bills. The market value of miscellaneous investments is $422 million (2018: $387 million).
55
PROVINCE OF BRITISH COLUMBIA
PUBLIC ACCOUNTS 2018/19
Notes to Consolidated Summary Financial Statements
for the Fiscal Year Ended March 31, 2019—Continued
10. Sinking Fund Investments
| | In Millions | |
| | 2019 | | 2018 | |
| | $ | | $ | |
Sinking fund investments related to taxpayer–supported debt | | 533 | | 1,150 | |
Sinking fund investments related to self–supported debt | | 219 | | 198 | |
| | 752 | | 1,348 | |
| | In Millions | |
| | 2019 | | 2018 | |
| | $ | | $ | |
Provincial government bonds | | 438 | | 412 | |
Pooled investment portfolios | | 12 | | 11 | |
Local government bonds | | 4 | | 5 | |
Miscellaneous | | 298 | | 920 | |
| | 752 | | 1,348 | |
Provincial bonds of various provinces have a market value of $513 million (2018: $477 million), with yields ranging from 1.77% to 3.72%. Maturity dates range from June 1, 2019 to February 15, 2045.
Pooled investment portfolios have a market value of $12 million (2018: $11 million). These pooled investment portfolios consist of units in the British Columbia Investment Management Corporation’s bond funds, which mainly consist of various governments’ bonds and short–term unitized funds that hold money market instruments.
Local government bonds have a market value of $6 million (2018: $6 million), with yields of 2.17%. Maturity date is November 30, 2023. Local government bonds mainly consist of debt issued by the Municipal Finance Authority of British Columbia.
Miscellaneous investments have a market value of $298 million (2018: $920 million). These consist of Renminbi and Indian Rupee denominated bond proceeds held in investment accounts.
Sinking fund investments related to self–supported debt include Province of British Columbia bonds, with a carrying value of $126 million.
11. Loans for Purchase of Assets, Recoverable from Agencies
| | In Millions | |
| | 2019 | | 2018 | |
| | $ | | $ | |
British Columbia Hydro and Power Authority | | 22,160 | | 20,086 | |
Columbia Power Corporation | | 281 | | 286 | |
British Columbia Lottery Corporation | | 100 | | 155 | |
Improvement districts | | 6 | | 7 | |
| | 22,547 | | 20,534 | |
56
PROVINCE OF BRITISH COLUMBIA
PUBLIC ACCOUNTS 2018/19
Notes to Consolidated Summary Financial Statements
for the Fiscal Year Ended March 31, 2019—Continued
12. Accounts Payable and Accrued Liabilities
| | In Millions | |
| | 2019 | | 2018 | |
| | $ | | $ | |
Accounts payable | | 3,704 | | 3,134 | |
Other accrued estimated liabilities1 | | 2,943 | | 2,689 | |
Accrued interest on debt | | 652 | | 663 | |
| | 7,299 | | 6,486 | |
1Includes pending litigation, provision for guaranteed debt payout and other miscellaneous accrued claims as disclosed in Note 28.
13. Employee Future Benefits
| | In Millions | |
| | 2019 | | 2018 | |
| | $ | | $ | |
Vacation, compensatory time off, sick bank | | 1,141 | | 1,101 | |
Retirement allowance | | 739 | | 715 | |
Long–term disability | | 363 | | 360 | |
Post–retirement benefits | | 114 | | 112 | |
Worker compensation benefits | | 92 | | 82 | |
| | 2,449 | | 2,370 | |
There are a variety of employee benefit plans across the reporting entity with different terms that provide for post–employment benefits, compensated absences and termination benefits. The cost of benefits is recognized in the periods the employee provides service. A liability is recognized for benefits that do not vest or accumulate when an event that obligates the province to pay benefits occurs.
The retirement allowance includes actuarially determined liabilities. As at March 31, 2019, unamortized actuarial losses (gains) from actuarial estimates performed every three years were $(33) million (2018: $(34) million). During the year, the amount of benefits paid was $62 million (2018: $51 million).
Worker compensation benefits represent the actual premiums accruing to WorkSafeBC for the year. Amounts recorded in the financial statements relating to long–term disability benefits represent the actual amount of benefits paid during the year plus the actuarial estimate for future payments, based on claims ongoing at year–end.
57
PROVINCE OF BRITISH COLUMBIA
PUBLIC ACCOUNTS 2018/19
Notes to Consolidated Summary Financial Statements
for the Fiscal Year Ended March 31, 2019—Continued
14. Due to Other Governments
| | In Millions | |
| | 2019 | | 2018 | |
| | $ | | $ | |
Government of Canada: | | | | | |
Current | | 368 | | 463 | |
Long–term | | 2 | | 1 | |
Provincial governments: | | | | | |
Current | | 25 | | 31 | |
Local governments:1 | | | | | |
Current | | 149 | | 69 | |
| | 544 | | 564 | |
1Local governments are municipal units established by the provincial government that include regional and metropolitan municipalities, cities, towns, townships, districts, rural municipalities and villages.
15. Due to Crown Corporations, Agencies and Trust Funds
| | In Millions | |
| | 2019 | | 2018 | |
| | $ | | $ | |
Great Northern Way Campus Trust | | 10 | | 10 | |
Trust funds | | 68 | | 69 | |
| | 78 | | 79 | |
16. Deferred Revenue
| | In Millions | |
| | 2019 | | 2018 | |
| | $ | | $ | |
Deferred contributions | | 4,141 | | 3,923 | |
Federal and municipal infrastructure project revenues | | 1,798 | | 1,707 | |
Federal contributions | | 1,482 | | 1,363 | |
Unearned lease revenue | | 1,110 | | 913 | |
Petroleum, natural gas and minerals, leases and fees | | 619 | | 795 | |
Tuition | | 452 | | 380 | |
Motor vehicle licences and permits | | 281 | | 286 | |
Water rentals and recording fees | | 106 | | 114 | |
Derivative debt instruments | | 82 | | 100 | |
Medical Services Plan premiums | | 76 | | 95 | |
Forest stand Management Fund | | 13 | | 12 | |
Miscellaneous | | 244 | | 240 | |
| | 10,404 | | 9,928 | |
58
PROVINCE OF BRITISH COLUMBIA
PUBLIC ACCOUNTS 2018/19
Notes to Consolidated Summary Financial Statements
for the Fiscal Year Ended March 31, 2019—Continued
17. Employee Pension Plans
| | In Millions | |
| | 2019 | | 2018 | |
| | $ | | $ | |
Teachers’ Pension Plan | | 64 | | 118 | |
Members of the Legislative Assembly Superannuation Account | | 1 | | 1 | |
| | 65 | | 119 | |
Members of the Legislative Assembly Superannuation Account
The Legislative Assembly Superannuation Account (the “Account”) is administered by the British Columbia Pension Corporation (the “Pension Corporation”). As members of the Legislative Assembly retire, the present value of the amount required to provide a legislative member’s future pension benefit is transferred from the Account to the Public Service Pension Plan from which monthly pensions are paid. The province contributes to this plan and provides additional funding when the present value of the funding exceeds the accumulated assets in the Account available to fund those members’ benefit entitlements in the plan. This plan provides basic pension benefits based on length of service, highest four–year average earnings and plan members’ age at retirement. Benefits, such as group health benefits and inflation protection for the basic pension, are not guaranteed and are contingent upon available funding.
Other pension plans
Other pension plans represent defined benefit plans outside of the College, Public Service, Municipal, and Teachers’ Pension plans which are funded by entities within the government reporting entity. They include the Retirement Plan for Non–Teaching Employees of the Board of School Trustees of School District No. 43 (Coquitlam), the University of Victoria’s pension plan for employees other than faculty and professional staff, Simon Fraser University’s Academic Pension Plan and Administrative/Union Pension Plan, and Canadian Blood Services’ pension plan for regular employees. Only 14.67% of the pension fund assets and accrued benefit obligation are included for the Canadian Blood Services pension plan, reflecting the province’s interest in the plan. The accrued benefit obligation for these other pension plans is $730 million (2018: $765 million), with estimated pension fund assets of $821 million (2018: $887 million), and an unamortized actuarial gain (loss) of $26 million (2018: $80 million). The accrued net asset (liability) is $65 million (2018: $42 million) and is included in post retirement benefits in Note 13.
There are additional employee pension plans in Crown corporations and agencies consolidated on the modified equity basis. They include British Columbia Hydro and Power Authority, British Columbia Lottery Corporation, British Columbia Railway Company, and the Insurance Corporation of British Columbia. Net assets or net liabilities of the pension funds are included in the equity balance of the particular Crown corporation or agency in Note 7. Total accrued benefit obligations equal $8,190 million (2018: $7,571 million), with estimated pension fund assets of $6,523 million (2018: $6,229 million). The accrued net (liability) asset is $(1,667) million (2018: $(1,342) million).
Joint trusteed plans
The province contributes to four pension plans for substantially all of its employees. The four pension plans are the College Pension Plan, the Public Service Pension Plan, the Municipal Pension Plan, and the Teachers’ Pension Plan. The plans provide basic pensions based on length of service, highest five–year average earnings and plan members’ age at retirement. Benefits, such as group health benefits and inflation protection for the basic pension, are not guaranteed and are contingent upon available funding. No unfunded liability exists for the future indexing of pensions as the obligation is limited to the amount of available assets in separate inflation accounts.
59
PROVINCE OF BRITISH COLUMBIA
PUBLIC ACCOUNTS 2018/19
Notes to Consolidated Summary Financial Statements
for the Fiscal Year Ended March 31, 2019—Continued
17. Employee Pension Plans—Continued
The College, Public Service, Municipal and Teachers’ pension plans are joint trusteed plans. In joint trusteed plans, control of the plans and their assets is assumed by individual pension boards made up of plan employer and plan member appointed trustees. The Province participates as a plan employer in each plan. Provisions of these plans stipulate that the province has no formal claim to any pension plan surplus or asset. The boards are fully responsible for the management of the plans, including investment of the assets and administration of the plans. The Pension Corporation provides benefit administrative services as an agent of the boards of trustees. The British Columbia Investment Management Corporation provides investment management services as an agent of the boards of trustees.
In the event an unfunded liability is determined by an actuarial valuation (performed at least every three years), the pension boards are required to address it through contribution adjustments shared equally by plan members and employers. It is expected, therefore, that any unfunded liabilities in the future will be short–term in nature.
The reported net assets or net obligations of the pension plans are administered under joint trust arrangements. The province has no claim on accrued asset amounts. The province is responsible for 50% of a reported net obligation. Settlement of the obligation will occur in future periods as contributions maintain a fully funded plan status over time. Also, only 70% of the pension fund assets, accrued benefit obligation, and preliminary current year employer contributions are included for the Municipal Pension Plan, reflecting the province’s interest in the plan.
The accrued benefit obligations and pension assets shown for 2018/19 are based on extrapolations of the most recent actuarial valuations as shown below. Fund assets are based on market value at the date of actuarial valuation and extrapolated using actuarial growth assumptions as shown in the following table. The expected long–term inflation rates used in these assumptions are nil, since the future indexing of pensions is limited to the amount of available assets in the inflation adjustment account.
Key actuarial assumptions and dates:
| | Public | | | | | | | |
| | Service | | Municipal | | Teachers’ | | College | |
| | Pension | | Pension | | Pension | | Pension | |
| | Plan | | Plan | | Plan | | Plan | |
Date of actuarial valuation | | Mar 31/17 | | Dec 31/15 | | Dec 31/17 | | Aug 31/15 | |
Date of audited financial statements | | Mar 31/18 | | Dec 31/17 | | Dec 31/17 | | Aug 31/18 | |
Expected long–term rate of return | | 6.25% | | 6.25% | | 6.00% | | 6.25% | |
The audited financial statements of each pension plan listed, except the Account, may be found in the annual reports at www.pensionsbc.ca outside these audited statements.
60
PROVINCE OF BRITISH COLUMBIA
PUBLIC ACCOUNTS 2018/19
Notes to Consolidated Summary Financial Statements
for the Fiscal Year Ended March 31, 2019—Continued
17. Employee Pension Plans—Continued
Accrued net obligation (asset) table:
The estimated financial position as at March 31, 2019, for the basic pension in each plan is as follows:
| | In Millions | |
| | Public | | | | | | | | | |
| | Service | | Municipal | | Teachers’ | | College | | | |
| | Pension | | Pension | | Pension | | Pension | | | |
| | Plan | | Plan | | Plan | | Plan | | Total | |
| | $ | | $ | | $ | | $ | | $ | |
Accrued benefit obligation | | 19,189 | | 27,623 | | 20,854 | | 3,724 | | 71,390 | |
Pension fund assets | | 22,192 | | 29,469 | | 22,271 | | 3,940 | | 77,872 | |
| | (3,003 | ) | (1,846 | ) | (1,417 | ) | (216 | ) | (6,482 | ) |
Unamortized actuarial gain (loss) | | 1,194 | | 457 | | 1,545 | | 115 | | 3,311 | |
Accrued net obligation (asset) | | (1,809 | ) | (1,389 | ) | 128 | | (101 | ) | (3,171 | ) |
| | | | | | | | | | | |
Province’s accrued net obligation – 50% | | | | | | 64 | | | | 64 | |
The province is obligated under labour contracts to provide retirement benefits for its employees through contributions to these pension plans. Contribution rates are adjusted to reflect the results of the triennial actuarial valuation of each plan. When there is an accrued net obligation, the contribution rates will be increased to address the shortfall over the employees’ estimated remaining years of service. The province contributes approximately 50% of the total contributions for these plans; therefore, the province’s accrued net obligation is 50%. An accrued net obligation will not result in a payment to the plan, but will be addressed through increased contributions over time.
The preliminary overall fund rates of return (loss) reported to the pension boards as at December 31, 2018 for each plan are: College Pension Plan 2.2% (2018: 11.3%), Public Service Pension Plan 2.5% (2018: 12.0%), Municipal Pension Plan 2.1% (2018: 11.0%), and Teachers’ Pension Plan 2.3% (2018: 11.8%).
The province’s share includes contributions for all participants in the government reporting entity. Total contributions this year for each plan are: College Pension Plan $87 million (2018: $81 million), the Public Service Pension Plan $400 million (2018: $375 million), the Municipal Pension Plan $792 million (2018: $754 million), and the Teachers’ Pension Plan $396 million (2018: $401 million).
61
PROVINCE OF BRITISH COLUMBIA
PUBLIC ACCOUNTS 2018/19
Notes to Consolidated Summary Financial Statements
for the Fiscal Year Ended March 31, 2019—Continued
18. Taxpayer–supported Debt1
| | In Millions | |
| | Year of | | Canadian | | US | | Other | | | | | |
| | Maturity | | Dollar | | Dollar2 | | Currencies2 | | 2019 | | 2018 | |
| | $ | | $ | | $ | | $ | | $ | | | |
Short–term promissory notes | | 2019 | | | | | | | | 0 | | 2,012 | |
| | 2020 | | 2,381 | | 580 | | | | 2,961 | | 0 | |
Notes, bonds and debentures3 | | 2019 | | | | | | | | 0 | | 3,172 | |
| | 2020 | | 2,689 | | | | 97 | | 2,786 | | 2,763 | |
| | 2021 | | 1,938 | | | | 199 | | 2,137 | | 2,143 | |
| | 2022 | | 2,396 | | 990 | | | | 3,386 | | 3,385 | |
| | 2023 | | 2,453 | | 1,233 | | | | 3,686 | | 3,685 | |
| | 2024 | | 2,617 | | | | | | 2,617 | | 2,610 | |
| | 2025–2029 | | 4,992 | | 982 | | 1,231 | | 7,205 | | 7,000 | |
| | 2030–2034 | | 4,695 | | | | 257 | | 4,952 | | 4,949 | |
| | 2035–2039 | | 3,559 | | | | 266 | | 3,825 | | 3,777 | |
| | 2040–2044 | | 4,616 | | | | 257 | | 4,873 | | 4,867 | |
| | 2045–2049 | | 3,669 | | | | | | 3,669 | | 3,807 | |
| | 2050–2054 | | 575 | | | | | | 575 | | 20 | |
| | 2055–2059 | | 130 | | | | | | 130 | | 130 | |
| | 2060–2063 | | 181 | | | | | | 181 | | 181 | |
Capital leases | | 2019–2049 | | 253 | | | | | | 253 | | 254 | |
Total debt issued at face value | | | | 37,144 | | 3,785 | | 2,307 | | 43,236 | | 44,755 | |
| | | | | | | | | | | | | |
Unamortized premium (discount) | | | | | | | | | | (27 | ) | (3 | ) |
Total taxpayer–supported debt | | | | | | | | | | 43,209 | | 44,752 | |
| | | | | | | | | | | | | | |
The effective interest rates (weighted average) as at March 31 on the above debt are: | | | | | |
2019 | | 3.98 | % | | |
2018 | | | | 4.05 | % |
1The balances and interest rates reflect the impact of the related derivative contracts, presented in Note 20.
2Foreign currency denominated debt as at March 31, 2019 includes US$3,437 million which was fully hedged to CAD$3,785 million; 100 million Swiss Francs was fully hedged into CAD$96 million; 713 million EURO was fully hedged to CAD$1,034 million, $870 million AUD was fully hedged to CAD$881 million, CNY 1 billion (CAD$199 million) and INR 5 billion (CAD$97 million) were fully hedged with an investment in the same currency.
3Notes, bonds and debentures includes $2,749 million (2018: $2,728 million) in public private partnership obligations and $33 million (2018: $34 million) in other loans.
62
PROVINCE OF BRITISH COLUMBIA
PUBLIC ACCOUNTS 2018/19
Notes to Consolidated Summary Financial Statements
for the Fiscal Year Ended March 31, 2019—Continued
18. Taxpayer–supported Debt—Continued
Notes, bonds and debentures
Redeemable by the province
Balances include debentures issued to the Canada Pension Plan totalling $3,406 million (2018: $3,389 million) at a weighted average interest rate of 5.06% (2018: 5.08%). These debentures mature at various dates from April 12, 2019 to May 10, 2041 with interest rates varying between 2.55% and 6.75%. These debentures are redeemable in whole or in part before maturity, on thirty days prior notice, at the option of the province. During the year, $43 million (2018: $77 million) Canada Pension Plan debentures were issued.
Mortgages
Balances include mortgages totalling $164 million (2018: $176 million) secured by land and buildings. The carrying value is $174 million (2018: $175 million).
Aggregate payments to meet sinking fund instalments and retirement provisions
Aggregate payments for the next five fiscal years and thereafter to meet sinking fund instalments and retirement provisions on notes, bonds and debentures are:
| | In Millions | |
| | $ | |
2020 | | 3,094 | |
2021 | | 1,935 | |
2022 | | 3,380 | |
2023 | | 3,666 | |
2024 | | 2,607 | |
2025–2063 | | 25,355 | |
Total of stated minimum payments | | 40,037 | |
Capital Lease Obligations
Capital lease obligations consist of the present value of the minimum lease payments related to capital leased assets. The province has lease agreements with terms between 2 years and 41 years, with interest rates ranging between 0.00% and 7.50%.
Major leases include: Vancouver Coastal Health Authority capital lease obligation for the Gordon and Leslie Diamond Health Care Centre of $103 million (2018: $105 million), with a weighted average interest rate of 5.37% and maturing August 1, 2036, Ministry of Citizens’ Services capital lease obligation for office space in Capital Park of $64 million (2018: $66 million), with a weighted average interest rate of 3.97% and maturing April 1, 2037, Thompson Rivers University lease agreements for land and student residences of $36 million (2018: $37 million), with a weighted average interest rate of 5.14% and maturing August 31, 2047, and British Columbia Institute of Technology capital lease obligation for the building at Annacis Island Campus of $19 million (2018: $20 million), with a weighted average interest rate of 4.19% and maturing July 31, 2044.
63
PROVINCE OF BRITISH COLUMBIA
PUBLIC ACCOUNTS 2018/19
Notes to Consolidated Summary Financial Statements
for the Fiscal Year Ended March 31, 2019—Continued
18. Taxpayer–supported Debt—Continued
Aggregate payments to meet capital lease payments
Aggregate minimum lease payments over the next five fiscal years and thereafter are:
| | In Millions | |
| | $ | |
2020 | | 28 | |
2021 | | 24 | |
2022 | | 21 | |
2023 | | 19 | |
2024 | | 17 | |
2025–2049 | | 280 | |
Total minimum lease payments | | 389 | |
Less imputed interest | | (136 | ) |
Total capital lease liability | | 253 | |
64
PROVINCE OF BRITISH COLUMBIA
PUBLIC ACCOUNTS 2018/19
Notes to Consolidated Summary Financial Statements
for the Fiscal Year Ended March 31, 2019—Continued
19. Self–supported Debt1
| | In Millions | |
| | Year of | | Canadian | | US | | Other | | | | | |
| | Maturity | | Dollar | | Dollar2 | | Currencies2 | | 2019 | | 2018 | |
| | | | $ | | $ | | $ | | $ | | $ | |
Short–term promissory notes | | 2019 | | | | | | | | 0 | | 2,208 | |
| | 2020 | | 2,781 | | 272 | | | | 3,053 | | 0 | |
Notes, bonds and debentures | | 2019 | | | | | | | | 0 | | 1,234 | |
| | 2020 | | 175 | | | | | | 175 | | 175 | |
| | 2021 | | 1,100 | | | | | | 1,100 | | 1,100 | |
| | 2022 | | 526 | | | | | | 526 | | 526 | |
| | 2023 | | 500 | | | | | | 500 | | 500 | |
| | 2024 | | 200 | | | | | | 200 | | 200 | |
| | 2025–2029 | | 3,950 | | 646 | | 391 | | 4,987 | | 3,679 | |
| | 2030–2034 | | 1,610 | | | | 200 | | 1,810 | | 1,810 | |
| | 2035–2039 | | | | 376 | | | | 376 | | 373 | |
| | 2040–2044 | | 3,273 | | | | | | 3,273 | | 3,273 | |
| | 2045–2049 | | 6,320 | | | | | | 6,320 | | 5,620 | |
| | 2050–2054 | | 450 | | | | | | 450 | | 0 | |
| | 2055–2059 | | 60 | | | | | | 60 | | 60 | |
| | 2060–2063 | | 50 | | | | | | 50 | | 50 | |
Total debt issued at face value | | | | 20,995 | | 1,294 | | 591 | | 22,880 | | 20,808 | |
| | | | | | | | | | | | | |
Unamortized premium (discount) | | | | | | | | | | (210 | ) | (183 | ) |
Unrealized foreign exchange gain (loss) | | | | | | | | | | (15 | ) | (6 | ) |
Total self –supported debt | | | | | | | | | | 22,655 | | 20,619 | |
The effective interest rates (weighted average) as at March 31 on the above debt are: | | | | | |
| | | | | |
2019 | | 3.73 | % | | |
2018 | | | | 3.94 | % |
1The balances and interest rates reflect the impact of the related derivative contracts, presented in Note 20.
2Foreign currency denominated debt as at March 31, 2019 includes US$1,005 million (CAD$1,294 million), of which US$778 million was fully hedged to CAD$991 million and US$227 million was unhedged (CAD$303 million), and 402 million EURO was fully hedged to CAD$591 million.
Notes, bonds and debentures
Redeemable by the province
Balances include debentures issued to the Canada Pension Plan totalling $223 million (2018: $253 million) at a weighted average interest rate of 3.34% (2018: 3.54%). These debentures mature at various dates from May 8, 2042 to July 10, 2042, with interest rates varying between 3.22% and 3.54%. These debentures are redeemable in whole or in part before maturity, on thirty days prior notice, at the option of the province. During the year, no Canada Pension Plan debentures were issued (2018: nil).
65
PROVINCE OF BRITISH COLUMBIA
PUBLIC ACCOUNTS 2018/19
Notes to Consolidated Summary Financial Statements
for the Fiscal Year Ended March 31, 2019—Continued
19. Self–supported Debt—Continued
Aggregate payments to meet retirement provisions
Aggregate payments for the next five fiscal years and thereafter to meet retirement provisions on notes, bonds and debentures are:
| | In Millions | |
| | $ | |
2020 | | 175 | |
2021 | | 1,100 | |
2022 | | 526 | |
2023 | | 500 | |
2024 | | 200 | |
2025-2063 | | 17,326 | |
Total of stated minimum payments | | 19,827 | |
66
PROVINCE OF BRITISH COLUMBIA
PUBLIC ACCOUNTS 2018/19
Notes to Consolidated Summary Financial Statements
for the Fiscal Year Ended March 31, 2019—Continued
20. Risk Management and Derivative Financial Instruments
The province borrows funds in both domestic and foreign capital markets, and manages its existing debt portfolio to achieve the lowest debt costs within specified risk parameters. As a result, the province is exposed to risks associated with fluctuations in interest rates, foreign exchange rates, and credit risk. In accordance with risk management policy guidelines set by the Risk Committee of the Ministry of Finance, the province uses a variety of derivative financial instruments to hedge exposure to these risks.
Derivatives used by the province include interest rate swaps, cross–currency swaps, and forward foreign exchange contracts. A derivative instrument is a financial contract with a counterparty that is applied to effect a hedge on interest rate or foreign exchange exposure that exists in the underlying provincial debt instrument. A derivative derives value from the impact of market changes on the underlying hedged debt instrument.
The following tables present maturity schedules of the province’s derivatives, based on the notional amounts of the contracts. Cross–currency swaps can have an exchange of the notional amounts at the start of the contract, the end of the contract, or both. There is no exchange of the notional amounts in interest rate swaps.
Taxpayer–supported Portfolios (Notional Values)
| | In Millions | |
| | | | | | | | Forward | | | |
| | | | Cross– | | Interest | | Foreign | | | |
| | Year of | | Currency | | Rate | | Exchange | | | |
| | Maturity | | Swaps1 | | Swaps1 | | Contracts1 | | Total | |
| | | | $ | | $ | | $ | | $ | |
| | 2020 | | 37 | | 344 | | 580 | | 961 | |
| | 2021 | | | | 100 | | | | 100 | |
| | 2022 | | 990 | | 442 | | | | 1,432 | |
| | 2023 | | 1,233 | | 1,050 | | | | 2,283 | |
| | 2024 | | | | 112 | | | | 112 | |
| | 2025–2029 | | 2,213 | | 699 | | | | 2,912 | |
| | 2030–2034 | | 257 | | 311 | | | | 568 | |
| | 2035–2039 | | 266 | | 121 | | | | 387 | |
| | 2040–2044 | | 257 | | 100 | | | | 357 | |
| | 2045–2049 | | | | 400 | | | | 400 | |
Total | | | | 5,253 | | 3,679 | | 580 | | 9,512 | |
1At March 31, 2019, fair market valuation was an unrealized gain of $772 million (2018: $749 million gain) on cross–currency swaps, and an unrealized gain of $290 million (2018: $265 million gain) on interest rate swaps, and an unrealized gain of $5 million (2018: nil) on forward foreign exchange contracts. These unrealized gains and losses are incurred on derivatives held in matched hedging arrangements with related debt instruments. The unrealized gains or losses on these hedging derivatives are offset by corresponding unrealized gains or losses on the matched debt instruments. These gains and losses are subject to measurement uncertainty.
67
PROVINCE OF BRITISH COLUMBIA
PUBLIC ACCOUNTS 2018/19
Notes to Consolidated Summary Financial Statements
for the Fiscal Year Ended March 31, 2019—Continued
20. Risk Management and Derivative Financial Instruments—Continued
Self–supported Portfolios (Notional Values)
| | In Millions | |
| | | | | | | | Advanced | | Forward | | | |
| | | | Cross– | | Interest | | Rate | | Foreign | | | |
| | Year of | | Currency | | Rate | | Setting | | Exchange | | | |
| | Maturity | | Swaps2 | | Swaps2 | | Agreements2 | | Contracts2 | | Total | |
| | | | $ | | $ | | $ | | $ | | $ | |
| | 2020 | | | | | | 600 | | 271 | | 871 | |
| | 2021 | | | | | | | | | | 0 | |
| | 2022 | | | | | | | | | | 0 | |
| | 2023 | | | | | | | | | | 0 | |
| | 2024 | | | | | | | | | | 0 | |
| | 2025–2029 | | 391 | | | | | | 436 | | 827 | |
| | 2030–2034 | | 200 | | 3,350 | | | | | | 3,550 | |
| | 2035–2039 | | | | 75 | | | | 283 | | 358 | |
| | 2040–2044 | | | | | | | | | | 0 | |
| | 2045–2049 | | | | | | | | | | 0 | |
| | 2050–2054 | | | | 2,025 | | | | | | 2,025 | |
Total | | | | 591 | | 5,450 | | 600 | | 990 | | 7,631 | |
2At March 31, 2019, fair market valuation was an unrealized gain of $11 million (2018: $50 million gain) on cross currency swaps, an unrealized loss of $222 million (2018: $137 million gain) on interest rate swaps, an unrealized loss of $51 million (2018: $54 million loss) on advanced rate setting agreements, and an unrealized gain of $14 million (2018: $45 million gain) on forward foreign exchange contracts. These unrealized gains and losses are incurred on derivatives held in matched hedging arrangements with related debt instruments that are held to maturity. The unrealized gains or losses on these hedging derivatives are offset by corresponding unrealized gains or losses on the matched debt instruments. These gains and losses are subject to measurement uncertainty.
Interest rate risk
Interest rate risk is the risk that the province’s debt servicing costs will fluctuate due to changes in interest rates. The province uses derivative contracts (interest rate swaps) to manage interest rate risk by exchanging a series of interest payments and assuming either a fixed or floating rate liability to a counterparty, based on the notional principal amount. Derivatives allow the province to alter the proportion of its debt held in fixed and floating rate form to take advantage of changes in interest rates.
The government’s current policy guidelines with respect to the provincial government direct debt portfolio, which totals $28,230 million (2018: $30,022 million), allow floating rate exposure up to 45.00% (2018: 45.00%) of this portion of the taxpayer–supported debt. At March 31, 2019, floating rate debt exposure was 20.10% (2018: 18.96%) of the government direct debt portfolio.
Under current policy guidelines for British Columbia Hydro and Power Authority (BC Hydro), the maximum floating rate exposure is 25.00% (2018: 25.00%) of their debt which totals $22,054 million (2018: $19,980 million). At March 31, 2019, floating rate debt exposure for BC Hydro was 13.80% (2018: 16.20%) of their debt.
Based on the taxpayer–supported and self–supported debt portfolios at March 31, 2019, a one percent change in interest rates would impact the annual debt servicing expense by $71 million (2018: $64 million) for the taxpayer–supported debt portfolio and $31 million (2018: $22 million) for the self–supported debt portfolio.
At March 31, 2019, swap agreements relating to investments held by taxpayer–supported portfolios included interest rate swaps totalling $44 million (2018: $44 million).
68
PROVINCE OF BRITISH COLUMBIA
PUBLIC ACCOUNTS 2018/19
Notes to Consolidated Summary Financial Statements
for the Fiscal Year Ended March 31, 2019—Continued
20. Risk Management and Derivative Financial Instruments—Continued
Foreign exchange risk
Foreign exchange risk is the risk that the province’s debt servicing costs and principal payments will fluctuate due to changes in foreign exchange rates. The province uses derivative contracts (cross–currency swaps) to hedge foreign exchange risk by converting foreign currency principal and interest cash flows into Canadian dollar cash flows.
The government’s current policy guidelines with respect to the provincial government direct debt portfolio, which totals $28,230 million (2018: $30,022 million), allow unhedged foreign debt exposure up to 10.00% (2018: 10.00%) of this portion of the taxpayer–supported debt. At March 31, 2019, there was no unhedged foreign debt exposure of the government direct debt portfolio (2018: nil).
Under current policy guidelines for BC Hydro, the maximum unhedged foreign debt exposure is 5.00% (2018: 5.00%) of its debt, which totals $22,054 million (2018: $19,980 million). At March 31, 2019, 0.30% (2018: 0.40%) of its debt was in the form of unhedged foreign debt in US dollars.
Based on the taxpayer–supported and self–supported debt portfolios at March 31, 2019, a one cent change in the Canadian dollar versus the US dollar would not impact the annual debt servicing cost (2018: nil) for the taxpayer–supported debt portfolio; however, the self–supported debt portfolio would increase by $1 million (2018: $1 million).
At March 31, 2019, swap agreements relating to investments held by taxpayer–supported portfolios included cross–currency swaps totalling $37 million (2018: $35 million).
Credit risk
Credit risk is the risk that the province will incur financial losses due to a counterparty defaulting on its financial obligations. In accordance with the government’s policy guidelines, the province reduces its credit risk by dealing with only highly rated counterparties. The province only enters into derivative transactions with counterparties that have a rating from Standard & Poor’s or Moody’s Investors Service Inc. of at least A+/A1. The province also establishes limits on individual counterparty credit exposures and monitors these exposures on a regular basis.
The province implements Credit Support Annex agreements for all derivative type transactions, including cross–currency and interest rate swaps, to mitigate exposure to counterparty default risk. Under the terms of these agreements, the province may be required to pledge or receive eligible collateral with its counterparties. These amounts will be returned to or received from the counterparties when there are no longer any outstanding obligations. As at March 31, 2019, gross counterparty exposure was valued at $819 million, and collateral held was $156 million, for a net exposure of $663 million. Collateral held consists of $93 million cash received, which is included in accounts payable (Note 12), and $63 million of securities received, which has not been recognized in the financial statements as it is held by a third party until the derivative transaction is completed or default occurs.
21. Net Liabilities
The Consolidated Statement of Change in Net Liabilities (see page 41) shows the net impact of applying the expenditure basis of accounting. The net liabilities calculation uses the expenditure, rather than the expense basis of accounting. Under the expenditure basis of accounting, tangible capital assets, prepaid program costs and other assets are recorded as expenditures when calculating the current year surplus or deficit. Under the expense basis of accounting, these items are recorded on the Consolidated Statement of Financial Position as assets and amortized over an applicable period of time.
69
PROVINCE OF BRITISH COLUMBIA
PUBLIC ACCOUNTS 2018/19
Notes to Consolidated Summary Financial Statements
for the Fiscal Year Ended March 31, 2019—Continued
22. Tangible Capital Assets
| | In Millions | |
| | 2019 | | 2018 | |
| | $ | | $ | |
Land and land improvements | | 5,245 | | 5,046 | |
Buildings (including tenant improvements) | | 23,323 | | 22,044 | |
Highway infrastructure | | 13,048 | | 12,832 | |
Transportation equipment | | 2,539 | | 2,495 | |
Computer hardware and software | | 1,630 | | 1,445 | |
Other | | 2,045 | | 1,975 | |
| | 47,830 | | 45,837 | |
See Consolidated Statement of Tangible Capital Assets on page 100.
The estimated useful lives of the more common tangible capital assets are: buildings (3–90 years); highway infrastructure (3–77 years); transportation equipment (including rapid transit, ferries and related infrastructure) (8–100 years); computer hardware and software (1–15 years); major software systems (1–15 years); and other (including vehicles, specialized equipment, and furniture and equipment) (1–30 years). Land improvements are amortized over 30 years (recreation areas) or 40 years (dams and water management systems). Leasehold improvements are amortized over 2–40 years, over the lease term, or over the lesser of the lease term and the life of the asset.
BC Transportation Financing Authority (BCTFA) assets include capital assets under lease to South Coast British Columbia Transportation Authority (SCBCTA). These capital assets under lease consist of land, land improvements, interests in land, park and ride facilities, stations, guideways, rolling stocks and other assets related to the SkyTrain system, including the Millennium Line, Evergreen Line, the Expo Line SkyTrain systems and the West Coast Express. These assets are made available for use by SCBCTA under operating lease arrangements for a nominal lease amount pursuant to an Order in Council and to the Millennium Line Use Agreement, and represent one of the province’s contributions toward public transportation in the Metro Vancouver service area. The Expo Line and Millennium Line Use Agreements expire in January 2020. These agreements may be renewed, if mutually agreed, for successive five year terms as long as the assets remain a part of the Greater Vancouver regional transportation system. The net book value of these assets is $2,382 million (2018: $2,357 million).
The province received no donations of tangible capital assets during the year. (2018: $1 million).
70
PROVINCE OF BRITISH COLUMBIA
PUBLIC ACCOUNTS 2018/19
Notes to Consolidated Summary Financial Statements
for the Fiscal Year Ended March 31, 2019—Continued
23. Restricted Assets
| | In Millions | |
| | 2019 | | 2018 | |
| | $ | | $ | |
Endowment funds | | 1,834 | | 1,768 | |
Donors have placed restrictions on their contributions to the endowment funds of universities, colleges, school districts, health organizations, and taxpayer–supported Crown corporations. One restriction is that the original contribution should not be spent. Another potential restriction is that any investment income of the endowment fund that is required to offset the eroding effect of inflation or preserve the original value of the endowment should also not be spent.
24. Prepaid Program Costs
| | In Millions | |
| | 2019 | | 2018 | |
| | $ | | $ | |
Prepaid program costs | | 847 | | 768 | |
The prepaid program costs include deferred costs associated with the BC Timber Sales Program, prepaid operating costs and inventories of supplies and other not–for–resale items held by taxpayer–supported Crown corporations and agencies which are charged to expense when consumed in the normal course of operations. At March 31, 2019, the total inventories held for use or consumption was $377 million (2018: $370 million). During the year, the total expense due to the consumption of inventories was $1,370 million (2018: $1,341 million) including the effect of write–downs of $19 million (2018: $1 million).
25. Other Assets
| | In Millions | |
| | 2019 | | 2018 | |
| | $ | | $ | |
Deferred debt instrument costs | | 169 | | 189 | |
Other deferred costs | | 36 | | 53 | |
| | 205 | | 242 | |
71
PROVINCE OF BRITISH COLUMBIA
PUBLIC ACCOUNTS 2018/19
Notes to Consolidated Summary Financial Statements
for the Fiscal Year Ended March 31, 2019—Continued
26. Accumulated Surplus (Deficit)
| | In Millions | |
| | 2019 | | 2018 | |
| | $ | | $ | |
Accumulated surplus (deficit)—before other comprehensive income—beginning of year as previously reported1 | | 6,898 | | 6,597 | |
Adjustments to accumulated surplus (deficit)2,3 | | 118 | | 105 | |
Accumulated surplus (deficit)—beginning of year as restated | | 7,016 | | 6,702 | |
Surplus (deficit) for the year4 | | 1,535 | | 314 | |
Accumulated surplus (deficit)—before other comprehensive income | | 8,551 | | 7,016 | |
| | | | | |
Accumulated other comprehensive income from self–supported Crown corporations and agencies (see page 99)—beginning of year | | (235 | ) | (271 | ) |
Other comprehensive income from self–supported Crown corporations and agencies (see page 99) | | 266 | | 36 | |
Accumulated other comprehensive income from self–supported Crown corporations and agencies (see page 99)—end of year | | 31 | | (235 | ) |
Accumulated surplus (deficit)—end of year | | 8,582 | | 6,781 | |
1The opening accumulated surplus (deficit) figures for April 1, 2018 and April 1, 2017 are reported before accumulated other comprehensive income. | | | |
2During 2018/19, adjustments were made to the opening accumulated surplus for 2017/18 as follows: | | | |
British Columbia Hydro and Power Authority restatement for International Financial Reporting Standards policy changes | | 74 | |
Columbia Basin Trust restatement for liability recognition | | 39 | |
British Columbia Lottery Corporation restatement for International Financial Reporting Standards policy changes | | (8 | ) |
Total | | 105 | |
3During 2018/19, adjustments were made to the opening accumulated surplus for 2018/19, for the following items: | | | |
| | | |
British Columbia Hydro and Power Authority restatement for International Financial Reporting Standards policy changes | | 74 | |
Columbia Basin Trust restatement for liability recognition | | 52 | |
British Columbia Lottery Corporation restatement for International Financial Reporting Standards policy changes | | (8 | ) |
Total | | 118 | |
4During 2018/19, adjustments were made to the reported surplus figure for the 2017/18 fiscal year as follows: | | | |
| | | |
Columbia Basin Trust restatement for liability recognition | | 13 | |
Total | | 13 | |
72
PROVINCE OF BRITISH COLUMBIA
PUBLIC ACCOUNTS 2018/19
Notes to Consolidated Summary Financial Statements
for the Fiscal Year Ended March 31, 2019—Continued
27. Contingent Assets and Contractual Rights
(a) UNRECOGNIZED ASSETS
Intangible assets and items inherited by right of Crown, such as forest, water and mineral resources, are not recognized in these financial statements. Land inherited by the right of Crown is capitalized at a nominal value of one dollar.
The value of collections (e.g. artifacts, specimens, works of art, and documents) has been excluded from the Statement of Financial Position. When collections are purchased, these items are expensed.
(b) CONTINGENT ASSETS
The province has the following contingent assets where the estimated amount is, or exceeds $100,000, and the occurrence of the confirming future event is likely.
| | In Millions | |
| | 2019 | | 2018 | |
| | $ | | $ | |
Insurance claims | | 0 | | 1 | |
(c) CONTRACTUAL RIGHTS
Contractual rights are future–oriented financial information based on multi–year contracts the government has entered into that will become assets and revenue when terms of the contracts are met. The following table presents contractual rights that are greater than $50 million, by sector, by year.
| | In Millions | |
| | | | | | | | | | | | 2025 and | | | |
| | 2020 | | 2021 | | 2022 | | 2023 | | 2024 | | beyond | | Total | |
| | $ | | $ | | $ | | $ | | $ | | $ | | $ | |
Consolidated Revenue Fund and Taxpayer–supported Crown corporations and agencies | | | | | | | | | | | | | | | |
Education | | 15 | | 11 | | 9 | | 9 | | 9 | | | | 53 | |
Natural resources and economic development | | 267 | | 256 | | 263 | | 264 | | 266 | | 2,013 | | 3,329 | |
Other | | 135 | | 138 | | 137 | | 144 | | 148 | | 683 | | 1,385 | |
Transportation | | 359 | | 434 | | 508 | | 435 | | 308 | | 442 | | 2,486 | |
| | 776 | | 839 | | 917 | | 852 | | 731 | | 3,138 | | 7,253 | |
Self–supported Crown corporations and agencies | | | | | | | | | | | | | | | |
Natural resources and economic development | | 313 | | 244 | | 179 | | 154 | | 153 | | 2,741 | | 3,784 | |
Transportation | | 6 | | 6 | | 6 | | 6 | | 6 | | 48 | | 78 | |
Protection of persons and property | | 40 | | 37 | | 33 | | 26 | | 21 | | 60 | | 217 | |
| | 359 | | 287 | | 218 | | 186 | | 180 | | 2,849 | | 4,079 | |
Total | | 1,135 | | 1,126 | | 1,135 | | 1,038 | | 911 | | 5,987 | | 11,332 | |
73
PROVINCE OF BRITISH COLUMBIA
PUBLIC ACCOUNTS 2018/19
Notes to Consolidated Summary Financial Statements
for the Fiscal Year Ended March 31, 2019—Continued
28. Contingent Liabilities and Contractual Obligations
(a) GUARANTEED DEBT
The authorized limit for loans guaranteed by the province as at March 31, 2019 was $398 million (2018: $398 million). These guarantees include amounts where indemnities have been made for explicit quantifiable loans. Guaranteed debt as at March 31, 2019 totalled $14 million (2018: $15 million). See Consolidated Statement of Guaranteed Debt on page 101 for details.
(b) CONTINGENT LIABILITIES
Litigation
The province is a defendant in legal actions and is involved in matters such as expropriation, contract and tax disputes. These matters may give rise to future liabilities.
The province has the following contingent liabilities where the estimated or known claim is, or exceeds $100,000, but the likelihood of payment is uncertain.
| | In Millions | |
| | 2019 | | 2018 | |
| | $ | | $ | |
Property access disputes | | 281 | | 331 | |
Contract disputes | | 110 | | 120 | |
Tax disputes | | 30 | | 77 | |
Damage to persons or property | | | | 17 | |
Negligence and miscellaneous | | 89 | | 423 | |
| | 510 | | 968 | |
When it is determined it is likely a liability exists and the amount can be reasonably estimated, the amount is recorded as an accrued liability (see Note 12) and an expense. The accrued liability for pending litigation in process at March 31, 2019 was $111 million (2018: $111 million).
Tax Appeals
The province has received appeals under various tax statutes totalling $78 million (2018: $77 million). The cost to the province cannot be determined as the outcome of these appeals is uncertain.
Guarantees and Indemnities
The province also has contingent liabilities in the form of indemnities, indirect guarantees and outstanding claims for amounts that are not explicit or reasonably estimable at this time.
74
PROVINCE OF BRITISH COLUMBIA
PUBLIC ACCOUNTS 2018/19
Notes to Consolidated Summary Financial Statements
for the Fiscal Year Ended March 31, 2019—Continued
28. Contingent Liabilities and Contractual Obligations—Continued
Environmental Clean–up
The province is responsible for the remediation of numerous contaminated sites in the province that are no longer in productive economic use.
For sites where the province is directly responsible or has assumed responsibility for remediation, the following provision for future clean–up costs has been accrued based on preliminary environmental assessments, or estimations for those sites where an assessment has not been conducted. The provision is recorded as an accrued liability (see Note 12).
| | In Millions | |
| | 2019 | | 2018 | |
| | $ | | $ | |
Mine sites | | 320 | | 270 | |
Transportation infrastructure | | 47 | | 41 | |
Industrial sites | | 27 | | 28 | |
Pulp mills | | 15 | | 15 | |
Salt sheds | | 4 | | 5 | |
Maintenance yards | | 2 | | 3 | |
Miscellaneous | | 71 | | 64 | |
| | 486 | | 426 | |
This provision for future clean–up costs is an estimate of the minimum remediation costs for known sites where an assessment has been conducted, or where available information on sites is sufficient to estimate the costs. Where information is not available to make an estimate, costs are extrapolated from the estimated costs of similar sites. Where sites require ongoing remediation, monitoring, or maintenance all estimated future costs are discounted using the province’s weighted average cost of capital. As at March 31, 2019, the weighted average cost of capital is 3.98% (2018: 4.05%).
As at the reporting date, 30 sites where historical industrial activity has occurred have been identified for monitoring purposes. Remediation activities are unlikely to be performed on these sites and any future cost is not determinable.
Additional environmental liabilities of government business enterprises include $284 million (2018: $317 million) accrued by British Columbia Hydro and Power Authority, and $94 million (2018: $93 million) accrued by British Columbia Railway Company. The liabilities are included in the investment balance of the Crown corporation or agency in Note 7.
Aboriginal Land Claims
Treaty negotiations between the province, Canada and First Nations commenced in 1994. The province anticipates these negotiations will result in modern–day treaties defining the boundaries and nature of First Nations treaty settlement lands. As of March 31, 2019, there were 65 First Nations in various stages of negotiation, including 40 First Nations in active or completed negotiations, representing two–thirds of the aboriginal people in British Columbia.
75
PROVINCE OF BRITISH COLUMBIA
PUBLIC ACCOUNTS 2018/19
Notes to Consolidated Summary Financial Statements
for the Fiscal Year Ended March 31, 2019—Continued
28. Contingent Liabilities and Contractual Obligations—Continued
When final treaty agreements are ratified by all parties, the provincial cost of treaties is recorded in the Public Accounts. Costs are accounted for based on the substance of the final agreement.
A Final Agreement with Yale First Nation was ratified by the Yale First Nation in March 2011, by the provincial government on June 2, 2011 and by the Parliament of Canada on June 19, 2013. Yale First Nation is now negotiating implementation of the treaty; however, a treaty effective date has not yet been agreed to by the parties. Through the treaty, the province will provide Yale with a capital transfer of $2.5 million, economic development funding of $1.1 million and 1,179 hectares of provincial Crown lands.
It is expected the capital transfer components in all Agreements in Principle will be entirely provided by Canada. The current commitments of provincial Crown land for all Final Agreement and Increment Treaty Agreement tables are as follows:
· In–SHUCK–ch, 9,474 hectares
· Yekooche, 5,960 hectares
· K’omoks, 1,733 hectares
· Tla–o–qui–aht, 47 hectares
· Nazko, 172 hectares
· Te’mexw (Malahat, Scia’new, Snaw–naw–as, Songhees and T’Sou–ke), 1,182 hectares
· Kitselas, 34,839 hectares
· Kitsumkalum, 44,661 hectares
· Wuikinuxv, 13,946 hectares
· Ditidaht, 71 hectares
· Pacheedaht, 596 hectares
· Ktunaxa Nation Council, 418 hectares
· Lake Babine Nation (BC only), 511 hectares with a one–time payment of $0.02 million
· Kaska Dena Council, 677 hectares
· Homalco, 822 hectares
· Lheidli T’enneh, 3,416 hectares
· NStQ (Canoe Creek, Sugar Cane, Canim Lake, Soda Creek), 3,758 hectares
Upon coming into effect, treaties will also trigger implementation costs and may result in compensation to third parties. Those costs are not determinable at this time.
Eighty per cent of funding for First Nations’ negotiation costs is in the form of loans from Canada and is repayable from treaty settlements. The province has committed to reimburse Canada 50% of any negotiation support loans that default along with 50% of the interest accrued. The amount of the loans from Canada to the First Nations at March 31, 2019 was approximately $547 million (2018: $550 million). The amount of any provincial liability is not determinable at this time.
Some First Nations have chosen not to negotiate through the formal British Columbia Treaty Commission process. A number of First Nations have chosen to advance their claims through litigation. Claims include declarations with respect to aboriginal rights and title, commercial rights, challenges with respect to adequacy of consultation and accommodation, and damages for unjustified infringements. The amount of any provincial liability is not determinable at this time.
76
PROVINCE OF BRITISH COLUMBIA
PUBLIC ACCOUNTS 2018/19
Notes to Consolidated Summary Financial Statements
for the Fiscal Year Ended March 31, 2019—Continued
28. Contingent Liabilities and Contractual Obligations—Continued
Crown Corporations, Agencies and School Districts, Universities, Colleges, Institutes and Health Organizations (SUCH)
(i) The BC Transportation Financing Authority has unrecorded contingent liabilities of $40 million (2018: $62 million), including $2 million (2018: $34 million) for expropriation claims and $25 million (2018: $25 million) for contaminated sites.
(ii) The B.C. Pavilion Corporation and predecessor property owners remain liable for environmental and reclamation obligations for known hazards that may exist at its facilities. Management is not aware of any existing environmental problems related to its facilities that may result in a material liability to the B.C. Pavilion Corporation.
(c) CONTRACTUAL OBLIGATIONS
The government has entered into a number of multiple–year contracts for the delivery of services and the construction of assets. These contractual obligations will become liabilities in the future when the terms of the contracts are met. Disclosure relates to the unperformed portion of the contracts. Contractual obligations are future–oriented financial information about non–discounted future cash payments for operating and capital contracts, and do not indicate when the related expenses will be recognized in the financial statements.
The following table presents the minimum amounts required to satisfy the contractual obligations, for contractual obligations that are greater than $50 million, by sector, by year. Details are available as unaudited supplementary information on the public website at http://gov.bc.ca/contractualobligations18_19.
| | In Millions | |
| | | | | | | | | | | | 2025 and | | | |
| | 2020 | | 2021 | | 2022 | | 2023 | | 2024 | | beyond | | Total | |
| | $ | | $ | | $ | | $ | | $ | | $ | | $ | |
Consolidated Revenue Fund and Taxpayer–supported Crown corporations and agencies | | | | | | | | | | | | | | | |
Health | | 2,171 | | 748 | | 575 | | 488 | | 444 | | 5,780 | | 10,206 | |
Education | | 591 | | 379 | | 174 | | 59 | | 34 | | 158 | | 1,395 | |
Social services | | 230 | | 9 | | 1 | | | | | | | | 240 | |
Natural resources and economic development | | 60 | | 27 | | 28 | | 15 | | 15 | | 97 | | 242 | |
Other | | 464 | | 253 | | 235 | | 214 | | 194 | | 4,808 | | 6,168 | |
Transportation | | 1,138 | | 586 | | 478 | | 480 | | 475 | | 9,684 | | 12,841 | |
Protection of persons and property | | 377 | | 368 | | 370 | | 368 | | 368 | | 3,126 | | 4,977 | |
General government | | 434 | | 276 | | 116 | | 73 | | 49 | | 165 | | 1,113 | |
| | 5,465 | | 2,646 | | 1,977 | | 1,697 | | 1,579 | | 23,818 | | 37,182 | |
Self–supported Crown corporations and agencies | | | | | | | | | | | | | | | |
Natural resources and economic development | | 3,141 | | 2,858 | | 2,634 | | 2,289 | | 2,362 | | 44,223 | | 57,507 | |
Protection of persons and property | | 21 | | 21 | | 16 | | 13 | | 11 | | 25 | | 107 | |
General government | | 102 | | 59 | | 57 | | 57 | | 55 | | 159 | | 489 | |
| | 3,264 | | 2,938 | | 2,707 | | 2,359 | | 2,428 | | 44,407 | | 58,103 | |
Total | | 8,729 | | 5,584 | | 4,684 | | 4,056 | | 4,007 | | 68,225 | | 95,285 | |
77
PROVINCE OF BRITISH COLUMBIA
PUBLIC ACCOUNTS 2018/19
Notes to Consolidated Summary Financial Statements
for the Fiscal Year Ended March 31, 2019—Continued
29. Taxation Revenue
| | In Millions | |
| | 2019 | | 2018 | |
| | $ | | $ | |
Personal income | | 11,364 | | 8,923 | |
Provincial sales | | 7,362 | | 7,118 | |
Corporate income | | 5,180 | | 4,165 | |
Property | | 2,617 | | 2,367 | |
Property transfer | | 1,826 | | 2,141 | |
Carbon | | 1,465 | | 1,255 | |
Fuel | | 1,015 | | 1,010 | |
Tobacco | | 781 | | 727 | |
Employer health | | 464 | | | |
Harmonized sales | | 7 | | 13 | |
Other | | 633 | | 602 | |
| | 32,714 | | 28,321 | |
Personal income tax and corporate income tax revenues are recorded after deductions for non–refundable tax credits. Deductions allowable in the calculation of personal income tax revenue were $110 million (2018: $91 million) and corporate income tax were $108 million (2018: $111 million). The types of tax credits adjusting personal income tax and corporation income tax revenues are for foreign taxes, logging taxes, venture capital, scientific and experimental development tax, and mining flow–through share.
Personal income tax revenue was also reduced by $162 million (2018: $161 million) for the BC Tax Reduction.
Personal and corporate income tax refunds may be issued under the International Business Activity Act. Corporate income tax refunds were $8 million (2018: $11 million).
Property tax revenue was recorded net of home owner grants of $829 million (2018: $814 million).
30. Natural Resource Revenue
| | In Millions | |
| | 2019 | | 2018 | |
| | $ | | $ | |
Forests | | 1,406 | | 1,065 | |
Petroleum, natural gas and minerals | | 1,035 | | 1,056 | |
Water and other | | 667 | | 574 | |
| | 3,108 | | 2,695 | |
Oil and gas royalty revenues are reported after adjustments for various royalty deduction programs such as producer cost of service allowances, deep well, marginal, ultra marginal, low production, net profit, new pool discovery and road construction. Deductions allowable in the calculation of royalty revenue were $631 million (2018: $447 million). Natural resource revenue includes mining taxes of $404 million (2018: $483 million) and logging taxes of $123 million (2018: $59 million).
The province offers credits for certain costs incurred by producers including the deep well, road and summer drilling programs. Deep well credits of $2,622 million (2018: $2,590 million), road credits of $27 million (2018: $22 million) and summer drilling credits of $3 million (2018: $3 million) have been incurred by producers and will reduce future natural gas royalties payable when wells go into production.
78
PROVINCE OF BRITISH COLUMBIA
PUBLIC ACCOUNTS 2018/19
Notes to Consolidated Summary Financial Statements
for the Fiscal Year Ended March 31, 2019—Continued
31. Expense
| | In Millions | |
| | 2019 | | 2018 | |
| | $ | | $ | |
Total Expense by Group Account Classification | | | | | |
Salaries and benefits | | 21,144 | | 19,865 | |
Government transfers | | 15,228 | | 13,373 | |
Operating costs | | 13,297 | | 12,710 | |
Interest1 | | 2,684 | | 2,623 | |
Amortization | | 2,367 | | 2,250 | |
Other | | 873 | | 885 | |
| | 55,593 | | 51,706 | |
1Includes foreign exchange loss amortization of $2 million (2018: loss amortization of nil).
32. Valuation Allowances
| | In Millions | |
| | 2019 | | 2018 | |
| | $ | | $ | |
Accounts receivable | | 156 | | 174 | |
Tangible capital assets | | 38 | | 51 | |
Other investments | | | | 13 | |
Loans, advances and mortgages receivable | | 13 | | | |
| | 207 | | 238 | |
These amounts are included in “Other” of “Total Expense by Group Account Classification” in Note 31, and represent the write–down of assets in the above Consolidated Statement of Financial Position categories.
79
PROVINCE OF BRITISH COLUMBIA
PUBLIC ACCOUNTS 2018/19
Notes to Consolidated Summary Financial Statements
for the Fiscal Year Ended March 31, 2019—Continued
33. Trusts Under Administration
Trusts Under Administration are not included in the Summary Financial Statements, because the province has no equity in or power of appropriation over these trusts. The province administers these trusts on behalf of third parties according to the terms of the underlying trust arrangements. The trust assets consist of cash, term deposits, investments, real estate and other sundry assets. Trust liabilities consist of trade payables, loans payable, and mortgages payable. Summary financial information from the financial statements of trust funds is provided below.
| | In Millions | |
| | Assets | | Liabilities | | 2019 | | 2018 | |
| | $ | | $ | | $ | | $ | |
Public Guardian and Trustee of British Columbia1 —administered by government officials | | 1,079 | | (42 | ) | 1,037 | | 980 | |
Credit Union Deposit Insurance Corporation of British Columbia1 —administered by various government officials and a non–government investment corporation | | 721 | | (2 | ) | 719 | | 646 | |
Supreme and provincial court (Suitors’ Funds) —administered by the Courts | | 130 | | | | 130 | | 120 | |
Other trust funds —administered by various government officials | | 193 | | (46 | ) | 147 | | 135 | |
| | 2,123 | | (90 | ) | 2,033 | | 1,881 | |
1These organizations are reported under International Financial Reporting Standards. Their financial statements are draft and unaudited when the Public Accounts are prepared.
34. Comparison to Estimates
The Estimates numbers on the Statement of Operations are taken from the Estimated Statement of Operations, the Estimated Revenue by Source, and the Estimated Expense by Function, on pages 4 – 6 of the Estimates, Fiscal Year Ending March 31, 2019, presented to the Legislative Assembly February 20, 2018. The original Estimates do not include Supplementary Estimates of $375 million that were approved by the Legislature during the 2018/19 fiscal year.
80
PROVINCE OF BRITISH COLUMBIA
PUBLIC ACCOUNTS 2018/19
Notes to Consolidated Summary Financial Statements
for the Fiscal Year Ended March 31, 2019—Continued
35. Comparatives
Comparative figures have been restated to conform with the current year’s presentation. The effect of restatements on the previously reported operating result is disclosed in Note 26.
36. Asset Retirement Obligations1
| | In Millions | |
| | 2019 | | 2018 | |
| | $ | | $ | |
Consolidated Revenue Fund and Taxpayer–supported Crown corporations and agencies | | | | | |
Education | | 23 | | 21 | |
Natural resources and economic development | | 11 | | 10 | |
Health | | 2 | | 3 | |
| | 36 | | 34 | |
Self–supported Crown corporations and agencies | | | | | |
Transportation | | 203 | | 177 | |
Natural resources and economic development | | 53 | | 53 | |
General government | | 1 | | 2 | |
| | 257 | | 232 | |
| | 293 | | 266 | |
1Additional asset retirement obligation costs exist which have not been recognized because they cannot be reasonably estimated at this time. Self–supported Crown corporations’ balances in the natural resources and economic development, transportation and general government sectors are calculated using International Financial Reporting Standards.
81
PROVINCE OF BRITISH COLUMBIA
PUBLIC ACCOUNTS 2018/19
Notes to Consolidated Summary Financial Statements
for the Fiscal Year Ended March 31, 2019—Continued
37. Government Partnerships
Canadian Blood Services owns and operates the national blood supply system for Canada, except for the province of Quebec. It is a government partnership amongst Canadian provinces and territories. The ministers of health for the provinces and territories, except Quebec, provide contributions to fund its operations. Its financial results are proportionately consolidated with those of the province based upon the province’s share of its total provincial contributions (14.67%). The amounts included in these financial statements are as follows:
Consolidated Statement of Financial Position
| | In Millions | |
| | 2019 | | 2018 | |
| | $ | | $ | |
Financial assets | | 109 | | 106 | |
Liabilities | | 133 | | 132 | |
Net liabilities | | (24 | ) | (26 | ) |
Non–financial assets | | 63 | | 62 | |
Accumulated surplus (deficit) | | 39 | | 36 | |
Consolidated Statement of Operations
| | In Millions | |
| | 2019 | | 2018 | |
| | $ | | $ | |
Revenue | | 175 | | 185 | |
Expenses | | 172 | | 182 | |
Surplus (deficit) for the year | | 3 | | 3 | |
Accumulated surplus (deficit)—beginning of year | | 36 | | 33 | |
Accumulated surplus (deficit)—end of year | | 39 | | 36 | |
38. Regulatory Accounting
Included in the Summary Financial Statements are entities that are regulated by the independent British Columbia Utilities Commission (the Commission). The Commission is responsible for regulating utilities in British Columbia which includes establishing tariffs, approving the construction of new facilities planned by utilities, and their issuance of securities. As an independent provincial agency, the operating results of the Commission are also included in the Summary Financial Statements.
Rate–regulation can result in the deferral and amortization of costs and recoveries to allow for adjustment of future rates. In the absence of rate–regulation, these amounts would otherwise be included in the determination of net income in the year the amounts are incurred. BC Hydro had unamortized net regulatory assets at the end of March 31, 2019 of $4,194 million (2018: $5,140 million). Regulatory accounting resulted in a decrease to net income for BC Hydro for the year ended March 31, 2019 of $1,119 million (2018: $51 million increase). Further details are available in BC Hydro’s financial statements outside these audited financial statements at http://gov.bc.ca/financepublications.
An adjustment of $950 million to reduce net regulatory assets in the Summary Financial Statements was included in fiscal year 2018.
82
PROVINCE OF BRITISH COLUMBIA
PUBLIC ACCOUNTS 2018/19
Notes to Consolidated Summary Financial Statements
for the Fiscal Year Ended March 31, 2019—Continued
39. Subsequent Events
Columbia Basin Trust and Columbia Power Corporation
On April 16, 2019, Columbia Basin Trust and Columbia Power Corporation concluded an agreement to purchase Fortis Inc.’s 51% interest in the Waneta Expansion Limited Partnership for $991 million. This purchase will be reported proportionately within each organization beginning in fiscal year 2019/20.
83
PROVINCE OF BRITISH COLUMBIA
PUBLIC ACCOUNTS 2018/19
Supplementary Statement to the
Consolidated Summary Financial Statements
Reporting Entity
for the Fiscal Year Ended March 31, 2019
TAXPAYER–SUPPORTED CROWN CORPORATIONS AND AGENCIES
(GOVERNMENT ORGANIZATIONS)
RECORDED ON A CONSOLIDATED BASIS
Consolidated Revenue Fund1
Health Sector
BC Clinical and Support Services Society2
Canadian Blood Services3
Fraser Health Authority
Interior Health Authority
Louis Brier Home and Hospital
Menno Hospital
Mount St. Mary Hospital
Nisga’a Valley Health Authority
Northern Health Authority
Providence Health Care
Provincial Health Services Authority
St Joseph’s General Hospital
St Michael’s Centre
Vancouver Coastal Health Authority
Vancouver Island Health Authority
Education Sector
BCNET
British Columbia Institute of Technology
Camosun College
Capilano University
Coast Mountain College4
College of New Caledonia
College of the Rockies
Douglas College
Emily Carr University of Art & Design
Industry Training Authority
Justice Institute of British Columbia
Knowledge Network Corporation
Kwantlen Polytechnic University
Langara College
Nicola Valley Institute of Technology
North Island College
Northern Lights College
Okanagan College
85
PROVINCE OF BRITISH COLUMBIA
PUBLIC ACCOUNTS 2018/19
Supplementary Statement to the
Consolidated Summary Financial Statements
Reporting Entity
for the Fiscal Year Ended March 31, 2019—Continued
TAXPAYER–SUPPORTED CROWN CORPORATIONS AND AGENCIES
(GOVERNMENT ORGANIZATIONS)
RECORDED ON A CONSOLIDATED BASIS
Education Sector—Continued
Royal Roads University
School Districts
Selkirk College
Simon Fraser University
The British Columbia Council for International Education
The University of British Columbia
Thompson Rivers University
University of the Fraser Valley
University of Northern British Columbia
University of Victoria
Vancouver Community College
Vancouver Island University
Natural Resources and Economic Development Sector
BC Immigrant Investment Fund Ltd
BC Infrastructure Benefits Inc.5
B.C. Pavilion Corporation
British Columbia Enterprise Corporation
Columbia Basin Trust
Creston Valley Wildlife Management Authority Trust Fund
Destination BC Corp.
Forest Enhancement Society of BC
Forestry Innovation Investment Ltd
Innovate BC
Nechako–Kitamaat Development Fund Society
Oil and Gas Commission
Partnerships British Columbia Inc
Transportation Sector
BC Transportation Financing Authority
British Columbia Transit
Transportation Investment Corporation6
Protection of Persons and Property Sector
British Columbia Securities Commission
Organized Crime Agency of British Columbia Society
Real Estate Council of British Columbia
Real Estate Foundation of British Columbia
86
PROVINCE OF BRITISH COLUMBIA
PUBLIC ACCOUNTS 2018/19
Supplementary Statement to the
Consolidated Summary Financial Statements
Reporting Entity
for the Fiscal Year Ended March 31, 2019—Continued
TAXPAYER–SUPPORTED CROWN CORPORATIONS AND AGENCIES
(GOVERNMENT ORGANIZATIONS)
RECORDED ON A CONSOLIDATED BASIS
Social Services Sector
Community Living British Columbia
Legal Services Society
Other Sector
BC Games Society
British Columbia Assessment Authority
British Columbia Housing Management Commission
British Columbia Public School Employers’ Association
Community Social Services Employers’ Association of British Columbia
Crown Corporations Employers’ Association
First Peoples’ Heritage, Language and Culture Council
Health Employers Association of British Columbia
Post–Secondary Employers’ Association
Provincial Rental Housing Corporation
The Royal British Columbia Museum Corporation
SELF–SUPPORTED CROWN CORPORATIONS AND AGENCIES
(GOVERNMENT BUSINESS ENTERPRISES)
RECORDED ON A MODIFIED EQUITY BASIS6
British Columbia Hydro and Power Authority7
British Columbia Liquor Distribution Branch8
British Columbia Lottery Corporation8
Columbia Power Corporation7
Insurance Corporation of British Columbia9
1The Consolidated Revenue Fund has been allocated to the appropriate sector on the Consolidated Statement of Financial Position by Sector (page 88) and on the Consolidated Statement of Operations by Sector (page 92).
2This organization was amalgamated into Provincial Health Services Authority during the year.
3This organization reflects a government partnership amongst Canadian provinces and is proportionally consolidated based upon the province’s share (14.67%) of the total provincial contributions to the partnership.
4Formerly Northwest Community College.
5This organization was established during the year.
6Transportation Investment Corporation’s results were included in BC Transportation Financing Authority effective April 1, 2018.
7These organizations were included in the Natural Resources and Economic Development Sector results.
8These organizations were included in the General Government Sector results.
9This organization was included in the Protection of Persons and Property Sector results.
87
PROVINCE OF BRITISH COLUMBIA
PUBLIC ACCOUNTS 2018/19
Supplementary Statement to the Summary Financial Statements
Consolidated Statement of Financial Position by Sector
as at March 31, 2019
| | In Millions | |
| | | | | | | | | | | | | | | | | | Natural Resources and | |
| | | | | | | | | | | | | | | | | | Economic | |
| | Health | | Education | | Social Services | | Debt Servicing1 | | Development | |
| | 2019 | | 2018 | | 2019 | | 2018 | | 2019 | | 2018 | | 2019 | | 2018 | | 2019 | | 2018 | |
| | $ | | $ | | $ | | $ | | $ | | $ | | $ | | $ | | $ | | $ | |
Financial Assets | | | | | | | | | | | | | | | | | | | | | |
Cash and cash equivalents | | 1,498 | | 1,695 | | 2,652 | | 2,590 | | 4 | | 13 | | (130 | ) | 92 | | 250 | | 254 | |
Temporary investments | | 1 | | 8 | | 90 | | 108 | | 3 | | 5 | | | | | | 236 | | 242 | |
Accounts receivable | | 733 | | 737 | | 354 | | 260 | | 42 | | 44 | | 350 | | 344 | | 437 | | 434 | |
Inventories for resale | | 2 | | 2 | | 26 | | 32 | | | | | | | | | | 32 | | 29 | |
Due from Crown corporations and agencies | | 3 | | 4 | | 26 | | 9 | | 1 | | 2 | | | | | | 6 | | 1 | |
Due from other governments | | 58 | | 50 | | 65 | | 41 | | 35 | | 32 | | | | | | 135 | | 77 | |
Due from self–supported Crown corporations and agencies | | | | | | 66 | | 73 | | | | | | | | | | 151 | | 220 | |
Equity in self–supported Crown corporations and agencies | | | | | | 163 | | 68 | | | | | | | | | | 5,290 | | 4,914 | |
Loans, advances and mortgages receivable | | 5 | | 5 | | 779 | | 992 | | 1 | | 1 | | | | | | 98 | | 131 | |
Other investments | | 72 | | 68 | | 2,265 | | 1,959 | | 4 | | 5 | | 9 | | 9 | | 321 | | 359 | |
Sinking fund investments | | | | | | 49 | | 44 | | | | | | 752 | | 1,348 | | | | | |
Loans for purchase of assets, recoverable from agencies | | | | | | | | | | | | | | 33,613 | | 30,659 | | | | | |
| | 2,372 | | 2,569 | | 6,535 | | 6,176 | | 90 | | 102 | | 34,594 | | 32,452 | | 6,956 | | 6,661 | |
88
PROVINCE OF BRITISH COLUMBIA
PUBLIC ACCOUNTS 2018/19
Supplementary Statement to the Summary Financial Statements
Consolidated Statement of Financial Position by Sector—Continued
as at March 31, 2019
| | In Millions | |
| | | | | | | | | | Protection of Persons | | | | | | | | | | | | | |
| | Other2 | | Transportation | | and Property | | General Government3 | | Adjustments4 | | Total | |
| | 2019 | | 2018 | | 2019 | | 2018 | | 2019 | | 2018 | | 2019 | | 2018 | | 2019 | | 2018 | | 2019 | | 2018 | |
| | $ | | $ | | $ | | $ | | $ | | $ | | $ | | $ | | $ | | $ | | $ | | $ | |
Financial Assets | | | | | | | | | | | | | | | | | | | | | | | | | |
Cash and cash equivalents | | 458 | | 626 | | 51 | | 65 | | 35 | | 18 | | 325 | | 322 | | (2,545 | ) | (2,706 | ) | 2,598 | | 2,969 | |
Temporary investments | | 101 | | 108 | | | | | | | | | | | | | | | | | | 431 | | 471 | |
Accounts receivable | | 301 | | 369 | | 39 | | 36 | | 86 | | 91 | | 3,097 | | 2,389 | | (134 | ) | (118 | ) | 5,305 | | 4,586 | |
Inventories for resale | | 1 | | 1 | | 12 | | 8 | | 2 | | 2 | | 2 | | 2 | | | | | | 77 | | 76 | |
Due from Crown corporations and agencies | | 1 | | 16 | | 50 | | 37 | | | | | | | | | | (87 | ) | (69 | ) | 0 | | 0 | |
Due from other governments | | 8 | | 51 | | 161 | | 107 | | 289 | | 401 | | 522 | | 666 | | | | | | 1,273 | | 1,425 | |
Due from self–supported Crown corporations and agencies | | | | | | | | | | | | 5 | | 276 | | 216 | | | | | | 493 | | 514 | |
Equity in self–supported Crown corporations and agencies | | | | | | 200 | | 192 | | 129 | | 995 | | (65 | ) | (58 | ) | | | | | 5,717 | | 6,111 | |
Loans, advances and mortgages receivable | | 387 | | 309 | | | | | | 1 | | 1 | | 1,165 | | 971 | | (63 | ) | (92 | ) | 2,373 | | 2,318 | |
Other investments | | 181 | | 179 | | 75 | | 76 | | 76 | | 76 | | | | | | | | | | 3,003 | | 2,731 | |
Sinking fund investments | | | | | | 96 | | 96 | | | | | | | | | | (145 | ) | (140 | ) | 752 | | 1,348 | |
Loans for purchase of assets, recoverable from agencies | | | | | | | | | | | | | | | | | | (11,066 | ) | (10,125 | ) | 22,547 | | 20,534 | |
| | 1,438 | | 1,659 | | 684 | | 617 | | 618 | | 1,589 | | 5,322 | | 4,508 | | (14,040 | ) | (13,250 | ) | 44,569 | | 43,083 | |
89
PROVINCE OF BRITISH COLUMBIA
PUBLIC ACCOUNTS 2018/19
Supplementary Statement to the Summary Financial Statements
Consolidated Statement of Financial Position by Sector—Continued
as at March 31, 2019
| | In Millions | |
| | | | | | | | | | | | | | | | | | Natural Resources and | |
| | | | | | | | | | | | | | | | | | Economic | |
| | Health | | Education | | Social Services | | Debt Servicing1 | | Development | |
| | 2019 | | 2018 | | 2019 | | 2018 | | 2019 | | 2018 | | 2019 | | 2018 | | 2019 | | 2018 | |
| | $ | | $ | | $ | | $ | | $ | | $ | | $ | | $ | | $ | | $ | |
Liabilities | | | | | | | | | | | | | | | | | | | | | |
Accounts payable and accrued liabilities | | 1,570 | | 1,478 | | 1,258 | | 1,191 | | 90 | | 97 | | 737 | | 654 | | 1,353 | | 1,105 | |
Employee future benefits | | 1,258 | | 1,183 | | 515 | | 511 | | 26 | | 27 | | | | | | 30 | | 31 | |
Due to other governments | | 70 | | 71 | | 14 | | 15 | | | | | | | | | | 30 | | 54 | |
Due to Crown corporations, agencies and trust funds | | 22 | | 4 | | 4 | | 4 | | 2 | | 1 | | 2,555 | | 2,717 | | 2 | | 18 | |
Due to the Province of British Columbia | | | | | | | | | | 6 | | 6 | | | | | | 16 | | 10 | |
Deferred revenue | | 2,423 | | 2,344 | | 4,246 | | 3,772 | | 11 | | 37 | | 82 | | 100 | | 1,117 | | 1,318 | |
Employee pension plans | | | | | | 64 | | 118 | | | | | | | | | | | | | |
Taxpayer–supported debt | | 1,797 | | 1,763 | | 847 | | 822 | | | | | | 39,630 | | 41,091 | | 202 | | 299 | |
Self–supported debt | | | | | | | | | | | | | | 22,655 | | 20,619 | | | | | |
| | 7,140 | | 6,843 | | 6,948 | | 6,433 | | 135 | | 168 | | 65,659 | | 65,181 | | 2,750 | | 2,835 | |
Net assets (liabilities) | | (4,768 | ) | (4,274 | ) | (413 | ) | (257 | ) | (45 | ) | (66 | ) | (31,065 | ) | (32,729 | ) | 4,206 | | 3,826 | |
Non–financial Assets | | | | | | | | | | | | | | | | | | | | | |
Tangible capital assets | | 8,248 | | 7,954 | | 16,381 | | 15,549 | | 172 | | 179 | | | | | | 2,295 | | 2,304 | |
Restricted assets | | 5 | | 5 | | 1,827 | | 1,761 | | | | | | | | | | | | | |
Prepaid program costs | | 271 | | 294 | | 139 | | 111 | | 33 | | 2 | | | | | | 245 | | 218 | |
Other assets | | 31 | | 50 | | 5 | | 3 | | | | | | 43 | | 52 | | 1 | | | |
| | 8,555 | | 8,303 | | 18,352 | | 17,424 | | 205 | | 181 | | 43 | | 52 | | 2,541 | | 2,522 | |
Accumulated surplus (deficit) | | 3,787 | | 4,029 | | 17,939 | | 17,167 | | 160 | | 115 | | (31,022 | ) | (32,677 | ) | 6,747 | | 6,348 | |
90
PROVINCE OF BRITISH COLUMBIA
PUBLIC ACCOUNTS 2018/19
Supplementary Statement to the Summary Financial Statements
Consolidated Statement of Financial Position by Sector—Continued
as at March 31, 2019
| | In Millions | |
| | | | | | | | | | Protection of Persons | | | | | | | | | | | | | |
| | Other2 | | Transportation | | and Property | | General Government3 | | Adjustments4 | | Total | |
| | 2019 | | 2018 | | 2019 | | 2018 | | 2019 | | 2018 | | 2019 | | 2018 | | 2019 | | 2018 | | 2019 | | 2018 | |
| | $ | | $ | | $ | | $ | | $ | | $ | | $ | | $ | | $ | | $ | | $ | | $ | |
Liabilities | | | | | | | | | | | | | | | | | | | | | | | | | |
Accounts payable and accrued liabilities | | 530 | | 491 | | 656 | | 510 | | 349 | | 265 | | 919 | | 830 | | (163 | ) | (135 | ) | 7,299 | | 6,486 | |
Employee future benefits | | 12 | | 11 | | 31 | | 31 | | 42 | | 40 | | 535 | | 536 | | | | | | 2,449 | | 2,370 | |
Due to other governments | | 102 | | 1 | | | | 1 | | 222 | | 194 | | 106 | | 228 | | | | | | 544 | | 564 | |
Due to Crown corporations, agencies and trust funds | | 68 | | 69 | | | | | | 1 | | 4 | | 1 | | | | (2,577 | ) | (2,738 | ) | 78 | | 79 | |
Due to the Province of British Columbia | | 3 | | 4 | | 1 | | | | | | | | | | | | (26 | ) | (20 | ) | 0 | | 0 | |
Deferred revenue | | 152 | | 115 | | 2,056 | | 1,925 | | 303 | | 303 | | 14 | | 14 | | | | | | 10,404 | | 9,928 | |
Employee pension plans | | | | | | | | | | | | | | 1 | | 1 | | | | | | 65 | | 119 | |
Taxpayer–supported debt | | 225 | | 259 | | 11,535 | | 10,650 | | | | | | 247 | | 225 | | (11,274 | ) | (10,357 | ) | 43,209 | | 44,752 | |
Self–supported debt | | | | | | | | | | | | | | | | | | | | | | 22,655 | | 20,619 | |
| | 1,092 | | 950 | | 14,279 | | 13,117 | | 917 | | 806 | | 1,823 | | 1,834 | | (14,040 | ) | (13,250 | ) | 86,703 | | 84,917 | |
Net assets (liabilities) | | 346 | | 709 | | (13,595 | ) | (12,500 | ) | (299 | ) | 783 | | 3,499 | | 2,674 | | 0 | | 0 | | (42,134 | ) | (41,834 | ) |
Non–financial Assets | | | | | | | | | | | | | | | | | | | | | | | | | |
Tangible capital assets | | 2,054 | | 1,624 | | 17,215 | | 16,913 | | 96 | | 88 | | 1,386 | | 1,243 | | (17 | ) | (17 | ) | 47,830 | | 45,837 | |
Restricted assets | | | | | | 2 | | 2 | | | | | | | | | | | | | | 1,834 | | 1,768 | |
Prepaid program costs | | 43 | | 45 | | 28 | | 22 | | 10 | | 4 | | 78 | | 72 | | | | | | 847 | | 768 | |
Other assets | | | | | | 125 | | 137 | | | | | | | | | | | | | | 205 | | 242 | |
| | 2,097 | | 1,669 | | 17,370 | | 17,074 | | 106 | | 92 | | 1,464 | | 1,315 | | (17 | ) | (17 | ) | 50,716 | | 48,615 | |
Accumulated surplus (deficit) | | 2,443 | | 2,378 | | 3,775 | | 4,574 | | (193 | ) | 875 | | 4,963 | | 3,989 | | (17 | ) | (17 | ) | 8,582 | | 6,781 | |
1Debt servicing represents the financial impacts of activities related to management of the public debt.
2The Other Sector consists of activities, such as housing and culture, which cannot be allocated to any of the specifically described sector classifications.
3Includes the Legislature, tax collection and administration, Canadian Health and Social Transfers from the federal government, liquor and gaming profits, general administration and central agency services such as accounting, auditing, budgeting, insurance and risk management to all sectors.
4Represents sectoral adjustments to conform to government accounting policies and to eliminate transactions between sectors.
91
PROVINCE OF BRITISH COLUMBIA
PUBLIC ACCOUNTS 2018/19
Supplementary Statement to the Summary Financial Statements
Consolidated Statement of Operations by Sector
for the Fiscal Year Ended March 31, 2019
| | In Millions | |
| | | | | | | | | | | | | | | | | | Natural Resources and
Economic
Development | |
| | | | | | | | | | | | | | | | | | |
| | Health | | Education | | Social Services | | Debt Servicing1 | | |
| | 2019 | | 2018 | | 2019 | | 2018 | | 2019 | | 2018 | | 2019 | | 2018 | | 2019 | | 2018 | |
| | $ | | $ | | $ | | $ | | $ | | $ | | $ | | $ | | $ | | $ | |
Revenue | | | | | | | | | | | | | | | | | | | | | |
Taxation | | | | | | | | | | | | | | | | | | | | | |
Contributions from the federal government | | 161 | | 91 | | 1,133 | | 1,031 | | 183 | | 106 | | | | | | 171 | | 124 | |
Fees and licenses | | 1,840 | | 2,736 | | 2,567 | | 2,321 | | 4 | | 4 | | | | | | 116 | | 148 | |
Miscellaneous | | 1,177 | | 1,079 | | 1,400 | | 1,426 | | 16 | | 17 | | | | | | 183 | | 161 | |
Contributions from the provincial government / net earnings of self–supported Crown corporations and agencies | | 61 | | 61 | | 224 | | 223 | | 18 | | 21 | | | | | | 647 | | (158 | ) |
Natural resources | | | | | | | | | | | | | | | | | | 3,108 | | 2,695 | |
Investment income | | 29 | | 22 | | 236 | | 216 | | 2 | | 2 | | 1,254 | | 1,225 | | 36 | | 48 | |
Total revenue | | 3,268 | | 3,989 | | 5,560 | | 5,217 | | 223 | | 150 | | 1,254 | | 1,225 | | 4,261 | | 3,018 | |
92
PROVINCE OF BRITISH COLUMBIA
PUBLIC ACCOUNTS 2018/19
Supplementary Statement to the Summary Financial Statements
Consolidated Statement of Operations by Sector—Continued
for the Fiscal Year Ended March 31, 2019
| | In Millions | |
| | | | | | | | | | Protection of Persons | | | | | | | | | | | | | |
| | Other2 | Transportation | | and Property | | General Government3 | | Adjustments4 | | Total | |
| | 2019 | | 2018 | | 2019 | | 2018 | | 2019 | | 2018 | | 2019 | | 2018 | | 2019 | | 2018 | | 2019 | | 2018 | |
| | $ | | $ | | $ | | $ | | $ | | $ | | $ | | $ | | $ | | $ | | $ | | $ | |
Revenue | | | | | | | | | | | | | | | | | | | | | | | | | |
Taxation | | 93 | | 91 | | 567 | | 556 | | | | | | 32,054 | | 27,674 | | | | | | 32,714 | | 28,321 | |
Contributions from the federal government | | 94 | | 211 | | 138 | | 108 | | 49 | | 507 | | 7,123 | | 6,877 | | | | | | 9,052 | | 9,055 | |
Fees and licenses | | 35 | | 30 | | 55 | | 61 | | 945 | | 918 | | 31 | | 31 | | | | | | 5,593 | | 6,249 | |
Miscellaneous | | 81 | | 113 | | 72 | | 3,808 | | 177 | | 184 | | 404 | | 537 | | (97 | ) | (3,782 | ) | 3,413 | | 3,543 | |
Contributions from the provincial government / net earnings of self–supported Crown corporations and agencies | | 35 | | 103 | | 22 | | 34 | | (1,153 | ) | (1,324 | ) | 2,509 | | 2,510 | | (358 | ) | (414 | ) | 2,005 | | 1,056 | |
Natural resources | | | | | | | | | | | | | | | | | | | | | | 3,108 | | 2,695 | |
Investment income | | 15 | | 12 | | 11 | | (131 | ) | 3 | | 4 | | 110 | | 100 | | (453 | ) | (397 | ) | 1,243 | | 1,101 | |
Total revenue | | 353 | | 560 | | 865 | | 4,436 | | 21 | | 289 | | 42,231 | | 37,729 | | (908 | ) | (4,593 | ) | 57,128 | | 52,020 | |
93
PROVINCE OF BRITISH COLUMBIA
PUBLIC ACCOUNTS 2018/19
Supplementary Statement to the Summary Financial Statements
Consolidated Statement of Operations by Sector—Continued
for the Fiscal Year Ended March 31, 2019
| | In Millions | |
| | | | | | | | | | | | | | | | | | Natural Resources and | |
| | | | | | | | | | | | | | | | | | Economic | |
| | Health | | Education | | Social Services | | Debt Servicing1 | | Development | |
| | 2019 | | 2018 | | 2019 | | 2018 | | 2019 | | 2018 | | 2019 | | 2018 | | 2019 | | 2018 | |
| | $ | | $ | | $ | | $ | | $ | | $ | | $ | | $ | | $ | | $ | |
Expense | | | | | | | | | | | | | | | | | | | | | |
Salaries and benefits | | 8,700 | | 8,130 | | 9,440 | | 8,864 | | 492 | | 447 | | | | | | 695 | | 646 | |
Government transfers | | 5,961 | | 5,622 | | 1,408 | | 1,157 | | 3,710 | | 3,227 | | | | | | 1,749 | | 1,381 | |
Operating costs | | 6,931 | | 6,592 | | 2,255 | | 2,134 | | 1,124 | | 1,038 | | | | | | 1,026 | | 1,035 | |
Interest | | 120 | | 115 | | 43 | | 41 | | | | | | 2,528 | | 2,447 | | 6 | | 6 | |
Amortization | | 600 | | 584 | | 807 | | 777 | | 22 | | 20 | | | | | | 119 | | 108 | |
Other | | 236 | | 268 | | 230 | | 213 | | 59 | | 66 | | | | | | 254 | | 239 | |
Operating expense | | 22,548 | | 21,311 | | 14,183 | | 13,186 | | 5,407 | | 4,798 | | 2,528 | | 2,447 | | 3,849 | | 3,415 | |
Surplus (deficit) for the Fiscal Year ended March 31 | | (19,280 | ) | (17,322 | ) | (8,623 | ) | (7,969 | ) | (5,184 | ) | (4,648 | ) | (1,274 | ) | (1,222 | ) | 412 | | (397 | ) |
94
PROVINCE OF BRITISH COLUMBIA
PUBLIC ACCOUNTS 2018/19
Supplementary Statement to the Summary Financial Statements
Consolidated Statement of Operations by Sector—Continued
for the Fiscal Year Ended March 31, 2019
| | In Millions | |
| | | | | | | | | | Protection of Persons | | | | | | | | | | | | | |
| | Other2 | | Transportation | | and Property | | General Government3 | | Adjustments4 | | Total | |
| | 2019 | | 2018 | | 2019 | | 2018 | | 2019 | | 2018 | | 2019 | | 2018 | | 2019 | | 2018 | | 2019 | | 2018 | |
| | $ | | $ | | $ | | $ | | $ | | $ | | $ | | $ | | $ | | $ | | $ | | $ | |
Expense | | | | | | | | | | | | | | | | | | | | | | | | | |
Salaries and benefits | | 208 | | 184 | | 183 | | 175 | | 892 | | 825 | | 534 | | 594 | | | | | | 21,144 | | 19,865 | |
Government transfers | | 1,372 | | 1,148 | | 202 | | 148 | | 796 | | 866 | | 276 | | 111 | | (246 | ) | (287 | ) | 15,228 | | 13,373 | |
Operating costs | | 141 | | 151 | | 1,005 | | 974 | | 293 | | 263 | | 527 | | 526 | | (5 | ) | (3 | ) | 13,297 | | 12,710 | |
Interest | | 10 | | 12 | | 418 | | 388 | | | | | | 12 | | 11 | | (453 | ) | (397 | ) | 2,684 | | 2,623 | |
Amortization | | 86 | | 67 | | 617 | | 585 | | 20 | | 19 | | 96 | | 90 | | | | | | 2,367 | | 2,250 | |
Other | | 16 | | 16 | | 22 | | 49 | | 20 | | 27 | | 240 | | 3,913 | | (204 | ) | (3,906 | ) | 873 | | 885 | |
Operating expense | | 1,833 | | 1,578 | | 2,447 | | 2,319 | | 2,021 | | 2,000 | | 1,685 | | 5,245 | | (908 | ) | (4,593 | ) | 55,593 | | 51,706 | |
Surplus (deficit) for the Fiscal Year ended March 31 | | (1,480 | ) | (1,018 | ) | (1,582 | ) | 2,117 | | (2,000 | ) | (1,711 | ) | 40,546 | | 32,484 | | 0 | | 0 | | 1,535 | | 314 | |
1Debt servicing represents the financial impacts of activities related to management of the public debt.
2The Other Sector consists of activities, such as housing and culture, which cannot be allocated to any of the specifically described sector classifications.
3Includes the Legislature, tax collection and administration, Canadian Health and Social Transfers from the federal government, liquor and gaming profits, general administration and central agency services such as accounting, auditing, budgeting, insurance and risk management to all sectors.
4Represents sectoral adjustments to conform to government accounting policies and to eliminate transactions between sectors.
95
PROVINCE OF BRITISH COLUMBIA
PUBLIC ACCOUNTS 2018/19
Supplementary Statement to the Summary Financial Statements
Statement of Financial Position
for Self–supported Crown Corporations and Agencies1
as at March 31, 2019
| | In Millions | |
| | Natural Resources | | Protection of | | | | | | | |
| | and Economic | | Persons and | | General | | 2019 | | 2018 | |
| | Development2 | | Property3 | | Government4 | | Sub–Total | | Sub–Total | |
| | $ | | $ | | $ | | $ | | $ | |
Assets | | | | | | | | | | | |
Cash and cash equivalents | | 232 | | 76 | | 49 | | 357 | | 340 | |
Accounts receivable | | 1,314 | | 1,869 | | 63 | | 3,246 | | 2,984 | |
Inventories | | 168 | | | | 217 | | 385 | | 274 | |
Other investments | | 738 | | 17,059 | | | | 17,797 | | 16,435 | |
Tangible capital assets | | 28,489 | | 440 | | 427 | | 29,356 | | 26,474 | |
Other assets | | 5,249 | | 388 | | 30 | | 5,667 | | 5,536 | |
Total Assets | | 36,190 | | 19,832 | | 786 | | 56,808 | | 52,043 | |
| | | | | | | | | | | |
Liabilities | | | | | | | | | | | |
Accounts payable and accrued liabilities | | 5,321 | | 16,759 | | 445 | | 22,525 | | 19,169 | |
Deferred revenue | | 2,970 | | 2,968 | | 30 | | 5,968 | | 6,005 | |
Due to Province of British Columbia | | 151 | | | | 276 | | 427 | | 441 | |
Debt due to Province of British Columbia | | 22,683 | | | | 100 | | 22,783 | | 20,819 | |
Other debt | | | | | | | | 0 | | 0 | |
| | 31,125 | | 19,727 | | 851 | | 51,703 | | 46,434 | |
Equity | | | | | | | | | | | |
Investment by Province of British Columbia | | 46 | | | | | | 46 | | 46 | |
Other comprehensive income | | (47 | ) | 125 | | (40 | ) | 38 | | (228 | ) |
Unremitted earnings–end of year | | 5,066 | | (20 | ) | (25 | ) | 5,021 | | 5,791 | |
| | 5,065 | | 105 | | (65 | ) | 5,105 | | 5,609 | |
Total Liabilities and Equity | | 36,190 | | 19,832 | | 786 | | 56,808 | | 52,043 | |
96
PROVINCE OF BRITISH COLUMBIA
PUBLIC ACCOUNTS 2018/19
Supplementary Statement to the Summary Financial Statements
Statement of Financial Position
for Self–supported Crown Corporations and Agencies1
as at March 31, 2019—Continued
| | In Millions | |
| | | | | | | | Protection of | | | | | |
| | | | | | | | Persons and | | | | | |
| | Education | | Natural Resources | | Transportation | | Property | | 2019 | | 2018 | |
| | subsidiaries5 | | subsidiaries6 | | subsidiaries7 | | subsidiaries8 | | Grand Total | | Grand Total | |
| | $ | | $ | | $ | | $ | | $ | | $ | |
Assets | | | | | | | | | | | | | |
Cash and cash equivalents | | 41 | | 30 | | 117 | | 1 | | 546 | | 618 | |
Accounts receivable | | 144 | | 9 | | 3 | | 1 | | 3,403 | | 3,048 | |
Inventories | | 66 | | | | | | | | 451 | | 347 | |
Other investments | | 24 | | | | 200 | | 58 | | 18,079 | | 16,669 | |
Tangible capital assets | | 467 | | 210 | | 215 | | | | 30,248 | | 27,317 | |
Other assets | | 2 | | 194 | | 1 | | 1 | | 5,865 | | 5,738 | |
Total Assets | | 744 | | 443 | | 536 | | 61 | | 58,592 | | 53,737 | |
Liabilities | | | | | | | | | | | | | |
Accounts payable and accrued liabilities | | 36 | | 18 | | 308 | | 26 | | 22,913 | | 19,531 | |
Deferred revenue | | 20 | | | | 28 | | 11 | | 6,027 | | 6,086 | |
Due to Province of British Columbia | | 66 | | | | | | | | 493 | | 514 | |
Debt due to Province of British Columbia | | 71 | | | | | | | | 22,854 | | 20,868 | |
Other debt | | 388 | | 200 | | | | | | 588 | | 627 | |
| | 581 | | 218 | | 336 | | 37 | | 52,875 | | 47,626 | |
Equity | | | | | | | | | | | | | |
Investment by Province or British Columbia | | 72 | | 197 | | 106 | | | | 421 | | 420 | |
Other comprehensive income | | | | | | (8 | ) | 1 | | 31 | | (235 | ) |
Unremitted earnings–end of year | | 91 | | 28 | | 102 | | 23 | | 5,265 | | 5,926 | |
| | 163 | | 225 | | 200 | | 24 | | 5,717 | | 6,111 | |
Total Liabilities and Equity | | 744 | | 443 | | 536 | | 61 | | 58,592 | | 53,737 | |
1Self–supported Crown corporations and agencies report under International Financial Reporting Standards. These statements include related party transactions between self–supported Crown corporations and with taxpayer-supported entities. No elimination entries are recorded for these transactions. They are in the normal course of operations and are recorded at the exchange amount. The normal course of operations includes trade, financial and legal services, shared administration, business relationships, collaboration on projects, carbon offsets, and payment of cash dividends. Significant balances are disclosed in the notes to these financial statements.
2British Columbia Hydro and Power Authority and Columbia Power Corporation.
3Insurance Corporation of British Columbia.
4British Columbia Liquor Distribution Branch and British Columbia Lottery Corporation.
5Self–supported subsidiaries, including Great Northern Way Campus Trust, Heritage Realty Properties Ltd., SFU Community Trust, UBC Properties Trust, and Vancouver Island Technology Park Trust, of post–secondary institutions.
6Columbia Basin Trust joint ventures with Columbia Power Corporation (Brilliant Power Corporation, Brilliant Expansion Power Corporation, Arrow Lakes Power Corporation, and Waneta Expansion Power Corporation). Columbia Power Corporation’s equity investment is included as an integral component of Columbia Power Corporation.
7British Columbia Rail Company, a subsidiary of BC Transportation Financing Authority.
8Real Estate Errors and Omissions Insurance Corporation, a subsidiary of Real Estate Council of British Columbia.
97
PROVINCE OF BRITISH COLUMBIA
PUBLIC ACCOUNTS 2018/19
Supplementary Statement to the Summary Financial Statements
Summary of Results of Operations and Statement
of Equity for Self–supported Crown Corporations and Agencies1
for the Fiscal Year Ended March 31, 2019
| | In Millions | |
| | Natural Resources | | Protection of | | | | | | | |
| | and Economic | | Persons and | | General | | 2019 | | 2018 | |
| | Development2 | | Property3 | | Government4 | | Sub–Total | | Sub–Total | |
| | $ | | $ | | $ | | $ | | $ | |
Revenue | | 6,647 | | 6,507 | | 6,201 | | 19,355 | | 18,286 | |
Expense | | 6,070 | | 7,660 | | 3,692 | | 17,422 | | 17,349 | |
Net earnings of self–supported Crown corporations and agencies | | 577 | | (1,153 | ) | 2,509 | | 1,933 | | 937 | |
Dividends | | (129 | ) | | | (2,253 | ) | (2,382 | ) | (2,462 | ) |
Adjustments to dividends | | | | | | (256 | ) | (256 | ) | (260 | ) |
Transfers (to) from deferred revenue | | | | | | | | 0 | | 0 | |
Increase (decrease) in unremitted earnings in self–supported Crown corporations and agencies | | 448 | | (1,153 | ) | 0 | | (705 | ) | (1,785 | ) |
Unremitted earnings—beginning of year | | 4,609 | | 1,133 | | (17 | ) | 5,725 | | 7,510 | |
Adjustments to unremitted earnings | | 9 | | | | (8 | ) | 1 | | 66 | |
Unremitted earnings—end of year | | 5,066 | | (20 | ) | (25 | ) | 5,021 | | 5,791 | |
Accumulated other comprehensive income—beginning of year | | 49 | | (161 | ) | (33 | ) | (145 | ) | (40 | ) |
Adjustments to accumulated other comprehensive income | | (83 | ) | | | | | (83 | ) | (83 | ) |
Other comprehensive income | | (13 | ) | 286 | | (7 | ) | 266 | | (105 | ) |
Accumulated other comprehensive income—end of year | | (47 | ) | 125 | | (40 | ) | 38 | | (228 | ) |
Investment by Province of British Columbia | | 46 | | | | | | 46 | | 46 | |
Equity in self–supported Crown corporations and agencies for the year | | 5,065 | | 105 | | (65 | ) | 5,105 | | 5,609 | |
98
PROVINCE OF BRITISH COLUMBIA
PUBLIC ACCOUNTS 2018/19
Supplementary Statement to the Summary Financial Statements
Summary of Results of Operations and Statement
of Equity for Self–supported Crown Corporations and Agencies1
for the Fiscal Year Ended March 31, 2019—Continued
| | In Millions | |
| | | | | | | | Protection of | | | | | |
| | | | | | | | Persons and | | | | | |
| | Education | | Natural Resources | | Transportation | | Property | | 2019 | | 2018 | |
| | subsidiaries5 | | subsidiaries6 | | subsidiaries7 | | subsidiaries8 | | Grand Total | | Grand Total | |
| | $ | | $ | | $ | | $ | | $ | | $ | |
Revenue | | 50 | | 77 | | 28 | | 13 | | 19,523 | | 18,504 | |
Expense | | 33 | | 32 | | 18 | | 13 | | 17,518 | | 17,448 | |
Net earnings of self–supported Crown corporations and agencies | | 17 | | 45 | | 10 | | 0 | | 2,005 | | 1,056 | |
Dividends | | (6 | ) | (39 | ) | | | | | (2,427 | ) | (2,559 | ) |
Adjustments to dividends | | | | | | | | | | (256 | ) | (260 | ) |
Transfers (to) from deferred revenue | | (11 | ) | | | | | | | (11 | ) | (11 | ) |
Increase (decrease) in unremitted earnings in self–supported Crown corporations and agencies | | 0 | | 6 | | 10 | | 0 | | (689 | ) | (1,774 | ) |
Unremitted earnings—beginning of year | | (2 | ) | 22 | | 92 | | 23 | | 5,860 | | 7,634 | |
Adjustments to unremitted earnings | | 93 | | | | | | | | 94 | | 66 | |
Unremitted earnings—end of year | | 91 | | 28 | | 102 | | 23 | | 5,265 | | 5,926 | |
Accumulated other comprehensive income—beginning of year | | | | | | (7 | ) | | | (152 | ) | (48 | ) |
Adjustments to accumulated other comprehensive income | | | | | | | | | | (83 | ) | (83 | ) |
Other comprehensive income | | | | | | (1 | ) | 1 | | 266 | | (104 | ) |
Accumulated other comprehensive income—end of year | | 0 | | 0 | | (8 | ) | 1 | | 31 | | (235 | ) |
Investment by Province of British Columbia | | 72 | | 197 | | 106 | | | | 421 | | 420 | |
Equity in self–supported Crown corporations and agencies for the year | | 163 | | 225 | | 200 | | 24 | | 5,717 | | 6,111 | |
1Self–supported Crown corporations and agencies report under International Financial Reporting Standards. These statements include related party transactions between self–supported Crown corporations and with taxpayer-supported entities. No elimination entries are recorded for these transactions. They are in the normal course of operations and are recorded at the exchange amount. The normal course of operations includes trade, financial and legal services, shared administration, business relationships, collaboration on projects, carbon offsets, and payment of cash dividends. Significant balances are disclosed in the notes to these financial statements.
2British Columbia Hydro and Power Authority and Columbia Power Corporation.
3Insurance Corporation of British Columbia.
4British Columbia Liquor Distribution Branch and British Columbia Lottery Corporation.
5Self–supported subsidiaries, including Great Northern Way Campus Trust, Heritage Realty Properties Ltd., SFU Community Trust, UBC Properties Trust, and Vancouver Island Technology Park Trust, of post–secondary institutions.
6Columbia Basin Trust joint ventures with Columbia Power Corporation (Brilliant Power Corporation, Brilliant Expansion Power Corporation, Arrow Lakes Power Corporation, and Waneta Expansion Power Corporation). Columbia Power Corporation’s equity investment is included as an integral component of Columbia Power Corporation.
7British Columbia Rail Company, a subsidiary of BC Transportation Financing Authority.
8Real Estate Errors and Omissions Insurance Corporation, a subsidiary of Real Estate Council of British Columbia.
99
PROVINCE OF BRITISH COLUMBIA
PUBLIC ACCOUNTS 2018/19
Supplementary Statement to the Summary Financial Statements
Consolidated Statement of Tangible Capital Assets1
for the Fiscal Year Ended March 31, 2019
| | In Millions | |
| | | | | | | | | | Computer | | | | | | | |
| | Land and Land | | | | Highway | | Transportation | | Hardware/ | | | | 2019 | | 2018 | |
| | Improvements | | Building | | Infrastructure | | Equipment | | Software | | Other3 | | Total | | Total | |
| | $ | | $ | | $ | | $ | | $ | | $ | | $ | | $ | |
Historical Costs2 | | | | | | | | | | | | | | | | | |
Opening Cost | | 5,343 | | 35,729 | | 23,057 | | 3,938 | | 4,072 | | 6,555 | | 78,694 | | 72,492 | |
Additions | | 247 | | 2,259 | | 772 | | 143 | | 520 | | 511 | | 4,452 | | 3,908 | |
Disposals and valuation adjustments | | (30 | ) | (81 | ) | (31 | ) | (35 | ) | (113 | ) | (353 | ) | (643 | ) | (929 | ) |
Reclassification of self–supported status4 | | | | | | | | | | | | | | | | 3,223 | |
| | 5,560 | | 37,907 | | 23,798 | | 4,046 | | 4,479 | | 6,713 | | 82,503 | | 78,694 | |
Accumulated Amortization | | | | | | | | | | | | | | | | | |
Opening balance | | (297 | ) | (13,685 | ) | (10,225 | ) | (1,443 | ) | (2,627 | ) | (4,580 | ) | (32,857 | ) | (31,189 | ) |
Amortization expense | | (23 | ) | (944 | ) | (545 | ) | (98 | ) | (298 | ) | (459 | ) | (2,367 | ) | (2,250 | ) |
Effect of disposals and valuation adjustments | | 5 | | 45 | | 20 | | 34 | | 76 | | 371 | | 551 | | 787 | |
Reclassification of self–supported status4 | | | | | | | | | | | | | | | | (205 | ) |
| | (315 | ) | (14,584 | ) | (10,750 | ) | (1,507 | ) | (2,849 | ) | (4,668 | ) | (34,673 | ) | (32,857 | ) |
Net book value for the year ended March 31, 2019 | | 5,245 | | 23,323 | | 13,048 | | 2,539 | | 1,630 | | 2,045 | | 47,830 | | | |
| | | | | | | | | | | | | | | | | |
Net book value for the year ended March 31, 2018 | | 5,046 | | 22,044 | | 12,832 | | 2,495 | | 1,445 | | 1,975 | | | | 45,837 | |
1This statement includes assets that are held on capital leases at March 31, 2019 at a gross value of $385 million less accumulated amortization of $(157) million for a net book value totalling $228 million (2018: gross value of $382 million less accumulated amortization of $(153) million for a net book value of $229 million) comprised of: heavy equipment gross $2 million less accumulated amortization $(2) million for a net book value of Nil (2018: gross $4 million less accumulated amortization $(3) million for a net book value of $1 million); computer hardware/software gross $104 million less accumulated amortization $(79) million for a net book value of $25 million (2018: gross $102 million less accumulated amortization $(82) million for a net book value of $20 million); buildings gross $251 million less accumulated amortization $(53) million for a net book value of $198 million (2018: gross $251 million less accumulated amortization $(45) million for a net book value $206 million); and other assets gross $25 million less accumulated amortization $(23) million for a net book value of $2 million (2018: gross $25 million less accumulated amortization $(23) million for a net book value of $2 million).
2Historical cost includes work–in–progress at March 31, 2019 totalling $3,678 million (2018: $3,192 million) comprised of: buildings $1,969 million (2018: $1,688 million); land improvements $49 million (2018: $43 million); highway infrastructure $726 million (2018: $558 million); transportation equipment $151 million (2018: $162 million); computer hardware/software $698 million (2018: $626 million); and specialized equipment $85 million (2018: $115 million). Work–in–progress is not amortized. Work–in–progress includes capitalized interest expense at March 31, 2019 totalling $21 million (2018: $19 million).
3“Other” at net book value includes office furniture and equipment $743 million (2018: $729 million), vehicles $98 million (2018: $100 million), machinery $1,020 million (2018: $969 million) and miscellaneous $185 million (2018: $178 million).
4Transportation Investment Corporation was classified as a taxpayer–supported Crown corporation effective September 1, 2017
100
PROVINCE OF BRITISH COLUMBIA
PUBLIC ACCOUNTS 2018/19
Supplementary Statement to the
Summary Financial Statements
Consolidated Statement of Guaranteed Debt
as at March 31, 2019
Guaranteed debt represents the debt of organizations that has been explicitly guaranteed or indemnified by the government under the authority of a statute as to net principal or redemption provisions. These organizations may include municipalities and other governments, private enterprises and individuals, minority interests of provincial Crown corporations and agencies, and SUCH1 sector entities.
| | In Millions | |
| | 2019 | | 2018 | |
| | Maximum | | | | Maximum | | | |
| | Guarantee | | Net | | Guarantee | | Net | |
| | Authorized | | Outstanding | | Authorized | | Outstanding | |
| | $ | | $ | | $ | | $ | |
Taxpayer–supported Guaranteed Debt | | | | | | | | | |
General government: | | | | | | | | | |
Homeowner Protection Act loan guarantees2 | | 375 | | 1 | | 375 | | 1 | |
Subtotal, general government | | 375 | | 1 | | 375 | | 1 | |
Natural resources and economic development: | | | | | | | | | |
Financial Administration Act: | | | | | | | | | |
Feeder’s Association Loan Guarantee | | 13 | | 4 | | 13 | | 5 | |
Subtotal, natural resources and economic development | | 13 | | 4 | | 13 | | 5 | |
Total taxpayer–supported guaranteed debt | | 388 | | 5 | | 388 | | 6 | |
| | | | | | | | | |
Self–supported Guaranteed Debt | | | | | | | | | |
Hydro and Power Authority Act bonds and debentures3 | | 10 | | 10 | | 10 | | 10 | |
Total self–supported guaranteed debt | | 10 | | 10 | | 10 | | 10 | |
| | | | | | | | | |
Grand total, all guaranteed debt | | 398 | | 15 | | 398 | | 16 | |
Provision for probable payout | | | | (1 | ) | | | (1 | ) |
| | | | | | | | | |
Net total, all guaranteed debt | | 398 | | 14 | | 398 | | 15 | |
1School districts, universities, colleges and health authorities/hospital societies.
2Homeowner Protection Act loan guarantees include indemnities provided to Canadian Mortgage and Housing Corporation for any claims made on reconstruction loans made to homeowners for repairs to homes with premature building envelope failure.
3The government has unconditionally guaranteed the payment of principal and interest for $10 million (2018: $10 million) of debentures issued to the Canada Pension Plan Investment Fund that matures on August 9, 2024 with a coupon rate of 5.54%.
101
Supplementary Information
(Unaudited)
The following unaudited supplementary information is intended to provide additional information to financial statement readers and includes:
a) the impacts of the Crown corporations and the school districts, universities, colleges, institutes and health organizations (SUCH) sector on the province’s annual surplus (deficit); and
b) the Consolidated Staff Utilization.
The purpose of this information is to report organizational impacts on the Summary Financial Statements.

PROVINCE OF BRITISH COLUMBIA
PUBLIC ACCOUNTS 2018/19
Adjusted Net Income of Crown Corporations, Agencies and the SUCH Sector1
for the Fiscal Year Ended March 31, 2019
(Unaudited)
| | In Millions | |
| | | | | | | | | | | | Adjusted | |
| | Revenue | | Expense | | Net Income | | Adjustments | | Dividends | | Net Income2 | |
| | $ | | $ | | $ | | $ | | $ | | $ | |
Taxpayer–supported (Government Organizations) | | | | | | | | | | | | | |
BC Games Society | | 3 | | (3 | ) | | | | | | | | |
BC Immigrant Investment Fund Ltd. | | 4 | | (2 | ) | 2 | | | | | | 2 | |
BC Infrastructure Benefits Inc. | | 4 | | (4 | ) | | | | | | | | |
BCNET | | 19 | | (19 | ) | | | (1 | ) | | | (1 | ) |
B.C. Pavilion Corporation | | 132 | | (132 | ) | | | (15 | ) | | | (15 | ) |
BC Transportation Financing Authority | | 695 | | (1,334 | ) | (639 | ) | (132 | ) | | | (771 | ) |
British Columbia Assessment Authority3 | | 100 | | (96 | ) | 4 | | | | | | 4 | |
British Columbia Housing Management Commission | | 1,247 | | (1,247 | ) | | | (122 | ) | | | (122 | ) |
British Columbia Public School Employers’ Association | | 8 | | (7 | ) | 1 | | | | | | 1 | |
British Columbia Securities Commission | | 59 | | (49 | ) | 10 | | | | | | 10 | |
British Columbia Transit | | 335 | | (329 | ) | 6 | | 3 | | | | 9 | |
Canadian Blood Services | | 173 | | (171 | ) | 2 | | 1 | | | | 3 | |
Columbia Basin Trust | | 26 | | (50 | ) | (24 | ) | | | 39 | | 15 | |
Community Living British Columbia | | 1,025 | | (1,025 | ) | | | (6 | ) | | | (6 | ) |
Community Social Services Employers’ Association of British Columbia | | 3 | | (3 | ) | | | | | | | | |
Creston Valley Wildlife Management Authority Trust Fund | | 1 | | (1 | ) | | | | | | | | |
Crown Corporations Employers’ Association | | | | | | | | | | | | | |
Destination BC Corp. | | 54 | | (54 | ) | | | | | | | | |
First Peoples’ Heritage, Language and Culture Council | | 15 | | (15 | ) | | | | | | | | |
Forest Enhancement Society of BC | | 28 | | (28 | ) | | | (25 | ) | | | (25 | ) |
Forestry Innovation Investment Ltd. | | 25 | | (25 | ) | | | | | | | | |
Health Employers Association of British Columbia | | 22 | | (22 | ) | | �� | 1 | | | | 1 | |
105
PROVINCE OF BRITISH COLUMBIA
PUBLIC ACCOUNTS 2018/19
Adjusted Net Income of Crown Corporations, Agencies and the SUCH Sector1
for the Fiscal Year Ended March 31, 2019—Continued
(Unaudited)
| | In Millions | |
| | | | | | | | | | | | Adjusted | |
| | Revenue | | Expense | | Net Income | | Adjustments | | Dividends | | Net Income2 | |
| | $ | | $ | | $ | | $ | | $ | | $ | |
Taxpayer–supported (Government Organizations) —Continued | | | | | | | | | | | | | |
Industry Training Authority | | 110 | | (113 | ) | (3 | ) | | | | | (3 | ) |
Innovate BC | | 8 | | (8 | ) | | | (5 | ) | | | (5 | ) |
Knowledge Network Corporation | | 14 | | (12 | ) | 2 | | | | | | 2 | |
Legal Services Society | | 96 | | (96 | ) | | | | | | | | |
Nechako–Kitamaat Development Fund Society | | 1 | | (1 | ) | | | | | | | | |
Oil and Gas Commission | | 68 | | (72 | ) | (4 | ) | | | | | (4 | ) |
Organized Crime Agency of British Columbia Society | | 8 | | (7 | ) | 1 | | | | | | 1 | |
Partnerships British Columbia Inc. | | 10 | | (9 | ) | 1 | | | | | | 1 | |
Post–Secondary Employers’ Association | | 2 | | (2 | ) | | | | | | | | |
Provincial Rental Housing Corporation | | 111 | | (79 | ) | 32 | | 256 | | | | 288 | |
Real Estate Council of British Columbia | | 12 | | (11 | ) | 1 | | | | | | 1 | |
Real Estate Foundation of British Columbia | | 7 | | (7 | ) | | | | | | | | |
The British Columbia Council for International Education | | 3 | | (3 | ) | | | | | | | | |
The Royal British Columbia Museum Corporation | | 24 | | (22 | ) | 2 | | 1 | | | | 3 | |
Taxpayer–supported Crown corporations and agencies | | 4,452 | | (5,058 | ) | (606 | ) | (44 | ) | 39 | | (611 | ) |
| | | | | | | | | | | | | |
SUCH Sector | | | | | | | | | | | | | |
School Districts | | 6,769 | | (6,671 | ) | 98 | | 145 | | | | 243 | |
Universities | | 5,230 | | (4,894 | ) | 336 | | 57 | | 6 | | 399 | |
Colleges and Institutes | | 1,410 | | (1,352 | ) | 58 | | 95 | | | | 153 | |
Health Authorities | | 15,662 | | (15,751 | ) | (89 | ) | 187 | | | | 98 | |
Hospital Societies | | 1,029 | | (1,039 | ) | (10 | ) | (6 | ) | | | (16 | ) |
SUCH sector | | 30,100 | | (29,707 | ) | 393 | | 478 | | 6 | | 877 | |
Net impact of taxpayer–supported Crown corporations, agencies and SUCH sector | | 34,552 | | (34,765 | ) | (213 | ) | 434 | | 45 | | 266 | |
106
PROVINCE OF BRITISH COLUMBIA
PUBLIC ACCOUNTS 2018/19
Adjusted Net Income of Crown Corporations, Agencies and the SUCH Sector1
for the Fiscal Year Ended March 31, 2019—Continued
(Unaudited)
| | In Millions | |
| | | | | | | | | | | | Adjusted | |
| | Revenue | | Expense | | Net Income | | Adjustments | | Dividends | | Net Income2 | |
| | $ | | $ | | $ | | $ | | $ | | $ | |
Self–Supported (Government Enterprises) | | | | | | | | | | | | | |
British Columbia Hydro and Power Authority | | 6,573 | | (6,051 | ) | 522 | | | | (59 | ) | 463 | |
British Columbia Liquor Distribution Branch | | 3,611 | | (2,507 | ) | 1,104 | | | | (1,104 | ) | | |
British Columbia Lottery Corporation | | 2,590 | | (1,185 | ) | 1,405 | | | | (1,405 | ) | | |
Columbia Power Corporation | | 74 | | (19 | ) | 55 | | | | (70 | ) | (15 | ) |
Insurance Corporation of British Columbia | | 6,507 | | (7,660 | ) | (1,153 | ) | | | | | (1,153 | ) |
Sub–total | | 19,355 | | (17,422 | ) | 1,933 | | 0 | | (2,638 | ) | (705 | ) |
British Columbia Railway Company4 | | 28 | | (18 | ) | 10 | | | | | | 10 | |
Columbia Basin Trust joint ventures5 | | 77 | | (32 | ) | 45 | | | | (39 | ) | 6 | |
Real Estate Errors and Omissions Insurance Corporation6 | | 13 | | (13 | ) | | | | | | | | |
Great Northern Way Campus Trust7 | | 24 | | (12 | ) | 12 | | | | (1 | ) | 11 | |
Heritage Realty Properties Ltd8 | | 7 | | (7 | ) | | | | | | | | |
SFU Community Trust | | 1 | | | | 1 | | | | (3 | ) | (2 | ) |
UBC Properties Investments Ltd | | 1 | | | | 1 | | | | | | 1 | |
Vancouver Island Technology Park Trust8 | | 6 | | (4 | ) | 2 | | | | (2 | ) | | |
Miscellaneous | | 11 | | (10 | ) | 1 | | | | | | 1 | |
Sub–total | | 168 | | (96 | ) | 72 | | 0 | | (45 | ) | 27 | |
Net impact of self-supported crown corporations and agencies | | 19,523 | | (17,518 | ) | 2,005 | | 0 | | (2,683 | ) | (678 | ) |
1This schedule does not include elimination entries between entities.
2Adjusted Net Income includes the effect of contributions paid to the Consolidated Revenue Fund to indicate the impacts that the Crown corporations and agencies and the SUCH sector have made on the Consolidated Revenue Fund operating result. The Adjusted Net Income of Crown corporations and agencies and the SUCH sector combined with the Consolidated Revenue Fund operating result, after elimination entries between entities, make up the Summary Financial Statements surplus (deficit).
3The revenues and expenses reported for the British Columbia Assessment Authority include a stub period reversal of January–March 2018 and an inclusion of the stub period of January–March 2019.
4Subsidiary of BC Transportation Financing Authority.
5Brilliant Power Corporation, Brilliant Expansion Power Corporation, Arrow Lakes Power Corporation, and Waneta Expansion Power Corporation, co–owned with Columbia Power Corporation.
6Subsidiary of Real Estate Council of British Columbia.
7Subsidiary owned 25% each by Emily Carr University of Art & Design, British Columbia Institute of Technology, The University of British Columbia, and Simon Fraser University.
8Subsidiaries of the University of Victoria.
107
PROVINCE OF BRITISH COLUMBIA
PUBLIC ACCOUNTS 2018/19
SUCH 1 Statement of Financial Position
as at March 31, 2019
(Unaudited)
| | In Millions | |
| | Health | | | | | | | | | | | |
| | Authorities & | | | | | | | | | | | |
| | Hospital | | | | Colleges and | | School | | 2019 | | 2018 | |
| | Societies2 | | Universities | | Institutes | | Districts | | Total | | Total | |
| | $ | | $ | | $ | | $ | | $ | | $ | |
Financial Assets | | | | | | | | | | | | | |
Cash and cash equivalents | | 1,463 | | 566 | | 404 | | 1,676 | | 4,109 | | 4,243 | |
Temporary investments | | 1 | | 57 | | 14 | | 19 | | 91 | | 120 | |
Accounts receivable | | 310 | | 203 | | 30 | | 64 | | 607 | | 511 | |
Inventories for resale | | 20 | | 16 | | 8 | | 1 | | 45 | | 51 | |
Due from Crown corporations, agencies and trust funds | | 470 | | 50 | | 30 | | 10 | | 560 | | 242 | |
Due from other governments | | 38 | | 10 | | 8 | | 3 | | 59 | | 53 | |
Due from self–supported Crown corporations and agencies | | | | 64 | | 2 | | | | 66 | | 73 | |
Equity in self–supported Crown corporations and agencies | | | | 148 | | 13 | | 1 | | 162 | | 67 | |
Loans, advances and mortgages receivable | | 133 | | 29 | | | | 1 | | 163 | | 178 | |
Other investments | | 1 | | 2,549 | | 164 | | 53 | | 2,767 | | 2,413 | |
Sinking fund investments | | | | 46 | | 10 | | | | 56 | | 50 | |
Financial assets before accounting adjustments | | 2,436 | | 3,738 | | 683 | | 1,828 | | 8,685 | | 8,001 | |
Policy accounting adjustments | | (48 | ) | (500 | ) | 2 | | 10 | | (536 | ) | (468 | ) |
Financial assets | | 2,388 | | 3,238 | | 685 | | 1,838 | | 8,149 | | 7,533 | |
108
PROVINCE OF BRITISH COLUMBIA
PUBLIC ACCOUNTS 2018/19
SUCH 1 Statement of Financial Position
as at March 31, 2019—Continued
(Unaudited)
| | In Millions | |
| | Health | | | | | | | | | | | |
| | Authorities & | | | | | | | | | | | |
| | Hospital | | | | Colleges and | | School | | 2019 | | 2018 | |
| | Societies2 | | Universities | | Institutes | | Districts | | Total | | Total | |
| | $ | | $ | | $ | | $ | | $ | | $ | |
Liabilities | | | | | | | | | | | | | |
Accounts payable and accrued liabilities | | 1,048 | | 460 | | 173 | | 448 | | 2,129 | | 1,956 | |
Employee future benefits | | 1,236 | | 172 | | 89 | | 219 | | 1,716 | | 1,637 | |
Due to other governments | | 45 | | 5 | | 3 | | | | 53 | | 50 | |
Due to Crown corporations, agencies and trust funds | | 49 | | 6 | | 6 | | 1 | | 62 | | 42 | |
Deferred revenue | | 6,912 | | 6,255 | | 1,345 | | 6,282 | | 20,794 | | 19,670 | |
Taxpayer–supported debt | | 1,797 | | 717 | | 110 | | 19 | | 2,643 | | 2,585 | |
Liabilities before accounting adjustments | | 11,087 | | 7,615 | | 1,726 | | 6,969 | | 27,397 | | 25,940 | |
Policy accounting adjustments | | (4,691 | ) | (2,878 | ) | (968 | ) | (5,784 | ) | (14,321 | ) | (13,733 | ) |
Liabilities | | 6,396 | | 4,737 | | 758 | | 1,185 | | 13,076 | | 12,207 | |
Net liabilities | | (4,008 | ) | (1,499 | ) | (73 | ) | 653 | | (4,927 | ) | (4,674 | ) |
Non–financial Assets | | | | | | | | | | | | | |
Tangible capital assets | | 8,355 | | 6,805 | | 1,517 | | 8,052 | | 24,729 | | 23,583 | |
Restricted assets | | 5 | | 1,799 | | 43 | | 2 | | 1,849 | | 1,784 | |
Prepaid program costs | | 220 | | 98 | | 8 | | 11 | | 337 | | 325 | |
Other assets | | 31 | | | | 2 | | 2 | | 35 | | 51 | |
Non–financial assets before accounting adjustments | | 8,611 | | 8,702 | | 1,570 | | 8,067 | | 26,950 | | 25,743 | |
Policy accounting adjustments | | (159 | ) | (10 | ) | (8 | ) | (4 | ) | (181 | ) | (182 | ) |
Non–financial assets | | 8,452 | | 8,692 | | 1,562 | | 8,063 | | 26,769 | | 25,561 | |
Accumulated surplus (deficit) | | 4,444 | | 7,193 | | 1,489 | | 8,716 | | 21,842 | | 20,887 | |
1School districts, universities, colleges, institutes, and health organizations.
2These numbers include inter–entity eliminations between Health Authorities and Hospital Societies.
109
PROVINCE OF BRITISH COLUMBIA
PUBLIC ACCOUNTS 2018/19
SUCH 1 Statement of Operations
for the Fiscal Year Ended March 31, 2019
(Unaudited)
| | In Millions | |
| | Health | | | | | | | | | | | |
| | Authorities & | | | | | | | | | | | |
| | Hospital | | | | Colleges and | | School | | 2019 | | 2018 | |
| | Societies2 | | Universities | | Institutes | | Districts | | Total | | Total | |
| | $ | | $ | | $ | | $ | | $ | | $ | |
Revenue | | | | | | | | | | | | | |
Contributions from the federal government | | 33 | | 511 | | 18 | | 17 | | 579 | | 524 | |
Fees and licenses | | 441 | | 1,749 | | 526 | | 275 | | 2,991 | | 2,734 | |
Contributions from the provincial government/Crown corporations and agencies | | 14,798 | | 1,830 | | 729 | | 6,088 | | 23,445 | | 22,368 | |
Miscellaneous | | 530 | | 993 | | 125 | | 359 | | 2,007 | | 1,955 | |
Investment income | | 17 | | 161 | | 15 | | 30 | | 223 | | 189 | |
Total revenue | | 15,819 | | 5,244 | | 1,413 | | 6,769 | | 29,245 | | 27,770 | |
| | | | | | | | | | | | | |
Expense | | | | | | | | | | | | | |
Salaries and benefits | | 8,474 | | 3,058 | | 928 | | 5,413 | | 17,873 | | 16,770 | |
Government transfers | | | | 264 | | 12 | | | | 276 | | 257 | |
Operating costs | | 6,649 | | 1,009 | | 271 | | 933 | | 8,862 | | 8,373 | |
Interest | | 119 | | 37 | | 3 | | | | 159 | | 155 | |
Amortization | | 578 | | 389 | | 94 | | 318 | | 1,379 | | 1,330 | |
Other | | 98 | | 137 | | 44 | | 7 | | 286 | | 302 | |
Total operating expense | | 15,918 | | 4,894 | | 1,352 | | 6,671 | | 28,835 | | 27,187 | |
Surplus (deficit) for the year before accounting adjustments | | (99 | ) | 350 | | 61 | | 98 | | 410 | | 583 | |
Policy accounting adjustments | | 181 | | 57 | | 95 | | 145 | | 478 | | 496 | |
Surplus (deficit) for the year | | 82 | | 407 | | 156 | | 243 | | 888 | | 1,079 | |
1School districts, universities, colleges, institutes, and health organizations.
2These numbers include inter–entity eliminations between Health Authorities and Hospital Societies.
110
PROVINCE OF BRITISH COLUMBIA
PUBLIC ACCOUNTS 2018/19
Summary Financial Statements
Consolidated Staff Utilization
for the Fiscal Year Ended March 31, 20191
(Unaudited)
| | | | | | | | Variance | |
| | | | | | | | 2018/19 | | 2018/19 | |
| | 2018/19 | | 2018/19 | | 2017/18 | | Actual | | vs | |
| | Budget | | Actual | | Actual | | To Budget | | 2017/18 | |
Consolidated Revenue Fund2 | | 29,400 | | 30,891 | | 29,291 | | 1,491 | | 1,600 | |
Taxpayer–supported Crown corporations and agencies3 | | 5,033 | | 5,258 | | 5,076 | | 225 | | 182 | |
Total staff utilization | | 34,433 | | 36,149 | | 34,367 | | 1,716 | | 1,782 | |
The table above provides a summary of full–time equivalent (FTE) employment.
1Staff utilization is the full–time equivalent of the number of persons employed in the fiscal year whose salaries are paid by taxpayer–supported entities within the Summary Financial Statements. The figures do not include the SUCH entities or the self–supported Crown corporations and agencies.
2See the unaudited Consolidated Revenue Fund schedules at http://gov.bc.ca/publicaccounts for details outside these financial statements.
3See Financial Statements of Government Organizations and Enterprises at http://gov.bc.ca/financepublications for details outside these financial statements.
111
Consolidated Revenue Fund
Extracts
(Unaudited)
The following unaudited Consolidated Revenue Fund Extracts are intended to provide additional information to financial statement readers and includes details of the Consolidated Revenue Fund.
The purpose of this information is to reflect management accountability including appropriation control.
The accounting policies applied for this unaudited information are different in some cases from the generally accepted accounting principles followed for the audited Summary Financial Statements. For example, in order to reflect different management accountabilities, the Consolidated Revenue Fund nets recoveries against expenses, nets sinking funds against debt and nets sinking fund earnings against interest expense.

PROVINCE OF BRITISH COLUMBIA
PUBLIC ACCOUNTS 2018/19
Consolidated Revenue Fund1
Statement of Financial Position
as at March 31, 2019
(Unaudited)
| | In Millions | |
| | 2019 | | 2018 | |
| | $ | | $ | |
Financial Assets | | | | | |
Cash and cash equivalents | | 232 | | 448 | |
Accounts receivable | | 4,740 | | 3,941 | |
Inventories for resale | | 43 | | 40 | |
Due from other governments | | 1,182 | | 1,281 | |
Due from Crown corporations and agencies | | 430 | | 443 | |
Investments in Crown corporations and agencies | | 594 | | 594 | |
Loans, advances and mortgages receivable | | 1,956 | | 1,976 | |
Other investments | | 347 | | 345 | |
Loans for purchase of assets, recoverable from agencies | | 33,613 | | 30,659 | |
| | 43,137 | | 39,727 | |
Liabilities | | | | | |
Accounts payable and accrued liabilities | | 4,501 | | 3,879 | |
Employee future benefits | | 644 | | 645 | |
Due to other governments | | 489 | | 512 | |
Due to Crown corporations, agencies and trust funds | | 3,157 | | 3,008 | |
Deferred revenue | | 1,347 | | 1,575 | |
Employee pension plans | | 65 | | 119 | |
Taxpayer–supported debt | | 39,350 | | 40,175 | |
Self–supported debt | | 22,436 | | 20,421 | |
| | 71,989 | | 70,334 | |
Net assets (liabilities) | | (28,852 | ) | (30,607 | ) |
| | | | | |
Non–financial Assets | | | | | |
Tangible capital assets | | 3,017 | | 2,874 | |
Prepaid program costs | | 405 | | 347 | |
Other assets | | 43 | | 52 | |
| | 3,465 | | 3,273 | |
Accumulated operating result | | (25,387 | ) | (27,334 | ) |
1The Consolidated Revenue Fund includes the General Fund and the BC Prosperity Fund.
115
PROVINCE OF BRITISH COLUMBIA
PUBLIC ACCOUNTS 2018/19
Consolidated Revenue Fund1
Statement of Operations
for the Fiscal Year Ended March 31, 2019
(Unaudited)
| | In Millions | |
| | 2019 | | 2018 | |
| | Estimated 2 | | Actual | | Actual | |
| | $ | | $ | | $ | |
Revenue | | | | | | | |
Taxation | | 29,842 | | 31,970 | | 27,593 | |
Contributions from the federal government | | 7,130 | | 7,256 | | 7,439 | |
Other revenue | | 2,493 | | 2,610 | | 3,652 | |
Dividends | | 2,269 | | 2,382 | | 2,462 | |
Natural resources | | 2,204 | | 2,886 | | 2,513 | |
| | 43,938 | | 47,104 | | 43,659 | |
| | | | | | | |
Expense | | | | | | | |
Health | | 20,811 | | 20,717 | | 19,706 | |
Education | | 9,491 | | 9,522 | | 9,014 | |
Social services | | 5,159 | | 5,197 | | 4,655 | |
Interest3 | | 1,217 | | 1,240 | | 1,189 | |
Natural resources and economic development | | 1,976 | | 3,197 | | 2,839 | |
Other | | 1,874 | | 1,434 | | 981 | |
Transportation | | 863 | | 869 | | 808 | |
Protection of persons and property | | 1,414 | | 1,738 | | 1,736 | |
General government | | 1,073 | | 1,243 | | 4,805 | |
| | 43,878 | | 45,157 | | 45,733 | |
Operating result for the year | | 60 | | 1,947 | | (2,074 | ) |
| | | | | | | |
Accumulated operating result—beginning of year | | | | (27,334 | ) | (25,260 | ) |
Accumulated operating result—end of year | | | | (25,387 | ) | (27,334 | ) |
1The Consolidated Revenue Fund includes the General Fund and the BC Prosperity Fund.
2The estimated amount consists of the Main Estimates presented to the Legislative Assembly on February 20, 2018. It does not include other authorizations granted in subsequent Supplementary Estimates or under statutory authority of $1,878 million (2018: $479 million).
3Interest expense does not include the following: interest of $1,246 million (2018: $1,221 million) on cost of borrowing for relending to government bodies; and interest of $43 million (2018: $38 million) funded by sinking fund earnings. These amounts are not included because the interest expense and recovery are offsetting.
116
PROVINCE OF BRITISH COLUMBIA
PUBLIC ACCOUNTS 2018/19
General Fund
Statement of Financial Position
as at March 31, 2019
(Unaudited)
| | In Millions | |
| | 2019 | | 2018 | |
| | $ | | $ | |
Financial Assets | | | | | |
Cash and cash equivalents | | (289 | ) | (62 | ) |
Accounts receivable | | 4,740 | | 3,941 | |
Inventories for resale | | 43 | | 40 | |
Due from other governments | | 1,182 | | 1,281 | |
Due from Crown corporations and agencies | | 430 | | 443 | |
Investments in Crown corporations and agencies | | 594 | | 594 | |
Loans, advances and mortgages receivable | | 1,956 | | 1,976 | |
Other investments | | 347 | | 345 | |
Loans for purchase of assets, recoverable from agencies | | 33,613 | | 30,659 | |
| | 42,616 | | 39,217 | |
| | | | | |
Liabilities | | | | | |
Accounts payable and accrued liabilities | | 4,501 | | 3,879 | |
Employee future benefits | | 644 | | 645 | |
Due to other governments | | 489 | | 512 | |
Due to Crown corporations, agencies and trust funds | | 3,157 | | 3,008 | |
Deferred revenue | | 1,347 | | 1,575 | |
Employee pension plans | | 65 | | 119 | |
Taxpayer–supported debt | | 39,350 | | 40,175 | |
Self–supported debt | | 22,436 | | 20,421 | |
| | 71,989 | | 70,334 | |
Net assets (liabilities) | | (29,373 | ) | (31,117 | ) |
| | | | | |
Non–financial Assets | | | | | |
Tangible capital assets | | 3,017 | | 2,874 | |
Prepaid program costs | | 405 | | 347 | |
Other assets | | 43 | | 52 | |
| | 3,465 | | 3,273 | |
Accumulated operating result | | (25,908 | ) | (27,844 | ) |
117
PROVINCE OF BRITISH COLUMBIA
PUBLIC ACCOUNTS 2018/19
General Fund
Statement of Operations
for the Fiscal Year Ended March 31, 2019
(Unaudited)
| | In Millions | |
| | 2019 | | 2018 | |
| | Estimated | | Actual | | Actual | |
| | $ | | $ | | $ | |
Revenue | | | | | | | |
Taxation | | 29,842 | | 31,970 | | 27,593 | |
Contributions from the federal government | | 7,130 | | 7,256 | | 7,439 | |
Other revenue | | 2,485 | | 2,599 | | 3,645 | |
Dividends | | 2,269 | | 2,382 | | 2,462 | |
Natural resources | | 2,204 | | 2,886 | | 2,513 | |
| | 43,930 | | 47,093 | | 43,652 | |
Expense | | | | | | | |
Health | | 20,811 | | 20,717 | | 19,706 | |
Education | | 9,491 | | 9,522 | | 9,014 | |
Social services | | 5,159 | | 5,197 | | 4,655 | |
Interest | | 1,217 | | 1,240 | | 1,189 | |
Natural resources and economic development | | 1,976 | | 3,197 | | 2,839 | |
Other | | 1,874 | | 1,434 | | 981 | |
Transportation | | 863 | | 869 | | 808 | |
Protection of persons and property | | 1,414 | | 1,738 | | 1,736 | |
General government | | 1,073 | | 1,243 | | 4,805 | |
| | 43,878 | | 45,157 | | 45,733 | |
| | | | | | | |
Operating result for the year | | 52 | | 1,936 | | (2,081 | ) |
| | | | | | | |
Accumulated operating result–beginning of year | | | | (27,844 | ) | (25,763 | ) |
Accumulated operating result–end of year | | | | (25,908 | ) | (27,844 | ) |
118
PROVINCE OF BRITISH COLUMBIA
PUBLIC ACCOUNTS 2018/19
BC Prosperity Fund
Statement of Financial Position
as at March 31, 2019
(Unaudited)
| | In Millions | |
| | 2019 | | 2018 | |
| | $ | | $ | |
Financial Assets | | | | | |
Cash and cash equivalents | | 521 | | 510 | |
| | 521 | | 510 | |
Liabilities | | | | | |
| | 0 | | 0 | |
Net assets (liabilities) | | 521 | | 510 | |
| | | | | |
Non–financial Assets | | | | | |
| | 0 | | 0 | |
Accumulated operating result | | 521 | | 510 | |
BC Prosperity Fund
Statement of Operations
for the Fiscal Year Ended March 31, 2019
(Unaudited)
| | In Millions | |
| | 2019 | | 2018 | |
| | Estimated | | Actual | | Actual | |
| | $ | | $ | | $ | |
Revenue | | | | | | | |
Other revenue | | 8 | | 11 | | 7 | |
| | 8 | | 11 | | 7 | |
Expense | | | | | | | |
| | 0 | | 0 | | 0 | |
| | | | | | | |
Operating result for the year | | 8 | | 11 | | 7 | |
| | | | | | | |
Accumulated operating result–beginning of year | | | | 510 | | 503 | |
Accumulated operating result–end of year | | | | 521 | | 510 | |
119
PROVINCE OF BRITISH COLUMBIA
PUBLIC ACCOUNTS 2018/19
Consolidated Revenue Fund
Statement of Cash Flow
for the Fiscal Year Ended March 31, 2019
(Unaudited)
| | In Millions | |
| | 2019 | | 2018 | |
| | Receipts | | Disbursements | | Net | | Net | |
| | $ | | $ | | $ | | $ | |
Operating Transactions | | | | | | | | | |
Operating result for the year | | | | | | 1,947 | | (2,074 | ) |
Non–cash items included in surplus (deficit): | | | | | | | | | |
Amortization of tangible capital assets | | | | | | 237 | | 221 | |
Amortization of public debt deferred revenue and deferred charges | | | | | | 25 | | 173 | |
Concessionary loan adjustments increase (decrease) | | | | | | 208 | | (1 | ) |
(Gain) or loss on sale of tangible capital assets | | | | | | (6 | ) | (205 | ) |
Valuation adjustments | | | | | | 51 | | 20 | |
Accounts receivable (increase) | | | | | | (807 | ) | (399 | ) |
Due from other governments decrease (increase) | | | | | | 99 | | (434 | ) |
Due from self–supported Crown corporations and agencies decrease (increase) | | | | | | 13 | | (187 | ) |
Accounts payable increase | | | | | | 622 | | 305 | |
Employee future benefits (decrease) increase | | | | | | (1 | ) | 319 | |
Due to other governments (decrease) increase | | | | | | (23 | ) | 74 | |
Due to Crown corporations, agencies and funds increase | | | | | | 149 | | 55 | |
Employee pension plan (decrease) | | | | | | (54 | ) | (68 | ) |
Items applicable to future operations (decrease) increase | | | | | | (260 | ) | 71 | |
Cash derived from (used for) operations | | | | | | 2,200 | | (2,130 | ) |
| | | | | | | | | |
Capital Transactions | | | | | | | | | |
Tangible capital assets dispositions (acquisitions) | | 16 | | (421 | ) | (405 | ) | (220 | ) |
Cash (used for) capital | | 16 | | (421 | ) | (405 | ) | (220 | ) |
| | | | | | | | | |
Investment Transactions | | | | | | | | | |
Loans, advances and mortgages receivable issues | | 218 | | (418 | ) | (200 | ) | (186 | ) |
Other investments—net increase | | | | (2 | ) | (2 | ) | (3 | ) |
Cash (used for) investments | | 218 | | (420 | ) | (202 | ) | (189 | ) |
Total cash inflows (requirements) | | | | | | 1,593 | | (2,539 | ) |
120
PROVINCE OF BRITISH COLUMBIA
PUBLIC ACCOUNTS 2018/19
Consolidated Revenue Fund
Statement of Cash Flow
for the Fiscal Year Ended March 31, 2019—Continued
(Unaudited)
| | In Millions | |
| | 2019 | | 2018 | |
| | Receipts | | Disbursements | | Net | | Net | |
| | $ | | $ | | $ | | $ | |
Total cash inflows (requirements) carried forward from previous page | | | | | | 1,593 | | (2,539 | ) |
| | | | | | | | | |
Financing Transactions1 | | | | | | | | | |
Public debt increase (decrease) | | 20,425 | | (19,271 | ) | 1,154 | | (892 | ) |
(Used for) derived from purchase of assets, recoverable from agencies | | 7,138 | | (10,101 | ) | (2,963 | ) | 2,581 | |
Cash (used for) derived from financing | | 27,563 | | (29,372 | ) | (1,809 | ) | 1,689 | |
(Decrease) in cash and cash equivalents | | | | | | (216 | ) | (850 | ) |
Cash and cash equivalents—beginning of year | | | | | | 448 | | 1,298 | |
Cash and cash equivalents—end of year | | | | | | 232 | | 448 | |
| | | | | | | | | |
Cash and cash equivalents are made up of: | | | | | | | | | |
Cash | | | | | | 158 | | 379 | |
Cash equivalents | | | | | | 74 | | 69 | |
| | | | | | 232 | | 448 | |
1Financing transaction receipts are from debt issues and disbursements are for debt repayments.
121
PROVINCE OF BRITISH COLUMBIA
PUBLIC ACCOUNTS 2018/19
Consolidated Revenue Fund
Schedule of Net Revenue by Source
for the Fiscal Year Ended March 31, 2019
(Unaudited)
| | In Millions | |
| | 2019 | | 2018 | |
| | Estimated | | Actual | | Actual | |
| | $ | | $ | | $ | |
Taxation Revenue1 | | | | | | | |
Personal income | | 9,836 | | 11,364 | | 8,923 | |
Provincial sales | | 7,419 | | 7,353 | | 7,109 | |
Harmonized sales | | | | 7 | | 13 | |
Corporate income | | 4,096 | | 5,180 | | 4,165 | |
Property | | 2,447 | | 2,447 | | 2,202 | |
Property transfer | | 2,235 | | 1,826 | | 2,141 | |
Carbon | | 1,488 | | 1,465 | | 1,255 | |
Tobacco | | 822 | | 781 | | 727 | |
Fuel | | 518 | | 534 | | 538 | |
Employer health | | 463 | | 464 | | | |
Other | | 595 | | 633 | | 602 | |
Commissions on collection of public funds | | (66 | ) | (71 | ) | (70 | ) |
Valuation adjustments | | (11 | ) | (13 | ) | (12 | ) |
Total taxation revenue | | 29,842 | | 31,970 | | 27,593 | |
Contributions from the Federal Government | | | | | | | |
Canada health and social transfers | | 6,921 | | 7,090 | | 6,848 | |
Other contributions | | 209 | | 166 | | 591 | |
Total contributions from the federal government | | 7,130 | | 7,256 | | 7,439 | |
Other Revenue | | | | | | | |
Medical Services Plan premiums | | 1,298 | | 1,299 | | 2,205 | |
Motor vehicle licences and permits | | 570 | | 568 | | 557 | |
Other fees and licences | | 437 | | 457 | | 451 | |
Investment earnings | | 72 | | 96 | | 108 | |
Miscellaneous | | 257 | | 323 | | 284 | |
Asset dispositions | | 1 | | 7 | | 204 | |
Commissions on collection of public funds | | (8 | ) | (8 | ) | (8 | ) |
Valuation adjustments | | (134 | ) | (132 | ) | (149 | ) |
Total other revenue | | 2,493 | | 2,610 | | 3,652 | |
Dividends | | | | | | | |
Self–supported Crown corporations | | | | | | | |
British Columbia Liquor Distribution Branch | | 1,079 | | 1,104 | | 1,119 | |
British Columbia Lottery Corporation | | 1,048 | | 1,149 | | 1,131 | |
Columbia Power Corporation | | 83 | | 70 | | 53 | |
British Columbia Hydro and Power Authority | | 59 | | 59 | | 159 | |
Total dividends | | 2,269 | | 2,382 | | 2,462 | |
122
PROVINCE OF BRITISH COLUMBIA
PUBLIC ACCOUNTS 2018/19
Consolidated Revenue Fund
Schedule of Net Revenue by Source
for the Fiscal Year Ended March 31, 2019—Continued
(Unaudited)
| | In Millions | |
| | 2019 | | 2018 | |
| | Estimated | | Actual | | Actual | |
Natural Resource Revenue2 | | | | | | | |
Forests | | 938 | | 1,354 | | 1,044 | |
Petroleum, natural gas and minerals | | 757 | | 934 | | 965 | |
Water and other | | 516 | | 603 | | 510 | |
Commissions on collection of public funds | | (1 | ) | (1 | ) | (1 | ) |
Valuation adjustments | | (6 | ) | (4 | ) | (5 | ) |
Total natural resource revenue | | 2,204 | | 2,886 | | 2,513 | |
Net Consolidated Revenue Fund Revenue | | 43,938 | | 47,104 | | 43,659 | |
| | | | | | | |
Revenue Collected for and Transferred to Crown Corporations, Agencies and Other Entities3 | | | | | | | |
Ministry of Advanced Education, Skills and Training Post–secondary Institutions | | (67 | ) | (66 | ) | (93 | ) |
Ministry of Energy, Mines and Petroleum Resources Oil and Gas Commission | | (41 | ) | (46 | ) | (37 | ) |
Ministry of Finance British Columbia Transit | | (19 | ) | (21 | ) | (13 | ) |
BC Transportation Financing Authority | | (476 | ) | (469 | ) | (469 | ) |
Cowichan Tribes | | (3 | ) | (4 | ) | (3 | ) |
Municipalities or Eligible Entities | | (65 | ) | (77 | ) | (65 | ) |
Rural Areas | | (354 | ) | (370 | ) | (355 | ) |
South Coast British Columbia Transportation Authority | | (388 | ) | (383 | ) | (362 | ) |
Ministry of Forests, Lands, Natural Resource Operations and Rural Development Habitat Conservation Trust | | (6 | ) | (6 | ) | (6 | ) |
Total | | (1,419 | ) | (1,442 | ) | (1,403 | ) |
1Personal income tax and corporate income tax revenues are recorded after deductions for non–refundable tax credits. Deductions allowable in the calculation of personal income tax revenue were $110 million (2018: $91 million) and corporate income tax were $108 million (2018: $111 million). The types of tax credits adjusting personal income tax and corporation income tax revenues are for foreign taxes, logging taxes, venture capital, scientific and experimental development tax, and mining flow–through share.
Personal income tax revenue was also reduced by $162 million (2018: $161 million) for the BC Tax Reduction.
Personal and corporate income tax refunds may be issued under the International Business Activity Act. Corporate income tax refunds were $8 million (2018: $11 million).
Property tax revenue was recorded net of home owner grants of $829 million (2018: $814 million).
2Oil and gas royalty revenues are reported after adjustments for various royalty deduction programs such as producer cost of service allowances, deep well, marginal, ultra marginal, low production, net profit, new pool discovery and road construction. Deductions allowable in the calculation of royalty revenue were $631 million (2018: $447 million). Natural resource revenue includes mining taxes of $404 million (2018: $483 million) and logging taxes of $123 million (2018: $59 million).
The province offers credits for certain costs incurred by producers including the deep well, road and summer drilling programs. Deep well credits of $2,622 million (2018: $2,590 million), road credits of $27 million (2018: $22 million) and summer drilling credits of $3 million (2018: $3 million) have been incurred by producers and will reduce future natural gas royalties payable when wells go into production.
3The revenue collected for and transferred to Crown corporations, agencies and other entities has not been included in the Consolidated Revenue Fund.
123
PROVINCE OF BRITISH COLUMBIA
PUBLIC ACCOUNTS 2018/19
Consolidated Revenue Fund
Schedule of Comparison of Estimated Expenses to Actual Expenses
for the Fiscal Year Ended March 31, 2019
(Unaudited)
| | In Thousands | |
| | | | Other | | | | | |
| | Estimated | | Authorizations | | Total | | Actual | |
| | $ | | $ | | $ | | $ | |
Special Offices, Ministries and Other Appropriations | | | | | | | | | |
Legislative Assembly | | 77,408 | | | | 77,408 | | 72,563 | |
Officers of the Legislature | | 59,549 | | 19,383 | | 78,932 | | 78,428 | |
Office of the Premier | | 11,305 | | 227 | | 11,532 | | 11,532 | |
Advanced Education, Skills and Training | | 2,211,614 | | 5,500 | | 2,217,114 | | 2,216,473 | |
Agriculture | | 93,143 | | 5,001 | | 98,144 | | 97,789 | |
Attorney General | | 582,979 | | 39,884 | | 622,863 | | 621,954 | |
Children and Family Development | | 1,792,612 | | 35,332 | | 1,827,944 | | 1,825,946 | |
Citizens’ Services | | 524,149 | | 76,046 | | 600,195 | | 597,546 | |
Education | | 6,340,751 | | 41,007 | | 6,381,758 | | 6,362,473 | |
Energy, Mines and Petroleum Resources | | 60,320 | | 45,991 | | 106,311 | | 106,296 | |
Environment and Climate Change Strategy | | 179,286 | | 12,181 | | 191,467 | | 188,196 | |
Finance | | 579,093 | | 267,307 | | 846,400 | | 741,398 | |
Forests, Lands, Natural Resource Operations and Rural Development | | 734,181 | | 674,268 | | 1,408,449 | | 1,407,246 | |
Health | | 19,753,914 | | 89,434 | | 19,843,348 | | 19,819,831 | |
Indigenous Relations and Reconciliation | | 99,516 | | 131,289 | | 230,805 | | 230,252 | |
Jobs, Trade and Technology | | 105,269 | | (2,193 | ) | 103,076 | | 102,488 | |
Labour | | 12,638 | | | | 12,638 | | 12,563 | |
Mental Health and Addictions | | 9,983 | | 3,573 | | 13,556 | | 13,556 | |
Municipal Affairs and Housing | | 674,224 | | 144,566 | | 818,790 | | 817,104 | |
Public Safety and Solicitor General | | 786,466 | | 304,487 | | 1,090,953 | | 1,090,582 | |
Social Development and Poverty Reduction | | 3,363,727 | | | | 3,363,727 | | 3,362,597 | |
Tourism, Arts and Culture | | 144,381 | | 20,366 | | 164,747 | | 164,296 | |
Transportation and Infrastructure | | 890,092 | | 11,562 | | 901,654 | | 900,699 | |
Management of Public Funds and Debt | | 1,216,907 | | | | 1,216,907 | | 1,240,186 | |
Contingencies (All Ministries) and New Programs1 | | 550,000 | | (420,748 | ) | 129,252 | | 21,072 | |
Capital Funding | | 1,772,046 | | | | 1,772,046 | | 1,434,637 | |
Commissions on Collection of Public Funds | | 1 | | | | 1 | | | |
Allowances for Doubtful Revenue Accounts | | 1 | | | | 1 | | (6,279 | ) |
Tax Transfers | | 1,246,000 | | 373,311 | | 1,619,311 | | 1,619,311 | |
Auditor General for Local Government | | 2,600 | | | | 2,600 | | 2,371 | |
Forest Practices Board | | 3,845 | | | | 3,845 | | 3,839 | |
Total expense | | 43,878,000 | | 1,877,774 | | 45,755,774 | | 45,156,945 | |
124
PROVINCE OF BRITISH COLUMBIA
PUBLIC ACCOUNTS 2018/19
Consolidated Revenue Fund
Schedule of Comparison of Estimated Expenses to Actual Expenses
for the Fiscal Year Ended March 31, 2019—Continued
(Unaudited)
| | In Thousands | |
| | | | Other | | | | | |
| | Estimated | | Authorizations | | Total | | Actual | |
| | $ | | $ | | $ | | $ | |
Summary of Appropriations | | | | | | | | | |
| | | | | | | | | |
Voted expense | | 43,138,106 | | 1,798,408 | | 44,936,514 | | 44,372,232 | |
Statutory | | | | | | | | | |
Various Acts | | | | 59,135 | | 59,135 | | 59,135 | |
Special Accounts | | 856,678 | | 302,000 | | 1,158,678 | | 1,083,068 | |
Inter–account transfers | | (116,784 | ) | (281,769 | ) | (398,553 | ) | (357,490 | ) |
Total expense by appropriation 2018/19 | | 43,878,000 | | 1,877,774 | | 45,755,774 | | 45,156,945 | |
| | | | | | | | | |
Total expense by appropriation 2017/18 | | 45,941,000 | | 479,038 | | 46,420,038 | | 45,732,885 | |
1The budget for contingencies has been reallocated to ministries with approved access.
125
PROVINCE OF BRITISH COLUMBIA
PUBLIC ACCOUNTS 2018/19
Consolidated Revenue Fund
Schedule of Financing Transaction Disbursements
for the Fiscal Year Ended March 31, 2019
(Unaudited)
| | In Thousands | |
| | | | Other | | | | | |
| | Estimated | | Authorizations | | Total | | Actual | |
| | $ | | $ | | $ | | $ | |
Special Offices, Ministries and Other Appropriations | | | | | | | | | |
All Ministries | | | | 194,733 | | 194,733 | | 194,733 | |
Legislative Assembly | | 4,378 | | | | 4,378 | | 1,846 | |
Office of the Legislature | | 1,200 | | 125 | | 1,325 | | 1,325 | |
Office of the Premier | | 1 | | | | 1 | | | |
Advanced Education, Skills and Training | | 67,275 | | | | 67,275 | | 66,277 | |
Agriculture | | 1,191 | | | | 1,191 | | 919 | |
Attorney General | | 5,562 | | 7,533 | | 13,095 | | 13,095 | |
Children and Family Development | | 4,580 | | | | 4,580 | | 3,279 | |
Citizens’ Services | | 317,056 | | | | 317,056 | | 280,247 | |
Education | | 828 | | | | 828 | | 229 | |
Energy, Mines and Petroleum Resources | | 41,645 | | 4,279 | | 45,924 | | 45,924 | |
Environment and Climate Change Strategy | | 37,549 | | 7,596 | | 45,145 | | 35,401 | |
Finance | | 1,684,969 | | 129,277 | | 1,814,246 | | 1,769,301 | |
Forests, Lands, Natural Resource Operations and Rural Development | | 184,862 | | 11,199 | | 196,061 | | 186,868 | |
Health | | 1,432 | | | | 1,432 | | 601 | |
Indigenous Relations and Reconciliation | | 3,901 | | | | 3,901 | | 27 | |
Jobs, Trade and Technology | | 1 | | | | 1 | | | |
Labour | | 3 | | | | 3 | | | |
Mental Health and Addictions | | 1 | | | | 1 | | | |
Municipal Affairs and Housing | | 945 | | | | 945 | | 303 | |
Public Safety and Solicitor General | | 13,554 | | | | 13,554 | | 8,138 | |
Social Development and Poverty Reduction | | 1,549 | | | | 1,549 | | 372 | |
Tourism, Arts and Culture | | 1 | | | | 1 | | | |
Transportation and Infrastructure | | 3,436 | | | | 3,436 | | 3,167 | |
Contingencies (All Ministries) and New Programs | | 90,000 | | (15,406 | ) | 74,594 | | | |
Total financing transaction disbursements | | 2,465,919 | | 339,336 | | 2,805,255 | | 2,612,052 | |
| | | | | | | | | |
Summary of Appropriations | | | | | | | | | |
Loans, investments and other requirements | | 497,463 | | 304,342 | | 801,805 | | 749,553 | |
Revenue collected for, and transferred to, other entities | | 1,419,471 | | 34,994 | | 1,454,465 | | 1,442,033 | |
Capital expenditures | | 548,985 | | | | 548,985 | | 420,466 | |
Total financing transactions by appropriation | | 2,465,919 | | 339,336 | | 2,805,255 | | 2,612,052 | |
126
PROVINCE OF BRITISH COLUMBIA
PUBLIC ACCOUNTS 2018/19
Consolidated Revenue Fund
Schedule of Write–offs, Extinguishments and Remissions
for the Fiscal Year Ended March 31, 2019
(Unaudited)
| | In Millions | |
| | Assets, | | | | | |
| | Debts and | | Debts and | | | |
| | Obligations | | Obligations | | Remissions | |
| | Written Off | | Extinguished | | Made | |
| | $ | | $ | | $ | |
Ministry | | | | | | | |
Ministry of Advanced Education, Skills and Training | | | | 36 | | | |
Ministry of Attorney General | | 1 | | | | | |
Ministry of Children and Family Development | | 1 | | | | | |
Ministry of Citizens’ Services | | 3 | | | | | |
Ministry of Energy, Mines and Petroleum Resources | | 1 | | | | | |
Ministry of Finance | | 58 | | | | 1 | |
Ministry of Forests, Lands, Natural Resource Operations and Rural Development | | 23 | | | | | |
Ministry of Health | | 5 | | | | | |
Ministry of Public Safety and Solicitor General | | 6 | | | | | |
Ministry of Social Development and Poverty Reduction | | 4 | | | | | |
Total 2018/19 | | 102 | | 36 | | 1 | |
| | | | | | | |
Total 2017/18 | | 102 | | 3,766 | | 1 | |
This statement includes amounts authorized by sections 17, 18 and 19 of the Financial Administration Act. Amounts authorized for write–off, forgiveness or remission by other statutes are not shown separately in these financial statements.
This schedule is produced as required under Section 9(2)(d)(ii),(iii) and (iv) of the Budget Transparency and Accountability Act.
127
Provincial Debt
Summary
(Unaudited)
The following unaudited Provincial Debt Summary information is intended to provide additional information to financial statement readers.
The accounting policies applied for this unaudited information are different in some cases from the generally accepted accounting principles followed for the audited Summary Financial Statements. The Provincial Debt Summary figures include guaranteed debt in the calculation of total debt and calculate debt, interest costs and revenue as if the modified equity enterprises were consolidated on a line-by-line basis.

PROVINCE OF BRITISH COLUMBIA
PUBLIC ACCOUNTS 2018/19
Overview of Provincial Debt
(Unaudited)
The provincial government, its Crown corporations, agencies and government organizations incur debt to fund operations and finance capital projects.
Provincial debt is reported using two basic classifications: (1) taxpayer–supported debt; and (2) self–supported debt.
Taxpayer–supported Debt—includes government direct debt, which is incurred for government operating and capital purposes, the debt of Crown corporations and agencies, school districts, universities, colleges, institutes and health organizations that require operating or debt service subsidies from the provincial government and are fully consolidated in the Summary Financial Statements. The BC Transportation Financing Authority is an example of a taxpayer–supported Crown corporation.
Self–supported Debt—includes the debt of commercial Crown corporations and agencies as well as the Warehouse Borrowing Program. Commercial Crown corporations and agencies generate sufficient revenues to cover interest costs and repay principal and may pay dividends to the province. The British Columbia Hydro and Power Authority is an example of a commercial Crown corporation. The Warehouse Borrowing Program takes advantage of borrowing opportunities in advance of requirements. Eventually, this debt is allocated to the province or Crown corporations and agencies. In the interim, the funds are invested at market rates.
The Finance Statutes (Deficit Authorization and Debt Elimination) Amendment Act, 2009 requires that effective April 1, 2013, any increase in cash and cash equivalents in the Consolidated Revenue Fund must be applied to reduce or eliminate any provincial government direct operating debt. Supplementary estimates may not be presented to the Legislative Assembly if the most recent quarterly report includes a forecast that there will be provincial government direct operating debt at the end of the fiscal year to which the quarterly report applies.
The following provincial debt summary provides additional detailed information and related key indicators and benchmarks to allow a more informed assessment of the debt totals. A reconciliation is also provided to explain the differences between the Summary of Provincial Debt and the Summary Financial Statements.
The total provincial net debt as at March 31, 2019 was $65,962 million, which consists of $65,864 million in the Summary Financial Statements in addition to $835 million of non–guaranteed debt and $15 million of guaranteed debt less $752 million of sinking fund investments.
131
PROVINCE OF BRITISH COLUMBIA
PUBLIC ACCOUNTS 2018/19
Provincial Debt
as at March 31, 2019
(Unaudited)
The accumulated provincial net debt of $65,962 million has been incurred for various purposes as shown in Chart 1 below. Over the years, the proceeds from borrowings have contributed to economic development in the province and have provided resources to deliver health, education and social programs, and transportation infrastructure.
At March 31, 2019, taxpayer–supported net debt totalled $42,681 million including debt incurred for transportation infrastructure ($16,767 million), educational facilities ($14,274 million), health facilities ($7,968 million), and other debt ($3,672 million). Other debt is comprised mainly of debt related to social housing, provincial government general capital expenditures, service delivery agencies and various loan guarantee programs.
At March 31, 2019, self–supported debt totalled $23,281 million including debt of commercial Crown corporations and agencies: British Columbia Hydro and Power Authority ($22,064 million), Columbia River power projects ($418 million), Columbia Power Corporation ($282 million), British Columbia Lottery Corporation ($100 million), commercial subsidiaries of certain post–secondary institutions ($387 million), and debt of other government business enterprise ($30 million).
Chart 1 – Provincial debt as at March 31, 2019
In Millions/Percent of Total
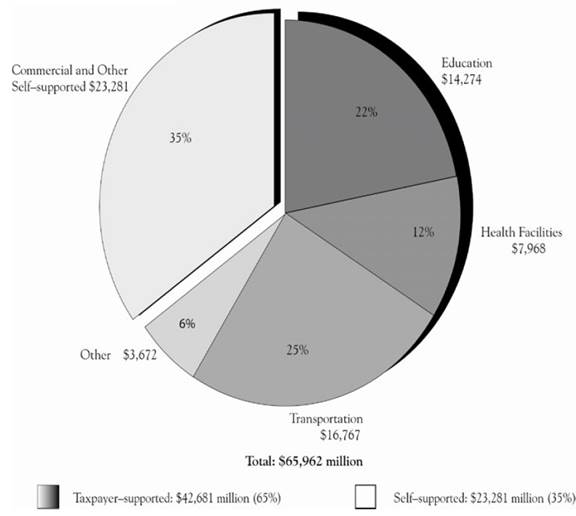
132
PROVINCE OF BRITISH COLUMBIA
PUBLIC ACCOUNTS 2018/19
Change in Provincial Debt1
(Unaudited)
Provincial debt increased by $1,043 million in 2018/19 when compared to the prior year. This includes a decrease in taxpayer–supported debt of $926 million and an increase in self–supported debt of $1,969 million. Warehouse Program debt was zero at fiscal year–end. Chart 2 below shows the change in provincial debt for the year ended March 31, 2019.
Taxpayer–supported Debt—Decreased by $926 million due to $1,156 million in government direct operating debt, $355 million for provincial government general capital, $34 million for social housing, and $97 million in other debt. The decrease was partially offset by increases of $613 million in the transportation sector, $65 million in the health sector, and $38 million in the education sector.
Self–supported Debt—Increased by $1,969 million due to new capital financing requirements of $2,074 million by British Columbia Hydro and Power Authority. This increase was partially offset by a $55 million decrease by British Columbia Lottery Corporation, $31 million decrease in the commercial subsidiaries of certain post–secondary institutions and $19 million decrease in other commercial Crown corporations.
Chart 2 – Change in provincial debt for the year ended March 31, 2019
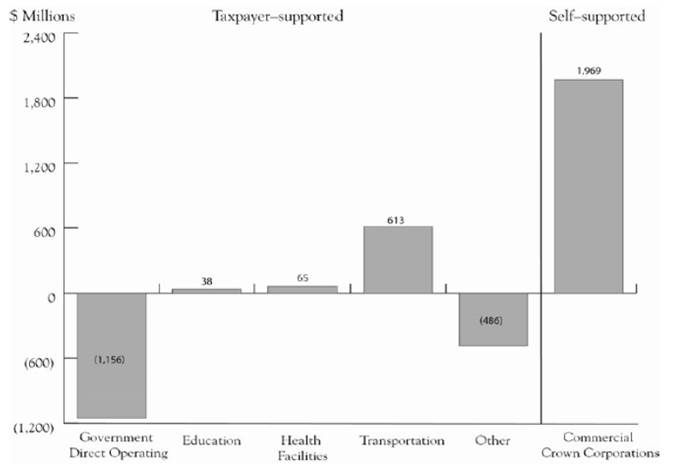
1Includes gross new borrowings plus changes in sinking fund balances less debt maturities.
133
PROVINCE OF BRITISH COLUMBIA
PUBLIC ACCOUNTS 2018/19
Reconciliation of Summary Financial Statements’ Deficit (Surplus)
to Change in Taxpayer–supported Debt and Total Debt
for the Fiscal Year Ended March 31, 2019
(Unaudited)
| | In Millions | |
| | 2019 | | 2018 | |
| | $ | | $ | |
(Surplus) for the year | | (1,535 | ) | (314 | ) |
| | | | | |
Taxpayer–supported debt decreased by: | | | | | |
Non–cash expenses included in (surplus) | | (2,794 | ) | (2,420 | ) |
Accounts receivable, accounts payable and other working capital net changes | | (962 | ) | (924 | ) |
| | (3,756 | ) | (3,344 | ) |
| | | | | |
Taxpayer–supported debt increased by: | | | | | |
Self–supported Crown corporation and agency earnings in excess of contributions to the Consolidated Revenue Fund | | (706 | ) | (1,891 | ) |
Tangible capital asset net acquisitions | | 4,379 | | 3,531 | |
Net increases in loans, advances and investments | | 692 | | 4,126 | |
| | 4,365 | | 5,766 | |
Net (decrease) increase in taxpayer–supported debt | | (926 | ) | 2,108 | |
Taxpayer–supported debt—beginning of year | | 43,607 | | 41,499 | |
Taxpayer–supported debt—end of year | | 42,681 | | 43,607 | |
Self–supported debt | | 23,281 | | 21,312 | |
Total debt1 | | 65,962 | | 64,919 | |
Reconciliation of Total Debt to Summary Financial Statements’ Debt
as at March 31, 2019
(Unaudited)
| | In Millions | |
| | 2019 | | 2018 | |
| | $ | | $ | |
Total debt | | 65,962 | | 64,919 | |
| | | | | |
Debt included as part of equity in self–supported Crown corporations and agencies | | (835 | ) | (880 | ) |
Contingent liabilities for debt of individuals and organizations that have been guaranteed by the province | | (15 | ) | (16 | ) |
Sinking fund investments | | 752 | | 1,348 | |
Summary Financial Statements’ debt | | 65,864 | | 65,371 | |
| | | | | |
Comprised of: | | | | | |
Taxpayer–supported debt | | 43,209 | | 44,752 | |
Self–supported debt | | 22,655 | | 20,619 | |
Summary Financial Statements’ debt | | 65,864 | | 65,371 | |
1See Summary of Provincial Debt, page 143.
134
PROVINCE OF BRITISH COLUMBIA
PUBLIC ACCOUNTS 2018/19
Change in Provincial Debt,
Comparison to Budget
(Unaudited)
Provincial debt increased by $1,043 million compared to a budgeted increase of $4,453 million resulting in a $3,410 million decrease from budget net of the $350 million forecast allowance. Chart 3 below shows the difference between the actual change in provincial debt and the budgeted change by major category.
Taxpayer–supported debt decreased by $926 million compared to a budgeted increase of $1,591 million. The $2,517 million decrease from budget is due to lower than forecasted borrowing for the transportation sector ($1,014 million), the education sector ($308 million), the health sector ($216 million), and other capital investments ($979 million).
Self–supported debt increased by $1,969 million compared to a budgeted increase of $2,512 million. The $543 million decrease from budget is due to lower than forecasted borrowing for British Columbia Hydro and Power Authority ($477 million), British Columbia Lottery Corporation ($70 million), Columbia Power Corporation ($4 million), and other government business enterprises ($40 million), partially offset by higher than forecasted borrowing for commercial subsidiaries of certain post–secondary institutions ($47 million) and Columbia River Power Projects of ($1 million).
Chart 3 – Change in provincial debt1 (actual vs budget) for the year ended March 31, 2019
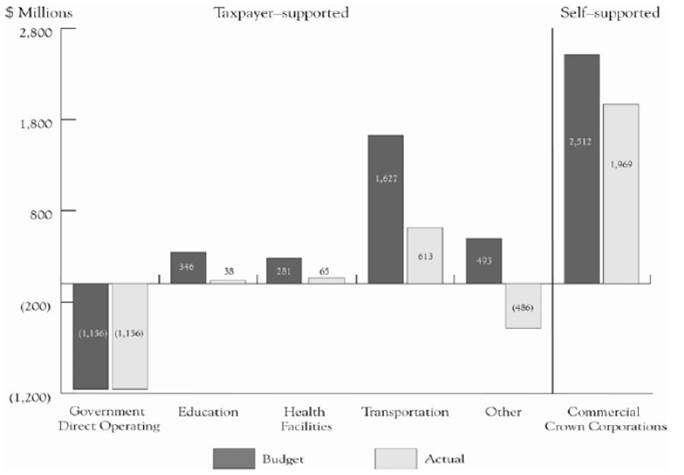
1The change in forecast allowance is not included in this chart.
135
PROVINCE OF BRITISH COLUMBIA
PUBLIC ACCOUNTS 2018/19
Interprovincial Comparison of Taxpayer–supported Debt
as a Percentage of Gross Domestic Product
(Unaudited)
Chart 4 below shows the ratio of each province’s taxpayer–supported debt as a percentage of their gross domestic product (GDP). The ratio of a province’s taxpayer–supported debt relative to its GDP highlights the ability of a province to service its debt load. This ratio is often used by investors and credit rating agencies when assessing a province’s investment quality. According to the most recent data published by Moody’s Investors Service Inc. (Moody’s), British Columbia’s taxpayer–supported debt ratio is one of the lowest in Canada and this translates into a strong credit rating and relatively low debt servicing costs.
Chart 4 – Interprovincial comparison of taxpayer–supported debt as a percentage of GDP
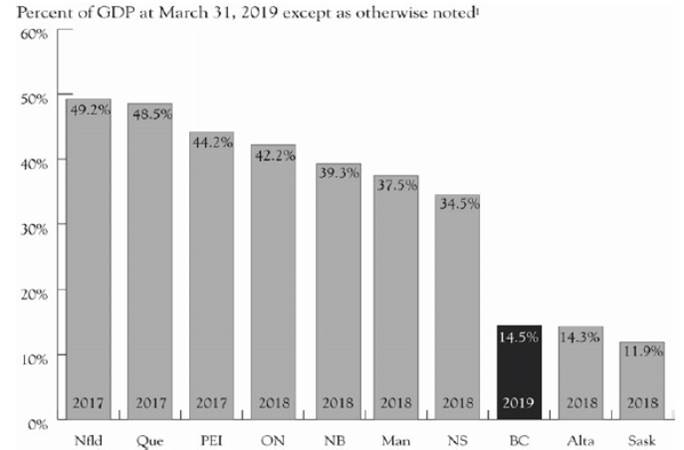
Source: Moody’s Investors Service Inc.
1Figure for Alberta has been restated to reflect latest Moody’s report.
British Columbia’s results as per Ministry of Finance’s actuals; Moody’s results for British Columbia as at March 31, 2018 are 15.3%.
136
PROVINCE OF BRITISH COLUMBIA
PUBLIC ACCOUNTS 2018/19
Interprovincial Comparison of Taxpayer–supported Debt
Service Costs as a Percentage of Revenue
(Unaudited)
Chart 5 shows the ratio (interest bite) of each province’s taxpayer–supported debt servicing costs as a percentage of revenue. The interest bite indicates how much of each dollar of provincial revenue is used to pay for taxpayer–supported debt service costs. According to the most recent data published by Moody’s, British Columbia has one of the lowest taxpayer–supported debt service costs as a percentage of revenue of all provinces.
Chart 5 – Interprovincial comparison of taxpayer–supported debt service costs as a percentage of revenue
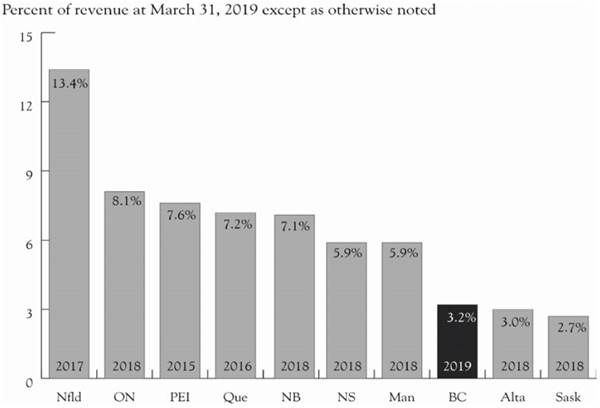
Source: Moody’s Investors Service Inc.
British Columbia’s results as per Ministry of Finance’s actuals; Moody’s results for British Columbia as at March 31, 2018 are 3.4%.
Moody’s definition of taxpayer–supported debt is modestly different from the definition used by the Ministry of Finance. The financial community has not agreed upon a definition for taxpayer–supported debt. The definition used by Moody’s is the closest to that employed by the ministry but, even then, there are small differences. The value of presenting Moody’s debt indicators is that it provides an interprovincial comparison from a third party source, which is helpful for readers to understand the province’s relative performance and ranking.
More comprehensive information on the debt of the province and its Crown corporations and agencies is provided on the Debt Management Branch website. This detailed information can assist readers in assessing the province’s debt position. The website is available on the Internet at: http://gov.bc.ca/provincialdebt.
137

INDEPENDENT AUDITOR’S REPORT
To the Minister of Finance, Province of British Columbia
Qualified Opinion
I have audited the accompanying debt-related statements of the Government of the Province of British Columbia (Government), which comprise the summary of provincial debt as at March 31, 2019, the key indicators of provincial debt and the summary of performance measures for the year then ended, and a summary of significant accounting policies and other explanatory information.
In my opinion, except for the effects of the matters described in the Basis for Qualified Opinion section of my report, the summary of provincial debt as at March 31, 2019, the key indicators of provincial debt and the summary of performance measures for the year then ended are prepared, in all material respects, in accordance with the basis of accounting as described in the notes to the debt-related statements.
Basis for Qualified Opinion
I believe that the audit evidence I have obtained is sufficient and appropriate to provide a basis for my qualified opinion. My qualification of the debt-related statements is as follows:
Classification of the fiscal 2017 debt of the Transportation Investment Corporation
As at March 31, 2017 Government determined the Transportation Investment Corporation to be a government business enterprise, and therefore classified the debt of the Transportation Investment Corporation as self-supported debt. Under Canadian Public Sector Accounting Standards, to be classified as a government business enterprise, an organization must be able to maintain its operations and meet its liabilities from revenues received from outside the government reporting entity. Based on the conditions that existed as of March 31, 2017, in my opinion, the Transportation Investment Corporation did not meet this criteria and therefore was inappropriately classified as a government business enterprise for that year. As a result, for the year ending March 31, 2017 the material changes to the debt-related statements would be as follows:
Taxpayer-supported debt | $3,430 million increase |
Self-supported debt | $3,430 million decrease |
Taxpayer-supported debt to revenue (per cent) | 6.9 increase |
Taxpayer-supported debt per capita ($) | 722 increase |
Taxpayer-supported debt to GDP (per cent) | 1.3 increase |
This qualification of my opinion relates only to the fiscal year ending March 31, 2017.
MINISTER OF FINANCE
Independent Auditor’s Report
I conducted my audit in accordance with Canadian generally accepted auditing standards. My responsibilities under those standards are further described in the Auditor’s Responsibilities for the Audit of the Debt-related Statements section of my report. I am independent of the Government in accordance with the ethical requirements that are relevant to my audit of the debt-related statements in Canada, and I have fulfilled my other ethical responsibilities in accordance with these requirements.
Emphasis of Matter - Basis of Accounting
I draw attention to the notes to the debt-related statements, which describe the basis of accounting. Through the debt-related statements the Government reports to the Legislative Assembly on its debt management by presenting five years of information on provincial debt and debt indicators, and compares its actual results of performance measures to its target measures for the fiscal year ended March 31, 2019. As a result, the debt-related statements may not be suitable for another purpose. My opinion is not modified in respect of this matter.
Other Accompanying Information
Government is responsible for the information they reported in the annual Public Accounts report.
My opinion on the debt-related statements does not cover other information accompanying the debt-related statements and, except for my independent auditor’s opinion on the summary financial statements, I do not express any form of assurance conclusion thereon.
In connection with my audit of the debt-related statements, my responsibility is to read other information and, in doing so, consider whether the other information is materially inconsistent with the debt-related statements or my knowledge obtained during the audit or otherwise appears to be materially misstated.
If, based on the work I have performed on the other information, I conclude that there is a material misstatement therein, I am required to report that fact in this auditor’s report. As described in the Basis for Qualified Opinion section above, I believe there are material misstatements in Government’s accounting for the classification of the fiscal 2017 debt of the Transportation Investment Corporation. I have concluded that the other information is materially misstated for the same reason with respect to the amounts or other items in the Public Accounts report affected by these departures from the stated basis of accounting.
Government’s Responsibility for the Debt-related Statements
Government is responsible for determining the appropriateness of the stated basis of accounting as described in the notes to the debt-related statements and for the preparation of the debt-related statements in accordance with the stated basis of accounting. Government is also responsible for such internal control as management determines is necessary to enable the preparation of the debt-related statements that are free from material misstatement, whether due to fraud or error.

MINISTER OF FINANCE
Independent Auditor’s Report
Auditor’s Responsibilities for the Audit of the Debt-related Statements
My objectives are to obtain reasonable assurance about whether the debt-related statements as a whole are free from material misstatement, whether due to fraud or error, and to issue an auditor’s report that includes my opinion. Reasonable assurance is a high level of assurance, but is not a guarantee that an audit conducted in accordance with Canadian generally accepted auditing standards will always detect a material misstatement when it exists. Misstatements can arise from fraud or error and are considered material if, individually or in the aggregate, they could reasonably be expected to influence the economic decisions of users taken on the basis of the debt-related statements.
As part of an audit in accordance with Canadian generally accepted auditing standards, I exercise professional judgment and maintain professional skepticism throughout the audit. I also:
· Identify and assess the risks of material misstatement of the debt-related statements, whether due to fraud or error, design and perform audit procedures responsive to those risks, and obtain audit evidence that is sufficient and appropriate to provide a basis for my opinion. The risk of not detecting a material misstatement resulting from fraud is higher than for one resulting from error, as fraud may involve collusion, forgery, intentional omissions, misrepresentations, or the override of internal control.
· Obtain an understanding of internal control relevant to the audit in order to design audit procedures that are appropriate in the circumstances, but not for the purpose of expressing an opinion on the effectiveness of the internal control.
· Evaluate the appropriateness of accounting policies used and the reasonableness of accounting estimates, if any, and related disclosures made by management.
· Evaluate the overall presentation, structure and content of the debt-related statements, and whether it represents the underlying transactions and events in a manner that complies with the basis of accounting described in the notes to the debt-related statements.
I communicate with those charged with governance regarding, among other matters, the planned scope and timing of the audit and significant audit findings, including any significant deficiencies in internal control that I identify during my audit.
| /s/ Carol Bellringer |
Victoria, British Columbia, Canada | Carol Bellringer, FCPA, FCA |
June 28, 2019 | Auditor General |

PROVINCE OF BRITISH COLUMBIA
PUBLIC ACCOUNTS 2018/19
Summary of Provincial Debt1
as at March 31
| | In Millions | |
| | 2019 | | 2018 | | 2017 | | 2016 | | 2015 | |
| | $ | | $ | | $ | | $ | | $ | |
Taxpayer–supported Debt | | | | | | | | | | | |
Provincial government direct operating | | | | | | | | | | | |
Provincial government operating | | | | | | 1,948 | | 5,338 | | 6,584 | |
Provincial government general capital | | | | 1,156 | | 2,696 | | 2,696 | | 2,696 | |
| | 0 | | 1,156 | | 4,644 | | 8,034 | | 9,280 | |
Education2 | | | | | | | | | | | |
Schools | | 8,904 | | 8,908 | | 8,473 | | 8,033 | | 7,600 | |
Post–secondary institutions | | 5,370 | | 5,328 | | 4,984 | | 4,731 | | 4,518 | |
| | 14,274 | | 14,236 | | 13,457 | | 12,764 | | 12,118 | |
Health facilities2 | | 7,968 | | 7,903 | | 7,552 | | 6,998 | | 6,522 | |
Highways, ferries and public transit | | | | | | | | | | | |
BC Transportation Financing Authority | | 11,293 | | 10,388 | | 9,974 | | 9,177 | | 8,428 | |
British Columbia Transit | | 73 | | 84 | | 94 | | 106 | | 123 | |
Port Mann Bridge3 | | 3,510 | | 3,508 | | | | | | | |
Public transit2 | | 870 | | 1,000 | | 1,000 | | 1,000 | | 1,000 | |
SkyTrain extension2 | | 1,021 | | 1,174 | | 1,174 | | 1,174 | | 1,174 | |
| | 16,767 | | 16,154 | | 12,242 | | 11,457 | | 10,725 | |
Other | | | | | | | | | | | |
B.C. Pavilion Corporation | | 371 | | 374 | | 376 | | 389 | | 381 | |
Provincial government general capital | | 2,363 | | 2,718 | | 2,288 | | 1,987 | | 1,698 | |
Social Housing4 | | 844 | | 878 | | 695 | | 760 | | 715 | |
Other5 | | 94 | | 188 | | 245 | | 330 | | 441 | |
| | 3,672 | | 4,158 | | 3,604 | | 3,466 | | 3,235 | |
Total taxpayer–supported debt | | 42,681 | | 43,607 | | 41,499 | | 42,719 | | 41,880 | |
143
PROVINCE OF BRITISH COLUMBIA
PUBLIC ACCOUNTS 2018/19
Summary of Provincial Debt1—Continued
as at March 31
| | In Millions | |
| | 2019 | | 2018 | | 2017 | | 2016 | | 2015 | |
| | $ | | $ | | $ | | $ | | $ | |
Self–supported Debt | | | | | | | | | | | |
| | | | | | | | | | | |
Commercial Crown corporations and agencies | | | | | | | | | | | |
British Columbia Hydro and Power Authority | | 22,064 | | 19,990 | | 19,685 | | 17,929 | | 16,544 | |
British Columbia Lottery Corporation | | 100 | | 155 | | 145 | | 150 | | 140 | |
Columbia Power Corporation | | 282 | | 286 | | 291 | | 296 | | 300 | |
Columbia River power projects6 | | 418 | | 433 | | 448 | | 459 | | 464 | |
Post–secondary institutions’ subsidiaries7 | | 387 | | 418 | | 340 | | 310 | | 222 | |
Transportation Investment Corporation3 | | | | | | 3,398 | | 3,355 | | 3,335 | |
Other8 | | 30 | | 30 | | 31 | | 33 | | 35 | |
Total self–supported debt | | 23,281 | | 21,312 | | 24,338 | | 22,532 | | 21,040 | |
Total provincial debt | | 65,962 | | 64,919 | | 65,837 | | 65,251 | | 62,920 | |
1Debt is after deductions of sinking funds, unamortized discounts and unrealized foreign exchange gains/(losses), and excludes accrued interest. Government direct and fiscal agency debt accrued interest is reported in the government’s accounts as an accounts payable.
2Represents government direct debt incurred for capital financing of education and health facilities and public transit infrastructure.
3Beginning in 2017/18, debt related to the Port Mann Bridge has been reclassified as taxpayer–supported due to the elimination of tolls effective September 1, 2017.
4Includes the debt of the British Columbia Housing Management Commission and the Provincial Rental Housing Corporation.
5Includes debt of other taxpayer–supported Crown corporations and agencies and the fiscal agency loans to local governments. Also includes reconstruction loan program guarantees, student loan guarantees, loan guarantees to agricultural producers, guarantees under economic development and home mortgage assistance programs.
6Debt related to joint ventures of the Columbia Power Corporation and the Columbia Basin Trust.
7Includes debt of Heritage Realty Properties Ltd., SFU Community Trust, and UBC Property Investments Ltd.
8Includes Columbia Basin Trust’s share of real estate investment joint ventures’ debt, British Columbia Liquor Distribution Branch and School District 91’s private company.
Summary of Provincial Debt
The debt–related statements are prepared using financial information that supports the government’s Summary Financial Statements, which are prepared in accordance with Canadian generally accepted accounting principles. However, in the debt–related statements, there are some differences in the methods of compilation and presentation compared to generally accepted accounting principles. In the debt–related statements, debt is calculated net of sinking fund assets, includes debt directly incurred by modified equity enterprises, and other commercial subsidiaries of taxpayer–supported entities, and includes debt incurred by others outside the government reporting entity where there is provincial guarantee as to the payment of principal and interest. Also, total provincial revenue and interest costs include the gross revenue and interest costs of modified equity enterprises, and total provincial interest costs are net of sinking fund earnings.
Provincial government general capital
In February 2009, government tabled the Finance Statutes (Deficit Authorization and Debt Elimination) Amendment Act, 2009, which prohibited spending on supplementary estimates until operating debt was eliminated. Historically, government direct operating debt included debt attributed to financing ministry capital expenditures, in addition to borrowing for operating deficits and working capital needs. In accordance with the amending legislation, beginning in 2009/10, debt attributed to amounts spent on ministry capital are reported as “Provincial government general capital” and reported separately from direct operating debt for deficit financing. Amounts attributed to ministry capital spending prior to 2008/09 are disclosed as a component of direct operating debt for compliance with the amended legislation. These segregated debt disclosures are consistent with government’s policy of paying down operating debt before other types of debt.
144
PROVINCE OF BRITISH COLUMBIA
PUBLIC ACCOUNTS 2018/19
Key Indicators of Provincial Debt1
for the Fiscal Years Ended March 31
| | 2019 | | 2018 | | 2017 | | 2016 | | 2015 | |
| | Budget | | | | | | | | | | | |
| | Estimate | | Actual | | Actual | | Actual | | Actual | | Actual | |
| | | | | | | | | | | | | |
Debt to Revenue (percent) | | | | | | | | | | | | | |
Total provincial | | 98.1 | | 89.5 | | 94.7 | | 99.3 | | 105.9 | | 106.6 | |
Taxpayer–supported | | 84.9 | | 75.0 | | 82.5 | | 81.8 | | 91.3 | | 94.1 | |
| | | | | | | | | | | | | |
Debt per Capita ($)2 | | | | | | | | | | | | | |
Total provincial | | 14,249 | | 13,214 | | 13,477 | | 13,855 | | 13,934 | | 13,586 | |
Taxpayer–supported | | 9,284 | | 8,550 | | 9,053 | | 8,733 | | 9,122 | | 9,043 | |
| | | | | | | | | | | | | |
Debt to GDP (percent)3 | | | | | | | | | | | | | |
Total provincial | | 23.8 | | 22.3 | | 23.2 | | 25.1 | | 26.6 | | 26.4 | |
Taxpayer–supported | | 15.5 | | 14.5 | | 15.6 | | 15.9 | | 17.4 | | 17.5 | |
| | | | | | | | | | | | | |
Interest Bite (cents per dollar of revenue)4 | | | | | | | | | | | | | |
Total provincial | | 3.9 | | 3.8 | | 4.0 | | 3.8 | | 4.7 | | 4.3 | |
Taxpayer–supported | | 3.5 | | 3.2 | | 3.3 | | 3.2 | | 4.0 | | 3.7 | |
| | | | | | | | | | | | | |
Interest Costs ($ millions) | | | | | | | | | | | | | |
Total provincial | | 2,755 | | 2,776 | | 2,759 | | 2,521 | | 2,879 | | 2,525 | |
Taxpayer–supported | | 1,845 | | 1,793 | | 1,725 | | 1,644 | | 1,892 | | 1,651 | |
| | | | | | | | | | | | | |
Interest Rate (percent)5 | | | | | | | | | | | | | |
Taxpayer–supported | | 4.2 | | 4.2 | | 4.1 | | 3.9 | | 4.5 | | 4.0 | |
| | | | | | | | | | | | | |
Revenue Factor for Key Indicators ($ million) | | | | | | | | | | | | | |
Total provincial6 | | 70,750 | | 73,734 | | 68,551 | | 66,334 | | 61,589 | | 59,018 | |
Taxpayer–supported7 | | 53,246 | | 56,894 | | 52,866 | | 50,726 | | 46,805 | | 44,514 | |
145
PROVINCE OF BRITISH COLUMBIA
PUBLIC ACCOUNTS 2018/19
Key Indicators of Provincial Debt1
for the Fiscal Years Ended March 31—Continued
| | 2019 | | 2018 | | 2017 | | 2016 | | 2015 | |
| | Budget | | | | | | | | | | | |
| | Estimate | | Actual | | Actual | | Actual | | Actual | | Actual | |
| | | | | | | | | | | | | |
Total Debt ($ millions) | | | | | | | | | | | | | |
Total provincial | | 69,372 | | 65,962 | | 64,919 | | 65,837 | | 65,251 | | 62,920 | |
Taxpayer–supported8 | | 45,198 | | 42,681 | | 43,607 | | 41,499 | | 42,719 | | 41,880 | |
| | | | | | | | | | | | | |
Provincial GDP ($ millions)9 | | 291,672 | | 295,316 | | 279,370 | | 261,808 | | 244,990 | | 238,726 | |
| | | | | | | | | | | | | |
Population (thousands at July 1)10 | | 4,869 | | 4,992 | | 4,817 | | 4,752 | | 4,683 | | 4,631 | |
1Figures for prior years have been restated to conform with the presentation used for 2018/19 and to include the effects of changes in underlying data.
2The ratio of debt to population (e.g., debt at March 31, 2019 divided by population at July 1, 2018).
3The ratio of debt outstanding at fiscal year end to provincial nominal gross domestic product (GDP) for the calendar year ending in the fiscal year (e.g., debt at March 31, 2019 divided by 2018 GDP).
4The ratio of interest costs (less sinking fund interest) to revenue. Figures include capitalized interest expense in order to provide a more comparable measure to outstanding debt.
5Weighted average of all outstanding debt issues.
6Includes revenue less earnings related to enterprises (sinking fund earnings, loan interest and net earnings), plus revenue of all enterprises.
7Excludes revenue of government enterprises, but includes dividends from enterprises paid to the Consolidated Revenue Fund.
8Excludes debt of commercial Crown corporations and agencies, and funds held under the province’s warehouse borrowing program.
9Nominal GDP for the calendar year ending in the fiscal year (e.g. GDP for 2018 is used for the fiscal year ended March 31, 2019). As nominal GDP for the calendar year ending 2018 is not available, the 2018 GDP projected in February 2019 Budget and Fiscal Plan 2019/20 – 2021/22 has been used for the fiscal year ended March 31, 2019 for demonstration purposes. Preliminary GDP figures are presented as published for the year noted.
10Population at July 1st within the fiscal year (e.g. population at July 1, 2018 is used for the fiscal year ended March 31, 2019). Preliminary population figures are presented as published for the year noted per the February 2019 Budget and Fiscal Plan 2019/20 – 2021/22.
Summary of Performance Measures
for the Fiscal Year Ended March 31, 2019
| | 2019 | | 2019 | | 2018 | |
| | Target | | Actual | | Actual | |
| | | | | | | |
Provincial credit rating1 | | Aaa | | Aaa | | Aaa | |
Taxpayer–supported debt to GDP ratio2 | | 15.5 | % | 14.5 | % | 15.6 | % |
Taxpayer–supported debt service costs as a percentage of revenue2 | | 3.5 | % | 3.2 | % | 3.3 | % |
1Performance target presented in the Ministry of Finance 2019/20–2021/22 Service Plan, actuals as per Moody’s Investors Services Inc.
2These performance measures, among others, are key indicators on which credit rating agencies rely to determine the province’s credit rating.
146
PROVINCE OF BRITISH COLUMBIA
PUBLIC ACCOUNTS 2018/19
Definitions
(Unaudited)
Consolidated Revenue Fund—includes the taxpayer–supported activities of the General Fund and special funds of the government through which the government delivers central government programs. It does not include the activities of government operated through Crown corporations and agencies or the school districts, universities, colleges, institutes and health organizations (SUCH) sector.
Consolidation—the methods used to combine the results of Crown corporations and agencies and the SUCH sector entities with the Consolidated Revenue Fund. The two methods used are:
(i) Full or Proportional Consolidation—the accounts of the Crown corporation, agency or SUCH sector entity are adjusted to a basis consistent with the accounting policies of the government. The operating result and financial position of the Crown and SUCH entities are combined with those of the Consolidated Revenue Fund on a line–by–line basis. Inter–entity accounts and transactions are eliminated upon consolidation. Proportional consolidation differs from full consolidation in that only the government’s portion of operating and financial results of a joint venture is combined with those of the Consolidated Revenue Fund on a line–by–line basis.
(ii) Modified Equity Consolidation—the original investment of the government in the Crown corporation, agency or SUCH sector entity is initially recorded at cost and adjusted annually to include the net earnings/losses and other net equity changes of the entity. There is no adjustment to conform to government accounting policies. Since the government ensures the ongoing activities of self–supported Crown corporations and agencies, full account is taken of losses in these entities, even when cumulative losses exceed the original investment. Accounts and transactions between self–supported entities are not eliminated; however, profit elements included in such transactions, including certain increases in contributed surplus, are eliminated.
Debt has a variety of meanings:
(i) Gross debt—the par value of the debt, unamortized discount and premiums, and unrealized foreign exchange gains or losses.
(ii) Net debt—gross debt less sinking fund investments.
(iii) Provincial debt—net debt plus guaranteed debt and debt directly incurred by modified equity entities.
Deficit—the meaning is dependent upon the statement to which it applies:
(i) Consolidated Statement of Financial Position: Accumulated Deficit—the amount by which the total liabilities of the government exceeds its total assets.
(ii) Consolidated Statement of Operations: Annual Deficit—the amount by which the total annual expenses for the operating year exceed total annual revenues (see “Surplus” definition).
Entitlement—a government transfer that must be made if the recipient meets specified eligibility criteria. Entitlements are non–discretionary in the sense that both eligibility criteria and the amount of the payment are prescribed in a statute or regulation.
Financial assets—assets on hand at the end of the accounting period, including cash and assets that are readily convertible into cash and are not intended for consumption in the normal course of activities. These assets could be liquidated to discharge existing liabilities or finance future operations. Financial assets could include sinking fund investments held to pay debt at maturity.
Government business enterprise—a government organization that has all the following characteristics:
(i) is a separate legal entity with the power to contract in its own name and that can sue or be sued;
(ii) has been delegated the financial and operational authority to carry on a business;
(iii) sells goods and/or services to individuals and organizations outside the government reporting entity as its principal activity; and
(iv) can, in the normal course of its operation, maintain its operations and meet its liabilities from revenue received from sources outside the government reporting entity.
147
PROVINCE OF BRITISH COLUMBIA
PUBLIC ACCOUNTS 2018/19
Definitions—Continued
(Unaudited)
Government partnership—a contractual arrangement between the government and a party or parties outside the government reporting entity that has all the following characteristics:
(i) the partners cooperate toward achieving significant, clearly defined common goals;
(ii) the partners make a financial investment in the government partnership;
(iii) the partners share control of decisions related to the financial and operating policies of the government partnership on an ongoing basis; and
(iv) the partners share, on an equitable basis, significant risks and benefits associated with the operation.
Government transfers—transfer of money from government to an individual, organization or another government from which the government making the transfer does not:
(i) receive any goods or services directly in return;
(ii) expect to be repaid in the future; nor
(iii) expect a financial return.
Grants—a government transfer made at the sole discretion of the government. The government has the discretion to decide whether or not to make the grant, any conditions to be complied with, the amount of the grant and the recipient of the grant.
Net liabilities—the amount by which the total liabilities of the government exceed its total financial assets. The separate calculation of this number on the Consolidated Statement of Financial Position is unique to financial statements for Canadian senior governments. This calculation excludes non–financial assets such as buildings and prepaid expenses.
Other comprehensive income (OCI)—is made up of certain unrealized gains and losses of self–supported Crown corporations that are not reported in their statement of operations, but are reported in their statement of financial position. These unrealized gains and losses will be recognized in the statement of operations when they become realized gains and losses.
Provincial government direct debt—combines the government direct operating debt and the debt incurred to finance education, health facilities and public transit. This combined portfolio represents the debt for which the government has direct responsibility for the associated debt service costs.
Self–supported Crown corporations and agencies—all Crown corporations and agencies that are accountable for the administration of their financial affairs and resources either to a minister of the government or directly to the legislature and are owned or controlled by the government. In addition, they must also carry on a business that sells goods and/or services to persons outside the government reporting entity as their principal activity and maintain operations and meet liabilities from revenue received outside the government reporting entity in the normal course of operations. This also includes the government’s interest in government business enterprises.
Sinking funds—a pool of cash and investments earmarked to provide resources for the redemption of debt.
Summary accounts—the financial position and operating result of the government reporting entity including the Consolidated Revenue Fund, Crown corporations, agencies and SUCH sector entities; the amounts represented by the Summary Financial Statements of the government.
Surplus—meaning is dependent upon the statement to which it applies:
(i) Consolidated Statement of Financial Position: the accumulated surplus is the amount by which the total assets of the government exceeds its total liabilities.
(ii) Consolidated Statement of Operations: the annual surplus is the amount by which the total annual revenues for the operating year exceed total annual expenses (see “Deficit” definition).
148
PROVINCE OF BRITISH COLUMBIA
PUBLIC ACCOUNTS 2018/19
Definitions—Continued
(Unaudited)
Taxpayer–supported Crown corporations and agencies and SUCH sector entities—all Crown corporations and agencies and entities outside the Consolidated Revenue Fund that meet the criteria of control (by the province) as established by generally accepted accounting principles. In addition, they must not meet the criteria for being self–supported. This also includes the government’s interest in government partnerships that are not government business enterprises.
Transfers under agreements (including shared cost)—a government transfer that is a reimbursement of eligible expenditures pursuant to an agreement between the government and the recipient. The recipient usually spends the money first; however, the government has some input into how the money is spent.
149
PROVINCE OF BRITISH COLUMBIA
PUBLIC ACCOUNTS 2018/19
Acronyms
(Unaudited)
APAC | | Accounting Policy Advisory Committee |
| | |
BC Hydro | | British Columbia Hydro and Power Authority |
| | |
BCHMC | | British Columbia Housing Management Commission |
| | |
BTAA | | Budget Transparency and Accountability Act |
| | |
CPA | | Chartered Professional Accountant |
| | |
CRF | | Consolidated Revenue Fund |
| | |
GAAP | | Generally accepted accounting principles (for senior governments as recommended |
| | |
| | by the Canadian Public Sector Accounting Board) |
| | |
GDP | | Gross domestic product |
| | |
Moody’s | | Moody’s Investors Service |
| | |
PSAS | | Public Sector Accounting Standards |
| | |
SCBCTA | | South Coast British Columbia Transportation Authority |
| | |
SFU | | Simon Fraser University |
| | |
SUCH | | School districts, universities, colleges, institutes and health organizations |
| | |
UBC | | The University of British Columbia |
150