FIRST QUARTERLY REPORT
FISCAL PLAN UPDATE
2019/20 — 2021/22,
2019/20 ECONOMIC OUTLOOK AND
FINANCIAL FORECAST
&
THREE MONTH RESULTS
APRIL — JUNE 2019

British Columbia Cataloguing in Publication Data
British Columbia. Ministry of Finance.
Quarterly report on the economy, fiscal situation and Crown corporations. — ongoing—
Quarterly.
Title on cover: Quarterly report.
Continues: British Columbia. Ministry of Finance.
Quarterly financial report. ISSN 0833-1375.
ISSN 1192-2176 — Quarterly Report on the economy, fiscal
situation and Crown corporations.
1. Finance, Public — British Columbia — Accounting
— Periodicals. 2. British Columbia — Economic conditions
— 1945— — Periodicals.*
3. Corporations, Government — British Columbia —
Accounting — Periodicals. I. Title.
HJ13.B77 354.711’007231’05
2019/20 FIRST QUARTERLY REPORT | | TABLE OF CONTENTS |
SEPTEMBER 10, 2019 |
Updated Fiscal Plan — 2019/20 to 2021/22 | |
| |
| Tables: | |
| | |
| Updated Fiscal Plan 2019/20 to 2021/22 | 1 |
| | |
Part One — Updated 2019/20 Financial Forecast | |
| |
| Introduction | 5 |
| Revenue | 7 |
| Expense | 10 |
| | Consolidated Revenue Fund (CRF) Spending | 10 |
| | Service Delivery Agency Spending | 11 |
| Full-Time Equivalents for the BC Public Service | 11 |
| Provincial Capital Spending | 12 |
| | Projects Over $50 Million | 12 |
| Provincial Debt | 15 |
| Risks to the Fiscal Forecast | 16 |
| Supplementary Schedules | 17 |
| | |
| Tables: | |
| | 1.1 | 2019/20 Forecast Update | 5 |
| | 1.2 | 2019/20 Financial Forecast Changes | 6 |
| | 1.3 | 2019/20 Capital Spending Update | 12 |
| | 1.4 | 2019/20 Provincial Debt Update | 15 |
| | 1.5 | 2019/20 Operating Statement | 17 |
| | 1.6 | 2019/20 Revenue by Source | 18 |
| | 1.7 | 2019/20 Expense by Ministry, Program and Agency | 19 |
| | 1.8 | 2019/20 Expense by Function | 20 |
| | 1.9 | 2019/20 Capital Spending | 21 |
| | 1.10 | Capital Expenditure Projects Greater Than $50 million | 22 |
| | 1.11 | 2019/20 Provincial Debt | 25 |
| | 1.12 | 2019/20 Statement of Financial Position | 26 |
| | |
Part Two — Economic Review and Outlook | |
| |
| Summary | 27 |
| | |
| British Columbia Economic Activity and Outlook | 27 |
| | Labour Market | 28 |
| | Consumer Spending and Housing | 30 |
| | Business and Government | 32 |
| | External Trade and Commodity Markets | 33 |
| | Demographics | 34 |
| | Inflation | 35 |
FIRST QUARTERLY REPORT 2019/20
i
TABLE OF CONTENTS
| Risks to the Economic Outlook | 36 |
| External Outlook | 36 |
| | United States | 36 |
| | Canada | 39 |
| | Asia | 40 |
| | Europe | 41 |
| Financial Markets | 42 |
| | Interest Rates | 42 |
| | Exchange Rate | 43 |
| | | |
| Tables: | |
| | 2.1 | British Columbia Economic Indicators | 28 |
| | 2.2 | U.S. Real GDP Forecast: Consensus vs B.C. Ministry of Finance | 38 |
| | 2.3 | Canadian Real GDP Forecast: Consensus vs B.C. Ministry of Finance | 39 |
| | 2.4 | Private Sector Canadian Interest Rate Forecasts | 42 |
| | 2.5 | Private Sector Exchange Rate Forecasts | 44 |
| | 2.6.1 | Gross Domestic Product (GDP): British Columbia | 45 |
| | 2.6.2 | Selected Nominal Income and Other Indicators: British Columbia | 46 |
| | 2.6.3 | Labour Market Indicators: British Columbia | 46 |
| | 2.6.4 | Major Economic Assumptions | 47 |
| | | |
Appendix — Fiscal Plan Update | |
| | | |
| Tables: | |
| | A1 | Material Assumptions — Revenue | 49 |
| | A2 | Natural Gas Price Forecasts — 2019/20 to 2021/22 | 54 |
| | A3 | Material Assumptions — Expense | 55 |
| | A4 | Operating Statement — 2012/13 to 2021/22 | 58 |
| | A5 | Revenue by Source — 2012/13 to 2021/22 | 59 |
| | A6 | Revenue by Source Supplementary Information — 2012/13 to 2021/22 | 60 |
| | A7 | Expense by Function — 2012/13 to 2021/22 | 61 |
| | A8 | Expense by Function Supplementary Information — 2012/13 to 2021/22 | 62 |
| | A9 | Full-Time Equivalents (FTEs) — 2012/13 to 2021/22 | 63 |
| | A10 | Capital Spending — 2012/13 to 2021/22 | 64 |
| | A11 | Statement of Financial Position — 2012/13 to 2021/22 | 65 |
| | A12 | Changes in Financial Position — 2012/13 to 2021/22 | 66 |
| | A13 | Provincial Debt — 2012/13 to 2021/22 | 67 |
| | A14 | Provincial Debt Supplementary Information — 2012/13 to 2021/22 | 68 |
| | A15 | Key Provincial Debt Indicators — 2012/13 to 2021/22 | 69 |
FIRST QUARTERLY REPORT 2019/20
ii
UPDATED FISCAL PLAN — 2019/20 to 2021/22
($ millions) | | 2019/20 | | 2020/21 | | 2021/22 | |
Budget 2019 Fiscal Plan | | 274 | | 287 | | 585 | |
Fiscal Plan Updates: | | | | | | | |
Personal income tax | | (85 | ) | (61 | ) | (72 | ) |
Corporate income tax | | 300 | | 355 | | 159 | |
Property transfer tax | | (475 | ) | (412 | ) | (314 | ) |
Other taxation revenue | | (17 | ) | (28 | ) | (29 | ) |
Natural resources revenue | | (19 | ) | 62 | | 107 | |
Contributions from the federal government | | (15 | ) | 45 | | 32 | |
Other revenue | | 184 | | 112 | | 287 | |
Commercial Crown corporation net income | | (26 | ) | (28 | ) | (31 | ) |
Statutory spending | | (220 | ) | — | | — | |
Service delivery agency net spending | | (102 | ) | (119 | ) | (273 | ) |
Interest and other savings | | 80 | | 78 | | 122 | |
Lower contingencies spending allocation | | 300 | | — | | — | |
Updated fiscal plan surplus | | 179 | | 291 | | 573 | |
| | | | | | | |
Prudence included in fiscal plan: | | | | | | | |
Contingencies | | (450 | ) | (400 | ) | (400 | ) |
Forecast allowance | | (500 | ) | (300 | ) | (300 | ) |
| | | | | | | |
Capital Spending: | | | | | | | |
Taxpayer-supported capital spending | | 5,776 | | 6,617 | | 6,843 | |
Self-supported capital spending | | 4,282 | | 3,343 | | 3,358 | |
| | 10,058 | | 9,960 | | 10,201 | |
Provincial Debt: | | | | | | | |
Taxpayer-supported debt | | 45,466 | | 49,491 | | 53,149 | |
Self-supported debt | | 25,354 | | 26,504 | | 27,481 | |
Total debt (including forecast allowance) | | 71,320 | | 76,295 | | 80,930 | |
| | | | | | | |
Taxpayer-supported debt-to-GDP ratio | | 14.8 | % | 15.5 | % | 16.0 | % |
Taxpayer-supported debt-to-revenue ratio | | 80.0 | % | 85.2 | % | 87.8 | % |
Balanced Financial Outlook
The fiscal plan update in the First Quarterly Report reflects a continued balanced fiscal outlook for British Columbia. Government continues to invest in priorities outlined in Budget 2019 to make life better for British Columbians.
Compared to Budget 2019, revenue forecasts are lower by $153 million in 2019/20, and higher by $45 million in 2020/21 and $139 million in 2021/22. Expense projections are lower by $58 million in 2019/20, and higher by $41 million in 2020/21 and $151 million in 2021/22. These changes result in modestly lower surpluses of $103 million over the three-year plan.
Property transfer tax revenue is forecast to decline over the fiscal plan compared to Budget 2019 due to slower activity in the housing market.
Other taxation revenue is up over the fiscal plan primarily from corporate income tax revenue increases due to the impacts of higher 2018 tax assessments and advance instalments.
Over the three years, natural resource revenue is higher than Budget 2019 mainly reflecting projected improvements in mining-related revenues partly offset by lower natural gas royalties, reflecting changes in the outlook for coal and natural gas prices.
FIRST QUARTERLY REPORT 2019/20
1
UPDATED FISCAL PLAN — 2019/20 to 2021/22
Contributions from the federal government are higher over the fiscal plan period. The updated plan incorporates higher transfers under the Disaster Financial Assistance Arrangements in support of floods and wildfires in the 2016 to 2018 period and increased contributions to post-secondary institutions and health authorities. These increases are partly offset by reduced Canada Health Transfer and Canada Social Transfer entitlements due to a lower federal government outlook for national nominal GDP growth and a decreased projection of B.C.’s population share of the national total. In addition, the updated plan incorporates a decline in B.C.’s share of the federal excise tax on cannabis due to weaker than expected sales.
Revenue from other taxpayer-supported sources is forecast to be up over the ensuing three years mainly due to improved forecasts from taxpayer-supported Crown corporations, post-secondary institutions and health authorities.
Commercial Crown corporation net income projections have decreased over the fiscal plan mainly due to asset amortization expenses stemming from the acquisition of the remaining portion of the Waneta Dam power expansion.
Compared to Budget 2019, forecast expenses in the fiscal plan period are higher primarily due to disaster response in fiscal 2019/20 and increased service delivery agency spending over the fiscal plan, partly offset by a lower contingencies spending allocation in 2019/20 and lower debt-servicing costs across the fiscal plan.
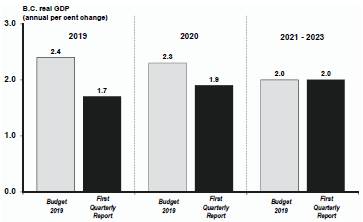
Resilient Economic Growth
In the context of a slowing global economy, the First Quarterly Report forecasts B.C. real GDP growth of 1.7 per cent in 2019 and 1.9 per cent in 2020, down from Budget 2019 growth projections of 2.4 per cent and 2.3 per cent, respectively. The Ministry’s lower forecast of economic growth in 2019 and 2020 largely reflects a decline in export activity, slower growth in retail sales and, to a lesser extent, weaker than anticipated home sales. The general outlook for B.C.’s economy for 2021 and beyond calls for stable growth of 2.0 per cent, in line with previous expectations.
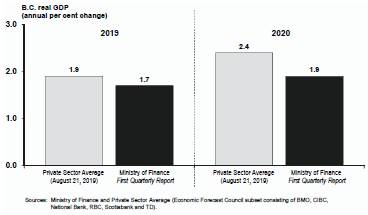
British Columbia’s Economic Outlook
The First Quarterly Report forecast for B.C. real GDP growth is 0.2 percentage points lower than the current average outlook of six private sector forecasters (a subset of the Economic Forecast Council) for 2019 and 0.5 percentage points lower for 2020.
Prudent Economic Forecast
This acknowledges downside risks to the economic outlook and is one of the levels of prudence built into the fiscal plan. The main downside risks to B.C.’s economic outlook include uncertainty regarding global trade policy and escalating trade tensions, weakening global economic activity, lower commodity prices, as well as slower domestic economic growth.
FIRST QUARTERLY REPORT 2019/20
2
UPDATED FISCAL PLAN — 2019/20 to 2021/22
Capital Investments
Taxpayer-supported capital spending on hospitals, education facilities, transportation infrastructure, housing and other projects is financed through a combination of provincial borrowing, funding provided by third parties, and from internal cash flows. Taxpayer-supported capital spending is forecast to total $19.2 billion over the fiscal plan period, representing a reduction of $0.9 billion over the Budget 2019 forecast, mainly in the transportation and post-secondary sectors.
Over the three years, self-supported infrastructure spending by commercial Crown corporations totals $11.0 billion, virtually unchanged from the Budget 2019 projections.
Debt Affordability
Government’s key debt affordability metric, the taxpayer-supported debt-to-GDP ratio is forecast to improve from Budget 2019 primarily due to a lower than projected 2018/19 ending debt balance. The forecast for taxpayer-supported debt-to-revenue is also lower than projected at budget and is expected to remain within a reasonable range over the fiscal plan at below 90 per cent.
Taxpayer-Supported Debt-to-GDP
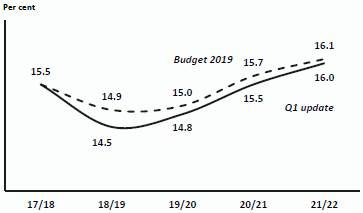
Taxpayer-supported debt is projected to increase by $10.5 billion over the plan period to reach $53.1 billion by 2021/22, due to record levels of planned investment in capital infrastructure.
Total provincial debt is projected to increase by $15.0 billion over the three-year plan, reaching $80.9 billion by the end of 2021/22, $1.4 billion lower than the forecast in Budget 2019.
Risks to the Fiscal Plan
The main risks to the government’s fiscal plan include:
· risks to the B.C. economic outlook, largely due to the continued uncertainty surrounding global trade policy and weakening economic activity;
· assumptions underlying revenue and Crown corporation forecasts such as economic factors, commodity prices, weather conditions, and the financial results of ICBC;
· potential changes to federal government transfer allocations, cost-sharing agreements with the federal government and impacts on the provincial income tax bases arising from federal tax policy and budget changes;
· statutory spending pressures for costs associated with responding to emergencies such as wildfires and floods; and
· utilization rates for government services such as health care, children and family services, and income assistance.
Government incorporates several levels of prudence in its projections to help mitigate the risks to the fiscal plan, including the following:
· the outlook for B.C.’s real GDP growth is lower than the current private sector average outlook (0.2 percentage points lower in 2019 and 0.5 percentage points lower for 2020);
· the updated fiscal plan includes Contingencies vote allocations of $450 million in 2019/20, and $400 million in 2020/21 and 2021/22 to help manage unexpected pressures and fund priority initiatives; and,
· the forecast allowance allocations are $500 million in 2019/20, and $300 million in 2020/21 and 2021/22 to guard against volatility, including revenue changes.
Conclusion
The Province’s fiscal outlook remains balanced and debt metrics remain affordable. Government remains focused on Budget 2019 commitments to make life more affordable, enhance services, and build a strong and sustainable economy.
FIRST QUARTERLY REPORT 2019/20
3
PART 1 | UPDATED 2019/20 FINANCIAL FORECAST
Introduction
Table 1.1 2019/20 Forecast Update
| | | | First | |
| | Budget | | Quarterly | |
($ millions) | | 2019 | | Report | |
Revenue | | 59,047 | | 58,894 | |
Expense | | (58,273 | ) | (58,215 | ) |
Forecast allowance | | (500 | ) | (500 | ) |
Surplus | | 274 | | 179 | |
Capital Spending: | | | | | |
Taxpayer-supported capital spending | | 6,340 | | 5,776 | |
Self-supported capital spending | | 4,274 | | 4,282 | |
| | 10,614 | | 10,058 | |
Provincial Debt: | | | | | |
Taxpayer-supported debt | | 46,384 | | 45,466 | |
Self-supported debt | | 25,664 | | 25,354 | |
Total debt (including forecast allowance) | | 72,548 | | 71,320 | |
Taxpayer-supported debt to GDP ratio | | 15.0 | % | 14.8 | % |
Taxpayer-supported debt to revenue ratio | | 81.5 | % | 80.0 | % |
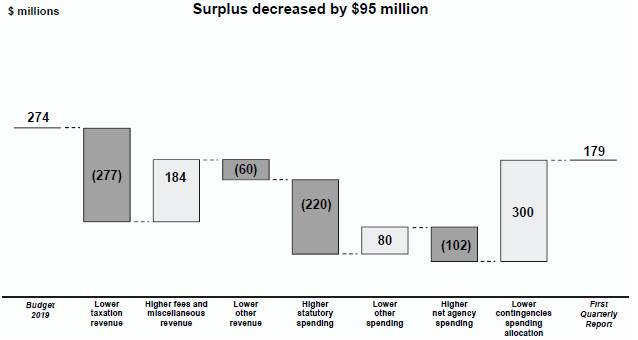
The first quarter forecast for 2019/20 shows an operating surplus of $179 million — $95 million lower than the projection in Budget 2019. The revenue forecast has decreased by $153 million primarily due to a reduction in property transfer tax. The expense forecast is $58 million lower mostly due to lower contingencies spending allocation and debt servicing costs, partly offset by higher statutory spending and net agency spending.
Chart 1.1 2019/20 Surplus — Major Changes from Budget 2019
FIRST QUARTERLY REPORT 2019/20
5
UPDATED 2019/20 FINANCIAL FORECAST
Table 1.2 2019/20 Financial Forecast Changes
| | ($ millions) | |
2019/20 surplus at Budget 2019 (February 19, 2019) | | 274 | |
| | | |
Revenue changes: | | | |
Personal income tax — slightly weaker 2018 tax assessment results and lower household income | | (85 | ) |
Corporate income tax — increase in instalments and prior-year settlement payment, reflecting stronger 2018 tax assessment results | | 300 | |
Property transfer tax — lower year-to-date sales results | | (475 | ) |
Provincial sales tax — impact of higher 2018/19 results partly offset by changes in the economic outlook | | 30 | |
Other taxation sources | | (47 | ) |
Natural gas royalties — lower prices, increased utilization of royalty programs/credits and decrease in natural gas liquids royalties | | (105 | ) |
Coal, metals and minerals — mainly higher coal prices | | 94 | |
Forests — mainly higher logging taxes partly offset by lower harvest volumes | | 23 | |
Other natural resources — mainly lower petroleum prices and production volumes | | (31 | ) |
Other revenue — mainly higher revenue from the SUCH sector entities | | 184 | |
Health and social transfers — lower B.C. population share of national total | | (5 | ) |
Other federal government transfers — mainly B.C.’s share of lower federal excise tax revenue on cannabis, reflecting fewer than expected licensed retail establishments and supply shortages experienced by retailers | | (10 | ) |
Commercial Crown corporation net income | | (26 | ) |
Total revenue changes | | (153 | ) |
| | | |
Less : expense increases (decreases): | | | |
Consolidated Revenue Fund changes: | | | |
Lower contingencies spending allocation — as a result of diminished risks related to wildfires | | (300 | ) |
Statutory spending: | | | |
Fire management costs | | 92 | |
Emergency Program Act — primarily higher costs related to prior-year floods | | 117 | |
BC Training and Education Savings Grant — higher projected uptake | | 11 | |
Contingencies for Sustainable Services Negotiating Mandate | | (30 | ) |
Prior year liability and other adjustments | | 3 | |
Management of public debt (net) — reflects revisions to scheduled borrowing | | (44 | ) |
Spending funded by third party recoveries | | (9 | ) |
Changes in spending profile of service delivery agencies: | | | |
Universities | | 75 | |
Colleges | | 55 | |
Health authorities and hospital societies | | 16 | |
Other service delivery agencies | | (38 | ) |
(Increase) decrease in transfers to service delivery agencies (elimination) | | (6 | ) |
Total expense changes | | (58 | ) |
| | | |
Total changes | | (95 | ) |
2019/20 surplus at the First Quarterly Report | | 179 | |
FIRST QUARTERLY REPORT 2019/20
6
UPDATED 2019/20 FINANCIAL FORECAST
Projected taxpayer-supported capital spending in 2019/20 is $564 million lower than forecast in Budget 2019, mainly due to timing of projects in the transportation sector. The self-supported capital spending forecast is essentially unchanged from budget.
The total debt forecast has decreased by over $1.2 billion compared to Budget 2019. Taxpayer-supported debt is forecast to end the year $918 million lower mainly as a result of a lower 2018/19 ending balance. Self-supported debt is forecast to be $310 million lower at the end of 2019/20 primarily as a result of the lower 2018/19 ending balance and higher internal financing within the commercial Crown corporations.
As a result of lower debt forecasts, the taxpayer-supported debt-to-revenue ratio is now expected to end 2019/20 at 80.0 per cent — a 1.5 percentage point improvement compared to Budget 2019. A lower forecast debt level also improves the forecasted taxpayer-supported debt-to-GDP ratio by 0.2 percentage points which is now expected to end the year at 14.8 per cent.
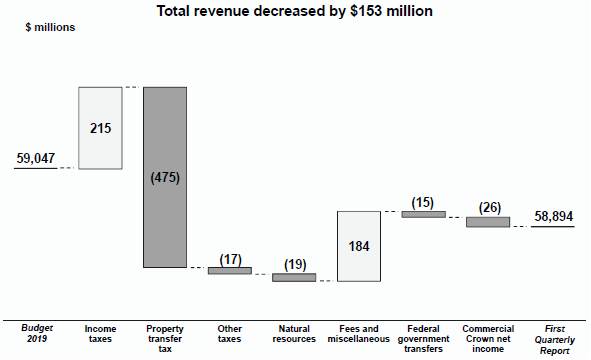
Revenue
Revenue for 2019/20 is forecast to be $58.9 billion — $153 million lower than the projection in Budget 2019. The decrease reflects lower revenue from taxation sources, natural resources, federal government contributions and commercial Crown corporation net income which are partly offset by increases in other revenues (predominantly improved projections from post-secondary institutions and health authorities).
Chart 1.2 Revenue Changes from Budget 2019
FIRST QUARTERLY REPORT 2019/20
7
UPDATED 2019/20 FINANCIAL FORECAST
Detailed revenue projections are disclosed in Table 1.6, and key assumptions and sensitivities relating to revenue are provided in Appendix Table A1. An analysis on historical volatility of major economic drivers can be found in the 2019 BC Financial and Economic Review (pages 14-15). For 2019/20, the major changes from the Budget 2019 forecast include the following:
Income Tax Revenue
Personal income tax revenue is down $85 million, mainly reflecting slightly weaker 2018 provincial tax assessments results and a lower projection of household income growth.
Corporate income tax revenue is up $300 million as stronger 2018 provincial income tax assessments results in increased advance instalments and a higher prior year settlement payment.
Other Tax Revenue
Property transfer tax revenue is down $475 million due to slower activity in the housing market. The revised outlook of $1,435 million includes the 20 per cent foreign buyers’ tax, forecast at $100 million (down from $190 million estimated at budget).
Provincial sales tax revenue is up $30 million due to the effect of higher 2018/19 results compared to the forecast in the Third Quarterly Report, partly offset by a lower outlook of consumer spending on taxable purchases.
Other taxation revenues are down $47 million as weaker property, tobacco, carbon and fuel taxes are partly offset by an improved projection for insurance premium tax, mainly resulting from the impacts of year-to-date activity and changes in 2018/19 results compared to the forecasts in the Third Quarterly Report.
Natural Resources Revenue
Revenue from natural gas royalties is down $105 million mainly due to lower natural gas prices, decreased royalties from the natural gas liquids and increased utilization of royalty program credits, partially offset by an improved outlook for natural gas production volumes. The updated natural gas price forecast is $0.39 ($Cdn/gigajoule, plant inlet), down from the Budget 2019 outlook ($0.72).
Forest revenue is up $23 million mainly due to higher revenue from logging tax reflecting higher than expected lumber prices and strong lumber demand in 2018. Due to the impacts of temporary, indefinite and permanent mill curtailments, the updated forecast for harvest volumes is 52 million cubic metres compared to 57 million cubic metres in Budget 2019. The effects of reduced Crown harvest volumes are offset by higher than expected stumpage rates.
Revenue from coal, metals, minerals and other mining-related sources is up $94 million mainly reflecting higher coal prices due to continuing strong demand from Asia.
Other natural resource revenues are expected to be down $31 million mainly due to reduced petroleum royalties reflecting projected decreases in production volumes and the average annual oil price.
FIRST QUARTERLY REPORT 2019/20
8
UPDATED 2019/20 FINANCIAL FORECAST
Other Taxpayer-supported Revenue
Other taxpayer-supported revenue consists of revenue from fees, licences, investment earnings and miscellaneous sources. These revenue sources are now expected to be up $184 million mainly due to improved outlooks from post-secondary institutions and health authorities.
Federal Government Transfers
Canada Health Transfer and Canada Social Transfer entitlements are down $5 million due to a lower B.C. population share of the national total.
Other federal government contributions are expected to be down $10 million mainly due to lower entitlement of B.C.’s share of the federal excise tax on cannabis. This reflects fewer than expected licensed retail establishments and supply shortages experienced by retailers.
Commercial Crown Corporations
The outlook for commercial Crown corporation net income is $26 million lower mainly due to asset amortization expenses stemming from the acquisition of the remaining portion of the Waneta Dam power expansion.
FIRST QUARTERLY REPORT 2019/20
9
UPDATED 2019/20 FINANCIAL FORECAST
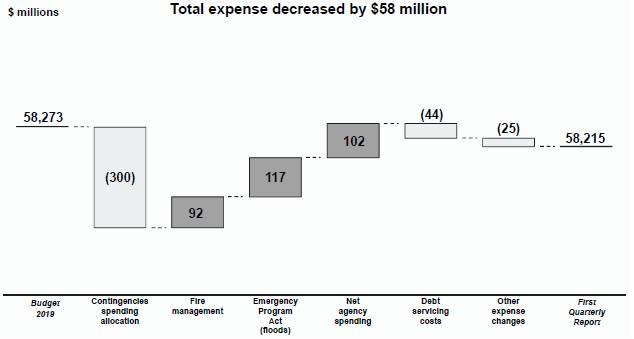
Expense
The First Quarterly Report expense forecast for 2019/20 is $58 million lower than Budget 2019 mainly due to a reduced contingencies spending allocation and lower debt servicing costs, partly offset by statutory spending for disaster response and higher spending by service delivery agencies.
Chart 1.3 Expense Changes from Budget 2019
Consolidated Revenue Fund (CRF) Spending
The total CRF direct program spending1 forecast for 2019/20 has decreased by $166 million mainly due to a reduction to the contingencies spending allocation and savings in debt servicing costs. These savings are partly offset by statutory spending.
Statutory spending is projected at $220 million in 2019/20 as follows:
· $117 million for Emergency Program Act expenses primarily related to prior-year floods — this is in addition to the $15 million in voted appropriation for the program, for total forecast expenses of $132 million.
· $92 million for fire management costs — this is in addition to the $101 million in the fire management voted appropriation, for a total spending forecast of $193 million.
· $11 million for the BC Training and Education Savings Program to reflect higher projected uptake under the program — this is in addition to the $30 million allocated in the 2019/20 Estimates, for total forecast expenses of $41 million.
Debt servicing costs are forecast to be $44 million lower than at budget due to lower debt levels and lower interest rate forecasts.
Other CRF spending increased by $3 million.
1 Expenses other than grants to government agencies — see Table 1.7 Total direct program spending.
FIRST QUARTERLY REPORT 2019/20
10
UPDATED 2019/20 FINANCIAL FORECAST
Contingencies
The Contingencies vote in 2019/20 included a preliminary allocation of $553 million for the Sustainable Services Negotiating Mandate. The updated and refined forecast is expected to be $30 million lower than at budget. The general contingencies allocation of $750 million, which is intended to help manage unexpected cost pressures and fund priority initiatives as they arise, is forecast to be lower by $300 million.
Spending Recovered from Third Parties
Expenses funded by third parties are forecast to fall by $9 million due to a decrease in the interest costs that are recovered from commercial Crown corporations.
Operating Transfers to Service Delivery Agencies
Operating transfers to service delivery agencies are forecast to be $6 million higher mainly due to adjustments to projected allocations across various service delivery agencies in response to spending forecast changes noted below.
Service Delivery Agency Spending
Service delivery agency expenses are forecast to increase by $108 million in 2019/20 compared to Budget 2019.
· Post-secondary sector expenses are forecast to increase by $130 million mainly due to higher salary and benefit costs as a result of higher enrolment, new programs, and increased research activity. The higher spending is expected to be offset by increased tuition revenues and federal research grants.
· The health authority and hospital society expense forecast is up $16 million, mainly due to higher staffing and operating costs to meet the projected volume growth in healthcare services delivered by these organizations.
· Other service delivery agency spending is forecast to be $38 million lower than budget.
Detailed expense projections are disclosed in Table 1.7. Key spending assumptions and sensitivities are provided in Appendix Table A3.
Full-Time Equivalents for the BC Public Service
The projection of full-time equivalent (FTE) staff utilization for 2019/20 remains unchanged from budget at 31,350 FTEs. Further details on FTEs are provided in Appendix Table A9.
FIRST QUARTERLY REPORT 2019/20
11
UPDATED 2019/20 FINANCIAL FORECAST
Provincial Capital Spending
Capital spending is projected to total $10.1 billion in 2019/20 — $556 million lower than the forecast in Budget 2019 (see Tables 1.3 and 1.9).
Table 1.3 2019/20 Capital Spending Update
| | ($ millions) | |
2019/20 capital spending at Budget 2019 | | 10,614 | |
Taxpayer-supported changes: | | | |
Primarily higher routine capital maintenance spending by health authorities | | 117 | |
Timing of post-secondary institution spending | | (94 | ) |
Timing of transportation sector spending | | (580 | ) |
Other net adjustments to capital schedules | | (7 | ) |
Total taxpayer-supported | | (564 | ) |
| | | |
Self-supported changes: | | | |
Liquor Distribution Branch higher spending | | 5 | |
BC Rail higher spending | | 3 | |
Total self-supported | | 8 | |
| | | |
Total changes | | (556 | ) |
2019/20 capital spending at the First Quarterly Report | | 10,058 | |
Taxpayer-supported capital spending is projected at $5.8 billion. The $564 million decrease since Budget 2019 is mainly due to timing changes in procurement and capital spending for transportation projects and self-funded post-secondary institution projects. This is partially offset by higher expected routine capital maintenance spending by health authorities
At $4.3 billion, self-supported capital spending is $8 million higher than Budget 2019 due to increased spending by Liquor Distribution Branch and BC Railway Company.
Projects Over $50 Million
Capital spending on projects greater than $50 million is presented in Table 1.10. Since Budget 2019 nineteen projects have been added to the table:
· Construction of the new Sheffield Elementary School in School District 43 Coquitlam ($52 million);
· New elementary and middle schools in West Langford ($89 million);
· Seismic upgrades to Victoria High School in Victoria ($80 million);
· Replacement of the Quesnel Junior School ($52 million);
· Mills Memorial Hospital Redevelopment in Terrace ($447 million);
· Burnaby Hospital Redevelopment - Phase 1 ($547 million);
· Cariboo Memorial Hospital Redevelopment in Williams Lake ($218 million);
· Highway 14 Corridor Improvements ($86 million);
· Quartz Creek Bridge Replacement ($121 million);
FIRST QUARTERLY REPORT 2019/20
12
UPDATED 2019/20 FINANCIAL FORECAST
· Kootenay Lake Ferry Service Upgrade ($55 million);
· Highway 1, 216th - 264th Street Widening ($235 million);
· Construction of new Affordable Rental Housing at 1636 Clark Drive in Vancouver ($100 million);
· Redevelopment of Affordable Rental Housing in the Lower Mainland: Stanley New Fountain Hotel in Vancouver ($63 million) and 6585 Sussex Avenue in Burnaby ($75 million);
· Nanaimo Correctional Centre Replacement ($157 million); and
· BC Hydro Projects including: Bridge River 2 units 7 and 8 upgrade project ($86 million), Wahleach generator refurbishment project ($51 million), Mount Lehman substation expansion project ($59 million), and Capilano substation upgrade project ($87 million).
The following projects have been completed since Budget 2019 and are no longer listed in the table:
· Salish Secondary School;
· Maples Adolescent Treatment Centre and Provincial Assessment Centre;
· Waneta Dam power expansion; and
· BC Hydro’s G.M. Shrum unit 1 to 5 turbine replacement project, Upper Columbia capacity additions at Mica units 5 and 6 project, Surrey area substation project, Big Bend substation, and the Waneta 2/3 interest acquisition.
Changes since Budget 2019 for existing projects include:
· Kitsilano Secondary School project completion date changed from 2018 to 2019 to align with revised project schedule;
· Centennial Secondary School project completion date changed from 2019 to 2020 to align with the revised project schedule;
· Eric Hamber Secondary School budget increased from $79 million to $102 million to accommodate project cost escalation;
· University of Victoria Student Housing project completion changed from 2024 to 2023 to align with revised project schedule;
· Royal Inland Hospital Clinical Services Building’s total costs decreased from $63 million to $61 million to reflect final project costs and funding source allocations;
· Royal Inland Hospital Patient Care Tower’s financing components changed for the direct procurement portion of the project. Internal borrowing increased from $38 million to $39 million, and other contributions decreased from $91 million to $90 million;
· Children’s and Women’s Hospital’s direct procurement portion of the project increased from $307 million to $308 million, and the P3 portion of the project decreased from $369 million to $368 million to reflect final project costs;
· Royal Columbian Hospital Phase 2 & 3 project costs increased from $1.1 billion to $1.236 billion to reflect increased construction costs due to market conditions;
FIRST QUARTERLY REPORT 2019/20
13
UPDATED 2019/20 FINANCIAL FORECAST
· Highway 1 216th Interchange project costs have increased from $59 million to $62 million due to extension of the High Occupancy Vehicle lane to tie in to the highway widening from 216th Street to 264th Street;
· Highway 91 Alex Fraser Bridge Capacity Improvements project financing components changed — internal borrowing increased from $36 million to $37 million, and Federal contributions decreased from $34 million to $33 million;
· Highway 1 Mackenzie Interchange project costs have increased from $85 million to $96 million and project completion date has changed from 2019 to 2020 as a result of design modifications due to variable rock conditions, additional environmental management, and schedule delays due to winter weather and efforts to reduce traffic and noise impacts;
· Highway 1 Kicking Horse Canyon Phase 4 project costs have increased by $151 million from $450 million to $601 million. These costs include additional engineering, design and geotechnical work, additional foundation supports for bridges and retaining walls, application of community benefits, additional technical project management resources, archeological work, consultation with Indigenous Groups, and higher contingencies based on the risk and complexity of the project;
· Highway 1 Illecillewaet project costs have increased from $63 million to $85 million due to escalating costs from materials, labour, and the complexity of work required;
· Hugh Keenleyside spillway gate reliability upgrade project costs decreased from $115 million to $114 million to reflect final project costs;
· Kamloops substation total project costs decreased from $56 million to $52 million;
· Horne Payne substation upgrade project went into service in March 2019 and as a result, total costs decreased from $93 million to $73 million to reflect anticipated final project costs; and
· The Liquor Distribution Branch Warehouse project decreased by $6 million from $55 million to $49 million and the project completion date changed from 2019 to 2020 to align with revised project schedule.
FIRST QUARTERLY REPORT 2019/20
14
UPDATED 2019/20 FINANCIAL FORECAST
Provincial Debt
The provincial debt, including a $500 million forecast allowance, is projected to total $71.3 billion by the end of the fiscal year — $1.2 billion lower than the forecast in Budget 2019. This reduction is due to a lower 2018/19 ending debt balance than projected in Budget 2019 and changes in borrowing during the fiscal year.
Table 1.4 2019/20 Provincial Debt Update
| | ($ millions) | |
| | | |
2019/20 provincial debt at Budget 2019 | | 72,548 | |
Taxpayer-supported changes: | | | |
Lower debt level from 2018/19 | | (1,276 | ) |
Change in surplus | | 95 | |
Changes in non-cash items and working capital balances | | 696 | |
Lower capital spending | | (564 | ) |
Lower contributions from external parties | | 131 | |
Total taxpayer-supported | | (918 | ) |
| | | |
Self-supported changes: | | | |
Lower debt level from 2018/19 | | (178 | ) |
Higher capital spending | | 8 | |
Increase in internal financing | | (140 | ) |
Total self-supported | | (310 | ) |
| | | |
Total changes | | (1,228 | ) |
2019/20 provincial debt at the First Quarterly Report | | 71,320 | |
Total debt at the end of 2018/19 was $1.45 billion lower than the Budget 2019 forecast (excluding the forecast allowance), mainly due to a higher operating surplus and lower capital spending.
Taxpayer-supported debt is now projected to end 2019/20 at $45.5 billion — $918 million lower than forecast in Budget 2019. This decrease reflects a lower opening balance (by $1.3 billion) and lower capital spending ($564 million), partly offset by lower contributions from external parties ($131 million), and lower internal financing ($791 million).
The taxpayer-supported debt-to-GDP ratio is projected to end 2019/20 at 14.8 per cent — a 0.2 percentage point improvement from Budget 2019.
The taxpayer-supported debt-to-revenue ratio is forecast to end the fiscal year at 80.0 per cent — a 1.5 percentage point improvement from Budget 2019.
Self-supported debt is forecast to be $25.4 billion at the end of 2019/20 — $310 million lower than Budget 2019, reflecting lower than expected 2018/19 debt ($178 million) carried forward into 2019/20 and higher than expected internal financing ($140 million), partly offset by an increase in capital infrastructure investments ($8 million).
Details on provincial debt are shown in Table 1.11.
FIRST QUARTERLY REPORT 2019/20
15
UPDATED 2019/20 FINANCIAL FORECAST
Total provincial debt is presented consistent with the Debt Summary Report included in the Public Accounts. Debt is shown net of sinking fund investments and unamortized discounts, excludes accrued interest, and includes non-guaranteed debt directly incurred by commercial Crown corporations and debt guaranteed by the Province. The reconciliation between provincial debt and the financial statement debt is shown in Appendix Table A11.
Risks to the Fiscal Forecast
There are a number of risks and pressures to the fiscal forecast including risks to the B.C. economic outlook, which are largely due to the continued uncertainty surrounding global economic activity. The forecasts of revenues, expenditures, capital spending and debt are estimates based on a number of economic, financial and external factors. Variables will change throughout the year as new information becomes available, with potentially material impacts.
Revenues can be volatile due in part to the influence of the cyclical nature of the natural resource sector in the economy. Changes in energy or commodity prices, such as natural gas and lumber, may have a significant effect on revenue and the fiscal forecast. In addition, personal and corporate income tax assessments for the 2018 tax year will not be finalized until March 2020 and could result in further revenue adjustments. In particular, property transfer and sales tax revenues are impacted by the number of residential transactions, average home sale prices and the amount of taxable purchases of goods and services.
The spending forecast contained in the fiscal plan is based on ministry and service delivery agency plans and strategies. Risks include changes to planning assumptions, such as utilization or demand rates for government services in the health care, education, or community social services sectors, as well as costs associated with natural disaster responses.
The financial results of ICBC remain a particular risk to total commercial Crown corporation net income. In addition, decisions that may arise from the comprehensive review of BC Hydro may result in impacts to the fiscal plan.
Capital spending and debt figures may be influenced by a number of factors including design development, procurement activity, weather, geotechnical conditions and interest rates. As a result, the actual operating surplus, capital expenditure and debt figures may differ from the current forecast. Government will continue to update the fiscal plan throughout the year in the second and third quarterly reports.
The potential fiscal impact from these risks is expected to be mitigated by the prudence that is incorporated in the fiscal plan, including the lower economic outlook compared to the private sector forecasters, the $450 million contingencies allocation, and the $500 million forecast allowance.
FIRST QUARTERLY REPORT 2019/20
16
UPDATED 2019/20 FINANCIAL FORECAST
Supplementary Schedules
The following tables provide the financial results for the three months ended June 30, 2019 and the 2019/20 full-year forecast.
Table 1.5 2019/20 Operating Statement
| | Year-to-Date to June 30 | | Full Year | |
| | 2019/20 | | Actual | | 2019/20 | | Actual | |
($ millions) | | Budget | | Actual | | Variance | | 2018/19 | | Budget | | Forecast | | Variance | | 2018/19 | |
Revenue | | 15,143 | | 15,226 | | 83 | | 13,751 | | 59,047 | | 58,894 | | (153 | ) | 57,128 | |
Expense | | (14,125 | ) | (13,973 | ) | 152 | | (13,176 | ) | (58,273 | ) | (58,215 | ) | 58 | | (55,593 | ) |
Surplus before forecast allowance | | 1,018 | | 1,253 | | 235 | | 575 | | 774 | | 679 | | (95 | ) | 1,535 | |
Forecast allowance | | — | | — | | — | | — | | (500 | ) | (500 | ) | — | | — | |
Surplus | | 1,018 | | 1,253 | | 235 | | 575 | | 274 | | 179 | | (95 | ) | 1,535 | |
Accumulated surplus beginning of the year | | 7,107 | | 8,551 | | 1,444 | | 7,016 | | 7,107 | | 8,551 | | 1,444 | | 7,016 | |
Accumulated surplus before comprehensive income | | 8,125 | | 9,804 | | 1,679 | | 7,591 | | 7,381 | | 8,730 | | 1,349 | | 8,551 | |
Accumulated other comprehensive income from self-supported Crown agencies | | 232 | | 802 | | 570 | | 214 | | 926 | | 89 | | (837 | ) | 31 | |
Accumulated surplus end of period | | 8,357 | | 10,606 | | 2,249 | | 7,805 | | 8,307 | | 8,819 | | 512 | | 8,582 | |
FIRST QUARTERLY REPORT 2019/20
17
UPDATED 2019/20 FINANCIAL FORECAST
Table 1.6 2019/20 Revenue by Source
| | Year-to-Date to June 30 | | Full Year | |
| | 2019/20 | | Actual | | 2019/20 | | Actual | |
($ millions) | | Budget | | Actual | | Variance | | 2018/19 | | Budget | | Forecast | | Variance | | 2018/19 | |
Taxation | | | | | | | | | | | | | | | | | |
Personal income | | 2,731 | | 2,731 | | — | | 2,438 | | 11,055 | | 10,970 | | (85 | ) | 11,364 | |
Corporate income | | 2,046 | | 2,108 | | 62 | | 1,859 | | 4,192 | | 4,492 | | 300 | | 5,180 | |
Employer health | | 460 | | 460 | | — | | — | | 1,854 | | 1,854 | | — | | 464 | |
Sales 1 | | 1,944 | | 1,955 | | 11 | | 1,865 | | 7,586 | | 7,616 | | 30 | | 7,369 | |
Fuel | | 251 | | 253 | | 2 | | 250 | | 1,021 | | 1,015 | | (6 | ) | 1,015 | |
Carbon | | 422 | | 406 | | (16 | ) | 356 | | 1,713 | | 1,705 | | (8 | ) | 1,465 | |
Tobacco | | 213 | | 205 | | (8 | ) | 218 | | 780 | | 770 | | (10 | ) | 781 | |
Property | | 684 | | 679 | | (5 | ) | 613 | | 2,996 | | 2,953 | | (43 | ) | 2,617 | |
Property transfer | | 529 | | 379 | | (150 | ) | 541 | | 1,910 | | 1,435 | | (475 | ) | 1,826 | |
Insurance premium | | 156 | | 156 | | — | | 150 | | 625 | | 645 | | 20 | | 633 | |
| | 9,436 | | 9,332 | | (104 | ) | 8,290 | | 33,732 | | 33,455 | | (277 | ) | 32,714 | |
Natural resources | | | | | | | | | | | | | | | | | |
Natural gas royalties | | 66 | | 30 | | (36 | ) | 27 | | 275 | | 170 | | (105 | ) | 199 | |
Forests | | 195 | | 197 | | 2 | | 241 | | 1,155 | | 1,178 | | 23 | | 1,406 | |
Other natural resources 2 | | 285 | | 279 | | (6 | ) | 342 | | 1,193 | | 1,256 | | 63 | | 1,503 | |
| | 546 | | 506 | | (40 | ) | 610 | | 2,623 | | 2,604 | | (19 | ) | 3,108 | |
Other revenue | | | | | | | | | | | | | | | | | |
Medical Services Plan premiums | | 338 | | 351 | | 13 | | 328 | | 1,015 | | 1,015 | | — | | 1,360 | |
Other fees and licenses 3 | | 902 | | 914 | | 12 | | 870 | | 4,372 | | 4,388 | | 16 | | 4,233 | |
Investment earnings | | 277 | | 299 | | 22 | | 266 | | 1,196 | | 1,224 | | 28 | | 1,243 | |
Miscellaneous 4 | | 751 | | 814 | | 63 | | 784 | | 3,375 | | 3,515 | | 140 | | 3,413 | |
| | 2,268 | | 2,378 | | 110 | | 2,248 | | 9,958 | | 10,142 | | 184 | | 10,249 | |
Contributions from the federal government | | | | | | | | | | | | | | | | | |
Health and social transfers | | 1,851 | | 1,851 | | — | | 1,775 | | 7,404 | | 7,399 | | (5 | ) | 7,090 | |
Other federal government contributions 5 | | 442 | | 404 | | (38 | ) | 332 | | 2,019 | | 2,009 | | (10 | ) | 1,962 | |
| | 2,293 | | 2,255 | | (38 | ) | 2,107 | | 9,423 | | 9,408 | | (15 | ) | 9,052 | |
Commercial Crown corporation net income | | | | | | | | | | | | | | | | | |
BC Hydro | | 17 | | 25 | | 8 | | 80 | | 712 | | 712 | | — | | (428 | ) |
Adjustment for regulatory accounts 6 | | — | | — | | — | | — | | — | | — | | — | | 950 | |
Liquor Distribution Branch | | 286 | | 290 | | 4 | | 294 | | 1,120 | | 1,120 | | — | | 1,104 | |
BC Lotteries (net of payments to the federal government) | | 341 | | 352 | | 11 | | 370 | | 1,396 | | 1,393 | | (3 | ) | 1,405 | |
ICBC | | (61 | ) | 55 | | 116 | | (268 | ) | (50 | ) | (50 | ) | — | | (1,153 | ) |
Other 7 | | 17 | | 33 | | 16 | | 20 | | 133 | | 110 | | (23 | ) | 127 | |
| | 600 | | 755 | | 155 | | 496 | | 3,311 | | 3,285 | | (26 | ) | 2,005 | |
Total revenue | | 15,143 | | 15,226 | | 83 | | 13,751 | | 59,047 | | 58,894 | | (153 | ) | 57,128 | |
1 Includes provincial sales tax and social services tax/hotel room tax related to prior years.
2 Columbia River Treaty, other energy and minerals, water rental and other resources.
3 Post-secondary, healthcare-related, motor vehicle, and other fees.
4 Includes reimbursements for health care and other services provided to external agencies, and other recoveries.
5 Includes contributions for health, education, community development, housing and social service programs, and transportation projects.
6 BC Hydro’s net loss for 2018/19 includes a write-off of a regulatory account. At the summary level, the Province recognized $950 million adjustment in fiscal 2017/18 with respect to BC Hydro’s deferred regulatory accounts.
7 Includes Columbia Power Corporation, BC Railway Company, Columbia Basin power projects, and post-secondary institutions’ self-supported subsidiaries.
FIRST QUARTERLY REPORT 2019/20
18
UPDATED 2019/20 FINANCIAL FORECAST
Table 1.7 2019/20 Expense by Ministry, Program and Agency
| | Year-to-Date to June 30 | | Full��Year | |
| | 2019/20 | | Actual | | 2019/20 | | Actual | |
($ millions) | | Budget | | Actual | | Variance | | 2018/19 | | Budget | | Forecast | | Variance | | 2018/19 | |
Office of the Premier | | 3 | | 4 | | 1 | | 3 | | 11 | | 11 | | — | | 11 | |
Advanced Education, Skills and Training | | 618 | | 620 | | 2 | | 566 | | 2,330 | | 2,330 | | — | | 2,218 | |
Agriculture | | 11 | | 21 | | 10 | | 11 | | 98 | | 98 | | — | | 98 | |
Attorney General | | 148 | | 174 | | 26 | | 156 | | 606 | | 606 | | — | | 622 | |
Children and Family Development | | 488 | | 496 | | 8 | | 427 | | 2,065 | | 2,065 | | — | | 1,828 | |
Citizens’ Services | | 131 | | 140 | | 9 | | 132 | | 552 | | 552 | | — | | 600 | |
Education | | 1,877 | | 1,894 | | 17 | | 1,818 | | 6,569 | | 6,580 | | 11 | | 6,382 | |
Energy, Mines and Petroleum Resources | | 47 | | 24 | | (23 | ) | 12 | | 180 | | 180 | | — | | 106 | |
Environment and Climate Change Strategy | | 45 | | 51 | | 6 | | 44 | | 243 | | 243 | | — | | 188 | |
Finance | | 230 | | 211 | | (19 | ) | 125 | | 878 | | 878 | | — | | 833 | |
Forests, Lands, Natural Resource Operations and Rural Development | | 166 | | 226 | | 60 | | 188 | | 823 | | 915 | | 92 | | 1,408 | |
Health | | 5,013 | | 4,915 | | (98 | ) | 4,780 | | 20,846 | | 20,846 | | — | | 19,843 | |
Indigenous Relations and Reconciliation | | 20 | | 43 | | 23 | | 16 | | 108 | | 108 | | — | | 231 | |
Jobs, Trade and Technology | | 24 | | 20 | | (4 | ) | 32 | | 97 | | 97 | | — | | 103 | |
Labour | | 4 | | 4 | | — | | 3 | | 16 | | 16 | | — | | 12 | |
Mental Health and Addictions | | 2 | | 2 | | — | | 2 | | 10 | | 10 | | — | | 14 | |
Municipal Affairs and Housing | | 302 | | 295 | | (7 | ) | 285 | | 828 | | 828 | | — | | 817 | |
Public Safety and Solicitor General | | 193 | | 213 | | 20 | | 205 | | 800 | | 917 | | 117 | | 1,091 | |
Social Development and Poverty Reduction | | 885 | | 878 | | (7 | ) | 821 | | 3,572 | | 3,572 | | — | | 3,363 | |
Tourism, Arts and Culture | | 54 | | 30 | | (24 | ) | 30 | | 164 | | 164 | | — | | 164 | |
Transportation and Infrastructure | | 228 | | 215 | | (13 | ) | 217 | | 926 | | 926 | | — | | 902 | |
Total ministries and Office of the Premier | | 10,489 | | 10,476 | | (13 | ) | 9,873 | | 41,722 | | 41,942 | | 220 | | 40,834 | |
Management of public funds and debt | | 310 | | 314 | | 4 | | 325 | | 1,278 | | 1,234 | | (44 | ) | 1,258 | |
Contingencies | | — | | — | | — | | — | | 750 | | 450 | | (300 | ) | 21 | |
Contingencies - | | | | | | | | | | | | | | | | | |
Sustainable Services Negotiating Mandate | | — | | — | | — | | — | | 553 | | 523 | | (30 | ) | — | |
Funding for capital expenditures | | 250 | | 220 | | (30 | ) | 86 | | 2,134 | | 2,022 | | (112 | ) | 1,435 | |
Refundable tax credit transfers | | 252 | | 361 | | 109 | | 328 | | 1,489 | | 1,489 | | — | | 1,618 | |
Legislative Assembly and other appropriations | | 37 | | 35 | | (2 | ) | 34 | | 159 | | 159 | | — | | 160 | |
Total appropriations | | 11,338 | | 11,406 | | 68 | | 10,646 | | 48,085 | | 47,819 | | (266 | ) | 45,326 | |
Elimination of transactions between appropriations 1 | | — | | (5 | ) | (5 | ) | (13 | ) | (24 | ) | (21 | ) | 3 | | (18 | ) |
Prior year liability adjustments | | — | | — | | — | | — | | — | | — | | — | | (151 | ) |
Consolidated revenue fund expense | | 11,338 | | 11,401 | | 63 | | 10,633 | | 48,061 | | 47,798 | | (263 | ) | 45,157 | |
Expenses recovered from external entities | | 901 | | 683 | | (218 | ) | 632 | | 3,520 | | 3,511 | | (9 | ) | 3,471 | |
Elimination of funding provided to service delivery agencies | | (7,027 | ) | (6,987 | ) | 40 | | (6,394 | ) | (28,631 | ) | (28,525 | ) | 106 | | (26,928 | ) |
Total direct program spending | | 5,212 | | 5,097 | | (115 | ) | 4,871 | | 22,950 | | 22,784 | | (166 | ) | 21,700 | |
Service delivery agency expense | | | | | | | | | | | | | | | | | |
School districts | | 2,053 | | 2,048 | | (5 | ) | 1,950 | | 6,912 | | 6,912 | | — | | 6,671 | |
Universities | | 1,173 | | 1,186 | | 13 | | 1,119 | | 5,128 | | 5,203 | | 75 | | 4,894 | |
Colleges and institutes | | 333 | | 339 | | 6 | | 312 | | 1,373 | | 1,428 | | 55 | | 1,352 | |
Health authorities and hospital societies | | 4,079 | | 4,062 | | (17 | ) | 3,823 | | 16,292 | | 16,308 | | 16 | | 15,918 | |
Other service delivery agencies | | 1,275 | | 1,241 | | (34 | ) | 1,101 | | 5,618 | | 5,580 | | (38 | ) | 5,058 | |
Total service delivery agency expense | | 8,913 | | 8,876 | | (37 | ) | 8,305 | | 35,323 | | 35,431 | | 108 | | 33,893 | |
Total expense | | 14,125 | | 13,973 | | (152 | ) | 13,176 | | 58,273 | | 58,215 | | (58 | ) | 55,593 | |
1 Reflects payments made under an agreement where an expense from a voted appropriation is recorded as revenue by a special account.
FIRST QUARTERLY REPORT 2019/20
19
UPDATED 2019/20 FINANCIAL FORECAST
Table 1.8 2019/20 Expense by Function
| | Year-to-Date to June 30 | | Full Year | |
| | 2019/20 | | Actual | | 2019/20 | | Actual | |
($ millions) | | Budget | | Actual | | Variance | | 2018/19 | | Budget | | Forecast | | Variance | | 2018/19 | |
Health: | | | | | | | | | | | | | | | | | |
Medical Services Plan | | 1,204 | | 1,204 | | — | | 1,171 | | 5,092 | | 5,092 | | — | | 4,861 | |
Pharmacare | | 319 | | 357 | | 38 | | 366 | | 1,471 | | 1,471 | | — | | 1,494 | |
Regional services | | 3,965 | | 3,966 | | 1 | | 3,712 | | 15,520 | | 15,543 | | 23 | | 14,996 | |
Other healthcare expenses 1 | | 179 | | 139 | | (40 | ) | 149 | | 900 | | 887 | | (13 | ) | 800 | |
| | 5,667 | | 5,666 | | (1 | ) | 5,398 | | 22,983 | | 22,993 | | 10 | | 22,151 | |
Education: | | | | | | | | | | | | | | | | | |
Elementary and secondary | | 2,169 | | 2,182 | | 13 | | 2,104 | | 7,468 | | 7,478 | | 10 | | 7,253 | |
Post-secondary | | 1,522 | | 1,557 | | 35 | | 1,470 | | 6,719 | | 6,798 | | 79 | | 6,390 | |
Other education expenses 2 | | 126 | | 33 | | (93 | ) | 31 | | 422 | | 430 | | 8 | | 442 | |
| | 3,817 | | 3,772 | | (45 | ) | 3,605 | | 14,609 | | 14,706 | | 97 | | 14,085 | |
Social services: | | | | | | | | | | | | | | | | | |
Social assistance 1,2 | | 571 | | 570 | | (1 | ) | 530 | | 2,320 | | 2,320 | | — | | 3,204 | |
Child welfare 1 | | 472 | | 478 | | 6 | | 410 | | 1,965 | | 1,967 | | 2 | | 1,652 | |
Low income tax credit transfers | | 62 | | 71 | | 9 | | 72 | | 317 | | 317 | | — | | 414 | |
Community living and other services | | 247 | | 286 | | 39 | | 258 | | 1,158 | | 1,163 | | 5 | | 73 | |
| | 1,352 | | 1,405 | | 53 | | 1,270 | | 5,760 | | 5,767 | | 7 | | 5,343 | |
Protection of persons and property | | 415 | | 445 | | 30 | | 412 | | 1,706 | | 1,818 | | 112 | | 2,004 | |
Transportation | | 476 | | 440 | | (36 | ) | 457 | | 2,300 | | 2,334 | | 34 | | 2,021 | |
Natural resources and economic development | | 727 | | 658 | | (69 | ) | 562 | | 3,233 | | 3,325 | | 92 | | 3,825 | |
Other | | 596 | | 536 | | (60 | ) | 459 | | 2,076 | | 2,073 | | (3 | ) | 1,810 | |
Contingencies | | — | | — | | — | | — | | 750 | | 450 | | (300 | ) | — | |
Contingencies - | | | | | | | | | | | | | | | | | |
Sustainable Services Negotiating Mandate | | — | | — | | — | | — | | 553 | | 523 | | (30 | ) | — | |
General government | | 401 | | 388 | | (13 | ) | 360 | | 1,506 | | 1,506 | | — | | 1,670 | |
Debt servicing | | 674 | | 663 | | (11 | ) | 653 | | 2,797 | | 2,720 | | (77 | ) | 2,684 | |
Total expense | | 14,125 | | 13,973 | | (152 | ) | 13,176 | | 58,273 | | 58,215 | | (58 | ) | 55,593 | |
1 Payments for healthcare services by the Ministry of Social Development and Poverty Reduction and the Ministry of Children and Family Development made on behalf of their clients are reported in the Health function.
2 Payments for training costs by the Ministry of Social Development and Poverty Reduction made on behalf of its clients are reported in the Education function.
FIRST QUARTERLY REPORT 2019/20
20
UPDATED 2019/20 FINANCIAL FORECAST
Table 1.9 2019/20 Capital Spending
| | Year-to-Date to June 30 | | Full Year | |
| | 2019/20 | | Actual | | 2019/20 | | Actual | |
($ millions) | | Budget | | Actual | | Variance | | 2018/19 | | Budget | | Forecast | | Variance | | 2018/19 | |
Taxpayer-supported | | | | | | | | | | | | | | | | | |
Education | | | | | | | | | | | | | | | | | |
School districts | | 215 | | 221 | | 6 | | 160 | | 843 | | 850 | | 7 | | 626 | |
Post-secondary institutions | | 198 | | 111 | | (87 | ) | 196 | | 1,034 | | 940 | | (94 | ) | 1,024 | |
Health | | 137 | | 102 | | (35 | ) | 99 | | 1,255 | | 1,372 | | 117 | | 904 | |
BC Transportation Financing Authority | | 362 | | 182 | | (180 | ) | 164 | | 1,881 | | 1,364 | | (517 | ) | 853 | |
BC Transit | | 37 | | 9 | | (28 | ) | 16 | | 194 | | 131 | | (63 | ) | 85 | |
Government ministries | | 73 | | 46 | | (27 | ) | 46 | | 672 | | 672 | | — | | 421 | |
Housing 1 | | 56 | | 92 | | 36 | | 18 | | 393 | | 378 | | (15 | ) | 483 | |
Other | | 6 | | 6 | | — | | 8 | | 68 | | 69 | | 1 | | 56 | |
Total taxpayer-supported | | 1,084 | | 769 | | (315 | ) | 707 | | 6,340 | | 5,776 | | (564 | ) | 4,452 | |
| | | | | | | | | | | | | | | | | |
Self-supported | | | | | | | | | | | | | | | | | |
BC Hydro | | 663 | | 625 | | (38 | ) | 539 | | 2,999 | | 2,999 | | — | | 3,826 | |
Columbia Basin power projects 2 | | 992 | | 991 | | (1 | ) | 1 | | 1,001 | | 1,001 | | — | | 2 | |
BC Railway Company | | 2 | | 1 | | (1 | ) | 5 | | 8 | | 11 | | 3 | | 33 | |
ICBC | | 23 | | 20 | | (3 | ) | 8 | | 92 | | 92 | | — | | 66 | |
BC Lottery Corporation | | 26 | | 13 | | (13 | ) | 6 | | 105 | | 105 | | — | | 75 | |
Liquor Distribution Branch | | 18 | | 5 | | (13 | ) | 10 | | 69 | | 74 | | 5 | | 60 | |
Other 3 | | — | | — | | — | | — | | — | | — | | — | | 44 | |
Total self-supported | | 1,724 | | 1,655 | | (69 | ) | 569 | | 4,274 | | 4,282 | | 8 | | 4,106 | |
Total capital spending | | 2,808 | | 2,424 | | (384 | ) | 1,276 | | 10,614 | | 10,058 | | (556 | ) | 8,558 | |
1 Includes BC Housing Management Commission and Provincial Rental Housing Corporation.
2 Joint ventures of the Columbia Power Corporation and Columbia Basin Trust.
3 Includes post-secondary institutions’ self-supported subsidiaries.
FIRST QUARTERLY REPORT 2019/20
21
UPDATED 2019/20 FINANCIAL FORECAST
Table 1.10 Capital Expenditure Projects Greater Than $50 million 1
| | | | Project | | Estimated | | Anticipated | | Project Financing | |
| | Year of | | Cost to | | Cost to | | Total | | Internal/ | | P3 | | Federal | | Other | |
($ millions) | | Completion | | June 30, 2019 | | Complete | | Cost | | Borrowing | | Liability | | Gov’t | | Contrib’ns | |
Taxpayer-supported | |
School districts | | | | | | | | | | | | | | | | | |
Kitsilano Secondary 2 | | 2019 | | 62 | | 3 | | 65 | | 61 | | — | | — | | 4 | |
Centennial Secondary 2 | | 2020 | | 49 | | 12 | | 61 | | 61 | | — | | — | | — | |
R.E. Mountain Secondary (Willoughby Slope) | | 2019 | | 39 | | 20 | | 59 | | 38 | | — | | — | | 21 | |
Argyle Secondary | | 2020 | | 17 | | 45 | | 62 | | 50 | | — | | — | | 12 | |
Grandview Heights Secondary | | 2021 | | 4 | | 89 | | 93 | | 71 | | — | | — | | 22 | |
Handsworth Secondary | | 2021 | | 1 | | 61 | | 62 | | 62 | | — | | — | | — | |
New Westminster Secondary | | 2021 | | 29 | | 78 | | 107 | | 107 | | — | | — | | — | |
Burnaby North Secondary | | 2021 | | 2 | | 77 | | 79 | | 79 | | | | | | | |
Eric Hamber Secondary | | 2022 | | 1 | | 101 | | 102 | | 94 | | — | | — | | 8 | |
South Side Area Elementary Middle | | 2022 | | 1 | | 53 | | 54 | | 49 | | | | | | 5 | |
Sheffield Elementary | | 2021 | | — | | 52 | | 52 | | 47 | | — | | — | | 5 | |
West Langford Elementary and Middle | | 2022 | | — | | 89 | | 89 | | 89 | | — | | — | | — | |
Victoria High School | | 2022 | | — | | 80 | | 80 | | 77 | | — | | — | | 3 | |
Quesnel Junior School | | 2022 | | — | | 52 | | 52 | | 52 | | — | | — | | — | |
Seismic mitigation program 3 | | 2030 | | 349 | | 1,195 | | 1,544 | | 1,544 | | — | | — | | — | |
Total school districts | | | | 554 | | 2,007 | | 2,561 | | 2,481 | | — | | — | | 80 | |
Post-secondary institutions | | | | | | | | | | | | | | | | | |
University of British Columbia — Undergraduate Life Science Teaching Laboratories Redevelopment | | 2019 | | 85 | | 3 | | 88 | | 12 | | — | | 32 | | 44 | |
Simon Fraser University — Energy Systems Engineering Building 4 | | 2019 | | 118 | | 8 | | 126 | | 45 | | — | | 45 | | 36 | |
British Columbia Institute of Technology — Health Sciences Centre for Advanced Simulation | | 2021 | | 3 | | 75 | | 78 | | 66 | | — | | — | | 12 | |
Camosun College — Centre for Health Sciences | | 2019 | | 55 | | 9 | | 64 | | 40 | | — | | 13 | | 11 | |
University of Victoria — Student Housing | | 2023 | | 6 | | 195 | | 201 | | 123 | | — | | — | | 78 | |
Total post-secondary institutions | | | | 267 | | 290 | | 557 | | 286 | | — | | 90 | | 181 | |
Health facilities | | | | | | | | | | | | | | | | | |
Queen Charlotte/Haida Gwaii Hospital 2 | | 2016 | | 48 | | 2 | | 50 | | 31 | | — | | — | | 19 | |
Surrey Emergency/Critical Care Tower | | | | | | | | | | | | | | | | | |
— Direct procurement | | 2019 | | 164 | | 30 | | 194 | | 174 | | — | | — | | 20 | |
— P3 contract | | 2014 | | 318 | | — | | 318 | | 139 | | 179 | | — | | — | |
Royal Inland Hospital Clinical Services Building 2 | | 2016 | | 61 | | — | | 61 | | 37 | | — | | — | | 24 | |
Royal Inland Hospital Patient Care Tower | | | | | | | | | | | | | | | | | |
— Direct procurement | | 2024 | | 23 | | 106 | | 129 | | 39 | | — | | — | | 90 | |
— P3 contract | | 2022 | | 29 | | 259 | | 288 | | — | | 164 | | — | | 124 | |
Vancouver General Hospital — Jim Pattison Pavilion Operating Rooms | | 2021 | | 14 | | 88 | | 102 | | 35 | | — | | — | | 67 | |
North Island Hospitals 2 | | | | | | | | | | | | | | | | | |
— Direct procurement | | 2017 | | 115 | | 11 | | 126 | | 73 | | — | | — | | 53 | |
— P3 contract | | 2017 | | 480 | | — | | 480 | | 60 | | 232 | | — | | 188 | |
Interior Heart and Surgical Centre 2 | | | | | | | | | | | | | | | | | |
— Direct procurement | | 2018 | | 175 | | 73 | | 248 | | 213 | | — | | — | | 35 | |
— P3 contract | | 2015 | | 133 | | — | | 133 | | 4 | | 79 | | — | | 50 | |
Vancouver General Hospital — Joseph and Rosalie Segal Family Health Centre 2 | | 2017 | | 73 | | 9 | | 82 | | 57 | | — | | — | | 25 | |
Children’s and Women’s Hospital | | | | | | | | | | | | | | | | | |
— Direct procurement | | 2020 | | 246 | | 62 | | 308 | | 178 | | — | | — | | 130 | |
— P3 contract | | 2018 | | 368 | | — | | 368 | | 167 | | 187 | | — | | 14 | |
Penticton Regional Hospital — Patient Care Tower | | | | | | | | | | | | | | | | | |
— Direct procurement | | 2021 | | 27 | | 53 | | 80 | | 22 | | — | | — | | 58 | |
— P3 contract | | 2019 | | 231 | | 1 | | 232 | | — | | 139 | | — | | 93 | |
| | | | | | | | | | | | | | | | | |
| | | | | | | | | | | | | | | | 
| |
FIRST QUARTERLY REPORT 2019/20
22
UPDATED 2019/20 FINANCIAL FORECAST
Table 1.10 Capital Expenditure Projects Greater Than $50 million 1 (continued)
| | | | Project | | Estimated | | Anticipated | | Project Financing | |
| | Year of | | Cost to | | Cost to | | Total | | Internal/ | | P3 | | Federal | | Other | |
($ millions) | | Completion | | June 30, 2019 | | Complete | | Cost | | Borrowing | | Liability | | Gov’t | | Contrib’ns | |
Royal Columbian Hospital — Phase 1 | | 2019 | | 194 | | 65 | | 259 | | 250 | | — | | — | | 9 | |
Royal Columbian Hospital — Phases 2 & 3 | | 2026 | | 15 | | 1,221 | | 1,236 | | 1,174 | | — | | — | | 62 | |
Peace Arch Hospital Renewal | | 2021 | | 8 | | 76 | | 84 | | 8 | | — | | — | | 76 | |
Centre for Mental Health and Addictions | | 2020 | | 26 | | 75 | | 101 | | 101 | | — | | — | | — | |
Dogwood Complex Residential Care | | 2021 | | — | | 51 | | 51 | | — | | — | | — | | 51 | |
Lions Gate Hospital — New Acute Care Facility | | 2023 | | — | | 166 | | 166 | | — | | — | | — | | 166 | |
St Paul’s Hospital | | 2026 | | 3 | | 1,912 | | 1,915 | | 990 | | — | | — | | 925 | |
Mills Memorial Hospital | | 2026 | | — | | 447 | | 447 | | 337 | | — | | — | | 110 | |
Burnaby Hospital Redevelopment — Phase 1 5 | | 2025 | | — | | 547 | | 547 | | 513 | | — | | — | | 34 | |
Cariboo Memorial Hospital | | 2026 | | — | | 218 | | 218 | | 131 | | — | | — | | 87 | |
Clinical and systems transformation 6 | | 2023 | | 343 | | 137 | | 480 | | 480 | | — | | — | | — | |
iHealth Project — Vancouver Island Health Authority 6 | | 2020 | | 94 | | 6 | | 100 | | — | | — | | — | | 100 | |
Total health facilities | | | | 3,188 | | 5,615 | | 8,803 | | 5,213 | | 980 | | — | | 2,610 | |
Transportation | | | | | | | | | | | | | | | | | |
Highway 97 widening from Highway 33 to Edwards Road 2 | | 2018 | | 65 | | 1 | | 66 | | 48 | | — | | 18 | | — | |
Highway 1 widening and 216th Street Interchange | | 2019 | | 44 | | 18 | | 62 | | 28 | | — | | 22 | | 12 | |
Highway 91 Alex Fraser Bridge Capacity Improvements | | 2019 | | 55 | | 15 | | 70 | | 37 | | — | | 33 | | — | |
Highway 97 Stone Creek to Williams Road | | 2019 | | 50 | | 15 | | 65 | | 65 | | — | | — | | — | |
Highway 97 Williams Lake Indian Reserve to Lexington Road | | 2019 | | 50 | | 7 | | 57 | | 57 | | — | | — | | — | |
Highway 1 — Admirals Road/McKenzie Avenue Interchange | | 2020 | | 78 | | 18 | | 96 | | 63 | | — | | 33 | | — | |
Highway 7 Corridor Improvements | | 2020 | | 37 | | 33 | | 70 | | 48 | | — | | 22 | | — | |
Highway 99 10-Mile Slide | | 2020 | | 14 | | 46 | | 60 | | 60 | | — | | — | | — | |
Highway 1 Lower Lynn Corridor Improvements | | 2021 | | 120 | | 78 | | 198 | | 77 | | — | | 66 | | 55 | |
Highway 1 Illecillewaet 4-laning and Brake Check improvements | | 2022 | | 8 | | 77 | | 85 | | 69 | | — | | 16 | | — | |
Highway 14 Corridor improvements | | 2022 | | 5 | | 81 | | 86 | | 56 | | — | | 30 | | — | |
Highway 1 Hoffmans Bluff to Jade Mountain | | 2023 | | 23 | | 176 | | 199 | | 144 | | — | | 55 | | — | |
Highway 91 to Highway 17 and Deltaport Way Corridor Improvements | | 2023 | | 32 | | 213 | | 245 | | 80 | | | | 82 | | 83 | |
Highway 1 Salmon Arm West | | 2023 | | 31 | | 132 | | 163 | | 115 | | — | | 48 | | — | |
Highway 1 RW Bruhn Bridge | | 2023 | | 11 | | 214 | | 225 | | 134 | | — | | 91 | | — | |
Pattullo Bridge Replacement 7 | | 2023 | | 29 | | 1,348 | | 1,377 | | 1,377 | | — | | — | | — | |
Quartz Creek Bridge Replacement | | 2023 | | 3 | | 118 | | 121 | | 71 | | — | | 50 | | — | |
Kootenay Lake ferry service upgrade | | 2023 | | 1 | | 54 | | 55 | | 38 | | — | | 17 | | — | |
Highway 1 216th - 264th Street widening | | 2024 | | 2 | | 233 | | 235 | | 99 | | — | | 109 | | 27 | |
Highway 1 Kicking Horse Canyon Phase 4 8 | | 2024 | | 7 | | 594 | | 601 | | 386 | | — | | 215 | | — | |
Broadway Subway | | 2025 | | 25 | | 2,802 | | 2,827 | | 1,830 | | — | | 897 | | 100 | |
Total transportation | | | | 690 | | 6,273 | | 6,963 | | 4,882 | | — | | 1,804 | | 277 | |
Other taxpayer-supported | | | | | | | | | | | | | | | | | |
Abbotsford courthouse | | | | | | | | | | | | | | | | | |
— Direct procurement | | 2021 | | 6 | | 12 | | 18 | | 18 | | — | | — | | — | |
— P3 contract | | 2021 | | 48 | | 86 | | 134 | | 48 | | 80 | | — | | 6 | |
Natural Resource Permitting Project 9 | | 2019 | | 87 | | — | | 87 | | 87 | | — | | — | | — | |
Stanley New Fountain Hotel (Affordable Rental Housing) | | 2021 | | 10 | | 53 | | 63 | | 20 | | — | | — | | 43 | |
6585 Sussex Ave (Affordable Rental Housing) | | 2021 | | 11 | | 64 | | 75 | | 43 | | — | | — | | 32 | |
Clark & 1st Ave (Affordable Rental Housing) | | 2023 | | 1 | | 99 | | 100 | | 67 | | — | | — | | 33 | |
Nanaimo Correctional Centre Replacement | | 2023 | | 1 | | 156 | | 157 | | 157 | | — | | — | | — | |
Total other | | | | 164 | | 470 | | 634 | | 440 | | 80 | | — | | 114 | |
Total taxpayer-supported | | | | 4,863 | | 14,655 | | 19,518 | | 13,302 | | 1,060 | | 1,894 | | 3,262 | |
| | | | | | | | | | | | | | | | | |
| | | | | | | | | | | | | | | |
| |
FIRST QUARTERLY REPORT 2019/20
23
UPDATED 2019/20 FINANCIAL FORECAST
Table 1.10 Capital Expenditure Projects Greater Than $50 million 1 (continued)
| | | | Project | | Estimated | | Anticipated | | Project Financing | |
| | Year of | | Cost to | | Cost to | | Total | | Internal/ | | P3 | | Federal | | Other | |
($ millions) | | Completion | | June 30, 2019 | | Complete | | Cost | | Borrowing | | Liability | | Gov’t | | Contrib’ns | |
Power generation and transmission | | | | | | | | | | | | | | | | | |
BC Hydro | | | | | | | | | | | | | | | | | |
— Hugh Keenleyside spillway gate reliability upgrade 2 | | 2015 | | 114 | | — | | 114 | | 114 | | — | | — | | — | |
— Dawson Creek/Chetwynd area transmission 2 | | 2015 | | 294 | | 2 | | 296 | | 296 | | — | | — | | — | |
— Ruskin Dam safety and powerhouse upgrade 2 | | 2018 | | 625 | | 17 | | 642 | | 642 | | — | | — | | — | |
— Kamloops substation 2 | | 2018 | | 50 | | 2 | | 52 | | 52 | | — | | — | | — | |
— W.A.C. Bennett Dam riprap upgrade project 2 | | 2018 | | 118 | | 1 | | 119 | | 119 | | — | | — | | — | |
— Horne Payne substation upgrade project 2 | | 2019 | | 66 | | 7 | | 73 | | 73 | | — | | — | | — | |
— John Hart generating station replacement 2 | | 2019 | | 961 | | 24 | | 985 | | 985 | | — | | — | | — | |
— Cheakamus unit 1 and 2 generator replacement | | 2019 | | 59 | | 15 | | 74 | | 74 | | — | | — | | — | |
— South Fraser transmission relocation project 10 | | TBD | | 30 | | 46 | | 76 | | 76 | | — | | — | | — | |
— Bridge River 2 units 5 and 6 upgrade project | | 2019 | | 65 | | 21 | | 86 | | 86 | | — | | — | | — | |
— Downtown Vancouver Electricity Supply: West End strategic property purchase | | 2020 | | 67 | | 14 | | 81 | | 81 | | — | | — | | — | |
— Fort St. John and Taylor Electric Supply | | 2020 | | 36 | | 17 | | 53 | | 53 | | — | | — | | — | |
— Supply Chain Applications project | | 2020 | | 39 | | 29 | | 68 | | 68 | | — | | — | | — | |
— UBC load increase stage 2 project | | 2021 | | 21 | | 34 | | 55 | | 55 | | — | | — | | — | |
— Peace Region Electricity Supply project | | 2021 | | 81 | | 204 | | 285 | | 285 | | — | | — | | — | |
— LNG Canada load interconnection project | | 2021 | | 13 | | 69 | | 82 | | 58 | | — | | — | | 24 | |
— Bridge River 2 units 7 and 8 upgrade project | | 2021 | | 8 | | 78 | | 86 | | 86 | | — | | — | | — | |
— Wahleach generator refurbishment project | | 2021 | | 8 | | 43 | | 51 | | 51 | | — | | — | | — | |
— Mica replace units 1-4 transformers project | | 2022 | | 15 | | 67 | | 82 | | 82 | | — | | — | | — | |
— G.M. Shrum G1-G10 control system upgrade | | 2022 | | 36 | | 39 | | 75 | | 75 | | — | | — | | — | |
— Mount Lehman substation expansion project | | 2022 | | 4 | | 55 | | 59 | | 59 | | — | | — | | — | |
— Capilano substation upgrade project | | 2024 | | 4 | | 83 | | 87 | | 87 | | — | | — | | — | |
— Site C project | | 2024 | | 3,817 | | 6,883 | | 10,700 | | 10,700 | | — | | — | | — | |
Columbia Basin power projects | | | | | | | | | | | | | | | | | |
— Waneta Dam power expansion — purchase of 51% interest 11 | | 2019 | | 991 | | — | | 991 | | 991 | | — | | — | | — | |
Total power generation and transmission | | | | 7,522 | | 7,750 | | 15,272 | | 15,248 | | — | | — | | 24 | |
Other self-supported | | | | | | | | | | | | | | | | | |
Liquor Distribution Branch Warehouse | | 2020 | | 43 | | 6 | | 49 | | 49 | | — | | — | | — | |
| | | | | | | | | | | | | | | | | |
Total self-supported | | | | 7,565 | | 7,756 | | 15,321 | | 15,297 | | — | | — | | 24 | |
Total $50 million projects | | | | 12,428 | | 22,411 | | 34,839 | | 28,599 | | 1,060 | | 1,894 | | 3,286 | |
1 Only projects that receive provincial funding and have been approved by Treasury Board and/or Crown corporation boards are included in this table. Ministry service plans may highlight projects that still require final approval. Capital costs reflect current government accounting policy.
2 Assets have been put into service and only trailing costs remain.
3 The Seismic Mitigation Program consists of all spending to date on Phase 2 of the program and may include spending on projects greater than $50 million included in the table above.
4 Simon Fraser University and private donors will contribute $26 million toward the project, and the university is also contributing land valued at $10 million.
5 The concept plan for the Phase 2 of the Burnaby Hospital Redevelopment has been approved. Financial information will be added to this table upon Business Case approval.
6 The project and estimated budget are currently under review.
7 Pattullo Bridge forecasted to open to the public in 2023 with the old bridge decommissioning to follow. Forecasted amount reflects total expenditures including capitalized and expensed items. This amount may change once contracts are finalized.
8 Kicking Horse Canyon Project costs exclude $11 million of past planning costs which are expensed.
9 The Ministry spent $87.0 million in developing a number of information systems under the Natural Resource Permitting Project. The Ministry subsequently wrote down $22.6 million of these costs as at March 31, 2019. The project is now completed with several systems in production being used by the natural resource ministries.
10 Construction work on the South Fraser transmission relocation project is currently suspended pending the government’s review of the George Massey Tunnel replacement.
11 Columbia Basin Trust and Columbia Power Corporation purchase of the Waneta Expansion asset for $991 million.
FIRST QUARTERLY REPORT 2019/20
24
UPDATED 2019/20 FINANCIAL FORECAST
Table 1.11 2019/20 Provincial Debt 1
| | Year-to-Date to June 30 | | Full Year | |
| | 2019/20 | | Actual | | 2019/20 | | Actual | |
($ millions) | | Budget | | Actual | | Variance | | 2018/19 | | Budget | | Forecast | | Variance | | 2018/19 | |
Taxpayer-supported debt | | | | | | | | | | | | | | | | | |
Provincial government operating | | — | | — | | — | | 547 | | — | | — | | — | | — | |
Other taxpayer-supported debt (mainly capital) | | | | | | | | | | | | | | | | | |
Education 2 | | | | | | | | | | | | | | | | | |
Post-secondary institutions | | 5,461 | | 5,377 | | (84 | ) | 5,386 | | 5,519 | | 5,558 | | 39 | | 5,370 | |
School districts | | 8,992 | | 8,903 | | (89 | ) | 8,953 | | 8,709 | | 9,017 | | 308 | | 8,904 | |
| | 14,453 | | 14,280 | | (173 | ) | 14,339 | | 14,228 | | 14,575 | | 347 | | 14,274 | |
Health 2 | | 7,975 | | 8,087 | | 112 | | 7,958 | | 7,918 | | 8,208 | | 290 | | 7,968 | |
Highways and public transit | | | | | | | | | | | | | | | | | |
BC Transit | | 86 | | 71 | | (15 | ) | 82 | | 122 | | 102 | | (20 | ) | 73 | |
BC Transportation Financing Authority | | 11,635 | | 11,492 | | (143 | ) | 10,610 | | 13,143 | | 12,588 | | (555 | ) | 11,293 | |
Port Mann Bridge | | 3,508 | | 3,510 | | 2 | | 3,508 | | 3,508 | | 3,510 | | 2 | | 3,510 | |
Public transit | | 1,000 | | 870 | | (130 | ) | 1,000 | | 1,000 | | 870 | | (130 | ) | 870 | |
SkyTrain extension | | 1,174 | | 1,021 | | (153 | ) | 1,174 | | 1,174 | | 1,021 | | (153 | ) | 1,021 | |
| | 17,403 | | 16,964 | | (439 | ) | 16,374 | | 18,947 | | 18,091 | | (856 | ) | 16,767 | |
Other | | | | | | | | | | | | | | | | | |
BC Immigrant Investment Fund | | 77 | | 69 | | (8 | ) | 141 | | 36 | | 49 | | 13 | | 70 | |
BC Pavilion Corporation | | 386 | | 370 | | (16 | ) | 372 | | 393 | | 378 | | (15 | ) | 371 | |
Provincial government general capital | | 3,195 | | 2,363 | | (832 | ) | 2,756 | | 3,639 | | 2,896 | | (743 | ) | 2,363 | |
Social housing 3 | | 909 | | 841 | | (68 | ) | 864 | | 1,196 | | 1,240 | | 44 | | 844 | |
Other 4 | | 27 | | 47 | | 20 | | 40 | | 27 | | 29 | | 2 | | 24 | |
| | 4,594 | | 3,690 | | (904 | ) | 4,173 | | 5,291 | | 4,592 | | (699 | ) | 3,672 | |
Total other taxpayer-supported | | 44,425 | | 43,021 | | (1,404 | ) | 42,844 | | 46,384 | | 45,466 | | (918 | ) | 42,681 | |
Total taxpayer-supported debt | | 44,425 | | 43,021 | | (1,404 | ) | 43,391 | | 46,384 | | 45,466 | | (918 | ) | 42,681 | |
Self-supported debt | | | | | | | | | | | | | | | | | |
Commercial Crown corporations | | | | | | | | | | | | | | | | | |
BC Hydro | | 22,368 | | 22,392 | | 24 | | 20,593 | | 23,386 | | 23,218 | | (168 | ) | 22,064 | |
BC Lotteries | | 139 | | 80 | | (59 | ) | 120 | | 167 | | 106 | | (61 | ) | 100 | |
Columbia Power Corporation | | 276 | | 276 | | — | | 281 | | 276 | | 277 | | 1 | | 282 | |
Columbia Basin power projects 5 | | 1,413 | | 1,404 | | (9 | ) | 425 | | 1,391 | | 1,337 | | (54 | ) | 418 | |
Post-secondary institutions’ subsidiaries | | 418 | | 388 | | (30 | ) | 418 | | 418 | | 387 | | (31 | ) | 387 | |
Other | | 28 | | 30 | | 2 | | 30 | | 26 | | 29 | | 3 | | 30 | |
Total self-supported debt | | 24,642 | | 24,570 | | (72 | ) | 21,867 | | 25,664 | | 25,354 | | (310 | ) | 23,281 | |
Forecast allowance | | — | | — | | — | | — | | 500 | | 500 | | — | | — | |
Total provincial debt | | 69,067 | | 67,591 | | (1,476 | ) | 65,258 | | 72,548 | | 71,320 | | (1,228 | ) | 65,962 | |
1 Provincial debt is prepared in accordance with Generally Accepted Accounting Principles and presented consistent with the Debt Summary Report included in the Public Accounts. Debt is shown net of sinking funds and unamortized discounts, excludes accrued interest, and includes non-guaranteed debt directly incurred by commercial Crown corporations and debt guaranteed by the Province.
2 Includes debt and guarantees incurred by the government on behalf of school districts, universities, colleges, health authorities and hospital societies (SUCH), and debt directly incurred by these entities.
3 Includes the BC Housing Management Commission and the Provincial Rental Housing Corporation.
4 Includes service delivery agencies, student loan guarantees, loan guarantees to agricultural producers, guarantees issued under economic development and home mortgage assistance programs and loan guarantee provisions.
5 Joint ventures of the Columbia Power Corporation and Columbia Basin Trust.
FIRST QUARTERLY REPORT 2019/20
25
UPDATED 2019/20 FINANCIAL FORECAST
Table 1.12 2019/20 Statement of Financial Position
| | Actual | | Year-to-Date | | Forecast | |
| | March 31, | | June 30, | | March 31, | |
($ millions) | | 2019 | | 2019 | | 2020 | |
Financial assets | | | | | | | |
Cash and temporary investments | | 3,029 | | 3,444 | | 2,976 | |
Other financial assets | | 12,524 | | 12,693 | | 12,853 | |
Sinking funds | | 752 | | 748 | | 665 | |
Investments in commercial Crown corporations: | | | | | | | |
Retained earnings | | 5,717 | | 7,338 | | 7,368 | |
Recoverable capital loans | | 22,547 | | 23,864 | | 24,583 | |
| | 28,264 | | 31,202 | | 31,951 | |
| | 44,569 | | 48,087 | | 48,445 | |
Liabilities | | | | | | | |
Accounts payable and accrued liabilities | | 10,435 | | 10,395 | | 10,875 | |
Deferred revenue | | 10,404 | | 10,506 | | 11,206 | |
Debt: | | | | | | | |
Taxpayer-supported debt | | 42,681 | | 43,021 | | 45,466 | |
Self-supported debt | | 23,281 | | 24,570 | | 25,354 | |
Forecast allowance | | — | | — | | 500 | |
Total provincial debt | | 65,962 | | 67,591 | | 71,320 | |
Add: debt offset by sinking funds | | 752 | | 748 | | 665 | |
Less: guarantees and non-guaranteed debt | | (850 | ) | (851 | ) | (827 | ) |
Financial statement debt | | 65,864 | | 67,488 | | 71,158 | |
| | 86,703 | | 88,389 | | 93,239 | |
Net liabilities | | (42,134 | ) | (40,302 | ) | (44,794 | ) |
Capital and other non-financial assets | | | | | | | |
Tangible capital assets | | 47,830 | | 48,046 | | 51,123 | |
Other non-financial assets | | 2,886 | | 2,862 | | 2,490 | |
| | 50,716 | | 50,908 | | 53,613 | |
Accumulated surplus | | 8,582 | | 10,606 | | 8,819 | |
Changes in Financial Position
| | Year-to-Date | | Forecast | |
| | June 30, | | March 31, | |
($ millions) | | 2019 | | 2020 | |
| | | | | |
(Surplus) deficit for the period | | (1,253 | ) | (179 | ) |
Comprehensive income (increase) decrease | | (771 | ) | (58 | ) |
(Increase) decrease in accumulated surplus | | (2,024 | ) | (237 | ) |
| | | | | |
Capital and other non-financial asset changes: | | | | | |
Taxpayer-supported capital investments | | 769 | | 5,776 | |
Less: amortization and other accounting changes | | (553 | ) | (2,483 | ) |
Increase in net capital assets | | 216 | | 3,293 | |
Increase (decrease) in other non-financial assets | | (24 | ) | (396 | ) |
Increase in capital and other non-financial assets | | 192 | | 2,897 | |
| | | | | |
Increase (decrease) in net liabilities | | (1,832 | ) | 2,660 | |
| | | | | |
Investment and working capital changes: | | | | | |
Investment in commercial Crown corporations: | | | | | |
Increase (decrease) in retained earnings | | 1,621 | | 1,651 | |
Self-supported capital investments | | 664 | | 4,282 | |
Less: loan repayments and other accounting changes | | 653 | | (2,246 | ) |
Increase (decrease) in investment in commercial Crown corporations | | 2,938 | | 3,687 | |
Increase (decrease) in cash and temporary investments | | 415 | | (53 | ) |
Other working capital changes | | 103 | | (1,000 | ) |
Increase in Investment and working capital | | 3,456 | | 2,634 | |
| | | | | |
Increase (decrease) in financial statement debt | | 1,624 | | 5,294 | |
(Increase) decrease in sinking fund debt | | 4 | | 87 | |
Increase (decrease) in guarantees and non-guaranteed debt | | 1 | | (23 | ) |
Increase (decrease) in total provincial debt | | 1,629 | | 5,358 | |
FIRST QUARTERLY REPORT 2019/20
26
PART 2 | ECONOMIC REVIEW AND OUTLOOK1
Summary
The Ministry of Finance (Ministry) estimates that British Columbia’s economy grew by 2.2 per cent in 2018. The Ministry forecasts economic growth of 1.7 per cent in 2019 and 1.9 per cent in 2020. Over the medium-term, economic growth in B.C. is expected to average 2.0 per cent annually during the 2021 to 2023 period. These projections are prudent relative to the current private sector outlook for B.C.
The Ministry’s forecast for B.C. real GDP growth is 0.2 percentage points lower than the current average outlook of six private sector forecasters (a subset of the Economic Forecast Council) for 2019 and 0.5 percentage points lower for 2020, in recognition of various downside risks to the economic outlook. This differential is one of the levels of prudence built into the fiscal plan.
Chart 2.1 Ministry’s Outlook for B.C. Prudent Compared to Private Sector

The main downside risks to B.C.’s economic outlook include uncertainty regarding global trade policies and escalating tensions, weakening global economic activity, lower commodity prices, as well as slower domestic economic growth.
British Columbia Economic Activity and Outlook
B.C.’s economic growth is expected to moderate somewhat this year and next, following estimated growth of 2.2 per cent in 2018. The Ministry now forecasts B.C. real GDP to grow by 1.7 per cent in 2019 and by 1.9 per cent in 2020, down from Budget 2019 growth projections of 2.4 per cent and 2.3 per cent, respectively.
The Ministry’s lower forecast of economic growth in 2019 largely reflects a decline in export activity, slower growth in retail sales and, to a lesser extent, weaker than anticipated home sales. Meanwhile, year-to-date data for B.C. employment and housing starts indicate stronger growth than projected earlier this year.
1 Reflects information available as of August 21, 2019, unless otherwise indicated.
First Quarterly Report 2019/20
27
ECONOMIC REVIEW AND OUTLOOK
Table 2.1 British Columbia Economic Indicators
| | | | | | Year-to-Date | |
| | Jan. to Mar. 2019 | | Apr. to Jun. 2019 | | Jan. to Jun. 2019 | |
| | change from | | change from | | change from | |
All data seasonally adjusted | | Oct. to Dec. 2018 | | Jan. to Mar. 2019 | | Jan. to Jun. 2018 | |
| | | | Per cent change | | | |
Employment | | +0.8 | | +0.9 | | +3.4 | |
Manufacturing shipments | | +0.1 | | +1.3 | | -0.1 | |
Exports | | -2.3 | | -2.1 | | -2.2 | |
Retail sales 1 | | +0.9 | | -0.3 | | +0.9 | |
Housing starts | | -5.0 | | +45.3 | | +15.6 | |
Non-residential building permits | | -11.5 | | -2.2 | | +47.5 | |
1 Data to May
Looking further ahead, the Ministry’s forecast of 1.9 per cent growth in 2020 incorporates revised external assumptions for weaker global activity and commodity prices, which translate into slower projected growth for B.C.’s real exports of goods and services. Residential construction activity is expected to moderate, while household consumption growth is expected to improve somewhat alongside lower interest rates over the forecast horizon. In addition, solid growth in business and government investment is expected to bolster overall economic growth.
An average of six private sector forecasters2 estimates that B.C. experienced the third strongest growth in real GDP among provinces in 2018. These private sector forecasters expect B.C.’s economy to rank among the top performers for provincial economic growth in 2019 and to lead economic growth in 2020.
Labour Market
Labour market activity in the province continues to be a source of strength. So far this year, B.C. ranked first among provinces in both employment growth and labour force growth. In addition, B.C. has maintained the lowest provincial unemployment rate for nearly two consecutive years, reflecting a robust labour market. On a year-to-date basis, B.C. employment advanced by 3.5 per cent compared to the January to July period of 2018. This translates into a net gain of around 86,000 new jobs, with full-time employment accounting for over half of these gains.
Year-to-date employment gains were led by increases in the professional, scientific and technical services sector (+18,200 jobs); the business, building and other support services sector (+17,300 jobs); and the trade sector (+15,500 jobs). By comparison, decreases were concentrated in the health care and social assistance sector (-8,300 jobs); the manufacturing sector (-8,000 jobs); and the forestry, fishing, mining, oil and gas sector (-2,700 jobs) compared to the January to July period of 2018.
2 A subset of the Economic Forecast Council that regularly forecasts economic performance in all provinces (BMO, CIBC, National Bank, RBC, Scotiabank and TD), as of August 21, 2019.
FIRST QUARTERLY REPORT 2019/20
28
ECONOMIC REVIEW AND OUTLOOK
Chart 2.2 B.C. Employment
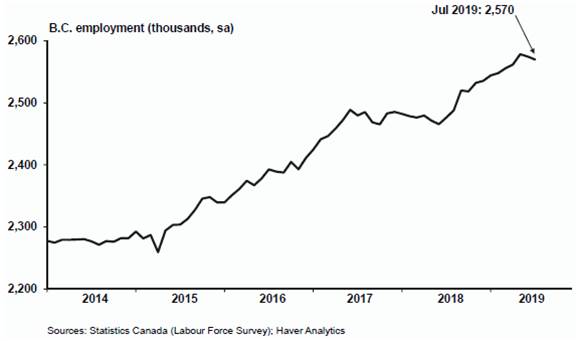
B.C.’s monthly unemployment rate continued to trend well below the national average and has ranked the lowest among provinces since August 2017. Year-to-date to July 2019, B.C.’s unemployment rate averaged 4.5 per cent, which is 0.4 percentage points below its average during the same period of last year. Meanwhile, the size of B.C.’s labour force grew by 3.1 per cent on a year-to-date basis, following modest growth in 2018. An increase in available workers provides some offset to hiring challenges associated with B.C.’s persistently high job vacancy rate, while tight labour market conditions generally support wage growth. So far this year, B.C.’s average weekly wage rate increased by 0.5 per cent compared to the first seven months of 2018, building on annual growth of 4.1 per cent observed in 2018.
Outlook
The Ministry forecasts employment in B.C. to increase by 2.6 per cent in 2019 (or by approximately 64,800 jobs), followed by annual growth of 1.0 per cent in 2020. The province’s unemployment rate is expected to average 4.8 per cent in 2019 and 5.0 per cent in 2020, before rising to average 5.3 per cent over the medium-term.
First Quarterly Report 2019/20
29
ECONOMIC REVIEW AND OUTLOOK
Consumer Spending and Housing
B.C.’s nominal retail sales rose by 0.9 per cent year-to-date to May 2019 compared to the same period of last year. This largely reflects a decline in housing-related spending at building material and garden equipment and supplies stores (-3.2 per cent) and at motor vehicle and parts dealers (-2.6 per cent) relative to the first five months of 2018. This was partially offset by year-to-date gains in sales at general merchandise stores (+5.5 per cent), at food and beverage stores (+3.7 per cent) and at gasoline stations (+2.6 per cent).
Chart 2.3 B.C. Retail Sales
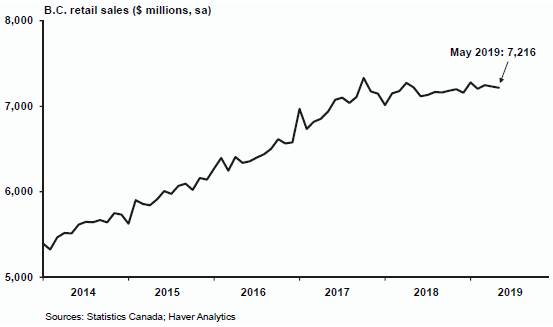
B.C. housing markets are adjusting to past increases in interest rates and to various provincial and federal measures. Overall, B.C. MLS home sales decreased by 16.1 per cent year-to-date to July 2019 compared to the same period of 2018. At the regional level, notable sales declines were observed in the higher priced Greater Vancouver market, where home sales fell by 21.5 per cent compared to the first seven months of 2018.
Chart 2.4 B.C. Home Sales and Price
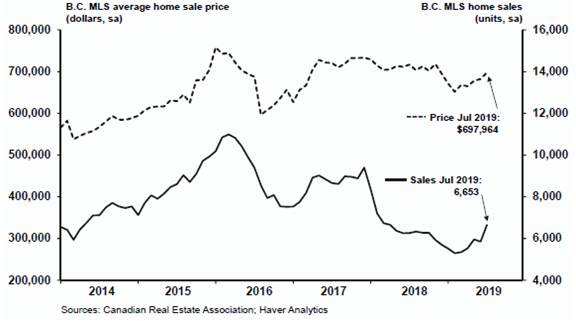
FIRST QUARTERLY REPORT 2019/20
30
ECONOMIC REVIEW AND OUTLOOK
An increase in the inventory of homes available for sale and a shift in the composition of sales contributed to a decline in the B.C. average home sale price, which decreased by 5.6 per cent year-to-date to July 2019 compared to the same period of 2018. Meanwhile, declining trends were observed in the MLS benchmark price across all dwelling types in Greater Vancouver on a year-to-date basis.
Chart 2.5 Greater Vancouver HPI Benchmark Price
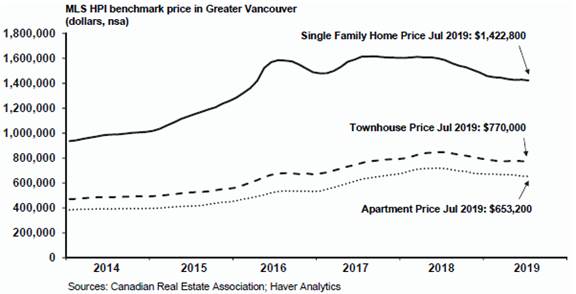
Momentum in new home construction in B.C. continued through the first half of 2019, with a boost from expedited multiple-unit construction activity in advance of development cost increases in Vancouver. By contrast, single-unit housing starts eased compared to the first half of 2018. Overall, B.C. housing starts increased by 16.8 per cent compared to the January to July period of 2018, to average around 48,700 annualized units. Meanwhile, the value of residential building permits, a leading indicator of new home construction, increased by 0.2 per cent year-to-date to June 2019.
Chart 2.6 B.C. Housing Starts
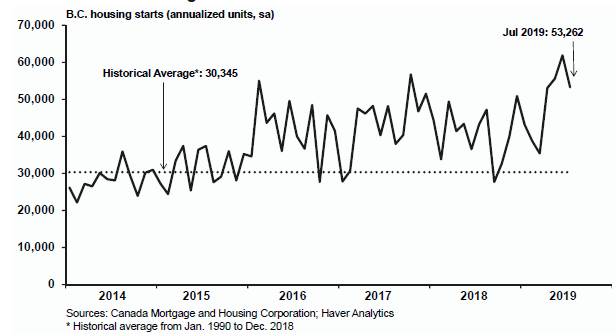
FIRST QUARTERLY REPORT 2019/20
31
ECONOMIC REVIEW AND OUTLOOK
Outlook
The Ministry forecasts real household consumption of goods and services to increase by 1.0 per cent in 2019, following estimated growth of 2.3 per cent in 2018. Looking ahead, real household consumption is expected to increase by 2.7 per cent on average over the forecast period from 2020 to 2023, supported by low interest rates and steady employment growth.
The Ministry expects nominal retail sales to rise by 1.0 per cent in 2019 and then increase to 3.8 per cent growth annually from 2020 to 2023.
The Ministry forecasts the total value of home sales to decrease by 17.2 per cent in 2019 then grow by 4.0 per cent in 2020 before rising to average around 7.0 per cent growth annually in the medium-term. Meanwhile, the average home sale price in B.C. is expected to increase moderately over the forecast horizon.
The Ministry expects B.C. housing starts to total 39,800 units in 2019, higher than forecast in Budget 2019. In 2020, housing starts are forecast to total approximately 31,500 units, followed by an annual average of about 30,700 units over the medium-term.
Business and Government
Real business investment increased by an estimated 5.8 per cent in 2018, led by gains in both residential investment and non-residential investment, along with steady growth in investment in machinery and equipment.
Non-residential construction strengthened through the first half of this year. The total value of non-residential building permits rose by 47.5 per cent year-to-date to June 2019 compared to the same period of 2018. Significant growth was observed in permit issuance for institutional and governmental building (+75.6 per cent) and commercial building (+47.9 per cent) relative to the first half of 2018. The value of permit issuance for industrial building (+12.4 per cent) also advanced on a year-to-date basis.
The Ministry estimates that real government investment increased by 6.9 per cent in 2018, while expenditure on goods and services by all levels of government rose by 4.1 per cent in 2018.
Outlook
Real business investment is projected to grow by 10.2 per cent in 2019, with gains expected in the residential, non-residential, and machinery and equipment segments. Looking further ahead, real business investment is forecast to grow by 4.7 per cent in 2020 and average approximately 3.1 per cent growth annually in the medium-term.
Real expenditure on goods and services by all levels of government is forecast to increase by 2.1 per cent in 2019 and by 0.1 per cent in 2020 before averaging around 1.4 per cent growth annually in the medium-term.
Following estimated growth of 3.5 per cent in 2018, the Ministry expects the net operating surplus of corporations (an approximation of corporate profits) to decrease by 1.9 per cent in 2019, largely reflecting slower growth in exports and retail sales. In 2020, the net operating surplus of corporations is forecast to increase by 1.6 per cent and to average 3.1 per cent growth annually in the 2021 to 2023 period.
FIRST QUARTERLY REPORT 2019/20
32
ECONOMIC REVIEW AND OUTLOOK
External Trade and Commodity Markets
During the January to June period of 2019, the value of B.C. merchandise exports decreased by 2.2 per cent compared to the same period of 2018. On a year-to-date basis, significant declines were observed in exports of metal and non-metallic mineral products (-19.7 per cent) and forestry products and building and packaging materials (-13.0 per cent), reflecting a combination of weaker global demand, lower commodity prices and supply constraints in the forestry sector. Meanwhile, increased exports of consumer goods (+11.5 per cent); farm, fishing and intermediate food products (+7.9 per cent); and energy products (+6.5 per cent) offset some of the weakness in exports during first half of 2019.
Chart 2.7 B.C. Exports
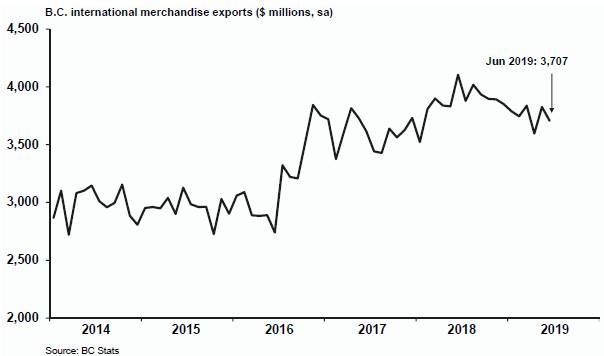
During the January to June period of 2019, merchandise exports to the U.S. decreased by 1.6 per cent and exports to non-U.S. destinations declined by 2.8 per cent. In both cases, declines were largely due to decreases in exports of forestry products and building and packaging materials and metals and non-metallic mineral products compared to the first six months of 2018.
B.C.’s manufacturing shipments decreased by 0.1 per cent year-to-date to June 2019 compared to the same period of 2018, as declines in shipments of wood products (-20.3 per cent), primary metals (-10.6 per cent) and paper products (-7.2 per cent) offset solid gains in shipments of fabricated metal products (+24.8 per cent), food products (+7.4 per cent) and machinery (+7.1 per cent).
So far in 2019, global trade policy concerns and slower global economic activity have weighed on many key commodity prices. Most notably, the price of Western spruce-pine-fir (SPF) 2x4 lumber averaged $367 US/000 board feet during the January to July period of 2019, down by 35.4 per cent from the same period of last year. Meanwhile, the price of pulp averaged $1,050 US/tonne, down by 9.1 per cent compared to the first seven months of 2018.
FIRST QUARTERLY REPORT 2019/20
33
ECONOMIC REVIEW AND OUTLOOK
Prices for oil and natural gas have been volatile in recent months. Since reaching a high of $66.24 US/barrel in late April 2019, the West Texas Intermediate (WTI) oil price has softened in response to concerns over weaker global demand. During the January to July period of 2019 the WTI daily oil price averaged $57.39 US/barrel, down by 13.5 per cent compared to the same period of 2018. Meanwhile, the plant inlet price of natural gas averaged $0.95 C/GJ year-to-date to June 2019, up by 38.3 per cent from the same period of 2018. However, the price of natural gas has steadily decreased in recent months, falling back to a near-record low of just $0.35 C/GJ in June 2019.
Metal and mineral prices experienced broad-based declines through the first seven months of 2019, as reduced global demand weighed on prices relative to the same period of last year. In particular, prices for copper, lead and zinc recorded significant declines compared to the January to July period of 2018, while silver and metallurgical coal experienced smaller declines. By contrast, prices for molybdenum and gold increased compared to the first seven months of 2018.
Outlook
Following an estimated gain of 2.3 per cent in 2018, real exports of goods and services are forecast to decrease by 1.5 per cent in 2019, given the environment of ongoing trade disputes and weaker global demand observed through the first half of this year. The pace of real export growth is projected to gradually improve to 0.4 per cent growth in 2020 and to average around 1.6 per cent growth annually over the medium-term.
The price of lumber is forecast to average $368 US/000 board feet in 2019 and $373 US/000 board feet in 2020, before easing to average $350 US/000 board feet in 2021 and beyond. The plant inlet price for natural gas is expected to average $0.39 C/GJ in 2019/20, $0.62 C/GJ in 2020/21, and $0.81 C/GJ in 2021/22. The outlook is subject to considerable uncertainty, as commodity prices can be volatile.
Demographics
B.C.’s population on April 1, 2019 was 5.03 million people, up 1.4 per cent from the same date in 2018. On a net basis, during the January to March period of 2019, the province welcomed 13,903 new residents, an increase of 5.0 per cent compared to the same period of 2018. Over 90 per cent of these new migrants relocated to B.C. from other countries. Meanwhile, net interprovincial migration totalled 1,008 people, partially reversing two consecutive quarters of net outflow of migrants from B.C. to other provinces.
Outlook
The forecast calls for B.C.’s July 1st population to increase by 1.2 per cent in 2019, with steady population growth of 1.2 per cent expected to continue annually over the forecast period.
Total net migration of about 52,600 persons is expected in 2019, with roughly 85 per cent arriving from international sources. Net migration of about 56,000 persons is projected for 2020, before averaging roughly 59,900 persons annually over the 2021 to 2023 period.
FIRST QUARTERLY REPORT 2019/20
34
ECONOMIC REVIEW AND OUTLOOK
Inflation
The annual rate of B.C.’s consumer price inflation continued to track above the national average, reflecting broad-based increases in consumer prices across segments. Year-to-date to July 2019, consumer prices rose by 2.5 per cent, boosted by increases in prices for food items and transportation compared to the same period of 2018, while price declines for gasoline partially offset the overall rise in inflation. The rate of inflation in B.C. has eased recently, largely reflecting lower energy prices, particularly for gasoline.
Chart 2.8 B.C. Inflation
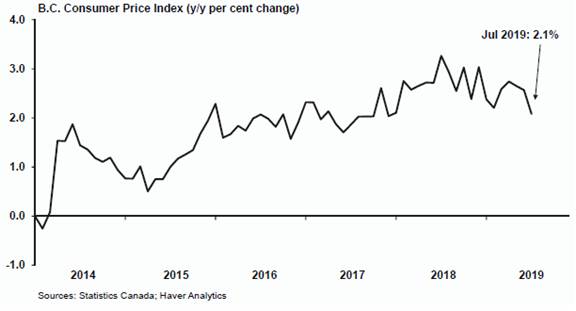
Outlook
Consumer price inflation in B.C. is forecast to be 2.5 per cent in 2019 before slowing to average 2.0 per cent annually from 2020 to 2023. For Canada, the annual rate of inflation is assumed to be 2.1 per cent in both 2019 and 2020. The national inflation rate is forecast to average 2.0 per cent (the Bank of Canada’s inflation target) over the medium-term.
FIRST QUARTERLY REPORT 2019/20
35
ECONOMIC REVIEW AND OUTLOOK
Risks to the Economic Outlook
Downside risks to B.C.’s economic outlook include the following:
· uncertainty regarding global trade policies, escalating global trade tensions including additional tariffs, and broader economic challenges in Asia, Europe and the UK;
· weakening global economic activity, with slowing growth in Asia and other regions, resulting in reduced demand for B.C.’s commodity exports;
· higher volatility in international foreign exchange, stock and bond markets;
· lower commodity prices, particularly for lumber, pulp and coal;
· slower growth in domestic residential investment and household consumption; and
· timing of investment and hiring related to the LNG Canada project.
External Outlook
Escalating trade tensions and rising economic uncertainty are clouding the global economic outlook. Several central banks have recently lowered their key interest rates in anticipation of slower global growth. Meanwhile, additional fiscal stimulus has been implemented in China. Japan’s economy continues to face challenges including persistent low growth and weak foreign demand ahead of a sales tax increase planned for October 2019. Economic growth in the euro zone has slowed, prompting the European Central Bank to consider further stimulus measures.
United States
The U.S. economy grew at an annualized pace of 2.1 per cent in the April to June quarter of 2019 following 3.1 per cent growth in the January to March quarter. The deceleration in quarterly real GDP growth reflects a decline in exports and weaker residential and non-residential investment, which partially offset steady growth in consumer and government spending compared to the previous quarter.
Chart 2.9 U.S. Economic Growth
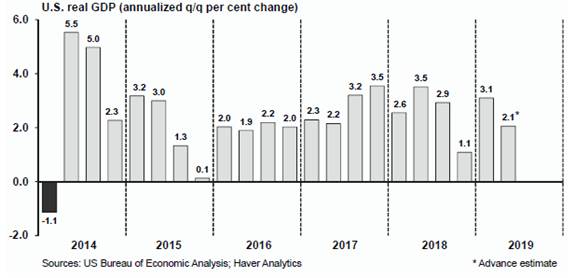
FIRST QUARTERLY REPORT 2019/20
36
ECONOMIC REVIEW AND OUTLOOK
U.S. employment advanced through the first seven months of 2019, with around 165,100 jobs created on average each month. Year-to-date to July 2019, U.S. employment rose by 1.7 per cent compared to the same period of 2018. The U.S. unemployment rate averaged 3.7 per cent year-to-date to July, down 0.3 percentage points compared to the first seven months of last year. Meanwhile, the U.S. labour force participation rate averaged 63.0 per cent year-to-date to July 2019, relatively unchanged compared to the same period of 2018.
The pace of U.S. home building activity has been relatively flat this year. U.S. housing starts averaged 1.23 million annualized units year-to-date to July 2019, down by 3.6 per cent compared to the same period of 2018. Similarly, residential building permits decreased by 4.2 per cent compared to the January to July period of 2018. U.S. home sales activity has been mixed during the first half of this year. New home sales advanced by 2.4 per cent year-to-date to June 2019 and existing home sales declined by 3.2 per cent compared to the first seven months of 2018. Moreover, a divergent trend between median prices for new and existing homes continued during this period. New home prices decreased by 2.4 per cent year-to-date to June 2019 and existing home prices rose by 4.1 per cent compared to the January to July period of 2018.
Chart 2.10 U.S. Housing Starts
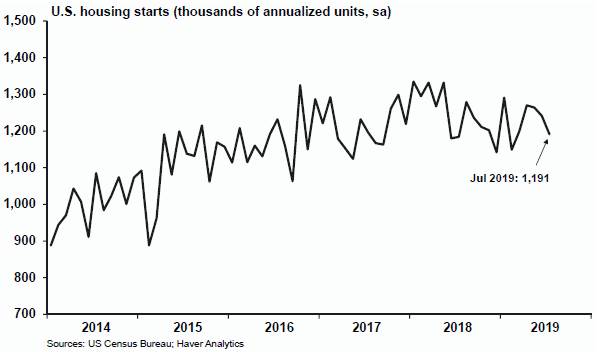
U.S. nominal retail sales increased by 3.1 per cent year-to-date to July 2019 compared to the same period last year. Meanwhile, U.S. consumer confidence remained high, supported by a combination of tight labour market conditions, strong wage growth and low debt servicing costs. The Conference Board’s index of consumer confidence averaged 128.3 year-to-date to July, improving on last year’s average of 127.2 during the first seven months of 2018.
FIRST QUARTERLY REPORT 2019/20
37
ECONOMIC REVIEW AND OUTLOOK
Outlook
Consensus Economics (Consensus) forecasters have lowered their near-term projections for U.S. economic growth. The August 2019 Consensus survey forecasts 2.3 per cent U.S. real GDP growth in 2019, down from previous projections (see Chart 2.11). For 2020, the Consensus forecasts U.S. economic growth to slow to 1.9 per cent.
Chart 2.11 Consensus Outlook for the U.S. in 2019
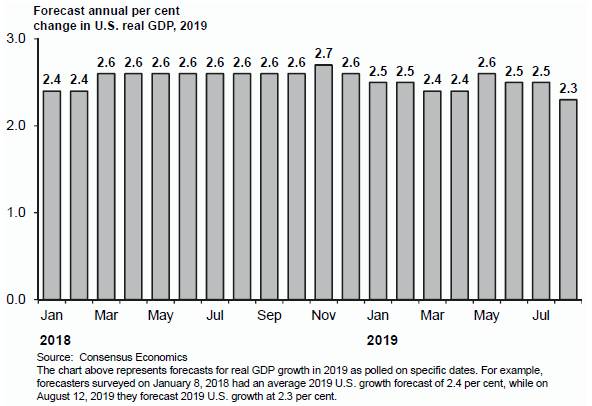
Rising concerns about the potential escalation of restrictive U.S. trade policy continues to cloud the outlook. In recognition of this uncertainty, the Ministry’s assumptions for U.S. growth are lower than the August 2019 Consensus. The Ministry assumes that U.S. real GDP will advance by 2.2 per cent in 2019 before slowing to 1.7 per cent growth in 2020 and beyond.
Table 2.2 U.S. Real GDP Forecast: Consensus versus B.C. Ministry of Finance
| | 2019 | | 2020 | |
| | Per cent change in real GDP | |
B.C. Ministry of Finance | | 2.2 | | 1.7 | |
Consensus Economics (August 2019) | | 2.3 | | 1.9 | |
first quarterly report 2019/20
38
ECONOMIC REVIEW AND OUTLOOK
Canada
Canada’s economy advanced by an annualized 0.4 per cent in the January to March quarter of 2019, following 0.3 per cent annualized growth in the October to December quarter of 2018. In the first three months of 2019, economic growth was driven by increases in household spending and business investment compared to the final quarter of 2018. Meanwhile, a pullback in exports and a continued decline in housing investment partially offset overall growth.
Chart 2.12 Canadian Economic Growth
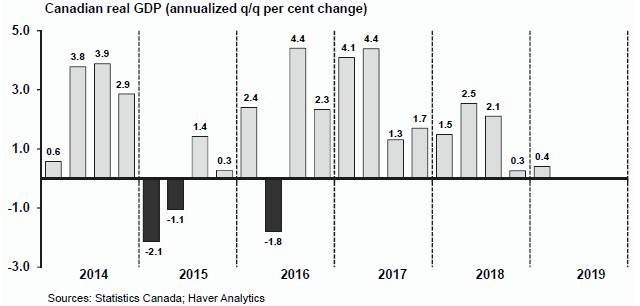
Canadian employment increased by 2.1 per cent year-to-date to July 2019 alongside a persistently low unemployment rate, which averaged 5.7 per cent during the first seven months of this year. Beyond the labour market, domestic economic activity has been somewhat modest so far this year. Canadian housing starts averaged 208,100 annualized units, down by 4.7 per cent compared to the first seven months of 2018. Meanwhile, home sales rose by 2.7 per cent year-to-date to July 2019 and the national average home sale price decreased by 0.5 per cent compared to the same period of 2018. Canadian nominal retail sales rose by 2.1 per cent year-to-date to May 2019, notably slower than the pace observed in recent years.
The value of Canadian merchandise exports increased by 3.3 per cent year-to-date to June 2019, while shipments of Canadian manufactured goods advanced by 2.0 per cent compared to the same period of 2018.
Outlook
The August 2019 Consensus forecasts Canadian real GDP to grow by 1.4 per cent in 2019 and by 1.7 per cent in 2020.
Table 2.3 Canadian Real GDP Forecast: Consensus versus B.C. Ministry of Finance
| | 2019 | | 2020 | |
| | Per cent change in real GDP | |
B.C. Ministry of Finance | | 1.2 | | 1.4 | |
Consensus Economics (August 2019) | | 1.4 | | 1.7 | |
First Quarterly Report 2019/20
39
ECONOMIC REVIEW AND OUTLOOK
The Canadian economic outlook is clouded by escalating global trade tensions and uncertainty around Canada-U.S. trade policy (particularly regarding tariffs and renegotiations related to the softwood lumber dispute and outstanding ratification of the Canada-United States-Mexico Agreement). In addition, Canada’s economy faces risks related to energy sector investment and domestic housing construction. Accordingly, the Ministry’s outlook is lower than the Consensus and assumes that the Canadian economy will expand by 1.2 per cent in 2019, followed by 1.4 per cent growth in 2020 and 1.6 per cent growth annually over the medium-term.
Chart 2.13 Consensus Outlook for Canada in 2019
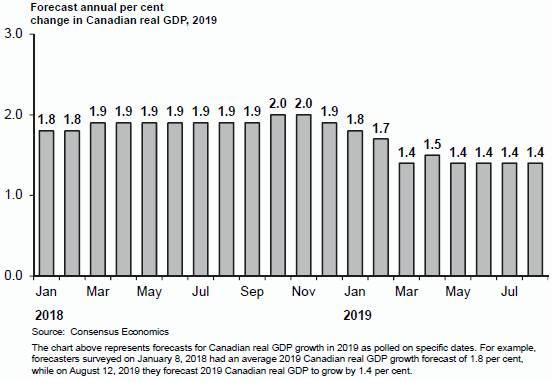
Asia
Despite announcing a variety of fiscal stimulus measures since July 2018, China’s economy slowed through the first half of this year. Year-over-year growth for China real GDP fell to 6.2 per cent in the second quarter of 2019, down from 6.4 per cent growth in the previous quarter. The recent deceleration in economic activity primarily reflects weaker exports and a slowdown in investment. In comparison, consumer spending lent support to overall growth, boosted by a strong labour market, accommodative financial conditions and current fiscal stimulus.
Japan’s economy expanded by an annualized rate of 1.8 per cent in the April to June quarter of 2019, slowing from 2.8 per cent annualized growth in the previous quarter. Consumer spending and business investment contributed to overall growth in the second quarter of 2019, ahead of the consumption tax increase scheduled for October 2019. Meanwhile, Japan’s exports contracted in the second quarter, reflecting ongoing struggles in the country’s trade and manufacturing sector relating to weak foreign demand, particularly from China and other Asian markets. Monetary policy in Japan remains highly accommodative in recognition of persistently low inflation, weak historical growth and ongoing risks to the economic outlook.
First Quarterly Report 2019/20
40
ECONOMIC REVIEW AND OUTLOOK
Outlook
The August 2019 Consensus forecasts China’s real GDP to grow by 6.2 per cent in 2019 and 6.0 per cent in 2020. Rising trade tensions and the implementation of structural reforms may further constrain China’s economic growth going forward. As such, the Ministry assumes that China’s economy will expand by 6.0 per cent in 2019 and by 5.8 per cent annually over the 2020 to 2023 period.
The August 2019 Consensus forecasts Japan real GDP to grow by 0.9 per cent in 2019 and by 0.3 per cent in 2020. In recognition of both foreign and domestic challenges to Japan’s economy, the Ministry assumes that Japan’s real GDP will increase by 0.5 per cent in 2019 and by 0.1 per cent in 2020. Looking beyond, Japan’s economy is forecast to average around 0.6 per cent growth over the medium-term.
Europe
Economic activity in the euro zone remains muted. Euro zone real GDP increased by an annualized 0.8 per cent in the second quarter of 2019, down from 1.8 per cent annualized growth in the previous quarter. Heightened uncertainty continued to weigh on trade and manufacturing activity in the region. Meanwhile, steady employment supported household income and consumer spending.
Monetary policy in the euro zone remains highly accommodative. On July 25, 2019 the European Central Bank reiterated that its key interest rates would likely remain at their present or lower levels at least through the first half of 2020 in order to provide supportive conditions for expansion in the euro area. Meanwhile, measures of underlying inflation in the region remain subdued.
The UK economy contracted by an annualized 0.8 per cent in the April to June quarter of 2019, following annualized growth of 2.0 per cent in the January to March quarter. Weakness in the manufacturing sector largely contributed to the overall contraction in the April to June quarter, following a temporary build up of inventories in anticipation of a March Brexit date. Britain’s exit from the European Union has since been deferred to October 31, 2019. Growing uncertainty about the timing and effect of Brexit continues to weigh on business confidence and cloud the economic outlook.
Outlook
The August 2019 Consensus forecasts the euro zone economy to expand by 1.1 per cent in 2019 and by 1.2 per cent in 2020. The euro zone economy faces significant challenges including elevated sovereign debt and the UK’s exit from the European Union. Therefore, the Ministry assumes that the euro zone’s economy will grow by 0.9 per cent in 2019, by 1.0 per cent in 2020, and average around 1.3 per cent growth annually over the medium-term.
First Quarterly Report 2019/20
41
ECONOMIC REVIEW AND OUTLOOK
Financial Markets
Interest Rates
Growing concern about escalating trade tensions and slowing global growth have prompted many central banks to consider more accommodative monetary policy. On July 31, 2019, the US Federal Reserve lowered the target range for its key interest rate by a quarter of a percentage point to 2.00-2.25 per cent, reflecting the Federal Reserve’s concerns about the global economy alongside muted U.S. inflation pressures. The move marked the first reduction to the target range since December 2008.
Chart 2.14 Interest Rate Forecasts
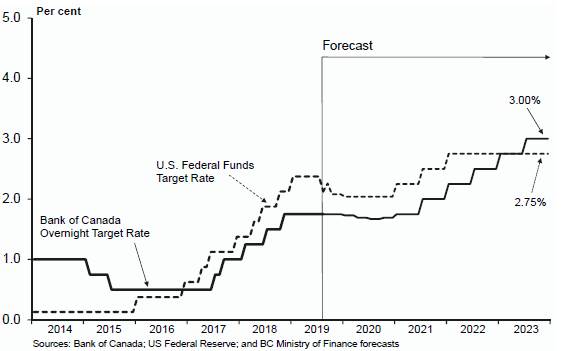
By comparison, on July 10, 2019, the Bank of Canada maintained its target for the overnight interest rate at 1.75 per cent, unchanged since the bank implemented a rate increase in October 2018. However, Canada’s central bank indicated that persistent trade tensions have clouded the global economic outlook, and cautioned that the potential for an escalation of trade conflicts poses a significant downside risk to the Canadian and global economies. Meanwhile, consumer interest rates have edged lower in recent months. For the first time since September 2016, the benchmark posted rate on a five-year fixed mortgage decreased, edging down from 5.34 per cent to 5.19 per cent in July 2019.
Table 2.4 Private Sector Canadian Interest Rate Forecasts
| | 3-month Treasury Bill | | 10-year Government Bond | |
Average annual interest rate (per cent) | | 2019 | | 2020 | | 2019 | | 2020 | |
BMO | | 1.7 | | 1.7 | | 1.6 | | 1.7 | |
CIBC | | 1.7 | | 1.5 | | 1.7 | | 1.7 | |
National Bank | | 1.7 | | 1.8 | | 1.7 | | 2.0 | |
RBC | | 1.7 | | 1.4 | | 1.7 | | 1.7 | |
Scotiabank | | 1.7 | | 1.7 | | 1.6 | | 1.6 | |
TD | | 1.7 | | 1.7 | | 1.6 | | 1.8 | |
Average (as of July 19, 2019) | | 1.7 | | 1.6 | | 1.6 | | 1.7 | |
First Quarterly Report 2019/20
42
ECONOMIC REVIEW AND OUTLOOK
Outlook
The US Federal Reserve may implement further monetary policy easing later this year in an effort to sustain the U.S. economic expansion. Based on the average of six private sector forecasts as of July 19, 2019, the Ministry assumes the U.S. federal funds rate to average 2.3 per cent in 2019 and 2.0 per cent in 2020. By comparison, these analysts are forecasting the Bank of Canada’s overnight target rate to average 1.8 per cent in 2019 and 1.7 per cent in 2020.
The Canadian three-month treasury bill interest rate is expected to average 1.7 per cent in 2019 and 1.6 per cent in 2020, according to the same six private sector forecasters. Meanwhile, the ten-year Government of Canada bond rate is forecast at 1.6 per cent in 2019 and 1.7 per cent in 2020 on average.
Exchange Rate
The value of the Canadian dollar has generally depreciated relative to the US dollar since February 2018. The decline primarily reflects the broad-based appreciation of the U.S. dollar alongside concerns over global trade tensions, despite a modest rise in oil prices in recent months. Overall, the loonie averaged 75.2 US cents during the first seven months of 2019, down from the average of 78.0 US cents observed during the same period of 2018.
Chart 2.15 Private Sector Expectations for the Canadian Dollar
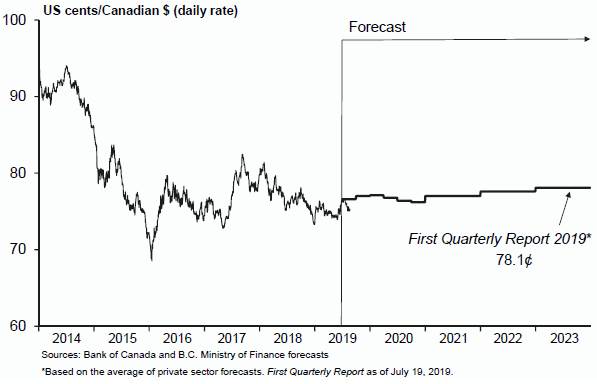
First Quarterly Report 2019/20
43
ECONOMIC REVIEW AND OUTLOOK
Outlook
Based on the average of six private sector forecasts as of July 19, 2019, the Ministry assumes the Canadian dollar will average 75.9 US cents in 2019 and 76.6 US cents in 2020.
Table 2.5 Private Sector Exchange Rate Forecasts
Average annual exchange rate (US cents/Can $) | | 2019 | | 2020 | |
BMO | | 75.8 | | 76.4 | |
CIBC | | 75.7 | | 75.6 | |
National Bank | | 76.0 | | 75.6 | |
RBC | | 76.3 | | 76.3 | |
Scotiabank | | 75.9 | | 78.8 | |
TD | | 75.8 | | 77.0 | |
Average (as of July 19, 2019) | | 75.9 | | 76.6 | |
First Quarterly Report 2019/20
44
ECONOMIC REVIEW AND OUTLOOK
Table 2.6.1 Gross Domestic Product (GDP): British Columbia
| | | | | | Forecast | |
| | 2017 | | 2018 e | | 2019 | | 2020 | | 2021 | | 2022 | | 2023 | |
Gross Domestic Product at Market Prices: | | | | | | | | | | | | | | | |
– Real (chained 2012 $ billions) | | 256.9 | | 262.4 | | 266.8 | | 272.0 | | 277.5 | | 283.1 | | 288.8 | |
(% change) | | 3.8 | | 2.2 | | 1.7 | | 1.9 | | 2.0 | | 2.0 | | 2.0 | |
– Nominal (current prices, $ billions) | | 282.2 | | 295.3 | | 306.7 | | 318.6 | | 331.3 | | 344.6 | | 358.5 | |
(% change) | | 6.9 | | 4.6 | | 3.8 | | 3.9 | | 4.0 | | 4.0 | | 4.0 | |
– GDP price deflator (2012 = 100) | | 109.9 | | 112.5 | | 115.0 | | 117.2 | | 119.4 | | 121.7 | | 124.1 | |
(% change) | | 3.0 | | 2.4 | | 2.1 | | 1.9 | | 1.9 | | 2.0 | | 2.0 | |
Real GDP per person (chained 2012 $) | | 52,188 | | 52,570 | | 52,819 | | 53,214 | | 53,636 | | 54,051 | | 54,473 | |
(% change) | | 2.5 | | 0.7 | | 0.5 | | 0.7 | | 0.8 | | 0.8 | | 0.8 | |
Real GDP per employed person | | | | | | | | | | | | | | | |
(% change) | | 0.1 | | 1.1 | | -0.9 | | 1.0 | | 1.0 | | 1.0 | | 1.0 | |
Unit labour cost1 (% change) | | 2.2 | | 3.7 | | 2.6 | | 2.0 | | 1.9 | | 1.9 | | 1.9 | |
| | | | | | | | | | | | | | | |
Components of Real GDP at Market Prices (chained 2012 $ billions) | |
Household expenditure on goods and services | | 169.0 | | 172.8 | | 174.5 | | 179.2 | | 184.0 | | 188.9 | | 194.1 | |
(% change) | | 4.6 | | 2.3 | | 1.0 | | 2.7 | | 2.7 | | 2.7 | | 2.7 | |
– Goods | | 68.6 | | 68.7 | | 67.9 | | 69.3 | | 70.8 | | 72.4 | | 74.0 | |
(% change) | | 5.4 | | 0.2 | | -1.2 | | 2.0 | | 2.2 | | 2.2 | | 2.2 | |
– Services | | 100.5 | | 104.1 | | 106.6 | | 109.9 | | 113.1 | | 116.5 | | 120.0 | |
(% change) | | 4.1 | | 3.6 | | 2.4 | | 3.1 | | 3.0 | | 3.0 | | 3.0 | |
NPISH2 expenditure on | | | | | | | | | | | | | | | |
goods and services | | 3.9 | | 3.9 | | 3.9 | | 3.9 | | 4.0 | | 4.0 | | 4.0 | |
(% change) | | -2.6 | | 0.0 | | 0.7 | | 0.3 | | 0.6 | | 0.6 | | 0.6 | |
Government expenditure on | | | | | | | | | | | | | | | |
goods and services | | 45.5 | | 47.4 | | 48.4 | | 48.4 | | 49.1 | | 49.8 | | 50.5 | |
(% change) | | 3.0 | | 4.1 | | 2.1 | | 0.1 | | 1.5 | | 1.4 | | 1.4 | |
Investment in fixed capital | | 62.4 | | 66.1 | | 73.7 | | 77.0 | | 79.1 | | 81.0 | | 82.9 | |
(% change) | | 9.2 | | 5.9 | | 11.6 | | 4.5 | | 2.7 | | 2.4 | | 2.4 | |
Final domestic demand | | 280.8 | | 290.3 | | 300.9 | | 309.0 | | 316.6 | | 324.1 | | 332.0 | |
(% change) | | 5.3 | | 3.4 | | 3.7 | | 2.7 | | 2.5 | | 2.4 | | 2.4 | |
Exports of goods and services | | 97.5 | | 99.8 | | 98.3 | | 98.7 | | 100.2 | | 101.8 | | 103.6 | |
(% change) | | 3.4 | | 2.3 | | -1.5 | | 0.4 | | 1.5 | | 1.7 | | 1.7 | |
Imports of goods and services | | 123.1 | | 128.0 | | 132.1 | | 135.4 | | 138.8 | | 142.4 | | 146.2 | |
(% change) | | 8.0 | | 4.0 | | 3.2 | | 2.5 | | 2.5 | | 2.6 | | 2.7 | |
Inventory change | | 1.7 | | 0.5 | | 0.1 | | 0.1 | | 0.0 | | 0.0 | | 0.0 | |
Statistical discrepancy | | -0.2 | | -0.2 | | -0.2 | | -0.2 | | -0.2 | | -0.2 | | -0.2 | |
Real GDP at market prices | | 256.9 | | 262.4 | | 266.8 | | 272.0 | | 277.5 | | 283.1 | | 288.8 | |
(% change) | | 3.8 | | 2.2 | | 1.7 | | 1.9 | | 2.0 | | 2.0 | | 2.0 | |
1 Unit labour cost is the nominal cost of labour incurred to produce one unit of real output.
2 Non-profit institutions serving households.
e B.C. Ministry of Finance estimate.
FIRST QUARTERLY REPORT 2019/20
45
ECONOMIC REVIEW AND OUTLOOK
Table 2.6.2 Selected Nominal Income and Other Indicators: British Columbia
| | | | | | Forecast | |
| | 2017 | | 2018 | | 2019 | | 2020 | | 2021 | | 2022 | | 2023 | |
Compensation of employees1 ($ millions) | | 135,668 | | 143,670 | e | 149,828 | | 155,829 | | 161,978 | | 168,312 | | 174,985 | |
(% change) | | 6.1 | | 5.9 | | 4.3 | | 4.0 | | 3.9 | | 3.9 | | 4.0 | |
Household income ($ millions) | | 245,089 | | 257,110 | e | 267,111 | | 277,276 | | 287,841 | | 298,660 | | 309,865 | |
(% change) | | 6.8 | | 4.9 | | 3.9 | | 3.8 | | 3.8 | | 3.8 | | 3.8 | |
Net operating surplus ($ millions) | | 35,742 | | 36,978 | e | 36,269 | | 36,832 | | 37,862 | | 39,091 | | 40,372 | |
(% change) | | 18.7 | | 3.5 | | -1.9 | | 1.6 | | 2.8 | | 3.2 | | 3.3 | |
Retail sales ($ millions) | | 84,291 | | 85,954 | | 86,775 | | 90,064 | | 93,459 | | 96,987 | | 100,681 | |
(% change) | | 9.3 | | 2.0 | | 1.0 | | 3.8 | | 3.8 | | 3.8 | | 3.8 | |
Housing starts (units) | | 43,664 | | 40,857 | | 39,800 | | 31,497 | | 31,017 | | 30,520 | | 30,486 | |
(% change) | | 4.4 | | -6.4 | | -2.6 | | -20.9 | | -1.5 | | -1.6 | | -0.1 | |
Residential sales ($ millions) | | 73,626 | | 55,822 | | 46,230 | | 48,077 | | 50,970 | | 55,096 | | 59,589 | |
(% change) | | -5.1 | | -24.2 | | -17.2 | | 4.0 | | 6.0 | | 8.1 | | 8.2 | |
Consumer price index (2002 = 100) | | 125.0 | | 128.4 | | 131.6 | | 134.2 | | 136.9 | | 139.5 | | 142.3 | |
(% change) | | 2.1 | | 2.7 | | 2.5 | | 2.0 | | 2.0 | | 2.0 | | 2.0 | |
1 Domestic basis; wages, salaries and employers’ social contributions.
e B.C. Ministry of Finance estimate.
Table 2.6.3 Labour Market Indicators: British Columbia
| | | | | | Forecast | |
| | 2017 | | 2018 | | 2019 | | 2020 | | 2021 | | 2022 | | 2023 | |
Population (thousands at July 1) | | 4,922 | | 4,992 | | 5,050 | | 5,111 | | 5,173 | | 5,237 | | 5,303 | |
(% change) | | 1.3 | | 1.4 | | 1.2 | | 1.2 | | 1.2 | | 1.2 | | 1.2 | |
Net migration (thousands) | | | | | | | | | | | | | | | |
– International1,4 | | 48.6 | | 57.1 | | 44.6 | | 45.9 | | 47.0 | | 46.7 | | 50.1 | |
– Interprovincial4 | | 12.7 | | 3.9 | | 8.0 | | 10.0 | | 12.0 | | 12.0 | | 12.0 | |
– Total | | 61.3 | | 61.0 | | 52.6 | | 56.0 | | 59.0 | | 58.7 | | 62.1 | |
Labour force population2 (thousands) | | 3,980 | | 4,032 | | 4,090 | | 4,143 | | 4,199 | | 4,256 | | 4,315 | |
(% change) | | 1.2 | | 1.3 | | 1.4 | | 1.3 | | 1.3 | | 1.4 | | 1.4 | |
Labour force (thousands) | | 2,601 | | 2,617 | | 2,686 | | 2,720 | | 2,754 | | 2,783 | | 2,811 | |
(% change) | | 2.7 | | 0.6 | | 2.7 | | 1.3 | | 1.2 | | 1.1 | | 1.0 | |
Participation rate3 (%) | | 65.3 | | 64.9 | | 65.7 | | 65.7 | | 65.6 | | 65.4 | | 65.1 | |
Employment (thousands) | | 2,467 | | 2,494 | | 2,558 | | 2,583 | | 2,608 | | 2,635 | | 2,661 | |
(% change) | | 3.7 | | 1.1 | | 2.6 | | 1.0 | | 1.0 | | 1.0 | | 1.0 | |
Unemployment rate (%) | | 5.1 | | 4.7 | | 4.8 | | 5.0 | | 5.3 | | 5.3 | | 5.3 | |
1 International migration includes net non-permanent residents and returning emigrants less net temporary residents abroad.
2 The civilian, non-institutionalized population 15 years of age and over.
3 Percentage of the labour force population in the labour force.
4 Components may not sum to total due to rounding.
FIRST QUARTERLY REPORT 2019/20
46
ECONOMIC REVIEW AND OUTLOOK
Table 2.6.4 Major Economic Assumptions
| | | | | | Forecast | |
| | 2017 | | 2018 | | 2019 | | 2020 | | 2021 | | 2022 | | 2023 | |
Real GDP | | | | | | | | | | | | | | | |
Canada (chained 2012 $ billions) | | 2,016 | | 2,054 | | 2,079 | | 2,108 | | 2,142 | | 2,176 | | 2,211 | |
(% change) | | 3.0 | | 1.9 | | 1.2 | | 1.4 | | 1.6 | | 1.6 | | 1.6 | |
U.S. (chained 2012 US$ billions) | | 18,108 | | 18,638 | | 19,048 | | 19,372 | | 19,701 | | 20,036 | | 20,377 | |
(% change) | | 2.4 | | 2.9 | | 2.2 | | 1.7 | | 1.7 | | 1.7 | | 1.7 | |
Japan (chained 2011 Yen trillions) | | 530 | | 534 | | 537 | | 538 | | 540 | | 544 | | 548 | |
(% change) | | 1.9 | | 0.8 | | 0.5 | | 0.1 | | 0.5 | | 0.7 | | 0.7 | |
China (constant 2010 US$ billions) | | 10,131 | | 10,800 | | 11,448 | | 12,112 | | 12,814 | | 13,557 | | 14,344 | |
(% change) | | 6.8 | | 6.6 | | 6.0 | | 5.8 | | 5.8 | | 5.8 | | 5.8 | |
Euro zone 1 (chained 2010 Euro billions) | | 10,377 | | 10,574 | | 10,669 | | 10,776 | | 10,905 | | 11,047 | | 11,191 | |
(% change) | | 2.6 | | 1.9 | | 0.9 | | 1.0 | | 1.2 | | 1.3 | | 1.3 | |
| | | | | | | | | | | | | | | |
Industrial production index (% change) | | | | | | | | | | | | | | | |
U.S. | | 2.3 | | 3.9 | | 1.0 | | 1.1 | | 1.5 | | 1.7 | | 1.7 | |
Japan | | 2.6 | | 1.0 | | -1.0 | | 0.2 | | 0.5 | | 0.7 | | 0.7 | |
China | | 6.5 | | 6.3 | | 5.3 | | 5.0 | | 5.0 | | 5.0 | | 5.0 | |
Euro zone 1 | | 2.9 | | 0.9 | | -0.1 | | 1.0 | | 1.0 | | 1.3 | | 1.3 | |
| | | | | | | | | | | | | | | |
Housing starts (thousands) | | | | | | | | | | | | | | | |
Canada | | 220 | | 213 | | 195 | | 180 | | 180 | | 180 | | 180 | |
(% change) | | 11.0 | | -3.1 | | -8.4 | | -7.7 | | 0.0 | | 0.0 | | 0.0 | |
U.S. | | 1,203 | | 1,250 | | 1,230 | | 1,250 | | 1,280 | | 1,300 | | 1,300 | |
(% change) | | 2.5 | | 3.9 | | -1.6 | | 1.6 | | 2.4 | | 1.6 | | 0.0 | |
Japan | | 965 | | 942 | | 900 | | 870 | | 880 | | 880 | | 880 | |
(% change) | | -0.3 | | -2.3 | | -4.5 | | -3.3 | | 1.1 | | 0.0 | | 0.0 | |
| | | | | | | | | | | | | | | |
Consumer price index | | | | | | | | | | | | | | | |
Canada (2002 = 100) | | 130.4 | | 133.4 | | 136.2 | | 139.1 | | 141.8 | | 144.7 | | 147.6 | |
(% change) | | 1.6 | | 2.3 | | 2.1 | | 2.1 | | 2.0 | | 2.0 | | 2.0 | |
| | | | | | | | | | | | | | | |
Canadian interest rates (%) | | | | | | | | | | | | | | | |
3-month treasury bills | | 0.71 | | 1.40 | | 1.66 | | 1.61 | | 1.88 | | 2.38 | | 2.88 | |
10-year government bonds | | 1.79 | | 2.26 | | 1.64 | | 1.75 | | 2.13 | | 2.69 | | 3.56 | |
| | | | | | | | | | | | | | | |
United States interest rates (%) | | | | | | | | | | | | | | | |
3-month treasury bills | | 0.95 | | 1.97 | | 2.22 | | 1.96 | | 2.15 | | 2.63 | | 2.75 | |
10-year government bonds | | 2.33 | | 2.91 | | 2.30 | | 2.29 | | 2.63 | | 3.19 | | 3.75 | |
| | | | | | | | | | | | | | | |
Exchange rate (US cents / Canadian $) | | 77.0 | | 77.2 | | 75.9 | | 76.6 | | 77.0 | | 77.6 | | 78.1 | |
British Columbia goods and services | | | | | | | | | | | | | | | |
Export price deflator (% change) | | 5.2 | | 3.0 | e | 2.1 | | 2.4 | | 3.0 | | 3.0 | | 3.0 | |
1 Euro zone (19) is Austria, Belgium, Cyprus, Estonia, Finland, France, Germany, Greece, Ireland, Italy, Latvia, Lithuania, Luxembourg, Malta, Netherlands, Portugal, Slovakia, Slovenia and Spain.
e B.C. Ministry of Finance estimate.
FIRST QUARTERLY REPORT 2019/20
47
APPENDIX | FISCAL PLAN UPDATE
Table A1 Material Assumptions — Revenue
| | Budget | | Updated | | | | | | | |
Revenue Source and Assumptions | | Estimate | | Forecast | | Plan | | Plan | | | |
($ millions unless otherwise specified) | | 2019/20 | | 2019/20 | | 2020/21 | | 2021/22 | | 2019/20 Sensitivities | |
Personal income tax * | | 11,055 | | 10,970 | | 11,522 | | 12,038 | | | |
Current calendar year assumptions | | | | | | | | | | | |
Household income growth | | 4.0 | % | 3.9 | % | 3.8 | % | 3.8 | % | +/- 1 percentage point change in 2019 B.C. household income growth equals +/- $100 to $110 million | |
Compensation of employees growth | | 4.3 | % | 4.3 | % | 4.0 | % | 3.9 | % | |
Tax base growth | | 3.9 | % | 3.7 | % | 3.8 | % | 3.6 | % | |
Average tax yield | | 5.74 | % | 5.74 | % | 5.79 | % | 5.84 | % | |
Current-year tax | | 10,603 | | 10,559 | | 11,064 | | 11,569 | | | |
Prior year’s tax assessments | | 485 | | 485 | | 495 | | 505 | | | |
Unapplied taxes | | 100 | | 100 | | 100 | | 100 | | | |
B.C. Tax Reduction | | (165 | ) | (165 | ) | (168 | ) | (171 | ) | | |
Non-refundable B.C. tax credits | | (109 | ) | (105 | ) | (105 | ) | (105 | ) | | |
Policy neutral elasticity ** | | 1.2 | | 1.2 | | 1.2 | | 1.2 | | +/- 0.5 change in 2019 B.C. policy neutral elasticity equals +/- $200 to $210 million | |
Fiscal year assumptions | | | | | | | | | | |
Prior-year adjustment | | — | | (40 | ) | | | | | |
| | | | | | | | | | | |
2018 Tax-year | | 2018 Assumptions | | | | | | | |
Household income growth | | 4.8 | % | 4.9 | % | | | | | +/- 1 percentage point change in 2018 B.C. household or taxable income growth equals +/- $120 to $130 million one-time effect (prior-year adjustment) and could result in an additional +/- $100 to $110 million base change in 2019/20 | |
Tax base growth | | 5.3 | % | 5.0 | % | | | | | |
Average 2018 tax yield | | 5.68 | % | 5.69 | % | | | | | |
2018 tax | | 10,183 | | 10,158 | | | | | | |
2017 & prior year’s tax assessments | | 475 | | 475 | | | | | | |
Unapplied taxes | | 100 | | 100 | | | | | | |
B.C. Tax Reduction | | (161 | ) | (161 | ) | | | | | |
Non-refundable B.C. tax credits | | (110 | ) | (115 | ) | | | | | |
Policy neutral elasticity ** | | 1.2 | | 1.1 | | | | | | | |
* Reflects information as at August 21, 2019
** Per cent growth in current year tax revenue (excluding policy measures) relative to per cent growth in household income (calendar year).
Corporate income tax * | | 4,192 | | 4,492 | | 4,639 | | 5,018 | | | |
Components of revenue (fiscal year) | | | | | | | | | | | |
Instalments — subject to general rate | | 3,927 | | 4,076 | | 4,367 | | 4,743 | | | |
Instalments — subject to small business rate | | 281 | | 262 | | 283 | | 303 | | | |
Non-refundable B.C. tax credits | | (112 | ) | (98 | ) | (108 | ) | (114 | ) | | |
Advance instalments | | 4,096 | | 4,240 | | 4,542 | | 4,932 | | | |
International Business Activity Act refunds | | (10 | ) | (10 | ) | — | | — | | | |
Prior-year settlement payment | | 106 | | 262 | | 97 | | 86 | | | |
Current calendar year assumptions | | | | | | | | | | | |
National tax base ($ billions) | | 322.6 | | 323.4 | | 344.9 | | 371.2 | | +/- 1% change in the 2019 national tax base equals +/- $40 to $50 million | |
B.C. instalment share of national tax base | | 14.5 | % | 14.5 | % | 14.1 | % | 14.6 | % | |
Effective tax rates (general/small business) | | 12.0 / 2.0 | | 12.0 / 2.0 | | 12.0 / 2.0 | | 12.0 / 2.0 | | |
Share of the B.C. tax base subject to small business rate | | 30.2 | % | 28.5 | % | 28.1 | % | 27.8 | % | +/- 1 percentage point change in the 2019 small business share equals -/+ $40 to $50 million | |
B.C. tax base growth (post federal measures) | | -3.9 | % | -5.2 | % | 3.5 | % | 4.6 | % | |
B.C. net operating surplus growth | | 0.3 | % | -1.9 | % | 1.6 | % | 2.8 | % | |
| | | | | | | | | | | |
2018 Tax-year | | 2018 Assumptions | | | | | | | |
B.C. tax base growth (post federal measures) | | 2.8 | % | 4.5 | % | | | | | +/- 1% change in the 2018 B.C. tax base equals +/- $60 to $70 million in 2019/20 | |
Share of the B.C. tax base subject to small business rate | | 31.1 | % | 29.5 | % | | | | | |
B.C. net operating surplus growth | | 4.2 | % | 3.5 | % | | | | | |
Gross 2018 tax | | 4,409 | | 4,565 | | | | | | | |
Prior-year settlement payment | | 106 | | 262 | | | | | | | |
Prior years losses/gains (included in above) | | (50 | ) | (50 | ) | | | | | | |
Non-refundable B.C. tax credits | | (104 | ) | (104 | ) | | | | | | |
* Reflects information as at August 21, 2019
Net cash received from the federal government and cash refunds under the International Business Activity Act are used as the basis for estimating revenue. Due to lags in the federal collection and instalment systems, changes to the B.C. net operating surplus and tax base forecasts affect revenue in the succeeding year. The 2019/20 instalments from the federal government reflects two-third of payments related to the 2019 tax year (paid during Apr-July 2019 and adjusted in Sept and Dec) and one-third of 2020 payments. Instalments for the 2019 (2020) tax year are based on B.C.’s share of the national tax base for the 2017 (2018) tax year and a forecast of the 2019 (2020) national tax base. B.C.’s share of the 2017 national tax base was 14.50%, based on tax assessments as of December 31, 2018. Cash adjustments for any under/over payments from the federal government in respect of 2018 will be received/paid on March 31, 2020.

FIRST QUARTERLY REPORT 2019/20
49
APPENDIX — FISCAL PLAN UPDATE
Table A1 Material Assumptions — Revenue (continued)
| | Budget | | Updated | | | | | | | |
Revenue Source and Assumptions | | Estimate | | Forecast | | Plan | | Plan | | | |
($ millions unless otherwise specified) | | 2019/20 | | 2019/20 | | 2020/21 | | 2021/22 | | 2019/20 Sensitivities | |
Employer health tax | | 1,854 | | 1,854 | | 1,928 | | 2,003 | | +/- 1 percentage point change in the 2019 compensation of employees growth equals up to +/- $20 million | |
Provincial sales tax | | 7,586 | | 7,616 | | 7,920 | | 8,248 | | | |
Provincial sales tax base growth (fiscal year) | | 4.7 | % | 3.5 | % | 3.8 | % | 4.2 | % | +/- 1 percentage point change in the 2019 consumer expenditure growth equals up to +/- $30 million | |
Calendar Year nominal expenditure | | | | | | | | | | |
Consumer expenditures on durable goods | | 2.5 | % | -2.0 | % | 2.4 | % | 2.4 | % | |
Consumer expenditures on goods and services | | 4.9 | % | 3.4 | % | 4.7 | % | 4.6 | % | |
Business investment | | 5.9 | % | 7.2 | % | 4.0 | % | 5.6 | % | |
Other | | 4.5 | % | 2.9 | % | 3.0 | % | 4.1 | % | |
Components of Provincial sales tax revenue | | | | | | | | | | +/- 1 percentage point change in the 2019 business investment growth equals up to +/- $10 million | |
Consolidated Revenue Fund | | 7,574 | | 7,604 | | 7,908 | | 8,236 | | |
BC Transportation Financing Authority | | 12 | | 12 | | 12 | | 12 | | |
Fuel and carbon taxes | | 2,734 | | 2,720 | | 2,975 | | 3,212 | | | |
Calendar Year | | | | | | | | | | | |
Real GDP | | 2.4 | % | 1.7 | % | 1.9 | % | 2.0 | % | | |
Gasoline volumes | | 0.0 | % | 4.6 | % | 0.0 | % | 0.0 | % | | |
Diesel volumes | | 2.0 | % | 0.0 | % | 2.0 | % | 2.0 | % | | |
Natural gas volumes | | 2.4 | % | -6.0 | % | 1.9 | % | 2.0 | % | | |
Carbon tax rates (April 1) | | | | | | | | | | | |
Carbon dioxide equivalent emissions ($/tonne) | | 40 | | 40 | | 45 | | 50 | | | |
Natural gas (cents/gigajoule) | | 198.64 | ¢ | 198.64 | ¢ | 223.47 | ¢ | 248.30 | ¢ | | |
Gasoline (cents/litre) | | 8.89 | ¢ | 8.89 | ¢ | 10.01 | ¢ | 11.12 | ¢ | | |
Light fuel oil (cents/litre) | | 10.23 | ¢ | 10.23 | ¢ | 11.51 | ¢ | 12.78 | ¢ | | |
| | | | | | | | | | | |
Components of revenue | | | | | | | | | | | |
Consolidated Revenue Fund | | 534 | | 537 | | 542 | | 547 | | | |
BC Transit | | 20 | | 20 | | 20 | | 20 | | | |
BC Transportation Financing Authority | | 467 | | 458 | | 461 | | 464 | | | |
| | 1,021 | | 1,015 | | 1,023 | | 1,031 | | | |
Carbon tax revenue | | 1,713 | | 1,705 | | 1,952 | | 2,181 | | | |
Property taxes | | 2,996 | | 2,953 | | 3,126 | | 3,274 | | | |
Calendar Year | | | | | | | | | | | |
Consumer Price Index | | 2.2 | % | 2.5 | % | 2.0 | % | 2.0 | % | +/- 1 percentage point change in 2019 new construction & inflation growth equals up to +/- $20 million in residential property taxation revenue | |
Housing starts (units) | | 34,015 | | 39,800 | | 31,497 | | 31,017 | | |
Home owner grants (fiscal year) | | 836 | | 838 | | 848 | | 861 | | |
Components of revenue | | | | | | | | | | |
Residential (net of home owner grants) | | 1,146 | | 1,158 | | 1,207 | | 1,248 | | |
Speculation and vacancy | | 185 | | 185 | | 185 | | 185 | | | |
Non-residential | | 1,331 | | 1,283 | | 1,390 | | 1,498 | | +/- 1% change in 2019 total business property assessment value equals up to +/- $15 million in non-residential property taxation revenue | |
Rural area | | 124 | | 121 | | 125 | | 129 | | |
Police | | 36 | | 33 | | 34 | | 34 | | |
BC Assessment Authority | | 95 | | 95 | | 96 | | 98 | | |
BC Transit | | 79 | | 78 | | 89 | | 82 | | |
Other taxes | | 3,315 | | 2,850 | | 2,923 | | 3,031 | | | |
Calendar Year | | | | | | | | | | | |
Population | | 1.3 | % | 1.2 | % | 1.2 | % | 1.2 | % | | |
Residential sales value | | 3.0 | % | -17.2 | % | 4.0 | % | 6.0 | % | | |
Real GDP | | 2.4 | % | 1.7 | % | 1.9 | % | 2.0 | % | | |
Nominal GDP | | 4.4 | % | 3.8 | % | 3.9 | % | 4.0 | % | | |
| | | | | | | | | | | |
Components of revenue | | | | | | | | | | +/- 1% change to 2019 residential sales value equals +/- $20 million in property transfer revenue, depending on property values | |
Property transfer | | 1,910 | | 1,435 | | 1,498 | | 1,596 | | |
Additional Property Transfer Tax (included in above)* | | 190 | | 100 | | 104 | | 111 | | |
Tobacco | | 780 | | 770 | | 770 | | 770 | | |
Insurance premium | | 625 | | 645 | | 655 | | 665 | | |
*Additional tax rate is 20%
FIRST QUARTERLY REPORT 2019/20
50
APPENDIX — FISCAL PLAN UPDATE
Table A1 Material Assumptions — Revenue (continued)
| | Budget | | Updated | | | | | | | |
Revenue Source and Assumptions | | Estimate | | Forecast | | Plan | | Plan | | | |
($ millions unless otherwise specified) | | 2019/20 | | 2019/20 | | 2020/21 | | 2021/22 | | 2019/20 Sensitivities | |
Energy, sales of Crown land tenures, metals, minerals and
other * | | 1,009 | | 964 | | 930 | | 933 | | | |
Natural gas price | | | | | | | | | | +/- $0.25 change in the natural gas price equals +/- $10 to $40 million, including impacts on production volumes and royalty program credits, but excluding any changes from natural gas liquids revenue (e.g. butane, pentanes) Sensitivities can also vary significantly at different price levels +/- 1% change in natural gas volumes equals +/- $2 million in natural gas royalties +/- 1 cent change in the exchange rate equals +/- $1 million in natural gas royalties | |
Plant inlet, $C/gigajoule | | 0.72 | | 0.39 | | 0.62 | | 0.81 | | |
Sumas, $US/MMBtu | | 1.75 | | 1.48 | | 1.67 | | 1.84 | | |
Natural gas production volumes | | | | | | | | | | |
Billions of cubic metres | | 52.7 | | 56.5 | | 58.9 | | 62.6 | | |
Petajoules | | 2,182 | | 2,345 | | 2,446 | | 2,601 | | |
Annual per cent change | | -1.2 | % | 6.6 | % | 4.3 | % | 6.3 | % | |
| | | | | | | | | | |
Oil price ($US/bbl at Cushing, OK) | | 64.50 | | 59.64 | | 63.63 | | 67.01 | | |
| | | | | | | | | | |
Auctioned land base (000 hectares) | | 35 | | 22 | | 25 | | 20 | | |
Average bid price/hectare ($) | | 300 | | 200 | | 350 | | 350 | | |
Cash sales of Crown land tenures | | 11 | | 4 | | 9 | | 7 | | |
Metallurgical coal price ($US/tonne, fob West Coast) | | 158 | | 185 | | 165 | | 160 | | |
Copper price ($US/lb) | | 3.02 | | 2.95 | | 3.11 | | 3.20 | | |
| | | | | | | | | | | |
Annual electricity volumes set by treaty (million mega-watt hours) | | 3.9 | | 3.9 | | 3.8 | | 3.8 | | +/- US$20 change in the average metallurgical coal price equals +/- $50 to $70 million +/- 10% change in the average Mid-Columbia electricity price equals +/- $15 million | |
Mid-Columbia electricity price ($US/mega-watt hour) | | 32.48 | | 31.07 | | 34.00 | | 38.67 | | |
| | | | | | | | | | |
Exchange rate (US¢/C$, calendar year) | | 76.0 | | 75.9 | | 76.6 | | 77.0 | | |
Components of revenue | | | | | | | | | | | |
Bonus bid auctions: | | | | | | | | | | Based on a recommendation from the Auditor General to be consistent with generally accepted accounting principles, bonus bid revenue recognition reflects ten-year deferral of cash receipts from the sale of Crown land tenures | |
Deferred revenue | | 174 | | 174 | | 114 | | 91 | | |
Current-year cash (one-tenth) | | 1 | | 1 | | 1 | | 1 | | |
Fees and rentals | | 52 | | 52 | | 52 | | 52 | | |
Total bonus bids, fees and rentals | | 227 | | 227 | | 167 | | 144 | | |
Natural gas royalties | | 275 | | 170 | | 247 | | 235 | | |
Petroleum royalties | | 73 | | 48 | | 48 | | 46 | | |
Columbia River Treaty electricity sales | | 147 | | 139 | | 152 | | 174 | | |
Oil and Gas Commission fees and levies | | 70 | | 69 | | 72 | | 74 | | | |
Coal, metals and other minerals revenue: | | | | | | | | | | | |
Coal tenures | | 8 | | 8 | | 8 | | 8 | | | |
Net coal mineral tax | | 153 | | 246 | | 134 | | 131 | | | |
Net metals and other minerals tax | | 12 | | 13 | | 54 | | 73 | | | |
Recoveries relating to revenue sharing payments | | | | | | | | | | | |
to indigenous people | | 28 | | 28 | | 31 | | 31 | | | |
Miscellaneous mining revenue | | 16 | | 16 | | 17 | | 17 | | | |
Total coal, metals and other minerals revenue | | 217 | | 311 | | 244 | | 260 | | | |
| | | | | | | | | | | |
Royalty programs and infrastructure credits | | | | | | | | | | | |
Deep drilling | | (273 | ) | (287 | ) | (251 | ) | (294 | ) | | |
Road, pipeline, Clean Growth Infrastructure Royalty | | | | | | | | | | | |
and other infrastructure programs | | (44 | ) | (42 | ) | (54 | ) | (112 | ) | | |
Total | | (317 | ) | (329 | ) | (305 | ) | (406 | ) | | |
Implicit average natural gas royalty rate | | 17.6 | % | 19.1 | % | 16.4 | % | 11.2 | % | | |
Royalty program (marginal, low productivity and ultra marginal drilling) adjustments reflect reduced royalty rates.
Natural gas royalties incorporate royalty programs and Treasury Board approved infrastructure credits.
* Reflects information as at August 2, 2019.

FIRST QUARTERLY REPORT 2019/20
51
APPENDIX — FISCAL PLAN UPDATE
Table A1 Material Assumptions — Revenue (continued)
| | Budget | | Updated | | | | | | | |
Revenue Source and Assumptions | | Estimate | | Forecast | | Plan | | Plan | | | |
($ millions unless otherwise specified) | | 2019/20 | | 2019/20 | | 2020/21 | | 2021/22 | | 2019/20 Sensitivities | |
Forests * | | 1,155 | | 1,178 | | 1,114 | | 1,063 | | | |
Prices (calendar year average) | | | | | | | | | | +/- US$50 change in SPF price equals +/- $150 to $175 million | |
SPF 2x4 ($US/thousand board feet) | | 380 | | 368 | | 373 | | 350 | | |
Pulp ($US/tonne) | | 1,135 | | 1,015 | | 900 | | 850 | | +/- US$50 change in pulp price equals +/-$5 to $10 million | |
Coastal log ($Cdn/cubic metre); | | | | | | | | | | |
Vancouver Log Market | | 135 | | 136 | | 130 | | 120 | | +/- Cdn$10 change in average log price equals +/-$25 to $35 million | |
| | | | | | | | | | |
Crown harvest volumes (million cubic metres) | | | | | | | | | | |
Interior | | 45.0 | | 40.5 | | 40.2 | | 40.0 | | +/- 10% change in Interior harvest volumes equals +/- $70 to $80 million | |
Coast | | 12.0 | | 11.5 | | 11.8 | | 12.0 | | |
Total | | 57.0 | | 52.0 | | 52.0 | | 52.0 | | |
B.C. Timber Sales (included in above) | | 11.2 | | 10.7 | | 11.2 | | 11.2 | | +/- 10% change in Coastal harvest volumes equals +/- $20 to $30 million | |
| | | | | | | | | | |
Stumpage rates ($Cdn/cubic metre) | | | | | | | | | | |
Total stumpage rates | | 18.25 | | 19.96 | | 19.40 | | 18.45 | | +/- 1 cent change in exchange rate equals +/- $25 to $35 million in stumpage revenue stumpage revenue | |
| | | | | | | | | | |
Components of revenue | | | | | | | | | | |
Tenures | | 695 | | 693 | | 683 | | 653 | | |
Recoveries relating to revenue sharing payments | | | | | | | | | | |
to indigenous people | | (33 | ) | (33 | ) | (33 | ) | (33 | ) | | |
B.C. Timber Sales | | 366 | | 366 | | 347 | | 327 | | The above sensitivities relate to stumpage revenue only. | |
Logging tax | | 50 | | 75 | | 40 | | 40 | | |
Other CRF revenue | | 23 | | 23 | | 23 | | 22 | | | |
Recoveries | | 54 | | 54 | | 54 | | 54 | | | |
* Reflects information as at August 2, 2019 | | | | | | | | | | | |
Other natural resources | | 459 | | 462 | | 456 | | 491 | | | |
Components of revenue | | | | | | | | | | | |
Water rental and licences* | | 388 | | 391 | | 392 | | 434 | | | |
Recoveries | | 48 | | 48 | | 41 | | 34 | | | |
Angling and hunting permits and licences | | 10 | | 10 | | 10 | | 10 | | | |
Recoveries | | 13 | | 13 | | 13 | | 13 | | | |
* Water rentals for power purposes are indexed to Consumer Price Index. | | | | | | | | | | | |
Other revenue | | 9,958 | | 10,142 | | 9,265 | | 9,547 | | | |
Components of revenue | | | | | | | | | | | |
Fees and licences | | | | | | | | | | | |
Medical Services Plan (MSP) premiums | | 1,015 | | 1,015 | | — | | — | | +/- 1 percentage point change in B.C.’s population growth equals +/- $10 million in MSP premium revenue | |
Consolidated Revenue Fund | | 951 | | 951 | | — | | — | | |
MSP recoveries | | 64 | | 64 | | — | | — | | |
Motor vehicle licences and permits | | 574 | | 573 | | 582 | | 593 | | |
International student health fees | | 29 | | 29 | | 70 | | 70 | | | |
Other Consolidated Revenue Fund | | 454 | | 430 | | 432 | | 446 | | | |
Summary consolidation eliminations | | (15 | ) | (14 | ) | (16 | ) | (15 | ) | | |
Other recoveries | | 122 | | 122 | | 116 | | 114 | | | |
Taxpayer-supported Crown corporations | | 139 | | 143 | | 143 | | 144 | | | |
Post-secondary education fees | | 2,329 | | 2,370 | | 2,496 | | 2,577 | | | |
Other healthcare-related fees | | 434 | | 429 | | 434 | | 435 | | | |
School Districts | | 306 | | 306 | | 324 | | 342 | | | |
Investment earnings | | | | | | | | | | | |
Consolidated Revenue Fund | | 105 | | 114 | | 109 | | 116 | | | |
Fiscal agency loans & sinking funds earnings | | 922 | | 913 | | 922 | | 894 | | | |
Summary consolidation eliminations | | (56 | ) | (48 | ) | (51 | ) | (52 | ) | | |
Taxpayer-supported Crown corporations | | 27 | | 31 | | 32 | | 32 | | | |
SUCH sector agencies | | 198 | | 214 | | 214 | | 215 | | | |
Sales of goods and services | | | | | | | | | | | |
SUCH sector agencies | | 873 | | 916 | | 928 | | 948 | | | |
BC Infrastructure Benefits Inc | | 18 | | 2 | | 83 | | 224 | | | |
Other taxpayer-supported Crown corporations | | 236 | | 222 | | 218 | | 223 | | | |
Miscellaneous | | 2,248 | | 2,375 | | 2,229 | | 2,241 | | | |
FIRST QUARTERLY REPORT 2019/20
52
APPENDIX — FISCAL PLAN UPDATE
Table A1 Material Assumptions — Revenue (continued)
| | Budget | | Updated | | | | | | | |
Revenue Source and Assumptions | | Estimate | | Forecast | | Plan | | Plan | | | |
($ millions unless otherwise specified) | | 2019/20 | | 2019/20 | | 2020/21 | | 2021/22 | | 2019/20 Sensitivities | |
Health and social transfers | | 7,404 | | 7,399 | | 7,662 | | 7,933 | | | |
National Cash Transfers | | | | | | | | | | | |
Canada Health Transfer (CHT) | | 40,373 | | 40,373 | | 41,813 | | 43,291 | | | |
Annual growth | | 4.6 | % | 4.6 | % | 3.6 | % | 3.5 | % | | |
Canada Social Transfer (CST) | | 14,586 | | 14,586 | | 15,023 | | 15,474 | | | |
B.C.’s share of national population (June 1) | | 13.47 | % | 13.46 | % | 13.48 | % | 13.50 | % | +/- 0.1 percentage point change in B.C.’s population share equals +/- $55 million | |
| | | | | | | | | | |
B.C. health and social transfers revenue | | | | | | | | | | | |
CHT | | 5,439 | | 5,435 | | 5,637 | | 5,844 | | | |
CST | | 1,965 | | 1,964 | | 2,025 | | 2,089 | | | |
| | | | | | | | | | | |
Other federal contributions | | 2,019 | | 2,009 | | 2,148 | | 2,217 | | | |
Components of revenue | | | | | | | | | | | |
Low Carbon Economy Leadership Fund | | 20 | | 20 | | 16 | | 21 | | | |
B.C.’s share of the federal cannabis excise tax | | 38 | | 12 | | 50 | | 70 | | | |
Disaster Financial Assistance Arrangements | | — | | — | | 69 | | 48 | | | |
Other Consolidated Revenue Fund | | 142 | | 145 | | 147 | | 148 | | | |
Vote Recoveries: | | | | | | | | | | | |
Labour Market Development Agreement | | 321 | | 321 | | 333 | | 332 | | | |
Labour Market and Skills Training Program | | 114 | | 114 | | 120 | | 120 | | | |
Home Care | | 87 | | 87 | | 87 | | 121 | | | |
Mental Health | | 61 | | 61 | | 81 | | 81 | | | |
Low Carbon Economy Leadership Fund | | 15 | | 15 | | 15 | | 28 | | | |
Early Childhood Development and Child Care Services | | 41 | | 41 | | 41 | | 41 | | | |
Child Safety, Family Support, Children in Care and with special needs | | 75 | | 75 | | 75 | | 75 | | | |
Policing and Security | | 5 | | 5 | | 9 | | 8 | | | |
Public Transit | | 136 | | 136 | | 148 | | 174 | | | |
Other recoveries | | 119 | | 119 | | 119 | | 118 | | | |
Taxpayer-supported Crown corporations | | 242 | | 240 | | 221 | | 224 | | | |
Post-secondary institutions | | 491 | | 509 | | 511 | | 502 | | | |
Other SUCH sector agencies | | 112 | | 109 | | 106 | | 106 | | | |
Service delivery agency direct revenue | | 7,461 | | 7,614 | | 7,771 | | 8,050 | | | |
School districts | | 709 | | 709 | | 708 | | 726 | | | |
Post-secondary institutions | | 4,139 | | 4,290 | | 4,387 | | 4,488 | | | |
Health authorities and hospital societies | | 977 | | 1,007 | | 1,001 | | 1,004 | | | |
BC Transportation Financing Authority | | 566 | | 550 | | 565 | | 570 | | | |
Other service delivery agencies | | 1,070 | | 1,058 | | 1,110 | | 1,262 | | | |
Commercial Crown corporation net income | | 3,311 | | 3,285 | | 3,475 | | 3,589 | | | |
BC Hydro | | 712 | | 712 | | 712 | | 712 | | | |
Reservoir water inflows | | 100 | % | 87 | % | 100 | % | 100 | % | +/-1% in hydro generation equals +/-$15 million | |
| | | | | | | | | | |
Mean gas price | | 2.18 | | 2.45 | | 2.19 | | 2.20 | | +/-10% equals +/-$2 million | |
(Sumas, $US/MMbtu — BC Hydro forecast based on NYMEX forward selling prices) | | | | | | | | | | | |
Electricity prices | | 25.88 | | 31.69 | | 31.55 | | 34.22 | | +/-10% change in electricity trade margins equals +/-$15 million | |
(Mid-C, $US/MWh) | | | | | | | | | | |
ICBC | | (50 | ) | (50 | ) | 86 | | 148 | | | |
Vehicle growth | | +1.9 | % | +1.9 | % | +1.9 | % | +1.9 | % | +/-1% equals +/-$64 million | |
Current claims cost percentage change | | +1.5 | % | +1.2 | % | +8.0 | % | +8.7 | % | +/-1% equals -/+$54 million | |
Unpaid claims balance ($ billions) | | 14.5 | | 15.3 | | 15.8 | | 16.4 | | +/-1% equals -/+$143 to $153 million | |
Investment return | | 3.5 | % | 3.5 | % | 2.9 | % | 2.8 | % | +/-1% return equals +/-$172 to $186 million | |
Loss ratio | | 93.7 | % | 93.8 | % | 90.6 | % | 90.0 | % | | |
FIRST QUARTERLY REPORT 2019/20
53
APPENDIX — FISCAL PLAN UPDATE
Table A2 Natural Gas Price Forecasts — 2019/20 to 2021/22
| | | | | | | | Adjusted to fiscal years and | |
| | | | | | | | $C/gigajoule at plant inlet | |
Private sector forecasts (calendar year) | | 2019 | | 2020 | | 2021 | | 2019/20 | | 2020/21 | | 2021/22 | |
GLJ Henry Hub US$/MMBtu (Jul 1, 2019) | | 2.61 | | 2.80 | | 2.95 | | 0.95 | | 1.26 | | 1.42 | |
Sproule Henry Hub US$/MMBtu (Jun 30, 2019) | | 2.75 | | 3.00 | | 3.25 | | 1.11 | | 1.55 | | 1.76 | |
McDaniel Henry Hub US$/MMBtu (Jul 1, 2019) | | 2.63 | | 2.85 | | 3.05 | | 0.99 | | 1.34 | | 1.54 | |
Deloitte Henry Hub US$/Mcf (Jun 30, 2019) | | 2.71 | | 2.90 | | 3.15 | | 0.96 | | 1.29 | | 1.55 | |
GLJ Alberta AECO-C Spot CDN$/MMBtu (Jul 1, 2019) | | 1.60 | | 1.90 | | 2.15 | | 0.44 | | 0.80 | | 1.03 | |
Sproule Alberta AECO-C Spot CDN$/MMBtu (Jun 30, 2019) | | 1.58 | | 1.88 | | 2.50 | | 0.54 | | 0.87 | | 1.40 | |
McDaniel AECO-C Spot C$/MMBtu (Jul 1, 2019) | | 1.60 | | 1.95 | | 2.45 | | 0.57 | | 0.91 | | 1.32 | |
Deloitte AECO-C Spot C$/Mcf (Jun 30, 2019) | | 1.69 | | 1.90 | | 2.20 | | 0.55 | | 0.74 | | 1.02 | |
GLJ Sumas Spot US$/MMBtu (Jul 1, 2019) | | 4.78 | | 2.35 | | 2.50 | | 1.15 | | 1.51 | | 1.67 | |
Sproule Sumas Spot CDN$/MMBtu (Jun 30, 2019) | | 5.58 | | 2.58 | | 3.30 | | 0.61 | | 1.18 | | 1.78 | |
GLJ BC Spot Plant Gate CDN$/MMBtu (Jul 1, 2019) | | 1.14 | | 1.49 | | 1.79 | | 0.29 | | 0.66 | | 0.93 | |
Sproule BC Station 2 CDN$/MMBtu (Jun 30, 2019) | | 0.84 | | 1.38 | | 2.10 | | 0.06 | | 0.51 | | 1.10 | |
McDaniel BC Avg Plant Gate C$MMBtu (Jul 1, 2019) | | 0.88 | | 1.35 | | 1.95 | | 0.29 | | 0.61 | | 1.11 | |
Deloitte BC Station 2 C$MMBtu (Jun 30, 2019) | | 1.03 | | 1.50 | | 1.75 | | 0.37 | | 0.60 | | 0.84 | |
GLJ Midwest Chicago US$/MMBtu (Jul 1, 2019) | | 2.55 | | 2.70 | | 2.85 | | 1.31 | | 1.75 | | 1.91 | |
Sproule Alliance Plant Gate CDN$/MMBtu (Jun 30, 2019) | | 3.55 | | 3.65 | | 3.96 | | 1.96 | | 2.47 | | 2.71 | |
EIA Henry Hub US$/MMBtu (Jul 9, 2019) | | 2.62 | | 2.52 | | | | 0.87 | | | | | |
TD Economics Henry Hub FuturesUS$/MMBtu (Jun 2019) | | 2.67 | | 2.52 | | | | 0.77 | | | | | |
Scotiabank Group Henry Hub US$/MMBtu (Jun 28, 2019) | | 2.90 | | 2.80 | | | | 1.31 | | | | | |
BMO Henry Hub US$/MMBtu (Jun 24, 2019) | | 2.70 | | 2.80 | | | | 1.54 | | | | | |
CIBC World Markets Inc. Henry Hub US$/MMBtu (Jul 2019) | | 2.68 | | 3.08 | | | | 1.10 | | | | | |
InSite Petroleum Consultants Ltd BC Spot C$/Mcf (Jun 30, 2019) | | 0.25 | | 0.70 | | 1.20 | | -0.22 | | -0.07 | | 0.33 | |
NYMEX Forward Market converted to Plant Inlet CDN$/GJ (Jul 11, 2019) | | | | | | | | 0.79 | | 0.97 | | 0.94 | |
Average all minus high/low | | | | | | | | 0.79 | | 1.04 | | 1.36 | |
Average one forecast per consultant minus high/low | | | | | | | | 0.63 | | 0.57 | | 0.96 | |
Natural gas royalty price forecast | | | | | | | | 0.39 | | 0.62 | | 0.81 | |
GLJ: Gilbert Laustsen Jung Petroleum Consultants Ltd US EIA: US Energy Information Administration AECO: Alberta Energy Company
Deloitte/AJM: Deloitte L.L.P acquired Ashton Jenkins Mann Petroleum Consultants McDaniel: McDaniel & Associates Consultants Ltd
Natural Gas Prices
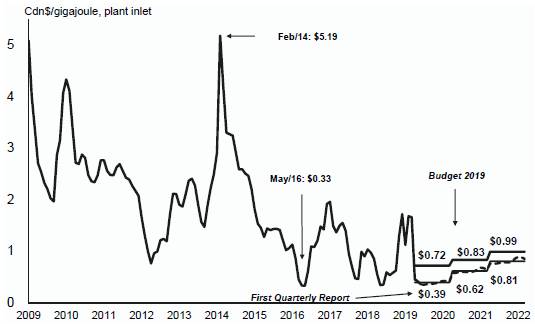
FIRST QUARTERLY REPORT 2019/20
54
APPENDIX — FISCAL PLAN UPDATE
Table A3 Material Assumptions — Expense
| | Budget | | Updated | | | | | | | |
Ministry Programs and Assumptions | | Estimate | | Forecast | | Plan | | Plan | | | |
($ millions unless otherwise specified) | | 2019/20 | | 2019/20 | | 2020/21 | | 2021/22 | | 2019/20 Sensitivities | |
Advanced Education, Skills and Training | | 2,330 | | 2,330 | | 2,341 | | 2,348 | | | |
Student spaces in public institutions | | 202,426 | | 202,426 | | 203,225 | | 203,909 | | Student enrolment may fluctuate due to a number of factors including economic changes and labour market needs. | |
| | |
| |
Attorney General | | 606 | | 606 | | 604 | | 606 | | | |
New cases filed/processed (# for all courts) | | 240,000 | | 240,000 | | 240,000 | | 240,000 | | The number of criminal cases proceeded on by the provincial and federal Crown (including appeals to higher courts in BC), the number of civil and family litigation cases, the number of violation tickets disputed, and the number of municipal bylaw tickets disputed which would go to court for resolution. | |
| | |
|
|
|
Crown Proceeding Act (CPA) | | 25 | | 25 | | 25 | | 25 | | The number of new cases, and the difference between estimated settlements and actual settlements. | |
| | | | | | | | | | |
Children and Family Development | | 2,065 | | 2,065 | | 2,184 | | 2,191 | | | |
Average children-in-care caseload (#) | | 6,397 | | 6,138 | | | | | | The average number of children in care is decreasing as a result of ministry efforts to keep children in family settings where safe and feasible. The average cost per child in care is projected to increase based on the higher cost of contracted residential services and an increasing acuity of need for children in care. A 1% change in either the caseload or average cost will affect expenditures by approximately $2.5 million (excluding Delegated Aboriginal Agencies). The ministry will present refined cost and caseload projections for children in care in 2020/21 and 2021/22 in Budget 2020. | |
Average annual residential cost per child in care ($) | | 63,000 | | 70,200 | | | | | | |
| |
|
|
|
|
|
|
|
|
Education | | 6,569 | | 6,580 | | 6,536 | | 6,569 | | | |
Public School Enrolment (# of FTEs) | | 563,506 | | 563,235 | | 567,085 | | 570,498 | | Updated forecast enrolment figures are based on submissions from school districts of their actual enrolment as at September 30 2018 for the 2018/19 school year and projected enrolment for February and May 2019 for Distributed Learning and Adults. Projections for 2019/20 to 2020/21 are based on the Ministry of Education’s enrolment forecasting model. | |
School age (K—12) | | 540,457 | | 540,822 | | 544,672 | | 548,085 | | |
Continuing Education | | 1,091 | | 1,049 | | 1,049 | | 1,049 | | |
Distributed Learning (online) | | 11,743 | | 11,448 | | 11,448 | | 11,448 | | |
Summer | | 6,865 | | 7,019 | | 7,019 | | 7,019 | | |
Adults | | 3,350 | | 2,670 | | 2,670 | | 2,670 | | |
Newcomer/Refugee | | — | | 228 | | 228 | | 228 | | |
Forests, Lands, Natural Resource Operations and Rural Development | | 823 | | 915 | | 808 | | 819 | | | |
BC Timber Sales | | 197 | | 213 | | 194 | | 201 | | Targets can be impacted by changes to actual inventory costs incurred. There is a lag of approximately 1.5 years between when inventory costs are incurred and when they are expensed. Volume harvested can also impact targets. For example, if volume harvested is less than projected in any year, then capitalized expenses will also be reduced in that year. | |
| | |
| |
| |
| |
| |
| |
| |
Fire Management | | 101 | | 193 | | 101 | | 101 | | Fire management costs have ranged from a low of $47 million in 2006 to a high of $650 million in 2017. | |
| | | | | | | | | | |
Health | | 20,846 | | 20,846 | | 21,518 | | 22,161 | | | |
Pharmacare | | 1,350 | | 1,350 | | 1,389 | | 1,445 | | A 1% change in utilization or prices affects costs by approximately $10 million. | |
| | | | | | | | | | | |
Medical Services Plan (MSP) | | 4,969 | | 4,969 | | 5,085 | | 5,197 | | A 1% increase in volume of services provided by fee-for-service physicians affects costs by approximately $25 million. | |
| | | | | | | | | | | |
Regional Services | | 14,216 | | 14,216 | | 14,733 | | 15,206 | | | |

FIRST QUARTERLY REPORT 2019/20
55
APPENDIX — FISCAL PLAN UPDATE
Table A3 Material Assumptions — Expense (continued)
| | Budget | | Updated | | | | | | | |
Ministry Programs and Assumptions | | Estimate | | Forecast | | Plan | | Plan | | | |
($ millions unless otherwise specified) | | 2019/20 | | 2019/20 | | 2020/21 | | 2021/22 | | 2019/20 Sensitivities | |
Public Safety and Solicitor General | | 800 | | 917 | | 803 | | 803 | | | |
Policing, Victim Services and Corrections | | 700 | | 700 | | 702 | | 702 | | Policing, Victim Services and Corrections costs are sensitive to the volume and severity of criminal activity, the number of inmate beds occupied and the number of offenders under community supervision. | |
Emergency Program Act (EPA) | | 15 | | 132 | | 15 | | 15 | | For authorized expenditures under the EPA, including those for further disasters, and the difference between initial estimates for disaster response and recovery costs and final project costs. In 2019/20, the projected EPA expenditures are based on forecasts as of June 30, 2019. | |
Social Development and Poverty Reduction | | 3,572 | | 3,572 | | 3,628 | | 3,662 | | | |
Temporary Assistance
annual average caseload (#) | | 43,000 | | 43,167 | | 42,000 | | 41,700 | | The expected to work caseload is sensitive to fluctuations in economic and employment trends. Costs are driven by changes to cost per case and caseload. Cost per case fluctuations result from changes in the needed supports required by clients, as well as caseload composition. | |
Disability Assistance
annual average caseload (#) | | 109,700 | | 109,338 | | 112,000 | | 113,000 | | The caseload for persons with disabilities is sensitive to the aging of the population and longer life expectancy for individuals with disabilities. Cost per case fluctuations are driven primarily by earnings exemptions which is dependent on the level of income earned by clients. | |
Adult Community Living: | | | | | | | | | | | |
Developmental Disabilities Programs | | | | | | | | | | | |
Average caseload (#) | | 20,750 | | 20,730 | | 21,590 | | 22,370 | | The adult community living caseload is sensitive to an aging population and to the level of service required. Cost per case fluctuations are driven by the proportion of clients receiving certain types of services at differing costs. For example, residential care services are significantly more costly than day programs. The average cost per client for PSI is projected to decrease to better reflect actual costs for the mix of services being provided. | |
Average cost per client ($) | | 47,200 | | 47,800 | | 46,600 | | 45,700 | | |
Personal Supports Initiative (PSI) | | | | | | | | | | |
Average caseload (#) | | 2,090 | | 2,070 | | 2,330 | | 2,580 | | |
Average cost per client ($) | | 16,200 | | 16,400 | | 15,000 | | 14,300 | | |
| | | | | | | | | | |
| | | | | | | | | | |
| | | | | | | | | | |
| | | | | | | | | | |
| | | | | | | | | | |
FIRST QUARTERLY REPORT 2019/20
56
APPENDIX — FISCAL PLAN UPDATE
Table A3 Material Assumptions — Expense (continued)
| | Budget | | Updated | | | | | | | |
Ministry Programs and Assumptions | | Estimate | | Forecast | | Plan | | Plan | | | |
($ millions unless otherwise specified) | | 2019/20 | | 2019/20 | | 2020/21 | | 2021/22 | | 2019/20 Sensitivities | |
Tax Transfers | | 1,489 | | 1,489 | | 1,718 | | 1,954 | | | |
Individuals | | 554.0 | | 554.0 | | 719.0 | | 887.0 | | | |
Climate Action Tax Credit | | 267.0 | | 267.0 | | 309.0 | | 352.0 | | These tax transfers are now expensed as required under generally accepted accounting principles. | |
Early Childhood Tax Benefit and BC Child Opportunity Benefit * | | 132.3 | | 132.3 | | 255.0 | | 380.0 | | |
| | | | | |
Sales Tax | | 50.0 | | 50.0 | | 50.0 | | 50.0 | | | |
Small Business Venture Capital | | 30.0 | | 30.0 | | 30.0 | | 30.0 | | | |
BC Senior’s Home Renovation | | 2.0 | | 2.0 | | 2.0 | | 2.0 | | Changes in 2018 tax transfers will result in one-time effect (prior-year adjustment) and could result in an additional base change in 2019/20. Production services tax credit is the most volatile of all tax transfers and is influenced by several factors including delay in filing returns and assessment of claims, length of projects and changes in the exchange rates. | |
Other tax transfers to individuals | | 72.6 | | 72.6 | | 72.9 | | 72.9 | | |
Family Bonus Program | | 0.1 | | 0.1 | | 0.1 | | 0.1 | | |
| | | | | | | | | | |
Corporations | | 935.0 | | 935.0 | | 999.0 | | 1,067.0 | | |
| | | | | | | | | | |
Film and Television | | 105.0 | | 105.0 | | 105.0 | | 105.0 | | |
Production Services | | 664.8 | | 664.8 | | 724.8 | | 789.3 | | |
Scientific Research & Experimental Development | | 72.0 | | 72.0 | | 76.0 | | 80.0 | | |
| | | | | |
Interactive Digital Media | | 55.0 | | 55.0 | | 55.0 | | 55.0 | | |
Mining Exploration | | 15.0 | | 15.0 | | 15.0 | | 15.0 | | |
Other tax transfers to corporations | | 23.2 | | 23.2 | | 23.2 | | 22.7 | | |
2018 Tax-year | 2018 forecast | | | | | | | |
Individuals | | 513.0 | | 513.0 | | | | | | | |
Corporations | | 860.0 | | 860.0 | | | | | | | |
Tax Transfers | | 1,373.0 | | 1,373.0 | | | | | | | |
* Effective October 1, 2020 the BC Child Opportunity Benefit will be combined with Early Childhood Tax Benefit into a single benefit.
Management of Public Funds and Debt | | 1,278 | | 1,234 | | 1,249 | | 1,282 | | | |
Interest rates for new provincial borrowing: | | | | | | | | | | Full year impact on MoPD on interest costs of a 1% change in interest rates equals $39.9 million; $100 million increase in debt level equals $2.2 million. | |
Short-term | | 2.35 | % | 1.73 | % | 1.71 | % | 2.07 | % | |
Long-term | | 3.46 | % | 2.38 | % | 2.60 | % | 3.02 | % | |
CDN/US exchange rate (cents) | | 130.6 | | 130.9 | | 130.6 | | 129.6 | | |
Service delivery agency net spending | | 6,739 | | 6,947 | | 6,646 | | 6,602 | | | |
School districts | | 96 | | 96 | | 9 | | 108 | | | |
Post-secondary institutions | | 3,697 | | 3,879 | | 3,822 | | 3,858 | | | |
Health authorities and hospital societies | | 621 | | 658 | | 546 | | 114 | | | |
BC Transportation Financing Authority | | 1,410 | | 1,445 | | 1,498 | | 1,540 | | | |
BC Infrastructure Benefits Inc | | 18 | | 2 | | 83 | | 224 | | | |
Other service delivery agencies | | 897 | | 867 | | 688 | | 758 | | | |
FIRST QUARTERLY REPORT 2019/20
57
APPENDIX — FISCAL PLAN UPDATE
Table A4 Operating Statement — 2012/13 to 2021/22
| | | | | | | | | | | | | | | | Updated | | | | | | Average | |
| | Actual | | Actual | | Actual | | Actual | | Actual | | Actual | | Actual | | Forecast | | Plan | | Plan | | annual | |
($ millions) | | 2012/13 | | 2013/14 | | 2014/15 | | 2015/16 | | 2016/17 | | 2017/18 | | 2018/19 | | 2019/20 | | 2020/21 | | 2021/22 | | change | |
| | | | | | | | | | | | | | | | | | | | | | (per cent) | |
Revenue | | 42,057 | | 43,715 | | 46,099 | | 47,601 | | 51,449 | | 52,020 | | 57,128 | | 58,894 | | 60,083 | | 62,597 | | 4.5 | |
Expense | | (43,204 | ) | (43,401 | ) | (44,439 | ) | (46,791 | ) | (48,683 | ) | (51,706 | ) | (55,593 | ) | (58,215 | ) | (59,492 | ) | (61,724 | ) | 4.0 | |
Surplus (deficit) before unusual items | | (1,147 | ) | 314 | | 1,660 | | 810 | | 2,766 | | 314 | | 1,535 | | 679 | | 591 | | 873 | | | |
Forecast allowance | | — | | — | | — | | — | | — | | — | | — | | (500 | ) | (300 | ) | (300 | ) | | |
Surplus (deficit) | | (1,147 | ) | 314 | | 1,660 | | 810 | | 2,766 | | 314 | | 1,535 | | 179 | | 291 | | 573 | | | |
| | | | | | | | | | | | | | | | | | | | | | | |
Per cent of nominal GDP: 1 | | | | | | | | | | | | | | | | | | | | | | | |
Surplus (deficit) | | -0.5 | | 0.1 | | 0.7 | | 0.3 | | 1.0 | | 0.1 | | 0.5 | | 0.1 | | 0.1 | | 0.2 | | | |
Per cent of revenue: | | | | | | | | | | | | | | | | | | | | | | | |
Surplus (deficit) | | -2.7 | | 0.7 | | 3.6 | | 1.7 | | 5.4 | | 0.6 | | 2.7 | | 0.3 | | 0.5 | | 0.9 | | | |
Per capita ($): 2 | | | | | | | | | | | | | | | | | | | | | | | |
Surplus (deficit) | | (251 | ) | 68 | | 353 | | 170 | | 569 | | 64 | | 308 | | 35 | | 57 | | 111 | | | |
1 Surplus (deficit) as a per cent of nominal GDP is calculated using nominal GDP for the calendar year ending in the fiscal year (e.g. 2019/20 amounts divided by nominal GDP for the 2019 calendar year).
2 Per capita revenue and expense is calculated using July 1 population (e.g. 2019/20 amounts divided by population on July 1, 2019).
FIRST QUARTERLY REPORT 2019/20
58
Appendix — Fiscal Plan Update
Table A5 Revenue by Source — 2012/13 to 2021/22
| | | | | | | | | | | | | | | | Updated | | | | | | Average | |
| | Actual | | Actual | | Actual | | Actual | | Actual | | Actual | | Actual | | Forecast | | Plan | | Plan | | annual | |
($ millions) | | 2012/13 | | 2013/14 | | 2014/15 | | 2015/16 | | 2016/17 | | 2017/18 | | 2018/19 | | 2019/20 | | 2020/21 | | 2021/22 | | change | |
| | | | | | | | | | | | | | | | | | | | | | (per cent) | |
Taxation revenue: | | | | | | | | | | | | | | | | | | | | | | | |
Personal income | | 6,977 | | 6,862 | | 8,076 | | 8,380 | | 9,704 | | 8,923 | | 11,364 | | 10,970 | | 11,522 | | 12,038 | | 6.2 | |
Corporate income | | 2,204 | | 2,427 | | 2,635 | | 2,787 | | 3,003 | | 4,165 | | 5,180 | | 4,492 | | 4,639 | | 5,018 | | 9.6 | |
Employer health | | — | | — | | — | | — | | — | | — | | 464 | | 1,854 | | 1,928 | | 2,003 | | n/a | |
Sales | | 6,068 | | 5,303 | | 5,762 | | 5,990 | | 6,606 | | 7,131 | | 7,369 | | 7,616 | | 7,920 | | 8,248 | | 3.5 | |
Fuel | | 890 | | 917 | | 932 | | 973 | | 969 | | 1,010 | | 1,015 | | 1,015 | | 1,023 | | 1,031 | | 1.6 | |
Carbon | | 1,120 | | 1,222 | | 1,198 | | 1,190 | | 1,220 | | 1,255 | | 1,465 | | 1,705 | | 1,952 | | 2,181 | | 7.7 | |
Tobacco | | 614 | | 724 | | 752 | | 734 | | 737 | | 727 | | 781 | | 770 | | 770 | | 770 | | 2.5 | |
Property | | 1,985 | | 2,080 | | 2,154 | | 2,219 | | 2,279 | | 2,367 | | 2,617 | | 2,953 | | 3,126 | | 3,274 | | 5.7 | |
Property transfer | | 758 | | 937 | | 1,065 | | 1,533 | | 2,026 | | 2,141 | | 1,826 | | 1,435 | | 1,498 | | 1,596 | | 8.6 | |
Corporation capital | | 1 | | — | | (1 | ) | — | | — | | — | | — | | — | | — | | — | | n/a | |
Insurance premium | | 433 | | 458 | | 483 | | 520 | | 549 | | 602 | | 633 | | 645 | | 655 | | 665 | | 4.9 | |
| | 21,050 | | 20,930 | | 23,056 | | 24,326 | | 27,093 | | 28,321 | | 32,714 | | 33,455 | | 35,033 | | 36,824 | | 6.4 | |
Natural resource revenue: | | | | | | | | | | | | | | | | | | | | | | | |
Natural gas royalties | | 169 | | 445 | | 493 | | 139 | | 152 | | 161 | | 199 | | 170 | | 247 | | 235 | | 3.7 | |
Bonus bids, rents on drilling rights and leases | | 868 | | 859 | | 834 | | 765 | | 633 | | 276 | | 279 | | 227 | | 167 | | 144 | | -18.1 | |
Columbia River Treaty | | 89 | | 170 | | 130 | | 116 | | 111 | | 111 | | 202 | | 139 | | 152 | | 174 | | 7.7 | |
Other energy and minerals | | 306 | | 269 | | 267 | | 226 | | 403 | | 619 | | 557 | | 428 | | 364 | | 380 | | 2.4 | |
Forests | | 562 | | 719 | | 754 | | 865 | | 913 | | 1,065 | | 1,406 | | 1,178 | | 1,114 | | 1,063 | | 7.3 | |
Other resources | | 479 | | 493 | | 459 | | 460 | | 499 | | 463 | | 465 | | 462 | | 456 | | 491 | | 0.3 | |
| | 2,473 | | 2,955 | | 2,937 | | 2,571 | | 2,711 | | 2,695 | | 3,108 | | 2,604 | | 2,500 | | 2,487 | | 0.1 | |
Other revenue: | | | | | | | | | | | | | | | | | | | | | | | |
Medical Services Plan premiums | | 2,047 | | 2,158 | | 2,254 | | 2,434 | | 2,558 | | 2,266 | | 1,360 | | 1,015 | | — | | — | | -100.0 | |
Post-secondary education fees | | 1,345 | | 1,445 | | 1,544 | | 1,666 | | 1,828 | | 2,034 | | 2,275 | | 2,370 | | 2,496 | | 2,577 | | 7.5 | |
Other health-care related fees | | 327 | | 333 | | 358 | | 374 | | 404 | | 429 | | 441 | | 429 | | 434 | | 435 | | 3.2 | |
Motor vehicle licences and permits | | 489 | | 504 | | 499 | | 521 | | 529 | | 557 | | 568 | | 573 | | 582 | | 593 | | 2.2 | |
Other fees and licences | | 699 | | 770 | | 770 | | 841 | | 894 | | 963 | | 949 | | 1,016 | | 1,069 | | 1,101 | | 5.2 | |
Investment earnings | | 1,189 | | 1,203 | | 1,171 | | 1,213 | | 1,232 | | 1,101 | | 1,243 | | 1,224 | | 1,226 | | 1,205 | | 0.1 | |
Sales of goods and services | | 942 | | 946 | | 967 | | 1,011 | | 1,131 | | 1,133 | | 1,164 | | 1,140 | | 1,229 | | 1,395 | | 4.5 | |
Miscellaneous | | 1,673 | | 2,256 | | 1,893 | | 2,287 | | 2,377 | | 2,410 | | 2,249 | | 2,375 | | 2,229 | | 2,241 | | 3.3 | |
| | 8,711 | | 9,615 | | 9,456 | | 10,347 | | 10,953 | | 10,893 | | 10,249 | | 10,142 | | 9,265 | | 9,547 | | 1.0 | |
Contributions from the federal government: | | | | | | | | | | | | | | | | | | | | | | | |
Canada Health Transfer | | 3,887 | | 4,280 | | 4,186 | | 4,454 | | 4,744 | | 4,994 | | 5,182 | | 5,435 | | 5,637 | | 5,844 | | 4.6 | |
Canada Social Transfer | | 1,555 | | 1,589 | | 1,641 | | 1,695 | | 1,751 | | 1,854 | | 1,908 | | 1,964 | | 2,025 | | 2,089 | | 3.3 | |
Other cost shared agreements | | 1,605 | | 1,645 | | 1,452 | | 1,498 | | 1,672 | | 2,207 | | 1,962 | | 2,009 | | 2,148 | | 2,217 | | 3.7 | |
| | 7,047 | | 7,514 | | 7,279 | | 7,647 | | 8,167 | | 9,055 | | 9,052 | | 9,408 | | 9,810 | | 10,150 | | 4.1 | |
Commercial Crown corporation net income: | | | | | | | | | | | | | | | | | | | | | | | |
BC Hydro 1 | | 509 | | 549 | | 581 | | 655 | | 684 | | 683 | | (428 | ) | 712 | | 712 | | 712 | | 3.8 | |
Liquor Distribution Branch | | 930 | | 877 | | 935 | | 1,031 | | 1,083 | | 1,119 | | 1,104 | | 1,120 | | 1,155 | | 1,195 | | 2.8 | |
BC Lotteries (net of payments to federal gov’t) | | 1,116 | | 1,165 | | 1,245 | | 1,304 | | 1,329 | | 1,391 | | 1,405 | | 1,393 | | 1,412 | | 1,422 | | 2.7 | |
ICBC | | 231 | | 136 | | 657 | | (293 | ) | (612 | ) | (1,327 | ) | (1,153 | ) | (50 | ) | 86 | | 148 | | -4.8 | |
BC Railway Company | | 6 | | 13 | | 5 | | 6 | | 7 | | 53 | | 8 | | 10 | | 9 | | 9 | | 4.6 | |
Transportation Investment Corporation | | (60 | ) | (88 | ) | (89 | ) | (80 | ) | (81 | ) | (29 | ) | — | | — | | — | | — | | n/a | |
Other | | 44 | | 49 | | 37 | | 87 | | 115 | | 116 | | 119 | | 100 | | 101 | | 103 | | 9.9 | |
Accounting adjustment 1 | | — | | — | | — | | — | | — | | (950 | ) | 950 | | — | | — | | — | | n/a | |
| | 2,776 | | 2,701 | | 3,371 | | 2,710 | | 2,525 | | 1,056 | | 2,005 | | 3,285 | | 3,475 | | 3,589 | | 2.9 | |
Total revenue | | 42,057 | | 43,715 | | 46,099 | | 47,601 | | 51,449 | | 52,020 | | 57,128 | | 58,894 | | 60,083 | | 62,597 | | 4.5 | |
1 BC Hydro’s loss for 2018/19 includes a write-off of a regulatory account. At the summary level, the Province recognized a $950 million adjustment in fiscal 2017/18 with respect to BC Hydro’s deferred regulatory accounts.
First Quarterly Report 2019/20
59
Appendix — Fiscal Plan Update
Table A6 Revenue by Source Supplementary Information — 2012/13 to 2021/22 1
| | | | | | | | | | | | | | | | Updated | | | | | | Average | |
| | Actual | | Actual | | Actual | | Actual | | Actual | | Actual | | Actual | | Forecast | | Plan | | Plan | | annual | |
| | 2012/13 | | 2013/14 | | 2014/15 | | 2015/16 | | 2016/17 | | 2017/18 | | 2018/19 | | 2019/20 | | 2020/21 | | 2021/22 | | change | |
| | | | | | | | | | | | | | | | | | | | | | (per cent) | |
Per cent of nominal GDP: 2 | | | | | | | | | | | | | | | | | | | | | | | |
Taxation and Medical Services Plan premiums | | 10.4 | | 10.1 | | 10.5 | | 10.7 | | 11.2 | | 10.8 | | 11.5 | | 11.2 | | 11.0 | | 11.1 | | 0.7 | |
Taxation | | 9.5 | | 9.1 | | 9.5 | | 9.8 | | 10.3 | | 10.0 | | 11.1 | | 10.9 | | 11.0 | | 11.1 | | 1.8 | |
Medical Services Plan premiums | | 0.9 | | 0.9 | | 0.9 | | 1.0 | | 1.0 | | 0.8 | | 0.5 | | 0.3 | | 0 | | 0 | | -100.0 | |
Natural resources | | 1.1 | | 1.3 | | 1.2 | | 1.0 | | 1.0 | | 1.0 | | 1.1 | | 0.8 | | 0.8 | | 0.8 | | -4.3 | |
Other | | 3.9 | | 4.2 | | 3.9 | | 4.2 | | 4.1 | | 3.9 | | 3.5 | | 3.3 | | 2.9 | | 2.9 | | -3.4 | |
Other excluding Merdical Services Plan premiums | | 3.0 | | 3.3 | | 3.0 | | 3.2 | | 3.2 | | 3.1 | | 3.0 | | 3.0 | | 2.9 | | 2.9 | | -0.5 | |
Contributions from the federal government | | 3.2 | | 3.3 | | 3.0 | | 3.1 | | 3.1 | | 3.2 | | 3.1 | | 3.1 | | 3.1 | | 3.1 | | -0.4 | |
Commercial Crown corporation net income | | 1.3 | | 1.2 | | 1.4 | | 1.1 | | 1.0 | | 0.4 | | 0.7 | | 1.1 | | 1.1 | | 1.1 | | -1.6 | |
Total revenue | | 19.0 | | 19.1 | | 19.0 | | 19.1 | | 19.5 | | 18.4 | | 19.3 | | 19.2 | | 18.9 | | 18.9 | | -0.1 | |
Growth rates (per cent): | | | | | | | | | | | | | | | | | | | | | | | |
Taxation and Medical Services Plan premiums | | 4.7 | | 0.0 | | 9.6 | | 5.7 | | 10.8 | | 3.2 | | 11.4 | | 1.2 | | 1.6 | | 5.1 | | n/a | |
Taxation | | 4.5 | | -0.6 | | 10.2 | | 5.5 | | 11.4 | | 4.5 | | 15.5 | | 2.3 | | 4.7 | | 5.1 | | n/a | |
Medical Services Plan premiums | | 6.7 | | 5.4 | | 4.4 | | 8.0 | | 5.1 | | -11.4 | | -40.0 | | -25.4 | | -100.0 | | n/a | | n/a | |
Natural resources | | -12.1 | | 19.5 | | -0.6 | | -12.5 | | 5.4 | | -0.6 | | 15.3 | | -16.2 | | -4.0 | | -0.5 | | n/a | |
Other | | 3.3 | | 10.4 | | -1.7 | | 9.4 | | 5.9 | | -0.5 | | -5.9 | | -1.0 | | -8.6 | | 3.0 | | n/a | |
Other excluding Merdical Services Plan premiums | | 2.3 | | 11.9 | | -3.4 | | 9.9 | | 6.1 | | 2.8 | | 3.0 | | 2.7 | | 1.5 | | 3.0 | | n/a | |
Contributions from the federal government | | -8.8 | | 6.6 | | -3.1 | | 5.1 | | 6.8 | | 10.9 | | 0.0 | | 3.9 | | 4.3 | | 3.5 | | n/a | |
Commercial Crown corporation net income | | 3.2 | | -2.7 | | 24.8 | | -19.6 | | -6.8 | | -58.2 | | 89.9 | | 63.8 | | 5.8 | | 3.3 | | n/a | |
Total revenue | | 0.6 | | 3.9 | | 5.5 | | 3.3 | | 8.1 | | 1.1 | | 9.8 | | 3.1 | | 2.0 | | 4.2 | | n/a | |
Per capita ($): 3 | | | | | | | | | | | | | | | | | | | | | | | |
Taxation and Medical Services Plan premiums | | 5,058 | | 4,987 | | 5,377 | | 5,603 | | 6,102 | | 6,214 | | 6,826 | | 6,825 | | 6,855 | | 7,118 | | 3.9 | |
Taxation | | 4,609 | | 4,520 | | 4,898 | | 5,093 | | 5,576 | | 5,754 | | 6,554 | | 6,624 | | 6,855 | | 7,118 | | 4.9 | |
Medical Services Plan premiums | | 448 | | 466 | | 479 | | 510 | | 526 | | 460 | | 272 | | 201 | | 0 | | 0 | | -100.0 | |
Natural resources | | 542 | | 638 | | 624 | | 538 | | 558 | | 548 | | 623 | | 516 | | 489 | | 481 | | -1.3 | |
Other | | 1,907 | | 2,077 | | 2,009 | | 2,166 | | 2,254 | | 2,213 | | 2,053 | | 2,008 | | 1,813 | | 1,845 | | -0.4 | |
Other excluding Merdical Services Plan premiums | | 1,459 | | 1,611 | | 1,530 | | 1,657 | | 1,728 | | 1,753 | | 1,781 | | 1,807 | | 1,813 | | 1,845 | | 2.6 | |
Contributions from the federal government | | 1,543 | | 1,623 | | 1,546 | | 1,601 | | 1,681 | | 1,840 | | 1,813 | | 1,863 | | 1,920 | | 1,962 | | 2.7 | |
Commercial Crown corporation net income | | 608 | | 583 | | 716 | | 567 | | 520 | | 215 | | 402 | | 650 | | 680 | | 694 | | 1.5 | |
Total revenue | | 9,209 | | 9,442 | | 9,793 | | 9,966 | | 10,588 | | 10,569 | | 11,445 | | 11,661 | | 11,757 | | 12,100 | | 3.1 | |
| | | | | | | | | | | | | | | | | | | | | | | |
Real Per Capita Revenue (2018 $) 4 | | 10,038 | | 10,300 | | 10,576 | | 10,646 | | 11,107 | | 10,856 | | 11,445 | | 11,381 | | 11,245 | | 11,351 | | 1.4 | |
Growth rate (per cent) | | -1.9 | | 2.6 | | 2.7 | | 0.7 | | 4.3 | | -2.3 | | 5.4 | | -0.6 | | -1.2 | | 0.9 | | 0.9 | |
1 | Numbers may not add due to rounding. |
2 | Revenue as a per cent of GDP is calculated using nominal GDP for the calendar year ending in the fiscal year (e.g. 2019/20 revenue divided by nominal GDP for the 2019 calendar year). |
3 | Per capita revenue is calculated using July 1 population (e.g. 2019/20 revenue divided by population on July 1, 2019). |
4 | Revenue is converted to real (inflation-adjusted) terms using the consumer price index (CPI) for the corresponding calendar year (e.g. 2019 CPI for 2019/20 revenue). |
First Quarterly Report 2019/20
60
Appendix — Fiscal Plan Update
Table A7 Expense by Function — 2012/13 to 2021/22 1,2
| | | | | | | | | | | | | | | | Updated | | | | | | Average | |
| | Actual | | Actual | | Actual | | Actual | | Actual | | Actual | | Actual | | Forecast | | Plan | | Plan | | annual | |
($ millions) | | 2012/13 | | 2013/14 | | 2014/15 | | 2015/16 | | 2016/17 | | 2017/18 | | 2018/19 | | 2019/20 | | 2020/21 | | 2021/22 | | change | |
| | | | | | | | | | | | | | | | | | | | | | (per cent) | |
Function: | | | | | | | | | | | | | | | | | | | | | | | |
Health: | | | | | | | | | | | | | | | | | | | | | | | |
Medical Services Plan | | 3,906 | | 4,114 | | 4,136 | | 4,345 | | 4,573 | | 4,623 | | 4,861 | | 5,092 | | 5,117 | | 5,229 | | 3.3 | |
Pharmacare | | 1,122 | | 1,130 | | 1,120 | | 1,335 | | 1,284 | | 1,400 | | 1,494 | | 1,471 | | 1,510 | | 1,566 | | 3.8 | |
Regional services | | 11,784 | | 11,960 | | 12,410 | | 12,811 | | 13,079 | | 14,094 | | 14,996 | | 15,543 | | 16,089 | | 16,589 | | 3.9 | |
Other healthcare expenses | | 690 | | 658 | | 704 | | 712 | | 753 | | 810 | | 800 | | 887 | | 894 | | 894 | | 2.9 | |
| | 17,502 | | 17,862 | | 18,370 | | 19,203 | | 19,689 | | 20,927 | | 22,151 | | 22,993 | | 23,610 | | 24,278 | | 3.7 | |
Education: | | | | | | | | | | | | | | | | | | | | | | | |
Elementary and secondary | | 6,002 | | 6,133 | | 6,064 | | 6,303 | | 6,422 | | 6,917 | | 7,253 | | 7,478 | | 7,457 | | 7,481 | | 2.5 | |
Post-secondary | | 5,103 | | 5,284 | | 5,349 | | 5,502 | | 5,672 | | 5,998 | | 6,390 | | 6,798 | | 6,935 | | 7,085 | | 3.7 | |
Other education expenses | | 423 | | 410 | | 414 | | 407 | | 374 | | 176 | | 442 | | 430 | | 441 | | 439 | | 0.4 | |
| | 11,528 | | 11,827 | | 11,827 | | 12,212 | | 12,468 | | 13,091 | | 14,085 | | 14,706 | | 14,833 | | 15,005 | | 3.0 | |
Social services: | | | | | | | | | | | | | | | | | | | | | | | |
Social assistance | | 1,552 | | 1,572 | | 1,589 | | 1,641 | | 1,692 | | 1,988 | | 2,202 | | 2,320 | | 2,361 | | 2,376 | | 4.8 | |
Child welfare | | 1,098 | | 1,097 | | 1,129 | | 1,301 | | 1,358 | | 1,507 | | 1,652 | | 1,967 | | 1,947 | | 1,954 | | 6.6 | |
Low income tax credit transfers | | 534 | | 279 | | 248 | | 247 | | 244 | | 239 | | 414 | | 317 | | 614 | | 782 | | 4.3 | |
Community living and other services | | 806 | | 857 | | 881 | | 917 | | 949 | | 1,003 | | 1,075 | | 1,163 | | 1,178 | | 1,198 | | 4.5 | |
| | 3,990 | | 3,805 | | 3,847 | | 4,106 | | 4,243 | | 4,737 | | 5,343 | | 5,767 | | 6,100 | | 6,310 | | 5.2 | |
Protection of persons and property | | 1,539 | | 1,520 | | 1,451 | | 1,572 | | 1,655 | | 1,930 | | 2,004 | | 1,818 | | 1,711 | | 1,715 | | 1.2 | |
Transportation | | 1,555 | | 1,580 | | 1,608 | | 1,670 | | 1,784 | | 1,931 | | 2,021 | | 2,334 | | 2,342 | | 2,336 | | 4.6 | |
Natural resources & economic development | | 2,092 | | 1,755 | | 2,191 | | 2,477 | | 2,465 | | 3,374 | | 3,825 | | 3,325 | | 3,055 | | 3,376 | | 5.5 | |
Other | | 1,346 | | 1,184 | | 1,288 | | 1,264 | | 2,260 | | 1,553 | | 1,810 | | 2,073 | | 2,045 | | 2,170 | | 5.4 | |
Contingencies | | — | | — | | — | | — | | — | | — | | — | | 450 | | 400 | | 400 | | n/a | |
Contingencies - Sustainable Services Negotiating Mandate | | — | | — | | — | | — | | — | | — | | — | | 523 | | 1,183 | | 1,827 | | n/a | |
General government | | 1,262 | | 1,386 | | 1,359 | | 1,501 | | 1,532 | | 1,540 | | 1,670 | | 1,506 | | 1,439 | | 1,437 | | 1.5 | |
Debt servicing | | 2,390 | | 2,482 | | 2,498 | | 2,786 | | 2,587 | | 2,623 | | 2,684 | | 2,720 | | 2,774 | | 2,870 | | 2.1 | |
Total expense | | 43,204 | | 43,401 | | 44,439 | | 46,791 | | 48,683 | | 51,706 | | 55,593 | | 58,215 | | 59,492 | | 61,724 | | | |
Per cent of operating expense: | | | | | | | | | | | | | | | | | | | | | | | |
Health | | 40.5 | | 41.2 | | 41.3 | | 41.0 | | 40.4 | | 40.5 | | 39.8 | | 39.5 | | 39.7 | | 39.3 | | -0.3 | |
Education | | 26.7 | | 27.3 | | 26.6 | | 26.1 | | 25.6 | | 25.3 | | 25.3 | | 25.3 | | 24.9 | | 24.3 | | -1.0 | |
Social services and housing | | 9.2 | | 8.8 | | 8.7 | | 8.8 | | 8.7 | | 9.2 | | 9.6 | | 9.9 | | 10.3 | | 10.2 | | 1.1 | |
Protection of persons and property | | 3.6 | | 3.5 | | 3.3 | | 3.4 | | 3.4 | | 3.7 | | 3.6 | | 3.1 | | 2.9 | | 2.8 | | -2.7 | |
Transportation | | 3.6 | | 3.6 | | 3.6 | | 3.6 | | 3.7 | | 3.7 | | 3.6 | | 4.0 | | 3.9 | | 3.8 | | 0.6 | |
Natural resources & economic development | | 4.8 | | 4.0 | | 4.9 | | 5.3 | | 5.1 | | 6.5 | | 6.9 | | 5.7 | | 5.1 | | 5.5 | | 1.4 | |
Other | | 3.1 | | 2.7 | | 2.9 | | 2.7 | | 4.6 | | 3.0 | | 3.3 | | 3.6 | | 3.4 | | 3.5 | | 1.4 | |
Contingencies | | — | | — | | — | | — | | — | | — | | — | | 0.8 | | 0.7 | | 0.6 | | n/a | |
Contingencies - Sustainable Services Negotiating Mandate | | — | | — | | — | | — | | — | | — | | — | | 0.9 | | 2.0 | | 3.0 | | n/a | |
General government | | 2.9 | | 3.2 | | 3.1 | | 3.2 | | 3.1 | | 3.0 | | 3.0 | | 2.6 | | 2.4 | | 2.3 | | -2.5 | |
Debt servicing | | 5.5 | | 5.7 | | 5.6 | | 6.0 | | 5.3 | | 5.1 | | 4.8 | | 4.7 | | 4.7 | | 4.6 | | -1.9 | |
| | 100.0 | | 100.0 | | 100.0 | | 100.0 | | 100.0 | | 100.0 | | 100.0 | | 100.0 | | 100.0 | | 100.0 | | | |
1 Figures reflect government accounting policies used in the 2018/19 Public Accounts audited financial statements.
2 Numbers may not add due to rounding.
First Quarterly Report 2019/20
61
Appendix — Fiscal Plan Update
Table A8 Expense by Function Supplementary Information — 2012/13 to 2021/22 1
| | | | | | | | | | | | | | | | Updated | | | | | | Average | |
| | Actual | | Actual | | Actual | | Actual | | Actual | | Actual | | Actual | | Forecast | | Plan | | Plan | | annual | |
| | 2012/13 | | 2013/14 | | 2014/15 | | 2015/16 | | 2016/17 | | 2017/18 | | 2018/19 | | 2019/20 | | 2020/21 | | 2021/22 | | change | |
| | | | | | | | | | | | | | | | | | | | | | (per cent) | |
Per cent of nominal GDP: 2 | | | | | | | | | | | | | | | | | | | | | | | |
Health | | 7.9 | | 7.8 | | 7.6 | | 7.7 | | 7.5 | | 7.4 | | 7.5 | | 7.5 | | 7.4 | | 7.3 | | -0.8 | |
Education | | 5.2 | | 5.2 | | 4.9 | | 4.9 | | 4.7 | | 4.6 | | 4.8 | | 4.8 | | 4.7 | | 4.5 | | -1.5 | |
Social services | | 1.8 | | 1.7 | | 1.6 | | 1.6 | | 1.6 | | 1.7 | | 1.8 | | 1.9 | | 1.9 | | 1.9 | | 0.6 | |
Protection of persons and property | | 0.7 | | 0.7 | | 0.6 | | 0.6 | | 0.6 | | 0.7 | | 0.7 | | 0.6 | | 0.5 | | 0.5 | | -3.2 | |
Transportation | | 0.7 | | 0.7 | | 0.7 | | 0.7 | | 0.7 | | 0.7 | | 0.7 | | 0.8 | | 0.7 | | 0.7 | | 0.0 | |
Natural resources & economic development | | 0.9 | | 0.8 | | 0.9 | | 1.0 | | 0.9 | | 1.2 | | 1.3 | | 1.1 | | 1.0 | | 1.0 | | 0.8 | |
Other | | 0.6 | | 0.5 | | 0.5 | | 0.5 | | 0.9 | | 0.6 | | 0.6 | | 0.7 | | 0.6 | | 0.7 | | 0.8 | |
Contingencies | | — | | — | | — | | — | | — | | — | | — | | 0.1 | | 0.1 | | 0.1 | | -2.1 | |
Contingencies - Sustainable Services Negotiating Mandate | | — | | — | | — | | — | | — | | — | | — | | 0.2 | | 0.4 | | 0.6 | | 13.9 | |
General government | | 0.6 | | 0.6 | | 0.6 | | 0.6 | | 0.6 | | 0.5 | | 0.6 | | 0.5 | | 0.5 | | 0.4 | | -3.0 | |
Debt servicing | | 1.1 | | 1.1 | | 1.0 | | 1.1 | | 1.0 | | 0.9 | | 0.9 | | 0.9 | | 0.9 | | 0.9 | | -2.4 | |
Operating expense | | 19.5 | | 19.0 | | 18.4 | | 18.8 | | 18.4 | | 18.3 | | 18.8 | | 19.0 | | 18.7 | | 18.6 | | -0.5 | |
Growth rates (per cent): | | | | | | | | | | | | | | | | | | | | | | | |
Health | | 3.5 | | 2.1 | | 2.8 | | 4.5 | | 2.5 | | 6.3 | | 5.8 | | 3.8 | | 2.7 | | 2.8 | | n/a | |
Education | | 2.7 | | 2.6 | | 0.0 | | 3.3 | | 2.1 | | 5.0 | | 7.6 | | 4.4 | | 0.9 | | 1.2 | | n/a | |
Social services | | 1.3 | | -4.6 | | 1.1 | | 6.7 | | 3.3 | | 11.6 | | 12.8 | | 7.9 | | 5.8 | | 3.4 | | n/a | |
Protection of persons and property | | 1.8 | | -1.2 | | -4.5 | | 8.3 | | 5.3 | | 16.6 | | 3.8 | | (9.3 | ) | -5.9 | | 0.2 | | n/a | |
Transportation | | 0.6 | | 1.6 | | 1.8 | | 3.9 | | 6.8 | | 8.2 | | 4.7 | | 15.5 | | 0.3 | | -0.3 | | n/a | |
Natural resources & economic development | | 11.7 | | -16.1 | | 24.8 | | 13.1 | | -0.5 | | 36.9 | | 13.4 | | (13.1 | ) | -8.1 | | 10.5 | | n/a | |
Other | | -4.8 | | -12.0 | | 8.8 | | -1.9 | | 78.8 | | -31.3 | | 16.5 | | 14.5 | | -1.4 | | 6.1 | | n/a | |
General government | | 2.2 | | 9.8 | | -1.9 | | 10.4 | | 2.1 | | 0.5 | | 8.4 | | (9.8 | ) | -4.4 | | -0.1 | | n/a | |
Debt servicing | | 0.3 | | 3.8 | | 0.6 | | 11.5 | | -7.1 | | 1.4 | | 2.3 | | 1.3 | | 2.0 | | 3.5 | | n/a | |
Operating expense | | 2.8 | | 0.5 | | 2.4 | | 5.3 | | 4.0 | | 6.2 | | 7.5 | | 4.7 | | 2.2 | | 3.8 | | n/a | |
Per capita ($): 3 | | | | | | | | | | | | | | | | | | | | | | | |
Health | | 3,832 | | 3,858 | | 3,903 | | 4,020 | | 4,052 | | 4,252 | | 4,438 | | 4,553 | | 4,620 | | 4,693 | | 2.3 | |
Education | | 2,524 | | 2,554 | | 2,513 | | 2,557 | | 2,566 | | 2,660 | | 2,822 | | 2,912 | | 2,902 | | 2,900 | | 1.6 | |
Social services | | 874 | | 822 | | 817 | | 860 | | 873 | | 962 | | 1,070 | | 1,142 | | 1,194 | | 1,220 | | 3.8 | |
Protection of persons and property | | 337 | | 328 | | 308 | | 329 | | 341 | | 392 | | 401 | | 360 | | 335 | | 331 | | -0.2 | |
Transportation | | 341 | | 341 | | 342 | | 350 | | 367 | | 392 | | 405 | | 462 | | 458 | | 452 | | 3.2 | |
Natural resources & economic development | | 458 | | 379 | | 465 | | 519 | | 507 | | 685 | | 766 | | 658 | | 598 | | 653 | | 4.0 | |
Other | | 295 | | 256 | | 274 | | 265 | | 465 | | 316 | | 363 | | 410 | | 400 | | 419 | | 4.0 | |
Contingencies | | — | | — | | — | | — | | — | | — | | — | | 89 | | 78 | | 77 | | n/a | |
Contingencies - Sustainable Services Negotiating Mandate | | — | | — | | — | | — | | — | | — | | — | | 104 | | 231 | | 353 | | n/a | |
General government | | 276 | | 299 | | 289 | | 314 | | 315 | | 313 | | 335 | | 298 | | 282 | | 278 | | 0.1 | |
Debt servicing | | 523 | | 536 | | 531 | | 583 | | 532 | | 533 | | 538 | | 539 | | 543 | | 555 | | 0.7 | |
Operating expense | | 9,460 | | 9,373 | | 9,442 | | 9,797 | | 10,018 | | 10,505 | | 11,138 | | 11,527 | | 11,641 | | 11,931 | | 2.6 | |
| | | | | | | | | | | | | | | | | | | | | | | |
Real Per Capita Operating Expense (2018 $) 4 | | 10,312 | | 10,226 | | 10,195 | | 10,465 | | 10,510 | | 10,790 | | 11,137 | | 11,249 | | 11,134 | | 11,193 | | 0.9 | |
Growth rate (per cent) | | 0.2 | | -0.8 | | -0.3 | | 2.6 | | 0.4 | | 2.7 | | 3.2 | | 1.0 | | -1.0 | | 0.5 | | 0.9 | |
1 Numbers may not add due to rounding.
2 Expense as a per cent of GDP is calculated using nominal GDP for the calendar year ending in the fiscal year (e.g. 2019/20 expense divided by nominal GDP for the 2019 calendar year).
3 Per capita expense is calculated using July 1 population (e.g. 2019/20 expense divided by population on July 1, 2019).
4 Expense is converted to real (inflation-adjusted) terms using the consumer price index (CPI) for the corresponding calendar year (e.g. 2019 CPI for 2019/20 expense).
First Quarterly Report 2019/20
62
Appendix — Fiscal Plan Update
Table A9 Full-Time Equivalents (FTEs) — 2012/13 to 2021/2022 1
| | | | | | | | | | | | | | | | Updated | | | | | | Average | |
| | Actual | | Actual | | Actual | | Actual | | Actual | | Actual | | Actual | | Forecast | | Plan | | Plan | | annual | |
| | 2012/13 | | 2013/14 | | 2014/15 | | 2015/16 | | 2016/17 | | 2017/18 | | 2018/19 | | 2019/20 | | 2020/21 | | 2021/22 | | change | |
| | | | | | | | | | | | | | | | | | | | | | (per cent) | |
Taxpayer-supported programs and agencies: | | | | | | | | | | | | | | | | | | | | | | | |
Ministries and special offices (CRF) | | 27,326 | | 26,526 | | 26,679 | | 27,192 | | 27,940 | | 29,291 | | 30,891 | | 31,350 | | 31,400 | | 31,400 | | 1.6 | |
Service delivery agencies 2 | | 4,508 | | 4,640 | | 4,798 | | 4,803 | | 4,850 | | 5,076 | | 5,258 | | 5,550 | | 6,049 | | 6,836 | | 4.7 | |
Total FTEs | | 31,834 | | 31,166 | | 31,477 | | 31,995 | | 32,790 | | 34,367 | | 36,149 | | 36,900 | | 37,449 | | 38,236 | | 2.1 | |
Growth rates (per cent): | | | | | | | | | | | | | | | | | | | | | | | |
Ministries and special offices (CRF) | | 0.4 | | -2.9 | | 0.6 | | 1.9 | | 2.8 | | 4.8 | | 5.5 | | 1.5 | | 0.2 | | 0.0 | | 1.5 | |
Service delivery agencies | | 3.7 | | 2.9 | | 3.4 | | 0.1 | | 1.0 | | 4.7 | | 3.6 | | 5.6 | | 9.0 | | 13.0 | | 4.7 | |
Population per FTE: 3 | | | | | | | | | | | | | | | | | | | | | | | |
Total FTEs | | 143.5 | | 148.6 | | 149.5 | | 149.3 | | 148.2 | | 143.2 | | 138.1 | | 136.9 | | 136.5 | | 135.3 | | -0.6 | |
1 Full-time equivalents (FTEs) are a measure of staff employment. FTEs are calculated by dividing the total hours of employment paid for in a given period by the number of hours an individual, full-time person would normally work in that period. This does not equate to the physical number of employees. For example, two half-time employees would equal one FTE, or alternatively, three FTEs may represent two full-time employees who have worked sufficient overtime hours to equal an additional FTE.
2 Service delivery agency FTE amounts do not include SUCH sector staff employment.
3 Population per FTE is calculated using July 1 population (e.g. population on July 1, 2019 divided by 2019/20 FTEs).
First Quarterly Report 2019/20
63
APPENDIX — FISCAL PLAN UPDATE
Table A10 Capital Spending — 2012/13 to 2021/22
| | | | | | | | | | | | | | | | Updated | | | | | | Average | |
| | Actual | | Actual | | Actual | | Actual | | Actual | | Actual | | Actual | | Forecast | | Plan | | Plan | | annual | |
($ millions) | | 2012/13 | | 2013/14 | | 2014/15 | | 2015/16 | | 2016/17 | | 2017/18 | | 2018/19 | | 2019/20 | | 2020/21 | | 2021/22 | | change | |
| | | | | | | | | | | | | | | | | | | | | | (per cent) | |
Taxpayer-supported: | | | | | | | | | | | | | | | | | | | | | | | |
Education | | | | | | | | | | | | | | | | | | | | | | | |
Schools districts | | 509 | | 466 | | 420 | | 430 | | 474 | | 578 | | 626 | | 850 | | 986 | | 849 | | 5.8 | |
Post-secondary institutions | | 591 | | 507 | | 718 | | 746 | | 792 | | 968 | | 1,024 | | 940 | | 1,073 | | 1,007 | | 6.1 | |
Health | | 742 | | 690 | | 900 | | 923 | | 1,004 | | 890 | | 904 | | 1,372 | | 1,441 | | 1,717 | | 9.8 | |
BC Transportation Financing Authority 1 | | 1,005 | | 1,017 | | 822 | | 867 | | 823 | | 717 | | 853 | | 1,364 | | 1,796 | | 2,158 | | 8.9 | |
BC Transit | | 48 | | 80 | | 83 | | 51 | | 41 | | 115 | | 85 | | 131 | | 236 | | 189 | | 16.4 | |
BC Place redevelopment | | 6 | | — | | — | | — | | — | | — | | — | | — | | — | | — | | n/a | |
Government direct (ministries) | | 267 | | 298 | | 326 | | 290 | | 301 | | 430 | | 421 | | 672 | | 507 | | 449 | | 5.9 | |
Housing | | 92 | | 65 | | 107 | | 127 | | 184 | | 169 | | 483 | | 378 | | 523 | | 367 | | 16.6 | |
Other | | 19 | | 28 | | 31 | | 25 | | 40 | | 41 | | 56 | | 69 | | 55 | | 107 | | 21.2 | |
| | 3,279 | | 3,151 | | 3,407 | | 3,459 | | 3,659 | | 3,908 | | 4,452 | | 5,776 | | 6,617 | | 6,843 | | 8.5 | |
Self-supported: | | | | | | | | | | | | | | | | | | | | | | | |
BC Hydro | | 1,929 | | 2,036 | | 2,169 | | 2,306 | | 2,444 | | 2,473 | | 3,826 | | 2,999 | | 3,115 | | 3,153 | | 5.6 | |
Columbia Basin power projects | | 94 | | 52 | | 28 | | 15 | | 2 | | 1 | | 2 | | 1,001 | | 13 | | 18 | | -16.8 | |
Transportation Investment Corporation 1 | | 540 | | 202 | | 76 | | 25 | | 38 | | 4 | | — | | — | | — | | — | | n/a | |
BC Railway Company | | 10 | | 8 | | 5 | | 23 | | 4 | | 11 | | 33 | | 11 | | 6 | | 2 | | -16.4 | |
ICBC | | 73 | | 82 | | 88 | | 90 | | 62 | | 54 | | 66 | | 92 | | 40 | | 40 | | -6.5 | |
BC Lottery Corporation | | 97 | | 100 | | 69 | | 68 | | 86 | | 82 | | 75 | | 105 | | 105 | | 90 | | -0.8 | |
Liquor Distribution Branch | | 10 | | 13 | | 25 | | 23 | | 27 | | 48 | | 60 | | 74 | | 64 | | 55 | | 20.9 | |
Other 2 | | 12 | | 26 | | 28 | | 23 | | 62 | | 56 | | 44 | | — | | — | | — | | n/a | |
| | 2,765 | | 2,519 | | 2,488 | | 2,573 | | 2,725 | | 2,729 | | 4,106 | | 4,282 | | 3,343 | | 3,358 | | 2.2 | |
Total capital spending | | 6,044 | | 5,670 | | 5,895 | | 6,032 | | 6,384 | | 6,637 | | 8,558 | | 10,058 | | 9,960 | | 10,201 | | 6.0 | |
Per cent of nominal GDP: 3 | | | | | | | | | | | | | | | | | | | | | | | |
Taxpayer-supported | | 1.5 | | 1.4 | | 1.4 | | 1.4 | | 1.4 | | 1.4 | | 1.5 | | 1.9 | | 2.1 | | 2.1 | | 3.8 | |
Self-supported | | 1.2 | | 1.1 | | 1.0 | | 1.0 | | 1.0 | | 1.0 | | 1.4 | | 1.4 | | 1.0 | | 1.0 | | -2.3 | |
Total | | 2.7 | | 2.5 | | 2.4 | | 2.4 | | 2.4 | | 2.4 | | 2.9 | | 3.3 | | 3.1 | | 3.1 | | 1.3 | |
Growth rates: | | | | | | | | | | | | | | | | | | | | | | | |
Taxpayer-supported | | -8.0 | | -3.9 | | 8.1 | | 1.5 | | 5.8 | | 6.8 | | 13.9 | | 29.7 | | 48.6 | | 3.4 | | 10.6 | |
Self-supported | | 0.8 | | -8.9 | | -1.2 | | 3.4 | | 5.9 | | 0.1 | | 50.5 | | 4.3 | | -18.6 | | 0.4 | | 3.7 | |
Total | | -4.2 | | -6.2 | | 4.0 | | 2.3 | | 5.8 | | 4.0 | | 28.9 | | 17.5 | | 16.4 | | 2.4 | | 7.1 | |
Per capita: 4 | | | | | | | | | | | | | | | | | | | | | | | |
Taxpayer-supported | | 718 | | 681 | | 724 | | 724 | | 753 | | 794 | | 892 | | 1,144 | | 1,295 | | 1,323 | | 7.0 | |
Self-supported | | 605 | | 544 | | 529 | | 539 | | 561 | | 554 | | 823 | | 848 | | 654 | | 649 | | 0.8 | |
Total | | 1,323 | | 1,225 | | 1,252 | | 1,263 | | 1,314 | | 1,348 | | 1,714 | | 1,991 | | 1,949 | | 1,972 | | 4.5 | |
| | | | | | | | | | | | | | | | | | | | | | | |
Real Per Capita Capital Spending (2018 $) 5 | | 1,443 | | 1,336 | | 1,352 | | 1,349 | | 1,378 | | 1,385 | | 1,714 | | 1,944 | | 1,864 | | 1,850 | | 2.8 | |
Growth rate (per cent) | | -6.6 | | -7.4 | | 1.2 | | -0.3 | | 2.2 | | 0.5 | | 23.8 | | 13.4 | | 8.7 | | -0.8 | | 3.5 | |
1 | Includes Transportation Investment Plan capital spending and, beginning in 2017/18, Transportation Investment Corporation rehabilitation costs for the Port Mann Bridge due to reclassification from self-supported commercial Crown corporation to a taxpayer-supported agency in response to the cancellation of tolls. Effective April 1, 2018, Transportation Investment Corporation became a subsidiary of BCTFA. |
2 | Includes post-secondary institutions’ self-supported subsidiaries. |
3 | Capital spending as a per cent of GDP is calculated using nominal GDP for the calendar year ending in the fiscal year (e.g. 2019/20 amounts divided by nominal GDP for the 2019 calendar year). |
4 | Per capita capital spending is calculated using July 1 population (e.g. 2019/20 amounts divided by population on July 1, 2019). |
5 | Capital spending is converted to real (inflation-adjusted) terms using the consumer price index (CPI) for the corresponding calendar year (e.g. 2019 CPI for 2019/20 capital spending). |
FIRST QUARTERLY REPORT 2019/20
64
APPENDIX — FISCAL PLAN UPDATE
Table A11 Statement of Financial Position — 2012/13 to 2021/22
| | | | | | | | | | | | | | | | Updated | | | | | | Average | |
| | Actual | | Actual | | Actual | | Actual | | Actual | | Actual | | Actual | | Forecast | | Plan | | Plan | | annual | |
($ millions) | | 2012/13 | | 2013/14 | | 2014/15 | | 2015/16 | | 2016/17 | | 2017/18 | | 2018/19 | | 2019/20 | | 2020/21 | | 2021/22 | | change | |
| | | | | | | | | | | | | | | | | | | | | | (per cent) | |
Financial assets: | | | | | | | | | | | | | | | | | | | | | | | |
Cash and temporary investments | | 3,173 | | 2,801 | | 3,675 | | 3,892 | | 4,232 | | 3,440 | | 3,029 | | 2,976 | | 3,184 | | 3,466 | | 1.0 | |
Other financial assets | | 8,186 | | 9,334 | | 9,115 | | 9,636 | | 10,143 | | 11,650 | | 12,524 | | 12,853 | | 13,266 | | 13,553 | | 5.8 | |
Sinking funds | | 1,778 | | 835 | | 977 | | 1,580 | | 1,087 | | 1,348 | | 752 | | 665 | | 497 | | 524 | | -12.7 | |
Investments in commercial Crown corporations: | | | | | | | | | | | | | | | | | | | | | | | |
Retained earnings | | 7,541 | | 7,839 | | 8,254 | | 7,514 | | 7,494 | | 6,111 | | 5,717 | | 7,368 | | 7,987 | | 8,793 | | 1.7 | |
Recoverable capital loans | | 17,208 | | 19,255 | | 20,624 | | 22,041 | | 23,809 | | 20,534 | | 22,547 | | 24,583 | | 25,751 | | 26,749 | | 5.0 | |
Total investments in commercial Crown corporations | | 24,749 | | 27,094 | | 28,878 | | 29,555 | | 31,303 | | 26,645 | | 28,264 | | 31,951 | | 33,738 | | 35,542 | | 4.1 | |
| | 37,886 | | 40,064 | | 42,645 | | 44,663 | | 46,765 | | 43,083 | | 44,569 | | 48,445 | | 50,685 | | 53,085 | | 3.8 | |
Liabilities: | | | | | | | | | | | | | | | | | | | | | | | |
Accounts payable & accrued liabilities | | 9,149 | | 8,298 | | 8,312 | | 8,486 | | 8,898 | | 9,618 | | 10,435 | | 10,875 | | 11,523 | | 12,114 | | 3.2 | |
Deferred revenue | | 9,828 | | 9,661 | | 9,771 | | 9,743 | | 9,525 | | 9,928 | | 10,404 | | 11,206 | | 11,852 | | 12,588 | | 2.8 | |
Debt: | | | | | | | | | | | | | | | | | | | | | | | |
Taxpayer-supported debt | | 38,182 | | 41,068 | | 41,880 | | 42,719 | | 41,499 | | 43,607 | | 42,681 | | 45,466 | | 49,491 | | 53,149 | | 3.7 | |
Self-supported debt | | 17,634 | | 19,625 | | 21,040 | | 22,532 | | 24,338 | | 21,312 | | 23,281 | | 25,354 | | 26,504 | | 27,481 | | 5.1 | |
Forecast allowance | | — | | — | | — | | — | | — | | — | | — | | 500 | | 300 | | 300 | | | |
Total provincial debt | | 55,816 | | 60,693 | | 62,920 | | 65,251 | | 65,837 | | 64,919 | | 65,962 | | 71,320 | | 76,295 | | 80,930 | | 4.2 | |
Add: debt offset by sinking funds | | 1,778 | | 835 | | 977 | | 1,580 | | 1,087 | | 1,348 | | 752 | | 665 | | 497 | | 524 | | -12.7 | |
Less: guarantees and non-guaranteed debt | | (755 | ) | (726 | ) | (739 | ) | (820 | ) | (835 | ) | (896 | ) | (850 | ) | (827 | ) | (807 | ) | (786 | ) | 0.4 | |
Financial statement debt | | 56,839 | | 60,802 | | 63,158 | | 66,011 | | 66,089 | | 65,371 | | 65,864 | | 71,158 | | 75,985 | | 80,668 | | 4.0 | |
| | 75,816 | | 78,761 | | 81,241 | | 84,240 | | 84,512 | | 84,917 | | 86,703 | | 93,239 | | 99,360 | | 105,370 | | 3.7 | |
Net liabilities | | (37,930 | ) | (38,697 | ) | (38,596 | ) | (39,577 | ) | (37,747 | ) | (41,834 | ) | (42,134 | ) | (44,794 | ) | (48,675 | ) | (52,285 | ) | 3.6 | |
| | | | | | | | | | | | | | | | | | | | | | | |
Capital and other assets: | | | | | | | | | | | | | | | | | | | | | | | |
Tangible capital assets | | 36,762 | | 37,778 | | 39,028 | | 40,282 | | 41,303 | | 45,837 | | 47,830 | | 51,123 | | 55,110 | | 59,266 | | 5.4 | |
Restricted assets | | 1,442 | | 1,493 | | 1,553 | | 1,631 | | 1,695 | | 1,768 | | 1,834 | | 1,893 | | 1,953 | | 2,013 | | 3.8 | |
Other assets | | 966 | | 1,307 | | 1,281 | | 1,093 | | 1,180 | | 1,010 | | 1,052 | | 597 | | 606 | | 597 | | -5.2 | |
| | 39,170 | | 40,578 | | 41,862 | | 43,006 | | 44,178 | | 48,615 | | 50,716 | | 53,613 | | 57,669 | | 61,876 | | 5.2 | |
Accumulated surplus (deficit) | | 1,240 | | 1,881 | | 3,266 | | 3,429 | | 6,431 | | 6,781 | | 8,582 | | 8,819 | | 8,994 | | 9,591 | | 25.5 | |
Per cent of nominal GDP: 1 | | | | | | | | | | | | | | | | | | | | | | | |
Net liabilities | | 17.1 | | 16.9 | | 15.9 | | 15.9 | | 14.3 | | 14.8 | | 14.3 | | 14.6 | | 15.3 | | 15.8 | | -0.9 | |
Capital and other assets | | 17.7 | | 17.7 | | 17.3 | | 17.3 | | 16.7 | | 17.2 | | 17.2 | | 17.5 | | 18.1 | | 18.7 | | 0.6 | |
Growth rates (per cent): | | | | | | | | | | | | | | | | | | | | | | | |
Net liabilities | | 6.4 | | 2.0 | | -0.3 | | 2.5 | | -4.6 | | 10.8 | | 0.7 | | 18.7 | | 8.7 | | 7.4 | | 1.7 | |
Capital and other assets | | 3.2 | | 3.6 | | 3.2 | | 2.7 | | 2.7 | | 10.0 | | 4.3 | | 21.4 | | 7.6 | | 7.3 | | 9.7 | |
Per capita: 2 | | | | | | | | | | | | | | | | | | | | | | | |
Net liabilities | | 8,306 | | 8,358 | | 8,200 | | 8,286 | | 7,768 | | 8,499 | | 8,441 | | 8,869 | | 9,524 | | 10,106 | | 2.2 | |
Capital and other assets | | 8,577 | | 8,764 | | 8,893 | | 9,004 | | 9,092 | | 9,877 | | 10,160 | | 10,615 | | 11,284 | | 11,960 | | 3.8 | |
1 | Net liabilities as a per cent of nominal GDP is calculated using nominal GDP for the calendar year ending in the fiscal year (e.g. 2019/20 amount divided by nominal GDP for the 2019 calendar year). |
2 | Per capita net liabilities is calculated using July 1 population (e.g. 2019/20 amount divided by population on July 1, 2019). |
FIRST QUARTERLY REPORT 2019/20
65
APPENDIX — FISCAL PLAN UPDATE
Table A12 Changes in Financial Position — 2012/13 to 2021/22
| | | | | | | | | | | | | | | | Updated | | | | | | | |
| | Actual | | Actual | | Actual | | Actual | | Actual | | Actual | | Actual | | Forecast | | Plan | | Plan | | 10-Year | |
($ millions) | | 2012/13 | | 2013/14 | | 2014/15 | | 2015/16 | | 2016/17 | | 2017/18 | | 2018/19 | | 2019/20 | | 2020/21 | | 2021/22 | | Total | |
(Surplus) deficit for the year | | 1,147 | | (314 | ) | (1,660 | ) | (810 | ) | (2,766 | ) | (314 | ) | (1,535 | ) | (179 | ) | (291 | ) | (573 | ) | (7,295 | ) |
Comprehensive income (increase) decrease | | (81 | ) | (327 | ) | 275 | | 647 | | (236 | ) | (36 | ) | (266 | ) | (58 | ) | 116 | | (24 | ) | 10 | |
Change in accumulated (surplus) deficit | | 1,066 | | (641 | ) | (1,385 | ) | (163 | ) | (3,002 | ) | (350 | ) | (1,801 | ) | (237 | ) | (175 | ) | (597 | ) | (7,285 | ) |
| | | | | | | | | | | | | | | | | | | | | | | |
Capital and other asset changes: | | | | | | | | | | | | | | | | | | | | | | | |
Taxpayer-supported capital investments | | 3,279 | | 3,151 | | 3,407 | | 3,459 | | 3,659 | | 3,908 | | 4,452 | | 5,776 | | 6,617 | | 6,843 | | 44,551 | |
Less: amortization and other accounting changes | | (2,209 | ) | (2,135 | ) | (2,157 | ) | (2,205 | ) | (2,638 | ) | 626 | | (2,459 | ) | (2,483 | ) | (2,630 | ) | (2,687 | ) | (20,977 | ) |
Increase in net capital assets | | 1,070 | | 1,016 | | 1,250 | | 1,254 | | 1,021 | | 4,534 | | 1,993 | | 3,293 | | 3,987 | | 4,156 | | 23,574 | |
Increase (decrease) in restricted assets | | 65 | | 51 | | 60 | | 78 | | 64 | | 73 | | 66 | | 59 | | 60 | | 60 | | 636 | |
Increase (decrease) in other assets | | 72 | | 341 | | (26 | ) | (188 | ) | 87 | | (170 | ) | 42 | | (455 | ) | 9 | | (9 | ) | (297 | ) |
Change in capital and other assets | | 1,207 | | 1,408 | | 1,284 | | 1,144 | | 1,172 | | 4,437 | | 2,101 | | 2,897 | | 4,056 | | 4,207 | | 23,913 | |
| | | | | | | | | | | | | | | | | | | | | | | |
Increase (decrease) in net liabilities | | 2,273 | | 767 | | (101 | ) | 981 | | (1,830 | ) | 4,087 | | 300 | | 2,660 | | 3,881 | | 3,610 | | 16,628 | |
| | | | | | | | | | | | | | | | | | | | | | | |
Investment and working capital changes: | | | | | | | | | | | | | | | | | | | | | | | |
Investment in commercial Crown corporations: | | | | | | | | | | | | | | | | | | | | | | | |
Increase (decrease) in retained earnings | | 543 | | 298 | | 415 | | (740 | ) | (20 | ) | (1,383 | ) | (394 | ) | 1,651 | | 619 | | 806 | | 1,795 | |
Self-supported capital investments | | 2,765 | | 2,519 | | 2,488 | | 2,573 | | 2,725 | | 2,729 | | 4,106 | | 4,282 | | 3,343 | | 3,358 | | 30,888 | |
Less: loan repayments and other accounting changes | | (724 | ) | (472 | ) | (1,119 | ) | (1,156 | ) | (957 | ) | (6,004 | ) | (2,093 | ) | (2,246 | ) | (2,175 | ) | (2,360 | ) | (19,306 | ) |
Change in investment | | 2,584 | | 2,345 | | 1,784 | | 677 | | 1,748 | | (4,658 | ) | 1,619 | | 3,687 | | 1,787 | | 1,804 | | 13,377 | |
Increase (decrease) in cash and temporary investments | | (62 | ) | (372 | ) | 874 | | 217 | | 340 | | (792 | ) | (411 | ) | (53 | ) | 208 | | 282 | | 231 | |
Other working capital changes | | 1,090 | | 1,223 | | (201 | ) | 978 | | (180 | ) | 645 | | (1,015 | ) | (1,000 | ) | (1,049 | ) | (1,013 | ) | (522 | ) |
Changes in investment and working capital | | 3,612 | | 3,196 | | 2,457 | | 1,872 | | 1,908 | | (4,805 | ) | 193 | | 2,634 | | 946 | | 1,073 | | 13,086 | |
| | | | | | | | | | | | | | | | | | | | | | | |
Increase (decrease) in financial statement debt | | 5,885 | | 3,963 | | 2,356 | | 2,853 | | 78 | | (718 | ) | 493 | | 5,294 | | 4,827 | | 4,683 | | 29,714 | |
(Increase) decrease in sinking fund debt | | (287 | ) | 943 | | (142 | ) | (603 | ) | 493 | | (261 | ) | 596 | | 87 | | 168 | | (27 | ) | 967 | |
Increase (decrease) in guarantees | | (34 | ) | 27 | | (33 | ) | 6 | | (23 | ) | (188 | ) | (2 | ) | (60 | ) | (2 | ) | — | | (309 | ) |
Increase (decrease) in non-guaranteed debt | | 59 | | (56 | ) | 46 | | 75 | | 38 | | 249 | | (44 | ) | 37 | | (18 | ) | (21 | ) | 365 | |
Increase (decrease) in total provincial debt | | 5,623 | | 4,877 | | 2,227 | | 2,331 | | 586 | | (918 | ) | 1,043 | | 5,358 | | 4,975 | | 4,635 | | 30,737 | |
| | | | | | | | | | | | | | | | | | | | | | | |
Represented by increase (decrease) in: | | | | | | | | | | | | | | | | | | | | | | | |
Taxpayer-supported debt | | 3,523 | | 2,886 | | 812 | | 839 | | (1,220 | ) | 2,108 | | (926 | ) | 2,785 | | 4,025 | | 3,658 | | 18,490 | |
Self-supported debt | | 2,100 | | 1,991 | | 1,415 | | 1,492 | | 1,806 | | (3,026 | ) | 1,969 | | 2,073 | | 1,150 | | 977 | | 11,947 | |
Forecast allowance | | — | | — | | — | | — | | — | | — | | — | | 500 | | (200 | ) | — | | 300 | |
Total provincial debt | | 5,623 | | 4,877 | | 2,227 | | 2,331 | | 586 | | (918 | ) | 1,043 | | 5,358 | | 4,975 | | 4,635 | | 30,737 | |
FIRST QUARTERLY REPORT 2019/20
66
APPENDIX — FISCAL PLAN UPDATE
Table A13 Provincial Debt — 2012/13 to 2021/22
| | | | | | | | | | | | | | | | Updated | | | | | | Average | |
| | Actual | | Actual | | Actual | | Actual | | Actual | | Actual | | Actual | | Forecast | | Plan | | Plan | | annual | |
($ millions) | | 2012/13 | | 2013/14 | | 2014/15 | | 2015/16 | | 2016/17 | | 2017/18 | | 2018/19 | | 2019/20 | | 2020/21 | | 2021/22 | | change | |
| | | | | | | | | | | | | | | | | | | | | | (per cent) | |
Taxpayer-supported debt: | | | | | | | | | | | | | | | | | | | | | | | |
Provincial government direct operating | | 9,408 | | 10,223 | | 9,280 | | 8,034 | | 4,644 | | 1,156 | | — | | — | | — | | — | | -100.0 | |
Other taxpayer-supported debt (mainly capital): | | | | | | | | | | | | | | | | | | | | | | | |
Education facilities | | | | | | | | | | | | | | | | | | | | | | | |
Post-secondary institutions | | 4,315 | | 4,386 | | 4,518 | | 4,731 | | 4,984 | | 5,328 | | 5,370 | | 5,558 | | 5,798 | | 6,302 | | 4.3 | |
School districts | | 6,830 | | 7,245 | | 7,600 | | 8,033 | | 8,473 | | 8,908 | | 8,904 | | 9,017 | | 9,514 | | 9,162 | | 3.3 | |
| | 11,145 | | 11,631 | | 12,118 | | 12,764 | | 13,457 | | 14,236 | | 14,274 | | 14,575 | | 15,312 | | 15,464 | | 3.7 | |
Health facilities | | 5,691 | | 6,038 | | 6,522 | | 6,998 | | 7,552 | | 7,903 | | 7,968 | | 8,208 | | 8,683 | | 9,630 | | 6.0 | |
Highways, ferries and public transit | | | | | | | | | | | | | | | | | | | | | | | |
BC Transit | | 163 | | 143 | | 123 | | 106 | | 94 | | 84 | | 73 | | 102 | | 144 | | 177 | | 0.9 | |
BC Transportation Financing Authority | | 7,084 | | 7,912 | | 8,428 | | 9,177 | | 9,974 | | 10,388 | | 11,293 | | 12,588 | | 14,402 | | 16,437 | | 9.8 | |
Port Mann Bridge 1 | | — | | — | | — | | — | | — | | 3,508 | | 3,510 | | 3,510 | | 3,510 | | 3,510 | | n/a | |
Public transit | | 1,000 | | 1,000 | | 1,000 | | 1,000 | | 1,000 | | 1,000 | | 870 | | 870 | | 870 | | 870 | | -1.5 | |
SkyTrain extension | | 1,174 | | 1,174 | | 1,174 | | 1,174 | | 1,174 | | 1,174 | | 1,021 | | 1,021 | | 1,021 | | 1,021 | | -1.5 | |
| | 9,421 | | 10,229 | | 10,725 | | 11,457 | | 12,242 | | 16,154 | | 16,767 | | 18,091 | | 19,947 | | 22,015 | | 9.9 | |
Other | | | | | | | | | | | | | | | | | | | | | | | |
BC Immigrant Investment Fund | | 363 | | 440 | | 414 | | 304 | | 217 | | 161 | | 70 | | 49 | | 30 | | 11 | | -32.2 | |
BC Pavilion Corporation | | 383 | | 382 | | 381 | | 389 | | 376 | | 374 | | 371 | | 378 | | 385 | | 392 | | 0.3 | |
Provincial government general capital | | 1,073 | | 1,372 | | 1,698 | | 1,987 | | 2,288 | | 2,718 | | 2,363 | | 2,896 | | 3,333 | | 3,720 | | 14.8 | |
Social Housing | | 658 | | 719 | | 715 | | 760 | | 695 | | 878 | | 844 | | 1,240 | | 1,772 | | 1,828 | | 12.0 | |
Other | | 40 | | 34 | | 27 | | 26 | | 28 | | 27 | | 24 | | 29 | | 29 | | 89 | | 9.3 | |
| | 2,517 | | 2,947 | | 3,235 | | 3,466 | | 3,604 | | 4,158 | | 3,672 | | 4,592 | | 5,549 | | 6,040 | | 10.2 | |
Total other taxpayer-supported debt | | 28,774 | | 30,845 | | 32,600 | | 34,685 | | 36,855 | | 42,451 | | 42,681 | | 45,466 | | 49,491 | | 53,149 | | 7.1 | |
Total taxpayer-supported debt | | 38,182 | | 41,068 | | 41,880 | | 42,719 | | 41,499 | | 43,607 | | 42,681 | | 45,466 | | 49,491 | | 53,149 | | 3.7 | |
Self-supported debt: | | | | | | | | | | | | | | | | | | | | | | | |
Commercial Crown corporations and agencies | | | | | | | | | | | | | | | | | | | | | | | |
BC Hydro | | 14,167 | | 15,559 | | 16,544 | | 17,929 | | 19,685 | | 19,990 | | 22,064 | | 23,218 | | 24,376 | | 25,380 | | 6.7 | |
BC Lotteries | | 132 | | 155 | | 140 | | 150 | | 145 | | 155 | | 100 | | 106 | | 124 | | 124 | | -0.7 | |
Columbia Power Corporation | | — | | — | | 300 | | 296 | | 291 | | 286 | | 282 | | 277 | | 271 | | 265 | | n/a | |
Columbia Basin power projects | | 475 | | 470 | | 464 | | 459 | | 448 | | 433 | | 418 | | 1,337 | | 1,319 | | 1,300 | | 11.8 | |
Post-secondary institution subsidiaries | | 215 | | 198 | | 222 | | 310 | | 340 | | 418 | | 387 | | 387 | | 387 | | 387 | | 6.7 | |
Transportation Investment Corporation 1 | | 2,610 | | 3,209 | | 3,335 | | 3,355 | | 3,398 | | — | | — | | — | | — | | — | | n/a | |
Other | | 35 | | 34 | | 35 | | 33 | | 31 | | 30 | | 30 | | 29 | | 27 | | 25 | | -3.7 | |
Total self-supported debt | | 17,634 | | 19,625 | | 21,040 | | 22,532 | | 24,338 | | 21,312 | | 23,281 | | 25,354 | | 26,504 | | 27,481 | | 5.1 | |
Forecast allowance | | — | | — | | — | | — | | — | | — | | — | | 500 | | 300 | | 300 | | n/a | |
Total provincial debt | | 55,816 | | 60,693 | | 62,920 | | 65,251 | | 65,837 | | 64,919 | | 65,962 | | 71,320 | | 76,295 | | 80,930 | | 4.2 | |
1 | Beginning in 2017/18, debt related to the Port Mann Bridge was reclassified as taxpayer-supported due to the elimination of tolls effective September 1, 2017. |
FIRST QUARTERLY REPORT 2019/20
67
APPENDIX — FISCAL PLAN UPDATE
Table A14 Provincial Debt Supplementary Information — 2012/13 to 2021/22 1
| | | | | | | | | | | | | | | | Updated | | | | | | Average | |
| | Actual | | Actual | | Actual | | Actual | | Actual | | Actual | | Actual | | Forecast | | Plan | | Plan | | annual | |
($ millions) | | 2012/13 | | 2013/14 | | 2014/15 | | 2015/16 | | 2016/17 | | 2017/18 | | 2018/19 | | 2019/20 | | 2020/21 | | 2021/22 | | change | |
| | | | | | | | | | | | | | | | | | | | | | (per cent) | |
Per cent of nominal GDP: 2 | | | | | | | | | | | | | | | | | | | | | | | |
Taxpayer-supported debt: | | | | | | | | | | | | | | | | | | | | | | | |
Provincial government direct operating | | 4.2 | | 4.5 | | 3.8 | | 3.2 | | 1.8 | | 0.4 | | — | | — | | — | | — | | -100.0 | |
Education facilities | | 5.0 | | 5.1 | | 5.0 | | 5.1 | | 5.1 | | 5.0 | | 4.8 | | 4.8 | | 4.8 | | 4.7 | | -0.8 | |
Health facilities | | 2.6 | | 2.6 | | 2.7 | | 2.8 | | 2.9 | | 2.8 | | 2.7 | | 2.7 | | 2.7 | | 2.9 | | 1.4 | |
Highways, ferries and public transit | | 4.3 | | 4.5 | | 4.4 | | 4.6 | | 4.6 | | 5.7 | | 5.7 | | 5.9 | | 6.3 | | 6.6 | | 5.1 | |
Other | | 1.1 | | 1.3 | | 1.3 | | 1.4 | | 1.4 | | 1.5 | | 1.2 | | 1.5 | | 1.7 | | 1.8 | | 5.4 | |
Total taxpayer-supported debt | | 17.2 | | 17.9 | | 17.3 | | 17.2 | | 15.7 | | 15.5 | | 14.5 | | 14.8 | | 15.5 | | 16.0 | | -0.8 | |
Self-supported debt: | | | | | | | | | | | | | | | | | | | | | | | |
Commercial Crown corporations & agencies | | 8.0 | | 8.6 | | 8.7 | | 9.0 | | 9.2 | | 7.6 | | 7.9 | | 8.3 | | 8.3 | | 8.3 | | 0.5 | |
Total provincial debt | | 25.2 | | 26.5 | | 26.0 | | 26.2 | | 24.9 | | 23.0 | | 22.3 | | 23.3 | | 23.9 | | 24.4 | | -0.3 | |
Growth rates (per cent): | | | | | | | | | | | | | | | | | | | | | | | |
Taxpayer-supported debt: | | | | | | | | | | | | | | | | | | | | | | | |
Provincial government direct operating | | 20.4 | | 8.7 | | -9.2 | | -13.4 | | -42.2 | | -75.1 | | -100.0 | | 0.0 | | 0.0 | | 0.0 | | -21.1 | |
Education facilities | | 5.2 | | 4.4 | | 4.2 | | 5.3 | | 5.4 | | 5.8 | | 0.3 | | 2.1 | | 5.1 | | 1.0 | | 3.9 | |
Health facilities | | 7.5 | | 6.1 | | 8.0 | | 7.3 | | 7.9 | | 4.6 | | 0.8 | | 3.0 | | 5.8 | | 10.9 | | 6.2 | |
Highways, ferries and public transit | | 9.0 | | 8.6 | | 4.8 | | 6.8 | | 6.9 | | 32.0 | | 3.8 | | 7.9 | | 10.3 | | 10.4 | | 10.0 | |
Other | | 8.6 | | 17.1 | | 9.8 | | 7.1 | | 4.0 | | 15.4 | | -11.7 | | 25.1 | | 20.8 | | 8.8 | | 10.5 | |
Total taxpayer-supported debt | | 10.2 | | 7.6 | | 2.0 | | 2.0 | | -2.9 | | 5.1 | | -2.1 | | 6.5 | | 8.9 | | 7.4 | | 4.5 | |
Self-supported debt: | | | | | | | | | | | | | | | | | | | | | | | |
Commercial Crown corporations & agencies | | 13.5 | | 11.3 | | 7.2 | | 7.1 | | 8.0 | | -12.4 | | 9.2 | | 8.9 | | 4.5 | | 3.7 | | 6.1 | |
Total provincial debt | | 11.2 | | 8.7 | | 3.7 | | 3.7 | | 0.9 | | -1.4 | | 1.6 | | 8.1 | | 7.0 | | 6.1 | | 5.0 | |
Per capita: 3 | | | | | | | | | | | | | | | | | | | | | | | |
Taxpayer-supported debt: | | | | | | | | | | | | | | | | | | | | | | | |
Provincial government direct operating | | 2,060 | | 2,208 | | 1,971 | | 1,682 | | 956 | | 235 | | — | | — | | — | | — | | -100.0 | |
Education facilities | | 2,440 | | 2,512 | | 2,574 | | 2,672 | | 2,769 | | 2,892 | | 2,860 | | 2,886 | | 2,996 | | 2,989 | | 2.3 | |
Health facilities | | 1,246 | | 1,304 | | 1,386 | | 1,465 | | 1,554 | | 1,606 | | 1,596 | | 1,625 | | 1,699 | | 1,861 | | 4.6 | |
Highways, ferries and public transit | | 2,063 | | 2,209 | | 2,278 | | 2,399 | | 2,519 | | 3,282 | | 3,359 | | 3,582 | | 3,903 | | 4,255 | | 8.4 | |
Other | | 551 | | 636 | | 687 | | 726 | | 742 | | 845 | | 736 | | 909 | | 1,086 | | 1,167 | | 8.7 | |
Total taxpayer-supported debt | | 8,361 | | 8,870 | | 8,897 | | 8,944 | | 8,540 | | 8,859 | | 8,550 | | 9,002 | | 9,684 | | 10,273 | | 2.3 | |
Self-supported debt: | | | | | | | | | | | | | | | | | | | | | | | |
Commercial Crown corporations & agencies | | 3,861 | | 4,239 | | 4,470 | | 4,717 | | 5,009 | | 4,330 | | 4,664 | | 5,020 | | 5,186 | | 5,312 | | 3.6 | |
Total provincial debt | | 12,222 | | 13,108 | | 13,367 | | 13,661 | | 13,549 | | 13,189 | | 13,214 | | 14,121 | | 14,929 | | 15,643 | | 2.8 | |
Real Per Capita Provincial Debt (2018 $) 4 | | 13,322 | | 14,300 | | 14,435 | | 14,593 | | 14,213 | | 13,548 | | 13,214 | | 13,782 | | 14,279 | | 14,675 | | 1.1 | |
Growth rate (per cent) | | 8.4 | | 7.3 | | 0.9 | | 1.1 | | -2.6 | | -4.7 | | -2.5 | | 4.3 | | 3.6 | | 2.8 | | 1.9 | |
1 | Numbers may not add due to rounding. |
2 | Debt as a per cent of GDP is calculated using nominal GDP for the calendar year ending in the fiscal year (e.g. 2019/20 debt divided by nominal GDP for the 2019 calendar year). |
3 | Per capita debt is calculated using July 1 population (e.g. 2019/20 debt divided by population on July 1, 2019). |
4 | Debt is converted to real (inflation-adjusted) terms using the consumer price index (CPI) for the corresponding calendar year (e.g. 2019 CPI for 2019/20 debt). |
FIRST QUARTERLY REPORT 2019/20
68
APPENDIX — FISCAL PLAN UPDATE
Table A15 Key Provincial Debt Indicators — 2012/13 to 2021/22
| | | | | | | | | | | | | | | | Updated | | | | | | Average | |
| | Actual | | Actual | | Actual | | Actual | | Actual | | Actual | | Actual | | Forecast | | Plan | | Plan | | annual | |
| | 2012/13 | | 2013/14 | | 2014/15 | | 2015/16 | | 2016/17 | | 2017/18 | | 2018/19 | | 2019/20 | | 2020/21 | | 2021/22 | | change | |
| | | | | | | | | | | | | | | | | | | | | | (per cent) | |
Debt to revenue (per cent) | | | | | | | | | | | | | | | | | | | | | | | |
Total provincial | | 104.1 | | 107.8 | | 106.6 | | 105.9 | | 99.3 | | 94.7 | | 89.5 | | 95.4 | | 99.0 | | 100.4 | | -0.4 | |
Taxpayer-supported | | 93.6 | | 96.4 | | 94.1 | | 91.3 | | 81.8 | | 82.5 | | 75.0 | | 80.0 | | 85.2 | | 87.8 | | -0.7 | |
Debt per capita ($) 1 | | | | | | | | | | | | | | | | | | | | | | | |
Total provincial | | 12,222 | | 13,108 | | 13,367 | | 13,661 | | 13,549 | | 13,189 | | 13,214 | | 14,121 | | 14,929 | | 15,643 | | 2.8 | |
Taxpayer-supported | | 8,361 | | 8,870 | | 8,897 | | 8,944 | | 8,540 | | 8,859 | | 8,550 | | 9,002 | | 9,684 | | 10,273 | | 2.3 | |
Debt to nominal GDP (per cent) 2 | | | | | | | | | | | | | | | | | | | | | | | |
Total provincial | | 25.2 | | 26.5 | | 26.0 | | 26.2 | | 24.9 | | 23.0 | | 22.3 | | 23.3 | | 23.9 | | 24.4 | | -0.3 | |
Taxpayer-supported | | 17.2 | | 17.9 | | 17.3 | | 17.2 | | 15.7 | | 15.5 | | 14.5 | | 14.8 | | 15.5 | | 16.0 | | -0.8 | |
Interest bite (cents per dollar of revenue) 3 | | | | | | | | | | | | | | | | | | | | | | | |
Total provincial | | 4.4 | | 4.3 | | 4.3 | | 4.7 | | 3.8 | | 4.0 | | 3.8 | | 3.9 | | 3.8 | | 3.8 | | -1.5 | |
Taxpayer-supported | | 3.9 | | 3.7 | | 3.7 | | 4.0 | | 3.2 | | 3.3 | | 3.2 | | 3.2 | | 3.2 | | 3.3 | | -1.9 | |
Interest costs ($ millions) | | | | | | | | | | | | | | | | | | | | | | | |
Total provincial | | 2,339 | | 2,444 | | 2,525 | | 2,879 | | 2,521 | | 2,759 | | 2,776 | | 2,948 | | 2,944 | | 3,071 | | 3.1 | |
Taxpayer-supported | | 1,600 | | 1,583 | | 1,651 | | 1,892 | | 1,644 | | 1,725 | | 1,793 | | 1,821 | | 1,869 | | 1,998 | | 2.5 | |
Interest rate (per cent) 4 | | | | | | | | | | | | | | | | | | | | | | | |
Taxpayer-supported | | 4.4 | | 4.0 | | 4.0 | | 4.5 | | 3.9 | | 4.1 | | 4.2 | | 4.1 | | 3.9 | | 3.9 | | -1.3 | |
| | | | | | | | | | | | | | | | | | | | | | | |
Background Information: | | | | | | | | | | | | | | | | | | | | | | | |
Revenue ($ millions) | | | | | | | | | | | | | | | | | | | | | | | |
Total provincial 5 | | 53,637 | | 56,279 | | 59,018 | | 61,589 | | 66,334 | | 68,551 | | 73,734 | | 74,753 | | 77,043 | | 80,625 | | 4.6 | |
Taxpayer-supported 6 | | 40,775 | | 42,611 | | 44,514 | | 46,805 | | 50,726 | | 52,866 | | 56,894 | | 56,799 | | 58,116 | | 60,510 | | 4.5 | |
Debt ($ millions) | | | | | | | | | | | | | | | | | | | | | | | |
Total provincial | | 55,816 | | 60,693 | | 62,920 | | 65,251 | | 65,837 | | 64,919 | | 65,962 | | 71,320 | | 76,295 | | 80,930 | | 4.2 | |
Taxpayer-supported 7 | | 38,182 | | 41,068 | | 41,880 | | 42,719 | | 41,499 | | 43,607 | | 42,681 | | 45,466 | | 49,491 | | 53,149 | | 3.7 | |
Provincial nominal GDP ($ millions) 8 | | 221,413 | | 228,972 | | 242,044 | | 249,072 | | 263,978 | | 282,204 | | 295,324 | | 306,665 | | 318,598 | | 331,270 | | 4.6 | |
Population (thousands at July 1) 9 | | 4,567 | | 4,630 | | 4,707 | | 4,776 | | 4,859 | | 4,922 | | 4,992 | | 5,050 | | 5,111 | | 5,173 | | 1.4 | |
1 | The ratio of debt to population (e.g. 2019/20 debt divided by population at July 1, 2019). |
2 | The ratio of debt outstanding at fiscal year end to provincial nominal gross domestic product (GDP) for the calendar year ending in the fiscal year (e.g. 2019/20 debt divided by 2019 nominal GDP). |
3 | The ratio of interest costs (less sinking fund interest) to revenue. Figures include capitalized interest expense in order to provide a more comparable measure to outstanding debt. |
4 | Weighted average of all outstanding debt issues. |
5 | Includes revenue of the consolidated revenue fund (excluding dividends from enterprises) plus revenue of all government organizations and enterprises. |
6 | Excludes revenue of government enterprises, but includes dividends from enterprises paid to the consolidated revenue fund. |
7 | Excludes debt of commercial Crown corporations and agencies and funds held under the province’s warehouse borrowing program. |
8 | Nominal GDP for the calendar year ending in the fiscal year (e.g. nominal GDP for 2019 is used for the fiscal year ended March 31, 2020). |
9 | Population at July 1st within the fiscal year (e.g. population at July 1, 2019 is used for the fiscal year ended March 31, 2020). |
FIRST QUARTERLY REPORT 2019/20
69