Exhibit 99.14
This page
intentionally left blank
FIRST QUARTERLY REPORT
2020/21 ECONOMIC OUTLOOK AND
FINANCIAL FORECAST
&
THREE MONTH RESULTS
APRIL – JUNE 2020

| British Columbia Cataloguing in Publication Data |
| British Columbia. Ministry of Finance. Quarterly report on the economy, fiscal situation and Crown corporations. — ongoing– Quarterly. Title on cover: Quarterly report. Continues: British Columbia. Ministry of Finance. Quarterly financial report. ISSN 0833-1375. ISSN 1192-2176 — Quarterly Report on the economy, fiscal situation and Crown corporations. 1. Finance, Public — British Columbia — Accounting — Periodicals. 2. British Columbia — Economic conditions — 1945 — Periodicals.* 3. Corporations, Government — British Columbia — Accounting — Periodicals. I. Title. HJ13.B77 354.711’007231’05 |
2020/21 FIRST QUARTERLY REPORT SEPTEMBER 10, 2020 | | TABLE OF CONTENTS |
| Part One — Updated 2020/21 Financial Forecast | |
| | Introduction | 3 |
| | Revenue | 6 |
| | Expense | 10 |
| | | Consolidated Revenue Fund (CRF) Spending | 10 |
| | | Service Delivery Agency Spending | 12 |
| | Topic Box: COVID-19 Pandemic Spending & Related Measures | 13 |
| | July 14 Economic and Fiscal Update | 17 |
| | Full-Time Equivalents for the BC Public Service | 18 |
| | Provincial Capital Spending | 18 |
| | | Projects Over $50 Million | 18 |
| | Provincial Debt | 21 |
| | Risks to the Fiscal Forecast | 23 |
| | Supplementary Schedules | 24 |
| | Tables: | |
| | | 1.1 | Forecast Update | 3 |
| | | 1.2 | Financial Forecast Changes | 5 |
| | | 1.3 | Q1 Forecast and July 14 (Scenario) Changes from Budget 2020 | 17 |
| | | 1.4 | Capital Spending Update | 18 |
| | | 1.5 | Provincial Debt Update | 21 |
| | | 1.6 | Operating Statement | 25 |
| | | 1.7 | Revenue by Source | 26 |
| | | 1.8 | Expense by Ministry, Program and Agency | 27 |
| | | 1.9 | Expense by Function | 28 |
| | | 1.10 | Capital Spending | 29 |
| | | 1.11 | Capital Expenditure Projects Greater Tan $50 million | 30 |
| | | 1.12 | Provincial Debt | 33 |
| | | 1.13 | Statement of Financial Position | 34 |
| | | 1.14 | Material Assumptions – Revenue | 35 |
| | | 1.15 | Material Assumptions – Expense | 40 |
| | Appendix A: Description of COVID-19 Response Measures | 43 |
| FIRST QUARTERLY REPORT 2020/21 | | i |
TABLE OF CONTENTS
| Part Two — Economic Review and Outlook | |
| Summary | 49 |
| British Columbia Economic Activity and Outlook | 50 |
| | Labour Market | 51 |
| | Consumer Spending and Housing | 52 |
| | Business and Government | 56 |
| | External Trade and Commodity Markets | 57 |
| | Demographics | 58 |
| | Inflation | 59 |
| Risks to the Economic Outlook | 60 |
| External Outlook | 60 |
| | United States | 60 |
| | Canada | 63 |
| | Asia | 65 |
| | Europe | 66 |
| Financial Markets | 66 |
| | Interest Rates | 66 |
| | Exchange Rate | 68 |
| Topic Box: The Economic Forecast Council, First Quarterly Report 2020 | 72 |
| Tables: | | |
| | 2.1 | British Columbia Economic Indicators | 50 |
| | 2.2 | U.S. Real GDP Forecast: Consensus vs B.C. Ministry of Finance | 63 |
| | 2.3 | Canadian Real GDP Forecast: Consensus vs B.C. Ministry of Finance | 64 |
| | 2.4 | Private Sector Canadian Interest Rate Forecasts | 67 |
| | 2.5 | Private Sector Exchange Rate Forecasts | 68 |
| | 2.6.1 | Gross Domestic Product (GDP): British Columbia | 69 |
| | 2.6.2 | Selected Nominal Income and Other Indicators: British Columbia | 70 |
| | 2.6.3 | Labour Market Indicators: British Columbia | 70 |
| | 2.6.4 | Major Economic Assumptions | 71 |
| ii | | FIRST QUARTERLY REPORT 2020/21 | |
PART 1 | UPDATED 2020/21 FINANCIAL FORECAST
Introduction
Table 1.1 2020/21 Forecast Update
| | | | | | First | | | | |
| | | Budget | | | Quarterly | | | | |
| ($ millions) | | 2020 | | | Report | | | Change | |
| Revenue | | | 60,585 | | | | 56,013 | | | | (4,572 | ) |
| Expense | | | (60,058 | ) | | | (67,805 | ) | | | (7,747 | ) |
| Forecast allowance | | | (300 | ) | | | (1,000 | ) | | | (700 | ) |
| Surplus (deficit) | | | 227 | | | | (12,792 | ) | | | (13,019 | ) |
| Capital Spending: | | | | | | | | | | | | |
| Taxpayer-supported capital spending | | | 7,126 | | | | 7,015 | | | | (111 | ) |
| Self-supported capital spending | | | 3,409 | | | | 3,372 | | | | (37 | ) |
| | | | 10,535 | | | | 10,387 | | | | (148 | ) |
| Provincial Debt: | | | | | | | | | | | | |
| Taxpayer-supported debt | | | 49,202 | | | | 59,802 | | | | 10,600 | |
| Self-supported debt | | | 26,890 | | | | 27,068 | | | | 178 | |
| Total debt (including forecast allowance) | | | 76,392 | | | | 87,870 | | | | 11,478 | |
| Taxpayer-supported debt to GDP ratio | | | 15.5 | % | | | 20.8 | % | | | 5.3 | % |
| Taxpayer-supported debt to revenue ratio | | | 84.1 | % | | | 110.6 | % | | | 26.5 | % |
In response to the major changes resulting from the COVID-19 pandemic, on July 14, 2020 the B.C. Ministry of Finance released an economic and fiscal update. An overview of the difference between the July 14 fiscal scenario and the First Quarterly Report is provided on page 17.
Consistent with previous years, the First Quarterly Report presents changes to forecasts from Budget 2020. Due to the high degree of uncertainty regarding the depth and duration of the economic downturn caused by the pandemic and the path of recovery, the First Quarterly Report presents a forecast update for the current fiscal year only.
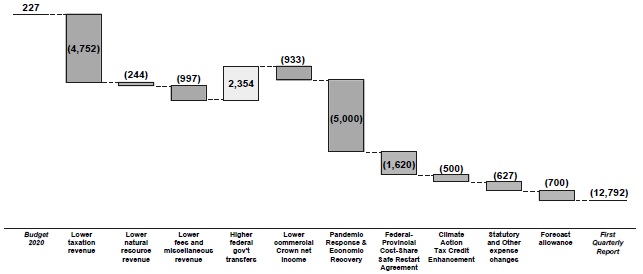
The fiscal forecast for 2020/21 in this First Quarterly Report reflects the unprecedented impacts of the COVID-19 pandemic on almost all of the province’s revenue streams, and the additional expenses for the response measures implemented to support critical health and social services, provide immediate financial relief to individuals and businesses, and to help boost economic recovery. Compared to Budget 2020, revenue forecasts are lower by $4.6 billion and expenses are higher by $7.7 billion. The provincial operating deficit projection is $12.8 billion, after incorporating an increased forecast allowance of $1.0 billion to reflect the heightened level of uncertainty over the remainder of the year. Details of the revenue and expense forecast changes from Budget 2020 are shown in Table 1.2.
The updated forecast includes $2.4 billion of federal government funding related to supporting British Columbians impacted by the COVID-19 pandemic. The forecast does not include the recently announced federal government funding of $2.0 billion to help provinces and territories open schools safely. B.C.’s share of this funding is estimated to be $242 million, provided in two instalments: the first in the fall and the second in early 2021. At this time, it is not certain how much of the second instalment will be spent in fiscal 2020/21 versus during the school year, but after March 31, 2021. It is expected that this funding also represents additional spending with no impact to the operating deficit. The fiscal update in the Second Quarterly Report will incorporate this additional federal government support for reopening schools safely as more detailed provincial spending plans are developed.
| | FIRST QUARTERLY REPORT 2020/21 | | 3 |
UPDATED 2020/21 FINANCIAL FORECAST
Projected taxpayer-supported capital spending in 2020/21 is $7.015 billion, which is $111 million lower than forecast in Budget 2020, mainly due to timing of projects in the transportation sector. The self-supported capital spending forecast is $37 million lower than at Budget 2020.
As a result of lower revenue and increased spending forecasts, taxpayer-supported debt at the end of 2020/21 is forecast at $59.8 billion, an increase of $10.6 billion compared to the Budget 2020 forecast. Self-supported debt is forecast to be $178 million higher at the end of 2020/21.
Chart 1.1 2020/21 Surplus (Deficit) – Major Changes from Budget 2020
Decline of $13.0 billion resulting in a $12.8 billion deficit
$ millions
| 4 | | FIRST QUARTERLY REPORT 2020/21 | |
UPDATED 2020/21 FINANCIAL FORECAST
Table 1.2 2020/21 Financial Forecast Changes
| | | | ($ millions) | |
| 2020/21 surplus at Budget 2020 (February 18, 2020) | | | 227 | |
| | | | | |
| Revenue changes: | | | | |
| Personal income tax – mainly expected decline in 2020 household income | | | (978 | ) |
| Corporate income tax – mainly decrease in instalments, reflecting a lower federal government outlook for 2020 national corporate taxable income | | | (1,144 | ) |
| Provincial sales tax – lower retail sales and consumer expenditures | | | (1,024 | ) |
| Property taxes – mainly reflecting tax relief provided to commercial property owners and lower speculation and vacancy tax | | | (694 | ) |
| Property transfer tax – lower year-to-date sales in the housing sector | | | (315 | ) |
| Fuel and carbon taxes – lower volume sales in all fuel types and delay of the carbon tax rate increase from April 1, 2020 to April 1, 2021 | | | (469 | ) |
| Employer health tax – mainly expected decline in employee compensation | | | (148 | ) |
| Other taxation sources – impacts of 2019/20 Public Accounts and year-to-date results | | | 20 | |
| Natural gas royalties – lower production volumes, decrease in natural gas liquids royalties, partly offset by decreased utilization of royalty and infrastructure programs/credits and higher natural gas prices | | | (113 | ) |
| Mining – lower coal prices and production and higher costs | | | (84 | ) |
| Electricity sales under the Columbia River Treaty – lower Mid-C electricity prices | | | (34 | ) |
| Forests – higher stumpage rates partly offset by lower logging tax revenue and lower harvest volumes | | | 30 | |
| Other natural resources – lower petroleum prices and production volumes, and decreased revenue from water rentals | | | (43 | ) |
| Post-secondary institution fees | | | (355 | ) |
| K-12 school district fees | | | (130 | ) |
| Other fees – mainly lower BC Transit fees and international student health fees | | | (63 | ) |
| Investment earnings – mainly decreased recoveries relating to fiscal agency loans | | | (36 | ) |
| Miscellaneous revenue – mainly lower sales in post-secondary institutions and B.C. Pavilion Corporation, and reduced motor vehicle fines | | | (413 | ) |
| COVID-19 related federal government funding | | | 2,376 | |
| Other federal government transfers – mainly lower B.C.’s share of federal excise tax revenue on cannabis | | | (22 | ) |
| Commercial Crown corporation net income – mainly due to closures of casinos during the pandemic | | | (933 | ) |
| Total revenue changes | | | (4,572 | ) |
| | | | | |
| Less: expense increases (decreases): | | | | |
| Consolidated Revenue Fund changes: | | | | |
| COVID-19 Contingencies - Vote 52: Pandemic Response and Economic Recovery | | | 5,000 | |
| Federal-Provincial cost-shared investments under the Safe Restart Agreement: | | | | |
| Provincial portion (COVID-19 Contingencies - Vote 53) | | | 810 | |
| Federal portion | | | 810 | |
| Statutory spending: | | | | |
| Fire management costs | | | 76 | |
| Emergency Program Act | | | 94 | |
| Signed agreements under the Sustainable Services Negotiating Mandate | | | 310 | |
| COVID-19 temporary pandemic pay | | | 425 | |
| Housing Priority Initiatives Special Account – purchase of hotels to house decamped homeless populations | | | 111 | |
| Sustainable Environment Fund | | | 14 | |
| Refundable tax credits – mainly due to the one-time enhancement of the Climate Action Tax Credit | | | 414 | |
| Other expense changes | | | (25 | ) |
| Management of public debt (net) | | | 83 | |
| Changes in spending profile of service delivery agencies: | | | | |
| School districts | | | 152 | |
| Universities | | | (61 | ) |
| Colleges | | | (23 | ) |
| Health authorities and hospital societies | | | 229 | |
| Other service delivery agencies 1 | | | 609 | |
| (Increase) decrease in transfers to service delivery agencies (elimination) | | | (1,281 | ) |
| Total expense changes | | | 7,747 | |
| Subtotal | | | (12,319 | ) |
| (Increase) / Reduction in forecast allowance | | | (700 | ) |
| | | | | |
| Total changes | | | (13,019 | ) |
| 2020/21 deficit at the First Quarterly Report | | | (12,792 | ) |
1 Includes BC Transportation Financing Authority, BC Transit, BC Housing Management Commission, Community Living BC, and other entities.
| | FIRST QUARTERLY REPORT 2020/21 | | 5 |
UPDATED 2020/21 FINANCIAL FORECAST
Revenue
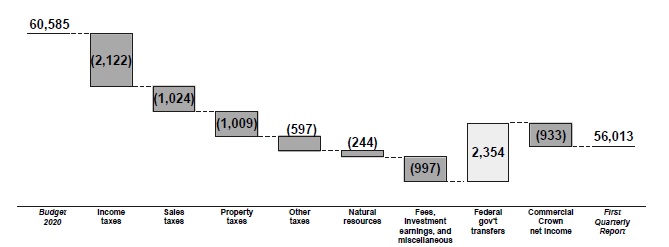
Revenue for 2020/21 is forecast to be $56.0 billion — $4.572 billion lower than the projection in Budget 2020. The decrease reflects lower revenue from taxation sources, natural resources, fees, investment earnings, miscellaneous sources and commercial Crown corporation net income, which are partly offset by increases in federal government contributions.
Chart 1.2 Revenue Changes from Budget 2020
Total revenue decreases by $4.6 billion
$ millions
Detailed revenue projections are disclosed in Table 1.7, and key assumptions and sensitivities relating to revenue are provided in Table 1.14. An analysis on historical volatility of major economic drivers can be found in the 2020 B. C. Financial and Economic Review (pages 16-17). For 2020/21, the major changes from the Budget 2020 forecast include the following:
Income Tax Revenue
Personal income tax revenue is down $978 million mainly due to the impacts of the COVID-19 pandemic on the revised outlook for employment and household income. For the 2020 calendar year, employment is projected to decline 7.8 per cent annually and household income is forecast to decline 3.3 per cent from 2019, compared to the budget assumptions of 1.0 per cent and 3.8 per cent growth, respectively.
Corporate income tax revenue is down $1,144 million mainly due to decreased advance instalments reflecting a lower federal government forecast for 2020 national corporate taxable income and corporate profits.
Employer health tax is down $148 million reflecting expected declines in employer payrolls (forecast uses employee compensation as a proxy). Due to the impacts of the COVID-19 pandemic, employee compensation is now projected to decline 6.4 per cent annually compared to the budget assumption of 4.0 per cent growth.
| 6 | | FIRST QUARTERLY REPORT 2020/21 | |
UPDATED 2020/21 FINANCIAL FORECAST
Other Tax Revenue
Provincial sales tax revenue is down $1,024 million due to the effects of lower 2019/20 results compared to the forecast in the Third Quarterly Report, the impacts of lower retail sales and consumer expenditures in 2020 and the delay of the Budget 2020 measures until April 1, 2021 as part of the government response to the global pandemic. The delayed measures are the elimination of exemptions for certain beverages and the expansion of registration requirements on sales of software and telecommunication services. The strategies taken to help limit the spread of the coronavirus outbreak including social distancing and restrictions in sectors of the economy contributed to reduced consumer purchases of taxable items and sales tax revenue.
Property tax revenue is down $694 million mainly due to lower revenues from non-residential school taxes and the speculation and vacancy tax. Lower non-residential school tax revenue mainly reflects the reductions in school property tax rates for commercial properties by an average of 25 per cent in the 2020 calendar year as part of government’s response to the COVID-19 pandemic. The outlook also includes a revised forecast of $80 million for the speculation and vacancy tax, down $105 million from budget, reflecting lower 2019/20 results.
Fuel and carbon tax revenues are down $469 million due to lower year-to-date volume sales across all fuel types as well as the delay of the carbon tax rate increase to April 1, 2021 as part of the government response to the global pandemic. The updated forecast assumes that the carbon tax rate remains at $40/tonne carbon dioxide equivalent emissions for the 2020/21 fiscal year. Carbon tax revenue is now projected to be $394 million lower than budget.
Property transfer tax revenue is down $315 million due to slower activity in the housing market. The revised outlook of $1,271 million includes the 20 per cent foreign buyers’ tax revenue, forecast at $109 million (down from $123 million estimated at budget).
Other taxation revenues are up $20 million due to the effects of 2019/20 actual results and year-to-date activity. Insurance premium tax revenue is forecast to be up $45 million, partly offset by a $25 million reduction in the tobacco tax revenue projection.
Natural Resources Revenue
Revenue from natural gas royalties is down $113 million mainly due to lower natural gas production volumes and decreased royalties from the natural gas liquids, partially offset by decreased utilization of royalty program credits and an increase in the natural gas price outlook. The updated natural gas price forecast is $0.86 ($Cdn/gigajoule, plant inlet), up from the Budget 2020 outlook ($0.62). Since the prices for natural gas liquids (e.g. pentane and condensate) are more closely aligned to oil rather than natural gas, the lower byproduct royalties from these commodities reflect the expected decline in oil prices, now forecast to be $37.40 US/barrel in 2020/21, down 39 per cent from the budget outlook.
Revenue from coal, metals, minerals and other mining-related sources is down $84 million mainly reflecting the negative effects of the COVID-19 pandemic on global prices, demand for mineral products and higher mining-related costs.
| | FIRST QUARTERLY REPORT 2020/21 | | 7 |
UPDATED 2020/21 FINANCIAL FORECAST
Revenue from electricity sales under the Columbia River Treaty is down $34 million due to lower Mid-C electricity prices mainly reflecting a reduction in demand related to COVID-19 and cooler June temperatures.
Forest revenue is up $30 million mainly due to higher timber tenures revenue reflecting improved lumber prices, partly offset by decreased revenues from logging tax due to higher refunds related to prior years and a reduction in logging activities. Due to the impacts of temporary, indefinite and permanent mill curtailments as well as the effects of COVID-19, the updated forecast for harvest volumes is 44 million cubic metres compared to 46 million cubic metres in Budget 2020. The effects of reduced Crown harvest volumes are offset by higher than expected stumpage rates. Lumber prices are a component of stumpage rate calculations with stumpage rates expected to increase as lumber prices rise. Lumber prices for Spruce-Pine-Fir 2x4 reached a record high of $940 US/thousand board feet on August 28, 2020 following eleven weeks of strong price increases.
Revenue from other natural resources is down $43 million. Revenue from petroleum royalties is down $26 million due to lower petroleum prices, mainly reflecting a decline in demand resulting from reduced global travel during the COVID-19 pandemic, and lower oil production. Other natural resource revenues are expected to be down $17 million mainly due to reduced water rentals collected under the Water Sustainability Act and lower Oil and Gas Commission fees.
Other Taxpayer-supported Revenue
Other taxpayer-supported revenue consists of revenue from fees, licences, investment earnings and miscellaneous sources. These revenue sources are now expected to total $8.7 billion, down $997 million from budget. The updated forecast for fee revenues totals $4.1 billion, down $548 million from budget mainly due to lower projections for post-secondary institutions, K-12 school districts, BC Transit and international student health fees. The revised forecast for investment earnings is $1.2 billion, down $36 million from budget mainly due to lower interest related to Fiscal Agency Loans. This lower vote recovery revenue has an equal and offsetting expense decrease. The miscellaneous revenue outlook of $3.4 billion is $413 million below budget mainly due to lower sales of goods and services in post-secondary institutions, B.C. Pavilion Corporation and reduced motor vehicle fines.
Federal Government Transfers
Federal government contributions are expected to be up $2,354 million mainly due to COVID-19 pandemic relief funding. COVID-19 related contributions totaling $2,376 million will be used in support of the Safe Restart Agreement ($1,963 million), the COVID-19 Essential Workers Support Fund ($371 million), and the Financial Assistance Agreement to Support Closure and Restoration of Oil and Gas Sites in British Columbia ($42 million). This increase is partly offset by B.C.’s share of lower federal excise tax revenue on cannabis reflecting fewer than expected licenced retail establishments.
| 8 | | FIRST QUARTERLY REPORT 2020/21 | |
UPDATED 2020/21 FINANCIAL FORECAST
Commercial Crown Corporations
The outlook for commercial Crown corporation net income is $933 million lower from Budget 2020 projections, as follows:
BC Lottery Corporation’s net income forecast is lower by $894 million due to the closure of casinos as part of the COVID-19 pandemic protective measures.
BC Liquor Distribution Branch’s net income is down $42 million due to the closure of restaurants and other establishments as well as the implementation of a temporary wholesale pricing model for liquor licensees.
The forecast for ICBC results remains unchanged from budget as potential savings from fewer accidents in the first quarter may be offset by increased risk and uncertainty for the remainder of the year.
The forecast for BC Hydro results is unchanged from budget at this time. The impacts of COVID-19 relief measures and electricity demand reductions will be deferred into the corporation’s regulatory accounts and will not impact net income. While those are likely the greatest impacts of COVID-19 on BC Hydro, operating cost pressures (including those related to COVID-19) may impact BC Hydro’s net income forecast in future quarters.
| | FIRST QUARTERLY REPORT 2020/21 | | 9 |
UPDATED 2020/21 FINANCIAL FORECAST
Expense
The First Quarterly Report expense forecast for 2020/21 is $7.747 billion higher than Budget 2020 mainly due to spending related to the COVID-19 pandemic, authorized through supplementary estimates and statutory appropriations.
Chart 1.3 Expense Changes from Budget 2020
Total expense increases by $7.7 billion
$ millions

Consolidated Revenue Fund (CRF) Spending
The total CRF direct program spending1 forecast for 2020/21 has increased by $6.8 billion mainly due to spending related to the COVID-19 pandemic, statutory spending and debt servicing costs.
Since the tabling of Budget 2020 the Legislative Assembly has passed two Supplementary Estimates to establish the following Contingencies votes in response to the COVID-19 pandemic:
| · | $5 billion for the Pandemic Response and Economic Recovery (Vote 52); and |
| · | $1 billion for the Federal and Provincial Pandemic Support (Vote 53). This funding reflects the provincial portion of the federal-provincial cost-shared investments under the Safe Restart Agreement, which at this time is forecast $810 million. |
The full range of the provincial measures in response to the COVID-19 crisis is outlined in the topic box (pages 13-16), including spending details for Votes 52 and 53.
Statutory spending is projected at $1.4 billion in 2020/21 as follows:
| · | $425 million for the COVID-19 temporary pandemic pay; |
| · | $310 million for the signed agreements under the Sustainable Services Negotiating Mandate; |
| · | $94 million for Emergency Program Act expenses primarily related to prior-year floods ($35 million) and costs in response to the COVID-19 pandemic ($44 million); |
1 Expenses other than grants to government agencies — see Table 1.8 Total direct program spending.
| 10 | | FIRST QUARTERLY REPORT 2020/21 | |
UPDATED 2020/21 FINANCIAL FORECAST
| · | $76 million for fire management and preparedness costs; |
| · | $125 million in other statutory spending including $111 million to fund the purchases of hotels to house decamped homeless populations; and |
| · | $414 million in higher refundable tax transfers mainly due to the one-time enhancement of the Climate Action Tax Credit ($500 million), partly offset by lower tax credits for foreign film production. |
Debt servicing costs are forecast to be $83 million higher than at budget due to higher debt levels.
Other CRF spending increased by $5 million.
Contingencies
Budget 2020 includes a Contingencies Vote of $1.066 billion in 2020/21, which was notionally allocated as follows:
| · | $600 million to help manage uncertain costs and pressures including funding for increases in demand-driven programs and priority initiatives; and |
| · | $466 million notionally allocated to support new collective agreements consistent with Sustainable Services Negotiating Mandate. |
Statutory spending authority of $310 million is forecast to be utilized for the increases to salary and benefit payments negotiated under the Sustainable Services Negotiating Mandate. As a result, further capacity in the Contingencies Vote is available to help manage emerging costs and pressures.
Spending Recovered from Third Parties
Expenses funded by third parties are forecast to increase by $780 million mainly due to the $810 million federal contribution towards the federal-provincial cost-shared investments under the Safe Restart Agreement. This increase is partially offset by lower spending recovered from gaming revenue.
Operating Transfers to Service Delivery Agencies
Operating transfers to service delivery agencies are forecast to be $1.3 billion higher than Budget 2020 mainly due to increased allocations to various agencies for the concluded collective agreements, and to fund additional expenses related to the COVID-19 pandemic. These funding increases are related to spending forecast changes noted on the next page.
| | FIRST QUARTERLY REPORT 2020/21 | | 11 |
UPDATED 2020/21 FINANCIAL FORECAST
Service Delivery Agency Spending
Service delivery agency expenses are forecast to increase by $906 million in 2020/21 compared to Budget 2020.
| · | School district expense forecasts are higher by $152 million mainly to reflect the concluded collective agreements, and higher operating costs to support a safe return to school during the COVID-19 pandemic. This forecast does not include additional funding that may be provided from the recently announced federal contribution for reopening the schools safely. |
| · | Post-secondary sector expenses are forecast to decrease by $84 million mainly due to lower operating costs as a result of the COVID-19 pandemic. |
| · | The health authority and hospital society expense forecast is up $229 million, mainly due to higher staffing and equipment needs (including PPE, testing equipment, ventilators and beds), as well as contact tracing and increased rural and remote community supports due to COVID-19. At this time, the forecast does not include additional funding that may be allocated to health authorities from the Contingencies Vote 52. |
| · | Other service delivery agency spending is forecast to be $609 million higher than budget, mainly related to increased shelter and housing expenses to support vulnerable populations during the COVID-19 pandemic. |
Detailed expense projections are disclosed in Table 1.8. Key spending assumptions and sensitivities are provided in Table 1.15.
| 12 | | FIRST QUARTERLY REPORT 2020/21 | |
UPDATED 2020/21 FINANCIAL FORECAST
COVID-19 Pandemic Spending & Related Measures
This section provides an overview of the Province’s pandemic response measures, including an update on notional allocations from the $5 billion Pandemic Contingencies vote as of August 31, 2020, as well as a summary of tax and payment relief and deferral measures. This enhanced reporting follows the presentation of information set out in the July 14 Economic and Fiscal Update. This section also includes estimated spending through the first quarter only (April - June, 2020) on COVID-19 related programs.
Vote 52 Contingencies (All Ministries): Pandemic Response and Economic Recovery
On March 23, 2020, the Legislative Assembly authorized supplementary estimates of $5 billion and a new Vote 52 - Contingencies for Pandemic Response and Economic Recovery (Pandemic Contingencies). Government has notionally allocated $3.5 billion of the $5 billion Pandemic Contingencies for critical services and financial relief measures and has set aside $1.5 billion for economic recovery measures that will be announced in September 2020.
Critical services include health and mental health related response, supports for child care providers, and providing essential social services to vulnerable populations such as adults with developmental disabilities, people experiencing homelessness, and children, youth and young adults receiving provincial supports. This category of spending also includes $46 million in funding for the K-12 education sector to support school restart activities (but does not yet include any additional funding that may be provided from the federal government).
Table 1 – Vote 52 Pandemic Contingencies Notional Allocations as of August 31, 2020
| Category | Notional | Measures |
| | Allocation | |
| | Over $1 billion | Health and mental health |
| | $254 million | Child care services |
Critical services | $158 million | Temporary housing, meals and supports for vulnerable populations |
| | $56 million | Essential services for adults with developmental disabilities, vulnerable children and youth, family justice and victim services, and public health communications |
| | $46 million | K-12 Education - safe return to school funding |
| | $900 million | B.C. Emergency Benefit for Workers |
| | $685 million | Crisis Supplement and other supports for income and disability assistance clients |
Financial supports | $150 million | Temporary Rental Supplement |
| | $79 million | Canada Emergency Commercial Rent Assistance Program |
| | Over $70 million | Emergency financial relief for organizations providing animal care, the agriculture sector, park operators and community tourism organizations, Domestic Motion Picture providers, local sports organizations and B.C. Pavilion Corporation. |
Economic Recovery | $1.5 billion | Measures to be announced in September 2020 |
| Total | $5 billion | Pandemic Contingencies Spending Measures |
| | FIRST QUARTERLY REPORT 2020/21 | | 13 |
UPDATED 2020/21 FINANCIAL FORECAST
Financial relief measures include income supports, such as the B.C. Emergency Benefit for Workers, and the crisis supplement for income and disability assistance clients including low-income seniors. Measures also include rental relief assistance for individuals, families and businesses, and targeted financial relief for a number of sectors.
Details on the Pandemic Contingencies notional allocations as of August 31, 2020 are shown in Table 1. The key changes from the July 14 update include:
| · | Updated forecast of $900 million for the B.C. Emergency Benefit for Workers; |
| · | Updated forecast of $685 million for the crisis supplement and other income assistance supports, which was extended to December; |
| · | $106 million for the Pandemic Pay has been removed, as the full provincial and federal amount ($425 million) will be funded through statutory spending as per Table 2; and |
| · | $46 million for K-12 return to school funding added. |
Descriptions of all measures can be found in Appendix A (pages 43-47).
Actual expenditures through Q1 for Pandemic Contingencies measures totalled $1.036 billion. This includes:
| · | $606 million for the B.C. Emergency Benefit for Workers; |
| · | $233 million for the crisis supplement; |
| · | $178 million for child care services; and |
| · | $19 million across a number of other measures including agriculture supports, supports for vulnerable children and youth, and mental health services. |
Note that first quarter actual spending (April - June, 2020) is based on unaudited ministry reports and subject to normal changes from quarterly estimation and adjustment processes.
There was also nearly $18 million of COVID-19 related expenditures from ministry base budgets in the April - June, 2020 period.
Vote 53 Contingencies (All Ministries): Federal and Provincial Pandemic Support
On July 16, 2020, the federal, provincial and territorial governments announced plans for a Safe Restart Agreement, which aims to support the reopening of provincial and territorial economies over the next six to eight months.
Under the Agreement, the federal government has committed $19 billion in funding for seven priority areas, with close to $2 billion allocated for B.C. While some of the federal funding will be used to offset the cost of continuing significant measures in B.C. that are already underway or planned, part of the agreement requires 50/50 provincial/federal cost-sharing. This relates specifically to municipal and transit-related relief and restart measures.
On August 14, 2020, the Legislative Assembly authorized Vote 53 Contingencies (All Ministries): Federal and Provincial Pandemic Support. The new Vote 53 Contingencies provides up to $1 billion net spending appropriation for the Province to support the cost-share arrangement for municipal and transit funding, and other pandemic priorities.
Preliminary spending allocations for Vote 53 are $810 million for municipal and transit related restart supports, however, detailed spending allocations are still under development.
Other COVID-19 Response and Relief Measures
In addition to the new $5 billion Pandemic Contingencies spending measures, government has implemented a number of other measures which include tax and revenue measures, and statutory spending related to COVID-19.
Tax measures include a reduction in school tax for commercial properties by an average of 25 per cent in the 2020 calendar year and the one-time Climate Action Tax Credit enhancement. Government has also delayed the scheduled increase to the carbon tax rate and other new Budget 2020 tax measures.
| 14 | | FIRST QUARTERLY REPORT 2020/21 | |
UPDATED 2020/21 FINANCIAL FORECAST
Revenue relief measures include temporary wholesale pricing model for restaurants, bars and tourism operators with liquor licences, and ICBC payment relief and deferral measures.
Statutory spending directly related to COVID-19 includes funding for the Pandemic Pay for frontline workers in health and social sectors (a federal-provincial cost-sharing initiative), hotel purchases to support homelessness response measures, and spending related to COVID-19 emergency coordination and response.
Government also approved revised spending targets for the Forest Enhancement Society of BC to ensure its tree planting continues as planned to secure future economic and environmental benefits while meeting the new COVID-19 related guidelines for industrial camps.
The estimated provincial value of these measures is nearly $1.8 billion as shown in Table 2.
Government has also implemented payment deferral measures to provide administrative and financial relief to individuals, businesses and municipalities. This includes a six-month moratorium on student loan collection, BC Hydro bill relief for residential and commercial customers, and bill deferrals for industrial customers and deferred school tax remittance for municipalities. It also included short-term deferrals on stumpage fees between May 1, 2020 to July 31, 2020, of which, an estimated $2 million was deferred and has since been repaid. Government has also provided administrative relief by extending tax filing and payment deadlines for the employer health tax, provincial sales tax, municipal and regional district tax on short-term accommodation, tobacco tax, motor fuel tax, and carbon tax.
The values of eligible deferrals continue to be estimated at over $6.2 billion as shown in Table 3. As these payments are expected to be received at a later date, they do not directly impact the fiscal plan. There may be payment defaults on some of these revenues owed to government, depending on the breadth and duration of the pandemic, as well as consumer and business confidence and behaviour. As cash payments are received starting in October, any adjustments related to doubtful accounts will be made if necessary and incorporated into future quarterly report forecasts. The First Quarterly Report update includes an additional $10 million provision for doubtful accounts related to forest revenues, which is unrelated to deferral measures.
Table 2 – Other Response and Temporary Relief Measures
| Estimated Cost | Measure |
| $714 million | Reduced school tax for commercial properties for the 2020 calendar year ($566 million in fiscal 2020/21) |
| $500 million | Climate Action Tax Credit one-time enhancement |
$106 million
($425 million
federal-provincial) | Pandemic Pay for Frontline Workers |
| $111 million | Purchase of hotels to house decamped homeless populations |
| $268 million | Delays to increase the carbon tax rate and other new tax measures |
| $44 million | Emergency Program Act – COVID-19 related coordination and measures |
| $26 million | Temporary wholesale pricing model for liquor licensees |
| $17 million | ICBC temporary fee relief measures |
| $11 million | Forest Enhancement Society of BC – tree planting camps |
| $1,797 billion | Provincial Total for Other Response and Temporary Relief Measures |
| | FIRST QUARTERLY REPORT 2020/21 | | 15 |
UPDATED 2020/21 FINANCIAL FORECAST
Table 3 – Payment Deferral Measures (no direct operating fiscal impact)
Estimated value of deferral | Measure |
| $70 million | Six-month moratorium on student fee collection |
| $103 million | BC Hydro bill deferrals for industrial customers and bill relief measures |
| Over $1 billion | Postponing municipal remittance date for school taxes to the end of the calendar year |
| Over $5 billion | Extending tax filing and payment deadlines for the employer health tax, provincial sales tax, municipal and regional district tax on short-term accommodation, tobacco tax, motor fuel tax, and carbon tax. |
| Over $6.2 billion | Total Value of Deferrals |
| 16 | | FIRST QUARTERLY REPORT 2020/21 | |
UPDATED 2020/21 FINANCIAL FORECAST
July 14 Economic and Fiscal Update
In response to the major changes resulting from the COVID-19 pandemic, on July 14, 2020 the B.C. Ministry of Finance released an economic and fiscal update. Given the limited data available at the time and various elements of uncertainty regarding the depth and duration of the economic slowdown, a scenario was developed to provide a possible economic and fiscal outcome for B.C. for 2020-2021.
The First Quarterly Report confirms the revenue declines in taxation, natural resources, and other sources that were anticipated on July 14. However, the overall impacts on revenues and expenses are lower, with a $5.7 billion decline from Budget 2020 compared to a $6.3 billion decline shown in the July 14 scenario.
Other changes since the scenario update include funding from the federal-provincial Safe Restart Agreement with the related provincial spending for the cost-shared initiatives, increased statutory spending, and lower interest expense due to lower debt and interest rate projections.
Table 1.3 2020/21 Q1 Forecast and July 14 (Scenario) Changes from Budget 2020
| | | ($ millions) | |
| | | July 14 | | | Q1 | | | Difference | |
| Effects of COVID-19 and other changes | | | | | | | | | | | | |
| Personal income tax revenue | | | (999 | ) | | | (978 | ) | | | 21 | |
| Corporate income tax revenue | | | (973 | ) | | | (1,144 | ) | | | (171 | ) |
| Provincial sales tax revenue | | | (1,305 | ) | | | (986 | ) | | | 319 | |
| Employer health tax revenue | | | (238 | ) | | | (148 | ) | | | 90 | |
| Fuel tax revenue | | | (117 | ) | | | (75 | ) | | | 42 | |
| Carbon tax revenue | | | (265 | ) | | | (164 | ) | | | 101 | |
| Property tax revenues | | | (40 | ) | | | (128 | ) | | | (88 | ) |
| Property transfer tax revenue | | | (425 | ) | | | (315 | ) | | | 110 | |
| Natural resource revenues | | | (293 | ) | | | (244 | ) | | | 49 | |
| All other CRF revenues | | | (77 | ) | | | (76 | ) | | | 1 | |
| Refundable tax transfers (tax credits) | | | 141 | | | | 86 | | | | (55 | ) |
| Commercial Crown corporation net income | | | (882 | ) | | | (890 | ) | | | (8 | ) |
| Taxpayer-supported agency impacts | | | (869 | ) | | | (632 | ) | | | 250 | |
| | | | (6,342 | ) | | | (5,694 | ) | | | 661 | |
| Pandemic Response Measures | | | | | | | | | | | | |
| Pandemic Response & Economic Recovery | | | (5,000 | ) | | | (5,000 | ) | | | - | |
| Provincial portion of the Cost-Share Safe Restart Agreement | | | - | | | | (810 | ) | | | (810 | ) |
| Federal portion of the Cost-Share Safe Restart Agreement | | | - | | | | (810 | ) | | | (810 | ) |
| Enhancement of the Climate Action Tax Credit | | | (500 | ) | | | (500 | ) | | | - | |
| COVID-19 temporary pandemic pay | | | - | | | | (425 | ) | | | (425 | ) |
| Other business relief and tax measures | | | (733 | ) | | | (877 | ) | | | (144 | ) |
| Federal government COVID-19 related funding 1 | | | - | | | | 2,376 | | | | 2,376 | |
| | | | | | | | | | | | | |
| Statutory and other spending | | | - | | | | (496 | ) | | | (496 | ) |
| Management of Public Debt | | | (176 | ) | | | (83 | ) | | | 93 | |
| Total changes compared to Budget 2020 | | | (12,751 | ) | | | (12,319 | ) | | | 445 | |
| Budget 2020 Operating Surplus | | | 227 | | | | 227 | | | | - | |
| Increased Forecast Allowance | | | - | | | | (700 | ) | | | (700 | ) |
| 2020/21 Q1 deficit forecast | | | (12,524 | ) | | | (12,792 | ) | | | (255 | ) |
| 1 | Includes $810 million for municipal and transit funding, part of the $1,963 million Safe Restart Agreement; $371 million for pandemic pay; and $42 million for closure and restoration of orphan wells. |
| | FIRST QUARTERLY REPORT 2020/21 | | 17 |
UPDATED 2020/21 FINANCIAL FORECAST
Full-Time Equivalents for the BC Public Service
The projection of full-time equivalent (FTE) staff utilization for 2020/21 remains unchanged from budget at 31,800 FTEs.
Provincial Capital Spending
Capital spending is projected to total $10.4 billion in 2020/21 — $148 million lower than the forecast in Budget 2020 (see Tables 1.4 and 1.10).
| Table 1.4 2020/21 Capital Spending Update | | | |
| | | ($ millions) | |
| 2020/21 capital spending at Budget 2020 | | | 10,535 | |
| Taxpayer-supported changes: | | | | |
| Primarily higher projected own-source school district spending | | | 49 | |
| Timing of post-secondary institution spending | | | (26 | ) |
| Timing of health authority spending | | | (52 | ) |
| Timing of transportation sector spending | | | (210 | ) |
| Higher social housing spending | | | 124 | |
| Other net adjustments to capital schedules | | | 4 | |
| Total taxpayer-supported | | | (111 | ) |
| Self-supported changes: | | | | |
| Timing of Liquor Distribution Branch spending | | | (32 | ) |
| Lower other spending | | | (5 | ) |
| Total self-supported | | | (37 | ) |
| Total changes | | | (148 | ) |
| 2020/21 capital spending at the First Quarterly Report | | | 10,387 | |
Taxpayer-supported capital spending is projected at $7.0 billion. The $111 million decrease since Budget 2020 is mainly due to timing changes in procurement and capital spending for transportation projects and to a lesser extent health projects. This is partially offset by higher capital spending on supportive housing and higher projected capital spending on projects funded from school districts’ own sources.
At $3.4 billion, self-supported capital spending is $37 million lower than Budget 2020 mainly due to changes to the timing of BC Liquor Distribution Branch projects.
Projects Over $50 Million
Capital spending on projects greater than $50 million is presented in Table 1.11. Since Budget 2020 three projects have been added to the table:
| · | Cowichan District Hospital ($887 million); |
| · | Dawson Creek and District Hospital ($378 million); and |
| · | Street light replacement program project ($80 million). |
| 18 | | FIRST QUARTERLY REPORT 2020/21 | |
UPDATED 2020/21 FINANCIAL FORECAST
The following projects have been completed since Budget 2020 and are no longer listed in the table:
| · | Kitsilano Secondary School; |
| · | University of British Columbia Undergraduate Life Science Teaching Laboratories Redevelopment project; |
| · | Camosun College Centre for Health Sciences project; |
| · | Queen Charlotte/Haida Gwaii Hospital; |
| · | Surrey Emergency/Critical Care Tower project; |
| · | North Island Hospitals project; |
| · | Vancouver General Hospital Joseph and Rosalie Segal Family Health Centre project; |
| · | Highway 97 Stone Creek to Williams Road project; |
| · | Kamloops substation project; and |
| · | BC Liquor Distribution Branch Warehouse project. |
Changes since Budget 2020 for existing projects include:
| · | Grandview Heights Secondary School project costs have decreased from $85 million to $83 million to reflect the updated post-tender budget; |
| · | Handsworth Secondary School project completion date changed from 2021 to 2022 to align with revised project schedule. Total cost has been updated from $70 million to $69 million to reflect the post-tender budget; |
| · | Eric Hamber Secondary School project costs have decreased from $109 million to $105 million to reflect the updated post-tender budget; |
| · | British Columbia Institute of Technology Health Sciences Centre for Advanced Simulation project completion date changed from 2021 to 2022 to align with revised project schedule; |
| · | University of Victoria Student Housing project costs increased from $201 million to $232 million to reflect increased costs due to market conditions. Internal borrowing increased from $123 million to $128 million and other contributions increased from $78 million to $104 million; |
| · | Red Fish Healing Centre for Mental Health and Addiction - qəqi? †əw?ənəq leləm (formerly reported as Centre for Mental Health and Addictions) project cost increased from $101 million to $131 million, reflecting archeological considerations and additional site remediation costs; |
| · | Lions Gate Hospital New Acute Care Facility total project cost increased from $166 million to $255 million. Internal borrowing increased by $89 million to reflect updated costing and refined scope; |
| · | Burnaby Hospital Redevelopment Phase 1 project cost increased from $547 million to $577 million. Internal borrowing increased from $513 million to $543 million to reflect an increased project scope; |
| · | Clinical and Systems Transformation project completion date changed from 2023 to 2025 to align with the revised project schedule. Internal borrowing increased from $480 million to $702 million to accommodate revised scope and timelines; |
| | FIRST QUARTERLY REPORT 2020/21 | | 19 |
UPDATED 2020/21 FINANCIAL FORECAST
| · | iHealth Project (Vancouver Island Health Authority) project completion date changed from 2020 to 2025 to align with the revised project schedule. Internal borrowing increased by $55 million to accommodate revised scope and timelines; |
| · | Highway 99 10-Mile Slide project completion date changed from 2020 to 2021 to align with the revised project schedule; |
| · | Highway 1 Chase 4-laning (formerly reported as Highway 1 Hoffman’s Bluff to Jade Mountain) project costs have increased from $199 million to $260 million reflecting more detailed engineering work, further consultation and increased construction costs due to market conditions. Internal borrowing increased from $144 million to $248 million and Federal contributions decreased from $55 million to $12 million; |
| · | Highway 1 Salmon Arm West project costs have increased from $163 million to $185 million reflecting more detailed engineering work, further consultation and increased construction costs due to market conditions. Internal borrowing increased from $115 million to $154 million and Federal contributions decreased from $48 million to $31 million; |
| · | Stanley New Fountain Hotel (Affordable Rental Housing) project completion date changed from 2021 to 2022 to align with revised project schedule. Project costs increased from $63 million to $69 million to accommodate revised project schedule and cost escalation. Internal borrowing decreased from $20 million to $19 million and other contributions increased from $43 million to $50 million; |
| · | 6585 Sussex Ave (Affordable Rental Housing) project completion date changed from 2021 to 2022 to align with revised project schedule; |
| · | Clark & 1st Ave (Affordable Rental Housing) project completion date changed from 2023 to 2024 to align with revised project schedule. Project costs increased from $100 million to $109 million to accommodate revised project schedule and cost escalation. Internal borrowing increased from $67 million to $75 million and other contributions increased from $33 million to $34 million; |
| · | Ruskin Dam safety and powerhouse upgrade project costs decreased from $642 million to $638 million; |
| · | Horne Payne substation upgrade project costs have increased from $70 million to $71 million; |
| · | John Hart generating station replacement project costs have decreased from $980 million to $979 million; |
| · | Bridge River 2 units 5 and 6 upgrade project costs have decreased from $78 million to $74 million; |
| · | Supply Chain Applications project costs have increased from $68 million to $69 million; |
| · | Mica replace units 1 to 4 generator transformers project costs have decreased from $82 million to $80 million; |
| · | G.M. Shrum G1 to 10 control system upgrade project completion date changed from 2022 to 2023 to align with the revised project schedule; and |
| · | ICBC’s Enhanced Care Coverage Program project costs have increased from $92 million to $94 million to reflect updated project cost. |
| 20 | | FIRST QUARTERLY REPORT 2020/21 | |
UPDATED 2020/21 FINANCIAL FORECAST
Provincial Debt
The provincial debt, including a $1 billion forecast allowance, is projected to total $87.9 billion by the end of the fiscal year — $11.5 billion higher than the forecast in Budget 2020. This increase is primarily due to the anticipated operating deficit of $12.8 billion for the year.
| Table 1.5 2020/21 Provincial Debt Update | | | |
| | | ($ millions) | |
| 2020/21 provincial debt forecast at Budget 2020 | | | 76,392 | |
| Taxpayer-supported changes: | | | | |
| Higher debt level from 2019/20 | | | 1,660 | |
| Change in operating results (before forecast allowance) | | | 12,319 | |
| Increase in cash and temporary investments | | | 1,342 | |
| Increase in accounts payable and deferred revenue | | | (2,183 | ) |
| Decrease in accounts receivable | | | (592 | ) |
| Decrease in loans, advances and mortgages receivable | | | (1,185 | ) |
| Decrease in sinking fund balances | | | (193 | ) |
| Decrease in prepaid program costs and other non-financial assets | | | (538 | ) |
| Lower capital spending | | | (111 | ) |
| Lower contributions from external parties | | | 81 | |
| Total taxpayer-supported | | | 10,600 | |
| Self-supported changes: | | | | |
| Higher debt level from 2019/20 | | | 163 | |
| Lower capital spending | | | (37 | ) |
| Changes in internal financing | | | 52 | |
| Total self-supported | | | 178 | |
| | | | | |
| Forecast allowance increase | | | 700 | |
| | | | | |
| Total changes | | | 11,478 | |
| | | | | |
| 2020/21 provincial debt forecast at the First Quarterly Report | | | 87,870 | |
Total debt at the end of 2019/20 was $1.8 billion higher than the Budget 2020 forecast (excluding the forecast allowance), mainly due to the pre-borrowing to ensure liquidity during the COVID-19 pandemic.
Taxpayer-supported debt is forecast to be $59.8 billion at the end of 2020/21 — $10.6 billion higher than forecast in Budget 2020. This increase reflects the change in operating results of $12.3 billion (before forecast allowance), higher opening balance of $1.7 billion, and $1.3 billion higher cash held for increased liquidity, partly offset by an increase in accounts payable and deferred revenue of $2.2 billion, and decrease in other working capital of $2.5 billion.
The taxpayer-supported debt-to-GDP ratio is projected to end 2020/21 at 20.8 per cent — 5.3 percentage points higher than forecast in Budget 2020. The taxpayer-supported debt-to-revenue ratio is forecast to end the fiscal year at 110.6 per cent — 26.5 percentage points higher than forecast in Budget 2020.
| | FIRST QUARTERLY REPORT 2020/21 | | 21 |
UPDATED 2020/21 FINANCIAL FORECAST
Self-supported debt is forecast to be $27.1 billion at the end of 2020/21 — $178 million higher than Budget 2020, reflecting higher than expected 2019/20 debt ($163 million) and lower than expected internal financing ($52 million), partly offset by a decrease in capital infrastructure investments ($37 million).
The forecast allowance has been increased by $700 million to mirror the operating statement forecast allowance.
While there is an increase in borrowing and higher debt levels, the B.C. government is able to borrow at low interest rates, which is partly due to province’s triple-A credit rating. As a result, debt affordability remains at levels that are lower than they have been historically, as shown on Chart 1.4 below.
Chart 1.4 Debt Affordability
Interest bite for Taxpayer-Supported Debt
(cents per dollar of revenue)1
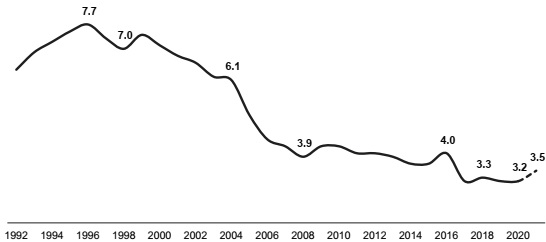
1 The ratio of interest costs (less sinking fund interest) to revenue. Figures include capitalized interest expense in order to provide a more comparable measure to outstanding debt.
Details on provincial debt are shown in Table 1.12.
Total provincial debt is presented consistent with the Debt Summary Report included in the Public Accounts. Debt is shown net of sinking fund investments and unamortized discounts, excludes accrued interest, and includes non-guaranteed debt directly incurred by commercial Crown corporations and debt guaranteed by the Province. The reconciliation between provincial debt and the financial statement debt is shown in Table 1.13.
| 22 | | FIRST QUARTERLY REPORT 2020/21 | |
UPDATED 2020/21 FINANCIAL FORECAST
Risks to the Fiscal Forecast
The global response to the COVID-19 pandemic to protect the health and safety of people included social distancing rules, self-isolation processes, border closures and restrictions and shutdowns in some sectoral and regional parts of the global economy. Governments around the world also implemented various measures and strategies to provide liquidity and financial relief to individuals and businesses.
The major risks to the updated economic and fiscal forecasts are the extent of the spread or containment of the virus in B.C. and its major trading partners; and the behaviour and confidence of individuals, consumers and businesses during Phase 3 of BC’s Restart Plan. The uncertainty of the depth and duration of the pandemic as well as the pace and timing of the recovery contributes to the volatility in the updated fiscal outlook.
Personal and corporate income tax assessments for the 2019 tax year will not be finalized until March 2021. In addition, delays provided to individuals and businesses to file their income tax returns means that less information is available now which could result in further revenue and tax transfer expense adjustments related to the 2019 income tax entitlement. Property transfer tax and provincial sales tax revenues are impacted by the number of residential transactions, average home sale prices and the amount of taxable purchases of goods and services. The global COVID-19 pandemic has resulted in heightened risks to these and other factors affecting own source revenues, including net income of commercial Crown corporations.
The spending forecast contained in the fiscal plan is based on ministry and service delivery agency plans and strategies and the allocations of the additional Contingencies in Vote 52 and Vote 53. Risks include the extent of the spread of the COVID-19 virus in addition to changes in planning assumptions such as utilization or demand rates for government services in the health care, education, community social services sectors, as well as costs associated with natural disasters.
In recognition of the heightened risks this year, the updated forecast includes a $1.0 billion forecast allowance, a $700 million increase from budget.
Capital spending may be influenced by several factors including physical distancing on work sites, design development, procurement activity, weather, geotechnical conditions and interest rates. Risks associated with operating results and capital spending could also affect debt levels.
As a result, the actual operating result, capital spending and debt figures may differ from the current forecast. Government will continue to update the fiscal outlook throughout the year in the second and third quarterly reports.
The potential fiscal impacts from these risks may be partly offset by the prudence incorporated in the updated forecast, including the lower economic outlook compared to the private sector forecasters, the $600 million contingencies vote allocation and the $1.0 billion forecast allowance.
| | FIRST QUARTERLY REPORT 2020/21 | | 23 |
UPDATED 2020/21 FINANCIAL FORECAST
Supplementary Schedules
The following tables provide the financial results for the three months ended June 30, 2020 and the 2020/21 full-year forecast.
| 24 | | FIRST QUARTERLY REPORT 2020/21 | |
UPDATED 2020/21 FINANCIAL FORECAST
Table 1.6 2020/21 Operating Statement
| | | Year-to-Date to June 30 | | | Full Year | |
| | | 2020/21 | | | Actual | | | 2020/21 | | | Actual | |
| ($ millions) | | Budget | | | Actual | | | Variance | | | 2019/20 | | | Budget | | | Forecast | | | Variance | | | 2019/20 | |
| Revenue | | | 15,695 | | | | 13,980 | | | | (1,715 | ) | | | 15,226 | | | | 60,585 | | | | 56,013 | | | | (4,572 | ) | | | 58,660 | |
| Expense | | | (14,474 | ) | | | (15,108 | ) | | | (634 | ) | | | (13,973 | ) | | | (60,058 | ) | | | (67,805 | ) | | | (7,747 | ) | | | (58,981 | ) |
| Surplus(deficit) before forecast allowance | | | 1,221 | | | | (1,128 | ) | | | (2,349 | ) | | | 1,253 | | | | 527 | | | | (11,792 | ) | | | (12,319 | ) | | | (321 | ) |
| Forecast allowance | | | - | | | | - | | | | - | | | | - | | | | (300 | ) | | | (1,000 | ) | | | (700 | ) | | | - | |
| Surplus(deficit) | | | 1,221 | | | | (1,128 | ) | | | (2,349 | ) | | | 1,253 | | | | 227 | | | | (12,792 | ) | | | (13,019 | ) | | | (321 | ) |
| Accumulated surplus beginning of the year | | | 8,754 | | | | 8,106 | | | | (648 | ) | | | 8,551 | | | | 8,754 | | | | 8,106 | | | | (648 | ) | | | 8,427 | |
| Accumulated surplus(deficit) before comprehensive income | | | 9,975 | | | | 6,978 | | | | (2,997 | ) | | | 9,804 | | | | 8,981 | | | | (4,686 | ) | | | (13,667 | ) | | | 8,106 | |
| Accumulated other comprehensive income from self-supported Crown agencies | | | 35 | | | | 545 | | | | 510 | | | | 802 | | | | 65 | | | | (172 | ) | | | (237 | ) | | | (224 | ) |
| Accumulated surplus(deficit) end of period | | | 10,010 | | | �� | 7,523 | | | | (2,487 | ) | | | 10,606 | | | | 9,046 | | | | (4,858 | ) | | | (13,904 | ) | | | 7,882 | |
| | FIRST QUARTERLY REPORT 2020/21 | | 25 |
UPDATED 2020/21 FINANCIAL FORECAST
Table 1.7 2020/21 Revenue by Source
| | | Year-to-Date to June 30 | | Full Year | |
| | | 2020/21 | | | Actual | | | 2020/21 | | | Actual | |
| ($ millions) | | Budget | | | Actual | | | Variance | | | 2019/20 | | | Budget | | | Forecast | | | Variance | | | 2019/20 | |
| Taxation | | | | | | | | | | | | | | | | | | | | | | | | | | | | | | | | |
| Personal income | | | 2,910 | | | | 2,532 | | | | (378 | ) | | | 2,731 | | | | 11,771 | | | | 10,793 | | | | (978 | ) | | | 10,657 | |
| Corporate income | | | 2,346 | | | | 2,346 | | | | - | | | | 2,108 | | | | 4,739 | | | | 3,595 | | | | (1,144 | ) | | | 5,011 | |
| Employer health | | | 479 | | | | 456 | | | | (23 | ) | | | 460 | | | | 1,924 | | | | 1,776 | | | | (148 | ) | | | 1,897 | |
| Sales 1 | | | 2,079 | | | | 1,506 | | | | (573 | ) | | | 1,955 | | | | 7,905 | | | | 6,881 | | | | (1,024 | ) | | | 7,374 | |
| Fuel | | | 252 | | | | 219 | | | | (33 | ) | | | 253 | | | | 1,024 | | | | 949 | | | | (75 | ) | | | 1,008 | |
| Carbon | | | 489 | | | | 357 | | | | (132 | ) | | | 406 | | | | 1,954 | | | | 1,560 | | | | (394 | ) | | | 1,682 | |
| Tobacco | | | 205 | | | | 180 | | | | (25 | ) | | | 205 | | | | 755 | | | | 730 | | | | (25 | ) | | | 729 | |
| Property | | | 750 | | | | 681 | | | | (69 | ) | | | 679 | | | | 3,026 | | | | 2,332 | | | | (694 | ) | | | 2,608 | |
| Property transfer | | | 426 | | | | 330 | | | | (96 | ) | | | 379 | | | | 1,586 | | | | 1,271 | | | | (315 | ) | | | 1,609 | |
| Insurance premium | | | 165 | | | | 165 | | | | - | | | | 156 | | | | 660 | | | | 705 | | | | 45 | | | | 691 | |
| | | | 10,101 | | | | 8,772 | | | | (1,329 | ) | | | 9,332 | | | | 35,344 | | | | 30,592 | | | | (4,752 | ) | | | 33,266 | |
| Natural resources | | | | | | | | | | | | | | | | | | | | | | | | | | | | | | | | |
| Natural gas royalties | | | 49 | | | | 27 | | | | (22 | ) | | | 30 | | | | 207 | | | | 94 | | | | (113 | ) | | | 118 | |
| Forests | | | 153 | | | | 111 | | | | (42 | ) | | | 197 | | | | 867 | | | | 897 | | | | 30 | | | | 988 | |
| Other natural resources 2 | | | 237 | | | | 195 | | | | (42 | ) | | | 279 | | | | 1,075 | | | | 914 | | | | (161 | ) | | | 1,162 | |
| | | | 439 | | | | 333 | | | | (106 | ) | | | 506 | | | | 2,149 | | | | 1,905 | | | | (244 | ) | | | 2,268 | |
| Other revenue | | | | | | | | | | | | | | | | | | | | | | | | | | | | | | | | |
| Medical Services Plan premiums | | | - | | | | - | | | | - | | | | 351 | | | | - | | | | - | | | | - | | | | 1,063 | |
| Fees and licenses 3 | | | 944 | | | | 840 | | | | (104 | ) | | | 914 | | | | 4,667 | | | | 4,119 | | | | (548 | ) | | | 4,509 | |
| Investment earnings | | | 317 | | | | 311 | | | | (6 | ) | | | 299 | | | | 1,247 | | | | 1,211 | | | | (36 | ) | | | 1,263 | |
| Miscellaneous 4 | | | 839 | | | | 655 | | | | (184 | ) | | | 814 | | | | 3,798 | | | | 3,385 | | | | (413 | ) | | | 3,838 | |
| | | | 2,100 | | | | 1,806 | | | | (294 | ) | | | 2,378 | | | | 9,712 | | | | 8,715 | | | | (997 | ) | | | 10,673 | |
| Contributions from the federal government | | | | | | | | | | | | | | | | | | | | | | | | | | | | | | | | |
| Health and social transfers | | | 1,921 | | | | 1,920 | | | | (1 | ) | | | 1,851 | | | | 7,683 | | | | 7,681 | | | | (2 | ) | | | 7,494 | |
| COVID-19 related funding | | | - | | | | - | | | | - | | | | - | | | | - | | | | 2,376 | | | | 2,376 | | | | - | |
| Other federal government contributions 5 | | | 475 | | | | 426 | | | | (49 | ) | | | 404 | | | | 2,280 | | | | 2,260 | | | | (20 | ) | | | 2,041 | |
| | | | 2,396 | | | | 2,346 | | | | (50 | ) | | | 2,255 | | | | 9,963 | | | | 12,317 | | | | 2,354 | | | | 9,535 | |
| Commercial Crown corporation net income | | | | | | | | | | | | | | | | | | | | | | | | | | | | | | | | |
| BC Hydro | | | 13 | | | | 6 | | | | (7 | ) | | | 25 | | | | 712 | | | | 712 | | | | - | | | | 705 | |
| Liquor Distribution Branch | | | 312 | | | | 301 | | | | (11 | ) | | | 290 | | | | 1,134 | | | | 1,092 | | | | (42 | ) | | | 1,107 | |
| BC Lottery Corporation 6 | | | 325 | | | | 76 | | | | (249 | ) | | | 352 | | | | 1,363 | | | | 469 | | | | (894 | ) | | | 1,336 | |
| ICBC 7 | | | (31 | ) | | | 300 | | | | 331 | | | | 55 | | | | 86 | | | | 86 | | | | - | | | | (376 | ) |
| Other 8 | | | 40 | | | | 40 | | | | - | | | | 33 | | | | 122 | | | | 125 | | | | 3 | | | | 146 | |
| | | | 659 | | | | 723 | | | | 64 | | | | 755 | | | | 3,417 | | | | 2,484 | | | | (933 | ) | | | 2,918 | |
| Total revenue | | | 15,695 | | | | 13,980 | | | | (1,715 | ) | | | 15,226 | | | | 60,585 | | | | 56,013 | | | | (4,572 | ) | | | 58,660 | |
1 Includes provincial sales tax and social services tax/hotel room tax related to prior years.
2 Columbia River Treaty, other energy and minerals, water rental and other resources.
3 Post-secondary, healthcare-related, motor vehicle, and other fees.
4 Includes reimbursements for health care and other services provided to external agencies, and other recoveries.
5 Includes contributions for health, education, community development, housing and social service programs, and transportation projects.
6 Net of payments to the federal government.
7 Does not include non-controlling interest.
8 Includes Columbia Power Corporation, BC Railway Company, Columbia Basin power projects, and post-secondary institutions’ self-supported subsidiaries.
| 26 | | FIRST QUARTERLY REPORT 2020/21 | |
UPDATED 2020/21 FINANCIAL FORECAST
Table 1.8 2020/21 Expense by Ministry, Program and Agency
| | | Year-to-Date to June 30 | | | Full Year | | | | |
| | | 2020/21 | | | Actual | | | 2020/21 | | | Actual | |
| ($ millions) | | Budget | | | Actual | | | Variance | | | 2019/20 1 | | | Budget | | | Forecast | | | Variance | | | 2019/20 | |
| Office of the Premier | | | 3 | | | | 3 | | | | - | | | | 4 | | | | 11 | | | | 11 | | | | - | | | | 12 | |
| Advanced Education, Skills and Training | | | 615 | | | | 615 | | | | - | | | | 620 | | | | 2,366 | | | | 2,366 | | | | - | | | | 2,331 | |
| Agriculture | | | 19 | | | | 22 | | | | 3 | | | | 21 | | | | 95 | | | | 95 | | | | - | | | | 112 | |
| Attorney General | | | 164 | | | | 182 | | | | 18 | | | | 174 | | | | 652 | | | | 652 | | | | - | | | | 718 | |
| Children and Family Development | | | 529 | | | | 426 | | | | (103 | ) | | | 497 | | | | 2,228 | | | | 2,228 | | | | - | | | | 2,149 | |
| Citizens’ Services | | | 132 | | | | 153 | | | | 21 | | | | 142 | | | | 552 | | | | 552 | | | | - | | | | 596 | |
| Education | | | 1,948 | | | | 2,024 | | | | 76 | | | | 1,894 | | | | 6,697 | | | | 6,697 | | | | - | | | | 6,647 | |
| Energy, Mines and Petroleum Resources | | | 39 | | | | 15 | | | | (24 | ) | | | 24 | | | | 114 | | | | 114 | | | | - | | | | 251 | |
| Environment and Climate Change Strategy | | | 51 | | | | 59 | | | | 8 | | | | 53 | | | | 245 | | | | 259 | | | | 14 | | | | 244 | |
| Finance | | | 227 | | | | 263 | | | | 36 | | | | 209 | | | | 838 | | | | 1,684 | | | | 846 | | | | 1,366 | |
| Forests, Lands, Natural Resource Operations and Rural Development | | | 174 | | | | 193 | | | | 19 | | | | 224 | | | | 844 | | | | 920 | | | | 76 | | | | 958 | |
| Health | | | 5,360 | | | | 5,238 | | | | (122 | ) | | | 4,915 | | | | 22,190 | | | | 22,190 | | | | - | | | | 20,825 | |
| Indigenous Relations and Reconciliation | | | 16 | | | | 32 | | | | 16 | | | | 43 | | | | 97 | | | | 97 | | | | - | | | | 353 | |
| Jobs, Economic Development and Competitiveness | | | 24 | | | | 23 | | | | (1 | ) | | | 20 | | | | 93 | | | | 93 | | | | - | | | | 98 | |
| Labour | | | 4 | | | | 5 | | | | 1 | | | | 4 | | | | 17 | | | | 17 | | | | - | | | | 16 | |
| Mental Health and Addictions | | | 2 | | | | 2 | | | | - | | | | 2 | | | | 10 | | | | 10 | | | | - | | | | 23 | |
| Municipal Affairs and Housing | | | 258 | | | | 320 | | | | 62 | | | | 295 | | | | 650 | | | | 650 | | | | - | | | | 1,182 | |
| Public Safety and Solicitor General | | | 213 | | | | 216 | | | | 3 | | | | 213 | | | | 852 | | | | 946 | | | | 94 | | | | 963 | |
| Social Development and Poverty Reduction | | | 897 | | | | 910 | | | | 13 | | | | 877 | | | | 3,683 | | | | 3,683 | | | | - | | | | 3,569 | |
| Tourism, Arts and Culture | | | 69 | | | | 64 | | | | (5 | ) | | | 30 | | | | 161 | | | | 161 | | | | - | | | | 184 | |
| Transportation and Infrastructure | | | 230 | | | | 227 | | | | (3 | ) | | | 215 | | | | 929 | | | | 929 | | | | - | | | | 919 | |
| Total ministries and Office of the Premier | | | 10,974 | | | | 10,992 | | | | 18 | | | | 10,476 | | | | 43,324 | | | | 44,354 | | | | 1,030 | | | | 43,516 | |
| Management of public funds and debt | | | 294 | | | | 320 | | | | 26 | | | | 314 | | | | 1,197 | | | | 1,280 | | | | 83 | | | | 1,234 | |
| Contingencies | | | - | | | | - | | | | - | | | | - | | | | 1,066 | | | | 1,066 | | | | - | | | | - | |
| COVID-19 Contingencies - Vote 52 2,3 | | | - | | | | 1,036 | | | | 1,036 | | | | - | | | | - | | | | 5,000 | | | | 5,000 | | | | - | |
| COVID-19 Contingencies - Vote 53 4 | | | - | | | | - | | | | - | | | | - | | | | - | | | | 810 | | | | 810 | | | | - | |
| Funding for capital expenditures | | | 290 | | | | 230 | | | | (60 | ) | | | 220 | | | | 2,789 | | | | 2,724 | | | | (65 | ) | | | 1,653 | |
| Refundable tax credit transfers | | | 375 | | | | 369 | | | | (6 | ) | | | 361 | | | | 1,686 | | | | 2,100 | | | | 414 | | | | 1,413 | |
| Legislative Assembly and other appropriations | | | 40 | | | | 30 | | | | (10 | ) | | | 35 | | | | 166 | | | | 166 | | | | - | | | | 150 | |
| Total appropriations | | | 11,973 | | | | 12,977 | | | | 1,004 | | | | 11,406 | | | | 50,228 | | | | 57,500 | | | | 7,272 | | | | 47,966 | |
| Elimination of transactions between | | | | | | | | | | | | | | | | | | | | | | | | | | | | | | | | |
| appropriations 5 | | | (5 | ) | | | (4 | ) | | | 1 | | | | (5 | ) | | | (20 | ) | | | (15 | ) | | | 5 | | | | (20 | ) |
| Prior year liability adjustments | | | - | | | | - | | | | - | | | | - | | | | - | | | | - | | | | - | | | | (126 | ) |
| Consolidated revenue fund expense | | | 11,968 | | | | 12,973 | | | | 1,005 | | | | 11,401 | | | | 50,208 | | | | 57,485 | | | | 7,277 | | | | 47,820 | |
| Expenses recovered from external entities | | | 665 | | | | 662 | | | | (3 | ) | | | 683 | | | | 3,335 | | | | 4,115 | | | | 780 | | | | 3,850 | |
| Elimination of funding provided to service | | | | | | | | | | | | | | | | | | | | | | | | | | | | | | | | |
| delivery agencies | | | (7,529 | ) | | | (7,676 | ) | | | (147 | ) | | | (6,987 | ) | | | (30,813 | ) | | | (32,029 | ) | | | (1,216 | ) | | | (28,928 | ) |
| Total direct program spending | | | 5,104 | | | | 5,959 | | | | 855 | | | | 5,097 | | | | 22,730 | | | | 29,571 | | | | 6,841 | | | | 22,742 | |
| Service delivery agency expense | | | | | | | | | | | | | | | | | | | | | | | | | | | | | | | | |
| School districts | | | 2,074 | | | | 1,997 | | | | (77 | ) | | | 2,048 | | | | 7,080 | | | | 7,232 | | | | 152 | | | | 6,995 | |
| Universities | | | 1,242 | | | | 1,193 | | | | (49 | ) | | | 1,186 | | | | 5,457 | | | | 5,396 | | | | (61 | ) | | | 5,252 | |
| Colleges and institutes | | | 351 | | | | 329 | | | | (22 | ) | | | 339 | | | | 1,464 | | | | 1,441 | | | | (23 | ) | | | 1,465 | |
| Health authorities and hospital societies | | | 4,346 | | | | 4,207 | | | | (139 | ) | | | 4,062 | | | | 17,425 | | | | 17,654 | | | | 229 | | | | 17,038 | |
| Other service delivery agencies | | | 1,357 | | | | 1,423 | | | | 66 | | | | 1,241 | | | | 5,902 | | | | 6,511 | | | | 609 | | | | 5,489 | |
| Total service delivery agency expense | | | 9,370 | | | | 9,149 | | | | (221 | ) | | | 8,876 | | | | 37,328 | | | | 38,234 | | | | 906 | | | | 36,239 | |
| Total expense | | | 14,474 | | | | 15,108 | | | | 634 | | | | 13,973 | | | | 60,058 | | | | 67,805 | | | | 7,747 | | | | 58,981 | |
1 Restated to reflect government’s current organization and accounting policies.
2 On March 23, 2020, the Legislative Assembly passed Supplementary Estimates of $5 billion to establish a new Vote 52 - Contingencies (All Ministries): Pandemic Response and Economic Recovery.
3 As of June 30, 2020, COVID-19 spending funded by Vote 52 is as follows (by ministry): $606 million Finance - Other Appropriations; $233 million Social Development and Poverty Reduction; $181 million Children and Family Development; $10 million Tourism, Arts, and Culture; $3 million Mental Health and Addictions; and $3 million Agriculture. There is also an additional $18 million spent funded from the base budgets of various ministries; bringing the total Q1 actual COVID-19 spending to $1.054 billion.
4 On August 14, 2020, the Legislative Assembly passed Supplementary Estimates of $1 billion to establish a new Vote 53 - Contingencies (All Ministries): Federal and Provincial Pandemic Support. The forecast reflects the provincial portion of the federal-provincial cost-shared investments under the Safe Restart Agreement.
5 Reflects payments made under an agreement where an expense from a voted appropriation is recorded as revenue by a special account.
| | FIRST QUARTERLY REPORT 2020/21 | | 27 |
UPDATED 2020/21 FINANCIAL FORECAST
Table 1.9 2020/21 Expense by Function
| | | Year-to-Date to June 30 | | | Full Year | |
| | | 2020/21 | | | Actual | | | 2020/21 | | | Actual | |
| ($ millions) | | Budget | | | Actual | | | Variance | | | 2019/20 | | | Budget | | | Forecast | | | Variance | | | 2019/20 | |
| Health: | | | | | | | | | | | | | | | | | | | | | | | | | | | | | | | | |
| Medical Services Plan | | | 1,233 | | | | 1,242 | | | | 9 | | | | 1,204 | | | | 5,275 | | | | 5,275 | | | | - | | | | 5,013 | |
| Pharmacare | | | 338 | | | | 340 | | | | 2 | | | | 357 | | | | 1,561 | | | | 1,561 | | | | - | | | | 1,517 | |
| Regional services | | | 4,380 | | | | 4,148 | | | | (232 | ) | | | 3,966 | | | | 16,541 | | | | 16,954 | | | | 413 | | | | 16,047 | |
| Other healthcare expenses 1 | | | 25 | | | | 71 | | | | 46 | | | | 139 | | | | 908 | | | | 843 | | | | (65 | ) | | | 872 | |
| | | | 5,976 | | | | 5,801 | | | | (175 | ) | | | 5,666 | | | | 24,285 | | | | 24,633 | | | | 348 | | | | 23,449 | |
| Education: | | | | | | | | | | | | | | | | | | | | | | | | | | | | | | | | |
| Elementary and secondary | | | 2,217 | | | | 2,144 | | | | (73 | ) | | | 2,182 | | | | 7,618 | | | | 7,724 | | | | 106 | | | | 7,582 | |
| Post-secondary | | | 1,609 | | | | 1,565 | | | | (44 | ) | | | 1,557 | | | | 7,125 | | | | 7,141 | | | | 16 | | | | 6,842 | |
| Other education expenses 2 | | | 123 | | | | 36 | | | | (87 | ) | | | 33 | | | | 435 | | | | 438 | | | | 3 | | | | 310 | |
| | | | 3,949 | | | | 3,745 | | | | (204 | ) | | | 3,772 | | | | 15,178 | | | | 15,303 | | | | 125 | | | | 14,734 | |
| Social services: | | | | | | | | | | | | | | | | | | | | | | | | | | | | | | | | |
| Social assistance 1,2 | | | 565 | | | | 582 | | | | 17 | | | | 570 | | | | 2,363 | | | | 2,447 | | | | 84 | | | | 2,342 | |
| Child welfare 1 | | | 513 | | | | 412 | | | | (101 | ) | | | 478 | | | | 2,239 | | | | 2,238 | | | | (1 | ) | | | 1,940 | |
| Low income tax credit transfers | | | 78 | | | | 82 | | | | 4 | | | | 71 | | | | 352 | | | | 867 | | | | 515 | | | | 435 | |
| Community living and other services | | | 300 | | | | 304 | | | | 4 | | | | 286 | | | | 1,247 | | | | 1,248 | | | | 1 | | | | 1,170 | |
| | | | 1,456 | | | | 1,380 | | | | (76 | ) | | | 1,405 | | | | 6,201 | | | | 6,800 | | | | 599 | | | | 5,887 | |
| Protection of persons and property | | | 443 | | | | 455 | | | | 12 | | | | 445 | | | | 1,817 | | | | 1,930 | | | | 113 | | | | 2,126 | |
| Transportation | | | 473 | | | | 484 | | | | 11 | | | | 440 | | | | 2,228 | | | | 2,219 | | | | (9 | ) | | | 2,126 | |
| Natural resources and economic development | | | 660 | | | | 663 | | | | 3 | | | | 658 | | | | 3,097 | | | | 3,069 | | | | (28 | ) | | | 3,778 | |
| Other | | | 514 | | | | 513 | | | | (1 | ) | | | 536 | | | | 2,033 | | | | 2,788 | | | | 755 | | | | 2,501 | |
| Contingencies | | | - | | | | - | | | | - | | | | - | | | | 1,066 | | | | 1,066 | | | | - | | | | - | |
| COVID-19 Contingencies - Vote 52 3 | | | - | | | | 1,036 | | | | 1,036 | | | | - | | | | - | | | | 5,000 | | | | 5,000 | | | | - | |
| COVID-19 Contingencies - Vote 53 4 | | | - | | | | - | | | | - | | | | - | | | | - | | | | 810 | | | | 810 | | | | - | |
| General government | | | 353 | | | | 349 | | | | (4 | ) | | | 388 | | | | 1,430 | | | | 1,440 | | | | 10 | | | | 1,653 | |
| Debt servicing | | | 650 | | | | 682 | | | | 32 | | | | 663 | | | | 2,723 | | | | 2,747 | | | | 24 | | | | 2,727 | |
| Total expense | | | 14,474 | | | | 15,108 | | | | 634 | | | | 13,973 | | | | 60,058 | | | | 67,805 | | | | 7,747 | | | | 58,981 | |
1 Payments for healthcare services by the Ministry of Social Development and Poverty Reduction and the Ministry of Children and Family Development made on behalf of their clients are reported in the Health function.
2 Payments for training costs by the Ministry of Social Development and Poverty Reduction made on behalf of its clients are reported in the Education function.
3 On March 23, 2020, the Legislative Assembly passed Supplementary Estimates of $5 billion to establish a new Vote 52 - Contingencies (All Ministries): Pandemic Response and Economic Recovery.
4 On August 14, 2020, the Legislative Assembly passed Supplementary Estimates of $1 billion to establish a new Vote 53 - Contingencies (All Ministries): Federal and Provincial Pandemic Support. The forecast reflects the provincial portion of the federal-provincial cost-shared investments under the Safe Restart Agreement.
| 28 | | FIRST QUARTERLY REPORT 2020/21 | |
UPDATED 2020/21 FINANCIAL FORECAST
Table 1.10 2020/21 Capital Spending
| | | Year-to-Date to June 30 | | | Full Year | |
| | | 2020/21 | | | Actual | | | 2020/21 | | | Actual | |
| ($ millions) | | Budget | | | Actual | | | Variance | | | 2019/20 | | | Budget | | | Forecast | | | Variance | | | 2019/20 | |
| Taxpayer-supported | | | | | | | | | | | | | | | | | | | | | | | | | | | | | | | | |
| Education | | | | | | | | | | | | | | | | | | | | | | | | | | | | | | | | |
| School districts | | | 250 | | | | 229 | | | | (21 | ) | | | 221 | | | | 994 | | | | 1,043 | | | | 49 | | | | 877 | |
| Post-secondary institutions | | | 116 | | | | 124 | | | | 8 | | | | 111 | | | | 977 | | | | 951 | | | | (26 | ) | | | 936 | |
| Health | | | 188 | | | | 117 | | | | (71 | ) | | | 102 | | | | 1,862 | | | | 1,810 | | | | (52 | ) | | | 1,009 | |
| BC Transportation Financing Authority | | | 356 | | | | 238 | | | | (118 | ) | | | 182 | | | | 1,870 | | | | 1,713 | | | | (157 | ) | | | 955 | |
| BC Transit | | | 23 | | | | 25 | | | | 2 | | | | 9 | | | | 184 | | | | 131 | | | | (53 | ) | | | 73 | |
| Government ministries | | | 50 | | | | 25 | | | | (25 | ) | | | 46 | | | | 569 | | | | 569 | | | | - | | | | 520 | |
| Social housing 1 | | | 150 | | | | 159 | | | | 9 | | | | 92 | | | | 578 | | | | 702 | | | | 124 | | | | 355 | |
| Other | | | 12 | | | | 9 | | | | (3 | ) | | | 6 | | | | 92 | | | | 96 | | | | 4 | | | | 47 | |
| Total taxpayer-supported | | | 1,145 | | | | 926 | | | | (219 | ) | | | 769 | | | | 7,126 | | | | 7,015 | | | | (111 | ) | | | 4,772 | |
| Self-supported | | | | | | | | | | | | | | | | | | | | | | | | | | | | | | | | |
| BC Hydro | | | 800 | | | | 698 | | | | (102 | ) | | | 625 | | | | 3,092 | | | | 3,092 | | | | - | | | | 3,082 | |
| Columbia Basin power projects 2 | | | 3 | | | | 1 | | | | (2 | ) | | | 991 | | | | 14 | | | | 8 | | | | (6 | ) | | | 994 | |
| BC Railway Company | | | 3 | | | | 1 | | | | (2 | ) | | | 1 | | | | 10 | | | | 11 | | | | 1 | | | | 6 | |
| ICBC | | | 20 | | | | 18 | | | | (2 | ) | | | 20 | | | | 116 | | | | 116 | | | | - | | | | 62 | |
| BC Lottery Corporation | | | 26 | | | | 6 | | | | (20 | ) | | | 13 | | | | 105 | | | | 105 | | | | - | | | | 102 | |
| Liquor Distribution Branch | | | 21 | | | | 3 | | | | (18 | ) | | | 5 | | | | 72 | | | | 40 | | | | (32 | ) | | | 36 | |
| Other 3 | | | - | | | | - | | | | - | | | | - | | | | - | | | | - | | | | - | | | | 104 | |
| Total self-supported | | | 873 | | | | 727 | | | | (145 | ) | | | 1,655 | | | | 3,409 | | | | 3,372 | | | | (37 | ) | | | 4,386 | |
| Total capital spending | | | 2,018 | | | | 1,653 | | | | (364 | ) | | | 2,424 | | | | 10,535 | | | | 10,387 | | | | (148 | ) | | | 9,158 | |
1 Includes BC Housing Management Commission and Provincial Rental Housing Corporation.
2 Joint ventures of the Columbia Power Corporation and Columbia Basin Trust.
3 Includes post-secondary institutions’ self-supported subsidiaries.
| | FIRST QUARTERLY REPORT 2020/21 | | 29 |
UPDATED 2020/21 FINANCIAL FORECAST
Table 1.11 Capital Expenditure Projects Greater Than $50 million 1
Note: Information in bold type denotes changes from Budget 2020 released on February 18, 2020.
| | | | | | Project | | | Estimated | | | Anticipated | | | Project Financing | |
| | | Year of | | | Cost to | | | Cost to | | | Total | | | Internal/ | | | P3 | | | Federal | | | Other | |
| ($ millions) | | Completion | | | June 30, 2020 | | | Complete | | | Cost | | | Borrowing | | | Liability | | | Gov’t | | | Contrib’ns | |
| Taxpayer-supported |
| Schools | | | | | | | | | | | | | | | | | | | | | | | | | | | | | | | | |
| Centennial Secondary 2 | | | 2020 | | | | 53 | | | | 8 | | | | 61 | | | | 61 | | | | - | | | | - | | | | - | |
| R.E. Mountain Secondary (Willoughby Slope)2 | | | 2020 | | | | 59 | | | | - | | | | 59 | | | | 38 | | | | - | | | | - | | | | 21 | |
| Argyle Secondary | | | 2020 | | | | 54 | | | | 8 | | | | 62 | | | | 50 | | | | - | | | | - | | | | 12 | |
| Grandview Heights Secondary | | | 2021 | | | | 39 | | | | 44 | | | | 83 | | | | 63 | | | | - | | | | - | | | | 20 | |
| Handsworth Secondary | | | 2022 | | | | 13 | | | | 56 | | | | 69 | | | | 69 | | | | - | | | | - | | | | - | |
| New Westminster Secondary | | | 2021 | | | | 73 | | | | 34 | | | | 107 | | | | 107 | | | | - | | | | - | | | | - | |
| Burnaby North Secondary | | | 2022 | | | | 5 | | | | 103 | | | | 108 | | | | 99 | | | | - | | | | - | | | | 9 | |
| Eric Hamber Secondary | | | 2023 | | | | 7 | | | | 98 | | | | 105 | | | | 93 | | | | - | | | | - | | | | 12 | |
| South Side Area Elementary Middle | | | 2022 | | | | 10 | | | | 44 | | | | 54 | | | | 49 | | | | | | | | | | | | 5 | |
| Sheffield Elementary | | | 2021 | | | | 2 | | | | 50 | | | | 52 | | | | 47 | | | | - | | | | - | | | | 5 | |
| West Langford Elementary and Middle | | | 2022 | | | | 9 | | | | 80 | | | | 89 | | | | 89 | | | | - | | | | - | | | | - | |
| Victoria High School | | | 2022 | | | | 3 | | | | 77 | | | | 80 | | | | 77 | | | | - | | | | - | | | | 3 | |
| Quesnel Junior School | | | 2022 | | | | 3 | | | | 49 | | | | 52 | | | | 52 | | | | - | | | | - | | | | - | |
| Cowichan Secondary | | | 2024 | | | | 3 | | | | 79 | | | | 82 | | | | 80 | | | | | | | | | | | | 2 | |
| Seismic mitigation program 3 | | | 2030 | | | | 540 | | | | 1,004 | | | | 1,544 | | | | 1,544 | | | | - | | | | - | | | | - | |
| Total schools | | | | | | | 873 | | | | 1,734 | | | | 2,607 | | | | 2,518 | | | | - | | | | - | | | | 89 | |
| Post-secondary institutions | | | | | | | | | | | | | | | | | | | | | | | | | | | | | | | | |
| Simon Fraser University – Energy Systems Engineering Building 2,4 | | | 2019 | | | | 124 | | | | 2 | | | | 126 | | | | 45 | | | | - | | | | 45 | | | | 36 | |
| British Columbia Institute of Technology – Health Sciences Centre for Advanced Simulation | | | 2022 | | | | 13 | | | | 75 | | | | 88 | | | | 66 | | | | - | | | | - | | | | 22 | |
| Simon Fraser University – Student Housing | | | 2022 | | | | 13 | | | | 91 | | | | 104 | | | | 73 | | | | - | | | | - | | | | 31 | |
| University of Victoria – Student Housing | | | 2023 | | | | 20 | | | | 212 | | | | 232 | | | | 128 | | | | - | | | | - | | | | 104 | |
| Total post-secondary institutions | | | | | | | 170 | | | | 380 | | | | 550 | | | | 312 | | | | - | | | | 45 | | | | 193 | |
| Health facilities | | | | | | | | | | | | | | | | | | | | | | | | | | | | | | | | |
| Royal Inland Hospital Patient Care Tower | | | | | | | | | | | | | | | | | | | | | | | | | | | | | | | | |
| – Direct procurement | | | 2024 | | | | 12 | | | | 117 | | | | 129 | | | | 39 | | | | - | | | | - | | | | 90 | |
| – P3 contract | | | 2022 | | | | 127 | | | | 161 | | | | 288 | | | | - | | | | 164 | | | | - | | | | 124 | |
| Vancouver General Hospital – Jim Pattison Pavilion Operating Rooms | | | 2021 | | | | 60 | | | | 42 | | | | 102 | | | | 35 | | | | - | | | | - | | | | 67 | |
| Interior Heart and Surgical Centre 2 | | | | | | | | | | | | | | | | | | | | | | | | | | | | | | | | |
| – Direct procurement | | | 2018 | | | | 176 | | | | 72 | | | | 248 | | | | 213 | | | | - | | | | - | | | | 35 | |
| – P3 contract | | | 2015 | | | | 133 | | | | - | | | | 133 | | | | 4 | | | | 79 | | | | - | | | | 50 | |
| Children’s and Women’s Hospital | | | | | | | | | | | | | | | | | | | | | | | | | | | | | | | | |
| – Direct procurement | | | 2020 | | | | 282 | | | | 26 | | | | 308 | | | | 178 | | | | - | | | | - | | | | 130 | |
| – P3 contract | | | 2018 | | | | 368 | | | | - | | | | 368 | | | | 167 | | | | 187 | | | | - | | | | 14 | |
| Penticton Regional Hospital – Patient Care Tower | | | | | | | | | | | | | | | | | | | | | | | | | | | | | | | | |
| – Direct procurement | | | 2022 | | | | 34 | | | | 46 | | | | 80 | | | | 22 | | | | - | | | | - | | | | 58 | |
| – P3 contract | | | 2019 | | | | 231 | | | | 1 | | | | 232 | | | | - | | | | 139 | | | | - | | | | 93 | |
| Royal Columbian Hospital – Phase 1 | | | 2020 | | | | 239 | | | | 20 | | | | 259 | | | | 250 | | | | - | | | | - | | | | 9 | |
| Royal Columbian Hospital – Phases 2 & 3 | | | 2026 | | | | 35 | | | | 1,201 | | | | 1,236 | | | | 1,174 | | | | - | | | | - | | | | 62 | |
| Peace Arch Hospital Renewal | | | 2022 | | | | 25 | | | | 59 | | | | 84 | | | | 8 | | | | - | | | | - | | | | 76 | |
| Red Fish Healing Centre for Mental Health and Addiction - qəqi? †əw?ənəq leləm5 | | | 2021 | | | | 61 | | | | 70 | | | | 131 | | | | 131 | | | | - | | | | - | | | | - | |
| Dogwood Complex Residential Care | | | 2022 | | | | 4 | | | | 54 | | | | 58 | | | | - | | | | - | | | | - | | | | 58 | |
| Health facilities continued on the next page | | | | | | | | | | | | | | | | | | | | | | | | | | | | | | | | |
| | | | | | | | | | | | | | | | | | | | | | | | | | | | | | | | | |
| 30 | | FIRST QUARTERLY REPORT 2020/21 | |
UPDATED 2020/21 FINANCIAL FORECAST
Table 1.11 Capital Expenditure Projects Greater Than $50 million 1
Note: Information in bold type denotes changes from Budget 2020 released on February 18, 2020.
| | | | | | Project | | | Estimated | | | Anticipated | | | Project Financing | |
| | | Year of | | | Cost to | | | Cost to | | | Total | | | Internal/ | | | P3 | | | Federal | | | Other | |
| ($ millions) | | Completion | | | June 30, 2020 | | | Complete | | | Cost | | | Borrowing | | | Liability | | | Gov’t | | | Contrib’ns | |
| Health facilities continued | | | | | | | | | | | | | | | | | | | | | | | | | | | | | | | | |
| Lions Gate Hospital – New Acute Care Facility | | | 2024 | | | | 2 | | | | 253 | | | | 255 | | | | 89 | | | | - | | | | - | | | | 166 | |
| St Paul’s Hospital | | | 2026 | | | | 8 | | | | 2,075 | | | | 2,083 | | | | 1,158 | | | | - | | | | - | | | | 925 | |
| Mills Memorial Hospital | | | 2026 | | | | 2 | | | | 445 | | | | 447 | | | | 337 | | | | - | | | | - | | | | 110 | |
| Burnaby Hospital Redevelopment - Phase 1 6 | | | 2025 | | | | 3 | | | | 574 | | | | 577 | | | | 543 | | | | - | | | | - | | | | 34 | |
| Cariboo Memorial Hospital | | | 2026 | | | | - | | | | 218 | | | | 218 | | | | 131 | | | | - | | | | - | | | | 87 | |
| Stuart Lake Hospital | | | 2024 | | | | - | | | | 116 | | | | 116 | | | | 98 | | | | - | | | | - | | | | 18 | |
| Cowichan District Hospital | | | 2026 | | | | - | | | | 887 | | | | 887 | | | | 605 | | | | - | | | | - | | | | 282 | |
| Dawson Creek & District Hospital | | | 2025 | | | | - | | | | 378 | | | | 378 | | | | 247 | | | | - | | | | - | | | | 131 | |
| Clinical and systems transformation | | | 2025 | | | | 457 | | | | 246 | | | | 703 | | | | 702 | | | | - | | | | - | | | | 1 | |
| iHealth Project – Vancouver Island Health Authority | | | 2025 | | | | 99 | | | | 56 | | | | 155 | | | | 55 | | | | - | | | | - | | | | 100 | |
| Total health facilities | | | | | | | 2,358 | | | | 7,117 | | | | 9,475 | | | | 6,186 | | | | 569 | | | | - | | | | 2,720 | |
| Transportation | | | | | | | | | | | | | | | | | | | | | | | | | | | | | | | | |
| Highway 91 Alex Fraser Bridge Capacity Improvements 2 | | | 2019 | | | | 66 | | | | 4 | | | | 70 | | | | 37 | | | | - | | | | 33 | | | | - | |
| Highway 97 Williams Lake Indian Reserve to Lexington Road 2 | | | 2019 | | | | 56 | | | | 1 | | | | 57 | | | | 57 | | | | - | | | | - | | | | - | |
| Highway 1 widening and 216th Street Interchange | | | 2020 | | | | 55 | | | | 7 | | | | 62 | | | | 28 | | | | - | | | | 22 | | | | 12 | |
| Highway 1 – Admirals Road/McKenzie Avenue Interchange | | | 2020 | | | | 93 | | | | 3 | | | | 96 | | | | 63 | | | | - | | | | 33 | | | | - | |
| Highway 7 Corridor improvements | | | 2020 | | | | 63 | | | | 7 | | | | 70 | | | | 48 | | | | - | | | | 22 | | | | - | |
| Highway 99 10-Mile Slide | | | 2021 | | | | 36 | | | | 24 | | | | 60 | | | | 60 | | | | - | | | | - | | | | - | |
| Highway 1 Lower Lynn Corridor improvements | | | 2021 | | | | 148 | | | | 50 | | | | 198 | | | | 77 | | | | - | | | | 66 | | | | 55 | |
| Highway 1 Illecillewaet 4-laning and Brake Check improvements | | | 2022 | | | | 24 | | | | 61 | | | | 85 | | | | 69 | | | | - | | | | 16 | | | | - | |
| Highway 14 Corridor improvements | | | 2022 | | | | 12 | | | | 74 | | | | 86 | | | | 56 | | | | - | | | | 30 | | | | - | |
| West Fraser Road Realignment | | | 2023 | | | | 4 | | | | 99 | | | | 103 | | | | 103 | | | | - | | | | - | | | | - | |
| Highway 1 Chase 4-laning 7 | | | 2023 | | | | 30 | | | | 230 | | | | 260 | | | | 248 | | | | - | | | | 12 | | | | - | |
| Highway 91 to Highway 17 and Deltaport Way Corridor improvements | | | 2023 | | | | 69 | | | | 191 | | | | 260 | | | | 87 | | | | - | | | | 82 | | | | 91 | |
| Highway 1 Salmon Arm West | | | 2023 | | | | 42 | | | | 143 | | | | 185 | | | | 154 | | | | - | | | | 31 | | | | - | |
| Highway 1 RW Bruhn Bridge | | | 2023 | | | | 21 | | | | 204 | | | | 225 | | | | 134 | | | | - | | | | 91 | | | | - | |
| Pattullo Bridge Replacement 8 | | | 2023 | | | | 178 | | | | 1,199 | | | | 1,377 | | | | 1,076 | | | | 301 | | | | - | | | | - | |
| Highway 1 Quartz Creek Bridge Replacement | | | 2023 | | | | 10 | | | | 111 | | | | 121 | | | | 71 | | | | - | | | | 50 | | | | - | |
| Kootenay Lake ferry service upgrade | | | 2023 | | | | 2 | | | | 53 | | | | 55 | | | | 38 | | | | - | | | | 17 | | | | - | |
| Highway 1 216th - 264th Street widening | | | 2024 | | | | 6 | | | | 229 | | | | 235 | | | | 99 | | | | - | | | | 109 | | | | 27 | |
| Highway 1 Kicking Horse Canyon Phase 4 9 | | | 2024 | | | | 23 | | | | 578 | | | | 601 | | | | 386 | | | | - | | | | 215 | | | | - | |
| Broadway Subway | | | 2025 | | | | 78 | | | | 2,749 | | | | 2,827 | | | | 1,830 | | | | - | | | | 897 | | | | 100 | |
| Total transportation | | | | | | | 1,016 | | | | 6,017 | | | | 7,033 | | | | 4,721 | | | | 301 | | | | 1,726 | | | | 285 | |
| Other taxpayer-supported | | | | | | | | | | | | | | | | | | | | | | | | | | | | | | | | |
| Abbotsford courthouse | | | | | | | | | | | | | | | | | | | | | | | | | | | | | | | | |
| – Direct procurement | | | 2020 | | | | 11 | | | | 7 | | | | 18 | | | | 18 | | | | - | | | | - | | | | - | |
| – P3 contract | | | 2020 | | | | 109 | | | | 25 | | | | 134 | | | | 48 | | | | 80 | | | | - | | | | 6 | |
| Nanaimo Correctional Centre Replacement | | | 2023 | | | | 4 | | | | 153 | | | | 157 | | | | 157 | | | | - | | | | - | | | | - | |
| Stanley New Fountain Hotel (Affordable Rental Housing) | | | 2022 | | | | 13 | | | | 56 | | | | 69 | | | | 19 | | | | - | | | | - | | | | 50 | |
| 6585 Sussex Ave (Affordable Rental Housing) | | | 2022 | | | | 18 | | | | 57 | | | | 75 | | | | 43 | | | | - | | | | - | | | | 32 | |
| Clark & 1st Ave (Affordable Rental Housing) | | | 2024 | | | | 3 | | | | 106 | | | | 109 | | | | 75 | | | | - | | | | - | | | | 34 | |
| Total other | | | | | | | 158 | | | | 404 | | | | 562 | | | | 360 | | | | 80 | | | | - | | | | 122 | |
| Total taxpayer-supported | | | | | | | 4,575 | | | | 15,652 | | | | 20,227 | | | | 14,097 | | | | 950 | | | | 1,771 | | | | 3,409 | |
| | | | | | | | | | | | | | | | | | | | | | | | | | | | | | | | | |
| | | | | | | | | | | | | | | | | | | | | | | | | | | | | | | | | |
| | FIRST QUARTERLY REPORT 2020/21 | | 31 |
UPDATED 2020/21 FINANCIAL FORECAST
Table 1.11 Capital Expenditure Projects Greater Than $50 million 1
Note: Information in bold type denotes changes from Budget 2020 released on February 18, 2020.
| | | | | | Project | | | Estimated | | | Anticipated | | | Project Financing | |
| | | Year of | | | Cost to | | | Cost to | | | Total | | | Internal/ | | | P3 | | | Federal | | | Other | |
| ($ millions) | | Completion | | | June 30, 2020 | | | Complete | | | Cost | | | Borrowing | | | Liability | | | Gov’t | | | Contrib’ns | |
| Power generation and transmission | | | | | | | | | | | | | | | | | | | | | | | | | | | | | | | | |
| BC Hydro | | | | | | | | | | | | | | | | | | | | | | | | | | | | | | | | |
| – Ruskin Dam safety and powerhouse upgrade 2 | | | 2018 | | | | 638 | | | | - | | | | 638 | | | | 638 | | | | - | | | | - | | | | - | |
| – Horne Payne substation upgrade project 2 | | | 2019 | | | | 69 | | | | 2 | | | | 71 | | | | 71 | | | | - | | | | - | | | | - | |
| – John Hart generating station replacement 2 | | | 2019 | | | | 976 | | | | 3 | | | | 979 | | | | 979 | | | | - | | | | - | | | | - | |
| – Cheakamus unit 1 and 2 generator replacement 2 | | | 2019 | | | | 62 | | | | - | | | | 62 | | | | 62 | | | | - | | | | - | | | | - | |
| – Bridge River 2 units 5 and 6 upgrade project 2 | | | 2019 | | | | 71 | | | | 3 | | | | 74 | | | | 74 | | | | - | | | | - | | | | - | |
| – South Fraser transmission relocation project 10 | | | TBD | | | | 30 | | | | 46 | | | | 76 | | | | 76 | | | | - | | | | - | | | | - | |
| – Downtown Vancouver Electricity Supply: West End strategic property purchase | | | 2020 | | | | 67 | | | | 14 | | | | 81 | | | | 81 | | | | - | | | | - | | | | - | |
| – Fort St. John and Taylor Electric Supply | | | 2020 | | | | 48 | | | | 5 | | | | 53 | | | | 53 | | | | - | | | | - | | | | - | |
| – Supply Chain Applications project | | | 2020 | | | | 62 | | | | 7 | | | | 69 | | | | 69 | | | | - | | | | - | | | | - | |
| – UBC load increase stage 2 project | | | 2021 | | | | 42 | | | | 13 | | | | 55 | | | | 55 | | | | - | | | | - | | | | - | |
| – Peace Region Electricity Supply (PRES) project 11 | | | 2021 | | | | 158 | | | | 127 | | | | 285 | | | | 285 | | | | - | | | | - | | | | - | |
| – LNG Canada load interconnection project | | | 2021 | | | | 43 | | | | 39 | | | | 82 | | | | 58 | | | | - | | | | - | | | | 24 | |
| – Bridge River 2 upgrade units 7 and 8 project | | | 2021 | | | | 33 | | | | 53 | | | | 86 | | | | 86 | | | | - | | | | - | | | | - | |
| – Wahleach refurbish generator project | | | 2021 | | | | 21 | | | | 30 | | | | 51 | | | | 51 | | | | - | | | | - | | | | - | |
| – Mica replace units 1 to 4 generator transformers project | | | 2022 | | | | 34 | | | | 46 | | | | 80 | | | | 80 | | | | - | | | | - | | | | - | |
| – G.M. Shrum G1 to 10 control system upgrade | | | 2023 | | | | 48 | | | | 27 | | | | 75 | | | | 75 | | | | - | | | | - | | | | - | |
| – Mount Lehman substation upgrade project | | | 2022 | | | | 8 | | | | 51 | | | | 59 | | | | 59 | | | | - | | | | - | | | | - | |
| – Street light replacement program | | | 2023 | | | | 2 | | | | 78 | | | | 80 | | | | 80 | | | | - | | | | - | | | | - | |
| – Capilano substation upgrade project | | | 2024 | | | | 8 | | | | 79 | | | | 87 | | | | 87 | | | | - | | | | - | | | | - | |
| – Sperling substation (SPG) metalclad switchgear replacement project | | | 2024 | | | | 3 | | | | 51 | | | | 54 | | | | 54 | | | | - | | | | - | | | | - | |
| – Site C project | | | 2024 | | | | 5,517 | | | | 5,183 | | | | 10,700 | | | | 10,700 | | | | - | | | | - | | | | - | |
| Total power generation and transmission | | | | | | | 7,940 | | | | 5,857 | | | | 13,797 | | | | 13,773 | | | | - | | | | - | | | | 24 | |
| Other self-supported | | | | | | | | | | | | | | | | | | | | | | | | | | | | | | | | |
| Enhanced Care Coverage Program (ICBC) | | | 2022 | | | | 29 | | | | 65 | | | | 94 | | | | 94 | | | | - | | | | - | | | | - | |
| Total other | | | | | | | 29 | | | | 65 | | | | 94 | | | | 94 | | | | - | | | | - | | | | - | |
| Total self-supported | | | | | | | 7,969 | | | | 5,922 | | | | 13,891 | | | | 13,867 | | | | - | | | | - | | | | 24 | |
| Total $50 million projects | | | | | | | 12,544 | | | | 21,574 | | | | 34,118 | | | | 27,964 | | | | 950 | | | | 1,771 | | | | 3,433 | |
| 1 | Only projects that receive provincial funding and have been approved by Treasury Board and/or Crown corporation boards are included in this table. Ministry service plans may highlight projects that still require final approval. Capital costs reflect current government accounting policy. |
| 2 | Assets have been put into service and only trailing costs remain. |
| 3 | The Seismic Mitigation Program consists of all spending to date on Phase 2 of the program and may include spending on projects greater than $50 million included in the table above. |
| 4 | Simon Fraser University and private donors contributed $26 million toward the project, and the university also contributed land valued at $10 million. |
| 5 | Previously reported as Centre for Mental Health and Addictions. |
| 6 | The concept plan for Phase 2 of the Burnaby Hospital Redevelopment has been approved. Financial information will be added to the table upon business case approval. |
| 7 | Formerly Hoffman’s Bluff to Jade Mountain. |
| 8 | Pattullo Bridge forecasted to open to the public in 2023 with old bridge decommissioning to follow. Forecasted amount reflects total expenditures including capitalized and expensed items. |
| 9 | Kicking Horse Canyon Project costs exclude $11 million of past planning costs which are expensed. |
| 10 | Construction work on the South Fraser transmission relocation project is currently suspended pending the government’s review of the George Massey Tunnel replacement. |
| 11 | The total cost represents the gross cost of the project and has not been netted for Federal Government contributions. The Federal Government’s contribution amount is dependent on the final actual project costs and what costs are eligible under the agreement. |
| 32 | | FIRST QUARTERLY REPORT 2020/21 | |
UPDATED 2020/21 FINANCIAL FORECAST
Table 1.12 2020/21 Provincial Debt 1
| | | Year-to-Date to June 30 | | | Full Year | |
| | | 2020/21 | | | Actual | | | 2020/21 | | | Actual | |
| ($ millions) | | Budget | | | Actual | | | Variance | | | 2019/20 | | | Budget | | | Forecast | | | Variance | | | 2019/20 | |
| Taxpayer-supported debt | | | | | | | | | | | | | | | | | | | | | | | | | | | | | | | | |
| Provincial government | | | | | | | | | | | | | | | | | | | | | | | | | | | | | | | | |
| Operating | | | - | | | | - | | | | - | | | | - | | | | - | | | | 8,220 | | | | 8,220 | | | | - | |
| Liquidity enhancement 2 | | | - | | | | 5,255 | | | | 5,255 | | | | - | | | | - | | | | - | | | | - | | | | - | |
| Total provincial government | | | - | | | | 5,255 | | | | 5,255 | | | | - | | | | - | | | | 8,220 | | | | 8,220 | | | | - | |
| Other taxpayer-supported debt (mainly capital) | | | | | | | | | | | | | | | | | | | | | | | | | | | | | | | | |
| Education 3 | | | | | | | | | | | | | | | | | | | | | | | | | | | | | | | | |
| Post-secondary institutions | | | 5,571 | | | | 6,044 | | | | 473 | | | | 5,377 | | | | 5,698 | | | | 6,094 | | | | 396 | | | | 5,670 | |
| School districts | | | 9,138 | | | | 10,479 | | | | 1,341 | | | | 8,903 | | | | 9,437 | | | | 10,516 | | | | 1,079 | | | | 9,775 | |
| Total education | | | 14,709 | | | | 16,523 | | | | 1,814 | | | | 14,280 | | | | 15,135 | | | | 16,610 | | | | 1,475 | | | | 15,445 | |
| Health 3 | | | 8,287 | | | | 9,784 | | | | 1,497 | | | | 8,087 | | | | 8,750 | | | | 9,354 | | | | 604 | | | | 8,507 | |
| Highways and public transit | | | | | | | | | | | | | | | | | | | | | | | | | | | | | | | | |
| BC Transit | | | 80 | | | | 81 | | | | 1 | | | | 71 | | | | 108 | | | | 104 | | | | (4 | ) | | | 65 | |
| BC Transportation Financing Authority | | | 12,809 | | | | 12,402 | | | | (407 | ) | | | 11,492 | | | | 14,195 | | | | 13,753 | | | | (442 | ) | | | 12,193 | |
| Port Mann Bridge | | | 3,510 | | | | 3,510 | | | | - | | | | 3,510 | | | | 3,510 | | | | 3,510 | | | | - | | | | 3,510 | |
| Public transit | | | 542 | | | | 870 | | | | 328 | | | | 870 | | | | 542 | | | | 870 | | | | 328 | | | | 870 | |
| SkyTrain extension | | | 714 | | | | 1,021 | | | | 307 | | | | 1,021 | | | | 714 | | | | 1,021 | | | | 307 | | | | 1,021 | |
| Total highways and public transit | | | 17,655 | | | | 17,884 | | | | 229 | | | | 16,964 | | | | 19,069 | | | | 19,258 | | | | 189 | | | | 17,659 | |
| Other | | | | | | | | | | | | | | | | | | | | | | | | | | | | | | | | |
| BC Immigrant Investment Fund | | | 42 | | | | 45 | | | | 3 | | | | 69 | | | | 30 | | | | 47 | | | | 17 | | | | 45 | |
| BC Pavilion Corporation | | | 380 | | | | 377 | | | | (3 | ) | | | 370 | | | | 385 | | | | 385 | | | | - | | | | 378 | |
| Provincial government general capital | | | 3,082 | | | | 3,702 | | | | 620 | | | | 2,363 | | | | 3,584 | | | | 3,701 | | | | 117 | | | | 3,133 | |
| Social housing 4 | | | 1,158 | | | | 1,204 | | | | 46 | | | | 841 | | | | 2,193 | | | | 2,169 | | | | (24 | ) | | | 1,027 | |
| Other 5 | | | 35 | | | | 60 | | | | 25 | | | | 47 | | | | 56 | | | | 58 | | | | 2 | | | | 35 | |
| Total other | | | 4,697 | | | | 5,388 | | | | 691 | | | | 3,690 | | | | 6,248 | | | | 6,360 | | | | 112 | | | | 4,618 | |
| Total other taxpayer-supported | | | 45,348 | | | | 49,579 | | | | 4,231 | | | | 43,021 | | | | 49,202 | | | | 51,582 | | | | 2,380 | | | | 46,229 | |
| Total taxpayer-supported debt | | | 45,348 | | | | 54,834 | | | | 9,486 | | | | 43,021 | | | | 49,202 | | | | 59,802 | | | | 10,600 | | | | 46,229 | |
| Self-supported debt | | | | | | | | | | | | | | | | | | | | | | | | | | | | | | | | |
| Commercial Crown corporations | | | | | | | | | | | | | | | | | | | | | | | | | | | | | | | | |
| BC Hydro | | | 23,508 | | | | 24,001 | | | | 493 | | | | 22,392 | | | | 24,357 | | | | 24,379 | | | | 22 | | | | 23,238 | |
| BC Liquor Distribution Branch | | | 291 | | | | 211 | | | | (80 | ) | | | - | | | | 273 | | | | 175 | | | | (98 | ) | | | 210 | |
| BC Lottery Corporation 6 | | | 112 | | | | 262 | | | | 150 | | | | 80 | | | | 123 | | | | 280 | | | | 157 | | | | 233 | |
| Columbia Power Corporation | | | 276 | | | | 271 | | | | (5 | ) | | | 276 | | | | 271 | | | | 270 | | | | (1 | ) | | | 276 | |
| Columbia Basin power projects 7 | | | 1,387 | | | | 1,369 | | | | (18 | ) | | | 1,404 | | | | 1,368 | | | | 1,365 | | | | (3 | ) | | | 1,387 | |
| Post-secondary institutions’ subsidiaries | | | 388 | | | | 504 | | | | 116 | | | | 388 | | | | 388 | | | | 504 | | | | 116 | | | | 504 | |
| Other | | | 95 | | | | 89 | | | | (6 | ) | | | 30 | | | | 110 | | | | 95 | | | | (15 | ) | | | 84 | |
| Total self-supported debt | | | 26,057 | | | | 26,707 | | | | 650 | | | | 24,570 | | | | 26,890 | | | | 27,068 | | | | 178 | | | | 25,932 | |
| Forecast allowance | | | - | | | | - | | | | - | | | | - | | | | 300 | | | | 1,000 | | | | 700 | | | | - | |
| Total provincial debt | | | 71,405 | | | | 81,541 | | | | 10,136 | | | | 67,591 | | | | 76,392 | | | | 87,870 | | | | 11,478 | | | | 72,161 | |
1 Provincial debt is prepared in accordance with Generally Accepted Accounting Principles and presented consistent with the Debt Summary Report included in the Public Accounts. Debt is shown net of sinking funds and unamortized discounts, excludes accrued interest, and includes non-guaranteed debt directly incurred by commercial Crown corporations and debt guaranteed by the Province.
2 Liquidity enhancement represents the additional temporary borrowing undertaken during the COVID-19 crisis, beyond operating or capital needs, which is held in cash or cash equivalents.
3 Includes debt and guarantees incurred by the government on behalf of school districts, universities, colleges, health authorities and hospital societies (SUCH), and debt directly incurred by these entities.
4 Includes the BC Housing Management Commission and the Provincial Rental Housing Corporation.
5 Includes debt of other service delivery agencies, loan guarantees to agricultural producers, guarantees issued under economic development and home mortgage assistance programs and loan guarantee provisions.
6 BC Lottery Corporation budget amounts did not include amounts for lease liabilities related to right of use assets (IFRS 16 Leases). At March 31, 2020, BC Lottery Corporation recorded $53 million in lease liabilities.
7 Joint ventures of the Columbia Power Corporation and Columbia Basin Trust.
| | FIRST QUARTERLY REPORT 2020/21 | | 33 |
UPDATED 2020/21 FINANCIAL FORECAST
Table 1.13 2020/21 Statement of Financial Position
| | | Actual | | | Year-to-Date | | | Forecast | |
| | | March 31, | | | June 30, | | | March 31, | |
| ($ millions) | | 2020 | | | 2020 | | | 2021 | |
| Financial assets | | | | | | | | | | | | |
| Cash and temporary investments | | | 3,985 | | | | 9,124 | | | | 5,081 | |
| Other financial assets | | | 12,278 | | | | 13,981 | | | | 10,501 | |
| Sinking funds | | | 692 | | | | 677 | | | | 499 | |
| Investments in commercial Crown corporations: | | | | | | | | | | | | |
| Retained earnings | | | 6,515 | | | | 7,617 | | | | 7,407 | |
| Recoverable capital loans | | | 24,768 | | | | 25,563 | | | | 25,845 | |
| | | | 31,283 | | | | 33,180 | | | | 33,252 | |
| | | | 48,238 | | | | 56,962 | | | | 49,333 | |
| Liabilities | | | | | | | | | | | | |
| Accounts payable and accrued liabilities | | | 11,497 | | | | 10,981 | | | | 12,546 | |
| Deferred revenue | | | 10,576 | | | | 11,200 | | | | 11,634 | |
| Debt: | | | | | | | | | | | | |
| Taxpayer-supported debt | | | 46,229 | | | | 54,834 | | | | 59,802 | |
| Self-supported debt | | | 25,932 | | | | 26,707 | | | | 27,068 | |
| Forecast allowance | | | - | | | | - | | | | 1,000 | |
| Total provincial debt | | | 72,161 | | | | 81,541 | | | | 87,870 | |
| Add: debt offset by sinking funds | | | 692 | | | | 677 | | | | 499 | |
| Less: guarantees and non-guaranteed debt | | | (1,337 | ) | | | (1,327 | ) | | | (1,228 | ) |
| Financial statement debt | | | 71,516 | | | | 80,891 | | | | 87,141 | |
| | | | 93,589 | | | | 103,072 | | | | 111,321 | |
| Net liabilities | | | (45,351 | ) | | | (46,110 | ) | | | (61,988 | ) |
| Capital and other non-financial assets | | | | | | | | | | | | |
| Tangible capital assets | | | 50,025 | | | | 50,369 | | | | 54,460 | |
| Other non-financial assets | | | 3,208 | | | | 3,264 | | | | 2,670 | |
| | | | 53,233 | | | | 53,633 | | | | 57,130 | |
| Accumulated surplus (deficit) | | | 7,882 | | | | 7,523 | | | | (4,858 | ) |
Changes in Financial Position
| | | Year-to-Date | | | Forecast | |
| | | June 30, | | | March 31, | |
| ($ millions) | | 2020 | | | 2021 | |
| Deficit for the period | | | 1,128 | | | | 12,792 | |
| Comprehensive income (increase) decrease | | | (769 | ) | | | (52 | ) |
| Decrease in accumulated surplus | | | 359 | | | | 12,740 | |
| Capital and other non-financial asset changes: | | | | | | | | |
| Taxpayer-supported capital investments | | | 926 | | | | 7,015 | |
| Less: amortization and other accounting changes | | | (582 | ) | | | (2,580 | ) |
| Increase in net capital assets | | | 344 | | | | 4,435 | |
| Increase (decrease) in other non-financial assets | | | 56 | | | | (538 | ) |
| Increase in capital and other non-financial assets | | | 400 | | | | 3,897 | |
| Increase in net liabilities | | | 759 | | | | 16,637 | |
| Investment and working capital changes: | | | | | | | | |
| Investment in commercial Crown corporations: | | | | | | | | |
| Increase in retained earnings | | | 1,102 | | | | 892 | |
| Self-supported capital investments | | | 727 | | | | 3,372 | |
| Less: loan repayments and other accounting changes | | | 68 | | | | (2,295 | ) |
| Increase in investment in commercial Crown corporations | | | 1,897 | | | | 1,969 | |
| Increase in cash and temporary investments | | | 5,139 | | | | 1,096 | |
| Increase (decrease) in other working capital | | | 1,580 | | | | (4,077 | ) |
| Increase (decrease) in Investment and working capital | | | 8,616 | | | | (1,012 | ) |
| Increase in financial statement debt | | | 9,375 | | | | 15,625 | |
| Decrease in sinking fund debt | | | 15 | | | | 193 | |
| Decrease in guarantees and non-guaranteed debt | | | (10 | ) | | | (109 | ) |
| Increase in total provincial debt | | | 9,380 | | | | 15,709 | |
| 34 | | FIRST QUARTERLY REPORT 2020/21 | |
UPDATED 2020/21 FINANCIAL FORECAST
Table 1.14 Material Assumptions – Revenue
| | | Budget | | | Updated | | | |
| Revenue Source and Assumptions | | Estimate | | | Forecast | | | |
| ($ millions unless otherwise specified) | | 2020/21 | | | 2020/21 | | | 2020/21 Sensitivities |
| Personal income tax * | | | 11,771 | | | | 10,793 | | | |
| Current calendar year assumptions | | | | | | | | | | |
| Household income growth | | | 3.8 | % | | | -3.3 | % | | +/- 1 percentage point change in |
| Compensation of employees growth | | | 4.0 | % | | | -6.4 | % | | 2020 B.C. household income growth |
| Tax base growth | | | 3.8 | % | | | -4.0 | % | | equals +/- $105 to $115 million |
| Average tax yield | | | 5.92 | % | | | 5.82 | % | | |
| Current-year tax | | | 11,289 | | | | 10,262 | | | |
| Prior year’s tax assessments | | | 520 | | | | 520 | | | |
| Unapplied taxes | | | 90 | | | | 100 | | | |
| B.C. Tax Reduction | | | (170 | ) | | | (190 | ) | | |
| Non-refundable B.C. tax credits | | | (94 | ) | | | (94 | ) | | |
| Policy neutral elasticity ** | | | 1.2 | | | | 1.3 | | | +/- 0.5 change in 2020 B.C. |
| Fiscal year assumptions | | | | | | | | | | policy neutral elasticity |
| Prior-year adjustment | | | - | | | | 134 | | | equals -/+ $200 to $210 million |
| | | | | | | | | | | |
| 2019 Tax-year | | | 2019 Assumptions | | | |
| Household income growth | | | 4.4 | % | | | 4.5 | % | | +/- 1 percentage point change in 2019 |
| Tax base growth | | | 4.8 | % | | | 4.8 | % | | B.C. household or taxable income |
| Average 2019 tax yield | | | 5.75 | % | | | 5.75 | % | | growth equals +/- $100 to $120 |
| 2019 tax | | | 10,572 | | | | 10,572 | | | million one-time effect |
| 2018 & prior year’s tax assessments | | | 510 | | | | 510 | | | (prior-year adjustment) |
| Unapplied taxes | | | 90 | | | | 100 | | | and could result in an |
| B.C. Tax Reduction | | | (166 | ) | | | (166 | ) | | additional +/- $120 to $140 million |
| Non-refundable B.C. tax credits | | | (94 | ) | | | (94 | ) | | base change in 2020/21 |
| Policy neutral elasticity ** | | | 1.3 | | | | 1.3 | | | |
| |
| * Reflects information as at August 14, 2020 | | | | | | | | | | |
| ** Per cent growth in current year tax revenue (excluding policy measures) relative to per cent growth in household income (calendar year). |
| |
| |
| Corporate income tax * | | | 4,739 | | | | 3,595 | | | |
| Components of revenue (fiscal year) | | | | | | | | | | |
| Instalments – subject to general rate | | | 4,600 | | | | 3,542 | | | |
| Instalments – subject to small business rate | | | 281 | | | | 217 | | | |
| Non-refundable B.C. tax credits | | | (145 | ) | | | (132 | ) | | |
| Advance instalments | | | 4,736 | | | | 3,627 | | | |
| Prior-year settlement payment | | | 3 | | | | (32 | ) | | |
| Current calendar year assumptions | | | | | | | | | | |
| National tax base ($ billions) | | | 365.9 | | | | 295.4 | | | +/- 1% change in the 2020 |
| B.C. instalment share of national tax base | | | 14.2 | % | | | 14.1 | % | | national tax base equals |
| Effective tax rates (general/small business) | | | 12.0 / 2.0 | | | | 12.0 / 2.0 | | | +/- $20 to $40 million |
| Share of the B.C. tax base subject to | | | | | | | | | | |
| small business rate | | | 26.9 | % | | | 26.9 | % | | +/- 1 percentage point change in the |
| B.C. tax base growth (post federal measures) | | | 3.9 | % | | | -7.8 | % | | 2020 small business share equals |
| B.C. net operating surplus growth | | | 2.0 | % | | | -18.6 | % | | -/+ $40 to $60 million |
| | | | | | | | | | | |
| 2019 Tax-year | | | 2019 Assumptions | | | |
| B.C. tax base growth (post federal measures) | | | -4.5 | % | | | -4.5 | % | | |
| Share of the B.C. tax base subject to | | | | | | | | | | |
| small business rate | | | 27.4 | % | | | 27.4 | % | | +/- 1% change in the 2019 B.C. tax base |
| B.C. net operating surplus growth | | | -8.8 | % | | | -6.7 | % | | equals +/- $40 to $50 million one-time effect |
| Gross 2019 tax | | | 4,638 | | | | 4,638 | | | (prior-year adjustment) and could result in an |
| Prior-year settlement payment | | | 3 | | | | (32 | ) | | additional instalments payments of |
| Prior years losses/gains (included in above) | | | (50 | ) | | | (100 | ) | | +/- $60 to $80 million in 2020/21 |
| Non-refundable B.C. tax credits | | | (137 | ) | | | (122 | ) | | |
* Reflects information as at August 21, 2020.
Net cash received from the federal government and cash refunds under the International Business Activity Act (phasing out) are used as the basis for estimating revenue. Due to lags in the federal collection and instalment systems, changes to the B.C. net operating surplus and tax base forecasts affect revenue in the succeeding year. The 2020/21 instalments from the federal government reflects two-third of payments related to the 2020 tax year (paid during Apr-July 2020 and adjusted in Sept and Dec) and one-third of 2021 payments. Instalments for the 2020 (2021) tax year are based on B.C.’s share of the national tax base for the 2019 (2020) tax year and a forecast of the 2020 (2021) national tax base. B.C.’s share of the 2018 national tax base was 14.2%, based on tax assessments as of December 31, 2019. Cash adjustments for any under/over payments from the federal government in respect of 2019 will be received/paid on March 31, 2021.

| | FIRST QUARTERLY REPORT 2020/21 | | 35 |
UPDATED 2020/21 FINANCIAL FORECAST
| Table 1.14 Material Assumptions – Revenue (continued) |
| |
| | | Budget | | | Updated | | | |
| Revenue Source and Assumptions | | Estimate | | | Forecast | | | |
| ($ millions unless otherwise specified) | | 2020/21 | | | 2020/21 | | | 2020/21 Sensitivities |
| Employer health tax | | | 1,924 | | | | 1,776 | | | |
| Compensation of employees growth | | | 4.0 | % | | | -6.4 | % | | +/- 1 percentage point change in the |
| | | | | | | | | | | 2020 compensation of employees |
| | | | | | | | | | | growth equals up to +/- $20 million |
| Provincial sales tax | | | 7,905 | | | | 6,881 | | | |
| Provincial sales tax base growth (fiscal year) | | | 3.7 | % | | | -6.8 | % | | +/- 1 percentage point change in the |
| Calendar Year nominal expenditure | | | | | | | | | | 2020 consumer expenditure growth |
| Consumer expenditures on durable goods | | | 1.7 | % | | | -19.5 | % | | equals up to +/- $25 million |
| Consumer expenditures on goods and services | | | 4.5 | % | | | -6.7 | % | | |
| Business investment | | | 4.1 | % | | | -10.7 | % | | |
| Other | | | 3.2 | % | | | -7.8 | % | | |
| Components of Provincial sales tax revenue | | | | | | | | | | +/- 1 percentage point change in the |
| Consolidated Revenue Fund | | | 7,895 | | | | 6,871 | | | 2020 business investment growth |
| BC Transportation Financing Authority | | | 10 | | | | 10 | | | equals up to +/- $10 million |
| Fuel and carbon taxes | | | 2,978 | | | | 2,509 | | | |
| Calendar Year | | | | | | | | | | |
| Real GDP | | | 2.0 | % | | | -6.7 | % | | |
| Gasoline volumes | | | 0.0 | % | | | -6.0 | % | | |
| Diesel volumes | | | 2.0 | % | | | -4.0 | % | | |
| Natural gas volumes | | | 2.0 | % | | | -12.0 | % | | |
| Carbon tax rates * | | | | | | | | | | |
| Carbon dioxide equivalent emissions ($/tonne) | | | 45 | | | | 40 | | | |
| Natural gas (cents/gigajoule) | | | 223.47 | ¢ | | | 198.64 | ¢ | | |
| Gasoline (cents/litre) | | | 9.96 | ¢ | | | 8.89 | ¢ | | |
| Light fuel oil (cents/litre) | | | 11.71 | ¢ | | | 10.23 | ¢ | | |
| |
| *Carbon tax rate increase scheduled for April 1, 2020 at Budget 2020 is now delayed to April 1, 2021. |
| |
| Components of revenue | | | | | | | | | | |
| Consolidated Revenue Fund | | | 543 | | | | 501 | | | |
| BC Transit | | | 20 | | | | 18 | | | |
| BC Transportation Financing Authority | | | 461 | | | | 430 | | | |
| | | | 1,024 | | | | 949 | | | |
| Carbon tax revenue | | | 1,954 | | | | 1,560 | | | |
| | | | | | | | | | | |
| Property taxes | | | 3,026 | | | | 2,332 | | | |
| Calendar Year | | | | | | | | | | |
| Consumer Price Index | | | 2.2 | % | | | 0.9 | % | | +/- 1 percentage point change in |
| Housing starts (units) | | | 35,021 | | | | 34,000 | | | 2020 new construction & inflation |
| Home owner grants (fiscal year) | | | 848 | | | | 870 | | | growth equals up to +/- $20 million in |
| Components of revenue | | | | | | | | | | residential property taxation revenue |
| Residential (net of home owner grants) | | | 1,170 | | | | 1,134 | | | |
| Speculation and vacancy | | | 185 | | | | 80 | | | |
| Non-residential | | | 1,334 | | | | 762 | | | +/- 1% change in 2020 total |
| Rural area | | | 125 | | | | 129 | | | business property assessment |
| Police | | | 34 | | | | 37 | | | value equals up to +/- $20 million |
| BC Assessment Authority | | | 96 | | | | 99 | | | in non-residential property |
| BC Transit | | | 82 | | | | 91 | | | taxation revenue |
| Other taxes | | | 3,001 | | | | 2,706 | | | |
| Calendar Year | | | | | | | | | | |
| Population | | | 1.4 | % | | | 1.4 | % | | |
| Residential sales value | | | 4.6 | % | | | -9.6 | % | | |
| Real GDP | | | 2.0 | % | | | -6.7 | % | | |
| Nominal GDP | | | 3.9 | % | | | -6.5 | % | | |
| Components of revenue | | | | | | | | | | +/- 1% change to 2020 residential |
| Property transfer | | | 1,586 | | | | 1,271 | | | sales value equals +/- $15 million |
| Additional Property Transfer Tax (included in above)* | | 123 | | | | 109 | | | in property transfer revenue, |
| Tobacco | | | 755 | | | | 730 | | | depending on property values |
| Insurance premium | | | 660 | | | | 705 | | | |
| | | | | | | | | | | |
|
| *Additional tax rate is 20% | | | | | | | | | | |
| 36 | | FIRST QUARTERLY REPORT 2020/21 | |
UPDATED 2020/21 FINANCIAL FORECAST
| Table 1.14 Material Assumptions – Revenue (continued) |
| | | |
| | | Budget | | | Updated | | | |
| Revenue Source and Assumptions | | Estimate | | | Forecast | | | |
| ($ millions unless otherwise specified) | | 2020/21 | | | 2020/21 | | | 2020/21 Sensitivities |
| Energy, sales of Crown land tenures, metals, minerals and other * | | | 838 | | | | 571 | | | |
| Natural gas price | | | | | | | | | | +/- $0.25 change in the natural gas price equals |
| Plant inlet, $C/gigajoule | | | 0.62 | | | | 0.86 | | | +/- $30 to $40 million, including impacts on production volumes |
| Sumas, $US/MMBtu | | | 1.96 | | | | 1.55 | | | and royalty program credits, but excluding any changes from |
| Natural gas production volumes | | | | | | | | | | natural gas liquids revenue (e.g. butane, pentanes) |
| Billions of cubic metres | | | 56.3 | | | | 53.3 | | | Sensitivities can also vary significantly at different price levels |
| Petajoules | | | 2,343 | | | | 2,218 | | | +/- 1% change in natural gas volumes equals +/- $2 million |
| Annual per cent change | | | 7.1 | % | | | -1.0 | % | | in natural gas royalties |
| | | | | | | | | | | +/- 1 cent change in the exchange rate equals +/- less than |
| Oil price ($US/bbl at Cushing, OK) | | | 61.13 | | | | 37.40 | | | $1 million in natural gas royalties |
| | | | | | | | | | | +/- $10/bbl change in petroleum price equals +/- $7 million |
| Auctioned land base (000 hectares) | | | 25 | | | | - | | | in petroleum royalties |
| Average bid price/hectare ($) | | | 350 | | | | - | | | +/- 27% change in natural gas liquids (equivalent to +/- $10/bbl |
| Cash sales of Crown land tenures | | | 9 | | | | - | | | oil price) prices equals +/- $28 million in natural gas |
| Metallurgical coal price ($US/tonne, fob Australia) | | | 155 | | | | 127 | | | liquids royalties |
| Copper price ($US/lb) | | | 2.81 | | | | 2.62 | | | +/- US$20 change in the average metallurgical coal price |
| Annual electricity volumes set by treaty | | | 3.8 | | | | 3.8 | | | equals +/- $50 to $80 million |
| (million mega-watt hours) | | | | | | | | | | |
Mid-Columbia electricity price
($US/mega-watt hour) | | | 33.93 | | | | 26.45 | | | +/- 10% change in the average Mid-Columbia electricity price equals +/- $15 million |
| | | | | | | | | | |
| | | | | | | | | | | |
| Exchange rate (US cents/$C, calendar year) | | | 76.3 | | | | 73.3 | | | |
| Components of revenue | | | | | | | | | | |
| Bonus bid auctions: | | | | | | | | | | Based on a recommendation |
| Deferred revenue | | | 115 | | | | 115 | | | from the Auditor General to be |
| Current-year cash (one-tenth) | | | 1 | | | | - | | | consistent with generally |
| Fees and rentals | | | 52 | | | | 50 | | | accepted accounting principles, |
| Total bonus bids, fees and rentals | | | 168 | | | | 165 | | | bonus bid revenue recognition |
| Natural gas royalties after deductions and allowances | | | 207 | | | | 94 | | | reflects ten-year deferral of
cash receipts from the sale of |
| Petroleum royalties | | | 44 | | | | 18 | | | Crown land tenures |
| Columbia River Treaty electricity sales | | | 153 | | | | 119 | | | |
| Oil and Gas Commission fees and levies | | | 72 | | | | 65 | | | |
| Coal, metals and other minerals revenue: | | | | | | | | | | |
| Coal tenures | | | 8 | | | | 8 | | | |
| Net coal mineral tax | | | 90 | | | | 19 | | | |
| Net metals and other minerals tax | | | 41 | | | | 28 | | | |
| Recoveries relating to revenue sharing payments to First Nations | | | 38 | | | | 38 | | | |
| Miscellaneous mining revenue | | | 17 | | | | 17 | | | |
| Total coal, metals and other minerals revenue | | | 194 | | | | 110 | | | |
| | | | | | | | | | | |
| Gross royalties prior to deductions and allowances | | | | | | | | | | |
| Gross natural gas revenue | | | 170 | | | | 215 | | | |
| Gross natural gas liquids royalties revenue | | | 510 | | | | 308 | | | |
| | | | | | | | | | | |
| Royalty programs and infrastructure credits | | | | | | | | | | |
| Deep drilling | | | (267 | ) | | | (243 | ) | | |
| Road, pipeline, Clean Growth Infrastructure Royalty and other infrastructure programs | | | (76 | ) | | | (76 | ) | | |
| Total | | | (343 | ) | | | (319 | ) | | |
| Implicit average natural gas royalty rate | | | 14.3 | % | | | 5.0 | % | | |
Royalty program (marginal, low productivity and ultra marginal drilling) adjustments reflect reduced royalty rates.
Natural gas royalties incorporate royalty programs and Treasury Board approved infrastructure credits.
* Reflects information as at August 5, 2020
| | FIRST QUARTERLY REPORT 2020/21 | | 37 |
UPDATED 2020/21 FINANCIAL FORECAST
| Table 1.14 Material Assumptions – Revenue (continued) |
| | | | | | | | | |
| | | Budget | | | Updated | | | |
| Revenue Source and Assumptions | | Estimate | | | Forecast | | | |
| ($ millions unless otherwise specified) | | 2020/21 | | | 2020/21 | | | 2020/21 Sensitivities |
| Forests * | | | 867 | | | | 897 | | | |
| Prices (calendar year average) | | | | | | | | | | +/- US$50 change in SPF |
| SPF 2x4 ($US/thousand board feet) | | | 380 | | | | 410 | | | price equals +/- $125 to $150 million |
| Pulp ($US/tonne) | | | 815 | | | | 834 | | | +/- US$50 change in pulp price |
| Coastal log ($Cdn/cubic metre); | | | | | | | | | | equals +/-$5 to $10 million |
| Vancouver Log Market | | | 120 | | | | 137 | | | +/- Cdn$10 change in average |
| | | | | | | | | | | log price equals +/-$20 to |
| Crown harvest volumes (million cubic metres) | | | | | | | | | | $30 million |
| Interior | | | 35.0 | | | | 33.5 | | | +/- 10% change in Interior |
| Coast | | | 11.0 | | | | 10.5 | | | harvest volumes equals |
| Total | | | 46.0 | | | | 44.0 | | | +/- $60 to $70 million |
| B.C. Timber Sales (included in above) | | | 10.5 | | | | 10.5 | | | +/- 10% change in Coastal |
| | | | | | | | | | | harvest volumes equals |
| Stumpage rates ($Cdn/cubic metre) | | | | | | | | | | +/- $10 to $20 million |
| Total stumpage rates | | | 16.83 | | | | 18.52 | | | +/- 1 cent change in |
| | | | | | | | | | | exchange rate equals |
| Components of revenue | | | | | | | | | | +/- $20 to $25 million in |
| Timber tenures (net of revenue sharing recoveries) | | | 394 | | | | 438 | | | stumpage revenue |
| Recoveries relating to tenures stumpage revenue sharing payments to First Nations | | | 40 | | | | 40 | | | |
| B.C. Timber Sales | | | 361 | | | | 362 | | | The above sensitivities relate |
| Logging tax | | | 30 | | | | 15 | | | to stumpage revenue only. |
| Other CRF revenue | | | 21 | | | | 21 | | | |
| Other recoveries | | | 21 | | | | 21 | | | |
|
| * Reflects information as at August 6, 2020 | | | | | | | | | | |
| | | | | | | | | | | |
| Other natural resources | | | 444 | | | | 437 | | | |
| Components of revenue | | | | | | | | | | |
| Water rental and licences* | | | 375 | | | | 368 | | | |
| Recoveries | | | 46 | | | | 46 | | | |
| Angling and hunting permits and licences | | | 10 | | | | 10 | | | |
| Recoveries | | | 13 | | | | 13 | | | |
| | | | | | | | | | | |
|
| * Water rentals for power purposes are indexed to Consumer Price Index. | | | | |
| | | | | | | | | | | |
| Total natural resource recoveries relating to | | | | | | | | | | Revenue sharing from natural gas royalties, |
| revenue sharing payments to First Nations | | | 80 | | | | 80 | | | mineral tax and forest stumpage revenues |
| | | | | | | | | | | |
| Other revenue | | | 9,712 | | | | 8,715 | | | |
| Components of revenue | | | | | | | | | | |
| Fees and licences | | | | | | | | | | |
| Motor vehicle licences and permits | | | 586 | | | | 571 | | | |
| International student health fees | | | 70 | | | | 40 | | | |
| Other Consolidated Revenue Fund | | | 447 | | | | 444 | | | |
| Summary consolidation eliminations | | | (16 | ) | | | (14 | ) | | |
| Other recoveries | | | 110 | | | | 110 | | | |
| Taxpayer-supported Crown corporations | | | 149 | | | | 125 | | | |
| Post-secondary education fees | | | 2,578 | | | | 2,223 | | | |
| Other healthcare-related fees | | | 439 | | | | 446 | | | |
| School Districts | | | 304 | | | | 174 | | | |
| Investment earnings | | | | | | | | | | |
| Consolidated Revenue Fund | | | 108 | | | | 110 | | | |
| Fiscal agency loans & sinking funds earnings | | | 926 | | | | 886 | | | |
| Summary consolidation eliminations | | | (47 | ) | | | (42 | ) | | |
| Taxpayer-supported Crown corporations | | | 36 | | | | 33 | | | |
| SUCH sector agencies | | | 224 | | | | 224 | | | |
| Sales of goods and services | | | | | | | | | | |
| SUCH sector agencies | | | 935 | | | | 606 | | | |
| BC Infrastructure Benefits Inc | | | 73 | | | | 67 | | | |
| Other taxpayer-supported Crown corporations | | | 227 | | | | 156 | | | |
| Miscellaneous | | | 2,563 | | | | 2,556 | | | |
| 38 | | FIRST QUARTERLY REPORT 2020/21 | |
UPDATED 2020/21 FINANCIAL FORECAST
| Table 1.14 Material Assumptions – Revenue (continued) |
| |
| | | Budget | | | Updated | | | |
| Revenue Source and Assumptions | | Estimate | | | Forecast | | | |
| ($ millions unless otherwise specified) | | 2020/21 | | | 2020/21 | | | 2020/21 Sensitivities |
| Health and social transfers | | | 7,683 | | | | 7,681 | | | |
| National Cash Transfers | | | | | | | | | | |
| Canada Health Transfer (CHT) | | | 41,870 | | | | 41,870 | | | |
| Annual growth | | | 3.7 | % | | | 3.7 | % | | |
| Canada Social Transfer (CST) | | | 15,023 | | | | 15,023 | | | |
| B.C.’s share of national population (June 1) | | | 13.503 | % | | | 13.501 | % | | +/- 0.1 percentage point change in |
| | | | | | | | | | | B.C.’s population share equals |
| B.C. health and social transfers revenue | | | | | | | | | | +/- $57 million |
| CHT | | | 5,654 | | | | 5,653 | | | |
| CST | | | 2,029 | | | | 2,028 | | | |
| | | | | | | | | | | |
| Other federal contributions | | | 2,280 | | | | 4,636 | | | |
| Components of revenue | | | | | | | | | | |
| COVID-19 related funding: | | | | | | | | | | |
| Safe Restart Agreement | | | | | | | 1,963 | | | |
| COVID-19 Essential Workers Support Fund | | | | | | | 371 | | | |
| Financial Assistance Agreement to Support Closure | | | | | | | | | | |
| and Restoration of Oil and Gas | | | | | | | | | | |
| Sites in British Columbia | | | | | | | 42 | | | |
| Total | | | — | | | | 2,376 | | | |
| Disaster Financial Arrangements | | | 80 | | | | 68 | | | |
| B.C.’s share of the federal cannabis excise tax | | | 50 | | | | 25 | | | |
| Low Carbon Economy Leadership Fund | | | 16 | | | | 16 | | | |
| Other Consolidated Revenue Fund | | | 145 | | | | 152 | | | |
| Vote Recoveries: | | | | | | | | | | |
| Labour Market Development Agreement | | | 329 | | | | 329 | | | |
| Labour Market and Skills Training Program | | | 124 | | | | 124 | | | |
| Home Care | | | 88 | | | | 88 | | | |
| Mental Health | | | 81 | | | | 81 | | | |
| Low Carbon Economy Leadership Fund | | | 15 | | | | 15 | | | |
| Early Childhood Development and | | | | | | | | | | |
| Child Care Services | | | 41 | | | | 41 | | | |
| Child Safety, Family Support, Children | | | | | | | | | | |
| in Care and with special needs | | | 75 | | | | 75 | | | |
| Policing and Security | | | 9 | | | | 9 | | | |
| Public Transit | | | 46 | | | | 46 | | | |
| Local government services and transfers | | | 159 | | | | 159 | | | |
| Other recoveries | | | 125 | | | | 125 | | | |
| Taxpayer-supported Crown corporations | | | 260 | | | | 284 | | | |
| Post-secondary institutions | | | 525 | | | | 509 | | | |
| Other SUCH sector agencies | | | 112 | | | | 114 | | | |
| Service delivery agency direct revenue | | | 8,182 | | | | 7,223 | | | |
| School districts | | | 724 | | | | 587 | | | |
| Post-secondary institutions | | | 4,480 | | | | 3,791 | | | |
| Health authorities and hospital societies | | | 1,214 | | | | 1,238 | | | |
| BC Transportation Financing Authority | | | 565 | | | | 548 | | | |
| Other service delivery agencies | | | 1,199 | | | | 1,059 | | | |
| Commercial Crown corporation net income | | | 3,417 | | | | 2,484 | | | |
| BC Hydro | | | 712 | | | | 712 | | | |
| Reservoir water inflows | | | 100 | % | | | 106 | % | | +/-1% in hydro generation, equals +/- $3 million |
| Mean gas price | | | 2.16 | | | | 2.38 | | | +/-10% equals +/-$0.4 million |
| (Sumas, $US/MMbtu – BC Hydro forecast based on NYMEX forward selling prices) |
| Electricity prices | | | 27.67 | | | | 24.08 | | | +/-10% change in electricity/gas trade |
| (Mid-C, $US/MWh) | | | | | | | | | | income equals +/-$20 million |
| ICBC | | | 86 | | | | 86 | | | |
| Vehicle growth | | | +1.3% | | | | -1.1 | % | | +/-1% equals +/-$64 million |
| Current claims cost percentage change | | | +13.4% | | | | 2.6 | % | | +/-1% equals -/+$49 million |
| Unpaid claims balance ($ billions) | | | 16.1 | | | | 15.7 | | | +/-1% equals -/+$157 to $160 million |
| Investment return | | | 2.5 | % | | | 2.1 | % | | +/-1% return equals +/-$184 to $187 million |
| Loss ratio | | | 89.0 | % | | | 82.2 | % | | |
| | FIRST QUARTERLY REPORT 2020/21 | | 39 |
UPDATED 2020/21 FINANCIAL FORECAST
| Table 1.15 Material Assumptions – Expense |
| |
| | | Budget | | | Updated | | | |
| Ministry Programs and Assumptions | | Estimate | | | Forecast | | | |
| ($ millions unless otherwise specified) | | 2020/21 | | | 2020/21 | | | 2020/21 Sensitivities |
| Advanced Education, Skills and Training | | | 2,366 | | | | 2,366 | | | |
| Student spaces in public institutions | | | 203,575 | | | | 203,575 | | | Student enrolments may fluctuate due to a number of factors |
| | | | | | | | | | | including economic changes, labour market needs and impact of COVID-related changes to delivery models and institutional protocols. Current year forecast to be updated at Q3 to align with PSI reporting, consistent with past practice. |
| | | | | | | | | | | |
| Attorney General | | | 652 | | | | 652 | | | |
New cases filed/processed (# for all courts) | | | 240,000 | | | | 240,000 | | | The number of criminal cases proceeded on by the provincial and federal Crown (including appeals to higher courts in BC), the number of civil and family litigation cases, the number of violation tickets disputed, and the number of municipal bylaw tickets disputed which would go to court for resolution. |
| | | | | | | | | | | |
| Crown Proceeding Act (CPA) | | | 25 | | | | 25 | | | The number of new cases, and the difference between estimated settlements and actual settlements. |
| | | | | | | | | | | |
| Children and Family Development | | | 2,228 | | | | 2,228 | | | |
| Average children-in-care | | | 5,912 | | | | 5,912 | | | The average number of children-in-care is decreasing as a |
| caseload (#) | | | | | | | | | | result of ministry efforts to keep children in family settings |
Average annual residential
cost per child in care ($) | | | 83,211 | | | | 83,211 | | | where safe and feasible. The average cost per child in care is projected to increase based on the higher cost of contracted residential services and an increasing acuity of need for children in care. A 1% increase in the cost per case or a 1% increase in the average caseload will affect expenditures by $2.4 million (excluding Delegated Aboriginal Agencies). |
| | | | | | | | | | | |
| Education | | | 6,697 | | | | 6,697 | | | |
| Public School Enrolment (# of FTEs) | | | 570,113 | | | | 569,992 | | | Updated forecast enrolment figures are based on submissions from |
| School age (K–12) | | | 547,661 | | | | 547,540 | | | school districts of their actual enrolment as at September 30, 2019 |
| Continuing Education | | | 1,115 | | | | 1,115 | | | for the 2019/20 school year and projected enrolment for February |
| Distributed Learning (online) | | | 11,177 | | | | 11,177 | | | and May 2020 for Distributed Learning and Adults. Projections for |
| Summer | | | 7,279 | | | | 7,279 | | | 2020/21 to 2022/23 are based on the Ministry of Education’s |
| Adults | | | 2,881 | | | | 2,881 | | | enrolment forecasting model. |
| | | | | | | | | | | |
| Forests, Lands, Natural Resource Operations and Rural Development | | | 844 | | | | 920 | | | |
| BC Timber Sales | | | 219 | | | | 219 | | | Targets can be impacted by changes to actual inventory costs incurred. There is a lag of approximately 1.5 years between when inventory costs are incurred and when they are expensed. Volume harvested can also impact targets. For example, if volume harvested is less than projected in any year, then capitalized expenses will also be reduced in that year. |
| | | | | | | | | | | |
| Fire Management | | | 136 | | | | 212 | | | Costs are driven by length of season and severity of weather |
| | | | | | | | | | | conditions, severity of fires, proportion of interface fires and size of fires. |
| Health | | | 22,190 | | | | 22,190 | | | |
| Pharmacare | | | 1,411 | | | | 1,411 | | | A 1% increase in volume of services provided by fee-for-service physicians affects costs by approximately $25 million. |
| Medical Services Plan (MSP) | | | 5,243 | | | | 5,243 | | | A 1% increase in volume of services provided by fee-for-service physicians affects costs by approximately $25 million. |
| Regional Services | | | 15,233 | | | | 15,233 | | | |
| 40 | | FIRST QUARTERLY REPORT 2020/21 | |
UPDATED 2020/21 FINANCIAL FORECAST
| Table 1.15 Material Assumptions – Expense (continued) |
| |
| | | Budget | | | Updated | | | |
| Ministry Programs and Assumptions | | Estimate | | | Forecast | | | |
| ($ millions unless otherwise specified) | | 2020/21 | | | 2020/21 | | | 2020/21 Sensitivities |
| Public Safety and Solicitor General | | | 852 | | | | 946 | | | |
| Policing, Victim Services and Corrections | | | 702 | | | | 702 | | | Policing, Victim Services and Corrections costs are sensitive to the volume and severity of criminal activity, the number of inmate beds occupied and the number of offenders under community supervision. |
| | | | | | | | | | | |
| Emergency Program Act (EPA) | | | 37 | | | | 131 | | | For authorized expenditures under the EPA, including those for further disasters, and the difference between initial estimates for disaster response and recovery costs and final project costs. In 2020/21, the projected EPA expenditures are based on forecasts as of June 30, 2020. |
| | | | | | | | | | | |
| Social Development and Poverty Reduction | | | 3,683 | | | | 3,683 | | | |
| Temporary Assistance | | | 43,900 | | | | 63,596 | | | |
| annual average caseload (#) | | | | | | | | | | The expected to work caseload is sensitive to fluctuations in economic and employment trends. Costs are driven by changes to cost per case and caseload. Cost per case fluctuations result from changes in the needed supports required by clients, as well as caseload composition. |
| | | | | | | | | | | |
Disability Assistance annual average caseload (#) | | | 112,700 | | | | 116,005 | | | The caseload for persons with disabilities is sensitive to the aging of the population and longer life expectancy for individuals with disabilities. Cost per case fluctuations are driven primarily by earnings exemptions which is dependent on the level of income earned by clients. |
| | | | | | | | | | | |
| Adult Community Living: | | | | | | | | | | |
| Developmental Disabilities Programs | | | | | | | | | | |
| Average caseload (#) | | | 21,630 | | | | 21,620 | | | The adult community living caseload is sensitive to an aging |
| Average cost per client ($) | | | 48,400 | | | | 51,900 | | | fluctuations are driven by the proportion of clients receiving |
| Personal Supports Initiative (PSI) | | | | | | | | | | certain types of services at differing costs. For example, |
| Average caseload (#) | | | 2,360 | | | | 2,390 | | | residential care services are significantly more costly than day |
| Average cost per client ($) | | | 15,400 | | | | 16,100 | | | programs |
| | FIRST QUARTERLY REPORT 2020/21 | | 41 |
UPDATED 2020/21 FINANCIAL FORECAST
| Table 1.15 Material Assumptions – Expense (continued) |
| |
| | | Budget | | | Updated | | | |
| Ministry Programs and Assumptions | | Estimate | | | Forecast | | | |
| ($ millions unless otherwise specified) | | 2020/21 | | | 2020/21 | | | 2020/21 Sensitivities |
| Tax Transfers | | | 1,686 | | | | 2,100 | | | |
| Individuals | | | 702.0 | | | | 1,217.0 | | | |
| Climate Action Tax Credit | | | 302.0 | | | | 802.0 | | | These tax transfers are now expensed as |
| BC Child Opportunity Benefit* | | | 255.0 | | | | 255.0 | | | required under generally accepted accounting |
| Sales Tax | | | 50.0 | | | | 65.0 | | | principles. |
| Small Business Venture Capital | | | 30.0 | | | | 30.0 | | | |
| BC Senior’s Home Renovation | | | 2.0 | | | | 2.0 | | | |
| Other tax transfers to individuals | | | 63.0 | | | | 63.0 | | | |
| Corporations | | | 984.0 | | | | 883.0 | | | |
| Film and Television | | | 100.0 | | | | 97.5 | | | |
| Production Services | | | 695.3 | | | | 542.7 | | | |
| Scientific Research & Experimental Development | | | 76.0 | | | | 119.8 | | | |
| Interactive Digital Media | | | 70.0 | | | | 70.0 | | | |
| Mining Exploration | | | 20.0 | | | | 30.0 | | | |
| Other tax transfers to corporations | | | 22.7 | | | | 23.0 | | | |
| | | | | | | | | | | |
| Prior-year adjustment (included above)** | | | | | | | 16.0 | | | |
| Individuals | | | | | | | - | | | |
| Corporations | | | | | | | 16.0 | | | Changes in 2019 tax transfers will result in |
| | | | | | | | | | | one-time effect (prior-year adjustment) and |
| 2019 Tax-year | | | 2019 Assumptions | | | could result in an additional base change |
| Tax Transfers | | | 1,434.0 | | | | 1,465.0 | | | in 2020/21. Production services tax credit is |
| Individuals | | | 527.0 | | | | 527.0 | | | the most volatile of all tax transfers and is |
| Corporations | | | 907.0 | | | | 938.0 | | | influenced by several factors including delay |
| Film and Television | | | 100.0 | | | | 110.0 | | | in filing returns and assessment of claims, |
| Production Services | | | 624.0 | | | | 610.0 | | | length of projects and changes in the |
| Scientific Research & Experimental | | | | | | | | | | exchange rates. |
| Development | | | 70.0 | | | | 90.0 | | | |
| Interactive Digital Media | | | 70.0 | | | | 75.0 | | | |
| Other tax transfers to corporations | | | 43.0 | | | | 53.0 | | | |
| | | | | | | | | | | |
|
| * Effective October 1, 2020 the BC Child Opportunity Benefit will be combined with Early Childhood Tax Benefit into a single benefit. |
| **2020/21 tax transfer forecast incorporates adjustments relating to prior years. |
| | | | | | | | | | | |
| Management of Public Funds and Debt | | | 1,197 | | | | 1,280 | | | |
| Interest rates for new provincial borrowing: | | | | | | | | | | Full year impact on MoPD on interest costs of a 1% change in |
| Short-term | | | 1.52 | % | | | 0.32 | % | | interest rates equals $47.7 million; |
| Long-term | | | 2.69 | % | | | 2.17 | % | | $100 million increase in debt level equals $1.7 million. |
| CDN/US exchange rate (cents) | | | 131.4 | | | | 136.6 | | | |
| Service delivery agency net spending | | | 8,029 | | | | 7,684 | | | |
| School districts | | | 576 | | | | 502 | | | Expenses, net of Provincial funding. These are mainly funded |
| Post-secondary institutions | | | 4,233 | | | | 4,086 | | | through revenue from other sources. |
| Health authorities and hospital societies | | | 963 | | | | 990 | | | |
| BC Transportation Financing Authority | | | 1,444 | | | | 1,398 | | | |
| BC Infrastructure Benefits Inc | | | 73 | | | | 68 | | | |
| Other service delivery agencies | | | 740 | | | | 640 | | | |
| 42 | | FIRST QUARTERLY REPORT 2020/21 | |
UPDATED 2020/21 FINANCIAL FORECAST
Appendix A: Description of Measures
Pandemic Contingencies Spending Measures
Health care (over $1 billion): Funding related to health related COVID-19 response measures includes:
| · | Increased lab testing, including the establishment of over 80 separate testing sites to help avoid the transmission of COVID-19 within existing health care settings; |
| · | Additional funding for long-term care and assisted living facilities, including addressing increased COVID-19 related costs, implementing single-site work orders to help prevent the spread of disease between facilities, and hiring of up to three full-time equivalent staff at each of the 584 facilities; |
| · | Prevention and contact tracing measures, including plans to hire 500 contact tracers between September 2020 and March 2021 to help with the projected rise in cases of COVID-19; |
| · | Health related costs wrap-around support services for those that were living in unsafe decampments who have been moved to temporary housing; |
| · | Free parking at health authority sites to remove barriers to anyone who needed access and reduce the burden on health care workers; and |
| · | Other increased operating costs including personal protective equipment, accelerating rescheduled surgeries, and increased staffing across the health spectrum from general screening staff at health facility entrances to specialist physicians and nurses, and staff within the BC Center for Disease Control. |
Mental health and addictions support ($21 million): Funding includes mental health supports such as expanded virtual mental health supports including free online, video and phone-based skills-building for seniors, adults and youth and a Mobile Response Team to support the mental well-being and psychological safety of front-line health-care workers. In addition, this includes a number of addiction support services such as:
| · | Opioid response and addictions supports including funding for supportive recovery providers, and youth substance use treatment services; |
| · | Youth supports provided through Foundry and Foundry Virtual which offer health and wellness resources, services and supports online and through integrated service centres; |
| · | Scaling up existing overdose prevention services and adding new outreach teams to further help prevent overdose deaths, including opening 17 new supervised consumption services and 12 new inhalation services in communities that have been hit the hardest by the overdose crisis; |
| · | Funding to hire 42 new full-time registered nurses, psychiatric nurses, social workers and peer support workers for 14 interdisciplinary outreach teams across the province; |
| · | The Lifeguard application, which supports individuals with addictions with a means to call emergency services if they become unresponsive while using substances; and |
| · | Rapid Access to Consultative Expertise Line to support first responders with overdose health emergencies physicians treating patients with substance use disorders. |
| | FIRST QUARTERLY REPORT 2020/21 | | 43 |
UPDATED 2020/21 FINANCIAL FORECAST
Child care services ($254 million): Temporary emergency funding provided from April to August to ensure child care spaces remained available for essential service workers and to provide financial relief and preserve spaces for parents during any temporary closures. Licensed child care providers that stayed open received funding to keep operations going. These centres were eligible to receive seven times their average monthly funding from government which is expected to cover approximately 75 per cent of a group facility’s average monthly operating expenses. Licensed child care providers that closed were eligible to receive two times their average monthly government funding which is expected to cover approximately 20 per cent of an average group facility’s monthly operating expenses.
Temporary housing, meal and health supports for vulnerable populations ($158 million): Spaces at hotels, motels and community centres are assisting a range of people, including people experiencing homelessness, to self-isolate and follow health orders as well as receive food and support services. In addition to funding for these supports, the Province has made capital investments (approximately $111 million) to purchase hotels to help move people living in unsafe, dense encampments at Oppenheimer Park, Pandora Avenue and Topaz Park into safe spaces. Nearly 3,300 leased spaces are currently secured at sites throughout B.C.’s health regions to enable safe physical distancing in homeless shelters and help people self-isolate, with close to 300 spaces in communities secured for people leaving violent or unstable situations.
Essential services for adults with developmental disabilities and for vulnerable children and youth ($56 million): Funding to ensure continuity of services for adults with developmental disabilities receiving care from Community Living BC. Funding will provide a range of supports for children and youth that access provincial supports, including: $225 per month for eligible B.C. families with children with special needs to September 30, 2020, continuing existing care-giver arrangements for youth aging out of foster care, and extending the maximum duration of Agreements with Young Adults program beyond 48 months. Other essential service supports include funding to facilitate virtual court proceedings and accelerate the resolution of family law matters, supports for victim services, and COVID-19 related public awareness campaigns to communicate health and safety information.
K-12 Education – Return to School Funding ($46 million): Funding to support and ensure the health and safety of students and staff in the K-12 education sector, including school districts and independent schools, to restart in the fall. This investment will ensure the increased cleaning of high-contact surfaces, increased number of hand-hygiene stations and the availability of masks upon request, among other safety measures.
B.C. Emergency Benefit for Workers ($900 million): Provides a one-time, tax-free $1,000 payment to British Columbians who are losing income because of COVID-19. B.C. residents who lost their employment or self-employment income for reasons related to COVID-19 on or after March 1 and that are eligible for the Canada Emergency Response Benefit (CERB) are eligible for the B.C. Emergency Benefit for Workers. Over 600,000 British Columbians to date have received the benefit.
| 44 | | FIRST QUARTERLY REPORT 2020/21 | |
UPDATED 2020/21 FINANCIAL FORECAST
Crisis Supplement and Supports for Income and Disability Assistance Clients ($685 million): Temporary supplement of $300 per month for income and disability assistance clients, including low-income seniors receiving the Seniors Supplement, from April through December. This new emergency funding was put in place to ensure that those in greatest need do not encounter additional barriers while some service organizations closed or reduced service hours during the pandemic, and to help cover the increased costs of food and shelter. Over 200,000 people, including clients and their families, have benefited from the crisis supplement. Other measures include increased funding for the transportation supplement and temporary earning exemptions related to federal support measures such as the Canada Emergency Response Benefit (CERB) to ensure that provincial supports are not reduced due to these supports.
Temporary Rental Supplement ($149 million): A new temporary rental supplement of $500 per month for eligible households with dependents and $300 per month for eligible households with no dependents. The rental supplement is available for the months of April through to August on a per-household basis for low-to-middle income households where the income has been affected by COVID-19. Over 81,000 applications have been approved for the supplement to date.
Canada Emergency Commercial Rent Assistance Program ($79 million): A federal-provincial cost share program that provides forgivable loans to qualifying commercial property owners to cover 50 per cent of monthly rent payments that are payable by eligible small business tenants who are experiencing financial hardship during April, May, June and July. The loans will be forgiven if the mortgaged property owner agrees to reduce the small business tenants’ rent by at least 75 per cent under a rent forgiveness agreement, which will include a term not to evict the tenant while the agreement is in place. The small business tenant would cover the remainder, up to 25 per cent of the rent.
Emergency financial relief for businesses/sectors (over $70 million): Targeted funding to support businesses, non-profit organizations and sectors which includes:
| · | Emergency funding to support the continued care of animals in major facilities, tourism attractions, and refuge and re-habitation centres that have reduced their operations due to COVID-19; |
| · | Financial relief and recovery for the agriculture sector, as well as temporary accommodations for domestic migrant farm workers to support self-isolation and reduce the spread of COVID-19; |
| · | Support for park operators to prepare B.C. parks for reopening and to implement a day use reservation system for 12 high-use parks; |
| · | Financial relief to Community Destination Marketing Organizations to offset Municipal Regional District Tax (MRDT) revenue loss and to support local recovery efforts; |
| · | Support for the domestic film and television industry to support restart and recovery and maintain B.C.’s competitive motion picture sector; |
| · | Financial relief to Local Sport Organizations (LSOs) to support their administration and operational needs to help restart in sports; and |
| · | Financial relief for B.C. Pavilion Corporation to maintain operations during prolonged closures of major events. |
| | FIRST QUARTERLY REPORT 2020/21 | | 45 |
UPDATED 2020/21 FINANCIAL FORECAST
Statutory Spending, Tax and Other Relief Measures
Reduced school tax for commercial properties for the 2020 calendar year ($714 million for calendar year 2020, or $566 million for fiscal 2020/21): Reduced the school property tax rate for commercial properties (property classes 4, 5, 6, 7, and 8) to achieve an average 25 per cent reduction in the total property tax bill for most businesses for the 2020 calendar year.
B.C. Climate Action Tax Credit one-time enhancement ($500 million): Approximately 80 per cent of British Columbians will benefit from a one-time enhancement to the B.C. Climate Action Tax Credit in July 2020 of up to $174.50 for adults and up to $51.25 per child. With this enhancement and the regular credit amount, an eligible family of four will receive a combined payment of up to $564 and eligible individuals will receive a combined payment up to $218. This boosts the regular Climate Action Tax Credit payment of up to $112.50 per family of four and up to $43.50 per adult.
Temporary Pandemic Pay ($425 million: $106 million provincial, $319 million federal): This is a federal-provincial cost share program to provide a one-time temporary wage boost that supports health, social services and corrections employees delivering in-person, front-line care during the COVID-19 pandemic. Pandemic pay will benefit over 250,000 frontline workers in health and social services by providing an hourly wage boost over the 16-week period starting on March 15, 2020, during the height of the Province’s initial response to the pandemic.
Delays to increase the carbon tax rate and other new tax measures ($268 million): Postponing the scheduled increase to the carbon tax rate, delaying the implementation of the PST on sweetened, carbonated drinks, and delaying changes to PST registration requirements to April 1, 2021.
Hotel purchases – Housing Priority Initiatives (HPI) Special Account ($111 million): To provide temporary housing for those formerly living in the encampments in Oppenheimer Park, Pandora Avenue and Topaz Park, the Province purchased the following four hotels:
| · | Comfort Inn (Victoria) – approx. $19.6 million |
| · | Paul’s Motor Inn (Victoria) – approx. $14.5 million |
| · | Howard Johnson Hotel (Vancouver) – approx. $56.9 million |
| · | Buchan Hotel (Vancouver) – approx. $19.7 million |
Statutory spending under the HPI special account for the hotels (and related closing costs) will support temporary housing for those formerly living in the encampments and the transition plan to long-term housing, which is currently under development.
Emergency Program Act (EPA) – COVID-19 related costs ($44 million): The Province anticipates statutory spending above the voted allocation to manage emergency costs within scope of the act. This includes an estimated $44 million for COVID-19 related emergency management costs such as costs related to managing emergency operations centres to support provincial, regional and local coordination, and emergency measures to support returning travellers and temporary foreign workers with self-isolation requirements.
| 46 | | FIRST QUARTERLY REPORT 2020/21 | |
UPDATED 2020/21 FINANCIAL FORECAST
Temporary wholesale pricing model for liquor licensees ($26 million): Wholesale pricing model that will allow liquor licensees, such as restaurants, bars and tourism operators, to purchase beer, wine and spirits at reduced cost from the end of July 2020 to March 31, 2021.
ICBC temporary fee relief measures ($17 million): Temporary changes in effect to August include:
| · | Waiving the $30 fee when you cancel insurance |
| · | Waiving the $18 plating fee when you choose to reinstate the policy on your vehicle |
| · | Suspension of insurance for feet vehicle customers |
Forest Enhancement Society ($11 million): Revised spending targets for the Forest Enhancement Society to ensure that its tree planting continues as planned to secure future economic and environmental benefits while meeting the new COVID-19 related guidelines for industrial camps.
Six-month moratorium on student fee collection ($70 million in deferrals): Starting March 30, 2020, all B.C. student loan repayments are automatically frozen until September 30, 2020.
BC Hydro bill deferrals for industrial customers and other relief measures ($103 million): Qualifying major industrial customers, like pulp and paper mills and mines, can defer 50 per cent of their bill payments for six months, to the end of August 2020. In addition, the industrial relief includes bill relief to certain large industrial customers in the form of reduced demand charges. BC Hydro is also providing bill relief and credit to residential and commercial customers.
Stumpage Fee Deferrals ($2 million): To support companies with financial liquidity while navigating through the COVID-19 crisis, a stumpage fee deferral was available to Tree Farm, Replaceable Forest, and First Nations Woodlands licence holders. The deferral period was for 3 months (May 1, 2020 to July 31, 2020) and interest accrued on any outstanding balances that carried through the deferral period. The revenue deferred from this program was estimated at $2 million and has since been repaid.
Postponing municipal remittance date for school taxes to the end of the calendar year (over $1 billion in deferrals): Delaying the remittances from the summer to the end of the year to provide significant relief to local governments facing cash flow issues.
Extending tax fling and payment deadlines (over $5 billion in deferrals): Providing administrative relief to businesses by postponing the fling and payment date by six months for the EHT, PST, municipal and regional district tax on short-term accommodation, tobacco tax, motor fuel tax, and carbon tax.
For more details, visit: https://www2.gov.bc.ca/gov/content/safety/emergency-preparedness-response-recovery/covid-19-provincial-support
| | FIRST QUARTERLY REPORT 2020/21 | | 47 |
This page intentionally left blank
PART 2 | ECONOMIC REVIEW AND OUTLOOK1
Summary
Similar to other economies globally and in Canada, B.C.’s economy has been significantly impacted by the COVID-19 pandemic, as demonstrated by wide-spread job losses and impacts to businesses. However, the province began easing restrictions in mid-May, and is currently in Phase 3 of BC’s Restart Plan. This reopening, along with the relief measures and supports introduced by the provincial and federal governments and the Bank of Canada, will support the economy along its recovery path.
Due to the high degree of uncertainty regarding the depth and duration of the economic downturn caused by the pandemic and the path of recovery, a two-year outlook is presented at this time.
The Ministry of Finance (Ministry) estimates that British Columbia’s economy grew by 2.3 per cent in 2019. The Ministry forecasts the economy to contract by 6.7 per cent in 2020, before expanding by 3.0 per cent in 2021.
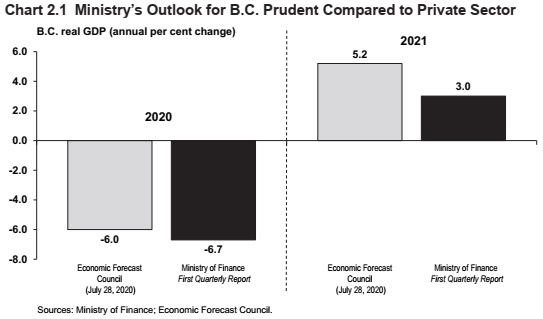
Typically, the Ministry surveys the 13-member Economic Forecast Council (EFC) during the annual budget process. However, given the unprecedented economic impacts and uncertainty caused by the COVID-19 pandemic this year, the Ministry decided to resurvey the EFC in advance of the First Quarterly Report. This is different from the average of six private sector forecasters that is typically presented. In recognition of various significant downside risks to the economic outlook, the Ministry’s forecast for B.C. real GDP growth is 0.7 percentage points lower than the current average outlook of the EFC for 2020 and 2.2 percentage points lower for 2021. This differential is one of the levels of prudence built into the fiscal plan.
The main downside risk to B.C.’s economic outlook includes uncertainty regarding the impact of COVID-19 on the provincial, national and global economies and the potential for, and severity of, future waves of the infection. Other risks include escalating trade tensions, weakening global economic activity, and lower commodity prices.
| 1 | Reflects information available as of August 28, 2020, unless otherwise indicated. |
| | FIRST QUARTERLY REPORT 2020/21 | | 49 |
ECONOMIC REVIEW AND OUTLOOK
British Columbia Economic Activity and Outlook
The Ministry forecasts B.C. real GDP to decline by 6.7 per cent in 2020 and grow by 3.0 per cent in 2021, which is similar to the scenario presented in the July 14 Economic and Fiscal Update that showed a real GDP decline of 6.8 per cent in 2020 and growth of 3.1 per cent in 2021. The First Quarterly Report projection for 2020 is well below the 2.0 per cent growth forecast in Budget 2020, while the outlook for 2021 is above the 1.9 per cent gain expected in Budget 2020 as the economy recovers.
The Ministry forecasts B.C. nominal GDP to decline by 6.5 per cent in 2020 and grow by 4.8 per cent in 2021, which is higher than the scenario presented in the July 14 Economic and Fiscal Update that showed a nominal GDP decline of 8.2 per cent in 2020 and growth of 4.1 per cent in 2021. This improvement refects recent data releases that have shown slightly better than expected employment gains, retail sales and housing activity along with higher than expected inflation. Similar to the outlook for real GDP, the First Quarterly Report projection for nominal GDP for 2020 is well below the 3.9 per cent growth forecast in Budget 2020, while the outlook for 2021 is above the 3.9 per cent gain expected in Budget 2020.
| Table 2.1 British Columbia Economic Indicators | | | | | | | | | |
| | | | | | | | | Year-to-Date | |
| | | Jan. to Mar. 2020 | | | Apr. to Jun. 2020 | | | Jan. to Jun. 2020 | |
| | | change from | | | change from | | | change from | |
| All data seasonally adjusted | | Oct. to Dec. 2019 | | | Jan. to Mar. 2020 | | | Jan. to Jun. 2019 | |
| | | Per cent change | |
| Employment | | | -2.1 | | | | -11.5 | | | | -8.1 | |
| Manufacturing shipments | | | -2.3 | | | | -9.6 | | | | -11.1 | |
| Exports | | | -5.8 | | | | -7.7 | | | | -15.0 | |
| Retail sales | | | -0.1 | | | | -9.3 | | | | -4.3 | |
| Housing starts | | | -14.5 | | | | +1.1 | | | | -25.5 | |
| Non-residential building permits | | | +20.6 | | | | -15.1 | | | | -25.0 | |
The economic outlook assumes that a second wave of the virus will occur in the fall, physical distancing measures remain in place, global travel remains restricted, and that businesses in the tourism, restaurant, retail, and recreation sectors are impacted until at least the end of next year. The forecast assumes that consumers and businesses will exhibit cautious spending behaviour which is reflected in the labour market, income, consumer spending, business investment, and corporate profits projections. Global trade is expected to be impacted by reduced demand and lower commodity prices. Meanwhile, housing market activity in B.C. has been resilient despite the pandemic and has been reflected in the outlook.
A major decline in economic activity is expected across all provinces. An average of six private sector forecasters2 expect B.C. real GDP to decline by 5.4 per cent in 2020 and grow by 5.2 per cent in 2021. This is better than the expected decline of 6.4 per cent on average across Canada for 2020 and similar to the 5.2 per cent growth expected nationally for 2021.
| 2 | A subset of the Economic Forecast Council that regularly forecasts economic performance in all provinces (BMO, CIBC, National Bank, RBC, Scotiabank and TD), as of August 28, 2020. |
| 50 | | FIRST QUARTERLY REPORT 2020/21 | |
ECONOMIC REVIEW AND OUTLOOK
Labour Market
The labour market has been significantly impacted by the COVID-19 pandemic. Job losses in the province have been steep, with 164,900 fewer jobs in July compared to February (-6.5 per cent). The employment declines since February have been mainly concentrated in the service producing sectors, with notable declines in the business, building and other support services sector (-24,300 jobs), wholesale and retail trade sector (-23,500 jobs), accommodation and food services sector (-20,800 jobs), other services sector (-20,800 jobs) and information, culture and recreation sector (-19,200 jobs). Among the good producing sectors, job losses have been mainly concentrated in construction (-28,500 jobs). Some people have been impacted more than others, most notably women and youth as these groups tend to be over-represented in some of the hardest hit service sectors. Overall, the unemployment rate in B.C. increased to 11.1 per cent in July from 5.0 per cent in February.
On a year-to-date basis, B.C. employment declined by 8.0 per cent compared to the January to July period of 2019. This translates into a net loss of around 204,900 jobs, with 121,200 of these in full-time jobs and around 83,700 in part-time jobs. Year-to-date job losses were particularly seen in accommodation and food services (-39,900 jobs), information, culture and recreation (-36,500 jobs), business, building and other support services (-22,700 jobs), other services (-20,500 jobs), wholesale and retail trade (-19,900 jobs), and construction (-18,600 jobs).
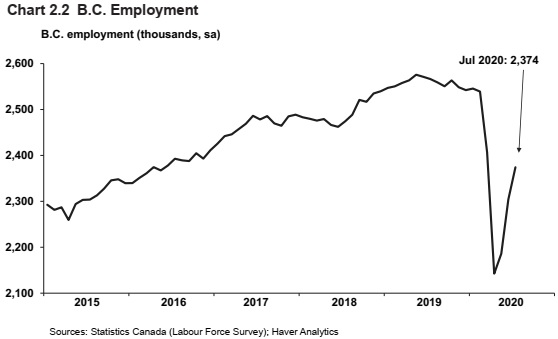
Year-to-date to July 2020, B.C.’s unemployment rate averaged 9.4 per cent, which is 4.8 percentage points above its average over the same period of last year. Meanwhile, B.C.’s labour force declined by 3.2 per cent, reflecting a drop in the labour force participation rate from 65.8 per cent to 62.5 per cent. B.C.’s average weekly wage rate has increased by 10.0 per cent compared to the first seven months of 2019. However, this likely does not reflect rising wage patterns, rather it is mainly due to compositional effects related to the shedding of lower-wage and part-time workers, which raises the overall average wage. Aggregate wages and salaries data indicate that during the initial stage of the pandemic there was a 3.7 per cent and a 6.7 per cent monthly decline in wages during March and April, respectively. Year-to-date to June, aggregate wages and salaries has decreased 1.1 per cent compared to the first six months of last year.
| | FIRST QUARTERLY REPORT 2020/21 | | 51 |
ECONOMIC REVIEW AND OUTLOOK
Outlook
Physical distancing measures are assumed to remain in place and global travel is expected to remain restricted. As such, some sectors in B.C., such as tourism, restaurant, retail, and recreation are not expected to fully recover all of the recent job losses until at least the end of next year. The Ministry forecasts employment in B.C. to decrease by 7.8 per cent in 2020 (or by approximately 200,000 jobs), followed by annual growth of 3.6 per cent in 2021 (or by approximately 84,000 jobs). The province’s unemployment rate is expected to average 10.4 per cent in 2020 and 8.8 per cent in 2021.
Consumer Spending and Housing
Consumer spending patterns have been heavily influenced by the COVID-19 pandemic. While households increased spending on some essential items earlier in the year (such as food and beverages and household-related supplies), they cut back spending on many discretionary items including motor vehicles, clothing and home furnishings. Consumer spending was also likely impacted by job losses, precautionary saving behaviour, reduced confidence and physical distancing.
B.C. nominal retail sales declined by 18.5 per cent in April compared to March, which was the largest monthly decline on record (data going back to 1991). As restrictions began to ease in May, nominal retail sales increased by 14.1 per cent in May compared to April, and grew by a further 12.7 per cent in June compared to May. The rebound in May and June translated into B.C. retail sales being 0.2 per cent lower in June compared to February 2020.
Year-to-date to June 2020, nominal retail sales in B.C. are 4.3 per cent lower compared to the same period in 2019. This largely reflects declines at clothing and clothing accessories stores (-40.5 per cent), furniture and home furnishing stores (-21.5 per cent), gasoline stations (-16.5 per cent), and motor vehicle and parts dealers (-15.3 per cent) relative to the first six months of 2019. This was partially offset by year-to-date gains in sales at food and beverage stores (+13.0 per cent), building material and garden equipment and supplies stores (+6.7 per cent), and general merchandise stores (+5.2 per cent). The hospitality sector has been particularly hard hit with sales at food services and drinking places down by 29.1 per cent year-to-date to June compared to the first six months of last year.
The Bank of Canada’s latest Canadian Survey of Consumer Expectations, released in July 2020, indicates that consumer sentiment across Canada worsened in the second quarter compared to the first quarter of 2020, particularly with regards to the labour market and household income. The pandemic has impacted B.C. consumer confidence which fell month-over-month by 46.8 points in March and 36.9 points in April, to reach the lowest level on record since data became available in 2002, according to the Conference Board of Canada’s Consumer Confidence Index. Consumer sentiment has improved somewhat since then, however in August confidence was still 52.3 points lower compared to February. Year-to-date, B.C. consumer confidence was 38.4 points lower than the same period of 2019.
| 52 | | FIRST QUARTERLY REPORT 2020/21 | |
ECONOMIC REVIEW AND OUTLOOK
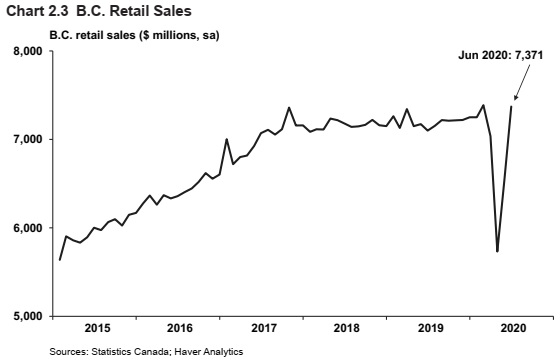
The COVID-19 pandemic, physical distancing measures, and temporary halting of open houses across the province disrupted new listings and sales activity in B.C.’s housing market. New listings and home sales fell to record lows in April, down by 56.2 per cent and 59.2 per cent, respectively, compared to February. As restrictions began to ease in May, activity resumed swiftly, with new listings and sales activity in July surpassing levels observed in February. New listings in the province more than doubled in July compared to April, and were up by 7.2 per cent relative to February mainly reflecting gains in Greater Vancouver and Victoria. Home sales in the province were 25.5 per cent higher in July compared to February, with gains observed in all regions and led by Greater Vancouver and the Fraser Valley. Meanwhile, B.C.’s average home sale price rose by 6.9 per cent in July compared to February, with gains observed in most regions.
Overall, B.C. MLS home sales increased by 0.7 per cent year-to-date to July 2020 compared to the same period of 2019. At the regional level, year-to-date sales increases were observed in the two largest markets of Greater Vancouver (11.8 per cent) and Fraser Valley (7.3 per cent), while sales declined in Okanagan-Mainline (-5.6 per cent) and Victoria (-4.1 per cent), the third and fourth largest markets. B.C.’s average home sale price increased by 10.0 per cent year-to-date to July 2020 compared to the same period of 2019, partly reflecting pent-up demand, lower interest rates, and relatively stronger sales in the more expensive regions of Greater Vancouver and Fraser Valley.
| | FIRST QUARTERLY REPORT 2020/21 | | 53 |
ECONOMIC REVIEW AND OUTLOOK

Regional MLS composite benchmark house prices (which are seasonally adjusted and incorporate all dwelling types) for Greater Vancouver and the Fraser Valley rose by 0.3 per cent and 1.2 per cent, respectfully in July compared to February. On a year-to-date to July basis, the composite benchmark house prices for Greater Vancouver and the Fraser Valley increased by 2.2 per cent and 2.1 per cent compared to the same period of 2019, with price increases across all dwelling types.
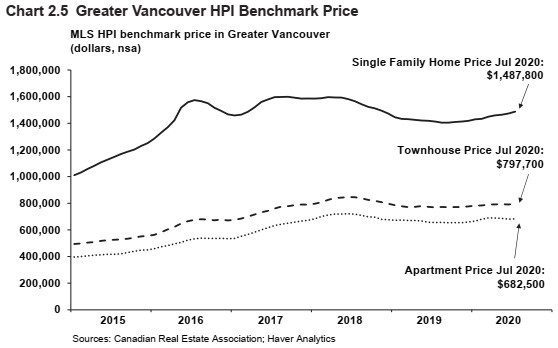
| 54 | | FIRST QUARTERLY REPORT 2020/21 | |
ECONOMIC REVIEW AND OUTLOOK
Housing starts have been resilient so far this year, with starts averaging 36,994 annualized units since February and totaling 42,381 annualized units in July. This strength has been broadly consistent with recent building permit issuance, led by the large multi-family segment. Nevertheless, on a year-to-date basis, B.C. housing starts decreased by 24.1 per cent compared to the record high levels observed during the January to July period of 2019, to average 36,661 annualized units. The value of residential building permits, a leading indicator of home construction, decreased by 7.1 per cent year-to-date to June 2020.
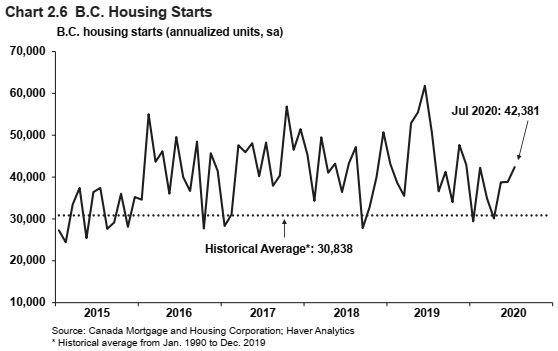
Outlook
Consumer spending is expected to decline this year due to job losses, lower income and weak consumer confidence, before picking up next year as employment and income prospects improve. The Ministry forecasts real household consumption of goods and services to decrease by 7.7 per cent in 2020, followed by projected growth of 3.6 per cent in 2021.
The Ministry expects nominal retail sales to fall by 10.8 per cent in 2020 and then increase by 5.4 per cent in 2021.
The Ministry forecasts the total value of home sales to decrease by 9.6 per cent in 2020 before growing by 3.8 per cent in 2021, reflecting changes in unit sales and the average home sale price. Unit home sales in B.C. are forecast to decrease by 12.1 per cent in 2020, followed by an increase of 3.1 per cent in 2021. Meanwhile, the average home sale price in B.C. is expected to increase by 2.8 per cent in 2020, followed by a marginal increase of 0.7 per cent in 2021.
The Ministry expects B.C. housing starts to total 34,000 units in 2020. In 2021, housing starts are forecast to total approximately 32,000 units.
| | FIRST QUARTERLY REPORT 2020/21 | | 55 |
ECONOMIC REVIEW AND OUTLOOK
Business and Government
Real business investment increased by an estimated 14.1 per cent in 2019, with strong gains in both non-residential investment and investment in machinery and equipment, along with solid growth in residential investment.
Non-residential construction permitting slowed through the first half of this year. The total value of non-residential building permits fell by 25.0 per cent year-to-date to June 2020 compared to the same period of 2019. Significant declines were observed in permit issuance for commercial buildings (-35.0 per cent) and industrial buildings (-18.3 per cent) relative to the first half of 2019. Meanwhile, the value of permit issuance for institutional and governmental buildings increased (+3.2 per cent).
The Bank of Canada’s latest Business Outlook Survey, released in July 2020, indicates that business sentiment is negative across all regions in Canada as businesses navigate pandemic related uncertainty. Small business confidence in B.C. fell to a record low in March, according to the Canadian Federation of Independent Business index of small business confidence. While small business confidence appears to have recovered somewhat, based on the August survey results, many small business owners remain concerned about the general state of their business’ health and in particular the short-term outlook.
B.C.’s tourism sector has been severely impacted by COVID-19. The number of international travelers entering the province fell by 60.5 per cent and 93.3 per cent month-over-month in March and April, respectively. The number of international visitors dropped a further 13.4 per cent in May before increasing by 7.7 per cent in June. However, international visitors in the second quarter were still down by 97.6 per cent compared to the same quarter last year. Year-to-date to June, the number of international visitors to B.C. was down by 59.3 per cent from the same period in 2019.
The Ministry estimates that real government investment increased by 1.2 per cent in 2019, while expenditure on goods and services by all levels of government rose by 3.3 per cent. This year, the provincial and federal governments responded quickly to the COVID-19 pandemic with significant relief measures and supports.
Outlook
Real business investment is projected to fall by 10.8 per cent in 2020, with declines expected in all segments. Looking further ahead, real business investment is forecast to rebound by 2.0 per cent in 2021.
Real expenditure on goods and services by all levels of government is forecast to increase by 6.0 per cent in 2020, driven by the provincial and federal response to the COVID-19 pandemic, before declining by 1.3 per cent in 2021 as most measures are temporary in nature. Following an estimated decline of 6.7 per cent in 2019, the Ministry expects the net operating surplus of corporations (an approximation of corporate profits) to decrease by 18.6 per cent in 2020. In 2021, the net operating surplus of corporations is forecast to increase by 6.1 per cent, supported by a rebound in economic activity.
| 56 | | FIRST QUARTERLY REPORT 2020/21 | |
ECONOMIC REVIEW AND OUTLOOK
External Trade and Commodity Markets
As the economic impact of COVID-19 is being felt around the world, demand for B.C.’s merchandise export goods has weakened, and commodity prices have declined. Led by a substantial drop of 17.5 per cent in the exports of energy products, B.C.’s overall merchandise exports were down 5.3 per cent in June compared to February.
Compared to February, certain commodity prices in July experienced relatively large declines, most notably metallurgical coal (-27.6 per cent). In April, the West Texas Intermediate (WTI) oil price reached its lowest price since March 1999. Since then the price has recovered somewhat and the price in July was 19.4 per cent below its February value. The price of natural gas was 11.9 per cent lower in July than in February. In contrast, precious metals, such as gold (+15.4 per cent) and silver (+13.8 per cent), saw price increases as investors looked to hedge against global economic uncertainty. While most forestry product prices have risen somewhat from February to July, lumber prices have increased strongly (+25.8 per cent) due to low inventories, production curtailments and resilient demand.
During the January to June period of 2020, the value of B.C. merchandise exports decreased by 15.0 per cent compared to the same period of 2019. On a year-to-date basis, most major categories experienced significant declines, the most notable being exports of pulp and paper products (-24.4 per cent), energy products (-24.0 per cent) and logs, lumber and other wood products (-21.4 per cent). The broad decline in B.C.’s export sector is reflecting a combination of weaker global demand, lower commodity prices, and supply constraints in the forestry sector.
Exports to all of B.C.’s major trading partners have declined. The value of merchandise exports to the U.S. fell by 8.5 per cent and to non-U.S. destinations by 21.2 per cent during the January to June period of 2020 compared to the same period of last year. While lower exports of logs, lumber and other wood products and pulp and paper products contributed to the declines in both cases, declining exports of natural gas lowered overall exports to the U.S., while declining exports of coal further lowered the overall exports to non-U.S. destinations.
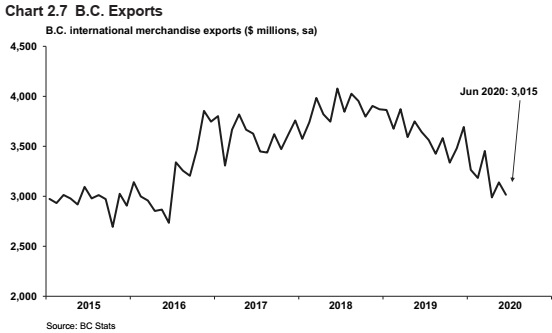
| | FIRST QUARTERLY REPORT 2020/21 | | 57 |
ECONOMIC REVIEW AND OUTLOOK
Compared to February, B.C.’s manufacturing shipments declined by 7.5 per cent in June as shipments of both durable and non-durable goods fell.
B.C.’s manufacturing shipments decreased by 11.1 per cent year-to-date to June 2020 compared to the same period of 2019, with durable goods accounting for almost two thirds of the decline. Among durable goods, there were notable declines in the shipment of transportation equipment (-18.6 per cent), wood products (-16.5 per cent) and machinery (-14.3 per cent), while the decline in non-durable goods were dominated by a significant fall in the shipment of paper products (-24.1 per cent). Minor gains were observed in shipments of non-metallic mineral products (+0.7 per cent).
So far in 2020, limited lumber supply and a resilient U.S. housing market have supported high lumber prices. Most notably, the price of Western spruce-pine-fir (SPF) 2x4 lumber averaged $411 US/000 board feet during the January to July period of 2020, up by 11.7 per cent from the same period of last year. Meanwhile, the price of pulp averaged $835 US/tonne, down by 20.5 per cent compared to the first seven months of 2019.
Slower global economic activity related to the COVID-19 pandemic has impacted both supply and demand of energy. The West Texas Intermediate (WTI) price averaged $37.34 US/barrel in the first seven months of 2020, down by 34.8 per cent compared to the same period of 2019. Meanwhile, the plant inlet price of natural gas averaged $0.74 C/GJ year-to-date to July 2020, down by 11.8 per cent from the same period of 2019.
Base metal and mineral prices experienced broad-based declines earlier this year, as reduced global demand weighed on prices. Year-to-date to July, prices for molybdenum, zinc, lead, copper, and metallurgical coal recorded declines compared to the January to July period of 2019. By contrast, prices for gold and silver increased compared to the first seven months of 2019.
Outlook
Following an estimated decline of 0.6 per cent in 2019, real exports of goods and services are forecast to decrease by 13.3 per cent in 2020, given the environment of weaker global demand observed through the first half of this year. The pace of real export growth is projected to gradually improve to 4.8 per cent growth in 2021.
The price of lumber is forecast to average $410 US/000 board feet in 2020 and $380 US/000 board feet in 2021. The plant inlet price for natural gas is expected to average $0.86 C/GJ in 2020/21. The outlook is subject to considerable uncertainty, as commodity prices can be volatile.
Demographics
On April 1, 2020, B.C.’s population was 5.12 million people, up 1.5 per cent from the same date in 2019. On a net basis, during the January to March period of 2020, the province welcomed 9,271 new residents, a decrease of over a third compared to the same period of 2019. Around 65 per cent of these new migrants relocated to B.C. from other countries. Net interprovincial migration totaled 3,247 individuals during the quarter.
| 58 | | FIRST QUARTERLY REPORT 2020/21 | |
ECONOMIC REVIEW AND OUTLOOK
Outlook
The forecast calls for B.C.’s July 1 population to increase by 1.4 per cent in 2020, and by 1.0 per cent in 2021.
Total net migration is expected to be about 48,100 persons and 55,300 persons in 2020 and 2021, respectively, with international immigrants making up just over 80 per cent of the net migration in both years. The outlook is subject to uncertainty, as the COVID-19 pandemic could potentially have material impact on international migration going forward.
Inflation
The onset of the global COVID-19 pandemic, public health measures and shifting consumer spending patterns have impacted supply and demand of goods and services. Although there have been certain goods such as food in which the prices have risen strongly, price declines in many other goods and services (particularly gasoline and clothing and footwear) have led to weak overall growth in B.C.’s Consumer Price Index (CPI). The year-over-year annual CPI inflation rate in July was 0.2 per cent, down from 2.4 per cent in February. As consumer price inflation is measured against a fixed basket of goods, the current basket will not fully reflect temporary changes in consumer spending patterns.
Year-to-date to July, consumer prices rose by 0.9 per cent compared to the same period of 2019, supported by increases in prices for food items, while prices for some other items such as transportation and energy have fallen, largely due to lower gasoline prices as world crude oil prices have only partly recovered from significant price declines in March and April.

Outlook
Consumer price inflation in B.C. is forecast to be 0.9 per cent in 2020 before increasing to 1.8 per cent in 2021. For Canada, the annual rate of inflation is assumed to be 0.7 per cent in 2020 and 1.8 per cent in 2021.
| | FIRST QUARTERLY REPORT 2020/21 | | 59 |
ECONOMIC REVIEW AND OUTLOOK
Risks to the Economic Outlook
B.C.’s economy, like other global and Canadian economies, has been significantly impacted by the COVID-19 pandemic in a way that has not been seen before and there are various elements of uncertainty that will influence the depth and duration of the economic slowdown in B.C. The economic forecast is based on information that is currently available and assumptions about the future path of recovery, and the outlook is subject to a larger than normal degree of uncertainty and potential for revision. Downside risks to B.C.’s economic outlook include the following:
| · | future outbreaks of COVID-19 in B.C. and among B.C.’s trading partners; |
| · | shifts in consumer and business behaviour and confidence due to COVID-19; |
| · | weakening global economic activity, exacerbated by COVID-19, resulting in reduced demand for B.C.’s commodity exports; |
| · | escalating global trade tensions including additional tariffs, and broader economic challenges in Asia, Europe and the UK; |
| · | higher volatility in international foreign exchange, stock and bond markets; |
| · | lower commodity prices, particularly for lumber, pulp and coal; and |
| · | timing of investment and hiring related to the LNG Canada project, similar to the risks that exist for other major capital projects. |
External Outlook
While global trade policy tensions and economic uncertainty slowed global activity in 2019, there were tentative signs toward the end of the year that this slowdown had stabilized. However, the emergence of the COVID-19 pandemic has greatly changed the external outlook. Economic data suggests the global economy could face its largest annual contraction on record. Additionally, the expectation of a global V-shaped recovery has been challenged by the recent resurgence of COVID-19 cases in many countries that started to reopen. As combating the COVID-19 virus requires robust health care systems and international collaboration, the virus presents a serious threat to the progress that has been made to combat global poverty over the past decades.
United States
Following an annualized 5.0 per cent decline in real GDP in the first quarter of the year, the U.S. economy fell at an annualized pace of 31.7 per cent in the second quarter of 2020, which was the largest drop on record (data going back to 1947). The second quarter saw widespread and substantial declines in consumer spending, exports, business investment and inventories. Higher government spending provided a slight offset.
After seeing record declines in April, the U.S. labour market has gradually improved. However, employment in July was still 8.4 per cent lower (-12,881,000 jobs) than in February and the unemployment rate was 10.2 per cent compared to 3.5 per cent in February.
Year-to-date to July, U.S. employment fell by 5.4 per cent compared to the same period of 2019. The U.S. unemployment rate averaged 8.7 per cent year-to-date to July, up 4.9 percentage points compared to the first seven months of last year. Meanwhile, the U.S. labour force participation rate averaged 61.9 per cent year-to-date to July, down 1.1 percentage point compared to the same period of 2019.
| 60 | | FIRST QUARTERLY REPORT 2020/21 | |
ECONOMIC REVIEW AND OUTLOOK
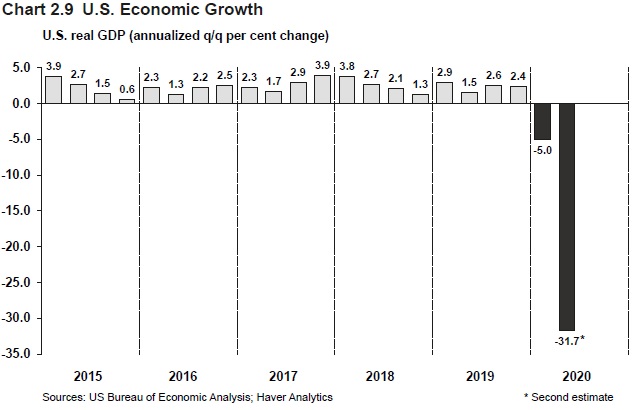
Although U.S. housing starts are down 4.5 per cent in July compared to February, U.S. home building activity has been relatively resilient so far in 2020. U.S. housing starts have averaged 1.31 million annualized units year-to-date to July 2020, up by 6.4 per cent compared to the same period of 2019. Residential building permits in July were 3.1 per cent higher than in February, and up 1.1 per cent year-to-date to July compared to the January to July period of 2019.
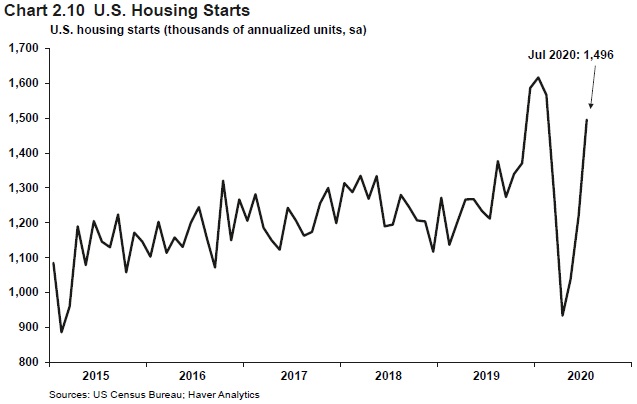
| | FIRST QUARTERLY REPORT 2020/21 | | 61 |
ECONOMIC REVIEW AND OUTLOOK
U.S. home sales activity has been mixed during the first seven months of this year. New home sales in July were 25.8 per cent higher than in February and 8.6 per cent higher year-to-date to July compared to the same period last year. Meanwhile, for existing home sales the changes were 1.7 per cent and -4.4 per cent, respectively.
While median prices for new homes were 0.4 per cent lower in July compared to February, median prices for existing homes increased 12.5 per cent over the same time period. New home prices increased by 3.2 per cent and existing home prices rose by 6.2 per cent year-to-date to July compared to the first seven months of 2019.
After experiencing record declines in March and April, U.S. nominal retail sales posted impressive gains in the subsequent months and were up 1.7 per cent in July compared to February. Leading the comeback have been sales at non-store retailers, food and beverage stores and motor vehicle and parts dealers, while sales at clothing and clothing accessory stores are down by almost a fifth. Year-to-date to July, retail sales are down 2.4 per cent compared to the same period last year. U.S. consumer confidence saw a record drop in April and has since remained subdued partly due to concerns over rising COVID-19 cases in parts of the country. The index was 47.8 points lower in August compared to February. Year-to-date to August, US consumer confidence decreased by 25.5 points relative to the same period of 2019.
Outlook
Consensus Economics (Consensus) forecasters have lowered their near-term projections for U.S. economic growth. The August 2020 Consensus survey forecasts U.S. real GDP to fall by 5.2 per cent in 2020, down from previous projections (see Chart 2.11). For 2021, the Consensus forecasts a rebound in the U.S. economy and growth to be 4.0 per cent.
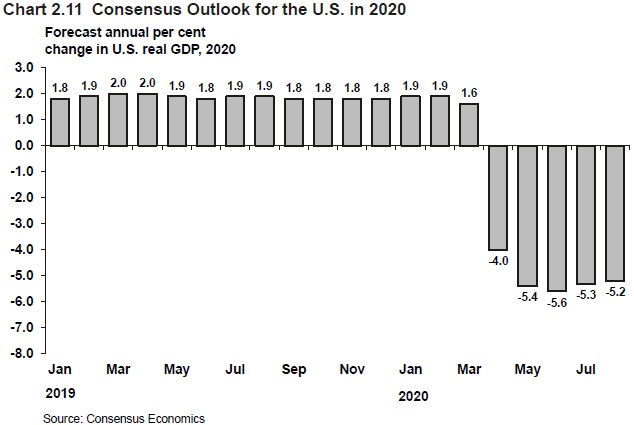
The chart above represents forecasts for U.S. real GDP growth in 2020 as polled on specific dates. For example, forecasters surveyed on January 13, 2020 had an average 2020 U.S. real GDP growth forecast of 1.9 per cent, while on August 10, 2020 they forecast 2020 U.S. real GDP to decline by 5.2 per cent.
| 62 | | FIRST QUARTERLY REPORT 2020/21 | |
ECONOMIC REVIEW AND OUTLOOK
Uncertainty regarding the ongoing COVID-19 pandemic and trade tensions continue to cloud the economic outlook. In recognition of this uncertainty, the Ministry’s assumptions for U.S. growth are lower than the August 2020 Consensus. The Ministry assumes that U.S. real GDP will fall by 7.2 per cent in 2020, before expanding by 2.5 per cent in 2021.
Table 2.2 U.S. Real GDP Forecast: Consensus versus B.C. Ministry of Finance
| | | 2020 | | | 2021 | |
| | | Per cent change in real GDP | |
| B.C. Ministry of Finance | | | -7.2 | | | | 2.5 | |
| Consensus Economics (August 2020) | | | -5.2 | | | | 4.0 | |
Canada
Although the Canadian economy showed signs of slowing growth towards the end of 2019 and in early 2020 as challenging global conditions weighed on exports and business investments, it was still operating close to potential. However, the onset of the COVID-19 pandemic in conjunction with the related plunge in oil prices, presented an unparalleled challenge for the economy.
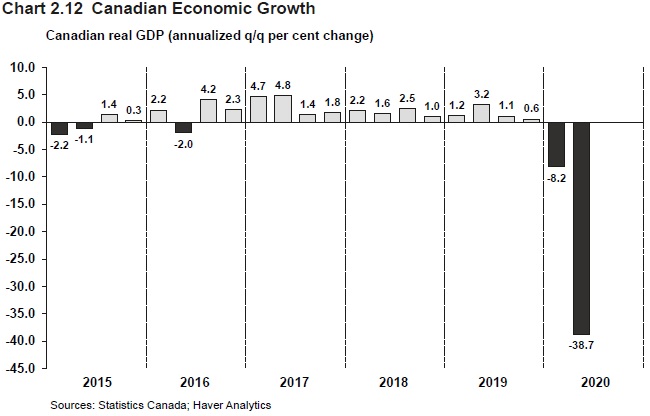
Following an annualized 8.2 per cent decline in real GDP in the first quarter of the year, the Canadian economy fell by an annualized 38.7 per cent in the second quarter of 2020, by far the largest contraction on record. The second quarter saw widespread and substantial declines in consumer spending, business investment, and exports.
After experiencing substantial job losses in March (around -1,011,000 jobs) and April (around -1,994,000), the Canadian labour market has shown some signs of improvement, adding 1,661,000 jobs from May to July. However, employment in July was still 7.0 per cent lower than in February. The unemployment rate peaked at 13.7 per cent in May before falling to 10.9 per cent in July, still 5.3 percentage points above its February level. Year-to-date to July, employment decreased by 6.4 per cent compared to the same period last year, while the unemployment rate averaged 9.8 per cent compared to 5.7 per cent over the same period last year.
| | FIRST QUARTERLY REPORT 2020/21 | | 63 |
ECONOMIC REVIEW AND OUTLOOK
After seeing declines in March and April, Canadian housing starts recovered swiftly and were up 16.3 per cent in July compared to February. This growth was mainly due to strong numbers in large urban centers such as Montreal and Toronto. So far in 2020, Canadian housing starts have averaged just over 206,300 annualized units, down by only 0.6 per cent compared to the first seven months of 2019. MLS home sales were up 16.9 per cent in July compared to February and down 3.1 per cent year-to-date to July compared to the first seven months of last year. The national average home sale price was up 9.1 per cent in July compared to February and 8.2 per cent higher on a year-to-date basis compared to the same period of last year.
Canadian nominal retail sales saw large monthly contractions in March and April, with the latter being the largest fall on record. However, substantial bounce backs in May and June led to retail sales being up 1.3 per cent in June compared to the level seen in February. Year-to-date to June 2020, retail sales were down 7.7 per cent compared to the first half of 2019.
The challenging global trade conditions facing exporters last year have intensified substantially due to the global COVID-19 pandemic and slump in oil prices. Compared to February, the value of Canadian merchandise exports was down 19.7 per cent in June, while shipments of Canadian manufactured goods were down 13.2 per cent. The value of Canadian merchandise exports fell by 17.1 per cent year-to-date to June 2020 compared to the same period of 2019, while shipments of Canadian manufactured goods fell by 16.8 per cent.
Outlook
The August 2020 Consensus forecasts Canadian real GDP to fall by 6.4 per cent in 2020, before expanding by 5.3 per cent in 2021.
Table 2.3 Canadian Real GDP Forecast: Consensus versus B.C. Ministry of Finance
| | | 2020 | | | 2021 | |
| | | Per cent change in real GDP | |
| B.C. Ministry of Finance | | | -7.8 | | | | 4.0 | |
| Consensus Economics (August 2020) | | | -6.4 | | | | 5.3 | |
The Canadian economic outlook is clouded by uncertainty regarding potential long-term economic disruptions due to the COVID-19 virus and the potential for a second wave of infections. Additionally, global trade tensions and volatile commodity prices add risks to the outlook. Accordingly, the Ministry’s outlook is lower than the Consensus and assumes that the Canadian economy will contract by 7.8 per cent in 2020, followed by 4.0 per cent growth in 2021.
| 64 | | FIRST QUARTERLY REPORT 2020/21 | |
ECONOMIC REVIEW AND OUTLOOK
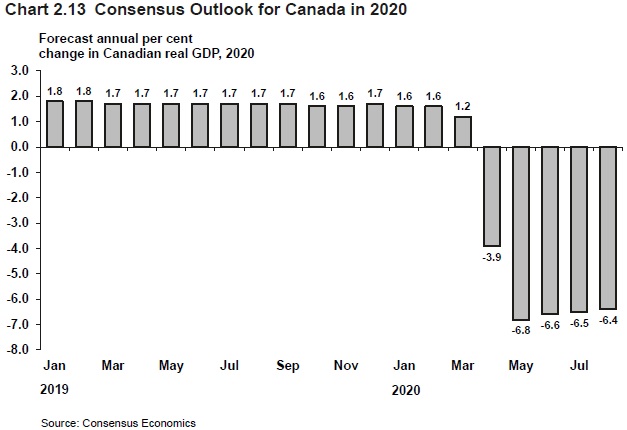
The chart above represents forecasts for Canadian real GDP growth in 2020 as polled on specific dates. For example, forecasters surveyed on January 13, 2020 had an average 2020 Canadian real GDP growth forecast of 1.6 per cent, while on August 10, 2020 they forecast 2020 Canadian real GDP to decline by 6.4 per cent.
Asia
After being the first country initiating containment measures to tackle the COVID-19 virus, China is among the countries furthest along in reopening their economy. In the second quarter of 2020, China real GDP grew an annualized 59.5 per cent, rebounding from an annualized decline of 36.5 per cent in the first quarter of the year. The growth in the second quarter was mainly due to domestic factors such as production and consumption along with monetary and fiscal measures introduced by the country to support the economy.
Japan’s economy contracted by an annualized rate of 27.8 per cent in the April to June quarter of 2020, adding to an annualized fall of 2.5 per cent in the first quarter and 7.0 per cent decline in the last quarter of last year. Notable declines so far this year were observed in private consumption and exports. On July 15, the Bank of Japan announced it would maintain its current monetary policy, leaving its funding programs and policy rate targets unchanged.
Outlook
The August 2020 Consensus forecasts China real GDP to grow by 2.1 per cent in 2020 and by 7.8 per cent in 2021. Intensifying US-China tensions and the potential resurgence of COVID-19, could impact China’s economic growth going forward. As such, the Ministry assumes that China’s economy will expand by 0.5 per cent in 2020 and by 5.9 per cent in 2021.
The August 2020 Consensus forecasts Japan real GDP to contract by 5.3 per cent in 2020 before growing by 2.5 per cent in 2021. In recognition of both foreign and domestic challenges to Japan’s economy, the Ministry assumes that Japan’s real GDP will fall by 6.5 per cent in 2020, before expanding by 1.5 per cent in 2021.
| | FIRST QUARTERLY REPORT 2020/21 | | 65 |
ECONOMIC REVIEW AND OUTLOOK
Europe
The euro zone has been severely hit by the COVID-19 virus and several countries have taken drastic measures to combat the virus. These measures have had severe implications for the economy, especially for the tourist dependent countries in southern Europe. Economic activity in the euro zone fell by an annualized 40.3 per cent in the second quarter of 2020, the sharpest decline since records started in 1995. This followed an annualized decline of 13.6 per cent observed in the first quarter. In recent months there have been some encouraging signs, especially from the retail sector, but there is still considerable uncertainty going forward.
On July 16, 2020 the European Central Bank left interest rates unchanged and maintained its emergency bond-buying program, after expanding its bond program in June. On July 21, the 27 members of the European Union (EU) agreed to borrow up to 750 billion euro in a stimulus plan to reverse the economic downturn.
The UK economy contracted by an annualized 59.8 per cent in the April to June quarter of 2020, the largest decline since records began in 1955. This contraction followed an annualized decline of 8.5 per cent in the January to March quarter. The contraction in the second quarter was largely due to lower consumer spending and, to a lesser extent, gross capital formation and government spending. Growing uncertainty about Brexit and the renegotiation of trade deals with the EU and other countries continue to weigh on business confidence and clouds the economic outlook.
Outlook
The August 2020 Consensus forecasts the euro zone economy to fall by 7.9 per cent in 2020, before expanding by 5.7 per cent in 2021. The Ministry assumes the euro zone’s economy will contract by 9.5 per cent in 2020, before growing by 4.5 per cent in 2021.
Financial Markets
Interest Rates
The COVID-19 pandemic has caused an unprecedented global economic contraction, prompting a broad array of extraordinary monetary and fiscal policy responses around the world.
The US Federal Reserve (Fed) has left the target range for the federal funds rate unchanged at 0.00 to 0.25 per cent, following two rate cuts totaling 150 basis points in March 2020. In addition, the Fed has provided some forward guidance by indicating its intention to keep interest rates at current levels until the economy has recovered which includes improvements in the labour market and inflation closer to the stated goal. Furthermore, the Fed has resumed large-scale asset purchases (i.e. quantitative easing), launched several credit facilities to support financial market functioning, and introduced financial-assistance programs to support the flow of credit to households, businesses and local governments.
On July 15, 2020, the Bank of Canada maintained its target for the overnight interest rate at 0.25 per cent and left its quantitative easing program unchanged. This scheduled rate announcement followed three interest rate cuts of 50 basis points each on March 4, March 13 and March 27. The Bank of Canada has also provided some forward guidance, committing to maintain the current policy rate and quantitative easing program until inflation is back on target at around 2 per cent and until the recovery is well underway. The Bank of Canada also noted that it expects the recovery to slow after the third quarter of 2020 due to ongoing confidence and consumer behaviour effects, as well as structural economic challenges. The benchmark posted rate on a 5-year fixed mortgage has continued to decline and is currently at 4.79 per cent, a level not seen since June 2017.
| 66 | | FIRST QUARTERLY REPORT 2020/21 | |
ECONOMIC REVIEW AND OUTLOOK
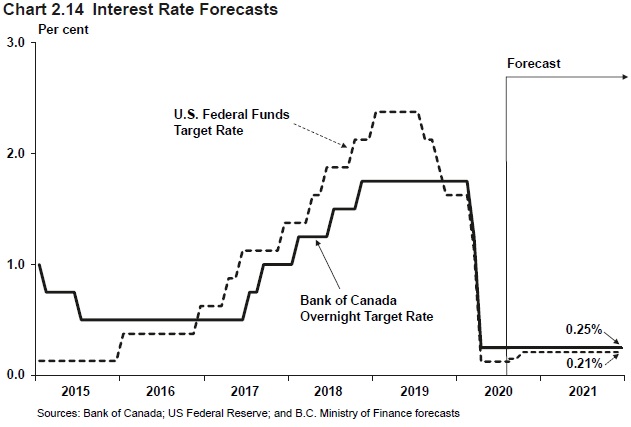
Table 2.4 Private Sector Canadian Interest Rate Forecasts
| | | 3-month Treasury Bill | | | 10-year Government Bond | |
| Average annual interest rate (per cent) | | 2020 | | | 2021 | | | 2020 | | | 2021 | |
| BMO | | | 0.45 | | | | 0.20 | | | | 0.76 | | | | 1.00 | |
| CIBC | | | 0.47 | | | | 0.31 | | | | 0.76 | | | | 0.88 | |
| National Bank | | | 0.46 | | | | 0.21 | | | | 0.72 | | | | 0.74 | |
| RBC | | | 0.46 | | | | 0.23 | | | | 0.70 | | | | 0.73 | |
| Scotiabank | | | 0.46 | | | | 0.20 | | | | 0.81 | | | | 1.23 | |
| TD | | | 0.46 | | | | 0.20 | | | | 0.71 | | | | 0.95 | |
| Average (as of July 23, 2020) | | | 0.46 | | | | 0.23 | | | | 0.74 | | | | 0.92 | |
Outlook
The US Federal Reserve and Bank of Canada have signaled their commitment to support their respective economies and provide liquidity in the financial system. Based on the average of six private sector forecasts as of July 23, 2020, the Ministry assumes the U.S. federal funds rate to average 0.41 per cent in 2020 and 0.21 per cent in 2021. By comparison, the Bank of Canada’s overnight target rate is forecast to average 0.56 per cent in 2020 and 0.25 per cent in 2021.
| | FIRST QUARTERLY REPORT 2020/21 | | 67 |
ECONOMIC REVIEW AND OUTLOOK
The Canadian three-month treasury bill interest rate is expected to average 0.46 per cent in 2020 and 0.23 per cent in 2021, according to the same six private sector forecasters. Meanwhile, the 10-year Government of Canada bond rate is forecast at 0.74 per cent in 2020 and 0.92 per cent in 2021.
Exchange Rate
After strengthening slightly against the US dollar around the start of this year, the Canadian dollar began to reverse course in February, before depreciating substantially in March and April as economic risk increased with the spread of COVID-19 and oil prices retreated. Since April, the Canadian dollar has appreciated somewhat, as the US dollar continued to lose ground against a broad basket of currencies (after initial gains as a safe haven in March) and oil prices rebounded.
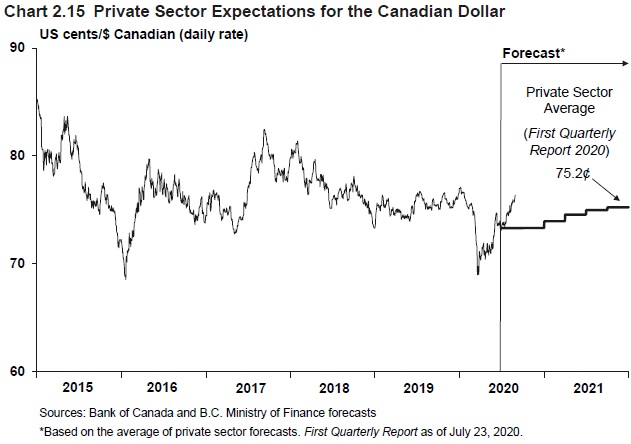
Outlook
Based on the average of six private sector forecasts as of July 23, 2020, the Ministry assumes the Canadian dollar will average 73.3 US cents in 2020 and 74.7 US cents in 2021.
Table 2.5 Private Sector Exchange Rate Forecasts
| Average annual exchange rate (US cents/$ Canadian) | | 2020 | | | 2021 | |
| BMO | | | 73.6 | | | | 74.7 | |
| CIBC | | | 72.9 | | | | 72.3 | |
| National Bank | | | 73.1 | | | | 76.4 | |
| RBC | | | 72.9 | | | | 72.9 | |
| Scotiabank | | | 74.1 | | | | 77.3 | |
| TD | | | 73.3 | | | | 74.6 | |
| Average (as of July 23, 2020) | | | 73.3 | | | | 74.7 | |
| 68 | | FIRST QUARTERLY REPORT 2020/21 | |
ECONOMIC REVIEW AND OUTLOOK
| Table 2.6.1 Gross Domestic Product (GDP): British Columbia | | | | | | | | | | |
| | | | | | | | | | |
| | | | | | | | | Forecast | |
| | | 2018 | | | 2019 e | | | 2020 | | | 2021 | |
| Gross Domestic Product at Market Prices: | | | | | | | | | | | | | | | | |
| – Real (chained 2012 $ billions) | | | 264.1 | | | | 270.0 | | | | 252.0 | | | | 259.5 | |
| (% change) | | | 2.6 | | | | 2.3 | | | | -6.7 | | | | 3.0 | |
| – Nominal (current prices, $ billions) | | | 295.4 | | | | 307.5 | | | | 287.5 | | | | 301.5 | |
| (% change) | | | 4.5 | | | | 4.1 | | | | -6.5 | | | | 4.8 | |
| – GDP price deflator (2012 = 100) | | | 111.9 | | | | 113.9 | | | | 114.1 | | | | 116.2 | |
| (% change) | | | 1.9 | | | | 1.8 | | | | 0.2 | | | | 1.8 | |
| Real GDP per person (chained 2012 $) | | | 52,800 | | | | 53,244 | | | | 48,983 | | | | 49,932 | |
| (% change) | | | 1.0 | | | | 0.8 | | | | -8.0 | | | | 1.9 | |
| Real GDP per employed person | | | | | | | | | | | | | | | | |
| (% change) | | | 1.5 | | | | -0.4 | | | | 1.2 | | | | -0.5 | |
| Unit labour cost1 (% change) | | | 3.3 | | | | 3.2 | | | | 0.3 | | | | 1.7 | |
| Components of Real GDP at Market Prices (chained 2012 $ billions) | | | | | | | | | | | | | | | | |
| Household expenditure on goods and services | | | 171.5 | | | | 174.0 | | | | 160.6 | | | | 166.3 | |
| (% change) | | | 2.3 | | | | 1.4 | | | | -7.7 | | | | 3.6 | |
| – Goods | | | 69.6 | | | | 68.7 | | | | 61.0 | | | | 63.2 | |
| (% change) | | | 1.3 | | | | -1.3 | | | | -11.2 | | | | 3.6 | |
| – Services | | | 101.9 | | | | 105.3 | | | | 99.6 | | | | 103.1 | |
| (% change) | | | 3.0 | | | | 3.3 | | | | -5.5 | | | | 3.6 | |
| NPISH2 expenditure on goods and services | | | 4.0 | | | | 4.1 | | | | 4.0 | | | | 4.0 | |
| (% change) | | | 3.6 | | | | 1.9 | | | | -3.2 | | | | 0.8 | |
| Government expenditure on goods and services | | | 46.8 | | | | 48.3 | | | | 51.2 | | | | 50.6 | |
| (% change) | | | 3.0 | | | | 3.3 | | | | 6.0 | | | | -1.3 | |
| Investment in fixed capital | | | 62.0 | | | | 69.5 | | | | 65.3 | | | | 66.5 | |
| (% change) | | | 1.3 | | | | 12.0 | | | | -6.1 | | | | 1.9 | |
| Final domestic demand | | | 284.3 | | | | 296.2 | | | | 281.5 | | | | 287.8 | |
| (% change) | | | 2.2 | | | | 4.2 | | | | -5.0 | | | | 2.2 | |
| Exports of goods and services | | | 103.9 | | | | 103.2 | | | | 89.5 | | | | 93.8 | |
| (% change) | | | 4.2 | | | | -0.6 | | | | -13.3 | | | | 4.8 | |
| Imports of goods and services | | | 125.4 | | | | 129.4 | | | | 118.0 | | | | 121.5 | |
| (% change) | | | 2.9 | | | | 3.1 | | | | -8.8 | | | | 2.9 | |
| Inventory change | | | 1.3 | | | | 0.3 | | | | -0.6 | | | | -0.2 | |
| Statistical discrepancy | | | 0.1 | | | | 0.1 | | | | 0.1 | | | | 0.1 | |
| Real GDP at market prices | | | 264.1 | | | | 270.0 | | | | 252.0 | | | | 259.5 | |
| (% change) | | | 2.6 | | | | 2.3 | | | | -6.7 | | | | 3.0 | |
1 Unit labour cost is the nominal cost of labour incurred to produce one unit of real output.
2 Non-profit institutions serving households.
e B.C. Ministry of Finance estimate.
| | FIRST QUARTERLY REPORT 2020/21 | | 69 |
ECONOMIC REVIEW AND OUTLOOK
| Table 2.6.2 Selected Nominal Income and Other Indicators: British Columbia | | | | | | | | | |
| | | | | | | | | | | | | |
| | | | | | | | | | | | Forecast | |
| | | | 2018 | | | | 2019 | | | | 2020 | | | | 2021 | |
| Compensation of employees1 ($ millions) | | | 143,959 | | | | 151,945 | e | | | 142,235 | | | | 149,017 | |
| (% change) | | | 5.9 | | | | 5.5 | | | | -6.4 | | | | 4.8 | |
| Household income ($ millions) | | | 257,443 | | | | 269,124 | e | | | 260,369 | | | | 264,846 | |
| (% change) | | | 4.8 | | | | 4.5 | | | | -3.3 | | | | 1.7 | |
| Net operating surplus ($ millions) | | | 33,341 | | | | 31,123 | e | | | 25,325 | | | | 26,859 | |
| (% change) | | | -0.4 | | | | -6.7 | | | | -18.6 | | | | 6.1 | |
| Retail sales ($ millions) | | | 85,933 | | | | 86,428 | | | | 77,093 | | | | 81,224 | |
| (% change) | | | 1.9 | | | | 0.6 | | | | -10.8 | | | | 5.4 | |
| Housing starts (units) | | | 40,857 | | | | 44,932 | | | | 34,000 | | | | 32,016 | |
| (% change) | | | -6.4 | | | | 10.0 | | | | -24.3 | | | | -5.8 | |
| Residential sales value ($ millions) | | | 55,860 | | | | 54,174 | | | | 48,960 | | | | 50,825 | |
| (% change) | | | -24.2 | | | | -3.0 | | | | -9.6 | | | | 3.8 | |
| Residential sales (units) | | | 78,526 | | | | 77,351 | | | | 68,000 | | | | 70,102 | |
| (% change) | | | -24.5 | | | | -1.5 | | | | -12.1 | | | | 3.1 | |
| Residential average sale price ($) | | | 711,360 | | | | 700,366 | | | | 720,000 | | | | 725,025 | |
| (% change) | | | 0.4 | | | | -1.5 | | | | 2.8 | | | | 0.7 | |
| Consumer price index (2002 = 100) | | | 128.4 | | | | 131.4 | | | | 132.6 | | | | 134.9 | |
| (% change) | | | 2.7 | | | | 2.3 | | | | 0.9 | | | | 1.8 | |
1 Domestic basis; wages, salaries and employers’ social contributions.
e B.C. Ministry of Finance estimate.
| Table 2.6.3 Labour Market Indicators: British Columbia | | | | | | | | | | | | |
| | | | | | | | | | |
| | | | | | | | | Forecast | |
| | | 2018 | | | 2019 | | | 2020 | | | 2021 | |
| Population (thousands at July 1) | | | 5,001 | | | | 5,071 | | | | 5,144 | | | | 5,197 | |
| (% change) | | | 1.6 | | | | 1.4 | | | | 1.4 | | | | 1.0 | |
| Net migration (thousands) | | | | | | | | | | | | | | | | |
| - International1’4 | | | 57.5 | | | | 64.4 | | | | 39.1 | | | | 45.3 | |
| - Interprovincial4 | | | 9.5 | | | | 9.6 | | | | 9.0 | | | | 10.0 | |
| - Total | | | 67.0 | | | | 74.0 | | | | 48.1 | | | | 55.3 | |
| Labour force population2 (thousands) | | | 4,032 | | | | 4,097 | | | | 4,161 | | | | 4,213 | |
| (% change) | | | 1.3 | | | | 1.6 | | | | 1.5 | | | | 1.2 | |
| Labour force (thousands) | | | 2,617 | | | | 2,685 | | | | 2,633 | | | | 2,680 | |
| (% change) | | | 0.6 | | | | 2.6 | | | | -1.9 | | | | 1.8 | |
| Participation rate3 (%) | | | 64.9 | | | | 65.5 | | | | 63.3 | | | | 63.6 | |
| Employment (thousands) | | | 2,494 | | | | 2,559 | | | | 2,359 | | | | 2,443 | |
| (% change) | | | 1.1 | | | | 2.6 | | | | -7.8 | | | | 3.6 | |
| Unemployment rate (%) | | | 4.7 | | | | 4.7 | | | | 10.4 | | | | 8.8 | |
1 International migration includes net non-permanent residents and returning emigrants less net temporary residents abroad.
2 The civilian, non-institutionalized population 15 years of age and over.
3 Percentage of the labour force population in the labour force.
4 Components may not sum to total due to rounding.
| 70 | | FIRST QUARTERLY REPORT 2020/21 | |
Economic Review and Outlook
Table 2.6.4 Major Economic Assumptions
| | | | | | | | | Forecast | |
| | | 2018 | | | 2019 | | | 2020 | | | 2021 | |
| Real GDP | | | | | | | | | | | | | | | | |
| Canada (chained 2012 $ billions) | | | 2,058 | | | | 2,092 | | | | 1,929 | | | | 2,006 | |
| (% change) | | | 2.0 | | | | 1.7 | | | | -7.8 | | | | 4.0 | |
| U.S. (chained 2012 US$ billions) | | | 18,688 | | | | 19,092 | | | | 17,717 | | | | 18,160 | |
| (% change) | | | 3.0 | | | | 2.2 | | | | -7.2 | | | | 2.5 | |
| Japan (chained 2011 Yen trillions) | | | 532 | | | | 536 | | | | 501 | | | | 509 | |
| (% change) | | | 0.3 | | | | 0.7 | | | | -6.5 | | | | 1.5 | |
| China (constant 2010 US$ billions) | | | 10,875 | | | | 11,539 | | | | 11,597 | | | | 12,281 | |
| (% change) | | | 6.8 | | | | 6.1 | | | | 0.5 | | | | 5.9 | |
| Euro zone1 (chained 2015 Euro billions) | | | 11,214 | | | | 11,357 | | | | 10,278 | | | | 10,741 | |
| (% change) | | | 1.9 | | | | 1.3 | | | | -9.5 | | | | 4.5 | |
| Industrial production index (% change) | | | | | | | | | | | | | | | | |
| U.S. | | | 3.9 | | | | 0.9 | | | | -10.0 | | | | 2.0 | |
| Japan | | | 1.0 | | | | -2.6 | | | | -12.5 | | | | 2.5 | |
| China | | | 6.3 | | | | 5.8 | | | | 0.5 | | | | 5.7 | |
| Euro zone1 | | | 0.7 | | | | -1.3 | | | | -12.5 | | | | 8.0 | |
| Housing starts (thousands) | | | | | | | | | | | | | | | | |
| Canada | | | 213 | | | | 209 | | | | 190 | | | | 185 | |
| (% change) | | | -3.1 | | | | -2.0 | | | | -9.0 | | | | -2.6 | |
| U.S | | | 1,250 | | | | 1,290 | | | | 1,100 | | | | 1,170 | |
| (% change) | | | 3.9 | | | | 3.2 | | | | -14.7 | | | | 6.4 | |
| Japan | | | 942 | | | | 905 | | | | 770 | | | | 770 | |
| (% change) | | | -2.3 | | | | -4.0 | | | | -14.9 | | | | 0.0 | |
| Consumer price index | | | | | | | | | | | | | | | | |
| Canada (2002 = 100) | | | 133.4 | | | | 136.0 | | | | 137.0 | | | | 139.4 | |
| (% change) | | | 2.3 | | | | 1.9 | | | | 0.7 | | | | 1.8 | |
| Canadian interest rates (%) | | | | | | | | | | | | | | | | |
| 3-month treasury bills | | | 1.40 | | | | 1.66 | | | | 0.46 | | | | 0.23 | |
| 10-year government bonds | | | 2.26 | | | | 1.55 | | | | 0.74 | | | | 0.92 | |
| United States interest rates (%) | | | | | | | | | | | | | | | | |
| 3-month treasury bills | | | 1.97 | | | | 2.10 | | | | 0.38 | | | | 0.16 | |
| 10-year government bonds | | | 2.91 | | | | 2.14 | | | | 0.90 | | | | 1.11 | |
| Exchange rate (US cents/$ Canadian) | | | 77.2 | | | | 75.4 | | | | 73.3 | | | | 74.7 | |
| British Columbia goods and services | | | | | | | | | | | | | | | | |
| Export price deflator (% change) | | | 1.8 | | | | 1.0 | e | | | -0.4 | | | | 3.0 | |
1 Euro zone (19) is Austria, Belgium, Cyprus, Estonia, Finland, France, Germany, Greece, Ireland, Italy, Latvia, Lithuania, Luxembourg, Malta, Netherlands, Portugal, Slovakia, Slovenia and Spain.
e B.C. Ministry of Finance estimate.
| | First Quarterly Report 2020/21 | | 71 |
ECONOMIC REVIEW AND OUTLOOK
The Economic Forecast Council, First Quarterly Report 2020
Introduction
In accordance with the Budget Transparency and Accountability Act, the Minister of Finance, in preparing the provincial budget, consults the Economic Forecast Council (the Council or EFC) on British Columbia’s economic outlook. The 13-member Council is comprised of leading economists from several of Canada’s major banks and private research institutions.
Given the unprecedented economic impacts and uncertainty caused by the COVID-19 pandemic this year, the Ministry resurveyed the EFC in advance of the First Quarterly Report. EFC members submitted economic forecasts and provided their views on the short-term timing and path of the economic recovery, key medium-term issues facing the province, and economic policies that could support B.C.’s recovery.
EFC surveys were due on July 28, 2020. Forecast details from the surveys are summarized in the table at the end of this topic box.
British Columbia Outlook
On average, Council members forecast B.C. real GDP to decline by 6.0 per cent in 2020, down 8.4 percentage points from the Council’s previous projection of 2.4 per cent growth from January 2020. The Council forecasts growth of 5.2 per cent in 2021, an upward revision of 2.9 percentage points from their previous forecast, as B.C.’s economy begins to recover from the downturn in 2020 (see Chart 1).
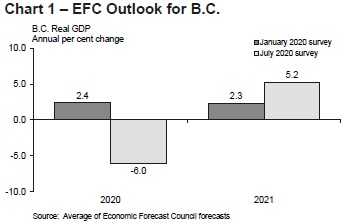
Forecasts for when B.C. real GDP will reach its pre-COVID-19 level range from mid-2021 to the first half of 2023. Most members expect this lost ground to be regained in 2022.
The EFC generally expects a rapid partial recovery in economic activity as public health restrictions are eased, followed by much slower growth thereafter. Many members expect the recovery path to be bumpy with potential setbacks depending on the evolution of the pandemic in B.C. and abroad. Others noted that it will likely be uneven across sectors, with a slower recovery in sectors that involve substantial physical interaction, such as tourism and live entertainment. A few members noted that a full economic recovery will be unlikely without a vaccine or effective treatment for COVID-19, and that an accelerated timeline for these medical technologies could speed up the recovery across the economy.
Until a vaccine or effective treatment is widely available, Council members recommended policies in collaboration with the private sector and other levels of government that protect public health while enabling British Columbians to safely and confidently resume activities. Policies aimed at providing safe schooling and childcare services were mentioned as ways to enable individuals to participate in the labour market (particularly women). Other ideas included the creation of pedestrian streets in high-density areas, supports for telework such as increased broadband infrastructure, and skills training to facilitate labour market transitions.
Looking ahead, Council members generally agree that immigration will continue to play a major role in B.C.’s medium-term outlook. Some members noted increased risks to international immigration flows due to mobility restrictions across borders. However, it was highlighted that B.C.’s relative success in limiting the spread of COVID-19 may attract more newcomers. Various members mentioned the connection between immigration and the housing market, and recommended policies to support housing affordability and supply, as well as broader policies to continue to attract and retain diverse talent.
| 72 | | First Quarterly Report 2020/21 | |
ECONOMIC REVIEW AND OUTLOOK
As in previous surveys, the EFC noted developments in the natural resource sector as a key issue for B.C.’s economy, with related discussions about climate change objectives, challenges in the forestry sector and ongoing reconciliation with Indigenous peoples. Continued investments were recommended to support businesses across all sectors of the economy during the public health crisis (including financial and tax supports, capital projects and initiatives to foster entrepreneurship) in order to prevent permanent job loss and maintain the productive capacity of B.C.’s economy.
Many members discussed the appropriate timing for stimulus withdrawal and reductions to government deficits and debt in the coming years. There was a strong consensus that economic supports for households and businesses should be maintained throughout the COVID-19 pandemic to support the economic recovery and wellbeing of British Columbians.
Canadian Outlook
The Council expects Canada’s economic growth to be somewhat below B.C.’s in 2020 and 2021. Canadian real GDP is forecasted to decline by 7.0 per cent in 2020, then increase by 5.1 per cent in 2021 (see Chart 2).
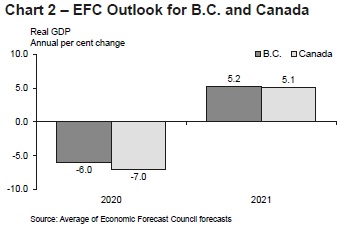
Members noted several aspects of B.C.’s economy that contribute to higher growth compared to the Canadian average, including LNG development, strong residential and non-residential construction sectors, and diversified trading partners.
International Outlook
On average, the Council forecasts U.S. real GDP to fall by 5.8 per cent in 2020, followed by growth of 4.8 per cent in 2021.
Most members discussed trade risks surrounding the international outlook with regards to growing protectionism and trade barriers as well as weak demand and commodity prices, with potential impacts on B.C. exports.
| British Columbia Economic Forecast Council: | | | | | | |
| Summary of B.C. real GDP forecasts, annual per cent change | | | | | | |
| | | | | | | | | |
| Participant | | Organization | | | 2020 | | | | 2021 | |
| Douglas Porter | | Bank of Montreal | | | -5.3 | | | | 6.3 | |
| Brendon Ogmundson | | BC Real Estate Association | | | -6.0 | | | | 3.8 | |
| Ken Peacock | | Business Council of BC | | | -7.8 | | | | 4.8 | |
| Helmut Pastrick | | Central 1 Credit Union | | | -6.9 | | | | 4.8 | |
| Avery Shenfeld | | CIBC | | | -6.1 | | | | 5.9 | |
| Pedro Antunes | | Conference Board of Canada | | | -6.1 | | | | 8.0 | |
| Arlene Kish | | IHSMarkit | | | -6.8 | | | | 3.7 | |
| Sebastien Lavoie | | Laurentian Bank Securities | | | -6.8 | | | | 5.2 | |
| Stefane Marion | | National Bank | | | -5.7 | | | | 4.0 | |
| Craig Wright | | RBC | | | -4.2 | | | | 3.9 | |
| Jean-Francois Perrault | | Scotiabank | | | -5.5 | | | | 6.6 | |
| Aaron Stokes | | Stokes Economics | | | -4.9 | | | | 4.8 | |
| Derek Burleton | | TD | | | -5.6 | | | | 5.4 | |
| Average | | | | | -6.0 | | | | 5.2 | |
| Standard Deviation | | | | | 0.9 | | | | 1.3 | |
| | First Quarterly Report 2020/21 | | 73 |
ECONOMIC REVIEW AND OUTLOOK
Other international risks included escalating geopolitical tensions and the global evolution of the COVID-19 pandemic.
Canadian Dollar
Council members’ projections for the Canadian dollar ranged from 72.1 US cents to 75.0 US cents in 2020, lower than the range of 74.3 US cents to 79.1 US cents forecast in January 2020. In 2021, EFC forecasts ranged from 72.3 US cents to 78.3 US cents.
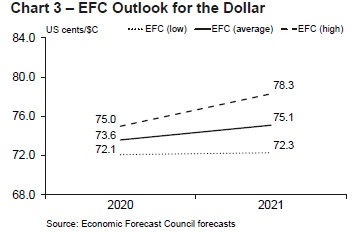
| Forecast Survey - Participants’ Opinions | | | | | | | | | | | |
| | | | | | | | | | | | |
| All figures are based | | 2020 | | 2021 | |
| on annual averages | | Range | | | Average 1 | | Range | | | Average 1 | |
| British Columbia | | | | | | | | | | | | | | | |
| Real GDP (% change) | | | -7.8 - -4.2 | | | | -6.0 | (13) | | 3.7-8.0 | | | | 5.2 | (13) |
| Nominal GDP (% change) | | | -9.3--1.4 | | | | -5.3 | (13) | | 5.0-10.7 | | | | 7.2 | (13) |
| GDP Deflator (% change) | | | -2.6-2.8 | | | | 0.6 | (12) | | 1.1 -5.8 | | | | 2.0 | (12) |
| Real business non-residential investment (% change) | | | | | | | | | | | | | | | |
| Real business machinery and equipment investment (% change) | | | -20.0--8.4 | | | | -13.5 | (5) | | 0.5-26.6 | | | | 10.0 | (5) |
| Household Income (% change) | | | -4.8-4.4 | | | | -1.2 | (8) | | -1.6-6.5 | | | | 3.8 | (8) |
| Net Migration (thousand persons) | | | 35.0-62.8 | | | | 43.3 | (9) | | 38.0 - 75.0 | | | | 51.9 | (9) |
| Employment (% change) | | | -9.6 - -5.8 | | | | -6.8 | (13) | | 2.8-6.9 | | | | 5.0 | (13) |
| Unemployment rate (%) | | | 7.8-10.8 | | | | 9.2 | (13) | | 5.7-9.4 | | | | 7.2 | (13) |
| Net operating surplus of corporations (% change) | | | -26.0--7.9 | | | | -17.6 | (6) | | -2.2-37.8 | | | | 15.0 | (6) |
| Housing starts (thousand units) | | | 28.0-38.3 | | | | 34.7 | (13) | | 27.3-42.0 | | | | 36.7 | (13) |
| MLS residential unit sales (thousand units) | | | 63.5 - 78.0 | | | | 70.8 | (7) | | 75.0 - 88.0 | | | | 79.7 | (7) |
| MLS residential average sale price ($ thousand) | | | 710.1 -750.0 | | | | 730.9 | (7) | | 683.5-810.0 | | | | 741.7 | (7) |
| Retail sales (% change) | | | -11.7--1.8 | | | | -6.4 | (8) | | 1.0-12.1 | | | | 5.9 | (8) |
| Consumer price index (% change) | | | 0.2-1.2 | | | | 0.7 | (11) | | 1.2-2.1 | | | | 1.7 | (11) |
| United States | | | | | | | | | | | | | | | |
| Real GDP (% change) | | | -7.5 - -4.5 | | | | -5.8 | (13) | | 3.5-6.7 | | | | 4.8 | (13) |
| Intended Federal Funds rate (%) | | | 0.14-0.70 | | | | 0.34 | (12) | | 0.06-0.25 | | | | 0.19 | (12) |
| Housing starts (million units) | | | 1.10-1.35 | | | | 1.25 | (12) | | 1.23-1.40 | | | | 1.31 | (12) |
| Canada | | | | | | | | | | | | | | | |
| Real GDP (% change) | | | -8.5 - -5.9 | | | | -7.0 | (13) | | 3.7-6.7 | | | | 5.1 | (13) |
| Bank of Canada overnight target rate (%) | | | 0.25-0.60 | | | | 0.39 | (12) | | 0.25-0.25 | | | | 0.25 | (12) |
| Exchange rate (US cents/$C) | | | 72.1 -75.0 | | | | 73.6 | (13) | | 72.3-78.3 | | | | 75.1 | (13) |
| Housing starts (thousand units) | | | 145-200 | | | | 185 | (13) | | 155-215 | | | | 194 | (13) |
| Consumer price index (% change) | | | 0.4-2.1 | | | | 0.8 | (13) | | 1.0-2.0 | | | | 1.6 | (13) |
1 Based on responses from participants providing forecasts. Number of respondents shown in parentheses.
| 74 | | First Quarterly Report 2020/21 | |
This page intentionally left blank