EXHIBIT 99.7

Budget and Fiscal Plan
2021/22 – 2023/24
April 20, 2021

National Library of Canada Cataloguing in Publication Data
British Columbia.
Budget and fiscal plan. –- 2002/03/2004/05-
Annual
Also available on the Internet.
Continues: British Columbia. Ministry of Finance and
Corporate Relations. Budget ... reports. ISSN 1207-5841
ISSN 1705-6071 = Budget and fiscal plan — British Columbia.
1. Budget — British Columbia — Periodicals. 2. British
Columbia — Appropriations and expenditures — Periodicals.
I. British Columbia. Ministry of Finance. II. Title.
HJ12.B742 352.48’09711’05 C2003-960048-3
BUDGET AND FISCAL PLAN 2021/22 to 2023/24
April 20, 2021 | TABLE OF CONTENTS |
| Attestation by the Secretary to Treasury Board | |
| | |
| Summary | 1 |
| | |
| Part 1: Three Year Fiscal Plan | |
| Introduction | 5 |
| Expense | 6 |
| Consolidated Revenue Fund Spending | 6 |
| COVID-19 Response & Recovery | 6 |
| Protecting the Health and Safety of British Columbians | 8 |
| Strengthening the Health Care for People | 8 |
| Investing in Mental Health and Responding to the Overdose Crisis | 9 |
| Supports for People and Businesses | 11 |
| Reducing Poverty and Helping Those Most in Need | 11 |
| Affordable, Accessible and High-Quality Child Care | 13 |
| Making Life More Affordable | 14 |
| Reconciliation with Indigenous Peoples | 16 |
| Investing in the Services British Columbians Count On | 17 |
| Support for B.C. Businesses | 19 |
| Preparing for Recovery | 21 |
| Targeted Training & Job Creation | 21 |
| CleanBC | 23 |
| InBC Strategic Investment Fund | 26 |
| Investing in Communities | 26 |
| BC Public Service | 34 |
| BC Public Sector Compensation | 34 |
| Spending Recovered from Third Parties | 34 |
| Transfers to Service Delivery Agencies | 35 |
| Service Delivery Agency Spending | 35 |
| Revenue | 38 |
| Major Revenue Sources | 40 |
| Capital Spending | 46 |
| Taxpayer-Supported Capital Spending | 46 |
| Self-Supported Capital Spending | 55 |
| Projects Over $50 Million | 55 |
| Provincial Debt | 61 |
| Risks to the Fiscal Plan | 64 |
Budget and Fiscal Plan - 2021/22 to 2023/24
i
| Table of Contents |
| |
| Tables: | | |
| 1.1 | Three Year Fiscal Plan | 5 |
| 1.2.1 | Budget 2021 New Operating Spending Summary | 7 |
| 1.2.2 | Pandemic and Recovery Contingencies Allocations for 2021/22 | 7 |
| 1.2.3 | Investments for Mental Health and Addictions Services | 11 |
| 1.2.4 | Investments to Support Reconciliation | 16 |
| 1.2.5 | Investments in Justice and Public Safety Services | 19 |
| 1.2.6 | Ongoing Business Supports from the Fall StrongerBC Economic Recovery Plan | 20 |
| 1.2.7 | 2021/22 Investments to Support Recovery for People | 23 |
| 1.2.8 | Investments for CleanBC (including Contingencies allocations) | 24 |
| 1.2.9 | CleanBC Program for Industry - Total Funding | 25 |
| 1.2.10 | InBC Strategic Investment Fund | 26 |
| 1.2.11 | Investments to Support Recovery for Communities | 27 |
| 1.3 | Expense by Ministry, Program and Agency | 36 |
| 1.4 | Revenue by Source | 37 |
| 1.5.1 | Comparison of Major Factors Underlying Revenue | 39 |
| 1.5.2 | Corporate Income Tax Revenue | 40 |
| 1.5.3 | Sales Tax Revenue | 40 |
| 1.5.4 | Federal Government Contributions | 44 |
| 1.6 | Capital Spending | 46 |
| 1.7 | Provincial Transportation Investments | 53 |
| 1.8 | Capital Expenditure Projects Greater Than $50 Million | 58 |
| 1.9 | Provincial Debt Summary | 61 |
| 1.10 | Provincial Borrowing Requirements | 62 |
| 1.11 | Provincial Debt Changes | 63 |
| 1.12 | Key Fiscal Sensitivities | 64 |
| | | |
| Topic Boxes: | | |
| Investing in Infrastructure to Support Recovery | 28 |
| Economic Recovery and the Path to Fiscal Balance | 30 |
| A Collaborative Approach to Address COVID-19 Through Partnership with the Federal Government ... | 45 |
| | |
| Part 2: Tax Measures | |
| Tax Measures | – Supplementary Information | 70 |
| | | |
| Tables: | | |
| 2.1 | Summary of Tax Measures | 69 |
Budget and Fiscal Plan - 2021/22 to 2023/24
ii
| Table of Contents |
| |
| Part 3: British Columbia Economic Review and Outlook | |
| Summary | 79 |
| British Columbia Economic Activity and Outlook | 80 |
| Labour Market | 81 |
| Consumer Spending and Housing | 83 |
| Inflation | 86 |
| Business and Government | 87 |
| External Trade and Commodity Markets | 88 |
| Demographics | 90 |
| Risks to the Economic Outlook | 90 |
| External Outlook | 91 |
| United States | 91 |
| Canada | 94 |
| Asia | 96 |
| Europe | 97 |
| Financial Markets | 97 |
| Interest Rates | 97 |
| Exchange Rate | 99 |
| | |
| Tables: | |
| 3.1 British Columbia Economic Indicators | 80 |
| 3.2 U.S. Real GDP Forecast: Consensus versus B.C. Ministry of Finance | 93 |
| 3.3 Canadian Real GDP Forecast: Consensus versus B.C. Ministry of Finance | 95 |
| 3.4 Private Sector Canadian Interest Rate Forecasts | 98 |
| 3.5 Private Sector Exchange Rate Forecasts | 99 |
| 3.6.1 Gross Domestic Product (GDP): British Columbia | 100 |
| 3.6.2 Selected Nominal Income and Other Indicators: British Columbia | 101 |
| 3.6.3 Labour Market Indicators: British Columbia | 101 |
| 3.6.4 Major Economic Assumptions | 102 |
| | |
| Topic Box: | |
| The Economic Forecast Council, Budget 2021 | 103 |
Budget and Fiscal Plan - 2021/22 to 2023/24
iii
| Table of Contents |
| |
| Part 4: 2020/21 Updated Financial Forecast (Third Quarterly Report) |
| Introduction | | 107 |
| Revenue | | 109 |
| Expense | | 109 |
| Government Employment (FTEs) | 110 |
| Provincial Capital Spending | 124 |
| Provincial Debt | 125 |
| Risks to the Fiscal Forecast | 126 |
| Supplementary Schedules | 126 |
| | | |
| Topic Boxes: | |
| COVID-19 Pandemic Spending & Related Measures | 111 |
| | | |
| Description of COVID -19 Measures | 115 |
| | | |
| Tables: | | |
| 4.1 | 2020/21 Forecast Update | 107 |
| 4.2 | 2020/21 Financial Forecast Changes | 108 |
| 4.3 | 2020/21 Capital Spending Update | 124 |
| 4.4 | 2020/21 Provincial Debt Update | 125 |
| 4.5 | 2020/21 Operating Statement | 127 |
| 4.6 | 2020/21 Revenue by Source | 128 |
| 4.7 | 2020/21 Expense by Ministry, Program and Agency | 129 |
| 4.8 | 2020/21 Expense by Function | 130 |
| 4.9 | 2020/21 Capital Spending | 131 |
| 4.10 | 2020/21 Provincial Debt | 132 |
| 4.11 | 2020/21 Statement of Financial Position | 133 |
| 4.12 | 2020/21 Changes in Financial Position | 133 |
| | | |
| Appendix | | 135 |
Budget and Fiscal Plan - 2021/22 to 2023/24
iv
 | April 20, 2021 |
As required by Section 7(1)(d) of the Budget Transparency and Accountability Act, I confirm that Budget 2021 contains the following elements:
| • | Fiscal forecasts for 2021/22 to 2023/24 (provided in Part 1) and economic forecasts for 2021 to 2025 (provided in Part 3). |
| • | A report on the advice received from the Economic Forecast Council (EFC) in February 2021 (updated in March 2021) on the economic growth outlook for British Columbia, including a range of forecasts for 2021 and 2022 (see Part 3, page 103). |
| • | Material economic, demographic, fiscal, accounting policy, and other assumptions and risks underlying Budget 2021 economic and fiscal forecasts. In particular: |
| − | The economic forecast reflects an improved outlook for British Columbia amidst ongoing uncertainty associated with the global COVID-19 pandemic. In recognition of downside risks, the economic projections assumed in Budget 2021 are prudent relative to the average of the forecasts provided by the Economic Forecast Council. |
| − | Consistent with past practice, the economic forecast does not incorporate fiscal policy measures announced in the current budget (Budget 2021), since the timing of budget decisions generally coincides with the development of the economic forecast. These budget policy measures will be incorporated into the economic outlook in the updated forecast included in the First Quarterly Report. |
| − | The corporate income tax revenue forecast is based on projections for national corporate taxable income provided by the federal government. |
| − | Natural gas royalty forecasts continue to adopt a lower natural gas price forecast compared to the private sector average in order to maintain prudence against volatility. |
| − | The fiscal plan includes three-year financial projections for school districts, post-secondary institutions and health authorities, based on plans submitted by those entities to the Ministries of Education, Advanced Education, Skills and Training, and Health, respectively, and for the other service delivery agencies and the commercial Crown corporations. |
| − | The fiscal plan includes general program contingencies of $1.0 billion in 2021/22, $800 million in 2022/23 and $700 million 2023/24, and a forecast allowance of $1.0 billion in 2021/22, $750 million in 2022/23, and $400 million in 2023/24. In addition, Budget 2021 provides a Pandemic and Recovery Contingencies allocation of $3.25 billion in 2021/22, $1.0 billion in 2022/23, and $300 million in 2023/24. Government’s economic and fiscal prudence measures generally have resulted in government exceeding its budget targets. |
| − | Budget 2021 contains an additional $1.5 billion in 2022/23 and 2.0 billion in 2023/24 in funding available for priority spending initiatives to be developed for future budgets, and for budgetary pressures such as caseload growth. |
To the best of my knowledge, the three-year fiscal plan contained in Budget 2021 conforms to the standards and guidelines of generally accepted accounting principles for senior governments as outlined in Note 1 of the 2019/20 Public Accounts.
I would like to recognize staff in government ministries and agencies for their contribution to this document. I would especially like to acknowledge staff in the Ministry of Finance, whose professionalism, commitment and expertise were essential to the completion of this budget and fiscal plan.
| | /s/ Heather Wood |
| | Heather Wood |
| | Deputy Minister and Secretary to Treasury Board |
Budget and Fiscal Plan - 2021/22 to 2023/24

SUMMARY | BUDGET AND FISCAL PLAN - 2021/22 to 2023/24
| | | Updated | | | Budget | | | | | | | |
| | | Forecast | | | Estimate | | | Plan | | | Plan | |
| ($ millions) | | 2020/21 | | | 2021/22 | | | 2022/23 | | | 2023/24 | |
| Revenue | | | 60,967 | | | | 58,929 | | | | 63,286 | | | | 65,074 | |
| Expense | | | (61,601 | ) | | | (64,377 | ) | | | (67,020 | ) | | | (68,697 | ) |
| Pandemic and Recovery Contingencies | | | (7,510 | ) | | | (3,250 | ) | | | (1,000 | ) | | | (300 | ) |
| Forecast allowance | | | - | | | | (1,000 | ) | | | (750 | ) | | | (400 | ) |
| Deficit | | | (8,144 | ) | | | (9,698 | ) | | | (5,484 | ) | | | (4,323 | ) |
| | | | | | | | | | | | | | | | | |
| Capital spending: | | | | | | | | | | | | | | | | |
| Taxpayer-supported capital spending | | | 6,277 | | | | 8,479 | | | | 9,025 | | | | 8,872 | |
| Self-supported capital spending | | | 3,812 | | | | 4,976 | | | | 4,640 | | | | 3,489 | |
| Total capital spending | | | 10,089 | | | | 13,455 | | | | 13,665 | | | | 12,361 | |
| Provincial Debt: | | | | | | | | | | | | | | | | |
| Taxpayer-supported debt | | | 59,962 | | | | 71,642 | | | | 82,771 | | | | 92,732 | |
| Self-supported debt | | | 27,524 | | | | 30,238 | | | | 32,688 | | | | 33,882 | |
| Total debt (including forecast allowance) | | | 87,486 | | | | 102,880 | | | | 116,209 | | | | 127,014 | |
| Taxpayer-supported debt to GDP ratio | | | 20.3 | % | | | 22.8 | % | | | 25.0 | % | | | 26.9 | % |
| Taxpayer-supported debt to revenue ratio | | | 102.6 | % | | | 125.9 | % | | | 135.4 | % | | | 147.5 | % |
| | | | | | | | | | | | | | | | | |
| | | 2020 | | | 2021 | | | 2022 | | | 2023 | |
| Economic Forecast: | | | | | | | | | | | | | | | | |
| Real GDP growth | | | -5.3 | % | | | 4.4 | % | | | 3.8 | % | | | 2.2 | % |
| Nominal GDP growth | | | -4.5 | % | | | 6.4 | % | | | 5.4 | % | | | 4.0 | % |
A StrongerBC, for Everyone
The emergence and evolution of the COVID-19 pandemic has challenged the people of British Columbia and the world alike. While B.C. has demonstrated resilience and there are signs of optimism for the year ahead, the Province continues to respond to the ongoing health and economic impacts from the pandemic.
Budget 2021 builds on the Province’s COVID-19 Action Plan by prioritizing $8.7 billion in new investments across the three-year fiscal plan to protect the health and safety of British Columbians, to support people and businesses in addressing the pandemic’s immediate impacts, and to prepare the province for recovery once the pandemic is over.
The fiscal plan also reflects the ongoing uncertainty of the pandemic by maintaining Pandemic and Recovery Contingencies of $3.25 billion in 2021/22, $1 billion in 2022/23 and $300 million in 2023/24. This will ensure that the Province can continue to deliver COVID-19 response and recovery measures and builds additional prudence in the fiscal plan. Total new operating spending is $13.2 billion over fiscal plan, as shown in Table 1.2.1 on page 7.
Budget 2021 sets the path for working towards fiscal balance with declining deficits from $9.7 billion in 2021/22 to $4.3 billion in 2023/24. The topic box on page 30 provides additional information about the Province’s approach to economic recovery and path to fiscal balance.
Health and Safety
The health and safety of British Columbians remains government’s top priority. The pandemic highlighted the importance of a robust and responsive health care system. Budget 2021 invests more than $3.1 billion over three years
Budget and Fiscal Plan - 2021/22 to 2023/24
1
SUMMARY
to strengthen B.C.’s health care and mental health systems. This includes measures to support long-term care residents and patients, provide more options for seniors and others to receive care at home, accelerate surgeries and diagnostic imaging services, and expand the number of urgent and primary care centres in B.C. Historic investments of $500 million over three years are provided to address the opioid crisis and improve access to mental health and addictions services. Funding will provide targeted mental health supports for children, youth and Indigenous peoples, as well as prevention, treatment and emergency response services.
In addition to these investments, government has allocated $900 million from the Pandemic and Recovery Contingencies to support ongoing COVID-19 related health response needs, including vaccine roll-out, testing and screening, and the provision of personal protective equipment for frontline healthcare workers.
Supporting People and Businesses
Budget 2021 continues to deliver and enhance the services people rely on and helps make life more affordable. This includes nearly $1.6 billion more over the fiscal plan to provide supports for British Columbians receiving income and disability assistance, including low-income seniors, to improve financial security for some of B.C.’s most vulnerable people.
This budget also provides significant new investments to support essential public services including: the K-12 education sector ($1.2 billion), children, youth and family services ($85 million), supports for adults with developmental disabilities ($367 million), and justice and public safety services ($206 million).
The plan also invests new funding in key government priorities. Budget 2021 provides over $375 million over the plan for homelessness response and affordable housing initiatives. It provides $233 million more over three years to advance the ChildcareBC strategy to provide more affordable, accessible and high quality child care to support families and help parents — particularly women — to participate in the workforce.
The budget contains a number of measures which support reconciliation, including $197 million for: engagement with Indigenous peoples on legislation, policy, and programs; negotiation capacity; initiatives that increase participation of Indigenous people in land and resource activities within their territories; and resources to continue the implementation of reconciliation agreements and the Declaration on the Rights of Indigenous Peoples Act.
Budget 2021 continues to support businesses through the ongoing COVID-19 response initiatives implemented during the fall 2020 StrongerBC Economic Recovery Plan. This includes funding for the Small and Medium Sized Business Recovery Grant program, and tax incentives for businesses that increased hiring or compensation in the last quarter of 2020 compared to the previous quarter. It also includes $45 million more to support farmers and the agriculture sector, and $120 million to support the tourism sector, including community infrastructure grants, supports for anchor attractions, and initiatives to promote domestic and international travel to B.C. when health restrictions are lifted.
Preparing for Recovery
While the Province continues to manage the ongoing pandemic, Budget 2021 makes investments of over $1 billion over the fiscal plan to help position B.C. for a strong economic recovery. This includes new training investments to increase the overall capacity of the health care workforce. The budget also allocates an additional $200 million in 2021/22 from the Pandemic and Recovery Contingencies to help boost training and job creation initiatives. This includes more skills training opportunities for Indigenous people, an increase in youth work placement and job opportunities, and for micro-credentialing programs that will help people to quickly move into good-paying jobs.
The Province also continues to invest in a greener and more sustainable future with $506 million in new investments for CleanBC. Budget 2021 provides $500 million in financing to support the new InBC Strategic Investment Fund that will help to attract and anchor high-growth
Budget and Fiscal Plan - 2021/22 to 2023/24
2
SUMMARY
businesses, talent and jobs in B.C. The plan also provides $147 million over three years for new investments in communities by improving broadband and cellular connectivity for rural and remote communities, enhancing campgrounds and recreational trails, and investing in community infrastructure and programs to mark the 150th anniversary of B.C.’s entry into the confederation.
Capital Investments
Budget 2021 makes significant new capital commitments in the health, transportation, and education sectors. Taxpayer-supported capital spending on hospitals, schools, post-secondary facilities, affordable housing, transit, roads and other infrastructure around the province is expected to be $26.4 billion over the fiscal plan period. This three-year total is $3.5 billion higher than Budget 2020. These important investments help build and improve infrastructure to deliver services people count on in communities around the province and are expected to create over 85,000 jobs during the next three years, providing economic stimulus to support B.C.’s economic recovery.
Capital spending of self-supported Crown corporations is expected to total $13.1 billion over three years, relating primarily to electrical generation, transmission and distribution projects.
Economic Outlook
The COVID-19 pandemic pushed economies all over the world into deep recessions and B.C. was no exception. Widespread job losses strained households and unprecedented challenges weighed on businesses. While the reopening of the economy and government emergency response programs have gone a long way to support economic recovery, the pandemic continues and significant challenges remain. The swift development of effective vaccines together with stronger than expected economic activity in 2020 have improved the outlook.
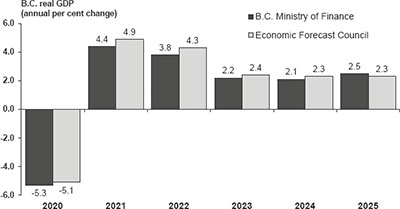
It is estimated that the B.C. economy contracted by 5.3 per cent in 2020 and that it will expand by 4.4 per cent in 2021 and then 3.8 per cent in 2022. Over the medium-term (2023 to 2025), growth is expected to range between 2.1 per cent and 2.5 per cent annually.
The Budget 2021 forecast over the three-year fiscal plan for B.C. real GDP growth is below the average outlook provided by the Economic Forecast Council (EFC). This is one of the levels of prudence built into the fiscal plan. The outlook for 2025 is slightly higher than the average EFC forecast as LNG production is anticipated to provide more support to the economy in that year.
Prudent Economic Forecast
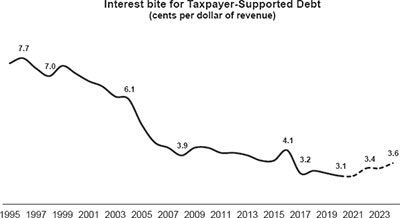
Debt Affordability
Debt is expected to increase significantly to finance the operating and capital investment needs of the province. Taxpayer-supported debt at the end of the three-year fiscal plan in 2023/24 is forecast to be $92.7 billion, with the taxpayer debt-to-GDP ratio at 26.9 per cent. In spite of the debt level increase, debt servicing costs remain at a historically low level due to prevailing low interest rates. A common metric of affordability is the interest bite, or the taxpayer-supported interest
Debt Affordability
Budget and Fiscal Plan - 2021/22 to 2023/24
3
SUMMARY
costs as a percentage of provincial government revenue, which continues to remain lower than it has been historically, forecast at 3.4 per cent in 2021/22 and 3.6 per cent by 2023/24.
Risks to the Fiscal Plan
The main risks to the government’s fiscal plan include:
| • | Ongoing health-related uncertainty relating to the pandemic, including the extent of the spread or containment of the virus in B.C. and across the world; |
| • | Uncertainty relating to the depth and duration of the pandemic and the pace and timing of recovery which contributes to the potential volatility in the economic and fiscal outlooks; |
| • | Increased demands for government services, such as health care, income assistance, other social service programs, or COVID-19 response or recovery programs; |
| • | Changes in the timing of capital projects and related spending which may be influenced by several factors, such as physical distancing on work sites, design development, procurement activity, market conditions, weather, geotechnical conditions and interest rates; and |
| • | Actual operating results and capital spending which may affect borrowing requirements and overall provincial debt. |
To mitigate the risks to the fiscal plan, government has incorporated increased levels of prudence in its projections which include:
| • | Annual forecast allowances of $1.0 billion in 2021/22, $750 million in 2022/23 and $400 million in 2023/24 to guard against volatility, including revenue changes; |
| • | General Program Contingencies allocation of $1 billion in 2021/22, $800 million in 2022/23 and $700 million in 2023/24 to help manage unexpected pressures; |
| • | Pandemic and Recovery Contingencies allocation of $3.25 billion in 2021/22, $1.0 billion in 2022/23 and $300 million in 2023/24 to continue to fund short-term initiatives to address health or economic recovery needs related to COVID-19; |
| • | Notional allocations of $1.5 billion in 2022/23 and $2.0 billion 2023/24 for caseload pressures and priority initiatives that may require funding in future budgets; and |
| • | A forecast for B.C.’s real GDP growth that is lower than the outlook provided by the Economic Forecast Council (0.5 percentage points lower in both 2021 and 2022, and 0.2 percentage points lower in both 2023 and 2024). |
Conclusion
Budget 2021 continues to prioritize investments that help B.C. respond to the pandemic. This includes significant new investments in health and safety, supports to people and businesses, and preparing B.C. for recovery. These investments will help create jobs, support recovery, and build a more sustainable, inclusive and equitable economy. The past year has presented challenges, but also opportunities to think about how to do things better. In the coming months, the Province will engage with businesses, workers, industry and Indigenous and community leaders to help move the province forward to build a stronger B.C. for everyone.
Budget and Fiscal Plan - 2021/22 to 2023/24
4
PART 1 | THREE YEAR FISCAL PLAN
Table 1.1 Three Year Fiscal Plan
| ($ millions) | | Updated Forecast 2020/21 | | | Budget Estimate 2021/22 | | | Plan 2022/23 | | | Plan 2023/24 | |
| Revenue | | | 60,967 | | | | 58,929 | | | | 63,286 | | | | 65,074 | |
| Expense | | | (61,601 | ) | | | (64,377 | ) | | | (67,020 | ) | | | (68,697 | ) |
| Pandemic and Recovery Contingencies | | | (7,510 | ) | | | (3,250 | ) | | | (1,000 | ) | | | (300 | ) |
| Forecast allowance | | | — | | | | (1,000 | ) | | | (750 | ) | | | (400 | ) |
| Deficit | | | (8,144 | ) | | | (9,698 | ) | | | (5,484 | ) | | | (4,323 | ) |
| Capital spending: | | | | | | | | | | | | | | | | |
| Taxpayer-supported capital spending | | | 6,277 | | | | 8,479 | | | | 9,025 | | | | 8,872 | |
| Self-supported capital spending | | | 3,812 | | | | 4,976 | | | | 4,640 | | | | 3,489 | |
| Total capital spending | | | 10,089 | | | | 13,455 | | | | 13,665 | | | | 12,361 | |
| Provincial Debt: | | | | | | | | | | | | | | | | |
| Taxpayer-supported debt | | | 59,962 | | | | 71,642 | | | | 82,771 | | | | 92,732 | |
| Self-supported debt | | | 27,524 | | | | 30,238 | | | | 32,688 | | | | 33,882 | |
| Total debt (including forecast allowance) | | | 87,486 | | | | 102,880 | | | | 116,209 | | | | 127,014 | |
| Taxpayer-supported debt to GDP ratio | | | 20.3 | % | | | 22.8 | % | | | 25.0 | % | | | 26.9 | % |
| Taxpayer-supported debt to revenue ratio | | | 102.6 | % | | | 125.9 | % | | | 135.4 | % | | | 147.5 | % |
Introduction
Budget 2021 provides for the needs of British Columbians as we turn the corner from the COVID-19 pandemic, and lays a foundation for an economic recovery with enhanced services and supports that people rely on. The fiscal plan reflects the increased level of spending and the unprecedented impacts of the pandemic on the Province’s revenues. The path to balance is demonstrated with declining deficits from $9.7 billion in 2021/22 to $4.3 billion in 2023/24.
Budget 2021 investments focus on the response and recovery from the pandemic, providing supports for people and businesses, and improving the health and safety of British Columbians through a strengthened health care system. Government’s consolidated operating expense totals $67.6 billion in 2021/22, $68.0 billion in 2022/23, and $69.0 billion in 2023/24, including ministry operating budget increases of $8.7 billion over the fiscal plan and $4.6 billion of time-limited Pandemic and Recovery Contingencies appropriation. Revenue is forecast to grow to $65.1 billion by 2023/24, substantially recovering from the pandemic-related decline.
Capital spending on schools, hospitals, affordable housing, roads, bridges, hydro-electric projects and other infrastructure is expected to total $39.5 billion over the three-year fiscal plan period. These investments will help ensure that the necessary infrastructure is in place to deliver the services that people count on in communities around the province and create jobs that support a strong and sustainable economy.
The new operating funding initiatives are discussed in the expense section starting on the next page. Details on the Province’s revenue forecasts are provided in the revenue section,
Budget and Fiscal Plan - 2021/22 to 2023/24
5
Three Year Fiscal Plan
starting on page 37. The capital investments section is on page 46, followed by the debt section on page 61, and a discussion on the risks to the fiscal plan on page 64.
Budget 2021 demonstrates government’s ongoing commitment to incorporate Gender- Based Analysis Plus (GBA+) into its policy and budget process. Since 2018, the Province has used GBA+ to ensure that comprehensive, evidence-based policy advice is provided to decision makers to achieve better results for all British Columbians. Budget 2021 uses GBA+ analysis to inform spending and tax decisions. This analytical tool helps assess, where appropriate, the effect of different spending or tax measures on different groups, including people of different genders, incomes, ethnicities, geographic areas, ages, abilities or sexual orientation. This lens helps to build a province where everyone has equal access to opportunities and services that are inclusive, respectful and representative of the diverse population in B.C.
Expense
Consolidated Revenue Fund Spending
Consolidated Revenue Fund (core government) spending in 2021/22 is $58.3 billion, with planned expenditures of $59.0 billion in 2022/23 and $59.9 billion in 2023/24 as shown in Table 1.3 on page 36. Government remains committed to investing in the health, social and economic needs of British Columbians as the province continues to manage through the effects of the unprecedented COVID-19 pandemic and into recovery. Budget 2021 prioritizes investments towards health and safety, supports for people and businesses and preparing for recovery. Funding decisions are also underpinned by government’s five foundational principles: to put people first; to engage in lasting and meaningful reconciliation with Indigenous peoples; to support equity and anti-racism in our province; to build a better future through fighting climate change; and to build a strong, sustainable economy that works for everyone.
COVID-19 Response & Recovery
Budget 2021 focuses on health and safety, supports for people and businesses and preparing for B.C.’s longer term economic recovery with $8.7 billion in budget increases over the fiscal plan. This includes permanent funding increases to address enhancements to and increasing demand for essential public services including health care, opioid and substance-use prevention and response services, education, and justice and public safety services. New permanent funding also includes further advancing key government priorities: child care, poverty reduction, mental health, housing, reconciliation with Indigenous peoples and CleanBC.
Government has also budgeted $4.6 billion over three years to maintain the Pandemic and Recovery Contingencies to support ongoing measures related to the pandemic, with $3.25 billion in 2021/22, $1 billion in 2022/23 and $300 million in 2023/24. The Pandemic and Recovery Contingencies will be used to continue short-term funding initiatives or newer programs where the demand and costs may fluctuate as the pandemic, vaccine roll-out and related health orders continue to evolve. This includes ongoing supports for people and businesses, such as the B.C. Recovery Benefit, the Small and Medium Sized Business Recovery Grant, supports to the tourism sector and a tax incentive for businesses that increased hiring or wages for employees in the fourth quarter of 2020. A summary of the Budget 2021 operating spending is shown in Table 1.2.1.
Budget and Fiscal Plan - 2021/22 to 2023/24
6
Three Year Fiscal Plan
Table 1.2.1 Budget 2021 New Operating Spending Summary
| ($ millions) | | 2021/22 | | | 2022/23 | | | 2023/24 | | | Total | |
| Health & Safety | | | 760 | | | | 795 | | | | 1,562 | | | | 3,116 | |
| Supports for People & Business | | | 1,427 | | | | 1,527 | | | | 1,557 | | | | 4,511 | |
| Preparing for Recovery | | | 307 | | | | 336 | | | | 406 | | | | 1,049 | |
| Sub-total | | | 2,494 | | | | 2,658 | | | | 3,525 | | | | 8,676 | |
| Pandemic & Recovery Contingencies | | | 3,250 | | | | 1,000 | | | | 300 | | | | 4,550 | |
| Total | | | 5,744 | | | | 3,658 | | | | 3,825 | | | | 13,226 | |
Note: Table may not sum due to rounding
In addition, the Pandemic and Recovery Contingencies will help ensure government is well positioned to support people and businesses through any unanticipated urgent health or targeted recovery measures, with unallocated funding being directed to reduce the operating deficit. Notional allocations for 2021/22 Pandemic and Recovery Contingencies are shown in Table 1.2.2.
Table 1.2.2 Pandemic and Recovery Contingencies Allocations for 2021/22
| Category | | Notional
Allocation* | | Measures |
| Health and Safety | | $900 million | | Health-related COVID-19 management |
Supports for Businesses and People | | $265 million | | Temporary housing, meals and supports for vulnerable populations |
| $225 million | | Essential services including justice services, child care safety grants, agriculture/food security and potential increased demand for income assistance |
| $195 million | | Small and Medium Sized Business Recovery Grant Program |
| $120 million | | Tourism and art sector supports |
| $150 million | | Increased Employment Incentive tax credit |
| $100 million | | B.C. Recovery Benefit |
| Preparing for Recovery | | $100 million | | Skills training and youth employment initiatives |
| $100 million | | Community infrastructure programs, BC 150 Community Grants and CleanBC recovery investments |
| Unallocated | | $1.1 billion | | Reserve for unanticipated urgent health or recovery measures |
| Total | | $3.25 billion | | |
*Notional allocations are based on current forecasts, with any changes communicated in Quarterly Reports.
Budget and Fiscal Plan - 2021/22 to 2023/24
7
Three Year Fiscal Plan
Protecting the Health and Safety of British Columbians
Government’s top priority in responding to the pandemic is to protect the health and safety of British Columbians. Budget 2021 continues to prioritize health and safety by providing significant new investments to build capacity in the health sector and continue measures that support the safety of health care workers, long-term care residents and patients, and other targeted supports to seniors. The Province is also making historic investments to address the opioid crisis and improve mental health and addictions services.
Strengthening the Health Care for People
Budget 2021 includes significant new investments in the health care system of $2.6 billion in base budget funding over the fiscal plan period, bringing total annual health spending to over $25.4 billion by 2023/24 as shown in Chart 1.1.1. This includes $253 million over three years to continue to expand team-based and urgent primary care that provides British Columbians with faster access to doctors and nurse practitioners. The three-year fiscal plan also provides $300 million more to address growing demand for cancer care, PharmaCare and services under the Medical Services Plan. It also provides $495 million over the fiscal plan to continue to fund the successful strategy to reduce diagnostic imaging and surgery backlogs exacerbated by the pandemic. This new permanent funding is expected to further reduce wait times for British Columbians to improve patient experiences and outcomes.
Chart 1.1.1 Investing in People’s Health and Mental Health*
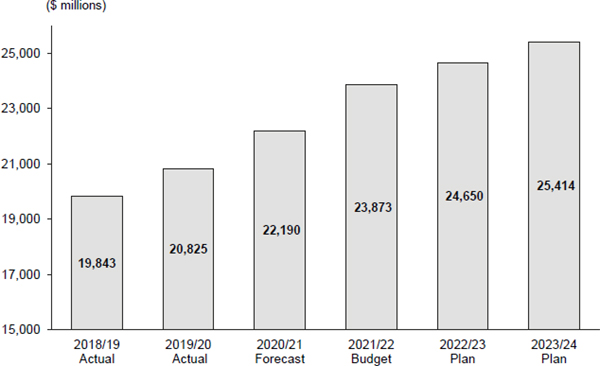
* Does not include time-limited funding initiatives related to pandemic response and economic recovery.
The Province has allocated an additional $900 million for 2021/22 from the Pandemic and Recovery Contingencies for health-related needs as the health sector continues to manage the effects of the pandemic. This will support the Province’s vaccine deployment, increased personal protective equipment, and screening services across multiple health facilities.
Budget and Fiscal Plan - 2021/22 to 2023/24
8
Three Year Fiscal Plan
Funding will also be used to maintain a number of newly implemented health strategies such as the Hospital-at-Home program which allows British Columbians to receive health services outside of a hospital, and the Rural and Remote Collaborative Framework to better connect remote Indigenous and non-Indigenous communities to critical health care services.
Budget 2021 also responds to the recommendations of the In Plain Sight report by providing $45 million over three years of new funding for First Nations cultural safety and humility training and Indigenous liaisons within each regional health authority. These investments will help to address systemic racism in the health care system through training and education and by prioritizing the hiring of a health care workforce that better represents the diverse communities it serves.
In addition to new operating investments, Budget 2021 funds significant capital investments for major hospital projects including the New Surrey Hospital and Cancer Centre project. These are detailed in the capital section starting on page 50.
Improving Health Services for Seniors
As part of the health care priority investments, the Province is committed to providing seniors with better access and services. This includes funding to support seniors to access more health services from home that continues to improve safety and quality of services in long-term and assisted living facilities.
Helping seniors stay at home longer improves the patient experience and reduces demands on other acute forms of care. Budget 2021 invests $12 million over the fiscal plan for the Home Health Monitoring Initiative which supports patients with moderate to highly complex chronic and episodic health conditions to self-manage their health from the comfort of their homes, using blue-tooth-enabled devices that communicate blood pressure and other health indicators to monitoring nurses in their local health authority. In addition, $68 million over three years will increase the number of care aides and other community care providers to deliver better home care and to help seniors with daily living.
As part of the Province’s continued safety measures, B.C. will continue to maintain the single site health facility orders and enhanced screening at long-term and assisted living facilities. Government is also building on its recruitment campaign launched last year in response to the COVID-19 pandemic. In doing so, Budget 2021 provides permanent funding to support the Province’s commitment to grow the workforce that will support B.C.’s aging population. This includes an investment of $585 million over the fiscal plan period for the Health Career Access Program that will recruit, train, and employ up to 3,000 health care workers over the next three years. This will introduce more health care support workers into long-term care homes and assisted living facilities across the province.
Investing in Mental Health and Responding to the Overdose Crisis
The COVID-19 pandemic has highlighted the importance of mental health, including the challenges faced by youth, as well as the damaging impacts of the ongoing overdose crisis. Budget 2021 provides the largest investment in mental health and addictions services in B.C. history with $500 million in new funding across the fiscal plan. This funding supports progress on B.C.’s mental health and addictions strategy, A Pathway to Hope, which provides a roadmap to enhancing and improving mental
Budget and Fiscal Plan - 2021/22 to 2023/24
9
Three Year Fiscal Plan
health and addictions services. This includes targeted supports for children and youth, improved quality and access to mental health services, and prevention, treatment and emergency response to the overdose crisis.
Improved Wellness for Children, Youth and Young Adults
Government is investing $97 million to provide targeted mental health supports for children, youth and young adults in recognition of the critical importance of early diagnosis, intervention and supports. Funding will support the Mental Health in Schools program, as well as expand the number of integrated child and youth teams from five to 20 teams across B.C. by 2023/24 to support more school and community-based, multidisciplinary mental health and substance use services. The goal of these teams is to provide quicker, more direct support to students with coordinated responses so that youth do not have to retell their issues or stories to multiple people, which may cause more trauma.
Budget 2021 also provides funding to support and expand the number of Foundry Centres to 23 by 2023/24. Foundry currently has 11 locations and virtual service offerings that provide health and wellness resources and services for young people ages 12 to 24. Funding will support a full suite of treatment and recovery services for youth experiencing substance use issues as well as other more intensive supports for children and youth with severe mental health or substance-use conditions.
Improved Access & Better Quality Mental Health Services
To improve the access and quality of mental health services, Budget 2021 will invest $75 million in new funding over three years. This includes $14 million for the First Nations Health Authority to deliver targeted mental health and addictions services to Indigenous peoples throughout B.C. There is also $8 million over three years in new funding to expand eating disorder care at each of the health authorities and to maintain suicide prevention services that were implemented in response to COVID-19. The budget also provides $53 million across the fiscal plan to expand the early psychosis intervention program to be accessible across the province. The program supports early identification, diagnosis and treatment of psychosis to maximize the likelihood that intervention will successfully reduce the burden of suffering and improve daily functioning.
Substance Use and Overdose Emergency Response
Budget 2021 provides $330 million over the fiscal plan to provide a full spectrum of treatment and recovery services for individuals experiencing issues with substance use. This includes $152 million for opioid treatment. Overdose prevention supports implemented in response to the pandemic will become permanent programs through Budget 2021. This means continued operation of new supervised consumption sites, Assertive Community Treatment teams, the Lifeguard App, consultative services for health care professionals providing substance use treatment, and additional nursing supports.
Other substance-use services include end-to-end services from initial sobering and assessment and withdrawal management services, through to supporting an individual transition back into daily life. Funding will support the creation of 195 new substance-use treatment and recovery beds throughout B.C. for all types of substance use. New beds will be supported by new outpatient, peer supports and community-based support services throughout the province.
Budget and Fiscal Plan - 2021/22 to 2023/24
10
Three Year Fiscal Plan
Table 1.2.3 Investments for Mental Health and Addictions Services
| ($ millions) | | 2021/22 | | 2022/23 | | 2023/24 | | Total | |
| Opioid use disorder treatment | | 51 | | 51 | | 51 | | 152 | |
| Treatment and recovery services | | 38 | | 45 | | 50 | | 133 | |
| Overdose prevention | | 15 | | 15 | | 15 | | 45 | |
| Mental health supports for children and youth | | 26 | | 31 | | 40 | | 97 | |
| Eating disorder care and suicide prevention | | 2 | | 2 | | 3 | | 8 | |
| Early psychosis intervention | | 10 | | 18 | | 25 | | 53 | |
| First Nations Health Authority | | 5 | | 5 | | 5 | | 14 | |
| Total | | 146 | | 165 | | 189 | | 500 | |
| | | | | | | | | | |
| Note: Table may not sum due to rounding | |
Supports for People and Businesses
Government continues to focus on putting people first by delivering the services people rely on and working to make life more affordable for everyone. Through Budget 2021, the Province is making significant new investments to reduce poverty, advance child care, make life more affordable, advance meaningful reconciliation with Indigenous peoples, and invest in the services people count on. In addition, government continues to provide relief and recovery supports for B.C. businesses to support them through the pandemic and better prepare them for the post-pandemic recovery. This includes ongoing business relief and recovery measures implemented through the StrongerBC Economic Recovery Plan, such as business recovery grants, tax incentives to encourage business hiring and/or employee wage increases, and PST rebates on machinery and equipment. It also provides targeted supports for farmers and the agriculture sector to build resilience in local food security. The budget also allocates new funding to support the tourism sector during the pandemic and when it is safe to welcome visitors back to B.C.
Reducing Poverty and Helping Those Most in Need
In 2019, the Province introduced TogetherBC, B.C.’s first poverty reduction strategy. The strategy aims to lift people out of poverty and create a more diverse, equitable and prosperous province. Poverty reduction has been a key government priority, with significant investments to help lift British Columbians and, in particular, children out of poverty. Recent examples include:
| • | the Child Care Fee Reduction Initiative and Affordable Child Care Benefit that were introduced in 2018 to make child-care more affordable; |
| • | the new B.C. Child Opportunity Benefit implemented on October 1, 2020, that provides a monthly, tax-free benefit of up to $1,600 per year for the first child for low and middle-income families with children under the age of 18; and |
| • | three increases to the minimum wage since 2017, with another planned increase on June 1, 2021, to $15.20 per hour. |
Income and Disability Assistance Enhancements
Budget 2021 continues to invest in poverty reduction initiatives by providing $1.6 billion over the fiscal plan to increase supports and address demand for income and disability assistance. Building on previous rate increases of $100 a month in September 2017 and
Budget and Fiscal Plan - 2021/22 to 2023/24
11
Three Year Fiscal Plan
$50 a month in April 2019, Budget 2021 provides a $175 per month increase for income and disability assistance rates — the largest ever permanent increase. Since April 2017, the monthly rate for a single person on income assistance has increased by 53 per cent and for a single person on disability assistance by 38 per cent. Over 240,000 people, including 49,000 children will directly benefit from this rate increase. This means B.C. has the highest income assistance rates in Canada, and the third highest disability assistance rates.
Budget 2021 will also increase the Senior’s Supplement by $50 — the first increase since it was introduced in 1987. This increase will benefit up to 80,000 low-income seniors, including 20,000 more seniors who will become eligible for the supplement because of the increase. The Province is also increasing the comforts allowance for people on income assistance, a supplement that allows people on assistance living in a special care facility (such as community care centre or assisted living facility) to buy basic personal items such as hygiene products. The $20 per month increase is the first increase to the comforts allowance for income assistance clients since 2005.
Supports for Individuals Experiencing Homelessness
The COVID-19 pandemic has increased the prevalence, risks and visibility of homelessness around the province. Government responded quickly by committing $162 million in 2020/21 to lease spaces at hotels, motels and community centres to provide temporary shelters and meal supports, and to connect those experiencing homelessness with other services. Government is continuing to address homelessness by allocating $265 million in 2021/22 from the Pandemic and Recovery Contingencies to extend supports and services for people experiencing or at risk of homelessness. There is an additional $30 million over the fiscal plan for ongoing housing support costs associated with recent hotel purchases that are providing 400 units of temporary shelter.
The Pandemic and Recovery Contingencies allocation includes funding to help maintain more than 3,000 temporary emergency shelter and hotel spaces that have been secured during the pandemic to provide temporary shelter and accommodations. Funding also extends the additional 650 urgent shelter spaces, rent supplements, and supportive housing sites used to support recent decampments efforts in Vancouver and Victoria, with on-site health and other supports. Supports include meals, support staff, security as well as personal protective equipment to help service operators maintain safe and healthy shelters and housing.
The Province is also maintaining outreach services to connect homeless and vulnerable populations with resources and available programs. New Budget 2021 funding will create 388 new permanent shelter spaces in communities throughout the province. Shelters provide a warm, dry place for individuals to sleep, but just as importantly offer meal services, showers, laundry, access to social workers, referrals to community services and harm reduction services.
In addition to continued investments in the Homes for B.C. Supportive Housing Fund, the Province is partnering with the federal government through the Rapid Housing Initiative to convert existing buildings into supportive housing, and to support development of modular housing to expedite housing solutions for homeless or other vulnerable populations. These collaborative, long-term initiatives will support B.C. in increasing capacity to respond to and reduce homelessness and improve people’s lives.
Budget and Fiscal Plan - 2021/22 to 2023/24
12
Three Year Fiscal Plan
Affordable, Accessible and High-Quality Child Care
Since Budget 2018, government has been creating affordable, accessible, and high-quality child care throughout B.C. Investments over the past three years have funded over 26,000 new child care spaces, provided more than 35,000 families with low-cost child care, and provided $2 per hour wage increases for over 11,000 registered Early Childhood Educators. It has also reduced fees by up to $350 per month per child for over 69,000 child care spaces through the Child Care Fee Reduction Initiative, and supported an estimated 63,000 children from low- and middle-income families to receive up to $1,250/month per child through the Affordable Child Care Benefit.
The pandemic underscored the vital importance of child care to families — especially women — to participate in the workforce. As part of the Province’s COVID-19 Action Plan, government provided over $300 million in 2020/21 for temporary emergency funding for child care providers to remain open for front-line workers, and to ensure those that closed temporarily were poised to reopen again to support parents in returning to the work place. Further investments of $99 million through the StrongerBC Economic Recovery Plan provided child care providers with health and safety grants and contributed to recovery efforts by accelerating the creation of over 3,200 more new spaces as part of the 26,000 spaces funded to date. This will help more child care businesses to open, help more parents get back to work, and help to build strong, local economies that benefit everyone in the community.
As part of the Pandemic and Recovery Contingencies, government has allocated a further $20 million in 2021/22 to provide more health and safety grants to child care providers for increased cleaning supplies, personal protective equipment, or space enhancements to ensure child care centres remain safe.
In addition to the approximate 2,500 - 3,000 new spaces that will be created per year under the New Spaces Fund, Budget 2021 advances the ChildcareBC strategy by investing $233 million more over the fiscal plan to create more new spaces and continue to make child care more affordable. This brings the total child care budget to nearly $2.3 billion over the fiscal plan, as shown in Chart 1.1.2.
New investments include $20 million over three years to add 400 more spaces to the Aboriginal Head Start program that provides no-fee, culturally-based child care for Indigenous families. In addition, approximately 2,000 more families will be able to access Supported Child Development and Aboriginal Supported Child Development programs. Children who are already enrolled in these programs will receive additional hours of support.
Budget 2021 also includes $111 million over the fiscal plan to expand the Province’s low-to no-cost child care program, which provides child care for no more than $10 per day, regardless of a parent’s income. This will give families access to 3,750 new low-cost child care spaces throughout the province through 75 additional ChildcareBC Universal Prototype Sites.
Early childhood educators (ECEs) are not only the heart of the child care system — they are the workforce behind the workforce. Government recognizes the importance of continuing to invest in ECEs throughout the province, both to recruit them into the child care sector and to support them to stay. Budget 2021 improves access to ECE training by adding 110 more post-secondary seats in B.C. and provides $94 million over the plan to double the current ECE wage enhancement to a $4 an hour increase. This will benefit about 11,000 ECEs who are working in child care centres throughout
Budget and Fiscal Plan - 2021/22 to 2023/24
13
Three Year Fiscal Plan
Chart 1.1.2 Child Care Programs*
* Does not include time-limited funding initiatives related to pandemic response and economic recovery.
the province to support recruitment and retention of a stable, qualified, and skilled workforce.
Bringing child care and education together is one step in government’s long-term vision to create a universal, inclusive early care and learning system in B.C. that will better support families and inspire lifelong learning in children. Budget 2021 will expand the Seamless Day Pilot under the Ministry of Education which will benefit families in accessing more child care on school grounds. The pilot will expand to 20 additional school districts — on top of the four that are currently participating — and will integrate school-age care programs into kindergarten and Grade 1 classrooms. These steps will support the work that is ahead for the Province as it continues to engage with partners from the child care and education sector, including Indigenous-led child care providers, to continue to build an inclusive early care and learning system to move British Columbia even further along the path to universal child care.
Making Life More Affordable
Building B.C. and Affordable Housing
Budget 2021 continues to fund the Homes for B.C. plan, a key government priority to deliver 114,000 affordable homes over 10 years to improve market supply and provide more housing options for growing families, seniors, women and children fleeing violence, students and Indigenous peoples. Budget 2021 provides $80 million across the fiscal plan to continue to support B.C.’s housing strategy, which includes the improvement of rental and housing opportunities through continued partnerships with all levels of government, Indigenous peoples, non-profits and the private sector. This brings the total housing operating budget to over $1.1 billion annually over the fiscal plan as shown in Chart 1.1.3. As of February 28, 2021, over 26,000 new homes have been completed or are underway since the Homes for B.C. plan was launched in 2018.
Budget and Fiscal Plan - 2021/22 to 2023/24
14
Three Year Fiscal Plan
Chart 1.1.3 Investments in Housing Affordability and Homelessness Supports*

* Does not include time-limited funding initiatives related to pandemic response and economic recovery.
Over the course of the fiscal plan, the Province intends to fund the building of more than 10,000 new low- and middle-income housing units through grant funding to non-profit housing providers and $1.6 billion in capital investments. Additionally, government will provide up to $2 billion in low-cost financing to expand the HousingHub program which will work with a variety of partners to facilitate the creation of approximately 9,000 units of affordable rental housing and homeownership options for middle-income British Columbians over the next three to five years. This builds on the approximately 1,000 completed homes through previous HousingHub projects. Through these varied strategies, B.C. continues to take action towards its goal of a province where everyone has opportunities to access a secure, safe and affordable home.
Free Transit for Youth
The Province is allocating $26 million to help families get around more affordably by making transit free for children aged 12 and under. This includes investments from the 2020/21 federal-provincial Safe Restart Agreement for transit and new Budget 2021 funding. Free transit for children supports the Province’s poverty reduction strategy, improves affordability and promotes greener transportation options through public transit for families. The first phase of the initiative will be launched in September 2021 with free transit for children aged 12 and under on all BC Transit and TransLink transportation including buses, SkyTrain, Canada Line, SeaBus, West Coast Express and HandyDART. This will improve affordability for families by reducing the cost of transit. For example, it is estimated that families with children and youth in the TransLink service area who access monthly passes will save up to $672 per year per child.
Overall, this program will enable approximately 340,000 children across the province to access transit for free effective September 2021. This will improve equitable access to transportation, especially for lower income and Indigenous families that tend to be more reliant on public transit. It will also help to rebuild transit ridership, and attract new family ridership and future public commuters which supports the Province’s CleanBC emissions reduction goals.
Budget and Fiscal Plan - 2021/22 to 2023/24
15
Three Year Fiscal Plan
B.C. Recovery Benefit
Budget 2021 allocates $100 million to continue to fund the B.C. Recovery Benefit, which launched in December 2020 and remains open for new applications until June 30, 2021. The B.C. Recovery Benefit provides a one-time, tax-free payment of up to $1,000 for eligible families and single parents and up to $500 for eligible individuals. The benefit is provided on a sliding scale and phases out at a net income of $175,000 for families and single parents; and at $87,500 for individuals. The benefit provides financial relief to middle and lower-income British Columbians while helping to stimulate the economy. The overall program is forecasted to cost $1.4 billion based on year-to-date uptake, with $1.3 billion forecasted for 2020/21 and $100 million anticipated for 2021/22 (with additional Pandemic and Recovery Contingencies available should uptake in 2021/22 exceed the forecasted allocation). As of February 28, 2021, nearly 1.7 million applications have been approved, benefiting over 2.3 million British Columbians.
Reconciliation with Indigenous Peoples
A strong and sustainable economy that works for everyone means moving forward together through true and lasting reconciliation with Indigenous peoples. The Declaration on the Rights of Indigenous Peoples Act (Declaration Act) recognizes and respects the human rights of Indigenous peoples and ensures they are involved in decisions that affect them and their territories. Budget 2021 includes $60 million annually in base budget funding to support a range of activities, including engagement with Indigenous peoples on legislation, policy, and programs; negotiation capacity; and initiatives that increase participation in land and resource activities within their territories. The Province has also allocated $17 million over three years to support the implementation of the Declaration Act and government’s commitments under existing reconciliation agreements, including land transfers.
Budget 2021 also supports reconciliation through a range of new investments that support the health and well-being of Indigenous peoples and communities. This includes new funding for culturally based child care through the Aboriginal Head Start program, skills training initiatives for Indigenous people, culturally safe access to health services and mental health and addictions treatment, and for other priority initiatives as discussed throughout this document.
Table 1.2.4 Investments to Support Reconciliation
| ($ millions) | | 2021/22 | | | 2022/23 | | | 2023/24 | | | Total | |
| Indigenous Funding Program | | | 60 | | | | 60 | | | | 60 | | | | 180 | |
| Implementation resources | | | 6 | | | | 6 | | | | 6 | | | | 17 | |
| Health sector - First Nations cultural safety and humility training and Indigenous liaisons | | | 15 | | | | 15 | | | | 15 | | | | 45 | |
| First Nations Health Authority - culturally based mental health and addictions services | | | 5 | | | | 5 | | | | 5 | | | | 14 | |
| Aboriginal Head Start Program - culturally based child care for Indigenous families | | | 7 | | | | 7 | | | | 7 | | | | 20 | |
| Skills training initiatives for Indigenous peoples* | | | 17 | | | | — | | | | — | | | | 17 | |
| Total | | | 110 | | | | 93 | | | | 93 | | | | 293 | |
Note: Table may not sum due to rounding
*Pandemic and Recovery Contingencies allocation
Budget and Fiscal Plan - 2021/22 to 2023/24
16
Three Year Fiscal Plan
Investing in the Services British Columbians Count On
K-12 Education
The Province will invest $1.2 billion over the fiscal plan to support the growing number of students accessing B.C.’s K-12 education system and to support wage increases for teachers and support staff under the Sustainable Services Negotiating Mandate. Funding will also support the growing number of special needs students, English/French language learners, and Indigenous learners in both public and independent schools. In addition, Budget 2021 supports the K-12 education sector with new funding to improve access to mental health supports in schools, to expand early learning and onsite child care opportunities, and to develop a framework to address racism and reconciliation. This brings the total annual budget for the K-12 education sector to over $7.1 billion per year as shown in Chart 1.1.4. In addition, the fiscal plan includes approximately $3.5 billion for capital investments to expand, replace, maintain or renovate schools throughout B.C. as further discussed on page 47.
Chart 1.1.4 Investing in K-12 Education*

* Does not include time-limited funding initiatives related to pandemic response and economic recovery.
Improving the Lives of Families, Children and Youth
Budget 2021 provides $85 million over the fiscal plan to support family, children and youth services. This includes additional funding to support children in ministry care or with Delegated Aboriginal Agencies. The budget also supports programs for children living with a disability, and provides more funding for medical equipment and services for children that are deaf or hard of hearing. This also includes $41 million to support alternatives to care arrangements by reuniting families, promoting adoption, and other permanent transfer of custody options. These investments support government’s overall strategy to reduce the number of children in care and, where appropriate, keep families
Budget and Fiscal Plan - 2021/22 to 2023/24
17
Three Year Fiscal Plan
together to improve outcomes for children. In particular, this supports a government priority of improving Indigenous child welfare outcomes by keeping children and youth safely at home and connected to community and culture. This helps to ensure a diversity of Indigenous voices, history and practices are reflected in child services in collaboration with Delegated Aboriginal Agencies and Indigenous communities.
Social Services and Supports for Adults with Developmental Disabilities
Community Living BC provides supports and services to over 24,000 adults with developmental disabilities and their families. This includes contracted services to support community inclusion programs, respite for families, residential and employment supports, and other connections to community. The Province is providing $367 million in new funding to Community Living BC over three years. This will support approximately 1,300 more clients each year, while addressing staffing and operational costs for service providers, including wage enhancements under the Sustainable Services Negotiating Mandate, to ensure Community Living BC can continue to deliver the services people count on.
Timely and Equitable Access to Justice
The Province is providing $132 million more over three years to support a justice system that serves all British Columbians. This includes funding to support courts, family dispute resolution, legal clinics, parent legal centres and family maintenance enforcement services as well as sector wage enhancements under the Sustainable Services Negotiating Mandate. These services support timely and equitable access to justice, particularly for women, visible minorities, single parents, refugee claimants, Indigenous peoples, those with low incomes or who live in poverty, and members of the LGBTQ2S+ community who tend to have greater unmet legal needs.
Justice sector funding includes $16 million over three years to support the Province’s court modernization strategy. An additional $24 million in one-time funding from the Pandemic and Recovery Contingencies is allocated in 2021/22 to augment these efforts. This funding will support the safe operations of courts during the pandemic, including increased cleaning and personal protective equipment, as well as virtualization, electronic filing solutions and other system enhancements. These measures have province-wide benefits, including fewer cases being directed to the courts. In addition, those living in rural or remote communities benefit by saving hours of travel time. Modernization also provides safe alternatives through virtual delivery of witness and victim statements.
Maintaining Public Safety
The Province is adding $73 million over the fiscal plan to support public safety services. This includes funding to support policing and security, initiatives under the Gang Suppression Action Plan, the BC Coroners Service, the Office of the Fire Commissioner, road safety programs, and sector wage enhancements under the Sustainable Services Negotiating Mandate. Funding will help to address added staffing needs for front-line RCMP officers in rural communities to address increased investigative complexity and co-ordinated responses for emergencies such as floods, wildfires, and the ongoing health emergencies of COVID-19 and the opioid crisis.
Budget and Fiscal Plan - 2021/22 to 2023/24
18
Three Year Fiscal Plan
Table 1.2.5 Investments in Justice and Public Safety Services
| ($ millions) | | 2021/22 | | | 2022/23 | | | 2023/24 | | | Total | |
| Courts modernization | | | 5 | | | | 5 | | | | 5 | | | | 16 | |
| Courts and tribunal services | | | 15 | | | | 15 | | | | 15 | | | | 45 | |
| Justice supports (e.g. Parent legal centres) | | | 4 | | | | 4 | | | | 6 | | | | 14 | |
| Public safety and crime prevention programs | | | 5 | | | | 5 | | | | 5 | | | | 14 | |
| Policing services | | | 12 | | | | 12 | | | | 12 | | | | 37 | |
| Sustainable Services Negotiating Mandate | | | 25 | | | | 28 | | | | 28 | | | | 80 | |
| | | | | | | | | | | | | | | | | |
| Total | | | 66 | | | | 69 | | | | 71 | | | | 206 | |
Note: Table may not sum due to rounding
Support for B.C. Businesses
The fall 2020 StrongerBC Economic Recovery Plan is a key step in continuing to support business recovery over the coming year. Funding in 2020/21 included $44 million for digital marketing training and the Launch Online program which has supported thousands of B.C. businesses to create or improve their e-commerce presence through contracts with B.C. technology companies. It also included $7.5 million for B.C. agri-tech companies and $6 million in supply chain grants to strengthen B.C.’s supply chain, and a further $10 million to support small- and medium-sized manufacturing businesses commercialize new technologies and/or products and improve market access (see page 119 for complete listing of measures).
Budget 2021 provides ongoing funding for StrongerBC initiatives, including allocating $195 million in 2021/22 to continue the Small and Medium Sized Business Recovery Grant Program. The program has been updated with streamlined access and expanded eligibility to ensure more businesses can access up to $30,000 in provincial grant funding that can be used to support their recovery and adapt to COVID-19. This may include diversifying their business to include new services, modifying physical space, offsetting fixed costs such as rent, or growing the business by moving online. Tourism-related businesses (which may include transportation, accommodation, food and beverage and recreation organizations) can receive an additional top-up of $15,000. In total, the budget for the program remains $345 million, as committed by the Province in the fall.
Budget 2021 also allocates $150 million to support the Increased Employment Incentive tax credit for private sector employers as announced as part of the StrongerBC Economic Recovery Plan. This program provides a tax credit to businesses that increased their payroll through hiring or compensation increases in the last quarter of 2020 compared to the previous quarter. Other continuing StrongerBC business supports include a PST exemption on select equipment and machinery until the end of September 2021 to support businesses to pivot or upgrade operations. This is estimated to save businesses $470 million over the tax exemption period. Government has also permanently allowed restaurants, bars and tourism operators with liquor licenses to purchase beer, wine and spirits at the wholesale price, providing over $70 million per year in support for the industry. This measure helps alleviate financial pressures and provides more cost certainty for the hospitality sector to support recovery and to help the estimated 190,000 British Columbians who work in the sector.
Budget and Fiscal Plan - 2021/22 to 2023/24
19
Table 1.2.6 Ongoing Business Supports from the Fall StrongerBC Economic Recovery Plan
| ($ millions) | | 2020/21 Forecast | | | 2021/22 | | | Total | |
| Spending Measures | | | | | | | | | | | | |
| Small and Medium Sized Business Recovery Grant* | | | 150 | | | | 195 | | | | 345 | |
| Increased Employment Incentive tax credit* | | | 40 | | | | 150 | | | | 190 | |
| Farmer supports to access labour* | | | 25 | | | | 35 | | | | 60 | |
| Tourism sector supports* | | | 73 | | | | 120 | | | | 193 | |
| Sub-total | | | 288 | | | | 500 | | | | 788 | |
| | | | | | | | | | | | | |
| Other Business Supports | | | | | | | | | | | | |
| PST Exemptions on select machinery and equipment | | | 235 | | | | 235 | | | | 470 | |
| Wholesale pricing for hospitality licensees** | | | 31 | | | | 71 | | | | 102 | |
| Sub-total | | | 266 | | | | 306 | | | | 572 | |
| | | | | | | | | | | | | |
| Total | | | 554 | | | | 806 | | | | 1,360 | |
Note: Table may not sum due to rounding
*Pandemic and Recovery Contingencies allocations
**Permanent measure
Support for Farmers and the Agriculture Sector
Budget 2021 invests $10 million over the fiscal plan to expand the Grow BC, Feed BC, Buy BC strategy launched in 2018 to strengthen B.C.’s agrifood and seafood sector and expand the domestic market for B.C. food and beverage products. Grow BC helps young farmers access land, and supports fruit and nut growers and processors to expand local food production; Feed BC increases the use of B.C.-grown and processed foods in hospitals, schools, and other government facilities; and Buy BC helps local producers and processors market their products by re-establishing a strong, recognizable Buy BC brand and supporting industry-led Buy BC marketing activities. This funding is in addition to the $7 million provided as part of the StrongerBC Economic Recovery Plan to expand the B.C. food hub network and support farm innovation and food processing.
The Province has also allocated $35 million in 2021/22 to continue to support B.C. farmers in safely accessing and accommodating temporary foreign workers to support crop harvesting. This includes providing hotel-based quarantine services for foreign workers to meet COVID-19 related-health orders to minimize risks of on-farm outbreaks and maintain B.C.’s critically important local food supply.
Tourism and Arts Sector Supports
Tourism is a valuable component of the B.C. economy as one of the largest employers and a generator of small businesses; however, it remains one of the hardest-hit sectors from the pandemic which has disproportionately affected women, youth, part-time workers, immigrants and Indigenous peoples who make up a greater proportion of the tourism workforce compared to the overall labour force. Through the fall 2020 StrongerBC Economic Recovery Plan, government dedicated $100 million of the Small and Medium Sized Business Recovery Grant program specifically to tourism operators, which continues into 2021. In addition, over $70 million was provided in other tourism relief and recovery measures which included grants for Indigenous-owned tourism businesses and investments to help small municipalities build, adapt, and diversify their tourism infrastructure such as trails construction, visitor centre improvements and safety upgrades to amenities. It also included funding to Destination BC to market B.C. domestically and secure its spot in the international tourism market for when it is safe to welcome visitors back to the province.
Budget and Fiscal Plan - 2021/22 to 2023/24
20
Three Year Fiscal Plan
Budget 2021 builds on these investments by allocating $120 million in 2021/22 from the Pandemic and Recovery Contingencies for further tourism recovery and to support B.C. in remaining a globally competitive destination. This includes $20 million in recovery funding for more community destination development grants to enhance tourism infrastructure, such as rail trails, rest stops, and airport improvements. This funding doubles the StrongerBC investment to help create short-term jobs while also increasing the future capacity of tourism destinations.
Government will also continue to work with business and tourism stakeholders, as well as health officials, to ensure B.C.’s tourism sector is poised to welcome the world back in the near future. Government has reserved $100 million to support tourism recovery, including support for major anchor attractions. Anchor attractions are vital in drawing visitors into B.C. communities, stimulating local economies and creating experiences that connect visitors to people, place and culture. These initiatives will contribute to government’s broader strategy to support destination development and anchor attractions in future years. Other supports will help promote domestic and international travel when restrictions are lifted to help revitalize businesses and the tourism workforce.
Budget 2021 is also doubling the budget for the Arts Infrastructure Program by providing $6 million over three years to support recovery to arts and culture organizations. This program will provide increased grants of up to $250,000 to arts and culture organizations to support capital improvement projects, such as the purchase or construction of new spaces and the expansion of existing spaces. It also provides funding for specialized equipment, such as accessibility improvements and sound systems. This new funding builds on the $35 million in Arts and Culture Resiliency funding provided in 2020/21 as part of the StrongerBC Economic Recovery Plan that provided financial relief and grants to artists and arts and culture organizations.
Preparing for Recovery
The pandemic has already begun to reshape the future economy, and the Province will continue to work with businesses, workers, economists and Indigenous and community leaders to ensure a strong and sustainable recovery. Budget 2021 continues to prepare for recovery by investing over $1 billion over the fiscal plan, including $200 million allocated from the Pandemic and Recovery Contingencies to support training, job creation, CleanBC recovery investments and supports for communities.
Targeted Training & Job Creation
Post-Secondary Education and Skills Training
Investments in post-secondary education and training opportunities are a critical part of B.C.’s recovery strategy, which helps train or re-train people to secure good-paying jobs and strengthen B.C.’s labour force. Budget 2021 provides $649 million over three years to support the post-secondary education sector, including sector wage increases under the Sustainable Services Negotiating Mandate. Funding also includes $96 million over three years to support the health sector’s longer-term human resource needs while supporting people to find rewarding careers in health. This funding will help thousands of people transition to jobs in the health care system, while supporting job recovery and addressing the province’s future workforce needs.
Budget and Fiscal Plan - 2021/22 to 2023/24
21
Three Year Fiscal Plan
Budget 2021 also provides an additional $32 million in one-time funding to continue training initiated through the StrongerBC Economic Recovery Plan. This includes $17 million in 2021/22 to support skills training for Indigenous people, which builds on the $19 million provided in 2020/21. This will help support 1,250 Indigenous people to gain new skills, transfer their training knowledge to other jobs, and participate in the labour market while contributing to economic recovery and resiliency in their communities. Funding is allocated to 266 Indigenous communities and organizations (203 First Nations, 38 Métis Chartered Communities, and 25 Aboriginal Friendship Centres) around the province where Indigenous communities have the flexibility to determine priority training needs.
The Province is allocating $5 million in 2021/22, on top of the $4 million invested in 2020/21, to support micro-credential training in B.C., which provides options for those looking to retrain for new career opportunities. Micro-credentials are formally recognized learning experiences that offer learners the ability to gain skills and competencies through shorter, more flexible programs rather than a standard degree, diploma or certification program. Initial funding is being used to deliver 25 micro-credential courses for an estimated 2,000 students. The new funding will be used to develop an additional 30 courses. The flexibility of micro-credential programs will improve accessibility to post-secondary education, particularly for women, Indigenous peoples, people with disabilities and people with multiple barriers who struggle with the financial, time or physical ability requirements associated with taking a full program.
Budget 2021 allocates $6 million in 2021/22 to support work-integrated learning placements for 3,000 students, whose unemployment rate has been disproportionately affected by the pandemic. Funding will allow post-secondary institutions to work with employers to connect them with students and support with the recruitment process, such as job postings and managing interviews, as well as helping to improve employer awareness of federal and provincial wage subsidy programs.
There is also $4 million allocated in 2021/22 to continue short-term skills training programs to support unemployed or underemployed individuals to train in high demand sectors such as construction, technology, health care and child care to ensure graduating students are well positioned to secure employment. The Province will also continue partnering with the federal government on further skills training opportunities in the coming year.
Youth Employment Initiatives
Pandemic-related employment losses have been unequal, concentrated among lower-wage workers in high-contact services, where youth are over-represented. To provide targeted employment opportunities for youth, Budget 2021 allocates $36 million in 2021/22 Pandemic and Recovery Contingencies. This includes $15 million to expand the Innovator Skills Initiative program that provides up to $10,000 in funding for businesses to hire a post-secondary student, or non-student youth who has completed industry-approved certification or training, into a technology or tech-enabled position. This creates 3,000 job placements for youth in a high-opportunity sector with higher- than-average wages.
The Province is also providing $9 million to expand co-op positions in the natural resources sector to create employment opportunities that improve knowledge and data about the land base, create field work experience, and advance public education and public safety objectives. Budget 2021 also allocates $3 million for the Recreation Sites
Budget and Fiscal Plan - 2021/22 to 2023/24
22
Three Year Fiscal Plan
and Trails B.C. youth program which provides safe, quality recreation opportunities for the public by developing, maintaining, and managing the provincial network of sites and trails. This will create 72 new jobs that will help those hardest hit by the pandemic — including youth, women and Indigenous peoples — by providing high quality employment and training opportunities in rural and remote communities while restoring public outdoor recreation spaces.
B.C. Parks, the Conservation Officer Services and the Aquatic Invasive Species programs will also receive $4 million to support over 80 short-term youth employment opportunities. The youth employment program provides meaningful work opportunities to young people while helping them gain valuable skills, experiences, and insights into conservation and natural resource law enforcement careers in the public sector. This includes opportunities and experiences in conservation, recreation, community engagement, Indigenous relations, public outreach, wildlife safety, and education on aquatic invasive species.
Finally, $5 million is allocated in 2021/22 to extend the Clean Coast, Clean Waters program initiated as part of the StrongerBC Economic Recovery Plan to create jobs removing marine debris in coastal communities.
Table 1.2.7 2021/22 Investments to Support Recovery for People
| ($ millions) | | 2021/22 | |
| Skills Training Initiatives | | | | |
| Skills training for Indigenous peoples | | | 17 | |
| Micro-credential training | | | 5 | |
| Work-integrated learning | | | 6 | |
| Short-term skills training | | | 4 | |
| Sub-total | | | 32 | |
| | | | | |
| Youth Employment Initiatives | | | | |
| Innovator Skills Initiative | | | 15 | |
| Natural resources sector employment opportunities | | | 9 | |
| BC Parks, Conservation Officer Services and Aquatic Invasive Species youth programs | | | 4 | |
| Clean Coast, Clean Waters Program | | | 5 | |
| Recreation Sites and Trails BC Youth Employment Program | | | 3 | |
| Sub-total | | | 36 | |
| | | | | |
| Total | | | 68 | |
Note: Table may not sum due to rounding
CleanBC
B.C. continues to be a climate action leader with new investments totaling $506 million over the fiscal plan to support CleanBC. This includes $269 million in new operating and capital funding for clean transportation, energy efficient buildings and communities (as discussed in the Investing in Infrastructure to Support Recovery topic box on page 28), and other cleantech and climate change initiatives. It also includes $96 million more for the CleanBC Program for Industry in alignment with scheduled carbon tax increases, while adjusting for the delayed increase to the tax in April 2020 that provided relief to businesses and families from the pandemic. There is also an additional
Budget and Fiscal Plan - 2021/22 to 2023/24
23
Three Year Fiscal Plan
$120 million to continue the Climate Action Tax Credit in 2023/24. Budget 2021 also includes a new PST exemption on electric bikes, estimated to save British Columbians $7 million per year. These significant investments bring CleanBC allocations to nearly $2.2 billion since 2019/20.
These CleanBC investments are in addition to the Province’s other climate-related spending, including public transit projects such as the expansion of Vancouver’s Broadway Subway, energy-efficiency spending on public-sector buildings, the Innovative Clean Energy Fund, the First Nations Clean Energy Business Fund, and Forest Carbon Initiative, among others. Future Climate Change Accountability Reports will continue to report on actual expenditures.
Table 1.2.8 Investments for CleanBC (including Contingencies allocations)
| ($ millions) | | 2021/22 | | | 2022/23 | | | 2023/24 | | | Total | |
| New Operating Funding | | | | | | | | | | | | | | | | |
| Clean transportation | | | 93 | | | | 19 | | | | 10 | | | | 123 | |
| Energy efficient buildings and communities | | | 32 | | | | 20 | | | | 5 | | | | 57 | |
| Clean energy and Cleantech innovation | | | 60 | | | | — | | | | — | | | | 60 | |
| Climate preparedness and adaptation | | | 6 | | | | — | | | | — | | | | 6 | |
| Climate strategy resourcing | | | 2 | | | | 1 | | | | 1 | | | | 4 | |
| | | | | | | | | | | | | | | | | |
| New Capital Funding | | | | | | | | | | | | | | | | |
| Clean transportation | | | 3 | | | | 3 | | | | 1 | | | | 7 | |
| Carbon Neutral Capital Program | | | 6 | | | | 6 | | | | — | | | | 12 | |
| Subtotal | | | 202 | | | | 50 | | | | 17 | | | | 269 | |
| | | | | | | | | | | | | | | | | |
| Other Investments | | | | | | | | | | | | | | | | |
| Adjustment to CleanBC Program for Industry | | | (38 | ) | | | (40 | ) | | | 173 | | | | 96 | |
| Continuation of Climate Action Tax Credit | | | — | | | | — | | | | 120 | | | | 120 | |
| PST exemption on e-bikes | | | 7 | | | | 7 | | | | 7 | | | | 21 | |
| | | | | | | | | | | | | | | | | |
| Total | | | 171 | | | | 17 | | | | 317 | | | | 506 | |
Notes: Table may not sum due to rounding.
Cleaner Transportation
Budget 2021 provides $123 million in operating funding and $7 million in capital funding over three years to support cleaner transportation through financial incentives, greener infrastructure, technological advancements, and electrification of school buses, ferries, and government fleets. This includes $94 million over the fiscal plan to continue the Go Electric Program which provides financial rebates to customers who buy zero-emissions vehicles, charging stations, and funding to support commercialization of medium and heavy-duty vehicles. This funding is in addition to a new $40 million invested in 2020/21 to transition the existing incentives program to an income-tested model in 2021/22. This program directly supports B.C. in meeting its 2025 mandate to have at least 10 per cent of new light duty vehicles sold in B.C. be zero emissions vehicles. New funding of $18 million will provide grants to local governments to improve active transportation infrastructure, such as building connecting sidewalks, installing bike lanes, and building multi-use paths in parks. There is also $10 million over three years to develop policy on reducing the carbon intensity of fuel and develop the hydrogen economy.
Budget and Fiscal Plan - 2021/22 to 2023/24
24
Three Year Fiscal Plan
CleanBC Program for Industry
The CleanBC Program for Industry reduces emissions at industrial operations and drives innovation by directing a portion of the carbon taxes paid by industry into two streams:
| 1. | The CleanBC Industrial Incentive Program: provides incentives to large regulated industrial operations upon reducing emissions to world-leading benchmark levels; and |
| 2. | The CleanBC Industry Fund: finances emissions reduction projects identified by industry. |
Budget 2021 maintains the Province’s commitment to partner with industry by providing new program funding of $173 million in 2023/24, in alignment with planned increases to the carbon tax, bringing total funding to the Program to $519 million over the fiscal plan period. Budget 2021 commits stable base funding which will enable some early investment decisions through the Industry Fund to better align with industry capital planning timelines. This supports government with a strong foundation for a sustainable future by working side by side with industry and other partners to continue to adopt new technologies and maintain B.C. industry’s position as global leaders in reducing their carbon footprint.
Table 1.2.9 CleanBC Program for Industry - Total Funding
| ($ millions) | | 2021/22 | | | 2022/23 | | | 2023/24 | | | Total | |
| Base budget program funding | | | 98 | | | | 142 | | | | 191 | | | | 431 | |
| Contingencies allocations | | | 22 | | | | 28 | | | | 38 | | | | 88 | |
| | | | | | | | | | | | | | | | | |
| Total | | | 120 | | | | 171 | | | | 229 | | | | 519 | |
Note: Table may not sum due to rounding
Energy Efficient Buildings and Communities
Investments in CleanBC also support the adoption of energy efficiency measures in buildings and communities. Budget 2021 provides $57 million in operating funding to support energy efficient buildings and communities. This includes $34 million to reduce diesel consumption for electric generation in remote communities, including Indigenous communities, and $11 million to develop and fund a new program for local governments to plan for building compact, energy efficient communities. The budget also provides $12 million in capital funding to support school districts under the Carbon Neutral Capital Program.
Clean Energy and Cleantech Innovation
Budget 2021 also provides $60 million in one-time funding for 2021/22 to support the Centre for Innovation and Clean Energy and for cleantech investments to support partnership opportunities with the federal government. Announced as part of the StrongerBC Economic Recovery Plan, the Centre for Innovation and Clean Energy will support the development and commercialization of clean technology in B.C. — creating good jobs and supporting technological advancements required to transition to a low-carbon future.
Budget and Fiscal Plan - 2021/22 to 2023/24
25
Three Year Fiscal Plan
Climate Preparedness and Adaptation
The Province also continues to invest in research and forward-looking strategies to support climate preparedness and adaptation. Budget 2021 provides $6 million to support planning and preventative action, and to better understand climate risk to reduce the impact of negative outcomes of climate change over time.
InBC Strategic Investment Fund
Initially announced as part of the StrongerBC Economic Recovery Plan, Budget 2021 will provide InBC Investment Corp. with $500 million over three years, financed through a fiscal agency loan, to establish a new strategic investment fund. Investments through the fund will help to attract and anchor high-growth businesses, talent, and good jobs in B.C. InBC will make investment decisions independent of government but will be guided by criteria that seek to achieve financial returns while delivering on specified economic, social, and environmental policy priorities. These may include criteria that promote the decarbonization of the economy, good quality, family-supporting jobs in all parts of the province, and that advance reconciliation with Indigenous peoples. With the governance and mandate development of the fund well underway, it is anticipated that InBC will be ready to invest later in the 2021/22 fiscal year.
Table 1.2.10 InBC Strategic Investment Fund*
| ($ millions) | | 2021/22 | | | 2022/23 | | | 2023/24 | | | Total | |
| Available funding | | | 100 | | | | 200 | | | | 200 | | | | 500 | |
*Represents available financing to support investments. Draws against amounts provisioned depend on the actual investment schedule.
Investing in Communities
Investing in community infrastructure remains a key strategy to supporting recovery across B.C. and building more resilient communities. These investments help to ensure the necessary infrastructure is in place to deliver the services people count on, while generating jobs and upgrading facilities to attract new residents and visitors.
Connectivity
The pandemic has highlighted the importance of technology and how it supports people, businesses and communities in their work, to access services and to stay connected. Historically, there has been no stable funding to improve or expand broadband and cellular access to all British Columbians. Building on the Province’s recent one-time investments of $140 million, Budget 2021 establishes stable base funding of $40 million over the plan to further invest in the Province’s connectivity strategy. Providing reliable high-speed broadband to rural, remote and Indigenous communities supports a more inclusive society, improves access to health care and education and helps unlocks opportunities for businesses to better reach and access local, regional and global markets.
B.C. Parks Infrastructure Investments and Campsite Expansion
The pandemic limited access to indoor recreational facilities and highlighted the value of high-quality outdoor recreational opportunities. Budget 2021 responds to the substantial increase in demand for outdoor activities during the pandemic by providing $36 million in operating funding and $47 million in capital funding for new B.C.
Budget and Fiscal Plan - 2021/22 to 2023/24
26
Three Year Fiscal Plan
Parks investments over three years. Operating funding will be used to expand and enhance park management and recreation opportunities through new and upgraded campsites and trails. It will also support the maintenance and preservation of provincial parks infrastructure and facilities for both front-country and back-country sites and trails, as well as invest in B.C. Parks’ reservation services to further improve the park user experience. Capital funding will be used to build and expand campgrounds, and to provide more campsite facilities and amenities. This will create hundreds of new campsites starting in 2022/23. Capital funding will also be used to enhance trails, including improving accessibility for those who use wheelchairs, strollers or who may have other accessibility challenges. New investments in park infrastructure are anticipated to create more than 50 direct and indirect jobs annually.
Investing in Canada Infrastructure Program
The Province continues to partner with the federal government to deliver local community projects across B.C. under the Investing in Canada Infrastructure Program. The Government of Canada has committed to $3.9 billion in B.C. infrastructure over a 10-year period starting in 2018/19 to support public transit; green infrastructure; community, culture and recreation; rural and northern communities; and the COVID-19 resilience stream. The Province has supported these initiatives with total allocations of $3.6 billion anticipated over the 10-year period. This includes new Budget 2021 provincial funding commitments of $41 million over the fiscal plan, or $247 million over the next six years to maximize federal contributions and continue to support local governments, not-for-profit entities and First Nations in accessing community infrastructure funding. The Ministry of Municipal Affairs will be communicating further details on the application process for new intakes in the fall of 2021.
Marking BC 150+
2021 has been and continues to be a remarkable year, which also includes the 150th anniversary of British Columbia’s entry into confederation. As part of this milestone, Budget 2021 provides $30 million in one-time funding in 2021/22 to support initiatives around B.C. communities that honour:
| • | reconciliation and learning; |
| • | diversity and inclusion; and |
| • | resiliency and the next 150 years. |
Investments will raise cultural awareness, recognize the diversity that contributes to B.C.’s vibrant social and economic fabric, and support resiliency and recovery across the province to mark this milestone. More details will be shared on the program in the summer, closer to the anniversary date.
Table 1.2.11 Investments to Support Recovery for Communities
| ($ millions) | | 2021/22 | | | 2022/23 | | | 2023/24 | | | Total | |
| Connectivity | | | 10 | | | | 10 | | | | 20 | | | | 40 | |
| B.C. Parks investments and campsite expansion | | | 10 | | | | 12 | | | | 14 | | | | 36 | |
| BC 150+* | | | 30 | | | | - | | | | - | | | | 30 | |
| | | | | | | | | | | | | | | | | |
| Total | | | 50 | | | | 22 | | | | 34 | | | | 106 | |
Note: Table may not sum due to rounding
*Pandemic and Recovery Contingencies allocations
Budget and Fiscal Plan - 2021/22 to 2023/24
27
Three Year Fiscal Plan
Investing in Infrastructure to Support Recovery
Community Infrastructure: Building Better Communities and a Sustainable Economy for Everyone
The StrongerBC Economic Recovery Plan announced in September 2020 provided over $400 million as a first step towards targeted investments in community infrastructure to support economic recovery by creating jobs and building better communities. This includes investments to revitalize community infrastructure, enhance connections between communities by road and air, improve broadband and cellular access and to help get people back to work.
Budget 2021 builds on community infrastructure investments by providing $147 million in new funding over the fiscal plan. This includes supports to further improve broadband and cellular access in rural, remote and Indigenous communities to better enable people to access essential services and work. There are also new investments to maintain and improve community and arts infrastructure, including upgrades to B.C. parks and campsites as British Columbians head to the outdoors and to prepare for the return of tourism throughout the province. B.C. will also provide $41 million over the fiscal plan to partner with the federal government in the Investing in Canada Infrastructure program for clean energy and community infrastructure projects.
The Province also continues to invest in key strategies that contribute to a more equitable and sustainable economy. As part of the StrongerBC Economic Recovery Plan, the Province invested $99 million in 2020/21 to ensure child care spaces were safe and available for parents and accelerated the creation of more child care spaces to support recovery efforts. Building even more child care spaces is instrumental in enabling parents, particularly women, to enter or rejoin the workforce. Through the New Spaces Fund, inclusion in the construction of new schools and other grant funding, the Province has funded over 26,000 new child care spaces since Budget 2018. Budget 2021 provides more towards the creation of new spaces over the fiscal plan (see page 13) as government works to integrate child care into the broader learning environment.
Budget 2018 committed to invest $7 billion over 10 years in the homes people need and B.C. continues to deliver on its commitment to build housing that is safe and more affordable. The Province is providing more than $1.6 billion over the next three years to support the construction of new low- and middle-income housing throughout B.C. Budget 2021 also provides up to $2 billion in low-cost financing to expand the HousingHub program. This program will facilitate the creation of approximately 9,000 additional units of affordable rental housing and homeownership options for middle-income British Columbians over the next three to five years.
Budget 2021 includes $7.6 billion in transportation investments over the next three years, as shown in Table 1.7 (page 53). Along with highway rehabilitation and upgrades, transportation investments include the replacement of the George Massey Tunnel with a new crossing, which has advanced to the business case review stage, and completing the planning for the Surrey-Langley SkyTrain project. The infrastructure investments keep B.C. on the path to a sustainable future, through shorter commute times and greener transportation. Budget 2021 also includes the Richmond Hospital redevelopment project, which has advanced to the business case review stage. Investing in renewal and expansion of health authority-owned long-term care facilities is a priority for Budget 2021. Over 20 projects across the Province are in planning. In total, the projects are expected to result in the replacement of approximately 2,850 beds, and the creation of over 1,500 net new beds.
New buildings incorporate modern energy- efficient design to reduce the carbon footprint of public-sector buildings. For example, Glenmerry Elementary, Mills Memorial Hospital and Dawson Creek and District Hospital will exceed the energy performance
Budget and Fiscal Plan - 2021/22 to 2023/24
28
Three Year Fiscal Plan
typically achieved by a Leadership in Energy and Environmental Design (LEED) Gold design. The UVic Student Housing project is being built to the innovative Passive House standard. For existing buildings, Budget 2021 provides an additional $12 million for schools to reduce emissions and lower energy costs through the Carbon Neutral Capital Program.
The Province also remains committed to promoting the use of mass timber where feasible, to support a more resilient and competitive forestry sector, by incorporating mass timber into projects like Bayview Elementary and Begbie Elementary. The British Columbia Institute of Technology Student Housing project uses mass timber, has a lower carbon footprint compared to traditional concrete construction, and has an energy-efficient design that supports the Province’s commitment to meeting legislated greenhouse gas reduction targets.
Major Capital Infrastructure: Creating Jobs While Growing Our Province
With the record $26.4 billion capital plan, Budget 2021 is making a historic investment in major infrastructure to deliver the critical services people count on as communities grow, keeping B.C. a desirable destination to work, study and live. This record capital spending over three years is $3.5 billion higher than Budget 2020 with infrastructure recovery investments in the areas of health, education and transportation. Rising capital investments are needed to replace older infrastructure, protect existing assets and build new ones. By leveraging existing capital project planning and with interest rates forecast to remain low by historical standards, the capital plan is well-positioned to support the recovery with shovel-ready projects, spanning all sectors and regions across the Province.
Overall, capital investments are anticipated to create over 85,000 jobs in the fiscal plan period. This includes direct construction jobs as well as indirect jobs, such as offsite employment at suppliers (for example, material manufacturing and food services). These benefits ripple out into the broader economy with the additional income being spent in the community and further supports recovery.
The capital investments include more apprenticeship and training opportunities in local communities, in particular for Indigenous peoples, women, people with disabilities and other traditionally under-represented groups who want to build a career in the skilled trades. The Broadway subway project, which is beginning construction, will provide opportunities under the Province’s Community Benefits Agreement. Altogether, these investments will allow the Province to build back better, create good-paying jobs, provide economic stimulus and form the foundation of B.C.’s long-term prosperity for decades to come.
The Capital Plan
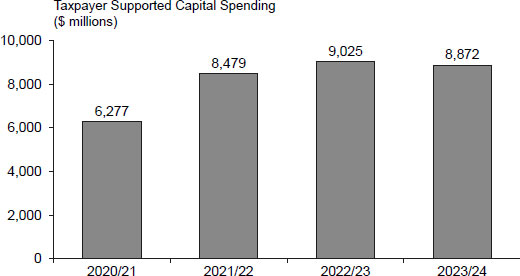
Budget and Fiscal Plan - 2021/22 to 2023/24
29
Three Year Fiscal Plan
Economic Recovery and the Path to Fiscal Balance
As required under the Budget Transparency and Accountability Act, government presented a balanced budget on February 18, 2020 for 2020/21 – 2022/23. This plan was suddenly impacted by the COVID-19 pandemic. The Province’s strong fiscal and economic position, as highlighted by successive past balanced budgets, allowed government to respond to the pandemic with health, social and economic supports. Within weeks of the onset of the pandemic, B.C. took early leadership in its fiscal response and implemented its COVID-19 Action Plan to deliver critical services and provide financial relief and supports to people and businesses.
Responding to the pandemic meant that government needed to pause the requirement to table balanced budgets for 2021/22 to 2023/24. This approach is consistent with general economic policy that encourages governments to provide appropriate supports and stimulus as needed to address economic downturns and extraordinary events, even if those supports and stimulus result in time- limited deficits.
Given the unprecedented economic impacts, the increased level of supports and the commitment to transparency, government enhanced its financial reporting by providing timely updates of the Ministry of Finance’s evolving forecast and economic scenarios as well as all of the pandemic response measures, including detailed reporting about allocations from the pandemic-related Contingencies votes. This reporting started with the July 14, 2020 Economic and Fiscal Update, which was not required under the Budget Transparency and Accountability Act. Government also maintained quarterly fiscal updates and continued to provide enhanced reporting about response measures and changes to allocations from the pandemic-related Contingencies votes in the First Quarterly Report in September and the Fall 2020 Economic and Fiscal Update in December.
Third Quarter Results for 2020/21 and the Updated Fiscal Plan
Government’s 2020/21 deficit is projected to be $8.1 billion, an improvement from the projected $13.6 billion deficit forecast in the fall 2020 update (as detailed in the Third Quarterly Report starting on page 107). This is consistent with past practice whereby government aims to meet or exceed its fiscal forecasts. The improvement is mainly due to: higher tax revenue results; reducing the $1.0 billion forecast allowance; moderately lower spending than anticipated; and a number of other changes, including a one-time Canada Health Transfer top-up provided late in March 2021 from the federal government.
The deficit is forecast to increase moderately compared to the 2020/21 deficit to $9.7 billion (which includes a $1.0 billion forecast allowance). While there is lower forecasted pandemic-related spending and improved overall revenue forecasts in 2021/22, this year-over-year deficit increase is partly attributed to the $3.2 billion in one-time federal funding that was received last year (2020/21) to support pandemic measures, including funding under the Safe Restart Agreement. B.C. welcomes the time-limited federal funding in 2020/21 and support for vaccine roll out in 2021/22. Moving forward, B.C. will need to see sustained and long-term federal funding for health care and other important services. See the Topic Box titled “A Collaborative Approach to Address COVID-19 Through Partnership with the Federal Government” on page 45 for more information about B.C.’s priorities for enhanced federal transfers and other supports for British Columbians.
Beginning in 2021/22, the fiscal plan reflects ongoing and declining deficits in the medium term as B.C.’s economy continues to respond to and recover from the pandemic. It is important to note that the projected declining deficits incorporate higher than normal levels of
Budget and Fiscal Plan - 2021/22 to 2023/24
30
Three Year Fiscal Plan
| Operating Statement – 2008/09 to 2023/2024 |
| | | | | | | | | | | | | | | | | | | | | | | | | | | | | | | | | | | | | | | | | | | | | | | | | | | Updated | | | Budget | | | | | | | | | |
| | | Actual | | | Actual | | | Actual | | | Actual | | | Actual | | | Actual | | | Actual | | | Actual | | | Actual | | | Actual | | | Actual | | | Actual | | | Forecast | | | Estimate | | | Plan | | | Plan | |
| ($ billions) | | 2008/09 | | | 2009/10 | | | 2010/11 | | | 2011/12 | | | 2012/13 | | | 2013/14 | | | 2014/15 | | | 2015/16 | | | 2016/17 | | | 2017/18 | | | 2018/19 | | | 2019/20 | | | 2020/21 | | | 2021/22 | | | 2022/23 | | | 2023/24 | |
| Revenue | | | 38.7 | | | | 38.0 | | | | 40.7 | | | | 41.8 | | | | 42.1 | | | | 43.7 | | | | 46.1 | | | | 47.6 | | | | 51.4 | | | | 52.0 | | | | 57.1 | | | | 58.7 | | | | 61.0 | | | | 58.9 | | | | 63.3 | | | | 65.1 | |
| Expense | | | (38.6 | ) | | | (39.8 | ) | | | (40.9 | ) | | | (43.6 | ) | | | (43.2 | ) | | | (43.4 | ) | | | (44.4 | ) | | | (46.8 | ) | | | (48.7 | ) | | | (51.7 | ) | | | (55.6 | ) | | | (59.0 | ) | | | (69.1 | ) | | | (67.6 | ) | | | (68.0 | ) | | | (69.0 | ) |
| Forecast Allowance | | | | | | | — | | | | — | | | | — | | | | — | | | | — | | | | — | | | | — | | | | — | | | | — | | | | — | | | | — | | | | — | | | | (1.0 | ) | | | (0.8 | ) | | | (0.4 | ) |
| Surplus (deficit) | | | 0.1 | | | | (1.8 | ) | | | (0.2 | ) | | | (1.8 | ) | | | (1.1 | ) | | | 0.3 | | | | 1.7 | | | | 0.8 | | | | 2.8 | | | | 0.3 | | | | 1.5 | | | | (0.3 | ) | | | (8.1 | ) | | | (9.7 | ) | | | (5.5 | ) | | | (4.3 | ) |
prudence across the three-year track as shown in the Budget Prudence Measures table on the next page.
Budget 2021 Fiscal Planning Framework
The pausing of the balanced budget requirement is not unprecedented as similar action occurred after the global financial crisis of 2008/09 (or the Great Recession), allowing for multiple deficit years. However, the duration, depth, and breadth of the pandemic recession is materially different from the Great Recession.
The Ministry of Finance estimates that B.C.’s real GDP fell by 5.3 per cent in 2020, much deeper than the 2.4 per cent decline in 2009. This is further discussed in the Economic Outlook chapter beginning on page 79.
During this year’s consultation with the Economic Forecast Council, members noted that adaptive and targeted government supports are needed throughout the pandemic with careful consideration about when and how they are withdrawn in B.C. and Canada. From a longer-term perspective, it was agreed that the B.C. government should remain disciplined in its fiscal planning to maintain the solid fiscal position with which it entered the pandemic.
Budget 2021 builds on the Province’s COVID-19 response and recovery measures implemented over the past year and focuses on taking care of people, businesses and supporting a just economic recovery. Government will return to balanced budgets after the pandemic has ended and the province is on a path to stable economic recovery.
As a first step, Budget 2021 uses fiscal guardrails to help maintain fiscal discipline and guide government’s decision-making while B.C. continues to manage its response to the pandemic and prepare for recovery.
Budget 2021 Fiscal Guardrails
Government has established a framework of fiscal guardrails to guide financial decisions for Budget 2021. These include:
| • | Year-over-year declining deficits – Budget 2021 presents declining deficits starting in 2021/22, with deficit projections of $9.7 billion, $5.5 billion and $4.3 billion over the next three years. The significant yearly improvements include the tapering of supports, where possible, that address immediate needs caused by the pandemic and recovery over the short term. |
| • | Targeted spending criteria – Permanent and time-limited spending on new initiatives are focused on health and safety, supports for people and businesses, and measures to help B.C. to prepare for recovery. This includes supports to address gaps that were exposed or exacerbated by the pandemic, including supports for vulnerable populations such as seniors, those receiving income and disability assistance and people experiencing homelessness. |
| • | Increased prudence levels: – Budget 2021 includes increased prudence compared to past budgets, such as more prudent forecasts compared to the Economic Forecast Council; a larger Contingencies Vote to account for any additional urgent government spending, including placeholders for future budget needs such as caseload growth and priority initiatives; and higher forecast allowance to cover fluctuations in revenues. |
| • | Pandemic and Recovery Contingencies – The unprecedented nature of the COVID-19 pandemic required a unique response that will taper off when the pandemic passes. These initiatives are funded through a time-limited Pandemic and Recovery |
Budget and Fiscal Plan - 2021/22 to 2023/24
31
Three Year Fiscal Plan
Budget Prudence Measures
| | | Budget 2020 | | Budget 2021 |
| | | 2020/21 | | 2021/22 | | 2022/23 | | 2023/24 |
| Real GDP Growth Below EFC (percentage points, pp)* | | 0.4pp | | 0.5pp | | 0.5pp | | 0.2pp |
| | | | | | | | | |
| Contingencies – General Programs | | $600 million | | $1.00 billion | | $800 million | | $700 million |
| | | | | | | | | |
| Contingencies – Pandemic and Recovery | | $8.00 billion (Supplementary Estimates) | | $3.25 billion | | $1.00 billion | | $300 million |
| | | | | | | | | |
| Contingencies – Caseload pressures and Priority Investments | | — | | — | | $1.50 billion | | $2.00 billion |
| | | | | | | | | |
| Forecast Allowance | | $300 million | | $1.00 billion | | $750 million | | $400 million |
* Calendar Year
Contingencies, including a reserve that will be limited to the most urgent health and recovery needs. Access will be restricted to measures that are time-limited in nature and that do not create increased costs to government in the future. Reserve funding that is not needed will be held in order to reduce the government’s forecasted operating deficit.
| • | “Best in Class” Debt Metrics and Debt Affordability – Debt-to-GDP and debt- to-revenue ratios are measures used to monitor the Province’s overall level and sustainability of debt. Government has set overall envelopes for Budget 2021 operating and capital funding investments so that the level of debt remains affordable while making progress on important new and existing infrastructure projects and related programs and services. (See the Topic Box titled “Investing in Infrastructure to Support Recovery” on page 28 for a description of government’s capital investments and priorities). Even after continuing to make significant investments in schools, hospitals, housing, transportation and other priorities, the debt-to-GDP ratio is projected to remain below 30 per cent in all years of the fiscal plan at 22.8 per cent in 2021/22, 25.0 per cent in 2022/23 and 26.9 per cent by 2023/24. Debt-to- revenue is projected to be 125.9 per cent in 2021/22, 135.4 per cent in 2022/23, and 147.5 per cent in 2023/24. These metrics continue to compare favorably to debt metrics in other “peer” jurisdictions. |
| • | Transparent and Timely Reporting – As demonstrated throughout 2020/21, government is committed to transparent and timely reporting and will continue to provide updated economic forecasts as well as detailed reporting of pandemic measures, including Pandemic and Recovery Contingencies allocations. |
Government’s Economic Framework
British Columbia has a strong economic foundation, which has helped to manage the impacts of the COVID-19 pandemic. As the pandemic evolved, government introduced new measures to keep people safe and to prepare for recovery. This included the September 2020 StrongerBC Economic Recovery Plan which delivered early economic recovery programs to create jobs and opportunities, help businesses to adapt, and spur economic stimulus to foster stronger, more resilient communities1.
Budget 2021 continues to build on the StrongerBC Economic Recovery Plan, by adapting government’s response with a focus on innovative, inclusive and sustainable growth. Increasingly, the Province’s support for innovation will be channeled into projects that address social and environmental issues, along with economic ones. This includes the new $500 million InBC Strategic Investment Fund for B.C. businesses as described on page 26.
| 1 | Further detail is provided as part of the 2020/21 Third Quarterly Report about the broad suite of measures implemented by the BC Government since the start of the pandemic (see page 111) |
Budget and Fiscal Plan - 2021/22 to 2023/24
32
Three Year Fiscal Plan
Announced in September, the fund will invest to achieve a financial return as well as specific social, economic and environmental policy objectives.
Budget 2021 makes continued investment to balance economic interests with sound environmental management and government’s commitment to reconciliation. Government’s commitment to engage with Indigenous peoples on land and resource activities is supported through the $180 million in stable, ongoing funding over the fiscal plan (see page 16) and signifies the importance of reconciliation to the economic prosperity of all British Columbians. B.C.’s mining sector is poised to play a critical role in supporting the transition to a low-carbon future both here and abroad, as metals and minerals found within B.C. are used to create green technology, such as electric vehicles and wind turbines, and B.C.’s mining operations stand out as having a lower greenhouse gas intensity than most global competitors. In addition, continued funding of $519 million over the fiscal plan period to the CleanBC Program for Industry will help large industry, including forestry and mining operations, transition to low-carbon technology, furthering B.C.’s environmental advantage (see page 25). Budget 2021 also adds $11 million over the fiscal plan to support timely permitting for land-based decisions and ensure the Province is more appropriately resourced to promote sustainable economic development. This approach presents a competitive advantage, particularly as capital markets are increasingly focused on investing in jurisdictions that reflect a strong record of environmental, social and governance factors and will help ensure that the resource wealth in B.C. continues to be a key source of the province’s economic strength.
The pandemic has reinforced the importance of a strong and sustainable economy that produces good paying jobs and raises the standard of living for British Columbians. In the coming months, the Province will engage with workers, businesses, industries, and Indigenous and community leaders to renew the economic framework. The framework will be released this fall and will continue to focus on ensuring our future economy is:
| • | innovative, generating new ideas, products, services and processes, |
| • | inclusive, with everyone in British Columbia engaged in and benefiting from economic growth, and |
| • | sustainable, meeting people’s needs today without compromising our future. |
B.C.’s renewed economic framework will include strategies to grow B.C.’s advanced manufacturing and technology sectors; advance sustainable natural resource development; attract high growth businesses and talent to anchor in B.C.; and build upon the province’s legacy as a leader in global climate change and clean energy.
The Path to Balanced Budgets
Given the unprecedented level of uncertainty resulting from the ongoing impacts of the pandemic, it is too early to forecast a specific timeline to balance. However, preliminary analysis indicates a return to balanced budgets within a range of seven to nine years (the period of 2028/29 - 2030/31), consistent with projections tabled by other provinces in their 2021 budgets.
While the analysis incorporates economic growth scenarios and other assumptions, the Province will be working over the coming months to finalize a specific timeline to return to balance. Decisions required to achieve the timeline and the approach to balancing will be carefully guided by indicators that monitor the health of the economy, communities, and businesses. This will ensure a thoughtful approach that protects the momentum of the recovery and sustains important investments for British Columbians. The specific timeline, approach and plan will be presented in Budget 2022 when there will be greater certainty about the path and pace of economic recovery.
Budget and Fiscal Plan - 2021/22 to 2023/24
33
Three Year Fiscal Plan
BC Public Service
Full-time equivalent (FTE) staff utilization in core government ministries is projected to be 32,750 FTEs across the fiscal plan. This is an increase of 350 FTEs compared to the 2020/21 FTE forecast. The anticipated FTE growth is mainly due to increased staffing needs across the public service to respond to the COVID-19 pandemic, and for expansion of programs including CleanBC, mental health services, housing, and natural resource permitting. It also accounts for FTE growth related to bringing key services, such as revenue and tax administration services, back into core government.
BC Public Sector Compensation
There are nearly 490,000 people in British Columbia’s public sector working in the core public service, at Crown corporations and agencies, in health and community social services, K-12 public education and post-secondary institutions. Of those people, approximately 385,000 are unionized employees.
Budget 2021 provides funding to support collective agreements settled over the past year under the three-year 2019 Sustainable Services Negotiating Mandate. Over the fiscal plan period, a total of $1.6 billion in funding is provided for agreements signed under the mandate. The mandate supports government’s commitment to improve the services people count on, make life more affordable and invest in sustainable economic growth.
Spending Recovered from Third Parties
Government projects that, over the fiscal plan period, it will incur almost $10 billion in program spending which will be recovered from third parties.
A total of $3.5 billion of programs will be delivered with funding from the federal government, such as the Labour Market Development Agreement, the Canada Job Grant, public transit, health, and child and family support programs.
Recovered costs include an estimated $2.6 billion in interest payments from commercial Crown corporations through the fiscal agency loan program and from sinking fund investment returns.
$3.8 billion in government spending is supported by various recovery sources, primarily other jurisdictions, other levels of government, agencies, and fees and licenses. Expenses that relate to these recoveries include health care, PharmaCare, transportation projects, and grants to various organizations in the community, and employee health benefits costs collected from participating government agencies.
Program spending from recoveries have no net impact to the government’s fiscal plan as the recoveries are reported as revenue and the spending is expensed as it is incurred.
Budget and Fiscal Plan - 2021/22 to 2023/24
34
Three Year Fiscal Plan
Transfers to Service Delivery Agencies
Around 62 per cent of ministry spending takes the form of transfers (both operating and capital) to service delivery agencies for the provision of services on behalf of government. These transfers will total $103 billion over the three-year fiscal plan period and will support education, health care, social services, housing, and transportation programs delivered by the agencies. These service delivery agencies include the SUCH sector (schools, universities, colleges and health organizations), Community Living BC, BC Housing Management Commission, BC Transit, and the BC Transportation Financing Authority.
Service Delivery Agency Spending
Service delivery agency spending is projected to increase from $39.5 billion in 2021/22 to $40.9 billion by 2023/24, an increase of $900 million or 3.5 per cent. Additional funding may be allocated to agencies during the year out of pandemic and recovery contingencies, which may result in higher actual spending in 2021/22.
School district spending is projected to increase from $7.48 billion in 2021/22 to $7.53 billion in 2023/24, an increase of over $40 million reflecting higher salary and benefits and other operating costs.
Post-secondary institution spending is projected to rise from $7.0 billion in 2021/22 to $7.4 billion by 2023/24 — an increase of $400 million, or 5.7 per cent. The spending increase is primarily due to higher staffing and operating costs related to higher enrolment.
Health authority and hospital society spending is projected to increase from $18.3 billion in 2021/22 to $19.3 billion in 2023/24 an increase of $1 billion or 5.5 per cent; this reflects increased funding from the government, as discussed on page 8.
Projected spending by other service delivery agencies is forecast to remain stable around $6.7 billion over the fiscal plan. This spending relates mainly to services in the transportation, social services, and housing sectors.
Budget and Fiscal Plan - 2021/22 to 2023/24
35
Three Year Fiscal Plan
Table 1.3 Expense by Ministry, Program and Agency
| ($ millions) | | Updated
Forecast
2020/21 1 | | | Budget
Estimate
2021/22 | | | Plan
2022/23 | | | Plan
2023/24 | |
| Office of the Premier | | | 11 | | | | 15 | | | | 15 | | | | 15 | |
| Advanced Education and Skills Training | | | 2,366 | | | | 2,592 | | | | 2,583 | | | | 2,592 | |
| Agriculture, Food and Fisheries | | | 95 | | | | 100 | | | | 100 | | | | 100 | |
| Attorney General | | | 1,154 | | | | 1,272 | | | | 1,311 | | | | 1,337 | |
| Children and Family Development | | | 2,224 | | | | 2,393 | | | | 2,427 | | | | 2,430 | |
| Citizens’ Services | | | 554 | | | | 604 | | | | 609 | | | | 619 | |
| Education | | | 6,694 | | | | 7,132 | | | | 7,162 | | | | 7,162 | |
| Energy, Mines and Low Carbon Innovation | | | 114 | | | | 109 | | | | 99 | | | | 99 | |
| Environment and Climate Change Strategy | | | 261 | | | | 301 | | | | 346 | | | | 396 | |
| Finance | | | 1,768 | | | | 990 | | | | 1,048 | | | | 956 | |
| Forests, Lands, Natural Resource Operations and Rural Development | | | 929 | | | | 888 | | | | 858 | | | | 854 | |
| Health | | | 22,190 | | | | 23,873 | | | | 24,650 | | | | 25,414 | |
| Indigenous Relations and Reconciliation | | | 97 | | | | 179 | | | | 194 | | | | 182 | |
| Jobs, Economic Recovery and Innovation | | | 78 | | | | 79 | | | | 80 | | | | 80 | |
| Labour | | | 17 | | | | 17 | | | | 17 | | | | 17 | |
| Mental Health and Addictions | | | 13 | | | | 13 | | | | 13 | | | | 13 | |
| Municipal Affairs | | | 149 | | | | 308 | | | | 247 | | | | 247 | |
| Public Safety and Solicitor General | | | 992 | | | | 901 | | | | 907 | | | | 907 | |
| Social Development and Poverty Reduction | | | 3,682 | | | | 4,360 | | | | 4,455 | | | | 4,478 | |
| Tourism, Arts, Culture and Sport | | | 159 | | | | 162 | | | | 162 | | | | 162 | |
| Transportation and Infrastructure | | | 929 | | | | 949 | | | | 949 | | | | 949 | |
| Total ministries and Office of the Premier | | | 44,476 | | | | 47,237 | | | | 48,232 | | | | 49,009 | |
| Management of public funds and debt | | | 1,248 | | | | 1,340 | | | | 1,401 | | | | 1,528 | |
| Contingencies - general programs | | | 736 | | | | 1,000 | | | | 800 | | | | 700 | |
| Contingencies - caseload pressures and priority initiatives | | | — | | | | — | | | | 1,500 | | | | 2,000 | |
| Pandemic and Recovery Contingencies | | | 7,510 | | | | 3,250 | | | | 1,000 | | | | 300 | |
| Funding for capital expenditures | | | 2,192 | | | | 3,448 | | | | 3,930 | | | | 4,161 | |
| Refundable tax credit transfers | | | 2,367 | | | | 1,871 | | | | 1,953 | | | | 2,036 | |
| Legislative Assembly and other appropriations | | | 232 | | | | 174 | | | | 166 | | | | 166 | |
| Total appropriations | | | 58,666 | | | | 58,320 | | | | 58,982 | | | | 59,900 | |
| Elimination of transactions between appropriations 2 | | | (15 | ) | | | (14 | ) | | | (14 | ) | | | (16 | ) |
| Prior year liability adjustments | | | (80 | ) | | | — | | | | — | | | | — | |
| Consolidated revenue fund expense | | | 58,666 | | | | 58,306 | | | | 58,968 | | | | 59,884 | |
| Expenses recovered from external entities | | | 4,335 | | | | 3,535 | | | | 3,242 | | | | 3,204 | |
| Funding provided to service delivery agencies | | | (33,891 | ) | | | (33,682 | ) | | | (34,319 | ) | | | (35,005 | ) |
| Total direct program spending | | | 29,110 | | | | 28,159 | | | | 27,891 | | | | 28,083 | |
| Service delivery agency expense: | | | | | | | | | | | | | | | | |
| School districts | | | 7,535 | | | | 7,482 | | | | 7,522 | | | | 7,526 | |
| Universities | | | 5,368 | | | | 5,510 | | | | 5,690 | | | | 5,859 | |
| Colleges and institutes | | | 1,456 | | | | 1,497 | | | | 1,508 | | | | 1,539 | |
| Health authorities and hospital societies | | | 19,371 | | | | 18,271 | | | | 18,655 | | | | 19,314 | |
| Other service delivery agencies | | | 6,271 | | | | 6,708 | | | | 6,754 | | | | 6,676 | |
| Total service delivery agency expense | | | 40,001 | | | | 39,468 | | | | 40,129 | | | | 40,914 | |
| Total expense | | | 69,111 | | | | 67,627 | | | | 68,020 | | | | 68,997 | |
| 1 | Restated to reflect government’s current organization and accounting policies. |
| 2 | Reflects payments made under an agreement where an expense from a voted appropriation is recorded as revenue by a special account. |
Budget and Fiscal Plan - 2021/22 to 2023/24
36
Three Year Fiscal Plan
Table 1.4 Revenue by Source
| ($ millions) | | Updated
Forecast
2020/21 | | | Budget
Estimate
2021/22 | | | Plan
2022/23 | | | Plan
2023/24 | |
| Taxation revenue | | | | | | | | | | | | | | | | |
| Personal income | | | 11,118 | | | | 11,170 | | | | 11,565 | | | | 12,047 | |
| Corporate income | | | 4,807 | | | | 3,409 | | | | 5,728 | | | | 5,736 | |
| Employer health | | | 1,840 | | | | 1,923 | | | | 2,000 | | | | 2,073 | |
| Sales 1 | | | 7,446 | | | | 7,872 | | | | 8,492 | | | | 8,865 | |
| Fuel | | | 933 | | | | 983 | | | | 992 | | | | 969 | |
| Carbon | | | 1,640 | | | | 1,985 | | | | 2,221 | | | | 2,116 | |
| Tobacco | | | 720 | | | | 780 | | | | 800 | | | | 800 | |
| Property | | | 2,324 | | | | 2,970 | | | | 3,108 | | | | 3,230 | |
| Property transfer | | | 2,000 | | | | 1,975 | | | | 1,912 | | | | 1,877 | |
| Insurance premium | | | 705 | | | | 715 | | | | 725 | | | | 735 | |
| | | | 33,533 | | | | 33,782 | | | | 37,543 | | | | 38,448 | |
| Natural resource revenue | | | | | | | | | | | | | | | | |
| Natural gas royalties | | | 191 | | | | 286 | | | | 315 | | | | 366 | |
| Forests | | | 1,121 | | | | 1,204 | | | | 948 | | | | 916 | |
| Other natural resources 2 | | | 903 | | | | 1,042 | | | | 1,114 | | | | 1,107 | |
| | | | 2,215 | | | | 2,532 | | | | 2,377 | | | | 2,389 | |
| Other revenue | | | | | | | | | | | | | | | | |
| Post-secondary education fees | | | 2,485 | | | | 2,508 | | | | 2,625 | | | | 2,711 | |
| Other fees and licences 3 | | | 1,957 | | | | 2,129 | | | | 2,080 | | | | 2,157 | |
| Investment earnings | | | 1,205 | | | | 1,174 | | | | 1,185 | | | | 1,186 | |
| Miscellaneous 4 | | | 3,151 | | | | 3,409 | | | | 3,578 | | | | 3,642 | |
| | | | 8,798 | | | | 9,220 | | | | 9,468 | | | | 9,696 | |
| Contributions from the federal government | | | | | | | | | | | | | | | | |
| Health and social transfers | | | 8,285 | | | | 7,939 | | | | 8,176 | | | | 8,578 | |
| COVID-19 related funding | | | 2,616 | | | | 175 | | | | 40 | | | | — | |
| Other federal government contributions 5 | | | 2,459 | | | | 2,416 | | | | 2,248 | | | | 2,332 | |
| | | | 13,360 | | | | 10,530 | | | | 10,464 | | | | 10,910 | |
| Commercial Crown corporation net income | | | | | | | | | | | | | | | | |
| BC Hydro | | | 691 | | | | 712 | | | | 712 | | | | 712 | |
| Liquor Distribution Branch | | | 1,151 | | | | 1,099 | | | | 1,103 | | | | 1,146 | |
| BC Lottery Corporation 6 | | | 383 | | | | 771 | | | | 1,283 | | | | 1,403 | |
| ICBC | | | 709 | | | | 154 | | | | 202 | | | | 229 | |
| Other 7 | | | 127 | | | | 129 | | | | 134 | | | | 141 | |
| | | | 3,061 | | | | 2,865 | | | | 3,434 | | | | 3,631 | |
| Total revenue | | | 60,967 | | | | 58,929 | | | | 63,286 | | | | 65,074 | |
| 1 | Includes provincial sales tax, HST/PST housing transition tax and harmonized sales tax related to prior years. |
| 2 | Columbia River Treaty, Crown land tenures, other energy and minerals, water rental, and other resources. |
| 3 | Health-care-related, motor vehicle, and other fees. |
| 4 | Includes reimbursements for health care and other services provided to external agencies, and other recoveries. |
| 5 | Includes contributions for health, education, community development, housing and social service programs, and transportation projects. |
| 6 | Net of payments to the federal government and beginning in 2021/22 also net of payments under the gaming revenue sharing agreement with First Nations. |
| 7 | Includes Columbia Power Corporation, BC Railway Company, Columbia Basin power projects, and other agencies’ self-supported subsidiaries. |
Budget and Fiscal Plan - 2021/22 to 2023/24
37
Three Year Fiscal Plan
Revenue
Total revenue growth is expected to average 2.2 per cent annually over the three-year period to 2023/24, with growth in taxation, natural resources, other sources, and net income of commercial Crown corporations and declining revenue from federal government contributions.
Chart 1.2 Revenue Forecast
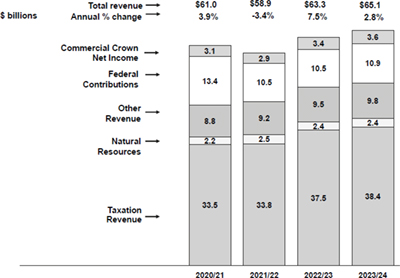
Revenue growth in taxation sources averages 4.7 per cent over the three-year fiscal plan period. B.C. and the federal government continue to support business competitiveness in the face of ongoing global developments through the continuation of corporate income tax relief through the incentives for investment in capital assets, such as buildings, machinery and equipment. The effects of these changes, combined with the impacts of economic growth and LNG Canada’s final investment decision to build an LNG facility in Kitimat, result in a 4.7 per cent average annual growth in the taxation revenue forecast.
Natural resource revenue is forecast to increase by 14.3 per cent in 2021/22, with higher revenues from natural gas royalties, forests, the mineral tax on coal mine operations, electricity sales under the Columbia River Treaty and water rentals, which are partly offset by declining revenue from bonus bids and rents on drilling licences and leases. The revenue is expected to decline in 2022/23 by 6.1 per cent mainly due to lower forest stumpage revenues reflecting lumber prices decreasing from historically high prices experienced in early 2021. Natural resource revenue is expected to be relatively flat in 2023/24, rising by 0.5 per cent.
Budget and Fiscal Plan - 2021/22 to 2023/24
38
Three Year Fiscal Plan
Table 1.5.1 Comparison of Major Factors Underlying Revenue
| Calendar Year | | April 20, 2021 | | | February 18, 2020 | |
| Per cent growth unless otherwise indicated | | 2020 | | | 2021 | | | 2022 | | | 2023 | | | 2020 | | | 2021 | | | 2022 | | | 2023 | |
| Real GDP | | | -5.3 | | | | 4.4 | | | | 3.8 | | | | 2.2 | | | | 2.0 | | | | 1.9 | | | | 1.9 | | | | 1.9 | |
| Nominal GDP | | | -4.5 | | | | 6.4 | | | | 5.4 | | | | 4.0 | | | | 3.9 | | | | 3.9 | | | | 3.9 | | | | 3.9 | |
| Household income | | | 4.9 | | | | 0.8 | | | | 2.8 | | | | 3.4 | | | | 3.8 | | | | 3.8 | | | | 3.8 | | | | 3.8 | |
| Wages and salaries | | | -0.7 | | | | 4.5 | | | | 4.0 | | | | 3.7 | | | | 4.0 | | | | 3.9 | | | | 4.0 | | | | 4.0 | |
| Corporations net operating surplus | | | -13.6 | | | | 9.2 | | | | 8.8 | | | | 3.3 | | | | 2.0 | | | | 2.6 | | | | 2.6 | | | | 3.0 | |
| Employment | | | -6.6 | | | | 4.7 | | | | 2.4 | | | | 1.6 | | | | 1.0 | | | | 1.0 | | | | 1.0 | | | | 1.0 | |
| Consumer expenditures on durable goods | | | -2.3 | | | | 2.6 | | | | 3.1 | | | | 2.8 | | | | 1.7 | | | | 2.4 | | | | 2.5 | | | | 2.4 | |
| Consumer expenditures on goods and services | | | -4.8 | | | | 5.3 | | | | 5.9 | | | | 5.7 | | | | 4.5 | | | | 4.4 | | | | 4.5 | | | | 4.5 | |
| Business investment | | | -9.3 | | | | 5.6 | | | | 6.4 | | | | 6.3 | | | | 4.1 | | | | 4.5 | | | | 5.8 | | | | 4.8 | |
| Residential investment | | | -6.9 | | | | 3.5 | | | | 4.6 | | | | 4.8 | | | | 3.7 | | | | 3.3 | | | | 5.0 | | | | 5.0 | |
| Retail sales | | | 2.6 | | | | 3.7 | | | | 3.4 | | | | 3.4 | | | | 3.0 | | | | 3.3 | | | | 3.5 | | | | 3.5 | |
| Residential sales value | | | 35.7 | | | | 8.0 | | | | -3.3 | | | | -2.7 | | | | 4.6 | | | | 5.3 | | | | 5.6 | | | | 5.6 | |
| B.C. Housing starts | | | -16.0 | | | | -8.6 | | | | -3.0 | | | | -1.3 | | | | -22.1 | | | | -8.5 | | | | -4.8 | | | | 0.0 | |
| U.S. Housing starts | | | 7.0 | | | | 3.6 | | | | -1.4 | | | | -2.1 | | | | -1.5 | | | | 0.8 | | | | 1.6 | | | | 0.0 | |
| SPF 2x4 price ($US/thousand board feet) | | $ | 570 | | | $ | 650 | | | $ | 475 | | | $ | 450 | | | $ | 380 | | | $ | 360 | | | $ | 350 | | | $ | 350 | |
| Exchange rate (US cents/Canadian dollar) | | | 74.6 | | | | 79.0 | | | | 79.0 | | | | 78.0 | | | | 76.3 | | | | 76.1 | | | | 77.0 | | | | 77.5 | |
| Fiscal Year | | 2020/21 | | | 2021/22 | | | 2022/23 | | | 2023/24 | | | 2020/21 | | | 2021/22 | | | 2022/23 | | | 2023/24 | |
| Natural gas price ($Cdn/GJ at plant inlet) | | $ | 1.23 | | | $ | 1.48 | | | $ | 1.48 | | | $ | 1.50 | | | $ | 0.62 | | | $ | 0.74 | | | $ | 0.88 | | | $ | 0.96 | |
| Bonus bid average bid price per hectare ($) | | $ | 0 | | | $ | 0 | | | $ | 200 | | | $ | 300 | | | $ | 350 | | | $ | 350 | | | $ | 350 | | | $ | 300 | |
| Electricity price ($US/mega-watt hour, Mid-C) | | $ | 27 | | | $ | 37 | | | $ | 34 | | | $ | 33 | | | $ | 34 | | | $ | 36 | | | $ | 34 | | | $ | 35 | |
| Metallurgical coal price ($US/tonne, fob Australia) | | $ | 135 | | | $ | 136 | | | $ | 145 | | | $ | 148 | | | $ | 155 | | | $ | 155 | | | $ | 152 | | | $ | 152 | |
| Copper price ($US/lb) | | $ | 3.05 | | | $ | 3.52 | | | $ | 3.35 | | | $ | 3.20 | | | $ | 2.81 | | | $ | 2.90 | | | $ | 2.97 | | | $ | 3.07 | |
| Average stumpage rates ($Cdn/cubic metre) | | $ | 23.32 | | | $ | 24.21 | | | $ | 19.05 | | | $ | 18.36 | | | $ | 16.83 | | | $ | 16.03 | | | $ | 15.67 | | | $ | 15.46 | |
| Crown harvest volumes (million cubic metres) | | | 46.0 | | | | 46.0 | | | | 45.0 | | | | 45.0 | | | | 46.0 | | | | 46.0 | | | | 46.0 | | | | 45.0 | |
Other revenue consists of fees, licences, investment earnings and other miscellaneous sources, incorporating estimates provided by ministries and taxpayer-supported agencies. Over the next three years, these revenues are projected to average 3.3 per cent annual growth, slightly lower than the Budget 2021 real GDP outlook.
Federal government contributions in 2020/21 include one-time COVID-19 related funding; as a result, the forecast for 2021/22 shows a 21.2 per cent decline year-over-year.The federal contributions are expected to increase by 1.8 per cent annually over the next two years mainly due to expected increases in the Canada Health Transfer (CHT) and the Canada Social Transfer (CST) disbursements. The combined CHT and CST contributions are forecast to average 3.9 per cent annual growth over next two years in the fiscal plan and represent about 77 per cent of total federal government contributions. Other federal government transfers are projected to decline at an average of 1.8 per cent annually over the three-year fiscal plan.
The net income of commercial Crown corporations is expected to average 5.9 per cent growth annually over the next three years reflecting a full recovery of BC Lottery Corporation’s net income to pre-pandemic levels, and stable growth in the other agencies. More details on commercial Crown corporations net income are provided beginning on page 44.
Budget and Fiscal Plan - 2021/22 to 2023/24
39
Three Year Fiscal Plan
Major Revenue Sources
Key assumptions and sensitivities relating to revenue are provided in Appendix Table A5. The assumptions and factors that are the major drivers for preparing projections of individual revenue sources include sensitivities which provide a sense of potential impacts to revenue projections if there are changes to these underlying assumptions and factors. The following text references the forecasts of these assumptions and factors in explaining individual revenue sources. An analysis of historical volatility of the economic variables related to revenue sources can be found in the 2020 British Columbia Financial and Economic Review (pages 16-17). The major revenue components are detailed below.
Taxation revenue
Personal income tax revenue is forecast to average 2.7 per cent growth over the next three years, in line with projected increases in wages and salaries and household income.
Corporate income tax revenue is mainly based on cash instalments and settlement adjustments for prior years; this often results in a year-over-year volatility which is exacerbated by the effects of the pandemic. Revenue is expected to decline 29.1 per cent in 2021/22 mainly due to a decrease in instalments for 2021 tax year reflecting the effects of COVID-19 pandemic on the national corporate tax base and a lower settlement payment for prior years. Average annual growth over the next two years is forecast to be 29.7 per cent due to annual increases in instalments reflecting the federal government’s projection of national corporate taxable income as well as annual changes in settlement payments relating to prior years.
Table 1.5.2 Corporate Income Tax Revenue
| ($ millions) | | 2020/21 | | | 2021/22 | | | 2022/23 | | | 2023/24 | |
| Advance instalments: | | | | | | | | | | | | | | | | |
| – Payment share | | | 14.41 | % | | | 13.32 | % | | | 14.42 | % | | | 14.32 | % |
| – Instalments | | | 4,899 | | | | 4,371 | | | | 5,462 | | | | 5,772 | |
| Prior-years’ settlement payment | | | (92 | ) | | | (962 | ) | | | 266 | | | | (36 | ) |
| Corporate income tax revenue | | | 4,807 | | | | 3,409 | | | | 5,728 | | | | 5,736 | |
| Annual per cent growth | | | -4.1 | % | | | -29.1 | % | | | 68.0 | % | | | 0.1 | % |
Provincial sales tax revenue is expected to average 6.0 per cent growth annually over the three-year fiscal plan, in line with expected increases in nominal GDP and consumer expenditures on taxable goods and services. The forecast incorporates the exemption for electric bicycles and tricycles effective April 21, 2021 outlined in Part 2: Tax Measures and the effect of delaying tax measures initially announced in Budget 2020.
Table 1.5.3 Sales Tax Revenue
| ($ millions) | | 2020/21 | | | 2021/22 | | | 2022/23 | | | 2023/24 | |
| Provincial sales taxes | | | 7,446 | | | | 7,872 | | | | 8,492 | | | | 8,865 | |
| Annual per cent change (calendar year) | | | 2020 | | | | 2021 | | | | 2022 | | | | 2023 | |
| Consumer expenditures on durable goods | | | -2.3 | % | | | 2.6 | % | | | 3.1 | % | | | 2.8 | % |
| Consumer expenditures on goods and services | | | -4.8 | % | | | 5.3 | % | | | 5.9 | % | | | 5.7 | % |
| Residential investment | | | -6.9 | % | | | 3.5 | % | | | 4.6 | % | | | 4.8 | % |
| Government expenditures | | | 13.6 | % | | | -0.4 | % | | | 3.7 | % | | | 2.2 | % |
| Nominal GDP | | | -4.5 | % | | | 6.4 | % | | | 5.4 | % | | | 4.0 | % |
| Retail sales | | | 2.6 | % | | | 3.7 | % | | | 3.4 | % | | | 3.4 | % |
Budget and Fiscal Plan - 2021/22 to 2023/24
40
Three Year Fiscal Plan
Motor fuel tax revenue growth is expected to average 1.3 per cent annually over the three-year plan. Diesel volumes are forecasted to grow 2 per cent annually and other fuel volumes rise in line with real GDP growth. In 2023/24 the forecast assumes that gasoline purchases decline due to provincial policy measures relating to clean energy initiatives.
Carbon tax revenue is forecast to rise an average of 8.9 per cent annually over the next three years as the carbon tax rate increases from $45/tonne of CO2 equivalent emissions in 2021/22 to $50 in 2022/23. In 2023/24 the revenue is projected to decline in line with provincial policy measures relating to clean energy initiatives.
Tobacco tax revenue is projected to be $780 million in 2021/22 and $800 million in the following two years of the fiscal plan. The forecast incorporates increased tobacco tax rates, effective July 1, 2021.
Property tax revenue is expected to grow 27.8 per cent in 2021/22 due to a return to pre-pandemic tax rates for commercial properties in the 2021 tax year. The temporary tax relief measure for commercial property owners in the 2020 tax year was estimated at $714 million. The tax revenue is expected to grow by an average of 4.3 per cent annually over the following two years, consistent with expected housing starts, non-residential investment and inflation.
Property transfer tax revenue is expected to decline slightly in 2021/22 reflecting an anticipated moderation of market activity in 2022 and assuming a portion of strong revenues received in 2020/21 do not carry forward. This decline is expected to be followed by an average annual decline of 2.5 per cent over the next two years, consistent with the expected annual changes in residential sales values.
Employer health tax revenue is forecast at $1.9 billion in 2021/22. Over the next two years, revenue growth is expected to average 3.8 per cent annually, consistent with growth in wages and salaries.
More information on tax measures is detailed in Part 2: Tax Measures.
Natural resource revenue
Natural gas royalties are expected to increase 49.7 per cent in 2021/22 mainly due to higher natural gas prices, increased royalties from natural gas liquids and an improved outlook for natural gas production volumes, partially offset by increased utilization of royalty program credits. Over the next two years, royalties are expected to increase at a 13.1 per cent average annual rate as the effects of rising prices and production volumes and increasing royalties from natural gas liquids are partially offset by increased utilization of royalty programs and infrastructure credits.
The forecast assumes an average price of $1.48 ($Cdn/gigajoule, plant inlet) in 2021/22, up from $1.23 in 2020/21. This assumption is within the 20th percentile of the private sector forecasters, continuing the prudence incorporated since 2013/14. Prices are expected to increase over the next two years, averaging $1.48 in 2022/23 and $1.50 in 2023/24, consistent with the growth of the average of the private-sector forecasts. Over the three-year fiscal plan period, the projected natural gas prices average 14 cents lower than the average of the private-sector forecasters.
See Appendix Table A6 for more details regarding natural gas price forecasts.
Budget and Fiscal Plan - 2021/22 to 2023/24
41
Three Year Fiscal Plan
Revenue from bonus bids and rents on drilling licences and leases is forecast to decline over the next three years, from $165 million in 2020/21 to $110 million in 2023/24. The decrease is due to declining deferred revenue. The bonus bid revenue recognition reflects ten-year deferral of cash receipts from sale of Crown land tenures. Cash sales are expected to increase from no sales in 2021/22 to $6 million in 2023/24. More detail is provided in Appendix Table A5.
Mining and minerals: Revenue from mineral tax, fees and miscellaneous mining receipts is forecast to increase 54.3 per cent in 2021/22 mainly due to improving prices and production volumes for coal and copper, reflecting increased global demand. Coal forecasts have improved due to increased demand from China while copper forecasts have benefited from global stimulus spending by governments and corporations through increased electrification and reductions to carbon emissions. Over the next two years revenue is projected to average a 31.3 per cent annual increase mainly due to the expected improvement in mining taxes from coal operations.
Chart 1.3 Revenue from Energy, Metals, and Minerals
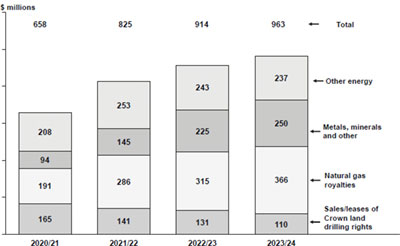
Other energy revenue is comprised of electricity sales under the Columbia River Treaty, petroleum royalties, and fees collected by the Oil and Gas Commission. These revenues are expected to increase by an average of 4.4 per cent annually over the three-year fiscal plan mainly due to higher Mid-Columbia electricity prices.
Forest revenue is expected to increase 7.4 per cent in 2021/22 due to the impacts of higher overall stumpage rates and logging tax revenue mainly reflecting improved outlook for lumber prices. Forest revenue is expected to decline an average of 12.8 per cent annually over the following two years mainly due to lower expected overall stumpage rates, lower harvest levels and lumber prices decreasing from the historically high levels experienced in early 2021. Total harvest levels on Crown land are projected to decrease from 46 million cubic metres in 2021/22 to 45 million cubic metres over the next two years. Over the four years to 2023/24, the forecast assumes that the Ministry of Indigenous Relations and Reconciliation will recover $167 million of stumpage revenue in support of funding the Forest Consultation and Revenue Sharing Agreements with First Nations.
Budget and Fiscal Plan - 2021/22 to 2023/24
42
Three Year Fiscal Plan
Other natural resource revenue is comprised of water rentals and fees for hunting and fishing licences collected under the Wildlife Act. These revenues are expected to increase an average of 5.4 per cent annually over the next three years mainly reflecting higher water rentals collected under the Water Sustainability Act.
Other Taxpayer-Supported Revenue
Fees and licences: Over the three-year fiscal plan, revenue from fees and licences is expected to average 3.1 per cent annual growth mainly due to increasing projections for post-secondary institutions, the K-12 sector and health authorities. Over the next three years, fee revenue projections from the Schools, Universities, Colleges, and Health (SUCH) sector account for over 70 per cent of the total fee revenue forecast.
Investment earnings are expected to decline an average of 0.5 per cent annually over the three-year fiscal plan mainly due to lower recoveries through the fiscal agency loan program. Lower revenue from these recoveries has an equal and offsetting lower expense resulting in no net impact on the projected annual surplus. These recoveries are expected to comprise approximately 74 per cent of total investment earnings.
Miscellaneous revenue is projected to average 4.9 per cent annual growth over the fiscal plan period. Over 54 per cent of the total miscellaneous revenue of approximately $3.5 billion is expected to be collected by SUCH sector entities.
Federal Government Transfers
Canada Health Transfer and Canada Social Transfer contributions are expected to decline 4.2 percent in 2021/22 mainly due to an additional one-time $542 million contribution included in 2020/21 forecast, supporting the recovery of the health care systems following the pandemic. Over the next two years, contributions are expected to increase at a 3.9 per cent average annual rate mainly reflecting increasing national cash transfers and a rising B.C. population share of the national total. The plan assumes the national Canada Health Transfer (CHT) cash disbursement increases 3.0 per cent in the first two years of the plan, followed by an increase of 5.5 per cent in 2023/24. The national CHT cash disbursement in 2021/22 is based on a three-year average (2019 to 2021) of Canada’s nominal GDP growth, subject to a minimum annual growth rate of 3.0 per cent. The forecast adopts the most recent federal government outlook for national nominal GDP. The national CST cash disbursement is projected to increase 3.0 per cent annually, consistent with the federal government forecast.
COVID-19 pandemic relief funding in the 2020/21 to 2022/23 totals $2,831 million and includes funding in support of the following:
| • | Safe Return to Class funding ($242 million) |
| • | Safe Restart Agreement ($1,963 million) |
| • | COVID-19 Essential Workers Support Fund ($371 million) |
| • | Canada’s COVID-19 Immunization Plan ($135 million) |
| • | Financial Assistance Agreement to Support Closure and Restoration of Oil and Gas Sites in British Columbia ($120 million) |
Budget and Fiscal Plan - 2021/22 to 2023/24
43
Three Year Fiscal Plan
Table 1.5.4 Federal Government Contributions
| ($ millions) | | 2020/21 | | | 2021/22 | | | 2022/23 | | | 2023/24 | |
| Canada Health Transfer | | | 6,243 | | | | 5,843 | | | | 6,017 | | | | 6,353 | |
| Canada Social Transfer | | | 2,042 | | | | 2,096 | | | | 2,159 | | | | 2,225 | |
| Total Health and Social Transfers | | | 8,285 | | | | 7,939 | | | | 8,176 | | | | 8,578 | |
| COVID-19 related funding | | | 2,616 | | | | 175 | | | | 40 | | | | — | |
| Disaster Financial Assistance Agreements | | | 147 | | | | — | | | | 62 | | | | 145 | |
| Low Carbon Economy Leadership Fund | | | 29 | | | | 13 | | | | 2 | | | | — | |
| BC Housing Management Commission | | | 208 | | | | 166 | | | | 152 | | | | 157 | |
| Ministry Vote Recoveries | | | 1,094 | | | | 1,294 | | | | 1,068 | | | | 1,046 | |
| Other Transfers to Ministries and Agencies | | | 981 | | | | 943 | | | | 964 | | | | 984 | |
| Total Other Contributions | | | 2,459 | | | | 2,416 | | | | 2,248 | | | | 2,332 | |
| Total Federal Government Contributions | | | 13,360 | | | | 10,530 | | | | 10,464 | | | | 10,910 | |
| BC share of national population (June 1) | | | 13.55 | % | | | 13.55 | % | | | 13.55 | % | | | 13.56 | % |
Other federal government contributions are expected to decline an average of 1.8 per cent annually over the fiscal plan. These contributions include B.C.’s share of the federally imposed cannabis duty, funding under the Disaster Financial Assistance Arrangements, as well as transfers in support of housing initiatives, labour market development, home care, mental health, public transit and other ministry programs.
Commercial Crown Corporations
British Columbia Hydro and Power Authority (BC Hydro): BC Hydro’s net income is set by regulation at $712 million in 2021/22 and 2022/23 and is forecast to remain at $712 million in 2023/24. The payment of dividends was phased out to assist with stabilizing rate increases and improve BC Hydro’s capital structure to a 60:40 debt-to-equity ratio (currently 80:20). No dividend payments are forecast during the fiscal plan period.
British Columbia Liquor Distribution Branch (LDB): LDB is projecting a net income of $1.099 billion in 2021/22 and growing to $1.146 billion in 2023/24. The forecast is lower than at Budget 2020, which reflects a reduced mark-up after the Province’s implementation of wholesale pricing for liquor licencees, such as restaurants, bars and pubs (estimated at $71 million annually).
British Columbia Lottery Corporation (BCLC): BCLC’s operations were disrupted due to the pandemic, with the closure of all gambling facilities for the entire 2020/21 fiscal year in compliance with provincial health orders. BCLC’s net income is forecast to recover to pre-pandemic levels over the fiscal plan from $383 million in 2020/21, to $1.4 billion in 2023/24 (net of payments under the Province’s gaming revenue sharing agreement with First Nations, and $11 million in annual payments to the federal government). Government will distribute approximately 25 per cent of its gaming income to charities, First Nations, and local governments.
Insurance Corporation of British Columbia (ICBC): ICBC is forecasting positive net incomes for 2021/22 and beyond, including $154 million in 2021/22, $202 million in 2022/23, and $229 million in 2023/24. Amongst other changes, this forecast includes the continuation of the positive effects from the April 1, 2019 product reform changes; declining crash frequency trends; the COVID-19 rebate in respect of 2020/21; and the May 1, 2021 transition to the new enhanced care-based system.
For more information relating to commercial Crown corporations, please see Service Plans listed on the Budget 2021 website or the corporations’ respective websites.
Budget and Fiscal Plan - 2021/22 to 2023/24
44
Three Year Fiscal Plan
A Collaborative Approach to Address COVID-19 Through Partnership with the Federal Government
British Columbians have benefitted from the complementary efforts of both the provincial and federal governments in responding to COVID-19.
Through the Safe Restart Program and other supports, the federal government provided B.C. with over $3 billion to increase pandemic response in health care, child care, schools, infrastructure and emergency supports for the province’s most vulnerable people. This includes over $1.3 billion for a number of provincial-federal cost shared programs, including: supports for local governments and transit providers; financial relief for commercial tenants; and temporary pandemic pay for frontline workers. While these pandemic-related federal supports have largely ended, the pandemic and its wide-ranging impacts have not. The collaborative investments that have supported British Columbians during the pandemic will continue to be needed as we emerge from the pandemic and move towards recovery.
The pandemic’s impacts made it clear that there were gaps in the social safety net in Canada, gaps which were addressed on a short-term basis through the B.C. Emergency Benefit for Workers, crisis supplements, and the B.C. Recovery Benefit, as well as federal measures such as Canada Emergency Response Benefit and the federal sickness, caregiver and recovery benefits, and temporary changes to make employment insurance more accessible and flexible. B.C. supports making the temporary changes to employment insurance permanent and welcomes any opportunities to work with the federal government to address other gaps in the safety net, such as permanent paid sick leave.
The pandemic increased health care costs substantially in 2020/21, and it will have lasting impacts on health care going forward. Even before the pandemic, provincial health care systems were under strain from known cost drivers such as inflation, population growth, and aging. System funding pressure was further exacerbated by the federal decision to proceed with a reduction in the growth rate of the Canada Health Transfer in 2017-18. While one-time federal funding has helped with the immediate pressures of the pandemic, it does not address the long-term funding partnership. The Parliamentary Budget Officer has indicated that the federal government is in a position to permanently increase spending over the long term. Premiers have made enhancing long-term federal health care funding their top priority for federal negotiations. This includes calling for increasing the Canada Health Transfer to 35 per cent of provincial/territorial health care spending and adopting a growth rate that maintains that federal share, as discussed in provincial/territorial finance ministers’ February 2021 report to the Council of the federation.
B.C. joins other provinces in calling for additional improvements to the federal government’s Fiscal Stabilization program that are needed to address significant annual declines in provincial revenues due to extraordinary economic circumstances such as those brought about as a result of the COVID-19 pandemic.
As the province looks ahead, there is an ongoing need for targeted federal investments to help B.C. to build back better; such investments are needed to support infrastructure projects, expand broadband and cellular access, increase skills training to help people get back in the workforce and increase access to child-care which is essential to our recovery. British Columbia joins other provinces and territories in requesting that a meaningful portion of federal stimulus funding be earmarked for key provincial priorities to recognize the important role provinces and territories are playing in fostering economic growth. This would help B.C. continue to boost recovery and bolster the province’s economic resilience.
Budget and Fiscal Plan - 2021/22 to 2023/24
45
Three Year Fiscal Plan
Capital Spending
In Budget 2021, capital spending on schools, hospitals, roads, bridges, housing, hydro-electric projects and other infrastructure around the province is expected to total $39.5 billion over the three-year fiscal plan period. These investments will help ensure that the necessary infrastructure is in place to deliver the services that people count on in communities around the province and create jobs that support a strong and sustainable economy. For more information on how infrastructure investments are supporting economic recovery and a stronger BC please see the topic box on page 28.
Taxpayer-Supported Capital Spending
Taxpayer-supported capital spending over the next three years will total $26.4 billion, the highest level ever. This includes completion of existing approved projects along with new investments to expand and sustain provincial infrastructure including schools, post-secondary facilities, affordable housing, roads, bridges and hospitals. The Budget 2021 three-year total is $3.5 billion higher than Budget 2020 mainly due to new capital spending in the areas of health, education and transportation, as well as revised timing for capital projects.
Table 1.6 Capital Spending
| ($ millions) | | Updated
Forecast
2020/21 | | | Budget
Estimate
2021/22 | | | Plan
2022/23 | | | Plan
2023/24 | |
| Taxpayer-supported | | | | | | | | | | | | | | | | |
| Education | | | | | | | | | | | | | | | | |
| Schools (K–12) | | | 972 | | | | 1,197 | | | | 1,114 | | | | 1,187 | |
| Post-secondary institutions | | | 931 | | | | 1,263 | | | | 1,271 | | | | 1,261 | |
| Health | | | 1,533 | | | | 2,245 | | | | 2,603 | | | | 2,972 | |
| BC Transportation Financing Authority | | | 1,525 | | | | 2,162 | | | | 2,539 | | | | 2,264 | |
| BC Transit | | | 114 | | | | 113 | | | | 199 | | | | 257 | |
| Government ministries | | | 435 | | | | 641 | | | | 521 | | | | 457 | |
| Social housing 1 | | | 679 | | | | 671 | | | | 574 | | | | 335 | |
| Other 2 | | | 88 | | | | 187 | | | | 204 | | | | 139 | |
| Total taxpayer-supported | | | 6,277 | | | | 8,479 | | | | 9,025 | | | | 8,872 | |
| Self-supported | | | | | | | | | | | | | | | | |
| BC Hydro | | | 3,573 | | | | 4,738 | | | | 4,413 | | | | 3,305 | |
| Columbia Basin power projects 3 | | | 8 | | | | 9 | | | | 13 | | | | 25 | |
| BC Railway Company | | | 3 | | | | 11 | | | | 4 | | | | 2 | |
| ICBC | | | 107 | | | | 68 | | | | 42 | | | | 46 | |
| BC Lottery Corporation | | | 89 | | | | 96 | | | | 120 | | | | 90 | |
| Liquor Distribution Branch | | | 32 | | | | 54 | | | | 48 | | | | 21 | |
| Total self-supported commercial | | | 3,812 | | | | 4,976 | | | | 4,640 | | | | 3,489 | |
| Total capital spending | | | 10,089 | | | | 13,455 | | | | 13,665 | | | | 12,361 | |
1 Includes BC Housing Management Commission and Provincial Rental Housing Corporation.
2 Includes BC Pavilion Corporation, Royal BC Museum and other service delivery agencies.
3 Joint ventures of the Columbia Power Corporation and Columbia Basin Trust.
Budget and Fiscal Plan - 2021/22 to 2023/24
46
Three Year Fiscal Plan
Investments in Schools
Over the three years of the fiscal plan, approximately $3.5 billion will be invested to maintain, replace, renovate or expand K-12 facilities. This includes continued investment in new school space to accommodate increasing enrollment in growth districts, as well as in the program to seismically upgrade or replace schools.
Examples of K-12 capital investments in Budget 2021 include:
| • | The new Stitos Elementary Middle School in the Chilliwack School District will provide 930 new spaces for students in kindergarten to Grade 8. This new school has a total budget of $53.6 million, will be designed to meet LEED gold standards, and is scheduled to be complete in September 2022. It will feature a neighbourhood learning centre with space for child care programming. |
| • | Cowichan Secondary in the Cowichan Valley School District is being replaced under the ministry’s Seismic Mitigation Program. The school will be replaced with a 1,100-student-capacity secondary school on its current site. The $82-million replacement school is scheduled to be complete in 2024 and will be partially funded by the Cowichan Valley School District. The neighbourhood learning centre will include a Gathering Place, Elder Place and an Audio Recording Room for Indigenous language. |
| • | Two schools in the Pacific Rim School District will be upgraded and partially replaced under the ministry’s Seismic Mitigation Program. The $45-million project will deliver a 240-student-capacity Ucluelet Elementary and a 250-student-capacity Ucluelet Secondary. The schools are scheduled to open in 2022. Included in the project is a neighbourhood learning centre that will feature space for child care programming. |
| • | The new Grandview Heights Secondary School is currently under construction in the Surrey School District and will provide 1,500 new spaces for students in Grade 8 to 12. This new school has a total budget of $82.8 million, is designed to meet LEED gold standards, and is scheduled to be complete in September 2021. |
| • | The new Regent Road Elementary School is currently under construction in the Surrey School District and will provide 655 new spaces for students in Grade K to 7. This new school has a total budget of $33.3 million, is designed to meet LEED gold standards, and is scheduled to be complete in September 2022. |
| • | The new Tatalu Elementary School in the Surrey School District will provide 655 new spaces for students in Grade K to 7. This new school has a total budget of $44.1 million, will be designed to meet LEED gold standards, and is scheduled to be complete in 2023. It will feature a neighbourhood learning centre with space for child care programming. |
| • | The new Southwest Yorkson Elementary School is currently under construction in the Langley School District and will provide 555 new spaces for students in Grade K to 5. This new school has a total budget of $32.2 million, is designed to meet LEED gold standards, and is scheduled to be complete in September 2021. It will feature a neighbourhood learning centre with space for child care programming. |
| • | The new Hornby Island Community School is currently under construction in the Comox Valley School District and will replace the old school, which was destroyed by fire in 2018. The new school has a budget of $10.4 million and is scheduled to be complete in early 2022. This school will provide 95 spaces for grades K to 7 students and will have a neighbourhood learning centre in the form of a larger gym. The gym is the largest indoor space on the island and will act as a community hub. |
Budget and Fiscal Plan - 2021/22 to 2023/24
47
Three Year Fiscal Plan
| • | The upgraded and renovated Gudangaay Tlaats’gaa Naay School in the Haida Gwaii School District will be made seismically safe and will convert a secondary school to accommodate students in Grade K to 12. This project has a total budget of $16.5 million and is scheduled to be complete in fall 2022. The project will reduce district costs associated with operating two underutilized facilities and will ensure students are in safe seats. The project also includes the construction of a tsunami tower, as this school is located in a low-lying area that is vulnerable to tsunamis and without an adequate evacuation route. |
| • | The new Parkcrest Elementary School in the Kamloops-Thompson School District will replace the previous school destroyed by a fire in 2019 and will provide 510 spaces for students in Grade K to 6. This new school has a budget of $37.3 million, will be designed to reduce greenhouse gas emissions and annual energy costs, and is scheduled to be complete in September 2024. It will feature a neighbourhood learning centre with space for child care programming. The school will also feature a larger gymnasium funded by the City of Kamloops. |
| • | Two new schools are approved for the Sooke School District. The $89 million project will bring a new 500-student-capacity Pexsisen Elementary, and a new 700-student-capacity Centre Mountain Lellum Middle school. The elementary school will feature a neighbourhood learning centre, with space for child care programming. The two new schools are scheduled to open in September 2022. |
| • | Quesnel Junior School in the Quesnel School District is approved for replacement on a new site, to address the significant structural and building conditions issues at the school. This new 550-student-capacity middle school has a total budget of $52.4 million, will be designed to meet LEED gold standards, and is scheduled to be complete in 2022. |
Spending to Support Post-Secondary Education
Budget 2021 includes $3.8 billion in total capital spending over the next three years by post-secondary institutions throughout the province. Investments in priority projects will build capacity and help meet the province’s future workforce and economic development needs in key sectors, including health, science, trades and technology. A significant portion of this capital investment is funded through other sources, including foundations, donations, internal sources, revenues generated from services, and federal funding.
Current and planned investments in the post-secondary sector include:
| • | Construction of a new $88-million health science building at British Columbia Institute of Technology’s Burnaby campus. The new building will provide flexible simulation space for health education. |
| • | $10 million to modernize space to expand programming focused on the technology sector at British Columbia Institute of Technology’s downtown Vancouver and Burnaby campuses. |
| • | $13-million renovation to the Library & Academic Building at Coast Mountain College’s Terrace campus to provide a dedicated space for students to study, modernized registration and learning spaces, and address issues following a flood in 2018. |
Budget and Fiscal Plan - 2021/22 to 2023/24
48
Three Year Fiscal Plan
| • | $27-million National Centre for Indigenous Laws as an addition to the Fraser Law building at the University of Victoria that will be home to the world’s first joint degree in Indigenous legal orders and Canadian common law, as well as the Indigenous Law Research Unit. |
| • | $15 million for a new First Peoples Gathering House at Simon Fraser University’s Burnaby campus, which contains a large Ceremonial Hall for ceremonies and learning events. |
| • | The provincial student housing program, announced in 2018, to build approximately 5,000 new student housing beds at B.C.’s public post-secondary institutions. Examples of approved projects include: |
| – | $68 million to construct five new mass timber student housing buildings with 376 beds at Okanagan College, across three campuses — Kelowna, Vernon and Salmon Arm. |
| – | $114 million to build a 12-storey mass timber student housing building with 464 beds at British Columbia Institute of Technology’s Burnaby campus. |
| – | $232 million to construct two student housing buildings at the University of Victoria. The buildings include 621 net new beds, a dining facility and multi-purpose program space. |
| – | $104 million to build a student housing building with 386 beds and to renovate and expand the current dining facility at the Simon Fraser University Burnaby campus. |
| – | $25 million to build a 220-bed student housing building at the University of British Columbia Okanagan campus. |
| • | Three grant-supported projects for student housing projects located in rural regions: |
| – | $5 million to construct 12 beds for Indigenous students at the College of New Caledonia Prince George campus. |
| – | $19 million to construct 100 student housing beds at the College of the Rockies in Cranbrook. |
| – | $22 million to replace and expand housing for 104 students (33 net new beds) at the Coast Mountain College’s Terrace campus. |
| • | The B.C. Knowledge Development Fund provides capital investment funding for vital research infrastructure for public post-secondary institutions, teaching hospitals and affiliated non-profit agencies across the province, enabling institutions to attract researchers and skilled technicians. Examples of approved projects include: |
| – | $11 million for specialized equipment to develop a facility, with capabilities for the study of quantum systems under normal and extreme conditions. Quantum mechanics, which provides a description of the microscopic world of atoms and their constituents, is fundamental to materials being developed for transformational technologies, such as green chemicals, electric vehicle batteries and efficient and safer nuclear power plants. Simon Fraser University is leading the collaboration with McMaster University, Mount Alison University, UBC, TRIUMF and the Université de Montréal. |
Budget and Fiscal Plan - 2021/22 to 2023/24
49
Three Year Fiscal Plan
| – | $10 million for specialized equipment for the development and installation of an independent, symbiotic target module at TRIUMF’s ARIEL facility at the UBC Vancouver campus to harness residual proton beam remains left over from other experiments and use them to produce medical isotopes, which can be processed and distributed to partners across Canada for use in the development of novel therapeutic radiopharmaceuticals, helping to launch a new generation of cancer therapies at the BC Cancer Agency and other partners. |
| – | $9.5 million for specialized equipment to develop a state-of-the-art facility intended to revolutionize understanding of the ocean and what drives ocean and climate variability, allowing better prediction of weather, climate changes, and fish stocks, to help move towards carbon-free energy sources by exploiting ocean waves and wind. The Canadian Pacific Robotic Oceanic Observing Facility (C-PROOF) will be led by the University of Victoria, and data sent to Ocean Networks Canada for distribution across the world. |
Expanding and Upgrading Health Facilities
Capital spending on infrastructure in the health sector will total $7.8 billion over the next three years. These investments support new major construction projects and upgrading of health facilities, medical and diagnostic equipment, and information management/technology systems. These investments are supported by funding from the Province as well as other sources, such as regional hospital districts and foundations.
Key capital investments in the health sector include:
| • | A new St. Paul’s Hospital at the Station Street site in Vancouver, which will include capacity for 548 inpatient beds, a new and larger emergency department, a surgical suite, consolidated specialty outpatient clinics and an underground parkade. Construction started in March 2021 and the new hospital is expected to be open for patients in early 2027. |
| • | A net-new integrated hospital and cancer centre in Surrey to help meet the needs of a growing and aging population in the region. The new hospital will include 168 inpatient beds, emergency department, medical imaging department including computed tomography (CT) and magnetic resonance imaging (MRI), surgical suite, pharmacy, laboratory, and academic space. The new cancer centre will include an oncology ambulatory care unit, chemotherapy, radiation therapy, functional imaging, and a new cyclotron. Construction is planned to begin in summer 2023 and the new facility is expected to be open for patients in summer 2027. |
| • | Phase 2 of the Royal Columbian Hospital Redevelopment, which includes a new 348-bed acute care tower with six floors of inpatient beds, including critical care and maternity, a new and expanded emergency department, a new surgical and interventional suite with 18 operating rooms and an underground parkade. Procurement started in fall 2018 and completed in 2020. Construction started in December 2020 and the new acute care tower is expected to open for patients in 2025. |
| • | Replacement of the 54-year-old Cowichan District Hospital in Duncan with a new hospital on a greenfield site in North Cowichan. The replacement hospital will increase inpatient beds from 134 to 201 and increase emergency department treatment spaces from 17 to 36. The facility will also increase the number of operating rooms, replace the mobile MRI with a fixed MRI, and add a helipad to the roof of the inpatient tower. Construction is expected to start in spring 2022 and be completed in 2026. |
Budget and Fiscal Plan - 2021/22 to 2023/24
50
Three Year Fiscal Plan
| • | Replacement of the Mills Memorial Hospital in Terrace, which was originally built in 1959. The new hospital will include 78 inpatient beds, an increase of 34 beds. Construction is planned to start in 2021 and be completed in 2024. Demolition and site redevelopment will continue until 2026. |
| • | Phase 1 of the Burnaby Hospital Redevelopment, which involves construction of a new patient care tower, new energy centre, renovation and expansion of the Support Facilities Building, minor renovation of the nursing tower and demolition of the West Wing and Cascade Buildings. The new six-storey tower will accommodate relocated services, including medical and surgical inpatient services, outpatient services, a consolidated maternity/labour and delivery unit, and a mental health and substance use patient unit. Renovations and expansion of the support facilities building will improve access to care by providing additional operating rooms, a new medical device reprocessing department, additional parking, and renovations to key support services. Construction is expected to start in 2021 and be completed in 2025. |
| • | A new 107-bed patient care tower at the Royal Inland Hospital in Kamloops that will improve patient experience and outcomes by significantly increasing the number of single-patient rooms, providing new and larger operating rooms, and expanding the existing emergency department. Construction on the new patient care tower started in fall 2018 and it is expected to open to patients in 2022. Internal renovations to the emergency department, pediatric unit and morgue are scheduled to begin in 2022 and be completed in 2024. |
| • | Replacement of the Dawson Creek and District Hospital on a 10-acre greenfield site in Dawson Creek. The new hospital will include 70 inpatient beds, an increase of 24 beds. The emergency department, surgical and operating room space and ambulatory care services will also be expanded. Construction of the new hospital is expected to commence in 2022 and be completed in 2026. |
| • | A new patient care tower, including a surgical services centre, at the Penticton Regional Hospital that will improve patient experience and outcomes. The new patient care tower opened in April 2019. A second phase involving renovations to the existing emergency department and pharmacy started in 2019 and is planned to complete in 2022. |
| • | Redevelopment of the Cariboo Memorial Hospital in Williams Lake. The project includes construction of a three-storey addition and renovation of vacated spaces in the existing hospital. Once the project is complete, the redeveloped hospital will include 53 inpatient beds, an increase of 25 beds, and a new and larger emergency department. Construction of the three-storey addition is planned to start in 2021 and expected to be completed in 2023. The renovations are planned to begin in 2023 and be completed in 2026. |
| • | Replacement of the Stuart Lake Hospital in Fort St. James. The hospital will be built on the same site as the existing one. Once complete, the existing facility will be demolished to make way for parking. The new hospital will be three times larger than the current facility. The project scope includes an emergency department with two treatment rooms, a trauma bay and ambulance bay, and a primary care centre that will consolidate services currently offered in Fort St. James. Construction is expected to begin in 2022 and complete in 2024. |
Budget and Fiscal Plan - 2021/22 to 2023/24
51
Three Year Fiscal Plan
Supporting the Transportation Investment Plan
Budget 2021 includes further investments in government’s Transportation Investment Plan. The Province has secured federal cost sharing on projects and has also leveraged investments through partnerships with private organizations. B.C. continues to work with federal and municipal governments to confirm priorities for funding under the Investing in Canada Infrastructure Program and pursue federal funding available through merit-based Investing in Canada Plan infrastructure programs.
Over the three years of the fiscal plan, transportation capital investments totalling $7.5 billion will maintain the flow of people and goods to support the B.C. economy. Timing of capital spending on these projects is subject to several factors, including funding from partners such as the federal government infrastructure programs and market conditions.
Examples of key capital investments in the transportation sector include:
| • | Replacing the Pattullo Bridge with a new four-lane bridge (expandable to six-lanes) that meets current seismic and road design standards and the removal of the existing bridge. It will provide a safe and reliable crossing for vehicles, pedestrians and cyclists, and network connections in Surrey and New Westminster. |
| • | Obtaining a final decision on the scope, budget, delivery and schedule for the George Massey Crossing and interim works projects and completing planning for the Surrey-Langley SkyTrain and Highway 1 widening from Langley to Whatcom Road in Abbotsford projects, to meet the needs of growing regions and ease congestion in key corridors. |
| • | Constructing the Broadway Subway, which will add 5.7 kilometres of SkyTrain line and six stations, to provide frequent and reliable access to one of the most congested transit corridors in Metro Vancouver, meet current and future transportation needs, reduce traffic congestion and air pollution, and improve livability. |
| • | Four-laning the final 4.8 kilometres of the 26-kilometre section of Highway 1 through the Kicking Horse Canyon between Highway 95 and the western boundary of Yoho National Park to improve safety and reliability, and facilitate the movement of goods. |
| • | Four-laning 16.4 kilometres of Highway 1 between Kamloops and Golden to improve safety and traffic flow and renew aging infrastructure, including: Illecillewaet (east of Revelstoke); Chase Creek Road to Chase Creek Bridge (Chase); 1st Avenue SW to 10th Street SW (Salmon Arm); Quartz Creek Bridge replacement (west of Golden) and R.W. Bruhn Bridge replacement (Sicamous). |
| • | Widening ten kilometres of Highway 1 through Langley between 216th Street and 264th Street to accommodate new high-occupancy vehicle lanes, including reconfiguring the 232 Street interchange, new underpasses at Glover Road and the CP Rail crossing and a truck parking lot near Highways 1 and 17 for up to 150 commercial trucks and 45 passenger vehicles. |
| • | Improvements along highway corridors in Delta to increase travel safety and efficiency, including: upgrading the Highway 91 at Nordel Interchange; Highway 91 Connector at Nordel Way intersection; Highway 17 at 80th Street intersection (Tilbury); 27B Avenue On-Ramp to Deltaport Way and 27B Avenue between Deltaport Way and 41B Street; and a new interchange at Highway 17 and Highway 91 Connector (Sunbury). |
Budget and Fiscal Plan - 2021/22 to 2023/24
52
Three Year Fiscal Plan
| • | Improvements to Highway 14 along the southern coast of Vancouver Island to improve safety and traffic flow and facilitate transit usage, including: widening and realigning 1.5 kilometres between Glinz Lake Road and Connie Road; a new park and ride facility on Gillespie Road; and wider shoulders between Otter Point Road and Woodhaven Road. |
| • | Construction of a flyover from Highway 17 northbound to Keating Cross Road westbound in Central Saanich to improve safety by eliminating left turn across highway traffic onto Keating Cross Road and realigning the southbound highway on-ramp. |
| • | Procuring an electric-ready ferry vessel for service on Kootenay Lake and upgrading the Balfour and Kootenay Bay terminals. The new vessel will have almost twice the capacity of the existing MV Balfour and be able to carry between 50 and 60 vehicles. |
| • | Constructing a 5.4 kilometre two-lane realignment of West Fraser Road to bypass a section through active slides that was washed-out in 2018 and provide a safe, reliable, and efficient roadway to get local people to and from their homes, schools, jobs and appointments, including a new bridge over Narcosli Creek and rock stabilization work. |
| • | Upgrading intersections and providing passing lanes on provincial highway corridors to improve safety and traffic flow, a signalized T-intersection on Highway 97 at Swan Lumber Road near Fort St. John, improvements along Highway 97 between Racing and Quesnel-Hydraulic Roads in Quesnel and westbound passing lanes on Highway 16 near Broman Lake east of Topley and Toboggan Lake west of Smithers. |
| • | Expansion of SkyTrain fleet and upgrades to stations and facilities in Metro Vancouver to serve rapidly growing transit demand and to support the Broadway Subway project. |
| • | Procurement and delivery of the first 10 battery electric buses for use by BC Transit in Victoria to reduce carbon emissions and improve rider experience. |
| • | Construction of the Victoria HandyDART Centre for use by BC Transit, which will facilitate growth of Victoria’s bus system and support introducing a low-carbon fleet of vehicles that will enhance HandyDART services. |
Table 1.7 Provincial Transportation Investments
| | | Updated
Forecast
2020/21 | | | Budget Estimate
2021/22 | | | Plan
2022/23 | | | Plan
2023/24 | | | Fiscal Plan
Total | |
| Provincial investments: | | | | | | | | | | | | | | | | | | | | |
| – Highway corridor rehabilitation | | | 258 | | | | 314 | | | | 292 | | | | 213 | | | | 819 | |
| – Side road improvements | | | 129 | | | | 162 | | | | 115 | | | | 118 | | | | 395 | |
| – Pattullo Bridge replacement | | | 228 | | | | 225 | | | | 310 | | | | 288 | | | | 823 | |
| – Highway 1 to Alberta border | | | 136 | | | | 267 | | | | 311 | | | | 259 | | | | 837 | |
| – Broadway Subway | | | 185 | | | | 337 | | | | 363 | | | | 381 | | | | 1,081 | |
| –Transit Infrastructure 1 | | | 112 | | | | 136 | | | | 272 | | | | 341 | | | | 749 | |
| –Transportation and Trade Network Reliability 2 | | | 226 | | | | 360 | | | | 442 | | | | 299 | | | | 1,101 | |
| – Safety improvements | | | 40 | | | | 41 | | | | 30 | | | | 30 | | | | 101 | |
| – Community and other programs | | | 19 | | | | 18 | | | | 13 | | | | 26 | | | | 57 | |
| Total provincial investments | | | 1,333 | | | | 1,860 | | | | 2,148 | | | | 1,955 | | | | 5,963 | |
| Investments funded through contributions from other partners | | | 385 | | | | 534 | | | | 581 | | | | 532 | | | | 1,647 | |
| Total investments in transportation infrastructure 3 | | | 1,718 | | | | 2,394 | | | | 2,729 | | | | 2,487 | | | | 7,610 | |
1 Includes notional funding for Surrey-Langley SkyTrain.
2 Includes notional funding for George Massey Crossing.
3 Total investments include operating and capital spending.
Budget and Fiscal Plan - 2021/22 to 2023/24
53
Three Year Fiscal Plan
The public and private sectors will provide about $7.6 billion for transportation operating and capital investments over the next three years, including:
| • | $6.0 billion of provincial investment in transportation infrastructure; and |
| • | $1.6 billion of investment leveraged through federal cost sharing and partnerships with private organizations, local governments and other agencies. |
Ministry Capital Spending
Budget 2021 includes $1.6 billion in capital spending by government ministries over the plan period. This will support investments in maintaining, upgrading and expanding infrastructure, such as provincial park amenities, courthouses, correctional centres, office buildings and information systems.
Current and planned capital investments made by government ministries include:
| • | An expansion of BC Parks facilities to enhance recreation opportunities across the province, including new campgrounds and amenities, as well as further development of accessible and back-country trails. |
| • | A new Nanaimo Correctional Centre will replace the existing 190-bed outdated correctional centre and increase capacity with a 12-room unit for women. The centre will be culturally responsive and is designed to the LEED gold standard. |
| • | In order to preserve, protect and provide better access to the human and natural history collections of British Columbia, government is planning for a capital project to modernize and renew the Royal BC Museum. The museum’s new collections and research building is expected to break ground in Colwood in 2022 with anticipated completion in 2024. |
Capital Project Reserves
The Province has included $220 million in project reserves in its three-year capital plan as a prudent planning measure. In addition to covering risks from unforeseen costs for ministry capital projects, the reserves may be used to fund emerging capital priorities of government ministries.
Financing Capital Projects
Provincial capital infrastructure spending is financed through a combination of sources:
| • | cost sharing with partners (e.g. federal government, regional hospital districts); |
| • | partnerships with the private sector (public-private partnerships, or P3s); and |
Budget and Fiscal Plan - 2021/22 to 2023/24
54
Three Year Fiscal Plan
Self-Supported Capital Spending
Capital investments of self-supported commercial Crown agencies are projected to total $13.1 billion over the fiscal plan period. Self-supported capital investments include:
| • | $12.5 billion (95 per cent) of total self-supported capital spending is for electrical generation, transmission and distribution projects to meet growing customer demand and to enhance reliability. Included in this total is construction of a third dam and hydroelectric generating station on the Peace River through the Site C project. BC Hydro’s electricity system was largely built in the 1960s, 1970s, and 1980s and B.C.’s population and economy continue to grow. BC Hydro is upgrading and maintaining aging assets and building new infrastructure so that British Columbians continue to receive reliable and clean electricity. |
| • | $306 million will be used for BC Lottery Corporation projects, including replacement of key legacy business systems, expansion of the lottery distribution network, and acquisition of gaming equipment to support lottery, PlayNow internet gaming, casino and community gaming activities. |
| • | $156 million will be used for ICBC projects, including investment in information technology and facility maintenance and upgrades. |
| • | $123 million will be used for Liquor Distribution Branch projects, including investments for updates and improvements to liquor stores, expansion of cannabis stores, technology-related projects and ongoing operating equipment replacements. |
Table 1.8 provides information on major capital projects, and further details on provincial capital investments are shown in the service plans of ministries and Crown agencies.
Projects Over $50 Million
Approved major capital projects with multi-year budgets totaling $50 million or more, including provincial funding, are shown in Table 1.8. Annual allocations of the budget for these projects are included as part of the provincial government’s capital investment spending shown in Table 1.6.
In addition to financing through provincial sources, major projects may be cost-shared with the federal government, municipalities and regional districts, and/or the private sector. Total capital spending for these major projects is $41.3 billion, reflecting provincial financing of $36.2 billion, including internal sources and P3 liabilities, as well as $5.1 billion in contributions from the federal government and other sources, including private donations.
Major capital investments include $3.0 billion for K-12 school projects; $732 million for post-secondary institutions; $11.2 billion for health facilities; $6.9 billion for major transportation capital infrastructure; $749 million for projects in other sectors; $18.5 billion for power generation and transmission capital projects by BC Hydro; and $96 million for ICBC’s Enhanced Care Coverage Program.
Budget and Fiscal Plan - 2021/22 to 2023/24
55
Three Year Fiscal Plan
Three projects have been added to the table since the Fall 2020 Economic & Fiscal Update:
| • | Okanagan College – Student Housing project ($68 million), expected to be complete in 2023; |
| • | New Surrey Hospital and Cancer Centre ($1.66 billion), expected to be complete in 2028; and |
| • | Mica modernize controls project through BC Hydro ($56 million), expected to be complete in 2023. |
Since the Fall 2020 Economic & Fiscal Update, the Highway 97 Williams Lake Indian Reserve to Lexington Road project has been completed and is no longer listed in the table.
Changes since the Fall 2020 Economic & Fiscal Update for existing projects include:
| • | Centennial Secondary project’s year of completion was amended from 2021 to 2017; |
| • | Argyle Secondary project’s year of completion was amended from 2020 to 2021 to align with the revised project schedule; |
| • | Eric Hamber Secondary project’s anticipated total cost increased from $105 million to $106 million. Internal borrowing was amended from $93 million to $94 million to reflect updated costing; |
| • | West Langford Elementary and Middle project name changed to Pexsisen Elementary and Centre Mountain Lellum Middle; |
| • | The Seismic Mitigation Program’s anticipated total cost increased from $1.5 billion to $2.0 billion to reflect additional funding provided in Budget 2021; |
| • | British Columbia Institute of Technology’s Student Housing project’s anticipated total cost was amended from $115 million to $114 million to reflect the revised project cost estimate. Internal borrowing decreased from $109 million to $108 million; |
| • | Interior Heart and Surgical Centre’s anticipated total cost of the direct procurement portion was amended from $248 million to $243 million to reflect the revised project cost estimate. Internal borrowing decreased from $213 million to $208 million; |
| • | Children’s and Women’s Hospital project’s anticipated total cost of the direct procurement portion was amended from $308 million to $298 million to reflect the revised project cost estimate. Internal borrowing decreased from $178 million to $168 million; |
| • | Penticton Regional Hospital – Patient Care Tower project’s anticipated total cost of the direct procurement portion was amended from $80 million to $76 million to reflect the revised project cost estimate. Internal borrowing decreased from $22 million to $18 million; |
| • | Royal Columbian Hospital – Phase 1 project’s anticipated total cost was amended from $259 million to $251 million to reflect the revised project cost estimate. Internal borrowing decreased from $250 million to $242 million; |
| • | Royal Columbian Hospital – Phases 2 & 3 project’s anticipated total cost was amended from $1.236 billion to $1.244 billion to reflect the revised project cost estimate. Internal borrowing increased from $1.174 billion to $1.182 billion; |
Budget and Fiscal Plan - 2021/22 to 2023/24
56
Three Year Fiscal Plan
| • | Peace Arch Hospital Renewal project’s anticipated total cost was amended from $84 million to $91 million to reflect the updated project cost estimate. Funding from Other Contributions was revised from $76 million to $83 million to reflect increased contributions from the Peace Arch Hospital Foundation and Fraser Health Authority; |
| • | St. Paul’s Hospital’s year of completion was amended from 2026 to 2027 to align with the revised project schedule. The project’s anticipated total cost was revised from $2.083 billion to $2.174 billion to reflect updated costing. Internal borrowing increased from $1.158 billion to $1.327 billion and other contributions decreased from $925 million to $847 million; |
| • | Dawson Creek and District Hospital project’s year of completion was amended from 2025 to 2026 to align with the revised project schedule; |
| • | Highway 1 Illecillewaet Four-Laning and Brake Check improvements project’s year of completion was amended from 2022 to 2021 to align with the revised project schedule; |
| • | Highway 14 Corridor improvements project’s anticipated total cost was revised from $86 million to $77 million to reflect the post-tender budget. Internal borrowing decreased from $56 million to $48 million and federal contributions decreased from $30 million to $29 million; |
| • | Highway 1 Chase Four-Laning project’s anticipated total cost was revised from $260 million to $220 million to reflect the post-tender budget. Internal borrowing decreased from $248 million to $208 million; |
| • | Highway 1 Salmon Arm West project’s anticipated total cost was revised from $185 million to $155 million to reflect the post-tender budget. Internal borrowing decreased from $154 million to $124 million; |
| • | Pattullo Bridge Replacement project’s year of completion was amended from 2023 to 2024 to align with the revised project schedule; |
| • | Nanaimo Correctional Centre Replacement project’s anticipated total cost was amended from $157 million to $167 million to reflect updated costing; |
| • | Horne Payne substation upgrade project’s anticipated total cost increased from $71 million to $72 million to reflect revised estimates for the final designs; |
| • | Fort St. John and Taylor Electric Supply project’s anticipated total cost decreased from $53 million to $52 million to reflect the revised project cost estimate; |
| • | UBC load increase Stage 2 project’s year of completion was amended from 2021 to 2020 to align with the revised project schedule; |
| • | Downtown Vancouver Electricity Supply – West End strategic property purchase project’s year of completion was amended from 2020 to 2021 to align with the revised project schedule; |
| • | Wahleach refurbish generator project’s year of completion was amended from 2021 to 2022 to align with the revised project schedule; |
| • | G.M. Shrum G1 to 10 control system upgrade project’s year of completion was amended from 2023 to 2022 to align with the revised project schedule; and |
| • | As announced on February 26, 2021, the cost of the Site C project is estimated at $16.0 billion, with a one year delay to 2025 for the project in-service date. BC Hydro continues to review the updated cost estimate, along with risks, further to recommendations in the Milburn Report. |
Budget and Fiscal Plan - 2021/22 to 2023/24
57
Three Year Fiscal Plan
Table 1.8 Capital Expenditure Projects Greater Than $50 million 1
Note: Information in bold type denotes changes from the Fall 2020 Economic & Fiscal Update released on December 17, 2020.
| | | | | | Project | | | Estimated | | | Anticipated | | | Project Financing | |
| ($ millions) | | Year of
Completion | | | Cost to
Dec. 31, 2020 | | | Cost to
Complete | | | Total
Cost | | | Internal/
Borrowing | | | P3
Liability | | | Federal
Gov’t | | | Other
Contrib’ns | |
| | | | | | | | | | | | | | | | | | | | | | | | | |
| | | Taxpayer-supported | | | | | | |
| Schools | | | | | | | | | | | | | | | | | | | | | | | | |
| Centennial Secondary 2 | | 2017 | | | | 58 | | | | 3 | | | | 61 | | | | 61 | | | | — | | | | — | | | | — | |
| Argyle Secondary | | 2021 | | | | 61 | | | | 1 | | | | 62 | | | | 50 | | | | — | | | | — | | | | 12 | |
| Grandview Heights Secondary | | 2021 | | | | 57 | | | | 26 | | | | 83 | | | | 63 | | | | — | | | | — | | | | 20 | |
| Handsworth Secondary | | 2022 | | | | 28 | | | | 41 | | | | 69 | | | | 69 | | | | — | | | | — | | | | — | |
| New Westminster Secondary | | 2021 | | | | 88 | | | | 19 | | | | 107 | | | | 107 | | | | — | | | | — | | | | — | |
| Burnaby North Secondary | | 2022 | | | | 17 | | | | 91 | | | | 108 | | | | 99 | | | | — | | | | — | | | | 9 | |
| Eric Hamber Secondary | | 2023 | | | | 12 | | | | 94 | | | | 106 | | | | 94 | | | | — | | | | — | | | | 12 | |
| Stitos Elementary Middle | | 2022 | | | | 17 | | | | 37 | | | | 54 | | | | 49 | | | | 5 | | | | | | | | | |
| Sheffield Elementary | | 2022 | | | | 5 | | | | 47 | | | | 52 | | | | 47 | | | | — | | | | — | | | | 5 | |
| Pexsisen Elementary and Centre Mountain Lellum Middle | | 2022 | | | | 19 | | | | 70 | | | | 89 | | | | 89 | | | | — | | | | — | | | | — | |
| Victoria High School | | 2022 | | | | 11 | | | | 69 | | | | 80 | | | | 77 | | | | — | | | | — | | | | 3 | |
| Quesnel Junior School | | 2022 | | | | 6 | | | | 46 | | | | 52 | | | | 52 | | | | — | | | | — | | | | — | |
| Cowichan Secondary | | 2024 | | | | 3 | | | | 79 | | | | 82 | | | | 80 | | | | 2 | | | | | | | | | |
| Seismic mitigation program 3 | | 2030 | | | | 682 | | | | 1,344 | | | | 2,026 | | | | 2,026 | | | | — | | | | — | | | | — | |
| Total schools | | | | | | 1,064 | | | | 1,967 | | | | 3,031 | | | | 2,963 | | | | — | | | | — | | | | 68 | |
| Post-secondary institutions | | | | | | | | | | | | | | | | | | | | | | | | | | | | | | | |
| Simon Fraser University – Energy Systems Engineering Building 2,4 | | 2019 | | | | 124 | | | | 2 | | | | 126 | | | | 45 | | | | — | | | | 45 | | | | 36 | |
| British Columbia Institute of Technology – Health Sciences Centre for Advanced Simulation | | 2022 | | | | 29 | | | | 59 | | | | 88 | | | | 66 | | | | — | | | | — | | | | 22 | |
| Simon Fraser University – Student Housing | | 2022 | | | | 14 | | | | 90 | | | | 104 | | | | 73 | | | | — | | | | — | | | | 31 | |
| University of Victoria – Student Housing | | 2023 | | | | 42 | | | | 190 | | | | 232 | | | | 128 | | | | — | | | | — | | | | 104 | |
| Okanagan College – Student Housing | | 2023 | | | | — | | | | 68 | | | | 68 | | | | 67 | | | | — | | | | — | | | | 1 | |
| British Columbia Institute of Technology – Student Housing | | 2024 | | | | — | | | | 114 | | | | 114 | | | | 108 | | | | — | | | | — | | | | 6 | |
| Total post-secondary institutions | | | | | | 209 | | | | 523 | | | | 732 | | | | 487 | | | | — | | | | 45 | | | | 200 | |
| Health facilities | | | | | | | | | | | | | | | | | | | | | | | | | | | | | | | |
| Royal Inland Hospital Patient Care Tower | | | | | | | | | | | | | | | | | | | | | | | | | | | | | | | |
| – Direct procurement | | 2024 | | | | 13 | | | | 116 | | | | 129 | | | | 39 | | | | — | | | | — | | | | 90 | |
| – P3 contract | | 2022 | | | | 200 | | | | 88 | | | | 288 | | | | — | | | | 164 | | | | — | | | | 124 | |
| Vancouver General Hospital – Jim Pattison Pavilion Operating Rooms | | 2021 | | | | 81 | | | | 21 | | | | 102 | | | | 35 | | | | — | | | | — | | | | 67 | |
| Interior Heart and Surgical Centre 2 – Direct procurement | | 2018 | | | | 176 | | | | 67 | | | | 243 | | | | 208 | | | | — | | | | — | | | | 35 | |
| – P3 contract | | 2015 | | | | 133 | | | | — | | | | 133 | | | | 4 | | | | 79 | | | | — | | | | 50 | |
| Children’s and Women’s Hospital | | | | | | | | | | | | | | | | | | | | | | | | | | | | | | | |
| – Direct procurement | | 2020 | | | | 286 | | | | 12 | | | | 298 | | | | 168 | | | | — | | | | — | | | | 130 | |
| – P3 contract | | 2018 | | | | 368 | | | | — | | | | 368 | | | | 167 | | | | 187 | | | | — | | | | 14 | |
| Penticton Regional Hospital – Patient Care Tower | | | | | | | | | | | | | | | | | | | | | | | | | | | | | | | |
| – Direct procurement | | 2022 | | | | 34 | | | | 42 | | | | 76 | | | | 18 | | | | — | | | | — | | | | 58 | |
| – P3 contract | | 2019 | | | | 231 | | | | 1 | | | | 232 | | | | — | | | | 139 | | | | — | | | | 93 | |
| Royal Columbian Hospital – Phase 1 | | 2020 | | | | 242 | | | | 9 | | | | 251 | | | | 242 | | | | — | | | | — | | | | 9 | |
| Royal Columbian Hospital – Phases 2 & 3 | | 2026 | | | | 59 | | | | 1,185 | | | | 1,244 | | | | 1,182 | | | | — | | | | — | | | | 62 | |
| Peace Arch Hospital Renewal | | 2022 | | | | 25 | | | | 66 | | | | 91 | | | | 8 | | | | — | | | | — | | | | 83 | |
| Red Fish Healing Centre for Mental Health and Addiction - θəqiʔ ɫəwʔənəq leləm | | 2021 | | | | 93 | | | | 38 | | | | 131 | | | | 131 | | | | — | | | | — | | | | — | |
| Dogwood Complex Residential Care | | 2022 | | | | 4 | | | | 54 | | | | 58 | | | | — | | | | — | | | | — | | | | 58 | |
| Lions Gate Hospital – New Acute Care Facility | | 2024 | | | | 2 | | | | 253 | | | | 255 | | | | 89 | | | | — | | | | — | | | | 166 | |
| St Paul’s Hospital | | 2027 | | | | 11 | | | | 2,163 | | | | 2,174 | | | | 1,327 | | | | — | | | | — | | | | 847 | |
| Health facilities continued on the next page | | | | | | | | | | | | | | | | | | | | | | | | | | | | | | | |
Budget and Fiscal Plan - 2021/22 to 2023/24
58
Three Year Fiscal Plan
Table 1.8 Capital Expenditure Projects Greater Than $50 million 1 (continued)
Note: Information in bold type denotes changes from the Fall 2020 Economic & Fiscal Update released on December 17, 2020.
| | | | | | Project | | | Estimated | | | Anticipated | | | Project Financing | |
| ($ millions) | | Year of
Completion | | | Cost to
Dec. 31, 2020 | | | Cost to
Complete | | | Total
Cost | | | Internal/
Borrowing | | | P3
Liability | | | Federal
Gov’t | | | Other
Contrib’ns | |
| Health facilities continued | | | | | | | | | | | | | | | | | | | | | | | | | | | | | | | |
| Mills Memorial Hospital | | 2026 | | | | 14 | | | | 433 | | | | 447 | | | | 337 | | | | — | | | | — | | | | 110 | |
| Burnaby Hospital Redevelopment - Phase 1 5 | | 2025 | | | | 4 | | | | 573 | | | | 577 | | | | 543 | | | | — | | | | — | | | | 34 | |
| Cariboo Memorial Hospital | | 2026 | | | | — | | | | 218 | | | | 218 | | | | 131 | | | | — | | | | — | | | | 87 | |
| Stuart Lake Hospital | | 2024 | | | | 1 | | | | 115 | | | | 116 | | | | 98 | | | | — | | | | — | | | | 18 | |
| Cowichan District Hospital | | 2026 | | | | — | | | | 887 | | | | 887 | | | | 605 | | | | — | | | | — | | | | 282 | |
| Dawson Creek & District Hospital | | 2026 | | | | — | | | | 378 | | | | 378 | | | | 247 | | | | — | | | | — | | | | 131 | |
| New Surrey Hospital and Cancer Centre | | 2028 | | | | — | | | | 1,660 | | | | 1,660 | | | | 1,660 | | | | — | | | | — | | | | — | |
| Clinical and Systems Transformation | | 2025 | | | | 488 | | | | 215 | | | | 703 | | | | 702 | | | | — | | | | — | | | | 1 | |
| iHealth Project – Vancouver Island Health Authority | | 2025 | | | | 99 | | | | 56 | | | | 155 | | | | 55 | | | | — | | | | — | | | | 100 | |
| Total health facilities | | | | | | 2,564 | | | | 8,650 | | | | 11,214 | | | | 7,996 | | | | 569 | | | | — | | | | 2,649 | |
| Transportation | | | | | | | | | | | | | | | | | | | | | | | | | | | | | | | |
| Highway 91 Alex Fraser Bridge Capacity Improvements 2 | | 2019 | | | | 66 | | | | 4 | | | | 70 | | | | 37 | | | | — | | | | 33 | | | | — | |
| Highway 1 widening and 216th Street Interchange 2 | | 2020 | | | | 60 | | | | 2 | | | | 62 | | | | 28 | | | | — | | | | 22 | | | | 12 | |
| Highway 1 – Admirals Road/McKenzie Avenue Interchange 2 | | 2020 | | | | 96 | | | | — | | | | 96 | | | | 63 | | | | — | | | | 33 | | | | — | |
| Highway 7 Corridor improvements 2 | | 2020 | | | | 70 | | | | — | | | | 70 | | | | 48 | | | | — | | | | 22 | | | | — | |
| Highway 99 10-Mile Slide | | 2021 | | | | 45 | | | | 15 | | | | 60 | | | | 60 | | | | — | | | | — | | | | — | |
| Highway 1 Lower Lynn Corridor improvements | | 2021 | | | | 159 | | | | 39 | | | | 198 | | | | 77 | | | | — | | | | 66 | | | | 55 | |
| Highway 1 Illecillewaet Four-Laning and Brake Check improvements | | 2021 | | | | 41 | | | | 44 | | | | 85 | | | | 69 | | | | — | | | | 16 | | | | — | |
| Highway 14 Corridor improvements | | 2022 | | | | 18 | | | | 59 | | | | 77 | | | | 48 | | | | — | | | | 29 | | | | — | |
| West Fraser Road Realignment | | 2023 | | | | 7 | | | | 96 | | | | 103 | | | | 103 | | | | — | | | | — | | | | — | |
| Highway 1 Chase Four-Laning | | 2023 | | | | 36 | | | | 184 | | | | 220 | | | | 208 | | | | — | | | | 12 | | | | — | |
| Highway 91 to Highway 17 and Deltaport Way Corridor improvements | | 2023 | | | | 93 | | | | 167 | | | | 260 | | | | 87 | | | | — | | | | 82 | | | | 91 | |
| Highway 1 Salmon Arm West | | 2023 | | | | 43 | | | | 112 | | | | 155 | | | | 124 | | | | — | | | | 31 | | | | — | |
| Highway 1 RW Bruhn Bridge | | 2023 | | | | 23 | | | | 202 | | | | 225 | | | | 134 | | | | — | | | | 91 | | | | — | |
| Highway 1 Quartz Creek Bridge Replacement | | 2023 | | | | 10 | | | | 111 | | | | 121 | | | | 71 | | | | — | | | | 50 | | | | — | |
| Kootenay Lake ferry service upgrade | | 2023 | | | | 7 | | | | 78 | | | | 85 | | | | 68 | | | | — | | | | 17 | | | | — | |
| Pattullo Bridge Replacement 6 | | 2024 | | | | 263 | | | | 1,114 | | | | 1,377 | | | | 1,076 | | | | 301 | | | | — | | | | — | |
| Highway 1 216th - 264th Street widening | | 2024 | | | | 13 | | | | 222 | | | | 235 | | | | 99 | | | | — | | | | 109 | | | | 27 | |
| Highway 1 Kicking Horse Canyon Phase 4 7 | | 2024 | | | | 90 | | | | 511 | | | | 601 | | | | 386 | | | | — | | | | 215 | | | | — | |
| Broadway Subway | | 2025 | | | | 365 | | | | 2,462 | | | | 2,827 | | | | 1,380 | | | | 450 | | | | 897 | | | | 100 | |
| Total transportation | | | | | | 1,505 | | | | 5,422 | | | | 6,927 | | | | 4,166 | | | | 751 | | | | 1,725 | | | | 285 | |
| Other taxpayer-supported | | | | | | | | | | | | | | | | | | | | | | | | | | | | | | | |
| Abbotsford courthouse | | | | | | | | | | | | | | | | | | | | | | | | | | | | | | | |
| – Direct procurement | | 2020 | | | | 15 | | | | 3 | | | | 18 | | | | 18 | | | | — | | | | — | | | | — | |
| – P3 contract | | 2020 | | | | 134 | | | | — | | | | 134 | | | | 48 | | | | 80 | | | | — | | | | 6 | |
| Nanaimo Correctional Centre Replacement | | 2023 | | | | 4 | | | | 163 | | | | 167 | | | | 167 | | | | — | | | | — | | | | — | |
| 6585 Sussex Ave (Affordable Rental Housing) | | 2021 | | | | 30 | | | | 45 | | | | 75 | | | | 43 | | | | — | | | | — | | | | 32 | |
| Stanley New Fountain Hotel (Affordable Rental Housing) | | 2022 | | | | 25 | | | | 44 | | | | 69 | | | | 19 | | | | — | | | | — | | | | 50 | |
| Clark & 1st Ave (Affordable Rental Housing) | | 2024 | | | | 4 | | | | 105 | | | | 109 | | | | 75 | | | | — | | | | — | | | | 34 | |
| Royal BC Museum – Collections and Research Building | | 2024 | | | | 15 | | | | 162 | | | | 177 | | | | 177 | | | | — | | | | — | | | | — | |
| Total other | | | | | | 227 | | | | 522 | | | | 749 | | | | 547 | | | | 80 | | | | — | | | | 122 | |
| Total taxpayer-supported | | | | | | 5,569 | | | | 17,084 | | | | 22,653 | | | | 16,159 | | | | 1,400 | | | | 1,770 | | | | 3,324 | |
Budget and Fiscal Plan - 2021/22 to 2023/24
59
Three Year Fiscal Plan
Table 1.8 Capital Expenditure Projects Greater Than $50 million 1 (continued)
Note: Information in bold type denotes changes from the Fall 2020 Economic & Fiscal Update released on December 17, 2020.
| | | | | | Project | | | Estimated | | | Anticipated | | | Project Financing | |
| ($ millions) | | Year of
Completion | | | Cost to
Dec. 31, 2020 | | | Cost to
Complete | | | Total
Cost | | | Internal/
Borrowing | | | P3
Liability | | | Federal
Gov’t | | | Other
Contrib’ns | |
| Power generation and transmission | | | | | | | | | | | | | | | | | | | | | | | | | | | | | | | |
| BC Hydro | | | | | | | | | | | | | | | | | | | | | | | | | | | | | | | |
| – Horne Payne substation upgrade project 2 | | 2019 | | | | 71 | | | | 1 | | | | 72 | | | | 72 | | | | — | | | | — | | | | — | |
| – John Hart generating station replacement 2 | | 2019 | | | | 977 | | | | 2 | | | | 979 | | | | 979 | | | | — | | | | — | | | | — | |
| – Bridge River 2 units 5 and 6 upgrade project 2 | | 2019 | | | | 73 | | | | 1 | | | | 74 | | | | 74 | | | | — | | | | — | | | | — | |
| – South Fraser transmission relocation project 8 | | TBD | | | | 30 | | | | 46 | | | | 76 | | | | 76 | | | | — | | | | — | | | | — | |
| – Fort St. John and Taylor Electric Supply 2 | | 2020 | | | | 51 | | | | 1 | | | | 52 | | | | 52 | | | | — | | | | — | | | | — | |
| – Supply Chain Applications project 2 | | 2020 | | | | 67 | | | | 2 | | | | 69 | | | | 69 | | | | — | | | | — | | | | — | |
| – UBC load increase stage 2 project 2 | | 2020 | | | | 48 | | | | 7 | | | | 55 | | | | 55 | | | | — | | | | — | | | | — | |
| – Downtown Vancouver Electricity Supply: West End strategic property purchase | | 2021 | | | | 67 | | | | 14 | | | | 81 | | | | 81 | | | | — | | | | — | | | | — | |
| – Peace Region Electricity Supply (PRES) project 9 | | 2021 | | | | 193 | | | | 92 | | | | 285 | | | | 285 | | | | — | | | | TBD | | | | — | |
| – LNG Canada load interconnection project | | 2021 | | | | 65 | | | | 17 | | | | 82 | | | | 58 | | | | — | | | | — | | | | 24 | |
| – Bridge River 2 upgrade units 7 and 8 project | | 2021 | | | | 50 | | | | 36 | | | | 86 | | | | 86 | | | | — | | | | — | | | | — | |
| – Wahleach refurbish generator project | | 2022 | | | | 24 | | | | 27 | | | | 51 | | | | 51 | | | | — | | | | — | | | | — | |
| – Mica replace units 1 to 4 generator transformers project | | 2022 | | | | 41 | | | | 39 | | | | 80 | | | | 80 | | | | — | | | | — | | | | — | |
| – G.M. Shrum G1 to 10 control system upgrade | | 2022 | | | | 51 | | | | 24 | | | | 75 | | | | 75 | | | | — | | | | — | | | | — | |
| – Mount Lehman substation upgrade project | | 2023 | | | | 20 | | | | 39 | | | | 59 | | | | 59 | | | | — | | | | — | | | | — | |
| – Street light replacement program | | 2023 | | | | 4 | | | | 76 | | | | 80 | | | | 80 | | | | — | | | | — | | | | — | |
| – 5L063 Telkwa relocation project | | 2023 | | | | 15 | | | | 51 | | | | 66 | | | | 66 | | | | — | | | | — | | | | — | |
| – Mica modernize controls project | | 2023 | | | | 26 | | | | 30 | | | | 56 | | | | 56 | | | | — | | | | — | | | | — | |
| – Capilano substation upgrade project | | 2024 | | | | 11 | | | | 76 | | | | 87 | | | | 87 | | | | — | | | | — | | | | — | |
| – Sperling substation (SPG) metalclad switchgear replacement project | | 2024 | | | | 5 | | | | 49 | | | | 54 | | | | 54 | | | | — | | | | — | | | | — | |
| – Site C project 10 | | 2025 | | | | 6,455 | | | | 9,545 | | | | 16,000 | | | | 16,000 | | | | — | | | | — | | | | — | |
| Total power generation and transmission | | | | | | 8,344 | | | | 10,175 | | | | 18,519 | | | | 18,495 | | | | — | | | | — | | | | 24 | |
| Other self-supported | | | | | | | | | | | | | | | | | | | | | | | | | | | | | | | |
| Enhanced Care Coverage Program (ICBC) | | 2022 | | | | 63 | | | | 33 | | | | 96 | | | | 96 | | | | — | | | | — | | | | — | |
| Total self-supported | | | | | | 8,407 | | | | 10,208 | | | | 18,615 | | | | 18,591 | | | | — | | | | — | | | | 24 | |
| Total $50 million projects | | | | | | 13,976 | | | | 27,292 | | | | 41,268 | | | | 34,750 | | | | 1,400 | | | | 1,770 | | | | 3,348 | |
| 1 | Only projects that receive provincial funding and have been approved by Treasury Board and/or Crown corporation boards are included in this table. Ministry service plans may highlight projects that still require final approval. Capital costs reflect current government accounting policy. |
| 2 | Assets have been put into service and only trailing costs remain. |
| 3 | The Seismic Mitigation Program consists of all spending to date on Phase 2 of the program and may include spending on projects greater than $50 million included in the table above. |
| 4 | Simon Fraser University and private donors contributed $26 million toward the project, and the university also contributed land valued at $10 million. |
| 5 | The concept plan for Phase 2 of the Burnaby Hospital Redevelopment has been approved. Financial information will be added to the table upon business case approval. |
| 6 | Pattullo Bridge forecasted to open to the public in 2024 with old bridge decommissioning to follow. Forecasted amount reflects total expenditures including capitalized and expensed items. |
| 7 | Kicking Horse Canyon Project costs exclude $11 million of past planning costs which are expensed. |
| 8 | Construction work on the South Fraser transmission relocation project is currently suspended pending the government’s review of the George Massey Tunnel replacement. |
| 9 | The total cost represents the gross cost of the project and has not been netted for Federal Government contributions. The Federal Government’s contribution amount is dependent on the final actual project costs and what costs are eligible under the agreement. |
| 10 | As announced on February 26, 2021, the cost of the Site C project is estimated at $16 billion, with a one year delay to 2025 for the project in-service date. BC Hydro continues to review the updated cost estimate, along with risks, further to recommendations in the Milburn Report. Site C project total anticipated cost and project cost to date include capital costs, charges subject to regulatory deferral and certain operating expenditures. |
Budget and Fiscal Plan - 2021/22 to 2023/24
60
Three Year Fiscal Plan
Provincial Debt
Table 1.9 Provincial Debt Summary1
| ($ millions unless otherwise indicated) | | Updated
Forecast
2020/21 | | | Budget
Estimate
2021/22 | | | Plan
2022/23 | | | Plan
2023/24 | |
| Taxpayer-supported debt | | | | | | | | | | | | | | | | |
| Provincial government | | | | | | | | | | | | | | | | |
| Operating | | | 8,799 | | | | 14,939 | | | | 19,483 | | | | 22,912 | |
| Capital 2 | | | 33,823 | | | | 37,180 | | | | 41,145 | | | | 45,740 | |
| Total Provincial government | | | 42,622 | | | | 52,119 | | | | 60,628 | | | | 68,652 | |
| Taxpayer-supported entities | | | | | | | | | | | | | | | | |
| BC Transportation Financing Authority | | | 13,441 | | | | 15,538 | | | | 17,779 | | | | 19,962 | |
| Health Authorities and Hospital Societies | | | 1,845 | | | | 1,841 | | | | 1,800 | | | | 1,755 | |
| Post Secondary institutions | | | 837 | | | | 858 | | | | 875 | | | | 886 | |
| Social Housing 3 | | | 932 | | | | 990 | | | | 1,362 | | | | 1,098 | |
| Other | | | 285 | | | | 296 | | | | 327 | | | | 379 | |
| Total taxpayer-supported debt | | | 59,962 | | | | 71,642 | | | | 82,771 | | | | 92,732 | |
| Self-supported debt | | | 27,524 | | | | 30,238 | | | | 32,688 | | | | 33,882 | |
| Total debt before forecast allowance | | | 87,486 | | | | 101,880 | | | | 115,459 | | | | 126,614 | |
| Forecast allowance 4 | | | — | | | | 1,000 | | | | 750 | | | | 400 | |
| Total provincial debt | | | 87,486 | | | | 102,880 | | | | 116,209 | | | | 127,014 | |
| Taxpayer-supported debt to GDP ratio | | | 20.3 | % | | | 22.8 | % | | | 25.0 | % | | | 26.9 | % |
| Total provincial debt to GDP ratio | | | 29.6 | % | | | 32.7 | % | | | 35.1 | % | | | 36.9 | % |
| Taxpayer-supported debt per capita ($) | | | 11,648 | | | | 13,829 | | | | 15,779 | | | | 17,443 | |
| Taxpayer-supported interest bite (cents per dollar of revenue) | | | 3.1 | | | | 3.4 | | | | 3.4 | | | | 3.6 | |
| 1 | Provincial debt is prepared in accordance with Generally Accepted Accounting Principles and presented consistent with the Debt Summary Report included in the Public Accounts . Debt is shown net of sinking funds and unamortized discounts, excludes accrued interest, and includes non-guaranteed debt directly incurred by commercial Crown corporations and debt guaranteed by the Province. |
| 2 | Includes debt incurred by the government to fund the building of capital assets in the education, health, social housing and other sectors. |
| 3 | Includes the BC Housing Management Commission and the Provincial Rental Housing Corporation. BC Housing Management Commission has been approved for up to $2 billion for future borrowing to fund investments in affordable housing through HousingHub. The debt forecast reflects projects that have been approved as of February 2021. |
| 4 | Reflects the operating statement forecast allowance for each year (amounts are not cumulative). Since it is unknown as to which agency would require this debt, the forecast allowance is shown as a separate item over the plan. |
Government obtains financing from outside sources mainly through debt instruments that are to be repaid on future dates.
Total provincial debt is projected to increase by $39.5 billion over the fiscal plan period to reach $127.0 billion by 2023/24.
Taxpayer-supported debt is forecast to increase by $32.8 billion to $92.7 billion by 2023/24, resulting in an increasing taxpayer-supported debt-to-GDP ratio, which is forecast to remain below 30 per cent in each year of the fiscal plan. This increased borrowing is to finance the annual operating deficits and to fund significant investments in capital infrastructure over the next three years, including $7.3 billion for education, $7.8 billion for health facilities, $7.5 billion for transportation sector projects, $1.6 billion for social housing and $2.2 billion for other initiatives.
The Province’s operating results have generally been better than forecast, reflecting the prudence built into the budget and fiscal plan; as a result, actual debt levels have been lower than projected. Furthermore, changes in the timing of capital project spending may reduce borrowing requirements and debt needed to fund capital investments in the near term.
Budget and Fiscal Plan - 2021/22 to 2023/24
61
Three Year Fiscal Plan
The self-supported debt of commercial Crown corporations is forecast to increase by $6.4 billion over the fiscal plan period, ending at $33.9 billion. This increase is mainly for capital investments related to improving and expanding British Columbia’s hydroelectric generation assets.
Chart 1.4 Debt to GDP
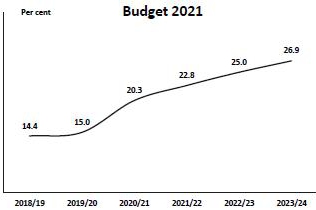
As is the case with other jurisdictions in Canada and around the world that have been impacted by the COVID-19 pandemic, B.C. government’s debt is expected to increase significantly to finance the operating and capital investment needs of the province. In spite of the debt level increase, debt servicing costs remain at a historically low level due to prevailing low interest rates. A common metric of affordability is the interest bite, or the taxpayer-supported interest costs as a percentage of revenue, which is forecast at 3.4 per cent in 2021/22 and 3.6 per cent by 2023/24.
Chart 1.5 Debt Affordability

Government’s borrowing requirements over the fiscal plan period are anticipated to total $51.9 billion, which will finance government’s operating and capital investments, as well as refinancing of debt maturities.
Total provincial debt is presented consistent with the Debt Summary Report included in the Public Accounts. Debt is shown net of sinking fund investments and unamortized discounts, excludes accrued interest, and includes non-guaranteed debt directly incurred by commercial Crown corporations and debt guaranteed by the Province.
Table 1.10 Provincial Borrowing Requirements
| ($ millions) | | Updated
Forecast
2020/21 | | | Budget
Estimate
2021/22 | | | Plan
2022/23 | | | Plan
2023/24 | |
| Total provincial debt1 at beginning of year | | | 72,161 | | | | 87,486 | | | | 102,880 | | | | 116,209 | |
| New borrowing 2 | | | 17,914 | | | | 18,248 | | | | 17,969 | | | | 15,249 | |
| Direct borrowing by Crown corporations and agencies | | | 519 | | | | 389 | | | | 57 | | | | 62 | |
| Retirement of debt 3 | | | (3,108 | ) | | | (4,243 | ) | | | (4,447 | ) | | | (4,156 | ) |
| Change in forecast allowance | | | — | | | | 1,000 | | | | (250 | ) | | | (350 | ) |
| Net change in total debt | | | 15,325 | | | | 15,394 | | | | 13,329 | | | | 10,805 | |
| Total provincial debt1 at year end | | | 87,486 | | | | 102,880 | | | | 116,209 | | | | 127,014 | |
| Annual growth in debt (per cent) | | | 21.2 | | | | 17.6 | | | | 13.0 | | | | 9.3 | |
| 1 | Provincial debt is prepared in accordance with Generally Accepted Accounting Principles and presented consistent with the Debt Summary Report included in the Public Accounts . Debt is shown net of sinking funds and unamortized discounts, excludes accrued interest, and includes non-guaranteed debt directly incurred by commercial Crown corporations and debt guaranteed by the Province. |
| 2 | New long-term borrowing plus net change in short-term debt. |
| 3 | Sinking fund contributions, sinking fund earnings and net maturities of long-term debt (after deduction of sinking fund balances for maturing issues). |
Budget and Fiscal Plan - 2021/22 to 2023/24
62
Three Year Fiscal Plan
The reconciliation between provincial debt and the financial statement debt is shown in Appendix Table A16.
Additional details on government’s outstanding debt are provided in Appendix Tables A17 to A19.
Relationship Between Surplus (Deficit) and Debt
In addition to operating results, the change in debt is affected by cash balance changes and other working capital changes, as well as the debt financing requirements of government’s capital plan. Table 1.11 reconciles the forecast deficits with changes in debt.
Table 1.11 Provincial Debt Changes
| ($ millions) | | Updated
Forecast
2020/21 | | | Budget
Estimate
2021/22 | | | Plan
2022/23 | | | Plan
2023/24 | |
| Total provincial debt1 at beginning of year | | | 72,161 | | | | 87,486 | | | | 102,880 | | | | 116,209 | |
| Taxpayer-supported debt changes | | | | | | | | | | | | | | | | |
| Annual deficit (before forecast allowance) | | | 8,144 | | | | 8,698 | | | | 4,734 | | | | 3,923 | |
| Non-cash items | | | (2,582 | ) | | | (2,633 | ) | | | (2,862 | ) | | | (2,879 | ) |
| Changes in cash balances 2 | | | 837 | | | | (2,516 | ) | | | 201 | | | | 176 | |
| Changes in other working capital balances 3 | | | 1,057 | | | | (348 | ) | | | 31 | | | | (131 | ) |
| Taxpayer-supported capital spending | | | 6,277 | | | | 8,479 | | | | 9,025 | | | | 8,872 | |
| Annual change in total taxpayer-supported debt | | | 13,733 | | | | 11,680 | | | | 11,129 | | | | 9,961 | |
| Self-supported debt changes | | | | | | | | | | | | | | | | |
| Net operating cash flows | | | (2,220 | ) | | | (2,262 | ) | | | (2,190 | ) | | | (2,295 | ) |
| Commercial crown capital spending | | | 3,812 | | | | 4,976 | | | | 4,640 | | | | 3,489 | |
| Annual change in total self-supported debt | | | 1,592 | | | | 2,714 | | | | 2,450 | | | | 1,194 | |
| Annual change in forecast allowance | | | — | | | | 1,000 | | | | (250 | ) | | | (350 | ) |
| Annual change in total provincial debt | | | 15,325 | | | | 15,394 | | | | 13,329 | | | | 10,805 | |
| Total provincial debt1 at year end | | | 87,486 | | | | 102,880 | | | | 116,209 | | | | 127,014 | |
| 1 | Provincial debt is prepared in accordance with Generally Accepted Accounting Principles and presented consistent with the Debt Summary Report included in the Public Accounts . Debt is shown net of sinking funds and unamortized discounts, excludes accrued interest, and includes non-guaranteed debt directly incurred by commercial Crown corporations and debt guaranteed by the Province. |
| 2 | Changes in cash balances include all cash balances from the Consolidated Revenue Fund, School Districts, Universities, Colleges, Health Authorities, Hospital Societies and other taxpayer-supported agencies. |
| 3 | Changes in other working capital balances include changes in accounts receivables, accounts payable, accrued liabilities, deferred revenue, investments, restricted assets and other assets. |
Budget and Fiscal Plan - 2021/22 to 2023/24
63
Three Year Fiscal Plan
Risks to the Fiscal Plan
Table 1.12 provides the estimated fiscal impacts of the identified sensitivities for some of the key variables in the fiscal plan projections on an individual basis. However, inter-relationships between the variables may cause the actual variances to be higher or lower than the estimates shown in the table. For example, an increase in the US/CDN dollar exchange rate may be partly offset by higher commodity prices.
The assumptions and risk sensitivities for individual revenue sources and major program areas can be found in Appendix Tables A5 and A6, beginning on page 152.
Table 1.12 Key Fiscal Sensitivities
| Variable | | Increases of | | Annual Fiscal Impact
($ millions) |
| Nominal GDP | | 1% | | $150 – $250 |
| Lumber prices (US$/thousand board feet) | | $50 | | $125 – $175 1 |
| Natural gas prices (Cdn$/gigajoule) | | 25 cents | | $40 – $60 2 |
| US exchange rate (US cent/Cdn $) | | 1 cent | | -$25 to -$50 |
| Interest rates | | 1 percentage point | | -$156 |
| Debt | | $500 million | | -$8 to -$10 |
| 1 | Sensitivity relates to stumpage revenue only. |
| 2 | Sensitivities can vary significantly especially at lower prices. |
Own Source Revenue
The main areas that may affect own source revenue forecasts are B.C.’s overall economic performance, the relative health of its major trading partners, the exchange rate and commodity prices.
Revenues are sensitive to economic performance. For example, taxation and other revenue sources are driven by economic factors, such as household income, consumer expenditures, housing starts, employment, population growth and the exchange rate. The revenue forecast contained in the fiscal plan is based on the economic forecast detailed in Part 3: British Columbia Economic Review and Outlook. As well, it incorporates commodity price forecasts developed by the Ministry of Forests, Lands, Natural Resource Operations and Rural Development and the Ministry of Energy, Mines and Low Carbon Innovation based on private sector information.
The continuation of investment incentives provided over the four years starting in 2019/20 due to B.C. joining with the federal government to enhance competitiveness, assumes a behavioural response from businesses in acquisition of capital assets. Changes in the timing or strength of the B.C. business response could result in different impacts. Income-tax revenue forecasts are based on projections of household income and net operating surpluses of corporations. The forecasts are updated from reports on tax assessments provided by the Canada Revenue Agency. As a result, revenue estimates and tax credits can be affected by timing lags in the reporting of current and prior year tax assessments by the Canada Revenue Agency as well as the federal government estimates of national corporate taxable income.
Budget and Fiscal Plan - 2021/22 to 2023/24
64
Three Year Fiscal Plan
Natural resource revenues in British Columbia can also be volatile, largely due to the influence of the cyclical natural resource sector in the economy and the importance of natural resource revenues in the Province’s revenue base. Changes in commodity prices, such as natural gas, lumber or coal may have a significant effect on natural resource revenues and economic growth.
The economic and revenue forecasts could be affected by trade related issues, such as the ongoing U.S.-Canada softwood lumber dispute. The imposition of countervailing and anti-dumping duties by the U.S. on Canadian softwood lumber exports has the effects of increasing market uncertainty and volatility as well as increasing costs for Canadian producers. B.C. disagrees with the views that the lumber industry is subsidized or that it sells lumber into the U.S. at below cost or sales value in Canada, and is supporting the federal government in its appeals of the application of duties to the World Trade Organization and under Chapter 19 of the North American Free Trade Agreement and under Chapter 10 of the Canada US Mexico Free Trade Agreement.
Over the fiscal plan period, the outlook for forest revenue incorporates declining stumpage rates, rising interest rates and an appreciation in the Canadian dollar. The impacts of the mountain pine beetle infestation and forest fires have reduced the supply of saw logs available to the forest industry. In addition, the industry continues to pay duties on their exports of softwood lumber products into the United States. As a result, some B.C. communities and residents that are reliant on the forest sector have been adversely affected by the continuing uncertainty and volatility. Actual results for a number of factors including assumptions for lumber prices, harvest volumes, interest and exchange rates could pose risks to the fiscal plan.
Details on major assumptions and sensitivities resulting from changes to those assumptions are outlined in Appendix Table A5.
Federal Government Contributions
Potential policy changes regarding federal government allocations, including health and social transfers and cost-sharing agreements, could affect the revenue and the expenditure forecasts.
Crown Corporations
Crown corporations provided financial forecasts and statements of assumptions approved by their boards, which were used to prepare the fiscal plan. These forecasts, along with further details on assumptions and risks, are also included in the service plans of these corporations and agencies, being released with the budget.
SUCH Sector
Health authorities have submitted an overall balanced financial plan for 2021/22 to 2023/24. The individual plans have been signed off by the board chairs of the respective health authorities. The Ministry of Health will continue to work with the health authorities to manage any emerging revenue and spending pressures.
Forecasts for the universities, colleges, and institutions have been signed off by chairs of the board or audit committee and lead financial officers.
Budget and Fiscal Plan - 2021/22 to 2023/24
65
Three Year Fiscal Plan
Forecasts for the combined school districts have been compiled by the Ministry of Education based on the requirements of the School Act, the current year plans developed by the school districts, and ministry policy assumptions respecting future funding allocations. Variances from these assumptions could impact the fiscal plan.
The fiscal plan incorporates three-year projections for school districts, post-secondary institutions, and health authorities, based on plans submitted by those entities.
Spending
Government funds several demand-driven programs, including those delivered through third-party delivery agencies, such as health care, K-12 and post-secondary education, income assistance and community social services. The budgets for these programs reflect reasonable estimates of demand and other factors such as price inflation. If demand is higher than estimated, this will result in a spending pressure to be managed.
The spending plans for the Ministry of Forests, Lands, Natural Resource Operations and Rural Development, and the Ministry of Public Safety and Solicitor General include base amounts to fight wildfires and deal with floods and other public emergencies.
Unanticipated or unpredictable occurrences may affect expenses in these ministries.
Increasing levels of debt result in a higher potential impact from the risk of interest rate increases.
Details on major assumptions and sensitivities resulting from changes to those assumptions are shown in Appendix Table A7 and in ministry service plans.
Capital Risks
The capital spending forecasts included in the fiscal plan may be affected by subsequent planning (i.e. design development) and procurement activities (i.e. receipt/review of construction bids) resulting in project costs that are higher than the initial approved budgets. For large capital projects, government will review the budget and scope risks, and the strategies to mitigate these risks.
Other risks affecting capital spending forecasts include:
| • | changes in the timing of capital project spending, which may reduce borrowing requirements and debt needed to fund capital investments in the near term; |
| • | weather and geotechnical conditions, including the outcome of environmental impact studies, causing project delays and/or unexpected costs; |
| • | changes in market conditions, including service demand, the impact of inflation on building material costs, the availability of, and wage rates for, skilled workers, and borrowing costs; |
| • | the accuracy of capital project budget and construction schedule forecasts; |
| • | the successful negotiation/timing of cost-sharing agreements with the federal government and other funding partners; and |
| • | the timing and outcomes of public-private sector partnership negotiations. |
Budget and Fiscal Plan - 2021/22 to 2023/24
66
Three Year Fiscal Plan
Pending Litigation
The spending plan for the Ministry of the Attorney General contains provisions for payments under the Crown Proceeding Act based on estimates of expected claims, judgments and related costs of settlements likely to be incurred. Litigation developments may occur that are beyond the assumptions used in the plan (for example, higher-than-expected volumes, or size of claim amounts and timing of judgments and settlements). These developments may affect government revenues and/or expenditures in other ministries. Litigation may also impact government agencies and corporations.
Write-downs and Other Adjustments
Ministry budgets provide for anticipated levels of asset or loan write-downs where these expenses can be reasonably estimated. The overall spending forecast does not make allowance for extraordinary items other than the amount provided in the contingencies vote.
Prudence and Risk
The economic, financial, and external variables and factors that impact the estimates of revenues, expenditures, capital spending and debt will change throughout the year as new information becomes available with potentially material impacts. As a result, the actual operating surplus/deficit, capital expenditure and debt figures may differ from the current forecast. Government will continue to update the fiscal plan throughout the year.
Government incorporates four main levels of prudence to help mitigate risks to the budget plan projections. These prudence measures generally have resulted in government positively exceeding its budget targets.
| • | The Budget 2021 economic outlook is lower than the average of the forecasts provided by the members of the Economic Forecast Council (EFC). The Budget 2021 plan assumes annual real GDP growth of 4.4 per cent in 2021, 3.8 per cent in 2022, and range between 2.1 per cent and 2.5 per cent annually over the 2023 to 2025 period. This is lower than the EFC average by 0.5 percentage points in both 2021 and 2022 (somewhat more than usual), and by 0.2 percentage points in both 2023 and 2024. The prudent outlook compared to the private sector acknowledges the downside risks to the economic forecast over the forecast horizon. |
| • | The Budget 2021 natural gas price forecast is lower than the private sector average over the next three years, reflecting the recommendation of Dr. Tim O’Neill in 2013 to adopt more caution in preparing the natural gas royalty forecast. Over the ensuing three years, the Budget 2021 natural gas price projection averages 14 cents lower than the average of the private sector forecasters (see Appendix Table A6 for details). |
| • | Budget 2021 includes higher than normal forecast allowances, recognizing the increased forecasting uncertainty, with $1.0 billion in 2021/22, $750 million in 2022/23, and $400 million in 2023/24. The forecast allowance helps offset the impacts of revenue volatility and statutory spending such as additional costs to fight wildfires and to deal with floods and other public emergencies. |
Budget and Fiscal Plan - 2021/22 to 2023/24
67
Three Year Fiscal Plan
| • | The Budget 2021 expense forecast includes a contingencies allocation of $1.0 billion in 2021/22, $800 million in 2022/23 and $700 million 2023/24. The contingencies allocation is a prudent measure to provide for unforeseen and unbudgeted costs that may arise, and to fund priority initiatives. In addition to the usual contingency provisions, Budget 2021 includes Pandemic and Recovery Contingencies of $3.25 billion in 2021/22, $1.0 billion in 2022/23, and $300 million in 2023/24. Furthermore, Budget 2021 also includes notional allocations for caseload pressures and priority initiatives that may require funding in future budgets, providing $1.5 billion in 2022/23 and $2.0 billion in 2023/24. |
The EFC provides advice to the Minister of Finance annually on issues facing the global economy and B.C.’s economic outlook, including areas of concern, risks and opportunities for the B.C. economy. The Minister of Finance receives advice from staff and colleagues on the various levels of prudence incorporated in the fiscal plan, tax policy initiatives for consideration and the potential risks that could arise over the next three years. Since the risks could be ongoing or one-time in nature and could impact both revenues and expenditures, consideration is given to both the forecast allowance and contingencies vote allocations. However, since a number of these risks are not readily quantifiable, there is no specific formulaic approach in the determination of the forecast allowance and contingencies vote allocations.
Budget and Fiscal Plan - 2021/22 to 2023/24
68
PART 2 | TAX MEASURES
Table 2.1 Summary of Tax Measures
| | | | | | Taxpayer Impacts | |
| | | | Effective Date | | 2021/22 | | | | 2022/23 | |
| | | | | ($ millions) | |
| Income Tax Act | | | | | | | | | |
| • | Extend book publishing tax credit | | April 1, 2021 | | (3 | ) | | | (3 | ) |
| • | Waive requirement to repay B.C. Emergency Benefit for Workers | | March 1, 2020 | | — | | | | — | |
| • | Extend mining flow-through share tax credit eligibility period | | March 1, 2018 | | * | | | | * | |
| • | Align climate action tax credit increase with carbon tax rate increase | | July 1, 2021 | | 33 | | | | 10 | |
| | | | | | | | | | | |
| Probate Fees | | | | | | | | | |
| • | Provide remission of probate fees on memorial grants | | July 1, 2021 | | * | | | | * | |
| | | | | | | | | | | |
| Carbon Tax Act | | | | | | | | | |
| • | Delay carbon tax rate increase | | April 1, 2021 | | (228 | ) | | | — | |
| | | | | | | | | | | |
| Motor Fuel Tax Act | | | | | | | | | |
| • | Expand eligibility for the fuel tax refund for persons with disabilities | | April 20, 2021 | | * | | | | * | |
| | | | | | | | | | | |
| Provincial Sales Tax Act | | | | | | | | | |
| • | Introduce exemption for electric bicycles and tricycles | | April 21, 2021 | | (7 | ) | | | (7 | ) |
| • | Expand exemption for new resident’s effects | | March 11, 2019 | | * | | | | * | |
| • | Address provincial sales tax refunds on “grey market” vehicle transactions | | Regulation | | * | | | | * | |
| | | | | | | | | | | |
| Tobacco Tax Act | | | | | | | | | |
| • | Increase tobacco tax rates for cigarettes, heated tobacco products and loose tobacco | | July 1, 2021 | | 60 | | | | 80 | |
| | | | | | | | | | | |
| Home Owner Grant Act | | | | | | | | | |
| • | Increase threshold for home owner grant phase-out to $1.625 million from $1.525 million | | January 1, 2021 | | * | | | | * | |
| | | | | | | | | | | |
| School Act | | | | | | | | | |
| • | Set provincial residential class school property tax rates | | January 1, 2021 | | * | | | | * | |
| • | Set provincial non-residential class school property tax rates | | January 1, 2021 | | * | | | | * | |
| | | | | | | | | | | |
| Taxation (Rural Area) Act | | | | | | | | | |
| • | Set provincial rural area property tax rates | | January 1, 2021 | | * | | | | * | |
| | | | | | | | | | | |
| Speculation and Vacancy Tax Act | | | | | | | | | |
| • | Introduce exemption for corporations owned by agents of government | | 2021 tax year | | * | | | | * | |
| • | Introduce exemption for registered charities that hold property through a trustee | | November 27, 2018 | | * | | | | * | |
| • | Amend definition of beneficial owner | | November 27, 2018 | | * | | | | * | |
| | | | | | | | | | | |
| Various Acts | | | | | | | | | |
| • | Various technical measures | | Various | | * | | | | * | |
| | | | | | | | | | | |
| Total | | | | (145 | ) | | | 80 | |
* Denotes measures that have no material impact on taxpayers.
Budget and Fiscal Plan - 2021/22 to 2023/24
69
Tax Measures
Tax Measures — Supplementary Information
For more details on tax changes see:
www.gov.bc.ca/budgettaxchanges
Income Tax Act
Book Publishing Tax Credit Extended
As announced on March 10, 2021, the book publishing tax credit is extended for five years to March 31, 2026.
The book publishing tax credit supports an industry with a predominantly female work force.
Requirement to Repay B.C. Emergency Benefit for Workers Waived
Self-employed individuals are not required to repay the B.C. Emergency Benefit for Workers if they would have qualified for the benefit or the Canada Emergency Response Benefit on their gross income. This mirrors a federal change to the Canada Emergency Response Benefit.
Approximately 57 per cent of individuals who benefit from this relief are women. The average age of individuals who benefit from this relief is higher than that of B.C. Emergency Benefit for Workers recipients as a whole.
Mining Flow-Through Share Tax Credit Eligibility Period Extended
As previously announced, the mining flow-through share tax credit eligibility period during which an expenditure must be incurred by the issuer to be renounced in favour of flow-through shares is temporarily extended by 12 months. This aligns with proposed temporary federal timelines due to COVID-19. The 12-month extension applies to flow-through share agreements entered into on or after March 1, 2018 and before 2021 when using the general rule. It also applies to agreements entered into in 2019 or 2020 when using the look-back rule.
Purchasers of mining flow-through shares who claim the tax credit tend to be high-income earners and are predominantly male. This measure is not expected to change who will be claiming the credit.
The credit also supports mining, which has a predominantly male work force with above-average wages. The proportion of mining industry workers who are Indigenous is higher than in the B.C. labour market overall.
Budget and Fiscal Plan - 2021/22 to 2023/24
70
Tax Measures
Climate Action Tax Credit Increase Aligned with Carbon Tax Rate Increase
Effective July 1, 2021, the climate action tax credit rate remains at $174 per adult and $51 per child due to the delay in the carbon tax rate increase. Rates will increase to $193.50 per adult and $56.50 per child on July 1, 2022, in line with the corresponding carbon tax rate increase.
This alters the schedule established by Budget 2019 by one year. Delaying the climate action tax credit increase aligns with the delay to carbon tax increases, which support businesses and families during the COVID-19 pandemic while keeping B.C. on track to reach the federally mandated price of $50 per tonne of carbon dioxide equivalent emissions by 2022.
Approximately 63 per cent of the climate action tax credit goes towards single people. Single people comprise 75 per cent of the recipients, of which 57 per cent are female and 43 per cent are male.
The climate action tax credit helps offset the effects of carbon taxes paid by low- to moderate-income individuals and families.
Probate Fees
Remission of Probate Fees on Memorial Grants Provided
Effective July 1, 2021, amounts received from the federal Memorial Grant Program for First Responders by a person’s estate will not be subject to probate fees under the Probate Fee Act.
Carbon Tax Act
Carbon Tax Rate Increases Delayed
As announced on September 2, 2020, carbon tax rates are set at $45 per tonne of carbon dioxide equivalent emissions (CO2e) effective April 1, 2021. Rates will increase to $50 per tonne of CO2e on April 1, 2022.
This alters the schedule established by Budget 2017 Update, which would have increased carbon tax rates to $45 and $50 per tonne of CO2e on April 1, 2020, and April 1, 2021, respectively. Delaying the carbon tax increases will support businesses and families during the COVID-19 pandemic while keeping B.C. on track to reach the federally mandated price of $50 per tonne of CO2e by 2022.
The corresponding increase to the climate action tax credit is also delayed by one year.
Carbon tax applies broadly and does not specifically target individuals based on their gender, class, sexuality, race, ethnicity, religion, age or ability status. It is estimated that households pay approximately 28 per cent of the carbon tax, with businesses paying approximately 72 per cent. Research suggests that B.C.’s carbon tax is progressive. The negative effect on households with below-median income is smaller than that on households with above-median income. The climate action tax credit helps offset the effects of carbon taxes paid by low- to moderate-income individuals and families.
Budget and Fiscal Plan - 2021/22 to 2023/24
71
Tax Measures
Motor Fuel Tax Act
Eligibility for the Fuel Tax Refund for Persons with Disabilities Expanded
Effective April 20, 2021, eligibility for the motor fuel tax refund for persons with disabilities is expanded to include recipients of disability assistance, or a disability supplement, from Indigenous Services Canada. Eligibility is also expanded to include anyone who is in receipt of a 100 per cent disability pension resulting from service as a member of Her Majesty’s forces, whether or not this pension relates to an injury sustained in a war.
The motor fuel tax refund for persons with disabilities provides refunds of up to $500 per calendar year to people with qualifying disabilities.
If a person receives disability assistance or supplements under the Employment and Assistance for Persons with Disabilities Act, they are eligible to participate in the fuel tax refund program. Indigenous Services Canada provides comparable disability assistance or supplements to persons with disabilities who live on reserve lands. While people who live on reserve lands are eligible to participate in the fuel tax refund program if they meet other eligibility criteria, adding the on-reserve federal funding program to the eligibility criteria addresses a potential inequity.
Similarly, while an existing fuel tax refund program criterion relates to disability pensions that arise out of service in Her Majesty’s forces, eliminating the requirement that the pension relate to active service in a war recognizes that disabilities can arise out of other forms of service.
Provincial Sales Tax Act
Exemption for Electric Bicycles and Tricycles Introduced
Effective April 21, 2021, electric bicycles and tricycles are exempt from provincial sales tax. In addition, conversion kits used to electrify conventional bicycles and tricycles, and parts and services for electric bicycles and tricycles, are exempt from provincial sales tax.
For the purpose of these exemptions, electric bicycles or tricycles must have pedals or hand cranks that allow for human propulsion, wheels with a minimum diameter of 350 millimetres and maximum motor power of 500 watts. Additionally, they must be limited to a motor-assisted speed of 32 kilometres per hour and must not have a combustion engine or be marketed or designed to have the appearance of a motorcycle, moped or scooter. These exemptions support the Province’s Active Transportation Strategy goal of doubling the number of trips taken with active transportation by 2030.
Sixty-three per cent of British Columbians who commute to work by bicycle are male and 37 per cent are female. Older adults and people with physical limitations are also underrepresented. The adoption of electric bicycles or tricycles helps reduce these disparities by providing additional power to make longer and faster trips. Research shows that factors that keep women from biking more include increased concern for safety, the need to make multiple stops while hauling items such as groceries and transporting passengers. Electric bicycles and tricycles reduce these barriers by facilitating travel with cargo and children, as well as allowing for longer trips and providing trip times that are comparable to motor vehicle travel within 10 kilometres.
Budget and Fiscal Plan - 2021/22 to 2023/24
72
Tax Measures
Increased usage of electric bicycles or tricycles by underrepresented groups enhances access to physical activity and the community, contributing to better health outcomes that result in societal benefits.
Exemption for New Resident’s Effects Temporarily Expanded
Effective March 11, 2019, the exemption for a new resident’s effects is expanded to provide more time for new residents to bring their vehicles and other goods into B.C. without being subject to provincial sales tax. Under normal conditions, the personal effects of a new resident are generally exempt from provincial sales tax if they are brought into B.C. within one year of the individual becoming a resident. The expanded time frame is provided in response to COVID-19 travel restrictions and recognizes that it could have been challenging for people who became residents up to one year before the pandemic to complete their moves within the time frame allowed by the exemption.
With this temporary expansion, a new time frame applies to any person who became a resident of B.C. on or after March 11, 2019. Individuals who would otherwise qualify for the exemption will now have until the earlier of January 1, 2023 or one year following the end of the most recent quarantine order made under the Quarantine Act (Canada), to bring their personal effects into B.C.
Government does not have data on individuals who would be expected to pay provincial sales tax in the absence of this measure, but expects the benefits to accrue primarily to new residents who originate from locations ordinarily accessible from B.C. by road, such as other Canadian provinces and the United States. The measure enables these individuals to delay travelling back to their former residences for the purpose of personally transporting their vehicles and other goods to B.C. for personal use.
Measures to Address Provincial Sales Tax Refunds on “Grey Market” Vehicle Transactions to be Introduced
Effective on a date to be set by regulation, the provincial sales tax refund for motor vehicles purchased in B.C. and resold within seven days will be eliminated. Concurrently, persons who purchase vehicles in B.C. will be deemed to have purchased the vehicles for their own use, and not for resale, unless they represent otherwise to the seller at the time of purchase.
Provincial sales tax is not payable on goods purchased solely for resale. Under the current rules, a person who intends to resell a vehicle could claim a provincial sales tax exemption by informing the seller of the vehicle of their intentions. However, many motor vehicle dealers will not sell vehicles to resellers. For this reason, “grey market” purchasers who intend to resell vehicles do not state their intentions, pay the provincial sales tax and apply to the government for a refund. The changes announced in Budget 2021 maintain the longstanding provincial sales tax treatment of resale inventory but close the provincial sales tax refund process to the type of “grey market” activity described in Peter German’s money laundering report.
The Ministry of Finance does not collect, or have readily available, data on the gender, class, sexuality, race, ethnicity, religion, age or ability status of provincial sales tax refund applicants. Therefore, the distributional effects of these measures to curtail provincial sales tax refunds associated with “grey market” vehicle transactions are not known.
Budget and Fiscal Plan - 2021/22 to 2023/24
73
Tax Measures
Tobacco Tax Act
Tobacco Tax Rates for Cigarettes, Heated Tobacco Products and Loose Tobacco Increased
Effective July 1, 2021, the tax rate on cigarettes is increased to 32.5 cents from 29.5 cents per cigarette (to $65 from $59 per carton of 200 cigarettes). The default tax on heated tobacco products is also increased to 32.5 cents from 29.5 cents per heated tobacco product. A heated tobacco product is a product that contains tobacco and is designed to be heated, but not combusted, in a tobacco heating unit to produce a vapour for inhalation.
Also, effective July 1, 2021, the tax rate on loose tobacco (tobacco in a form other than cigarettes, cigars or heated tobacco products) is increased to 65 cents from 39.5 cents per gram. This increase better aligns the tax on “roll-your-own” tobacco with the level of tax that applies to premade cigarettes.
This measure will create an added incentive to reduce tobacco consumption. Smoking rates are higher among men and lower-income individuals. These populations will bear a greater proportion of the tax increase.
Home Owner Grant Act
Threshold for Home Owner Grant Set
As announced on January 5, 2021, the threshold for the phase-out of the home owner grant is increased to $1.625 million from $1.525 million for the 2021 tax year. For properties valued above the threshold, the grant is reduced by $5 for every $1,000 of assessed value that exceeds the threshold.
The home owner grant program provides a benefit to Canadian citizens and permanent residents of Canada who live in their home as their principal residence. The home owner grant program benefits home owners, who on average have higher incomes and wealth than renters. The program does not have an income test. The grant does not benefit renters or landlords, or owners for their second homes or vacation homes, corporate owners, foreign owners, or owners of vacant land or residential class improvements other than a home.
Canada-wide, homeownership is strongly related to age. For example, in 2016, a person aged 65 and older was 1.7 times more likely to own a home than a person aged 20 to 34. The homeownership rate was highest at 76.3 per cent for people aged 55-64, and was slightly lower, at 74.6 per cent for the population aged 65 and over.
Under the B.C. home owner grant program, seniors over the age of 65, certain veterans of older conflicts and their surviving spouses, and owners who house a person with disabilities are eligible for an additional grant amount of up to $275.
The reduction of the home owner grant amount for properties over the threshold means that otherwise-eligible owners of the most expensive homes receive only a partial grant or no grant at all. Low-income owners who would be eligible for the additional grant amount but who lose some of or all their grant because of the high value of their home can apply to the grant administrator for a low-income supplement which replaces the lost amount of grant. A similar program benefits all low-income veterans.
Budget and Fiscal Plan - 2021/22 to 2023/24
74
Tax Measures
School Act
Provincial Residential Class School Property Tax Rates Set
The longstanding rate-setting policy is that average residential class school property taxes, before application of the home owner grant, increase by the previous year’s provincial inflation rate. This rate-setting policy has been in place since 2003 and continues in 2021.
Provincial Non-Residential Class School Property Tax Rates Set
A single province-wide school property tax rate is set for each of the non-residential property classes. Consistent with longstanding policy, the rates for 2021, except for the rate for the industrial property classes, will be set so that non-residential class school tax revenue will increase by inflation plus tax on new construction from the 2019 tax revenues. The major industry class tax rate and the light industry class tax rate will be set at the same rate as the business class tax rate, consistent with the policy announced in Budget 2008.
This rate-setting policy has been in place since 2005, except for the 2020 tax year when significant property tax relief was delivered to commercial property classes through a reduction in school property tax rates.
The tax rate policy seeks to achieve an equitable balance between taxpayers in different areas of the province. Tax rates are lower in school districts that have the highest average assessed values. Still, a residential taxpayer with an average home value in a school district with low average values pays less school tax on their home than a taxpayer with an average home value in a school district with higher average assessed values.
The personal characteristics of the owners of non-residential property are generally not collected or available through the property tax system. Businesses most affected by a property tax are those that rely on brick and mortar operations.
Taxation (Rural Area) Act
Provincial Rural Area Property Tax Rates Set
A single rural area residential property tax rate applies province-wide. The longstanding rate-setting policy that average residential rural property taxes increase by the previous year’s provincial inflation rate continues for 2021.
Consistent with longstanding policy, non-residential rural area property tax rates are set so that total non-residential rural area tax revenue increases by inflation plus tax on new construction.
With the exception of utility and industrial properties in the Peace River Regional District, there is one rural tax rate per property class, province-wide. This means the tax falls more heavily in areas where average values are higher. The effect is relatively minor because average values do not vary widely in rural areas across B.C.
Budget and Fiscal Plan - 2021/22 to 2023/24
75
Tax Measures
Speculation and Vacancy Tax Act
Exemption for Corporations Owned by Agents of Government Introduced
Beginning in the 2021 tax year, corporations owned by agents of government can claim an exemption from the speculation and vacancy tax, consistent with corporations owned by municipalities, regional districts and Indigenous nations.
This exemption directly benefits agents of government rather than individuals.
Exemption for Registered Charities that Hold Property through a Trustee Introduced
Effective November 27, 2018, a residential property owned by a trustee of a trust who is holding legal title for the benefit of a registered charity can claim an exemption from the speculation and vacancy tax. The Speculation and Vacancy Tax Act already provides an exemption for owners that are registered charities. The new exemption ensures that registered charities are also exempt when they are not on legal title, and instead hold property through a trust.
The known cases of trustees who are holding legal title for the benefit of registered charities are all trustees of religious organizations. If these properties are liable for speculation and vacancy tax, they will presumably have less funds to perform their charitable activities, which will primarily negatively affect the people who rely on these charities.
Definition of Beneficial Owner Amended
Effective November 27, 2018, the Speculation and Vacancy Tax Act is amended to clarify that a beneficial owner, whose interest in a residential property is registered in the name of a trustee of a trust and contingent on the death of another individual, is not considered a beneficial owner for the purpose of the speculation and vacancy tax. This change harmonizes the definition of beneficial owner with the Land Owner Transparency Act and the Business Corporations Act.
Life interest trusts are commonly used by property owners as part of their end-of-life planning. This change to the definition of beneficial owner with respect to ownership interest contingent on death will most notably affect seniors and spouses of seniors who own homes and are residents of B.C.
Budget and Fiscal Plan - 2021/22 to 2023/24
76
Tax Measures
Various Acts
Various Technical Measures
Budget 2021 introduces a number of technical amendments to various tax acts including the Assessment Act, Employer Health Tax Act, Hydro and Power Authority Act, Income Tax Act, Police Act, Ports Property Tax Act, Property Transfer Tax Act, Provincial Sales Tax Act, Speculation and Vacancy Tax Act and Vancouver Charter for clarity and certainty:
| • | Effective on royal assent the Assessment Act is amended to: |
| – | allow BC Assessment to deliver notices electronically with taxpayer consent; |
| – | allow BC Assessment to make accessible through other online portals reports that are currently accessible only through BC Online; and |
| – | align with the terminology in the Vancouver Charter. |
| • | Effective March 30, 2021, the Employer Health Tax Act is amended to provide administrative provisions in respect of the Increased Employment Incentive. |
The incentive provides a 15 per cent refundable tax credit for employers who created new jobs for B.C. workers or increased payroll for existing low- or middle-income employees over the last quarter (October to December) of 2020.
| • | Effective January 1, 2019, the Hydro and Power Authority Act is amended to clarify that the Employer Health Tax Act applies to BC Hydro. |
| • | The Income Tax Act is amended: |
| – | effective March 13, 2020, to extend the deadline to file tax credits to the earlier of December 31, 2020 and six months from the original filing deadline for the book publishing tax credit, film tax credits, interactive digital media tax credit, mining exploration tax credits, scientific research and experimental development tax credit and the training tax credits; |
| – | effective March 25, 2020, to ensure that federal COVID-19 response measures do not affect the operation of B.C. income tax benefits and remittances of provincial income tax withholdings; and |
| – | effective December 18, 2020, to provide administrative provisions in respect of the BC Recovery Benefit. The benefit is a refundable tax credit of up to $500 for an individual and up to $1,000 for a family. |
| • | Effective on royal assent, the Carbon Tax Act, Employer Health Tax Act, Forest Act, Income Tax Act, Insurance Premium Tax Act, International Business Activity Act, Logging Tax Act, Mineral Tax Act, Motor Fuel Tax Act, Property Transfer Tax Act, Provincial Sales Tax Act, Speculation and Vacancy Tax Act and Tobacco Tax Act are amended to harmonize appeal procedures with the Court of Appeal Act. This will allow parties to appeal a Supreme Court of British Columbia decision without having to first obtain leave of a justice of the Court of Appeal. |
| • | Effective on royal assent, the Carbon Tax Act, Home Owner Grant Act, Insurance Premium Tax Act, Land Tax Deferment Act, Logging Tax Act, Motor Fuel Tax Act, Property Transfer Tax Act, Provincial Sales Tax Act and Taxation (Rural Area) Act are amended to allow Ministry of Finance officials to perform analysis of tax data to develop fiscal policy. |
Budget and Fiscal Plan - 2021/22 to 2023/24
77
Tax Measures
| • | Effective on a date to be specified by regulation, the Employer Health Tax Act, Income Tax Act and Speculation and Vacancy Tax Act are amended to further protect taxpayer information from unintended disclosures. |
| • | Effective on January 1, 2022, the Police Act is amended to base the calculation of rates and apportionments on the estimate of costs by the Solicitor General for the previous taxation year rather than the current taxation year. This will allow tax rates to be set earlier in the taxation year. |
| • | Effective for the 2021 taxation year, the Ports Property Tax Act is amended to add District of Stewart to the list of municipalities receiving compensation following the designation of Stewart World Port. |
| • | Effective April 20, 2021, the Property Transfer Tax Act is amended to restrict a taxpayer’s choice of arbitration to disputes about the fair market value portion of an assessment. |
| • | The Provincial Sales Tax Act is amended to: |
| – | effective April 1, 2021, clarify that the exemption for water does not apply to beverages taxed under the soda beverage measures announced in Budget 2020; |
| – | effective on royal assent and on a date to be specified by regulation, make minor changes in terminology to provisions related to multi-jurisdictional vehicles; |
| – | effective on royal assent, clarify that an agent is authorized to use the registration number of their principal when acting on their behalf; and |
| – | effective April 1, 2021, make minor clarifications to provisions related to registration thresholds for Canadian sellers of goods, along with Canadian and foreign sellers of software and telecommunication services. |
| • | The Speculation and Vacancy Tax Act is amended to: |
| – | effective on royal assent, update the reference to line 150 of an income tax return to line 15000; and |
| – | effective January 1, 2022, clarify that the administrator can assess within the specified time period. |
| • | Effective on royal assent, minor changes in terminology are made to the Vancouver Charter for consistency with technical amendments to the Assessment Act. |
Budget and Fiscal Plan - 2021/22 to 2023/24
78
PART 3 | BRITISH COLUMBIA ECONOMIC REVIEW AND OUTLOOK 1
Summary
The COVID-19 pandemic pushed economies all over the world into deep recessions. B.C. was no exception. Widespread job losses strained households and unprecedented challenges weighed on businesses. While the reopening of the economy and government emergency response programs have gone a long way to support economic recovery, the pandemic is not over and significant challenges remain. The swift development of effective vaccines together with stronger than expected economic activity in 2020 have improved the outlook.
While there is a high degree of uncertainty, the Ministry of Finance (Ministry) is returning to its regular practice of providing a five-year economic outlook. The outlook is conditional on assumptions which could change substantially over the coming months. As such, the outlook is subject to a larger than normal degree of risk and potential revision.
The economic outlook assumes that provincial, national, and global economic activity broadly returns to pre-pandemic levels sometime in 2022. Underpinning the projected recovery are the assumptions that large-scale immunization campaigns will be well underway and that global travel restrictions will ease. The exact timing will vary by jurisdiction and industry. High-contact service industries such as tourism, hospitality, recreation, and retail will likely be challenged by the need for containment measures for some time. As such, the recovery is expected to continue to be uneven.
The Ministry estimates that the economy contracted by 5.3 per cent in 2020 and forecasts that it will expand by 4.4 per cent in 2021 and then 3.8 per cent in 2022. Over the medium-term (2023 to 2025), growth is expected to range between 2.1 per cent and 2.5 per cent annually.
Chart 3.1 Ministry’s Outlook for B.C. Prudent Compared to Private Sector
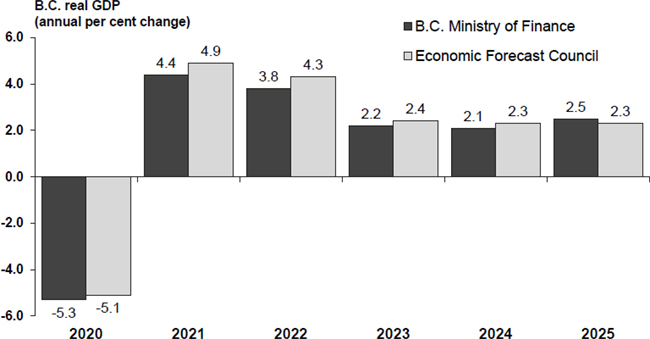
1 Reflects information available as of April 7, 2021, unless otherwise indicated.
Budget and Fiscal Plan - 2021/22 to 2023/24
79
British Columbia Economic Review and Outlook
The Ministry’s forecast for B.C. real GDP growth is lower than the outlook provided by the Economic Forecast Council (EFC), with 0.5 percentage points of prudence in both 2021 and 2022 (somewhat more than usual), and 0.2 percentage points of prudence in both 2023 and 2024. This differential is one of the levels of prudence built into the fiscal plan. The Ministry’s outlook for 2025 is slightly higher than the average EFC forecast as LNG production is anticipated to provide more support to the economy in that year.
The main downside risk to B.C.’s economic outlook continues to be uncertainty regarding the duration of the COVID-19 pandemic and the degree to which it will have lasting effects on provincial, national, and global economies. Other risks include ongoing uncertainty regarding global trade policies and lower commodity prices.
British Columbia Economic Activity and Outlook
The economic outlook has improved over the forecast horizon. The Ministry’s current estimate of a 5.3 per cent decline in B.C. real GDP in 2020 is up from the 6.2 per cent decline forecast in the Fall 2020 Economic & Fiscal Update. Recent data has shown that growth in retail sales, housing activity, exports, and aggregate wages and salaries have outpaced expectations.
Table 3.1 British Columbia Economic Indicators
| | | Fourth Quarter | | Annual* | | Year-to-Date |
| All data seasonally adjusted | | Oct. to Dec. 2020 change from Jul. to Sep. 2020 | | Jan. to Dec. 2020 change from Jan. to Dec. 2019 | | Jan. to Feb. 2021 change from Jan. to Feb. 2020 |
| | | Per cent change | | Per cent change | | Per cent change |
| Employment | | +4.0 | | -6.6 | | -1.1 |
| Manufacturing shipments1 | | +4.8 | | -3.3 | | +19.5 |
| Merchandise exports | | +8.8 | | -8.2 | | +24.4 |
| Retail sales1 | | +4.0 | | +2.6 | | +15.3 |
| Housing starts | | +4.5 | | -16.0 | | +11.1 |
| Non-residential building permits | | +3.4 | | -14.8 | | -8.3 |
* Annual non-seasonally adjusted data
1 Data to January
Expectations for the coming years are also higher. The most significant development driving this shift was the approval and rollout of COVID-19 vaccines. It is prudently assumed that all British Columbian’s who are eligible and choose to be vaccinated will receive it by September 2021. Vaccine rollout has spurred optimism among households, businesses, and governments and brought forward expectations of the resumption of economic activities constrained by the pandemic. The outlook for global trade is also brighter. As such, the rebound in the economy in 2021 is now expected to be 4.4 per cent, up from the Fall 2020 Economic & Fiscal Update forecast of 3.0 per cent. In 2022, growth is expected to be 3.8 per cent. Nevertheless, while an end to the pandemic is now conceivable, the timing is uncertain and economic conditions remain challenging. Consequently, risks to the outlook remain elevated. Over the medium-term, B.C.’s economy is forecast to grow by 2.3 per cent on average from 2023 to 2025.
The Ministry estimates that B.C. nominal GDP fell by 4.5 per cent in 2020 and will grow by 6.4 per cent in 2021 and by 5.4 per cent in 2022. This is an improvement from the Fall 2020 Economic & Fiscal Update projection of a 6.0 per cent decline in 2020 and a 3.9 per cent increase in 2021. Over the medium-term, B.C.’s nominal GDP is forecast to grow by 4.1 per cent on average from 2023 to 2025.
Budget and Fiscal Plan - 2021/22 to 2023/24
80
British Columbia Economic Review and Outlook
Private sector forecasters have revised up their near-term economic growth projections for B.C. in recent months. An average of six private sector forecasters2 (a subset of the Economic Forecast Council) estimates that B.C. real GDP declined by 5.0 per cent in 2020 and forecasts growth of 5.8 per cent in 2021 and 4.4 per cent in 2022. This is better than the estimated decline of 5.4 per cent on average across Canada in 2020 and the expected national growth of 5.7 per cent in 2021 and 4.2 per cent in 2022.
Labour Market
B.C. lost an unprecedented number of jobs following the onset of the COVID-19 pandemic. At the beginning of 2020, B.C. had one of the strongest labour markets in the country with unemployment rates near historic lows. Then in March and April 2020, employment fell by 410,600 persons (-15.5 per cent). These losses were much worse than what the province experienced during the depths of the 2008/09 recession when B.C. lost fewer jobs over a longer period of time (around 69,000 jobs over seven months). Furthermore, pandemic-related employment losses have been uneven, mainly concentrated among lower-wage workers in high-contact services, where women and youth are overrepresented. And many who remained employed experienced reduced hours.
Employment has nearly recovered since the low in April 2020. As of February 2021, about 96 per cent of pandemic-related employment declines had been reversed, labour market participation rates had bounced back, and average hours worked had mostly recovered (bringing B.C. to 99.4 per cent of pre-pandemic employment levels). However, there were still 15,100 fewer people employed than in February 2020 (-0.6 per cent). Moreover, while the unemployment rate had retreated from a peak of 13.4 per cent in May 2020 to 6.9 per cent in February 2021, long-term unemployment had risen. The share of unemployed people that have been without work for twenty-seven weeks or more was 33.0 per cent in February 2021, its highest reading in thirty-six years (in February 2020 it was 12.8 per cent). Long-term unemployment is associated with the risks of skill erosion and labour market detachment.
In 2020 overall, employment fell by 6.6 per cent (-175,300 jobs) and year-to-date to February 2021 it was down by 1.1 per cent compared to the first two months of 2020. The year-to-date decline translated to a net loss of around 29,900 jobs, driven by 29,200 fewer full-time jobs and 750 fewer part-time jobs. Service industries heavily impacted by social distancing and travel restrictions continue to be negatively impacted by the pandemic. Industries less affected by social distancing or more able to adapt through remote work, on the other hand, have generally experienced growth. Year-to-date to February 2021, significant job losses were seen in construction (-32,000 jobs), accommodation and food services (-26,150 jobs), and wholesale and retail trade (-17,200 jobs), while employment gains were led by professional, scientific, and technical services (+29,800 jobs), public administration (+21,300 jobs), and healthcare and social assistance (+10,900 jobs).
In 2020, employee compensation (aggregate wages, salaries, and employers’ social contributions) in B.C. declined by 0.7 per cent compared to 2019. This decline is smaller in magnitude than that of employment because low-wage workers dominated job losses.
| 2 | A subset of the Economic Forecast Council that regularly forecasts economic performance in all provinces (BMO, CIBC, National Bank, RBC, Scotiabank, and TD), as of April 7, 2021. |
Budget and Fiscal Plan - 2021/22 to 2023/24
81
British Columbia Economic Review and Outlook
Chart 3.2 B.C. Employment
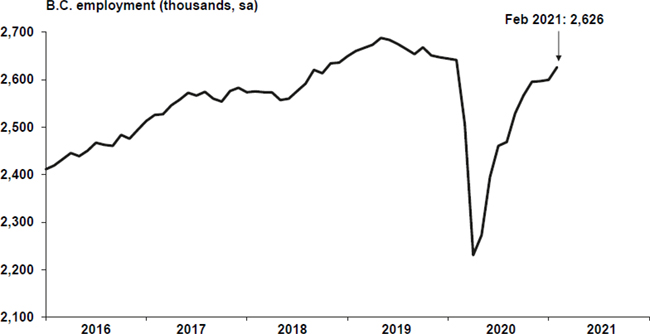
Sources: Statistics Canada (Labour Force Survey); Haver Analytics
Job losses in 2020 widened pre-pandemic inequalities. Among the industries hardest hit, youth, female, and visible minority workers tend to be overrepresented. Labour market outcomes among these groups have improved alongside the general employment recovery, but some gaps remain wider than before COVID-19. In February 2021, lower female youth employment accounted for over half of the remaining gap between pre-pandemic and current employment levels. And new labour force data shows that since at least July 2020 (when data became available), visible minorities in B.C. have experienced persistently higher unemployment rates than British Columbians who are neither Indigenous nor part of a group designated as a visible minority.
The B.C. unemployment rate averaged 8.9 per cent in 2020 and 7.5 per cent year-to-date to February 2021, up from 4.9 per cent in the first two months of 2020. Meanwhile year-to-date to February 2021, B.C.’s labour force grew by 1.7 per cent, reflecting population growth and a slight bump in the labour force participation rate from 64.9 per cent to 65.4 per cent.
Outlook
The outlook for B.C.’s labour market has improved. The approval and rollout of multiple COVID-19 vaccines has spurred optimism, but the path forward remains uncertain. Some sectors, such as tourism, hospitality, recreation, and retail, will take longer to operate near full capacity again. The Ministry forecasts employment in B.C. to increase by 4.7 per cent in 2021 (approximately +117,000 jobs), followed by annual growth of 2.4 per cent in 2022 (approximately +64,000 jobs). Growth is then expected to moderate over the medium-term, gradually slowing to 1.3 per cent by 2025.
The province’s unemployment rate is expected to average 7.5 per cent in 2021 and 6.7 per cent in 2022. After that, it is expected to gradually drift down each year until reaching 5.9 per cent in 2025.
Budget and Fiscal Plan - 2021/22 to 2023/24
82
British Columbia Economic Review and Outlook
Consumer Spending and Housing
In the wake of the COVID-19 pandemic, job losses, precautionary saving behaviour, reduced confidence, and physical distancing weighed on consumer spending and housing. Sharp contractions in retail and home sales however quickly reversed course as restrictions eased. By mid-2020, both were above their pre-pandemic levels. The resilience in spending was supported by government emergency response programs, adjusted business practices, a consumer pivot towards goods purchases while services were disrupted by the pandemic, low interest rates, and an increased demand for larger homes as the pandemic wore on and people continued to spend significantly more time at home. Furthermore, higher-wage workers were more likely to retain employment and maintain their income levels during the pandemic.
In 2020, nominal retail sales were 2.6 per cent higher than in 2019. Underlying the headline growth figure, however, were mixed results across retailers. Marked increases in purchases at retailers such as food and beverage (+15.2 per cent), building material and garden equipment and supplies (+15.7 per cent), and general merchandise (+8.0 per cent) stores contrasted with declining sales at clothing and clothing accessories stores (-25.1 per cent), gasoline stations (-12.4 per cent), and motor vehicles and parts dealers (-2.7 per cent). In January 2021, retail sales were up by 15.3 per cent compared to the same month a year earlier, driven by somewhat similar component movements.
Chart 3.3 B.C. Retail Sales
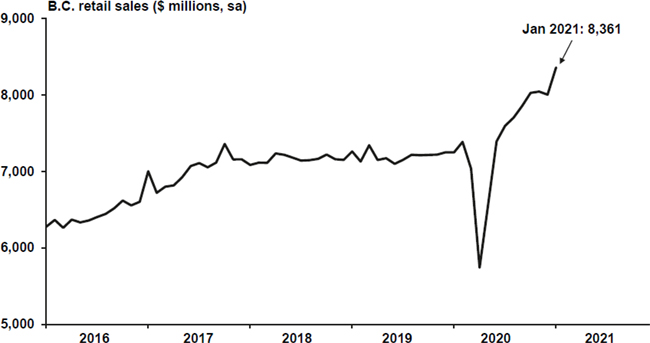
Sources: Statistics Canada; Haver Analytics
Despite the strength in spending on goods, surveys suggest that consumer confidence has been slower to recover. However, a marked uptick in March 2021 meant that the B.C. consumer confidence index averaged 116.1 points in the first three months of this year, roughly the same as during the first few months of 2020 (+0.3 percentage points).
National and sector-specific data suggests that B.C. consumer spending on services has likely declined sharply during the pandemic. While retail trade data offers a clear indication of consumer spending on goods, there is a lack of timely comprehensive data for consumer spending on services at the provincial level. National data shows that
Budget and Fiscal Plan - 2021/22 to 2023/24
83
British Columbia Economic Review and Outlook
nominal Canadian consumer spending on services fell by 9.0 per cent in 2020, though. And data for sales at food services and drinking places in B.C., which provides a partial picture, showed a decline of 25.2 per cent in 2020 compared to 2019.
Monthly B.C. home sales reached record levels in late 2020 and have continued to grow in 2021. Resilient higher-wage employment, low interest rates, and increased demand for larger dwellings by remote workers fueled housing demand. MLS home sales increased by 21.5 per cent in 2020 compared to 2019. And year-to-date to February 2021, home sales were up by 86.7 per cent relative to the first two months of 2020. Underlying this year-to-date rise were higher sales in every region including the four largest: Greater Vancouver (+75.1 per cent), Fraser Valley (+110.8 per cent), Okanagan-Mainline (+94.6 per cent), and Victoria (+60.0 per cent). Sharp increases were also observed in Chilliwack (+153.0 per cent) and on Vancouver Island (+98.7 per cent). This may reflect a greater demand for housing outside of larger central business districts, as newly remote workers became less constrained geographically.
Meanwhile, the average home sale price in B.C. increased by 11.6 per cent in 2020 compared to 2019. Strong average sale price growth was observed in most markets in the province. Year-to-date to February 2021, prices were up by 16.5 per cent compared to the same period a year earlier.
Chart 3.4 B.C. Home Sales and Price
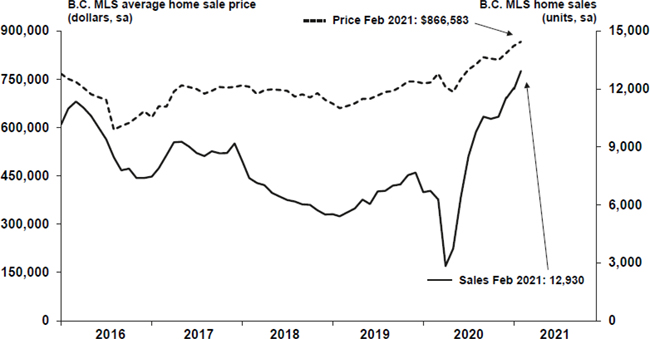
Sources: Canadian Real Estate Association; Haver Analytics
Regional MLS composite benchmark house prices (which incorporate all dwelling types) for Greater Vancouver and the Fraser Valley rose by 3.5 per cent and 3.6 per cent, respectively, in 2020. Price increases were observed across all dwelling types, but were strongest for single-family detached dwellings, followed by townhouses and then apartments. In February 2021, Greater Vancouver and Fraser Valley composite benchmark prices continued to rise, growing by 6.3 per cent and 10.6 per cent year-to-date, respectively.
Housing starts slowed but remained relatively strong in 2020, following a record high level in 2019. The 2016 to 2019 period was one of particularly strong housing starts in B.C. Although starts declined by 16.0 per cent in 2020, at 37,734 units, they were
Budget and Fiscal Plan - 2021/22 to 2023/24
84
British Columbia Economic Review and Outlook
Chart 3.5 Greater Vancouver HPI Benchmark Price
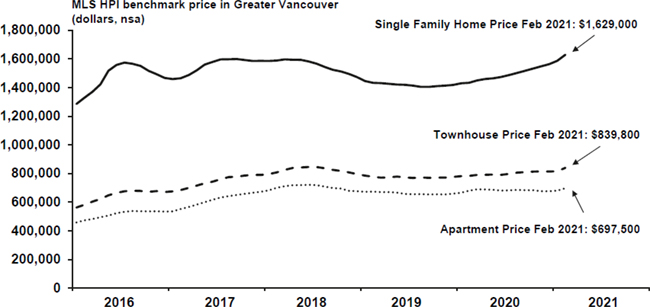
Sources: Canadian Real Estate Association; Haver Analytics
well above the long-run historical average of around 31,100 units. Apartment and other multi-dwelling units were the key drivers of large increases in recent years and also the moderation in 2020. Year-to-date to February 2021, housing starts were 11.1 per cent higher than the same period a year earlier. The value of residential building permits, a leading indicator of home construction, fell by 9.6 per cent in 2020 overall but edged up 1.4 per cent year-to-date in February 2021.
Chart 3.6 B.C. Housing Starts
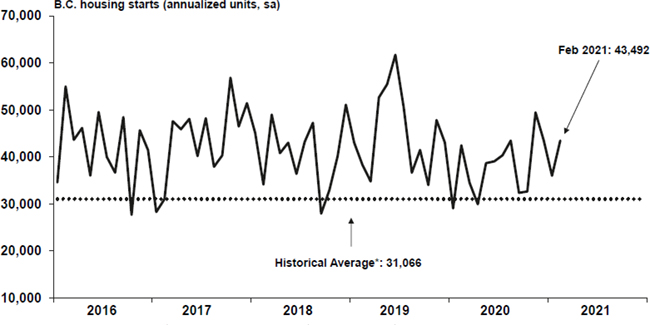
Sources: Canada Mortgage and Housing Corporation; Haver Analytics
* Historical average from Jan. 1990 to Dec. 2020
Outlook
Consumer spending is expected to pick up this year as employment prospects continue to improve and services move closer toward normal operations. Following an estimated decline of 5.6 per cent in 2020, the Ministry forecasts real household consumption of goods and services to increase by 3.7 per cent in 2021, followed by 3.8 per cent in 2022. Growth is then expected to moderate gradually to 2.1 per cent in 2025.
Budget and Fiscal Plan - 2021/22 to 2023/24
85
British Columbia Economic Review and Outlook
The Ministry expects nominal retail sales to continue to grow, expanding by 3.7 per cent in 2021 and then by 3.4 per cent in 2022. It is then expected to increase by 3.3 per cent each year on average over the 2023 to 2025 period.
The Ministry forecasts unit home sales to increase by 4.8 per cent in 2021, decline by 5.1 per cent in 2022 and a further 4.5 per cent in 2023, and then remain relatively flat over 2024 and 2025. The forecasted moderation in homes sales partly reflects an expectation of rising interest rates. Meanwhile, average home sale price growth in B.C. is expected to be relatively stable over the forecast horizon, rising 3.1 per cent in 2021, 1.9 per cent in 2022, and between 1.8 per cent and 2.0 per cent over the medium-term. Putting unit sales and prices together, the total value of home sales is forecast to increase by 8.0 per cent in 2021, fall by 3.3 per cent in 2022 and a further 2.7 per cent in 2023, and then average 2.2 per cent growth in 2024 and 2025.
The Ministry expects B.C. housing starts to total approximately 34,500 units in 2021, 33,500 units in 2022, and average 32,000 units per year over the 2023 to 2025 period (above the long-run historical average).
Inflation
The pandemic has led to lower inflation. Travel restrictions prompted declines in global demand for crude oil and social distancing and stay-at-home guidance led to rising demand for goods like groceries but decreased purchases of products like clothing and high-contact services. While categories such as food and health and personal care saw price rises, price declines in other categories (particularly gasoline, recreation, and clothing and footwear) have led to weak overall growth in B.C.’s Consumer Price Index (CPI). The annual CPI inflation rate in 2020 was 0.8 per cent.
In February 2021, consumer prices rose by 1.0 per cent year-to-date compared to the same period in 2020. The underlying price movements were similar to those of 2020 overall, with higher prices for food, shelter, health and personal care, and other categories partially offset by lower prices for clothing and footwear and gasoline.
Chart 3.7 B.C. Inflation
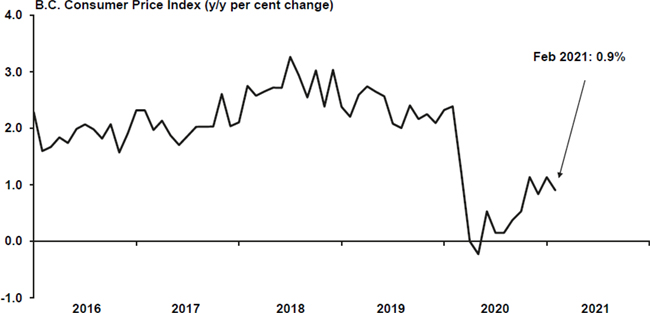
Sources: Statistics Canada; Haver Analytics
Budget and Fiscal Plan - 2021/22 to 2023/24
86
British Columbia Economic Review and Outlook
Outlook
Consumer price inflation in B.C. is forecast to be 1.7 per cent in 2021 and rise to 2.0 per cent in 2022. In the medium-term, inflation is expected to remain around the 2.0 per cent Bank of Canada target. For Canada, annual rates of inflation are expected to be similar: 1.8 per cent in 2021, 1.9 per cent in 2022, and around 2.0 per cent over the medium-term.
Business and Government
Non-residential construction permitting slowed in 2020, following strong gains over the preceding few years. The total value of non-residential building permits fell by 14.8 per cent in 2020 compared to 2019. Underlying this were significant declines in permit issuance for commercial buildings (-26.6 per cent) and industrial buildings (-22.0 per cent). Meanwhile, the value of permit issuance for institutional and governmental buildings increased (+36.5 per cent). In February 2021, the value of non-residential building permits was down by 8.3 per cent year-to-date.
Small business confidence in B.C. has largely recovered since experiencing a significant setback during the initial months of the pandemic, according to the Canadian Federation of Independent Business index for the twelve-month outlook of small businesses. However, the comparable index for the short-term outlook has not fully recovered. Businesses remain particularly concerned about conditions over the next few months.
B.C.’s tourism sector has been severely impacted by COVID-19. The number of international travelers entering the province collapsed as travel restrictions were put in place to support containment. By April 2020, the inflow of international travelers had fallen by 96.7 per cent relative to February 2020. Visitor numbers have remained relatively unchanged since then. In 2020 overall, the number of international travelers visiting B.C. was down by 84.5 per cent compared to 2019 and in January 2021 it was down by 91.3 per cent relative to January 2020.
Outlook
Following an estimated decline of 4.8 per cent in 2020, the Ministry forecasts total real investment in B.C. (business and government) to rise by 5.8 per cent in 2021, 4.2 per cent in 2022, and range between 0.6 and 1.7 per cent growth annually over the 2023 to 2025 period.
Following an estimated decline of 9.2 per cent last year, real business investment is projected to grow by 5.6 per cent in 2021, with increases expected in all segments (non-residential, residential, machinery and equipment, and intellectual property). Looking further ahead, real business investment is forecast to grow by 4.2 per cent in 2022 and average 1.8 per cent growth annually over the medium-term. The LNG Canada project is expected to generate a significant amount of economic activity which will support B.C.’s economy over the forecast horizon.
Real expenditure on goods and services by all levels of government is estimated to have increased by 10.5 per cent in 2020, driven by the provincial and federal response to the COVID-19 pandemic. In 2021, real spending is forecast to tick down by 0.9 per cent as some of the extraordinary supports are temporary in nature, and then grow by 1.6 per cent in 2022. Over the 2023 to 2025 period, government expenditures are expected to be relatively flat.
Budget and Fiscal Plan - 2021/22 to 2023/24
87
British Columbia Economic Review and Outlook
Following an estimated decline of 13.6 per cent, the Ministry expects the nominal net operating surplus of corporations (an approximation of corporate profits) to increase by 9.2 per cent in 2021 and 8.8 per cent in 2022. Over 2023 to 2025, the net operating surplus of corporations is expected to grow between 3.0 per cent and 7.5 per cent annually.
External Trade and Commodity Markets
As the pandemic unfolded, global international trade experienced pronounced disruptions. For B.C., broad-based declines reflected a combination of weaker global demand and lower commodity prices. Provincial merchandise goods exports contracted by 8.2 per cent in 2020. The majority of the decline was attributable to lower exports of energy products (-26.1 per cent), primarily coal. Exports of pulp and paper products (-19.2 per cent) and machinery and equipment (-7.7 per cent) also experienced significant declines. Conversely, solid wood products rose by 5.7 per cent, seeing rapid increases in the second half of 2020 and into 2021. Over the first two months of 2021, surging exports of solid wood products to the U.S. (supported by strong construction activity and subsequently high lumber prices) were a key driver behind the 24.4 per cent year-to-date increase in overall goods exports. Exports of natural gas to the U.S. were also a large contributor to the year-to-date rise in merchandise exports.
The value of merchandise exports to the U.S. (the destination for over half of B.C. exports) increased by 0.5 per cent in 2020, while exports to non-U.S. destinations fell by 17.0 per cent. Energy products posted the largest declines to both U.S. and non-U.S. destinations. However, while exports of solid wood products to non-U.S. international destinations contracted by about one-quarter, their shipments to the U.S. increased by about one-quarter. In February 2021, exports to the U.S. were up by 38.0 per cent year-to-date and exports destined elsewhere grew by 7.9 per cent.
Chart 3.8 B.C. Exports
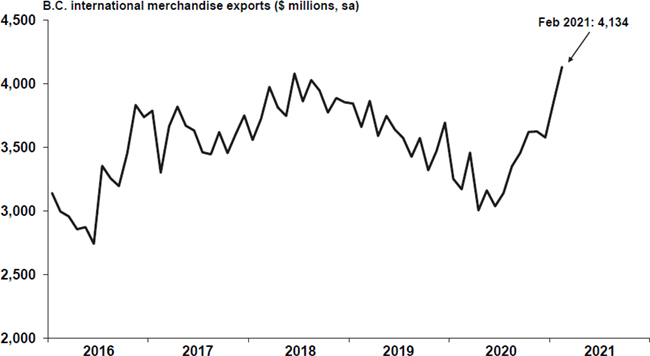
Source: BC Stats
B.C.’s manufacturing shipments fell by 3.3 per cent in 2020 compared to 2019. Declines were relatively broad-based and consistent with the declines seen in merchandise exports. Among durable goods, the bulk of declines were driven by lower shipments of
Budget and Fiscal Plan - 2021/22 to 2023/24
88
British Columbia Economic Review and Outlook
fabricated metal products (-16.3 per cent), transportation equipment (-20.4 per cent), and machinery (-10.2 per cent). Higher wood products shipments (+11.2 per cent) partly offset the overall decline. Lower shipments of non-durables were largely attributable to paper products (-17.1 per cent), although higher food manufacturing shipments (+5.5 per cent) provided some offset. In January 2021, shipments were however up by 19.5 per cent compared to the same month a year earlier.
B.C. tourism data and national export data suggest that B.C.’s exports of services declined sharply during the pandemic. Provincial-level data on exports of services in 2020 will not be available until late 2021. However, available national-level data shows that Canadian service exports were down 17.7 per cent in 2020 relative to 2019, with most of the losses occurring in the travel services category. In B.C., the number of international travelers entering the province nearly stopped during the pandemic and remains very low, indicating a similar decline in service exports.
In 2020 and into 2021, limited lumber supply and resilient Canadian and U.S. housing markets have supported high lumber prices. Notably, the price of Western spruce-pine-fir (SPF) 2x4 lumber averaged $570 US/000 board feet in 2020 (up by 53.3 per cent from 2019) and has averaged $986 US/000 board feet in the first three months of 2021.
Falling energy demand due to pandemic-related travel restrictions and excess supply, due to a temporary lapse in production limit agreements between OPEC nations, led to lower crude oil prices in 2020. The West Texas Intermediate (WTI) price averaged $39.23 US/barrel in 2020, down by 31.2 per cent compared to 2019. The WTI price then increased in late 2020 and over the first three months of 2021, reaching $62.33 US/barrel in March. Meanwhile, the plant inlet price of natural gas averaged $0.96 C/GJ in 2020, up by 20.5 per cent from 2019. In March 2021 it averaged $2.00 C/GJ year-to-date (+136.9 per cent). Natural gas prices have been supported by improved market access (pipelines being reopened or brought online) and reduced production outlooks in parts of the U.S.
Base metal and mineral prices experienced broad-based declines in 2020, as reduced global demand weighed on prices. Prices for molybdenum, zinc, lead, and metallurgical coal all recorded declines compared to 2019, while copper prices posted a modest gain. By contrast, prices for gold and silver increased substantially in 2020. More recently, nearly all of the above metals saw significant price increases and were up on a year-to-date to March 2021 basis. The exception was metallurgical coal, which saw lower prices than the same period a year earlier.
Outlook
Following an estimated contraction of 10.3 per cent in 2020, growth in real exports of goods and services is projected to be 5.6 per cent in 2021, 4.4 per cent in 2022, and then range between 2.8 per cent and 5.3 per cent annually over the 2023 to 2025 period. The anticipated production of LNG toward the end of the forecast horizon also provides support to the outlook.
The price of lumber is forecast to average $650 US/000 board feet in 2021 and $475 US/000 board feet in 2022, before gradually declining to reach $400 US/000 board feet in the medium-term. The plant inlet price for natural gas is expected to average $1.48 C/GJ in 2021/22, $1.48 C/GJ in 2022/23, and $1.50 C/GJ in 2023/24. The outlook is subject to considerable uncertainty, as commodity prices can be volatile.
Budget and Fiscal Plan - 2021/22 to 2023/24
89
British Columbia Economic Review and Outlook
Demographics
On July 1, 2020, B.C.’s population was 5.15 million people, up 1.1 per cent from July 1, 2019. B.C.’s population has changed little since the onset of the pandemic, as travel restrictions significantly slowed international migration.
In 2020, the province welcomed 20,395 net new migrants, down from a net increase of 79,887 persons in 2019. Underlying the annual change was a collapse in net international migration (from +65,961 persons in 2019 to -599 persons in 2020) and increasing net interprovincial migration (from +13,926 persons in 2019 to +20,994 persons in 2020).
Outlook
The forecast calls for B.C.’s July 1 population to increase by 0.6 per cent in 2021 and then by around 1.3 per cent each year between 2022 and 2025.
Total net migration is expected to be about 58,500 persons in 2021 and 68,100 persons in 2022. International migrants are expected to make up about 80 per cent of migrants, as they have in recent years (apart from 2020). Over the medium-term, total net migration is expected to reach about 68,800 persons. Expectations for the eventual easing of travel restrictions and the fall 2020 increase in federal immigration targets are supporting the forecast. However, the outlook is more uncertain than usual, as the COVID-19 pandemic could continue to have a material impact on international migration going forward.
Risks to the Economic Outlook
B.C.’s economy, like other provincial, national, and global economies, has been significantly impacted by the COVID-19 pandemic. There are various elements of uncertainty that will influence the depth and duration of the economic slowdown and recovery. The economic forecast is based on information that is currently available and assumptions about the future path of recovery, and the outlook is subject to a larger than normal degree of uncertainty and potential revision. While upside risks are present (primarily, faster than anticipated vaccine rollout), the current balance of risks are tilted to the downside. Downside risks to B.C.’s economic outlook include the following:
| • | delays in the achievement of broad immunity to COVID-19 through vaccination in B.C. or among B.C.’s trading partners; |
| • | emergence of COVID-19 variants of concern and future outbreaks in B.C. or among B.C.’s trading partners; |
| • | medium- to long-term damage to the economy due to the pandemic through channels such as persistent unemployment and labour market detachment, higher precautionary savings by households, business closures, or lower private capital investment; |
| • | weakening global economic activity, exacerbated by COVID-19, resulting in reduced demand for B.C.’s commodity exports; |
| • | ongoing global trade tensions and broader economic challenges in Asia, Europe, and the U.K.; |
| • | higher volatility in international foreign exchange, stock, and bond markets; |
| • | lower commodity prices, particularly for lumber, pulp, and coal; and |
| • | timing of investment and hiring related to the LNG Canada project, similar to the risks that exist for other major capital projects. |
Budget and Fiscal Plan - 2021/22 to 2023/24
90
British Columbia Economic Review and Outlook
External Outlook
The external outlook deteriorated as the pandemic emerged and the global economy faced its largest annual contraction on record. The economic recovery has been protracted as many countries experienced second and third waves of COVID-19 cases. Faster than expected development of effective vaccines has fueled optimism though and provided more certainty around timelines for a return to pre-pandemic levels of economic activity. Nevertheless, near-term prospects are uneven across countries and industries. Prospects vary with the amount of time it is expected to take until broad immunity has been achieved through vaccines and the extent to which economic activities can take place in the presence of containment measures.
United States
U.S. real GDP shrank by 3.5 per cent in 2020. This was a more severe contraction than the 2009 2.5 per cent decline during the Great Recession and the largest contraction since the 1940’s. Nevertheless, the decline in 2020 was smaller than those of other developed nations. Relatively less restrictive containment measures and generous government support programs contributed to the smaller contraction. Driving the declines in 2020 were lower consumption of services, exports, and business investment. Lower imports, higher consumption of goods, and increased government spending provided some offset. The U.S. economy finished the year growing by a 4.3 per cent annualized rate in the fourth quarter of 2020; this left real GDP 2.4 per cent lower than pre-pandemic (fourth quarter of 2019) levels.
Chart 3.9 U.S. Real GDP
U.S. real GDP (chained 2012 US$ billions, saar)

Sources: US Bureau of Economic Analysis; Haver Analytics
After seeing record declines in the spring of 2020, the U.S. labour market has improved. However, only about 60 per cent of employment losses have been reversed. In 2020 overall, employment was 5.8 per cent lower than in 2019. And during the first three months of 2021, employment was still 5.6 per cent lower on a year-to-date basis. The unemployment rate was 6.0 per cent in March 2021, down from a peak of nearly 15 per cent but up from its pre-pandemic rate of 3.5 per cent. The number of long-term
Budget and Fiscal Plan - 2021/22 to 2023/24 |
British Columbia Economic Review and Outlook
unemployed has nearly quadrupled since the start of the pandemic and continues to rise. Meanwhile, the U.S. labour force participation rate averaged 61.4 per cent year-to-date to March 2021, down 1.7 percentage points compared to the same period of 2020.
U.S. home building activity has been resilient. Despite marked declines during the early months of the pandemic, housing starts rebounded and posted a 7.0 per cent increase in 2020 overall. However, year-to-date to February 2021, they were down 5.6 per cent compared to the first two months of 2020. Meanwhile, residential building permits (a leading indicator of building activity) were up 4.7 per cent in 2020 compared to 2019 and then up 21.3 per cent year-to-date to February 2021. Similar to B.C. and Canada, the home sale market has been strong in the U.S. Year-to-date to February 2021, new single-family home sales were up by 15.6 per cent compared to the same period of 2020, while their median sale price was up by 6.3 per cent.
Chart 3.10 U.S. Housing Starts
U.S. housing starts (thousands of annualized units, sa)
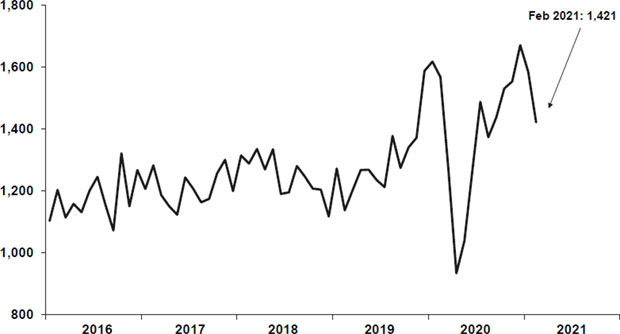
Sources: US Census Bureau; Haver Analytics
After experiencing record declines in March and April last year, U.S. nominal retail sales posted strong gains in the subsequent months. In 2020 overall, retail edged up by just 0.6 per cent compared to 2019. Year-to-date to February 2021 though, sales were 7.9 per cent higher relative to the first two months of 2020. Underlying the headline growth figures were strong gains in sales at businesses such as non-store retailers and food and beverage stores offsetting declines at food services and drinking places, clothing and accessory stores, and gasoline stations.
U.S. consumer confidence fell significantly in the early months of the pandemic and has shown relatively little improvement since then. Year-to-date to March 2021, the consumer confidence index averaged 96.3 points, down 30.9 points from the same period in 2020.
Already challenging international trade conditions worsened due to the global COVID-19 pandemic, ongoing U.S.-China trade tensions, and the slump in oil prices. Accordingly, the value of U.S. merchandise exports fell by 13.2 per cent annually in 2020. In February 2021 they were down by 3.0 per cent on a year-to-date basis.
Budget and Fiscal Plan - 2021/22 to 2023/24 |
British Columbia Economic Review and Outlook
Outlook
Consensus Economics (Consensus) forecasters have recently raised their near-term projections for U.S. economic growth. The February 2021 Consensus survey forecasts U.S. real GDP to expand by 4.7 per cent in 2021. Meanwhile, for 2022, Consensus forecasts growth of 3.6 per cent (Table 3.2).
Table 3.2 U.S. Real GDP Forecast: Consensus versus B.C. Ministry of Finance
| | | 2021 | | | 2022 | |
| | | Percent change in real GDP | |
| B.C. Ministry of Finance | | | 4.2 | | | | 3.1 | |
| Consensus Economics (February 2021*) | | | 4.7 | | | | 3.6 | |
| * Comparable month to B.C. Ministry of Finance forecast. | | | | | | | | |
Uncertainty regarding the pandemic and trade tensions continue to weigh on the economic outlook. In recognition of these uncertainties, the Ministry’s assumptions for U.S. growth are prudent relative to the February 2021 Consensus (the Consensus comparable to when Ministry assumptions were developed). The Ministry assumes that U.S. real GDP will grow by 4.2 per cent in 2021 and by 3.1 per cent in 2022. Growth is then expected to gradually taper off to 1.7 per cent by 2025.
Chart 3.11 Consensus Outlook for the U.S. in 2021
Forecast annual per cent
change in U.S. real GDP, 2021
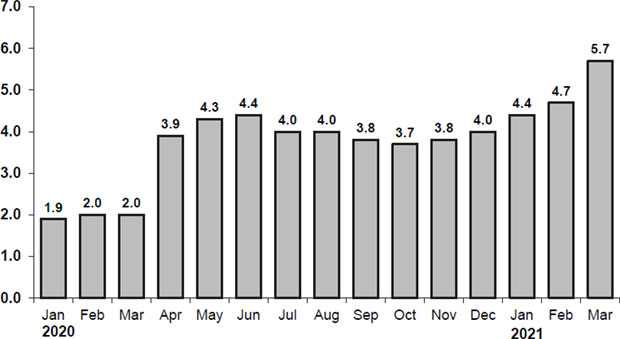
Source: Consensus Economics
The chart above represents forecasts for U.S. real GDP growth in 2021 as polled on specific dates. For example, forecasters surveyed on January 13, 2020 had an average 2021 U.S. real GDP growth forecast of 1.9 per cent, while on March 8, 2021 they forecast 2021 U.S. real GDP to grow by 5.7 per cent.
Budget and Fiscal Plan - 2021/22 to 2023/24 |
British Columbia Economic Review and Outlook
Canada
The onset of the COVID-19 pandemic, in conjunction with the related plunge in oil prices, presented an unparalleled challenge for the Canadian economy. In 2020, real GDP fell by 5.4 per cent, a greater decline than the Great Recession’s 2009 contraction of 2.9 per cent and the largest contraction on record (data available back to 1961). Last year’s slowdown in economic activity was driven by substantial declines in household consumption (primarily services), exports, and investment in inventories. Falling imports provided some offset. By the fourth quarter of 2020, Canada had recovered approximately three-quarters of the economic activity lost due to the pandemic, leaving real GDP 3.2 per cent lower than pre-pandemic levels.
Chart 3.12 Canadian Real GDP
Canadian real GDP (chained 2012 $ billions, saar)
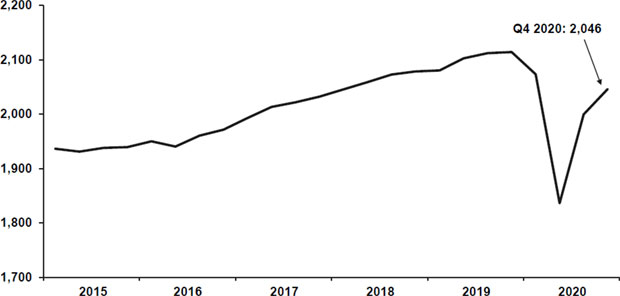
Sources: Statistics Canada; Haver Analytics
The Canadian economy shed nearly 3 million jobs in March and April 2020. As of February 2021, roughly 80 per cent of those employment losses had been reversed. However, there were still nearly 600,000 fewer Canadians employed relative to pre-pandemic (February 2020) levels. In 2020 on average, employment fell by 5.2 per cent and the unemployment rate averaged 9.5 per cent. Year-to-date to February 2021, employment was down by 3.7 per cent compared to the first two months of 2020 and the unemployment rate averaged 8.8 per cent. Participation rates retreated during 2020 and have yet to fully recover; participation averaged 64.7 per cent during the first two months of 2021, down 0.8 percentage points year-to-date. Underlying these headline labour market figures were several key factors: declines in both full- and part-time work; steep job losses in high-contact services and construction; overrepresentation of youth, women, and visible minorities among the unemployed; and rising long-term unemployment.
Budget and Fiscal Plan - 2021/22 to 2023/24 |
British Columbia Economic Review and Outlook
The housing market was strong in 2020. Declining activity as COVID-19 containment measures were first introduced swiftly gave way to strong rebounds in both construction and sales. Housing starts grew by 4.4 per cent annually in 2020 and by 24.4 per cent year-to-date to February 2021 compared to the same period a year earlier. The growth so far in 2021 was largely due to strong numbers in the urban centers of Montreal, Vancouver, and Quebec City. Meanwhile, MLS home sales were up by 12.6 per cent annually in 2020 and by 44.4 per cent year-to-date to February 2021 compared to the first two months of last year. Sales growth was broad-based in 2020, with double-digit gains observed in all provinces except Alberta. The average home sale price rose by 12.9 per cent in 2020 and was up by 23.7 per cent year-to-date to February 2021.
Canadian nominal retail sales also saw large contractions in March and April 2020 as containment measures began. However, rapid recovery in the subsequent months led to retail sales exceeding their pre-pandemic levels by early summer. Nevertheless, retail did not increase enough to make up for the sales lost during the early months of the pandemic, leaving annual sales 1.4 per cent lower than in 2019. In January 2021, retail sales were 1.3 per cent higher than in the same month a year earlier.
The challenging global trade conditions that faced exporters at the beginning of 2020 intensified due to the global COVID-19 pandemic and a slump in oil prices. In 2020 the value of Canadian merchandise exports fell by 12.4 per cent and the value of services exports shrank by 17.7 per cent compared to 2019. In February 2021, though, merchandise exports were 6.5 per cent higher year-to-date. Services exports, on the other hand, were down by 14.6 per cent. Shipments of Canadian manufactured goods were 11.4 per cent lower in 2020 and up by 1.1 per cent in January 2021 in year-over-year terms.
Outlook
The February 2021 Consensus forecasts Canadian real GDP to rise by 4.6 per cent in 2021 and by 4.0 per cent in 2022 (Table 3.3).
Table 3.3 Canadian Real GDP Forecast: Consensus versus B.C. Ministry of Finance
| | | 2021 | | | 2022 | |
| | | Percent change in real GDP | |
| B.C. Ministry of Finance | | | 4.1 | | | | 3.5 | |
| Consensus Economics (February 2021*) | | | 4.6 | | | | 4.0 | |
| * Comparable month to B.C. Ministry of Finance forecast. | | | | | | | | |
The Canadian economic outlook continues to be clouded by uncertainty regarding the potential for medium- and long-term negative impacts from the pandemic recession. Additionally, ongoing global trade tensions and volatile commodity prices add risks to the outlook. Accordingly, the Ministry’s outlook is lower than the February 2021 Consensus (the Consensus comparable to when Ministry assumptions were developed). The Ministry assumes that the Canadian economy will rebound by 4.1 per cent in 2021 and grow by 3.5 per cent in 2022. Over the medium-term, annual growth is expected to moderate, gradually reaching 1.6 per cent by 2025.
Budget and Fiscal Plan - 2021/22 to 2023/24 |
British Columbia Economic Review and Outlook
Chart 3.13 Consensus Outlook for Canada in 2021
Forecast annual per cent
change in Canadian real GDP, 2021
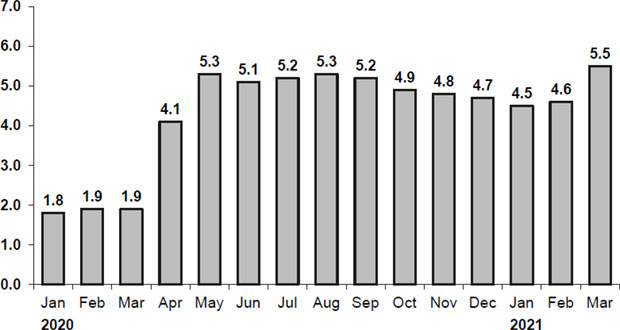
Source: Consensus Economics
The chart above represents forecasts for Canadian real GDP growth in 2021 as polled on specific dates. For example, forecasters surveyed on January 13, 2020 had an average 2021 Canadian real GDP growth forecast of 1.8 per cent, while on March 8, 2021 they forecast 2021 Canadian real GDP to grow by 5.5 per cent.
Asia
Stringent and ultimately successful containment measures supported a V-shaped recovery in China. It was the only major economy to post positive economic growth in 2020. The 2.3 per cent annual real GDP growth was however China’s slowest expansion since 1976. Industrial production and exports led the rebound, as goods from China filled the gaps created by COVID-19-induced manufacturing disruptions elsewhere. Domestic investment has also supported the recovery, along with accommodative monetary and fiscal measures.
Japan recorded a 4.8 per cent decline in real GDP in 2020, the largest contraction since 2009. Household consumption led the declines, followed by exports and private investment. Lower imports and higher government spending provided a partial offset. Underlying 2020’s overall declines, though, was recovering economic activity through the second half of the year; by the fourth quarter real GDP was 1.3 per cent lower than before the pandemic (fourth quarter of 2019). Still, on March 19, 2021, the Bank of Japan continued to characterize the economic situation as severe and reiterated that monetary conditions would remain accommodative.
Outlook
The February 2021 Consensus forecasts China real GDP to grow by 8.4 per cent in 2021 and by 5.5 per cent in 2022. Ongoing U.S.-China trade tensions and the lingering potential for COVID-19 outbreaks until mass vaccination is complete, domestically and abroad, could dampen China’s economic growth going forward. As such, the Ministry’s prudent assumption is that China’s economy will expand by 7.6 per cent in 2021, 5.1 per cent in 2022, and 5.0 per cent each year over the medium-term.
Budget and Fiscal Plan - 2021/22 to 2023/24 |
British Columbia Economic Review and Outlook
The February 2021 Consensus forecasts Japan real GDP to expand by 2.3 per cent in both 2021 and 2022. In recognition of enduring foreign and domestic challenges to Japan’s economy, as well as risks associated with the virus, the Ministry assumes that Japan’s real GDP will grow more slowly. The forecast is for economic activity to rise by 1.7 per cent in both 2021 and 2022 and then gradually soften over the medium-term to 0.7 per cent.
Europe
The euro zone has been acutely impacted by COVID-19. Containment measures had severe implications for the economy, especially for tourist-dependent countries in southern Europe. In 2020, real GDP in the euro zone fell 6.8 per cent compared to 2019, the largest annual contraction since data began in 1995. Declines were broad-based across nearly all sectors of the economy. Like many other economies, only lower imports and higher government spending made positive contributions to headline GDP growth. And despite improving economic activity through the second half of the year, fourth quarter real GDP was still 4.9 per cent lower than pre-pandemic (fourth quarter of 2019) levels.
On March 11, 2021 the European Central Bank maintained key interest rates at accommodative levels and increased the pace of its emergency bond-buying program. Last year (July 21, 2020), the 27 members of the European Union (EU) agreed to borrow up to 750 billion euro in a stimulus plan to reverse the economic downturn. This short-term stimulus plan is part of a broader 1.8 trillion euro seven-year budget plan. After long negotiations, the stimulus plan was approved by EU leaders on December 10, 2020.
Outlook
The February 2021 Consensus forecasts the euro zone economy to make a partial recovery in 2021, growing by 4.4 per cent, before expanding by a further 4.1 per cent in 2022. In light of uncertainties associated with COVID-19 and shifting trade conditions due to Brexit, the Ministry assumes the euro zone’s economy will recover more slowly. The Ministry forecasts growth of 3.7 per cent in 2021, 3.4 per cent in 2022, and then a gradual deceleration over the medium-term toward 1.2 per cent growth in 2025.
Financial Markets
Interest Rates
The COVID-19 pandemic caused an unprecedented global economic contraction, prompting a broad array of extraordinary monetary and fiscal policy responses around the world.
On March 17, 2021, the US Federal Reserve (Fed) left the target range for the federal funds rate unchanged at 0.00 to 0.25 per cent. The target range has been at this level since March 2020, when the Fed cut its rate by 150 basis points. The Fed has also provided forward guidance by indicating its intention to keep interest rates at current levels until the economy has recovered, which includes improvements in the labour market as well as inflation that averages 2.0 per cent over time. The latter policy would allow for inflation to run above its long-standing target of 2.0 per cent for some time. Further, the Fed continues to make large-scale asset purchases (i.e. quantitative easing), support financial market functioning through several credit facilities, and execute a sequence of actions to support the flow of credit to households and businesses.
Budget and Fiscal Plan - 2021/22 to 2023/24 |
British Columbia Economic Review and Outlook
Chart 3.14 Interest Rate Forecasts
Per cent
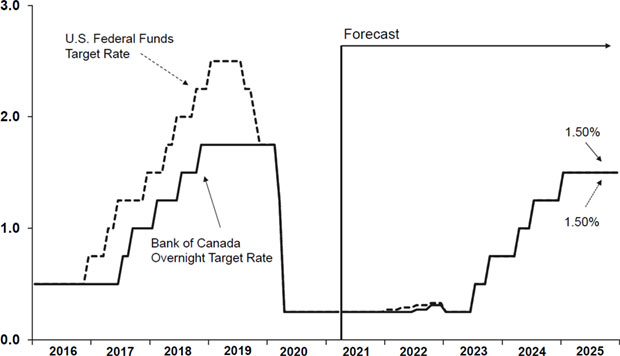
Sources: Bank of Canada; US Federal Reserve; and B.C. Ministry of Finance forecasts
On March 10, 2021, the Bank of Canada maintained its target for the overnight interest rate at its stated effective lower bound of 0.25 per cent and left its quantitative easing program unchanged. In March 2020, the Bank responded to the COVID-19 crisis by cutting its target rate by 150 basis points. It has also provided forward guidance, committing to maintain the current policy rate and quantitative easing program until its inflation target of 2.0 per cent is sustainably achieved and the recovery is well underway. On a related note, the conventional mortgage lending rate on a 5-year term mortgage held steady at 4.79 per cent in March 2021, its level since August 2020.
Table 3.4 Private Sector Canadian Interest Rate Forecasts
| | | 3-month Treasury Bill | | | 10-year Government Bond | |
| Average annual interest rate (per cent) | | 2021 | | | 2022 | | | 2021 | | | 2022 | |
| BMO | | | 0.10 | | | | 0.10 | | | | 1.41 | | | | 1.58 | |
| CIBC | | | 0.12 | | | | 0.26 | | | | 1.20 | | | | 1.58 | |
| National Bank | | | 0.14 | | | | 0.24 | | | | 1.39 | | | | 1.78 | |
| RBC | | | 0.17 | | | | 0.34 | | | | 0.88 | | | | 1.26 | |
| Scotiabank | | | 0.13 | | | | 0.31 | | | | 1.15 | | | | 1.73 | |
| TD | | | 0.13 | | | | 0.20 | | | | 1.16 | | | | 1.64 | |
| Average (as of February 26, 2021) | | | 0.13 | | | | 0.24 | | | | 1.20 | | | | 1.59 | |
Outlook
The US Federal Reserve and the Bank of Canada have signaled their commitment to support their respective economies and provide liquidity to the financial system. Based on the average of six private sector forecasts as of February 26, 2021, the Ministry assumes the U.S. federal funds rate to average 0.25 per cent in 2021 and 0.30 per cent in 2022. By comparison, the Bank of Canada’s overnight target rate is expected to average 0.25 per cent in 2021 and 0.27 per cent in 2022.
Budget and Fiscal Plan - 2021/22 to 2023/24 |
British Columbia Economic Review and Outlook
The Canadian three-month treasury bill interest rate is expected to average 0.13 per cent in 2021 and 0.24 per cent in 2022, according to the same six private sector forecasters. Meanwhile, the 10-year Government of Canada bond rate is assumed to be 1.20 per cent in 2021 and 1.59 per cent in 2022.
Exchange Rate
The value of the Canadian dollar has largely moved in step with oil prices during the pandemic. Following the onset of the pandemic, oil prices collapsed and the value of the Canadian dollar depreciated to a low of 71.1 US cents in April 2020. Since then, the Canadian dollar has gradually appreciated and surpassed pre-pandemic values, supported by recovering oil prices and a weakening U.S. dollar. The Canadian dollar averaged 74.6 US cents in 2020 and 79.0 US cents during the first three months of 2021.
Chart 3.15 Private Sector Expectations for the Canadian Dollar
US cents/Canadian $ (daily rate)
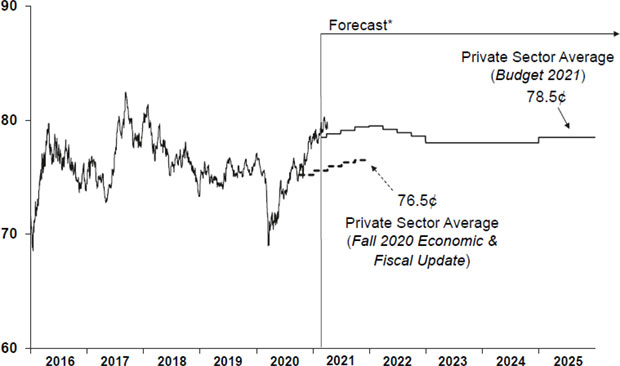
Sources: Bank of Canada and B.C. Ministry of Finance forecasts.
* Based on the average of private sector forecasts. Fall 2020 Economic & Fiscal Update as of October 8, 2020 and Budget 2021 as of February 26, 2021.
Outlook
Based on the average of six private sector forecasts as of February 26, 2021, the Ministry assumes the Canadian dollar will average 79.0 US cents in both 2021 and 2022.
| Table 3.5 Private Sector Exchange Rate Forecasts | | | | | | | | |
| | | | | | | | | |
| Average annual exchange rate (US cents/Can $) | | 2021 | | | 2022 | |
| BMO | | | 79.3 | | | | 80.0 | |
| CIBC | | | 77.7 | | | | 74.4 | |
| National Bank | | | 79.4 | | | | 83.1 | |
| RBC | | | 77.8 | | | | 76.0 | |
| Scotiabank | | | 79.8 | | | | 80.5 | |
| TD | | | 79.7 | | | | 80.2 | |
| Average (as of February 26, 2021) | | | 79.0 | | | | 79.0 | |
Budget and Fiscal Plan - 2021/22 to 2023/24 |
British Columbia Economic Review and Outlook
Table 3.6.1 Gross Domestic Product (GDP): British Columbia
| | | | | | | | | Forecast | |
| | | 2019 | | | 2020 e | | | 2021 | | | 2022 | | | 2023 | | | 2024 | | | 2025 | |
| Gross Domestic Product at Market Prices: | | | | | | | | | | | | | | | | | | | | | | | | | | | | |
| – Real (chained 2012 $ billions) | | | 271.8 | | | | 257.4 | | | | 268.6 | | | | 278.9 | | | | 285.2 | | | | 291.2 | | | | 298.5 | |
| (% change) | | | 2.7 | | | | -5.3 | | | | 4.4 | | | | 3.8 | | | | 2.2 | | | | 2.1 | | | | 2.5 | |
| – Nominal (current prices, $ billions) | | | 309.1 | | | | 295.3 | | | | 314.3 | | | | 331.2 | | | | 344.3 | | | | 357.5 | | | | 373.2 | |
| (% change) | | | 4.4 | | | | -4.5 | | | | 6.4 | | | | 5.4 | | | | 4.0 | | | | 3.9 | | | | 4.4 | |
| – GDP price deflator (2012 = 100) | | | 113.7 | | | | 114.7 | | | | 117.0 | | | | 118.7 | | | | 120.7 | | | | 122.8 | | | | 125.0 | |
| (% change) | | | 1.7 | | | | 0.9 | | | | 2.0 | | | | 1.5 | | | | 1.7 | | | | 1.7 | | | | 1.8 | |
| Real GDP per person (chained 2012 $) | | | 53,387 | | | | 50,008 | | | | 51,855 | | | | 53,171 | | | | 53,637 | | | | 54,054 | | | | 54,695 | |
| (% change) | | | 1.0 | | | | -6.3 | | | | 3.7 | | | | 2.5 | | | | 0.9 | | | | 0.8 | | | | 1.2 | |
| Real GDP per employed person (% change) | | | -0.3 | | | | 1.4 | | | | -0.3 | | | | 1.3 | | | | 0.6 | | | | 0.8 | | | | 1.2 | |
| Unit labour cost1 (% change) | | | 2.9 | | | | 4.9 | | | | 0.2 | | | | 0.2 | | | | 1.4 | | | | 1.4 | | | | 1.4 | |
| | | | | | | | | | | | | | | | | | | | | | | | | | | | | |
| Components of Real GDP at Market Prices (chained 2012 $ billions) | | | | | | | | | | | | | | | | | |
| Household expenditure on goods and services | | | 175.7 | | | | 165.9 | | | | 172.0 | | | | 178.5 | | | | 184.8 | | | | 190.0 | | | | 194.0 | |
| (% change) | | | 1.7 | | | | -5.6 | | | | 3.7 | | | | 3.8 | | | | 3.5 | | | | 2.8 | | | | 2.1 | |
| – Goods | | | 70.6 | | | | 71.3 | | | | 72.6 | | | | 73.5 | | | | 74.5 | | | | 75.4 | | | | 76.4 | |
| (% change) | | | -0.2 | | | | 1.0 | | | | 1.8 | | | | 1.3 | | | | 1.4 | | | | 1.3 | | | | 1.3 | |
| – Services | | | 105.1 | | | | 94.7 | | | | 99.5 | | | | 105.1 | | | | 110.4 | | | | 114.6 | | | | 117.5 | |
| (% change) | | | 3.0 | | | | -9.9 | | | | 5.1 | | | | 5.6 | | | | 5.0 | | | | 3.8 | | | | 2.6 | |
| NPISH2 expenditure on goods and services | | | 4.3 | | | | 4.2 | | | | 4.2 | | | | 4.3 | | | | 4.4 | | | | 4.4 | | | | 4.5 | |
| (% change) | | | 4.2 | | | | -3.1 | | | | 0.7 | | | | 3.4 | | | | 0.9 | | | | 0.9 | | | | 0.9 | |
| | | | | | | | | | | | | | | | | | | | | | | | | | | | | |
| Government expenditure on goods and services | | | 47.8 | | | | 52.8 | | | | 52.3 | | | | 53.2 | | | | 53.3 | | | | 53.1 | | | | 52.9 | |
| (% change) | | | 3.1 | | | | 10.5 | | | | -0.9 | | | | 1.6 | | | | 0.2 | | | | -0.3 | | | | -0.3 | |
| Investment in fixed capital | | | 66.8 | | | | 63.6 | | | | 67.3 | | | | 70.1 | | | | 70.5 | | | | 71.7 | | | | 72.9 | |
| (% change) | | | 8.0 | | | | -4.8 | | | | 5.8 | | | | 4.2 | | | | 0.6 | | | | 1.7 | | | | 1.7 | |
| | | | | | | | | | | | | | | | | | | | | | | | | | | | | |
| Final domestic demand | | | 294.6 | | | | 286.6 | | | | 296.0 | | | | 306.4 | | | | 313.2 | | | | 319.3 | | | | 324.3 | |
| (% change) | | | 3.4 | | | | -2.7 | | | | 3.3 | | | | 3.5 | | | | 2.2 | | | | 2.0 | | | | 1.6 | |
| Exports of goods and services | | | 104.2 | | | | 93.5 | | | | 98.7 | | | | 103.1 | | | | 106.0 | | | | 109.5 | | | | 115.3 | |
| (% change) | | | 0.9 | | | | -10.3 | | | | 5.6 | | | | 4.4 | | | | 2.8 | | | | 3.3 | | | | 5.3 | |
| Imports of goods and services | | | 128.9 | | | | 121.2 | | | | 125.4 | | | | 130.0 | | | | 133.4 | | | | 137.1 | | | | 140.6 | |
| (% change) | | | 2.7 | | | | -6.0 | | | | 3.5 | | | | 3.6 | | | | 2.6 | | | | 2.7 | | | | 2.6 | |
| Inventory change | | | 2.6 | | | | -0.7 | | | | 0.2 | | | | 0.2 | | | | 0.2 | | | | 0.1 | | | | 0.1 | |
| Statistical discrepancy | | | 0.2 | | | | 0.2 | | | | 0.2 | | | | 0.2 | | | | 0.2 | | | | 0.2 | | | | 0.2 | |
| | | | | | | | | | | | | | | | | | | | | | | | | | | | | |
| Real GDP at market prices | | | 271.8 | | | | 257.4 | | | | 268.6 | | | | 278.9 | | | | 285.2 | | | | 291.2 | | | | 298.5 | |
| (% change) | | | 2.7 | | | | -5.3 | | | | 4.4 | | | | 3.8 | | | | 2.2 | | | | 2.1 | | | | 2.5 | |
1 Unit labour cost is the nominal cost of labour incurred to produce one unit of real output.
2 Non-profit institutions serving households.
e B.C. Ministry of Finance estimate.
Budget and Fiscal Plan - 2021/22 to 2023/24 |
British Columbia Economic Review and Outlook
Table 3.6.2 Selected Nominal Income and Other Indicators: British Columbia
| | | | | | | | | Forecast | |
| | | 2019 | | | 2020 | | | 2021 | | | 2022 | | | 2023 | | | 2024 | | | 2025 | |
| Compensation of employees1 ($ millions) | | | 152,588 | | | | 151,538 | | | | 158,404 | | | | 164,763 | | | | 170,786 | | | | 176,908 | | | | 183,921 | |
| (% change) | | | 5.6 | | | | -0.7 | | | | 4.5 | | | | 4.0 | | | | 3.7 | | | | 3.6 | | | | 4.0 | |
| | | | | | | | | | | | | | | | | | | | | | | | | | | | | |
| Household income ($ millions) | | | 270,796 | | | | 283,988 | e | | | 286,169 | | | | 294,059 | | | | 304,139 | | | | 315,186 | | | | 327,469 | |
| (% change) | | | 6.5 | | | | 4.9 | | | | 0.8 | | | | 2.8 | | | | 3.4 | | | | 3.6 | | | | 3.9 | |
| | | | | | | | | | | | | | | | | | | | | | | | | | | | | |
| Net operating surplus ($ millions) | | | 31,882 | | | | 27,550 | e | | | 30,084 | | | | 32,727 | | | | 33,808 | | | | 34,830 | | | | 37,454 | |
| (% change) | | | -7.0 | | | | -13.6 | | | | 9.2 | | | | 8.8 | | | | 3.3 | | | | 3.0 | | | | 7.5 | |
| | | | | | | | | | | | | | | | | | | | | | | | | | | | | |
| Retail sales ($ millions) | | | 86,428 | | | | 88,666 | | | | 91,916 | | | | 95,017 | | | | 98,284 | | | | 101,475 | | | | 104,738 | |
| (% change) | | | 0.6 | | | | 2.6 | | | | 3.7 | | | | 3.4 | | | | 3.4 | | | | 3.2 | | | | 3.2 | |
| | | | | | | | | | | | | | | | | | | | | | | | | | | | | |
| Housing starts (units) | | | 44,932 | | | | 37,734 | | | | 34,500 | | | | 33,473 | | | | 33,027 | | | | 32,036 | | | | 31,027 | |
| (% change) | | | 10.0 | | | | -16.0 | | | | -8.6 | | | | -3.0 | | | | -1.3 | | | | -3.0 | | | | -3.2 | |
| | | | | | | | | | | | | | | | | | | | | | | | | | | | | |
| Residential sales ($ millions) | | | 54,174 | | | | 73,495 | | | | 79,410 | | | | 76,783 | | | | 74,674 | | | | 76,325 | | | | 77,957 | |
| (% change) | | | -3.0 | | | | 35.7 | | | | 8.0 | | | | -3.3 | | | | -2.7 | | | | 2.2 | | | | 2.1 | |
| | | | | | | | | | | | | | | | | | | | | | | | | | | | | |
| Residential sales (units) | | | 77,350 | | | | 94,012 | | | | 98,525 | | | | 93,529 | | | | 89,311 | | | | 89,492 | | | | 89,618 | |
| (% change) | | | -1.5 | | | | 21.5 | | | | 4.8 | | | | -5.1 | | | | -4.5 | | | | 0.2 | | | | 0.1 | |
| | | | | | | | | | | | | | | | | | | | | | | | | | | | | |
| Residential Average Sale Price ($) | | | 700,369 | | | | 781,759 | | | | 805,993 | | | | 820,950 | | | | 836,105 | | | | 852,874 | | | | 869,878 | |
| (% change) | | | -1.5 | | | | 11.6 | | | | 3.1 | | | | 1.9 | | | | 1.8 | | | | 2.0 | | | | 2.0 | |
| | | | | | | | | | | | | | | | | | | | | | | | | | | | | |
| Consumer price index (2002 = 100) | | | 131.4 | | | | 132.4 | | | | 134.6 | | | | 137.3 | | | | 140.3 | | | | 143.1 | | | | 146.0 | |
| (% change) | | | 2.3 | | | | 0.8 | | | | 1.7 | | | | 2.0 | | | | 2.1 | | | | 2.0 | | | | 2.0 | |
1 Domestic basis; wages, salaries and employers’ social contributions.
e B.C. Ministry of Finance estimate.
Table 3.6.3 Labour Market Indicators: British Columbia
| | | | | | | | | Forecast | |
| | | 2019 | | | 2020 | | | 2021 | | | 2022 | | | 2023 | | | 2024 | | | 2025 | |
| Population (thousands at July 1) | | | 5,091 | | | | 5,148 | | | | 5,181 | | | | 5,246 | | | | 5,316 | | | | 5,387 | | | | 5,458 | |
| (% change) | | | 1.6 | | | | 1.1 | | | | 0.6 | | | | 1.3 | | | | 1.4 | | | | 1.3 | | | | 1.3 | |
| | | | | | | | | | | | | | | | | | | | | | | | | | | | | |
| Net migration (thousands) | | | | | | | | | | | | | | | | | | | | | | | | | | | | |
| | | | | | | | | | | | | | | | | | | | | | | | | | | | | |
| – International1,4 | | | 66.0 | | | | -0.6 | | | | 43.5 | | | | 55.1 | | | | 56.9 | | | | 56.8 | | | | 56.8 | |
| | | | | | | | | | | | | | | | | | | | | | | | | | | | | |
| – Interprovincial4 | | | 13.9 | | | | 21.0 | | | | 15.0 | | | | 13.0 | | | | 12.0 | | | | 12.0 | | | | 12.0 | |
| | | | | | | | | | | | | | | | | | | | | | | | | | | | | |
| – Total | | | 79.9 | | | | 20.4 | | | | 58.5 | | | | 68.1 | | | | 68.9 | | | | 68.8 | | | | 68.8 | |
| | | | | | | | | | | | | | | | | | | | | | | | | | | | | |
| Labour force population2 (thousands) | | | 4,241 | | | | 4,300 | | | | 4,343 | | | | 4,406 | | | | 4,473 | | | | 4,541 | | | | 4,608 | |
| (% change) | | | 1.9 | | | | 1.4 | | | | 1.0 | | | | 1.5 | | | | 1.5 | | | | 1.5 | | | | 1.5 | |
| | | | | | | | | | | | | | | | | | | | | | | | | | | | | |
| Labour force (thousands) | | | 2,798 | | | | 2,735 | | | | 2,819 | | | | 2,865 | | | | 2,901 | | | | 2,932 | | | | 2,960 | |
| (% change) | | | 2.9 | | | | -2.2 | | | | 3.1 | | | | 1.6 | | | | 1.3 | | | | 1.1 | | | | 1.0 | |
| | | | | | | | | | | | | | | | | | | | | | | | | | | | | |
| Participation rate3 (%) | | | 66.0 | | | | 63.6 | | | | 64.9 | | | | 65.0 | | | | 64.9 | | | | 64.6 | | | | 64.2 | |
| | | | | | | | | | | | | | | | | | | | | | | | | | | | | |
| Employment (thousands) | | | 2,666 | | | | 2,491 | | | | 2,608 | | | | 2,672 | | | | 2,715 | | | | 2,750 | | | | 2,786 | |
| (% change) | | | 3.0 | | | | -6.6 | | | | 4.7 | | | | 2.4 | | | | 1.6 | | | | 1.3 | | | | 1.3 | |
| | | | | | | | | | | | | | | | | | | | | | | | | | | | | |
| Unemployment rate (%) | | | 4.7 | | | | 8.9 | | | | 7.5 | | | | 6.7 | | | | 6.4 | | | | 6.2 | | | | 5.9 | |
1 International migration includes net non-permanent residents and returning emigrants less net temporary residents abroad.
2 The civilian, non-institutionalized population 15 years of age and over.
3 Percentage of the labour force population in the labour force.
4 Components may not sum to total due to rounding.
Budget and Fiscal Plan - 2021/22 to 2023/24 |
British Columbia Economic Review and Outlook
Table 3.6.4 Major Economic Assumptions
| | | | | | | | | Forecast | |
| | | 2019 | | | 2020 | | | 2021 | | | 2022 | | | 2023 | | | 2024 | | | 2025 | |
| Real GDP | | | | | | | | | | | | | | | | | | | | | | | | | | | | |
| Canada (chained 2012 $ billions) | | | 2,102 | | | | 1,989 | | | | 2,070 | | | | 2,143 | | | | 2,186 | | | | 2,223 | | | | 2,258 | |
| (% change) | | | 1.9 | | | | -5.4 | | | | 4.1 | | | | 3.5 | | | | 2.0 | | | | 1.7 | | | | 1.6 | |
| U.S. (chained 2012 US$ billions) | | | 19,092 | | | | 18,426 | | | | 19,200 | | | | 19,795 | | | | 20,191 | | | | 20,554 | | | | 20,904 | |
| (% change) | | | 2.2 | | | | -3.5 | | | | 4.2 | | | | 3.1 | | | | 2.0 | | | | 1.8 | | | | 1.7 | |
| Japan (chained 2015 Yen trillions) | | | 556 | | | | 529 | | | | 538 | | | | 547 | | | | 553 | | | | 556 | | | | 560 | |
| (% change) | | | 0.3 | | | | -4.8 | | | | 1.7 | | | | 1.7 | | | | 1.0 | | | | 0.7 | | | | 0.7 | |
| China (constant 2010 US$ billions) | | | 11,522 | | | | 11,793 | | | | 12,689 | | | | 13,336 | | | | 14,003 | | | | 14,703 | | | | 15,438 | |
| (% change) | | | 5.9 | | | | 2.3 | | | | 7.6 | | | | 5.1 | | | | 5.0 | | | | 5.0 | | | | 5.0 | |
| Euro zone1 (chained 2015 Euro billions) | | | 11,355 | | | | 10,588 | | | | 10,980 | | | | 11,353 | | | | 11,523 | | | | 11,685 | | | | 11,825 | |
| (% change) | | | 1.3 | | | | -6.8 | | | | 3.7 | | | | 3.4 | | | | 1.5 | | | | 1.4 | | | | 1.2 | |
| | | | | | | | | | | | | | | | | | | | | | | | | | | | | |
| Industrial production index (% change) | | | | | | | | | | | | | | | | | | | | | | | | | | | | |
| U.S. | | | 0.9 | | | | -6.7 | | | | 4.7 | | | | 2.9 | | | | 2.0 | | | | 1.8 | | | | 1.7 | |
| Japan | | | -2.6 | | | | -9.7 | | | | 5.2 | | | | 3.6 | | | | 1.5 | | | | 1.0 | | | | 0.9 | |
| China | | | 5.8 | | | | 1.8 | | | | 7.5 | | | | 4.8 | | | | 4.5 | | | | 4.5 | | | | 4.4 | |
| Euro zone1 | | | -1.3 | | | | -8.7 | | | | 5.9 | | | | 2.9 | | | | 1.5 | | | | 1.4 | | | | 1.2 | |
| | | | | | | | | | | | | | | | | | | | | | | | | | | | | |
| Housing starts (thousands) | | | | | | | | | | | | | | | | | | | | | | | | | | | | |
| Canada | | | 209 | | | | 218 | | | | 200 | | | | 190 | | | | 185 | | | | 185 | | | | 180 | |
| (% change) | | | -2.0 | | | | 4.4 | | | | -8.2 | | | | -5.0 | | | | -2.6 | | | | 0.0 | | | | -2.7 | |
| U.S. | | | 1,290 | | | | 1,380 | | | | 1,430 | | | | 1,410 | | | | 1,380 | | | | 1,350 | | | | 1,300 | |
| (% change) | | | 3.2 | | | | 7.0 | | | | 3.6 | | | | -1.4 | | | | -2.1 | | | | -2.2 | | | | -3.7 | |
| Japan | | | 905 | | | | 815 | | | | 810 | | | | 820 | | | | 840 | | | | 880 | | | | 880 | |
| (% change) | | | -4.0 | | | | -9.9 | | | | -0.7 | | | | 1.2 | | | | 2.4 | | | | 4.8 | | | | 0.0 | |
| | | | | | | | | | | | | | | | | | | | | | | | | | | | | |
| Consumer price index | | | | | | | | | | | | | | | | | | | | | | | | | | | | |
| Canada (2002 = 100) | | | 136.0 | | | | 137.0 | | | | 139.5 | | | | 142.1 | | | | 145.1 | | | | 148.0 | | | | 151.0 | |
| (% change) | | | 1.9 | | | | 0.7 | | | | 1.8 | | | | 1.9 | | | | 2.1 | | | | 2.0 | | | | 2.0 | |
| | | | | | | | | | | | | | | | | | | | | | | | | | | | | |
| Canadian interest rates (%) | | | | | | | | | | | | | | | | | | | | | | | | | | | | |
| 3-month treasury bills | | | 1.65 | | | | 0.45 | | | | 0.13 | | | | 0.24 | | | | 0.44 | | | | 1.06 | | | | 1.50 | |
| 10-year government bonds | | | 1.59 | | | | 0.75 | | | | 1.20 | | | | 1.59 | | | | 1.88 | | | | 2.13 | | | | 2.25 | |
| | | | | | | | | | | | | | | | | | | | | | | | | | | | | |
| United States interest rates (%) | | | | | | | | | | | | | | | | | | | | | | | | | | | | |
| 3-month treasury bills | | | 2.10 | | | | 0.37 | | | | 0.10 | | | | 0.22 | | | | 0.44 | | | | 1.06 | | | | 1.50 | |
| 10-year government bonds | | | 2.14 | | | | 0.89 | | | | 1.36 | | | | 1.74 | | | | 2.13 | | | | 2.38 | | | | 2.50 | |
| | | | | | | | | | | | | | | | | | | | | | | | | | | | | |
| Exchange rate (US cents / Canadian $) | | | 75.4 | | | | 74.6 | | | | 79.0 | | | | 79.0 | | | | 78.0 | | | | 78.0 | | | | 78.5 | |
| | | | | | | | | | | | | | | | | | | | | | | | | | | | | |
| British Columbia goods and services | | | | | | | | | | | | | | | | | | | | | | | | | | | | |
| Export price deflator (% change) | | | -2.8 | | | | 0.1 | e | | | 3.7 | | | | 0.5 | | | | 1.9 | | | | 1.8 | | | | 2.0 | |
| 1 | Euro zone (19) is Austria, Belgium, Cyprus, Estonia, Finland, France, Germany, Greece, Ireland, Italy, Latvia, Lithuania, Luxembourg, Malta, Netherlands, Portugal, Slovakia, Slovenia and Spain. |
| e | B.C. Ministry of Finance estimate. |
Budget and Fiscal Plan - 2021/22 to 2023/24 |
British Columbia Economic Review and Outlook
The Economic Forecast Council, Budget 2021
Introduction
In accordance with the Budget Transparency and Accountability Act, the Minister of Finance, in preparing the provincial budget, consults the Economic Forecast Council (the Council or EFC) on British Columbia’s economic outlook. The 13-member Council is comprised of leading economists from several of Canada’s major financial and private research institutions.
The most recent meeting between the Minister and the EFC was on February 26, 2021, with Council members presenting their estimates for economic performance in 2020 and their forecasts for 2021 through 2025. Key topics of discussion included: the varied impacts of the COVID-19 pandemic across industries and GBA+ identity factors; government policies to support the economy while maintaining fiscal discipline; issues around equity and inclusion; B.C.’s housing market; the outlook for immigration and trade; and uncertainty in the global economic outlook.
After the meeting, EFC members were welcome to revise their forecasts until March 3, 2021 (five of the thirteen members chose to resubmit). Forecast details from the Council’s surveys are summarized in the table at the end of this topic box.
British Columbia Outlook
On average, the Council estimates that B.C.’s economy contracted by 5.1 per cent in 2020. This was an improvement of 0.9 percentage points compared to its prior projection in July 2020 (when the Council was resurveyed in advance of the First Quarterly Report given the unprecedented economic impacts and uncertainty caused by COVID-19). Members’ latest forecast calls for B.C. economic growth of 4.9 per cent in 2021 and 4.3 per cent in 2022, down 0.3 percentage points in 2021 and up 1.0 percentage points in 2022 from their July outlook. Over the medium-term, the Council forecasts B.C.’s economy to grow by 2.4 per cent in 2023 and by 2.3 per cent annually in 2024 and 2025 (see Chart 1).
Chart 1 – EFC Outlook for B.C.

Source: Average of Economic Forecast Council forecasts.
*Forecasts for 2023-2025 were not part of the July 2020 survey.
The Council estimates that B.C.’s economy contracted less than Canada’s in 2020, partly due to the province’s relative success in limiting the spread of COVID-19. B.C.’s economy is expected to continue to outperform the national average throughout the forecast horizon (see Chart 2). While the outlook for B.C. is generally positive, the EFC noted the uncertain nature of current projections.
Chart 2 – EFC Outlook for B.C. and Canada
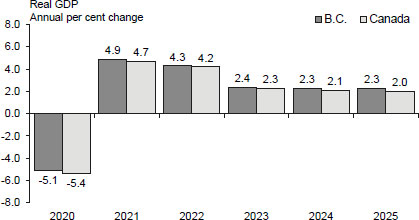
Source: Average of Economic Forecast Council forecasts.
Members generally expect B.C. real GDP to reach its pre-pandemic level around late 2021 or early 2022, but emphasised that the recovery will continue to be uneven across several dimensions. Among industries, they noted that real estate and professional sectors rebounded quickly following an initial fall
Budget and Fiscal Plan - 2021/22 to 2023/24 |
British Columbia Economic Review and Outlook
in activity. On the other hand, high-contact service industries, such as in-person retail, accommodation, restaurants, and particularly the broader tourism sector, have been harder hit by the pandemic and are expected to struggle until widespread immunization is achieved.
Among GBA+ identity factors, EFC members discussed the pandemic’s disproportionately negative economic impacts on women, youth, and people with lower education levels. A common thread with these three groups is an over-representation in the hardest hit industries. Furthermore, women’s disproportionate role in caring for children (during school and daycare closures) and other family members was also highlighted as a factor.
Government policies identified to support the economy included supports for childcare and skills training. The former may increase women’s labour market participation, according to some members. Meanwhile skills training may reduce permanent job loss and help people adapt to the evolving economy. Looking to the future, the Council sees an increasingly digital economy with implications for e-commerce, technology sectors and post-secondary education. The Council also noted that expanding the labour force via immigration and improved inclusiveness of all British Columbians will be critical for sustained growth.
More immediately, the EFC noted that adaptive and targeted government supports are needed throughout the pandemic with careful consideration about when and how they are withdrawn in B.C. and Canada. However, they also advised against adding broad and untargeted new stimulus, given the various initiatives already underway across jurisdictions and the expectation that forthcoming vaccines will unleash pent-up consumer spending in hard hit sectors. From a longer-term perspective, it was agreed that the B.C. government should remain disciplined in its fiscal planning to maintain the solid fiscal position with which it entered the pandemic.
Some members described B.C.’s housing outlook as strong, while others expect it to cool somewhat following the robust sales and price gains in 2020. Low interest rates were the main factor identified as boosting recent activity. The demand for space among teleworkers was another common theme, with several members pointing to the relatively high demand for single detached versus multi-unit homes. Looking ahead, renewed international migration after a pandemic-induced lull is expected to help support B.C.’s housing
British Columbia Economic Forecast Council:
Summary of B.C. real GDP forecasts, annual per cent change
| Participant | | Organization | | 2020 | | | 2021 | | | 2022 | | | 2023 | | | 2024 | | | 2025 | |
| Robert Kavcic | | Bank of Montreal | | | -4.6 | | | | 5.7 | | | | 4.7 | | | | 3.2 | | | | 2.2 | | | | 2.2 | |
| Brendon Ogmundson | | BC Real Estate Association | | | -5.0 | | | | 5.0 | | | | 3.8 | | | | 2.6 | | | | 2.2 | | | | 2.2 | |
| Ken Peacock | | Business Council of BC | | | -6.0 | | | | 4.5 | | | | 4.8 | | | | 3.0 | | | | 2.7 | | | | 2.7 | |
| Bryan Yu | | Central 1 Credit Union1 | | | -5.0 | | | | 4.2 | | | | 4.5 | | | | 2.9 | | | | 2.8 | | | | 2.7 | |
| Avery Shenfeld | | CIBC1 | | | -5.3 | | | | 5.8 | | | | 4.4 | | | | n/a | | | | n/a | | | | n/a | |
| Pedro Antunes | | Conference Board of Canada1 | | | -4.8 | | | | 4.9 | | | | 3.6 | | | | 0.6 | | | | 1.3 | | | | 1.8 | |
| Arlene Kish | | IHS Markit | | | -5.5 | | | | 4.1 | | | | 3.7 | | | | 2.3 | | | | 2.7 | | | | 2.3 | |
| Sébastien Lavoie | | Laurentian Bank Securities | | | -5.7 | | | | 4.6 | | | | 4.7 | | | | 2.1 | | | | 1.8 | | | | 1.8 | |
| Stéfane Marion | | National Bank | | | -4.7 | | | | 4.0 | | | | 4.2 | | | | 2.0 | | | | 2.2 | | | | 2.4 | |
| Craig Wright | | RBC1 | | | -5.0 | | | | 5.9 | | | | 4.7 | | | | n/a | | | | n/a | | | | n/a | |
| Jean-François Perrault | | Scotiabank | | | -5.0 | | | | 5.5 | | | | 4.3 | | | | n/a | | | | n/a | | | | n/a | |
| Aaron Stokes | | Stokes Economics | | | -4.7 | | | | 4.5 | | | | 4.4 | | | | 3.0 | | | | 3.4 | | | | 2.5 | |
| Derek Burleton | | TD1 | | | -4.9 | | | | 5.1 | | | | 4.2 | | | | 2.1 | | | | 1.9 | | | | 2.2 | |
| Average | | | | | -5.1 | | | | 4.9 | | | | 4.3 | | | | 2.4 | | | | 2.3 | | | | 2.3 | |
| Standard Deviation | | | | | 0.4 | | | | 0.7 | | | | 0.4 | | | | 0.8 | | | | 0.6 | | | | 0.3 | |
1 Updated subsequent to the February 26, 2021 meeting.
Budget and Fiscal Plan - 2021/22 to 2023/24 |
British Columbia Economic Review and Outlook
market. As in past years, many members noted B.C.’s desirability as a place to live, and the ongoing need to continue to increase housing supply and improve affordability to attract and retain talent.
Other topics discussed by the Council included the general resilience of LNG development and other capital projects despite minor pandemic- related delays, recent strength in the natural resources sector (particularly forestry), and issues surrounding climate change.
Canadian Outlook
After falling by 5.4 per cent in 2020, the EFC expects Canadian real GDP to grow by 4.7 per cent in 2021. Economic growth is then forecast to taper off, with the economy expanding by 4.2 per cent in 2022, 2.3 per cent in 2023, 2.1 per cent in 2024, and 2.0 per cent in 2025.
Members generally anticipate the completion of widespread immunization across Canada over the second half of 2021, with a similar though slightly faster timeline in the U.S. This is expected to support cross-border mobility for trade (such as tourism) and immigration (alongside higher national immigration targets). The outlook for interest rates was also discussed, with some uncertainty around the timing and pace of monetary policy tightening as the economy recovers.
International Outlook
The Council forecasts U.S. real GDP growth of 5.1 per cent in 2021 following a decline of 3.5 per cent the previous year. The EFC is calling for 3.9 per cent growth in 2022, then 2.4 per cent, 2.1 per cent, and 2.0 per cent growth in 2023, 2024, and 2025, respectively.
The new U.S. fiscal stimulus package worth US$1.9 trillion was highlighted as a key international development, with potentially sizable impacts on B.C.’s exports. However, the Council also noted enduring trade barriers with the U.S., the uncertain evolution of global supply chains, and ongoing geopolitical tensions as risks to the outlook.
Canadian Dollar
Council members’ projections for the Canadian dollar ranged from 76.5 US cents to 82.0 US cents in 2021 and from 75.0 US cents to 83.0 US cents in 2022. Over the medium- term, EFC forecasts ranged from lows of around of 71 to 74 US cents to highs of around 81 to 83 US cents (see Chart 3).
Chart 3 – EFC Outlook for the Dollar
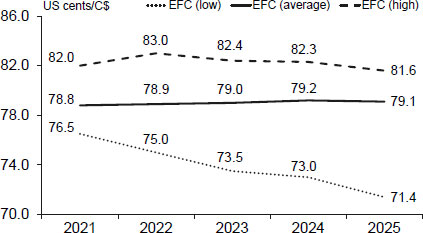
Source: Economic Forecast Council forecasts.
Budget and Fiscal Plan - 2021/22 to 2023/24 |
British Columbia Economic Review and Outlook
Forecast Survey – Participants’ Opinions
| All figures are based | | 2020 | | 2021 | | 2022 | | 2023 | | 2024 | | 2025 | |
| on annual averages | | Range | | Average 1 | | Range | | Average 1 | | Range | | Average 1 | | Range | | Average 1 | | Range | | Average 1 | | Range | | Average 1 | |
| British Columbia | | | | | | | | | | | | | | | | | | | | | | | | | |
| | | | | | | | | | | | | | | | | | | | | | | | | | |
| Real GDP (% change) | | -6.0 – -4.6 | | -5.1 (13) | | 4.0 – 5.9 | | 4.9 (13) | | 3.6 – 4.8 | | 4.3 (13) | | 0.6 – 3.2 | | 2.4 (10) | | 1.3 – 3.4 | | 2.3 (10) | | 1.8 – 2.7 | | 2.3 (10) | |
| Nominal GDP (% change) | | -8.0 – -1.9 | | -4.0 (13) | | 5.7 – 8.3 | | 7.3 (13) | | 5.4 – 7.1 | | 6.2 (13) | | 2.7 – 5.2 | | 4.3 (10) | | 3.0 – 5.1 | | 4.1 (10) | | 3.5 – 4.8 | | 4.2 (10) | |
| GDP Deflator (% change) | | -2.0 – 3.0 | | 1.1 (13) | | 0.8 – 3.3 | | 2.3 (13) | | 1.1 – 2.7 | | 1.9 (13) | | 1.3 – 2.2 | | 1.9 (10) | | 0.9 – 2.3 | | 1.7 (10) | | 1.5 – 2.3 | | 1.9 (10) | |
| Real business non-residential investment (% change) | | -15.4 – 6.0 | | -5.1 (7) | | 2.0 – 15.0 | | 10.2 (7) | | 4.5 – 14.2 | | 8.5 (7) | | -5.0 – 10.0 | | 1.0 (7) | | -11.0 – 4.0 | | -1.9 (6) | | -11.7 – 6.0 | | -1.1 (6) | |
| Real business machinery and equipment investment (% change) | | -20.0 – -0.9 | | -11.8 (6) | | 5.0 – 30.0 | | 14.9 (6) | | 3.0 – 9.1 | | 5.6 (6) | | -10.2 – 7.0 | | 0.7 (6) | | -15.4 – 3.5 | | -2.8 (5) | | -15.0 – 5.5 | | -1.3 (5) | |
| Household Income (% change) | | -4.0 – 9.5 | | 3.9 (10) | | -4.0 – 5.5 | | 1.8 (10) | | 2.5 – 5.4 | | 4.4 (10) | | 2.8 – 4.8 | | 3.6 (9) | | 3.0 – 5.5 | | 4.1 (8) | | 3.0 – 6.2 | | 4.1 (8) | |
| Net Migration (thousand persons) | | -2.0 – 53.6 | | 30.3 (10) | | 16.0 – 78.0 | | 42.9 (10) | | 50.0 – 95.0 | | 65.7 (10) | | 47.7 – 86.8 | | 69.3 (9) | | 47.6 – 89.0 | | 65.9 (9) | | 48.2 – 90.0 | | 64.9 (9) | |
| Employment (% change) | | -6.6 – -6.1 | | -6.4 (12) | | 3.4 – 6.5 | | 5.1 (12) | | 1.9 – 3.4 | | 2.6 (12) | | 1.0 – 2.8 | | 1.8 (10) | | 0.7 – 2.5 | | 1.4 (10) | | 0.7 – 2.5 | | 1.3 (10) | |
| Unemployment rate (%) | | 8.8 – 9.6 | | 9.0 (13) | | 6.3 – 8.2 | | 6.9 (13) | | 4.6 – 6.9 | | 5.6 (13) | | 4.9 – 5.8 | | 5.4 (10) | | 4.8 – 5.7 | | 5.2 (10) | | 4.8 – 5.7 | | 5.1 (10) | |
| Net operating surplus of corporations (% change) | | -28.0 – 11.2 | | -8.4 (7) | | -17.6 – 25.0 | | 7.3 (7) | | -3.3 – 13.3 | | 5.1 (7) | | -6.0 – 10.0 | | 3.3 (7) | | -12.8 – 8.0 | | 0.9 (6) | | -2.0 – 16.3 | | 6.2 (6) | |
| Housing starts (thousand units) | | 37.5 – 38.0 | | 37.9 (13) | | 32.4 – 43.0 | | 37.1 (13) | | 31.6 – 45.0 | | 36.9 (13) | | 30.7 – 45.0 | | 37.9 (10) | | 29.6 – 45.0 | | 36.9 (10) | | 28.6 – 48.0 | | 36.5 (10) | |
| MLS residential unit sales (thousand units) | | 90.3 – 94.0 | | 93.5 (8) | | 90.0 – 140.5 | | 109.9 (8) | | 85.0 – 115.2 | | 96.1 (8) | | 79.5 – 95.0 | | 89.6 (7) | | 78.0 – 105.0 | | 90.1 (7) | | 78.0 – 99.7 | | 88.5 (7) | |
| MLS residential average sale price ($ thousand) | | 773.0 – 782.0 | | 779.3 (8 | ) | 780.3 – 868.2 | | 833.0 (8) | | 792.0 – 890.0 | | 852.9 (8) | | 807.8 – 930.0 | | 875.9 (7) | | 832.0 – 990.0 | | 905.6 (7) | | 853.7 – 1,060.0 | | 935.4 (7) | |
| Retail sales (% change) | | 0.4 – 2.5 | | 1.9 (9) | | 3.0 – 9.5 | | 5.5 (9) | | 2.5 – 5.7 | | 4.5 (9) | | 2.5 – 5.4 | | 4.0 (8) | | 2.1 – 6.5 | | 4.0 (8) | | 2.1 – 6.0 | | 3.8 (8) | |
| Consumer price index (% change) | | 0.8 – 1.0 | | 0.8 (12) | | 1.1 – 2.1 | | 1.7 (12) | | 1.7 – 2.3 | | 2.0 (12) | | 1.3 – 2.1 | | 1.9 (9) | | 1.5 – 2.1 | | 1.9 (9) | | 1.7 – 2.1 | | 2.0 (9) | |
| | | | | | | | | | | | | | | | | | | | | | | | | | |
| United States | | | | | | | | | | | | | | | | | | | | | | | | | |
| | | | | | | | | | | | | | | | | | | | | | | | | | |
| Real GDP (% change) | | -3.6 – -3.5 | | -3.5 (13) | | 4.0 – 6.2 | | 5.1 (13) | | 3.0 – 4.3 | | 3.9 (13) | | 1.6 – 3.0 | | 2.4 (11) | | 1.1 – 2.5 | | 2.1 (11) | | 1.2 – 2.5 | | 2.0 (11) | |
| Intended Federal Funds rate (%) | | 0.13 – 0.42 | | 0.29 (11) | | 0.09 �� 0.25 | | 0.18 (12) | | 0.09 – 0.75 | | 0.24 (12) | | 0.10 – 1.13 | | 0.44 (11) | | 0.12 – 1.81 | | 0.85 (11) | | 0.13 – 2.13 | | 1.27 (11) | |
| Housing starts (million units) | | 1.34 – 1.45 | | 1.39 (13) | | 1.31 – 1.65 | | 1.53 (13) | | 1.30 – 1.65 | | 1.49 (13) | | 1.2 – 1.7 | | 1.50 (10) | | 1.17 – 1.80 | | 1.49 (10) | | 1.20 – 1.65 | | 1.47 (10) | |
| | | | | | | | | | | | | | | | | | | | | | | | | | |
| Canada | | | | | | | | | | | | | | | | | | | | | | | | | |
| | | | | | | | | | | | | | | | | | | | | | | | | | |
| Real GDP (% change) | | -5.7 – -5.2 | | -5.4 (13) | | 4.0 – 6.3 | | 4.7 (13) | | 3.3 – 4.8 | | 4.2 (13) | | 1.4 – 3.0 | | 2.3 (11) | | 1.7 – 2.5 | | 2.1 (11) | | 1.7 – 2.5 | | 2.0 (11) | |
| Bank of Canada overnight target rate (%) | | 0.25 – 0.60 | | 0.38 (11) | | 0.25 – 0.25 | | 0.25 (12) | | 0.25 – 0.50 | | 0.29 (12) | | 0.25 – 1.00 | | 0.46 (11) | | 0.25 – 1.50 | | 0.91 (11) | | 0.25 – 2.00 | | 1.33 (11) | |
| Exchange rate (US cents/C$) | | 74.5 – 79.0 | | 75.7 (12 | ) | 76.5 – 82.0 | | 78.8 (13) | | 75.0 – 83.0 | | 78.9 (13) | | 73.5 – 82.4 | | 79.0 (10) | | 73.0 – 82.3 | | 79.2 (10) | | 71.4 – 81.6 | | 79.1 (10) | |
| Housing starts (thousand units) | | 215 – 219 | | 218 (13 | ) | 200 – 234 | | 210 (13) | | 199 – 215 | | 206 (13) | | 185 – 225 | | 206 (10) | | 178 – 220 | | 203 (10) | | 165 – 230 | | 202 (10) | |
| Consumer price index (% change) | | 0.5 – 1.0 | | 0.7 (13) | | 1.0 – 2.3 | | 1.7 (13) | | 1.4 – 2.4 | | 2.0 (13) | | 1.6 – 2.1 | | 1.9 (11) | | 1.9 – 2.1 | | 2.0 (11) | | 1.9 – 2.2 | | 2.0 (11) | |
1 Based on responses from participants providing forecasts. Number of respondents shown in parentheses.
Budget and Fiscal Plan - 2021/22 to 2023/24 |
PART 4 | 2020/21 UPDATED FINANCIAL FORECAST (THIRD QUARTERLY REPORT)
Table 4.1 2020/21 Forecast Update
| ($ millions) | | Budget
2020 | | | First
Quarterly
Report | | | Fall
2020
Update | | | Third
Quarterly
Report | |
| Revenue | | | 60,585 | | | | 56,013 | | | | 57,424 | | | | 60,967 | |
| Expense | | | (60,058 | ) | | | (67,805 | ) | | | (70,067 | ) | | | (69,111 | ) |
| Forecast allowance | | | (300 | ) | | | (1,000 | ) | | | (1,000 | ) | | | — | |
| Surplus (deficit) | | | 227 | | | | (12,792 | ) | | | (13,643 | ) | | | (8,144 | ) |
| Capital Spending: | | | | | | | | | | | | | | | | |
| Taxpayer-supported capital spending | | | 7,126 | | | | 7,015 | | | | 6,781 | | | | 6,277 | |
| Self-supported capital spending | | | 3,409 | | | | 3,372 | | | | 3,365 | | | | 3,812 | |
| Total capital spending | | | 10,535 | | | | 10,387 | | | | 10,146 | | | | 10,089 | |
| Provincial Debt: | | | | | | | | | | | | | | | | |
| Taxpayer-supported debt | | | 49,202 | | | | 59,802 | | | | 60,546 | | | | 59,962 | |
| Self-supported debt | | | 26,890 | | | | 27,068 | | | | 27,080 | | | | 27,524 | |
| Total debt (including forecast allowance) | | | 76,392 | | | | 87,870 | | | | 88,626 | | | | 87,486 | |
| Taxpayer-supported debt to GDP ratio | | | 15.5 | % | | | 20.8 | % | | | 20.8 | % | | | 20.3 | % |
| Taxpayer-supported debt to revenue ratio | | | 84.1 | % | | | 110.6 | % | | | 109.7 | % | | | 102.6 | % |
Introduction
The third-quarter fiscal outlook for 2020/21 forecasts a deficit of $8.1 billion, an improvement of $5.5 billion since the second-quarter outlook in the Fall 2020 Economic & Fiscal Update. The main changes are higher revenues ($3.5 billion), lower expenses ($956 million) and the unused forecast allowance, which was set at $1.0 billion to reflect the increased forecasting uncertainty. Changes are illustrated in Chart 4.1 below, with additional detail provided in Table 4.2.
The taxpayer-supported capital spending forecast is lower than at Fall 2020 Economic & Fiscal Update by $504 million and the self-supported capital spending is higher by $447 million (see Table 4.3 on page 124 for details). The taxpayer-supported debt forecast is lower by $584 million due to improved operating results and changes to cash and other working capital balances. (see Table 4.4 on page 125 for details).
Chart 4.1 2020/21 Deficit – Major Changes from the Fall 2020 Update
Deficit decreased by $5.5 billion
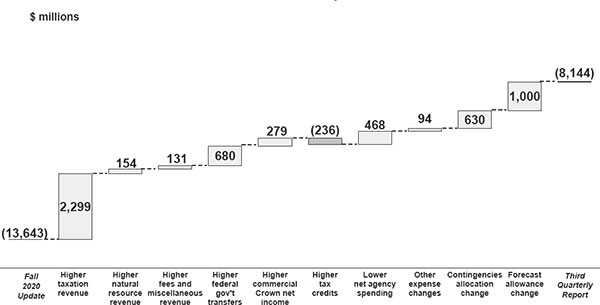
Budget and Fiscal Plan - 2021/22 to 2023/24
107
2020/21 Updated Financial Forecast (Third Quarterly Report)
Table 4.2 2020/21 Financial Forecast Changes
| | | | ($ millions) | |
| 2020/21 surplus at Budget 2020 (February 18, 2020) | | | 227 | | | | | | | | | | | | 227 | |
| 2020/21 deficit at the First Quarterly Report (September 10, 2020) | | | | | | | (12,792 | ) | | | | | | | | |
| 2020/21 deficit at the Fall 2020 Economic & Fiscal Update (December 17, 2020) | | | | | | | | | | | (13,643 | ) | | | | |
| | | | | | | | | | | | | | | | | |
| | | | Q1 | | | | Fall 2020 | | | | Q3 | | | | Total | |
| | | | Update | | | | Update | | | | Update | | | | Changes | |
| Revenue changes: | | | | | | | | | | | | | | | | |
| Personal income tax – mainly expected changes in 2020 household income | | | (978 | ) | | | 171 | | | | 154 | | | | (653 | ) |
| Corporate income tax – changes in instalments, mainly reflecting federal government outlook for 2020 national corporate taxable income partly offset by weaker 2019 tax assessments results | | | (1,144 | ) | | | 78 | | | | 1,134 | | | | 68 | |
| Provincial sales tax – lower retail sales and consumer expenditures and impacts of tax measures | | | (1,024 | ) | | | (135 | ) | | | 700 | | | | (459 | ) |
| Property taxes – mainly reflecting tax relief provided to commercial property owners, lower speculation and vacancy tax and updated 2021 assessment values and tax rate | | | (694 | ) | | | 7 | | | | (15 | ) | | | (702 | ) |
| Property transfer tax – changes in year-to-date sales activity in the housing sector | | | (315 | ) | | | 479 | | | | 250 | | | | 414 | |
| Fuel and carbon taxes – year-to-date sales activity and delay of the carbon tax rate increase from April 1, 2020 to April 1, 2021 | | | (469 | ) | | | (15 | ) | | | 79 | | | | (405 | ) |
| Employer health tax – mainly expected changes in employee compensation | | | (148 | ) | | | 47 | | | | 17 | | | | (84 | ) |
| Other taxation sources – impacts of 2019/20 Public Accounts and year-to-date results | | | 20 | | | | 10 | | | | (20 | ) | | | 10 | |
| Mining – changes in coal and copper prices, changes in coal production and mining costs | | | (84 | ) | | | (18 | ) | | | 2 | | | | (100 | ) |
| Forests – higher stumpage rates partly offset by lower logging tax revenue and changes in harvest volumes | | | 30 | | | | 96 | | | | 128 | | | | 254 | |
| Other natural resources – commodity prices and production volumes, utilization of royalty infrastructure programs/credits and changes in water rentals revenue | | | (190 | ) | | | 78 | | | | 24 | | | | (88 | ) |
| Fees, licences, investment earnings and miscellaneous sources: | | | | | | | | | | | | | | | | |
| Post-secondary institutions | | | (673 | ) | | | 67 | | | | 145 | | | | (461 | ) |
| K-12 school districts | | | (137 | ) | | | (25 | ) | | | 78 | | | | (84 | ) |
| Taxpayer-supported Crowns | | | (111 | ) | | | (94 | ) | | | (45 | ) | | | (250 | ) |
| Other sources – lower fees from Health Authorities and reduced motor vehicle fees and fines | | | (76 | ) | | | 4 | | | | (47 | ) | | | (119 | ) |
| Canada health and social transfers – mainly additional pandemic relief one-time funding supporting recovery of health care systems and changes in B.C. population share of national total | | | (2 | ) | | | 52 | | | | 552 | | | | 602 | |
| COVID-19 related federal government funding | | | 2,376 | | | | 242 | | | | (2 | ) | | | 2,616 | |
| Other federal government transfers – mainly higher transfers under the Disaster Financial Assistance Arrangements and higher funding in support of taxpayer-supported Crowns and SUCH sector agencies | | | (20 | ) | | | 69 | | | | 130 | | | | 179 | |
| Commercial Crown corporation net income – ICBC, BC Lottery Corp and the Liquor Distribution Branch | | | (933 | ) | | | 298 | | | | 279 | | | | (356 | ) |
| Total revenue changes | | | (4,572 | ) | | | 1,411 | | | | 3,543 | | | | 382 | |
| | | | | | | | | | | | | | | | | |
| Less : expense increases (decreases): | | | | | | | | | | | | | | | | |
| Consolidated Revenue Fund changes: | | | | | | | | | | | | | | | | |
| Pandemic Response and Economic Recovery Contingencies (Vote 52) – updated spending forecast | | | 5,000 | | | | 2,000 | | | | (300 | ) | | | 6,700 | |
| Contingencies (Vote 45) – updated spending forecast | | | — | | | | — | | | | (330 | ) | | | (330 | ) |
| Federal-Provincial cost-shared investments under the Safe Restart Agreement: | | | | | | | | | | | | | | | — | |
| Provincial portion (COVID-19 Contingencies - Vote 53) | | | 810 | | | | — | | | | — | | | | 810 | |
| Federal portion | | | 810 | | | | — | | | | — | | | | 810 | |
| Statutory spending: | | | — | | | | | | | | | | | | — | |
| Fire management costs | | | 76 | | | | 2 | | | | 2 | | | | 80 | |
| Emergency Program Act | | | 94 | | | | 26 | | | | 1 | | | | 121 | |
| Signed agreements under the Sustainable Services Negotiating Mandate | | | 310 | | | | 37 | | | | 2 | | | | 349 | |
| COVID-19 temporary pandemic pay 1 | | | 425 | | | | (41 | ) | | | — | | | | 384 | |
| Housing Priority Initiatives Special Account – purchase of hotels to house decamped homeless populations | | | 111 | | | | — | | | | 85 | | | | 196 | |
| Other statutory spending | | | 14 | | | | 71 | | | | 3 | | | | 88 | |
| Refundable tax credits: | | | | | | | | | | | | | | | — | |
| One-time enhancement of the Climate Action Tax Credit | | | 500 | | | | — | | | | — | | | | 500 | |
| Other refundable tax credits | | | (86 | ) | | | 31 | | | | 236 | | | | 181 | |
| Other expense changes – mainly favourable impacts of prior year liability | | | 88 | | | | (15 | ) | | | (97 | ) | | | (24 | ) |
| Spending funded by third party recoveries - mainly Safe Return to Class funding from the federal government | | | (30 | ) | | | 310 | | | | (90 | ) | | | 190 | |
| Changes in spending profile of service delivery agencies: | | | | | | | | | | | | | | | — | |
| School districts | | | 152 | | | | 214 | | | | 89 | | | | 455 | |
| Universities | | | (61 | ) | | | (14 | ) | | | (14 | ) | | | (89 | ) |
| Colleges | | | (23 | ) | | | 2 | | | | 13 | | | | (8 | ) |
| Health authorities and hospital societies | | | 229 | | | | 1,137 | | | | 580 | | | | 1,946 | |
| Other service delivery agencies 2 | | | 609 | | | | (165 | ) | | | (75 | ) | | | 369 | |
| (Increase) decrease in transfers to service delivery agencies (elimination) | | | (1,281 | ) | | | (1,333 | ) | | | (1,061 | ) | | | (3,675 | ) |
| Total expense changes | | | 7,747 | | | | 2,262 | | | | (956 | ) | | | 9,053 | |
| Subtotal | | | (12,319 | ) | | | (851 | ) | | | 4,499 | | | | (8,671 | ) |
| Forecast allowance (increase) decrease | | | (700 | ) | | | — | | | | 1,000 | | | | 300 | |
| Total changes | | | (13,019 | ) | | | (851 | ) | | | 5,499 | | | | (8,371 | ) |
| 2020/21 deficit at the First Quarterly Report | | | (12,792 | ) | | | | | | | | | | | | |
| 2020/21 deficit at the Fall 2020 Economic & Fiscal Update | | | | | | | (13,643 | ) | | | | | | | | |
| 2020/21 deficit at the Third Quarterly Report | | | | | | | | | | | (8,144 | ) | | | (8,144 | ) |
1 Total COVID-19 temporary pandemic pay remains at $425 million, however $41 million is included as part of Contingencies Vote 52 spending.
2 Includes BC Transportation Financing Authority, BC Transit, BC Housing Management Commission, Community Living BC, and other entities.
Budget and Fiscal Plan - 2021/22 to 2023/24
108
2020/21 Updated Financial Forecast (Third Quarterly Report)
Revenue
Total government revenue is now forecast to be $3,543 million higher than the Fall 2020 Economic & Fiscal Update. Major changes include:
| • | $2,299 million increase in taxation revenue, mainly reflecting higher income tax revenues due to corporate income tax installment payments from the federal government, and year-to-date information for provincial sales tax, property transfer tax and other taxation sources; |
| • | $154 million increase in natural resource revenue mainly due to the effects of higher stumpage rates and higher natural gas price; |
| • | $131 million increase in revenue from fees, licences, investment earnings and miscellaneous sources mainly due to improvements in post-secondary institutions and K-12 school districts projections; |
| • | $680 million increase in federal government contributions mainly due to higher one-time funding for recovery of the health care systems following the pandemic as well as higher transfers to taxpayer-supported agencies; and |
| • | $279 million increase in commercial Crown corporations’ net income mainly due to higher net income projections from the Insurance Corporation of BC. |
Expense
Total government spending is now forecast to be $956 million lower than the Fall 2020 Economic & Fiscal Update. Major changes include:
| • | $630 million lower in contingencies allocation, including $300 million from Pandemic Response and Economic Recovery contingencies (Vote 52). (For details on COVID-19 Pandemic Spending & Related Measures, please see the topic box on page 111); |
| • | $97 million decrease in other expenses mainly due to favourable adjustments of prior year liability; |
| • | $90 million in lower spending funded by recoveries from third parties; and |
| • | $468 million in lower net expense by service delivery agencies due to the timing of expense recognition mainly related to health authorities’ purchase of personal protective equipment. Funding was provided by the Province in the current fiscal year, while the accounting expense is recorded in the period when the inventory is used. |
These spending reductions are partly offset by
| • | $236 million in higher refundable tax transfers mainly reflecting stronger 2019 tax assessments; and |
| • | $93 million higher in statutory spending mainly to fund the purchases of hotels to house decamped homeless populations. |
Table 4.2 provides a detailed breakdown of changes in the operating results by quarter from Budget 2020.
Budget and Fiscal Plan - 2021/22 to 2023/24
109
2020/21 Updated Financial Forecast (Third Quarterly Report)
Government Employment (FTEs)
Full-time equivalent (FTE) staff utilization in core government ministries is forecast to be 32,400 FTEs in 2020/21. This is an increase of 600 FTEs from the forecast as presented in Budget 2020. The majority of this increase reflects staffing requirements to implement budgeted program growth in court facilities, the Civil Resolution Tribunal, and CleanBC. Government’s COVID-19 response also required increased FTEs across the Ministry of Health and for various economic recovery job creation initiatives. Further details on FTEs are provided in Table A13 in the appendix.
Budget and Fiscal Plan - 2021/22 to 2023/24
110
2020/21 Updated Financial Forecast (Third Quarterly Report)
COVID-19 Pandemic Spending & Related Measures
This section provides an overview of the Province’s pandemic response measures, including an update on notional allocations within the Pandemic Contingencies votes as of February 28, 2021, as well as a summary of tax and payment relief and deferral measures.
Vote 52 Contingencies (All Ministries): Pandemic Response and Economic Recovery
On March 23, 2020, the Legislative Assembly authorized Supplementary Estimates of $5 billion and a new Vote 52 – Contingencies for Pandemic Response and Economic Recovery (Pandemic Contingencies).
Additional Supplementary Estimates of $2 billion for the Pandemic Contingencies was passed on December 17, 2020 for a total of $7 billion.
Details of the Pandemic Contingencies notional allocations as of February 28, 2021 are shown in Table 1.
Table 1: Vote 52 Pandemic Contingencies Allocations as of February 28, 2021
| Category | | Notional Allocation | | Measures |
| | | $2.0 billion1 | | Health and mental health |
| | | $56 million2 | | Child care services |
Critical
| | $162 million | | Temporary housing, meals and supports for vulnerable populations |
| services | | $130 million | | Essential services for adults with developmental disabilities, vulnerable children and youth, courts, family justice and victim services, public health communications, Urban Indigenous Service Providers, food security and agriculture worker accommodations |
| | | $1.3 billion3 | | B.C. Recovery Benefit |
| | | $645 million | | B.C. Emergency Benefit for Workers |
| | | $718 million | | Temporary monthly increases and other supports for people in receipt of income and disability assistance including the Crisis Supplement and Recovery Supplement |
| Financial | | $129 million | | Temporary Rental Supplement |
| supports | | $70 million | | Canada Emergency Commercial Rent Assistance Program |
| | | $60 million | | Emergency financial relief for organizations providing animal care, park operators and community tourism organizations, Domestic Motion Picture providers, local sports organizations, Royal BC Museum and the B.C. Pavilion Corporation. |
| | | $40 million4 | | Increased Employment Incentive |
| Economic Recovery | | $1.4 billion | | See table starting on page 119 for updated forecasts for initiatives under the StrongerBC Economic Recovery Plan. |
| Total | | $6.7 billion | | Pandemic Contingencies Spending Measures |
| 1 | An additional $230 million in new health care related job opportunities is included in the economic recovery envelope. |
| 2 | The total estimate for the temporary emergency funding for child care providers is $319 million, however, the Ministry of Children and Family Development is redirecting some base budget to offset the new program costs, reducing the overall forecasted draw on Contingencies. |
| 3 | The total program cost for the B.C. Recovery Benefit is forecast to be $1.4 billion, of which $1.3 billion is forecast for 2020/21 and $100 million is forecast for 2021/22. |
| 4 | The total program cost for the Increased Employment Incentive is forecast to be $190 million, of which $40 million is forecast for 2020/21 and $150 million is forecast for 2021/22. |
Budget and Fiscal Plan - 2021/22 to 2023/24
111
2020/21 Updated Financial Forecast (Third Quarterly Report)
Critical services include health and mental health related responses, supports for child care providers, and providing essential social services to vulnerable populations such as adults with developmental disabilities, people experiencing homelessness, and children, youth and young adults receiving provincial supports.
Financial support measures include income supports, such as the BC Emergency Benefit for Workers and the BC Recovery Benefit, as well as top-up supports for income and disability assistance clients including low- income seniors. Measures also include rental relief assistance for individuals, families and businesses, and targeted financial relief for a number of sectors.
Economic recovery spending measures include a grant program for small and medium sized businesses, training and job creation initiatives including new jobs to help people enter the health sector. Other measures include community infrastructure grants and projects, support for the tourism sector and programs to increase food security. Economic recovery spending also includes provincial funding to support K-12 students to return to classrooms, and funding for CleanBC initiatives and other technology and innovation programs and initiatives.
Vote 53 Contingencies (All Ministries): Federal and Provincial Pandemic Support
On July 16, 2020, the federal, provincial and territorial governments announced plans for a Safe Restart Agreement, which aimed to support the reopening of provincial and territorial economies over the next six to eight months.
Under the Agreement, the federal government has committed close to $2 billion for B.C. While approximately $1.15 billion of the federal funding was used to help fund the cost of continuing significant measures in B.C. that were underway or planned, part of the agreement requires 50/50 provincial/ federal cost-sharing. This relates specifically to municipal and transit-related relief and restart measures.
On August 14, 2020, the Legislative Assembly authorized Vote 53 Contingencies (All Ministries): Federal and Provincial Pandemic Support. The Vote 53 Contingencies provides up to $1 billion net spending appropriation for the Province to support the cost-share arrangement for municipal and transit funding, and other pandemic priorities.
The current provincial spending forecast for Vote 53 is $810 million with a total spending forecast of $1.62 billion for initiatives as shown in Table 2.
Other COVID-19 Response and Relief Measures
In addition to the Vote 52 and Vote 53 Pandemic Contingencies spending measures, government has implemented a number of other measures which include tax and revenue measures, and statutory spending related to COVID-19.
Tax measures include a reduction in school tax for commercial properties by an average of 25 per cent in the 2020 calendar year (estimated at $714 million in reduced taxes). Government has also delayed the scheduled increase to the carbon tax rate and other
Table 2: Vote 53 Federal and Provincial Contingencies Allocations as of February 28, 2021
| | | Provincial Allocation | | Federal Allocation | | Total |
| Municipalities | | $270 million | | $270 million | | $540 million |
| Transit | | $540 million | | $540 million | | $1.08 billion |
| Total | | $810 million | | $810 billion | | $1.620 billion |
Budget and Fiscal Plan - 2021/22 to 2023/24
112
2020/21 Updated Financial Forecast (Third Quarterly Report)
Budget 2020 tax measures to April 1, 2021, estimated to reduce taxes by $268 million.
As part of the StrongerBC Economic Recovery Plan, government also introduced a temporary PST exemption on select machinery and equipment to support businesses that are pivoting their operations in response to the pandemic. The PST exemption is estimated to save businesses $470 million.
Revenue relief measures include the ICBC customer premium rebate (estimated $600 million), wholesale pricing for restaurants, bars and tourism operators with liquor licenses, and other ICBC payment relief and deferral measures.
Statutory spending directly related to COVID-19 includes funding for the Pandemic Pay for frontline workers in health and social sectors (a federal-provincial cost- sharing initiative), hotel purchases to support homelessness response measures, and spending related to COVID-19 emergency coordination and response.
Government also approved revised spending targets for the Forest Enhancement Society to ensure its tree planting continues as planned to secure future economic and environmental benefits while meeting the new COVID-19 related guidelines for industrial camps.
The estimated provincial value of these measures is nearly $3.0 billion as shown in Table 3.
Government also implemented payment deferral measures to provide administrative and financial relief to individuals, businesses
Table 3: Other Response and Temporary Relief Measures as of February 28, 2021
| Estimated Cost | | Measure |
| $714 million | | Reduced school tax for commercial properties for the 2020 calendar year |
| $500 million | | Climate Action Tax Credit one-time enhancement |
| $470 million1 | | Temporary PST rebate on select machinery and equipment |
| $600 million | | ICBC COVID-19 Customer Premium Rebate |
$96 million
($384 million total
federal-provincial) | | Pandemic Pay for Frontline Workers |
| $268 million | | Delay in the increase of the carbon tax rate and other new tax measures |
| $196 million | | Purchase of hotels to house decamped homeless populations |
| $68 million | | Emergency Program Act – COVID-19 related coordination and measures |
| $31 million2 | | Temporary wholesale pricing model for liquor licensees |
| $17 million | | ICBC temporary fee relief measures |
| $11 million | | Forest Enhancement Society of BC – tree planting camps |
| $5 million | | Columbia Basin Trust Regional Grants |
| $3 million | | Commercial Recreation Tenures and Permits financial relief |
| $2 million | | Fee Relief for the Gaming Sector |
| $3.0 billion | | Provincial Total for Other Response and Temporary Relief Measures |
| 1 | $235 million in 2020/21 and $235 million in 2021/22. |
| 2 | Estimated cost represents foregone revenues for 2020/21, however, this measure was extended permanently. |
Budget and Fiscal Plan - 2021/22 to 2023/24
113
2020/21 Updated Financial Forecast (Third Quarterly Report)
and municipalities. This included a six-month moratorium on student loan collection, BC Hydro bill relief for residential and commercial customers, and bill deferrals for industrial customers and deferred school tax remittance for municipalities. Government also provided administrative relief by extending tax filing and payment deadlines for the employer health tax, provincial sales tax, municipal and regional district tax on short-term accommodation, tobacco tax, motor fuel tax, and carbon tax. The estimated value of eligible deferrals is over $6.2 billion as shown in Table 4. As of February 28, 2021, all deferral measures have since concluded, with the exception of the employer health tax instalment payment deadline extension.
As deferral payments are expected to be received at a later date, they do not directly impact the fiscal plan.
Descriptions of all measures can be found in the following pages.
Table 4 – Payment Deferral Measures (no direct operating fiscal impact)
| Estimated value of deferral | | Measure |
| $70 million | | Six-month moratorium on student fee collection |
| $103 million | | BC Hydro bill deferrals for industrial customers and bill relief measures |
| Over $1 billion | | Postponing municipal remittance date for school taxes to the end of the calendar year |
| Over $5 billion | | Extending tax filing and payment deadlines for the employer health tax, provincial sales tax, municipal and regional district tax on short-term accommodation, tobacco tax, motor fuel tax, and carbon tax. |
| Over $6.2 billion | | Total Value of Deferrals |
*Note: All deferral measures have since concluded, with the exception of the employer health tax instalment payment deadline extension.
Budget and Fiscal Plan - 2021/22 to 2023/24
114
2020/21 Updated Financial Forecast (Third Quarterly Report)
Description of COVID-19 Measures
Vote 52 Pandemic Contingencies Spending Measures as of February 28, 2021
Health care ($1.95 billion): Funding related to health related COVID-19 response measures includes:
| • | Increased lab testing, including the establishment of over 100 separate testing sites to help avoid the transmission of COVID-19 within existing health care settings; |
| • | Additional funding for long-term care and assisted living facilities, including addressing increased COVID-19 related costs, implementing single-site work orders to help prevent the spread of disease between facilities, and hiring of up to three full-time equivalent staff at each of the 584 facilities; |
| • | Prevention and contact tracing measures, including plans to hire over 900 contact tracers between September 2020 and March 2021 to help with the projected rise in cases of COVID-19; |
| • | Health related costs wrap-around support services for those that were living in unsafe decampments who have been moved to temporary housing; |
| • | Free parking at health authority sites to remove barriers for anyone who needed access and reduce the burden on health care workers; and |
| • | Other increased operating costs including personal protective equipment, accelerating rescheduled surgeries, and increased staffing across the health spectrum including general screening staff at health facility entrances to specialist physicians and nurses, and staff within the BC Center for Disease Control. |
Mental health and addictions support ($39 million): Funding includes mental health supports such as expanded virtual mental health supports for seniors, adults and youth and a Mobile Response Team to support the mental well-being and psychological safety of front-line health-care workers. In addition, this includes a number of addiction support services such as:
| • | Opioid response and addictions supports including funding for supportive recovery providers and youth substance use treatment services; |
| • | Youth supports provided through Foundry and Foundry Virtual which offers health and wellness resources, services and supports online and through integrated service centres; |
| • | Scaling up existing overdose prevention services and adding new outreach teams to further help prevent overdose deaths, including opening 17 new supervised consumption services and 12 new inhalation consumption sites in communities that have been hit the hardest by the overdose crisis; |
| • | Funding to hire 42 new full-time registered nurses, psychiatric nurses, social workers and peer support workers for 14 interdisciplinary outreach teams across the province; |
| • | The Lifeguard application, which provides a means to call emergency services if individuals with addictions become unresponsive while using substances; |
Budget and Fiscal Plan - 2021/22 to 2023/24
115
2020/21 Updated Financial Forecast (Third Quarterly Report)
| • | Establishing the Rapid Access to Consultative Expertise Line to connect first responders with overdose health emergency physicians when treating patients with substance use disorders; and |
| • | Funding to create six new Assertive Community Treatment (ACT) teams, who use a psychosocial rehabilitation approach for individuals with severe and complex mental illness, with or without substance use or addiction. |
Child care services ($319 million): Temporary emergency funding was provided from April to August to ensure child care spaces remained available for essential service workers and to provide financial relief and preserve spaces for parents during any temporary closures. Licensed child care providers that stayed open received funding to keep operations going. These centres were eligible to receive seven times their average monthly funding from government which is expected to cover approximately 75 per cent of a group facility’s average monthly operating expenses. Licensed child care providers who closed their facilities were eligible to receive two times their average monthly government funding which is expected to cover approximately 20 per cent of an average group facility’s monthly operating expenses.
Temporary housing, meal and health supports for vulnerable populations ($162 million): Spaces at hotels, motels and community centres are providing shelter to assist a range of people, including people experiencing homelessness, to self-isolate and follow health orders as well as receive food and support services. In addition to funding for these supports, the Province has made capital investments (approximately $196 million) to purchase hotels to help move people living in unsafe, dense encampments. Approximately 3,000 leased spaces are currently secured at sites throughout B.C.’s health regions to enable safe physical distancing in homeless shelters and help people self-isolate, with close to 150 spaces in communities secured for people leaving violent or unstable situations.
Other Essential services ($130 million): Funding to ensure continuity of services for adults with developmental disabilities receiving care from Community Living BC. Funding also provides a range of supports for children and youth that access provincial supports, including $225 per month for eligible B.C. families with children with special needs that ended September 30, 2020. Continuing existing care-giver arrangements for youth aging out of foster care and extend the maximum duration of Agreements with Young Adults program beyond 48 months is also being funded. Other essential service supports include funding to facilitate virtual and in-person court proceedings, accelerate the resolution of family law matters, and provide supports for victim services including sexual assault centres. Funding was also provided to support Indigenous service providers, support food security, and support the agriculture sector workers with temporary accommodations, and COVID-19 related public awareness campaigns to communicate health and safety information.
BC Recovery Benefit ($1.4 billion): the BC Recovery Benefit is a one-time payment of up to $1,000 for families with household incomes under $175,000 annually and up to $500 to single people earning less than $87,500 annually. The benefit is anticipated to help up to 2.7 million individuals and families, including those in receipt of income and disability assistance. The spending for this program for fiscal 2020/21 and 2021/22 are forecasted to be $1.3 billion and $100 million respectively. As of February 28, 2021, nearly 1.7 million applications have been approved, benefiting over 2.3 million British Columbians.
Budget and Fiscal Plan - 2021/22 to 2023/24
116
2020/21 Updated Financial Forecast (Third Quarterly Report)
B.C. Emergency Benefit for Workers ($645 million): Provided a one-time, tax-free $1,000 payment to British Columbians who lost income because of COVID-19. B.C. residents who lost their employment or self-employment income for reasons related to COVID-19 on or after March 1, 2020 and that were eligible for the Canada Emergency Response Benefit (CERB) were eligible for the B.C. Emergency Benefit for Workers. Over 643,000 British Columbians received this benefit.
Supports for Income and Disability Assistance Clients ($718 million): From April to December 2020, income and disability assistance clients, including low-income seniors receiving the Seniors Supplement, received a temporary crisis supplement of $300 per month. This new emergency funding was put in place to ensure that those in greatest need do not encounter additional barriers while some service organizations closed or reduced service hours during the pandemic, and to help cover the increased costs of food and shelter. In January - March 2021, the BC Recovery Supplement provided $150 monthly increase to existing income and disability assistance benefits. Other measures include increased funding for the transportation supplement and temporary earning exemptions related to federal support measures such as the Canada Emergency Response Benefit (CERB) to ensure that provincial supports are not reduced due to these supports. Over 200,000 people, including clients and their families, have benefited from these additional supports.
Temporary Rental Supplement ($129 million): A temporary rental supplement of $500 per month for eligible households with dependents and $300 per month for eligible households with no dependents, which was available for the months of April through to August 2020 on a per-household basis for low-to-middle income households where the income has been affected by COVID-19. Over 87,000 applications were approved for this supplement.
Canada Emergency Commercial Rent Assistance Program ($70 million provincial contribution): This was a federal-provincial cost share program that provided forgivable loans to qualifying commercial property owners to cover 50 per cent of monthly rent payments that are payable by eligible small business tenants who experienced financial hardship between April and September. The loans were forgiven if the mortgaged property owner agreed to reduce the small business tenants’ rent by at least 75 per cent under a rent forgiveness agreement, which included a term not to evict the tenant while the agreement is in place. The small business tenant covered the remainder, up to 25 per cent of the rent. The federal government has subsequently introduced a new Canada Emergency Rent Subsidy program.
Emergency financial relief for businesses/sectors ($60 million): Targeted funding to support businesses, non-profit organizations and sectors which includes:
| • | Emergency funding to support the continued care of animals in major facilities, tourism attractions, and refuge and re-habitation centres that have reduced their operations due to COVID-19; |
| • | Support for park operators to prepare BC Parks for re-opening and to implement a day use reservation system for 12 high-use parks; |
| • | Financial relief to Community Destination Marketing Organizations to offset Municipal Regional District Tax (MRDT) revenue loss and to support local recovery efforts; |
Budget and Fiscal Plan - 2021/22 to 2023/24
117
2020/21 Updated Financial Forecast (Third Quarterly Report)
| • | Support for the domestic film and television industry to assist with restart and recovery and maintain B.C.’s competitive motion picture sector; |
| • | Financial relief to Local Sport Organizations (LSOs) to support their administration and operational needs to help restart in sports; and |
| • | Financial relief for the Royal BC Museum and the BC Pavilion Corporation to maintain operations during prolonged closures and health restrictions on major events. |
Increased Employment Incentive ($190 million): the Increased Employment Incentive is a new refundable tax credit to employers who increase their total payroll for B.C. employees from the third to the fourth quarter of 2020. The incentive is intended to help B.C. businesses that were affected by the COVID-19 pandemic to recover and help create good jobs for people. Employers can increase their payroll by hiring new employees, increasing the hours of existing employees, or giving existing employees a raise. Applications for this program is anticipated to begin in March 2021. The spending for this program for fiscal 2020/21 and 2021/22 are forecasted to be $40 million and $150 million respectively.
Economic Recovery Spending Measures ($1.4 billion): Government has implemented a number of measures as part of the StrongerBC Economic Recovery Plan to support job creation and training opportunities and to provide recovery supports for businesses and community. Initiatives also aim to strengthen food security and supply chains and to improve economic resiliency in B.C. through investments in connectivity, clean energy, manufacturing and forestry. An updated list of economic recovery measures and forecasts as of February 28, 2021 is listed in the following table. Updated forecasts or newly introduced initiatives since the StrongerBC Economic Recovery Plan was introduced in September 2020 are shown in bold.
Budget and Fiscal Plan - 2021/22 to 2023/24
118
2020/21 Updated Financial Forecast (Third Quarterly Report)
| Economic Recovery Category and Measures | | Allocation ($M) | |
| Recovery for People - Jobs and Training | | | 361.663 | |
| BC Parks and Conservation Officer Service Youth Employment | | | 1.800 | |
| Community Job Creation Projects | | | 25.000 | |
| Digital Superclusters – Youth Training & Job Placement | | | 7.000 | |
| Early Retirement Bridging Program | | | 18.000 | |
| Forest Employment Program | | | 12.000 | |
| Jobs in Health Care | | | 229.900 | |
| Indigenous Community Skills Training and Education | | | 15.000 | |
| Micro-Credentialing | | | 2.000 | |
| Employment Supports for People with Disabilities and with Barriers | | | 20.000 | |
| Recreation Sites and Trails Youth Crew Program Expansion | | | 0.428 | |
| Short-Term Skills Training for in-demand Jobs | | | 20.000 | |
| Targeted Training for Health and Human Services | | | 10.535 | |
| Recovery for People – Supports | | | 52.651 | |
| Anti-Racism Restart and Recovery | | | 2.716 | |
| K-12 Return to School Funding | | | 45.600 | |
| Mental Health Support for the Workforce | | | 2.000 | |
| Youth Suicide Prevention and Life Promotion | | | 2.335 | |
| Recovery for Businesses | | | 277.200 | |
| Amplify BC | | | 22.500 | |
| Amateur Sports | | | 15.000 | |
| Building Confidence App | | | 2.000 | |
| Destination B.C. Tourism Recovery Strategy | | | 5.000 | |
| Digital Marketing and Launch Online | | | 44.000 | |
| Indigenous Tourism BC | | | 5.000 | |
| Small Business Recovery Grant1 including Tourism Top-up | | | 150.000 | |
| Technology & Innovation - Digitization of the Industrial Lands Inventory | | | 0.700 | |
| Tourism Dependent Communities | | | 19.400 | |
| Tourism Regional Destination Marketing Initiatives | | | 13.600 | |
| Recovery for Communities - Community Infrastructure | | | 366.533 | |
| Active Transportation - Connections, Road Widening and Maintenance | | | 16.675 | |
| Air Access Grants | | | 15.750 | |
| COVID-19 Community Economic Recovery Infrastructure Program | | | 100.000 | |
| Highways Climate Change Adaptation | | | 20.700 | |
| Anacla/Bamfield Economic Recovery Initiative | | | 25.700 | |
| Intercity Bus Grants | | | 10.750 | |
| Investing in Canada Infrastructure Program | | | 41.188 | |
| Regional/ Local Airports Medivac Grants | | | 16.500 | |
Budget and Fiscal Plan - 2021/22 to 2023/24
119
2020/21 Updated Financial Forecast (Third Quarterly Report)
| Economic Recovery Category and Measures | | Allocation ($M) |
| Regional Port Enhancement Program | | | 40.000 | |
| Remote and Rural Community Access Program | | | 25.650 | |
| Species and Ecosystems Conservation and Restoration | | | 10.215 | |
| Shoreline Clean-up, Derelict Vessel and Illegal Dumping Clean-Up | | | 14.830 | |
| Tulsequah Chief Mine Remediation | | | 1.575 | |
| Watershed Initiative and Wetlands Projects (Watersheds B.C.) | | | 27.000 | |
| Recovery for Communities - Social Supports | | | 133.760 | |
| Arts and Culture Resilience Plan | | | 35.000 | |
| Child Care Spaces and Safety Grants | | | 98.760 | |
| Building for a Better Future - Food Security and Farming | | | 29.540 | |
| Agritech | | | 7.500 | |
| Expanding B.C.’s Food Hub | | | 5.600 | |
| Increasing B.C. Food Production and Processing | | | 1.950 | |
| Invasive Species Detection and Removal | | | 12.000 | |
| New Entrant Land Matching Program and Provincial Replant Program | | | 0.890 | |
| On-Farm Innovation Top-Up Program | | | 1.600 | |
| Building for a Better Future - Self-Resilience | | | 188.750 | |
| Building Innovation Fund Recapitalization | | | 8.000 | |
| Centre for Innovation and Clean Energy2 | | | 0.000 | |
| Commercial Vehicle Innovation Challenge | | | 30.000 | |
| Convert Underperforming Forests | | | 5.000 | |
| Go Electric Specialty Use Vehicle Incentive Program | | | 31.000 | |
| Mass Timber Demonstration Projects | | | 3.000 | |
| Property Assessed Clean Energy (PACE) Roadmap and Pilot Program | | | 0.500 | |
| Recycled Plastics Manufacturing Stimulus | | | 5.000 | |
| Technology & Innovation – Connectivity | | | 90.000 | |
| Value Added Manufacturing and Supply Chains | | | 16.250 | |
| Vote 52 Operating Total | | | 1,410.097 | |
| CRF Capital Measures – Community Infrastructure | | | 7.400 | |
| BC Parks Stimulus Proposal – Capital Construction Projects | | | 5.000 | |
| Remote and Rural Roads Access | | | 2.400 | |
| Total Economic Recovery Spending | | | 1,417.497 | |
| 1 | The Small and Medium Sized Business Program has a total program allocation of $345 million, with the application period extended until August 31, 2021. The spending forecast for this program is $150 million in 2020/21 and $195 million in 2021/22. |
| 2 | The $35 million allocated for the Centre for Innovation and Clean Energy has been included in the budget for 2021/22 due to changes in the implementation timelines. |
Budget and Fiscal Plan - 2021/22 to 2023/24
120
2020/21 Updated Financial Forecast (Third Quarterly Report)
Vote 53 Federal-Provincial Pandemic Contingencies
Municipalities ($270 million provincial and $270 million federal funding for a total of $540 million): Funding to local governments in response to revenue loss and additional service needs, such as increased funding to address homelessness and community safety, as a result of COVID-19.
Transit ($540 million provincial and $540 million federal funding for a total of $1.08 billion): Funding to BC Transit, TransLink and BC Ferries in response to revenue loss and additional service needs as a result of COVID-19.
Statutory Spending, Tax and Other Relief Measures
Reduced school tax for commercial properties for the 2020 calendar year ($714 million): Reduced the school property tax rate for commercial properties (property classes 4, 5, 6, 7, and 8) to achieve an average 25 per cent reduction in the total property tax bill for most businesses for the 2020 calendar year.
ICBC COVID-19 Customer Premium Rebate ($600 million): ICBC customers will receive one-time rebates averaging $190 this spring as part of the $600 million that was saved due to a major decrease in crashes and costs during the COVID-19 pandemic. Most customers who had an active policy from April 1 to September 30, 2020, will be eligible, with their rebate amount based on a portion of what they paid for coverage during that period.
B.C. Climate Action Tax Credit one-time enhancement ($500 million): Approximately 80 per cent of British Columbians benefited from a one-time enhancement to the B.C. Climate Action Tax Credit in July 2020 with up to $174.50 for adults and up to $51.25 per child. With this enhancement and the regular credit amount, an eligible family of four received a combined payment of up to $564 and eligible individuals received a combined payment up to $218. This boosts the regular Climate Action Tax Credit payment by up to $112.50 per family of four and by up to$ 43.50 per adult.
Temporary PST Rebate on Select Machinery and Equipment ($470 million): Effective September 17, 2020, eligible businesses will receive a 100 per cent PST rebate on select machinery and equipment. This program will run for one year, ending on September 30, 2021. This will support businesses to pivot operations to meet provincial health orders and adjust to a post-COVID economy.
Pandemic Pay for Frontline Workers ($384 million): A federal-provincial cost-shared program to provide a one-time temporary wage boost for health, social services and corrections employees delivering in-person, front-line care during the COVID-19 pandemic. Pandemic pay is anticipated to benefit over 250,000 front-line workers in health and social services by providing an hourly wage boost over the 16-week period starting on March 15, 2020, during the height of the Province’s initial response to the pandemic.
Budget and Fiscal Plan - 2021/22 to 2023/24
121
2020/21 Updated Financial Forecast (Third Quarterly Report)
Delays to the planned increase in the carbon tax rate and delays in the effective date of other new tax measures ($268 million): Postponing the scheduled April 1, 2020 increase to the carbon tax rate and delaying the July 1, 2020 implementation of the PST on sweetened, carbonated drinks and change to PST registration requirements to April 1, 2021.
Housing Priority Initiatives (HPI) Special Account hotel purchases ($196 million): To provide temporary housing for those formerly living in the encampments in Oppenheimer Park, Pandora Avenue, Topaz Park, and other Victoria and Vancouver encampments. As of February 28, 2021, the Province has purchased 4 hotels:
| • | Comfort Inn (Victoria) – approx. $19.6 million |
| • | Paul’s Motor Inn (Victoria) – approx. $14.5 million |
| • | Howard Johnson Hotel (Vancouver) – approx. $56.9 million |
| • | Buchan Hotel (Vancouver) – approx. $19.7 million |
The Province also continues to pursue other properties to support resolving encampments in Victoria and Vancouver. Statutory spending under the HPI special account for the hotels (and related closing costs) will support temporary housing for those formerly living in the encampments in the short and medium term while a permanent long-term housing plan is under development.
Emergency Program Act (EPA) – COVID-19 related costs ($68 million):
Under the EPA, the Province anticipates statutory spending above the voted allocation to manage emergency costs within scope of the act. This includes an estimated $44 million for COVID-19 related emergency management costs such as costs related to managing emergency operations centres to support provincial, regional and local coordination, and emergency measures to support returning travellers and temporary foreign workers with self-isolation requirements.
Wholesale pricing for liquor licenses ($31 million):
Wholesale pricing that will allow liquor licensees, such as restaurants, bars and tourism operators, to purchase beer, wine and spirits at reduced cost from the end of July 2020 to March 31, 2021. This measure has now been extended permanently.
ICBC temporary fee relief measures ($17 million): Temporary relief measures to August 2020 which included:
| • | Waiving the $30 fee for cancelled insurance |
| • | Waiving the $18 plating fee for reinstating a vehicle policy |
| • | Suspension of insurance for fleet vehicle customers |
Forest Enhancement Society ($11 million): Revised spending targets for the Forest Enhancement Society to ensure that its tree planting continues as planned to secure future economic and environmental benefits while meeting the new COVID-19 related guidelines for industrial camps.
Budget and Fiscal Plan - 2021/22 to 2023/24
122
2020/21 Updated Financial Forecast (Third Quarterly Report)
Columbia Basin Trust Regional Grants ($5 million): To support the Province’s response to the impacts of the COVID-19 pandemic , the Columbia Basin Trust increased its spending on regional grants by allocating its 2020/21 forecasted net income surplus of $5 million on new regional grants to support enhancements to internet connectivity, affordable housing, business supports, and outdoor spaces.
Commercial Recreation Tenures and Permits Financial Relief ($3 million): Financial relief for rent owing for Land Act commercial recreation tenures, adventure guides, and commercial recreation park use permits under the Park Act to support tourism operators experiencing financial hardship due to the COVID-19 pandemic.
Fee Relief for the Gaming Sector ($2 million): Waives the fee obligation for gaming services facilities providers and their senior officials to pay one anniversary fee in light of year-long facility closures.
Temporary Deferral Measures
Six-month moratorium on student loan collection ($73 million in deferrals): Starting March 30, 2020, all B.C. student loan repayments were automatically frozen until September 30, 2020.
BC Hydro bill deferrals for industrial customers and other relief measures ($104 million): Qualifying major industrial customers, like pulp and paper mills and mines, were able to defer 50 per cent of their bill payments for six months, to the end of August 2020. In addition, the industrial relief includes bill relief to certain large industrial customers in the form of reduced demand charges. BC Hydro also provided bill relief and credit to residential and commercial customers.
Stumpage Fee Deferrals ($2 million): To support companies with financial liquidity while navigating through the COVID-19 crisis, a stumpage fee deferral was available to holders of tree farm licenses, replaceable forest licenses and First Nations woodlands license. The deferral period was for 3 months (May 1, 2020 to July 31, 2020) and interest accrued on any outstanding balances that carried through the deferral period. The revenue deferred from this program was estimated at $2 million and has since been repaid.
Postponing municipal remittance date for school taxes to the end of the 2020 calendar year (over $1 billion in deferrals): Delayed the remittances from the summer to the end of the year to provide significant relief to local governments facing cash flow issues.
Extending tax filing and payment deadlines (over $5 billion in deferrals): Provided administrative relief to businesses by postponing the filing and payment date by six months for PST, municipal and regional district tax on short-term accommodation, tobacco tax, motor fuel tax, and carbon tax; and until April 1, 2021 for the employer health tax instalment payment deadlines.
For more details, visit: https://www2.gov.bc.ca/gov/content/safety/emergency- preparedness-response-recovery/covid-19-provincial-support
Budget and Fiscal Plan - 2021/22 to 2023/24
123
2020/21 Updated Financial Forecast (Third Quarterly Report)
Table 4.3 2020/21 Capital Spending Update
| | | ($ millions) | |
| 2020/21 capital spending at Budget 2020 | | | 10,535 | | | | | | | | | | | | 10,535 | |
| 2020/21 capital spending at the First Quarterly Report | | | | | | | 10,387 | | | | | | | | | |
| 2020/21 capital spending at the Fall 2020 Economic & Fiscal Update | | | | | | | | | | | 10,146 | | | | | |
| | | | | | | | | | | | | | | | | |
| | | Q1
Update | | | Fall.2020
Update | | | Q3
Update | | | Total
Changes | |
| Taxpayer-supported changes: | | | | | | | | | | | | | | | | |
| Timing of school district spending | | | 49 | | | | (40 | ) | | | (31 | ) | | | (22 | ) |
| Timing of post-secondary institution spending | | | (26 | ) | | | 8 | | | | (28 | ) | | | (46 | ) |
| Timing of health authority spending | | | (52 | ) | | | (117 | ) | | | (160 | ) | | | (329 | ) |
| Timing of transportation sector spending | | | (210 | ) | | | (29 | ) | | | (176 | ) | | | (415 | ) |
| Timing of social housing spending | | | 124 | | | | (26 | ) | | | 3 | | | | 101 | |
| Other net adjustments to capital schedules | | | 4 | | | | (30 | ) | | | (112 | ) | | | (138 | ) |
| Total taxpayer-supported | | | (111 | ) | | | (234 | ) | | | (504 | ) | | | (849 | ) |
| | | | | | | | | | | | | | | | | |
| Self-supported changes: | | | | | | | | | | | | | | | | |
| Liquor Distribution Branch - project schedules | | | (32 | ) | | | (7 | ) | | | (1 | ) | | | (40 | ) |
| BC Hydro Site C project | | | — | | | | 5 | | | | 476 | | | | 481 | |
| ICBC | | | — | | | | (3 | ) | | | (6 | ) | | | (9 | ) |
| BC Lottery Corporation | | | — | | | | | | | | (16 | ) | | | (16 | ) |
| Lower other spending | | | (5 | ) | | | (2 | ) | | | (6 | ) | | | (13 | ) |
| Total self-supported | | | (37 | ) | | | (7 | ) | | | 447 | | | | 403 | |
| Total changes | | | (148 | ) | | | (241 | ) | | | (57 | ) | | | (446 | ) |
| 2020/21 capital spending at the First Quarterly Report | | | 10,387 | | | | | | | | | | | | | |
| 2020/21 capital spending at the Fall 2020 Economic & Fiscal Update | | | | | | | 10,146 | | | | | | | | | |
| 2020/21 capital spending at the Third Quarterly Report | | | | | | | | | | | 10,089 | | | | 10,089 | |
Provincial Capital Spending
Capital spending is projected to total $10.1 billion in 2020/21 — $57 million lower than the forecast in the Fall 2020 Economic & Fiscal Update (see Table 4.3).
The forecast for taxpayer-supported capital spending is $504 million lower than in the Fall 2020 Economic & Fiscal Update, mainly due to changes in the timing of capital project spending in the health and transportation sectors, and timing of maintenance and acquisition of core government assets.
Self-supported capital spending is expected to be $447 million higher than the forecast in the Fall 2020 Economic & Fiscal Update, primarily due to higher capital spending by BC Hydro, which is partially offset by lower capital spending in the other commercial Crown corporations.
Budget and Fiscal Plan - 2021/22 to 2023/24
124
2020/21 Updated Financial Forecast (Third Quarterly Report)
Table 4.4 2020/21 Provincial Debt Update
| | | ($ millions) | |
| 2020/21 provincial debt forecast at Budget 2020 | | | 76,392 | | | | | | | | | | | | 76,392 | |
| 2020/21 provincial debt forecast at the First Quarterly Report | | | | | | | 87,870 | | | | | | | | | |
| 2020/21 provincial debt forecast at the Fall 2020 Economic & Fiscal Update | | | | | | | | | | | 88,626 | | | | | |
| | | | | | | | | | | | | | | | | |
| | | Q1 | | | Fall 2020 | | | Q3 | | | Total | |
| | | Update | | | Update | | | Update | | | Changes | |
| Taxpayer-supported changes: | | | | | | | | | | | | | | | | |
| Higher debt level from 2019/20 | | | 1,660 | | | | — | | | | — | | | | 1,660 | |
| Change in operating results (before forecast allowance) | | | 12,319 | | | | 851 | | | | (4,499 | ) | | | 8,671 | |
| Increase in cash and temporary investments | | | 1,342 | | | | 220 | | | | 643 | | | | 2,205 | |
| Changes in other assets | | | (2,508 | ) | | | (101 | ) | | | 1,919 | | | | (690 | ) |
| Changes in accounts payable and deferred revenue | | | (2,183 | ) | | | (38 | ) | | | 1,972 | | | | (249 | ) |
| Higher capital contributions from external parties | | | 81 | | | | 46 | | | | (115 | ) | | | 12 | |
| Lower capital spending | | | (111 | ) | | | (234 | ) | | | (504 | ) | | | (849 | ) |
| Total taxpayer-supported | | | 10,600 | | | | 744 | | | | (584 | ) | | | 10,760 | |
| | | | | | | | | | | | | | | | | |
| Self-supported changes: | | | | | | | | | | | | | | | | |
| Higher debt level from 2019/20 | | | 163 | | | | — | | | | — | | | | 163 | |
| Higher capital spending | | | (37 | ) | | | (7 | ) | | | 447 | | | | 403 | |
| Changes in internal financing | | | 52 | | | | 19 | | | | (3 | ) | | | 68 | |
| Total self-supported | | | 178 | | | | 12 | | | | 444 | | | | 634 | |
| | | | | | | | | | | | | | | | | |
| Forecast allowance increase (decrease) | | | 700 | | | | — | | | | (1,000 | ) | | | (300 | ) |
| | | | | | | | | | | | | | | | | |
| Total changes | | | 11,478 | | | | 756 | | | | (1,140 | ) | | | 11,094 | |
| | | | | | | | | | | | | | | | | |
| 2020/21 provincial debt forecast at the First Quarterly Report | | | 87,870 | | | | | | | | | | | | | |
| 2020/21 provincial debt forecast at the Fall 2020 Economic & Fiscal Update | | | | | | | 88,626 | | | | | | | | | |
| 2020/21 provincial debt forecast at the Third Quarterly Report | | | | | | | | | | | 87,486 | | | | 87,486 | |
Provincial Debt
The provincial debt is projected to total $87.5 billion by the end of the fiscal year — $11.1 billion higher than the projection at Budget 2020, and $1.1 billion lower from the projection in the Fall 2020 Economic & Fiscal Update.
Taxpayer-supported debt is projected to be $60.0 billion — $10.8 billion higher than the projection at Budget 2020. The forecast is $584 million lower than at the Fall 2020 Economic & Fiscal Update mainly due to improved operating results, partially offset by changes in working capital balances.
Self-supported debt is projected to be $27.5 billion — $634 million higher than the projection at Budget 2020, and $444 million higher than at the Fall 2020 Economic & Fiscal Update mainly due to higher capital spending.
The $1 billion forecast allowance from the Fall 2020 Economic & Fiscal Update has been removed to mirror the operating statement forecast allowance.
Details on changes in provincial debt by quarter are shown in Table 4.4.
Budget and Fiscal Plan - 2021/22 to 2023/24
125
2020/21 Updated Financial Forecast (Third Quarterly Report)
Risks to the Fiscal Forecast
Although the publication date for Budget 2021 is after the fiscal year end of March 31, the fiscal forecast for 2020/21 is based on information obtained from ministries, agencies, and other sources in February, and does not constitute final results. However, the range of potential change to the current forecast is expected to be low, and does not necessitate maintaining an amount for forecast allowance.
The forecasts of revenues, expenditures, capital spending and debt are estimates based on multiple economic, financial and external factors. In addition, capital spending and debt figures may be influenced by several factors including design development, procurement activity, weather, geotechnical conditions and interest rates. As a result, the actual operating surplus, capital expenditure and debt figures may differ from the current forecast.
Revenues can be volatile due in part to the influence of the cyclical nature of the natural resource sector in the economy. Changes in energy or commodity prices, such as natural gas and lumber, may have a significant effect on revenue and the fiscal forecast.
The spending forecast in the fiscal plan is based on ministry and service delivery agency plans and strategies. The main risks are changes to planning assumptions, such as utilization or demand rates for government services in the health care, education, or community social services sectors, and costs associated with natural disaster responses.
Supplementary Schedules
The following tables provide the financial results for the nine months ended December 31, 2020, and the 2020/21 full-year forecast.
Budget and Fiscal Plan - 2021/22 to 2023/24
126
2020/21 Updated Financial Forecast (Third Quarterly Report)
Table 4.5 2020/21 Operating Statement
| | | Year-to-Date to December 31 | | | Full Year | |
| | | 2020/21 | | | Actual | | | 2020/21 | | | Actual | |
| ($ millions) | | Budget | | | Actual | | | Variance | | | 2019/20 | | | Budget | | | Forecast | | | Variance | | | 2019/20 | |
| Revenue | | | 44,532 | | | | 44,564 | | | | 32 | | | | 43,403 | | | | 60,585 | | | | 60,967 | | | | 382 | | | | 58,660 | |
| Expense | | | (42,745 | ) | | | (47,161 | ) | | | (4,416 | ) | | | (42,215 | ) | | | (60,058 | ) | | | (69,111 | ) | | | (9,053 | ) | | | (58,981 | ) |
| Surplus (deficit) before forecast allowance | | | 1,787 | | | | (2,597 | ) | | | (4,384 | ) | | | 1,188 | | | | 527 | | | | (8,144 | ) | | | (8,671 | ) | | | (321 | ) |
| Forecast allowance | | | — | | | | — | | | | — | | | | — | | | | (300 | ) | | | — | | | | 300 | | | | — | |
| Surplus (deficit) | | | 1,787 | | | | (2,597 | ) | | | (4,384 | ) | | | 1,188 | | | | 227 | | | | (8,144 | ) | | | (8,371 | ) | | | (321 | ) |
| Accumulated surplus beginning of the year | | | 8,754 | | | | 8,106 | | | | (648 | ) | | | 8,427 | | | | 8,754 | | | | 8,106 | | | | (648 | ) | | | 8,427 | |
| Accumulated surplus (deficit) before comprehensive income | | | 10,541 | | | | 5,509 | | | | (5,032 | ) | | | 9,615 | | | | 8,981 | | | | (38 | ) | | | (9,019 | ) | | | 8,106 | |
| Accumulated other comprehensive income from self-supported Crown agencies | | | 725 | | | | 965 | | | | 241 | | | | 110 | | | | 65 | | | | 1,361 | | | | 1,296 | | | | (224 | ) |
| Accumulated surplus (deficit) end of period | | | 11,266 | | | | 6,474 | | | | (4,792 | ) | | | 9,725 | | | | 9,046 | | | | 1,323 | | | | (7,723 | ) | | | 7,882 | |
Budget and Fiscal Plan - 2021/22 to 2023/24
127
2020/21 Updated Financial Forecast (Third Quarterly Report)
Table 4.6 2020/21 Revenue by Source
| | | Year-to-Date to December 31 | | | Full Year | |
| | | 2020/21 | | | Actual | | | 2020/21 | | | Actual | |
| ($ millions) | | Budget | | | Actual | | | Variance | | | 2019/20 | | | Budget | | | Forecast | | | Variance | | | 2019/20 | |
| Taxation | | | | | | | | | | | | | | | | | | | | | | | | | | | | | | | | |
| Personal income | | | 8,731 | | | | 8,142 | | | | (589 | ) | | | 8,091 | | | | 11,771 | | | | 11,118 | | | | (653 | ) | | | 10,657 | |
| Corporate income | | | 3,119 | | | | 3,408 | | | | 289 | | | | 3,043 | | | | 4,739 | | | | 4,807 | | | | 68 | | | | 5,011 | |
| Employer health | | | 1,452 | | | | 1,369 | | | | (83 | ) | | | 1,394 | | | | 1,924 | | | | 1,840 | | | | (84 | ) | | | 1,897 | |
| Sales 1 | | | 6,240 | | | | 5,743 | | | | (497 | ) | | | 5,866 | | | | 7,905 | | | | 7,446 | | | | (459 | ) | | | 7,374 | |
| Fuel | | | 802 | | | | 693 | | | | (109 | ) | | | 783 | | | | 1,024 | | | | 933 | | | | (91 | ) | | | 1,008 | |
| Carbon | | | 1,396 | | | | 1,156 | | | | (240 | ) | | | 1,201 | | | | 1,954 | | | | 1,640 | | | | (314 | ) | | | 1,682 | |
| Tobacco | | | 607 | | | | 577 | | | | (30 | ) | | | 590 | | | | 755 | | | | 720 | | | | (35 | ) | | | 729 | |
| Property | | | 2,249 | | | | 1,709 | | | | (540 | ) | | | 2,033 | | | | 3,026 | | | | 2,324 | | | | (702 | ) | | | 2,608 | |
| Property transfer | | | 1,245 | | | | 1,493 | | | | 248 | | | | 1,235 | | | | 1,586 | | | | 2,000 | | | | 414 | | | | 1,609 | |
| Insurance premium | | | 495 | | | | 495 | | | | — | | | | 469 | | | | 660 | | | | 705 | | | | 45 | | | | 691 | |
| | | | 26,336 | | | | 24,785 | | | | (1,551 | ) | | | 24,705 | | | | 35,344 | | | | 33,533 | | | | (1,811 | ) | | | 33,266 | |
| Natural resources | | | | | | | | | | | | | | | | | | | | | | | | | | | | | | | | |
| Natural gas royalties | | | 152 | | | | 93 | | | | (59 | ) | | | 80 | | | | 207 | | | | 191 | | | | (16 | ) | | | 118 | |
| Forests | | | 608 | | | | 705 | | | | 97 | | | | 707 | | | | 867 | | | | 1,121 | | | | 254 | | | | 988 | |
| Other natural resources 2 | | | 804 | | | | 655 | | | | (149 | ) | | | 922 | | | | 1,075 | | | | 903 | | | | (172 | ) | | | 1,162 | |
| | | | 1,564 | | | | 1,453 | | | | (111 | ) | | | 1,709 | | | | 2,149 | | | | 2,215 | | | | 66 | | | | 2,268 | |
| Other revenue | | | | | | | | | | | | | | | | | | | | | | | | | | | | | | | | |
| Medical Services Plan premiums | | | — | | | | — | | | | — | | | | 1,065 | | | | — | | | | (4 | ) | | | (4 | ) | | | 1,063 | |
| Post-secondary education fees | | | 1,747 | | | | 1,604 | | | | (143 | ) | | | 1,661 | | | | 2,578 | | | | 2,485 | | | | (93 | ) | | | 2,451 | |
| Other fees and licenses 3 | | | 1,545 | | | | 1,373 | | | | (172 | ) | | | 1,532 | | | | 2,089 | | | | 1,961 | | | | (128 | ) | | | 2,058 | |
| Investment earnings | | | 935 | | | | 929 | | | | (6 | ) | | | 897 | | | | 1,247 | | | | 1,205 | | | | (42 | ) | | | 1,263 | |
| Miscellaneous 4 | | | 2,763 | | | | 2,354 | | | | (409 | ) | | | 2,625 | | | | 3,798 | | | | 3,151 | | | | (647 | ) | | | 3,838 | |
| | | | 6,990 | | | | 6,260 | | | | (730 | ) | | | 7,780 | | | | 9,712 | | | | 8,798 | | | | (914 | ) | | | 10,673 | |
| Contributions from the federal government | | | | | | | | | | | | | | | | | | | | | | | | | | | | | | | | |
| Health and social transfers | | | 5,762 | | | | 5,799 | | | | 37 | | | | 5,570 | | | | 7,683 | | | | 8,285 | | | | 602 | | | | 7,494 | |
| COVID-19 related funding | | | — | | | | 1,783 | | | | 1,783 | | | | — | | | | — | | | | 2,616 | | | | 2,616 | | | | — | |
| Other federal government contributions 5 | | | 1,447 | | | | 1,553 | | | | 106 | | | | 1,257 | | | | 2,280 | | | | 2,459 | | | | 179 | | | | 2,041 | |
| | | | 7,209 | | | | 9,135 | | | | 1,926 | | | | 6,827 | | | | 9,963 | | | | 13,360 | | | | 3,397 | | | | 9,535 | |
| Commercial Crown corporation net income | | | | | | | | | | | | | | | | | | | | | | | | | | | | | | | | |
| BC Hydro | | | 301 | | | | 309 | | | | 8 | | | | 293 | | | | 712 | | | | 691 | | | | (21 | ) | | | 705 | |
| Liquor Distribution Branch | | | 905 | | | | 929 | | | | 24 | | | | 879 | | | | 1,134 | | | | 1,151 | | | | 17 | | | | 1,107 | |
| BC Lottery Corporation 6 | | | 1,010 | | | | 301 | | | | (709 | ) | | | 1,062 | | | | 1,363 | | | | 383 | | | | (980 | ) | | | 1,336 | |
| ICBC 7 | | | 125 | | | | 1,265 | | | | 1,140 | | | | 20 | | | | 86 | | | | 709 | | | | 623 | | | | (376 | ) |
| Other 8 | | | 92 | | | | 127 | | | | 35 | | | | 128 | | | | 122 | | | | 127 | | | | 5 | | | | 146 | |
| | | | 2,433 | | | | 2,931 | | | | 498 | | | | 2,382 | | | | 3,417 | | | | 3,061 | | | | (356 | ) | | | 2,918 | |
| Total revenue | | | 44,532 | | | | 44,564 | | | | 32 | | | | 43,403 | | | | 60,585 | | | | 60,967 | | | | 382 | | | | 58,660 | |
| 1 | Includes provincial sales tax and social services tax/hotel room tax related to prior years. |
| 2 | Columbia River Treaty, other energy and minerals, water rental and other resources. |
| 3 | Healthcare-related, motor vehicle, and other fees. |
| 4 | Includes reimbursements for health care and other services provided to external agencies, and other recoveries. |
| 5 | Includes contributions for health, education, community development, housing and social service programs, and transportation projects. |
| 6 | Net of payments to the federal government. |
| 7 | Year-to-date results do not include the COVID-19 rebate (estimated $600 million), which is included in the full-year forecast. |
| 8 | Includes Columbia Power Corporation, BC Railway Company, Columbia Basin power projects, and post-secondary institutions’ self-supported subsidiaries. |
Budget and Fiscal Plan - 2021/22 to 2023/24
128
2020/21 Updated Financial Forecast (Third Quarterly Report)
Table 4.7 2020/21 Expense by Ministry, Program and Agency
| | | Year-to-Date to December 31 | | | Full Year | |
| | | 2020/21 | | | Actual | | | 2020/21 | | | Actual | |
| ($ millions) | | Budget 1 | | | Actual 1 | | | Variance | | | 2019/20 1 | | | Budget 1 | | | Forecast | | | Variance | | | 2019/20 1 | |
| Office of the Premier | | | 9 | | | | 8 | | | | (1 | ) | | | 10 | | | | 11 | | | | 11 | | | | — | | | | 12 | |
| Advanced Education and Skills Training | | | 1,784 | | | | 1,770 | | | | (14 | ) | | | 1,806 | | | | 2,366 | | | | 2,366 | | | | — | | | | 2,331 | |
| Agriculture, Food and Fisheries | | | 70 | | | | 93 | | | | 23 | | | | 76 | | | | 95 | | | | 95 | | | | — | | | | 112 | |
| Attorney General | | | 906 | | | | 860 | | | | (46 | ) | | | 872 | | | | 1,154 | | | | 1,154 | | | | — | | | | 1,192 | |
| Children and Family Development | | | 1,646 | | | | 1,498 | | | | (148 | ) | | | 1,540 | | | | 2,229 | | | | 2,229 | | | | — | | | | 2,148 | |
| Citizens’ Services | | | 405 | | | | 522 | | | | 117 | | | | 433 | | | | 552 | | | | 552 | | | | — | | | | 598 | |
| Education | | | 5,017 | | | | 5,074 | | | | 57 | | | | 4,889 | | | | 6,695 | | | | 6,694 | | | | (1 | ) | | | 6,627 | |
| Energy, Mines and Low Carbon Innovation | | | 92 | | | | 67 | | | | (25 | ) | | | 102 | | | | 114 | | | | 114 | | | | — | | | | 251 | |
| Environment and Climate Change Strategy | | | 163 | | | | 214 | | | | 51 | | | | 198 | | | | 245 | | | | 261 | | | | 16 | | | | 244 | |
| Finance | | | 624 | | | | 953 | | | | 329 | | | | 565 | | | | 839 | | | | 1,768 | | | | 929 | | | | 1,368 | |
| Forests, Lands, Natural Resource Operations and Rural Development | | | 568 | | | | 678 | | | | 110 | | | | 669 | | | | 844 | | | | 929 | | | | 85 | | | | 958 | |
| Health | | | 16,438 | | | | 16,179 | | | | (259 | ) | | | 15,436 | | | | 22,190 | | | | 22,190 | | | | — | | | | 20,825 | |
| Indigenous Relations and Reconciliation | | | 64 | | | | 92 | | | | 28 | | | | 151 | | | | 97 | | | | 97 | | | | — | | | | 353 | |
| Jobs, Economic Recovery and Innovation | | | 63 | | | | 49 | | | | (14 | ) | | | 61 | | | | 78 | | | | 78 | | | | — | | | | 82 | |
| Labour | | | 13 | | | | 13 | | | | — | | | | 12 | | | | 17 | | | | 17 | | | | — | | | | 16 | |
| Mental Health and Addictions | | | 7 | | | | 5 | | | | (2 | ) | | | 5 | | | | 10 | | | | 10 | | | | — | | | | 23 | |
| Municipal Affairs | | | 128 | | | | 150 | | | | 22 | | | | 285 | | | | 147 | | | | 147 | | | | — | | | | 717 | |
| Public Safety and Solicitor General | | | 650 | | | | 702 | | | | 52 | | | | 672 | | | | 871 | | | | 992 | | | | 121 | | | | 989 | |
| Social Development and Poverty Reduction | | | 2,751 | | | | 2,752 | | | | 1 | | | | 2,656 | | | | 3,682 | | | | 3,682 | | | | — | | | | 3,568 | |
| Tourism, Arts, Culture and Sport | | | 132 | | | | 131 | | | | (1 | ) | | | 119 | | | | 159 | | | | 159 | | | | — | | | | 182 | |
| Transportation and Infrastructure | | | 693 | | | | 695 | | | | 2 | | | | 681 | | | | 929 | | | | 929 | | | | — | | | | 920 | |
| Total ministries and Office of the Premier | | | 32,223 | | | | 32,505 | | | | 282 | | | | 31,238 | | | | 43,324 | | | | 44,474 | | | | 1,150 | | | | 43,516 | |
| Management of public funds and debt | | | 900 | | | | 944 | | | | 44 | | | | 932 | | | | 1,197 | | | | 1,248 | | | | 51 | | | | 1,234 | |
| Contingencies | | | — | | | | — | | | | — | | | | — | | | | 1,066 | | | | 736 | | | | (330 | ) | | | — | |
| Pandemic and Recovery Contingencies - Vote 52 2,4 | | | — | | | | 3,845 | | | | 3,845 | | | | — | | | | — | | | | 6,700 | | | | 6,700 | | | | — | |
| Pandemic and Recovery Contingencies - Vote 53 3,4 | | | — | | | | 405 | | | | 405 | | | | — | | | | — | | | | 810 | | | | 810 | | | | — | |
| Funding for capital expenditures | | | 1,560 | | | | 1,188 | | | | (372 | ) | | | 987 | | | | 2,789 | | | | 2,192 | | | | (597 | ) | | | 1,653 | |
| Refundable tax credit transfers | | | 1,217 | | | | 1,678 | | | | 461 | | | | 1,218 | | | | 1,686 | | | | 2,367 | | | | 681 | | | | 1,413 | |
| Legislative Assembly and other appropriations | | | 121 | | | | 148 | | | | 27 | | | | 106 | | | | 166 | | | | 234 | | | | 68 | | | | 150 | |
| Total appropriations | | | 36,021 | | | | 40,713 | | | | 4,692 | | | | 34,481 | | | | 50,228 | | | | 58,761 | | | | 8,533 | | | | 47,966 | |
| Elimination of transactions between | | | | | | | | | | | | | | | | | | | | | | | | | | | | | | | | |
| appropriations 5 | | | (5 | ) | | | (11 | ) | | | (6 | ) | | | (15 | ) | | | (20 | ) | | | (15 | ) | | | 5 | | | | (20 | ) |
| Prior year liability adjustments | | | — | | | | — | | | | — | | | | — | | | | — | | | | (80 | ) | | | (80 | ) | | | (126 | ) |
| Consolidated revenue fund expense | | | 36,016 | | | | 40,702 | | | | 4,686 | | | | 34,466 | | | | 50,208 | | | | 58,666 | | | | 8,458 | | | | 47,820 | |
| Expenses recovered from external entities | | | 2,274 | | | | 2,691 | | | | 417 | | | | 2,532 | | | | 3,335 | | | | 4,335 | | | | 1,000 | | | | 3,850 | |
| Elimination of funding provided to service delivery agencies | | | (23,043 | ) | | | (24,092 | ) | | | (1,049 | ) | | | (20,993 | ) | | | (30,813 | ) | | | (33,891 | ) | | | (3,078 | ) | | | (28,928 | ) |
| Total direct program spending | | | 15,247 | | | | 19,301 | | | | 4,054 | | | | 16,005 | | | | 22,730 | | | | 29,110 | | | | 6,380 | | | | 22,742 | |
| Service delivery agency expense | | | | | | | | | | | | | | | | | | | | | | | | | | | | | | | | |
| School districts | | | 5,063 | | | | 4,980 | | | | (83 | ) | | | 4,991 | | | | 7,080 | | | | 7,535 | | | | 455 | | | | 6,995 | |
| Universities | | | 3,878 | | | | 3,761 | | | | (117 | ) | | | 3,754 | | | | 5,457 | | | | 5,368 | | | | (89 | ) | | | 5,252 | |
| Colleges and institutes | | | 1,071 | | | | 1,024 | | | | (47 | ) | | | 1,040 | | | | 1,464 | | | | 1,456 | | | | (8 | ) | | | 1,465 | |
| Health authorities and hospital societies | | | 13,314 | | | | 13,755 | | | | 441 | | | | 12,528 | | | | 17,425 | | | | 19,371 | | | | 1,946 | | | | 17,038 | |
| Other service delivery agencies | | | 4,172 | | | | 4,340 | | | | 168 | | | | 3,897 | | | | 5,902 | | | | 6,271 | | | | 369 | | | | 5,489 | |
| Total service delivery agency expense | | | 27,498 | | | | 27,860 | | | | 362 | | | | 26,210 | | | | 37,328 | | | | 40,001 | | | | 2,673 | | | | 36,239 | |
| Total expense | | | 42,745 | | | | 47,161 | | | | 4,416 | | | | 42,215 | | | | 60,058 | | | | 69,111 | | | | 9,053 | | | | 58,981 | |
| 1 | Restated to reflect government’s current organization and accounting policies as of December 31, 2020. |
| 2 | On March 23, 2020, the Legislative Assembly passed Supplementary Estimates of $5 billion to establish a new Vote 52 - Contingencies (All Ministries): Pandemic Response and Economic Recovery. An additional $2 billion in appropriation was authorized on December 17, 2020 to fund further COVID-19 measures. |
| 3 | On August 14, 2020, the Legislative Assembly passed Supplementary Estimates No. 2 of $1 billion to establish a new Vote 53 - Contingencies (All Ministries): Federal and Provincial Pandemic Support. The forecast reflects the provincial portion of the federal-provincial cost-shared investments under the Safe Restart Agreement. |
| 4 | As of December 31, 2020, COVID-19 spending funded by Vote 52 is as follows (by ministry): $1,490 million Finance - B.C. Emergency Benefits for Workers; $992 million Health; $642 million Social Development and Poverty Reduction; $296 million Children and Family Development; $191 million Attorney General (Housing); $234 million other ministries. Additional COVID-19 spending include: $405 million from Vote 53 and $176 million from the base budgets of various ministries; bringing the total Q3 actual COVID-19 spending to $4.426 billion. |
| 5 | Reflects payments made under an agreement where an expense from a voted appropriation is recorded as revenue by a special account. |
Budget and Fiscal Plan - 2021/22 to 2023/24
129
2020/21 Updated Financial Forecast (THIRD QUARTERLY REPORT)
Table 4.8 2020/21 Expense by Function
| | | Year-to-Date to December 31 | | | Full Year | |
| | | 2020/21 | | | Actual | | | 2020/21 | | | Actual | |
| ($ millions) | | Budget | | | Actual | | | Variance | | | 2019/20 | | | Budget | | | Forecast | | | Variance | | | 2019/20 | |
| Health: | | | | | | | | | | | | | | | | | | | | | | | | | | | | | | | | |
| Medical Services Plan | | | 3,687 | | | | 3,746 | | | | 59 | | | | 3,712 | | | | 5,275 | | | | 5,275 | | | | — | | | | 5,013 | |
| Pharmacare | | | 1,247 | | | | 1,090 | | | | (157 | ) | | | 1,177 | | | | 1,561 | | | | 1,561 | | | | — | | | | 1,517 | |
| Regional services | | | 12,720 | | | | 12,222 | | | | (498 | ) | | | 12,029 | | | | 16,541 | | | | 16,586 | | | | 45 | | | | 16,047 | |
| Other healthcare expenses 1 | | | 435 | | | | 543 | | | | 108 | | | | 428 | | | | 908 | | | | 917 | | | | 9 | | | | 872 | |
| | | | 18,089 | | | | 17,601 | | | | (488 | ) | | | 17,346 | | | | 24,285 | | | | 24,339 | | | | 54 | | | | 23,449 | |
| | | | | | | | | | | | | | | | | | | | | | | | | | | | | | | | | |
| Education: | | | | | | | | | | | | | | | | | | | | | | | | | | | | | | | | |
| Elementary and secondary | | | 5,454 | | | | 5,017 | | | | (437 | ) | | | 5,370 | | | | 7,618 | | | | 8,024 | | | | 406 | | | | 7,582 | |
| Post-secondary | | | 5,108 | | | | 4,807 | | | | (301 | ) | | | 4,943 | | | | 7,125 | | | | 6,982 | | | | (143 | ) | | | 6,842 | |
| Other education expenses 2 | | | 339 | | | | 446 | | | | 107 | | | | 163 | | | | 435 | | | | 432 | | | | (3 | ) | | | 310 | |
| | | | 10,901 | | | | 10,270 | | | | (631 | ) | | | 10,476 | | | | 15,178 | | | | 15,438 | | | | 260 | | | | 14,734 | |
| | | | | | | | | | | | | | | | | | | | | | | | | | | | | | | | | |
| Social services: | | | | | | | | | | | | | | | | | | | | | | | | | | | | | | | | |
| Social assistance 1,2 | | | 1,762 | | | | 1,785 | | | | 23 | | | | 1,740 | | | | 2,363 | | | | 2,441 | | | | 78 | | | | 2,342 | |
| Child welfare 1 | | | 1,626 | | | | 1,442 | | | | (184 | ) | | | 1,469 | | | | 2,239 | | | | 2,232 | | | | (7 | ) | | | 1,940 | |
| Low income tax credit transfers | | | 261 | | | | 232 | | | | (29 | ) | | | 231 | | | | 352 | | | | 884 | | | | 532 | | | | 435 | |
| Community living and other services | | | 938 | | | | 944 | | | | 6 | | | | 893 | | | | 1,247 | | | | 1,225 | | | | (22 | ) | | | 1,170 | |
| | | | 4,587 | | | | 4,403 | | | | (184 | ) | | | 4,333 | | | | 6,201 | | | | 6,782 | | | | 581 | | | | 5,887 | |
| | | | | | | | | | | | | | | | | | | | | | | | | | | | | | | | | |
| Protection of persons and property | | | 1,345 | | | | 1,387 | | | | 42 | | | | 1,400 | | | | 1,817 | | | | 1,954 | | | | 137 | | | | 2,126 | |
| Transportation | | | 1,515 | | | | 1,571 | | | | 56 | | | | 1,446 | | | | 2,228 | | | | 2,172 | | | | (56 | ) | | | 2,126 | |
| Natural resources and economic development | | | 2,071 | | | | 2,195 | | | | 124 | | | | 2,594 | | | | 3,097 | | | | 3,262 | | | | 165 | | | | 3,778 | |
| Other | | | 1,109 | | | | 1,166 | | | | 57 | | | | 1,494 | | | | 2,033 | | | | 2,719 | | | | 686 | | | | 2,501 | |
| Contingencies | | | — | | | | — | | | | — | | | | — | | | | 1,066 | | | | 736 | | | | (330 | ) | | | — | |
| Pandemic and Recovery Contingencies - Vote 52 3,4 | | | — | | | | 3,845 | | | | 3,845 | | | | — | | | | — | | | | 6,700 | | | | 6,700 | | | | — | |
| Pandemic and Recovery Contingencies - Vote 53 5 | | | — | | | | 405 | | | | 405 | | | | — | | | | — | | | | 810 | | | | 810 | | | | — | |
| General government | | | 1,134 | | | | 2,288 | | | | 1,154 | | | | 1,111 | | | | 1,430 | | | | 1,499 | | | | 69 | | | | 1,653 | |
| Debt servicing | | | 1,994 | | | | 2,030 | | | | 36 | | | | 2,015 | | | | 2,723 | | | | 2,700 | | | | (23 | ) | | | 2,727 | |
| | | | | | | | | | | | | | | | | | | | | | | | | | | | | | | | | |
| Total expense | | | 42,745 | | | | 47,161 | | | | 4,416 | | | | 42,215 | | | | 60,058 | | | | 69,111 | | | | 9,053 | | | | 58,981 | |
| 1 | Payments for healthcare services by the Ministry of Social Development and Poverty Reduction the Ministry of Mental Health and Addictions and the Ministry of Children and Family Development made on behalf of their clients are reported in the Health function. |
| 2 | Payments for training costs by the Ministry of Social Development and Poverty Reduction made on behalf of its clients are reported in the Education function. |
| 3 | On March 23, 2020, the Legislative Assembly passed Supplementary Estimates of $5 billion to establish a new Vote 52 - Contingencies (All Ministries): Pandemic Response and Economic Recovery. An additional $2 billion in appropriation was authorized on December 17, 2020 to fund further COVID-19 measures. |
| 4 | As of December 31, 2020, COVID-19 spending funded by Vote 52 is as follows (by function): $1.12 billion in social assistance, $360 million in child welfare $158 million in K-12 education, $9 million in Post-Sec education, $1.059 billion in healthcare, $74 million in economic development, $290 million in general government, $412 million in transportation, $42 million in protection services and $721 million in other services. |
| 5 | On August 14, 2020, the Legislative Assembly passed Supplementary Estimates No. 2 of $1 billion to establish a new Vote 53 - Contingencies (All Ministries): Federal and Provincial Pandemic Support. The forecast reflects the provincial portion of the federal-provincial cost-shared investments under the Safe Restart Agreement. |
Budget and Fiscal Plan - 2021/22 to 2023/24
130
2020/21 Updated Financial Forecast (THIRD QUARTERLY REPORT)
Table 4.9 2020/21 Capital Spending
| | | Year-to-Date to December 31 | | | Full Year | |
| | | 2020/21 | | | Actual | | | 2020/21 | | | Actual | |
| ($ millions) | | Budget | | | Actual | | | Variance | | | 2019/20 | | | Budget | | | Forecast | | | Variance | | | 2019/20 | |
| Taxpayer-supported | | | | | | | | | | | | | | | | | | | | | | | | | | | | | | | | |
| Education | | | | | | | | | | | | | | | | | | | | | | | | | | | | | | | | |
| School districts | | | 721 | | | | 711 | | | | (10 | ) | | | 636 | | | | 994 | | | | 972 | | | | (22 | ) | | | 877 | |
| Post-secondary institutions | | | 605 | | | | 567 | | | | (38 | ) | | | 580 | | | | 977 | | | | 931 | | | | (46 | ) | | | 936 | |
| Health | | | 971 | | | | 597 | | | | (374 | ) | | | 526 | | | | 1,862 | | | | 1,533 | | | | (329 | ) | | | 1,009 | |
| BC Transportation Financing Authority | | | 1,257 | | | | 1,034 | | | | (223 | ) | | | 642 | | | | 1,870 | | | | 1,525 | | | | (345 | ) | | | 955 | |
| BC Transit | | | 103 | | | | 92 | | | | (11 | ) | | | 41 | | | | 184 | | | | 114 | | | | (70 | ) | | | 73 | |
| Government ministries | | | 268 | | | | 194 | | | | (74 | ) | | | 245 | | | | 569 | | | | 435 | | | | (134 | ) | | | 520 | |
| Social housing 1 | | | 422 | | | | 355 | | | | (67 | ) | | | 259 | | | | 578 | | | | 679 | | | | 101 | | | | 355 | |
| Other | | | 57 | | | | 52 | | | | (5 | ) | | | 29 | | | | 92 | | | | 88 | | | | (4 | ) | | | 47 | |
| Total taxpayer-supported | | | 4,404 | | | | 3,602 | | | | (802 | ) | | | 2,958 | | | | 7,126 | | | | 6,277 | | | | (849 | ) | | | 4,772 | |
| | | | | | | | | | | | | | | | | | | | | | | | | | | | | | | | | |
| Self-supported | | | | | | | | | | | | | | | | | | | | | | | | | | | | | | | | |
| BC Hydro | | | 2,376 | | | | 2,383 | | | | 7 | | | | 2,258 | | | | 3,092 | | | | 3,573 | | | | 481 | | | | 3,082 | |
| Columbia Basin power projects 2 | | | 10 | | | | 3 | | | | (7 | ) | | | 994 | | | | 14 | | | | 8 | | | | (6 | ) | | | 994 | |
| BC Railway Company | | | 7 | | | | 1 | | | | (6 | ) | | | 5 | | | | 10 | | | | 3 | | | | (7 | ) | | | 6 | |
| ICBC | | | 68 | | | | 72 | | | | 4 | | | | 40 | | | | 116 | | | | 107 | | | | (9 | ) | | | 62 | |
| BC Lottery Corporation | | | 79 | | | | 31 | | | | (48 | ) | | | 59 | | | | 105 | | | | 89 | | | | (16 | ) | | | 102 | |
| Liquor Distribution Branch | | | 53 | | | | 14 | | | | (39 | ) | | | 24 | | | | 72 | | | | 32 | | | | (40 | ) | | | 36 | |
| Other 3 | | | — | | | | — | | | | — | | | | — | | | | — | | | | — | | | | — | | | | 104 | |
| Total self-supported | | | 2,593 | | | | 2,504 | | | | (89 | ) | | | 3,380 | | | | 3,409 | | | | 3,812 | | | | 403 | | | | 4,386 | |
| | | | | | | | | | | | | | | | | | | | | | | | | | | | | | | | | |
| Total capital spending | | | 6,997 | | | | 6,106 | | | | (891 | ) | | | 6,338 | | | | 10,535 | | | | 10,089 | | | | (446 | ) | | | 9,158 | |
| 1 | Includes BC Housing Management Commission and Provincial Rental Housing Corporation. |
| 2 | Joint ventures of the Columbia Power Corporation and Columbia Basin Trust. |
| 3 | Includes post-secondary institutions’ self-supported subsidiaries. |
Budget and Fiscal Plan - 2021/22 to 2023/24
131
2020/21 Updated Financial Forecast (THIRD QUARTERLY REPORT)
Table 4.10 2020/21 Provincial Debt 1
| | | Year-to-Date to December 31 | | | Full Year | |
| | | 2020/21 | | | Actual | | | 2020/21 | | Actual | |
| ($ millions) | | Budget | | | Actual | | | Variance | | | 2019/20 | | | Budget | | | Forecast | | | Variance | | | 2019/20 | |
| Taxpayer-supported debt | | | | | | | | | | | | | | | | | | | | | | | | | | | | | | | | |
| Provincial government operating | | | — | | | | 7,008 | | | | 7,008 | | | | — | | | | — | | | | 8,799 | | | | 8,799 | | | | — | |
| Other taxpayer-supported debt (mainly capital) | | | | | | | | | | | | | | | | | | | | | | | | | | | | | | | | |
| Education 2 | | | | | | | | | | | | | | | | | | | | | | | | | | | | | | | | |
| Post-secondary institutions | | | 5,659 | | | | 6,272 | | | | 613 | | | | 5,802 | | | | 5,698 | | | | 6,047 | | | | 349 | | | | 5,670 | |
| School districts | | | 9,341 | | | | 10,558 | | | | 1,217 | | | | 9,173 | | | | 9,437 | | | | 10,628 | | | | 1,191 | | | | 9,775 | |
| Total education | | | 15,000 | | | | 16,830 | | | | 1,830 | | | | 14,975 | | | | 15,135 | | | | 16,675 | | | | 1,540 | | | | 15,445 | |
| Health 2 | | | 8,594 | | | | 9,318 | | | | 724 | | | | 8,255 | | | | 8,750 | | | | 9,355 | | | | 605 | | | | 8,507 | |
| Highways and public transit | | | | | | | | | | | | | | | | | | | | | | | | | | | | | | | | |
| BC Transit | | | 102 | | | | 62 | | | | (40 | ) | | | 66 | | | | 108 | | | | 61 | | | | (47 | ) | | | 65 | |
| BC Transportation Financing Authority | | | 13,733 | | | | 13,205 | | | | (528 | ) | | | 12,070 | | | | 14,195 | | | | 13,441 | | | | (754 | ) | | | 12,193 | |
| Port Mann Bridge | | | 3,510 | | | | 3,510 | | | | — | | | | 3,504 | | | | 3,510 | | | | 3,510 | | | | — | | | | 3,510 | |
| Public transit | | | 542 | | | | 870 | | | | 328 | | | | 542 | | | | 542 | | | | 870 | | | | 328 | | | | 870 | |
| SkyTrain extension | | | 714 | | | | 1,020 | | | | 306 | | | | 714 | | | | 714 | | | | 1,021 | | | | 307 | | | | 1,021 | |
| Total highways and public transit | | | 18,601 | | | | 18,667 | | | | 66 | | | | 16,896 | | | | 19,069 | | | | 18,903 | | | | (166 | ) | | | 17,659 | |
| Other | | | | | | | | | | | | | | | | | | | | | | | | | | | | | | | | |
| InBC Investment Corp | | | 34 | | | | 43 | | | | 9 | | | | 46 | | | | 30 | | | | 37 | | | | 7 | | | | 45 | |
| BC Pavilion Corporation | | | 384 | | | | 375 | | | | (9 | ) | | | 378 | | | | 385 | | | | 385 | | | | — | | | | 378 | |
| Provincial government general capital | | | 3,082 | | | | 3,615 | | | | 533 | | | | 2,910 | | | | 3,584 | | | | 3,702 | | | | 118 | | | | 3,133 | |
| Social housing 3 | | | 1,158 | | | | 1,761 | | | | 603 | | | | 1,103 | | | | 2,193 | | | | 2,063 | | | | (130 | ) | | | 1,027 | |
| Other 4 | | | 49 | | | | 37 | | | | (12 | ) | | | 32 | | | | 56 | | | | 43 | | | | (13 | ) | | | 35 | |
| Total other | | | 4,707 | | | | 5,831 | | | | 1,124 | | | | 4,469 | | | | 6,248 | | | | 6,230 | | | | (18 | ) | | | 4,618 | |
| Total other taxpayer-supported | | | 46,902 | | | | 50,646 | | | | 3,744 | | | | 44,595 | | | | 49,202 | | | | 51,163 | | | | 1,961 | | | | 46,229 | |
| Total taxpayer-supported debt | | | 46,902 | | | | 57,654 | | | | 10,752 | | | | 44,595 | | | | 49,202 | | | | 59,962 | | | | 10,760 | | | | 46,229 | |
| Self-supported debt | | | | | | | | | | | | | | | | | | | | | | | | | | | | | | | | |
| Commercial Crown corporations | | | | | | | | | | | | | | | | | | | | | | | | | | | | | | | | |
| BC Hydro | | | 24,082 | | | | 24,902 | | | | 820 | | | | 23,293 | | | | 24,357 | | | | 24,818 | | | | 461 | | | | 23,238 | |
| BC Liquor Distribution Branch | | | 279 | | | | 215 | | | | (64 | ) | | | 293 | | | | 273 | | | | 218 | | | | (55 | ) | | | 210 | |
| BC Lottery Corporation 5 | | | 119 | | | | 229 | | | | 110 | | | | 90 | | | | 123 | | | | 272 | | | | 149 | | | | 233 | |
| Columbia Power Corporation | | | 277 | | | | 271 | | | | (6 | ) | | | 277 | | | | 271 | | | | 270 | | | | (1 | ) | | | 276 | |
| Columbia Basin power projects 6 | | | 1,387 | | | | 1,349 | | | | (38 | ) | | | 1,387 | | | | 1,368 | | | | 1,349 | | | | (19 | ) | | | 1,387 | |
| Post-secondary institutions’ subsidiaries | | | 388 | | | | 497 | | | | 109 | | | | 451 | | | | 388 | | | | 497 | | | | 109 | | | | 504 | |
| Other | | | 102 | | | | 96 | | | | (6 | ) | | | 89 | | | | 110 | | | | 100 | | | | (10 | ) | | | 84 | |
| Total self-supported debt | | | 26,634 | | | | 27,559 | | | | 925 | | | | 25,880 | | | | 26,890 | | | | 27,524 | | | | 634 | | | | 25,932 | |
| Forecast allowance | | | — | | | | — | | | | — | | | | — | | | | 300 | | | | — | | | | (300 | ) | | | — | |
| Total provincial debt | | | 73,536 | | | | 85,213 | | | | 11,677 | | | | 70,475 | | | | 76,392 | | | | 87,486 | | | | 11,094 | | | | 72,161 | |
| 1 | Provincial debt is prepared in accordance with Generally Accepted Accounting Principles and presented consistent with the Debt Summary Report included in the Public Accounts. Debt is shown net of sinking funds and unamortized discounts, excludes accrued interest, and includes non-guaranteed debt directly incurred by commercial Crown corporations and debt guaranteed by the Province. |
| 2 | Includes debt and guarantees incurred by the government on behalf of school districts, universities, colleges, health authorities and hospital societies (SUCH), and debt directly incurred by these entities. |
| 3 | Includes the BC Housing Management Commission and the Provincial Rental Housing Corporation. |
| 4 | Includes debt of other service delivery agencies, loan guarantees to agricultural producers, guarantees issued under economic development and home mortgage assistance programs and loan guarantee provisions. |
| 5 | BC Lottery Corporation budget amounts did not include amounts for lease liabilities related to right of use assets (IFRS 16 Leases). At March 31, 2020, BC Lottery Corporation recorded $53 million in lease liabilities. |
| 6 | Joint ventures of the Columbia Power Corporation and Columbia Basin Trust. |
Budget and Fiscal Plan - 2021/22 to 2023/24
132
2020/21 Updated Financial Forecast (THIRD QUARTERLY REPORT)
Table 4.11 2020/21 Statement of Financial Position
| | | Actual | | | Year-to-Date | | | Forecast | |
| | | March 31, | | | December 31, | | | March 31, | |
| ($ millions) | | 2020 | | | 2020 | | | 2021 | |
| Financial assets: | | | | | | | | | | | | |
| Cash and temporary investments | | | 3,985 | | | | 6,964 | | | | 4,822 | |
| Other financial assets | | | 12,278 | | | | 15,537 | | | | 13,492 | |
| Sinking funds | | | 692 | | | | 490 | | | | 494 | |
| Investments in commercial Crown corporations: | | | | | | | | | | | | |
| Retained earnings | | | 6,515 | | | | 9,349 | | | | 9,519 | |
| Recoverable capital loans | | | 24,768 | | | | 26,553 | | | | 26,254 | |
| Total investments in commercial Crown corporations | | | 31,283 | | | | 35,902 | | | | 35,773 | |
| Total financial assets | | | 48,238 | | | | 58,893 | | | | 54,581 | |
| Liabilities: | | | | | | | | | | | | |
| Accounts payable and accrued liabilities | | | 11,497 | | | | 10,522 | | | | 12,227 | |
| Deferred revenue | | | 10,576 | | | | 12,843 | | | | 11,186 | |
| Debt: | | | | | | | | | | | | |
| Taxpayer-supported debt | | | 46,229 | | | | 57,654 | | | | 59,962 | |
| Self-supported debt | | | 25,932 | | | | 27,559 | | | | 27,524 | |
| Forecast allowance | | | — | | | | — | | | | — | |
| Total provincial debt | | | 72,161 | | | | 85,213 | | | | 87,486 | |
| Add: debt offset by sinking funds | | | 692 | | | | 490 | | | | 494 | |
| Less : guarantees and non-guaranteed debt | | | (1,337 | ) | | | (1,307 | ) | | | (1,275 | ) |
| Financial statement debt | | | 71,516 | | | | 84,396 | | | | 86,705 | |
| Total liabilities | | | 93,589 | | | | 107,761 | | | | 110,118 | |
| Net liabilities | | | (45,351 | ) | | | (48,868 | ) | | | (55,537 | ) |
| Capital and other non-financial assets: | | | | | | | | | | | | |
| Tangible capital assets | | | 50,025 | | | | 51,784 | | | | 53,720 | |
| Other non-financial assets | | | 3,208 | | | | 3,558 | | | | 3,140 | |
| Total capital and other non-financial assets | | | 53,233 | | | | 55,342 | | | | 56,860 | |
| Accumulated surplus (deficit) | | | 7,882 | | | | 6,474 | | | | 1,323 | |
Table 4.12 2020/21 Changes in Financial Position
| ($ millions) | | Year-to-Date
December 31,
2020 | | | Forecast
March 31,
2021 | |
| Deficit for the period | | | 2,192 | | | | 8,144 | |
| Comprehensive income (increase) decrease | | | (784 | ) | | | (1,585 | ) |
| Decrease in accumulated surplus | | | 1,408 | | | | 6,559 | |
| | | | | | | | | |
| Capital and other non-financial asset changes: | | | | | | | | |
| Taxpayer-supported capital investments | | | 3,602 | | | | 6,277 | |
| Less: amortization and other accounting changes | | | (1,843 | ) | | | (2,582 | ) |
| Increase in net capital assets | | | 1,759 | | | | 3,695 | |
| Increase (decrease) in other non-financial assets | | | 350 | | | | (68 | ) |
| Increase in capital and other non-financial assets | | | 2,109 | | | | 3,627 | |
| | | | | | | | | |
| Increase in net liabilities | | | 3,517 | | | | 10,186 | |
| | | | | | | | | |
| Investment and working capital changes: | | | | | | | | |
| Investment in commercial Crown corporations: | | | | | | | | |
| Increase in retained earnings | | | 2,834 | | | | 3,004 | |
| Self-supported capital investments | | | 2,504 | | | | 3,812 | |
| Less: loan repayments and other accounting changes | | | (719 | ) | | | (2,326 | ) |
| Increase in investment in commercial Crown corporations | | | 4,619 | | | | 4,490 | |
| Increase in cash and temporary investments | | | 2,979 | | | | 837 | |
| Increase (decrease) in other working capital | | | 1,765 | | | | (324 | ) |
| Increase (decrease) in Investment and working capital | | | 9,363 | | | | 5,003 | |
| | | | | | | | | |
| Increase in financial statement debt | | | 12,880 | | | | 15,189 | |
| Decrease in sinking fund debt | | | 202 | | | | 198 | |
| Decrease in guarantees and non-guaranteed debt | | | (30 | ) | | | (62 | ) |
| Increase in total provincial debt | | | 13,052 | | | | 15,325 | |
Budget and Fiscal Plan - 2021/22 to 2023/24
133

APPENDIX
| A1 | Tax Expenditures | 137 |
| A1.1.1 | Personal Income Tax - Tax Expenditures (Refundable Tax Credits) | 139 |
| A1.1.2 | Corporate Income Tax - Tax Expenditures (Refundable Tax Credits) | 140 |
| A1.2.1 | Personal Income Tax - Tax Expenditures (Deductions and Non-Refundable Tax Credits) | 141 |
| A1.2.2 | Corporate Income Tax - Tax Expenditures (Deductions and Non-Refundable Tax Credits) | 143 |
| A1.3 | Property Taxes - Tax Expenditures | 143 |
| A1.4 | Consumption Taxes - Tax Expenditures | 145 |
| A1.5 | Employer Health Tax - Tax Expenditures (Refundable Tax Credit) | 146 |
| A2 | Interprovincial Comparisons of Tax Rates - 2021 | 147 |
| A3 | Comparison of Provincial and Federal Taxes by Province - 2021 | 148 |
| A4 | Interprovincial Comparisons of Provincial Personal Income Taxes Payable - 2021 | 150 |
| A4.1 | Net Provincial Taxes Since Budget 2016 | 151 |
| A5 | Material Assumptions - Revenue | 152 |
| A6 | Natural Gas Price Forecasts - 2021/22 to 2023/24 | 158 |
| A7 | Material Assumptions - Expense | 159 |
| A8 | Operating Statement - 2014/15 to 2023/24 | 161 |
| A9 | Revenue by Source - 2014/15 to 2023/24 | 162 |
| A10 | Revenue by Source Supplementary Information - 2014/15 to 2023/24 | 163 |
| A11 | Expense by Function - 2014/15 to 2023/24 | 164 |
| A12 | Expense by Function Supplementary Information - 2014/15 to 2023/24 | 165 |
| A13 | Full-Time Equivalents (FTEs) 2014/15 to 2023/24 | 166 |
| A14 | Capital Spending - 2014/15 to 2023/24 | 167 |
| A15 | Statement of Financial Position - 2014/15 to 2023/24 | 168 |
| A16 | Changes in Financial Position - 2014/15 to 2023/24 | 169 |
| A17 | Provincial Debt - 2014/15 to 2023/24 | 170 |
| A18 | Provincial Debt Supplementary Information - 2014/15 to 2023/24 | 171 |
| A19 | Key Provincial Debt Indicators - 2014/15 to 2023/24 | 172 |
Budget and Fiscal Plan - 2021/22 to 2023/24
135

Appendix
A1: Tax Expenditures
Introduction
Tax expenditures reduce the amount of tax a taxpayer pays and are used to deliver government programs or benefits through the tax system. Tax expenditures are usually made by offering special tax rates, exemptions or credits. Governments introduce tax expenditures primarily to achieve social policy objectives such as transfers to lower-income families or to promote economic development and job creation.
Reporting tax expenditures improves government accountability by providing a more complete picture of government activities. The tax expenditure appendix does not include tax expenditures introduced or expanded in Budget 2021; these are described in Part 2: Tax Measures. Beginning with Budget 2012, refundable tax transfers are accounted for in a voted appropriation. For transparency and consistency with previous tax expenditure reports, Tables A1.1.1 and A1.1.2 also report on these tax transfers.
The Role of Tax Expenditure Programs
Using the tax system to deliver programs can reduce administration costs and compliance costs for recipients. In certain situations, the tax system allows intended beneficiaries to be readily identified from information that is already collected. In these cases, setting up a separate expenditure program would result in costly overlap and duplication of effort. An example is the climate action tax credit, which is delivered through the income tax system by the Canada Revenue Agency. If this were a direct provincial expenditure program, a provincial agency or office would have to be established to duplicate much of the work already done by the Canada Revenue Agency. In addition, it would require individuals to undertake a separate, time-consuming application process to qualify for the benefit.
There are several potential drawbacks to tax expenditure programs. First, their overall cost often receives less public scrutiny than is the case for spending programs because annual budget appropriations by the legislature are not typically required. Second, tax expenditure programs do not always effectively target those who are intended to benefit from them. Some tax expenditure programs that are intended to provide tax relief for lower-income earners may, in reality, provide the greatest benefit to higher-income earners who pay the most taxes. Finally, costs are often more difficult to control under a tax expenditure program because the benefits tend to be more open-ended and enforcement is often more difficult than for spending programs.
Tax Expenditure Reporting
Not all tax reductions, credits, exemptions and refunds are classed as tax expenditures.
The emphasis is on tax reductions, credits, exemptions and refunds that are close equivalents to spending programs. By implication, the list does not include tax measures designed to meet broad tax policy objectives such as improving fairness in the tax system or measures designed to simplify the administration of a tax. The list also does not include anything that is not intended to be part of a tax base.
Tax expenditures that cost less than $2 million annually are generally not included. Where practical, smaller items have been presented together as an aggregate figure.
Budget and Fiscal Plan - 2021/22 to 2023/24
137
Appendix
British Columbia Tax Expenditures
Tables A1.1.1 to A1.5 report tax expenditure estimates.
The cost of individual tax expenditures cannot be added together to reach a total tax expenditure figure for two reasons: in some cases, the programs interact with one another so that eliminating one program could increase or decrease the cost of another; and eliminating certain tax expenditure programs could change the choices taxpayers make, which in turn would affect the cost estimates.
The estimates for each tax expenditure are based on a static analysis of the costs and do not consider any behavioural changes, which could change the costs over time. In addition, estimates are generally recalculated each year using current data sources and using refinements to the methods of estimation, which can result in significant changes to the value of a given tax expenditure from prior years’ reports.
Tables A1.1.1 and A1.1.2 list tax programs delivered through refundable personal and corporate income tax credits, respectively. Refundable tax credits can be used to reduce income tax liabilities with any remainder refunded to the taxpayer. These tax credits are reported in a voted appropriation.
Tables A1.2.1 and A1.2.2 list tax expenditures that are deductions, exemptions or non-refundable tax credits for personal and corporate income tax, respectively. Deductions reduce taxable income, whereas non-refundable tax credits can only be used to reduce income taxes payable. The tables include both provincial measures and federal measures. Federal measures are deductions and exemptions that reduce British Columbia income tax. Under the tax collection agreement between British Columbia and the federal government, the federal government has sole responsibility for determining income subject to tax, including British Columbia tax.
Table A1.3 lists property tax exemptions and grants. Property tax exemptions can reduce the tax owing or remove a property from tax. Grants reduce the final tax owing and may be refunded after full payment has been received. Exemptions are used to define the tax base; estimates for property tax expenditures for government entities, municipalities, colleges, schools, hospitals and similar public facilities are not shown.
Table A1.4 lists consumption tax exemptions. Fuel tax estimates include point-of-sale exemptions for certain individuals and businesses, and refunds if fuel is purchased then subsequently used for an exempt purpose. Provincial sales tax exemptions are typically point-of-sale exemptions and either apply to everyone at the point of sale or apply in certain circumstances with appropriate documentation.
Table A1.5 reports a refundable employer health tax credit provided as part of B.C.’s Economic Recovery Plan.
More information on British Columbia tax expenditures in Tables A1.1.1 to A1.5 can be found at https://www2.gov.bc.ca/gov/content/taxes. Information on federal tax expenditures in Tables A1.2.1 and A1.2.2 can be found at https://www.canada.ca/en/ services/taxes/income-tax.html.
Budget and Fiscal Plan - 2021/22 to 2023/24
138
Appendix
Table A1.1.1 Personal Income Tax – Tax Expenditures (Refundable Tax Credits)
| | | 2019/20 | | 2020/21 | | 2021/22 | |
| | | Actual Cost | | Estimated Cost1 | | Planned Cost | |
| | | ($ millions) | | ($ millions) | | ($ millions) | |
| BC Child Opportunity Benefit | | — | | 141 | | 410 | |
| • | Tax-free monthly payment made to eligible families to help with the cost of raising children under age 18. | | | | | | | |
| • | The maximum benefit is $1,600 for a family’s first child, $1,000 for a second child and $800 for each subsequent child. | | | | | | | |
| • | Started October 1, 2020. | | | | | | | |
| BC Recovery Benefit | | — | | 1,307 | | 100 | |
| • | Provides a one-time tax-free payment to British Columbians of $500 per individual or $1,000 per family. | | | | | | | |
| • | The benefit is reduced between $62,500 and $87,500 of net income for individuals and $125,000 and $175,000 of family net income for families. | | | | | | | |
| • | Application period commenced December 18, 2020. | | | | | | | |
| Climate action tax credit | | 252 | | 802 | | 312 | |
| • | Helps offset the impact of the carbon taxes paid by low- to moderate-income individuals and families. | | | | | | | |
| • | The benefit varies based on the composition of the family and their family net income. | | | | | | | |
| • | Includes a one-time enhanced payment in July 2020 made as part of B.C.’s COVID-19 Action Plan. | | | | | | | |
| • | Introduced in 2008 with the carbon tax. | | | | | | | |
| Early childhood tax benefit | | 132 | | 133 | | — | |
| • | Tax-free monthly payment made to eligible families to help with the cost of raising children under age 6. | | | | | | | |
| • | The maximum benefit was $660 per year per child under the age of 6 and was reduced between family net income of $100,000 and $150,000. | | | | | | | |
| • | The early childhood tax benefit was replaced with the BC Child Opportunity Benefit effective October 1, 2020. | | | | | | | |
| Emergency Benefit for Workers | | — | | 645 | | — | |
| • | Provided a one-time tax-free payment of $1,000 to British Columbians who lost income or employment between March 1, 2020 and September 26, 2020 due to the COVID-19 pandemic. | | | | | | | |
| • | Introduced as part of BC’s COVID-19 Action Plan and ended on December 2, 2020. | | | | | | | |
| Home renovation tax credit for seniors and persons with disabilities | | 2 | | 4 | | 3 | |
| • | Assists eligible individuals 65 and over and persons with disabilities with the cost of certain permanent home renovations to improve accessibility or be more functional or mobile at home. | | | | | | | |
| • | Recipients may receive up to 10 per cent of qualifying renovation expenses, up to a maximum of $10,000 of qualifying renovation expenses or $1,000. | | | | | | | |
| • | Introduced in 2012. | | | | | | | |
| Sales tax credit | | 51 | | 65 | | 58 | |
| • | Helps offset the cost of provincial sales tax for low-income individuals and families. | | | | | | | |
| • | The maximum benefit is $75 for individuals and $150 for couples. | | | | | | | |
| • | Reintroduced in 2013 in conjunction with reimplementation of the provincial sales tax. | | | | | | | |
| Small business venture capital tax credit | | 26 | | 29 | | 30 | |
| • | Encourages investors to make early-stage equity investments that help B.C. small businesses develop and grow. | | | | | | | |
| • | Individuals receive a credit of up to 30 per cent of their investment and may claim a benefit of up to $120,000 per tax year. | | | | | | | |
| • | Introduced in 1979. | | | | | | | |
| Training tax credits 2 | | 11 | | 12 | | 12 | |
| • | Provides refundable income tax credits for apprentices based on the apprenticeship level completed. | | | | | | | |
| • | Provides refundable income tax credits for employers who employ apprentices of up to 15 per cent of the apprentices’ salaries. | | | | | | | |
| • | Introduced in 2007. Sunset date of December 31, 2022. | | | | | | | |
| 1 | Figures include prior year adjustments of -$3 million for the sales tax credit. |
| 2 | Training tax credits for corporations are listed in Table A1.1.2. The training tax credit for individuals includes tax credits for apprentices and unincorporated employers. |
Budget and Fiscal Plan - 2021/22 to 2023/24
139
Appendix
Table A1.1.2 Corporate Income Tax – Tax Expenditures (Refundable Tax Credits)
| | | 2019/20 | | 2020/21 | | 2021/22 | |
| | | Actual Cost | | Estimated Cost1 | | Planned Cost | |
| | | ($ millions) | | ($ millions) | | ($ millions) | |
| Book publishing tax credit | | 2 | | 2 | | 3 | |
| • | Supports book publishers that carry out business primarily in B.C. | | | | | | | |
| • | Introduced in 2003. | | | | | | | |
| • | Budget 2021 extends this credit for five years to March 31, 2026. | | | | | | | |
| Film Incentive BC tax credit | | 69 | | 171 | | 118 | |
| • | Supports the production of film or television productions in B.C. The Film Incentive BC tax credit is for domestic productions meeting Canadian content requirements. | | | | | | | |
| • | Basic, regional location and film training tax credits were introduced in 1998. | | | | | | | |
| • | Digital animation and visual effects (DAVE) tax credit was introduced in 2008, and expanded to post-production activities in 2015. | | | | | | | |
| • | Distant location tax credit was introduced in 2009. | | | | | | | |
| • | B.C.-based scriptwriters tax credit was introduced in 2018. | | | | | | | |
| • | Tax credit does not have a sunset date. | | | | | | | |
| Production services tax credit | | 631 | | 704 | | 667 | |
| • | Supports the production of film or video productions in B.C. The production services tax credit is available to both domestic and foreign producers. | | | | | | | |
| • | Introduced in 1998. | | | | | | | |
| • | Regional location tax credit and digital animation and visual effects (DAVE) tax credit introduced in 2008. Post-production activities became eligible for the DAVE credit in 2015. | | | | | | | |
| • | Distant location tax credit was introduced in 2009. | | | | | | | |
| • | Tax credit does not have a sunset date. | | | | | | | |
| Interactive digital media tax credit | | 86 | | 91 | | 71 | |
| • | Supports the development of interactive digital media products in B.C. | | | | | | | |
| • | In 2017, eligibility was expanded to small business venture capital corporations, and principal business requirements were relaxed for corporations with annual qualifying B.C. labour expenditures greater than $2 million. | | | | | | | |
| • | Introduced in September 2010. Sunset date of August 31, 2023. | | | | | | | |
| International business activity program tax refunds | | 3 | | 2 | | — | |
| • | Provided eligible corporations, certain foreign banks authorized to carry on business in Canada and specialists employed by these entities a refund of B.C. income tax paid on income related to the corporation’s international business carried on in B.C. | | | | | | | |
| • | Program eliminated effective September 12, 2017. The 2019/20 cost represents refunds paid in respect of eligible income earned before September 12, 2017. | | | | | | | |
| Mining exploration tax credit | | 36 | | 29 | | 20 | |
| • | Supports eligible corporations conducting grassroots mineral exploration in B.C. | | | | | | | |
| • | Introduced for expenditures incurred after July 31, 1998; expanded to active partners in partnerships effective after March 31, 2003 and enhanced tax credit for prescribed areas introduced effective after February 20, 2007. | | | | | | | |
| • | Tax credit does not have a sunset date. | | | | | | | |
| Scientific research and experimental development tax credit 2 | | 71 | | 121 | | 101 | |
| • | Supports research and development carried on in B.C. | | | | | | | |
| • | Capital expenditures removed from qualifying expenditures effective after 2013 and taxable income removed from calculation of refundable tax credit expenditure limit for taxation years ending after March 18, 2019. | | | | | | | |
| • | Introduced effective September 1, 1999. Sunset date of August 31, 2022. | | | | | | | |
| 1 | Figures include prior year adjustments of -$1 million for the book publishing tax credit, $53 million for the Film Incentive BC tax credit, $18 million for the production services tax credit, $17 million for the interactive digital media tax credit, $25 million for the refundable portion of the scientific research and experimental development tax credit and -$9 million for the mining exploration tax credit. |
| 2 | The scientific research and experimental development tax credit has a non-refundable component, which is reported in Table A1.2.2. |

Budget and Fiscal Plan - 2021/22 to 2023/24
140
Appendix
Table A1.1.2 Corporate Income Tax – Tax Expenditures (Refundable Tax Credits) (continued)
| | | 2019/20 | | 2020/21 | | 2021/22 | |
| | | Actual Cost | | Estimated Cost | | Planned Cost | |
| | | ($ millions) | | ($ millions) | | ($ millions) | |
| Training tax credits 1 | | 10 | | 12 | | 10 | |
| • | Provides refundable income tax credits for employers who employ apprentices of up to 15 per cent of the apprentices’ salaries. | | | | | | | |
| • | Enhanced tax credit for shipbuilders and ship repair industry for expenditures made on or after October 1, 2012. | | | | | | | |
| • | Introduced effective January 1, 2007. Sunset date of December 31, 2022. | | | | | | | |
| 1 | Training tax credits for individuals are reported in Table A1.1.1. |
Table A1.2.1 Personal Income Tax – Tax Expenditures (Deductions and Non-Refundable Tax Credits)
| | | | 2019/20 | | 2020/21 | | 2021/22 | |
| | | | Actual Cost | | Estimated Cost | | Planned Cost | |
| | | | ($ millions) | | ($ millions) | | ($ millions) | |
| Provincial Measures | | | | | | | |
| Age tax credit | | 101 | | 105 | | 109 | |
| • | Provides an income-tested tax credit to elderly British Columbians. | | | | | | | |
| • | Introduced in 2000. | | | | | | | |
| BC caregiver tax credit | | 6 | | 6 | | 6 | |
| • | Provides a tax credit to individuals who care for family members with a disability. | | | | | | | |
| • | Introduced in 2018 in response to changes to the federal caregiver tax credit. | | | | | | | |
| Canada Pension Plan tax credit | | 198 | | 210 | | 211 | |
| • | Provides a tax credit to individuals who make Canada Pension Plan contributions. | | | | | | | |
| • | Introduced in 2000. | | | | | | | |
| Charitable donations tax credit | | 277 | | 281 | | 284 | |
| • | Provides a tax credit to individuals who make charitable donations to registered charities and eligible donees. | | | | | | | |
| • | Introduced in 2000. | | | | | | | |
| Disability tax credit | | 37 | | 39 | | 40 | |
| • | Provides a tax credit to persons with a disability. | | | | | | | |
| • | Introduced in 2000. | | | | | | | |
| Employment Insurance tax credit | | 59 | | 63 | | 63 | |
| • | Provides a tax credit to individuals who pay Employment Insurance premiums. | | | | | | | |
| • | Introduced in 2000. | | | | | | | |
| Medical expense tax credit | | 77 | | 79 | | 79 | |
| • | Provides a tax credit to individuals who make sufficient qualifying medical expenditures. | | | | | | | |
| • | Introduced in 2000. | | | | | | | |
| Mining flow-through share tax credit | | 20 | | 20 | | 20 | |
| • | Provides a tax credit to individuals who invest in flow-through shares on renounced mining expenditures. | | | | | | | |
| • | Introduced in 2001. Sunset date removed in 2019. | | | | | | | |
| Pension tax credit | | 30 | | 30 | | 31 | |
| • | Provides a tax credit to individuals who receive amounts from private pension plans. | | | | | | | |
| • | Introduced in 2000. | | | | | | | |
| Political contribution tax credit | | 3 | | 3 | | 3 | |
| • | Provides a tax credit to individuals who donate to provincial political parties, constitutency associations or candidates. | | | | | | | |
| • | Introduced in 2000. Prior to 2000, B.C. had a similar deduction, rather than a credit. | | | | | | | |
Budget and Fiscal Plan - 2021/22 to 2023/24
141
Appendix
Table A1.2.1 Personal Income Tax – Tax Expenditures (Deductions and Non-Refundable Tax Credits) (continued)
| | | | 2019/20 | | 2020/21 | | 2021/22 | |
| | | | Actual Cost | | Estimated Cost | | Planned Cost | |
| | | | ($ millions) | | ($ millions) | | ($ millions) | |
| Provincial Measures (continued) | | | | | | | |
| Spousal and eligible dependant tax credits | | 88 | | 90 | | 91 | |
| • | Provides a tax credit to an individual who has a low-income spouse, or to a single parent who supports a minor child. | | | | | | | |
| • | Introduced in 2000. | | | | | | | |
| Tuition tax credit | | 60 | | 61 | | 62 | |
| • | Provides a tax credit for tuition paid to a post-secondary institution. | | | | | | | |
| • | Costs also include education tax credit amounts in respect of studies prior to the elimination of that tax credit in 2019, which have been carried forward. | | | | | | | |
| • | Unused tax credits may be carried forward to future years. | | | | | | | |
| • | Introduced in 2000. | | | | | | | |
| Federal Measures 1 | | | | | | | |
| Child care expense deduction | | 74 | | 51 | | 60 | |
| • | Allows families to deduct child care costs from taxable income. | | | | | | | |
| • | Introduced in 1972. | | | | | | | |
| Non-taxation of business-paid health and dental benefits | | 153 | | 181 | | 190 | |
| • | Allows for private health and dental benefits to not be taxed. | | | | | | | |
| • | Introduced in 1948. | | | | | | | |
| Northern residents deduction | | 17 | | 15 | | 21 | |
| • | Provides a deduction to individuals living in northern communities. | | | | | | | |
| • | Introduced in 1987. | | | | | | | |
| Pension income splitting | | 83 | | 92 | | 101 | |
| • | Allows for spouses to split pension income, other than income from the Canada Pension Plan and Old Age Security. | | | | | | | |
| • | Introduced in 2007. | | | | | | | |
| Registered pension plans | | 1,526 | | 1,395 | | 1,425 | |
| • | Allows amounts contributed to a pension plan to be deducted from taxable income. | | | | | |
| • | Introduced in 1919. | | | | | | | |
| Registered retirement savings plans (RRSPs) | | 891 | | 826 | | 812 | |
| • | Allows amounts contributed to an RRSP to be deducted from taxable income. | | | | | | | |
| • | Introduced in 1957. | | | | | | | |
| Tax-free savings accounts (TFSAs) | | 83 | | 66 | | 67 | |
| • | Allows for investment income to be earned tax-free within a TFSA. | | | | | | | |
| • | Introduced in 2009. | | | | | | | |
| 1 | These measures show the foregone provincial revenue resulting from federal measures . Each measure is calculated from the 2021 federal cost projections as reported in the Government of Canada’s Report on Federal Tax Expenditures 2021 by applying British Columbia residents’ share of the measure and the relevant tax rates. Certain tax expenditure items have been excluded where no data is available or the amounts are immaterial. |
Budget and Fiscal Plan - 2021/22 to 2023/24
142
Appendix
Table A1.2.2 Corporate Income Tax – Tax Expenditures (Deductions and Non-Refundable Tax Credits)
| | | 2019/20 | | 2020/21 | | 2021/22 | |
| | | Actual Cost | | Estimated Cost | | Planned Cost | |
| | | ($ millions) | | ($ millions) | | ($ millions) | |
| Provincial Measures | | | | | | | |
| Small business venture capital tax credit | | 3 | | 3 | | 3 | |
| • | See description under Table A1.1.1. | | | | | | | |
| • | Corporations receive a credit of up to 30 per cent of their investment. There is no annual limit on the benefit that can be claimed. | | | | | | | |
| Scientific research and experimental development tax credit 1 | | 108 | | 77 | | 89 | |
| • | See description under Table A1.1.2. | | | | | | | |
| Small business corporate income tax rate | | 1,394 | | 1,460 | | 1,271 | |
| • | Provides a reduced income tax rate for Canadian-controlled private corporations on active business income up to $500,000. | | | | | | | |
| • | The small business corporate income tax rate was reduced to 2 per cent from 2.5 per cent effective April 1, 2017. | | | | | | | |
| • | Introduced in 1975. | | | | | | | |
| Additional access to small business corporate income tax rate for credit unions | | 43 | | 25 | | 22 | |
| • | Provides a reduced income tax rate for credit unions on a portion of taxable income. | | | | | |
| • | Introduced in 1977. | | | | | | | |
| • | In 2017, expanded access for credit unions to the provincial reduced tax rate continued despite the phase-out of the corresponding federal measure. | | | | | | | |
| Federal Measure 2 | | | | | | | |
| Charitable donations deduction | | 83 | | 83 | | 82 | |
| • | Generally permits corporations to deduct charitable donations made to registered charities up to a maximum of 75 per cent of the corporation’s taxable income. The limit may be exceeded for donations of certain items. | | | | | | | |
| • | Encourages corporations to make donations to charities. | | | | | | | |
| • | Introduced in 1929 for certain charities, and expanded to all charities by 1933. | | | | | | | |
| 1 | The scientific research and experimental development tax credit has a refundable component, which is reported in Table A1.1.2. |
| 2 | The deduction for corporate charitable donations is a federal measure but the estimate shows only the foregone provincial revenue. This is calculated from the 2021 federal cost projection as reported in the Government of Canada’s Report on Federal Tax Expenditures 2021 by applying British Columbia’s share of corporate taxable income and the relevant tax rates to the federal estimate. |
| Table A1.3 Property Taxes – Tax Expenditures | | | | | | | |
| | | | | | | | |
| | | 2019/20 | | 2020/21 | | 2021/22 | |
| | | Actual Cost | | Estimated Cost | | Planned Cost | |
| | | ($ millions) | | ($ millions) | | ($ millions) | |
| School and Rural Area Property Tax | | | | | | | |
| Assessment exemption of $10,000 for business properties 1 | | 6 | | 6 | | 6 | |
| • | Assessed improvement values for property tax are reduced by $10,000 for each industrial and business property. | | | | | | | |
| • | Introduced in 1984. | | | | | | | |
| Overnight tourist accommodation assessment relief 1 | | 2 | | 2 | | 2 | |
| • | Reduces the taxable assessed value of smaller tourist accommodation properties. | | | | | | | |
| • | Introduced in 1988. Assessment reductions for properties in rural areas were increased in 2016. | | | | | | | |
| Home owner grant 2 | | 852 | | 870 | | 887 | |
| • | Reduces property taxes for Canadians and permanent residents of Canada who use the property as their principal residence. The benefit relative to tax paid is greater for lower-valued homes. | | | | | | | |
| • | The grant is phased out on properties with an assessed value above a threshold value. Low-income seniors and some other low-income individuals may be eligible for a low-income grant supplement if some or all of the grant is reduced because of the phase-out. | | | | | | | |
| • | The grant is up to $275 higher for seniors, eligible veterans and people with disabilities. | | | | | |
| • | The northern and rural area home owner benefit was introduced in 2011, which provides a $200 higher grant outside the Metro Vancouver, Capital and Fraser Valley regional districts. | | | | | | | |
| • | Introduced in 1957. | | | | | | | |
| 1 | Estimates are for the calendar years and include only school and rural area property taxes levied by the Province. |
| 2 | The home owner grant includes the northern and rural area home owner benefit. |
Budget and Fiscal Plan - 2021/22 to 2023/24
143
Appendix
Table A1.3 Property Taxes – Tax Expenditures (continued)
| | | 2019/20 | | 2020/21 | |
| | | Actual Cost | | Estimated Cost1 | |
| | | ($ millions) | | ($ millions) | |
| Property Transfer Tax | | | | | |
| Exemptions for the following: | | | | | |
| First Time Home Buyers | | 65 | | 74 | |
| • | Exempts Canadian citizens and permanent residents of Canada who purchase their first home. | | | | | |
| • | The homeowner must live in the home as their principal residence for at least one year after purchase and the property must have a fair market value of $500,000 or less. A phase-out applies for homes up to $525,000. | | | | | |
| • | Introduced in 1994. | | | | | |
| Newly Built Home | | 76 | | 76 | |
| • | Exempts Canadians and permanent residents of Canada from property transfer tax for a newly built home with a fair market value of up to $750,000. A partial exemption applies up to $800,000. | | | | | |
| • | The homeowner must live in the home for at least one year after purchase. There is no requirement to live in B.C. before the purchase. | | | | | |
| • | Introduced in 2016. | | | | | |
| Property transfers between related individuals | | 168 | | 143 | |
| • | Long-standing exemption for spousal and intergenerational transfers for principal residences, recreational properties and family farms and in the event of a division of property due to divorce or marital breakdown. Available to Canadians citizens and permanent residents of Canada. | | | | | |
| Property transfers to municipalities, regional districts, hospital districts, library boards, school boards, water districts | | 13 | | 15 | |
| • | Long-standing exemption for transfers to specified public bodies. | | | | | |
| Property transfers to charities registered under the Income Tax Act (Canada) | | 15 | | 17 | |
| • | Long-standing exemption for transfers of properties to a registered charity or a specified individual where the land will be used for a charitable purpose. | | | | | |
| Speculation and Vacancy Tax 2 | | | | | |
| $2,000 tax credit for B.C. residents | | 3 | | | |
| • | Provides a tax credit of up to $2,000 for owners who are B.C. residents on the first $400,000 of their property value subject to the tax. | | | | | |
| Income tax credit for non-B.C. residents who pay B.C. income tax | | 4 | | | |
| • | Provides a tax credit to reduce a non-B.C. resident’s tax payable based on their B.C. income. | | | | | |
| Exemptions for the following: 3 | | | | | |
| Recently acquired or inherited properties | | 85 | | | |
| • | Provides an exemption from tax for a property that is purchased or acquired in the calendar year. | | | | | |
| Properties with no residence | | 60 | | | |
| • | Provides a temporary exemption from tax for vacant land. Ended after the 2019 tax year. | | | | | |
| Separation or divorce | | 7 | | | |
| • | Provides an exemption from tax for owners who are going through a separation or divorce. | | | | | |
| Death of an owner | | 15 | | | |
| • | Provides a two year exemption from tax for owners of a property that applies in the year of an owner’s death and the following year. | | | | | |
| Rental restricted properties | | 32 | | | |
| • | Provides a temporary exemption from tax for properties with a rental restriction bylaw or covenant until 2022. | | | | | |
| Exemption for hazardous or damaged residential property | | 9 | | | |
| • | Provides an exemption from tax for property that is damaged by natural disaster or is uninhabitable. | | | | | |
| Exemption for strata accommodation property | | 3 | | | |
| • | Provides a temporary exemption from tax for properties that are strata hotels until 2021. | | | | | |
| Exemption for daycares | | 2 | | | |
| • | Provides an exemption from tax for property that is used as a licenced daycare. | | | | | |
| 1 | Future costs for First Time Home Buyers’ Program and Newly Built Home Exemption will vary depending on completion and sale of new homes below the threshold value and by activity of first-time buyers in the market. Other property transfer tax exemptions will be more stable over time. |
| 2 | Certain exemptions such as the principal residence exemption, occupied by a tenant exemption and land under development exemption, are intended to exclude principal residences, rental properties and properties under development from the tax base. |
Exemptions resulting in immaterial expenditures were excluded from this table.
Costs are for the 2019 calendar year. In calculating the cost of the expenditure no credits have been applied that an owner may have been entitled to receive had they been assessed tax. The calculations are based on actual exemptions claimed not what an owner would have otherwise been entitled to claim had they not chosen this particular exemption and are based on a 50 per cent ownership share which may not reflect the true mixture of owner types who jointly own property. All measures were introduced when the tax was introduced in 2018.
| 3 | This is the revenue spent on exemptions without applying any credits. Ownership percentage is assumed to be split into equal parts based on the number of owners on title (i.e., if a property has 3 owners, each owner is assumed to have 1/3 ownership). The tax rate of either 0.5 per cent or 2 per cent based on their ownership type is then applied to their ownership percentage. |
Budget and Fiscal Plan - 2021/22 to 2023/24
144
Appendix
Table A1.4 Consumption Taxes – Tax Expenditures
| | | 2019/20 | | 2020/21 | | 2021/22 | |
| | | Estimated Cost1 | | Estimated Cost | | Planned Cost | |
| | | ($ millions) | | ($ millions) | | ($ millions) | |
| Fuel Taxes 2 | | | | | | | |
| Tax exemption for alternative fuels | | 3 | | 3 | | 3 | |
| • | Exempts hydrogen used in a fuel cell vehicle, natural gas, and gasoline and diesel that contains at least 85 per cent methanol from motor fuel tax. | | | | | | | |
| • | Introduced in 2009 for hydrogen used in a fuel cell vehicle, 1982 for natural gas and 1992 for 85 per cent methanol. | | | | | | | |
| Tax exemption for international flights (jet fuel) | | 23 | | 12 | | 18 | |
| • | Exempts fuel purchased by interjurisdictional airlines from motor fuel tax. | | | | | | | |
| • | Introduced in 2012. | | | | | | | |
| Tax exemptions for farmers 2 | | 12 | | 11 | | 12 | |
| • | Exempts coloured gasoline and coloured diesel purchased by qualifying farmers from motor fuel and carbon tax. | | | | | | | |
| • | Introduced in 2008 for motor fuel tax and 2014 for carbon tax. | | | | | | | |
| Provincial Sales Tax 3 | | | | | | | |
| Rebate for select machinery and equipment | | — | | 235 | | 235 | |
| • | Provides, as part of B.C.’s Economic Recovery Plan, a temporary rebate to encourage business investment. | | | | | | | |
| Exemptions for the following: | | | | | | | |
| Food for human consumption 4 | | 1,554 | | 1,594 | | 1,585 | |
| • | Provides an exemption to reduce the cost of basic necessities. | | | | | | | |
| Production machinery and equipment | | 225 | | 175 | | 186 | |
| • | Provides an exemption to help reduce the cost of certain machinery and equipment for businesses in the manufacturing, oil and gas, mining and logging industries. | | | | | | | |
| Residential energy (e.g., electricity, natural gas, fuel oil) | | 266 | | 276 | | 281 | |
| • | Provides an exemption to reduce the cost of residential energy. | | | | | | | |
| Non-residential electricity | | 172 | | 198 | | 198 | |
| • | Provides an exemption to help businesses become more competitive and support increased investment, growth and job creation. Phased in starting January 1, 2018 and fully implemented on April 1, 2019. | | | | | | | |
| Prescription and non-prescription drugs, vitamins and certain other health care products | | 255 | | 259 | | 261 | |
| • | Provides exemptions to reduce the cost of certain drugs, vitamins and health care products. | | | | | | | |
| Children’s clothing and footwear | | 43 | | 37 | | 43 | |
| • | Provides an exemption to reduce the cost of clothing and footwear for children under 15. | | | | | | | |
| Clothing patterns, fabrics and notions | | 8 | | 8 | | 8 | |
| • | Provides an exemption to reduce the cost of patterns, yarns, natural fibres, threads and fabric that are commonly used in making or repairing clothing. | | | | | | | |
| Specified school supplies | | 46 | | 46 | | 46 | |
| • | Provides an exemption to reduce the cost of school supplies. | | | | | | | |
| Books, magazines and newspapers | | 45 | | 46 | | 47 | |
| • | Provides an exemption to reduce the cost of reading material. | | | | | | | |
| Basic land-line telephone and cable service | | 54 | | 54 | | 54 | |
| • | Provides exemptions to reduce the cost of basic land-line telephone and basic cable television service. | | | | | | | |
| “1-800” and equivalent telephone services | | 4 | | 4 | | 4 | |
| • | Provides an exemption to reduce the cost of offering toll-free telephone services. | | | | | | | |
| Specified safety equipment | | 39 | | 42 | | 42 | |
| • | Provides exemptions to reduce the cost of specified work-related and general-use protective gear and safety equipment. | | | | | | | |
| 1 | Exemptions are largely point-of-sale exemptions - they can only be estimated unlike expenditures provided through the income or property tax systems. |
| 2 | Estimate is for both motor fuel tax and carbon tax. |
| 3 | Estimates are based on internal data, publicly-available industry data and Statistics Canada data. All exemptions for provincial sales tax existed prior to the implementation of the Provincial Sales Tax Act in 2013 except for the exemption for non-residential electricity, which was introduced in 2018, and the expansion of the exemption for bicycles and tricycles in 2021 to include electric bicycles and tricycles. |
| 4 | Effective April 1, 2021, carbonated sodas and certain other beverages are subject to provincial sales tax. |
Budget and Fiscal Plan - 2021/22 to 2023/24
145
Appendix
Table A1.4 Consumption Taxes – Tax Expenditures (continued)
| | | 2019/20 | | 2020/21 | | 2021/22 | |
| | | Estimated Cost1 | | Estimated Cost | | Planned Cost | |
| | | ($ millions) | | ($ millions) | | ($ millions) | |
| Provincial Sales Tax 2 | | | | | | | |
| Exemptions for the following: | | | | | | | |
| Labour to repair major household appliances, clothing and footwear | | 15 | | 15 | | 15 | |
| • | Provides exemptions to reduce the cost of repairing certain essentials. | | | | | | | |
| Livestock for human consumption and feed, seed and fertilizer | | 64 | | 67 | | 68 | |
| • | Provides exemptions to reduce the cost of animals that are part of the food system. | | | | | | |
| Specified energy conservation equipment | | 21 | | 22 | | 22 | |
| • | Provides exemptions to reduce the cost of certain energy conservation equipment. | | | | | | |
| Bicycles | | 14 | | 15 | | 22 | |
| • | Provides exemptions to reduce the cost of non-motorized bicycles, adult-sized tricycles and parts and services. Expanded on April 21, 2021 to include electric bicycles and adult-sized tricycles, conversion kits and parts and services. | | | | | | |
| 1 | Exemptions are largely point-of-sale exemptions - they can only be estimated unlike expenditures provided through the income or property tax systems. Estimates are based on internal data, publicly-available industry data and Statistics Canada data. All exemptions for provincial sales tax existed prior to the |
| 2 | implementation of the Provincial Sales Tax Act in 2013 except for the exemption for non-residential electricity, which was introduced in 2018, and the expansion of the exemption for bicycles and tricycles in 2021 to include electric bicycles and tricycles. |
Table A1.5 Employer Health Tax – Tax Expenditures (Refundable Tax Credit)
| | | 2019/20 | | 2020/21 | | 2021/22 | |
| | | Actual Cost | | Estimated Cost | | Planned Cost | |
| | | ($ millions) | | ($ millions) | | ($ millions) | |
| Increased Employment Incentive | | - | | 38 | | 152 | |
| • | Provides a refundable tax credit to employers who increase their payroll for low-to middle-income workers between the third and fourth quarters of 2020. | | | | | | | |
| • | Introduced for the quarter ended December 31, 2020 as part of BC’s Economic Recovery Plan. | | | | | | | |
Budget and Fiscal Plan - 2021/22 to 2023/24
146
Appendix
| Table A2 | Interprovincial Comparisons of Tax Rates – 2021
(Rates known and in effect as of April 1, 2021) |
| Tax | | British
Columbia | | | Alberta | | | Saskat-
chewan | | | Manitoba | | | Ontario | | | Quebec | | | New
Brunswick | | | Nova
Scotia | | | Prince
Edward
Island | | | Newfound-
land and
Labrador | |
| Corporate income tax (per cent of taxable income) | | | | | | | | | | | | | | | | | | | | | | | | | | | | | | |
| General rate | | 12 | | | 8 | | | 12 | | | 12 | | | 11.5 | | | 11.5 | | | 14 | | | 14 | | | 16 | | | 15 | |
| Manufacturing rate 1 | | 12 | | | 8 | | | 10 | | | 12 | | | 10 | | | 11.5 | | | 14 | | | 14 | | | 16 | | | 15 | |
| Small business rate | | 2 | | | 2 | | | 2 | | | 0 | | | 3.2 | | | 3.2 | | | 2.5 | | | 2.5 | | | 2 | | | 3 | |
| Small business threshold ($000s) | | 500 | | | 500 | | | 600 | | | 500 | | | 500 | | | 500 | | | 500 | | | 500 | | | 500 | | | 500 | |
| Corporation capital tax (per cent) Financial 2 | | Nil | | | Nil | | | 0.7/4 | | | 6 | | | Nil | | | 1.25 | | | 4/5 | | | 4 | | | 5 | | | 6 | |
| Health care premiums/month ($) | | | | | | | | | | | | | | | | | | | | | | | | | | | | | | |
| Individual/family 3 | | Nil | | | Nil | | | Nil | | | Nil | | | Nil | | | Nil | | | Nil | | | Nil | | | Nil | | | Nil | |
| Payroll tax (per cent) 4 | | 1.95 | | | Nil | | | Nil | | | 2.15 | | | 1.95 | | | 4.26 | | | Nil | | | Nil | | | Nil | | | 2 | |
| Insurance premium tax (per cent) 5 | | 2-7 | | | 3/4 | | | 3/4 | | | 2-4.25 | | | 2-3.5 | | | 3.48 | | | 2/3 | | | 3/4 | | | 3.75/4 | | | 5 | |
| Fuel tax (cents per litre) 6 | | | | | | | | | | | | | | | | | | | | | | | | | | | | | | |
| Gasoline | | 24.46 | | | 21.84 | | | 23.84 | | | 22.84 | | | 31.87 | | | 29.7 | | | 29.5 | | | 25.5 | | | 25.1 | | | 32.5 | |
| Diesel | | 26.71 | | | 23.73 | | | 25.73 | | | 24.73 | | | 33.11 | | | 30.2 | | | 36.4 | | | 25.2 | | | 32.8 | | | 36.1 | |
| Sales tax (per cent) 7 | | | | | | | | | | | | | | | | | | | | | | | | | | | | | | |
| General rate | | 7 | | | Nil | | | 6 | | | 7 | | | 8 | | | 9.975 | | | 10 | | | 10 | | | 10 | | | 10 | |
| Tobacco tax ($ per carton of 200 cigarettes) 8 | | 59 | | | 55 | | | 61.71 | | | 69.41 | | | 45.86 | | | 29.80 | | | 63.59 | | | 72.39 | | | 67.99 | | | 72.34 | |
| 1 | In British Columbia (and some other provinces), the general rate applies to income from manufacturing and processing. |
| 2 | In Saskatchewan, small financial corporations pay the rate of 0.7 per cent on their capital. A small financial corporation has less than $1.5 billion in taxable capital. Large financial corporations are subject to the 4 per cent rate. Manitoba’s tax only applies to large financial corporations with taxable paid-up capital of at least $4 billion on taxable capital exceeding $10 million. Quebec’s tax only applies to life insurance companies. In New Brunswick, trust and loan companies are subject to the rate of 4 per cent, while banks are subject to the rate of 5 per cent. Financial institutions in Prince Edward Island pay tax on their paid-up capital exceeding $2 million. |
| 3 | British Columbia Medical Services Plan premiums were eliminated effective January 1, 2020. Ontario levies a health premium, as part of its provincial personal income tax system, of up to $900 per year per person. |
| 4 | Provinces with payroll taxes provide payroll tax relief for small businesses. Quebec also levies a compensation tax of up to 4.29 per cent on salaries and wages paid by financial institutions. |
| 5 | Lower rates apply to premiums for life, sickness and accident insurance; higher rates apply to premiums for property insurance including automobile insurance. In British Columbia, the highest rate applies to unlicensed insurance. In Manitoba, Ontario, Quebec and Newfoundland and Labrador, sales taxes also apply to certain insurance premiums except, generally, those related to individual life and health. |
| 6 | Tax rates are for regular fuel used on highways and include all provincial taxes payable by consumers at the pump. The British Columbia rates include |
6.75 cents per litre dedicated to the BC Transportation Financing Authority and the carbon tax rates of 9.96 cents per litre for gasoline and 11.71 cents per litre for diesel. The British Columbia rates do not include regional taxes that increase the gasoline and diesel rates by 12.5 cents per litre in the South Coast British Columbia Transportation Authority service region and by 5.5 cents per litre in the Capital Regional District. The rates for Ontario, Quebec, New Brunswick, Nova Scotia, Prince Edward Island, and Newfoundland and Labrador include provincial sales tax based on average pump prices as of February 2021. The rates for Alberta, Saskatchewan, Manitoba, and Ontario include federal carbon pricing backstop rates of 8.84 cents per litre for gasoline and 10.73 cents per litre for diesel. The rates for New Brunswick include a provincial carbon tax rate of 8.84 cents per litre for gasoline and
10.73 cents per litre for diesel. The rates for Prince Edward Island and Newfoundland and Labrador include provincial carbon tax rates of 6.63 cents per litre for gasoline and 8.05 cents per litre for diesel. Quebec’s rates do not include increased or reduced regional tax rates, such as an additional 3 cents per litre on gasoline in the Montreal area.
| 7 | Tax rates shown are statutory rates. Ontario, Quebec, New Brunswick, Nova Scotia, Prince Edward Island and Newfoundland and Labrador have harmonized their sales taxes with the federal GST. Alberta imposes a 4 per cent tax on short-term rental accommodation. |
| 8 | Includes estimated provincial sales tax in all provinces except British Columbia, Alberta and Quebec. |
Budget and Fiscal Plan - 2021/22 to 2023/24
147
Appendix
Table A3 Comparison of Provincial and Federal Taxes by Province – 2021
| Tax | | British Columbia | | | Alberta | | | Saskat-
chewan | | | Manitoba | | | Ontario | | | Quebec | | | New
Brunswick | | | Nova
Scotia | | | Prince
Edward
Island | | | New-
foundland
and
Labrador | |
| Two Income Family of Four - $120,000 | | | | | | | | | | | | | | ( $ | ) | | | | | | | | | | | | | |
| 1. Provincial Income Tax | | 5,154 | | | 6,798 | | | 7,099 | | | 9,594 | | | 6,675 | | | 11,118 | | | 9,903 | | | 11,323 | | | 10,734 | | | 9,785 | |
| Net Child Benefits | | (62 | ) | | 0 | | | 0 | | | - | | | 0 | | | (2,672 | ) | | 0 | | | 0 | | | - | | | 0 | |
| 2. Property Tax - Gross | | 5,646 | | | 3,787 | | | 3,350 | | | 4,672 | | | 6,056 | | | 4,347 | | | 3,144 | | | 5,689 | | | 5,756 | | | 2,457 | |
| - Net | | 5,076 | | | 3,787 | | | 3,350 | | | 4,672 | | | 6,056 | | | 4,347 | | | 3,144 | | | 5,689 | | | 5,756 | | | 2,457 | |
| 3. Sales Tax | | 1,717 | | | 0 | | | 1,523 | | | 2,069 | | | 2,279 | | | 2,990 | | | 2,676 | | | 2,601 | | | 2,361 | | | 2,682 | |
| 4. Fuel Tax | | 218 | | | 195 | | | 225 | | | 210 | | | 221 | | | 288 | | | 163 | | | 233 | | | 127 | | | 248 | |
| 5. Net Carbon Tax | | 348 | | | (589 | ) | | (592 | ) | | (315 | ) | | (154 | ) | | - | | | 124 | | | - | | | 124 | | | 124 | |
| 6. Provincial Direct Taxes | | 12,452 | | | 10,192 | | | 11,605 | | | 16,230 | | | 15,076 | | | 16,071 | | | 16,011 | | | 19,846 | | | 19,103 | | | 15,296 | |
| 7. Health Care Premiums | | - | | | - | | | - | | | - | | | - | | | - | | | - | | | - | | | - | | | - | |
| 8. Total Provincial Tax | | 12,452 | | | 10,192 | | | 11,605 | | | 16,230 | | | 15,076 | | | 16,071 | | | 16,011 | | | 19,846 | | | 19,103 | | | 15,296 | |
| 9. Federal Income Tax | | 13,351 | | | 13,351 | | | 13,351 | | | 13,351 | | | 13,351 | | | 13,320 | | | 13,351 | | | 13,351 | | | 13,351 | | | 13,351 | |
| 10. Net Federal GST | | 1,520 | | | 1,561 | | | 1,480 | | | 1,389 | | | 1,457 | | | 1,449 | | | 1,345 | | | 1,307 | | | 1,353 | | | 1,348 | |
| 11. Total Tax | | 27,323 | | | 25,104 | | | 26,436 | | | 30,970 | | | 29,884 | | | 30,840 | | | 30,706 | | | 34,504 | | | 33,806 | | | 29,995 | |
| Two Income Family of Four - $90,000 | | | | | | | | | | | | | | | | | | | | | | | | | | | | | | |
| 1. Provincial Income Tax | | 3,010 | | | 4,037 | | | 3,633 | | | 5,672 | | | 3,208 | | | 6,382 | | | 5,776 | | | 6,722 | | | 6,562 | | | 5,741 | |
| Net Child Benefits | | (1,196 | ) | | 0 | | | 0 | | | - | | | 0 | | | (3,806 | ) | | 0 | | | 0 | | | - | | | 0 | |
| 2. Property Tax - Gross | | 2,756 | | | 2,132 | | | 2,047 | | | 2,939 | | | 3,896 | | | 4,005 | | | 2,585 | | | 3,579 | | | 3,621 | | | 1,546 | |
| - Net | | 2,186 | | | 2,132 | | | 2,047 | | | 2,939 | | | 3,896 | | | 4,005 | | | 2,585 | | | 3,579 | | | 3,621 | | | 1,546 | |
| 3. Sales Tax | | 1,425 | | | 0 | | | 1,259 | | | 1,712 | | | 1,888 | | | 2,563 | | | 2,222 | | | 2,173 | | | 1,956 | | | 2,224 | |
| 4. Fuel Tax | | 218 | | | 195 | | | 225 | | | 210 | | | 221 | | | 288 | | | 163 | | | 233 | | | 127 | | | 248 | |
| 5. Net Carbon Tax | | 306 | | | (636 | ) | | (642 | ) | | (365 | ) | | (208 | ) | | - | | | 124 | | | _ | | | 124 | | | 124 | |
| 6. Provincial Direct Taxes | | 5,948 | | | 5,728 | | | 6,523 | | | 10,169 | | | 9,004 | | | 9,432 | | | 10,870 | | | 12,706 | | | 12,390 | | | 9,883 | |
| 7. Health Care Premiums | | - | | | - | | | - | | | - | | | - | | | - | | | - | | | - | | | - | | | - | |
| 8. Total Provincial Tax | | 5,948 | | | 5,728 | | | 6,523 | | | 10,169 | | | 9,004 | | | 9,432 | | | 10,870 | | | 12,706 | | | 12,390 | | | 9,883 | |
| 9. Federal Income Tax | | 7,762 | | | 7,762 | | | 7,762 | | | 7,762 | | | 7,762 | | | 7,750 | | | 7,762 | | | 7,762 | | | 7,762 | | | 7,762 | |
| 10. Net Federal GST | | 1,261 | | | 1,272 | | | 1,224 | | | 1,149 | | | 1,207 | | | 1,242 | | | 1,117 | | | 1,092 | | | 1,121 | | | 1,118 | |
| 11. Total Tax | | 14,972 | | | 14,762 | | | 15,509 | | | 19,080 | | | 17,973 | | | 18,424 | | | 19,749 | | | 21,560 | | | 21,273 | | | 18,763 | |
| Single Parent with One Child - $60,000 | | | | | | | | | | | | | | | | | | | | | | | | | | | | | | |
| 1. Provincial Income Tax | | 2,055 | | | 1,465 | | | 1,632 | | | 3,274 | | | 2,633 | | | 3,268 | | | 3,773 | | | 4,826 | | | 4,361 | | | 4,239 | |
| Net Child Benefits | | (700 | ) | | (38 | ) | | 0 | | | - | | | 0 | | | (2,320 | ) | | 0 | | | 0 | | | - | | | 0 | |
| 2. Property Tax | | - | | | - | | | - | | | - | | | - | | | - | | | - | | | - | | | - | | | - | |
| 3. Sales Tax | | 948 | | | 0 | | | 864 | | | 1,161 | | | 1,238 | | | 1,753 | | | 1,245 | | | 1,425 | | | 1,232 | | | 1,458 | |
| 4. Fuel Tax | | 218 | | | 195 | | | 225 | | | 210 | | | 221 | | | 288 | | | 163 | | | 233 | | | 127 | | | 248 | |
| 5. Net Carbon Tax | | 215 | | | (513 | ) | | (517 | ) | | (275 | ) | | (133 | ) | | - | | | 124 | | | - | | | 124 | | | 124 | |
| 6. Provincial Direct Taxes | | 2,736 | | | 1,109 | | | 2,205 | | | 4,371 | | | 3,959 | | | 2,989 | | | 5,306 | | | 6,484 | | | 5,844 | | | 6,069 | |
| 7. Health Care Premiums | | - | | | - | | | - | | | - | | | - | | | - | | | - | | | - | | | - | | | - | |
| 8. Total Provincial Tax | | 2,736 | | | 1,109 | | | 2,205 | | | 4,371 | | | 3,959 | | | 2,989 | | | 5,306 | | | 6,484 | | | 5,844 | | | 6,069 | |
| 9. Federal Income Tax | | 4,537 | | | 4,537 | | | 4,537 | | | 4,537 | | | 4,537 | | | 4,526 | | | 4,537 | | | 4,537 | | | 4,537 | | | 4,537 | |
| 10. Net Federal GST | | 839 | | | 887 | | | 840 | | | 779 | | | 792 | | | 849 | | | 752 | | | 716 | | | 748 | | | 733 | |
| 11. Total Tax | | 8,112 | | | 6,533 | | | 7,582 | | | 9,687 | | | 9,288 | | | 8,364 | | | 10,595 | | | 11,737 | | | 11,129 | | | 11,338 | |
| Unattached Individual - $30,000 | | | | | | | | | | | | | | | | | | | | | | | | | | | | | | |
| 1. Provincial Income Tax | | 606 | | | 784 | | | 808 | | | 1,166 | | | (279 | ) | | 188 | | | 1,269 | | | 1,160 | | | 1,651 | | | 1,538 | |
| 2. Property Tax | | - | | | - | | | - | | | - | | | - | | | - | | | - | | | - | | | - | | | - | |
| 3. Sales Tax | | 461 | | | 0 | | | 434 | | | 587 | | | 594 | | | 897 | | | 508 | | | 797 | | | 571 | | | 351 | |
| 4. Fuel Tax | | 218 | | | 195 | | | 225 | | | 210 | | | 221 | | | 288 | | | 163 | | | 233 | | | 127 | | | 248 | |
| 5. Net Carbon Tax | | (29 | ) | | (366 | ) | | (376 | ) | | (236 | ) | | (176 | ) | | - | | | 124 | | | - | | | 124 | | | 124 | |
| 6. Provincial Direct Taxes | | 1,256 | | | 614 | | | 1,091 | | | 1,727 | | | 359 | | | 1,373 | | | 2,064 | | | 2,190 | | | 2,473 | | | 2,261 | |
| 7. Health Care Premiums | | - | | | - | | | - | | | - | | | - | | | - | | | - | | | - | | | - | | | - | |
| 8. Total Provincial Tax | | 1,256 | | | 614 | | | 1,091 | | | 1,727 | | | 359 | | | 1,373 | | | 2,064 | | | 2,190 | | | 2,473 | | | 2,261 | |
| 9. Federal Income Tax | | 2,030 | | | 2,030 | | | 2,030 | | | 2,030 | | | 2,030 | | | 2,026 | | | 2,030 | | | 2,030 | | | 2,030 | | | 2,030 | |
| 10. Net Federal GST | | (21 | ) | | (1 | ) | | (22 | ) | | (39 | ) | | 3 | | | (10 | ) | | (45 | ) | | (51 | ) | | (53 | ) | | (48 | ) |
| 11. Total Tax | | 3,265 | | | 2,643 | | | 3,099 | | | 3,718 | | | 2,392 | | | 3,389 | | | 4,049 | | | 4,169 | | | 4,451 | | | 4,242 | |
Budget and Fiscal Plan - 2021/22 to 2023/24
148
Appendix
Table A3 Comparison of Provincial and Federal Taxes by Province – 2021 (continued)
| Tax | | British Columbia | | | Alberta | | | Saskat-
chewan | | | Manitoba | | | Ontario | | | Quebec | | | New
Brunswick | | | Nova
Scotia | | | Prince
Edward
Island | | | New-
foundland
and
Labrador | |
| Unattached Individual - $80,000 | | | | | | | | | | | | | | ( $ ) | | | | | | | | | | | | | | | | |
| 1. Provincial Income Tax | | 4,095 | | | 5,426 | | | 6,661 | | | 7,239 | | | 5,241 | | | 8,888 | | | 7,829 | | | 9,009 | | | 8,420 | | | 7,872 | |
| 2. Property Tax - Gross | | 2,323 | | | 1,869 | | | 1,548 | | | 2,802 | | | 3,555 | | | 2,817 | | | 3,282 | | | 3,412 | | | 3,452 | | | 1,474 | |
| - Net | | 1,753 | | | 1,869 | | | 1,548 | | | 2,802 | | | 3,555 | | | 2,817 | | | 3,282 | | | 3,412 | | | 3,452 | | | 1,474 | |
| 3. Sales Tax | | 1,226 | | | 0 | | | 1,092 | | | 1,491 | | | 1,717 | | | 2,085 | | | 1,988 | | | 1,921 | | | 1,717 | | | 1,986 | |
| 4. Fuel Tax | | 218 | | | 195 | | | 225 | | | 210 | | | 221 | | | 288 | | | 163 | | | 233 | | | 127 | | | 248 | |
| 5. Net Carbon Tax | | 274 | | | (182 | ) | | (180 | ) | | (42 | ) | | 51 | | | -- | | | 124 | | | -- | | | 124 | | | 124 | |
| 6. Provincial Direct Taxes | | 7,565 | | | 7,307 | | | 9,347 | | | 11,699 | | | 10,784 | | | 14,078 | | | 13,387 | | | 14,574 | | | 13,841 | | | 11,703 | |
| 7. Health Care Premiums | | -- | | | -- | | | -- | | | -- | | | -- | | | -- | | | -- | | | -- | | | -- | | | -- | |
| 8. Total Provincial Tax | | 7,565 | | | 7,307 | | | 9,347 | | | 11,699 | | | 10,784 | | | 14,078 | | | 13,387 | | | 14,574 | | | 13,841 | | | 11,703 | |
| 9. Federal Income Tax | | 10,552 | | | 10,552 | | | 10,552 | | | 10,552 | | | 10,552 | | | 10,527 | | | 10,552 | | | 10,552 | | | 10,552 | | | 10,552 | |
| 10. Net Federal GST | | 1,150 | | | 1,175 | | | 1,084 | | | 1,051 | | | 1,100 | | | 1,030 | | | 1,005 | | | 971 | | | 1,010 | | | 1,004 | |
| 11. Total Tax | | 19,267 | | | 19,035 | | | 20,983 | | | 23,303 | | | 22,436 | | | 25,635 | | | 24,944 | | | 26,097 | | | 25,403 | | | 23,259 | |
| | | | | | | | | | | | | | | | | | | | | | | | | | | | | | | |
| Senior Couple with Equal Pension Incomes - $40,000 | | | | | | | | | | | | | | | | | | | | | | | | | | | | | | |
| 1. Provincial Income Tax | | 0 | | | 0 | | | (488 | ) | | (261 | ) | | (1,576 | ) | | (1,036 | ) | | 0 | | | 310 | | | 933 | | | 5 | |
| 2. Property Tax - Gross | | 2,756 | | | 2,132 | | | 2,047 | | | 2,939 | | | 3,896 | | | 4,005 | | | 2,585 | | | 3,579 | | | 3,621 | | | 1,546 | |
| - Net | | 1,911 | | | 2,132 | | | 2,047 | | | 2,939 | | | 3,896 | | | 4,005 | | | 2,585 | | | 3,579 | | | 3,621 | | | 1,546 | |
| 3. Sales Tax | | 937 | | | 0 | | | 896 | | | 1,209 | | | 1,211 | | | 1,792 | | | 1,307 | | | 1,700 | | | 1,249 | | | 1,360 | |
| 4. Fuel Tax | | 218 | | | 195 | | | 225 | | | 210 | | | 221 | | | 288 | | | 163 | | | 233 | | | 127 | | | 248 | |
| 5. Net Carbon Tax | | 0 | | | (343 | ) | | (342 | ) | | (135 | ) | | (4 | ) | | -- | | | 124 | | | -- | | | 124 | | | 124 | |
| 6. Provincial Direct Taxes | | 3,065 | | | 1,985 | | | 2,337 | | | 3,962 | | | 3,748 | | | 5,050 | | | 4,179 | | | 5,822 | | | 6,054 | | | 3,283 | |
| 7. Health Care Premiums | | -- | | | -- | | | -- | | | -- | | | -- | | | -- | | | -- | | | -- | | | -- | | | -- | |
| 8. Total Provincial Tax | | 3,065 | | | 1,985 | | | 2,337 | | | 3,962 | | | 3,748 | | | 5,050 | | | 4,179 | | | 5,822 | | | 6,054 | | | 3,283 | |
| 9. Federal Income Tax | | 0 | | | 0 | | | 0 | | | 0 | | | 0 | | | 0 | | | 0 | | | 0 | | | 0 | | | 0 | |
| 10. Net Federal GST | | 422 | | | 468 | | | 445 | | | 398 | | | 402 | | | 358 | | | 385 | | | 332 | | | 341 | | | 416 | |
| 11. Total Tax | | 3,487 | | | 2,453 | | | 2,782 | | | 4,360 | | | 4,150 | | | 5,407 | | | 4,564 | | | 6,154 | | | 6,395 | | | 3,699 | |
Personal Income Tax
| • | Income tax is based on basic personal credits, applicable credits and typical major deductions at each income level. Quebec residents pay federal income tax less an abatement of 16.5 per cent of basic federal tax. This abatement has been used to reduce Quebec provincial tax rather than federal tax, for comparative purposes. |
| • | The amounts noted for each family are their family total incomes. Total income is used for these tables as it provides a more accurate view of the taxes paid by a family at a particular level of earnings. The two income family of four with $120,000 of income is assumed to have one spouse earning $80,000 and the other $40,000, the family with $90,000 of income is assumed to have one spouse earning $50,000 and the other $40,000, and each spouse in the senior couple is assumed to have $20,000 of income. The senior couple is assumed to have pension income and the remaining representative families are assumed to have employment income. |
Net Child Benefits
| • | Net child benefits are provincial measures affecting payments to families with children. Provincial child benefit measures are available in B.C. (BC Child Opportunity Benefit), Alberta (Alberta Child and Family Benefit), Ontario (Child Benefit), Quebec (Child Assistance Payments), New Brunswick (Child Tax Benefit), Nova Scotia (Child Benefit) and Newfoundland and Labrador (Child Benefit). |
| • | The single parent is assumed to have one child aged 5. The family earning $90,000 of income is assumed to have two children aged 5 and 7. The family earning $120,000 of income is assumed to have two children aged 15 and 17. |
Property Tax
| • | Property taxes are based on a representative two-storey home, townhouse or condominium in a major city in each respective province. |
| • | It is assumed that the single parent and the individual at $30,000 of income rent accommodation, the family at $90,000 of income and senior couple own townhouses, the family at $120,000 of income owns a single family detached home, and the individual at $80,000 of income owns a condominium in a major city for each province. Net local and provincial property taxes are estimated as taxes owing, after credits provided through the property tax system are subtracted. |
Sales Tax
| • | Estimates are based on expenditure patterns from the Survey of Household Spending. In estimating individual and family taxable consumption, disposable income is reduced by 20 per cent to reflect housing (mortgage and property taxes or rent) costs. The senior couple is assumed to own their home and have no mortgage costs. For each province, disposable income is further reduced by estimated federal and provincial income taxes. In addition, the single individual with $80,000 of income and the family with $90,000 of income are assumed to have savings equal to 5 per cent of their disposable income. For each family, disposable income is distributed among expenditures using the consumption pattern of a typical family with the relevant characteristics as estimated using family expenditure data, and the relevant sales tax component is extracted. Sales tax includes provincial retail sales taxes in British Columbia, Saskatchewan, and Manitoba; Quebec’s value-added tax; the provincial component of the harmonized sales tax in Ontario, New Brunswick, Nova Scotia, Prince Edward Island and Newfoundland and Labrador; and Alberta’s Tourism Levy. Sales tax estimates have been reduced by sales tax credits where applicable. |
Fuel and Carbon Taxes
| • | Fuel tax is based on annual consumption: all families are assumed to consume 1,500 litres of gasoline. |
| • | Net carbon tax is estimated as carbon tax liabilities minus rebates such as B.C.’s climate action tax credit, where applicable. Carbon tax liabilities are based on direct fuel charges on gasoline, natural gas and home heating fuel where such charges apply (fuel charges do not apply to home heating fuel in New Brunswick, Prince Edward Island and Newfoundland and Labrador). Estimated carbon tax liabilities are based on natural gas and home heating fuel consumption amounts from household energy consumption data produced by Natural Resources Canada. Carbon tax liabilities do not include the effect of cap-and-trade or output-based pricing systems. |
| • | The federal government requires provinces to implement a price on carbon of at least $40/tonne of CO2e starting April 2021 and $50/tonne of CO2e starting April 2022. Provinces that do not have a carbon pricing program have the federal carbon pricing backstop rates applied to the price of the fuel. As of December 31, 2020, Ontario, Manitoba, Saskatchewan and Alberta are subject to the federal carbon pricing on fuel purchases. Families in these provinces receive the federal climate action incentive to offset the cost of the carbon pricing. |
Health Care Premiums
| • | B.C. Medical Services Plan premiums were eliminated January 1, 2020. |
Effective Tax Rates
| • | B.C. taxes are calculated using rates in effect for 2021. Taxes for other provinces are calculated using rates that were announced prior to February 28, 2021, and that come into effect during 2021. The effect of federal or provincial COVID-19-related measures are not included in the table. |
Budget and Fiscal Plan - 2021/22 to 2023/24
149
Appendix
| Table A4 | Interprovincial Comparisons of Provincial Personal Income Taxes Payable1 – 2021
(Rates known as of February 28, 2021) |
| Taxable income | | | British
Columbia | | | Alberta | | | Saskat-
chewan | | | Manitoba | | | Ontario | | | Quebec2 | | | New
Brunswick | | | Nova
Scotia | | | Prince
Edward
Island | | | New-
foundland
and
Labrador | |
| | | | | Annual provincial taxes payable 3 ($) | |
| $ | 10,000 | | | | 0 | | | | 0 | | | | 0 | | | | 0 | | | | 0 | | | | 0 | | | | 0 | | | | 0 | | | | 0 | | | | 0 | |
| $ | 20,000 | | | | 0 | | | | 0 | | | | 269 | | | | 926 | | | | 0 | | | | 56 | | | | 180 | | | | 595 | | | | 516 | | | | 0 | |
| $ | 30,000 | | | | 681 | | | | 871 | | | | 1,245 | | | | 1,960 | | | | 319 | | | | 1,319 | | | | 1,379 | | | | 1,514 | | | | 1,736 | | | | 1,613 | |
| $ | 40,000 | | | | 1,331 | | | | 1,801 | | | | 2,221 | | | | 3,083 | | | | 1,788 | | | | 2,648 | | | | 2,577 | | | | 3,001 | | | | 2,965 | | | | 2,523 | |
| $ | 50,000 | | | | 2,002 | | | | 2,731 | | | | 3,279 | | | | 4,281 | | | | 2,597 | | | | 4,282 | | | | 3,801 | | | | 4,488 | | | | 4,279 | | | | 3,909 | |
| $ | 60,000 | | | | 2,738 | | | | 3,666 | | | | 4,460 | | | | 5,485 | | | | 3,478 | | | | 5,950 | | | | 5,218 | | | | 5,989 | | | | 5,599 | | | | 5,300 | |
| $ | 70,000 | | | | 3,503 | | | | 4,658 | | | | 5,701 | | | | 6,751 | | | | 4,388 | | | | 7,612 | | | | 6,691 | | | | 7,701 | | | | 7,137 | | | | 6,742 | |
| $ | 80,000 | | | | 4,273 | | | | 5,658 | | | | 6,951 | | | | 8,343 | | | | 5,453 | | | | 9,274 | | | | 8,173 | | | | 9,396 | | | | 8,807 | | | | 8,238 | |
| $ | 100,000 | | | | 6,294 | | | | 7,658 | | | | 9,451 | | | | 11,823 | | | | 8,017 | | | | 12,916 | | | | 11,341 | | | | 12,786 | | | | 12,147 | | | | 11,398 | |
| $ | 125,000 | | | | 9,537 | | | | 10,158 | | | | 12,576 | | | | 16,173 | | | | 12,369 | | | | 18,085 | | | | 15,471 | | | | 17,161 | | | | 16,705 | | | | 15,348 | |
| $ | 150,000 | | | | 13,212 | | | | 13,027 | | | | 16,085 | | | | 20,523 | | | | 16,722 | | | | 23,450 | | | | 19,696 | | | | 21,536 | | | | 21,297 | | | | 19,504 | |
| | | | | | | | | | | | | | | | | | | | | | | | | | | | | | | | | | | | | | | | | | | |
| | | | | Provincial personal income taxes as a per cent of taxable income (%) | |
| $ | 10,000 | | | | 0.0 | | | | 0.0 | | | | 0.0 | | | | 0.0 | | | | 0.0 | | | | 0.0 | | | | 0.0 | | | | 0.0 | | | | 0.0 | | | | 0.0 | |
| $ | 20,000 | | | | 0.0 | | | | 0.0 | | | | 1.3 | | | | 4.6 | | | | 0.0 | | | | 0.3 | | | | 0.9 | | | | 3.0 | | | | 2.6 | | | | 0.0 | |
| $ | 30,000 | | | | 2.3 | | | | 2.9 | | | | 4.1 | | | | 6.5 | | | | 1.1 | | | | 4.4 | | | | 4.6 | | | | 5.0 | | | | 5.8 | | | | 5.4 | |
| $ | 40,000 | | | | 3.3 | | | | 4.5 | | | | 5.6 | | | | 7.7 | | | | 4.5 | | | | 6.6 | | | | 6.4 | | | | 7.5 | | | | 7.4 | | | | 6.3 | |
| $ | 50,000 | | | | 4.0 | | | | 5.5 | | | | 6.6 | | | | 8.6 | | | | 5.2 | | | | 8.6 | | | | 7.6 | | | | 9.0 | | | | 8.6 | | | | 7.8 | |
| $ | 60,000 | | | | 4.6 | | | | 6.1 | | | | 7.4 | | | | 9.1 | | | | 5.8 | | | | 9.9 | | | | 8.7 | | | | 10.0 | | | | 9.3 | | | | 8.8 | |
| $ | 70,000 | | | | 5.0 | | | | 6.7 | | | | 8.1 | | | | 9.6 | | | | 6.3 | | | | 10.9 | | | | 9.6 | | | | 11.0 | | | | 10.2 | | | | 9.6 | |
| $ | 80,000 | | | | 5.3 | | | | 7.1 | | | | 8.7 | | | | 10.4 | | | | 6.8 | | | | 11.6 | | | | 10.2 | | | | 11.7 | | | | 11.0 | | | | 10.3 | |
| $ | 100,000 | | | | 6.3 | | | | 7.7 | | | | 9.5 | | | | 11.8 | | | | 8.0 | | | | 12.9 | | | | 11.3 | | | | 12.8 | | | | 12.1 | | | | 11.4 | |
| $ | 125,000 | | | | 7.6 | | | | 8.1 | | | | 10.1 | | | | 12.9 | | | | 9.9 | | | | 14.5 | | | | 12.4 | | | | 13.7 | | | | 13.4 | | | | 12.3 | |
| $ | 150,000 | | | | 8.8 | | | | 8.7 | | | | 10.7 | | | | 13.7 | | | | 11.1 | | | | 15.6 | | | | 13.1 | | | | 14.4 | | | | 14.2 | | | | 13.0 | |
| 1 | Calculated for a single individual with wage income and claiming credits for Canada Pension Plan and Quebec Pension Plan contributions, Employment Insurance premiums, Quebec Parental Insurance Plan premiums, and the basic personal amount. |
| 2 | Quebec residents pay federal tax less an abatement of 16.5 per cent of federal tax. In the table, the Quebec abatement has been used to reduce Quebec provincial personal income tax for comparative purposes. |
| 3 | Includes provincial low income reductions, surtaxes payable in Ontario and Prince Edward Island, and the Ontario Health Premium tax. Excludes credits for sales and property tax credits. |
Budget And Fiscal Plan - 2021/22 to 2023/24
150
Appendix
Table A4.1 Net Provincial Taxes Since Budget 2016
| Tax | | 2016 | | | 2017 | | | 2018 | | | 2019 | | | 2020 | | | 2021 | |
| $30,000 of Family Net Income | | ($) | |
| 1. MSP Premiums | | | 0 | | | | 0 | | | | 0 | | | | 0 | | | | - | | | | - | |
| 2. Provincial Income Tax | | | 0 | | | | 0 | | | | 0 | | | | 0 | | | | (1,000 | ) | | | 0 | |
| 3. Early Childhood Tax Benefit | | | (660 | ) | | | (660 | ) | | | (660 | ) | | | (660 | ) | | | (495 | ) | | | - | |
| 4. BC Child Opportunity Benefit | | | - | | | | - | | | | - | | | | - | | | | (600 | ) | | | (2,406 | ) |
| 5. Carbon Tax | | | (126 | ) | | | (126 | ) | | | (129 | ) | | | (150 | ) | | | (645 | ) | | | (193 | ) |
| 6. Sales Tax | | | 818 | | | | 830 | | | | 839 | | | | 845 | | | | 940 | | | | 1,022 | |
| 7. Fuel Tax | | | 145 | | | | 145 | | | | 145 | | | | 145 | | | | 145 | | | | 145 | |
| 8. Net Provincial Tax | | | 177 | | | | 189 | | | | 195 | | | | 180 | | | | (1,655 | ) | | | (1,432 | ) |
| | | | | | | | | | | | | | | | | | | | | | | | | |
| $60,000 of Family Net Income | | | | | | | | | | | | | | | | | | | | | | | | |
| 1. MSP Premiums | | | 1,800 | | | | 1,800 | | | | 900 | | | | 900 | | | | - | | | | - | |
| 2. Provincial Income Tax | | | 1,714 | | | | 1,663 | | | | 1,595 | | | | 1,505 | | | | 416 | | | | 1,361 | |
| 3. Early Childhood Tax Benefit | | | (660 | ) | | | (660 | ) | | | (660 | ) | | | (660 | ) | | | (495 | ) | | | - | |
| 4. BC Child Opportunity Benefit | | | - | | | | - | | | | - | | | | - | | | | (345 | ) | | | (1,380 | ) |
| 5. Carbon Tax | | | 208 | | | | 208 | | | | 233 | | | | 261 | | | | (224 | ) | | | 217 | |
| 6. Sales Tax | | | 958 | | | | 969 | | | | 1,003 | | | | 1,025 | | | | 1,164 | | | | 1,210 | |
| 7. Fuel Tax | | | 218 | | | | 218 | | | | 218 | | | | 218 | | | | 218 | | | | 218 | |
| 8. Net Provincial Tax | | | 4,238 | | | | 4,198 | | | | 3,289 | | | | 3,249 | | | | 734 | | | | 1,626 | |
| | | | | | | | | | | | | | | | | | | | | | | | | |
| $80,000 of Family Net Income | | | | | | | | | | | | | | | | | | | | | | | | |
| 1. MSP Premiums | | | 1,800 | | | | 1,800 | | | | 900 | | | | 900 | | | | - | | | | - | |
| 2. Provincial Income Tax | | | 2,869 | | | | 2,824 | | | | 2,761 | | | | 2,713 | | | | 1,682 | | | | 2,662 | |
| 3. Early Childhood Tax Benefit | | | (660 | ) | | | (660 | ) | | | (660 | ) | | | (660 | ) | | | (495 | ) | | | - | |
| 4. BC Child Opportunity Benefit | | | - | | | | - | | | | - | | | | - | | | | (345 | ) | | | (1,380 | ) |
| 5. Carbon Tax | | | 236 | | | | 236 | | | | 265 | | | | 305 | | | | (59 | ) | | | 348 | |
| 6. Sales Tax | | | 1,174 | | | | 1,184 | | | | 1,215 | | | | 1,245 | | | | 1,357 | | | | 1,491 | |
| 7. Fuel Tax | | | 218 | | | | 218 | | | | 218 | | | | 218 | | | | 218 | | | | 218 | |
| 8. Net Provincial Tax | | | 5,637 | | | | 5,602 | | | | 4,699 | | | | 4,721 | | | | 2,358 | | | | 3,339 | |
| | | | | | | | | | | | | | | | | | | | | | | | | |
| $100,000 of Family Net Income | | | | | | | | | | | | | | | | | | | | | | | | |
| 1. MSP Premiums | | | 1,800 | | | | 1,800 | | | | 900 | | | | 900 | | | | - | | | | - | |
| 2. Provincial Income Tax | | | 4,340 | | | | 4,298 | | | | 4,234 | | | | 4,148 | | | | 3,062 | | | | 4,004 | |
| 3. Early Childhood Tax Benefit | | | (660 | ) | | | (660 | ) | | | (660 | ) | | | (660 | ) | | | (495 | ) | | | - | |
| 4. BC Child Opportunity Benefit | | | - | | | | - | | | | - | | | | - | | | | (145 | ) | | | (598 | ) |
| 5. Carbon Tax | | | 269 | | | | 269 | | | | 303 | | | | 348 | | | | 86 | | | | 397 | |
| 6. Sales Tax | | | 1,434 | | | | 1,447 | | | | 1,480 | | | | 1,527 | | | | 1,633 | | | | 1,659 | |
| 7. Fuel Tax | | | 290 | | | | 290 | | | | 290 | | | | 290 | | | | 290 | | | | 290 | |
| 8. Net Provincial Tax | | | 7,473 | | | | 7,444 | | | | 6,547 | | | | 6,553 | | | | 4,431 | | | | 5,752 | |
Personal Income Tax
| • | For each family, the amount noted is the family net income. Net income forms the basis of many benefits provided through the tax system and, therefore, will provide a more accurate illustration of benefits received and premiums paid by a family at their respective family net income level. Income tax is calculated based on applicable tax rates and credits. All families are assumed to have each spouse earning an equal amount of employment income. |
| • | Families are assumed to have two children aged 5 and 12. |
Net Child Benefits
| • | Net child benefits are provincial measures affecting payments to families with children. The BC early childhood tax benefit was in effect until September 2020. The BC Child Opportunity Benefit was effective October 1, 2020. |
Sales, Fuel and Carbon Tax Estimates
| • | Disposable income is estimated based on the total amounts received in 2016 and then adjusted for inflation. In estimating taxable consumption, disposable income is reduced by 20 per cent to reflect rent. Cost of groceries and utilities are estimated based on the Survey of Household Spending and subtracted, thereafter. |
| • | For each family, income after rent, groceries and utilities is distributed among the remaining expenditures using the consumption pattern of a typical family with two children estimated based on expenditure patterns from the Survey of Household Spending. The relevant sales tax component is extracted based on the estimates. |
| • | Fuel tax is based on annual consumption: 1,000 litres of fuel for the family at $30,000; 1,500 litres of fuel for the family at $60,000 and at $80,000; and 2,000 of fuel for the family at $100,000. |
| • | Net carbon tax is estimated as carbon tax liabilities minus the BC climate action tax credit. Carbon tax liabilities are based on direct fuel charges on gasoline, natural gas and home heating fuel. Estimated carbon tax liabilities are based on natural gas and home heating fuel consumption amounts from household energy consumption data from Natural Resources Canada. |
Health Care Premiums
| • | B.C. Medical Services Plan premiums were eliminated January 1, 2020. This table assumes that the full Medical Services Plan premium is paid by the family and not paid by the employer. |
COVID-19 Relief in 2020
| • | As part of COVID-19 relief, a one-time enhancement to the climate action tax credit was paid with the July 2020 payment. The amount of the benefit is included in net carbon taxes. |
| • | The BC Recovery Benefit provided families up to $1,000 per family reduced by family net income over $125,000. Payments for the benefit commenced in December 2020. The amount of the benefit is net against provincial income taxes for 2020. |
Budget And Fiscal Plan - 2021/22 to 2023/24
151
Appendix
Table A5 Material Assumptions – Revenue
Revenue Source and Assumptions
($ millions unless otherwise specified) | | Updated
Forecast
2020/21 | | | Budget
Estimate
2021/22 | | | Plan
2022/23 | | | Plan
2023/24 | | | 2021/22 Sensitivities |
| Personal income tax * | | | 11,118 | | | | 11,170 | | | | 11,565 | | | | 12,047 | | | |
| Current calendar year assumptions | | | | | | | | | | | | | | | | | | |
| Household income growth | | | 4.9 | % | | | 0.8 | % | | | 2.8 | % | | | 3.4 | % | | +/- 1 percentage point change in |
| Compensation of employees growth | | | -0.7 | % | | | 4.5 | % | | | 4.0 | % | | | 3.7 | % | | 2021 B.C. household income growth |
| Tax base growth | | | 4.9 | % | | | 0.0 | % | | | 2.4 | % | | | 3.2 | % | | equals +/- $100 to $120 million |
| Average tax yield | | | 5.48 | % | | | 5.53 | % | | | 5.58 | % | | | 5.63 | % | | |
| Current-year tax | | | 10,720 | | | | 10,819 | | | | 11,177 | | | | 11,634 | | | |
| Prior year’s tax assessments | | | 470 | | | | 450 | | | | 460 | | | | 470 | | | |
| Unapplied taxes | | | 100 | | | | 100 | | | | 100 | | | | 100 | | | |
| B.C. Tax Reduction | | | (190 | ) | | | (185 | ) | | | (182 | ) | | | (180 | ) | | |
| Non-refundable B.C. tax credits | | | (104 | ) | | | (114 | ) | | | (114 | ) | | | (114 | ) | | |
| Policy neutral elasticity ** | | | 1.0 | | | | 1.2 | | | | 1.2 | | | | 1.2 | | | +/- 0.5 change in 2021 B.C. |
| Fiscal year assumptions | | | | | | | | | | | | | | | | | | policy neutral elasticity |
| Prior-year adjustment | | | 97 | | | | | | | | | | | | | | | equals -/+ $40 to $50 million |
| | | | | | | | | | | | | | | | | | | |
| 2019 Tax-year | | | 2019 Assumptions | | | | | | | | | | | |
| Household income growth | | | 6.5 | % | | | | | | | | | | | | | | +/- 1 percentage point change in 2020 |
| Tax base growth | | | 5.6 | % | | | | | | | | | | | | | | B.C. household or taxable income |
| Average 2019 tax yield | | | 5.57 | % | | | | | | | | | | | | | | growth equals +/- $120 to $140 |
| 2019 tax | | | 10,387 | | | | | | | | | | | | | | | million one-time effect |
| 2018 & prior year’s tax assessments | | | 440 | | | | | | | | | | | | | | | (prior-year adjustment) |
| Unapplied taxes | | | 248 | | | | | | | | | | | | | | | and could result in an |
| B.C. Tax Reduction | | | (168 | ) | | | | | | | | | | | | | | additional +/- $100 to $120 million |
| Non-refundable B.C. tax credits | | | (120 | ) | | | | | | | | | | | | | | base change in 2021/22 |
| Policy neutral elasticity ** | | | 0.6 | | | | | | | | | | | | | | | |
| | | | | | | | | | | | | | | | | | | |
| * Reflects information as at March 18, 2021 | | | | | | | | | | | | | | | | | | |
| ** Per cent growth in current year tax revenue (excluding policy measures) relative to per cent growth in household income (calendar year). |
| |
| Corporate income tax * | | | 4,807 | | | | 3,409 | | | | 5,728 | | | | 5,736 | | | |
| Components of revenue (fiscal year) | | | | | | | | | | | | | | | | | | |
| Instalments – subject to general rate | | | 4,707 | | | | 4,226 | | | | 5,264 | | | | 5,568 | | | |
| Instalments – subject to small business rate | | | 289 | | | | 257 | | | | 315 | | | | 326 | | | |
| Non-refundable B.C. tax credits | | | (97 | ) | | | (112 | ) | | | (117 | ) | | | (122 | ) | | |
| Advance instalments | | | 4,899 | | | | 4,371 | | | | 5,462 | | | | 5,772 | | | |
| Prior-year settlement payment | | | (92 | ) | | | (962 | ) | | | 266 | | | | (36 | ) | | |
| Current calendar year assumptions | | | | | | | | | | | | | | | | | | |
| National tax base ($ billions) | | | 376.0 | | | | 356.4 | | | | 391.1 | | | | 428.7 | | | +/- 1% change in the 2021 |
| B.C. instalment share of national tax base | | | 14.4 | % | | | 13.3 | % | | | 14.4 | % | | | 14.3 | % | | national tax base equals |
| Effective percentage tax rates (% general/small business) | | | 12.0 / 2.0 | | | | 12.0 / 2.0 | | | | 12.0 / 2.0 | | | | 12.0 / 2.0 | | | +/- $40 to $50 million |
| Share of the B.C. tax base subject to the small business rate | | | 26.9 | % | | | 26.8 | % | | | 26.5 | % | | | 26.3 | % | | +/- 1 percentage point change in the |
| B.C. tax base growth (post federal measures) | | | -4.0 | % | | | 10.1 | % | | | 9.0 | % | | | 3.8 | % | | 2021 small business share equals |
| B.C. net operating surplus growth | | | -13.6 | % | | | 9.2 | % | | | 8.8 | % | | | 3.3 | % | | -/+ $40 to $50 million |
| | | | | | | | | | | | | | | | | | | |
| 2019 Tax-year | | | 2019 Assumptions | | | | | | | | | | | |
| B.C. tax base growth (post federal measures) | | | -6.2 | % | | | | | | | | | | | | | | |
| Share of the B.C. tax base subject to small business rate | | | 28.7 | % | | | | | | | | | | | | | | +/- 1% change in the 2020 B.C. tax base |
| B.C. net operating surplus growth | | | -7.0 | % | | | | | | | | | | | | | | equals +/- $40 to $50 million one-time effect |
| Gross 2019 tax | | | 4,486 | | | | | | | | | | | | | | | (prior-year adjustment) and could result in an |
| Prior-year settlement payment | | | (92 | ) | | | | | | | | | | | | | | additional instalments payments of |
| Prior years losses/gains (included in above) | | | (55 | ) | | | | | | | | | | | | | | +/- $60 to $70 million in 2021/22 |
| Non-refundable B.C. tax credits | | | (75 | ) | | | | | | | | | | | | | | |
* Reflects information as at March 18, 2021
Cash received from the federal government is used as the basis for estimating revenue. Due to lags in the federal collection and instalment systems, changes to the B.C. net operating surplus and tax base forecasts affect revenue in the succeeding year. The 2021/22 instalments from the federal government reflects two-third of payments related to the 2021 tax year (paid during Apr-July 2021 and adjusted in Sept and Dec) and one-third of 2022 payments. Instalments for the 2021 (2022) tax year are based on B.C.’s share of the national tax base for the 2020 (2021) tax year and a forecast of the 2021 (2022) national tax base. B.C.’s share of the 2019 national tax base was 14.1%, based on tax assessments as of December 31, 2020. Cash adjustments for any under/over payments from the federal government in respect of 2020 will be received/paid on March 31, 2022.
Budget And Fiscal Plan - 2021/22 to 2023/24
152
Appendix
Table A5 Material Assumptions – Revenue (continued)
Revenue Source and Assumptions
($ millions unless otherwise specified) | | Updated
Forecast
2020/21 | | | Budget
Estimate
2021/22 | | | Plan
2022/23 | | | Plan
2023/24 | | | 2021/22 Sensitivities |
| Employer health tax | | | 1,840 | | | | 1,923 | | | | 2,000 | | | | 2,073 | | | |
| Compensation of employees growth | | | -0.7 | % | | | 4.5 | % | | | 4.0 | % | | | 3.7 | % | | +/- 1 percentage point change in the |
| | | | | | | | | | | | | | | | | | | 2021 compensation of employees |
| | | | | | | | | | | | | | | | | | | growth equals up to +/- $20 million |
| Provincial sales tax | | | 7,446 | | | | 7,872 | | | | 8,492 | | | | 8,865 | | | |
| Provincial sales tax base growth (fiscal year) | | | -2.2 | % | | | 5.0 | % | | | 4.8 | % | | | 4.5 | % | | +/- 1 percentage point change in the |
| Calendar Year nominal expenditure | | | | | | | | | | | | | | | | | | 2021 consumer expenditure growth |
| Consumer expenditures on durable goods | | | -2.3 | % | | | 2.6 | % | | | 3.1 | % | | | 2.8 | % | | equals up to +/- $20 million |
| Consumer expenditures on goods and services | | | -4.8 | % | | | 5.3 | % | | | 5.9 | % | | | 5.7 | % | | |
| Business investment | | | -9.3 | % | | | 5.6 | % | | | 6.4 | % | | | 6.3 | % | | |
| Other | | | -4.4 | % | | | 7.8 | % | | | 4.9 | % | | | 3.9 | % | | |
| Components of Provincial sales tax revenue | | | | | | | | | | | | | | | | | | +/- 1 percentage point change in the |
| Consolidated Revenue Fund | | | 7,436 | | | | 7,867 | | | | 8,487 | | | | 8,860 | | | 2021 business investment growth BC |
| Transportation Financing Authority | | | 10 | | | | 5 | | | | 5 | | | | 5 | | | equals up to +/- $10 million |
| | | | | | | | | | | | | | | | | | | |
| Fuel and carbon taxes | | | 2,573 | | | | 2,968 | | | | 3,213 | | | | 3,085 | | | |
| Calendar Year | | | | | | | | | | | | | | | | | | |
| Real GDP | | | -5.3 | % | | | 4.4 | % | | | 3.8 | % | | | 2.2 | % | | |
| Gasoline volumes | | | -3.0 | % | | | 5.0 | % | | | 0.0 | % | | | -5.0 | % | | |
| Diesel volumes | | | -2.0 | % | | | 5.0 | % | | | 2.0 | % | | | 2.0 | % | | |
| Natural gas volumes | | | -8.0 | % | | | 5.0 | % | | | 3.8 | % | | | 2.2 | % | | |
| Carbon tax rates (April 1) | | | | | | | | | | | | | | | | | | |
| Carbon dioxide equivalent emissions ($/tonne) | | | 40 | | | | 45 | | | | 50 | | | | 50 | | | |
| Natural gas (cents/gigajoule) | | | 198.64 | ¢ | | | 223.47 | ¢ | | | 248.30 | ¢ | | | 248.30 | ¢ | | |
| Gasoline (cents/litre) | | | 8.89 | ¢ | | | 9.96 | ¢ | | | 11.05 | ¢ | | | 11.05 | ¢ | | |
| Light fuel oil (cents/litre) | | | 10.23 | ¢ | | | 11.71 | ¢ | | | 13.01 | ¢ | | | 13.01 | ¢ | | |
| | | | | | | | | | | | | | | | | | | |
| Components of revenue * | | | | | | | | | | | | | | | | | | |
| Consolidated Revenue Fund | | | 501 | | | | 528 | | | | 534 | | | | 523 | | | |
| BC Transit | | | 17 | | | | 18 | | | | 18 | | | | 18 | | | |
| BC Transportation Financing Authority | | | 415 | | | | 437 | | | | 440 | | | | 428 | | | |
| Fuel tax revenue | | | 933 | | | | 983 | | | | 992 | | | | 969 | | | |
| Carbon tax revenue | | | 1,640 | | | | 1,985 | | | | 2,221 | | | | 2,116 | | | |
| | | | | | | | | | | | | | | | | | | |
| * In 2023/24 revenue is projected to decline as the forecast includes the impacts of provincial policy measures relating to clean energy initiatives. |
| | | | | | | | | | | | | | | | | | | |
| Property taxes | | | 2,324 | | | | 2,970 | | | | 3,108 | | | | 3,230 | | | |
| Calendar Year | | | | | | | | | | | | | | | | | | |
| Consumer Price Index | | | 0.8 | % | | | 1.7 | % | | | 2.0 | % | | | 2.1 | % | | +/- 1 percentage point change in |
| Housing starts (units) | | | 37,734 | | | | 34,500 | | | | 33,473 | | | | 33,027 | | | 2021 new construction & inflation |
| Home owner grants (fiscal year) | | | 870 | | | | 887 | | | | 905 | | | | 923 | | | growth equals up to +/- $20 million in |
| Components of revenue | | | | | | | | | | | | | | | | | | residential property taxation revenue |
| Residential (net of home owner grants) | | | 1,131 | | | | 1,167 | | | | 1,196 | | | | 1,232 | | | |
| Speculation and vacancy | | | 80 | | | | 80 | | | | 80 | | | | 80 | | | |
| Non-residential | | | 777 | | | | 1,371 | | | | 1,448 | | | | 1,530 | | | +/- 1% change in 2021 total |
| Rural area | | | 129 | | | | 129 | | | | 132 | | | | 138 | | | business property assessment |
| Police | | | 36 | | | | 36 | | | | 37 | | | | 38 | | | value equals up to +/- $15 million |
| BC Assessment Authority | | | 99 | | | | 101 | | | | 102 | | | | 102 | | | in non-residential property |
| BC Transit | | | 72 | | | | 86 | | | | 113 | | | | 110 | | | taxation revenue |
| | | | | | | | | | | | | | | | | | | |
| Other taxes | | | 3,425 | | | | 3,470 | | | | 3,437 | | | | 3,412 | | | |
| Calendar Year | | | | | | | | | | | | | | | | | | |
| Population | | | 1.1 | % | | | 0.6 | % | | | 1.3 | % | | | 1.4 | % | | |
| Residential sales value | | | 35.7 | % | | | 8.0 | % | | | -3.3 | % | | | -2.7 | % | | |
| Real GDP | | | -5.3 | % | | | 4.4 | % | | | 3.8 | % | | | 2.2 | % | | |
| Nominal GDP | | | -4.5 | % | | | 6.4 | % | | | 5.4 | % | | | 4.0 | % | | |
| Components of revenue | | | | | | | | | | | | | | | | | | +/- 1% change to 2021 residential |
| Property transfer | | | 2,000 | | | | 1,975 | | | | 1,912 | | | | 1,877 | | | sales value equals +/- $15 million |
| Additional Property Transfer Tax (included in above) | | | 100 | | | | 99 | | | | 96 | | | | 94 | | | in property transfer revenue, |
| Tobacco | | | 720 | | | | 780 | | | | 800 | | | | 800 | | | depending on property values |
| Insurance premium | | | 705 | | | | 715 | | | | 725 | | | | 735 | | | |
Budget And Fiscal Plan - 2021/22 to 2023/24
153
Appendix
Table A5 Material Assumptions – Revenue (continued)
Revenue Source and Assumptions
($ millions unless otherwise specified) | | Updated
Forecast
2020/21 | | | Budget
Estimate
2021/22 | | | Plan
2022/23 | | | Plan
2023/24 | | | 2021/22 Sensitivities |
| Energy, sales of Crown land tenures, metals, minerals and other * | | | 658 | | | | 825 | | | | 914 | | | | 963 | | | |
| Natural gas price | | | | | | | | | | | | | | | | | | +/- $0.25 change in the natural gas |
| Plant inlet, $C/gigajoule | | | 1.23 | | | | 1.48 | | | | 1.48 | | | | 1.50 | | | price equals +/- $40 to $60 million, |
| Sumas, $US/MMBtu | | | 2.43 | | | | 2.79 | | | | 2.76 | | | | 2.76 | | | including impacts on production |
| Natural gas production volumes | | | | | | | | | | | | | | | | | | volumes and royalty program |
| Billions of cubic metres | | | 55.4 | | | | 60.3 | | | | 66.7 | | | | 72.4 | | | credits, but excluding any |
| Petajoules | | | 2,301 | | | | 2,505 | | | | 2,771 | | | | 3,004 | | | changes from natural gas liquids |
| Annual per cent change | | | 2.8 | % | | | 8.9 | % | | | 10.6 | % | | | 8.4 | % | | revenue (e.g. butane, pentanes) |
| | | | | | | | | | | | | | | | | | | Sensitivities can also vary |
| Oil price ($US/bbl at Cushing, OK) | | | 41.69 | | | | 48.38 | | | | 51.98 | | | | 55.04 | | | significantly at different price levels |
| | | | | | | | | | | | | | | | | | | +/- 1% change in natural gas |
| Auctioned land base (000 hectares) | | | - | | | | - | | | | 10 | | | | 20 | | | volumes equals +/- $3 million |
| Average bid price/hectare ($) | | | - | | | | - | | | | 200 | | | | 300 | | | in natural gas royalties |
| Cash sales of Crown land tenures | | | - | | | | - | | | | 2 | | | | 6 | | | +/- 1 cent change in the exchange rate |
| Metallurgical coal price ($US/tonne, fob Australia) | | | 135 | | | | 136 | | | | 145 | | | | 148 | | | equals +/-$3 million in natural gas royalties |
| Copper price ($US/lb) | | | 3.05 | | | | 3.52 | | | | 3.35 | | | | 3.20 | | | |
| Annual electricity volumes set by treaty | | | 3.8 | | | | 3.8 | | | | 3.8 | | | | 3.9 | | | +/- $10/bbl change in petroleum price |
| (million mega-watt hours) | | | | | | | | | | | | | | | | | | equals +/- $6 million in petroleum royalties |
| Mid-Columbia electricity price | | | 26.99 | | | | 36.98 | | | | 33.93 | | | | 32.52 | | | +/- 21% change in natural gas liquids |
| ($US/mega-watt hour) | | | | | | | | | | | | | | | | | | (equivalent to +/- $10/bbl oil price) prices |
| | | | | | | | | | | | | | | | | | | equals +/- $40 to $50 million in natural gas |
| Exchange rate (US¢/C$, calendar year) | | | 74.6 | | | | 79.0 | | | | 79.0 | | | | 78.0 | | | liquids royalties |
| Components of revenue | | | | | | | | | | | | | | | | | | |
| Bonus bid auctions: | | | | | | | | | | | | | | | | | | +/- US$20 change in the average |
| Deferred revenue | | | 115 | | | | 91 | | | | 81 | | | | 61 | | | metallurgical coal price |
| Current-year cash (one-tenth) | | | - | | | | - | | | | - | | | | - | | | equals +/- $50 to $80 million |
| Fees and rentals | | | 50 | | | | 50 | | | | 50 | | | | 49 | | | +/- 10% change in the average |
| Total bonus bids, fees and rentals | | | 165 | | | | 141 | | | | 131 | | | | 110 | | | Mid-Columbia electricity price |
| Natural gas royalties after deductions and allowances | | | 191 | | | | 286 | | | | 315 | | | | 366 | | | equals +/- $15 million |
| Petroleum royalties | | | 21 | | | | 21 | | | | 22 | | | | 21 | | | |
| Columbia River Treaty electricity sales | | | 117 | | | | 161 | | | | 148 | | | | 143 | | | Based on a recommendation |
| Oil and Gas Commission fees and levies | | | 70 | | | | 71 | | | | 73 | | | | 73 | | | from the Auditor General to be |
| Coal, metals and other minerals revenue: | | | | | | | | | | | | | | | | | | consistent with generally |
| Coal tenures | | | 6 | | | | 8 | | | | 8 | | | | 8 | | | accepted accounting principles, |
| Net coal mineral tax | | | 2 | | | | 29 | | | | 94 | | | | 124 | | | bonus bid revenue recognition |
| Net metals and other minerals tax | | | 40 | | | | 49 | | | | 61 | | | | 58 | | | reflects ten-year deferral of |
| Recoveries relating to revenue sharing payments | | | | | | | | | | | | | | | | | | cash receipts from the sale of |
| to First Nations | | | 28 | | | | 41 | | | | 44 | | | | 42 | | | Crown land tenures |
| Miscellaneous mining revenue | | | 18 | | | | 18 | | | | 18 | | | | 18 | | | |
| Total coal, metals and other minerals revenue | | | 94 | | | | 145 | | | | 225 | | | | 250 | | | |
| | | | | | | | | | | | | | | | | | | |
| Gross royalties prior to deductions and allowances | | | | | | | | | | | | | | | | | | |
| Gross natural gas revenue | | | 478 | | | | 625 | | | | 678 | | | | 768 | | | |
| Gross natural gas liquids royalties revenue | | | 353 | | | | 439 | | | | 536 | | | | 632 | | | |
| | | | | | | | | | | | | | | | | | | |
| Royalty programs and infrastructure credits | | | | | | | | | | | | | | | | | | |
| Deep drilling | | | (421 | ) | | | (514 | ) | | | (579 | ) | | | (657 | ) | | |
| Road, pipeline, Clean Growth Infrastructure Royalty and other infrastructure programs | | | (71 | ) | | | (71 | ) | | | (104 | ) | | | (135 | ) | | |
| Total | | | (492 | ) | | | (585 | ) | | | (683 | ) | | | (792 | ) | | |
| Implicit average natural gas royalty rate | | | 6.8 | % | | | 7.7 | % | | | 7.7 | % | | | 8.1 | % | | |
Royalty program (marginal, low productivity and ultra marginal drilling) adjustments reflect reduced royalty rates. Natural gas royalties incorporate royalty programs and Treasury Board approved infrastructure credits. * Reflects information as at March 17, 2021.
Budget And Fiscal Plan - 2021/22 to 2023/24
154
Appendix
Table A5 Material Assumptions – Revenue (continued)
Revenue Source and Assumptions
($ millions unless otherwise specified) | | Updated
Forecast
2020/21 | | | Budget
Estimate
2021/22 | | | Plan
2022/23 | | | Plan
2023/24 | | | 2021/22 Sensitivities |
| Forests * | | | 1,121 | | | | 1,204 | | | | 948 | | | | 916 | | | |
| Prices (calendar year average) | | | | | | | | | | | | | | | | | | +/- US$50 change in SPF |
| SPF 2x4 ($US/thousand board feet) | | | 570 | | | | 650 | | | | 475 | | | | 450 | | | price equals +/- $125 to $175 million |
| | | | | | | | | | | | | | | | | | | |
| Crown harvest volumes (million cubic metres) | | | | | | | | | | | | | | | | | | |
| Interior | | | 35.2 | | | | 35.0 | | | | 34.0 | | | | 34.0 | | | +/- 10% change in Interior |
| Coast | | | 10.8 | | | | 11.0 | | | | 11.0 | | | | 11.0 | | | harvest volumes equals |
| Total | | | 46.0 | | | | 46.0 | | | | 45.0 | | | | 45.0 | | | +/- $80 to $90 million |
| B.C. Timber Sales (included in above) | | | 9.2 | | | | 10.0 | | | | 9.8 | | | | 9.5 | | | +/- 10% change in Coastal |
| | | | | | | | | | | | | | | | | | | harvest volumes equals |
| Stumpage rates ($Cdn/cubic metre) | | | | | | | | | | | | | | | | | | +/- $20 to $25 million |
| Total stumpage rates | | | 23.32 | | | | 24.21 | | | | 19.05 | | | | 18.36 | | | +/- 1 cent change in |
| | | | | | | | | | | | | | | | | | | exchange rate equals |
| Components of revenue | | | | | | | | | | | | | | | | | | +/- $20 to $30 million in |
| Timber tenures (net of revenue sharing recoveries) | | | 697 | | | | 744 | | | | 515 | | | | 498 | | | stumpage revenue |
| Recoveries relating to revenue sharing payments to First Nations | | | 40 | | | | 46 | | | | 41 | | | | 40 | | | |
| B.C. Timber Sales | | | 365 | | | | 344 | | | | 321 | | | | 307 | | | The above sensitivities relate |
| Logging tax | | | (20 | ) | | | 30 | | | | 30 | | | | 30 | | | to stumpage revenue only. |
| Other CRF revenue | | | 18 | | | | 30 | | | | 30 | | | | 30 | | | |
| Recoveries | | | 21 | | | | 10 | | | | 11 | | | | 11 | | | |
| | | | | | | | | | | | | | | | | | | |
| * Reflects information as at March 15, 2021 | | | | | | | | | | | | | | | | | | |
| | | | | | | | | | | | | | | | | | | |
| Other natural resources | | | 436 | | | | 503 | | | | 515 | | | | 510 | | | |
| Components of revenue | | | | | | | | | | | | | | | | | | |
| Water rental and licences* | | | 370 | | | | 430 | | | | 442 | | | | 437 | | | +/- 5% change in water |
| Recoveries | | | 46 | | | | 50 | | | | 50 | | | | 50 | | | power production equals |
| Angling and hunting permits and licences | | | 7 | | | | 10 | | | | 10 | | | | 10 | | | +/- $15 to $20 million |
| Recoveries | | | 13 | | | | 13 | | | | 13 | | | | 13 | | | |
| * Water rentals for power purposes are indexed to Consumer Price Index. | | | | | | | | | | | | | | | | | | |
| | | | | | | | | | | | | | | | | | | |
| Total natural resource recoveries relating to | | | | | | | | | | | | | | | | | | Revenue sharing from natural gas royalties, |
| revenue sharing payments to First Nations | | | 70 | | | | 88 | | | | 86 | | | | 84 | | | mineral tax and forest stumpage revenues. |
| | | | | | | | | | | | | | | | | | | |
| Other revenue | | | 8,798 | | | | 9,220 | | | | 9,468 | | | | 9,696 | | | |
| Components of revenue | | | | | | | | | | | | | | | | | | |
| Fees and licences | | | | | | | | | | | | | | | | | | |
| Motor vehicle licences and permits | | | 568 | | | | 578 | | | | 588 | | | | 599 | | | |
| International student health fees | | | 70 | | | | 70 | | | | 70 | | | | 70 | | | |
| Other Consolidated Revenue Fund | | | 443 | | | | 448 | | | | 456 | | | | 456 | | | |
| Summary consolidation eliminations | | | (14 | ) | | | (14 | ) | | | (15 | ) | | | (14 | ) | | |
| Ministry vote recoveries | | | 110 | | | | 187 | | | | 100 | | | | 144 | | | |
| Taxpayer-supported Crown corporations | | | 132 | | | | 155 | | | | 157 | | | | 163 | | | |
| Post-secondary education fees | | | 2,485 | | | | 2,508 | | | | 2,625 | | | | 2,711 | | | |
| Other healthcare-related fees | | | 396 | | | | 437 | | | | 466 | | | | 466 | | | |
| School Districts | | | 252 | | | | 268 | | | | 258 | | | | 273 | | | |
| Investment earnings | | | | | | | | | | | | | | | | | | |
| Consolidated Revenue Fund | | | 100 | | | | 98 | | | | 100 | | | | 100 | | | |
| Fiscal agency loans & sinking funds earnings | | | 894 | | | | 863 | | | | 867 | | | | 878 | | | |
| Summary consolidation eliminations | | | (42 | ) | | | (43 | ) | | | (43 | ) | | | (55 | ) | | |
| Taxpayer-supported Crown corporations | | | 32 | | | | 30 | | | | 27 | | | | 28 | | | |
| SUCH sector agencies | | | 221 | | | | 226 | | | | 234 | | | | 235 | | | |
| Sales of goods and services | | | | | | | | | | | | | | | | | | |
| SUCH sector agencies | | | 550 | | | | 704 | | | | 818 | | | | 893 | | | |
| BC Infrastructure Benefits Inc | | | 7 | | | | 120 | | | | 265 | | | | 289 | | | |
| Other taxpayer-supported Crown corporations | | | 159 | | | | 180 | | | | 214 | | | | 225 | | | |
| Miscellaneous | | | 2,435 | | | | 2,405 | | | | 2,281 | | | | 2,235 | | | |
Budget And Fiscal Plan - 2021/22 to 2023/24
155
Appendix
Table A5 Material Assumptions – Revenue (continued)
Revenue Source and Assumptions
($ millions unless otherwise specified) | | Updated
Forecast
2020/21 | | | Budget
Estimate
2021/22 | | | Plan
2022/23 | | | Plan
2023/24 | | | 2021/22 Sensitivities |
| Health and social transfers | | | 8,285 | | | | 7,939 | | | | 8,176 | | | | 8,578 | | | |
| National Cash Transfers | | | | | | | | | | | | | | | | | | |
| Canada Health Transfer (CHT) | | | 41,870 | | | | 43,126 | | | | 44,420 | | | | 46,873 | | | |
| Annual growth | | | 3.7 | % | | | 3.0 | % | | | 3.0 | % | | | 5.5 | % | | |
| Canada Social Transfer (CST) | | | 15,023 | | | | 15,474 | | | | 15,938 | | | | 16,416 | | | |
| B.C.’s share of national population (June 1) | | | 13.545 | % | | | 13.548 | % | | | 13.545 | % | | | 13.555 | % | | +/- 0.1 percentage point change in |
| | | | | | | | | | | | | | | | | | | B.C.’s population share equals |
| B.C. health and social transfers revenue | | | | | | | | | | | | | | | | | | +/- $60 million |
| CHT | | | 5,671 | | | | 5,843 | | | | 6,017 | | | | 6,353 | | | |
| CST | | | 2,035 | | | | 2,096 | | | | 2,159 | | | | 2,225 | | | |
| Prior-year adjustments: | | | | | | | | | | | | | | | | | | |
| CHT | | | 20 | | | | - | | | | - | | | | - | | | |
| CST | | | 7 | | | | - | | | | - | | | | - | | | |
| Reimbursement of Canada Health Care Act violation penalties | | | 10 | | | | - | | | | - | | | | - | | | |
| Helping Health Care Systems Recover funding | | | 542 | | | | - | | | | - | | | | - | | | |
| Other federal contributions | | | 5,075 | | | | 2,591 | | | | 2,288 | | | | 2,332 | | | |
| Components of revenue | | | | | | | | | | | | | | | | | | |
| COVID-19 related funding: | | | | | | | | | | | | | | | | | | |
| Safe Restart Agreement | | | 1,963 | | | | - | | | | - | | | | - | | | |
| COVID-19 Essential Workers Support Fund | | | 371 | | | | - | | | | - | | | | - | | | |
| Safe Return to Class Fund | | | 242 | | | | - | | | | - | | | | - | | | |
| Financial Assistance Agreement to Support Closure and Restoration of Oil and Gas | | | | | | | | | | | | | | | | | | |
| Sites in British Columbia | | | 40 | | | | 40 | | | | 40 | | | | - | | | |
| Canada’s COVID-19 Immunization Plan | | | - | | | | 135 | | | | - | | | | - | | | |
| Total | | | 2,616 | | | | 175 | | | | 40 | | | | - | | | |
| Disaster Financial Assistance Arrangements | | | 147 | | | | - | | | | 62 | | | | 145 | | | |
| B.C.’s share of the federal cannabis excise tax | | | 40 | | | | 50 | | | | 60 | | | | 70 | | | |
| Low Carbon Economy Leadership Fund | | | 29 | | | | 13 | | | | 2 | | | | - | | | |
| Other Consolidated Revenue Fund | | | 150 | | | | 153 | | | | 154 | | | | 154 | | | |
| Vote Recoveries: | | | | | | | | | | | | | | | | | | |
| Labour Market Development Agreement | | | 329 | | | | 339 | | | | 339 | | | | 338 | | | |
| Labour Market and Skills Training Program | | | 124 | | | | 191 | | | | 124 | | | | 124 | | | |
| Home Care | | | 88 | | | | 122 | | | | 81 | | | | 81 | | | |
| Mental Health | | | 81 | | | | 81 | | | | 81 | | | | 82 | | | |
| Low Carbon Economy Leadership Fund | | | 15 | | | | 28 | | | | - | | | | - | | | |
| Early Childhood Development and | | | | | | | | | | | | | | | | | | |
| Child Care Services | | | 41 | | | | 41 | | | | 41 | | | | 41 | | | |
| Child Safety, Family Support, Children | | | | | | | | | | | | | | | | | | |
| in Care and with special needs | | | 93 | | | | 93 | | | | 93 | | | | 93 | | | |
| Policing and Security | | | 9 | | | | 10 | | | | 12 | | | | 12 | | | |
| Public Transit | | | 46 | | | | 88 | | | | 187 | | | | 165 | | | |
| Local government services and transfers | | | 159 | | | | 191 | | | | 2 | | | | 2 | | | |
| Other recoveries | | | 109 | | | | 110 | | | | 108 | | | | 108 | | | |
| Taxpayer-supported Crown corporations | | | 357 | | | | 265 | | | | 257 | | | | 269 | | | |
| Post-secondary institutions | | | 529 | | | | 527 | | | | 532 | | | | 535 | | | |
| Other SUCH sector agencies | | | 113 | | | | 114 | | | | 113 | | | | 113 | | | |
| Service delivery agency direct revenue | | | 7,411 | | | | 7,682 | | | | 8,083 | | | | 8,311 | | | |
| School districts | | | 640 | | | | 705 | | | | 653 | | | | 668 | | | |
| Post-secondary institutions | | | 4,022 | | | | 4,189 | | | | 4,447 | | | | 4,626 | | | |
| Health authorities and hospital societies | | | 1,191 | | | | 1,023 | | | | 1,063 | | | | 1,064 | | | |
| BC Transportation Financing Authority | | | 502 | | | | 531 | | | | 543 | | | | 522 | | | |
| Other service delivery agencies | | | 1,056 | | | | 1,234 | | | | 1,377 | | | | 1,431 | | | |
Budget And Fiscal Plan - 2021/22 to 2023/24
156
Appendix
Table A5 Material Assumptions – Revenue (continued)
Revenue Source and Assumptions
($ millions unless otherwise specified) | | Updated
Forecast
2020/21 | | | Budget
Estimate
2021/22 | | | Plan
2022/23 | | | Plan
2023/24 | | | 2021/22 Sensitivities |
| Commercial Crown corporation net income | | | 3,061 | | | | 2,865 | | | | 3,434 | | | | 3,631 | | | |
| BC Hydro | | | 691 | | | | 712 | | | | 712 | | | | 712 | | | |
| Reservoir water inflows | | | 110 | % | | | 100% | | | | 100 | % | | | 100 | % | | +/-1% in hydro generation |
| | | | | | | | | | | | | | | | | | | equals +/-$10 million |
| Mean gas price | | | 3.11 | | | | 3.08 | | | | 2.61 | | | | 2.46 | | | +/-10% equals +/-$1.0 million |
| (Sumas, $US/MMbtu – BC Hydro forecast based on NYMEX forward selling prices) | | | | | | |
| Electricity prices | | | 27.87 | | | | 30.83 | | | | 29.78 | | | | 28.67 | | | +/-10% change in electricity trade |
| (Mid-C, $US/MWh) | | | | | | | | | | | | | | | | | | margins equals +/-$30 million |
| ICBC | | | 709 | | | | 154 | | | | 202 | | | | 229 | | | |
| Vehicle growth | | | 1.3 | % | | | 1.8 | % | | | 1.8 | % | | | 1.8 | % | | +/-1% equals +/-$51 million |
| Current claims cost percentage change | | | -4.2 | % | | | -13.0 | % | | | 2.0 | % | | | 3.5 | % | | +/-1% equals -/+$39 million |
| Unpaid claims balance ($ billions) | | | 15.9 | | | | 14.0 | | | | 11.9 | | | | 10.0 | | | +/-1% equals -/+$140 to $159 million |
| Investment return | | | 4.5 | % | | | 2.3 | % | | | 2.6 | % | | | 2.7 | % | | +/-1% return equals +/-$199 to $213 million |
| Loss ratio | | | 84.6 | % | | | 86.3 | % | | | 87.0 | % | | | 86.4 | % | | |
Budget And Fiscal Plan - 2021/22 to 2023/24
157
Appendix
Table A6 Natural Gas Price Forecasts – 2021/22 to 2023/24
| Private sector forecasts (calendar year) | | 2021 | | | 2022 | | | 2023 | | | 2021/22 | | | 2022/23 | | | 2023/24 | |
| GLJ Henry Hub US$/MMBtu (Jan 1, 2021) | | | 2.75 | | | | 2.80 | | | | 2.85 | | | | 1.90 | | | | 1.87 | | | | 1.96 | |
| Sproule Henry Hub US$/MMBtu (Jan 31, 2021) | | | 3.00 | | | | 3.00 | | | | 3.00 | | | | 2.07 | | | | 2.10 | | | | 2.15 | |
| McDaniel Henry Hub US$/MMBtu (Jan 1, 2021) | | | 2.75 | | | | 2.81 | | | | 2.86 | | | | 1.79 | | | | 1.88 | | | | 1.98 | |
| Deloitte Henry Hub US$/Mcf (Dec 31, 2020) | | | 2.70 | | | | 2.85 | | | | 3.00 | | | | 1.65 | | | | 1.85 | | | | 2.03 | |
| GLJ Alberta AECO-C Spot CDN$/MMBtu (Jan 1, 2021) | | | 2.72 | | | | 2.67 | | | | 2.60 | | | | 1.55 | | | | 1.41 | | | | 1.37 | |
| Sproule Alberta AECO-C Spot CDN$/MMBtu (Jan 31, 2021) | | | 2.86 | | | | 2.78 | | | | 2.69 | | | | 1.59 | | | | 1.51 | | | | 1.47 | |
| McDaniel AECO-C Spot C$/MMBtu (Jan 1, 2021) | | | 2.75 | | | | 2.65 | | | | 2.55 | | | | 1.48 | | | | 1.39 | | | | 1.33 | |
| Deloitte AECO-C Spot C$/Mcf (Dec 31, 2020) | | | 2.65 | | | | 2.70 | | | | 2.75 | | | | 1.34 | | | | 1.38 | | | | 1.43 | |
| GLJ Sumas Spot US$/MMBtu (Jan 1, 2021) | | | 2.70 | | | | 2.70 | | | | 2.75 | | | | 1.49 | | | | 1.42 | | | | 1.51 | |
| Sproule Sumas Spot CDN$/MMBtu (Jan 31, 2021) | | | 3.76 | | | | 3.69 | | | | 3.62 | | | | 1.69 | | | | 1.63 | | | | 1.60 | |
| GLJ BC Spot Plant Gate CDN$/MMBtu (Jan 1, 2021) | | | 2.49 | | | | 2.39 | | | | 2.33 | | | | 1.53 | | | | 1.37 | | | | 1.33 | |
| Sproule BC Station 2 CDN$/MMBtu (Jan 31, 2021) | | | 2.76 | | | | 2.68 | | | | 2.59 | | | | 1.43 | | | | 1.36 | | | | 1.31 | |
| McDaniel BC Avg Plant Gate C$MMBtu (Jan 1, 2021) | | | 2.45 | | | | 2.35 | | | | 2.24 | | | | 1.42 | | | | 1.32 | | | | 1.25 | |
| Deloitte BC Station 2 C$MMBtu (Dec 31, 2020) | | | 2.65 | | | | 2.75 | | | | 2.80 | | | | 1.57 | | | | 1.65 | | | | 1.70 | |
| GLJ Midwest Chicago US$/MMBtu (Jan 1, 2021) | | | 2.60 | | | | 2.65 | | | | 2.70 | | | | 1.67 | | | | 1.65 | | | | 1.74 | |
| Sproule Alliance Plant Gate CDN$/MMBtu (Jan 31, 2021) | | | 3.75 | | | | 3.74 | | | | 3.74 | | | | 2.45 | | | | 2.45 | | | | 2.47 | |
| EIA Henry Hub US$/MMBtu (Feb 9, 2021) | | | 2.95 | | | | 3.27 | | | | | | | | 1.49 | | | | | | | | | |
| TD Economics Henry Hub FuturesUS$/MMBtu (Dec 2020) | | | 2.78 | | | | 2.99 | | | | | | | | 1.48 | | | | | | | | | |
| Scotiabank Group Henry Hub US$/MMBtu (Dec 2020) | | | 2.70 | | | | 2.55 | | | | | | | | 1.77 | | | | | | | | | |
| BMO Henry Hub US$/MMBtu (Jan 2021) | | | 2.50 | | | | 2.50 | | | | | | | | 1.58 | | | | | | | | | |
| InSite Petroleum Consultants Ltd BC Spot C$/Mcf (Dec 31, 2020) | | | 2.85 | | | | 2.91 | | | | 2.97 | | | | 1.74 | | | | 1.80 | | | | 1.85 | |
| NYMEX Forward Market converted to Plant Inlet CDN$/GJ (Feb 4, 2021) | | | | | | | | | | | | | | | 2.01 | | | | 2.24 | | | | 1.55 | |
| | | | | | | | | | | | | | | | | | | | | | | | | |
| Average all minus high/low | | | | | | | | | | | | | | | 1.63 | | | | 1.62 | | | | 1.65 | |
| | | | | | | | | | | | | | | | | | | | | | | | | |
| Average one forecast per consultant minus high/low | | | | | | | | | | | | | | | 1.55 | | | | 1.46 | | | | 1.44 | |
| | | | | | | | | | | | | | | | | | | | | | | | | |
| Natural gas royalty price forecast | | | | | | | | | | | | | | | 1.48 | | | | 1.48 | | | | 1.50 | |
GLJ: Gilbert Laustsen Jung Petroleum Consultants Ltd US EIA: US Energy Information Administration AECO: Alberta Energy Company Deloitte/AJM: Deloitte L.L.P acquired Ashton Jenkins Mann Petroleum Consultants McDaniel: McDaniel & Associates Consultants Ltd
Natural Gas Prices
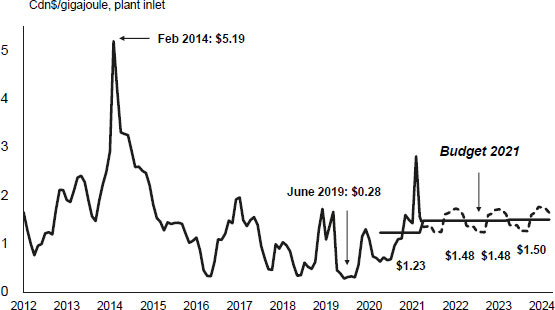
Budget And Fiscal Plan - 2021/22 to 2023/24
158
Appendix
Table A7 Material Assumptions – Expense
Ministry Programs and Assumptions
($ millions unless otherwise specified) | | Updated
Forecast
2020/21 | | | Budget
Estimate
2021/22 | | | Plan
2022/23 | | | Plan
2023/24 | | | 2021/22 Sensitivities |
| Advanced Education, Skills and Training | | | 2,366 | | | | 2,592 | | | | 2,583 | | | | 2,592 | | | |
| Student spaces in public institutions | | | 192,954 | | | | 206,513 | | | | 205,886 | | | | 205,904 | | | Student enrolments may fluctuate due to a number of factors |
| | | | | | | | | | | | | | | | | | | including economic changes and labour market needs. |
| | | | | | | | | | | | | | | | | | | |
| Attorney General | | | 1,154 | | | | 1,272 | | | | 1,311 | | | | 1,337 | | | |
| New cases filed/processed | | | 240,000 | | | | 242,000 | | | | 242,000 | | | | 242,000 | | | The number of criminal cases proceeded on by the provincial and |
| (# for all courts) | | | | | | | | | | | | | | | | | | federal Crown (including appeals to higher courts in BC), the |
| | | | | | | | | | | | | | | | | | | number of civil and family litigation cases, the number of violation |
| | | | | | | | | | | | | | | | | | | tickets disputed, and the number of municipal bylaw tickets |
| | | | | | | | | | | | | | | | | | | disputed which would go to court for resolution. |
| | | | | | | | | | | | | | | | | | | |
| Crown Proceeding Act (CPA) | | | 25 | | | | 25 | | | | 25 | | | | 25 | | | The number of new cases, and the difference between estimated |
| | | | | | | | | | | | | | | | | | | settlements and actual settlements. |
| | | | | | | | | | | | | | | | | | | |
| Children and Family Development | | | 2,224 | | | | 2,393 | | | | 2,427 | | | | 2,430 | | | |
| Average children-in-care | | | 5,488 | | | | 5,160 | | | | 4,924 | | | | 4,805 | | | The average number of children-in-care is decreasing as a result |
| caseload (#) | | | | | | | | | | | | | | | | | | of ministry efforts to keep children in family settings where safe |
| Average annual residential | | | 85,058 | | | | 92,137 | | | | 100,027 | | | | 108,824 | | | and feasible. The average cost per child in care is projected to |
| cost per child in care ($) | | | | | | | | | | | | | | | | | | increase based on the higher cost of contracted residential |
| | | | | | | | | | | | | | | | | | | services and an increasing acuity of need for children in care. A |
| | | | | | | | | | | | | | | | | | | 1% increase in the cost per case or a 1% increase in the average |
| | | | | | | | | | | | | | | | | | | caseload will affect expenditures by $2.4 million (excluding |
| | | | | | | | | | | | | | | | | | | Delegated Aboriginal Agencies). |
| Education | | | 6,694 | | | | 7,132 | | | | 7,162 | | | | 7,162 | | | |
| | | | | | | | | | | | | | | | | | | |
| Public School Enrolment (# of FTEs) | | | 558,081 | | | | 567,675 | | | | 572,356 | | | | 576,587 | | | Updated forecast enrolment figures are based on submissions |
| School age (K–12) | | | 534,215 | | | | 541,741 | | | | 550,384 | | | | 554,596 | | | from school districts of their actual enrolment as at September |
| Continuing Education | | | 824 | | | | 962 | | | | 962 | | | | 962 | | | 30, 2020 for the 2020/21 school year and projected enrolment for |
| Distributed Learning (online) | | | 18,090 | | | | 15,460 | | | | 11,410 | | | | 11,429 | | | February and May 2021 for Distributed Learning and Adults. |
| Summer | | | 3,376 | | | | 7,279 | | | | 7,279 | | | | 7,279 | | | Projections for 2021/22 and 2022/23 are based on the Ministry of |
| Adults | | | 1,577 | | | | 2,233 | | | | 2,321 | | | | 2,321 | | | Education’s enrolment forecasting model. |
| | | | | | | | | | | | | | | | | | | |
| Forests, Lands, Natural Resource | | | | | | | | | | | | | | | | | | |
| Operations and Rural Development | | | 929 | | | | 888 | | | | 858 | | | | 854 | | | |
| BC Timber Sales | | | 224 | | | | 234 | | | | 204 | | | | 200 | | | Targets can be impacted by changes to actual inventory costs |
| | | | | | | | | | | | | | | | | | | incurred. There is a lag of approximately 1.5 years between when |
| | | | | | | | | | | | | | | | | | | inventory costs are incurred and when they are expensed. |
| | | | | | | | | | | | | | | | | | | Volume harvested can also impact targets. For example, if |
| | | | | | | | | | | | | | | | | | | volume harvested is less than projected in any year, then |
| | | | | | | | | | | | | | | | | | | capitalized expenses will also be reduced in that year. |
| | | | | | | | | | | | | | | | | | | |
| Fire Management | | | 213 | | | | 136 | | | | 136 | | | | 136 | | | Costs are driven by length of season and severity of weather |
| | | | | | | | | | | | | | | | | | | conditions, severity of fires, proportion of interface fires, size of |
| | | | | | | | | | | | | | | | | | | fires and damaged caused. Costs have ranged from a low of $47 |
| | | | | | | | | | | | | | | | | | | million in 2006 to a high of $650 million in 2017. |
| Health | | | 22,190 | | | | 23,873 | | | | 24,650 | | | | 25,414 | | | |
| Pharmacare | | | 1,411 | | | | 1,470 | | | | 1,514 | | | | 1,539 | | | A 1% change in utilization or prices affects costs by |
| | | | | | | | | | | | | | | | | | | approximately $12 million. |
| | | | | | | | | | | | | | | | | | | |
| Medical Services Plan (MSP) | | | 5,243 | | | | 5,550 | | | | 5,838 | | | | 6,043 | | | |
| | | | | | | | | | | | | | | | | | | A 1% increase in volume of services provided by fee-for-service |
| | | | | | | | | | | | | | | | | | | physicians affects costs by approximately $30 million. |
| | | | | | | | | | | | | | | | | | | |
| Regional Services | | | 15,233 | | | | 16,536 | | | | 16,981 | | | | 17,503 | | | |
| Public Safety and Solicitor General | | | 992 | | | | 901 | | | | 907 | | | | 907 | | | |
| Policing, Victim Services and Corrections | | | 763 | | | | 744 | | | | 743 | | | | 743 | | | Policing, Victim Services and Corrections costs are sensitive to |
| | | | | | | | | | | | | | | | | | | the volume and severity of criminal activity, the number of inmate |
| | | | | | | | | | | | | | | | | | | beds occupied and the number of offenders under community |
| | | | | | | | | | | | | | | | | | | supervision. |
| | | | | | | | | | | | | | | | | | | |
| Emergency Program Act (EPA) | | | 158 | | | | 36 | | | | 36 | | | | 36 | | | For authorized expenditures under the EPA, including those for |
| | | | | | | | | | | | | | | | | | | further disasters, and the difference between initial estimates for |
| | | | | | | | | | | | | | | | | | | disaster response and recovery costs and final project costs. |
Budget And Fiscal Plan - 2021/22 to 2023/24
159
Appendix
Table A7 Material Assumptions – Expense (continued)
Ministry Programs and Assumptions
($ millions unless otherwise specified) | | Updated
Forecast
2020/21 | | | Budget
Estimate
2021/22 | | | Plan
2022/23 | | | Plan
2023/24 | | | 2021/22 Sensitivities |
| Social Development and Poverty Reduction | | | 3,682 | | | | 4,360 | | | | 4,455 | | | | 4,478 | | | |
| Temporary Assistance | | | 46,370 | | | | 43,800 | | | | 44,000 | | | | 44,100 | | | The expected-to-work caseload is sensitive to fluctuations in |
| annual average caseload (#) | | | | | | | | | | | | | | | | | | economic and employment trends. Costs are driven by changes |
| | | | | | | | | | | | | | | | | | | to cost per case and caseload. Cost per case fluctuations result |
| | | | | | | | | | | | | | | | | | | from changes in the needed supports required by clients, as well |
| | | | | | | | | | | | | | | | | | | as caseload composition. |
| | | | | | | | | | | | | | | | | | | |
| Disability Assistance | | | 114,341 | | | | 116,800 | | | | 118,500 | | | | 119,100 | | | The caseload for persons with disabilities is sensitive to the aging |
| annual average caseload (#) | | | | | | | | | | | | | | | | | | of the population and longer life expectancy for individuals with |
| | | | | | | | | | | | | | | | | | | disabilities. Cost per case fluctuations are driven primarily by |
| | | | | | | | | | | | | | | | | | | earnings exemptions which is dependent on the level of income |
| | | | | | | | | | | | | | | | | | | earned by clients. |
| | | | | | | | | | | | | | | | | | | |
| Adult Community Living: | | | | | | | | | | | | | | | | | | |
| Developmental Disabilities Programs | | | | | | | | | | | | | | | | | | The adult community living caseload is sensitive to an aging |
| Average caseload (#) | | | 21,590 | | | | 22,470 | | | | 23,380 | | | | 24,330 | | | population and to the level of service required. Cost per case |
| Average cost per client ($) | | | 52,200 | | | | 52,800 | | | | 52,000 | | | | 50,600 | | | fluctuations are driven by the proportion of clients receiving |
| Personal Supports Initiative (PSI) | | | | | | | | | | | | | | | | | | certain types of services at differing costs. For example,
residential care services are significantly more costly than day |
| Average caseload (#) | | | 2,370 | | | | 2,690 | | | | 3,040 | | | | 3,400 | | | programs. |
| Average cost per client ($) | | | 15,900 | | | | 15,100 | | | | 13,600 | | | | 12,200 | | | |
| | | | | | | | | | | | | | | | | | | |
| Tax Transfers | | | 2,367 | | | | 1,871 | | | | 1,953 | | | | 2,036 | | | |
| Individuals | | | 1,242.0 | | | | 876.0 | | | | 905.0 | | | | 915.0 | | | |
| Climate Action Tax Credit | | | 802.0 | | | | 312.0 | | | | 345.0 | | | | 355.0 | | | These tax transfers are now expensed as |
| BC Child Opportunity Benefit | | | 273.8 | | | | 410.0 | | | | 410.0 | | | | 410.0 | | | required under generally accepted accounting |
| Sales Tax | | | 64.7 | | | | 57.5 | | | | 50.0 | | | | 50.0 | | | principles. |
| Small Business Venture Capital | | | 29.3 | | | | 30.0 | | | | 30.0 | | | | 30.0 | | | |
| BC Senior’s Home Renovation | | | 3.7 | | | | 3.0 | | | | 3.0 | | | | 3.0 | | | Changes in 2020 tax transfers will result in |
| Other tax transfers to individuals | | | 68.5 | | | | 63.5 | | | | 67.0 | | | | 67.0 | | | one-time effect (prior-year adjustment) and |
| | | | | | | | | | | | | | | | | | | could result in an additional base change |
| Corporations | | | 1,125.0 | | | | 995.0 | | | | 1,048.0 | | | | 1,121.0 | | | in 2021/22. Production services tax credit is |
| Film and Television | | | 171.4 | | | | 117.5 | | | | 126.3 | | | | 130.0 | | | the most volatile of all tax transfers and is |
| Production Services | | | 704.0 | | | | 666.7 | | | | 701.7 | | | | 762.0 | | | influenced by several factors including delay |
| Scientific Research & Experimental | | | | | | | | | | | | | | | | | | in filing returns and assessment of claims, |
| Development | | | 121.3 | | | | 101.3 | | | | 106.2 | | | | 111.2 | | | length of projects and changes in the |
| Interactive Digital Media | | | 90.8 | | | | 71.3 | | | | 76.3 | | | | 80.0 | | | exchange rates. |
| Mining Exploration | | | 29.3 | | | | 20.0 | | | | 20.0 | | | | 20.0 | | | |
| Other tax transfers to corporations | | | 8.2 | | | | 18.2 | | | | 17.5 | | | | 17.8 | | | |
| | | | | | | | | | | | | | | | | | | |
| Prior-year adjustment (included above)* | | | 117.3 | | | | | | | | | | | | | | | |
| | | | | | | | | | | | | | | | | | | |
| Individuals | | | 5.0 | | | | | | | | | | | | | | | |
| Corporations | | | 112.3 | | | | | | | | | | | | | | | |
| | | | | | | | | | | | | | | | | | | |
| 2019 Tax-year | | | 2019 Assumptions | | | | | | | | | | | |
| Tax Transfers | | | 1,525.0 | | | | | | | | | | | | | | | |
| Individuals | | | 531.0 | | | | | | | | | | | | | | | |
| Corporations | | | 994.0 | | | | | | | | | | | | | | | |
| Film and Television | | | 145.0 | | | | | | | | | | | | | | | |
| Production Services | | | 632.0 | | | | | | | | | | | | | | | |
| Scientific Research & Experimental | | | | | | | | | | | | | | | | | | |
| Development | | | 90.0 | | | | | | | | | | | | | | | |
| Interactive Digital Media | | | 83.0 | | | | | | | | | | | | | | | |
| Other tax transfers to corporations | | | 44.0 | | | | | | | | | | | | | | | |
| | | | | | | | | | | | | | | | | | | |
|
| *2020/21 tax transfer forecast incorporates adjustments relating to prior years. | | |
| | | |
| Management of Public Funds and Debt | | | 1,248 | | | | 1,340 | | | | 1,401 | | | | 1,528 | | | |
| Interest rates for new provincial borrowing: | | | | | | | | | | | | | | | | | | Full year impact on MoPD on interest costs of a 1% change in |
| Short-term | | | 0.21 | % | | | 0.20 | % | | | 0.31 | % | | | 0.61 | % | | interest rates equals $87.9 million; $100 million increase in debt |
| Long-term | | | 2.09 | % | | | 2.53 | % | | | 2.82 | % | | | 3.20 | % | | level equals $1.9 million. |
| CDN/US exchange rate (cents) | | | 132.2 | | | | 126.2 | | | | 127.1 | | | | 128.2 | | | |
| | | | | | | | | | | | | | | | | | | |
| Service delivery agency net spending | | | 7,166 | | | | 7,888 | | | | 8,275 | | | | 8,839 | | | |
| School districts | | | 579 | | | | 576 | | | | 572 | | | | 563 | | | Expenses, net of Provincial funding. These are mainly funded |
| Post-secondary institutions | | | 4,008 | | | | 4,181 | | | | 4,340 | | | | 4,499 | | | through revenue from other sources. |
| Health authorities and hospital societies | | | 611 | | | | 965 | | | | 1,002 | | | | 1,004 | | | |
| BC Transportation Financing Authority | | | 1,381 | | | | 1,467 | | | | 1,528 | | | | 1,667 | | | |
| BC Infrastructure Benefits Inc | | | 8 | | | | 120 | | | | 264 | | | | 289 | | | |
| Other service delivery agencies | | | 579 | | | | 579 | | | | 569 | | | | 817 | | | |
Budget And Fiscal Plan - 2021/22 to 2023/24
160
Appendix
Table A8 Operating Statement – 2014/15 to 2023/24
| | | | | | | | | | | | | | | Updated | | Budget | | | | | | Average | |
| | | Actual | | Actual | | Actual | | Actual | | Actual | | Actual | | Forecast | | Estimate | | Plan | | Plan | | annual | |
| ($ millions) | | 2014/15 | | 2015/16 | | 2016/17 | | 2017/18 | | 2018/19 | | 2019/20 | | 2020/21 | | 2021/22 | | 2022/23 | | 2023/24 | | change | |
| | | | | | | | | | | | | | | | | | | | | | | (percent) | |
| Revenue | | | 46,099 | | | 47,601 | | | 51,449 | | | 52,020 | | | 57,128 | | | 58,660 | | | 60,967 | | | 58,929 | | | 63,286 | | | 65,074 | | | 3.9 | |
| Expense | | | (44,440 | ) | | (46,832 | ) | | (48,684 | ) | | (51,706 | ) | | (55,597 | ) | | (58,981 | ) | | (69,111 | ) | | (67,627 | ) | | (68,020 | ) | | (68,997 | ) | | 5.0 | |
| Surplus (deficit) before forecast allowance | | | 1,659 | | | 769 | | | 2,765 | | | 314 | | | 1,531 | | | (321 | ) | | (8,144 | ) | | (8,698 | ) | | (4,734 | ) | | (3,923 | ) | | | |
| Forecast allowance | | | - | | | - | | | - | | | - | | | - | | | - | | | - | | | (1,000 | ) | | (750 | ) | | (400 | ) | | | |
| Surplus (deficit) | | | 1,659 | | | 769 | | | 2,765 | | | 314 | | | 1,531 | | | (321 | ) | | (8,144 | ) | | (9,698 | ) | | (5,484 | ) | | (4,323 | ) | | | |
| | | | | | | | | | | | | | | | | | | | | | | | | | | | | | | | | | | |
| Per cent of nominal GDP: 1 | | | | | | | | | | | | | | | | | | | | | | | | | | | | | | | | | | |
| Surplus (deficit) | | | 0.7 | | | 0.3 | | | 1.0 | | | 0.1 | | | 0.5 | | | -0.1 | | | -2.8 | | | -3.1 | | | -1.7 | | | -1.3 | | | | |
| Per cent of revenue: | | | | | | | | | | | | | | | | | | | | | | | | | | | | | | | | | | |
| Surplus (deficit) | | | 3.6 | | | 1.6 | | | 5.4 | | | 0.6 | | | 2.7 | | | -0.5 | | | -13.4 | | | -16.5 | | | -8.7 | | | -6.6 | | | | |
| Per capita ($): 2 | | | | | | | | | | | | | | | | | | | | | | | | | | | | | | | | | | |
| Surplus (deficit) | | | 352 | | | 161 | | | 569 | | | 64 | | | 306 | | | (63 | ) | | (1,582 | ) | | (1,872 | ) | | (1,045 | ) | | (813 | ) | | | |
| 1 | Surplus (deficit) as a per cent of nominal GDP is calculated using nominal GDP for the calendar year ending in the fiscal year (e.g. 2021/22 amounts divided by nominal GDP for the 2021 calendar year). |
| 2 | Per capita revenue and expense is calculated using July 1 population (e.g. 2021/22 amounts divided by population on July 1, 2021). |
Budget and Fiscal Plan - 2021/22 to 2023/24
161
Appendix
Table A9 Revenue by Source – 2014/15 to 2023/24
| | | | | | | | | | | | | | | Updated | | Budget | | | | | | Average | |
| | | Actual | | Actual | | Actual | | Actual | | Actual | | Actual | | Forecast | | Estimate | | Plan | | Plan | | annual | |
| ($ millions) | | 2014/15 | | 2015/16 | | 2016/17 | | 2017/18 | | 2018/19 | | 2019/20 | | 2020/21 | | 2021/22 | | 2022/23 | | 2023/24 | | change | |
| | | | | | | | | | | | | | | | | | | | | | | (percent) | |
| Taxation revenue: | | | | | | | | | | | | | | | | | | | | | | | |
| Personal income | | | 8,076 | | | 8,380 | | | 9,704 | | | 8,923 | | | 11,364 | | | 10,657 | | | 11,118 | | | 11,170 | | | 11,565 | | | 12,047 | | | 4.5 | |
| Corporate income | | | 2,635 | | | 2,787 | | | 3,003 | | | 4,165 | | | 5,180 | | | 5,011 | | | 4,807 | | | 3,409 | | | 5,728 | | | 5,736 | | | 9.0 | |
| Employer health | | | - | | | - | | | - | | | - | | | 464 | | | 1,897 | | | 1,840 | | | 1,923 | | | 2,000 | | | 2,073 | | | n/a | |
| Sales | | | 5,762 | | | 5,990 | | | 6,606 | | | 7,131 | | | 7,369 | | | 7,374 | | | 7,446 | | | 7,872 | | | 8,492 | | | 8,865 | | | 4.9 | |
| Fuel | | | 932 | | | 973 | | | 969 | | | 1,010 | | | 1,015 | | | 1,008 | | | 933 | | | 983 | | | 992 | | | 969 | | | 0.4 | |
| Carbon | | | 1,198 | | | 1,190 | | | 1,220 | | | 1,255 | | | 1,465 | | | 1,682 | | | 1,640 | | | 1,985 | | | 2,221 | | | 2,116 | | | 6.5 | |
| Tobacco | | | 752 | | | 734 | | | 737 | | | 727 | | | 781 | | | 729 | | | 720 | | | 780 | | | 800 | | | 800 | | | 0.7 | |
| Property | | | 2,154 | | | 2,219 | | | 2,279 | | | 2,367 | | | 2,617 | | | 2,608 | | | 2,324 | | | 2,970 | | | 3,108 | | | 3,230 | | | 4.6 | |
| Property transfer | | | 1,065 | | | 1,533 | | | 2,026 | | | 2,141 | | | 1,826 | | | 1,609 | | | 2,000 | | | 1,975 | | | 1,912 | | | 1,877 | | | 6.5 | |
| Corporation capital | | | (1 | ) | | - | | | - | | | - | | | - | | | - | | | | | | | | | | | | | | | n/a | |
| Insurance premium | | | 483 | | | 520 | | | 549 | | | 602 | | | 633 | | | 691 | | | 705 | | | 715 | | | 725 | | | 735 | | | 4.8 | |
| | | | 23,056 | | | 24,326 | | | 27,093 | | | 28,321 | | | 32,714 | | | 33,266 | | | 33,533 | | | 33,782 | | | 37,543 | | | 38,448 | | | 5.8 | |
| Natural resource revenue: | | | | | | | | | | | | | | | | | | | | | | | | | | | | | | | | | | |
| Natural gas royalties | | | 493 | | | 139 | | | 152 | | | 161 | | | 199 | | | 118 | | | 191 | | | 286 | | | 315 | | | 366 | | | -3.3 | |
| Bonus bids, rents on drilling rights and leases | | | 834 | | | 765 | | | 633 | | | 276 | | | 279 | | | 225 | | | 165 | | | 141 | | | 131 | | | 110 | | | -20.2 | |
| Columbia River Treaty | | | 130 | | | 116 | | | 111 | | | 111 | | | 202 | | | 119 | | | 117 | | | 161 | | | 148 | | | 143 | | | 1.1 | |
| Other energy and minerals | | | 267 | | | 226 | | | 403 | | | 619 | | | 557 | | | 386 | | | 185 | | | 237 | | | 320 | | | 344 | | | 2.9 | |
| Forests | | | 754 | | | 865 | | | 913 | | | 1,065 | | | 1,406 | | | 988 | | | 1,121 | | | 1,204 | | | 948 | | | 916 | | | 2.2 | |
| Other resources | | | 459 | | | 460 | | | 499 | | | 463 | | | 465 | | | 432 | | | 436 | | | 503 | | | 515 | | | 510 | | | 1.2 | |
| | | | 2,937 | | | 2,571 | | | 2,711 | | | 2,695 | | | 3,108 | | | 2,268 | | | 2,215 | | | 2,532 | | | 2,377 | | | 2,389 | | | -2.3 | |
| Other revenue: | | | | | | | | | | | | | | | | | | | | | | | | | | | | | | | | | | |
| Medical Services Plan premiums | | | 2,254 | | | 2,434 | | | 2,558 | | | 2,266 | | | 1,360 | | | 1,063 | | | - | | | - | | | - | | | - | | | -100.0 | |
| Post-secondary education fees | | | 1,544 | | | 1,666 | | | 1,828 | | | 2,034 | | | 2,275 | | | 2,451 | | | 2,485 | | | 2,508 | | | 2,625 | | | 2,711 | | | 6.5 | |
| Other health-care related fees | | | 358 | | | 374 | | | 404 | | | 429 | | | 441 | | | 475 | | | 396 | | | 437 | | | 466 | | | 466 | | | 3.0 | |
| Motor vehicle licences and permits | | | 499 | | | 521 | | | 529 | | | 557 | | | 568 | | | 579 | | | 568 | | | 578 | | | 588 | | | 598 | | | 2.0 | |
| Other fees and licences | | | 770 | | | 841 | | | 894 | | | 963 | | | 949 | | | 1,004 | | | 993 | | | 1,114 | | | 1,026 | | | 1,093 | | | 4.0 | |
| Investment earnings | | | 1,171 | | | 1,213 | | | 1,232 | | | 1,101 | | | 1,243 | | | 1,263 | | | 1,205 | | | 1,174 | | | 1,185 | | | 1,186 | | | 0.1 | |
| Sales of goods and services | | | 967 | | | 1,011 | | | 1,131 | | | 1,133 | | | 1,164 | | | 1,162 | | | 716 | | | 1,004 | | | 1,297 | | | 1,407 | | | 4.3 | |
| Miscellaneous | | | 1,893 | | | 2,287 | | | 2,377 | | | 2,410 | | | 2,249 | | | 2,676 | | | 2,435 | | | 2,405 | | | 2,281 | | | 2,235 | | | 1.9 | |
| | | | 9,456 | | | 10,347 | | | 10,953 | | | 10,893 | | | 10,249 | | | 10,673 | | | 8,798 | | | 9,220 | | | 9,468 | | | 9,696 | | | 0.3 | |
| Contributions from the federal government: | | | | | | | | | | | | | | | | | | | | | | | | | | | | | | | | | | |
| Canada Health Transfer | | | 4,186 | | | 4,454 | | | 4,744 | | | 4,994 | | | 5,182 | | | 5,523 | | | 6,243 | | | 5,843 | | | 6,017 | | | 6,353 | | | 4.7 | |
| Canada Social Transfer | | | 1,641 | | | 1,695 | | | 1,751 | | | 1,854 | | | 1,908 | | | 1,971 | | | 2,042 | | | 2,096 | | | 2,159 | | | 2,225 | | | 3.4 | |
| Other cost shared agreements | | | 1,452 | | | 1,498 | | | 1,672 | | | 2,207 | | | 1,962 | | | 2,041 | | | 5,075 | | | 2,591 | | | 2,288 | | | 2,332 | | | 5.4 | |
| | | | 7,279 | | | 7,647 | | | 8,167 | | | 9,055 | | | 9,052 | | | 9,535 | | | 13,360 | | | 10,530 | | | 10,464 | | | 10,910 | | | 4.6 | |
| Commercial Crown corporation net income: | | | | | | | | | | | | | | | | | | | | | | | | | | | | | | | | | | |
| BC Hydro 1 | | | 581 | | | 655 | | | 684 | | | 683 | | | (428 | ) | | 705 | | | 691 | | | 712 | | | 712 | | | 712 | | | 2.3 | |
| Liquor Distribution Branch | | | 935 | | | 1,031 | | | 1,083 | | | 1,119 | | | 1,104 | | | 1,107 | | | 1,151 | | | 1,099 | | | 1,103 | | | 1,146 | | | 2.3 | |
| BC Lottery Corporation 2 | | | 1,245 | | | 1,304 | | | 1,329 | | | 1,391 | | | 1,405 | | | 1,336 | | | 383 | | | 771 | | | 1,283 | | | 1,403 | | | 1.3 | |
| ICBC | | | 657 | | | (293 | ) | | (612 | ) | | (1,327 | ) | | (1,153 | ) | | (376 | ) | | 709 | | | 154 | | | 202 | | | 229 | | | -11.1 | |
| BC Railway Company | | | 5 | | | 6 | | | 7 | | | 53 | | | 10 | | | 13 | | | 10 | | | 9 | | | 8 | | | 8 | | | 5.4 | |
| Transportation Investment Corporation | | | (89 | ) | | (80 | ) | | (81 | ) | | (29 | ) | | - | | | - | | | - | | | - | | | - | | | - | | | n/a | |
| Other | | | 37 | | | 87 | | | 115 | | | 116 | | | 117 | | | 133 | | | 117 | | | 120 | | | 126 | | | 133 | | | 15.3 | |
| Accounting adjustment 1 | | | - | | | - | | | - | | | (950 | ) | | 950 | | | - | | | - | | | - | | | - | | | - | | | n/a | |
| | | | 3,371 | | | 2,710 | | | 2,525 | | | 1,056 | | | 2,005 | | | 2,918 | | | 3,061 | | | 2,865 | | | 3,434 | | | 3,631 | | | 0.8 | |
| Total revenue | | | 46,099 | | | 47,601 | | | 51,449 | | | 52,020 | | | 57,128 | | | 58,660 | | | 60,967 | | | 58,929 | | | 63,286 | | | 65,074 | | | 3.9 | |
| 1 | BC Hydro’s loss for 2018/19 includes a write-off of a regulatory account. At the summary level, the Province recognized a $950 million adjustment in fiscal 2017/18 with respect to BC Hydro’s deferred regulatory accounts. |
| 2 | Net of payments to the federal government and beginning in 2021/22 , is also net of payments under the gaming revenue sharing agreement with First Nations. |
Budget and Fiscal Plan - 2021/22 to 2023/24
162
Appendix
Table A10 Revenue by Source Supplementary Information – 2014/15 to 2023/241
| | | | | | | | | | | | | | | Updated | | Budget | | | | | | Average | |
| | | Actual | | Actual | | Actual | | Actual | | Actual | | Actual | | Forecast | | Estimate | | Plan | | Plan | | annual | |
| | | 2014/15 | | 2015/16 | | 2016/17 | | 2017/18 | | 2018/19 | | 2019/20 | | 2020/21 | | 2021/22 | | 2022/23 | | 2023/24 | | change | |
| | | | | | | | | | | | | | | | | | | | | | | (percent) | |
| Per cent of nominal GDP: 2 | | | | | | | | | | | | | | | | | | | | | | | |
| Taxation and Medical Services Plan premiums | | | 10.4 | | | 10.7 | | | 11.2 | | | 10.8 | | | 11.5 | | | 11.1 | | | 11.4 | | | 10.7 | | | 11.3 | | | 11.2 | | | 0.8 | |
| Taxation | | | 9.5 | | | 9.7 | | | 10.3 | | | 10.0 | | | 11.0 | | | 10.8 | | | 11.4 | | | 10.7 | | | 11.3 | | | 11.2 | | | 1.9 | |
| Medical Services Plan premiums | | | 0.9 | | | 1.0 | | | 1.0 | | | 0.8 | | | 0.5 | | | 0.3 | | | - | | | - | | | - | | | - | | | -100.0 | |
| Natural resources | | | 1.2 | | | 1.0 | | | 1.0 | | | 1.0 | | | 1.1 | | | 0.7 | | | 0.8 | | | 0.8 | | | 0.7 | | | 0.7 | | | -5.9 | |
| Other | | | 3.9 | | | 4.1 | | | 4.2 | | | 3.9 | | | 3.5 | | | 3.5 | | | 3.0 | | | 2.9 | | | 2.9 | | | 2.8 | | | -3.5 | |
| Other excluding Medical Services Plan premiums | | | 3.0 | | | 3.2 | | | 3.2 | | | 3.1 | | | 3.0 | | | 3.1 | | | 3.0 | | | 2.9 | | | 2.9 | | | 2.8 | | | -0.5 | |
| Contributions from the federal government | | | 3.0 | | | 3.0 | | | 3.1 | | | 3.2 | | | 3.1 | | | 3.1 | | | 4.5 | | | 3.4 | | | 3.2 | | | 3.2 | | | 0.7 | |
| Commercial Crown corporation net income | | | 1.4 | | | 1.1 | | | 1.0 | | | 0.4 | | | 0.7 | | | 0.9 | | | 1.0 | | | 0.9 | | | 1.0 | | | 1.1 | | | -3.0 | |
| Total revenue | | | 18.9 | | | 19.0 | | | 19.5 | | | 18.4 | | | 19.3 | | | 19.0 | | | 20.6 | | | 18.8 | | | 19.1 | | | 18.9 | | | 0.0 | |
| Growth rates (per cent): | | | | | | | | | | | | | | | | | | | | | | | | | | | | | | | | | | |
| Taxation and Medical Services Plan premiums | | | 9.6 | | | 5.7 | | | 10.8 | | | 3.2 | | | 11.4 | | | 0.7 | | | -2.3 | | | 0.7 | | | 11.1 | | | 2.4 | | | n/a | |
| Taxation | | | 10.2 | | | 5.5 | | | 11.4 | | | 4.5 | | | 15.5 | | | 1.7 | | | 0.8 | | | 0.7 | | | 11.1 | | | 2.4 | | | n/a | |
| Medical Services Plan premiums | | | 4.4 | | | 8.0 | | | 5.1 | | | -11.4 | | | -40.0 | | | -21.8 | | | -100.0 | | | n/a | | | n/a | | | n/a | | | n/a | |
| Natural resources | | | -0.6 | | | -12.5 | | | 5.4 | | | -0.6 | | | 15.3 | | | -27.0 | | | -2.3 | | | 14.3 | | | -6.1 | | | 0.5 | | | n/a | |
| Other | | | -1.7 | | | 9.4 | | | 5.9 | | | -0.5 | | | -5.9 | | | 4.1 | | | -17.6 | | | 4.8 | | | 2.7 | | | 2.4 | | | n/a | |
| Other excluding Medical Services Plan premiums | | | -3.4 | | | 9.9 | | | 6.1 | | | 2.8 | | | 3.0 | | | 8.1 | | | -8.4 | | | 4.8 | | | 2.7 | | | 2.4 | | | n/a | |
| Contributions from the federal government | | | -3.1 | | | 5.1 | | | 6.8 | | | 10.9 | | | 0.0 | | | 5.3 | | | 40.1 | | | -21.2 | | | -0.6 | | | 4.3 | | | n/a | |
| Commercial Crown corporation net income | | | 24.8 | | | -19.6 | | | -6.8 | | | -58.2 | | | 89.9 | | | 45.5 | | | 4.9 | | | -6.4 | | | 19.9 | | | 5.7 | | | n/a | |
| Total revenue | | | 5.5 | | | 3.3 | | | 8.1 | | | 1.1 | | | 9.8 | | | 2.7 | | | 3.9 | | | -3.3 | | | 7.4 | | | 2.8 | | | n/a | |
| Per capita ($): 3 | | | | | | | | | | | | | | | | | | | | | | | | | | | | | | | | | | |
| Taxation and Medical Services Plan premiums | | | 5,377 | | | 5,603 | | | 6,102 | | | 6,205 | | | 6,801 | | | 6,743 | | | 6,514 | | | 6,521 | | | 7,157 | | | 7,232 | | | 3.3 | |
| Taxation | | | 4,898 | | | 5,093 | | | 5,576 | | | 5,745 | | | 6,529 | | | 6,534 | | | 6,514 | | | 6,521 | | | 7,157 | | | 7,232 | | | 4.4 | |
| Medical Services Plan premiums | | | 479 | | | 510 | | | 526 | | | 460 | | | 271 | | | 209 | | | - | | | - | | | - | | | - | | | -100.0 | |
| Natural resources | | | 624 | | | 538 | | | 558 | | | 547 | | | 620 | | | 445 | | | 430 | | | 489 | | | 453 | | | 449 | | | -3.6 | |
| Other | | | 2,009 | | | 2,166 | | | 2,254 | | | 2,210 | | | 2,046 | | | 2,096 | | | 1,709 | | | 1,780 | | | 1,805 | | | 1,824 | | | -1.1 | |
| Other excluding Medical Services Plan premiums | | | 1,530 | | | 1,657 | | | 1,728 | | | 1,750 | | | 1,774 | | | 1,888 | | | 1,709 | | | 1,780 | | | 1,805 | | | 1,824 | | | 2.0 | |
| Contributions from the federal government | | | 1,546 | | | 1,601 | | | 1,681 | | | 1,837 | | | 1,807 | | | 1,873 | | | 2,595 | | | 2,033 | | | 1,995 | | | 2,052 | | | 3.2 | |
| Commercial Crown corporation net income | | | 716 | | | 567 | | | 520 | | | 214 | | | 400 | | | 573 | | | 595 | | | 553 | | | 655 | | | 683 | | | -0.5 | |
| Total revenue | | | 9,793 | | | 9,966 | | | 10,588 | | | 10,553 | | | 11,402 | | | 11,522 | | | 11,844 | | | 11,375 | | | 12,065 | | | 12,240 | | | 2.5 | |
| | | | | | | | | | | | | | | | | | | | | | | | | | | | | | | | | | | |
| | | | | | | | | | | | | | | | | | | | | | | | | | | | | | | | | | | |
| Real Per Capita Revenue (2020 $) 4 | | | 10,905 | | | 10,977 | | | 11,453 | | | 11,178 | | | 11,757 | | | 11,610 | | | 11,844 | | | 11,190 | | | 11,632 | | | 11,555 | | | 0.6 | |
| Growth rate (per cent) | | | 2.7 | | | 0.7 | | | 4.3 | | | -2.4 | | | 5.2 | | | -1.2 | | | 2.0 | | | -5.5 | | | 4.0 | | | -0.7 | | | 0.9 | |
| 1 | Numbers may not add due to rounding. |
| 2 | Revenue as a per cent of GDP is calculated using nominal GDP for the calendar year ending in the fiscal year (e.g. 2021/22 revenue divided by nominal GDP for the 2021 calendar year). |
| 3 | Per capita revenue is calculated using July 1 population (e.g. 2021/22 revenue divided by population on July 1, 2021). |
| 4 | Revenue is converted to real (inflation-adjusted) terms using the consumer price index (CPI) for the corresponding calendar year (e.g. 2021 CPI for 2021/22 revenue). |
Budget and Fiscal Plan - 2021/22 to 2023/24
163
Appendix
Table A11 Expense by Function – 2014/15 to 2023/24 1,2
| | | | | | | | | | | | | | | Updated | | Budget | | | | | | Average | |
| ($ millions) | | Actual | | Actual | | Actual | | Actual | | Actual | | Actual | | Forecast | | Estimate | | Plan | | Plan | | annual | |
| | | 2014/15 | | 2015/16 | | 2016/17 | | 2017/18 | | 2018/19 | | 2019/20 | | 2020/21 | | 2021/22 | | 2022/23 | | 2023/24 | | change | |
| | | | | | | | | | | | | | | | | | | | | | | (percent) | |
| Function: | | | | | | | | | | | | | | | | | | | | | | | | | | | | | | | | | | |
| Health: | | | | | | | | | | | | | | | | | | | | | | | | | | | | | | | | | | |
| Medical Services Plan | | | 4,136 | | | 4,345 | | | 4,573 | | | 4,623 | | | 4,861 | | | 5,013 | | | 5,275 | | | 5,589 | | | 5,877 | | | 6,082 | | | 4.4 | |
| Pharmacare | | | 1,120 | | | 1,335 | | | 1,284 | | | 1,400 | | | 1,494 | | | 1,517 | | | 1,561 | | | 1,620 | | | 1,664 | | | 1,689 | | | 4.7 | |
| Regional services | | | 12,410 | | | 12,811 | | | 13,079 | | | 14,094 | | | 14,996 | | | 16,047 | | | 16,586 | | | 17,926 | | | 18,284 | | | 18,739 | | | 4.7 | |
| Other healthcare expenses | | | 704 | | | 712 | | | 753 | | | 810 | | | 800 | | | 872 | | | 917 | | | 971 | | | 1,019 | | | 1,070 | | | 4.8 | |
| Total health | | | 18,370 | | | 19,203 | | | 19,689 | | | 20,927 | | | 22,151 | | | 23,449 | | | 24,339 | | | 26,106 | | | 26,844 | | | 27,580 | | | 4.6 | |
| Education: | | | | | | | | | | | | | | | | | | | | | | | | | | | | | | | | | | |
| Elementary and secondary | | | 6,064 | | | 6,303 | | | 6,422 | | | 6,917 | | | 7,253 | | | 7,582 | | | 8,024 | | | 8,059 | | | 8,097 | | | 8,092 | | | 3.3 | |
| Post-secondary | | | 5,350 | | | 5,503 | | | 5,673 | | | 5,998 | | | 6,394 | | | 6,842 | | | 6,982 | | | 7,293 | | | 7,409 | | | 7,636 | | | 4.0 | |
| Other education expenses | | | 414 | | | 407 | | | 374 | | | 176 | | | 442 | | | 310 | | | 432 | | | 453 | | | 446 | | | 444 | | | 0.8 | |
| Total education | | | 11,828 | | | 12,213 | | | 12,469 | | | 13,091 | | | 14,089 | | | 14,734 | | | 15,438 | | | 15,805 | | | 15,952 | | | 16,172 | | | 3.5 | |
| Social services: | | | | | | | | | | | | | | | | | | | | | | | | | | | | | | | | | | |
| Social assistance | | | 1,589 | | | 1,641 | | | 1,692 | | | 1,988 | | | 2,202 | | | 2,342 | | | 2,441 | | | 2,885 | | | 2,948 | | | 2,957 | | | 7.1 | |
| Child welfare | | | 1,129 | | | 1,301 | | | 1,358 | | | 1,507 | | | 1,652 | | | 1,940 | | | 2,232 | | | 2,512 | | | 2,551 | | | 2,551 | | | 9.5 | |
| Low income tax credit transfers | | | 248 | | | 247 | | | 244 | | | 239 | | | 414 | | | 435 | | | 884 | | | 370 | | | 395 | | | 405 | | | 5.6 | |
| Community living and other services | | | 881 | | | 917 | | | 949 | | | 1,003 | | | 1,075 | | | 1,170 | | | 1,225 | | | 1,405 | | | 1,436 | | | 1,452 | | | 5.7 | |
| Total social services | | | 3,847 | | | 4,106 | | | 4,243 | | | 4,737 | | | 5,343 | | | 5,887 | | | 6,782 | | | 7,172 | | | 7,330 | | | 7,365 | | | 7.5 | |
| Protection of persons and property | | | 1,451 | | | 1,572 | | | 1,655 | | | 1,930 | | | 2,004 | | | 2,126 | | | 1,954 | | | 1,935 | | | 1,942 | | | 1,943 | | | 3.3 | |
| Transportation | | | 1,608 | | | 1,670 | | | 1,784 | | | 1,931 | | | 2,021 | | | 2,126 | | | 2,172 | | | 2,336 | | | 2,393 | | | 2,374 | | | 4.4 | |
| Natural resources & economic development | | | 2,191 | | | 2,477 | | | 2,465 | | | 3,374 | | | 3,825 | | | 3,778 | | | 3,262 | | | 3,467 | | | 3,544 | | | 3,674 | | | 5.9 | |
| Other | | | 1,288 | | | 1,264 | | | 2,260 | | | 1,553 | | | 1,810 | | | 2,501 | | | 2,719 | | | 2,218 | | | 2,257 | | | 2,223 | | | 6.3 | |
| Contingencies - general programs | | | - | | | - | | | - | | | - | | | - | | | - | | | 736 | | | 1,000 | | | 800 | | | 700 | | | n/a | |
| Contingencies - caseload pressures and priority initiatives | | | | | | | | | | | | | | | | | | | | | | | | | | | 1,500 | | | 2,000 | | | n/a | |
| Pandemic and Recovery Contingencies | | | | | | | | | | | | | | | | | | | | | 7,510 | | | 3,250 | | | 1,000 | | | 300 | | | n/a | |
| General government | | | 1,359 | | | 1,501 | | | 1,532 | | | 1,540 | | | 1,670 | | | 1,653 | | | 1,499 | | | 1,531 | | | 1,525 | | | 1,536 | | | 1.4 | |
| Debt servicing | | | 2,498 | | | 2,826 | | | 2,587 | | | 2,623 | | | 2,684 | | | 2,727 | | | 2,700 | | | 2,807 | | | 2,934 | | | 3,130 | | | 2.5 | |
| Total expense | | | 44,440 | | | 46,832 | | | 48,684 | | | 51,706 | | | 55,597 | | | 58,981 | | | 69,111 | | | 67,627 | | | 68,020 | | | 68,997 | | | | |
| Per cent of operating expense: | | | | | | | | | | | | | | | | | | | | | | | | | | | | | | | | | | |
| Health | | | 41.3 | | | 41.0 | | | 40.4 | | | 40.5 | | | 39.8 | | | 39.8 | | | 35.2 | | | 38.6 | | | 39.5 | | | 40.0 | | | -0.4 | |
| Education | | | 26.6 | | | 26.1 | | | 25.6 | | | 25.3 | | | 25.3 | | | 25.0 | | | 22.3 | | | 23.4 | | | 23.5 | | | 23.4 | | | -1.4 | |
| Social services | | | 8.7 | | | 8.8 | | | 8.7 | | | 9.2 | | | 9.6 | | | 10.0 | | | 9.8 | | | 10.6 | | | 10.8 | | | 10.7 | | | 2.4 | |
| Protection of persons and property | | | 3.3 | | | 3.4 | | | 3.4 | | | 3.7 | | | 3.6 | | | 3.6 | | | 2.8 | | | 2.9 | | | 2.9 | | | 2.8 | | | -1.6 | |
| Transportation | | | 3.6 | | | 3.6 | | | 3.7 | | | 3.7 | | | 3.6 | | | 3.6 | | | 3.1 | | | 3.5 | | | 3.5 | | | 3.4 | | | -0.6 | |
| Natural resources & economic development | | | 4.9 | | | 5.3 | | | 5.1 | | | 6.5 | | | 6.9 | | | 6.4 | | | 4.7 | | | 5.1 | | | 5.2 | | | 5.3 | | | 0.9 | |
| Other | | | 2.9 | | | 2.7 | | | 4.6 | | | 3.0 | | | 3.3 | | | 4.2 | | | 3.9 | | | 3.3 | | | 3.3 | | | 3.2 | | | 1.2 | |
| Contingencies - general programs | | | - | | | - | | | - | | | - | | | - | | | - | | | 1.1 | | | 1.5 | | | 1.2 | | | 1.0 | | | n/a | |
| Contingencies - caseload pressures and priority initiatives | | | | | | | | | | | | | | | | | | | | | | | | | | | 2.2 | | | 2.9 | | | n/a | |
| Pandemic and Recovery Contingencies | | | | | | | | | | | | | | | | | | | | | 10.9 | | | 4.8 | | | 1.5 | | | 0.4 | | | n/a | |
| General government | | | 3.1 | | | 3.2 | | | 3.1 | | | 3.0 | | | 3.0 | | | 2.8 | | | 2.2 | | | 2.3 | | | 2.2 | | | 2.2 | | | -3.5 | |
| Debt servicing | | | 5.6 | | | 6.0 | | | 5.3 | | | 5.1 | | | 4.8 | | | 4.6 | | | 3.9 | | | 4.2 | | | 4.3 | | | 4.5 | | | -2.4 | |
| Operating expense | | | 100.0 | | | 100.0 | | | 100.0 | | | 100.0 | | | 100.0 | | | 100.0 | | | 100.0 | | | 100.0 | | | 100.0 | | | 100.0 | | | | |
| 1 | Figures reflect government accounting policies used in the 2019/20 Public Accounts audited financial statements. |
| 2 | Numbers may not add due to rounding. |
Budget and Fiscal Plan - 2021/22 to 2023/24
164
Appendix
Table A12 Expense by Function Supplementary Information – 2014/15 to 2023/241
| | | | | | | | | | | | | | | Updated | | Budget | | | | | | Average | |
| | | Actual | | Actual | | Actual | | Actual | | Actual | | Actual | | Forecast | | Estimate | | Plan | | Plan | | annual | |
| | | 2014/15 | | 2015/16 | | 2016/17 | | 2017/18 | | 2018/19 | | 2019/20 | | 2020/21 | | 2021/22 | | 2022/23 | | 2023/24 | | change | |
| | | | | | | | | | | | | | | | | | | | | | | (percent) | |
| Per cent of nominal GDP: 2 | | | | | | | | | | | | | | | | | | | | | | | |
| Health | | | 7.5 | | | 7.7 | | | 7.5 | | | 7.4 | | | 7.5 | | | 7.6 | | | 8.2 | | | 8.3 | | | 8.1 | | | 8.0 | | | 0.7 | |
| Education | | | 4.9 | | | 4.9 | | | 4.7 | | | 4.6 | | | 4.8 | | | 4.8 | | | 5.2 | | | 5.0 | | | 4.8 | | | 4.7 | | | -0.4 | |
| Social services | | | 1.6 | | | 1.6 | | | 1.6 | | | 1.7 | | | 1.8 | | | 1.9 | | | 2.3 | | | 2.3 | | | 2.2 | | | 2.1 | | | 3.4 | |
| Protection of persons and property | | | 0.6 | | | 0.6 | | | 0.6 | | | 0.7 | | | 0.7 | | | 0.7 | | | 0.7 | | | 0.6 | | | 0.6 | | | 0.6 | | | -0.6 | |
| Transportation | | | 0.7 | | | 0.7 | | | 0.7 | | | 0.7 | | | 0.7 | | | 0.7 | | | 0.7 | | | 0.7 | | | 0.7 | | | 0.7 | | | 0.5 | |
| Natural resources & economic development | | | 0.9 | | | 1.0 | | | 0.9 | | | 1.2 | | | 1.3 | | | 1.2 | | | 1.1 | | | 1.1 | | | 1.1 | | | 1.1 | | | 1.9 | |
| Other | | | 0.5 | | | 0.5 | | | 0.9 | | | 0.6 | | | 0.6 | | | 0.8 | | | 0.9 | | | 0.7 | | | 0.7 | | | 0.6 | | | 2.3 | |
| Contingencies - general programs | | | - | | | - | | | - | | | - | | | - | | | - | | | 0.2 | | | 0.3 | | | 0.2 | | | 0.2 | | | n/a | |
| Contingencies - caseload pressures and priority initiatives | | | | | | | | | | | | | | | | | | | | | | | | | | | 0.5 | | | 0.6 | | | n/a | |
| Pandemic and Recovery Contingencies | | | | | | | | | | | | | | | | | | | | | 2.5 | | | 1.0 | | | 0.3 | | | 0.1 | | | n/a | |
| General government | | | 0.6 | | | 0.6 | | | 0.6 | | | 0.5 | | | 0.6 | | | 0.5 | | | 0.5 | | | 0.5 | | | 0.5 | | | 0.4 | | | -2.4 | |
| Debt servicing | | | 1.0 | | | 1.1 | | | 1.0 | | | 0.9 | | | 0.9 | | | 0.9 | | | 0.9 | | | 0.9 | | | 0.9 | | | 0.9 | | | -1.3 | |
| Operating expense | | | 18.2 | | | 18.7 | | | 18.4 | | | 18.3 | | | 18.8 | | | 19.1 | | | 23.4 | | | 21.5 | | | 20.5 | | | 20.0 | | | 1.1 | |
| Growth rates (per cent): | | | | | | | | | | | | | | | | | | | | | | | | | | | | | | | | | | |
| Health | | | 2.8 | | | 4.5 | | | 2.5 | | | 6.3 | | | 5.8 | | | 5.9 | | | 3.8 | | | 7.3 | | | 2.8 | | | 2.7 | | | n/a | |
| Education | | | 0.0 | | | 3.3 | | | 2.1 | | | 5.0 | | | 7.6 | | | 4.6 | | | 4.8 | | | 2.4 | | | 0.9 | | | 1.4 | | | n/a | |
| Social services | | | 1.1 | | | 6.7 | | | 3.3 | | | 11.6 | | | 12.8 | | | 10.2 | | | 15.2 | | | 5.8 | | | 2.2 | | | 0.5 | | | n/a | |
| Protection of persons and property | | | -4.5 | | | 8.3 | | | 5.3 | | | 16.6 | | | 3.8 | | | 6.1 | | | -8.1 | | | -1.0 | | | 0.4 | | | 0.1 | | | n/a | |
| Transportation | | | 1.8 | | | 3.9 | | | 6.8 | | | 8.2 | | | 4.7 | | | 5.2 | | | 2.2 | | | 7.6 | | | 2.4 | | | -0.8 | | | n/a | |
| Natural resources & economic development | | | 24.8 | | | 13.1 | | | -0.5 | | | 36.9 | | | 13.4 | | | -1.2 | | | -13.7 | | | 6.3 | | | 2.2 | | | 3.7 | | | n/a | |
| Other | | | 8.8 | | | -1.9 | | | 78.8 | | | -31.3 | | | 16.5 | | | 38.2 | | | 8.7 | | | -18.4 | | | 1.7 | | | -1.5 | | | n/a | |
| General government | | | -1.9 | | | 10.4 | | | 2.1 | | | 0.5 | | | 8.4 | | | -1.0 | | | -9.3 | | | 2.1 | | | -0.4 | | | 0.7 | | | n/a | |
| Debt servicing | | | 0.6 | | | 13.1 | | | -8.5 | | | 1.4 | | | 2.3 | | | 1.6 | | | -1.0 | | | 4.0 | | | 4.5 | | | 6.7 | | | n/a | |
| Operating expense | | | 2.4 | | | 5.4 | | | 4.0 | | | 6.2 | | | 7.5 | | | 6.1 | | | 17.2 | | | (2.1 | ) | | 0.6 | | | 1.4 | | | n/a | |
| Per capita ($): 3 | | | | | | | | | | | | | | | | | | | | | | | | | | | | | | | | | | |
| Health | | | 3,903 | | | 4,020 | | | 4,052 | | | 4,245 | | | 4,421 | | | 4,606 | | | 4,728 | | | 5,039 | | | 5,118 | | | 5,188 | | | 3.2 | |
| Education | | | 2,513 | | | 2,557 | | | 2,566 | | | 2,656 | | | 2,812 | | | 2,894 | | | 2,999 | | | 3,051 | | | 3,041 | | | 3,042 | | | 2.1 | |
| Social services | | | 817 | | | 860 | | | 873 | | | 961 | | | 1,066 | | | 1,156 | | | 1,317 | | | 1,384 | | | 1,397 | | | 1,385 | | | 6.0 | |
| Protection of persons and property | | | 308 | | | 329 | | | 341 | | | 392 | | | 400 | | | 418 | | | 380 | | | 374 | | | 370 | | | 365 | | | 1.9 | |
| Transportation | | | 342 | | | 350 | | | 367 | | | 392 | | | 403 | | | 418 | | | 422 | | | 451 | | | 456 | | | 447 | | | 3.0 | |
| Natural resources & economic development | | | 465 | | | 519 | | | 507 | | | 684 | | | 763 | | | 742 | | | 634 | | | 669 | | | 676 | | | 691 | | | 4.5 | |
| Other | | | 274 | | | 265 | | | 465 | | | 315 | | | 361 | | | 491 | | | 528 | | | 428 | | | 430 | | | 418 | | | 4.8 | |
| Contingencies - general programs | | | - | | | - | | | - | | | - | | | - | | | - | | | 143 | | | 193 | | | 153 | | | 132 | | | n/a | |
| Contingencies - caseload pressures and priority initiatives | | | | | | | | | | | | | | | | | | | | | | | | | | | 286 | | | 376 | | | n/a | |
| Pandemic and Recovery Contingencies | | | | | | | | | | | | | | | | | | | | | 1,459 | | | 627 | | | 191 | | | 56 | | | n/a | |
| General government | | | 289 | | | 314 | | | 315 | | | 312 | | | 333 | | | 325 | | | 291 | | | 296 | | | 291 | | | 289 | | | 0.0 | |
| Debt servicing | | | 531 | | | 592 | | | 532 | | | 532 | | | 536 | | | 536 | | | 525 | | | 542 | | | 559 | | | 589 | | | 1.2 | |
| Operating expense | | | 9,442 | | | 9,806 | | | 10,018 | | | 10,489 | | | 11,095 | | | 11,586 | | | 13,426 | | | 13,054 | | | 12,968 | | | 12,978 | | | 3.6 | |
| Real Per Capita Operating Expense (2020 $) 4 | | | 10,513 | | | 10,800 | | | 10,837 | | | 11,110 | | | 11,442 | | | 11,674 | | | 13,426 | | | 12,841 | | | 12,502 | | | 12,252 | | | 1.7 | |
| Growth rate (per cent) | | | -0.3 | | | 2.7 | | | 0.3 | | | 2.5 | | | 3.0 | | | 2.0 | | | 17.3 | | | -4.4 | | | -2.6 | | | -2.0 | | | 1.9 | |
| 1 | Numbers may not add due to rounding. |
| 2 | Expense as a per cent of GDP is calculated using nominal GDP for the calendar year ending in the fiscal year (e.g. 2021/22 expense divided by nominal GDP for the 2021 calendar year). |
| 3 | Per capita expense is calculated using July 1 population (e.g. 2021/22 expense divided by population on July 1, 2021). |
| 4 | Expense is converted to real (inflation-adjusted) terms using the consumer price index (CPI) for the corresponding calendar year (e.g. 2021 CPI for 2021/22 expense). |
Budget and Fiscal Plan - 2021/22 to 2023/24
165
Appendix
Table A13 Full-Time Equivalents (FTEs) – 2014/15 to 2023/2024 1
| | | | | | | | | | | | | | | Updated | | Budget | | | | | | Average | |
| | | Actual | | Actual | | Actual | | Actual | | Actual | | Actual | | Forecast | | Estimate | | Plan | | Plan | | annual | |
| | | 2014/15 | | 2015/16 | | 2016/17 | | 2017/18 | | 2018/19 | | 2019/20 | | 2020/21 | | 2021/22 | | 2022/23 | | 2023/24 | | change | |
| | | | | | | | | | | | | | | | | | | | | | | (percent) | |
| Taxpayer-supported programs and agencies: | | | | | | | | | | | | | | | | | | | | | | | |
| Ministries and special offices (CRF) | | | 26,679 | | | 27,192 | | | 27,940 | | | 29,291 | | | 30,891 | | | 31,774 | | | 32,400 | | | 32,750 | | | 32,750 | | | 32,750 | | | 2.3 | |
| Service delivery agencies 2 | | | 4,798 | | | 4,803 | | | 4,850 | | | 5,076 | | | 5,258 | | | 5,985 | | | 6,056 | | | 6,910 | | | 7,810 | | | 7,952 | | | 5.8 | |
| Total FTEs | | | 31,477 | | | 31,995 | | | 32,790 | | | 34,367 | | | 36,149 | | | 37,759 | | | 38,456 | | | 39,660 | | | 40,560 | | | 40,702 | | | 2.9 | |
| Growth rates (per cent): | | | | | | | | | | | | | | | | | | | | | | | | | | | | | | | | | | |
| Ministries and special offices (CRF) | | | 0.6 | | | 1.9 | | | 2.8 | | | 4.8 | | | 5.5 | | | 2.9 | | | 2.0 | | | 1.1 | | | 0.0 | | | 0.0 | | | 2.1 | |
| Service delivery agencies | | | 3.4 | | | 0.1 | | | 1.0 | | | 4.7 | | | 3.6 | | | 13.8 | | | 1.2 | | | 14.1 | | | 13.0 | | | 1.8 | | | 5.7 | |
| Population per FTE: 3 | | | | | | | | | | | | | | | | | | | | | | | | | | | | | | | | | | |
| Total FTEs | | | 149.5 | | | 149.3 | | | 148.2 | | | 143.4 | | | 138.6 | | | 134.8 | | | 133.9 | | | 130.6 | | | 129.3 | | | 130.6 | | | -1.5 | |
| 1 | Full-time equivalents (FTEs) are a measure of staff employment. FTEs are calculated by dividing the total hours of employment paid for in a given period by the number of hours an individual, full-time person would normally work in that period. This does not equate to the physical number of employees. For example, two half-time employees would equal one FTE, or alternatively, three FTEs may represent two full-time employees who have worked sufficient overtime hours to equal an additional FTE. |
| 2 | Service delivery agency FTE amounts do not include SUCH sector staff employment. |
| 3 | Population per FTE is calculated using July 1 population (e.g. population on July 1, 2021 divided by 2021/22 FTEs). |
Budget and Fiscal Plan - 2021/22 to 2023/24
166
Appendix
Table A14 Capital Spending – 2014/15 to 2023/24
| | | | | | | | | | | | | | | Updated | | Budget | | | | | | Average | |
| | | Actual | | Actual | | Actual | | Actual | | Actual | | Actual | | Forecast | | Estimate | | Plan | | Plan | | annual | |
| ($ millions) | | 2014/15 | | 2015/16 | | 2016/17 | | 2017/18 | | 2018/19 | | 2019/20 | | 2020/21 | | 2021/22 | | 2022/23 | | 2023/24 | | change | |
| | | | | | | | | | | | | | | | | | | | | | | (percent) | |
| Taxpayer-supported: | | | | | | | | | | | | | | | | | | | | | | | |
| Education | | | | | | | | | | | | | | | | | | | | | | | | | | | | | | | | | | |
| Schools districts | | | 420 | | | 430 | | | 474 | | | 578 | | | 626 | | | 877 | | | 972 | | | 1,197 | | | 1,114 | | | 1,187 | | | 12.2 | |
| Post-secondary institutions | | | 718 | | | 746 | | | 792 | | | 968 | | | 1,024 | | | 936 | | | 931 | | | 1,263 | | | 1,271 | | | 1,261 | | | 6.5 | |
| Health | | | 900 | | | 923 | | | 1,004 | | | 890 | | | 904 | | | 1,009 | | | 1,533 | | | 2,245 | | | 2,603 | | | 2,972 | | | 14.2 | |
| BC Transportation Financing Authority 1 | | | 822 | | | 867 | | | 823 | | | 717 | | | 853 | | | 955 | | | 1,525 | | | 2,162 | | | 2,539 | | | 2,264 | | | 11.9 | |
| BC Transit | | | 83 | | | 51 | | | 41 | | | 115 | | | 85 | | | 73 | | | 114 | | | 113 | | | 199 | | | 257 | | | 13.4 | |
| Government direct (ministries) | | | 326 | | | 290 | | | 301 | | | 430 | | | 421 | | | 520 | | | 435 | | | 641 | | | 521 | | | 457 | | | 3.8 | |
| Social Housing | | | 107 | | | 127 | | | 184 | | | 169 | | | 483 | | | 355 | | | 679 | | | 671 | | | 574 | | | 335 | | | 13.5 | |
| Other | | | 31 | | | 25 | | | 40 | | | 41 | | | 56 | | | 47 | | | 88 | | | 187 | | | 204 | | | 139 | | | 18.1 | |
| | | | 3,407 | | | 3,459 | | | 3,659 | | | 3,908 | | | 4,452 | | | 4,772 | | | 6,277 | | | 8,479 | | | 9,025 | | | 8,872 | | | 11.2 | |
| Self-supported: | | | | | | | | | | | | | | | | | | | | | | | | | | | | | | | | | | |
| BC Hydro | | | 2,169 | | | 2,306 | | | 2,444 | | | 2,473 | | | 3,826 | | | 3,082 | | | 3,573 | | | 4,738 | | | 4,413 | | | 3,305 | | | 4.8 | |
| Columbia Basin power projects | | | 28 | | | 15 | | | 2 | | | 1 | | | 2 | | | 994 | | | 8 | | | 9 | | | 13 | | | 25 | | | -1.3 | |
| Transportation Investment Corporation 1 | | | 76 | | | 25 | | | 38 | | | 4 | | | - | | | - | | | - | | | - | | | - | | | - | | | n/a | |
| BC Railway Company | | | 5 | | | 23 | | | 4 | | | 11 | | | 33 | | | 6 | | | 3 | | | 11 | | | 4 | | | 2 | | | -9.7 | |
| ICBC | | | 88 | | | 90 | | | 62 | | | 54 | | | 66 | | | 62 | | | 107 | | | 68 | | | 42 | | | 46 | | | -7.0 | |
| BC Lottery Corporation | | | 69 | | | 68 | | | 86 | | | 82 | | | 75 | | | 102 | | | 89 | | | 96 | | | 120 | | | 90 | | | 3.0 | |
| Liquor Distribution Branch | | | 25 | | | 23 | | | 27 | | | 48 | | | 60 | | | 36 | | | 32 | | | 54 | | | 48 | | | 21 | | | -1.9 | |
| Other 2 | | | 28 | | | 23 | | | 62 | | | 56 | | | 44 | | | 104 | | | - | | | - | | | - | | | - | | | n/a | |
| | | | 2,488 | | | 2,573 | | | 2,725 | | | 2,729 | | | 4,106 | | | 4,386 | | | 3,812 | | | 4,976 | | | 4,640 | | | 3,489 | | | 3.8 | |
| Total capital spending | | | 5,895 | | | 6,032 | | | 6,384 | | | 6,637 | | | 8,558 | | | 9,158 | | | 10,089 | | | 13,455 | | | 13,665 | | | 12,361 | | | 8.6 | |
| Per cent of nominal GDP: 3 | | | | | | | | | | | | | | | | | | | | | | | | | | | | | | | | | | |
| Taxpayer-supported | | | 1.4 | | | 1.4 | | | 1.4 | | | 1.4 | | | 1.5 | | | 1.5 | | | 2.1 | | | 2.7 | | | 2.7 | | | 2.6 | | | 7.0 | |
| Self-supported | | | 1.0 | | | 1.0 | | | 1.0 | | | 1.0 | | | 1.4 | | | 1.4 | | | 1.3 | | | 1.6 | | | 1.4 | | | 1.0 | | | -0.1 | |
| Total | | | 2.4 | | | 2.4 | | | 2.4 | | | 2.4 | | | 2.9 | | | 3.0 | | | 3.4 | | | 4.3 | | | 4.1 | | | 3.6 | | | 4.5 | |
| Growth rates: | | | | | | | | | | | | | | | | | | | | | | | | | | | | | | | | | | |
| Taxpayer-supported | | | 8.1 | | | 1.5 | | | 5.8 | | | 6.8 | | | 13.9 | | | 7.2 | | | 31.5 | | | 35.1 | | | 6.4 | | | -1.7 | | | 11.5 | |
| Self-supported | | | -1.2 | | | 3.4 | | | 5.9 | | | 0.1 | | | 50.5 | | | 6.8 | | | -13.1 | | | 30.5 | | | -6.8 | | | -24.8 | | | 5.1 | |
| Total | | | 4.0 | | | 2.3 | | | 5.8 | | | 4.0 | | | 28.9 | | | 7.0 | | | 10.2 | | | 33.4 | | | 1.6 | | | -9.5 | | | 8.8 | |
| Per capita: 4 | | | | | | | | | | | | | | | | | | | | | | | | | | | | | | | | | | |
| Taxpayer-supported | | | 724 | | | 724 | | | 753 | | | 793 | | | 889 | | | 937 | | | 1,219 | | | 1,637 | | | 1,721 | | | 1,669 | | | 9.7 | |
| Self-supported | | | 529 | | | 539 | | | 561 | | | 554 | | | 819 | | | 862 | | | 741 | | | 960 | | | 885 | | | 656 | | | 2.4 | |
| Total | | | 1,252 | | | 1,263 | | | 1,314 | | | 1,346 | | | 1,708 | | | 1,799 | | | 1,960 | | | 2,597 | | | 2,605 | | | 2,325 | | | 7.1 | |
| Real Per Capita Capital Spending (2020 $)5 | | | 1,395 | | | 1,391 | | | 1,421 | | | 1,426 | | | 1,761 | | | 1,813 | | | 1,960 | | | 2,555 | | | 2,512 | | | 2,195 | | | 5.2 | |
| Growth rate (per cent) | | | 1.2 | | | -0.3 | | | 2.2 | | | 0.4 | | | 23.5 | | | 2.9 | | | 8.1 | | | 30.4 | | | -1.7 | | | -12.6 | | | 5.4 | |
| 1 | Includes Transportation Investment Plan capital spending and, beginning in 2017/18, Transportation Investment Corporation rehabilitation costs for the Port Mann Bridge due to reclassification from self-supported commercial Crown corporation to a taxpayer-supported agency in response to the cancellation of tolls. Effective April 1, 2018, Transportation Investment Corporation became a subsidiary of BCTFA. |
| 2 | Includes post-secondary institutions’ self-supported subsidiaries. |
| 3 | Capital spending as a per cent of GDP is calculated using nominal GDP for the calendar year ending in the fiscal year (e.g. 2021/22 amounts divided by nominal GDP for the 2021 calendar year). |
| 4 | Per capita capital spending is calculated using July 1 population (e.g. 2021/22 amounts divided by population on July 1, 2021). |
| 5 | Capital spending is converted to real (inflation-adjusted) terms using the consumer price index (CPI) for the corresponding calendar year (e.g. 2021 CPI for 2021/22 capital spending). |
Budget and Fiscal Plan - 2021/22 to 2023/24
167
Appendix
Table A15 Statement of Financial Position – 2014/15 to 2023/24
| | | | | | | | | | | | | | | Updated | | Budget | | | | | | Average | |
| | | Actual | | Actual | | Actual | | Actual | | Actual | | Actual | | Forecast | | Estimate | | Plan | | Plan | | annual | |
| ($ millions) | | 2014/15 | | 2015/16 | | 2016/17 | | 2017/18 | | 2018/19 | | 2019/20 | | 2020/21 | | 2021/22 | | 2022/23 | | 2023/24 | | change | |
| | | | | | | | | | | | | | | | | | | | | | | (percent) | |
| Financial assets: | | | | | | | | | | | | | | | | | | | | | | | |
| Cash and temporary investments | | | 3,675 | | | 3,892 | | | 4,232 | | | 3,440 | | | 3,029 | | | 3,985 | | | 4,822 | | | 2,306 | | | 2,507 | | | 2,683 | | | -3.4 | |
| Other financial assets | | | 9,115 | | | 9,636 | | | 10,143 | | | 11,650 | | | 12,524 | | | 12,278 | | | 13,492 | | | 13,851 | | | 14,689 | | | 14,837 | | | 5.6 | |
| Sinking funds | | | 977 | | | 1,580 | | | 1,087 | | | 1,348 | | | 752 | | | 692 | | | 494 | | | 522 | | | 538 | | | 527 | | | -6.6 | |
| Investments in commercial Crown corporations: | | | | | | | | | | | | | | | | | | | | | | | | | | | | | | | | | | |
| Retained earnings | | | 8,269 | | | 7,529 | | | 7,509 | | | 6,126 | | | 5,732 | | | 6,515 | | | 9,519 | | | 9,332 | | | 10,017 | | | 11,133 | | | 3.4 | |
| Recoverable capital loans | | | 20,624 | | | 22,041 | | | 23,809 | | | 20,534 | | | 22,547 | | | 24,768 | | | 26,254 | | | 29,005 | | | 32,659 | | | 32,659 | | | 5.2 | |
| Total investments in commercial Crown corporations | | | 28,893 | | | 29,570 | | | 31,318 | | | 26,660 | | | 28,279 | | | 31,283 | | | 35,773 | | | 38,337 | | | 42,676 | | | 43,792 | | | 4.7 | |
| Total financial assets | | | 42,660 | | | 44,678 | | | 46,780 | | | 43,098 | | | 44,584 | | | 48,238 | | | 54,581 | | | 55,016 | | | 60,410 | | | 61,839 | | | 4.2 | |
| Liabilities: | | | | | | | | | | | | | | | | | | | | | | | | | | | | | | | | | | |
| Accounts payable & accrued liabilities | | | 8,443 | | | 8,618 | | | 9,031 | | | 9,751 | | | 10,573 | | | 11,497 | | | 12,227 | | | 12,712 | | | 14,040 | | | 14,683 | | | 6.3 | |
| Deferred revenue | | | 9,835 | | | 9,807 | | | 9,589 | | | 9,992 | | | 10,467 | | | 10,576 | | | 11,186 | | | 12,062 | | | 13,547 | | | 14,940 | | | 4.8 | |
| Debt: | | | | | | | | | | | | | | | | | | | | | | | | | | | | | | | | | | |
| Taxpayer-supported debt | | | 41,880 | | | 42,719 | | | 41,499 | | | 43,607 | | | 42,681 | | | 46,229 | | | 59,962 | | | 71,642 | | | 82,771 | | | 92,732 | | | 9.2 | |
| Self-supported debt | | | 21,040 | | | 22,532 | | | 24,338 | | | 21,312 | | | 23,281 | | | 25,932 | | | 27,524 | | | 30,238 | | | 32,688 | | | 33,882 | | | 5.4 | |
| Forecast allowance | | | - | | | - | | | - | | | - | | | - | | | - | | | - | | | 1,000 | | | 750 | | | 400 | | | n/a | |
| Total provincial debt | | | 62,920 | | | 65,251 | | | 65,837 | | | 64,919 | | | 65,962 | | | 72,161 | | | 87,486 | | | 102,880 | | | 116,209 | | | 127,014 | | | 8.1 | |
| Add: debt offset by sinking funds | | | 977 | | | 1,580 | | | 1,087 | | | 1,348 | | | 752 | | | 692 | | | 494 | | | 522 | | | 538 | | | 527 | | | -6.6 | |
| Less: guarantees and | | | | | | | | | | | | | | | | | | | | | | | | | | | | | | | | | | |
| non-guaranteed debt | | | (739 | ) | | (820 | ) | | (835 | ) | | (896 | ) | | (850 | ) | | (1,337 | ) | | (1,275 | ) | | (1,238 | ) | | (1,228 | ) | | (1,228 | ) | | 5.8 | |
| Financial statement debt | | | 63,158 | | | 66,011 | | | 66,089 | | | 65,371 | | | 65,864 | | | 71,516 | | | 86,705 | | | 102,164 | | | 115,519 | | | 126,313 | | | 8.0 | |
| Total liabilities | | | 81,436 | | | 84,436 | | | 84,709 | | | 85,114 | | | 86,904 | | | 93,589 | | | 110,118 | | | 126,938 | | | 143,106 | | | 155,936 | | | 7.5 | |
| Net liabilities | | | (38,776 | ) | | (39,758 | ) | | (37,929 | ) | | (42,016 | ) | | (42,320 | ) | | (45,351 | ) | | (55,537 | ) | | (71,922 | ) | | (82,696 | ) | | (94,097 | ) | | 10.4 | |
| | | | | | | | | | | | | | | | | | | | | | | | | | | | | | | | | | | |
| Capital and other assets: | | | | | | | | | | | | | | | | | | | | | | | | | | | | | | | | | | |
| Tangible capital assets | | | 39,028 | | | 40,282 | | | 41,303 | | | 45,837 | | | 47,830 | | | 50,025 | | | 53,720 | | | 59,566 | | | 65,729 | | | 71,722 | | | 7.0 | |
| Restricted assets | | | 1,553 | | | 1,631 | | | 1,695 | | | 1,768 | | | 1,834 | | | 1,931 | | | 1,999 | | | 2,063 | | | 2,128 | | | 2,193 | | | 3.9 | |
| Other assets | | | 1,383 | | | 1,155 | | | 1,242 | | | 1,072 | | | 1,114 | | | 1,277 | | | 1,141 | | | 837 | | | (358 | ) | | 829 | | | -5.5 | |
| Total capital and other non-financial assets | | | 41,964 | | | 43,068 | | | 44,240 | | | 48,677 | | | 50,778 | | | 53,233 | | | 56,860 | | | 62,466 | | | 67,499 | | | 74,744 | | | 6.6 | |
| Accumulated surplus (deficit) | | | 3,188 | | | 3,310 | | | 6,311 | | | 6,661 | | | 8,458 | | | 7,882 | | | 1,323 | | | (9,456 | ) | | (15,197 | ) | | (19,353 | ) | | -222.2 | |
| Per cent of nominal GDP: 1 | | | | | | | | | | | | | | | | | | | | | | | | | | | | | | | | | | |
| Net liabilities | | | 15.9 | | | 15.9 | | | 14.4 | | | 14.9 | | | 14.3 | | | 14.7 | | | 18.8 | | | 22.9 | | | 25.0 | | | 27.3 | | | 6.2 | |
| Capital and other assets | | | 17.2 | | | 17.2 | | | 16.8 | | | 17.2 | | | 17.1 | | | 17.2 | | | 19.3 | | | 19.9 | | | 20.4 | | | 21.7 | | | 2.6 | |
| Growth rates (per cent): | | | | | | | | | | | | | | | | | | | | | | | | | | | | | | | | | | |
| Net liabilities | | | -0.3 | | | 2.5 | | | -4.6 | | | 10.8 | | | 0.7 | | | 7.2 | | | 22.5 | | | 29.5 | | | 15.0 | | | 13.8 | | | -255.6 | |
| Capital and other assets | | | 3.2 | | | 2.6 | | | 2.7 | | | 10.0 | | | 4.3 | | | 4.8 | | | 6.8 | | | 9.9 | | | 8.1 | | | 10.7 | | | 14.6 | |
| Per capita: 2 | | | | | | | | | | | | | | | | | | | | | | | | | | | | | | | | | | |
| Net liabilities | | | 8,238 | | | 8,324 | | | 7,806 | | | 8,524 | | | 8,446 | | | 8,908 | | | 10,789 | | | 13,883 | | | 15,765 | | | 17,699 | | | 8.9 | |
| Capital and other assets | | | 8,915 | | | 9,017 | | | 9,104 | | | 9,875 | | | 10,134 | | | 10,456 | | | 11,046 | | | 12,057 | | | 12,868 | | | 14,059 | | | 5.2 | |
| 1 | Net liabilities as a per cent of nominal GDP is calculated using nominal GDP for the calendar year ending in the fiscal year (e.g. 2021/22 amount divided by nominal GDP for the 2021 calendar year). |
| 2 | Per capita net liabilities is calculated using July 1 population (e.g. 2021/22 amount divided by population on July 1, 2021). |
Budget and Fiscal Plan - 2021/22 to 2023/24
168
Appendix
Table A16 Changes in Financial Position – 2014/15 to 2023/24
| | | | | | | | | | | | | | | Updated | | Budget | | | | | | | |
| | | Actual | | Actual | | Actual | | Actual | | Actual | | Actual | | Forecast | | Estimate | | Plan | | Plan | | 10-Year | |
| ($ millions) | | 2014/15 | | 2015/16 | | 2016/17 | | 2017/18 | | 2018/19 | | 2019/20 | | 2020/21 | | 2021/22 | | 2022/23 | | 2023/24 | | Total | |
| | | | | | | | | | | | | | | | | | | | | | | | |
| (Surplus) deficit for the year | | | (1,659 | ) | | (769 | ) | | (2,765 | ) | | (314 | ) | | (1,531 | ) | | 570 | | | 8,144 | | | 9,698 | | | 5,484 | | | 4,323 | | | 21,181 | |
| Comprehensive income (increase) decrease | | | 275 | | | 647 | | | (236 | ) | | (36 | ) | | (266 | ) | | 6 | | | (1,585 | ) | | 1,081 | | | 257 | | | (167 | ) | | (24 | ) |
| Change in accumulated (surplus) deficit | | | (1,384 | ) | | (122 | ) | | (3,001 | ) | | (350 | ) | | (1,797 | ) | | 576 | | | 6,559 | | | 10,779 | | | 5,741 | | | 4,156 | | | 21,157 | |
| Capital and other asset changes: | | | | | | | | | | | | | | | | | | | | | | | | | | | | | | | | | | |
| Taxpayer-supported capital investments | | | 3,407 | | | 3,459 | | | 3,659 | | | 3,908 | | | 4,452 | | | 5,248 | | | 6,277 | | | 8,479 | | | 9,025 | | | 8,872 | | | 56,786 | |
| Less: amortization and other accounting changes | | | (2,157 | ) | | (2,205 | ) | | (2,638 | ) | | 626 | | | (2,459 | ) | | (3,053 | ) | | (2,582 | ) | | (2,633 | ) | | (2,862 | ) | | (2,879 | ) | | (22,842 | ) |
| Increase in net capital assets | | | 1,250 | | | 1,254 | | | 1,021 | | | 4,534 | | | 1,993 | | | 2,195 | | | 3,695 | | | 5,846 | | | 6,163 | | | 5,993 | | | 33,944 | |
| Increase (decrease) in restricted assets | | | 60 | | | 78 | | | 64 | | | 73 | | | 66 | | | 97 | | | 68 | | | 64 | | | 65 | | | 65 | | | 700 | |
| Increase (decrease) in other assets | | | (26 | ) | | (228 | ) | | 87 | | | (170 | ) | | 42 | | | 163 | | | (136 | ) | | (304 | ) | | (1,195 | ) | | 1,187 | | | (580 | ) |
| Change in capital and other assets | | | 1,284 | | | 1,104 | | | 1,172 | | | 4,437 | | | 2,101 | | | 2,455 | | | 3,627 | | | 5,606 | | | 5,033 | | | 7,245 | | | 34,064 | |
| Increase (decrease) in net liabilities | | | (100 | ) | | 982 | | | (1,829 | ) | | 4,087 | | | 304 | | | 3,031 | | | 10,186 | | | 16,385 | | | 10,774 | | | 11,401 | | | 55,221 | |
| | | | | | | | | | | | | | | | | | | | | | | | | | | | | | | | | | | |
| Investment and working capital changes: | | | | | | | | | | | | | | | | | | | | | | | | | | | | | | | | | | |
| Investment in commercial Crown corporations: | | | | | | | | | | | | | | | | | | | | | | | | | | | | | | | | | | |
| Increase (decrease) in retained earnings | | | 415 | | | (740 | ) | | (20 | ) | | (1,383 | ) | | (394 | ) | | 783 | | | 3,004 | | | (187 | ) | | 685 | | | 1,116 | | | 3,279 | |
| Self-supported capital investments | | | 2,488 | | | 2,573 | | | 2,725 | | | 2,729 | | | 4,106 | | | 4,301 | | | 3,812 | | | 4,976 | | | 4,640 | | | 3,489 | | | 35,839 | |
| Less: loan repayments and other accounting changes | | | (1,119 | ) | | (1,156 | ) | | (957 | ) | | (6,004 | ) | | (2,093 | ) | | (2,080 | ) | | (2,326 | ) | | (2,225 | ) | | (986 | ) | | (3,489 | ) | | (22,435 | ) |
| Change in investment | | | 1,784 | | | 677 | | | 1,748 | | | (4,658 | ) | | 1,619 | | | 3,004 | | | 4,490 | | | 2,564 | | | 4,339 | | | 1,116 | | | 16,683 | |
| Increase (decrease) in cash and temporary investments | | | 874 | | | 217 | | | 340 | | | (792 | ) | | (411 | ) | | 956 | | | 837 | | | (2,516 | ) | | 201 | | | 176 | | | (118 | ) |
| Other working capital changes | | | (202 | ) | | 977 | | | (181 | ) | | 645 | | | (1,019 | ) | | (1,339 | ) | | (324 | ) | | (974 | ) | | (1,959 | ) | | (1,899 | ) | | (6,275 | ) |
| Changes in investment and working capital | | | 2,456 | | | 1,871 | | | 1,907 | | | (4,805 | ) | | 189 | | | 2,621 | | | 5,003 | | | (926 | ) | | 2,581 | | | (607 | ) | | 10,290 | |
| | | | | | | | | | | | | | | | | | | | | | | | | | | | | | | | | | | |
| Increase (decrease) in financial statement debt | | | 2,356 | | | 2,853 | | | 78 | | | (718 | ) | | 493 | | | 5,652 | | | 15,189 | | | 15,459 | | | 13,355 | | | 10,794 | | | 65,511 | |
| (Increase) decrease in sinking fund debt | | | (142 | ) | | (603 | ) | | 493 | | | (261 | ) | | 596 | | | 60 | | | 198 | | | (28 | ) | | (16 | ) | | 11 | | | 308 | |
| Increase (decrease) in guarantees | | | (33 | ) | | 6 | | | (23 | ) | | (188 | ) | | (2 | ) | | 57 | | | (168 | ) | | - | | | 1,194 | | | (1,194 | ) | | (351 | ) |
| Increase (decrease) in non-guaranteed debt | | | 46 | | | 75 | | | 38 | | | 249 | | | (44 | ) | | 430 | | | 106 | | | (37 | ) | | (1,204 | ) | | 1,194 | | | 853 | |
| Increase (decrease) in total provincial debt | | | 2,227 | | | 2,331 | | | 586 | | | (918 | ) | | 1,043 | | | 6,199 | | | 15,325 | | | 15,394 | | | 13,329 | | | 10,805 | | | 66,321 | |
| | | | | | | | | | | | | | | | | | | | | | | | | | | | | | | | | | | |
| Represented by increase (decrease) in: | | | | | | | | | | | | | | | | | | | | | | | | | | | | | | | | | | |
| Taxpayer-supported debt | | | 812 | | | 839 | | | (1,220 | ) | | 2,108 | | | (926 | ) | | 3,548 | | | 13,733 | | | 11,680 | | | 11,129 | | | 9,961 | | | 51,664 | |
| Self-supported debt | | | 1,415 | | | 1,492 | | | 1,806 | | | (3,026 | ) | | 1,969 | | | 2,651 | | | 1,592 | | | 2,714 | | | 2,450 | | | 1,194 | | | 14,257 | |
| Forecast allowance | | | - | | | - | | | - | | | - | | | - | | | - | | | - | | | 1,000 | | | (250 | ) | | (350 | ) | | 400 | |
| Total provincial debt | | | 2,227 | | | 2,331 | | | 586 | | | (918 | ) | | 1,043 | | | 6,199 | | | 15,325 | | | 15,394 | | | 13,329 | | | 10,805 | | | 66,321 | |
Budget and Fiscal Plan - 2021/22 to 2023/24
169
Appendix
Table A17 Provincial Debt – 2014/15 to 2023/24
| | | | | | | | | | | | | | | Updated | | Budget | | | | | | Average | |
| | | Actual | | Actual | | Actual | | Actual | | Actual | | Actual | | Forecast | | Estimate | | Plan | | Plan | | annual | |
| ($ millions) | | 2014/15 | | 2015/16 | | 2016/17 | | 2017/18 | | 2018/19 | | 2019/20 | | 2020/21 | | 2021/22 | | 2022/23 | | 2023/24 | | change | |
| | | | | | | | | | | | | | | | | | | | | | | (percent) | |
| Taxpayer-supported debt: | | | | | | | | | | | | | | | | | | | | | | | | | | | | | | | | | | |
| Provincial government | | | | | | | | | | | | | | | | | | | | | | | | | | | | | | | | | | |
| Operating | | | 9,280 | | | 8,034 | | | 4,644 | | | 1,156 | | | - | | | - | | | 8,799 | | | 14,939 | | | 19,483 | | | 22,912 | | | 10.6 | |
| Capital 2 | | | | | | | | | | | | | | | | | | | | | | | | | | | | | | | | | | |
| K-12 education | | | 7,572 | | | 8,012 | | | 8,454 | | | 8,891 | | | 8,885 | | | 9,757 | | | 10,611 | | | 11,455 | | | 12,358 | | | 13,439 | | | 6.6 | |
| Post-secondary institutions | | | 3,860 | | | 4,063 | | | 4,285 | | | 4,584 | | | 4,607 | | | 4,917 | | | 5,210 | | | 5,626 | | | 6,209 | | | 6,835 | | | 6.6 | |
| Health facilities | | | 5,105 | | | 5,416 | | | 5,835 | | | 6,141 | | | 6,173 | | | 6,705 | | | 7,510 | | | 8,654 | | | 10,215 | | | 12,378 | | | 10.3 | |
| Ministries general capital | | | 1,698 | | | 1,987 | | | 2,288 | | | 2,718 | | | 2,363 | | | 3,133 | | | 3,702 | | | 4,241 | | | 4,698 | | | 5,096 | | | 13.0 | |
| Transportation | | | 2,174 | | | 2,174 | | | 2,174 | | | 5,682 | | | 5,401 | | | 5,401 | | | 5,401 | | | 5,403 | | | 5,405 | | | 5,406 | | | 10.7 | |
| Social housing | | | 413 | | | 428 | | | 449 | | | 619 | | | 619 | | | 805 | | | 1,131 | | | 1,444 | | | 1,788 | | | 2,028 | | | 19.3 | |
| Other | | | 242 | | | 242 | | | 242 | | | 242 | | | 242 | | | 252 | | | 258 | | | 357 | | | 472 | | | 558 | | | 9.7 | |
| Total capital | | | 21,064 | | | 22,322 | | | 23,727 | | | 28,877 | | | 28,290 | | | 30,970 | | | 33,823 | | | 37,180 | | | 41,145 | | | 45,740 | | | 9.0 | |
| Total provincial government | | | 30,344 | | | 30,356 | | | 28,371 | | | 30,033 | | | 28,290 | | | 30,970 | | | 42,622 | | | 52,119 | | | 60,628 | | | 68,652 | | | 9.5 | |
| | | | | | | | | | | | | | | | | | | | | | | | | | | | | | | | | | | |
| Taxpayer-supported entities: | | | | | | | | | | | | | | | | | | | | | | | | | | | | | | | | | | |
| BC Pavilion Corporation | | | 148 | | | 156 | | | 143 | | | 141 | | | 138 | | | 135 | | | 132 | | | 129 | | | 126 | | | 123 | | | -2.0 | |
| BC Transit | | | 123 | | | 106 | | | 94 | | | 84 | | | 73 | | | 65 | | | 61 | | | 86 | | | 119 | | | 167 | | | 3.5 | |
| BC Transportation Financing Authority | | | 8,428 | | | 9,177 | | | 9,974 | | | 10,388 | | | 11,293 | | | 12,193 | | | 13,441 | | | 15,538 | | | 17,779 | | | 19,962 | | | 10.1 | |
| Health Authorities and Hospital Societies | | | 1,417 | | | 1,582 | | | 1,717 | | | 1,762 | | | 1,795 | | | 1,802 | | | 1,845 | | | 1,841 | | | 1,800 | | | 1,755 | | | 2.4 | |
| InBC Investment Corp | | | 414 | | | 304 | | | 217 | | | 161 | | | 70 | | | 45 | | | 37 | | | 40 | | | 47 | | | 53 | | | -20.4 | |
| Post-secondary institutions | | | 658 | | | 668 | | | 699 | | | 744 | | | 763 | | | 753 | | | 837 | | | 858 | | | 875 | | | 886 | | | 3.4 | |
| School districts | | | 28 | | | 21 | | | 19 | | | 17 | | | 19 | | | 18 | | | 17 | | | 15 | | | 13 | | | 12 | | | -9.0 | |
| Social housing | | | 302 | | | 332 | | | 246 | | | 259 | | | 225 | | | 222 | | | 932 | | | 990 | | | 1,362 | | | 1,098 | | | 15.4 | |
| Other | | | 18 | | | 17 | | | 19 | | | 18 | | | 15 | | | 26 | | | 38 | | | 26 | | | 22 | | | 24 | | | 3.2 | |
| Total taxpayer-supported entities | | | 11,536 | | | 12,363 | | | 13,128 | | | 13,574 | | | 14,391 | | | 15,259 | | | 17,340 | | | 19,523 | | | 22,143 | | | 24,080 | | | 8.5 | |
| Total taxpayer-supported debt | | | 41,880 | | | 42,719 | | | 41,499 | | | 43,607 | | | 42,681 | | | 46,229 | | | 59,962 | | | 71,642 | | | 82,771 | | | 92,732 | | | 9.2 | |
| Self-supported debt: | | | | | | | | | | | | | | | | | | | | | | | | | | | | | | | | | | |
| Commercial Crown corporations and agencies | | | | | | | | | | | | | | | | | | | | | | | | | | | | | | | | | | |
| BC Hydro | | | 16,544 | | | 17,929 | | | 19,685 | | | 19,990 | | | 22,064 | | | 23,238 | | | 24,818 | | | 27,619 | | | 30,099 | | | 31,338 | | | 7.4 | |
| BC Lottery Corporation | | | 140 | | | 150 | | | 145 | | | 155 | | | 100 | | | 233 | | | 272 | | | 200 | | | 187 | | | 151 | | | 0.8 | |
| Columbia Basin power projects | | | 464 | | | 459 | | | 448 | | | 433 | | | 418 | | | 1,387 | | | 1,349 | | | 1,325 | | | 1,300 | | | 1,273 | | | 11.9 | |
| Columbia Power Corporation | | | 300 | | | 296 | | | 291 | | | 286 | | | 282 | | | 276 | | | 270 | | | 264 | | | 257 | | | 250 | | | -2.0 | |
| Liquor Distribution Branch | | | - | | | - | | | - | | | - | | | - | | | 210 | | | 218 | | | 228 | | | 239 | | | 254 | | | n/a | |
| Post-secondary institution subsidiaries | | | 222 | | | 310 | | | 340 | | | 418 | | | 387 | | | 504 | | | 498 | | | 497 | | | 497 | | | 498 | | | 9.4 | |
| Transportation Investment Corporation 1 | | | 3,335 | | | 3,355 | | | 3,398 | | | - | | | - | | | - | | | - | | | - | | | - | | | - | | | n/a | |
| Other | | | 35 | | | 33 | | | 31 | | | 30 | | | 30 | | | 84 | | | 99 | | | 105 | | | 109 | | | 118 | | | 14.5 | |
| Total self-supported debt | | | 21,040 | | | 22,532 | | | 24,338 | | | 21,312 | | | 23,281 | | | 25,932 | | | 27,524 | | | 30,238 | | | 32,688 | | | 33,882 | | | 5.4 | |
| Forecast allowance | | | - | | | - | | | - | | | - | | | - | | | - | | | - | | | 1,000 | | | 750 | | | 400 | | | n/a | |
| Total provincial debt | | | 62,920 | | | 65,251 | | | 65,837 | | | 64,919 | | | 65,962 | | | 72,161 | | | 87,486 | | | 102,880 | | | 116,209 | | | 127,014 | | | 8.1 | |
| 1 | Beginning in 2017/18, debt related to the Port Mann Bridge was reclassified as taxpayer-supported due to the elimination of tolls effective September 1, 2017. |
| 2 | Includes debt incurred by the government to fund the building and construction of capital assets in the education, health, social housing and other sectors. |
Budget and Fiscal Plan - 2021/22 to 2023/24
170
Appendix
Table A18 Provincial Debt Supplementary Information – 2014/15 to 2023/24 1
| | | | | | | | | | | | | | | Updated | | Budget | | | | | | Average | |
| | | Actual | | Actual | | Actual | | Actual | | Actual | | Actual | | Forecast | | Estimate | | Plan | | Plan | | annual | |
| ($ millions) | | 2014/15 | | 2015/16 | | 2016/17 | | 2017/18 | | 2018/19 | | 2019/20 | | 2020/21 | | 2021/22 | | 2022/23 | | 2023/24 | | change | |
| | | | | | | | | | | | | | | | | | | | | | | (percent) | |
| Per cent of nominal GDP: 2 | | | | | | | | | | | | | | | | | | | | | | | | | | | | | | | | | | |
| Taxpayer-supported debt: | | | | | | | | | | | | | | | | | | | | | | | | | | | | | | | | | | |
| Provincial government direct operating | | | 3.8 | | | 3.2 | | | 1.8 | | | 0.4 | | | - | | | - | | | 3.0 | | | 4.8 | | | 5.9 | | | 6.7 | | | 6.4 | |
| Provincial government capital | | | 8.6 | | | 8.9 | | | 9.0 | | | 10.2 | | | 9.6 | | | 10.0 | | | 11.5 | | | 11.8 | | | 12.4 | | | 13.3 | | | 4.9 | |
| Total provincial government | | | 12.4 | | | 12.1 | | | 10.8 | | | 10.6 | | | 9.6 | | | 10.0 | | | 14.4 | | | 16.6 | | | 18.3 | | | 19.9 | | | 5.4 | |
| Taxpayer-supported entities | | | 4.7 | | | 4.9 | | | 5.0 | | | 4.8 | | | 4.9 | | | 4.9 | | | 5.9 | | | 6.2 | | | 6.7 | | | 7.0 | | | 4.4 | |
| Total taxpayer-supported debt | | | 17.2 | | | 17.0 | | | 15.7 | | | 15.4 | | | 14.4 | | | 15.0 | | | 20.3 | | | 22.8 | | | 25.0 | | | 26.9 | | | 5.1 | |
| Self-supported debt: | | | | | | | | | | | | | | | | | | | | | | | | | | | | | | | | | | |
| Commercial Crown corporations & agencies | | | 8.6 | | | 9.0 | | | 9.2 | | | 7.6 | | | 7.9 | | | 8.4 | | | 9.3 | | | 9.6 | | | 9.9 | | | 9.8 | | | 1.5 | |
| Total provincial debt | | | 25.8 | | | 26.0 | | | 24.9 | | | 23.0 | | | 22.3 | | | 23.3 | | | 29.6 | | | 32.7 | | | 35.1 | | | 36.9 | | | 4.1 | |
| Growth rates (per cent): | | | | | | | | | | | | | | | | | | | | | | | | | | | | | | | | | | |
| Taxpayer-supported debt: | | | | | | | | | | | | | | | | | | | | | | | | | | | | | | | | | | |
| Provincial government direct operating | | | -9.2 | | | -13.4 | | | -42.2 | | | -75.1 | | | -100.0 | | | - | | | - | | | 69.8 | | | 30.4 | | | 17.6 | | | -12.2 | |
| Provincial government capital | | | 136.7 | | | 6.0 | | | 6.3 | | | 21.7 | | | -2.0 | | | 9.5 | | | 9.2 | | | 9.9 | | | 10.7 | | | 11.2 | | | 21.9 | |
| Taxpayer-supported entities | | | 5.0 | | | 7.2 | | | 6.2 | | | 3.4 | | | 6.0 | | | 6.0 | | | 13.6 | | | 12.6 | | | 13.4 | | | 8.7 | | | 8.2 | |
| Total taxpayer-supported debt | | | 39.1 | | | 2.0 | | | -2.9 | | | 5.1 | | | -2.1 | | | 8.3 | | | 29.7 | | | 19.5 | | | 15.5 | | | 12.0 | | | 12.6 | |
| Self-supported debt: | | | | | | | | | | | | | | | | | | | | �� | | | | | | | | | | | | | | |
| Commercial Crown corporations & agencies | | | 7.2 | | | 7.1 | | | 8.0 | | | -12.4 | | | 9.2 | | | 11.4 | | | 6.1 | | | 9.9 | | | 8.1 | | | 3.7 | | | 5.8 | |
| Total provincial debt | | | 26.5 | | | 3.7 | | | 0.9 | | | -1.4 | | | 1.6 | | | 9.4 | | | 21.2 | | | 17.6 | | | 13.0 | | | 9.3 | | | 10.2 | |
| Per capita: 3 | | | | | | | | | | | | | | | | | | | | | | | | | | | | | | | | | | |
| Taxpayer-supported debt: | | | | | | | | | | | | | | | | | | | | | | | | | | | | | | | | | | |
| Provincial government direct operating | | | 1,971 | | | 1,682 | | | 956 | | | 235 | | | - | | | - | | | 1,709 | | | 2,884 | | | 3,714 | | | 4,310 | | | 9.1 | |
| Provincial government capital | | | 4,475 | | | 4,673 | | | 4,883 | | | 5,858 | | | 5,646 | | | 6,083 | | | 6,570 | | | 7,177 | | | 7,844 | | | 8,604 | | | 7.5 | |
| Taxpayer-supported entities | | | 2,451 | | | 2,588 | | | 2,702 | | | 2,754 | | | 2,872 | | | 2,997 | | | 3,368 | | | 3,768 | | | 4,221 | | | 4,529 | | | 7.1 | |
| Total taxpayer-supported debt | | | 8,897 | | | 8,944 | | | 8,540 | | | 8,846 | | | 8,518 | | | 9,081 | | | 11,648 | | | 13,829 | | | 15,779 | | | 17,443 | | | 7.8 | |
| Self-supported debt: | | | | | | | | | | | | | | | | | | | | | | | | | | | | | | | | | | |
| Commercial Crown corporations & agencies | | | 4,470 | | | 4,717 | | | 5,009 | | | 4,323 | | | 4,646 | | | 5,094 | | | 5,347 | | | 5,837 | | | 6,232 | | | 6,373 | | | 4.0 | |
| Total provincial debt | | | 13,367 | | | 13,661 | | | 13,549 | | | 13,170 | | | 13,165 | | | 14,174 | | | 16,995 | | | 19,858 | | | 22,154 | | | 23,891 | | | 6.7 | |
| Real Per Capita Provincial Debt (2020 $)4 | | | 14,885 | | | 15,048 | | | 14,656 | | | 13,949 | | | 13,575 | | | 14,282 | | | 16,995 | | | 19,535 | | | 21,359 | | | 22,554 | | | 4.7 | |
| Growth rate (per cent) | | | 23.2 | | | 1.1 | | | -2.6 | | | -4.8 | | | -2.7 | | | 5.2 | | | 19.0 | | | 14.9 | | | 9.3 | | | 5.6 | | | 6.8 | |
| 1 | Numbers may not add due to rounding. |
| 2 | Debt as a per cent of GDP is calculated using nominal GDP for the calendar year ending in the fiscal year (e.g. 2021/22 debt divided by nominal GDP for the 2021 calendar year). |
| 3 | Per capita debt is calculated using July 1 population (e.g. 2021/22 debt divided by population on July 1, 2021). |
| 4 | Debt is converted to real (inflation-adjusted) terms using the consumer price index (CPI) for the corresponding calendar year (e.g. 2021 CPI for 2021/22 debt). |
Budget and Fiscal Plan - 2021/22 to 2023/24
171
Appendix
Table A19 Key Provincial Debt Indicators – 2014/15 to 2023/24
| | | | | | | | | | | | | | | Updated | | Budget | | | | | | Average | |
| | | Actual | | Actual | | Actual | | Actual | | Actual | | Actual | | Forecast | | Estimate | | Plan | | Plan | | annual | |
| | | 2014/15 | | 2015/16 | | 2016/17 | | 2017/18 | | 2018/19 | | 2019/20 | | 2020/21 | | 2021/22 | | 2022/23 | | 2023/24 | | change | |
| | | | | | | | | | | | | | | | | | | | | | | (percent) | |
| Debt to revenue (per cent) | | | | | | | | | | | | | | | | | | | | | | | | | | | | | | | | | | |
| Total provincial | | | 106.6 | | | 105.9 | | | 99.3 | | | 94.7 | | | 89.5 | | | 95.9 | | | 114.8 | | | 139.5 | | | 148.2 | | | 157.2 | | | 4.4 | |
| Taxpayer-supported | | | 94.1 | | | 91.3 | | | 81.8 | | | 82.5 | | | 75.0 | | | 80.6 | | | 102.6 | | | 125.9 | | | 135.4 | | | 147.5 | | | 5.1 | |
| Debt per capita ($) 1 | | | | | | | | | | | | | | | | | | | | | | | | | | | | | | | | | | |
| Total provincial | | | 13,367 | | | 13,661 | | | 13,549 | | | 13,170 | | | 13,165 | | | 14,174 | | | 16,995 | | | 19,858 | | | 22,154 | | | 23,891 | | | 6.7 | |
| Taxpayer-supported | | | 8,897 | | | 8,944 | | | 8,540 | | | 8,846 | | | 8,518 | | | 9,081 | | | 11,648 | | | 13,829 | | | 15,779 | | | 17,443 | | | 7.8 | |
| Debt to nominal GDP (per cent) 2 | | | | | | | | | | | | | | | | | | | | | | | | | | | | | | | | | | |
| Total provincial | | | 25.8 | | | 26.0 | | | 24.9 | | | 23.0 | | | 22.3 | | | 23.3 | | | 29.6 | | | 32.7 | | | 35.1 | | | 36.9 | | | 4.1 | |
| Taxpayer-supported | | | 17.2 | | | 17.0 | | | 15.7 | | | 15.4 | | | 14.4 | | | 15.0 | | | 20.3 | | | 22.8 | | | 25.0 | | | 26.9 | | | 5.1 | |
| Interest bite (cents per dollar of revenue) 3 | | | | | | | | | | | | | | | | | | | | | | | | | | | | | | | | | | |
| Total provincial | | | 4.3 | | | 4.7 | | | 3.8 | | | 4.0 | | | 3.8 | | | 3.8 | | | 3.6 | | | 3.9 | | | 4.0 | | | 4.2 | | | -0.1 | |
| Taxpayer-supported | | | 3.7 | | | 4.1 | | | 3.2 | | | 3.3 | | | 3.2 | | | 3.1 | | | 3.1 | | | 3.4 | | | 3.4 | | | 3.6 | | | -0.4 | |
| Interest costs ($ millions) | | | | | | | | | | | | | | | | | | | | | | | | | | | | | | | | | | |
| Total provincial | | | 2,525 | | | 2,919 | | | 2,521 | | | 2,759 | | | 2,786 | | | 2,872 | | | 2,777 | | | 2,908 | | | 3,138 | | | 3,412 | | | 3.4 | |
| Taxpayer-supported | | | 1,651 | | | 1,932 | | | 1,644 | | | 1,725 | | | 1,793 | | | 1,807 | | | 1,814 | | | 1,930 | | | 2,055 | | | 2,247 | | | 3.5 | |
| Interest rate (per cent) 4 | | | | | | | | | | | | | | | | | | | | | | | | | | | | | | | | | | |
| Taxpayer-supported | | | 4.0 | | | 4.6 | | | 3.9 | | | 4.1 | | | 4.2 | | | 4.1 | | | 3.4 | | | 2.9 | | | 2.7 | | | 2.6 | | | -4.8 | |
| Background Information: | | | | | | | | | | | | | | | | | | | | | | | | | | | | | | | | | | |
| Revenue ($ millions) | | | | | | | | | | | | | | | | | | | | | | | | | | | | | | | | | | |
| Total provincial 5 | | | 59,018 | | | 61,589 | | | 66,334 | | | 68,551 | | | 73,734 | | | 75,283 | | | 76,197 | | | 73,770 | | | 78,408 | | | 80,774 | | | 3.5 | |
| Taxpayer-supported 6 | | | 44,514 | | | 46,805 | | | 50,726 | | | 52,866 | | | 56,881 | | | 57,386 | | | 58,453 | | | 56,899 | | | 61,153 | | | 62,889 | | | 3.9 | |
| Debt ($ millions) | | | | | | | | | | | | | | | | | | | | | | | | | | | | | | | | | | |
| Total provincial | | | 62,920 | | | 65,251 | | | 65,837 | | | 64,919 | | | 65,962 | | | 72,161 | | | 87,486 | | | 102,880 | | | 116,209 | | | 127,014 | | | 8.1 | |
| Taxpayer-supported 7 | | | 41,880 | | | 42,719 | | | 41,499 | | | 43,607 | | | 42,681 | | | 46,229 | | | 59,962 | | | 71,642 | | | 82,771 | | | 92,732 | | | 9.2 | |
| Provincial nominal GDP ($ millions) 8 | | | 243,872 | | | 250,784 | | | 263,912 | | | 282,283 | | | 296,135 | | | 309,059 | | | 295,282 | | | 314,268 | | | 331,168 | | | 344,251 | | | 3.9 | |
| Population (thousands at July 1) 9 | | | 4,707 | | | 4,776 | | | 4,859 | | | 4,929 | | | 5,010 | | | 5,091 | | | 5,148 | | | 5,181 | | | 5,246 | | | 5,316 | | | 1.4 | |
| 1 | The ratio of debt to population (e.g. 2021/22 debt divided by population at July 1, 2021). |
| 2 | The ratio of debt outstanding at fiscal year end to provincial nominal gross domestic product (GDP) for the calendar year ending in the fiscal year (e.g. 2021/22 debt divided by 2021 nominal GDP). |
| 3 | The ratio of interest costs (less sinking fund interest) to revenue. Figures include capitalized interest expense in order to provide a more comparable measure to outstanding debt. |
| 4 | Weighted average of all outstanding debt issues. |
| 5 | Includes revenue of the consolidated revenue fund (excluding dividends from enterprises) plus revenue of all government organizations and enterprises. |
| 6 | Excludes revenue of government enterprises, but includes dividends from enterprises paid to the consolidated revenue fund. |
| 7 | Excludes debt of commercial Crown corporations and agencies and funds held under the province’s warehouse borrowing |
| 8 | Nominal GDP for the calendar year ending in the fiscal year (e.g. nominal GDP for 2021 is used for the fiscal year ended March 31, 2022). |
| 9 | Population at July 1st within the fiscal year (e.g. population at July 1, 2021 is used for the fiscal year ended March 31, 2022). |
Budget and Fiscal Plan - 2021/22 to 2023/24
172