Exhibit 99.12


2021
British Columbia
Financial and Economic
Review
81st Edition
(July 2021)

Table of Contents
2021 Financial and Economic Review – July 2021
Table of Contents
| Part 1 — Economic Review | 1 |
| | 2020 Overview | 3 |
| | British Columbia Economy | 4 |
| | | External Trade and Commodity Prices | 5 |
| | | Population | 8 |
| | | Labour Market | 8 |
| | | Inflation and Wages | 9 |
| | | Consumer Spending and Housing | 10 |
| | | Tourism | 11 |
| | Global Economy | 12 |
| | | United States | 12 |
| | | Canada | 13 |
| | | Asia | 14 |
| | | Europe | 14 |
| | | Financial Markets | 14 |
| | | | |
| | Charts | | |
| | | 1.1 | Provincial Economic Growth | 3 |
| | | 1.2 | British Columbia Real GDP Growth by Industry | 4 |
| | | 1.3 | Composition of British Columbia GDP by Industry | 5 |
| | | 1.4 | International Export Shares by Market | 6 |
| | | 1.5 | Lumber and Natural Gas Prices | 7 |
| | | 1.6 | Housing Starts | 10 |
| | | 1.7 | Home Sales and Price | 11 |
| | | 1.8 | Visitor Entries to British Columbia | 11 |
| | | 1.9 | Global Economic Growth | 12 |
| | | 1.10 | Canadian Dollar | 15 |
| | | | | |
| | Map | | |
| | | 1.1 | Net Interprovincial and International Migration in B.C., 2020 | 8 |
| | | | | |
| | Tables | | |
| | | 1.1 | British Columbia Population and Labour Market Statistics | 9 |
| | | 1.2 | British Columbia Price and Earnings Indicators | 9 |
| | | | | |
| | Topic Box | | |
| | | Historical Data Volatility | 16 |
| | | | |
| Part 2 — Financial Review | 19 |
| | 2020/21 Overview | 20 |
| | Revenue | 21 |
| | Expense | 31 |
| | Provincial Capital Spending | 35 |
| | Provincial Debt | 42 |
| | Pension Plans | 46 |
| | Contractual Rights | 47 |
| | Contractual Obligations | 48 |
| | Subsequent Events | 49 |
| | 2020/21 Public Accounts Audit Qualification | 49 |
| | 2021 Financial and Economic Review – July 2021 | i |
| | | |
Table of Contents
| Charts | |
| | 2.1 | 2020/21 Surplus (Deficit) – Major Changes from Budget 2020 | 21 |
| | 2.2 | Revenue Changes from Budget 2020 | 21 |
| | 2.3 | Expense Changes from Budget 2020 | 31 |
| | 2.4 | Components of Total Capital Spending – 2020/21 | 35 |
| | 2.5 | Capital Spending Changes from Budget 2020 | 37 |
| | 2.6 | Financing Taxpayer-Supported Capital Spending | 38 |
| | 2.7 | Components of Total Provincial Debt – 2020/21 | 43 |
| | 2.8 | Changes in Ending Debt Level from Budget 2020 | 43 |
| | 2.9 | Reconciliation of Surplus/Deficit to Change in Debt | 44 |
| | | | |
| Tables | |
| | 2.1 | 2020/21 Fiscal Summary | 20 |
| | 2.2.1 | Personal Income Tax Revenue Changes from Budget 2020 | 22 |
| | 2.2.2 | Corporate Income Tax Revenue Changes from Budget 2020 | 22 |
| | 2.2.3 | Consumption and Other Tax Revenue Changes from Budget 2020 | 23 |
| | 2.2.4 | Property Tax Revenue Changes from Budget 2020 | 23 |
| | 2.2.5 | Energy and Mineral Revenue Changes from Budget 2020 | 24 |
| | 2.2.6 | Forest Revenue Changes from Budget 2020 | 25 |
| | 2.2.7 | Other Revenue Changes from Budget 2020 | 25 |
| | 2.2.8 | Federal Government Transfer Changes from Budget 2020 | 26 |
| | 2.3 | Revenue by Source | 28 |
| | 2.4 | Expense by Ministry, Program and Agency | 29 |
| | 2.5.1 | 2020/21 Operating Results by Quarter | 30 |
| | 2.5.2 | 2020/21 Pandemic and Recovery Contingencies (Vote 52) | 32 |
| | 2.6 | Capital Spending | 36 |
| | 2.7 | Capital Expenditure Projects Greater Than $50 Million | 39 |
| | 2.8 | Provincial Debt Summary | 42 |
| | 2.9 | Key Debt Indicators | 45 |
| | 2.10 | Interprovincial Comparison of Credit Ratings, July 2021 | 46 |
| | 2.11 | Pension Plan Balances | 47 |
| | 2.12 | Taxpayer-Supported Contractual Obligations | 48 |
| | | | |
| Part 3 — Supplementary Information | 51 |
| General Description of the Province | 53 |
| Constitutional Framework | 54 |
| Provincial Government | 55 |
| Annual Financial Cycle | 57 |
| Government’s Financial Statements | 59 |
| | | | |
| Charts | |
| | 3.1 | Financial Planning and Reporting Cycle Overview | 58 |
| | | | |
| Tables | |
| | 3.1 | Provincial Taxes (as of July 2021) | 61 |
| | 3.2 | Interprovincial Comparisons of Tax Rates – 2021 | 67 |
| ii | 2021 Financial and Economic Review – July 2021 | |
| | | |
Table of Contents
| Appendix 1 — Economic Review Supplementary Tables | 69 |
| | | | |
| Tables | | |
| | A1.1A | Aggregate and Labour Market Indicators | 70 |
| | A1.1B | Prices, Earnings and Financial Indicators | 72 |
| | A1.1C | Other Indicators | 74 |
| | A1.1D | Commodity Production Indicators | 76 |
| | A1.2 | British Columbia Real GDP at Market Prices, Expenditure Based | 78 |
| | A1.3 | British Columbia GDP at Basic Prices, by Industry | 80 |
| | A1.4 | British Columbia GDP, Income Based | 82 |
| | A1.5 | Employment by Industry in British Columbia | 84 |
| | A1.6 | Capital Investment by Industry | 85 |
| | A1.7 | British Columbia International Goods Exports by Major Market and Selected Commodities, 2020 | 86 |
| | A1.8 | British Columbia International Goods Exports by Market Area | 87 |
| | A1.9 | Historical Commodity Prices (in US Dollars) | 88 |
| | A1.10 | British Columbia Forest Sector Economic Activity Indicators | 89 |
| | A1.11 | Historical Value of Mineral, Petroleum and Natural Gas Shipments | 90 |
| | A1.12 | Petroleum and Natural Gas Activity Indicators | 91 |
| | A1.13 | Supply and Consumption of Electrical Energy in British Columbia | 92 |
| | A1.14 | Components of British Columbia Population Change | 93 |
| | | | |
| Appendix 2 — Financial Review Supplementary Tables | 95 |
| | | | |
| Tables | | |
| | A2.1 | Operating Statement – 2009/10 to 2020/21 | 97 |
| | A2.2 | Statement of Financial Position – 2009/10 to 2020/21 | 98 |
| | A2.3 | Changes in Financial Position – 2009/10 to 2020/21 | 99 |
| | A2.4 | Revenue by Source – 2009/10 to 2020/21 | 100 |
| | A2.5 | Revenue by Source Supplementary Information – 2009/10 to 2020/21 | 101 |
| | A2.6 | Expense by Function – 2009/10 to 2020/21 | 102 |
| | A2.7 | Expense by Function Supplementary Information – 2009/10 to 2020/21 | 103 |
| | A2.8 | Full-Time Equivalents (FTEs) – 2009/10 to 2020/21 | 104 |
| | A2.9 | Capital Spending – 2009/10 to 2020/21 | 105 |
| | A2.10 | Provincial Debt – 2009/10 to 2020/21 | 106 |
| | A2.11 | Provincial Debt Supplementary Information – 2009/10 to 2020/21 | 107 |
| | A2.12 | Key Provincial Debt Indicators – 2009/10 to 2020/21 | 108 |
| | A2.13 | Historical Operating Statement Surplus (Deficit) | 109 |
| | A2.14 | Historical Provincial Debt Summary | 110 |
| | | | | | |
| | 2021 Financial and Economic Review – July 2021 | iii |
| | | |
| 1 | Reflects information available as of July 2, 2021. |
| | 2021 Financial and Economic Review – July 2021 | |
| | | |
Part 1 – Economic Review
2020 Overview
British Columbia’s economy declined in 2020, as the negative impacts from the COVID-19 pandemic pushed economies all over the world into deep recessions.
Similar to previous years, Statistics Canada published only real dollar GDP by industry at basic prices in the preliminary release of its 2020 Provincial Economic Accounts in May 2021. As a result, the following analysis refers to these real GDP figures, as opposed to the commonly reported income and expenditure market prices data released late in the year.2
In 2020, B.C.’s real GDP contraction of 3.8 per cent was the fourth smallest among provinces (behind Prince Edward Island, Nova Scotia, and New Brunswick), following growth of 2.5 per cent in 2019.
Chart 1.1 Provincial Economic Growth
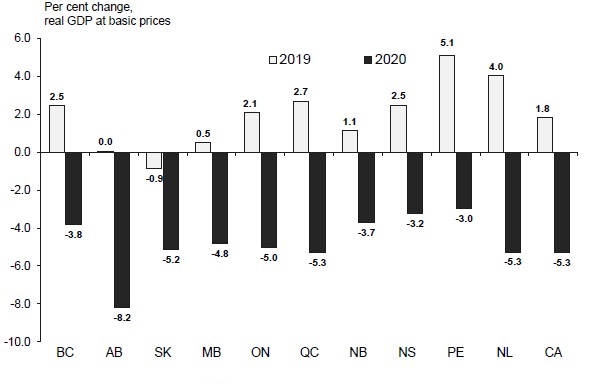
Sources: Statistics Canada (Tables 36-10-0402-01 and 36-10-0434-03 – May 2021 Preliminary Industry Accounts)
The decline in B.C.’s real GDP was almost entirely driven by service-producing industries such as arts, entertainment and recreation, accommodation and food services and transportation and warehousing. Goods-producing industries experienced modest declines with decreases in manufacturing and natural resources partially offset by increases in the construction sector.
Employment in B.C. decreased by 6.6 per cent in 2020. However, wages and salaries remained relatively stable compared to 2019 as low-wage workers accounted for the majority of job losses. Consumer spending on services likely declined sharply during the pandemic, while retail sales experienced modest growth of 1.3 per cent in 2020 with mixed results across retailers. While retail trade data offers a clear indication of consumer spending on goods, data on provincial consumer spending on services for 2020 will not be released until late 2021. Meanwhile, consumer prices increased by 0.8 per cent in 2020. Residential construction activity slowed but remained relatively strong, with housing starts declining in 2020 after recording all-time highs in 2019. In contrast, after declining for three consecutive years home sales reached record levels in late 2020 and at the same time the average home sales price had double-digit increases.
| 2 | Provincial and national real GDP by industry estimates are based on Statistics Canada’s preliminary industry accounts, released in May 2021. Further information on British Columbia’s economic performance is expected to be available in November 2021, when Statistics Canada releases revised GDP by industry data for 2020 and previous years, together with the full income and expenditure accounts for 2020. |
| | 2021 Financial and Economic Review – July 2021 | 3 |
| | | |
Part 1 – Economic Review
On the external front, global international trade experienced significant disruptions as the pandemic unfolded. B.C.’s international merchandise exports contracted in 2020 reflecting a combination of weaker global demand and lower commodity prices.
British Columbia Economy
B.C.’s real GDP declined by 3.8 per cent in 2020 following growth of 2.5 per cent in 2019. The decline in 2020 was almost entirely driven by service-producing industries, while goods-producing industries declined modestly.
Service-producing industries declined by 4.9 per cent in 2020. Output in the arts, entertainment and recreation (-39.6 per cent), accommodation and food services (-31.1 per cent), transportation and warehousing (-21.6 per cent), and in the health care and social assistance sector (-8.0 per cent) were the main drivers of the decrease. Output in the real estate and rental and leasing sector and the finance and insurance sector increased by 4.1 per cent and 2.5 per cent, respectively, in 2020.
B.C.’s goods-producing industries declined by 0.3 per cent in 2020, following 2.2 per cent growth in 2019. A notable decrease in the manufacturing sector (-7.1 per cent) was largely offset by a 4.2 per cent increase in the construction sector. The gain in construction was driven by large gains in the engineering construction subsector (+18.8 per cent), mainly related to activity in the oil and gas industry. Output in the residential and non-residential building construction subsectors declined by 1.9 per cent and 2.7 per cent, respectively, in 2020. Meanwhile, smaller changes were observed in the agriculture, forestry, fishing and hunting (-2.7 per cent), utilities (+2.7 per cent) and mining, quarrying, and oil and gas extraction (+0.6 per cent) sectors.
Chart 1.2 British Columbia Real GDP Growth by Industry
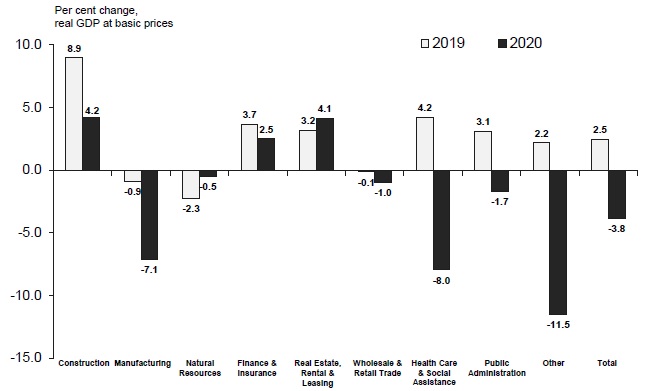
Source: Statistics Canada (Table 36-10-0402-01 – May 2021 Preliminary Industry Accounts)
Note: Other includes industries such as transportation and warehousing, educational services, and professional, scientific and technical services
| 4 | 2021 Financial and Economic Review – July 2021 | |
| | | |
Part 1 – Economic Review
In 2020, service-producing industries represented 76 per cent of B.C.’s GDP and goods-producing industries accounted for 24 per cent. The real estate and rental and leasing sector formed the largest share of the service-producing industries, followed by wholesale and retail trade. At the same time, the construction sector made up the largest share of the goods-producing industries, followed by the manufacturing sector, and the natural resources sector.
Chart 1.3 Composition of British Columbia GDP by Industry

Source: Statistics Canada (Table 36-10-0400-01 – May 2021 Preliminary Industry Accounts)
(numbers may not add to 100 per cent due to rounding)
External Trade and Commodity Prices
Exports by destination:
The value of B.C.’s nominal international merchandise exports fell by 8.1 per cent in 2020, after decreasing by 6.2 per cent in 2019. Merchandise exports to the U.S. (B.C.’s largest international trading partner) saw a small increase in 2020, while exports to other countries saw large declines.
B.C.’s merchandise exports to the U.S. increased by 0.5 per cent in 2020 compared to 2019, after decreasing by 3.1 per cent in 2019. B.C.’s exports of wood products to the U.S. increased by 26.8 per cent, primarily driven by exports of softwood lumber. Annual declines in exports of pulp and paper products, metallic mineral products, energy products, and machinery and equipment largely offset the gains from wood products and agriculture and food products.
| | 2021 Financial and Economic Review – July 2021 | 5 |
| | | |
Part 1 – Economic Review
B.C.’s merchandise exports to Japan declined by 21.2 per cent in 2020. Declines in exports to Japan were concentrated in wood products (-32.5 per cent), mostly due to lower exports of softwood lumber and logs, and exports of coal (-38.1 per cent). B.C.’s exports of metallic mineral products to Japan increased by 27.2 per cent in 2020, primarily copper.
B.C.’s exports to China decreased by 11.2 per cent in 2020, primarily driven by declines in exports of wood products (-34.2 per cent) and pulp and paper products (-10.0 per cent). Meanwhile, B.C.’s merchandise exports to South Korea declined by 19.5 per cent in 2020, largely reflecting lower exports of pulp and paper products (-39.2 per cent) and coal (-37.3 per cent), partly offset by an increase in copper exports (+19.6 per cent).
Appendix Tables A1.7 and A1.8 provide further detail on exports by major market and commodity groups.
Chart 1.4 International Export Shares by Market
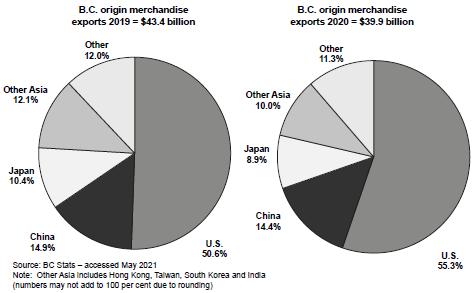
The share of B.C.’s international merchandise exports destined to the U.S. averaged 55.3 per cent in 2020, up from 50.6 per cent in 2019. Exports to China accounted for 14.4 per cent, down slightly from 14.9 per cent. Exports to Japan represented 8.9 per cent, down from 10.4 per cent while, exports to South Korea represented 5.3 per cent, down from 6.1 per cent.
Exports by commodity and prices:
Most of the annual decline in total exports was attributable to decreases in exports of energy products (-26.1 per cent), primarily coal, which fell by 39.1 per cent. Exports of pulp and paper products and machinery and equipment also experienced substantial declines of 19.2 per cent and 7.7 per cent, respectively. Increases in exports of wood products (+5.7 per cent), metallic mineral products (+4.7 per cent) and agriculture and food (+7.5 per cent) in 2020 helped offset the decline.
| 6 | 2021 Financial and Economic Review – July 2021 | |
| | | |
Part 1 – Economic Review
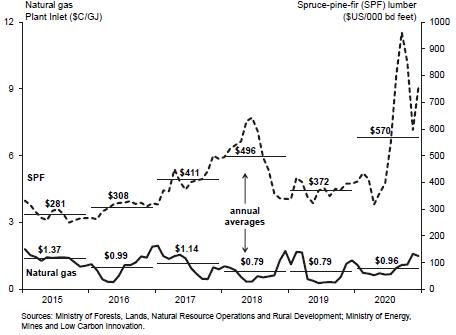
After forestry product prices fell in 2019, limited supply and resilient Canadian and U.S. housing markets contributed to large increases in lumber prices (+53.3 per cent) in 2020. Meanwhile, most industrial metal prices experienced steep declines, including lead, zinc and molybdenum, while copper increased by 2.8 per cent. In contrast, precious metal prices increased substantially, with gold and silver up 27.1 and 26.7 per cent, respectively.
Falling energy demand due to pandemic-related travel restrictions and excess supply led to lower crude oil prices in 2020, with the West Texas Intermediate (WTI) price averaging $39.23 US/barrel for the year, a decline of 31.2 per cent from 2019. Metallurgical coal prices also declined, while natural gas prices remained low despite increasing by 20.5 per cent.
Manufacturing shipments:
The nominal value of B.C.’s manufacturing shipments declined by 3.3 per cent in 2020 compared to 2019. Declines in manufacturing shipments were relatively broad-based and consistent with the declines seen in merchandise exports. Shipments of durable goods decreased by 3.4 per cent and non-durable goods decreased by 3.3 per cent. Lower shipments of fabricated metal products (-16.3 per cent), transportation equipment (-20.3 per cent) and machinery (-10.4 per cent) were largely responsible for the declines in durable goods. Declining shipments in non-durable goods were largely attributable to paper products (-17.1 per cent). These declines were partially offset by higher food manufacturing shipments (+5.2 per cent), and wood product shipments (+11.2 per cent).
Chart 1.5 Lumber and Natural Gas Prices
| | 2021 Financial and Economic Review – July 2021 | 7 |
| | | |
PART 1 – ECONOMIC REVIEW
Population
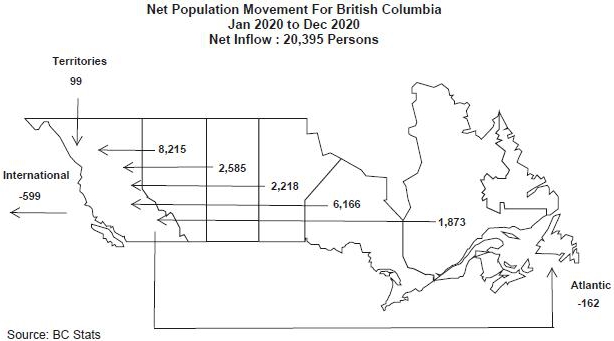
B.C.’s population on July 1, 2020 was 5.148 million people, an increase of 1.1 per cent from the same date in 2019. In 2020, interprovincial migration contributed a net total of 20,994 persons, significantly more than in 2019. Meanwhile, B.C. lost a net total of 599 persons through international migration, which was significantly impacted by travel restrictions. A natural increase of 1,069 persons (births minus deaths) also added to the province’s population count in 2020.
Map 1.1 Net Interprovincial and International Migration in B.C., 2020
Labour Market
Entering 2020, B.C. had one of the strongest labour markets in Canada with unemployment rates near historic lows. In the first two months following the onset of the pandemic employment declined by 410,600 jobs (-15.5 per cent) but recovered 366,100 of those jobs by December 2020. In 2020 as a whole, employment fell by 6.6 per cent losing 175,300 jobs. The employment losses consisted of about 123,200 full-time and 52,100 part-time jobs. The distribution of these losses was heavily weighted in the private sector (-178,800 jobs) and self-employed (-15,300 jobs), while the public sector had a gain of approximately 18,800 jobs. B.C.’s labour force also fell by 2.2 per cent in 2020. The unemployment rate averaged 8.9 per cent in 2020 as a whole after reaching a high of 13.4 per cent in May 2020.
Service-producing industries were heavily impacted by social distancing and travel restrictions accounting for nearly 84 per cent of the job losses (-146,600 jobs) in 2020. Significant losses were seen in accommodation and food service (-32,300 jobs), information, culture and recreation (-24,600 jobs) and wholesale and retail trade (-23,800 jobs). The goods-producing sector recorded a net loss of 28,800 jobs in 2020. Employment losses in the construction (-28,000 jobs) and manufacturing (-4,500 jobs) sectors were partially offset by gains in utilities (+5,800 jobs) and agriculture (+1,600 jobs). Industries less affected by social distancing or more able to adapt through remote work generally experienced less of an impact. Furthermore, pandemic-related employment losses have been uneven, mainly concentrated among lower-wage workers in high-contact services, where women and youth are overrepresented. And many who remained employed experienced reduced hours.
| 8 | 2021 FINANCIAL AND ECONOMIC REVIEW – JULY 2021 | |
| | | |
PART 1 – ECONOMIC REVIEW
Appendix Table A1.5 provides more details on employment by sector and subsectors.
Table 1.1 British Columbia Population and Labour Market Statistics
| | | Units | | | 2016 | | | 2017 | | | 2018 | | | 2019 | | | 2020 | |
| Population (as of July 1) | | (thousands) | | | | 4,859 | | | | 4,929 | | | | 5,010 | | | | 5,091 | | | | 5,148 | |
| | | (% change) | | | | 1.7 | | | | 1.4 | | | | 1.6 | | | | 1.6 | | | | 1.1 | |
| Net Migration | | | | | | | | | | | | | | | | | | | | | | | |
| International | | (persons) | | | | 40,012 | | | | 55,118 | | | | 61,311 | | | | 65,961 | | | | (599 | ) |
| Interprovincial | | (persons) | | | | 23,586 | | | | 15,293 | | | | 12,723 | | | | 13,926 | | | | 20,994 | |
| Labour Force | | (thousands) | | | | 2,612 | | | | 2,694 | | | | 2,719 | | | | 2,798 | | | | 2,735 | |
| | | (% change) | | | | 3.4 | | | | 3.1 | | | | 0.9 | | | | 2.9 | | | | (2.2 | ) |
| Employment | | (thousands) | | | | 2,454 | | | | 2,554 | | | | 2,590 | | | | 2,666 | | | | 2,491 | |
| | | (% change) | | | | 3.5 | | | | 4.1 | | | | 1.4 | | | | 3.0 | | | | (6.6 | ) |
| Unemployment Rate | | (%) | | | | 6.1 | | | | 5.2 | | | | 4.7 | | | | 4.7 | | | | 8.9 | |
Sources: Statistics Canada (Tables 17-10-0005-01, 17-10-0040-01, 17-10-0020-01, 14-10-0023-01 – accessed May 2021)
Inflation and Wages
B.C.’s annual Consumer Price Index (CPI) inflation rate was 0.8 per cent in 2020, following 2.3 per cent in 2019. The pandemic led to lower inflation with travel restrictions prompting declines in global demand for crude oil and social distancing and stay-at-home orders driving increased demand for goods like groceries but decreasing purchases for clothing and high-contact services. Price increases were led by food (+2.7 per cent), health and personal care (+2.6 per cent) and shelter (+1.4 per cent). The slower rate of inflation observed last year was mainly due to lower energy prices, most notably gasoline prices, which fell by 13.9 per cent in 2020. The annual CPI inflation rate excluding energy was 1.2 per cent in 2020.
Employee compensation (aggregate wages, salaries, and employers’ social contributions) in B.C. was relatively stable, declining 0.7 per cent in 2020, following growth of 5.6 per cent in 2019. The average weekly wage rate increased by 7.9 per cent in 2020 as job losses were dominated by low-wage workers.
Table 1.2 British Columbia Price and Earnings Indicators
| | | Units | | | 2016 | | | 2017 | | | 2018 | | | 2019 | | | 2020 | |
| Consumer Price Index | | (2002=100) | | | | 122.4 | | | | 125.0 | | | | 128.4 | | | | 131.4 | | | | 132.4 | |
| | | (% change) | | | | 1.8 | | | | 2.1 | | | | 2.7 | | | | 2.3 | | | | 0.8 | |
| Average Weekly Wage Rate | | ($) | | | | 925.5 | | | | 937.7 | | | | 974.2 | | | | 1,000.1 | | | | 1,079.6 | |
| | | (% change) | | | | 1.0 | | | | 1.3 | | | | 3.9 | | | | 2.7 | | | | 7.9 | |
| Compensation of Employees 1,2 | | ($ millions) | | | | 127,866 | | | | 135,921 | | | | 144,465 | | | | 152,588 | | | | 151,547 | |
| | | (% change) | | | | 3.3 | | | | 6.3 | | | | 6.3 | | | | 5.6 | | | | (0.7 | ) |
| Primary Household Income 1 | | ($ millions) | | | | 187,000 | | | | 198,265 | | | | 203,820 | | | | 216,834 | | | | n/a | |
| | | (% change) | | | | 2.9 | | | | 6.0 | | | | 2.8 | | | | 6.4 | | | | n/a | |
| Net Operating Surplus (Corporations) 1 | | ($ millions) | | | | 28,372 | | | | 33,638 | | | | 34,297 | | | | 31,882 | | | | n/a | |
| | | (% change) | | | | 19.0 | | | | 18.6 | | | | 2.0 | | | | (7.0 | ) | | | n/a | |
| 1 | As of November 2020 Provincial Economic Accounts |
| 2 | Component of income-based GDP, including wages, salaries and employers’ social contributions earned in B.C. by residents and non-residents of the province. 2020 value for compensation of employees is from Statistics Canada Table 36-10-0205-01. |
Sources: Statistics Canada (Tables 18-10-0005-01, 14-10-0064-01, 36-10-0221-01, 36-10-0205-01, 36-10-0224-01 – accessed May 2021)
| | 2021 FINANCIAL AND ECONOMIC REVIEW – JULY 2021 | 9 |
| | | |
PART 1 – ECONOMIC REVIEW
Consumer Spending and Housing
Following a sharp contraction in consumer spending in the initial months of the pandemic, spending on goods quickly reversed course and by mid-2020 was above pre-pandemic levels. B.C.’s nominal retail sales increased by 1.3 per cent in 2020 with mixed results across retailers. Increases were led by sales at food and beverage stores (+13.3 per cent), building material, and garden equipment and supplies dealers (+16.4 per cent), and general merchandise stores (+9.4 per cent). Meanwhile, significant declines were observed at clothing and clothing accessories stores (-24.6 per cent), gasoline stations (-13.8 per cent), and motor vehicles and parts dealers (-6.1 per cent).
National and sector-specific data suggests that B.C. consumer spending on services has likely declined sharply during the pandemic. National data shows that nominal Canadian consumer spending on services fell by 9.2 per cent in 2020. Data for sales at food services and drinking places in B.C., which provides a partial picture, showed a decline of 25.4 per cent in 2020 compared to 2019.
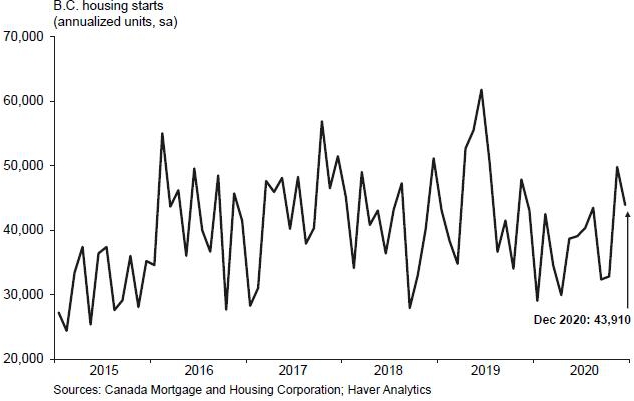
Housing starts in B.C. totalled 37,903 units in 2020, declining 15.6 per cent from the all-time annual high of 44,932 units in 2019. Meanwhile, the value of residential building permits (a leading indicator of potential new housing activity) fell by 9.6 per cent in 2020, following a decline of 5.2 per cent in 2019.
Chart 1.6 Housing Starts
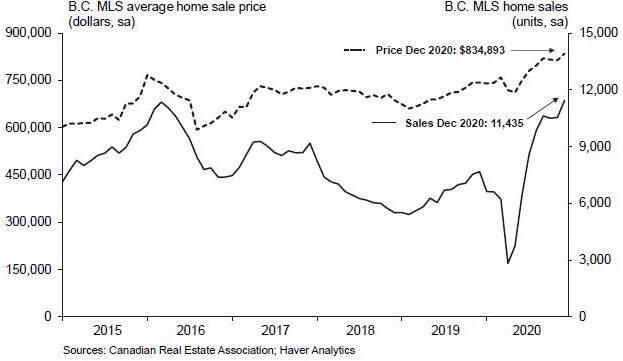
Resilient higher-wage employment, low interest rates, and increased demand for larger dwellings by remote workers fueled housing demand in 2020. After declining for three consecutive years, home sales reached record levels in late 2020 and were up 21.5 per cent on an annual basis compared to 2019. At the same time, the MLS average home sale price in B.C. increased by 11.6 per cent in 2020, following a slight decrease of 1.5 per cent in 2019.
| 10 | 2021 FINANCIAL AND ECONOMIC REVIEW – JULY 2021 | |
| | | |
PART 1 – ECONOMIC REVIEW
Chart 1.7 Home Sales and Price
Tourism
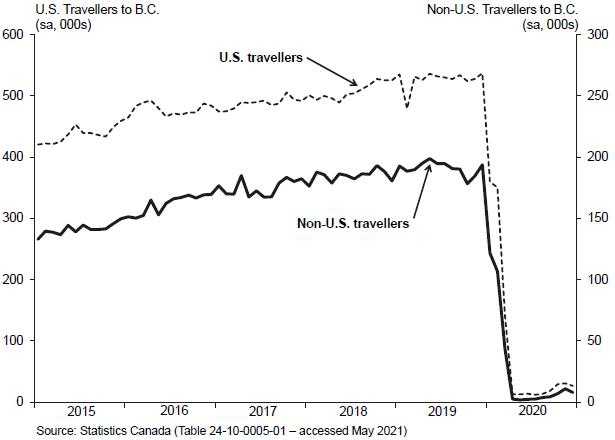
B.C.’s tourism sector was severely impacted by COVID-19. The number of international non-resident travellers to B.C. collapsed as travel restrictions were put in place. In 2020, the number of international travelers declined 84.5 per cent in 2020 compared to the previous year. The number of U.S. travellers to B.C. declined by 83.9 per cent and the number of non-U.S. travellers declined by 86.3 per cent in 2020 compared to the previous year.
Chart 1.8 Visitor Entries to British Columbia
| | 2021 FINANCIAL AND ECONOMIC REVIEW – JULY 2021 | 11 |
| | | |
PART 1 – ECONOMIC REVIEW
Global Economy
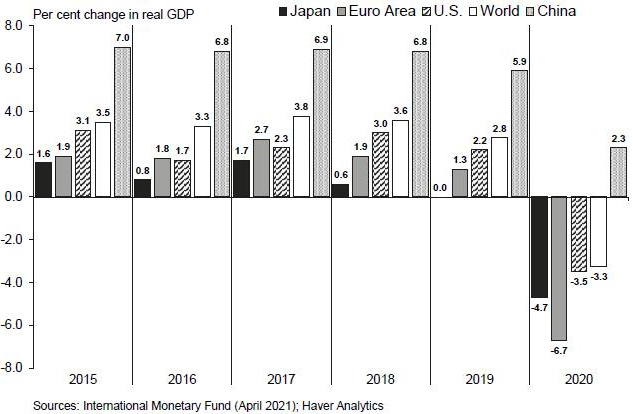
Overall, the International Monetary Fund estimates that global real GDP declined by 3.3 per cent in 2020 (the largest annual contraction on record), following 2.8 per cent growth in 2019. Declines were observed across most advanced economies and emerging markets. Apart from China, B.C.’s major trading partners saw declines in GDP in 2020 reflecting the COVID-19 pandemic. The U.S. economy contracted by 3.5 per cent in 2020, while Canadian economic output experienced the largest contraction on record, decreasing 5.3 per cent in 2020. Overseas, China was the only major economy to post positive economic growth of 2.3 per cent in 2020 while Japan’s economy shrank by 4.7 per cent. The euro area declined by 6.7 per cent in 2020, following 1.3 per cent growth in 2019.
Chart 1.9 Global Economic Growth
United States
U.S. real GDP shrank by 3.5 per cent in 2020, a more severe contraction than the 2009 Great Recession and the largest contraction since the 1940’s. Relatively less restrictive containment measures and generous government support programs contributed to the smaller contraction compared to other advanced economies. The decline in 2020 was mainly due to lower consumption of services, exports, and business investment while, lower imports, higher consumption of goods, and increased government spending provided some offset.
The U.S. labour market experienced record declines in the spring of 2020, partially recovering through the year. In 2020, employment was 5.8 per cent lower than in 2019 and the unemployment rate averaged 8.1 per cent. The labour force participation rate fell in 2020 with 61.8 per cent of Americans eligible to work participating in the labour market, down from 63.1 per cent in 2019.
| 12 | 2021 FINANCIAL AND ECONOMIC REVIEW – JULY 2021 | |
| | | |
PART 1 – ECONOMIC REVIEW
Despite significant declines early in the pandemic, new housing construction activity remained resilient in 2020. The level of housing starts was 1.38 million units in 2020, up 6.9 per cent compared to 2019. Sales of new single-family homes in the U.S. increased by 20.4 per cent in 2020, while the median sale price of new homes increased by 4.8 per cent. Sales of existing single-family homes increased by 6.3 per cent in 2020, while the median sale price increased by 9.7 per cent.
The U.S. current account deficit (the combined balances of trade in goods and services income, and net unilateral current transfers) increased from $US472.1 billion in 2019 to $US616.1 billion in 2020. As a share of nominal U.S. GDP, the current account deficit averaged -2.9 per cent in 2020.
Canada
The Canadian economy declined by 5.3 per cent in 2020, a larger decline than the 2.9 per cent contraction during the Great Recession in 2009, and the largest contraction on record (data available back to 1961). The slowdown in economic activity was driven by large declines in household consumption (primarily services), exports and investment in inventories, while lower imports provided some offset. Meanwhile, construction of residential structures increased in 2020 after two consecutive years of declines.
The Canadian labour market declined sharply at the start of the pandemic, losing nearly 3 million jobs in March and April 2020 before recovering through the rest of the year. On an annual basis, employment decreased by a total of 986,400 jobs (or -5.2 per cent) and the unemployment rate averaged 9.5 per cent in 2020.
The Canadian housing market was strong in 2020, with housing starts increasing by 3.8 per cent in 2020 to around 216,652 units, following a 2.0 per cent drop in 2019. The value of residential building permits increased by 8.1 per cent, following a decrease of 1.2 per cent in 2019. MLS home sales (units) were up annually by 12.3 per cent in 2020, after increasing by 6.6 per cent in 2019. The MLS average home sale price rose by 13.0 per cent to $567,907 in 2020.
Canadian retail sales decreased by 1.7 per cent in 2020, despite a rapid recovery from the initial contractions in March and April. Adjusted for price movements, retail sales volumes decreased by 2.1 per cent in 2020. The Canadian consumer price index rose by 0.7 per cent in 2020. The consumer price index excluding often volatile food and energy prices increased by a slightly higher 1.1 per cent.
Canada’s current account deficit narrowed to $40.1 billion in 2020 from $47.4 billion in 2019. As a share of nominal Canadian GDP, the current account deficit averaged -1.8 per cent in 2020 compared to -2.1 per cent in 2019.
Challenging global trade conditions paired with slumping oil prices led to a decrease (-13.4 per cent) in the value of Canada’s exports of goods and services in 2020. Meanwhile, imports of goods and services decreased by 11.7 per cent. The large decrease in merchandise exports (-12.4 per cent) was primarily driven by a 36.6 per cent decrease in exports of energy products (crude oil and bitumen, natural gas and natural gas liquids, and coal) as well as a 20.3 per cent decrease in exports of motor vehicles and parts. Service exports were down 17.7 per cent in 2020, driven by a significant decline in travel services (-59.4 per cent).
| | 2021 FINANCIAL AND ECONOMIC REVIEW – JULY 2021 | 13 |
| | | |
PART 1 – ECONOMIC REVIEW
Asia
China was the only major economy to post positive economic growth in 2020. Effective containment measures and resilient exports, along with accommodative monetary and fiscal measures supported a V-shaped recovery leading to 2.3 per cent annual real GDP growth in 2020, China’s slowest expansion since 1976.
Japan’s real GDP decreased by 4.7 per cent in 2020, the largest contraction since 2009. Household consumption led the declines, followed by exports and private investment. Meanwhile, lower imports and increased government spending partially offset the decline in real GDP.
Europe
Containment measures across the euro zone had severe implications for the economy, particularly for tourist-dependent countries. Real GDP in the euro area fell by 6.7 per cent in 2020 compared to 2019, a more severe contraction than the 2009 recession, and the largest annual contraction since data began in 1995. Declines were broad-based across most sectors with lower imports and higher government spending providing some offset. Germany’s economy shrank 5.1 per cent in 2020, less than the euro area average while other notable declines in France (-8.0 per cent), Italy (-8.9 per cent) and Spain (-10.8 per cent) were larger than the euro area average.
Outside the euro area, the U.K. economy contracted by 9.8 per cent in 2020, the largest annual decline on record. Annual output in services, production (manufacturing, mining and quarrying, energy supply, and water and waste management), construction and agriculture experienced significant annual declines.
Financial Markets
The global economic contraction brought on by the COVID-19 pandemic prompted an array of extraordinary monetary and fiscal policy responses around the world. The US Federal Reserve (Fed) lowered its federal funds rate by 150 basis points in March 2020 to the target range of 0.00 to 0.25 per cent. The Fed also provided forward guidance indicating that its intention is to keep rates at this level until the economy has recovered. Further, the Fed made large-scale asset purchases (i.e. quantitative easing), assisted financial market functioning through several credit facilities, and supported the flow of credit to households and businesses.
Similarly, the Bank of Canada responded to the COVID-19 crisis by cutting its target rate by 150 basis points, in March 2020, to an effective lower bound of 0.25 per cent throughout the rest of 2020. It also provided forward guidance, committing to maintain the current policy rate and quantitative easing program until its inflation target of 2.0 per cent is sustainably achieved and the recovery is well underway.
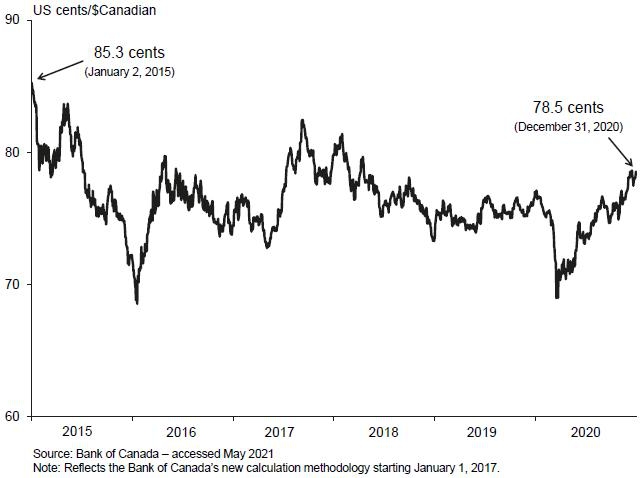
After averaging 75.4 US cents in 2019, the value of the Canadian dollar depreciated to 74.6 US cents in 2020. The Canadian dollar depreciated to a low of 71.1 US cents in April 2020 following the onset of the pandemic and the collapse in oil prices. From April through the remainder of the year, the Canadian dollar gradually appreciated surpassing pre-pandemic values, supported by recovering oil prices and a weakening U.S. dollar.
| 14 | 2021 FINANCIAL AND ECONOMIC REVIEW – JULY 2021 | |
| | | |
PART 1 – ECONOMIC REVIEW
Chart 1.10 Canadian Dollar
| | 2021 FINANCIAL AND ECONOMIC REVIEW – JULY 2021 | 15 |
| | | |
PART 1 – ECONOMIC REVIEW
Historical Data Volatility
Individual economic variables have unique characteristics. An important characteristic from a budgeting and planning perspective is the historical data volatility of a variable. Typically, variables that are more volatile over history are more difficult to forecast than variables that are more stable. This topic box summarizes the volatility of historical data from 1981 to 2019. Economic variables were relatively more volatile in 2020, reflecting the impact of the COVID-19 pandemic.
One of the most common measurements of data volatility is the standard deviation, which is frequently reported by agencies such as Statistics Canada and the Bank of Canada. Roughly speaking, the standard deviation of a variable measures how far the individual data points are from the average (mean) of all the data points in the series on an absolute basis (that is, without regard to whether each data point is above or below the average).
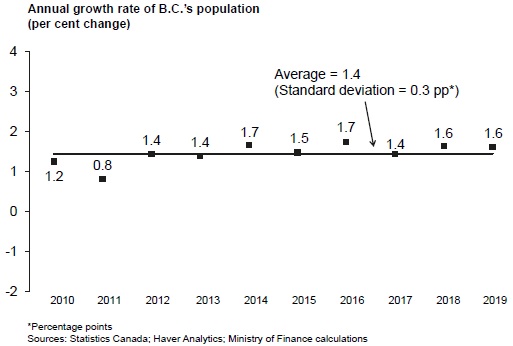
If a variable’s data points are generally close to the average, then the standard deviation will be relatively low (meaning that the variable is relatively stable). An example of a relatively stable variable is presented in Chart 1, which displays the annual growth rate of B.C.’s population.
Chart 1 – An Example of Historical Data Stability
Conversely, if a variable’s data points are generally spread out from the average, then the variable will have a relatively high standard deviation (meaning that the variable is relatively volatile). The annual growth rate of the natural gas price in Chart 2 is an example of a relatively volatile variable.
Chart 2 – An Example of Historical Data Volatility

The standard deviations and averages of selected key economic variables’ growth rates over different time periods are presented in Table 1. For instance, B.C. real GDP growth had a standard deviation of 0.6 percentage points and an average of 2.8 per cent from 2010 to 2019. This means that, on average, real GDP growth rates were 0.6 percentage points away from the average annual real GDP growth rate of 2.8 per cent over this period.
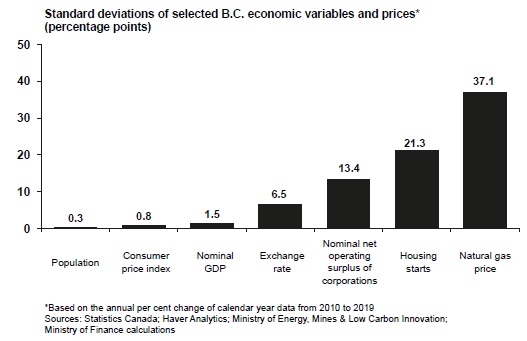
Standard deviations can vary widely across indicators and time. Variables such as the natural gas price and housing starts were relatively volatile from 2010 to 2019, while variables such as population and the consumer price index were relatively stable (see Chart 3). Meanwhile, some variables like the exchange rate have become more volatile over time, whereas other variables like population have become more stable (see Table 1).
| 16 | 2021 FINANCIAL AND ECONOMIC REVIEW – JULY 2021 | |
| | | |
Chart 3 – Recent Data Volatility
The Ministry of Finance manages the uncertainty associated with data volatility by incorporating prudence in the Province’s budget and fiscal plan.
PART 1 – ECONOMIC REVIEW
Table 1 – Data Volatility
Standard deviations and averages of growth rates of selected B.C. economic variables and prices
| All figures are based on the annual per cent | | 1982-2019 | | | 2000-2019 | | | 2010-2019 | |
| change of calendar year data1 | | | | | Standard | | | | | | Standard | | | | | | Standard | |
| | | Average2 | | | Deviation | | | Average2 | | | Deviation | | | Average2 | | | Deviation | |
| | | | | | (percentage | | | | | | (percentage | | | | | | (percentage | |
| | | (%) | | | points) | | | (%) | | | points) | | | (%) | | | points) | |
| Real GDP | | | 2.6 | | | | 2.3 | | | | 2.7 | | | | 1.7 | | | | 2.8 | | | | 0.6 | |
| Nominal GDP | | | 5.1 | | | | 2.8 | | | | 4.6 | | | | 2.8 | | | | 4.6 | | | | 1.5 | |
| Nominal consumption | | | 5.5 | | | | 1.9 | | | | 4.8 | | | | 1.4 | | | | 4.5 | | | | 0.9 | |
| Nominal business investment | | | 5.2 | | | | 9.2 | | | | 6.7 | | | | 6.9 | | | | 6.1 | | | | 4.0 | |
| Nominal residential home sales | | | 11.1 | | | | 22.6 | | | | 9.4 | | | | 19.1 | | | | 4.8 | | | | 19.2 | |
| Nominal household income | | | 5.2 | | | | 2.5 | | | | 4.5 | | | | 2.1 | | | | 4.4 | | | | 1.2 | |
| Nominal compensation of employees | | | 4.8 | | | | 2.6 | | | | 4.4 | | | | 2.3 | | | | 4.3 | | | | 1.4 | |
| Nominal net operating surplus of corporations | | | 10.6 | | | | 30.7 | | | | 6.6 | | | | 17.1 | | | | 7.1 | | | | 13.4 | |
| Consumer price index | | | 2.5 | | | | 1.9 | | | | 1.7 | | | | 0.7 | | | | 1.6 | | | | 0.8 | |
| Exchange rate | | | -0.1 | | | | 5.5 | | | | 0.8 | | | | 6.4 | | | | -1.3 | | | | 6.5 | |
| Copper price | | | 5.7 | | | | 24.3 | | | | 9.9 | | | | 27.9 | | | | 3.2 | | | | 20.6 | |
| Natural gas price | | | 4.1 | | | | 34.1 | | | | 4.3 | | | | 45.2 | | | | -6.0 | | | | 37.1 | |
| Pulp price | | | 3.5 | | | | 20.6 | | | | 4.5 | | | | 17.9 | | | | 5.2 | | | | 19.3 | |
| SPF 2x4 price | | | 3.6 | | | | 20.1 | | | | 2.5 | | | | 21.7 | | | | 9.4 | | | | 21.4 | |
| Housing starts | | | 3.2 | | | | 23.5 | | | | 7.8 | | | | 22.6 | | | | 12.4 | | | | 21.3 | |
| Population | | | 1.6 | | | | 0.7 | | | | 1.2 | | | | 0.4 | | | | 1.4 | | | | 0.3 | |
| 1 | Calendar and fiscal year data yield similar data volatility results |
| 2 | Measured as the mean |
Sources: Statistics Canada; Haver Analytics; Ministry of Energy, Mines & Low Carbon Innovation; Ministry of Forests, Lands, Natural Resource Operations & Rural Development; Ministry of Finance calculations
| | 2021 FINANCIAL AND ECONOMIC REVIEW – JULY 2021 | 17 |
| | | |
| | 2021 FINANCIAL AND ECONOMIC REVIEW – JULY 2021 | |
| | | |
PART 2 – FINANCIAL REVIEW
2020/21 Overview
Table 2.1 2020/21 Fiscal Summary
| | | 2020/21 | | | Actual | |
| ($ millions) | | Budget | | | Actual | | | Variance | | | 2019/20 1 | |
| Revenue | | | 60,585 | | | | 62,156 | | | | 1,571 | | | | 58,660 | |
| Expense | | | (60,058 | ) | | | (59,693 | ) | | | 365 | | | | (58,982 | ) |
| Pandemic and Recovery Contingencies | | | - | | | | (7,931 | ) | | | (7,931 | ) | | | - | |
| Forecast allowance | | | (300 | ) | | | - | | | | 300 | | | | - | |
| Surplus (Deficit) | | | 227 | | | | (5,468 | ) | | | (5,695 | ) | | | (322 | ) |
| | | | | | | | | | | | | | | | | |
| Capital spending: | | | | | | | | | | | | | | | | |
| Taxpayer-supported capital spending | | | 7,126 | | | | 5,428 | | | | (1,698 | ) | | | 4,772 | |
| Self-supported capital spending | | | 3,409 | | | | 3,475 | | | | 66 | | | | 4,386 | |
| | | | 10,535 | | | | 8,903 | | | | (1,632 | ) | | | 9,158 | |
| Provincial Debt: | | | | | | | | | | | | | | | | |
| Taxpayer-supported debt | | | 49,202 | | | | 59,750 | | | | 10,548 | | | | 46,229 | |
| Self-supported debt | | | 26,890 | | | | 27,350 | | | | 460 | | | | 25,932 | |
| Total debt (including forecast allowance) | | | 76,392 | | | | 87,100 | | | | 10,708 | | | | 72,161 | |
| | | | | | | | | | | | | | | | | |
| Key debt affordability metrics: | | | | | | | | | | | | | | | | |
| Taxpayer-supported debt to GDP ratio | | | 15.5 | % | | | 20.2 | % | | | 4.7 | % | | | 15.1 | % |
| Taxpayer-supported debt to revenue ratio | | | 84.1 | % | | | 101.2 | % | | | 17.1 | % | | | 80.6 | % |
| 1 | Figures have been restated to reflect government accounting policies in effect at March 31, 2021, and the impact of Statistics Canada’s historical data revisions of economic growth. |
The impacts of the COVID-19 global pandemic and government’s response measures resulted in significant consequences to government’s finances in the 2020/21 fiscal year. The Province ended the fiscal year with a $5.468 billion deficit, a decline of $5.695 billion from the $227 million surplus forecasted in Budget 2020, which was tabled before the pandemic (see Table 2.5.1 for detailed quarterly changes to the forecast).
Revenue was $1.571 billion higher than Budget 2020 as the decline in own-source revenues was offset by increased federal government contributions in support of COVID-19 pandemic measures. (See Revenue section for further details.)
Total government expenses were $7.566 billion higher than Budget 2020, mainly due to pandemic-related spending from contingencies votes that were appropriated through Supplementary Estimates during the year. (See Expense section for further details.)
Taxpayer-supported capital spending on hospitals, schools, post-secondary institutions, transportation infrastructure, social housing and other projects totalled $5.4 billion. This is $1.7 billion less than Budget 2020 due to scheduling delays across the sectors.
Self-supported capital spending of $3.475 billion was $66 million higher than budget. (See Capital section for further details.)
Government’s total debt balance at year end was $10.7 billion higher than forecast in Budget 2020 due to the operating deficit and changes to other operating requirements, including higher cash balances for increased liquidity. (See Debt section for further details.)
| 20 | 2021 FINANCIAL AND ECONOMIC REVIEW – JULY 2021 | |
| | | |
PART 2 – FINANCIAL REVIEW
Chart 2.1 2020/21 Surplus (Deficit) - Major Changes from Budget 2020
Decline of $5.695 billion, resulted in a $5.468 billion deficit
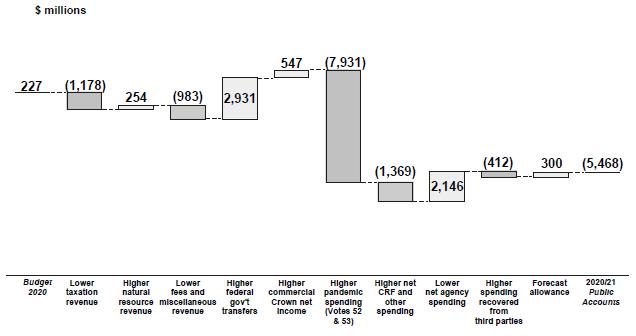
Financial information in this publication, including this chapter and Appendix 2, is sourced from the government’s 2020/21 Public Accounts.
Revenue
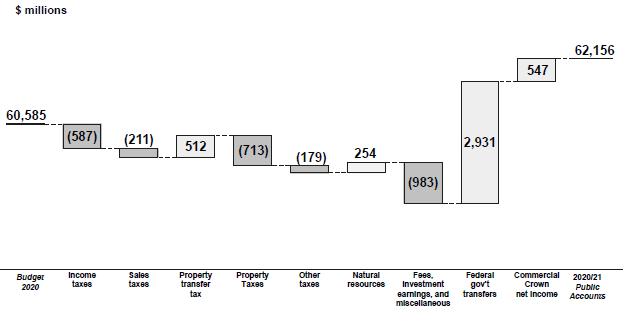
Revenue totalled $62.2 billion in 2020/21, $1,571 million higher than the Budget 2020 projection and up 6.0 per cent from 2019/20. Compared to budget, higher revenues from natural resources, investment earnings, commercial Crown corporation net income and federal government transfers were partly offset by lower revenues from taxation, fees and miscellaneous sources.
Changes of the major revenue components from Budget 2020 are outlined as follows.
Chart 2.2 Revenue Changes from Budget 2020
Total revenue increases by $1.6 billion
| | 2021 FINANCIAL AND ECONOMIC REVIEW – JULY 2021 | 21 |
| | | |
PART 2 – FINANCIAL REVIEW
Income Tax Revenue
Personal income tax revenue was down $653 million mainly due to the impacts of the pandemic on employment and incomes, resulting in lower taxes. 2020 household income growth exceeded expectations, however, this mainly reflected various federal and provincial emergency benefit payments. The average tax yield on these benefit payments is expected to be lower, as they primarily benefitted lower to middle income households, who are subject to lower tax rates. During the year, other influencing factors on personal income tax revenue included weaker tax assessments for the 2019 calendar year resulting in a lower tax base.
Table 2.2.1 Personal Income Tax Revenue Changes from Budget 2020
| | | Revenue | |
| | | changes | |
| | | ($ millions) | |
| Impacts of the pandemic - changes in 2020 household income and weaker average tax yield | | | (489 | ) |
| Prior year adjustment - improvement in 2020 taxes partly offset by weaker 2019 tax results | | | 97 | |
| Carry-forward impacts of the lower 2019 tax base | | | (261 | ) |
| | | | (653 | ) |
| | | | | | | | | | | | 2020/21 | |
| | | | | | | | Budget | | | | Public | |
| Indicators (annual percent change) | | | | | | | 2020 | | | | Accounts | |
| Household income | | | 2020
2021 | | | | 3.8
3.8 | %
% | | | 4.9
0.8 | % 1
% |
| | | | | | | | | | | | | |
| B.C. taxable income | | | 2020
2021 | | | | 3.8
3.7 | %
% | | | 4.9
0.0 | % 1
% |
| | | | | | | | | | | | | |
Corporate income tax revenue was up $66 million mainly due to increased instalments from the federal government partially offset by lower entitlement in respect of prior years. The $161 million increase in instalments reflects higher federal government forecast of 2020 corporate taxable income and B.C. payment share. The 2019 B.C. corporate income tax returns were weaker than expected resulting in a $95 million decrease to the prior years’ settlement payment. In 2019, B.C. taxable income declined 6.2 per cent annually compared to the 7.0 per cent annual decrease in the net operating surplus of B.C. corporations.
Table 2.2.2 Corporate Income Tax Revenue Changes from Budget 2020
| | | Revenue | |
| | | changes | |
| | | ($ millions) | |
| Advance instalments | | | 161 | |
| Prior years’ settlement payment | | | (95 | ) |
| | | | 66 | |
| | | | | | | |
| | | Budget | | | Actual | |
| Indicators ($ billions) | | 2020 | | | 2020/21 | |
| Payment Share | | | 14.17 | % | | | 14.42 | % |
| 2020 national corporate tax base | | | 365.9 | | | | 376.0 | |
| 2019 national corporate tax base | | | 349.5 | | | | 344.4 | |
| 2019 B.C. corporate tax base | | | 49.5 | | | | 48.6 | |
Other Tax Revenue
Sales tax revenues were $211 million lower than budget mainly due to lower growth in 2020 retail sales and goods consumption in particular durable and semi-durable goods as well as services. The delay of the Budget 2020 measures to April 1, 2021, as part of the government response to the global pandemic and the temporary PST rebate on select machinery and equipment also contributed to lower sales tax revenue. Net audit assessments and refunds were lower due to reduced audit and compliance activity in 2020 due to the pandemic. It is also likely that measures taken to help limit the spread of the coronavirus outbreak contributed to reduced consumer purchases of taxable items and sales tax revenue.
| 22 | 2021 FINANCIAL AND ECONOMIC REVIEW – JULY 2021 | |
| | | |
PART 2 – FINANCIAL REVIEW
Table 2.2.3 Consumption and Other Tax Revenue Changes from Budget 2020
| | | Revenue | |
| | | changes | |
| | | ($ millions) | |
| Provincial sales | | | (211 | ) |
| Carbon | | | (271 | ) |
| Fuel | | | (88 | ) |
| Tobacco | | | (44 | ) |
| Insurance premium | | | (8 | ) |
| | | | (622 | ) |
| | | | | | | | 2020/21 | |
| | | | Budget | | | | Public | |
| Indicators (annual percent change for the 2020 calendar year) | | | 2020 | | | | Accounts 1 | |
| Nominal consumer expenditures | | | 4.5 | % | | | -4.9 | % |
| Nominal consumer expenditures on durable goods | | | 1.7 | % | | | -2.3 | % |
| Nominal business investment | | | 4.1 | % | | | -9.3 | % |
| Consumer price index | | | 2.2 | % | | | 0.8 | % |
| Real GDP | | | 2.0 | % | | | -5.3 | % |
| Nominal GDP | | | 3.9 | % | | | -4.5 | % |
| Retail sales | | | 3.0 | % | | | 1.3 | % |
| 1 | Budget 2021 forecast for most variables, except retail sales and consumer price index which are actuals. |
Property transfer tax revenue was $512 million higher than budget due to higher residential sales values. Compared to 2019/20, revenue increased $488 million (30.3 per cent) as the average tax per residential transaction increased 35.3 per cent, while the number of residential transactions increased by 15.3 per cent. Revenue from the foreign buyers’ tax (included in total property transfer tax revenue) was $101 million compared to the $123 million budget assumption.
Fuel tax revenue was down $88 million from budget mainly due to lower than assumed gasoline, diesel, jet fuel and natural gas purchases. Travel restrictions due to the pandemic also contributed to lower consumption volumes.
Carbon tax revenue was down $271 million from budget mainly due to the delay in Carbon tax rate increase from $40 to $45 per tonne of carbon dioxide equivalent emissions from April 1, 2020 to April 1, 2021 as well as lower consumption of gasoline and diesel fuels.
Tobacco tax revenue was down $44 million from budget reflecting a decline in consumption volumes due in part to consumer lifestyle changes including purchases of alternatives such as vaping products.
Property tax revenue was $713 million lower than budget due to lower revenues from non-residential school taxes, residential school taxes, speculation and vacancy tax and BC Transit property levies. Lower non-residential school tax revenue ($567 million) mainly reflects the reduction in school property tax rates for commercial properties in the 2020 calendar year, announced as part of government’s response to the pandemic. Lower residential school taxes ($41 million) mainly reflect decreased residential property assessment values as well as higher claims relating to homeowner grant. The speculation and vacancy tax revenue was $115 million in 2020/21, $70 million lower than the budget estimate ($185 million), based on declarations by property owners for 2020 as well as reassessments relating to prior tax years.
Table 2.2.4 Property Tax Revenue Changes from Budget 2020
| | | Revenue | |
| | | changes | |
| | | ($ millions) | |
| Non-residential tax | | | (567 | ) |
| Speculation and vacancy tax | | | (70 | ) |
| Residential tax | | | (41 | ) |
| Other | | | (35 | ) |
| Total changes | | | (713 | ) |
| | 2021 FINANCIAL AND ECONOMIC REVIEW – JULY 2021 | 23 |
| | | |
PART 2 – FINANCIAL REVIEW
Insurance premium tax revenue was $8 million lower than budget mainly due to refunds issued to motor vehicle owners partially offset by increases in home insurance costs.
Employer health tax revenue was $232 million higher than budget mainly due to the pandemic adjustments relating to the prior year’s filing and payment deadlines and partly offset by lower 2020 compensation of employees than assumed at budget.
Natural Resources Revenue
Natural gas royalties were $11 million lower than budget due to lower prices for natural gas byproducts and increased utilization of the royalty and infrastructure credit programs, partly offset by higher natural gas prices. Byproducts include pentane, condensate and butane whose prices are more closely aligned to oil rather than natural gas. Prices for byproducts were lower than expected, ranging from down 33.8 per cent for pentane to down 61.9 per cent for butane. In 2020/21 natural gas prices averaged $1.24 ($Cdn/gigajoule, plant inlet), a 100 per cent increase from budget assumption.
Table 2.2.5 Energy and Mineral Revenue Changes from Budget 2020
| | | Revenue | |
| | | changes | |
| | | ($ millions) | |
| Natural gas royalties | | | (11 | ) |
| | | | | |
| Petroleum royalties | | | (26 | ) |
| | | | | |
| Coal, metals and other minerals | | | (92 | ) |
| | | | | |
| Electricity sales under the Columbia River Treaty | | | (36 | ) |
| | | | | |
| Other sources1 | | | (7 | ) |
| | | | (172 | ) |
| 1 | Includes Crown land tenures and fees and levies collected by the BC Oil and Gas Commission. |
| | | Budget | | | Actual | |
| Indicators | | 2020 | | | 2020/21 | |
| Natural gas price ($Cdn/GJ, plant inlet) | | $ | 0.62 | | | $ | 1.24 | |
| Natural gas production (annual change) | | | 7.1 | % | | | 2.8 | % |
| Pentane price ($C/bbl) | | $ | 65.02 | | | $ | 43.03 | |
| Condensates price ($C/bbl) | | $ | 64.37 | | | $ | 41.91 | |
| | | | | | | | | |
| Oil price ($US/bbl) | | $ | 61.13 | | | $ | 46.08 | |
| | | | | | | | | |
| Metallurgical coal price ($US/tonne) | | $ | 155 | | | $ | 117 | |
| Copper price ($US/lb) | | $ | 2.81 | | | $ | 3.13 | |
| | | | | | | | | |
| Electricity price ($US/Mwh) | | $ | 33.93 | | | $ | 27.03 | |
Coal, metals and other minerals revenue was $92 million lower than budget mainly due to lower metallurgical coal prices and significant capital spending in coal mine operations partially offset by the impacts of higher copper prices, improved copper grades and more efficient copper extraction process. Metallurgical coal prices averaged $117 (US/tonne) in 2020/21, down 24.5 per cent from the budget assumption ($155). Lower average prices during the year were mainly attributed to reduced demand for metallurgical coal by major steel producing countries during the COVID-19 pandemic combined with global oversupply.
Revenue from other energy sources was $69 million lower than budget mainly due to the effects of lower Mid-Columbia (Mid-C) electricity prices as well as the impacts of lower petroleum prices and production volumes. In 2020/21, petroleum prices averaged $46.08 per barrel, down 24.6 per cent from budget ($61.13) and Mid-C electricity prices averaged $27.03 ($US per mega-watt hour), down 20.3 per cent from the budget assumption ($33.93). Lower Mid-C electricity prices during the year were a result of improved natural gas supply and mild temperatures combined with an abundance of precipitation throughout the Pacific North West in late fall.
| 24 | 2021 FINANCIAL AND ECONOMIC REVIEW – JULY 2021 | |
| | | |
PART 2 – FINANCIAL REVIEW
Forests revenue was $437 million higher than budget mainly due to higher than expected stumpage revenue from timber tenures resulting from a higher average stumpage rate and increased Crown harvest volumes. Lumber prices for SPF 2x4 averaged $570 ($US/1000 bf) in 2020, up 50 per cent from the budget assumption ($380). The total Crown harvest volumes for 2020/21 were 47.1 million cubic metres, 2.4 per cent above budget. Logging tax revenue was higher than budget due to increased lumber prices and the depletion of companies’ loss carry-forwards.
Table 2.2.6 Forest Revenue Changes from Budget 2020
| | | Revenue | |
| | | changes | |
| | | ($ millions) | |
| Stumpage from timber tenures | | | 291 | |
| BC Timber Sales | | | 106 | |
| Logging Tax | | | 26 | |
| Other receipts | | | 14 | |
| | | | 437 | |
| | | Budget | | | Actual | |
| Indicators | | 2020 | | | 2020/21 | |
| SPF 2x4 ($US/1000 bf, calendar year) | | $ | 380 | | | $ | 570 | |
| Total stumpage rate ($/m3) | | $ | 16.83 | | | $ | 24.97 | |
| Harvest volumes (million m3) | | | 46.0 | | | | 47.1 | |
Other natural resource revenues, comprised of revenue from water rentals and hunting and fishing licenses, were $11 million lower than budget mainly due to lower water rentals revenue.
Other Taxpayer-Supported Sources
Revenue from fees, investment earnings and other miscellaneous sources totalled $8.7 billion, down $983 million from budget.
Fee revenue totalled $4.3 billion, down $338 million from budget mainly due to lower revenues from post-secondary institutions, K-12 school districts, health authorities and motor vehicle fees.
Miscellaneous revenue totalled $3.1 billion, $662 million below budget mainly due to lower revenues from taxpayer-supported Crown corporations and SUCH sector agencies. These decreases were partially offset by higher vote recoveries related to the PharmaCare and other health spending programs. The higher vote recovery funding had an equal and offsetting expense increase.
Revenue from investment earnings was $1.3 billion, up $17 million from budget due to prudence adopted at budget, partly offset by decreases in vote recoveries related to Fiscal Agency Loans and lower investment returns for taxpayer-supported Crown corporations and agencies.
Table 2.2.7 Other Revenue Changes from Budget 2020
| | | Revenue changes | |
| | | ($ millions) | |
| Fees | | | (338 | ) |
| | | | | |
| Miscellaneous sources | | | (662 | ) |
| | | | | |
| Investment earnings | | | 17 | |
| | | | (983 | ) |
Lower revenues from motor vehicle fees and taxpayer supported SUCH sector agencies
Lower revenues in taxpayer-supported SUCH sector agencies and Crown corporations, partly offset by higher PharmaCare and other vote recoveries
Prudence adopted at budget partly offset by lower fiscal agency loan recoveries
| | 2021 FINANCIAL AND ECONOMIC REVIEW – JULY 2021 | 25 |
| | | |
PART 2 – FINANCIAL REVIEW
Federal Government Transfers
Contributions from the federal government totaled $13 billion, $3 billion above budget.
Canada Health Transfer and Canada Social Transfer entitlements were $60 million higher as a result of a greater than assumed B.C. share of the national population (13.54 per cent compared to 13.50 per cent forecast at budget) and net refunds of deductions for violations relating to prior years under the Canada Health Act.
COVID-19 pandemic related funding contributions supporting the Safe Restart Agreement, COVID-19 Essential Workers Support Fund, Safe Return to Class Fund and the Financial Assistance Agreement to Support Closure and Restoration of Oil and Gas Sites in British Columbia, were $2.6 billion.
Table 2.2.8 Federal Government Transfer Changes from Budget 2020
| | | Revenue | |
| | | changes | |
| | | ($ millions) | |
| B.C. health and social transfers revenue | | | 60 | |
| | | | | |
| COVID-19 related funding | | | 2,603 | |
| | | | | |
| SUCH sector | | | 92 | |
| | | | | |
| Crown corporations and agencies | | | 53 | |
| | | | | |
| Vote recoveries | | | 38 | |
| | | | | |
| Other receipts | | | 85 | |
| | | | | |
| | | | 2,931 | |
Higher B.C. population share of the national total and net refunds of Canada Health Act violation deductions related to prior years
Funding supporting the Safe Restart Agreement, COVID-19 Essential Workers Support Fund, Safe Return to Class Fund and the Financial Assistance Agreement to Support Closure and Restoration of Oils and Gas Sites in British Columbia
Higher transfers to taxpayer-supported SUCH sector agencies (mainly post-secondary institutions)
Mainly higher transfers to BC Transit
Higher funding in support of local government services and transfers, labour market and skills training and other program spending
Mainly higher funding in support of Disaster Financial Assistance Arrangements, Forest Enhancement Society of BC and indigenous student education
Other federal government contributions were up $268 million from budget. SUCH1 sector entities received $92 million higher contributions, mainly by post-secondary institutions. Taxpayer-supported Crown corporations received $53 million higher contributions, mainly by BC Transit. Ministries received $38 million higher vote recovery funding in support of labour market and skills training as well as local government services and transfers. The increased vote recovery funding had an equal and offsetting expense increase. Other ministry receipts were $85 million higher than budget mainly due to higher funding in support of Disaster Financial Assistance Arrangements, the Forest Enhancement Society of BC and indigenous student education.
| 1 | SUCH: School districts, universities, colleges and institutes, and health organizations. |
| 26 | 2021 FINANCIAL AND ECONOMIC REVIEW – JULY 2021 | |
| | | |
PART 2 – FINANCIAL REVIEW
Commercial Crown Corporations
The net income of commercial Crown corporations (government business enterprises) was nearly $4 billion in 2020/21, $547 million higher than Budget 2020, and $1 billion higher than 2019/20. The variance from budget in overall earnings is mainly due to higher ICBC operating results partially offset by lower net income from BC Lottery Corporation.
British Columbia Hydro and Power Authority
BC Hydro’s net income of $688 million was $24 million lower than the forecast in Budget 2020. The lower net income was mainly due to variances in certain operating costs that were above planned amounts, and which were not subject to deferral.
British Columbia Liquor Distribution Branch
BC Liquor Distribution Branch (LDB) net income of $1.2 billion was $27 million higher than the forecast in Budget 2020, and $54 million higher than 2019/20. The increase in net income was mainly due to higher revenue from liquor operations, and lower amortization and other administrative expenses.
British Columbia Lottery Corporation
BC Lottery Corporation’s net income of $420 million (net of payments to the federal government) was $943 million lower than Budget 2020, and a decrease of $916 million over the prior year. The 2020/21 change was mainly due to the closure of all gaming facilities for the entire fiscal year in compliance with provincial health orders related to the COVID-19 pandemic.
Insurance Corporation of British Columbia
The Insurance Corporation of British Columbia’s (ICBC) net income of $1.5 billion was $1.4 billion higher than the $86 million projected in Budget 2020, and a $1.9 billion improvement from the 2019/20 loss. The significant improvement in 2020/21 was primarily due to a continuing trend of a lower number of crashes and claims frequency observed even before the favourable impacts of the COVID-19 pandemic, as well as higher than expected investment income. Although ICBC also experienced a significant net favourable impact (lower claims partially offset by lower premiums) from reduced driving during the provincial COVID-19 lockdown period in 2020/21, this benefit was returned to customers in the form of COVID-19 rebates.
More information about commercial Crown corporations’ financial results and performance measures is provided in each corporation’s Annual Service Plan Report available at its respective website.
| | 2021 FINANCIAL AND ECONOMIC REVIEW – JULY 2021 | 27 |
| | | |
PART 2 – FINANCIAL REVIEW
Table 2.3 Revenue by Source
| | | Budget | | | Actual | | | Actual | |
| ($ millions) | | 2020 | | | 2020/21 | | | 2019/20 | |
| Taxation | | | | | | | | | | | | |
| Personal income | | | 11,771 | | | | 11,118 | | | | 10,657 | |
| Corporate income | | | 4,739 | | | | 4,805 | | | | 5,011 | |
| Employer health | | | 1,924 | | | | 2,156 | | | | 1,897 | |
| Sales 1 | | | 7,905 | | | | 7,694 | | | | 7,374 | |
| Fuel | | | 1,024 | | | | 936 | | | | 1,008 | |
| Carbon | | | 1,954 | | | | 1,683 | | | | 1,682 | |
| Tobacco | | | 755 | | | | 711 | | | | 729 | |
| Property | | | 3,026 | | | | 2,313 | | | | 2,608 | |
| Property transfer | | | 1,586 | | | | 2,098 | | | | 1,609 | |
| Insurance premium | | | 660 | | | | 652 | | | | 691 | |
| | | | 35,344 | | | | 34,166 | | | | 33,266 | |
| Natural resources | | | | | | | | | | | | |
| Natural gas royalties | | | 207 | | | | 196 | | | | 118 | |
| Forests | | | 867 | | | | 1,304 | | | | 988 | |
| Other natural resources 2 | | | 1,075 | | | | 903 | | | | 1,162 | |
| | | | 2,149 | | | | 2,403 | | | | 2,268 | |
| Other revenue | | | | | | | | | | | | |
| Medical Services Plan premiums | | | - | | | | (4 | ) | | | 1,063 | |
| Other fees and licences 3 | | | 4,667 | | | | 4,333 | | | | 4,509 | |
| Investment earnings | | | 1,247 | | | | 1,264 | | | | 1,263 | |
| Miscellaneous 4 | | | 3,798 | | | | 3,136 | | | | 3,838 | |
| | | | 9,712 | | | | 8,729 | | | | 10,673 | |
| Contributions from the federal government | | | | | | | | | | | | |
| Health and social transfers | | | 7,683 | | | | 7,743 | | | | 7,430 | |
| COVID-19 related funding | | | - | | | | 2,603 | | | | 64 | |
| Other federal contributions 5 | | | 2,280 | | | | 2,548 | | | | 2,041 | |
| | | | 9,963 | | | | 12,894 | | | | 9,535 | |
| Commercial Crown corporation net income | | | | | | | | | | | | |
| BC Hydro | | | 712 | | | | 688 | | | | 705 | |
| Liquor Distribution Branch | | | 1,134 | | | | 1,161 | | | | 1,107 | |
| BC Lottery Corporation (net of payments to the federal government) | | | 1,363 | | | | 420 | | | | 1,336 | |
| ICBC | | | 86 | | | | 1,528 | | | | (376 | ) |
| Other 6 | | | 122 | | | | 167 | | | | 146 | |
| | | | 3,417 | | | | 3,964 | | | | 2,918 | |
| Total revenue | | | 60,585 | | | | 62,156 | | | | 58,660 | |
| 1 | Includes provincial sales tax, HST/PST housing transition tax and harmonized sales tax related to prior years. |
| 2 | Columbia River Treaty, Crown land tenures, other energy and minerals, water rental and other resources. |
| 3 | Post-secondary, healthcare-related, motor vehicle, and other fees. |
| 4 | Includes reimbursements for health care and other services provided to external agencies, and other recoveries. |
| 5 | Includes contributions for health, education, community development, housing and social service programs, and transportation projects. |
| 6 | Includes Columbia Power Corporation, BC Railway Company, Columbia Basin power projects, and post-secondary institutions’ self-supported subsidiaries. |
| 28 | 2021 FINANCIAL AND ECONOMIC REVIEW – JULY 2021 | |
| | | |
PART 2 – FINANCIAL REVIEW
Table 2.4 Expense by Ministry, Program and Agency 1
| | | | | | Contin- | | | Pandemic & | | | Statutory | | | Total | | | | | | | |
| | | Budget | | | gencies | | | Recovery | | | author- | | | author- | | | Actual | | | Actual | |
| ($ millions) | | | 2020 2 | | | | allocation | | | | Contingencies | | | | ization 3 | | | | izations | | | | 2020/21 | | | | 2019/20 2 | |
| Office of the Premier | | | 11 | | | | - | | | | - | | | | - | | | | 11 | | | | 11 | | | | 12 | |
| Advanced Education and Skills Training | | | 2,366 | | | | - | | | | 46 | | | | - | | | | 2,412 | | | | 2,412 | | | | 2,331 | |
| Agriculture, Food and Fisheries | | | 95 | | | | 32 | | | | 23 | | | | - | | | | 150 | | | | 150 | | | | 112 | |
| Attorney General | | | 1,154 | | | | 40 | | | | 310 | | | | - | | | | 1,504 | | | | 1,495 | | | | 1,192 | |
| Children and Family Development | | | 2,229 | | | | 41 | | | | 175 | | | | - | | | | 2,445 | | | | 2,445 | | | | 2,148 | |
| Citizens’ Services | | | 552 | | | | 13 | | | | 98 | | | | - | | | | 663 | | | | 663 | | | | 598 | |
| Education | | | 6,695 | | | | 16 | | | | 45 | | | | 1 | | | | 6,757 | | | | 6,756 | | | | 6,627 | |
| Energy, Mines and Low Carbon Innovation | | | 114 | | | | 61 | | | | 77 | | | | - | | | | 252 | | | | 252 | | | | 251 | |
| Environment and Climate Change Strategy | | | 245 | | | | 52 | | | | 402 | | | | 12 | | | | 711 | | | | 708 | | | | 244 | |
| Finance | | | 839 | | | | 61 | | | | 16 | | | | 883 | | | | 1,799 | | | | 1,781 | | | | 1,368 | |
| Forests, Lands, Natural Resource Operations and Rural Development | | | 844 | | | | 22 | | | | 100 | | | | 111 | | | | 1,077 | | | | 1,077 | | | | 958 | |
| Health | | | 22,190 | | | | 41 | | | | 1,924 | | | | - | | | | 24,155 | | | | 24,155 | | | | 20,825 | |
| Indigenous Relations and Reconciliation | | | 97 | | | | 184 | | | | 33 | | | | - | | | | 314 | | | | 314 | | | | 353 | |
| Jobs, Economic Recovery and Innovation | | | 78 | | | | 2 | | | | 171 | | | | - | | | | 251 | | | | 251 | | | | 82 | |
| Labour | | | 17 | | | | - | | | | 18 | | | | - | | | | 35 | | | | 35 | | | | 16 | |
| Mental Health and Addictions | | | 10 | | | | - | | | | 29 | | | | - | | | | 39 | | | | 39 | | | | 23 | |
| Municipal Affairs | | | 147 | | | | 37 | | | | 341 | | | | - | | | | 525 | | | | 524 | | | | 717 | |
| Public Safety and Solicitor General | | | 871 | | | | 54 | | | | 31 | | | | 102 | | | | 1,058 | | | | 1,057 | | | | 989 | |
| Social Development and Poverty Reduction | | | 3,682 | | | | 46 | | | | 755 | | | | - | | | | 4,483 | | | | 4,483 | | | | 3,568 | |
| Tourism, Arts, Culture and Sport | | | 159 | | | | 11 | | | | 183 | | | | - | | | | 353 | | | | 352 | | | | 182 | |
| Transportation and Infrastructure | | | 929 | | | | - | | | | 303 | | | | - | | | | 1,232 | | | | 1,232 | | | | 920 | |
| Total ministries and Office of the Premier | | | 43,324 | | | | 713 | | | | 5,080 | | | | 1,109 | | | | 50,226 | | | | 50,192 | | | | 43,516 | |
| Management of public funds and debt | | | 1,197 | | | | - | | | | - | | | | 49 | | | | 1,246 | | | | 1,246 | | | | 1,234 | |
| Contingencies | | | 1,066 | | | | (713 | ) | | | - | | | | - | | | | 353 | | | | - | | | | - | |
| Pandemic and Recovery Contingencies - Vote 52 4 | | | - | | | | - | | | | 2,730 | | | | - | | | | 2,730 | | | | 2,041 | | | | - | |
| Pandemic and Recovery Contingencies - Vote 53 5 | | | - | | | | - | | | | 190 | | | | - | | | | 190 | | | | - | | | | - | |
| Funding for capital expenditures | | | 2,789 | | | | - | | | | - | | | | - | | | | 2,789 | | | | 1,974 | | | | 1,653 | |
| Refundable tax credit transfers | | | 1,686 | | | | - | | | | - | | | | 672 | | | | 2,358 | | | | 2,358 | | | | 1,413 | |
| Legislative Assembly and other appropriations | | | 166 | | | | - | | | | - | | | | 50 | | | | 216 | | | | 209 | | | | 150 | |
| Total appropriations | | | 50,228 | | | | - | | | | 8,000 | | | | 1,880 | | | | 60,108 | | | | 58,020 | | | | 47,966 | |
| Elimination of transactions between appropriations 6 | | | (20 | ) | | | - | | | | - | | | | - | | | | (20 | ) | | | (15 | ) | | | (20 | ) |
| Prior year liability adjustments | | | - | | | | - | | | | - | | | | - | | | | - | | | | (123 | ) | | | (126 | ) |
| Consolidated revenue fund expense | | | 50,208 | | | | - | | | | 8,000 | | | | 1,880 | | | | 60,088 | | | | 57,882 | | | | 47,820 | |
| Expenses recovered from external entities 5 | | | 3,335 | | | | - | | | | - | | | | - | | | | 3,335 | | | | 4,557 | | | | 3,850 | |
| Funding provided to service delivery agencies | | | (30,813 | ) | | | - | | | | - | | | | - | | | | (30,813 | ) | | | (34,096 | ) | | | (28,928 | ) |
| Total direct program spending | | | 22,730 | | | | - | | | | 8,000 | | | | 1,880 | | | | 32,610 | | | | 28,343 | | | | 22,742 | |
| Service delivery agency expense | | | | | | | | | | | | | | | | | | | | | | | | | | | | |
| School districts | | | 7,080 | | | | - | | | | - | | | | - | | | | 7,080 | | | | 7,083 | | | | 6,995 | |
| Universities | | | 5,457 | | | | - | | | | - | | | | - | | | | 5,457 | | | | 5,272 | | | | 5,252 | |
| Colleges and institutes | | | 1,464 | | | | - | | | | - | | | | - | | | | 1,464 | | | | 1,431 | | | | 1,465 | |
| Health authorities and hospital societies | | | 17,425 | | | | - | | | | - | | | | - | | | | 17,425 | | | | 19,252 | | | | 17,038 | |
| Other service delivery agencies | | | 5,902 | | | | - | | | | - | | | | - | | | | 5,902 | | | | 6,243 | | | | 5,489 | |
| Total service delivery agency expense | | | 37,328 | | | | - | | | | - | | | | - | | | | 37,328 | | | | 39,281 | | | | 36,239 | |
| Total expense | | | 60,058 | | | | - | | | | 8,000 | | | | 1,880 | | | | 69,938 | | | | 67,624 | | | | 58,981 | |
| 1 | Amounts may not add due to rounding. |
| 2 | Amounts have been restated to reflect government accounting policies and organization in effect at March 31, 2021. |
| 3 | Statutory authorizations are appropriations permitted by an Act other than a Supply Act. |
| 4 | On March 23, 2020, the Legislative Assembly passed Supplementary Estimates of $5 billion to establish a new Vote 52 - Contingencies (All Ministries): Pandemic Response and Economic Recovery. An additional $2 billion in appropriation was authorized on December 17, 2020 to fund further COVID-19 measures. |
| 5 | On August 14, 2020, the Legislative Assembly passed Supplementary Estimates No. 2 of $1 billion to establish a new Vote 53 - Contingencies (All Ministries): Federal and Provincial Pandemic Support. The provincial portion of the actual spending is shown as part of ministries expenses; the federal matching spending is included in “Expenses recovered from external entities”. |
| 6 | Reflects payments made under an agreement where an expense from a voted appropriation is recorded as revenue by a special account (Housing Endowment Fund and British Columbia Training and Education Savings Program). |
| | 2021 FINANCIAL AND ECONOMIC REVIEW – JULY 2021 | 29 |
| | | |
PART 2 – FINANCIAL REVIEW
Table 2.5.1 2020/21 Operating Results by Quarter
| | | ($ millions) | |
| 2020/21 surplus at Budget 2020 (February 18, 2020) | | | 227 | | | | | | | | | | | | | | | | 227 | |
| 2020/21 deficit at the First Quarterly Report (September 10, 2020) | | | | | | | (12,792 | ) | | | | | | | | | | | | |
| 2020/21 deficit at the Fall 2020 Economic & Fiscal Update (December 17, 2020) | | | | | | | | | | | (13,643 | ) | | | | | | | | |
| 2020/21 surplus at the Third Quarterly Report (April 20, 2021) | | | | | | | | | | | | | | | (8,144 | ) | | | | |
| | | Q1 | | | Fall 2020 | | | Q3 | | | Q4 | | | Total | |
| | | Update | | | Update | | | Update | | | Update | | | Changes | |
| Revenue changes: | | | | | | | | | | | | | | | | | | | | |
| Personal income tax – mainly expected changes in 2020 household income and weaker tax yield | | | (978 | ) | | | 171 | | | | 154 | | | | - | | | | (653 | ) |
| Corporate income tax – changes in instalments, mainly reflecting federal government outlook for 2020 national corporate taxable income partly offset by weaker 2019 tax assessments results | | | (1,144 | ) | | | 78 | | | | 1,134 | | | | (2 | ) | | | 66 | |
| Provincial sales tax – lower retail sales and consumer expenditures and impacts of tax measures | | | (1,024 | ) | | | (135 | ) | | | 700 | | | | 248 | | | | (211 | ) |
| Property taxes – mainly reflecting tax relief provided to commercial property owners, lower speculation and vacancy tax and updated 2021 assessment values and tax rates | | | (694 | ) | | | 7 | | | | (15 | ) | | | (11 | ) | | | (713 | ) |
| Property transfer tax – changes in year-to-date sales activity in the housing sector | | | (315 | ) | | | 479 | | | | 250 | | | | 98 | | | | 512 | |
| Fuel and carbon taxes – year-to-date sales activity and delay of the carbon tax rate increase from April 1, 2020 to April 1, 2021 | | | (469 | ) | | | (15 | ) | | | 79 | | | | 46 | | | | (359 | ) |
| Employer health tax – mainly expected changes in employee compensation and higher taxes relating to prior years | | | (148 | ) | | | 47 | | | | 17 | | | | 316 | | | | 232 | |
| Other taxation sources – impacts of 2019/20 Public Accounts and year-to-date results | | | 20 | | | | 10 | | | | (20 | ) | | | (62 | ) | | | (52 | ) |
| Mining – changes in coal and copper prices, changes in coal production and mining costs | | | (84 | ) | | | (18 | ) | | | 2 | | | | 8 | | | | (92 | ) |
| Forests – higher stumpage rates as well as changes in logging tax revenue and harvest volumes | | | 30 | | | | 96 | | | | 128 | | | | 183 | | | | 437 | |
| Other natural resources – commodity prices and production volumes, utilization of royalty infrastructure programs/credits and changes in water rentals revenue | | | (190 | ) | | | 78 | | | | 24 | | | | (3 | ) | | | (91 | ) |
| Fees, licences, investment earnings and miscellaneous sources: | | | | | | | | | | | | | | | | | | | | |
| Post-secondary institutions | | | (673 | ) | | | 67 | | | | 145 | | | | (8 | ) | | | (469 | ) |
| K-12 school districts | | | (137 | ) | | | (25 | ) | | | 78 | | | | (182 | ) | | | (266 | ) |
| Taxpayer-supported Crowns | | | (111 | ) | | | (94 | ) | | | (45 | ) | | | 43 | | | | (207 | ) |
| Other sources – lower fees from Health Authorities and motor vehicle fees/fines partly offset by higher ministry program vote recoveries and investment earnings | | | (76 | ) | | | 4 | | | | (47 | ) | | | 78 | | | | (41 | ) |
| Canada health and social transfers – mainly due to changes in B.C. population share of national total. Additional pandemic relief one-time funding supporting recovery of health care systems was included in Q3 but will be recognized in 2021/22 instead | | | (2 | ) | | | 52 | | | | 552 | | | | (542 | ) | | | 60 | |
| COVID-19 related federal government funding | | | 2,376 | | | | 242 | | | | (2 | ) | | | (13 | ) | | | 2,603 | |
| Other federal government transfers – mainly higher transfers under the Disaster Financial Assistance Arrangements and higher funding in support of ministry program spending, taxpayer-supported Crowns and SUCH sector agencies | | | (20 | ) | | | 69 | | | | 130 | | | | 89 | | | | 268 | |
| Commercial Crown corporation net income – ICBC, BC Lottery Corp and the LDB | | | (933 | ) | | | 298 | | | | 279 | | | | 903 | | | | 547 | |
| Total revenue changes | | | (4,572 | ) | | | 1,411 | | | | 3,543 | | | | 1,189 | | | | 1,571 | |
| | | | | | | | | | | | | | | | | | | | | |
| Less: expense increases (decreases): | | | | | | | | | | | | | | | | | | | | |
| Consolidated Revenue Fund changes: | | | | | | | | | | | | | | | | | | | | |
| Pandemic and Recovery Contingencies (Vote 52) | | | 5,000 | | | | 2,000 | | | | (300 | ) | | | (389 | ) | | | 6,311 | |
| Change in Contingencies (Vote 45) spending allocation | | | - | | | | - | | | | (330 | ) | | | (23 | ) | | | (353 | ) |
| Ministry and Legislative Assembly savings | | | - | | | | - | | | | - | | | | (40 | ) | | | (40 | ) |
| Federal-Provincial cost-shared investments under the Safe Restart Agreement: Provincial portion (Pandemic and Recovery Contingencies - Vote 53) | | | 810 | | | | | | | | | | | | | | | | 810 | |
| Federal portion | | | 810 | | | | - | | | | - | | | | - | | | | 810 | |
| Statutory spending: | | | | | | | | | | | | | | | | | | | | |
| Fire management costs | | | 76 | | | | 2 | | | | 2 | | | | (23 | ) | | | 57 | |
| Emergency Program Act | | | 94 | | | | 26 | | | | 1 | | | | (19 | ) | | | 102 | |
| Signed agreements under the Sustainable Services Negotiating Mandate | | | 310 | | | | 37 | | | | 2 | | | | 9 | | | | 358 | |
| COVID-19 temporary pandemic pay | | | 425 | | | | (41 | ) | | | - | | | | (51 | ) | | | 333 | |
| Housing Priority Initiatives Special Account – purchase of hotels to house decamped homeless populations | | | 111 | | | | - | | | | 85 | | | | - | | | | 196 | |
| Other statutory spending | | | 14 | | | | 71 | | | | 3 | | | | 25 | | | | 113 | |
| Refundable tax credits: | | | | | | | | | | | | | | | | | | | | |
| One-time enhancement of the Climate Action Tax Credit | | | 500 | | | | - | | | | - | | | | (20 | ) | | | 480 | |
| Other refundable tax credits | | | (86 | ) | | | 31 | | | | 236 | | | | 11 | | | | 192 | |
| Other expense changes – mainly favourable impacts of prior year liability | | | 88 | | | | (15 | ) | | | (97 | ) | | | (45 | ) | | | (69 | ) |
| Spending funded by third party recoveries – mainly Safe Return to Class funding from the federal government | | | (30 | ) | | | 310 | | | | (90 | ) | | | 222 | | | | 412 | |
| Changes in spending profile of service delivery agencies: | | | | | | | | | | | | | | | | | | | | |
| School districts | | | 152 | | | | 214 | | | | 89 | | | | (452 | ) | | | 3 | |
| Universities | | | (61 | ) | | | (14 | ) | | | (14 | ) | | | (96 | ) | | | (185 | ) |
| Colleges | | | (23 | ) | | | 2 | | | | 13 | | | | (25 | ) | | | (33 | ) |
| Health authorities and hospital societies | | | 229 | | | | 1,137 | | | | 580 | | | | (119 | ) | | | 1,827 | |
| Other service delivery agencies | | | 609 | | | | (165 | ) | | | (75 | ) | | | (28 | ) | | | 341 | |
| (Increase) decrease in transfers to service delivery agencies - accounting elimination | | | (1,281 | ) | | | (1,333 | ) | | | (1,061 | ) | | | (424 | ) | | | (4,099 | ) |
| Total expense changes | | | 7,747 | | | | 2,262 | | | | (956 | ) | | | (1,487 | ) | | | 7,566 | |
| Subtotal | | | (12,319 | ) | | | (851 | ) | | | 4,499 | | | | 2,676 | | | | (5,995 | ) |
| Forecast allowance - (increase) decrease | | | (700 | ) | | | - | | | | 1,000 | | | | - | | | | 300 | |
| Total changes | | | (13,019 | ) | | | (851 | ) | | | 5,499 | | | | 2,676 | | | | (5,695 | ) |
| 2020/21 deficit at the First Quarterly Report | | | (12,792 | ) | | | | | | | | | | | | | | | | |
| 2020/21 deficit at the Fall 2020 Economic & Fiscal Update | | | | | | | (13,643 | ) | | | | | | | | | | | | |
| 2020/21 deficit at the Third Quarterly Report | | | | | | | | | | | (8,144 | ) | | | | | | | | |
| 2020/21 deficit at the Public Accounts | | | | | | | | | | | | | | | (5,468 | ) | | | (5,468 | ) |
| 1 | Includes BC Transportation Financing Authority, BC Transit, BC Housing Management Commission, Community Living BC, and other entities. |
| 30 | 2021 FINANCIAL AND ECONOMIC REVIEW – JULY 2021 | |
| | | |
Part 2 – Financial Review
Expense
In 2020/21, government expenses totalled $67.6 billion, $7.6 billion higher than Budget 2020 and $8.6 billion (14.7 per cent) higher than the previous year.
Chart 2.3 Expense Changes from Budget 2020
Total expense increased by $7.6 billion
$ millions
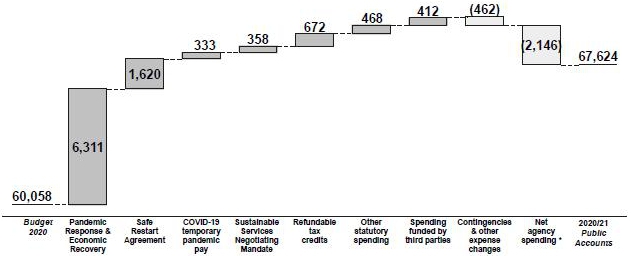
*Net agency spending reflects changes to spending of SUCH sector and other agencies, net of changes to government funding. For details, see table 2.5.1
Consolidated Revenue Fund
Consolidated Revenue Fund (CRF) direct program spending2 (expenses other than grants paid to government agencies) was $5.6 billion higher than Budget 2020. This was mainly due to higher spending related to the COVID-19 pandemic, higher statutory spending and higher spending funded by third parties, partially offset by lower ministry spending and favourable prior year liability adjustments.
Since Budget 2020, the government tabled two Supplementary Estimates to authorize an additional $7 billion to fund COVID-19 pandemic measures, under the new Vote 52 - Contingencies (All Ministries): Pandemic Response and Economic Recovery. During the year, spending in this vote totalled $6.3 billion as shown in the Table 2.5.2.
Government also tabled Supplementary Estimates of $1 billion under the new Vote 53 - Contingencies (All Ministries): Federal and Provincial Pandemic Support to fund the provincial contribution to the following pandemic measures that were cost-shared with the federal government, under the Safe Restart Agreement:
| · | $540 million in grants to BC Transit, TransLink and BC Ferries for transit services; and |
| · | $270 million in restart funding to local governments. |
The federal government equally matched the provincial contribution for these pandemic measures, bringing total spending for the year to $1.62 billion.
| 2 | See Table 2.4 – Total direct program spending. |
| | 2021 FINANCIAL AND ECONOMIC REVIEW – JULY 2021 | 31 |
| | | |
Part 2 – Financial Review
Table 2.5.2 2020/21 Pandemic and Recovery Contingencies (Vote 52)
| | | Actual | |
| ($ millions) | | 2020/21 | |
| Critical Services | | | | |
| Health and mental health | | | 1,722 | |
| Child care services | | | 56 | |
| Temporary housing, meals and supports for vulnerable populations | | | 162 | |
| Essential Services for adults with developmental disabilities, vulnerable children and youth, courts, family justice and victim services, public health communications, Urban Indigenous Service Providers, food security and agriculture worker accommodations | | | 130 | |
| Total Critical Services | | | 2,070 | |
| | | | | |
| Financial Supports | | | | |
| B.C. Recovery Benefit | | | 1,297 | |
| B.C. Emergency Benefit for Workers | | | 643 | |
| Temporary monthly increases and other supports for people in receipt of income and disability assistance including the Crisis Supplement and Recovery Supplement | | | 712 | |
| Temporary Rental Supplement | | | 129 | |
| Canada Emergency Commercial Rent Assistance Program | | | 79 | |
| Emergency financial relief for organizations providing animal care, park operators and community tourism organizations, Domestic Motion Picture providers, local sports organizations, Royal BC Museum and the B.C. Pavilion Corporation | | | 57 | |
| Total Financial Supports | | | 2,917 | |
| | | | | |
| Economic Recovery | | | | |
| Recovery for People - Jobs and Training | | | 348 | |
| Recovery for People - Supports | | | 51 | |
| Recovery for Businesses | | | 218 | |
| Recovery for Communities - Community Infrastructure | | | 355 | |
| Recovery for Communities - Social Supports | | | 134 | |
| Building for a Better Future - Food Security and Farming | | | 30 | |
| Building for a Better Future - Self-Resilience | | | 188 | |
| Total Economic Recovery | | | 1,324 | |
| Total Pandemic Contingencies Spending Measures | | | 6,311 | |
Statutory spending by government during the year totalled $1.83 billion in the following areas:
| · | $672 million for refundable tax credits, including $480 million for the one-time enhancement of the Climate Action Tax Credit; |
| · | $358 million for the signed agreements under the Sustainable Services Negotiating Mandate (Ministry of Finance); |
| · | $333 million for the COVID-19 temporary pandemic pay, a federal-provincial cost-shared initiative (Ministry of Finance); |
| · | $196 million to fund the purchases of hotels to house decamped homeless populations under the Housing Priority Initiatives Special Account (Ministry of Finance); |
| · | $102 million in emergency response, recovery, prevention, and preparedness costs, including $51 million for COVID-19 related expenses, under the Emergency Program Act (Ministry of Public Safety and Solicitor General); |
| 32 | 2021 FINANCIAL AND ECONOMIC REVIEW – JULY 2021 | |
| | | |
Part 2 – Financial Review
| · | $57 million in fire management costs (Ministry of Forests, Lands, Natural Resource Operations and Rural Development); and |
| · | $113 million in other areas, including $50 million for Elections BC. |
Other CRF spending was $475 million lower than Budget 2020 mainly due to unused portion of the Contingencies Vote ($353 million), ministry and other savings ($40 million), and other expense changes ($82 million, including prior period adjustments and interest costs).
Government used the Contingencies Vote as a prudent budgeting tool to fund priority initiatives and manage budget pressures. In 2020/21, $713 million of the $1.066 billion Contingencies Vote was spent on a number of priority initiatives and pressures, including:
| · | $184 million for various treaty and non-treaty agreements with First Nations, including costs under the Indigenous Funding Envelope and the LNG benefits agreement (Ministry of Indigenous Relations and Reconciliation); |
| · | $61 million mainly to support CleanBC initiatives (Ministry of Energy, Mines and Low Carbon Innovation); |
| · | $54 million to fund various public safety program operating pressures and initiatives including corrections, policing and security, Road Safety Initiative, intersection safety cameras and cannabis licensing (Ministry of Public Safety and Solicitor General); |
| · | $52 million mainly to fund CleanBC Program for Industry (Ministry of Environment and Climate Change Strategy); |
| · | $45 million mainly to fund income and disability assistance caseload pressures and provide grants to Community Living BC to support ongoing programs (Ministry of Social Development and Poverty Reduction); |
| · | $41 million to support ongoing operations of various family, children, and youth services (Ministry of Children and Family Development); |
| · | $40 million to support various justice sector program and initiatives including access to justice initiatives, court related costs and the Civil Resolution Tribunal (Ministry of Attorney General); |
| · | $37 million in grants to support local governments for various infrastructure projects (Ministry of Municipal Affairs); |
| · | $32 million to support various initiatives including the BC Salmon Restoration and Innovation Fund and the Greenhouse Carbon Tax Relief Grant program (Ministry of Agriculture, Food, and Fisheries); |
| · | $22 million to support various programs and initiatives including the contaminated site liability, the Big Bar landslide and softwood lumber litigation costs (Ministry of Forests, Lands, Natural Resource Operations and Rural Development); and |
| · | $145 million in other areas. |
| | 2021 FINANCIAL AND ECONOMIC REVIEW – JULY 2021 | 33 |
| | | |
Part 2 – Financial Review
Third party recovered spending relates to program spending funded or co-funded by parties outside of government. In addition to the $810 million contribution from the federal government for pandemic measures as part of Vote 53 discussed earlier, other cost-recovered spending was $412 million higher than Budget 2020 due to:
| · | $242 million higher recoveries from the federal government for the Safe Return to School during the pandemic; |
| · | $160 million higher recoverable health care costs mainly due to PharmaCare costs; |
| · | $119 million net increases in other program areas; offset by |
| · | $109 million lower recoveries from gaming grants due to the closure of gambling facilities during the pandemic. |
The recovered spending changes are offset by an equal net increase in revenue and as a result have no net impact on government’s financial results.
Operating transfers paid to service delivery agencies may change during the fiscal year as ministries make budget allocations, Contingencies Vote access is approved, and government invokes statutory authority. In 2020/21, operating grants to agencies increased by $4.1 billion compared to Budget 2020 primarily due to higher grants to health authorities ($2.8 billion), school districts ($477 million), BC Housing ($490 million) and various other service delivery agencies ($331 million) to support pandemic related services.
Service Delivery Agency Spending
Service delivery agency spending was $1.953 billion higher than Budget 2020, made up of the following:
| · | School districts’ spending was $3 million higher than Budget 2020 due to increased spending for health and safety measures for safe return to class during the pandemic partially offset by savings in operating costs as a result of provincial health orders to close schools. |
| · | Post-secondary institutions spending was $218 million lower than Budget 2020 due to lower operating costs during the pandemic as a result of provincial health orders to move classes online. The lower spending is partly offset by lower student-related tuition and auxiliary revenues. |
| · | Health authority and hospital society spending was $1.827 billion higher than Budget 2020 mainly due to increased staffing, operating, and supply costs associated with the ongoing pandemic. These costs included the addition of contract tracing staff, overtime for existing staff, costs associated with the rollout of the COVID-19 vaccination, costs associated with health authority staff that had to self-isolate and higher input costs for supplies such as personal protective equipment. |
| · | Spending in other service delivery agencies was $341 million higher than Budget 2020 mainly due to increased spending by the BC Housing Management Commission ($307 million) to provide temporary housing, meal and health supports for vulnerable populations and the Temporary Rental Supplement program during the pandemic, and a net increase in spending by other service delivery agencies ($34 million). |
A detailed review of the above changes by quarter is available in Table 2.5.1. Further information on 2020/21 spending by function is provided in Appendix Table A2.6.
| 34 | 2021 FINANCIAL AND ECONOMIC REVIEW – JULY 2021 | |
| | | |
Part 2 – Financial Review
Provincial Capital Spending
In 2020/21, capital spending totalled $8.9 billion, which was comprised of $5.4 billion for taxpayer-supported infrastructure and $3.5 billion for the self-supported infrastructure of commercial Crown corporations and agencies.
Direct spending on health and education facilities, social housing, and government capital projects (i.e. government ministry infrastructure, including IT systems, courthouses and correctional institutions) represented 45 per cent of total capital spending in 2020/21.
Spending on highways and public transportation is also taxpayer-supported and reflects government’s transportation and transit investment plans. Transportation investments comprised approximately 16 per cent of total capital spending in 2020/21. While this spending is predominantly taxpayer financed, a portion is funded from the federal government and other external sources.
Spending on power generation and transmission projects is the largest single category of capital spending and is entirely self-supported. The spending primarily reflects BC Hydro’s refurbishment and expansion of its generating and transmission assets.
Chart 2.4 Components of Total Capital Spending – 2020/21
Per Cent of Total
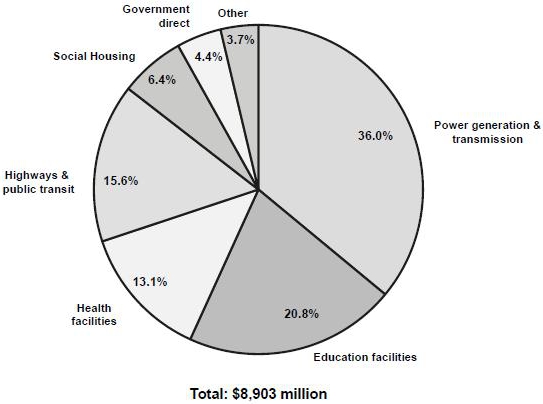
Taxpayer-Supported Capital Spending
In 2020/21, government spending on taxpayer-supported infrastructure was $1.7 billion lower than forecast in Budget 2020.
Education facilities spending, which includes both the K-12 and Post-Secondary sector, was $123 million lower than budget, largely due to timing changes for site acquisitions in the K-12 sector and COVID-19 impacts on projects in the Post-Secondary sector.
| | 2021 FINANCIAL AND ECONOMIC REVIEW – JULY 2021 | 35 |
| | | |
Part 2 – Financial Review
Health facilities spending was $700 million lower than budget primarily due to timing changes associated with major projects including the new Surrey Hospital and Cancer Centre, St. Paul’s Hospital and Royal Columbian Hospital projects. Decreased spending due to unforeseen project delays was partially offset by increased spending for health sector equipment and renovations in response to the COVID-19 pandemic.
Highways and public transit spending was $662 million less than budget, primarily due to schedule changes with the Broadway Subway, Pattullo Bridge replacement and Highway 1 to Chase Creek Road projects, as well as spring freshet damage to the West Fraser Road realignment project.
Social Housing, Ministry and Other spending was $213 million lower than budget, largely reflecting an extended procurement process related to the Nanaimo Correctional Centre, pausing of a core government IT refresh and timing of maintenance and acquisition of core government assets.
The above scheduling and cash flow changes do not represent a reduction in capital spending; rather the spending has been shifted to future years within the provincial capital plan.
Table 2.6 Capital Spending
| | | Budget | | | Actual | | | Actual | |
| ($ millions) | | 2020 | | | 2020/21 | | | 2019/20 | |
| Taxpayer-supported | | | | | | | | | | | | |
| Education facilities | | | 1,971 | | | | 1,848 | | | | 1,813 | |
| Health facilities | | | 1,862 | | | | 1,162 | | | | 1,009 | |
| Highways and public transit | | | 2,054 | | | | 1,392 | | | | 1,028 | |
| Social Housing | | | 578 | | | | 572 | | | | 355 | |
| Government direct (ministries) | | | 569 | | | | 389 | | | | 520 | |
| Other | | | 92 | | | | 65 | | | | 47 | |
| Total taxpayer-supported | | | 7,126 | | | | 5,428 | | | | 4,772 | |
| Self-supported commercial | | | | | | | | | | | | |
| Power generation and transmission | | | 3,106 | | | | 3,214 | | | | 4,076 | |
| Other | | | 303 | | | | 261 | | | | 310 | |
| Total self-supported | | | 3,409 | | | | 3,475 | | | | 4,386 | |
| Total capital spending | | | 10,535 | | | | 8,903 | | | | 9,158 | |
Self-Supported Capital Spending
Self-supported commercial Crown corporation and agency spending on capital projects in 2020/21 was $66 million higher than the Budget 2020 primarily due to $108 million increase by BC Hydro.
Further details on capital spending are provided in Appendix Table A2.9.
| 36 | 2021 FINANCIAL AND ECONOMIC REVIEW – JULY 2021 | |
| | | |
Part 2 – Financial Review
Chart 2.5 Capital Spending Changes from Budget 2020
Total spending lower by $1,632 million
$ millions
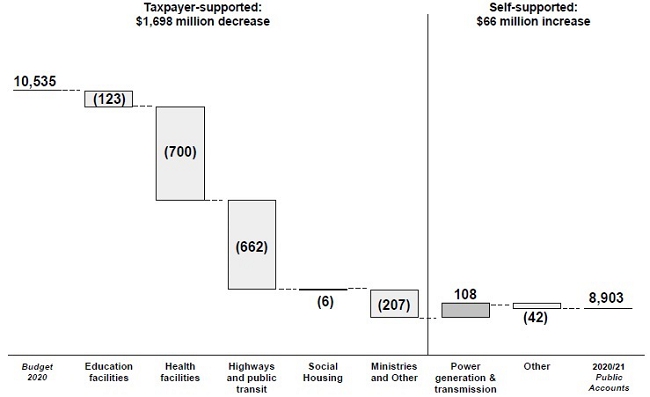
Major Capital Projects
Significant capital projects (those with multi-year budgets totaling $50 million or more) are shown in Table 2.7. Investments in these larger projects will provide long-term social and economic benefits for the province.
As projects are completed, or new ones receive approval, the projects are removed from or added to the $50 million table.
During the 2020/21 fiscal year, the following projects were removed:
| · | R.E. Mountain Secondary (Willoughby Slope); |
| · | University of British Columbia – Undergraduate Life Science Teaching Laboratories Redevelopment project; |
| · | North Island Hospitals project; |
| · | Queen Charlotte/Haida Gwaii Hospital; |
| · | Vancouver General Hospital – Joseph and Rosalie Segal Family Health Centre project; |
| · | Highway 1 Admirals Road/McKenzie Avenue Interchange project; |
| · | Highway 7 Corridor Improvements project; |
| · | Highway 97 Stone Creek to Williams Road project; |
| · | Highway 97 Williams Lake Indian Reserve to Lexington Road project; |
| · | BC Liquor Distribution Branch warehouse project; and |
| · | BC Hydro projects, including: Cheakamus unit 1 and 2 generator replacement; Kamloops substation; and Ruskin Dam safety and powerhouse upgrade. |
| | 2021 FINANCIAL AND ECONOMIC REVIEW – JULY 2021 | 37 |
| | | |
Part 2 – Financial Review
The following projects were added to the $50 million table during the fiscal year:
| · | British Columbia Institute of Technology – Student Housing ($114 million); |
| · | Okanagan College – Student Housing ($68 million); |
| · | Cowichan District Hospital ($887 million); |
| · | Dawson Creek and District Hospital ($378 million); |
| · | New Surrey Hospital and Cancer Centre ($1.66 billion); |
| · | Richmond Hospital ($861 million); |
| · | Royal BC Museum – Collections and Research Building ($224 million); |
| · | Highway 4 Kennedy Hill Safety Improvements ($54 million); and |
| · | BC Hydro projects, including: 5L063 Telkwa relocation project ($66 million) and Mica modernize controls project ($56 million). |
Financing Capital Spending
Provincial capital infrastructure spending is financed through a combination of sources:
| · | borrowing (debt financing); |
| · | operating cash flows (i.e. cash derived from the operating surplus and management of operating accounts); |
| · | partnerships with the private sector (public-private partnerships or P3s); and |
| · | cost-sharing with partners. |
Chart 2.6 shows that 88 per cent of 2020/21 taxpayer-supported capital spending was financed from direct net borrowing and 5 per cent from federal contributions. Other contributions accounted for 7 per cent of the financing.
Self-supported commercial Crown and agency capital spending of $3.5 billion was financed 40 per cent from direct net borrowing ($1.4 billion), and 60 per cent from operating cash flows ($2.1 billion).
Chart 2.6 Financing Taxpayer-Supported Capital Spending
Total taxpayer-supported capital spending: $5,428 million
$ millions
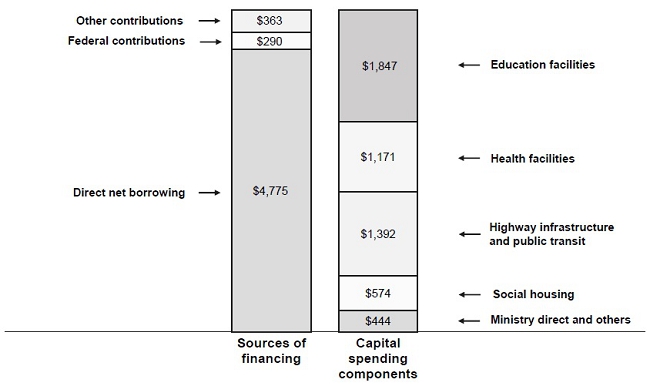
| 38 | 2021 FINANCIAL AND ECONOMIC REVIEW – JULY 2021 | |
| | | |
Part 2 – Financial Review
Table 2.7 Capital Expenditure Projects Greater Than $50 million 1
| | | | | | Project | | | Estimated | | | Anticipated | | | Project Financing | |
| | | Year of | | | Cost to | | | Cost to | | | Total | | | Internal/ | | | P3 | | | Federal | | | Other | |
| ($ millions) | | Completion | | | Mar. 31, 2021 | | | Complete | | | Cost | | | Borrowing | | | Liability | | | Gov’t | | | Contrib’ns | |
| | | | | | | | | | | | | | | | | | | | | | | | | |
| | | | | | Taxpayer-supported | | | | | | | | | | | | | | | | |
| Schools | | | | | | | | | | | | | | | | | | | | | | | | |
| Centennial Secondary 2 | | | 2017 | | | | 58 | | | | 3 | | | | 61 | | | | 61 | | | | - | | | | - | | | | - | |
| Argyle Secondary2 | | | 2021 | | | | 62 | | | | - | | | | 62 | | | | 50 | | | | - | | | | - | | | | 12 | |
| Grandview Heights Secondary | | | 2021 | | | | 65 | | | | 18 | | | | 83 | | | | 63 | | | | - | | | | - | | | | 20 | |
| New Westminster Secondary | | | 2021 | | | | 89 | | | | 18 | | | | 107 | | | | 107 | | | | - | | | | - | | | | - | |
| Burnaby North Secondary | | | 2022 | | | | 24 | | | | 84 | | | | 108 | | | | 99 | | | | - | | | | - | | | | 9 | |
| Handsworth Secondary | | | 2022 | | | | 42 | | | | 27 | | | | 69 | | | | 69 | | | | - | | | | - | | | | - | |
| Pexsisen Elementary and | | | | | | | | | | | | | | | | | | | | | | | | | | | | | | | | |
| Centre Mountain Lellum Middle | | | 2022 | | | | 25 | | | | 64 | | | | 89 | | | | 89 | | | | - | | | | - | | | | - | |
| Quesnel Junior School | | | 2022 | | | | 8 | | | | 44 | | | | 52 | | | | 52 | | | | - | | | | - | | | | - | |
| Sheffield Elementary | | | 2022 | | | | 6 | | | | 46 | | | | 52 | | | | 47 | | | | - | | | | - | | | | 5 | |
| Stitó:s Lá:lém totí:lt Elementary Middle School3 | | | 2022 | | | | 25 | | | | 29 | | | | 54 | | | | 49 | | | | | | | | | | | | 5 | |
| Eric Hamber Secondary | | | 2023 | | | | 14 | | | | 92 | | | | 106 | | | | 94 | | | | - | | | | - | | | | 12 | |
| Victoria High School | | | 2023 | | | | 16 | | | | 64 | | | | 80 | | | | 77 | | | | - | | | | - | | | | 3 | |
| Cowichan Secondary | | | 2024 | | | | 3 | | | | 79 | | | | 82 | | | | 80 | | | | | | | | | | | | 2 | |
| Seismic mitigation program 4 | | | 2030 | | | | 763 | | | | 1,263 | | | | 2,026 | | | | 2,026 | | | | - | | | | - | | | | - | |
| Total schools | | | | | | | 1,200 | | | | 1,831 | | | | 3,031 | | | | 2,963 | | | | - | | | | - | | | | 68 | |
| Post-secondary institutions | | | | | | | | | | | | | | | | | | | | | | | | | | | | | | | | |
| | | | | | | | | | | | | | | | | | | | | | | | | | | | | | | | |
| Simon Fraser University – Energy Systems Engineering Building 2,5 | | | 2019 | | | | 124 | | | | 2 | | | | 126 | | | | 45 | | | | - | | | | 45 | | | | 36 | |
| British Columbia Institute of Technology – Health Sciences Centre for Advanced Simulation | | | 2022 | | | | 44 | | | | 44 | | | | 88 | | | | 66 | | | | - | | | | - | | | | 22 | |
| Simon Fraser University – Student Housing | | | 2022 | | | | 25 | | | | 79 | | | | 104 | | | | 73 | | | | - | | | | - | | | | 31 | |
| Okanagan College – Student Housing | | | 2023 | | | | - | | | | 68 | | | | 68 | | | | 67 | | | | - | | | | - | | | | 1 | |
| University of Victoria – Student Housing | | | 2023 | | | | 60 | | | | 172 | | | | 232 | | | | 128 | | | | - | | | | - | | | | 104 | |
| British Columbia Institute of Technology – Student Housing | | | 2024 | | | | - | | | | 114 | | | | 114 | | | | 108 | | | | - | | | | - | | | | 6 | |
| Total post-secondary institutions | | | | | | | 253 | | | | 479 | | | | 732 | | | | 487 | | | | - | | | | 45 | | | | 200 | |
| Health facilities | | | | | | | | | | | | | | | | | | | | | | | | | | | | | | | | |
| Royal Inland Hospital Patient Care Tower | | | | | | | | | | | | | | | | | | | | | | | | | | | | | | | | |
| – Direct procurement | | | 2025 | | | | 20 | | | | 109 | | | | 129 | | | | 39 | | | | - | | | | - | | | | 90 | |
| – P3 contract | | | 2022 | | | | 233 | | | | 55 | | | | 288 | | | | - | | | | 164 | | | | - | | | | 124 | |
| Vancouver General Hospital – Operating Rooms Renewal – Phase 16 | | | 2021 | | | | 93 | | | | 9 | | | | 102 | | | | 35 | | | | - | | | | - | | | | 67 | |
| Interior Heart and Surgical Centre2 – Direct procurement | | | 2018 | | | | 176 | | | | - | | | | 176 | | | | 152 | | | | - | | | | - | | | | 24 | |
| – P3 contract | | | 2015 | | | | 133 | | | | - | | | | 133 | | | | 4 | | | | 79 | | | | - | | | | 50 | |
| Children’s and Women’s Hospital 2 – Direct procurement | | | 2020 | | | | 289 | | | | 9 | | | | 298 | | | | 168 | | | | - | | | | - | | | | 130 | |
| – P3 contract | | | 2018 | | | | 368 | | | | - | | | | 368 | | | | 167 | | | | 187 | | | | - | | | | 14 | |
| Penticton Regional Hospital - Patient Care Tower | | | | | | | | | | | | | | | | | | | | | | | | | | | | | | | | |
| – Direct procurement | | | 2022 | | | | 51 | | | | 25 | | | | 76 | | | | 18 | | | | - | | | | - | | | | 58 | |
| – P3 contract | | | 2019 | | | | 232 | | | | - | | | | 232 | | | | - | | | | 139 | | | | - | | | | 93 | |
| Royal Columbian Hospital – Phase 12 | | | 2020 | | | | 245 | | | | 6 | | | | 251 | | | | 242 | | | | - | | | | - | | | | 9 | |
| Royal Columbian Hospital – Phases 2 & 3 | | | 2026 | | | | 100 | | | | 1,144 | | | | 1,244 | | | | 1,182 | | | | - | | | | - | | | | 62 | |
| Peace Arch Hospital Renewal | | | 2022 | | | | 59 | | | | 32 | | | | 91 | | | | 8 | | | | - | | | | - | | | | 83 | |
| Red Fish Healing Centre for Mental Health and Addiction – θəqiʔ ɫəwʔənəq leləm | | | 2021 | | | | 117 | | | | 14 | | | | 131 | | | | 131 | | | | - | | | | - | | | | - | |
| Dogwood Complex Residential Care | | | 2022 | | | | 11 | | | | 47 | | | | 58 | | | | - | | | | - | | | | - | | | | 58 | |
| Lions Gate Hospital – New Acute Care Facility | | | 2024 | | | | 4 | | | | 306 | | | | 310 | | | | 144 | | | | - | | | | - | | | | 166 | |
| St Paul’s Hospital | | | 2027 | | | | 13 | | | | 2,161 | | | | 2,174 | | | | 1,327 | | | | - | | | | - | | | | 847 | |
| Health facilities continued on the next page | | | | | | | | | | | | | | | | | | | | | | | | | | | | | | | | |
Þ
| | 2021 FINANCIAL AND ECONOMIC REVIEW – JULY 2021 | 39 |
| | | |
Part 2 – Financial Review
Table 2.7 Capital Expenditure Projects Greater Than $50 million 1 (continued)
| | | | | | Project | | | Estimated | | | Anticipated | | | Project Financing | |
| | | Year of | | | Cost to | | | Cost to | | | Total | | | Internal/ | | | P3 | | | Federal | | | Other | |
| ($ millions) | | Completion | | | Mar. 31, 2021 | | | Complete | | | Cost | | | Borrowing | | | Liability | | | Gov’t | | | Contrib’ns | |
| Health facilities continued | | | | | | | | | | | | | | | | | | | | | | | | | | | | | | | | |
| Mills Memorial Hospital | | | 2026 | | | | 28 | | | | 595 | | | | 623 | | | | 513 | | | | - | | | | - | | | | 110 | |
| Burnaby Hospital Redevelopment - Phase 1 7 | | | 2027 | | | | 5 | | | | 607 | | | | 612 | | | | 578 | | | | - | | | | - | | | | 34 | |
| Cariboo Memorial Hospital | | | 2026 | | | | 2 | | | | 216 | | | | 218 | | | | 131 | | | | - | | | | - | | | | 87 | |
| Stuart Lake Hospital | | | 2024 | | | | 3 | | | | 113 | | | | 116 | | | | 98 | | | | - | | | | - | | | | 18 | |
| Cowichan District Hospital | | | 2026 | | | | 10 | | | | 877 | | | | 887 | | | | 605 | | | | - | | | | - | | | | 282 | |
| Dawson Creek & District Hospital | | | 2026 | | | | 1 | | | | 377 | | | | 378 | | | | 247 | | | | - | | | | - | | | | 131 | |
| New Surrey Hospital and Cancer Centre | | | 2027 | | | | - | | | | 1,660 | | | | 1,660 | | | | 1,660 | | | | - | | | | - | | | | - | |
| Richmond Hospital | | | 2031 | | | | - | | | | 861 | | | | 861 | | | | 791 | | | | - | | | | - | | | | 70 | |
| Clinical and Systems Transformation | | | 2025 | | | | 528 | | | | 175 | | | | 703 | | | | 702 | | | | - | | | | - | | | | 1 | |
| iHealth Project – Vancouver Island Health Authority | | | 2025 | | | | 105 | | | | 50 | | | | 155 | | | | 55 | | | | - | | | | - | | | | 100 | |
| Total health facilities | | | | | | | 2,826 | | | | 9,448 | | | | 12,274 | | | | 8,997 | | | | 569 | | | | - | | | | 2,708 | |
| Transportation | | | | | | | | | | | | | | | | | | | | | | | | | | | | | | | | |
| Highway 91 Alex Fraser Bridge Capacity Improvements 2 | | | 2019 | | | | 66 | | | | 4 | | | | 70 | | | | 37 | | | | - | | | | 33 | | | | - | |
| Highway 1 widening and 216th Street Interchange 2 | | | 2020 | | | | 60 | | | | 2 | | | | 62 | | | | 28 | | | | - | | | | 22 | | | | 12 | |
| Highway 1 Illecillewaet Four-Laning and Brake Check improvements | | | 2021 | | | | 41 | | | | 44 | | | | 85 | | | | 69 | | | | - | | | | 16 | | | | - | |
| Highway 1 Lower Lynn Corridor improvements | | | 2021 | | | | 164 | | | | 34 | | | | 198 | | | | 77 | | | | - | | | | 66 | | | | 55 | |
| Highway 99 10-Mile Slide | | | 2021 | | | | 53 | | | | 31 | | | | 84 | | | | 84 | | | | - | | | | - | | | | - | |
| Highway 4 Kennedy Hill Safety Improvements | | | 2022 | | | | 32 | | | | 22 | | | | 54 | | | | 40 | | | | - | | | | 14 | | | | - | |
| Highway 14 Corridor improvements | | | 2022 | | | | 22 | | | | 55 | | | | 77 | | | | 48 | | | | - | | | | 29 | | | | - | |
| Highway 1 Chase Four-Laning | | | 2023 | | | | 40 | | | | 180 | | | | 220 | | | | 208 | | | | - | | | | 12 | | | | - | |
| Highway 1 Quartz Creek Bridge Replacement | | | 2023 | | | | 11 | | | | 110 | | | | 121 | | | | 71 | | | | - | | | | 50 | | | | - | |
| Highway 1 RW Bruhn Bridge | | | 2023 | | | | 25 | | | | 200 | | | | 225 | | | | 134 | | | | - | | | | 91 | | | | - | |
| Highway 1 Salmon Arm West | | | 2023 | | | | 50 | | | | 105 | | | | 155 | | | | 124 | | | | - | | | | 31 | | | | - | |
| Highway 91 to Highway 17 and Deltaport Way Corridor improvements | | | 2023 | | | | 115 | | | | 145 | | | | 260 | | | | 87 | | | | - | | | | 82 | | | | 91 | |
| Kootenay Lake ferry service upgrade | | | 2023 | | | | 15 | | | | 70 | | | | 85 | | | | 68 | | | | - | | | | 17 | | | | - | |
| West Fraser Road Realignment | | | 2023 | | | | 9 | | | | 94 | | | | 103 | | | | 103 | | | | - | | | | - | | | | - | |
| Highway 1 216th - 264th Street widening | | | 2024 | | | | 16 | | | | 219 | | | | 235 | | | | 99 | | | | - | | | | 109 | | | | 27 | |
| Highway 1 Kicking Horse Canyon Phase 4 8 | | | 2024 | | | | 131 | | | | 470 | | | | 601 | | | | 386 | | | | - | | | | 215 | | | | - | |
| Pattullo Bridge Replacement 9 | | | 2024 | | | | 295 | | | | 1,082 | | | | 1,377 | | | | 1,076 | | | | 301 | | | | - | | | | - | |
| Broadway Subway10 | | | 2025 | | | | 419 | | | | 2,408 | | | | 2,827 | | | | 1,380 | | | | 450 | | | | 897 | | | | 100 | |
| Total transportation | | | | | | | 1,564 | | | | 5,275 | | | | 6,839 | | | | 4,119 | | | | 751 | | | | 1,684 | | | | 285 | |
| Other taxpayer-supported | | | | | | | | | | | | | | | | | | | | | | | | | | | | | | | | |
| Abbotsford courthouse2 | | | | | | | | | | | | | | | | | | | | | | | | | | | | | | | | |
| – Direct procurement | | | 2020 | | | | 16 | | | | - | | | | 16 | | | | 16 | | | | - | | | | - | | | | - | |
| – P3 contract | | | 2020 | | | | 134 | | | | - | | | | 134 | | | | 48 | | | | 80 | | | | - | | | | 6 | |
| Nanaimo Correctional Centre Replacement | | | 2024 | | | | 15 | | | | 152 | | | | 167 | | | | 167 | | | | - | | | | - | | | | - | |
| 6585 Sussex Ave (Affordable Rental Housing) | | | 2022 | | | | 35 | | | | 40 | | | | 75 | | | | 43 | | | | - | | | | - | | | | 32 | |
| Stanley New Fountain Hotel (Affordable Rental Housing) | | | 2022 | | | | 31 | | | | 38 | | | | 69 | | | | 19 | | | | - | | | | - | | | | 50 | |
| Clark & 1st Ave (Affordable Rental Housing) | | | 2024 | | | | 5 | | | | 104 | | | | 109 | | | | 75 | | | | - | | | | - | | | | 34 | |
| Royal BC Museum – Collections and Research Building | | | 2025 | | | | 12 | | | | 212 | | | | 224 | | | | 224 | | | | - | | | | - | | | | - | |
| Total other | | | | | | | 248 | | | | 546 | | | | 794 | | | | 592 | | | | 80 | | | | - | | | | 122 | |
| Total taxpayer-supported | | | | | | | 6,091 | | | | 17,579 | | | | 23,670 | | | | 17,158 | | | | 1,400 | | | | 1,729 | | | | 3,383 | |
| | | | | | | | | | | | | | | | | | | | | | | | | | | | | | | | Þ | |
| 40 | 2021 FINANCIAL AND ECONOMIC REVIEW – JULY 2021 | |
| | | |
Part 2 – Financial Review
Table 2.7 Capital Expenditure Projects Greater Than $50 million 1 (continued)
| | | | | | Project | | | Estimated | | | Anticipated | | | | | | Project Financing | |
| | | Year of | | | Cost to | | | Cost to | | | Total | | | Internal/ | | | P3 | | | Federal | | | Other | |
| ($ millions) | | Completion | | | Mar. 31, 2021 | | | Complete | | | Cost | | | Borrowing | | | Liability | | | Gov’t | | | Contrib’ns | |
| Power generation and transmission | | | | | | | | | | | | | | | | | | | | | | | | | | | | | | | | |
| BC Hydro | | | | | | | | | | | | | | | | | | | | | | | | | | | | | | | | |
| –Horne Payne substation upgrade project 2 | | | 2019 | | | | 72 | | | | - | | | | 72 | | | | 72 | | | | - | | | | - | | | | - | |
| –John Hart generating station replacement 2 | | | 2019 | | | | 978 | | | | 1 | | | | 979 | | | | 979 | | | | - | | | | - | | | | - | |
| –Bridge River 2 units 5 and 6 upgrade project 2 | | | 2019 | | | | 73 | | | | 1 | | | | 74 | | | | 74 | | | | - | | | | - | | | | - | |
| –South Fraser transmission relocation project 11 | | | TBD | | | | 30 | | | | 46 | | | | 76 | | | | 76 | | | | - | | | | - | | | | - | |
| –Supply Chain Applications project 2 | | | 2020 | | | | 68 | | | | 1 | | | | 69 | | | | 69 | | | | - | | | | - | | | | - | |
| –Fort St. John and Taylor Electric Supply 2 | | | 2020 | | | | 51 | | | | 1 | | | | 52 | | | | 52 | | | | - | | | | - | | | | - | |
| –UBC load increase stage 2 project 2 | | | 2020 | | | | 50 | | | | 5 | | | | 55 | | | | 55 | | | | - | | | | - | | | | - | |
| – Downtown Vancouver Electricity Supply: West End strategic property purchase | | | 2021 | | | | 68 | | | | 13 | | | | 81 | | | | 81 | | | | - | | | | - | | | | - | |
| –Peace Region Electricity Supply (PRES) project 12 | | | 2021 | | | | 202 | | | | 83 | | | | 285 | | | | 285 | | | | - | | | | TBD | | | | - | |
| – LNG Canada load interconnection project | | | 2021 | | | | 69 | | | | 13 | | | | 82 | | | | 58 | | | | - | | | | - | | | | 24 | |
| – Bridge River 2 upgrade units 7 and 8 project | | | 2021 | | | | 63 | | | | 22 | | | | 85 | | | | 85 | | | | - | | | | - | | | | - | |
| – Wahleach refurbish generator project | | | 2022 | | | | 28 | | | | 23 | | | | 51 | | | | 51 | | | | - | | | | - | | | | - | |
| – Mica replace units 1 to 4 generator transformers project | | | 2022 | | | | 48 | | | | 32 | | | | 80 | | | | 80 | | | | - | | | | - | | | | - | |
| – G.M. Shrum G1 to 10 control system upgrade | | | 2022 | | | | 53 | | | | 22 | | | | 75 | | | | 75 | | | | - | | | | - | | | | - | |
| – Mount Lehman substation upgrade project | | | 2023 | | | | 27 | | | | 32 | | | | 59 | | | | 59 | | | | - | | | | - | | | | - | |
| – Street light replacement program | | | 2023 | | | | 8 | | | | 67 | | | | 75 | | | | 75 | | | | - | | | | - | | | | - | |
| – 5L063 Telkwa relocation project | | | 2023 | | | | 16 | | | | 50 | | | | 66 | | | | 66 | | | | - | | | | - | | | | - | |
| – Mica modernize controls project | | | 2023 | | | | 30 | | | | 26 | | | | 56 | | | | 56 | | | | - | | | | - | | | | - | |
| – Capilano substation upgrade project | | | 2024 | | | | 14 | | | | 73 | | | | 87 | | | | 87 | | | | - | | | | - | | | | - | |
| – Sperling substation (SPG) metalclad switchgear replacement project | | | 2024 | | | | 6 | | | | 48 | | | | 54 | | | | 54 | | | | - | | | | - | | | | - | |
| –Site C project 13 | | | 2025 | | | | 6,867 | | | | 9,133 | | | | 16,000 | | | | 16,000 | | | | - | | | | - | | | | - | |
| Total power generation and transmission | | | | | | | 8,821 | | | | 9,692 | | | | 18,513 | | | | 18,489 | | | | - | | | | - | | | | 24 | |
| Other self-supported | | | | | | | | | | | | | | | | | | | | | | | | | | | | | | | | |
| Enhanced Care Coverage Program (ICBC) | | | 2022 | | | | 77 | | | | 22 | | | | 99 | | | | 99 | | | | - | | | | - | | | | - | |
| Total self-supported | | | | | | | 8,898 | | | | 9,714 | | | | 18,612 | | | | 18,588 | | | | - | | | | - | | | | 24 | |
| Total $50 million projects | | | | | | | 14,989 | | | | 27,293 | | | | 42,282 | | | | 35,746 | | | | 1,400 | | | | 1,729 | | | | 3,407 | |
| 1 | Only projects that receive provincial funding and have been approved by Treasury Board and/or Crown corporation boards are included in this table. Ministry service plans may highlight projects that still require final approval. Capital costs reflect current government accounting policy. |
| 2 | Assets have been put into service and only trailing costs remain. |
| 3 | Formerly reported as Stitos Elementary Middle |
| 4 | The Seismic Mitigation Program consists of all spending to date on Phase 2 of the program and may include spending on projects greater than $50 million included in the table above. |
| 5 | Simon Fraser University and private donors contributed $26 million toward the project, and the university also contributed land valued at $10 million. |
| 6 | Formerly reported as Vancouver General Hospital – Jim Pattison Pavilion Operating Rooms |
| 7 | The concept plan for Phase 2 of the Burnaby Hospital Redevelopment has been approved. Financial information will be added to the table upon business case approval. |
| 8 | Kicking Horse Canyon Project costs exclude $11 million of past planning costs which are expensed. |
| 9 | Pattullo Bridge forecasted to open to the public in 2024 with old bridge decommissioning to follow. Forecasted amount reflects total expenditures including capitalized and expensed items. |
| 10 | The Broadway Subway Project forecast and value of costs incurred to date include the City of Vancouver in-kind contribution of land rights, in keeping with the approved project budget. Under current government accounting, purchased intangible assets are given accounting recognition, and contributed intangible assets, such as land use rights or licenses are not. |
| 11 | Construction work on the South Fraser transmission relocation project is currently suspended pending the government's review of the George Massey Tunnel replacement. |
| 12 | The total cost represents the gross cost of the project and has not been netted for Federal Government contributions. The Federal Government's contribution amount is dependent on the final actual project costs and what costs are eligible under the agreement. |
| 13 | As announced on February 26, 2021, the cost of the Site C project is estimated at $16 billion, with a one year delay to 2025 for the project in-service date. BC Hydro continues to review the updated cost estimate, along with risks, further to recommendations in the Milburn Report. Site C project total anticipated cost and project cost to date include capital costs, charges subject to regulatory deferral and certain operating expenditures. |
| | 2021 Financial and Economic Review – July 2021 | 41 |
| | | |
Part 2 – Financial Review
Provincial Debt
As at March 31, 2021, total provincial debt was $87.1 billion — 29.5 per cent of B.C.’s nominal GDP. This is an increase of $14.9 billion over the year, out of which $6.2 billion relates to capital spending and $8.7 billion to finance government’s operating deficit and other operating requirements. About 31 per cent of the total debt is self-supported through the activities of commercial Crown corporations.
The taxpayer-supported debt-to-GDP ratio, a measure often used by investors and credit rating agencies to analyze a government’s ability to manage its debt load, stood at 20.2 per cent. This is higher by 5.2 percentage points from 2019/20 and is 4.7 percentage points higher than forecast in Budget 2020. The debt-to-revenue ratio was 101.2 per cent, 17.1 percentage points higher than Budget 2020 and an increase of 20.6 percentage points from 2019/20.
Table 2.8 Provincial Debt Summary 1
| | | | | | | Opening | | | Updated | | | | | | | |
| | | | Budget | | | Balance | | | Budget | | | Actual | | | Actual | |
| | ($ millions) | | 2020 | | | Adjustment 2 | | | 2020 | | | 2020/21 | | | 2019/20 | |
| | Taxpayer-supported debt | | | | | | | | | | | | | | | | | | | | |
| | Provincial government direct operating | | | | | | | | | | | | | | | 8,746 | | | | | |
| | Education facilities | | | 15,135 | | | | 882 | | | | 16,017 | | | | 16,861 | | | | 15,445 | |
| | Health facilities | | | 8,750 | | | | 374 | | | | 9,124 | | | | 9,359 | | | | 8,507 | |
| | Highways and public transit | | | 19,069 | | | | 478 | | | | 19,547 | | | | 18,782 | | | | 17,659 | |
| | Other | | | 6,248 | | | | (74 | ) | | | 6,174 | | | | 6,002 | | | | 4,618 | |
| | Total taxpayer-supported debt | | | 49,202 | | | | 1,660 | | | | 50,862 | | | | 59,750 | | | | 46,229 | |
| | Self-supported debt | | | | | | | | | | | | | | | | | | | | |
| | Power generation and transmission | | | 25,996 | | | | 16 | | | | 26,012 | | | | 26,270 | | | | 24,901 | |
| | Other | | | 894 | | | | 147 | | | | 1,041 | | | | 1,080 | | | | 1,031 | |
| | Total self-supported debt | | | 26,890 | | | | 163 | | | | 27,053 | | | | 27,350 | | | | 25,932 | |
| | Forecast allowance | | | 300 | | | | - | | | | 300 | | | | - | | | | - | |
| | Total provincial debt | | | 76,392 | | | | 1,823 | | | | 78,215 | | | | 87,100 | | | | 72,161 | |
| | Debt to GDP | | | | | | | | | | | | | | | | | | | | |
| | Taxpayer-supported | | | 15.5 | % | | | | | | | 16.0% 3 | | | | 20.2 | % | | | 15.1 | % |
| | Total | | | 24.0 | % | | | | | | | 24.6% 3 | | | | 29.5 | % | | | 23.6 | % |
| 1 | Provincial debt is prepared in accordance with Generally Accepted Accounting Principles and presented consistent with the Debt Summary Report included in the Public Accounts . Debt is shown net of sinking funds and unamortized discounts, excludes accrued interest, and includes non-guaranteed debt directly incurred by commercial Crown corporations and debt guaranteed by the Province. |
| 2 | The opening balance adjustment reflects actual balances at March 31, 2020 (the Budget 2020 projection was based on a forecast for 2019/20). |
| 3 | Revised to reflect Statistics Canada’s Provincial Economic Accounts update released on November 7, 2019. |
Debt for schools, post-secondary institutions and health facilities was largely incurred by government to issue capital grants to SUCH sector organizations for funding their infrastructure. Highways and public transit debt primarily reflects direct borrowing by government-controlled agencies, such as the BC Transportation Financing Authority. Power generation and transmission debt is entirely commercial in nature and is predominantly the debt of BC Hydro. A portion of this debt reflects borrowing for the Columbia Basin power projects managed by Columbia Power Corporation and Columbia Basin Trust.
| 42 | 2021 Financial and Economic Review – July 2021 | |
| | | |
Part 2 – Financial Review
Chart 2.7 Components of Total Provincial Debt - 2020/21
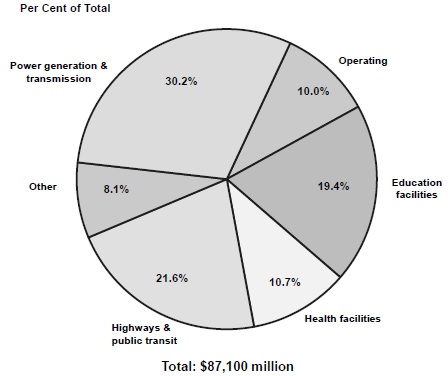
Other debt includes taxpayer-supported borrowing to finance social housing and other government borrowing for direct capital projects such as courthouses. Other debt also includes the self-supported borrowing of the BC Lottery Corporation for gaming equipment and gaming management software, the debt of post-secondary institutions’ commercial subsidiaries, and lease liabilities related to right-of-use3 assets.
Chart 2.8 Change in Ending Debt Level from Budget 2020
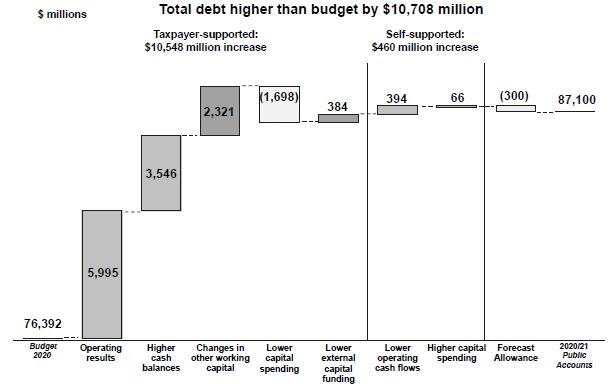
| 3 | In 2019/20 all commercial Crown corporations implemented IFRS 16 Leases. Due to the change in accounting standards, lease liabilities related to right-of-use assets are included as debt. |
| | 2021 Financial and Economic Review – July 2021 | 43 |
| | | |
Part 2 – Financial Review
Total debt was higher by $10.7 billion at year-end compared to the Budget 2020 forecast (see Chart 2.8).
This variance consists of:
| · | $10.5 billion higher taxpayer-supported debt, primarily due to lower operating results of $5.995 billion (excluding the forecast allowance), changes in cash and other working capital balances of $5.9 billion, and $1.3 billion lower net capital spending; |
| · | $460 million increase in self-supported debt due to lower operating cash flows and higher capital spending; and |
| · | $300 million forecast allowance. |
Surplus/Deficit Versus Change In Debt
For the 2020/21 fiscal year, government posted a deficit of $5.468 billion, which included net non-cash items of $52 million (primarily amortization and an adjustment for commercial Crown corporations net income and dividends). Working capital balances increased by $2.573 billion, including higher cash balances at year end to ensure liquidity during the COVID-19 pandemic. Taxpayer-supported capital spending was $5.428 billion. As a result, taxpayer-supported debt increased by $13.5 billion during the fiscal year.
The $1.418 billion increase in self-supported debt primarily reflects $3.48 billion of capital spending mainly for BC Hydro and BCLC, offset by $2.057 billion in net operating cash flows.
Chart 2.9 Reconciliation of Surplus/Deficit to Change In Debt
Year over year increase in debt: $14,939 million

| 44 | 2021 Financial and Economic Review – July 2021 | |
| | | |
Part 2 – Financial Review
Debt Indicators
Table 2.9 provides a summary of financial indicators depicting the province’s debt position, recent borrowing trends and related interest cost burden.
Further details on provincial debt are provided in Appendix Tables A2.10 to A2.12.
Table 2.9 Key Debt Indicators1
| | | Budget | | | Actual | | | Actual | |
| | 2020 | | | 2020/21 | | | 2019/20 | |
| Debt to revenue (per cent) | | | | | | | | | |
| Total provincial | | | 98.8 | | | | 115.1 | | | | 95.9 | |
| Taxpayer-supported | | | 84.1 | | | | 101.2 | | | | 80.6 | |
| Debt per capita ($) 2 | | | | | | | | | | | | |
| Total provincial | | | 14,850 | | | | 16,919 | | | | 14,175 | |
| Taxpayer-supported | | | 9,564 | | | | 11,606 | | | | 9,081 | |
| Debt to GDP (per cent) 3 | | | | | | | | | | | | |
| Total provincial | | | 24.0 | | | | 29.5 | | | | 23.3 | |
| Taxpayer-supported | | | 15.5 | | | | 20.2 | | | | 15.0 | |
| Interest bite (cents per dollar of revenue) 4 | | | | | | | | | | | | |
| Total provincial | | | 3.7 | | | | 3.7 | | | | 3.8 | |
| Taxpayer-supported | | | 3.1 | | | | 3.1 | | | | 3.1 | |
| Interest costs ($ millions) | | | | | | | | | | | | |
| Total provincial | | | 2,828 | | | | 2,817 | | | | 2,872 | |
| Taxpayer-supported | | | 1,819 | | | | 1,832 | | | | 1,807 | |
| Interest rate (per cent) 5 | | | | | | | | | | | | |
| Taxpayer-supported | | | 3.9 | | | | 3.5 | | | | 4.1 | |
| Revenue Factor for Key Indicators ($ millions) | | | | | | | | | | | | |
| Total provincial 6 | | | 77,319 | | | | 75,691 | | | | 75,283 | |
| Taxpayer-supported 7 | | | 58,515 | | | | 59,033 | | | | 57,386 | |
| Total debt ($ millions) | | | | | | | | | | | | |
| Total provincial | | | 76,392 | | | | 87,100 | | | | 72,161 | |
| Taxpayer-supported 8 | | | 49,202 | | | | 59,750 | | | | 46,229 | |
| Provincial GDP ($ millions) 9 | | | 318,068 | | | | 295,282 | | | | 309,059 | |
| Population (thousands at July 1) 10 | | | 5,144 | | | | 5,148 | | | | 5,091 | |
| 1 | Figures for prior year have been restated to conform with the presentation used for 2020/21 and to include the effects of changes in underlying data and statistics. |
| 2 | The ratio of debt to population (e.g. debt at March 31, 2021 divided by population at July 1, 2020). |
| 3 | The ratio of debt outstanding at fiscal year end to provincial nominal gross domestic product (GDP) for the calendar year ending in the fiscal year (e.g. debt at March 31, 2021 divided by 2020 GDP). |
| 4 | The ratio of interest costs (less sinking fund interest) to revenue. Figures include capitalized interest expense in order to provide a more comparable measure to outstanding debt. |
| 5 | Weighted average of all outstanding debt issues. |
| 6 | Includes revenue less earnings related to enterprises (sinking fund earnings, loan interest and net earnings), plus revenue of all enterprises. |
| 7 | Excludes revenues of commercial Crown corporations, but includes dividends paid to the Consolidated Revenue Fund. |
| 8 | Excludes debt of commercial Crown corporations. |
| 9 | Nominal GDP for the calendar year ending in the fiscal year (e.g. GDP for 2020 is used for the fiscal year ended March 31, 2021). As nominal GDP for the calendar year ending in 2020 is not available, the 2020 GDP projected in the April 2021 budget has been used for the fiscal year ended March 31, 2021 for demonstration purposes. |
| 10 | Population at July 1st within the fiscal year (e.g. population at July 1, 2020 is used for the fiscal year ended March 31, 2021). |
| | 2021 Financial and Economic Review – July 2021 | 45 |
| | | |
Part 2 - Financial Review
Credit Rating
A credit rating is an evaluation of the credit risk of a prospective borrower, predicting their ability to pay interest and to repay the debt principal. It impacts the borrower’s debt servicing costs and the investor’s rate of return since an investor will demand a higher interest rate on a higher-risk, lower-rated security. Table 2.10 provides an interprovincial comparison of credit ratings.
Table 2.10 Interprovincial Comparison of Credit Ratings, July 2021
| | | Rating Agency1 |
| | | Moody’s Investors | | | | |
| Province | | Service | | Standard & Poor’s | | DBRS |
| British Columbia | | Aaa | | AA+ | | AA(High) |
| Alberta | | Aa3 | | A | | AA (Low) |
| Saskatchewan | | Aa1 | | AA | | AA (Low) |
| Manitoba | | Aa2 | | A+ | | A (High) |
| Ontario | | Aa3 | | A+ | | AA (Low) |
| Quebec | | Aa2 | | AA- | | AA (Low) |
| New Brunswick | | Aa2 | | A+ | | A (High) |
| Nova Scotia | | Aa2 | | AA- | | A (High) |
| Prince Edward Island | | Aa2 | | A | | A |
| Newfoundland/Labrador | | A1 | | A | | A (Low) |
| 1 | The rating agencies assign letter ratings to borrowers. The major categories, in descending order of credit quality are: AAA/Aaa; AA/Aa; A; BBB/Baa; BB/Ba; and B. The “1”, “2”, “3”, “high”, “low”, “+”, and “-” modifiers show relative standing within the major categories. For example, AA+ exceeds AA and Aa2 exceeds Aa3. |
B.C.’s record in recent years for presenting surplus fiscal outlooks and for meeting annual budget targets has resulted in ratings of Aaa and AA+ from Moody’s and Standard & Poor’s respectively, while DBRS rates the province at AA (high) as of July 2021.
Pension Plans
The province contributes to four defined benefit pension plans (Public Service, Municipal, Teachers’ and College) for many of its employees. These pension plans are managed under joint trusteeship arrangements with the plan members. Under joint trusteeship, the provincial government has no formal claim on plan surpluses or assets; however, government is responsible for 50 per cent of any unfunded liabilities in the Public Service, Teachers’ and College plans, and 35 per cent of any unfunded liability in the Municipal plan since the province’s interest in that plan is only 70 per cent.
As a result, government’s balance sheet only includes its share of any unfunded pension liabilities incurred by the four pension plans under the joint trusteeship arrangements, as well as the entire liability for the MLA Superannuation Account, which is not part of a joint trusteeship arrangement. As at March 31, 2021, all pension plans under joint trusteeship were fully funded.
In the event that a plan is determined to be in a deficit position, the pension boards, by agreement, are required to address the deficit through contribution adjustments or other measures. As a result, it is expected that any unfunded pension liability in the future would be short-term in nature.
| 46 | 2021 Financial and Economic Review – July 2021 | |
| | | |
Part 2 - Financial Review
The pension valuations do not include future indexing of pensions, as this is a non-guaranteed supplemental benefit to the plans that is determined by the amount of available assets in separate inflation accounts. The estimated financial positions of each plan (based on extrapolations of the most recent actuarial valuations) as at March 31, 2021 are shown in Table 2.11.
Table 2.11 Pension Plan Balances
| | | Pension Plan | | | Total | | | | |
| ($ millions) | | Public Service | | | Municipal | | | Teachers | | | College | | | Other 1 | | | 2020/21 | | | 2019/20 | |
| Accrued benefit obligation | | | (22,664 | ) | | | (31,003 | ) | | | (22,429 | ) | | | (4,231 | ) | | | (841 | ) | | | (81,168 | ) | | | (76,436 | ) |
| Pension fund assets | | | 26,113 | | | | 35,334 | | | | 24,065 | | | | 4,723 | | | | 988 | | | | 91,223 | | | | 84,748 | |
| Subtotal | | | 3,449 | | | | 4,331 | | | | 1,636 | | | | 492 | | | | 147 | | | | 10,055 | | | | 8,312 | |
| Unamortized actuarial (gain) loss | | | (1,037 | ) | | | (2,089 | ) | | | (1,326 | ) | | | (273 | ) | | | (36 | ) | | | (4,761 | ) | | | (4,160 | ) |
| Accrued net asset (obligation) | | | 2,412 | | | | 2,242 | | | | 310 | | | | 219 | | | | 111 | | | | 5,294 | | | | 4,152 | |
| 1 | Represents other defined benefit plans, outside of the four main pension plans, which are funded by entities within the government reporting entity. Includes the Retirement Plan for Non-Teaching Employees of the Board of School Trustees of School District No. 43 (Coquitlam), the University of Victoria’s pension plan for employees other than faculty and professional staff, Simon Fraser University’s Academic Pension Plan and Administrative/Union Pension Plan, and the province’s 14.67% interest in the Canadian Blood Services pension plan. |
Actuarial valuations are performed on the pension plans every three years with the resulting reports released nine months after the valuation date. The pension plans and the dates of their last actuarial valuation are:
| · | Public Service Pension Plan, March 31, 2020; |
| · | Municipal Pension Plan, December 31, 2018; |
| · | Teachers’ Pension Plan, December 31, 2017; and |
| · | College Pension Plan, August 31, 2018. |
Key actuarial assumptions used for valuation purposes include a long-term annual rate of return on fund assets (currently 6.00 per cent for the Public Service Pension Plan and Teachers’ Pension Plan, and 6.25 per cent for the Municipal Pension Plan and the College Pension Plan) and the rate of annual salary increases (currently 3.25 per cent).
The pension plans are administered by the BC Pension Corporation in accordance with direction received from the various pension boards. The audited financial statements of each pension plan, along with full descriptions, benefit formulas, inflation assumptions and funding polices may be found on the corporation’s website at www.pensionsbc.ca.
Contractual Rights
Contractual rights represent the annual nominal future cash receipts for multi-year contracts. As at March 31, 2021, taxpayer-supported entities have $9.9 billion in contractual rights, and self-supported Crown corporations and subsidiaries have $6.0 billion in contractual rights, for a total of $15.9 billion in contract receipts over the future years, depending on the terms of the contract.
Contractual rights represent future receipts where the projected revenue has been quantified in an agreement. They are not off-balance sheet assets, nor are they deferred revenues.
| | 2021 FINANCIAL AND ECONOMIC REVIEW – JULY 2021 | 47 |
| | | |
Part 2 - Financial Review
Contractual Obligations
Contractual obligations represent the annual nominal future cash payments for multi-year contracts for the delivery of services and construction of assets — except in the case of P3 contracts, where the obligations related to construction of assets are recognized as liabilities as the assets are constructed.
As at March 31, 2021, taxpayer-supported entities have incurred $46.1 billion in contractual obligations, and self-supported Crown corporations and subsidiaries have incurred $49.3 billion in contractual obligations, for a total of $95.4 billion in contract payments that will be made over the future years, depending on the terms of the contract.
Contractual obligations represent ongoing program costs where the projected expense has been quantified in an agreement. They are not off-balance sheet debt, nor are they unfunded costs. Rather, these annual costs have been incorporated into the overall program budgets of the contracting ministries and other entities similar to other future-oriented government program costs such as legislated entitlements and capital asset amortization. In the case of self-supported Crown corporations and subsidiaries, the payments will be made from future revenue streams.
The 2020/21 Public Accounts Contractual Obligations schedule presents a detailed listing of obligations by function. Taxpayer-supported contractual obligations can also be grouped into eight categories (see Table 2.12) as follows:
| · | Coastal ferry services agreement – annual operating subsidy provided by the Ministry of Transportation and Infrastructure to BC Ferry Services Inc. in support of its smaller routes. |
| · | Capital construction and maintenance P3s – reflect the annual service payments that will be made to maintain the asset and retire the liabilities. |
| · | Provincial policing contracts – annual operating cost of the policing contract with the RCMP (aside from major cities such as Vancouver, which have their own police forces, policing in British Columbia is provided by the RCMP under contract). |
| · | Housing subsidy agreements – annual operating cost of the subsidy agreements between BC Housing Management Commission and cooperative subsidized housing associations. |
Table 2.12 Taxpayer-Supported Contractual Obligations
| ($ millions) | | | 2021/22 | | | | 2022/23 | | | | 2023/24 | | | | 2024/25 | | | | 2025/26 | | | | 2026/27+ | | | | Total | |
| Coastal ferry services agreement | | | 231 | | | | 231 | | | | 231 | | | | 231 | | | | 231 | | | | 8,551 | | | | 9,706 | |
| Capital construction and maintenance P3s | | | 1,337 | | | | 617 | | | | 689 | | | | 620 | | | | 451 | | | | 3,718 | | | | 7,432 | |
| Provincial policing contracts | | | 400 | | | | 398 | | | | 398 | | | | 398 | | | | 398 | | | | 2,388 | | | | 4,380 | |
| Housing subsidy agreements | | | 455 | | | | 356 | | | | 256 | | | | 185 | | | | 168 | | | | 4,276 | | | | 5,696 | |
| Program delivery agreements | | | 2,100 | | | | 332 | | | | 274 | | | | 233 | | | | 225 | | | | 1,584 | | | | 4,748 | |
| Operating and maintenance agreements | | | 849 | | | | 622 | | | | 545 | | | | 503 | | | | 237 | | | | 1,068 | | | | 3,824 | |
| Service delivery agreements | | | 673 | | | | 615 | | | | 528 | | | | 465 | | | | 466 | | | | 1,976 | | | | 4,723 | |
| Capital and economic development agreements | | | 2,564 | | | | 1,471 | | | | 786 | | | | 225 | | | | 128 | | | | 409 | | | | 5,583 | |
| | | | 8,609 | | | | 4,642 | | | | 3,707 | | | | 2,860 | | | | 2,304 | | | | 23,970 | | | | 46,092 | |
| 48 | 2021 Financial and Economic Review – July 2021 | |
| | | |
Part 2 - Financial Review
| · | Program delivery agreements – annual operating cost of agreements with third-party entities that provide services to the public on behalf of government, such as care homes. Some agreements are for one year only. |
| · | Operating and maintenance agreements – annual operating cost of agreements with third-party entities that operate and maintain government infrastructure on behalf of government. A majority of these agreements relate to health sector facilities. |
| · | Service delivery agreements – annual operating cost of agreements with third-party entities that provide services directly to government, such as the Telecommunications Service Master Agreement with Telus. |
| · | Capital and economic development agreements – annual cost of agreements to build infrastructure, such as school district, universities, and British Columbia Transportation Financing Authority’s commitments for future projects. |
Almost all (93 per cent or $45.7 billion) of the contractual obligations for self-supported Crown corporations and subsidiaries are for BC Hydro power purchase agreements with independent power producers (IPPs). This ongoing cost of energy is factored into BC Hydro’s financial statement projections in the fiscal plan, although any contractual increases to the tariffs paid to the IPPs will have to be recovered from future electricity rate increases.
The remaining contractual obligations for self-supported Crown corporations and subsidiaries relate to maintenance and service agreements, whose costs also are factored into government fiscal plan projections.
Subsequent Events
COVID-19 Global Pandemic
On March 18, 2020, the Government of British Columbia declared a state of emergency in response to the COVID-19 global pandemic that continued to be in force until June 30, 2021. To minimize the transmission of the virus, the Provincial Health Officer issued orders directed to all British Columbians and organizations operating in the province. Some actions taken will have an impact on future financial statements.
2020/21 Public Accounts Audit Qualification
The Audit Opinion on the 2020/21 Public Accounts includes one qualification on the longstanding issue on the recognition of restricted contributions.
Deferral of Revenues
The Auditor General recommends reporting restricted contributions as revenue in the period the transfers are received, unless the transfer establishes a financial liability on the part of the recipient. The government has maintained its longstanding recognition of deferring restricted contributions and recognizing revenue in the same period that programs and services are provided to the public. The impact of the recommendation in the current year would be to increase revenue and surplus/(deficit) by $5.98 billion and decrease liabilities by $5.98 billion.
The full text of the Auditor General’s opinion and the comments of the Comptroller General of British Columbia can be found in the 2020/21 Public Accounts.
| | 2021 FINANCIAL AND ECONOMIC REVIEW – JULY 2021 | 49 |
| | | |
| Part 3 |
| |
| Supplementary Information |
| — | General Description of the Province |
| | | |
| — | Constitutional Framework |
| | | |
| — | Provincial Government |
| | | |
| — | Annual Financial Cycle |
| | | |
| — | Government’s Financial Statements |
| | | |
| — | Provincial Taxes |
| 2021 FINANCIAL AND ECONOMIC REVIEW – JULY 2021 | |
| | | |

Part 3 – Supplementary Information
General Description of the Province
British Columbia is located on Canada’s Pacific coast, and has a land and freshwater area of 95 million hectares. It is Canada’s third largest province and comprises 9.5 per cent of the country’s total land area.
Geography
The province is nearly four times the size of Great Britain, 2.5 times larger than Japan and larger than any American state except Alaska. B.C.’s 7,022-kilometre coastline supports a large shipping industry through ice-free, deep-water ports. The province has about 8.5 million hectares of grazing land, 1.8 million hectares of lakes and rivers, and 950,000 hectares of agricultural land that is capable of supporting a wide range of crops.
Physiography
B.C. is characterized by mountainous topography, but also has substantial areas of lowland and plateau country. The province has four basic regions, a northwesterly trending mountain system on the coast, a similar mountain system on the east, and an extensive area of plateau country between the two. The northeastern corner of the province is lowland, a segment of the continent’s Great Plains.
The western system of mountains averages about 300 kilometres in width and extends along the entire B.C. coast and the Alaska panhandle. The Coast Mountains contain some of the tallest peaks in the province. The western system includes the Insular Mountains that form the basis of Vancouver Island and Haida Gwaii (previously known as the Queen Charlotte Islands). These islands help to shelter the waters off the mainland coast of B.C., which form an important transportation route for people and products.
The Interior of the province is a plateau of rolling forest and grassland, 600 to 1,200 metres in average elevation, incised deeply by rivers. North of Prince George the interior becomes mountainous, but plateau terrain returns just south of the Yukon boundary in the area drained by the Liard River. The southern Interior’s water system is dominated by the Fraser River, which has a drainage area covering about one-quarter of the province. The Rocky Mountains, in the eastern mountain system, rise abruptly on the southern B.C.-Alberta boundary and are cut by passes that provide dramatic overland transportation routes into the province. The Rocky Mountain Trench lies immediately to the west of the Rockies. This extensive valley, the longest in North America, is a geological fault zone separating different earth plates. It is the source of many of B.C.’s major rivers, including the Peace, Columbia and Fraser.
Climate and Vegetation
Coastal B.C. has abundant rainfall and mild temperatures associated with a maritime climate. The Pacific coast has an average annual rainfall of between 155 and 440 centimetres, while the more sheltered coasts of eastern Vancouver Island and the mainland along the Strait of Georgia average between 65 and 150 centimetres. Canada’s longest frost-free periods of over 180 days per year are enjoyed along the edges of the coastal zone and inland along the Fraser River valley. Temperatures fall quickly up the steep slopes of the Coast Mountains. The predominant trees in this coastal region are the western hemlock, western red cedar and balsam in the wetter parts, and Douglas fir and grand fir in the drier areas.
| | 2021 FINANCIAL AND ECONOMIC REVIEW – JULY 2021 | 53 |
| | | |
Part 3 – Supplementary Information
B.C.’s Interior region has a mainly continental type of climate, although not as severe as that of the Canadian Prairies. Considerable variation in climate occurs, especially in winter and across the Coast Mountains, as mild Pacific storms bring relief from cold spells. The southern Interior has the driest and warmest climate of the province. In the valleys, annual precipitation ranges from less than 30 centimetres to 50 centimetres, while daily temperatures can average over 20°C in July and just under freezing in January. The climate becomes more extreme further north and precipitation increases. The frost-free period in the North is short and variable. Spruce and lodgepole pine are the dominant trees of commercial value in the Interior.
The northeast region of the province is an extension of the western prairie region of Alberta. It has a continental climate that is more extreme than that of the northern interior region. However, it does have long hot summers and a frost-free period long enough to grow grain, forage and other crops.
Population
B.C. is the third largest province in terms of population, which was estimated at 5.148 million people, accounting for 13.5 per cent of Canada’s population on July 1, 2020. B.C.’s population grew at an average annual rate of 1.4 per cent between 2010 and 2020, slightly higher than the growth rate of the overall Canadian population for the same period.
The Vancouver census metropolitan area, a major Canadian shipping, manufacturing and services centre, had the largest urban population in B.C. with 2.738 million people in 2020. Meanwhile, the census metropolitan area for Victoria, the provincial capital, had a population of 0.409 million people in 2020.
Constitutional Framework
The structure of the British Columbia government is based on British parliamentary tradition and precedent. Prior to 1866, B.C. was composed of two British-controlled colonies — the Colony of Vancouver Island was established in 1849, and the Colony of British Columbia was established in 1858 on the mainland. In the Union Proclamation of 1866, the two colonies were joined to form the single united Crown Colony of British Columbia. On July 20, 1871, B.C. entered into Confederation with Canada. Although the Colony of Vancouver Island had a parliamentary form of government as far back as 1856, the first fully elected government was not instituted in B.C. until the autumn after Confederation with Canada. Responsible government was achieved in late 1872, when the lieutenant governor acquiesced to an executive council that was responsible to the legislative assembly.
Upon entering Confederation, B.C. came under the authority of the British North America Act, 1867 (BNA Act), a statute of the British parliament. Until 1982, the BNA Act defined the major national institutions and established the division of authority between the federal and provincial governments. In 1982, the British Parliament ended its legal right to legislate for Canada with the passage of the Canada Act, 1982 and its companion legislation, the Constitution Act, 1982, which also includes the Canadian Charter of Rights and Freedoms. The BNA Act was renamed the Constitution Act, 1867, which continues to be the foundation for the division of legislative powers between Canada, as a federal state, and provincial governments.
| 54 | 2021 FINANCIAL AND ECONOMIC REVIEW – JULY 2021 | |
| | | |
Part 3 – Supplementary Information
Indigenous Peoples
British Columbia is home to more than 270,000 Indigenous1 people, representing one in six Indigenous people in Canada. There are 203 First Nations in B.C. (of 600 in Canada), and they represent 34 distinct languages. At more than 89,000, the Métis population in B.C. is the fourth-largest in Canada.
Each Indigenous community has a unique history and experience and different ways of life, social organization, governance systems, and approaches to economic development.
As the original occupants of the land, Indigenous peoples have a special constitutional relationship with the Crown. This relationship, including existing Aboriginal2 and treaty rights, is recognized and affirmed in section 35 of the Constitution Act, 1982, and includes recognizing that Indigenous self-government is part of Canada’s evolving system of cooperative federalism and distinct orders of government.
Provincial Government
B.C.’s government is modeled after the British system. Functionally there are three main branches: the legislature, the executive and the judiciary.
Legislature
Legislative powers in British Columbia are exercised by a single legislative chamber, which is elected for a term of four years. B.C. was the first jurisdiction in Canada to establish set general election dates, in 2001. Provincial general elections are scheduled to take place on the third Saturday in October every four years.
The legislature consists of the lieutenant governor and 87 elected members of the legislative assembly. The legislative assembly represents the people of B.C. in the conduct of the province’s affairs. The assembly is required by law to meet at least once a year with a normal session lasting several months. However, special sessions can last just a few days or many months, depending on the nature of the government’s business.
The legislature operates on a fixed schedule — the second Tuesday in February each year is usually reserved for the Throne Speech and the fourth Tuesday in February each year is reserved for the Budget Speech.
Executive
The executive is composed of the lieutenant governor and the executive council.
The executive council, or cabinet, is headed by the premier and is composed of selected members of the ruling party. The lieutenant governor, the Queen’s representative in British Columbia, holds a largely ceremonial place in the modern provincial government. By constitutional custom, the lieutenant governor is appointed by the Governor General of Canada for a term usually lasting five years.
Following a general election, the lieutenant governor calls upon the leader of the political party with the majority of elected members to serve as premier and to form the provincial government.
| 1 | The term ‘Indigenous’ includes all people of Indigenous ancestry, including First Nations (status and non-status), Métis and Inuit. |
| 2 | The federal Constitution Act recognizes the Aboriginal peoples of Canada as the Indian, Inuit and Métis peoples of Canada; however, First Nations is the generally preferred term for Indian peoples of Canada, and Indigenous is preferred to Aboriginal. |
| | 2021 FINANCIAL AND ECONOMIC REVIEW – JULY 2021 | 55 |
| | | |
Part 3 – Supplementary Information
Where the general election does not result in a single political party having the majority of elected members, a minority government may be formed by the party that is able to form a coalition or enter into a confidence and supply agreement with another party, to ensure it has the majority required for all confidence motions and budgetary legislation.
The lieutenant governor, on the advice of the premier, appoints members of the executive council and is guided by the executive council’s advice as long as it holds the confidence of the legislative assembly.
The lieutenant governor, on recommendation of the premier, convenes, prorogues and dissolves the legislative assembly and gives Royal Assent to all measures and bills passed by the assembly before they become law.
Ministers are the executives responsible for government ministries, and are usually members of cabinet. Cabinet determines government policy and is held responsible by the legislative assembly for the operation of the provincial government.
Deputy ministers are the senior civil servants in their ministries and have responsibility for all operational matters including budget, human resources and program development. Deputy ministers are required to manage a complex set of multiple accountabilities which arise out of various powers, authorities and responsibilities attached to the position. The deputy minister is the principal source of support for a minister in fulfilling his or her collective and individual responsibilities and respecting his or her accountability. In providing this support, the deputy minister is responsible for:
| · | sound public service advice on policy development and implementation, both within the minister’s portfolio and with respect to the government’s overall policy and legislative agenda; |
| · | effective ministry management, as well as advice on management of the minister’s entire portfolio; and |
| · | fulfillment of authorities that have been assigned to the deputy minister or other officials either by the minister directly or by virtue of legislation. |
Judiciary
The judiciary performs functions that are central to the orderly operation of society. Judges hear and give judgment in criminal prosecutions and in actions arising from disputes between private citizens or between the government and private citizens. Judges apply both judge-made law, known as ‘‘common law,’’ and laws made by the Parliament of Canada and provincial legislatures. The judiciary is sometimes called on to determine whether laws passed by governments conform to the values expressed in the Canadian Charter of Rights and Freedoms.
B.C.’s judicial system is made up of the Provincial Court of British Columbia, the Supreme Court of British Columbia and the Court of Appeal of British Columbia. The Provincial Court hears cases that fall into five main categories: criminal cases, family cases, youth court cases, small claims, and traffic & bylaw cases. The provincial government appoints Provincial Court judges, and the federal government appoints Court of Appeal and Supreme Court judges.
| 56 | 2021 FINANCIAL AND ECONOMIC REVIEW – JULY 2021 | |
| | | |
Part 3 – Supplementary Information
The federal judicial system includes the Tax Court of Canada, the Federal Court of Canada (Appeals division and Trial division) and the Supreme Court of Canada. The Federal Court of Canada hears cases in limited areas of exclusively federal jurisdiction — for example, reviewing decisions made by federal tribunals such as the Canada Labour Relations Board. The Supreme Court of Canada is the court of final resort and hears selected appeals from the Federal Court of Appeal and provincial Courts of Appeal.
Provincial Government Jurisdiction
Under Canada’s constitutional framework, B.C. has ownership and jurisdiction over natural resources and is responsible for education, health and social services, municipal institutions, property and civil rights, the administration of justice and other matters of purely provincial or local concern.
Annual Financial Cycle
British Columbia’s Budget Transparency and Accountability Act (BTAA) outlines the Province’s reporting requirements during the financial cycle and imposes specific reporting deadlines or release dates for these publications. In particular, fixed dates for presentation of the budget, as well as dates for quarterly and annual reports, are set by law.
Under the BTAA, the provincial government focuses its budgeting and reporting on a summary accounts basis. The BTAA requirements include reporting on the advice of the Economic Forecast Council; presentation of the annual Estimates, Budget and Fiscal Plan, Quarterly Reports, and Public Accounts; publication of Quarterly Reports with revised forecasts; annual three-year service plans and service plan reports for each ministry and government organization; and an annual three-year government strategic plan and report.
Chart 3.1 summarizes the annual financial process of the Province. This process consists of four main stages.
Planning and Budget Preparation
Treasury Board, a committee of the executive council, reviews longer-term estimates of revenue, expense, capital and debt, and establishes a preliminary fiscal plan within the framework of the government’s overall strategic plan. Ministries, service delivery agencies, and Crown corporations prepare three-year service plans, including performance measures and targets, and operating and capital budgets, for review by government. Treasury Board makes recommendations to Cabinet on budget allocations for ministries and agencies, and assesses commercial Crown corporation net income benchmarks, within the context of the fiscal plan. Included as inputs into this process are a consultation paper published by September 15th that invites public comment on issues for consideration as government develops its fiscal and service plans, and provincewide public hearings held by a committee of the legislature. A report outlining the results of the budget consultation process is made public by November 15th of each year.
| | 2021 FINANCIAL AND ECONOMIC REVIEW – JULY 2021 | 57 |
| | | |
Part 3 – Supplementary Information
Chart 3.1 Financial Planning and Reporting Cycle Overview
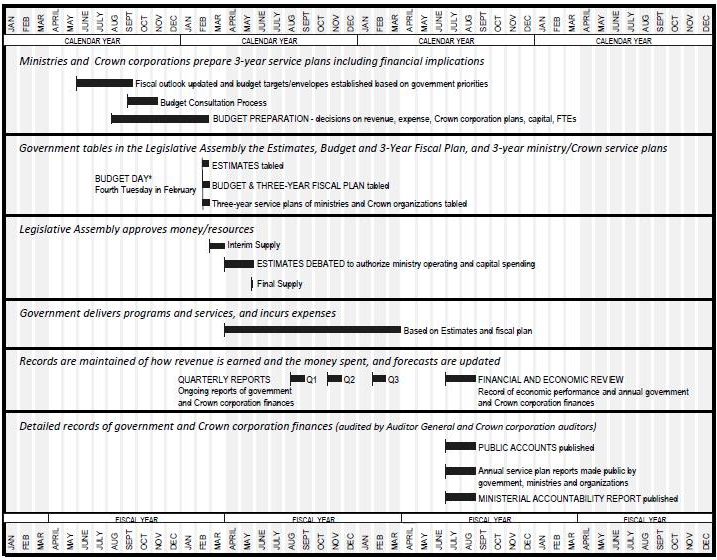
*In an election year the budget day may be delayed, in accordance with the Budget Transparency and Accountability Act.
Implementation and Reporting
The government’s revenue, expense and capital plans for the next three fiscal years, as well as other information on the government’s finances, are presented to the legislative assembly by the Minister of Finance in a budget document called the Budget and Fiscal Plan. The financial plan for the next fiscal year is also included in the document called the Estimates, which describes the individual appropriations to be voted on by the legislative assembly. Government’s strategic plan, service plans, and a report on major capital projects (those where government contribution exceeds $50 million) must also be tabled in the legislature. Throughout the year, the authorized funding as specified in the Estimates and ministry service plans is spent on programs and services. Crown corporations follow approved service plans under the direction of their own boards of directors. Quarterly Reports, including full-year forecasts, are published by legislated dates, thereby providing regular updates to the public on the government’s finances.
| 58 | 2021 FINANCIAL AND ECONOMIC REVIEW – JULY 2021 | |
| | | |
Part 3 – Supplementary Information
Evaluation
At the end of the fiscal year, the Public Accounts are prepared by the Office of the Comptroller General and examined by the Auditor General to ensure that the financial statements fairly present the government’s financial position. The Public Accounts are augmented by the British Columbia Financial and Economic Review, which provides an overview of annual and historical financial and economic results. In addition, annual service plan reports are made public that compare actual results with ministry and Crown corporation performance targets.
Accountability
The Public Accounts are presented to the legislative assembly and are reviewed by two committees of the legislative assembly (the Select Standing Committee on Public Accounts, and the Select Standing Committee on Crown Corporations). At the same time, the Ministerial Accountability Report is published detailing the individual and collective financial performance of cabinet ministers, and the performance achieved by the Ministers of State on non-financial targets.
Government’s Financial Statements
Government Reporting Entity
The provincial government conducts its activities through:
| · | the SUCH sector (school districts, universities, colleges, institutes, and health organizations); |
| · | other taxpayer-supported service delivery agencies; and |
| · | commercial Crown corporations. |
The accounts relating to the ministries and other direct activities of government are contained in the Consolidated Revenue Fund (CRF), whose financial results are reported as a separate entity in the Public Accounts. The CRF comprises all money over which the legislature has direct power of appropriation. The operations of public sector organizations, including the SUCH sector entities, service delivery agencies, and Crown corporations, are recorded in their own financial statements, which are subject to audit by the Auditor General or by private-sector auditors.
The relationships between the legislature and government’s public sector organizations are guided by legislation, governance agreements, and/or mandate letters to ensure effective oversight, alignment with government’s priorities, and preservation of public confidence in the management of public-sector programs and services for the citizens of British Columbia.
The Province consolidates the financial results of all these entities into a single set of financial statements, published annually in the Public Accounts.
| | 2021 FINANCIAL AND ECONOMIC REVIEW – JULY 2021 | 59 |
| | | |
Part 3 – Supplementary Information
Compliance with GAAP
British Columbia’s Budget Transparency and Accountability Act (BTAA) requires government’s financial statements to conform to generally accepted accounting principles (GAAP) for senior governments in Canada. In practice this means compliance with the Public Sector Accounting Standards (PSAS), which are set by the Canadian Public Sector Accounting Board (PSAB).
Under PSAS, service delivery agencies are consolidated with the CRF on a line-by-line basis. Commercial Crown corporations3 (government business enterprises) and commercial subsidiaries owned by service delivery agencies are consolidated on a modified equity basis — i.e. their net income is reported as revenue of the Province and their retained earnings as an investment.
Where the accounting policies of service delivery agencies differ from those used by the central government, the service delivery agency financial statements are adjusted to conform to government’s accounting policies. No adjustments for accounting differences are made for commercial Crown corporations, which prepare their statements in accordance with International Financial Reporting Standards (IFRS).
The BTAA authorizes Treasury Board to adopt different standards than those promoted by PSAB in order to ensure that British Columbia’s financial reporting reflects the policy framework within which the Crown corporations and agencies operate. Any alternative standard adopted by Treasury Board must come from other areas of Canadian GAAP or from a recognized standard setting body in another jurisdiction (e.g. the US Financial Accounting Standards Board). Treasury Board has issued one such regulation, mandating BC Hydro to follow the US FASB standard for rate-regulated accounting.
The full text of government’s significant accounting policies can be found in Note 1 to the Consolidated Summary Financial Statements in the 2020/21 Public Accounts.
| 3 | Crown corporations are considered commercial if the majority of their operating revenue comes from non-government sources, and their operating revenue is sufficient to cover operating and debt service costs without the need for government grants or other forms of assistance. Otherwise they are included with the service delivery agencies. |
| 60 | 2021 FINANCIAL AND ECONOMIC REVIEW – JULY 2021 | |
| | | |
Part 3 – Supplementary Information
Table 3.1 Provincial Taxes (as of July 2021)
Type and Statute Reference | Tax Base | Tax Rate | Characteristics and Exemptions |
Income — Income Tax Act | Taxable Income: · Corporate · Personal | General rate: 12% Small business rate: 2%. Tax rates of 5.06%, 7.7%, 10.5%, 12.29%, 14.7%, 16.8% and 20.5% corresponding to the following tax brackets: up to $42,184,
$42,184.01 to $84,369,
$84,369.01 to $96,866,
$96,866.01 to $117,623,
$117,623.01 to $159,483,
$159,483.01 to $222,420,
and over $222,420. | The Canada Revenue Agency administers B.C.’s personal and corporate income taxes under the Tax Collection Agreement between the province and the federal government. Corporate tax credits include the scientific research and experimental development tax credit, the book publishing tax credit, the interactive digital media tax credit and the film tax credits. In addition, the farmers’ food donation tax credit, mining exploration tax credit, logging tax credit, training tax credits and venture capital tax credits are available to both individuals and corporations. B.C. provides a set of non-refundable credits similar to most federal non-refundable credits. Refundible personal tax credits include the B.C. climate action tax credit, B.C. sales tax credit, the B.C. Child Opportunity Benefit and other credits available to individuals who meet specific eligibility criteria. |
Payroll — Employer Health Tax Act | B.C. remuneration | 1.95%. Rate is reduced if annual B.C. remuneration is between $500,000 and $1.5 million. Tax does not apply if B.C. remuneration is less than $500,000. | Employers with annual B.C. remuneration less than $500,000 are exempt from the tax. The exemption amount is shared by all associated employers. The tax rate is phased in for employers with annual B.C. remuneration between $500,000 and $1.5 million. Special rules exist for charities and non-profits. Charities and non-profits receive an exemption of $1.5 million per qualifying location, and charities with B.C. remuneration between $1.5 million and $4.5 million per qualifying location pay a reduced rate. Employers associated with charities do not have to share the exemption with the charity. |
Real property transfers — Property Transfer Tax Act | Fair market value of property based on the percentage of interest in the property. | 1% on the first $200,000 of the fair market value transferred, 2% of the fair market value that exceeds $200,000 but does not exceed $2,000,000 and 3% of the fair market value that exceeds $2,000,000. For residential class property and farm land associated with a farmers’ dwelling, the 3% rate becomes 5% for the fair market value above $3,000,000. Foreign nationals and foreign corporations purchasing residential class property in certain areas pay an additional 20% of fair market value. These areas are Metro Vancouver Regional District except Tsawwassen Lands, and Capital, Central Okanagan, Fraser Valley and Nanaimo Regional Districts. | Eligible first time home-buyers are fully exempt from tax on transfers of eligible properties up to $500,000. Similarly, eligible purchasers of newly constructed homes are fully exempt if the fair market value is $750,000 or less. Other exemptions include: some intergenerational transfers or transfers to a spouse of principal residences, recreational residences and family farms; transfers of property between spouses pursuant to written separation agreements or court orders; transfers of property to local governments, registered charities and educational institutions; transfers of property to veterans under the Veterans’ Land Act (Canada); transfers of land to be protected, preserved, conserved or kept in a natural state; and transfers of leases 30 years or less in duration. A number of technical exemptions are also provided. Foreign nationals who become citizens or permanent residents of Canada within a year of purchase may be eligible for a refund of the additional 20% tax. Foreign nationals who are in the Provincial Nominee Program process for immigration to Canada may be exempt from the additional 20% tax. |

| | 2021 FINANCIAL AND ECONOMIC REVIEW – JULY 2021 | 61 |
| | | |
Part 3 – Supplementary Information
Table 3.1 Provincial Taxes (as of July 2021) – Continued
Type and Statute Reference | Tax Base | Tax Rate | Characteristics and Exemptions |
Retail sales tax — Provincial Sales Tax Act | Purchase and lease of tangible personal property. Purchase of software, accommodation, related services, telecommunication services and legal services. Gifts of vehicles, boats and aircraft. | General rate: 7% Liquor: 10% Vapour products: 20% Accommodation: 8% Vehicles: 7% to 20% Boats and aircraft: 7% or 12% Manufactured buildings: reduced rate of tax. | Paid by purchasers and lessees and primarily collected through businesses required to be registered under the Act. Major consumer exemptions include, but are not limited to: · food for human consumption (including prepared food, but not including soda beverages), · residential energy, · children’s clothing and footwear (child-sized clothing and adult-sized clothing for children under 15 years of age), · basic cable and residential land-line telephone services, and · vitamins, drugs and household medical aids. Major business exemptions include, but are not limited to: · goods acquired solely for re-sale or re-lease, · goods purchased to be incorporated into goods for sale or lease, · certain production machinery and equipment purchased by major industries (manufacturers, logging, mining, oil and gas) for qualifying activities at qualifying locations, and · electricity. |
Tobacco — Tobacco Tax Act | By cigarette, heated tobacco product, cigar retail price, and weight on other tobacco products. | 32.5 cents per cigarette, tobacco stick or heated tobacco product unit, and 65 cents per gram of loose tobacco; 90.5% of taxable price on cigars to a maximum tax of $7 per cigar. | Tax is payable on tobacco by purchasers at the time of retail purchase. Tobacco is subject to a security scheme. Security is payable by wholesale dealers registered under the Act when tobacco is delivered to them. |
Carbon dioxide equivalent emissions from combustion of fuels and combustibles — Carbon Tax Act | Purchase, use, or, in certain circumstances, transfer or importation of: · Aviation Fuel · Gasoline · Heavy Fuel Oil · Jet Fuel · Kerosene · Light Fuel Oil · Methanol (not produced from biomass) · Naphtha · Butane · Coke Oven Gas · Ethane · Propane · Natural Gas · Refinery Gas · High Heat Value Coal · Low Heat Value Coal · Coke · Petroleum Coke · Gas Liquids · Pentanes Plus Combustion (to produce heat or energy) of: · Peat · Combustible Waste | Tax rates vary by type of fuel or combustible based on carbon dioxide equivalent emitted by each fuel or combustible. Tax rates are equivalent to $45 per tonne of carbon dioxide equivalent. | Tax is payable on fuels by purchasers at the time of retail purchase. Fuels, other than natural gas, are subject to a security scheme similar to the security scheme under the Motor Fuel Tax Act. Security is payable by collectors registered under the Act when fuel is sold in British Columbia for the first time after manufacture or importation. Tax on the purchase of natural gas is collected and remitted at the retail level. Tax on use, transfer and import is self-assessed. Tax on the burning of combustibles is self-assessed. Exemptions include: · fuels which are exported for use outside of British Columbia, · fuel used for certain non-energy purposes, · fuel used for eligible inter-jurisdictional transportation, · coloured gasoline and coloured diesel purchased by farmers solely for listed farm purposes, and · minor exemptions similar to exemptions in other consumption tax acts for administrative and technical reasons. |
| 62 | 2021 FINANCIAL AND ECONOMIC REVIEW – JULY 2021 | |
| | | |
Part 3 – Supplementary Information
Table 3.1 Provincial Taxes (as of July 2021) – Continued
Type and Statute Reference | Tax Base | Tax Rate | Characteristics and Exemptions |
Motor fuel — Motor Fuel Tax Act | Purchase, use, or in certain circumstances, transfer or importation of fuels: | | Tax generally applies to all fuels purchased for use, or used in internal combustion engines. Tax is payable on fuels by purchasers at the time of retail purchase. Most fuels are subject to a security scheme similar to the security scheme under the Carbon Tax Act. Security is payable by collectors registered under the Act when fuel is sold in British Columbia for the first time after manufacture or importation. The additional tax collected in the South Coast BC Transportation Service Region, on behalf of TransLink, helps fund regional transportation costs. The additional tax collected in the Victoria Regional Transit Service Area, on behalf of BC Transit, helps fund the public transit system. |
| | · Clear gasoline | General rate: 14.5 cents per litre (includes 6.75 cents per litre collected on behalf of the BC Transportation Financing Authority). South Coast BC Transportation Service Region: 27 cents per litre (includes 6.75 cents per litre collected on behalf of the BC Transportation Financing Authority and 18.5 cents per litre collected on behalf of TransLink). Victoria Regional Transit Service Area: 20 cents per litre (includes 6.75 cents per litre collected on behalf of the BC Transportation Financing Authority and 5.5 cents per litre collected on behalf of BC Transit). | |
| | · Motive fuel | General rate: 15 cents per litre (includes 6.75 cents per litre collected on behalf of the BC Transportation Financing Authority). South Coast BC Transportation Service Region: 27.5 cents per litre (includes 6.75 cents per litre collected on behalf of the BC Transportation Financing Authority and 18.5 cents per litre collected on behalf of TransLink). Victoria Regional Transit Service Area: 20.5 cents per litre (includes 6.75 cents per litre collected on behalf of the BC Transportation Financing Authority and 5.5 cents per litre collected on behalf of BC Transit). | Tax applies to diesel fuel but does not include alternative motor fuels or coloured fuels. |
| | · Alternative motor fuels (natural gas, hydrogen and methanol (M85+)) | Exempt. | Natural gas, when used as a motor fuel, is exempt from tax. Certain hydrogen is exempt from tax. Fuels comprised of at least 85% methanol are also exempt from tax. |
| | 2021 FINANCIAL AND ECONOMIC REVIEW – JULY 2021 | 63 |
| | | |
Part 3 – Supplementary Information
Table 3.1 Provincial Taxes (as of July 2021) — Continued
Type and Statute Reference | Tax Base | Tax Rate | Characteristics and Exemptions |
Motor fuel — Motor Fuel Tax Act (continued) | · Coloured fuel, marine diesel fuel · Locomotive fuel · Propane · Aviation fuel · Jet fuel · Natural gas used in stationary engines, other than listed below. · Natural gas used in pipeline compressors to transmit marketable gas. · Natural gas used in pipeline compressors to extract and transmit raw gas from wells to processing plants. · Natural gas used in compressors to re-inject sour gas into depleted wells. · Marine bunker fuel · Marine gas oil | 3 cents per litre. 3 cents per litre. 2.7 cents per litre. 2 cents per litre. 2 cents per litre. 1.1 cents per 810.32 litres. 1.9 cents per 810.32 litres. Exempt. Exempt. Exempt. Exempt. | Coloured fuel may be used in all vehicles not licensed to operate on a highway and in specific industrial vehicles. Farmers are exempt from paying the tax when fuel is used solely for listed farm purposes. Farm trucks are allowed to use tax-exempt coloured fuel for farming purposes on a highway. Marine diesel fuel used in interjurisdictional cruise ships and ships prohibited from coasting trade under the Coasting Trade Act is exempt from tax. Tax applies to fuel specifically for use in locomotives. Propane tax applies to all uses of propane. There are exemptions for propane used as residential energy in a residential dwelling, for propane used by qualifying farmers solely for a farm purpose, and for small containers of propane. Aviation fuel tax applies to fuel produced specifically for use in a non-turbine aircraft engine. Jet fuel tax applies to fuel produced specifically for use in a turbine aircraft engine. Jet fuel used for international flights is exempt. Exemption applies to bunker fuel used as fuel in a ship. Exemption applies to marine gas oil when used in primary gas turbine engines to propel passenger and cargo vessels. |
Natural resources — Logging Tax Act | Net income from logging in B.C. | 10% (fully recoverable against federal and provincial corporation and personal income tax). | Tax is calculated as net income from logging after deducting a processing allowance. |
— Mineral Land Tax Act | Assessed value of freehold mineral land and production areas. | Undesignated mineral land — $1.25 to $4.94 per hectare. Designated production areas — $4.94 per hectare. | Rates of tax set on sliding scale, dependent on size and designation of land. No tax is payable if the mineral land is less than 16.2 hectares, owned by a registered charity or if the administrator has classified the mineral lands as agricultural. |
| — Mineral Tax Act | Cash flow from individual metal and coal mines (other than placer gold mines). | 2% of net current proceeds (NCP). 13% of net revenue (NR). | Tax calculated for each operator on a mine-by-mine basis. NCP tax paid on current operating cash flow until all current and capital costs, plus any investment allowance, are recovered. Then NR tax paid on cumulative cash flow. NCP tax creditable against NR tax. |
| | Volume of production of limestone, dolomite, marble, shale, clay, volcanic ash, diatomaceous earth, sandstone, quartzite and dimension stone. | $0.15 per tonne removed from all quarries operated. | An operator may deduct 25,000 tonnes from the total number of tonnes removed from all quarries operated by that operator. However, the amount deducted from any one quarry by all operators of that quarry must not exceed 25,000 tonnes. |
| | Value of minerals sold by placer gold mines. | | |
| 64 | 2021 FINANCIAL AND ECONOMIC REVIEW – JULY 2021 | |
| | | |
Part 3 – Supplementary Information
Table 3.1 Provincial Taxes (as of July 2021) – Continued
Type and Statute Reference | Tax Base | Tax Rate | Characteristics and Exemptions |
Insurance — Insurance Premium Tax Act | B.C. premiums. | 4.4% for vehicle and property insurance, 2% for life, sickness, personal accident and loss of salary and wages insurance, 4% for other insurance and 7% for all contracts with unlicensed insurers. | Exemptions: fraternal benefit societies; mutual corporations with 50% of income from farm or 100% from religious, educational or charitable institutions; marine, except pleasure craft; approved medical or hospitalization plans; professional liability insurance from the Law Society of B.C.; liability insurance with the Real Estate Errors and Omissions Insurance Corporation; and assessments for the Real Estate Special Compensation Fund. |
Real property — Taxation (Rural Area) Act | Assessed value of land and improvements in rural areas (outside municipalities). Assessment determined under the Assessment Act. | Rates are set annually expressed as $/$1000 of taxable assessed value. For residential properties the rates are set to increase average residential rural taxes by the rate of inflation. For non-residential property classes, the rates are set so that total non-residential rural tax revenues increase by inflation plus tax on new construction. | Some exemptions apply under various statutes. |
| | | | | |
| | | Class
1 residential:
2 utilities:
3 supportive housing:
4 major industry:
5 light industry:
6 business and other:
7 managed forest land:
8 recreation/non-profit:
9 farm land: | Rate $/$1000 0.45 3.80 0.10 6.92 2.79 2.79 0.46 0.88 0.54 | |
| | | | | |
| | | In Peace River Regional District, tax rates are the same as above except | |
| | | 2 utilities:
4 major industry:
5 light industry: | 4.17 7.29 3.16 | |
| | | | | |
| | | | | |
Basic residential class school property tax — School Act section 119 | Assessed value of class 1 residential land and improvements. Assessment determined under the Assessment Act. | Rates are set annually to increase average residential taxes by the rate of inflation. The rates vary by school district. For 2020, rates range from about $0.84/$1000 to $4.5/$1000. | Basic rates are calculated using a formula to moderate effects of varying average assessments on school district taxes. Amendments to the School Act in 2002 allow the Minister of Finance to apply different tax rates within a school district. Tofino is the only municipality with a rate that differs from the rest of the school district. School districts may levy additional tax on residential class property if authorized by local referendum. None do. The Home Owner Grant Program and the Land Tax Deferment Program can reduce or postpone the tax liability for Canadian citizens and permanent residents of Canada who live in their own home as a principal residence. |
Additional school tax on homes over $3 million. — School Act section 120.1 | Assessed value of “dwelling property”.
Tax began in 2019. | Tax is 0.2% on the value of the dwelling property between $3,000,000 and $4,000,000 and 0.4% on the value above $4,000,000. | Dwelling property for the additional school tax is most residential class property where there is between one and three dwelling units. Properties with four or more units, such as apartment buildings, are not taxed. Vacant land in residential class is taxed unless it is in the Agricultural Land Reserve. |
| | 2021 FINANCIAL AND ECONOMIC REVIEW – JULY 2021 | 65 |
| | | |
Part 3 – Supplementary Information
Table 3.1 Provincial Taxes (as of July 2021) – Continued
Type and Statute Reference | Tax Base | Tax Rate | Characteristics and Exemptions |
Non-residential class school property tax — School Act section 119 | Assessed value of non-residential land and improvements. Assessment determined under the Assessment Act. | Rates are set annually and expressed as $/$1000 of taxable assessed value. | Some exemptions apply under various statutes. Tax rates for 2021 were set according to the usual policy, so that revenues would grow from 2019 by inflation and by the tax on new building since 2019. For 2020 only, tax rates were reduced for classes 4-8 as a response to the onset of the pandemic. |
| | | | | |
| | | For 2021 the rates are: | |
| | | Class 2 utilities: 3 supportive housing: 4 major industry: 5 light industry: 6 business and other: 7 managed forest land: 8 recreation/non-profit: 9 farm land: | Rate $/$1000 12.86 0.10 3.86 3.86 3.86 1.90 2.33 6.91 | An industrial property tax credit reduces provincial school property tax by 60% on major industrial (class 4) properties. A 50% provincial farm land property tax credit reduces the provincial school property tax on farm land (class 9). |
| | | | | |
| | | | | |
Police tax — Police Act | Assessed value of land and improvements in municipalities under 5,000 population and in rural areas. Assessment determined under the Assessment Act. | Rates are set annually to raise up to 50% of the provincial cost of rural and small community policing. Rates are set for each of the nine property classes in each municipality under 5,000 population, in each electoral area of the province and in the area of the province outside a regional district. | Basic rates are calculated using a formula that includes assessed value and population. Tax rate reductions are embedded in the rates to reflect the contribution taxpayers in the rural areas make to policing costs through the provincial rural area property tax and payments of grants in lieu of police tax by exempt taxpayers. Rates are further reduced to deliver traffic fine revenue sharing amounts to taxpayers: in municipalities over 5,000 where police tax does not apply the traffic fine revenue sharing amounts are paid to municipalities. |
Speculation and Vacancy tax — Speculation and Vacancy Tax Act | Tax is based on the assessed value of the residential property. Assessment determined under the Assessment Act. | Beginning in the 2019 tax year, the tax rate is 2% for foreign owners and untaxed worldwide earners (satellite families). The tax rate for other owners is 0.5%. | The tax is intended to capture foreign and domestic speculators who own residential property in designated taxable areas. Different exemptions and credits are available depending on owner type. The principal residence of a resident of British Columbia is exempt from tax. Residential property that is rented out is exempt. Property that is under construction or development is exempt. There are also a variety of hardship exemptions available. Residents of B.C. are entitled to an up to $2,000 tax credit. Other categories of owners are entitled to a tax credit based on reported B.C. income and the use of the property. |
| 66 | 2021 FINANCIAL AND ECONOMIC REVIEW – JULY 2021 | |
| | | |
Part 3 – Supplementary Information
Table 3.2 Interprovincial Comparisons of Tax Rates - 2021 (Rates known and in effect as of July 1, 2021)
| | | | | | | | | | | | | | | | | | | | | | | | | | | Prince | | | Newfound- | |
| | | British | | | | | | Saskat- | | | | | | | | | | | | New | | | Nova | | | Edward | | | land and | |
| Tax | | Columbia | | | Alberta | | | chewan | | | Manitoba | | | Ontario | | | Quebec | | | Brunswick | | | Scotia | | | Island | | | Labrador | |
| Corporate income tax (per cent of taxable income) | | | | | | | | | | | | | | | | | | | | | | | | | | | | | | | | | | | | | | | | |
| General rate | | | 12 | | | | 8 | | | | 12 | | | | 12 | | | | 11.5 | | | | 11.5 | | | | 14 | | | | 14 | | | | 16 | | | | 15 | |
| Manufacturing rate 1 | | | 12 | | | | 8 | | | | 10 | | | | 12 | | | | 10 | | | | 11.5 | | | | 14 | | | | 14 | | | | 16 | | | | 15 | |
| Small business rate | | | 2 | | | | 2 | | | | 2 | | | | 0 | | | | 3.2 | | | | 3.2 | | | | 2.5 | | | | 2.5 | | | | 2 | | | | 3 | |
| Small business threshold ($000s) | | | 500 | | | | 500 | | | | 600 | | | | 500 | | | | 500 | | | | 500 | | | | 500 | | | | 500 | | | | 500 | | | | 500 | |
| Corporation capital tax (per cent) Financial 2 | | | Nil | | | | Nil | | | | 0.7/4 | | | | 6 | | | | Nil | | | | 1.25 | | | | 4/5 | | | | 4 | | | | 5 | | | | 6 | |
| Health care premiums/month ($) Individual/family 3 | | | Nil | | | | Nil | | | | Nil | | | | Nil | | | | Nil | | | | Nil | | | | Nil | | | | Nil | | | | Nil | | | | Nil | |
| Payroll tax (per cent) 4 | | | 1.95 | | | | Nil | | | | Nil | | | | 2.15 | | | | 1.95 | | | | 4.26 | | | | Nil | | | | Nil | | | | Nil | | | | 2 | |
| Insurance premium tax (per cent) 5 | | | 2-7 | | | | 3/4 | | | | 3/4 | | | | 2-4.25 | | | | 2-3.5 | | | | 3.48 | | | | 2/3 | | | | 3/4 | | | | 3.75/4 | | | | 5 | |
| Fuel tax (cents per litre) 6 | | | | | | | | | | | | | | | | | | | | | | | | | | | | | | | | | | | | | | | | |
| Gasoline | | | 24.46 | | | | 21.84 | | | | 23.84 | | | | 22.84 | | | | 32.81 | | | | 30.91 | | | | 30.96 | | | | 26.62 | | | | 26.39 | | | | 35.85 | |
| Diesel | | | 26.71 | | | | 23.73 | | | | 25.73 | | | | 24.73 | | | | 33.78 | | | | 30.91 | | | | 37.43 | | | | 25.73 | | | | 33.36 | | | | 39.40 | |
| Sales tax (per cent) 7 | | | | | | | | | | | | | | | | | | | | | | | | | | | | | | | | | | | | | | | | |
| General rate | | | 7 | | | | Nil | | | | 6 | | | | 7 | | | | 8 | | | | 9.975 | | | | 10 | | | | 10 | | | | 10 | | | | 10 | |
| Tobacco tax ($ per carton of 200 cigarettes) 8 | | | 65 | | | | 55 | | | | 61.95 | | | | 69.69 | | | | 46.18 | | | | 29.80 | | | | 63.99 | | | | 72.79 | | | | 68.39 | | | | 79.34 | |
| 1 | In British Columbia (and some other provinces), the general rate applies to income from manufacturing and processing. |
| 2 | In Saskatchewan, small financial corporations pay the rate of 0.7 per cent on their capital. A small financial corporation has less than $1.5 billion in taxable capital. Large financial corporations are subject to the 4 per cent rate. Manitoba’s tax only applies to large financial corporations with taxable paid-up capital of at least $4 billion on taxable capital exceeding $10 million. Quebec’s tax only applies to life insurance companies. In New Brunswick, trust and loan companies are subject to the rate of 4 per cent, while banks are subject to the rate of 5 per cent. Financial institutions in Prince Edward Island pay tax on their paid-up capital exceeding $2 million. |
| 3 | British Columbia Medical Services Plan premiums were eliminated effective January 1, 2020. Ontario levies a health premium, as part of its provincial personal income tax system, of up to $900 per year per person. |
| 4 | Provinces with payroll taxes provide payroll tax relief for small businesses. Quebec also levies a compensation tax of up to 4.29 per cent on salaries and wages paid by financial institutions. |
| 5 | Lower rates apply to premiums for life, sickness and accident insurance; higher rates apply to premiums for property insurance including automobile insurance. In British Columbia, the highest rate applies to unlicensed insurance. In Manitoba, Ontario, Quebec and Newfoundland and Labrador, sales taxes also apply to certain insurance premiums except, generally, those related to individual life and health. |
| 6 | Tax rates are for regular fuel used on highways and include all provincial taxes payable by consumers at the pump. The British Columbia rates include 6.75 cents per litre dedicated to the BC Transportation Financing Authority and the carbon tax rates of 9.96 cents per litre for gasoline and 11.71 cents per litre for diesel. The British Columbia rates do not include regional taxes that increase the gasoline and diesel rates by 12.5 cents per litre in the South Coast British Columbia Transportation Authority service region and by 5.5 cents per litre in the Capital Regional District. The rates for Ontario, Quebec, New Brunswick, Nova Scotia, Prince Edward Island and Newfoundland and Labrador include provincial sales tax based on average pump prices as of June 21st, 2021. The rates for Alberta, Saskatchewan, Manitoba and Ontario include federal carbon pricing backstop rates of 8.84 cents per litre for gasoline and 10.73 cents per litre for diesel. The rates for New Brunswick and Newfoundland and Labrador include a provincial carbon tax rate of 8.84 cents per litre for gasoline and 10.73 cents per litre for diesel. The rates for Prince Edward Island include provincial carbon tax rates of 6.63 cents per litre for gasoline and 8.05 cents per litre for diesel. Quebec’s rates do not include increased or reduced regional tax rates, such as an additional 3 cents per litre on gasoline in the Montreal area. |
| 7 | Tax rates shown are statutory rates. Ontario, Quebec, New Brunswick, Nova Scotia, Prince Edward Island and Newfoundland and Labrador have harmonized their sales taxes with the federal GST. Alberta imposes a 4 per cent tax on short-term rental accommodation. |
| 8 | Includes estimated provincial sales tax in all provinces except British Columbia, Alberta and Quebec. |
| | 2021 FINANCIAL AND ECONOMIC REVIEW – JULY 2021 | 67 |
| | | |

| Appendix 1 |
| |
| Economic review |
| |
| Supplementary tables |
| | 2021 FINANCIAL AND ECONOMIC REVIEW – JULY 2021 | |
| | | |
Appendix 1 – Economic Review Supplementary Tables
Table A1.1A Aggregate and Labour Market Indicators
| | | | | | | | | | Real GDP | | | Primary | | | Gross fixed | | | Business | | | | | | | | | Unemployment | |
| | | | Population1 | | | Nominal GDP | | | (chained) | | | household income | | | capital formation | | | incorporations | | | Labour force | | | Employment | | | rate | |
| | | | (thousands) | | | ($ millions) | | | ($2012 millions) | | | ($ millions) | | | ($ millions) | | | (number) | | | (thousands) | | | (thousands) | | | (per cent) | |
| 1981 | | | | 2,827 | | | | 46,596 | | | | 104,634 | | | | 33,035 | | | | 13,256 | | | | - | | | | 1,416 | | | | 1,320 | | | | 6.8 | |
| 1982 | | | | 2,877 | | | | 46,600 | | | | 97,936 | | | | 34,966 | | | | 11,061 | | | | - | | | | 1,427 | | | | 1,253 | | | | 12.1 | |
| 1983 | | | | 2,908 | | | | 49,329 | | | | 98,655 | | | | 35,263 | | | | 10,903 | | | | - | | | | 1,446 | | | | 1,245 | | | | 13.9 | |
| 1984 | | | | 2,947 | | | | 51,788 | | | | 99,550 | | | | 36,944 | | | | 10,722 | | | | - | | | | 1,465 | | | | 1,245 | | | | 15.0 | |
| 1985 | | | | 2,975 | | | | 55,788 | | | | 106,567 | | | | 39,668 | | | | 11,573 | | | | - | | | | 1,493 | | | | 1,280 | | | | 14.3 | |
| 1986 | | | | 3,004 | | | | 58,954 | | | | 107,559 | | | | 41,991 | | | | 11,012 | | | | - | | | | 1,526 | | | | 1,332 | | | | 12.7 | |
| 1987 | | | | 3,049 | | | | 65,147 | | | | 114,142 | | | | 45,787 | | | | 12,607 | | | | - | | | | 1,567 | | | | 1,378 | | | | 12.1 | |
| 1988 | | | | 3,115 | | | | 72,095 | | | | 120,448 | | | | 50,643 | | | | 15,210 | | | | - | | | | 1,599 | | | | 1,435 | | | | 10.3 | |
| 1989 | | | | 3,197 | | | | 78,443 | | | | 124,256 | | | | 56,796 | | | | 18,748 | | | | - | | | | 1,659 | | | | 1,508 | | | | 9.1 | |
| 1990 | | | | 3,292 | | | | 82,374 | | | | 126,129 | | | | 62,770 | | | | 19,391 | | | | 19,550 | | | | 1,703 | | | | 1,560 | | | | 8.4 | |
| 1991 | | | | 3,374 | | | | 84,975 | | | | 126,535 | | | | 65,226 | | | | 19,283 | | | | 18,528 | | | | 1,751 | | | | 1,578 | | | | 9.9 | |
| 1992 | | | | 3,469 | | | | 90,515 | | | | 130,049 | | | | 68,047 | | | | 20,546 | | | | 20,406 | | | | 1,800 | | | | 1,617 | | | | 10.1 | |
| 1993 | | | | 3,568 | | | | 97,221 | | | | 136,155 | | | | 70,589 | | | | 21,435 | | | | 22,955 | | | | 1,848 | | | | 1,668 | | | | 9.7 | |
| 1994 | | | | 3,676 | | | | 103,598 | | | | 139,733 | | | | 74,124 | | | | 24,400 | | | | 25,774 | | | | 1,918 | | | | 1,743 | | | | 9.1 | |
| 1995 | | | | 3,777 | | | | 109,203 | | | | 143,402 | | | | 78,040 | | | | 23,076 | | | | 23,846 | | | | 1,951 | | | | 1,786 | | | | 8.5 | |
| 1996 | | | | 3,874 | | | | 112,540 | | | | 147,052 | | | | 80,322 | | | | 22,787 | | | | 23,237 | | | | 1,986 | | | | 1,813 | | | | 8.7 | |
| 1997 | | | | 3,949 | | | | 118,585 | | | | 151,968 | | | | 83,387 | | | | 24,819 | | | | 22,958 | | | | 2,032 | | | | 1,860 | | | | 8.5 | |
| 1998 | | | | 3,983 | | | | 119,775 | | | | 153,811 | | | | 85,832 | | | | 23,173 | | | | 20,759 | | | | 2,038 | | | | 1,858 | | | | 8.8 | |
| 1999 | | | | 4,011 | | | | 125,658 | | | | 159,162 | | | | 89,551 | | | | 23,281 | | | | 21,009 | | | | 2,064 | | | | 1,894 | | | | 8.3 | |
| 2000 | | | | 4,039 | | | | 136,411 | | | | 166,405 | | | | 94,462 | | | | 24,152 | | | | 21,388 | | | | 2,080 | | | | 1,931 | | | | 7.2 | |
| 2001 | | | | 4,077 | | | | 138,815 | | | | 167,541 | | | | 97,235 | | | | 26,197 | | | | 19,474 | | | | 2,082 | | | | 1,921 | | | | 7.7 | |
| 2002 | | | | 4,101 | | | | 143,993 | | | | 174,214 | | | | 101,152 | | | | 26,819 | | | | 20,987 | | | | 2,135 | | | | 1,952 | | | | 8.5 | |
| 2003 | | | | 4,124 | | | | 151,958 | | | | 178,240 | | | | 104,469 | | | | 29,096 | | | | 22,531 | | | | 2,172 | | | | 1,998 | | | | 8.0 | |
| 2004 | | | | 4,156 | | | | 164,600 | | | | 185,250 | | | | 111,064 | | | | 34,336 | | | | 24,703 | | | | 2,186 | | | | 2,028 | | | | 7.2 | |
| 2005 | | | | 4,196 | | | | 177,197 | | | | 194,460 | | | | 118,263 | | | | 39,429 | | | | 30,937 | | | | 2,220 | | | | 2,090 | | | | 5.9 | |
| 2006 | | | | 4,242 | | | | 190,479 | | | | 203,053 | | | | 128,744 | | | | 45,658 | | | | 33,273 | | | | 2,244 | | | | 2,138 | | | | 4.7 | |
| 2007 | | | | 4,291 | | | | 200,440 | | | | 209,419 | | | | 137,373 | | | | 49,568 | | | | 34,036 | | | | 2,303 | | | | 2,204 | | | | 4.3 | |
| 2008 | | | | 4,349 | | | | 206,427 | | | | 210,903 | | | | 142,034 | | | | 52,692 | | | | 30,085 | | | | 2,347 | | | | 2,239 | | | | 4.6 | |
| 2009 | | | | 4,411 | | | | 198,179 | | | | 205,878 | | | | 140,482 | | | | 46,303 | | | | 26,431 | | | | 2,371 | | | | 2,187 | | | | 7.8 | |
| 2010 | | | | 4,466 | | | | 206,990 | | | | 211,749 | | | | 144,734 | | | | 49,423 | | | | 30,305 | | | | 2,399 | | | | 2,215 | | | | 7.7 | |
| 2011 | | | | 4,502 | | | | 218,771 | | | | 218,203 | | | | 152,291 | | | | 50,911 | | | | 30,853 | | | | 2,404 | | | | 2,220 | | | | 7.7 | |
| 2012 | | | | 4,567 | | | | 223,328 | | | | 223,329 | | | | 158,221 | | | | 54,486 | | | | 31,066 | | | | 2,443 | | | | 2,275 | | | | 6.9 | |
| 2013 | | | | 4,630 | | | | 230,981 | | | | 228,310 | | | | 166,281 | | | | 53,814 | | | | 32,225 | | | | 2,454 | | | | 2,291 | | | | 6.6 | |
| 2014 | | | | 4,707 | | | | 243,872 | | | | 236,696 | | | | 172,841 | | | | 59,031 | | | | 34,951 | | | | 2,483 | | | | 2,332 | | | | 6.1 | |
| 2015 | | | | 4,776 | | | | 250,784 | | | | 241,509 | | | | 181,683 | | | | 59,392 | | | | 37,934 | | | | 2,527 | | | | 2,371 | | | | 6.2 | |
| 2016 | | | | 4,859 | | | | 263,912 | | | | 248,262 | | | | 187,000 | | | | 64,897 | | | | 43,556 | | | | 2,612 | | | | 2,454 | | | | 6.1 | |
| 2017 | | | | 4,929 | | | | 282,283 | | | | 257,724 | | | | 198,265 | | | | 69,871 | | | | 46,247 | | | | 2,694 | | | | 2,554 | | | | 5.2 | |
| 2018 | | | | 5,010 | | | | 296,135 | | | | 264,765 | | | | 203,820 | | | | 72,737 | | | | 46,245 | | | | 2,719 | | | | 2,590 | | | | 4.7 | |
| 2019 | | | | 5,091 | | | | 309,059 | | | | 271,789 | | | | 216,834 | | | | 79,858 | | | | 44,657 | | | | 2,798 | | | | 2,666 | | | | 4.7 | |
| 2020 | | | | 5,148 | | | | - | | | | - | | | | - | | | | - | | | | 47,789 | | | | 2,735 | | | | 2,491 | | | | 8.9 | |
| 1 | As at July 1. Data take into account adjustments made for net census undercount in 1996, 2001, 2006, 2011, 2016, non-permanent residents and incompletely enumerated Indian reserves. |
| 70 | 2021 FINANCIAL AND ECONOMIC REVIEW – JULY 2021 | |
| | | |
Appendix 1 – Economic Review Supplementary Tables
Table A1.1A Aggregate and Labour Market Indicators (continued)
| | | | | | | | | | Real GDP | | | Primary | | | Gross fixed | | | Business | | | | | | | | | Unemployment | |
| | | | Population1 | | | Nominal GDP | | | (chained) | | | household income | | | capital formation | | | incorporations | | | Labour force | | | Employment | | | rate | |
| | | | | | | | | | | | | | | | | | | | | | | | | | | | | |
| | | | (annual percentage change)2 | |
| 1982 | | | | 1.8 | | | | 0.0 | | | | (6.4 | ) | | | 5.8 | | | | (16.6 | ) | | | - | | | | 0.8 | | | | (5.0 | ) | | | 5.3 | |
| 1983 | | | | 1.1 | | | | 5.9 | | | | 0.7 | | | | 0.8 | | | | (1.4 | ) | | | - | | | | 1.3 | | | | (0.7 | ) | | | 1.8 | |
| 1984 | | | | 1.4 | | | | 5.0 | | | | 0.9 | | | | 4.8 | | | | (1.7 | ) | | | - | | | | 1.3 | | | | 0.0 | | | | 1.1 | |
| 1985 | | | | 0.9 | | | | 7.7 | | | | 7.0 | | | | 7.4 | | | | 7.9 | | | | - | | | | 1.9 | | | | 2.8 | | | | (0.7 | ) |
| 1986 | | | | 1.0 | | | | 5.7 | | | | 0.9 | | | | 5.9 | | | | (4.8 | ) | | | - | | | | 2.2 | | | | 4.1 | | | | (1.6 | ) |
| 1987 | | | | 1.5 | | | | 10.5 | | | | 6.1 | | | | 9.0 | | | | 14.5 | | | | - | | | | 2.7 | | | | 3.4 | | | | (0.6 | ) |
| 1988 | | | | 2.2 | | | | 10.7 | | | | 5.5 | | | | 10.6 | | | | 20.6 | | | | - | | | | 2.0 | | | | 4.1 | | | | (1.8 | ) |
| 1989 | | | | 2.6 | | | | 8.8 | | | | 3.2 | | | | 12.1 | | | | 23.3 | | | | - | | | | 3.8 | | | | 5.1 | | | | (1.2 | ) |
| 1990 | | | | 3.0 | | | | 5.0 | | | | 1.5 | | | | 10.5 | | | | 3.4 | | | | - | | | | 2.6 | | | | 3.4 | | | | (0.7 | ) |
| 1991 | | | | 2.5 | | | | 3.2 | | | | 0.3 | | | | 3.9 | | | | (0.6 | ) | | | (5.2 | ) | | | 2.8 | | | | 1.1 | | | | 1.5 | |
| 1992 | | | | 2.8 | | | | 6.5 | | | | 2.8 | | | | 4.3 | | | | 6.5 | | | | 10.1 | | | | 2.8 | | | | 2.5 | | | | 0.2 | |
| 1993 | | | | 2.9 | | | | 7.4 | | | | 4.7 | | | | 3.7 | | | | 4.3 | | | | 12.5 | | | | 2.7 | | | | 3.1 | | | | (0.4 | ) |
| 1994 | | | | 3.0 | | | | 6.6 | | | | 2.6 | | | | 5.0 | | | | 13.8 | | | | 12.3 | | | | 3.8 | | | | 4.5 | | | | (0.6 | ) |
| 1995 | | | | 2.8 | | | | 5.4 | | | | 2.6 | | | | 5.3 | | | | (5.4 | ) | | | (7.5 | ) | | | 1.7 | | | | 2.4 | | | | (0.6 | ) |
| 1996 | | | | 2.6 | | | | 3.1 | | | | 2.5 | | | | 2.9 | | | | (1.3 | ) | | | (2.6 | ) | | | 1.8 | | | | 1.6 | | | | 0.2 | |
| 1997 | | | | 1.9 | | | | 5.4 | | | | 3.3 | | | | 3.8 | | | | 8.9 | | | | (1.2 | ) | | | 2.3 | | | | 2.6 | | | | (0.2 | ) |
| 1998 | | | | 0.9 | | | | 1.0 | | | | 1.2 | | | | 2.9 | | | | (6.6 | ) | | | (9.6 | ) | | | 0.3 | | | | (0.1 | ) | | | 0.3 | |
| 1999 | | | | 0.7 | | | | 4.9 | | | | 3.5 | | | | 4.3 | | | | 0.5 | | | | 1.2 | | | | 1.3 | | | | 1.9 | | | | (0.5 | ) |
| 2000 | | | | 0.7 | | | | 8.6 | | | | 4.6 | | | | 5.5 | | | | 3.7 | | | | 1.8 | | | | 0.8 | | | | 2.0 | | | | (1.1 | ) |
| 2001 | | | | 0.9 | | | | 1.8 | | | | 0.7 | | | | 2.9 | | | | 8.5 | | | | (8.9 | ) | | | 0.1 | | | | (0.5 | ) | | | 0.5 | |
| 2002 | | | | 0.6 | | | | 3.7 | | | | 4.0 | | | | 4.0 | | | | 2.4 | | | | 7.8 | | | | 2.5 | | | | 1.6 | | | | 0.8 | |
| 2003 | | | | 0.6 | | | | 5.5 | | | | 2.3 | | | | 3.3 | | | | 8.5 | | | | 7.4 | | | | 1.7 | | | | 2.3 | | | | (0.5 | ) |
| 2004 | | | | 0.8 | | | | 8.3 | | | | 3.9 | | | | 6.3 | | | | 18.0 | | | | 9.6 | | | | 0.7 | | | | 1.5 | | | | (0.8 | ) |
| 2005 | | | | 1.0 | | | | 7.7 | | | | 5.0 | | | | 6.5 | | | | 14.8 | | | | 25.2 | | | | 1.5 | | | | 3.0 | | | | (1.3 | ) |
| 2006 | | | | 1.1 | | | | 7.5 | | | | 4.4 | | | | 8.9 | | | | 15.8 | | | | 7.6 | | | | 1.1 | | | | 2.3 | | | | (1.2 | ) |
| 2007 | | | | 1.2 | | | | 5.2 | | | | 3.1 | | | | 6.7 | | | | 8.6 | | | | 2.3 | | | | 2.6 | | | | 3.1 | | | | (0.4 | ) |
| 2008 | | | | 1.4 | | | | 3.0 | | | | 0.7 | | | | 3.4 | | | | 6.3 | | | | (11.6 | ) | | | 1.9 | | | | 1.6 | | | | 0.3 | |
| 2009 | | | | 1.4 | | | | (4.0 | ) | | | (2.4 | ) | | | (1.1 | ) | | | (12.1 | ) | | | (12.1 | ) | | | 1.0 | | | | (2.3 | ) | | | 3.2 | |
| 2010 | | | | 1.2 | | | | 4.4 | | | | 2.9 | | | | 3.0 | | | | 6.7 | | | | 14.7 | | | | 1.2 | | | | 1.3 | | | | (0.1 | ) |
| 2011 | | | | 0.8 | | | | 5.7 | | | | 3.0 | | | | 5.2 | | | | 3.0 | | | | 1.8 | | | | 0.2 | | | | 0.2 | | | | 0.0 | |
| 2012 | | | | 1.4 | | | | 2.1 | | | | 2.3 | | | | 3.9 | | | | 7.0 | | | | 0.7 | | | | 1.6 | | | | 2.5 | | | | (0.8 | ) |
| 2013 | | | | 1.4 | | | | 3.4 | | | | 2.2 | | | | 5.1 | | | | (1.2 | ) | | | 3.7 | | | | 0.5 | | | | 0.7 | | | | (0.3 | ) |
| 2014 | | | | 1.7 | | | | 5.6 | | | | 3.7 | | | | 3.9 | | | | 9.7 | | | | 8.5 | | | | 1.2 | | | | 1.8 | | | | (0.5 | ) |
| 2015 | | | | 1.5 | | | | 2.8 | | | | 2.0 | | | | 5.1 | | | | 0.6 | | | | 8.5 | | | | 1.8 | | | | 1.7 | | | | 0.1 | |
| 2016 | | | | 1.7 | | | | 5.2 | | | | 2.8 | | | | 2.9 | | | | 9.3 | | | | 14.8 | | | | 3.4 | | | | 3.5 | | | | (0.1 | ) |
| 2017 | | | | 1.4 | | | | 7.0 | | | | 3.8 | | | | 6.0 | | | | 7.7 | | | | 6.2 | | | | 3.1 | | | | 4.1 | | | | (0.9 | ) |
| 2018 | | | | 1.6 | | | | 4.9 | | | | 2.7 | | | | 2.8 | | | | 4.1 | | | | (0.0 | ) | | | 0.9 | | | | 1.4 | | | | (0.5 | ) |
| 2019 | | | | 1.6 | | | | 4.4 | | | | 2.7 | | | | 6.4 | | | | 9.8 | | | | (3.4 | ) | | | 2.9 | | | | 3.0 | | | | 0.0 | |
| 2020 | | | | 1.1 | | | | - | | | | - | | | | - | | | | - | | | | 7.0 | | | | (2.2 | ) | | | (6.6 | ) | | | 4.2 | |
| 1 | As at July 1. Data take into account adjustments made for net census undercount in 1996, 2001, 2006, 2011, 2016, non-permanent residents and incompletely enumerated Indian reserves. |
| 2 | Annual unemployment rate expressed as percentage point difference. |
Sources: Statistics Canada (Tables: 17-10-0005-01, 36-10-0222-01, 36-10-0224-01, 14-10-0327-01 - accessed May 2021) and BC Stats.
| | 2021 FINANCIAL AND ECONOMIC REVIEW – JULY 2021 | 71 |
| | | |
Appendix 1 – Economic Review Supplementary Tables
Table A1.1B Prices, Earnings and Financial Indicators
| | | | | | | | | | | | | | | Primary | | | Household | | | | | | | | | | |
| | | | | | | | | Average | | | Compensation | | | household | | | disposable | | | | | | | | | Conventional | |
| | | B.C. | | | Vancouver | | | weekly | | | of | | | income | | | income | | | Prime | | | Can/US | | | (5 year) | |
| | | CPI | | | CPI | | | wage rate1 | | | employees2 | | | per capita | | | per capita | | | rate | | | exchange rate | | | mortgage rate | |
| | | (2002=100) | | | (2002=100) | | | ($) | | | ($ millions) | | | (current $) | | | (current $) | | | (per cent) | | | (US cents) | | | (per cent)3 | |
| 1981 | | | 51.8 | | | | 51.2 | | | | - | | | | 25,554 | | | | 11,687 | | | | 9,535 | | | | 19.4 | | | | 83.4 | | | | 18.4 | |
| 1982 | | | 57.3 | | | | 56.6 | | | | - | | | | 26,380 | | | | 12,156 | | | | 10,085 | | | | 16.0 | | | | 81.1 | | | | 18.1 | |
| 1983 | | | 60.4 | | | | 59.7 | | | | - | | | | 26,834 | | | | 12,128 | | | | 10,139 | | | | 11.2 | | | | 81.1 | | | | 13.3 | |
| 1984 | | | 62.8 | | | | 62.1 | | | | - | | | | 27,748 | | | | 12,535 | | | | 10,611 | | | | 12.1 | | | | 77.2 | | | | 13.6 | |
| 1985 | | | 64.8 | | | | 64.0 | | | | - | | | | 29,303 | | | | 13,333 | | | | 11,377 | | | | 10.6 | | | | 73.2 | | | | 12.2 | |
| 1986 | | | 66.7 | | | | 66.2 | | | | - | | | | 30,408 | | | | 13,980 | | | | 11,863 | | | | 10.6 | | | | 72.0 | | | | 11.2 | |
| 1987 | | | 68.7 | | | | 68.2 | | | | - | | | | 33,177 | | | | 15,019 | | | | 12,695 | | | | 9.6 | | | | 75.4 | | | | 11.2 | |
| 1988 | | | 71.2 | | | | 70.6 | | | | - | | | | 36,537 | | | | 16,259 | | | | 13,587 | | | | 10.7 | | | | 81.3 | | | | 11.6 | |
| 1989 | | | 74.4 | | | | 73.8 | | | | - | | | | 40,711 | | | | 17,767 | | | | 14,843 | | | | 13.3 | | | | 84.5 | | | | 12.1 | |
| 1990 | | | 78.4 | | | | 77.8 | | | | - | | | | 44,656 | | | | 19,067 | | | | 15,528 | | | | 14.1 | | | | 85.7 | | | | 13.3 | |
| 1991 | | | 82.6 | | | | 81.9 | | | | - | | | | 46,772 | | | | 19,333 | | | | 15,887 | | | | 10.1 | | | | 87.3 | | | | 11.2 | |
| 1992 | | | 84.8 | | | | 84.3 | | | | - | | | | 49,430 | | | | 19,617 | | | | 16,272 | | | | 7.5 | | | | 82.7 | | | | 9.5 | |
| 1993 | | | 87.8 | | | | 87.3 | | | | - | | | | 51,782 | | | | 19,785 | | | | 16,575 | | | | 6.0 | | | | 77.5 | | | | 8.8 | |
| 1994 | | | 89.5 | | | | 89.1 | | | | - | | | | 54,492 | | | | 20,164 | | | | 16,744 | | | | 6.8 | | | | 73.2 | | | | 9.4 | |
| 1995 | | | 91.6 | | | | 91.3 | | | | - | | | | 57,214 | | | | 20,660 | | | | 16,934 | | | | 8.6 | | | | 72.9 | | | | 9.2 | |
| 1996 | | | 92.4 | | | | 92.1 | | | | - | | | | 58,685 | | | | 20,732 | | | | 16,884 | | | | 6.2 | | | | 73.3 | | | | 8.0 | |
| 1997 | | | 93.1 | | | | 92.6 | | | | 612.55 | | | | 60,816 | | | | 21,118 | | | | 17,198 | | | | 4.9 | | | | 72.2 | | | | 7.1 | |
| 1998 | | | 93.4 | | | | 93.0 | | | | 620.99 | | | | 62,340 | | | | 21,549 | | | | 17,491 | | | | 6.7 | | | | 67.4 | | | | 6.9 | |
| 1999 | | | 94.4 | | | | 93.9 | | | | 628.12 | | | | 64,358 | | | | 22,324 | | | | 18,318 | | | | 6.4 | | | | 67.3 | | | | 7.5 | |
| 2000 | | | 96.1 | | | | 96.0 | | | | 639.18 | | | | 68,975 | | | | 23,386 | | | | 18,872 | | | | 7.2 | | | | 67.3 | | | | 8.3 | |
| 2001 | | | 97.7 | | | | 97.8 | | | | 648.27 | | | | 70,663 | | | | 23,850 | | | | 19,826 | | | | 6.0 | | | | 64.6 | | | | 7.4 | |
| 2002 | | | 100.0 | | | | 100.0 | | | | 668.48 | | | | 73,752 | | | | 24,668 | | | | 20,996 | | | | 4.2 | | | | 63.7 | | | | 7.0 | |
| 2003 | | | 102.2 | | | | 102.0 | | | | 683.79 | | | | 76,134 | | | | 25,329 | | | | 21,447 | | | | 4.7 | | | | 71.4 | | | | 6.4 | |
| 2004 | | | 104.2 | | | | 104.0 | | | | 687.32 | | | | 81,017 | | | | 26,726 | | | | 22,427 | | | | 4.0 | | | | 76.8 | | | | 6.3 | |
| 2005 | | | 106.3 | | | | 106.0 | | | | 704.05 | | | | 86,189 | | | | 28,184 | | | | 23,216 | | | | 4.4 | | | | 82.5 | | | | 6.0 | |
| 2006 | | | 108.1 | | | | 108.0 | | | | 725.61 | | | | 94,384 | | | | 30,351 | | | | 25,108 | | | | 5.8 | | | | 88.2 | | | | 6.6 | |
| 2007 | | | 110.0 | | | | 110.2 | | | | 747.84 | | | | 99,719 | | | | 32,014 | | | | 26,428 | | | | 6.1 | | | | 93.1 | | | | 7.0 | |
| 2008 | | | 112.3 | | | | 112.8 | | | | 780.23 | | | | 103,735 | | | | 32,656 | | | | 27,179 | | | | 4.8 | | | | 93.7 | | | | 7.1 | |
| 2009 | | | 112.3 | | | | 112.9 | | | | 801.47 | | | | 101,368 | | | | 31,852 | | | | 27,274 | | | | 2.4 | | | | 87.6 | | | | 5.7 | |
| 2010 | | | 113.8 | | | | 114.9 | | | | 821.24 | | | | 103,864 | | | | 32,411 | | | | 28,225 | | | | 2.6 | | | | 97.1 | | | | 5.6 | |
| 2011 | | | 116.5 | | | | 117.5 | | | | 837.57 | | | | 108,841 | | | | 33,827 | | | | 28,969 | | | | 3.0 | | | | 101.1 | | | | 5.4 | |
| 2012 | | | 117.8 | | | | 119.0 | | | | 852.43 | | | | 112,543 | | | | 34,646 | | | | 29,722 | | | | 3.0 | | | | 100.1 | | | | 5.3 | |
| 2013 | | | 117.7 | | | | 119.2 | | | | 881.95 | | | | 117,735 | | | | 35,913 | | | | 30,982 | | | | 3.0 | | | | 97.1 | | | | 5.2 | |
| 2014 | | | 118.9 | | | | 120.5 | | | | 884.22 | | | | 122,520 | | | | 36,719 | | | | 31,512 | | | | 3.0 | | | | 90.5 | | | | 4.9 | |
| 2015 | | | 120.2 | | | | 121.9 | | | | 916.43 | | | | 127,754 | | | | 38,038 | | | | 32,610 | | | | 2.8 | | | | 78.2 | | | | 4.7 | |
| 2016 | | | 122.4 | | | | 124.6 | | | | 925.54 | | | | 130,955 | | | | 38,483 | | | | 33,038 | | | | 2.7 | | | | 75.4 | | | | 4.7 | |
| 2017 | | | 125.0 | | | | 127.3 | | | | 937.70 | | | | 138,027 | | | | 40,221 | | | | 34,782 | | | | 2.9 | | | | 77.0 | | | | 4.8 | |
| 2018 | | | 128.4 | | | | 131.0 | | | | 974.18 | | | | 145,349 | | | | 40,679 | | | | 34,888 | | | | 3.6 | | | | 77.2 | | | | 5.3 | |
| 2019 | | | 131.4 | | | | 134.1 | | | | 1,000.11 | | | | 153,325 | | | | 42,592 | | | | 36,450 | | | | 4.0 | | | | 75.4 | | | | 5.3 | |
| 2020 | | | 132.4 | | | | 134.9 | | | | 1,079.58 | | | | - | | | | - | | | | - | | | | 2.8 | | | | 74.6 | | | | 4.9 | |
| 1 | Data prior to 1997 are not available. |
| 2 | Component of household income account. This amount includes the wages, salaries and employers' social contributions earned by BC residents, regardless of where they are employed. |
| 3 | The most typical of those offered by the major chartered banks. |
| 72 | 2021 Financial and Economic Review – July 2021 | |
| | | |
Appendix 1 – Economic Review Supplementary Tables
Table A1.1B Prices, Earnings and Financial Indicators (continued)
| | | | | | | | | | | | | | | Primary | | | Household | | | | | | | | | | |
| | | | | | | | | Average | | | Compensation | | | household | | | disposable | | | | | | | | | Conventional | |
| | | B.C. | | | Vancouver | | | weekly | | | of | | | income | | | income | | | Prime | | | Can/US | | | (5 year) | |
| | | CPI | | | CPI | | | wage rate1 | | | employees2 | | | per capita | | | per capita | | | rate | | | exchange rate | | | mortgage rate3 | |
| | | | | | | | | | | | | | | | | | | | | | | | | | | | |
| | | (annual percentage change)4 | |
| 1982 | | | 10.6 | | | | 10.5 | | | | - | | | | 3.2 | | | | 4.0 | | | | 5.8 | | | | (3.4 | ) | | | (2.4 | ) | | | (0.2 | ) |
| 1983 | | | 5.4 | | | | 5.5 | | | | - | | | | 1.7 | | | | (0.2 | ) | | | 0.5 | | | | (4.8 | ) | | | 0.1 | | | | (4.9 | ) |
| 1984 | | | 4.0 | | | | 4.0 | | | | - | | | | 3.4 | | | | 3.4 | | | | 4.7 | | | | 0.9 | | | | (3.9 | ) | | | 0.3 | |
| 1985 | | | 3.2 | | | | 3.1 | | | | - | | | | 5.6 | | | | 6.4 | | | | 7.2 | | | | (1.5 | ) | | | (4.0 | ) | | | (1.4 | ) |
| 1986 | | | 2.9 | | | | 3.4 | | | | - | | | | 3.8 | | | | 4.9 | | | | 4.3 | | | | (0.1 | ) | | | (1.3 | ) | | | (1.0 | ) |
| 1987 | | | 3.0 | | | | 3.0 | | | | - | | | | 9.1 | | | | 7.4 | | | | 7.0 | | | | (1.0 | ) | | | 3.4 | | | | (0.1 | ) |
| 1988 | | | 3.6 | | | | 3.5 | | | | - | | | | 10.1 | | | | 8.3 | | | | 7.0 | | | | 1.2 | | | | 5.8 | | | | 0.5 | |
| 1989 | | | 4.5 | | | | 4.5 | | | | - | | | | 11.4 | | | | 9.3 | | | | 9.2 | | | | 2.5 | | | | 3.2 | | | | 0.4 | |
| 1990 | | | 5.4 | | | | 5.4 | | | | - | | | | 9.7 | | | | 7.3 | | | | 4.6 | | | | 0.9 | | | | 1.2 | | | | 1.3 | |
| 1991 | | | 5.4 | | | | 5.3 | | | | - | | | | 4.7 | | | | 1.4 | | | | 2.3 | | | | (4.0 | ) | | | 1.6 | | | | (2.1 | ) |
| 1992 | | | 2.7 | | | | 2.9 | | | | - | | | | 5.7 | | | | 1.5 | | | | 2.4 | | | | (2.6 | ) | | | (4.5 | ) | | | (1.7 | ) |
| 1993 | | | 3.5 | | | | 3.6 | | | | - | | | | 4.8 | | | | 0.9 | | | | 1.9 | | | | (1.6 | ) | | | (5.2 | ) | | | (0.8 | ) |
| 1994 | | | 1.9 | | | | 2.1 | | | | - | | | | 5.2 | | | | 1.9 | | | | 1.0 | | | | 0.8 | | | | (4.3 | ) | | | 0.6 | |
| 1995 | | | 2.3 | | | | 2.5 | | | | - | | | | 5.0 | | | | 2.5 | | | | 1.1 | | | | 1.9 | | | | (0.4 | ) | | | (0.2 | ) |
| 1996 | | | 0.9 | | | | 0.9 | | | | - | | | | 2.6 | | | | 0.3 | | | | (0.3 | ) | | | (2.4 | ) | | | 0.5 | | | | (1.2 | ) |
| 1997 | | | 0.8 | | | | 0.5 | | | | - | | | | 3.6 | | | | 1.9 | | | | 1.9 | | | | (1.3 | ) | | | (1.1 | ) | | | (0.9 | ) |
| 1998 | | | 0.3 | | | | 0.4 | | | | 1.4 | | | | 2.5 | | | | 2.0 | | | | 1.7 | | | | 1.7 | | | | (4.8 | ) | | | (0.1 | ) |
| 1999 | | | 1.1 | | | | 1.0 | | | | 1.1 | | | | 3.2 | | | | 3.6 | | | | 4.7 | | | | (0.2 | ) | | | (0.1 | ) | | | 0.6 | |
| 2000 | | | 1.8 | | | | 2.2 | | | | 1.8 | | | | 7.2 | | | | 4.8 | | | | 3.0 | | | | 0.8 | | | | 0.0 | | | | 0.8 | |
| 2001 | | | 1.7 | | | | 1.9 | | | | 1.4 | | | | 2.4 | | | | 2.0 | | | | 5.1 | | | | (1.3 | ) | | | (2.8 | ) | | | (0.9 | ) |
| 2002 | | | 2.4 | | | | 2.2 | | | | 3.1 | | | | 4.4 | | | | 3.4 | | | | 5.9 | | | | (1.8 | ) | | | (0.9 | ) | | | (0.4 | ) |
| 2003 | | | 2.2 | | | | 2.0 | | | | 2.3 | | | | 3.2 | | | | 2.7 | | | | 2.2 | | | | 0.5 | | | | 7.7 | | | | (0.6 | ) |
| 2004 | | | 2.0 | | | | 2.0 | | | | 0.5 | | | | 6.4 | | | | 5.5 | | | | 4.6 | | | | (0.7 | ) | | | 5.5 | | | | (0.2 | ) |
| 2005 | | | 2.0 | | | | 1.9 | | | | 2.4 | | | | 6.4 | | | | 5.5 | | | | 3.5 | | | | 0.4 | | | | 5.7 | | | | (0.3 | ) |
| 2006 | | | 1.7 | | | | 1.9 | | | | 3.1 | | | | 9.5 | | | | 7.7 | | | | 8.1 | | | | 1.4 | | | | 5.6 | | | | 0.7 | |
| 2007 | | | 1.8 | | | | 2.0 | | | | 3.1 | | | | 5.7 | | | | 5.5 | | | | 5.3 | | | | 0.3 | | | | 5.0 | | | | 0.4 | |
| 2008 | | | 2.1 | | | | 2.4 | | | | 4.3 | | | | 4.0 | | | | 2.0 | | | | 2.8 | | | | (1.3 | ) | | | 0.6 | | | | 0.1 | |
| 2009 | | | 0.0 | | | | 0.1 | | | | 2.7 | | | | (2.3 | ) | | | (2.5 | ) | | | 0.4 | | | | (2.4 | ) | | | (6.1 | ) | | | (1.4 | ) |
| 2010 | | | 1.3 | | | | 1.8 | | | | 2.5 | | | | 2.5 | | | | 1.8 | | | | 3.5 | | | | 0.2 | | | | 9.5 | | | | (0.1 | ) |
| 2011 | | | 2.4 | | | | 2.3 | | | | 2.0 | | | | 4.8 | | | | 4.4 | | | | 2.6 | | | | 0.4 | | | | 4.0 | | | | (0.2 | ) |
| 2012 | | | 1.1 | | | | 1.3 | | | | 1.8 | | | | 3.4 | | | | 2.4 | | | | 2.6 | | | | 0.0 | | | | (1.0 | ) | | | (0.1 | ) |
| 2013 | | | (0.1 | ) | | | 0.2 | | | | 3.5 | | | | 4.6 | | | | 3.7 | | | | 4.2 | | | | 0.0 | | | | (3.0 | ) | | | (0.0 | ) |
| 2014 | | | 1.0 | | | | 1.1 | | | | 0.3 | | | | 4.1 | | | | 2.2 | | | | 1.7 | | | | 0.0 | | | | (6.6 | ) | | | (0.3 | ) |
| 2015 | | | 1.1 | | | | 1.2 | | | | 3.6 | | | | 4.3 | | | | 3.6 | | | | 3.5 | | | | (0.2 | ) | | | (12.3 | ) | | | (0.2 | ) |
| 2016 | | | 1.8 | | | | 2.2 | | | | 1.0 | | | | 2.5 | | | | 1.2 | | | | 1.3 | | | | (0.1 | ) | | | (2.8 | ) | | | (0.0 | ) |
| 2017 | | | 2.1 | | | | 2.2 | | | | 1.3 | | | | 5.4 | | | | 4.5 | | | | 5.3 | | | | 0.2 | | | | 1.6 | | | | 0.1 | |
| 2018 | | | 2.7 | | | | 2.9 | | | | 3.9 | | | | 5.3 | | | | 1.1 | | | | 0.3 | | | | 0.7 | | | | 0.1 | | | | 0.5 | |
| 2019 | | | 2.3 | | | | 2.4 | | | | 2.7 | | | | 5.5 | | | | 4.7 | | | | 4.5 | | | | 0.4 | | | | (1.8 | ) | | | 0.0 | |
| 2020 | | | 0.8 | | | | 0.6 | | | | 7.9 | | | | - | | | | - | | | | - | | | | (1.2 | ) | | | (0.8 | ) | | | (0.3 | ) |
| 1 | Data prior to 1997 are not available. |
| 2 | Component of household income account. This amount includes the wages, salaries and employers’ social contributions earned by BC residents, regardless of where they are employed. |
| 3 | The most typical of those offered by the major chartered banks. |
| 4 | Prime rate, exchange rate and conventional (5 year) mortgage rates expressed as percentage point difference. |
Sources: Statistics Canada (Tables: 18-10-0005-01, 14-10-0064-01, 36-10-0224-01, 10-10-0122-01, 10-10-0145-01 - accessed May 2021), Haver Analytics and BC Stats.
| | 2021 Financial and Economic Review – July 2021 | 73 |
| | | |
Appendix 1 – Economic Review Supplementary Tables
Table A1.1C Other Indicators
| | | Manufacturing | | | | | | Housing | | | Non-residential | | | MLS home | | | MLS average | | | Tourism | | | High-tech | | | B.C. international | |
| | | shipments | | | Retail sales | | | starts | | | building permits | | | sales | | | home sale price | | | GDP1 | | | GDP2 | | | goods exports | |
| | | ($ millions) | | | ($ millions) | | | (units) | | | ($ millions) | | | (units) | | | ($) | | | ($ millions) | | | ($ millions) | | | ($ millions) | |
| 1981 | | | - | | | | - | | | | 41,585 | | | | 1,335 | | | | 19,161 | | | | 117,534 | | | | - | | | | - | | | | 8,877 | |
| 1982 | | | - | | | | - | | | | 19,807 | | | | 1,026 | | | | 25,040 | | | | 93,951 | | | | - | | | | - | | | | 9,925 | |
| 1983 | | | - | | | | - | | | | 22,607 | | | | 775 | | | | 32,131 | | | | 95,620 | | | | - | | | | - | | | | 11,659 | |
| 1984 | | | - | | | | - | | | | 16,169 | | | | 827 | | | | 30,955 | | | | 90,923 | | | | - | | | | - | | | | 12,315 | |
| 1985 | | | - | | | | - | | | | 17,969 | | | | 812 | | | | 43,530 | | | | 87,957 | | | | - | | | | - | | | | 12,715 | |
| 1986 | | | - | | | | - | | | | 20,687 | | | | 912 | | | | 46,145 | | | | 92,852 | | | | - | | | | - | | | | 15,690 | |
| 1987 | | | - | | | | - | | | | 28,944 | | | | 999 | | | | 56,376 | | | | 101,916 | | | | - | | | | - | | | | 15,883 | |
| 1988 | | | - | | | | - | | | | 30,487 | | | | 1,647 | | | | 67,460 | | | | 121,040 | | | | - | | | | - | | | | 17,405 | |
| 1989 | | | - | | | | - | | | | 38,894 | | | | 1,812 | | | | 83,652 | | | | 151,400 | | | | - | | | | - | | | | 17,775 | |
| 1990 | | | - | | | | - | | | | 36,720 | | | | 1,833 | | | | 58,027 | | | | 157,616 | | | | - | | | | - | | | | 16,607 | |
| 1991 | | | - | | | | 25,022 | | | | 31,875 | | | | 1,803 | | | | 84,554 | | | | 168,235 | | | | - | | | | - | | | | 15,253 | |
| 1992 | | | 24,398 | | | | 26,194 | | | | 40,621 | | | | 2,082 | | | | 93,564 | | | | 189,999 | | | | - | | | | - | | | | 16,336 | |
| 1993 | | | 26,583 | | | | 28,463 | | | | 42,807 | | | | 1,944 | | | | 80,919 | | | | 211,992 | | | | - | | | | - | | | | 19,034 | |
| 1994 | | | 30,333 | | | | 31,770 | | | | 39,408 | | | | 1,772 | | | | 75,315 | | | | 228,154 | | | | - | | | | - | | | | 22,856 | |
| 1995 | | | 34,207 | | | | 34,219 | | | | 27,057 | | | | 1,966 | | | | 58,082 | | | | 221,860 | | | | - | | | | - | | | | 26,874 | |
| 1996 | | | 32,932 | | | | 34,775 | | | | 27,641 | | | | 1,957 | | | | 72,037 | | | | 218,943 | | | | - | | | | - | | | | 25,717 | |
| 1997 | | | 33,496 | | | | 36,591 | | | | 29,351 | | | | 1,960 | | | | 68,154 | | | | 220,503 | | | | - | | | | 6,282 | | | | 26,699 | |
| 1998 | | | 31,757 | | | | 35,762 | | | | 19,931 | | | | 2,022 | | | | 52,889 | | | | 212,056 | | | | - | | | | 6,498 | | | | 25,942 | |
| 1999 | | | 36,679 | | | | 36,373 | | | | 16,309 | | | | 2,104 | | | | 58,093 | | | | 215,252 | | | | - | | | | 6,506 | | | | 29,044 | |
| 2000 | | | 40,699 | | | | 38,435 | | | | 14,418 | | | | 2,089 | | | | 54,431 | | | | 220,763 | | | | - | | | | 7,309 | | | | 33,640 | |
| 2001 | | | 38,303 | | | | 40,719 | | | | 17,234 | | | | 2,125 | | | | 69,813 | | | | 222,259 | | | | - | | | | 7,380 | | | | 31,680 | |
| 2002 | | | 38,610 | | | | 43,265 | | | | 21,625 | | | | 1,771 | | | | 82,941 | | | | 238,325 | | | | - | | | | 7,584 | | | | 28,828 | |
| 2003 | | | 39,772 | | | | 44,421 | | | | 26,174 | | | | 1,880 | | | | 93,611 | | | | 259,250 | | | | - | | | | 8,507 | | | | 28,265 | |
| 2004 | | | 41,607 | | | | 47,219 | | | | 32,925 | | | | 2,070 | | | | 96,975 | | | | 288,140 | | | | - | | | | 8,968 | | | | 31,008 | |
| 2005 | | | 42,883 | | | | 49,380 | | | | 34,667 | | | | 3,212 | | | | 106,888 | | | | 331,379 | | | | - | | | | 9,767 | | | | 34,167 | |
| 2006 | | | 44,480 | | | | 53,136 | | | | 36,443 | | | | 3,921 | | | | 97,420 | | | | 389,881 | | | | - | | | | 10,513 | | | | 33,466 | |
| 2007 | | | 42,418 | | | | 56,936 | | | | 39,195 | | | | 3,933 | | | | 103,179 | | | | 438,718 | | | | 5,837 | | | | 11,440 | | | | 31,524 | |
| 2008 | | | 39,435 | | | | 57,794 | | | | 34,321 | | | | 3,678 | | | | 69,244 | | | | 453,361 | | | | 5,858 | | | | 11,714 | | | | 33,124 | |
| 2009 | | | 32,951 | | | | 55,288 | | | | 16,077 | | | | 3,139 | | | | 85,191 | | | | 465,321 | | | | 5,790 | | | | 11,685 | | | | 25,240 | |
| 2010 | | | 35,575 | | | | 58,251 | | | | 26,479 | | | | 3,018 | | | | 74,927 | | | | 504,678 | | | | 6,154 | | | | 12,079 | | | | 28,646 | |
| 2011 | | | 37,998 | | | | 60,090 | | | | 26,400 | | | | 3,136 | | | | 76,990 | | | | 560,662 | | | | 6,346 | | | | 12,906 | | | | 32,671 | |
| 2012 | | | 38,491 | | | | 61,217 | | | | 27,465 | | | | 4,048 | | | | 67,756 | | | | 514,218 | | | | 6,535 | | | | 13,564 | | | | 31,484 | |
| 2013 | | | 40,199 | | | | 62,944 | | | | 27,054 | | | | 3,108 | | | | 73,048 | | | | 536,966 | | | | 6,835 | | | | 13,752 | | | | 33,421 | |
| 2014 | | | 43,888 | | | | 66,916 | | | | 28,356 | | | | 3,729 | | | | 84,153 | | | | 568,100 | | | | 7,159 | | | | 14,595 | | | | 35,832 | |
| 2015 | | | 45,157 | | | | 71,609 | | | | 31,446 | | | | 3,680 | | | | 102,684 | | | | 635,870 | | | | 7,668 | | | | 15,192 | | | | 35,497 | |
| 2016 | | | 47,089 | | | | 77,109 | | | | 41,843 | | | | 3,392 | | | | 112,425 | | | | 690,348 | | | | 8,260 | | | | 16,158 | | | | 38,423 | |
| 2017 | | | 51,320 | | | | 84,291 | | | | 43,664 | | | | 4,212 | | | | 103,957 | | | | 708,857 | | | | 8,993 | | | | 17,064 | | | | 43,241 | |
| 2018 | | | 55,115 | | | | 85,933 | | | | 40,857 | | | | 5,691 | | | | 78,524 | | | | 711,379 | | | | 9,624 | | | | 18,060 | | | | 46,280 | |
| 2019 | | | 53,311 | | | | 86,428 | | | | 44,932 | | | | 6,121 | | | | 77,349 | | | | 700,376 | | | | 10,184 | | | | 19,248 | | | | 43,432 | |
| 2020 | | | 51,529 | | | | 87,513 | | | | 37,903 | | | | 5,216 | | | | 94,008 | | | | 781,770 | | | | - | | | | - | | | | 39,925 | |
| 1 | Data prior to 2007 are not available. |
| 2 | Data prior to 1997 are not available. |
| 74 | 2021 Financial and Economic Review – July 2021 | |
| | | |
Appendix 1 – Economic Review Supplementary Tables
Table A1.1C Other Indicators (continued)
| | | Manufacturing | | | | | | Housing | | | Non-residential | | | MLS Home | | | MLS Average | | | Tourism | | | High-tech | | | B.C. international | |
| | | shipments | | | Retail sales | | | starts | | | building permits | | | Sales | | | Home Sale Price | | | GDP1 | | | GDP2 | | | goods exports | |
| | | | | | | | | | | | | | | | | | | | | | | | | | | | |
| | | (annual percentage change) | |
| 1982 | | | - | | | | - | | | | (52.4 | ) | | | (0.2 | ) | | | 30.7 | | | | (20.1 | ) | | | - | | | | - | | | | 11.8 | |
| 1983 | | | - | | | | - | | | | 14.1 | | | | (24.5 | ) | | | 28.3 | | | | 1.8 | | | | - | | | | - | | | | 17.5 | |
| 1984 | | | - | | | | - | | | | (28.5 | ) | | | 6.7 | | | | (3.7 | ) | | | (4.9 | ) | | | - | | | | - | | | | 5.6 | |
| 1985 | | | - | | | | - | | | | 11.1 | | | | (1.7 | ) | | | 40.6 | | | | (3.3 | ) | | | - | | | | - | | | | 3.3 | |
| 1986 | | | - | | | | - | | | | 15.1 | | | | 12.3 | | | | 6.0 | | | | 5.6 | | | | - | | | | - | | | | 23.4 | |
| 1987 | | | - | | | | - | | | | 39.9 | | | | 9.6 | | | | 22.2 | | | | 9.8 | | | | - | | | | - | | | | 1.2 | |
| 1988 | | | - | | | | - | | | | 5.3 | | | | 64.9 | | | | 19.7 | | | | 18.8 | | | | - | | | | - | | | | 9.6 | |
| 1989 | | | - | | | | - | | | | 27.6 | | | | 10.0 | | | | 24.0 | | | | 25.1 | | | | - | | | | - | | | | 2.1 | |
| 1990 | | | - | | | | - | | | | (5.6 | ) | | | 1.2 | | | | (30.6 | ) | | | 4.1 | | | | - | | | | - | | | | (6.6 | ) |
| 1991 | | | - | | | | - | | | | (13.2 | ) | | | (1.6 | ) | | | 45.7 | | | | 6.7 | | | | - | | | | - | | | | (8.2 | ) |
| 1992 | | | - | | | | 4.7 | | | | 27.4 | | | | 15.5 | | | | 10.7 | | | | 12.9 | | | | - | | | | - | | | | 7.1 | |
| 1993 | | | 9.0 | | | | 8.7 | | | | 5.4 | | | | (6.7 | ) | | | (13.5 | ) | | | 11.6 | | | | - | | | | - | | | | 16.5 | |
| 1994 | | | 14.1 | | | | 11.6 | | | | (7.9 | ) | | | (8.9 | ) | | | (6.9 | ) | | | 7.6 | | | | - | | | | - | | | | 20.1 | |
| 1995 | | | 12.8 | | | | 7.7 | | | | (31.3 | ) | | | 11.0 | | | | (22.9 | ) | | | (2.8 | ) | | | - | | | | - | | | | 17.6 | |
| 1996 | | | (3.7 | ) | | | 1.6 | | | | 2.2 | | | | (0.4 | ) | | | 24.0 | | | | (1.3 | ) | | | - | | | | - | | | | (4.3 | ) |
| 1997 | | | 1.7 | | | | 5.2 | | | | 6.2 | | | | 0.1 | | | | (5.4 | ) | | | 0.7 | | | | - | | | | - | | | | 3.8 | |
| 1998 | | | (5.2 | ) | | | (2.3 | ) | | | (32.1 | ) | | | 3.2 | | | | (22.4 | ) | | | (3.8 | ) | | | - | | | | 3.4 | | | | (2.8 | ) |
| 1999 | | | 15.5 | | | | 1.7 | | | | (18.2 | ) | | | 4.0 | | | | 9.8 | | | | 1.5 | | | | - | | | | 0.1 | | | | 12.0 | |
| 2000 | | | 11.0 | | | | 5.7 | | | | (11.6 | ) | | | (0.7 | ) | | | (6.3 | ) | | | 2.6 | | | | - | | | | 12.3 | | | | 15.8 | |
| 2001 | | | (5.9 | ) | | | 5.9 | | | | 19.5 | | | | 1.7 | | | | 28.3 | | | | 0.7 | | | | - | | | | 1.0 | | | | (5.8 | ) |
| 2002 | | | 0.8 | | | | 6.3 | | | | 25.5 | | | | (16.6 | ) | | | 18.8 | | | | 7.2 | | | | - | | | | 2.8 | | | | (9.0 | ) |
| 2003 | | | 3.0 | | | | 2.7 | | | | 21.0 | | | | 6.1 | | | | 12.9 | | | | 8.8 | | | | - | | | | 12.2 | | | | (2.0 | ) |
| 2004 | | | 4.6 | | | | 6.3 | | | | 25.8 | | | | 10.1 | | | | 3.6 | | | | 11.1 | | | | - | | | | 5.4 | | | | 9.7 | |
| 2005 | | | 3.1 | | | | 4.6 | | | | 5.3 | | | | 55.2 | | | | 10.2 | | | | 15.0 | | | | - | | | | 8.9 | | | | 10.2 | |
| 2006 | | | 3.7 | | | | 7.6 | | | | 5.1 | | | | 22.1 | | | | (8.9 | ) | | | 17.7 | | | | - | | | | 7.6 | | | | (2.1 | ) |
| 2007 | | | (4.6 | ) | | | 7.2 | | | | 7.6 | | | | 0.3 | | | | 5.9 | | | | 12.5 | | | | - | | | | 8.8 | | | | (5.8 | ) |
| 2008 | | | (7.0 | ) | | | 1.5 | | | | (12.4 | ) | | | (6.5 | ) | | | (32.9 | ) | | | 3.3 | | | | 0.4 | | | | 2.4 | | | | 5.1 | |
| 2009 | | | (16.4 | ) | | | (4.3 | ) | | | (53.2 | ) | | | (14.7 | ) | | | 23.0 | | | | 2.6 | | | | (1.2 | ) | | | (0.2 | ) | | | (23.8 | ) |
| 2010 | | | 8.0 | | | | 5.4 | | | | 64.7 | | | | (3.9 | ) | | | (12.0 | ) | | | 8.5 | | | | 6.3 | | | | 3.4 | | | | 13.5 | |
| 2011 | | | 6.8 | | | | 3.2 | | | | (0.3 | ) | | | 3.9 | | | | 2.8 | | | | 11.1 | | | | 3.1 | | | | 6.8 | | | | 14.1 | |
| 2012 | | | 1.3 | | | | 1.9 | | | | 4.0 | | | | 29.1 | | | | (12.0 | ) | | | (8.3 | ) | | | 3.0 | | | | 5.1 | | | | (3.6 | ) |
| 2013 | | | 4.4 | | | | 2.8 | | | | (1.5 | ) | | | (23.2 | ) | | | 7.8 | | | | 4.4 | | | | 4.6 | | | | 1.4 | | | | 6.2 | |
| 2014 | | | 9.2 | | | | 6.3 | | | | 4.8 | | | | 20.0 | | | | 15.2 | | | | 5.8 | | | | 4.7 | | | | 6.1 | | | | 7.2 | |
| 2015 | | | 2.9 | | | | 7.0 | | | | 10.9 | | | | (1.3 | ) | | | 22.0 | | | | 11.9 | | | | 7.1 | | | | 4.1 | | | | (0.9 | ) |
| 2016 | | | 4.3 | | | | 7.7 | | | | 33.1 | | | | (7.8 | ) | | | 9.5 | | | | 8.6 | | | | 7.7 | | | | 6.4 | | | | 8.2 | |
| 2017 | | | 9.0 | | | | 9.3 | | | | 4.4 | | | | 24.2 | | | | (7.5 | ) | | | 2.7 | | | | 8.9 | | | | 5.6 | | | | 12.5 | |
| 2018 | | | 7.4 | | | | 1.9 | | | | (6.4 | ) | | | 35.1 | | | | (24.5 | ) | | | 0.4 | | | | 7.0 | | | | 5.8 | | | | 7.0 | |
| 2019 | | | (3.3 | ) | | | 0.6 | | | | 10.0 | | | | 7.5 | | | | (1.5 | ) | | | (1.5 | ) | | | 5.8 | | | | 6.6 | | | | (6.2 | ) |
| 2020 | | | (3.3 | ) | | | 1.3 | | | | (15.6 | ) | | | (14.8 | ) | | | 21.5 | | | | 11.6 | | | | - | | | | - | | | | (8.1 | ) |
| 1 | Data prior to 2007 are not available. |
| 2 | Data prior to 1997 are not available. |
Sources: Statistics Canada (Tables: 16-10-0048-01, 20-10-0008-01, 34-10-0135-01, 34-10-0066-01, 34-10-0003-01 - accessed May 2021); Canadian Real Estate Association; Haver Analytics and BC Stats.
| | 2021 Financial and Economic Review – July 2021 | 75 |
| | | |
Appendix 1 – Economic Review Supplementary Tables
Table A1.1D Commodity Production Indicators
| | | Lumber1 | | | Timber scale | | | Pulp | | | Newsprint, etc | | | Oil & natural | | | Coal | | | Solid mineral | | | Electric pwr | | | Farm cash | | | Landed value of | |
| | | production | | | data | | | production | | | production | | | gas production | | | production | | | shipments | | | generated | | | receipts | | | seafood products | |
| | | (thousand m3) | | | (thousand m3) | | | (000 tonnes) | | | (000 tonnes) | | | ($ millions) | | | (000 tonnes) | | | ($ millions) | | | (GW.h) | | | ($ millions) | | | ($ millions) | |
| 1981 | | | 24,598 | | | | - | | | | - | | | | - | | | | - | | | | 11,782 | | | | - | | | | 51,008 | | | | 877 | | | | - | |
| 1982 | | | 23,855 | | | | - | | | | 2,823 | | | | 1,872 | | | | - | | | | 11,769 | | | | 2,769 | | | | 48,238 | | | | 962 | | | | 241 | |
| 1983 | | | 30,773 | | | | - | | | | 3,267 | | | | 2,148 | | | | - | | | | 11,717 | | | | 2,903 | | | | 47,213 | | | | 917 | | | | 210 | |
| 1984 | | | 30,884 | | | | - | | | | 3,051 | | | | 2,084 | | | | - | | | | 20,771 | | | | 3,346 | | | | 52,369 | | | | 1,005 | | | | 243 | |
| 1985 | | | 32,994 | | | | 76,869 | | | | 3,442 | | | | 2,470 | | | | - | | | | 22,993 | | | | 3,541 | | | | 59,126 | | | | 1,061 | | | | 378 | |
| 1986 | | | 31,468 | | | | 77,503 | | | | 3,727 | | | | 2,628 | | | | - | | | | 20,361 | | | | 3,160 | | | | 50,759 | | | | 1,106 | | | | 405 | |
| 1987 | | | 37,336 | | | | 90,592 | | | | 4,291 | | | | 2,759 | | | | - | | | | 21,990 | | | | 3,615 | | | | 63,066 | | | | 1,122 | | | | 455 | |
| 1988 | | | 36,736 | | | | 86,808 | | | | 4,354 | | | | 2,878 | | | | - | | | | 24,942 | | | | 3,943 | | | | 60,943 | | | | 1,206 | | | | 573 | |
| 1989 | | | 35,952 | | | | 86,793 | | | | 4,281 | | | | 2,862 | | | | 585 | | | | 24,800 | | | | 4,123 | | | | 57,655 | | | | 1,255 | | | | 513 | |
| 1990 | | | 33,514 | | | | 78,045 | | | | 3,709 | | | | 3,002 | | | | 902 | | | | 24,557 | | | | 3,954 | | | | 60,662 | | | | 1,299 | | | | 559 | |
| 1991 | | | 31,406 | | | | 73,449 | | | | 3,957 | | | | 2,721 | | | | 858 | | | | 24,965 | | | | 3,840 | | | | 62,981 | | | | 1,342 | | | | 492 | |
| 1992 | | | 33,396 | | | | 73,937 | | | | 3,954 | | | | 2,692 | | | | 890 | | | | 17,173 | | | | 3,500 | | | | 64,058 | | | | 1,404 | | | | 533 | |
| 1993 | | | 33,935 | | | | 79,232 | | | | 3,981 | | | | 3,067 | | | | 1,089 | | | | 20,633 | | | | 3,538 | | | | 58,774 | | | | 1,446 | | | | 605 | |
| 1994 | | | 33,671 | | | | 75,639 | | | | 4,670 | | | | 2,947 | | | | 1,270 | | | | 22,583 | | | | 4,066 | | | | 61,015 | | | | 1,538 | | | | 728 | |
| 1995 | | | 32,611 | | | | 75,430 | | | | 4,773 | | | | 2,836 | | | | 1,040 | | | | 24,350 | | | | 4,501 | | | | 58,006 | | | | 1,586 | | | | 604 | |
| 1996 | | | 32,671 | | | | 73,099 | | | | 4,473 | | | | 2,842 | | | | 1,333 | | | | 25,420 | | | | 4,340 | | | | 71,765 | | | | 1,706 | | | | 590 | |
| 1997 | | | 31,562 | | | | 69,155 | | | | 4,532 | | | | 2,260 | | | | 1,588 | | | | 27,830 | | | | 4,681 | | | | 66,961 | | | | 1,738 | | | | 604 | |
| 1998 | | | 30,238 | | | | 65,451 | | | | 4,296 | | | | 2,781 | | | | 1,574 | | | | 24,800 | | | | 4,466 | | | | 67,710 | | | | 1,780 | | | | 547 | |
| 1999 | | | 32,397 | | | | 75,878 | | | | 4,921 | | | | 3,047 | | | | 2,091 | | | | 24,845 | | | | 4,536 | | | | 68,045 | | | | 1,885 | | | | 613 | |
| 2000 | | | 34,346 | | | | 76,009 | | | | 5,324 | | | | 3,106 | | | | 4,783 | | | | 25,681 | | | | 7,901 | | | | 68,241 | | | | 2,024 | | | | 667 | |
| 2001 | | | 32,606 | | | | 69,796 | | | | 4,525 | | | | 2,900 | | | | 5,666 | | | | 27,006 | | | | 8,623 | | | | 57,332 | | | | 2,201 | | | | 647 | |
| 2002 | | | 35,501 | | | | 75,208 | | | | 4,465 | | | | 2,905 | | | | 4,251 | | | | 24,397 | | | | 2,864 | | | | 64,945 | | | | 2,174 | | | | 664 | |
| 2003 | | | 36,052 | | | | 74,899 | | | | 4,785 | | | | 2,916 | | | | 6,230 | | | | 23,073 | | | | 2,887 | | | | 63,051 | | | | 2,248 | | | | 645 | |
| 2004 | | | 39,951 | | | | 81,679 | | | | 4,777 | | | | 3,046 | | | | 6,784 | | | | 27,314 | | | | 3,740 | | | | 60,496 | | | | 2,360 | | | | 635 | |
| 2005 | | | 41,129 | | | | 83,590 | | | | 4,937 | | | | 2,982 | | | | 8,967 | | | | 26,715 | | | | 5,384 | | | | 67,774 | | | | 2,389 | | | | 706 | |
| 2006 | | | 41,198 | | | | 80,350 | | | | 4,742 | | | | 3,010 | | | | 7,148 | | | | 23,057 | | | | 5,991 | | | | 61,598 | | | | 2,346 | | | | 788 | |
| 2007 | | | 36,811 | | | | 72,684 | | | | 4,742 | | | | 2,764 | | | | 6,934 | | | | 25,725 | | | | 5,611 | | | | 71,830 | | | | 2,381 | | | | 727 | |
| 2008 | | | 28,263 | | | | 61,137 | | | | 4,115 | | | | 2,521 | | | | 9,264 | | | | 26,163 | | | | 7,403 | | | | 66,072 | | | | 2,522 | | | | 718 | |
| 2009 | | | 22,935 | | | | 48,822 | | | | 3,547 | | | | 2,094 | | | | 4,120 | | | | 21,193 | | | | 5,622 | | | | 65,057 | | | | 2,525 | | | | 700 | |
| 2010 | | | 26,831 | | | | 63,336 | | | | 4,262 | | | | 1,621 | | | | 4,528 | | | | 26,040 | | | | 7,166 | | | | 64,224 | | | | 2,547 | | | | 873 | |
| 2011 | | | 28,414 | | | | 69,580 | | | | 4,502 | | | | 1,553 | | | | 4,945 | | | | 27,431 | | | | 8,982 | | | | 69,257 | | | | 2,688 | | | | 813 | |
| 2012 | | | 29,164 | | | | 68,133 | | | | 4,444 | | | | 1,445 | | | | 3,415 | | | | 28,777 | | | | 7,826 | | | | 73,584 | | | | 2,845 | | | | 713 | |
| 2013 | | | 30,023 | | | | 71,053 | | | | 4,296 | | | | 1,420 | | | | 4,676 | | | | 31,132 | | | | 7,112 | | | | 67,851 | | | | 2,883 | | | | 775 | |
| 2014 | | | 29,635 | | | | 66,382 | | | | 4,294 | | | | 1,435 | | | | 6,996 | | | | 29,392 | | | | 6,815 | | | | 67,008 | | | | 3,037 | | | | 862 | |
| 2015 | | | 30,612 | | | | 68,711 | | | | 4,320 | | | | 1,252 | | | | 3,536 | | | | 25,551 | | | | 6,186 | | | | 71,771 | | | | 3,188 | | | | 885 | |
| 2016 | | | 31,448 | | | | 66,253 | | | | 4,223 | | | | 1,143 | | | | 3,077 | | | | 26,027 | | | | 6,704 | | | | 69,703 | | | | 3,119 | | | | 1,180 | |
| 2017 | | | 30,337 | | | | 64,525 | | | | 4,215 | | | | 1,126 | | | | 3,963 | | | | | x | | | 9,178 | | | | 74,476 | | | | 3,243 | | | | 1,187 | |
| 2018 | | | 29,200 | | | | 67,928 | | | | 4,089 | | | | 1,042 | | | | 4,750 | | | | | x | | | 9,783 | | | | 69,924 | | | | 3,453 | | | | 1,274 | |
| 2019 | | | 22,839 | | | | 54,299 | | | | 4,097 | | | | 986 | | | | 4,268 | | | | | x | | | 8,800 | | | | 65,013 | | | | 3,942 | | | | 1,106 | |
| 2020 | | | 21,051 | | | | 51,601 | | | | 3,926 | | | | 581 | | | | 4,015 | | | | - | | | | - | | | | - | | | | 4,026 | | | | - | |
| 1 | Total lumber production is total softwood production. |
| x | Suppressed to meet the confidentiality requirements of the Statistics Act. |

| 76 | 2021 FINANCIAL AND ECONOMIC REVIEW – JULY 2021 | |
| | | |
Appendix 1 – Economic Review Supplementary Tables
Table A1.1D Commodity Production Indicators (continued)
| | | | Lumber1 | | | Timber scale | | | Pulp | | | Newsprint, etc | | | Oil & natural | | | Coal | | | Solid mineral | | | Electric pwr | | | Farm cash | | | Landed value of | |
| | | | production | | | data | | | production | | | production | | | gas production | | | production | | | shipments | | | generated | | | receipts | | | seafood products | |
| | | | | | | | | | | | | | | | | | | | | | | | | | | | | | | | |
| | | | (annual percentage change) | |
| 1982 | | | | (3.0 | ) | | | - | | | | - | | | | - | | | | - | | | | (0.1 | ) | | | - | | | | (5.4 | ) | | | 9.7 | | | | - | |
| 1983 | | | | 29.0 | | | | - | | | | 15.7 | | | | 14.7 | | | | - | | | | (0.4 | ) | | | 4.8 | | | | (2.1 | ) | | | (4.7 | ) | | | (12.9 | ) |
| 1984 | | | | 0.4 | | | | - | | | | (6.6 | ) | | | (3.0 | ) | | | - | | | | 77.3 | | | | 15.3 | | | | 10.9 | | | | 9.6 | | | | 15.7 | |
| 1985 | | | | 6.8 | | | | - | | | | 12.8 | | | | 18.5 | | | | - | | | | 10.7 | | | | 5.8 | | | | 12.9 | | | | 5.7 | | | | 55.6 | |
| 1986 | | | | (4.6 | ) | | | 0.8 | | | | 8.3 | | | | 6.4 | | | | - | | | | (11.4 | ) | | | (10.8 | ) | | | (14.2 | ) | | | 4.2 | | | | 7.1 | |
| 1987 | | | | 18.6 | | | | 16.9 | | | | 15.1 | | | | 5.0 | | | | - | | | | 8.0 | | | | 14.4 | | | | 24.2 | | | | 1.4 | | | | 12.3 | |
| 1988 | | | | (1.6 | ) | | | (4.2 | ) | | | 1.5 | | | | 4.3 | | | | - | | | | 13.4 | | | | 9.1 | | | | (3.4 | ) | | | 7.6 | | | | 25.9 | |
| 1989 | | | | (2.1 | ) | | | (0.0 | ) | | | (1.7 | ) | | | (0.6 | ) | | | - | | | | (0.6 | ) | | | 4.6 | | | | (5.4 | ) | | | 4.0 | | | | (10.5 | ) |
| 1990 | | | | (6.8 | ) | | | (10.1 | ) | | | (13.4 | ) | | | 4.9 | | | | 54.0 | | | | (1.0 | ) | | | (4.1 | ) | | | 5.2 | | | | 3.5 | | | | 9.0 | |
| 1991 | | | | (6.3 | ) | | | (5.9 | ) | | | 6.7 | | | | (9.4 | ) | | | (4.8 | ) | | | 1.7 | | | | (2.9 | ) | | | 3.8 | | | | 3.3 | | | | (12.0 | ) |
| 1992 | | | | 6.3 | | | | 0.7 | | | | (0.1 | ) | | | (1.1 | ) | | | 3.7 | | | | (31.2 | ) | | | (8.9 | ) | | | 1.7 | | | | 4.7 | | | | 8.3 | |
| 1993 | | | | 1.6 | | | | 7.2 | | | | 0.7 | | | | 13.9 | | | | 22.4 | | | | 20.1 | | | | 1.1 | | | | (8.2 | ) | | | 3.0 | | | | 13.5 | |
| 1994 | | | | (0.8 | ) | | | (4.5 | ) | | | 17.3 | | | | (3.9 | ) | | | 16.6 | | | | 9.5 | | | | 14.9 | | | | 3.8 | | | | 6.4 | | | | 20.3 | |
| 1995 | | | | (3.1 | ) | | | (0.3 | ) | | | 2.2 | | | | (3.8 | ) | | | (18.1 | ) | | | 7.8 | | | | 10.7 | | | | (4.9 | ) | | | 3.1 | | | | (17.0 | ) |
| 1996 | | | | 0.2 | | | | (3.1 | ) | | | (6.3 | ) | | | 0.2 | | | | 28.2 | | | | 4.4 | | | | (3.6 | ) | | | 23.7 | | | | 7.6 | | | | (2.3 | ) |
| 1997 | | | | (3.4 | ) | | | (5.4 | ) | | | 1.3 | | | | (20.5 | ) | | | 19.1 | | | | 9.5 | | | | 7.9 | | | | (6.7 | ) | | | 1.9 | | | | 2.4 | |
| 1998 | | | | (4.2 | ) | | | (5.4 | ) | | | (5.2 | ) | | | 23.1 | | | | (0.9 | ) | | | (10.9 | ) | | | (4.6 | ) | | | 1.1 | | | | 2.4 | | | | (9.4 | ) |
| 1999 | | | | 7.1 | | | | 15.9 | | | | 14.5 | | | | 9.6 | | | | 32.8 | | | | 0.2 | | | | 1.6 | | | | 0.5 | | | | 5.9 | | | | 12.1 | |
| 2000 | | | | 6.0 | | | | 0.2 | | | | 8.2 | | | | 1.9 | | | | 128.7 | | | | 3.4 | | | | 74.2 | | | | 0.3 | | | | 7.4 | | | | 8.8 | |
| 2001 | | | | (5.1 | ) | | | (8.2 | ) | | | (15.0 | ) | | | (6.6 | ) | | | 18.5 | | | | 5.2 | | | | 9.1 | | | | (16.0 | ) | | | 8.7 | | | | (3.0 | ) |
| 2002 | | | | 8.9 | | | | 7.8 | | | | (1.3 | ) | | | 0.2 | | | | (25.0 | ) | | | (9.7 | ) | | | (66.8 | ) | | | 13.3 | | | | (1.2 | ) | | | 2.6 | |
| 2003 | | | | 1.6 | | | | (0.4 | ) | | | 7.2 | | | | 0.4 | | | | 46.6 | | | | (5.4 | ) | | | 0.8 | | | | (2.9 | ) | | | 3.4 | | | | (2.9 | ) |
| 2004 | | | | 10.8 | | | | 9.1 | | | | (0.2 | ) | | | 4.5 | | | | 8.9 | | | | 18.4 | | | | 29.5 | | | | (4.1 | ) | | | 5.0 | | | | (1.6 | ) |
| 2005 | | | | 2.9 | | | | 2.3 | | | | 3.3 | | | | (2.1 | ) | | | 32.2 | | | | (2.2 | ) | | | 44.0 | | | | 12.0 | | | | 1.3 | | | | 11.2 | |
| 2006 | | | | 0.2 | | | | (3.9 | ) | | | (3.9 | ) | | | 0.9 | | | | (20.3 | ) | | | (13.7 | ) | | | 11.3 | | | | (9.1 | ) | | | (1.8 | ) | | | 11.6 | |
| 2007 | | | | (10.6 | ) | | | (9.5 | ) | | | 0.0 | | | | (8.2 | ) | | | (3.0 | ) | | | 11.6 | | | | (6.3 | ) | | | 16.6 | | | | 1.5 | | | | (7.7 | ) |
| 2008 | | | | (23.2 | ) | | | (15.9 | ) | | | (13.2 | ) | | | (8.8 | ) | | | 33.6 | | | | 1.7 | | | | 31.9 | | | | (8.0 | ) | | | 5.9 | | | | (1.2 | ) |
| 2009 | | | | (18.9 | ) | | | (20.1 | ) | | | (13.8 | ) | | | (16.9 | ) | | | (55.5 | ) | | | (19.0 | ) | | | (24.1 | ) | | | (1.5 | ) | | | 0.1 | | | | (2.5 | ) |
| 2010 | | | | 17.0 | | | | 29.7 | | | | 20.2 | | | | (22.6 | ) | | | 9.9 | | | | 22.9 | | | | 27.5 | | | | (1.3 | ) | | | 0.9 | | | | 24.8 | |
| 2011 | | | | 5.9 | | | | 9.9 | | | | 5.6 | | | | (4.2 | ) | | | 9.2 | | | | 5.3 | | | | 25.3 | | | | 7.8 | | | | 5.5 | | | | (7.0 | ) |
| 2012 | | | | 2.6 | | | | (2.1 | ) | | | (1.3 | ) | | | (7.0 | ) | | | (30.9 | ) | | | 4.9 | | | | (12.9 | ) | | | 6.2 | | | | 5.8 | | | | (12.3 | ) |
| 2013 | | | | 2.9 | | | | 4.3 | | | | (3.3 | ) | | | (1.7 | ) | | | 36.9 | | | | 8.2 | | | | (9.1 | ) | | | (7.8 | ) | | | 1.3 | | | | 8.8 | |
| 2014 | | | | (1.3 | ) | | | (6.6 | ) | | | (0.0 | ) | | | 1.1 | | | | 49.6 | | | | (5.6 | ) | | | (4.2 | ) | | | (1.2 | ) | | | 5.4 | | | | 11.2 | |
| 2015 | | | | 3.3 | | | | 3.5 | | | | 0.6 | | | | (12.8 | ) | | | (49.5 | ) | | | (13.1 | ) | | | (9.2 | ) | | | 7.1 | | | | 5.0 | | | | 2.7 | |
| 2016 | | | | 2.7 | | | | (3.6 | ) | | | (2.2 | ) | | | (8.7 | ) | | | (13.0 | ) | | | 1.9 | | | | 8.4 | | | | (2.9 | ) | | | (2.2 | ) | | | 33.3 | |
| 2017 | | | | (3.5 | ) | | | (2.6 | ) | | | (0.2 | ) | | | (1.5 | ) | | | 28.8 | | | | - | | | | 36.9 | | | | 6.8 | | | | 4.0 | | | | 0.5 | |
| 2018 | | | | (3.7 | ) | | | 5.3 | | | | (3.0 | ) | | | (7.5 | ) | | | 19.9 | | | | - | | | | 6.6 | | | | (6.1 | ) | | | 6.5 | | | | 7.3 | |
| 2019 | | | | (21.8 | ) | | | (20.1 | ) | | | 0.2 | | | | (5.4 | ) | | | (10.1 | ) | | | - | | | | (10.1 | ) | | | (7.0 | ) | | | 14.2 | | | | (13.2 | ) |
| 2020 | | | | (7.8 | ) | | | (5.0 | ) | | | (4.2 | ) | | | (41.1 | ) | | | (5.9 | ) | | | - | | | | - | | | | - | | | | 2.1 | | | | - | |
| 1 | Total lumber production is total softwood production. |
Sources: Statistics Canada (Table: 16-10-0017-01, 16-10-0045-01, 25-10-0046-01, 25-10-0021-01, 32-10-0046-01 - accessed May 2021);
Ministry of Agriculture; Ministry of Forests, Lands, Natural Resource Operations and Rural Development; Ministry of Energy, Mines and Low Carbon Innovation; Natural Resources Canada and BC Stats.
| | 2021 FINANCIAL AND ECONOMIC REVIEW – JULY 2021 | 77 |
| | | |
Appendix 1 – Economic Review Supplementary Tables
Table A1.2 British Columbia Real GDP at Market Prices, Expenditure Based
| | | | | | General | | | | | | | | | | | | | | | | | | General | | | | | | | | | | |
| | | Household | | | Governments | | | | | | | | | | | | | | | Business | | | Governments | | | | | | | | | | |
| | | Final | | | Final | | | | | | Non- | | | Machinery | | | Intellectual | | | Gross Fixed | | | Gross Fixed | | | | | | | | | | |
| | | Consumption | | | Consumption | | | Residential | | | residential | | | and | | | Property | | | Capital | | | Capital | | | | | | | | | | |
| | | Expenditure | | | Expenditure | | | Structures | | | Structures | | | Equipment | | | Products | | | Formation | | | Formation | | | Exports | | | Imports | | | Real GDP | |
| | | | | | | | | | | | | | | | | | | | | | | | | | | | | | | | | | |
| | | (millions of 2012 $, chained) |
| 1981 | | | 57,254 | | | | 25,432 | | | | 8,426 | | | | 9,830 | | | | 2,233 | | | | 623 | | | | 19,304 | | | | 2,914 | | | | 30,775 | | | | 32,148 | | | | 104,634 | |
| 1982 | | | 54,284 | | | | 25,819 | | | | 6,252 | | | | 8,136 | | | | 1,816 | | | | 477 | | | | 15,312 | | | | 2,623 | | | | 29,217 | | | | 28,134 | | | | 97,936 | |
| 1983 | | | 54,543 | | | | 25,571 | | | | 6,633 | | | | 8,661 | | | | 1,353 | | | | 509 | | | | 14,745 | | | | 2,878 | | | | 30,779 | | | | 30,165 | | | | 98,655 | |
| 1984 | | | 55,969 | | | | 25,561 | | | | 6,305 | | | | 7,504 | | | | 1,452 | | | | 610 | | | | 14,082 | | | | 2,945 | | | | 32,978 | | | | 32,694 | | | | 99,550 | |
| 1985 | | | 58,030 | | | | 26,191 | | | | 6,817 | | | | 7,055 | | | | 1,642 | | | | 645 | | | | 14,661 | | | | 3,593 | | | | 36,256 | | | | 33,754 | | | | 106,567 | |
| 1986 | | | 59,253 | | | | 26,429 | | | | 7,509 | | | | 5,489 | | | | 1,564 | | | | 628 | | | | 13,838 | | | | 3,249 | | | | 38,048 | | | | 35,006 | | | | 107,559 | |
| 1987 | | | 62,383 | | | | 26,740 | | | | 8,934 | | | | 5,753 | | | | 1,913 | | | | 681 | | | | 15,979 | | | | 3,467 | | | | 41,273 | | | | 37,988 | | | | 114,142 | |
| 1988 | | | 65,379 | | | | 28,017 | | | | 9,955 | | | | 6,896 | | | | 2,567 | | | | 879 | | | | 19,300 | | | | 3,200 | | | | 43,541 | | | | 41,126 | | | | 120,448 | |
| 1989 | | | 69,152 | | | | 28,373 | | | | 11,457 | | | | 7,674 | | | | 3,081 | | | | 983 | | | | 22,273 | | | | 4,089 | | | | 42,822 | | | | 45,022 | | | | 124,256 | |
| 1990 | | | 72,042 | | | | 29,403 | | | | 11,655 | | | | 7,464 | | | | 3,113 | | | | 1,227 | | | | 22,583 | | | | 4,080 | | | | 42,344 | | | | 46,941 | | | | 126,129 | |
| 1991 | | | 72,471 | | | | 31,073 | | | | 11,010 | | | | 7,890 | | | | 3,191 | | | | 1,231 | | | | 22,520 | | | | 4,626 | | | | 43,018 | | | | 47,386 | | | | 126,535 | |
| 1992 | | | 74,713 | | | | 32,140 | | | | 13,535 | | | | 6,166 | | | | 3,185 | | | | 1,229 | | | | 23,455 | | | | 4,638 | | | | 45,157 | | | | 49,588 | | | | 130,049 | |
| 1993 | | | 77,151 | | | | 32,588 | | | | 13,875 | | | | 5,649 | | | | 3,091 | | | | 1,603 | | | | 23,560 | | | | 4,728 | | | | 46,950 | | | | 49,290 | | | | 136,155 | |
| 1994 | | | 80,289 | | | | 32,870 | | | | 13,955 | | | | 6,879 | | | | 3,510 | | | | 2,315 | | | | 25,912 | | | | 5,438 | | | | 50,039 | | | | 57,258 | | | | 139,733 | |
| 1995 | | | 82,775 | | | | 32,306 | | | | 12,270 | | | | 7,541 | | | | 3,587 | | | | 1,825 | | | | 24,600 | | | | 5,053 | | | | 53,082 | | | | 57,974 | | | | 143,402 | |
| 1996 | | | 85,806 | | | | 32,946 | | | | 12,459 | | | | 6,661 | | | | 3,675 | | | | 1,841 | | | | 24,294 | | | | 5,434 | | | | 53,351 | | | | 57,506 | | | | 147,052 | |
| 1997 | | | 89,016 | | | | 32,876 | | | | 13,071 | | | | 8,876 | | | | 4,066 | | | | 1,946 | | | | 27,333 | | | | 4,729 | | | | 55,463 | | | | 61,586 | | | | 151,968 | |
| 1998 | | | 90,175 | | | | 33,385 | | | | 11,314 | | | | 6,781 | | | | 4,496 | | | | 2,408 | | | | 25,452 | | | | 4,532 | | | | 56,944 | | | | 60,891 | | | | 153,811 | |
| 1999 | | | 92,443 | | | | 33,624 | | | | 10,499 | | | | 7,527 | | | | 4,517 | | | | 2,077 | | | | 25,097 | | | | 5,332 | | | | 61,911 | | | | 64,595 | | | | 159,162 | |
| 2000 | | | 95,344 | | | | 34,897 | | | | 10,563 | | | | 7,289 | | | | 4,897 | | | | 2,513 | | | | 26,065 | | | | 5,403 | | | | 67,308 | | | | 69,598 | | | | 166,405 | |
| 2001 | | | 97,251 | | | | 36,032 | | | | 11,629 | | | | 8,404 | | | | 4,811 | | | | 3,164 | | | | 28,386 | | | | 5,458 | | | | 66,794 | | | | 69,764 | | | | 167,541 | |
| 2002 | | | 100,887 | | | | 36,560 | | | | 13,554 | | | | 7,875 | | | | 4,681 | | | | 2,704 | | | | 28,868 | | | | 5,212 | | | | 67,270 | | | | 69,848 | | | | 174,214 | |
| 2003 | | | 104,235 | | | | 36,720 | | | | 14,601 | | | | 8,599 | | | | 4,693 | | | | 3,238 | | | | 30,948 | | | | 5,443 | | | | 69,226 | | | | 73,588 | | | | 178,240 | |
| 2004 | | | 108,952 | | | | 36,511 | | | | 17,112 | | | | 9,487 | | | | 5,274 | | | | 3,697 | | | | 35,317 | | | | 6,299 | | | | 72,828 | | | | 79,354 | | | | 185,250 | |
| 2005 | | | 113,429 | | | | 36,946 | | | | 18,352 | | | | 9,974 | | | | 6,342 | | | | 3,941 | | | | 38,637 | | | | 7,517 | | | | 76,457 | | | | 84,079 | | | | 194,460 | |
| 2006 | | | 120,181 | | | | 37,399 | | | | 19,671 | | | | 11,813 | | | | 7,355 | | | | 4,181 | | | | 43,107 | | | | 7,778 | | | | 79,417 | | | | 90,710 | | | | 203,053 | |
| 2007 | | | 126,699 | | | | 39,404 | | | | 20,099 | | | | 11,191 | | | | 8,044 | | | | 4,863 | | | | 44,436 | | | | 8,093 | | | | 81,168 | | | | 95,697 | | | | 209,419 | |
| 2008 | | | 129,782 | | | | 40,961 | | | | 19,096 | | | | 12,832 | | | | 8,067 | | | | 5,102 | | | | 45,183 | | | | 8,551 | | | | 78,546 | | | | 96,459 | | | | 210,903 | |
| 2009 | | | 130,162 | | | | 41,455 | | | | 17,460 | | | | 11,376 | | | | 6,129 | | | | 4,188 | | | | 39,098 | | | | 8,571 | | | | 73,286 | | | | 89,411 | | | | 205,878 | |
| 2010 | | | 135,142 | | | | 41,761 | | | | 17,494 | | | | 12,170 | | | | 7,237 | | | | 4,611 | | | | 41,533 | | | | 9,222 | | | | 79,025 | | | | 97,377 | | | | 211,749 | |
| 2011 | | | 137,998 | | | | 42,612 | | | | 17,987 | | | | 13,734 | | | | 7,500 | | | | 4,657 | | | | 43,876 | | | | 7,334 | | | | 82,874 | | | | 100,829 | | | | 218,203 | |
| 2012 | | | 140,749 | | | | 43,344 | | | | 19,282 | | | | 14,937 | | | | 7,812 | | | | 4,134 | | | | 46,165 | | | | 8,041 | | | | 85,442 | | | | 104,682 | | | | 223,329 | |
| 2013 | | | 144,336 | | | | 43,347 | | | | 19,396 | | | | 14,618 | | | | 7,182 | | | | 4,243 | | | | 45,442 | | | | 7,339 | | | | 88,297 | | | | 105,680 | | | | 228,310 | |
| 2014 | | | 149,395 | | | | 42,520 | | | | 20,558 | | | | 16,070 | | | | 7,814 | | | | 4,030 | | | | 48,478 | | | | 7,817 | | | | 94,851 | | | | 111,054 | | | | 236,696 | |
| 2015 | | | 155,326 | | | | 43,451 | | | | 22,528 | | | | 14,103 | | | | 6,832 | | | | 3,367 | | | | 46,833 | | | | 7,694 | | | | 94,041 | | | | 109,916 | | | | 241,509 | |
| 2016 | | | 160,338 | | | | 44,179 | | | | 25,916 | | | | 12,661 | | | | 7,744 | | | | 3,420 | | | | 49,843 | | | | 7,859 | | | | 97,054 | | | | 115,448 | | | | 248,262 | |
| 2017 | | | 167,984 | | | | 45,171 | | | | 25,970 | | | | 14,297 | | | | 8,036 | | | | 3,580 | | | | 51,910 | | | | 8,520 | | | | 99,738 | | | | 121,506 | | | | 257,724 | |
| 2018 | | | 172,683 | | | | 46,315 | | | | 25,311 | | | | 14,572 | | | | 8,464 | | | | 3,831 | | | | 52,131 | | | | 9,344 | | | | 103,240 | | | | 125,464 | | | | 264,765 | |
| 2019 | | | 175,666 | | | | 47,754 | | | | 24,944 | | | | 19,721 | | | | 8,487 | | | | 3,887 | | | | 56,713 | | | | 9,708 | | | | 104,204 | | | | 128,910 | | | | 271,789 | |
| 2020 | | | n/a | | | | n/a | | | | n/a | | | | n/a | | | | n/a | | | | n/a | | | | n/a | | | | n/a | | | | n/a | | | | n/a | | | | n/a | |

| 78 | 2021 Financial and Economic Review – July 2021 | |
| | | |
Appendix 1 – Economic Review Supplementary Tables
Table A1.2 British Columbia Real GDP at Market Prices, Expenditure Based (continued)
| | | | | | General | | | | | | | | | | | | | | | | | | General | | | | | | | | | | |
| | | Household | | | Governments | | | | | | | | | | | | | | | Business | | | Governments | | | | | | | | | | |
| | | Final | | | Final | | | | | | Non- | | | Machinery | | | Intellectual | | | Gross Fixed | | | Gross Fixed | | | | | | | | | | |
| | | Consumption | | | Consumption | | | Residential | | | residential | | | and | | | Property | | | Capital | | | Capital | | | | | | | | | | |
| | | Expenditure | | | Expenditure | | | Structures | | | Structures | | | Equipment | | | Products | | | Formation | | | Formation | | | Exports | | | Imports | | | Real GDP | |
| | | | | | | | | | | | | | | | | | | | | | | | | | | | | | | | | | |
| | | (annual percentage change) | |
| 1982 | | | (5.2 | ) | | | 1.5 | | | | (25.8 | ) | | | (17.2 | ) | | | (18.7 | ) | | | (23.4 | ) | | | (20.7 | ) | | | (10.0 | ) | | | (5.1 | ) | | | (12.5 | ) | | | (6.4 | ) |
| 1983 | | | 0.5 | | | | (1.0 | ) | | | 6.1 | | | | 6.5 | | | | (25.5 | ) | | | 6.7 | | | | (3.7 | ) | | | 9.7 | | | | 5.3 | | | | 7.2 | | | | 0.7 | |
| 1984 | | | 2.6 | | | | (0.0 | ) | | | (4.9 | ) | | | (13.4 | ) | | | 7.3 | | | | 19.8 | | | | (4.5 | ) | | | 2.3 | | | | 7.1 | | | | 8.4 | | | | 0.9 | |
| 1985 | | | 3.7 | | | | 2.5 | | | | 8.1 | | | | (6.0 | ) | | | 13.1 | | | | 5.7 | | | | 4.1 | | | | 22.0 | | | | 9.9 | | | | 3.2 | | | | 7.0 | |
| 1986 | | | 2.1 | | | | 0.9 | | | | 10.2 | | | | (22.2 | ) | | | (4.8 | ) | | | (2.6 | ) | | | (5.6 | ) | | | (9.6 | ) | | | 4.9 | | | | 3.7 | | | | 0.9 | |
| 1987 | | | 5.3 | | | | 1.2 | | | | 19.0 | | | | 4.8 | | | | 22.3 | | | | 8.4 | | | | 15.5 | | | | 6.7 | | | | 8.5 | | | | 8.5 | | | | 6.1 | |
| 1988 | | | 4.8 | | | | 4.8 | | | | 11.4 | | | | 19.9 | | | | 34.2 | | | | 29.1 | | | | 20.8 | | | | (7.7 | ) | | | 5.5 | | | | 8.3 | | | | 5.5 | |
| 1989 | | | 5.8 | | | | 1.3 | | | | 15.1 | | | | 11.3 | | | | 20.0 | | | | 11.8 | | | | 15.4 | | | | 27.8 | | | | (1.7 | ) | | | 9.5 | | | | 3.2 | |
| 1990 | | | 4.2 | | | | 3.6 | | | | 1.7 | | | | (2.7 | ) | | | 1.0 | | | | 24.8 | | | | 1.4 | | | | (0.2 | ) | | | (1.1 | ) | | | 4.3 | | | | 1.5 | |
| 1991 | | | 0.6 | | | | 5.7 | | | | (5.5 | ) | | | 5.7 | | | | 2.5 | | | | 0.3 | | | | (0.3 | ) | | | 13.4 | | | | 1.6 | | | | 0.9 | | | | 0.3 | |
| 1992 | | | 3.1 | | | | 3.4 | | | | 22.9 | | | | (21.9 | ) | | | (0.2 | ) | | | (0.2 | ) | | | 4.2 | | | | 0.3 | | | | 5.0 | | | | 4.6 | | | | 2.8 | |
| 1993 | | | 3.3 | | | | 1.4 | | | | 2.5 | | | | (8.4 | ) | | | (3.0 | ) | | | 30.4 | | | | 0.4 | | | | 1.9 | | | | 4.0 | | | | (0.6 | ) | | | 4.7 | |
| 1994 | | | 4.1 | | | | 0.9 | | | | 0.6 | | | | 21.8 | | | | 13.6 | | | | 44.4 | | | | 10.0 | | | | 15.0 | | | | 6.6 | | | | 16.2 | | | | 2.6 | |
| 1995 | | | 3.1 | | | | (1.7 | ) | | | (12.1 | ) | | | 9.6 | | | | 2.2 | | | | (21.2 | ) | | | (5.1 | ) | | | (7.1 | ) | | | 6.1 | | | | 1.3 | | | | 2.6 | |
| 1996 | | | 3.7 | | | | 2.0 | | | | 1.5 | | | | (11.7 | ) | | | 2.5 | | | | 0.9 | | | | (1.2 | ) | | | 7.5 | | | | 0.5 | | | | (0.8 | ) | | | 2.5 | |
| 1997 | | | 3.7 | | | | (0.2 | ) | | | 4.9 | | | | 33.3 | | | | 10.6 | | | | 5.7 | | | | 12.5 | | | | (13.0 | ) | | | 4.0 | | | | 7.1 | | | | 3.3 | |
| 1998 | | | 1.3 | | | | 1.5 | | | | (13.4 | ) | | | (23.6 | ) | | | 10.6 | | | | 23.7 | | | | (6.9 | ) | | | (4.2 | ) | | | 2.7 | | | | (1.1 | ) | | | 1.2 | |
| 1999 | | | 2.5 | | | | 0.7 | | | | (7.2 | ) | | | 11.0 | | | | 0.5 | | | | (13.7 | ) | | | (1.4 | ) | | | 17.7 | | | | 8.7 | | | | 6.1 | | | | 3.5 | |
| 2000 | | | 3.1 | | | | 3.8 | | | | 0.6 | | | | (3.2 | ) | | | 8.4 | | | | 21.0 | | | | 3.9 | | | | 1.3 | | | | 8.7 | | | | 7.7 | | | | 4.6 | |
| 2001 | | | 2.0 | | | | 3.3 | | | | 10.1 | | | | 15.3 | | | | (1.8 | ) | | | 25.9 | | | | 8.9 | | | | 1.0 | | | | (0.8 | ) | | | 0.2 | | | | 0.7 | |
| 2002 | | | 3.7 | | | | 1.5 | | | | 16.6 | | | | (6.3 | ) | | | (2.7 | ) | | | (14.5 | ) | | | 1.7 | | | | (4.5 | ) | | | 0.7 | | | | 0.1 | | | | 4.0 | |
| 2003 | | | 3.3 | | | | 0.4 | | | | 7.7 | | | | 9.2 | | | | 0.3 | | | | 19.7 | | | | 7.2 | | | | 4.4 | | | | 2.9 | | | | 5.4 | | | | 2.3 | |
| 2004 | | | 4.5 | | | | (0.6 | ) | | | 17.2 | | | | 10.3 | | | | 12.4 | | | | 14.2 | | | | 14.1 | | | | 15.7 | | | | 5.2 | | | | 7.8 | | | | 3.9 | |
| 2005 | | | 4.1 | | | | 1.2 | | | | 7.2 | | | | 5.1 | | | | 20.3 | | | | 6.6 | | | | 9.4 | | | | 19.3 | | | | 5.0 | | | | 6.0 | | | | 5.0 | |
| 2006 | | | 6.0 | | | | 1.2 | | | | 7.2 | | | | 18.4 | | | | 16.0 | | | | 6.1 | | | | 11.6 | | | | 3.5 | | | | 3.9 | | | | 7.9 | | | | 4.4 | |
| 2007 | | | 5.4 | | | | 5.4 | | | | 2.2 | | | | (5.3 | ) | | | 9.4 | | | | 16.3 | | | | 3.1 | | | | 4.0 | | | | 2.2 | | | | 5.5 | | | | 3.1 | |
| 2008 | | | 2.4 | | | | 4.0 | | | | (5.0 | ) | | | 14.7 | | | | 0.3 | | | | 4.9 | | | | 1.7 | | | | 5.7 | | | | (3.2 | ) | | | 0.8 | | | | 0.7 | |
| 2009 | | | 0.3 | | | | 1.2 | | | | (8.6 | ) | | | (11.3 | ) | | | (24.0 | ) | | | (17.9 | ) | | | (13.5 | ) | | | 0.2 | | | | (6.7 | ) | | | (7.3 | ) | | | (2.4 | ) |
| 2010 | | | 3.8 | | | | 0.7 | | | | 0.2 | | | | 7.0 | | | | 18.1 | | | | 10.1 | | | | 6.2 | | | | 7.6 | | | | 7.8 | | | | 8.9 | | | | 2.9 | |
| 2011 | | | 2.1 | | | | 2.0 | | | | 2.8 | | | | 12.9 | | | | 3.6 | | | | 1.0 | | | | 5.6 | | | | (20.5 | ) | | | 4.9 | | | | 3.5 | | | | 3.0 | |
| 2012 | | | 2.0 | | | | 1.7 | | | | 7.2 | | | | 8.8 | | | | 4.2 | | | | (11.2 | ) | | | 5.2 | | | | 9.6 | | | | 3.1 | | | | 3.8 | | | | 2.3 | |
| 2013 | | | 2.5 | | | | 0.0 | | | | 0.6 | | | | (2.1 | ) | | | (8.1 | ) | | | 2.6 | | | | (1.6 | ) | | | (8.7 | ) | | | 3.3 | | | | 1.0 | | | | 2.2 | |
| 2014 | | | 3.5 | | | | (1.9 | ) | | | 6.0 | | | | 9.9 | | | | 8.8 | | | | (5.0 | ) | | | 6.7 | | | | 6.5 | | | | 7.4 | | | | 5.1 | | | | 3.7 | |
| 2015 | | | 4.0 | | | | 2.2 | | | | 9.6 | | | | (12.2 | ) | | | (12.6 | ) | | | (16.5 | ) | | | (3.4 | ) | | | (1.6 | ) | | | (0.9 | ) | | | (1.0 | ) | | | 2.0 | |
| 2016 | | | 3.2 | | | | 1.7 | | | | 15.0 | | | | (10.2 | ) | | | 13.3 | | | | 1.6 | | | | 6.4 | | | | 2.1 | | | | 3.2 | | | | 5.0 | | | | 2.8 | |
| 2017 | | | 4.8 | | | | 2.2 | | | | 0.2 | | | | 12.9 | | | | 3.8 | | | | 4.7 | | | | 4.1 | | | | 8.4 | | | | 2.8 | | | | 5.2 | | | | 3.8 | |
| 2018 | | | 2.8 | | | | 2.5 | | | | (2.5 | ) | | | 1.9 | | | | 5.3 | | | | 7.0 | | | | 0.4 | | | | 9.7 | | | | 3.5 | | | | 3.3 | | | | 2.7 | |
| 2019 | | | 1.7 | | | | 3.1 | | | | (1.4 | ) | | | 35.3 | | | | 0.3 | | | | 1.5 | | | | 8.8 | | | | 3.9 | | | | 0.9 | | | | 2.7 | | | | 2.7 | |
| 2020 | | | - | | | | - | | | | - | | | | - | | | | - | | | | - | | | | - | | | | - | | | | - | | | | - | | | | - | |
| | | | | | | | | | | | | | | | | | | | | | | | | | | | | | | | | | | | | | | | | | | | | |
| Source: Statistics Canada (Table 36-10-0222-01 – accessed May 2021). |
| | 2021 Financial and Economic Review – July 2021 | 79 |
| | | |
Appendix 1 – Economic Review Supplementary Tables
Table A1.3 British Columbia GDP at Basic Prices, by Industry
| | | Crop and | | | Fishing, | | | Forestry | | | Support Activities | | | Mining, Quarrying | | | | | | | | | | | | Transportation | | | Wholesale | | | Finance | | | Real Estate | | | | | | | | | Real GDP | |
| | | Animal | | | Hunting and | | | and | | | for Agriculture | | | Oil and Gas | | | | | | | | | | | | and | | | and Retail | | | and | | | and Rental | | | Other | | | Public | | | at Basic | |
| | | Production | | | Trapping | | | Logging | | | and Forestry | | | Extraction | | | Manufacturing | | | Construction | | | Utilities | | | Warehousing | | | Trade | | | Insurance | | | and Leasing | | | Services1 | | | Administration | | | Prices | |
| | | | | | | | | | | | | | | | | | | | | | | | | | | | | | | | | | | | | | | | | | | | | | |
| | | (millions of 2012 $, chained) | |
| 1997 | | | 1,548 | | | | 317 | | | | 2,299 | | | | 708 | | | | 7,146 | | | | 11,247 | | | | 10,208 | | | | 3,277 | | | | 8,152 | | | | 12,424 | | | | 8,554 | | | | 21,233 | | | | 45,749 | | | | 9,304 | | | | 141,853 | |
| 1998 | | | 1,609 | | | | 212 | | | | 2,334 | | | | 737 | | | | 7,024 | | | | 11,101 | | | | 9,125 | | | | 3,422 | | | | 8,203 | | | | 13,027 | | | | 8,103 | | | | 21,783 | | | | 47,359 | | | | 9,320 | | | | 143,234 | |
| 1999 | | | 1,722 | | | | 165 | | | | 2,195 | | | | 695 | | | | 7,163 | | | | 12,603 | | | | 8,993 | | | | 3,647 | | | | 8,460 | | | | 13,287 | | | | 8,682 | | | | 22,453 | | | | 47,952 | | | | 9,641 | | | | 147,986 | |
| 2000 | | | 1,677 | | | | 182 | | | | 2,039 | | | | 783 | | | | 7,897 | | | | 14,789 | | | | 8,823 | | | | 4,252 | | | | 9,019 | | | | 13,874 | | | | 8,468 | | | | 23,086 | | | | 49,409 | | | | 9,836 | | | | 154,966 | |
| 2001 | | | 1,978 | | | | 151 | | | | 2,013 | | | | 723 | | | | 8,856 | | | | 13,713 | | | | 8,971 | | | | 3,038 | | | | 8,997 | | | | 14,356 | | | | 8,371 | | | | 23,815 | | | | 50,472 | | | | 10,038 | | | | 155,831 | |
| 2002 | | | 1,950 | | | | 187 | | | | 2,057 | | | | 659 | | | | 8,158 | | | | 13,748 | | | | 9,566 | | | | 3,706 | | | | 9,126 | | | | 15,111 | | | | 8,545 | | | | 25,241 | | | | 52,793 | | | | 10,473 | | | | 161,762 | |
| 2003 | | | 2,086 | | | | 184 | | | | 2,036 | | | | 706 | | | | 8,015 | | | | 13,934 | | | | 10,337 | | | | 3,642 | | | | 9,166 | | | | 15,690 | | | | 8,848 | | | | 26,011 | | | | 54,213 | | | | 10,421 | | | | 165,800 | |
| 2004 | | | 2,217 | | | | 205 | | | | 2,306 | | | | 671 | | | | 8,392 | | | | 15,050 | | | | 11,639 | | | | 3,659 | | | | 9,461 | | | | 16,341 | | | | 9,349 | | | | 26,909 | | | | 55,273 | | | | 10,464 | | | | 172,580 | |
| 2005 | | | 2,292 | | | | 196 | | | | 2,290 | | | | 693 | | | | 9,382 | | | | 15,719 | | | | 12,582 | | | | 4,139 | | | | 10,257 | | | | 17,084 | | | | 9,650 | | | | 28,230 | | | | 57,119 | | | | 10,467 | | | | 180,855 | |
| 2006 | | | 2,375 | | | | 218 | | | | 2,188 | | | | 678 | | | | 9,410 | | | | 16,602 | | | | 13,777 | | | | 3,511 | | | | 10,357 | | | | 18,284 | | | | 10,604 | | | | 29,385 | | | | 60,086 | | | | 10,986 | | | | 189,186 | |
| 2007 | | | 2,503 | | | | 174 | | | | 2,055 | | | | 694 | | | | 8,196 | | | | 16,438 | | | | 14,616 | | | | 4,384 | | | | 10,414 | | | | 19,389 | | | | 11,112 | | | | 30,979 | | | | 62,279 | | | | 11,291 | | | | 194,683 | |
| 2008 | | | 2,411 | | | | 149 | | | | 1,813 | | | | 599 | | | | 8,429 | | | | 15,122 | | | | 15,384 | | | | 4,373 | | | | 10,197 | | | | 19,324 | | | | 10,863 | | | | 31,654 | | | | 63,339 | | | | 11,925 | | | | 195,789 | |
| 2009 | | | 2,529 | | | | 156 | | | | 1,248 | | | | 604 | | | | 7,548 | | | | 13,029 | | | | 14,532 | | | | 4,282 | | | | 10,196 | | | | 18,413 | | | | 10,683 | | | | 32,807 | | | | 62,136 | | | | 12,619 | | | | 190,709 | |
| 2010 | | | 2,581 | | | | 181 | | | | 1,533 | | | | 621 | | | | 8,587 | | | | 13,798 | | | | 14,895 | | | | 4,143 | | | | 10,433 | | | | 19,032 | | | | 11,170 | | | | 33,943 | | | | 62,064 | | | | 12,779 | | | | 195,819 | |
| 2011 | | | 2,656 | | | | 172 | | | | 1,814 | | | | 694 | | | | 9,218 | | | | 14,272 | | | | 14,987 | | | | 4,529 | | | | 10,749 | | | | 19,375 | | | | 11,470 | | | | 34,980 | | | | 63,356 | | | | 13,015 | | | | 201,413 | |
| 2012 | | | 2,655 | | | | 150 | | | | 1,860 | | | | 678 | | | | 8,942 | | | | 14,693 | | | | 16,797 | | | | 4,587 | | | | 10,983 | | | | 20,058 | | | | 11,404 | | | | 36,365 | | | | 64,681 | | | | 12,736 | | | | 206,591 | |
| 2013 | | | 2,810 | | | | 172 | | | | 2,011 | | | | 670 | | | | 9,188 | | | | 14,623 | | | | 16,699 | | | | 4,507 | | | | 11,534 | | | | 21,065 | | | | 11,821 | | | | 37,657 | | | | 66,167 | | | | 12,666 | | | | 211,555 | |
| 2014 | | | 2,792 | | | | 196 | | | | 1,977 | | | | 702 | | | | 9,729 | | | | 15,427 | | | | 18,167 | | | | 4,554 | | | | 12,154 | | | | 21,480 | | | | 12,110 | | | | 39,164 | | | | 68,203 | | | | 12,473 | | | | 219,061 | |
| 2015 | | | 2,973 | | | | 195 | | | | 1,970 | | | | 733 | | | | 9,423 | | | | 15,845 | | | | 18,108 | | | | 4,805 | | | | 12,624 | | | | 21,627 | | | | 12,569 | | | | 40,757 | | | | 69,803 | | | | 12,607 | | | | 224,153 | |
| 2016 | | | 2,921 | | | | 174 | | | | 1,807 | | | | 721 | | | | 9,668 | | | | 16,517 | | | | 18,322 | | | | 5,023 | | | | 12,847 | | | | 22,551 | | | | 13,010 | | | | 42,387 | | | | 71,929 | | | | 12,754 | | | | 230,764 | |
| 2017 | | | 2,927 | | | | 165 | | | | 1,841 | | | | 754 | | | | 9,816 | | | | 16,769 | | | | 19,641 | | | | 5,032 | | | | 14,190 | | | | 23,351 | | | | 13,902 | | | | 43,611 | | | | 74,165 | | | | 12,911 | | | | 239,206 | |
| 2018 | | | 3,091 | | | | 150 | | | | 1,937 | | | | 784 | | | | 10,791 | | | | 16,918 | | | | 20,294 | | | | 4,831 | | | | 14,936 | | | | 23,839 | | | | 14,256 | | | | 44,270 | | | | 76,477 | | | | 13,311 | | | | 246,017 | |
| 2019 | | | 3,121 | | | | 132 | | | | 1,569 | | | | 786 | | | | 10,836 | | | | 16,770 | | | | 22,110 | | | | 4,867 | | | | 15,244 | | | | 23,804 | | | | 14,778 | | | | 45,669 | | | | 78,571 | | | | 13,724 | | | | 252,064 | |
| 2020 | | | 3,003 | | | | 128 | | | | 1,555 | | | | 765 | | | | 10,897 | | | | 15,580 | | | | 23,033 | | | | 4,999 | | | | 11,955 | | | | 23,575 | | | | 15,146 | | | | 47,559 | | | | 70,968 | | | | 13,487 | | | | 242,411 | |
| 1 | Other Services includes health care and social assistance, professional, scientific and technical services, educational services, information and cultural industries, accommodation and food services, administrative and support, waste management and remediation services, arts, entertainment and recreation, management of companies and enterprises, and other services (except public administration). |

| 80 | 2021 Financial and Economic Review – July 2021 | |
| | | |
Appendix 1 – Economic Review Supplementary Tables
Table A1.3 British Columbia GDP at Basic Prices, by Industry (continued)
| | | Crop and | | | Fishing, | | | Forestry | | | Support Activities | | | Mining, Quarrying | | | | | | | | | | | | Transportation | | | Wholesale | | | Finance | | | Real Estate | | | | | | | | | Real GDP | |
| | | Animal | | | Hunting and | | | and | | | for Agriculture | | | Oil and Gas | | | | | | | | | | | | and | | | and Retail | | | and | | | and Rental | | | Other | | | Public | | | at Basic | |
| | | Production | | | Trapping | | | Logging | | | and Forestry | | | Extraction | | | Manufacturing | | | Construction | | | Utilities | | | Warehousing | | | Trade | | | Insurance | | | and Leasing | | | Services1 | | | Administration | | | Prices | |
| | | | | | | | | | | | | | | | | | | | | | | | | | | | | | | | | | | | | | | | | | | | | | |
| | | (annual percentage change) | |
| 1998 | | | 4.0 | | | | (33.2 | ) | | | 1.5 | | | | 4.1 | | | | (1.7 | ) | | | (1.3 | ) | | | (10.6 | ) | | | 4.4 | | | | 0.6 | | | | 4.9 | | | | (5.3 | ) | | | 2.6 | | | | 3.5 | | | | 0.2 | | | | 1.0 | |
| 1999 | | | 7.0 | | | | (22.2 | ) | | | (6.0 | ) | | | (5.7 | ) | | | 2.0 | | | | 13.5 | | | | (1.4 | ) | | | 6.6 | | | | 3.1 | | | | 2.0 | | | | 7.1 | | | | 3.1 | | | | 1.3 | | | | 3.4 | | | | 3.3 | |
| 2000 | | | (2.6 | ) | | | 10.5 | | | | (7.1 | ) | | | 12.7 | | | | 10.3 | | | | 17.3 | | | | (1.9 | ) | | | 16.6 | | | | 6.6 | | | | 4.4 | | | | (2.5 | ) | | | 2.8 | | | | 3.0 | | | | 2.0 | | | | 4.7 | |
| 2001 | | | 18.0 | | | | (17.1 | ) | | | (1.3 | ) | | | (7.6 | ) | | | 12.1 | | | | (7.3 | ) | | | 1.7 | | | | (28.5 | ) | | | (0.2 | ) | | | 3.5 | | | | (1.1 | ) | | | 3.2 | | | | 2.2 | | | | 2.0 | | | | 0.6 | |
| 2002 | | | (1.4 | ) | | | 24.0 | | | | 2.2 | | | | (8.8 | ) | | | (7.9 | ) | | | 0.3 | | | | 6.6 | | | | 22.0 | | | | 1.4 | | | | 5.3 | | | | 2.1 | | | | 6.0 | | | | 4.6 | | | | 4.3 | | | | 3.8 | |
| 2003 | | | 7.0 | | | | (1.7 | ) | | | (1.0 | ) | | | 7.1 | | | | (1.8 | ) | | | 1.4 | | | | 8.1 | | | | (1.7 | ) | | | 0.4 | | | | 3.8 | | | | 3.5 | | | | 3.1 | | | | 2.7 | | | | (0.5 | ) | | | 2.5 | |
| 2004 | | | 6.3 | | | | 11.4 | | | | 13.3 | | | | (5.1 | ) | | | 4.7 | | | | 8.0 | | | | 12.6 | | | | 0.5 | | | | 3.2 | | | | 4.1 | | | | 5.7 | | | | 3.5 | | | | 2.0 | | | | 0.4 | | | | 4.1 | |
| 2005 | | | 3.4 | | | | (4.6 | ) | | | (0.7 | ) | | | 3.3 | | | | 11.8 | | | | 4.4 | | | | 8.1 | | | | 13.1 | | | | 8.4 | | | | 4.5 | | | | 3.2 | | | | 4.9 | | | | 3.3 | | | | 0.0 | | | | 4.8 | |
| 2006 | | | 3.6 | | | | 11.6 | | | | (4.5 | ) | | | (2.2 | ) | | | 0.3 | | | | 5.6 | | | | 9.5 | | | | (15.2 | ) | | | 1.0 | | | | 7.0 | | | | 9.9 | | | | 4.1 | | | | 5.2 | | | | 5.0 | | | | 4.6 | |
| 2007 | | | 5.4 | | | | (20.1 | ) | | | (6.1 | ) | | | 2.4 | | | | (12.9 | ) | | | (1.0 | ) | | | 6.1 | | | | 24.9 | | | | 0.5 | | | | 6.0 | | | | 4.8 | | | | 5.4 | | | | 3.7 | | | | 2.8 | | | | 2.9 | |
| 2008 | | | (3.7 | ) | | | (14.3 | ) | | | (11.8 | ) | | | (13.7 | ) | | | 2.8 | | | | (8.0 | ) | | | 5.3 | | | | (0.3 | ) | | | (2.1 | ) | | | (0.3 | ) | | | (2.2 | ) | | | 2.2 | | | | 1.7 | | | | 5.6 | | | | 0.6 | |
| 2009 | | | 4.9 | | | | 4.4 | | | | (31.2 | ) | | | 0.9 | | | | (10.5 | ) | | | (13.8 | ) | | | (5.5 | ) | | | (2.1 | ) | | | (0.0 | ) | | | (4.7 | ) | | | (1.6 | ) | | | 3.6 | | | | (1.9 | ) | | | 5.8 | | | | (2.6 | ) |
| 2010 | | | 2.1 | | | | 15.9 | | | | 22.9 | | | | 2.7 | | | | 13.8 | | | | 5.9 | | | | 2.5 | | | | (3.3 | ) | | | 2.3 | | | | 3.4 | | | | 4.6 | | | | 3.5 | | | | (0.1 | ) | | | 1.3 | | | | 2.7 | |
| 2011 | | | 2.9 | | | | (5.1 | ) | | | 18.3 | | | | 11.8 | | | | 7.3 | | | | 3.4 | | | | 0.6 | | | | 9.3 | | | | 3.0 | | | | 1.8 | | | | 2.7 | | | | 3.1 | | | | 2.1 | | | | 1.8 | | | | 2.9 | |
| 2012 | | | (0.0 | ) | | | (12.8 | ) | | | 2.6 | | | | (2.3 | ) | | | (3.0 | ) | | | 3.0 | | | | 12.1 | | | | 1.3 | | | | 2.2 | | | | 3.5 | | | | (0.6 | ) | | | 4.0 | | | | 2.1 | | | | (2.1 | ) | | | 2.6 | |
| 2013 | | | 5.8 | | | | 15.2 | | | | 8.1 | | | | (1.2 | ) | | | 2.8 | | | | (0.5 | ) | | | (0.6 | ) | | | (1.7 | ) | | | 5.0 | | | | 5.0 | | | | 3.7 | | | | 3.6 | | | | 2.3 | | | | (0.5 | ) | | | 2.4 | |
| 2014 | | | (0.6 | ) | | | 13.5 | | | | (1.7 | ) | | | 4.7 | | | | 5.9 | | | | 5.5 | | | | 8.8 | | | | 1.0 | | | | 5.4 | | | | 2.0 | | | | 2.4 | | | | 4.0 | | | | 3.1 | | | | (1.5 | ) | | | 3.5 | |
| 2015 | | | 6.5 | | | | (0.1 | ) | | | (0.4 | ) | | | 4.5 | | | | (3.1 | ) | | | 2.7 | | | | (0.3 | ) | | | 5.5 | | | | 3.9 | | | | 0.7 | | | | 3.8 | | | | 4.1 | | | | 2.3 | | | | 1.1 | | | | 2.3 | |
| 2016 | | | (1.7 | ) | | | (11.0 | ) | | | (8.3 | ) | | | (1.7 | ) | | | 2.6 | | | | 4.2 | | | | 1.2 | | | | 4.5 | | | | 1.8 | | | | 4.3 | | | | 3.5 | | | | 4.0 | | | | 3.0 | | | | 1.2 | | | | 2.9 | |
| 2017 | | | 0.2 | | | | (5.3 | ) | | | 1.9 | | | | 4.5 | | | | 1.5 | | | | 1.5 | | | | 7.2 | | | | 0.2 | | | | 10.5 | | | | 3.5 | | | | 6.9 | | | | 2.9 | | | | 3.1 | | | | 1.2 | | | | 3.7 | |
| 2018 | | | 5.6 | | | | (8.9 | ) | | | 5.2 | | | | 4.0 | | | | 9.9 | | | | 0.9 | | | | 3.3 | | | | (4.0 | ) | | | 5.3 | | | | 2.1 | | | | 2.5 | | | | 1.5 | | | | 3.1 | | | | 3.1 | | | | 2.8 | |
| 2019 | | | 1.0 | | | | (12.1 | ) | | | (19.0 | ) | | | 0.3 | | | | 0.4 | | | | (0.9 | ) | | | 8.9 | | | | 0.8 | | | | 2.1 | | | | (0.1 | ) | | | 3.7 | | | | 3.2 | | | | 2.7 | | | | 3.1 | | | | 2.5 | |
| 2020 | | | (3.8 | ) | | | (3.0 | ) | | | (0.9 | ) | | | (2.6 | ) | | | 0.6 | | | | (7.1 | ) | | | 4.2 | | | | 2.7 | | | | (21.6 | ) | | | (1.0 | ) | | | 2.5 | | | | 4.1 | | | | (9.7 | ) | | | (1.7 | ) | | | (3.8 | ) |
| 1 | Other Services includes health care and social assistance, professional, scientific and technical services, educational services, information and cultural industries, accommodation and food services, administrative and support, waste management and remediation services, arts, entertainment and recreation, management of companies and enterprises, and other services (except public administration). |
Source: Statistics Canada (Table: 36-10-0402-01 – accessed May 2021).
| | 2021 Financial and Economic Review – July 2021 | 81 |
| | | |
Appendix 1 – Economic Review Supplementary Tables
Table A1.4 British Columbia GDP, Income Based
| | | | | | | | | Net | | | | | | Consumption of | | | | | | | | | Consumption of | | | | | | Taxes less | | | | | | | |
| | | | | | Gross | | | Operating | | | Consumption of | | | Fixed Capital: | | | Gross | | | Net | | | Fixed Capital: | | | Taxes less | | | subsidies on | | | | | | GDP | |
| | | Compensation | | | Operating | | | Surplus: | | | Fixed Capital: | | | Government & | | | Mixed | | | Mixed | | | Unincorporated | | | subsidies on | | | Products & | | | Statistical | | | at Market | |
| | | of Employees* | | | Surplus | | | Corporations | | | Corporations | | | NPISH | | | Income | | | Income | | | Businesses | | | Production | | | Imports | | | Discrepancy | | | Prices | |
| | | | | | | | | | | | | | | | | | | | | | | | | | | | | | | | | | | | | |
| | | ($ millions) |
| 1981 | | | 25,637 | | | | 9,026 | | | | 3,226 | | | | 4,635 | | | | 1,165 | | | | 6,394 | | | | 4,913 | | | | 1,481 | | | | 2,158 | | | | 3,165 | | | | 216 | | | | 46,596 | |
| 1982 | | | 26,496 | | | | 7,620 | | | | 1,089 | | | | 5,227 | | | | 1,304 | | | | 6,990 | | | | 5,354 | | | | 1,637 | | | | 2,395 | | | | 2,893 | | | | 206 | | | | 46,600 | |
| 1983 | | | 27,018 | | | | 9,080 | | | | 2,334 | | | | 5,374 | | | | 1,372 | | | | 7,446 | | | | 5,732 | | | | 1,714 | | | | 2,847 | | | | 2,884 | | | | 54 | | | | 49,329 | |
| 1984 | | | 27,811 | | | | 10,459 | | | | 3,563 | | | | 5,480 | | | | 1,416 | | | | 8,010 | | | | 6,145 | | | | 1,865 | | | | 2,509 | | | | 3,258 | | | | (260 | ) | | | 51,788 | |
| 1985 | | | 29,101 | | | | 11,850 | | | | 4,746 | | | | 5,636 | | | | 1,468 | | | | 8,824 | | | | 6,843 | | | | 1,981 | | | | 2,531 | | | | 3,699 | | | | (217 | ) | | | 55,788 | |
| 1986 | | | 30,339 | | | | 12,298 | | | | 4,927 | | | | 5,788 | | | | 1,583 | | | | 9,581 | | | | 7,543 | | | | 2,038 | | | | 2,532 | | | | 4,506 | | | | (302 | ) | | | 58,954 | |
| 1987 | | | 32,837 | | | | 14,358 | | | | 6,902 | | | | 5,858 | | | | 1,598 | | | | 10,290 | | | | 8,103 | | | | 2,187 | | | | 2,607 | | | | 5,152 | | | | (97 | ) | | | 65,147 | |
| 1988 | | | 36,110 | | | | 15,750 | | | | 7,807 | | | | 6,161 | | | | 1,782 | | | | 11,259 | | | | 8,903 | | | | 2,356 | | | | 2,726 | | | | 5,568 | | | | 682 | | | | 72,095 | |
| 1989 | | | 40,296 | | | | 16,007 | | | | 7,385 | | | | 6,694 | | | | 1,928 | | | | 12,432 | | | | 9,827 | | | | 2,605 | | | | 2,888 | | | | 6,697 | | | | 123 | | | | 78,443 | |
| 1990 | | | 44,216 | | | | 14,530 | | | | 5,152 | | | | 7,231 | | | | 2,147 | | | | 13,549 | | | | 10,718 | | | | 2,831 | | | | 3,035 | | | | 6,800 | | | | 244 | | | | 82,374 | |
| 1991 | | | 46,296 | | | | 13,330 | | | | 3,871 | | | | 7,304 | | | | 2,155 | | | | 14,555 | | | | 11,560 | | | | 2,995 | | | | 2,964 | | | | 7,593 | | | | 237 | | | | 84,975 | |
| 1992 | | | 48,924 | | | | 13,342 | | | | 3,411 | | | | 7,622 | | | | 2,309 | | | | 15,450 | | | | 12,274 | | | | 3,176 | | | | 3,472 | | | | 8,389 | | | | 938 | | | �� | 90,515 | |
| 1993 | | | 51,312 | | | | 15,377 | | | | 5,079 | | | | 7,926 | | | | 2,372 | | | | 16,133 | | | | 12,698 | | | | 3,435 | | | | 3,952 | | | | 9,112 | | | | 1,335 | | | | 97,221 | |
| 1994 | | | 53,972 | | | | 19,431 | | | | 8,420 | | | | 8,483 | | | | 2,528 | | | | 17,118 | | | | 13,463 | | | | 3,655 | | | | 4,234 | | | | 8,830 | | | | 13 | | | | 103,598 | |
| 1995 | | | 56,768 | | | | 21,649 | | | | 9,975 | | | | 9,011 | | | | 2,663 | | | | 17,851 | | | | 14,052 | | | | 3,799 | | | | 4,268 | | | | 9,242 | | | | (575 | ) | | | 109,203 | |
| 1996 | | | 58,517 | | | | 21,917 | | | | 9,715 | | | | 9,409 | | | | 2,793 | | | | 18,321 | | | | 14,394 | | | | 3,927 | | | | 4,377 | | | | 9,476 | | | | (68 | ) | | | 112,540 | |
| 1997 | | | 60,781 | | | | 24,129 | | | | 11,400 | | | | 9,759 | | | | 2,970 | | | | 18,704 | | | | 14,700 | | | | 4,004 | | | | 4,665 | | | | 10,211 | | | | 96 | | | | 118,585 | |
| 1998 | | | 62,120 | | | | 23,496 | | | | 9,822 | | | | 10,617 | | | | 3,057 | | | | 19,467 | | | | 15,302 | | | | 4,166 | | | | 4,786 | | | | 10,346 | | | | (441 | ) | | | 119,775 | |
| 1999 | | | 64,216 | | | | 25,733 | | | | 11,594 | | | | 10,972 | | | | 3,167 | | | | 20,272 | | | | 16,061 | | | | 4,211 | | | | 4,919 | | | | 10,676 | | | | (158 | ) | | | 125,658 | |
| 2000 | | | 68,591 | | | | 30,979 | | | | 16,192 | | | | 11,403 | | | | 3,384 | | | | 20,843 | | | | 16,470 | | | | 4,373 | | | | 4,974 | | | | 11,063 | | | | (39 | ) | | | 136,411 | |
| 2001 | | | 70,309 | | | | 30,003 | | | | 14,546 | | | | 11,966 | | | | 3,491 | | | | 22,099 | | | | 17,467 | | | | 4,633 | | | | 5,076 | | | | 11,312 | | | | 16 | | | | 138,815 | |
| 2002 | | | 72,951 | | | | 30,307 | | | | 14,491 | | | | 12,229 | | | | 3,587 | | | | 23,426 | | | | 18,541 | | | | 4,885 | | | | 5,009 | | | | 12,408 | | | | (108 | ) | | | 143,993 | |
| 2003 | | | 75,268 | | | | 33,813 | | | | 17,612 | | | | 12,514 | | | | 3,687 | | | | 24,741 | | | | 19,781 | | | | 4,960 | | | | 5,122 | | | | 13,108 | | | | (93 | ) | | | 151,958 | |
| 2004 | | | 80,071 | | | | 39,402 | | | | 22,503 | | | | 13,004 | | | | 3,895 | | | | 26,253 | | | | 21,053 | | | | 5,199 | | | | 5,388 | | | | 13,491 | | | | (5 | ) | | | 164,600 | |
| 2005 | | | 85,336 | | | | 43,994 | | | | 25,971 | | | | 13,824 | | | | 4,199 | | | | 27,827 | | | | 22,337 | | | | 5,490 | | | | 5,679 | | | | 14,219 | | | | 142 | | | | 177,197 | |
| 2006 | | | 93,392 | | | | 46,643 | | | | 26,833 | | | | 15,187 | | | | 4,623 | | | | 29,526 | | | | 23,736 | | | | 5,790 | | | | 5,959 | | | | 14,881 | | | | 78 | | | | 190,479 | |
| 2007 | | | 98,459 | | | | 47,607 | | | | 25,901 | | | | 16,597 | | | | 5,109 | | | | 31,784 | | | | 25,438 | | | | 6,345 | | | | 6,505 | | | | 15,799 | | | | 287 | | | | 200,440 | |
| 2008 | | | 102,318 | | | | 49,897 | | | | 25,892 | | | | 18,259 | | | | 5,746 | | | | 32,435 | | | | 25,604 | | | | 6,830 | | | | 6,812 | | | | 14,756 | | | | 210 | | | | 206,427 | |
| 2009 | | | 100,375 | | | | 41,901 | | | | 17,293 | | | | 18,789 | | | | 5,819 | | | | 33,771 | | | | 26,845 | | | | 6,925 | | | | 7,038 | | | | 14,969 | | | | 125 | | | | 198,179 | |
| 2010 | | | 102,621 | | | | 45,534 | | | | 20,992 | | | | 18,561 | | | | 5,981 | | | | 35,494 | | | | 28,408 | | | | 7,086 | | | | 7,338 | | | | 15,870 | | | | 134 | | | | 206,990 | |
| 2011 | | | 106,845 | | | | 51,238 | | | | 25,450 | | | | 19,437 | | | | 6,351 | | | | 36,872 | | | | 29,536 | | | | 7,336 | | | | 7,216 | | | | 16,493 | | | | 107 | | | | 218,771 | |
| 2012 | | | 110,128 | | | | 50,606 | | | | 23,422 | | | | 20,589 | | | | 6,595 | | | | 38,645 | | | | 31,069 | | | | 7,576 | | | | 7,332 | | | | 16,611 | | | | 6 | | | | 223,328 | |
| 2013 | | | 114,300 | | | | 51,647 | | | | 23,263 | | | | 21,550 | | | | 6,834 | | | | 40,286 | | | | 32,361 | | | | 7,925 | | | | 8,129 | | | | 16,784 | | | | (165 | ) | | | 230,981 | |
| 2014 | | | 118,452 | | | | 56,480 | | | | 26,944 | | | | 22,450 | | | | 7,086 | | | | 42,286 | | | | 34,193 | | | | 8,093 | | | | 8,603 | | | | 18,012 | | | | 39 | | | | 243,872 | |
| 2015 | | | 123,805 | | | | 55,116 | | | | 23,835 | | | | 23,883 | | | | 7,398 | | | | 43,935 | | | | 35,527 | | | | 8,408 | | | | 8,736 | | | | 19,057 | | | | 135 | | | | 250,784 | |
| 2016 | | | 127,866 | | | | 60,562 | | | | 28,372 | | | | 24,554 | | | | 7,636 | | | | 46,030 | | | | 37,237 | | | | 8,793 | | | | 9,073 | | | | 20,593 | | | | (212 | ) | | | 263,912 | |
| 2017 | | | 135,921 | | | | 66,610 | | | | 33,638 | | | | 25,035 | | | | 7,937 | | | | 47,982 | | | | 38,543 | | | | 9,439 | | | | 9,625 | | | | 22,062 | | | | 83 | | | | 282,283 | |
| 2018 | | | 144,465 | | | | 68,860 | | | | 34,297 | | | | 26,149 | | | | 8,414 | | | | 49,654 | | | | 39,656 | | | | 9,998 | | | | 10,622 | | | | 22,511 | | | | 23 | | | | 296,135 | |
| 2019 | | | 152,588 | | | | 68,198 | | | | 31,882 | | | | 27,366 | | | | 8,950 | | | | 53,228 | | | | 42,771 | | | | 10,457 | | | | 12,613 | | | | 22,626 | | | | (194 | ) | | | 309,059 | |
| 2020 | | | - | | | | - | | | | - | | | | - | | | | - | | | | - | | | | - | | | | - | | | | - | | | | - | | | | - | | | | - | |
| * | Component of income-based GDP, including wages, salaries and employers' social contributions earned in B.C. by residents and non-residents of the province. |

| 82 | 2021 FINANCIAL AND ECONOMIC REVIEW – JULY 2021 | |
| | | |
Appendix 1 – Economic Review Supplementary Tables
Table A1.4 British Columbia GDP, Income Based (continued)
| | | | | | | | | Net | | | | | | Consumption of | | | | | | | | | Consumption of | | | | | | Taxes less | | | | | | | |
| | | | | | Gross | | | Operating | | | Consumption of | | | Fixed Capital: | | | Gross | | | Net | | | Fixed Capital: | | | Taxes less | | | subsidies on | | | | | | GDP | |
| | | Compensation | | | Operating | | | Surplus: | | | Fixed Capital: | | | Government & | | | Mixed | | | Mixed | | | Unincorporated | | | subsidies on | | | Products & | | | Statistical | | | at Market | |
| | | of Employees* | | | Surplus | | | Corporations | | | Corporations | | | NPISH | | | Income | | | Income | | | Businesses | | | Production | | | Imports | | | Discrepancy | | | Prices | |
| | | | | | | | | | | | | | | | | | | | | | | | | | | | | | | | | | | | | |
| | | (annual percentage change) |
| 1982 | | | 3.4 | | | | (15.6 | ) | | | (66.2 | ) | | | 12.8 | | | | 11.9 | | | | 9.3 | | | | 9.0 | | | | 10.5 | | | | 11.0 | | | | (8.6 | ) | | | (4.6 | ) | | | 0.0 | |
| 1983 | | | 2.0 | | | | 19.2 | | | | 114.3 | | | | 2.8 | | | | 5.2 | | | | 6.5 | | | | 7.1 | | | | 4.7 | | | | 18.9 | | | | (0.3 | ) | | | (73.8 | ) | | | 5.9 | |
| 1984 | | | 2.9 | | | | 15.2 | | | | 52.7 | | | | 2.0 | | | | 3.2 | | | | 7.6 | | | | 7.2 | | | | 8.8 | | | | (11.9 | ) | | | 13.0 | | | | (581.5 | ) | | | 5.0 | |
| 1985 | | | 4.6 | | | | 13.3 | | | | 33.2 | | | | 2.8 | | | | 3.7 | | | | 10.2 | | | | 11.4 | | | | 6.2 | | | | 0.9 | | | | 13.5 | | | | (16.5 | ) | | | 7.7 | |
| 1986 | | | 4.3 | | | | 3.8 | | | | 3.8 | | | | 2.7 | | | | 7.8 | | | | 8.6 | | | | 10.2 | | | | 2.9 | | | | 0.0 | | | | 21.8 | | | | 39.2 | | | | 5.7 | |
| 1987 | | | 8.2 | | | | 16.8 | | | | 40.1 | | | | 1.2 | | | | 0.9 | | | | 7.4 | | | | 7.4 | | | | 7.3 | | | | 3.0 | | | | 14.3 | | | | (67.9 | ) | | | 10.5 | |
| 1988 | | | 10.0 | | | | 9.7 | | | | 13.1 | | | | 5.2 | | | | 11.5 | | | | 9.4 | | | | 9.9 | | | | 7.7 | | | | 4.6 | | | | 8.1 | | | | (803.1 | ) | | | 10.7 | |
| 1989 | | | 11.6 | | | | 1.6 | | | | (5.4 | ) | | | 8.7 | | | | 8.2 | | | | 10.4 | | | | 10.4 | | | | 10.6 | | | | 5.9 | | | | 20.3 | | | | (82.0 | ) | | | 8.8 | |
| 1990 | | | 9.7 | | | | (9.2 | ) | | | (30.2 | ) | | | 8.0 | | | | 11.4 | | | | 9.0 | | | | 9.1 | | | | 8.7 | | | | 5.1 | | | | 1.5 | | | | 98.4 | | | | 5.0 | |
| 1991 | | | 4.7 | | | | (8.3 | ) | | | (24.9 | ) | | | 1.0 | | | | 0.4 | | | | 7.4 | | | | 7.9 | | | | 5.8 | | | | (2.3 | ) | | | 11.7 | | | | (2.9 | ) | | | 3.2 | |
| 1992 | | | 5.7 | | | | 0.1 | | | | (11.9 | ) | | | 4.4 | | | | 7.1 | | | | 6.1 | | | | 6.2 | | | | 6.0 | | | | 17.1 | | | | 10.5 | | | | 295.8 | | | | 6.5 | |
| 1993 | | | 4.9 | | | | 15.3 | | | | 48.9 | | | | 4.0 | | | | 2.7 | | | | 4.4 | | | | 3.5 | | | | 8.2 | | | | 13.8 | | | | 8.6 | | | | 42.3 | | | | 7.4 | |
| 1994 | | | 5.2 | | | | 26.4 | | | | 65.8 | | | | 7.0 | | | | 6.6 | | | | 6.1 | | | | 6.0 | | | | 6.4 | | | | 7.1 | | | | (3.1 | ) | | | (99.0 | ) | | | 6.6 | |
| 1995 | | | 5.2 | | | | 11.4 | | | | 18.5 | | | | 6.2 | | | | 5.3 | | | | 4.3 | | | | 4.4 | | | | 3.9 | | | | 0.8 | | | | 4.7 | | | | (4,523.1 | ) | | | 5.4 | |
| 1996 | | | 3.1 | | | | 1.2 | | | | (2.6 | ) | | | 4.4 | | | | 4.9 | | | | 2.6 | | | | 2.4 | | | | 3.4 | | | | 2.6 | | | | 2.5 | | | | (88.2 | ) | | | 3.1 | |
| 1997 | | | 3.9 | | | | 10.1 | | | | 17.3 | | | | 3.7 | | | | 6.3 | | | | 2.1 | | | | 2.1 | | | | 2.0 | | | | 6.6 | | | | 7.8 | | | | (241.2 | ) | | | 5.4 | |
| 1998 | | | 2.2 | | | | (2.6 | ) | | | (13.8 | ) | | | 8.8 | | | | 2.9 | | | | 4.1 | | | | 4.1 | | | | 4.0 | | | | 2.6 | | | | 1.3 | | | | (559.4 | ) | | | 1.0 | |
| 1999 | | | 3.4 | | | | 9.5 | | | | 18.0 | | | | 3.3 | | | | 3.6 | | | | 4.1 | | | | 5.0 | | | | 1.1 | | | | 2.8 | | | | 3.2 | | | | (64.2 | ) | | | 4.9 | |
| 2000 | | | 6.8 | | | | 20.4 | | | | 39.7 | | | | 3.9 | | | | 6.9 | | | | 2.8 | | | | 2.5 | | | | 3.8 | | | | 1.1 | | | | 3.6 | | | | (75.3 | ) | | | 8.6 | |
| 2001 | | | 2.5 | | | | (3.2 | ) | | | (10.2 | ) | | | 4.9 | | | | 3.2 | | | | 6.0 | | | | 6.1 | | | | 5.9 | | | | 2.1 | | | | 2.3 | | | | (141.0 | ) | | | 1.8 | |
| 2002 | | | 3.8 | | | | 1.0 | | | | (0.4 | ) | | | 2.2 | | | | 2.7 | | | | 6.0 | | | | 6.1 | | | | 5.4 | | | | (1.3 | ) | | | 9.7 | | | | (775.0 | ) | | | 3.7 | |
| 2003 | | | 3.2 | | | | 11.6 | | | | 21.5 | | | | 2.3 | | | | 2.8 | | | | 5.6 | | | | 6.7 | | | | 1.5 | | | | 2.3 | | | | 5.6 | | | | (13.9 | ) | | | 5.5 | |
| 2004 | | | 6.4 | | | | 16.5 | | | | 27.8 | | | | 3.9 | | | | 5.6 | | | | 6.1 | | | | 6.4 | | | | 4.8 | | | | 5.2 | | | | 2.9 | | | | (94.6 | ) | | | 8.3 | |
| 2005 | | | 6.6 | | | | 11.7 | | | | 15.4 | | | | 6.3 | | | | 7.8 | | | | 6.0 | | | | 6.1 | | | | 5.6 | | | | 5.4 | | | | 5.4 | | | | (2,940.0 | ) | | | 7.7 | |
| 2006 | | | 9.4 | | | | 6.0 | | | | 3.3 | | | | 9.9 | | | | 10.1 | | | | 6.1 | | | | 6.3 | | | | 5.5 | | | | 4.9 | | | | 4.7 | | | | (45.1 | ) | | | 7.5 | |
| 2007 | | | 5.4 | | | | 2.1 | | | | (3.5 | ) | | | 9.3 | | | | 10.5 | | | | 7.6 | | | | 7.2 | | | | 9.6 | | | | 9.2 | | | | 6.2 | | | | 267.9 | | | | 5.2 | |
| 2008 | | | 3.9 | | | | 4.8 | | | | (0.0 | ) | | | 10.0 | | | | 12.5 | | | | 2.0 | | | | 0.7 | | | | 7.6 | | | | 4.7 | | | | (6.6 | ) | | | (26.8 | ) | | | 3.0 | |
| 2009 | | | (1.9 | ) | | | (16.0 | ) | | | (33.2 | ) | | | 2.9 | | | | 1.3 | | | | 4.1 | | | | 4.8 | | | | 1.4 | | | | 3.3 | | | | 1.4 | | | | (40.5 | ) | | | (4.0 | ) |
| 2010 | | | 2.2 | | | | 8.7 | | | | 21.4 | | | | (1.2 | ) | | | 2.8 | | | | 5.1 | | | | 5.8 | | | | 2.3 | | | | 4.3 | | | | 6.0 | | | | 7.2 | | | | 4.4 | |
| 2011 | | | 4.1 | | | | 12.5 | | | | 21.2 | | | | 4.7 | | | | 6.2 | | | | 3.9 | | | | 4.0 | | | | 3.5 | | | | (1.7 | ) | | | 3.9 | | | | (20.1 | ) | | | 5.7 | |
| 2012 | | | 3.1 | | | | (1.2 | ) | | | (8.0 | ) | | | 5.9 | | | | 3.8 | | | | 4.8 | | | | 5.2 | | | | 3.3 | | | | 1.6 | | | | 0.7 | | | | (94.4 | ) | | | 2.1 | |
| 2013 | | | 3.8 | | | | 2.1 | | | | (0.7 | ) | | | 4.7 | | | | 3.6 | | | | 4.2 | | | | 4.2 | | | | 4.6 | | | | 10.9 | | | | 1.0 | | | | (2,850.0 | ) | | | 3.4 | |
| 2014 | | | 3.6 | | | | 9.4 | | | | 15.8 | | | | 4.2 | | | | 3.7 | | | | 5.0 | | | | 5.7 | | | | 2.1 | | | | 5.8 | | | | 7.3 | | | | (123.6 | ) | | | 5.6 | |
| 2015 | | | 4.5 | | | | (2.4 | ) | | | (11.5 | ) | | | 6.4 | | | | 4.4 | | | | 3.9 | | | | 3.9 | | | | 3.9 | | | | 1.5 | | | | 5.8 | | | | 246.2 | | | | 2.8 | |
| 2016 | | | 3.3 | | | | 9.9 | | | | 19.0 | | | | 2.8 | | | | 3.2 | | | | 4.8 | | | | 4.8 | | | | 4.6 | | | | 3.9 | | | | 8.1 | | | | (257.0 | ) | | | 5.2 | |
| 2017 | | | 6.3 | | | | 10.0 | | | | 18.6 | | | | 2.0 | | | | 3.9 | | | | 4.2 | | | | 3.5 | | | | 7.3 | | | | 6.1 | | | | 7.1 | | | | (139.2 | ) | | | 7.0 | |
| 2018 | | | 6.3 | | | | 3.4 | | | | 2.0 | | | | 4.4 | | | | 6.0 | | | | 3.5 | | | | 2.9 | | | | 5.9 | | | | 10.4 | | | | 2.0 | | | | (72.3 | ) | | | 4.9 | |
| 2019 | | | 5.6 | | | | (1.0 | ) | | | (7.0 | ) | | | 4.7 | | | | 6.4 | | | | 7.2 | | | | 7.9 | | | | 4.6 | | | | 18.7 | | | | 0.5 | | | | (943.5 | ) | | | 4.4 | |
| 2020 | | | - | | | | - | | | | - | | | | - | | | | - | | | | - | | | | - | | | | - | | | | - | | | | - | | | | - | | | | - | |
| * | Component of income-based GDP, including wages, salaries and employers' social contributions earned in B.C. by residents and non-residents of the province. |
Source: Statistics Canada (Table: 36-10-0221-01 – accessed May 2021).
| | 2021 FINANCIAL AND ECONOMIC REVIEW – JULY 2021 | 83 |
| | | |
APPENDIX 1 – ECONOMIC REVIEW SUPPLEMENTARY TABLES
Table A1.5 Employment by Industry in British Columbia
| |
| | | 2002 | | | 2003 | | | 2004 | | | 2005 | | | 2006 | | | 2007 | | | 2008 | | | 2009 | | | 2010 | | | 2011 | | | 2012 | | | 2013 | | | 2014 | | | 2015 | | | 2016 | | | 2017 | | | 2018 | | | 2019 | | | 2020 | |
| | | | | | | | | | | | | | | | | | | | | | | | | | | | | | | | | | | | | | | | | | | | | | | | | | | | | | | | | | |
| | | | | | | | | | | | | | | | | | | | | | | | | | | (thousands) | | | | | | | | | | | | | | | | | | | | | | | | | | | | |
| Total – all industries | | | 1,952 | | | | 1,998 | | | | 2,028 | | | | 2,090 | | | | 2,138 | | | | 2,204 | | | | 2,239 | | | | 2,187 | | | | 2,215 | | | | 2,220 | | | | 2,275 | | | | 2,291 | | | | 2,332 | | | | 2,371 | | | | 2,454 | | | | 2,554 | | | | 2,590 | | | | 2,666 | | | | 2,491 | |
| | | | | | | | | | | | | | | | | | | | | | | | | | | | | | | | | | | | | | | | | | | | | | | | | | | | | | | | | | | | | | | | | | | | | | | | | | | | | |
| Primary industries | | | 67 | | | | 78 | | | | 72 | | | | 76 | | | | 78 | | | | 82 | | | | 76 | | | | 72 | | | | 72 | | | | 65 | | | | 68 | | | | 76 | | | | 78 | | | | 74 | | | | 78 | | | | 79 | | | | 78 | | | | 77 | | | | 75 | |
| Agriculture | | | 30 | | | | 33 | | | | 36 | | | | 38 | | | | 35 | | | | 36 | | | | 33 | | | | 32 | | | | 30 | | | | 25 | | | | 24 | | | | 27 | | | | 25 | | | | 23 | | | | 24 | | | | 26 | | | | 25 | | | | 29 | | | | 30 | |
| Forestry, logging & support activities | | | 25 | | | | 27 | | | | 22 | | | | 22 | | | | 21 | | | | 24 | | | | 17 | | | | 14 | | | | 17 | | | | 15 | | | | 16 | | | | 18 | | | | 20 | | | | 20 | | | | 21 | | | | 20 | | | | 19 | | | | 18 | | | | 17 | |
| Fishing, hunting & trapping | | | 3 | | | | 5 | | | | 3 | | | | 2 | | | | 3 | | | | 3 | | | | 2 | | | | 2 | | | | 2 | | | | | x | | | 2 | | | | 2 | | | | 2 | | | | 2 | | | | 2 | | | | 2 | | | | 3 | | | | 2 | | | | 3 | |
| Mining & oil & gas extraction | | | 9 | | | | 13 | | | | 11 | | | | 14 | | | | 19 | | | | 20 | | | | 24 | | | | 24 | | | | 24 | | | | 25 | | | | 25 | | | | 29 | | | | 31 | | | | 29 | | | | 32 | | | | 31 | | | | 30 | | | | 29 | | | | 25 | |
| | | | | | | | | | | | | | | | | | | | | | | | | | | | | | | | | | | | | | | | | | | | | | | | | | | | | | | | | | | | | | | | | | | | | | | | | | | | | |
| Manufacturing | | | 198 | | | | 207 | | | | 208 | | | | 193 | | | | 190 | | | | 197 | | | | 180 | | | | 153 | | | | 152 | | | | 157 | | | | 168 | | | | 155 | | | | 163 | | | | 175 | | | | 176 | | | | 182 | | | | 180 | | | | 172 | | | | 168 | |
| Food, beverages & tobacco | | | 27 | | | | 31 | | | | 31 | | | | 31 | | | | 23 | | | | 27 | | | | 29 | | | | 27 | | | | 25 | | | | 29 | | | | 30 | | | | 27 | | | | 28 | | | | 33 | | | | 38 | | | | 34 | | | | 38 | | | | 37 | | | | 35 | |
| Wood products | | | 48 | | | | 51 | | | | 49 | | | | 47 | | | | 44 | | | | 44 | | | | 35 | | | | 28 | | | | 29 | | | | 31 | | | | 28 | | | | 30 | | | | 32 | | | | 36 | | | | 33 | | | | 30 | | | | 25 | | | | 22 | | | | 21 | |
| Paper | | | 17 | | | | 14 | | | | 12 | | | | 12 | | | | 15 | | | | 15 | | | | 13 | | | | 10 | | | | 9 | | | | 9 | | | | 12 | | | | 11 | | | | 13 | | | | 10 | | | | 9 | | | | 12 | | | | 9 | | | | 9 | | | | 10 | |
| Printing & related support activities | | | 9 | | | | 8 | | | | 8 | | | | 8 | | | | 8 | | | | 6 | | | | 8 | | | | 7 | | | | 6 | | | | 7 | | | | 8 | | | | 7 | | | | 6 | | | | 9 | | | | 5 | | | | 8 | | | | 7 | | | | 4 | | | | 2 | |
| Primary metals | | | 6 | | | | 9 | | | | 7 | | | | 7 | | | | 7 | | | | 6 | | | | 5 | | | | 5 | | | | 7 | | | | 6 | | | | 6 | | | | 5 | | | | 2 | | | | 5 | | | | 3 | | | | 4 | | | | 6 | | | | 7 | | | | 7 | |
| Metal fabrication | | | 13 | | | | 14 | | | | 15 | | | | 18 | | | | 15 | | | | 15 | | | | 16 | | | | 12 | | | | 12 | | | | 11 | | | | 14 | | | | 12 | | | | 12 | | | | 16 | | | | 14 | | | | 14 | | | | 14 | | | | 14 | | | | 10 | |
| Transportation equipment | | | 14 | | | | 12 | | | | 12 | | | | 9 | | | | 9 | | | | 12 | | | | 10 | | | | 10 | | | | 9 | | | | 9 | | | | 11 | | | | 9 | | | | 10 | | | | 8 | | | | 10 | | | | 10 | | | | 12 | | | | 11 | | | | 11 | |
| Machinery manufacturing | | | 10 | | | | 9 | | | | 10 | | | | 10 | | | | 9 | | | | 9 | | | | 6 | | | | 6 | | | | 7 | | | | 9 | | | | 10 | | | | 10 | | | | 9 | | | | 8 | | | | 11 | | | | 10 | | | | 9 | | | | 12 | | | | 8 | |
| Other manufacturing | | | 55 | | | | 58 | | | | 66 | | | | 53 | | | | 61 | | | | 64 | | | | 58 | | | | 48 | | | | 50 | | | | 47 | | | | 51 | | | | 45 | | | | 52 | | | | 49 | | | | 54 | | | | 61 | | | | 61 | | | | 57 | | | | 64 | |
| | | | | | | | | | | | | | | | | | | | | | | | | | | | | | | | | | | | | | | | | | | | | | | | | | | | | | | | | | | | | | | | | | | | | | | | | | | | | |
| Construction | | | 117 | | | | 118 | | | | 142 | | | | 166 | | | | 176 | | | | 192 | | | | 218 | | | | 202 | | | | 198 | | | | 195 | | | | 194 | | | | 202 | | | | 205 | | | | 208 | | | | 218 | | | | 236 | | | | 248 | | | | 250 | | | | 222 | |
| General contractors | | | 41 | | | | 47 | | | | 51 | | | | 65 | | | | 65 | | | | 65 | | | | 84 | | | | 77 | | | | 79 | | | | 78 | | | | 77 | | | | 85 | | | | 93 | | | | 91 | | | | 93 | | | | 105 | | | | 110 | | | | 107 | | | | 101 | |
| Special trade contractors | | | 76 | | | | 71 | | | | 92 | | | | 101 | | | | 111 | | | | 127 | | | | 134 | | | | 125 | | | | 119 | | | | 117 | | | | 118 | | | | 118 | | | | 112 | | | | 116 | | | | 125 | | | | 130 | | | | 138 | | | | 142 | | | | 120 | |
| | | | | | | | | | | | | | | | | | | | | | | | | | | | | | | | | | | | | | | | | | | | | | | | | | | | | | | | | | | | | | | | | | | | | | | | | | | | | |
| Utilities | | | 11 | | | | 11 | | | | 9 | | | | 10 | | | | 8 | | | | 10 | | | | 12 | | | | 12 | | | | 11 | | | | 10 | | | | 11 | | | | 11 | | | | 15 | | | | 16 | | | | 15 | | | | 14 | | | | 15 | | | | 13 | | | | 19 | |
| | | | | | | | | | | | | | | | | | | | | | | | | | | | | | | | | | | | | | | | | | | | | | | | | | | | | | | | | | | | | | | | | | | | | | | | | | | | | |
| Transportation & warehousing | | | 110 | | | | 115 | | | | 113 | | | | 116 | | | | 116 | | | | 123 | | | | 125 | | | | 114 | | | | 118 | | | | 123 | | | | 130 | | | | 128 | | | | 136 | | | | 142 | | | | 141 | | | | 141 | | | | 141 | | | | 147 | | | | 134 | |
| Transportation | | | 105 | | | | 109 | | | | 108 | | | | 112 | | | | 109 | | | | 116 | | | | 119 | | | | 108 | | | | 112 | | | | 115 | | | | 120 | | | | 118 | | | | 127 | | | | 135 | | | | 134 | | | | 130 | | | | 130 | | | | 139 | | | | 127 | |
| Warehousing & storage | | | 5 | | | | 6 | | | | 5 | | | | 5 | | | | 6 | | | | 7 | | | | 5 | | | | 6 | | | | 6 | | | | 8 | | | | 11 | | | | 9 | | | | 9 | | | | 7 | | | | 8 | | | | 11 | | | | 11 | | | | 8 | | | | 7 | |
| | | | | | | | | | | | | | | | | | | | | | | | | | | | | | | | | | | | | | | | | | | | | | | | | | | | | | | | | | | | | | | | | | | | | | | | | | | | | |
| Trade | | | 319 | | | | 326 | | | | 313 | | | | 330 | | | | 341 | | | | 354 | | | | 350 | | | | 358 | | | | 364 | | | | 351 | | | | 350 | | | | 365 | | | | 367 | | | | 363 | | | | 380 | | | | 388 | | | | 386 | | | | 399 | | | | 375 | |
| Wholesale trade | | | 72 | | | | 76 | | | | 66 | | | | 79 | | | | 80 | | | | 79 | | | | 85 | | | | 85 | | | | 80 | | | | 77 | | | | 82 | | | | 83 | | | | 82 | | | | 87 | | | | 92 | | | | 86 | | | | 85 | | | | 89 | | | | 89 | |
| Retail trade | | | 246 | | | | 249 | | | | 248 | | | | 251 | | | | 261 | | | | 275 | | | | 266 | | | | 273 | | | | 284 | | | | 275 | | | | 268 | | | | 282 | | | | 285 | | | | 276 | | | | 288 | | | | 302 | | | | 301 | | | | 310 | | | | 287 | |
| | | | | | | | | | | | | | | | | | | | | | | | | | | | | | | | | | | | | | | | | | | | | | | | | | | | | | | | | | | | | | | | | | | | | | | | | | | | | |
| Finance, Insurance, Real Estate | | | | | | | | | | | | | | | | | | | | | | | | | | | | | | | | | | | | | | | | | | | | | | | | | | | | | | | | | | | | | | | | | | | | | | | | | | | | |
| & Leasing | | | 124 | | | | 126 | | | | 128 | | | | 131 | | | | 134 | | | | 141 | | | | 140 | | | | 134 | | | | 140 | | | | 140 | | | | 139 | | | | 141 | | | | 138 | | | | 130 | | | | 138 | | | | 161 | | | | 155 | | | | 165 | | | | 164 | |
| Finance | | | 57 | | | | 60 | | | | 55 | | | | 59 | | | | 60 | | | | 66 | | | | 62 | | | | 58 | | | | 66 | | | | 54 | | | | 63 | | | | 60 | | | | 63 | | | | 58 | | | | 63 | | | | 68 | | | | 66 | | | | 71 | | | | 69 | |
| Insurance | | | 24 | | | | 21 | | | | 27 | | | | 26 | | | | 26 | | | | 28 | | | | 29 | | | | 28 | | | | 28 | | | | 32 | | | | 26 | | | | 29 | | | | 27 | | | | 29 | | | | 29 | | | | 34 | | | | 31 | | | | 31 | | | | 36 | |
| Real estate | | | 32 | | | | 35 | | | | 35 | | | | 34 | | | | 39 | | | | 36 | | | | 39 | | | | 39 | | | | 37 | | | | 45 | | | | 44 | | | | 44 | | | | 40 | | | | 36 | | | | 40 | | | | 53 | | | | 52 | | | | 54 | | | | 52 | |
| Leasing | | | 11 | | | | 11 | | | | 11 | | | | 13 | | | | 10 | | | | 9 | | | | 11 | | | | 10 | | | | 9 | | | | 9 | | | | 6 | | | | 8 | | | | 8 | | | | 7 | | | | 6 | | | | 7 | | | | 6 | | | | 9 | | | | 7 | |
| | | | | | | | | | | | | | | | | | | | | | | | | | | | | | | | | | | | | | | | | | | | | | | | | | | | | | | | | | | | | | | | | | | | | | | | | | | | | |
| Public administration | | | 90 | | | | 95 | | | | 99 | | | | 93 | | | | 88 | | | | 93 | | | | 99 | | | | 105 | | | | 106 | | | | 107 | | | | 103 | | | | 103 | | | | 102 | | | | 101 | | | | 109 | | | | 108 | | | | 109 | | | | 119 | | | | 120 | |
| Federal administration | | | 33 | | | | 37 | | | | 35 | | | | 32 | | | | 34 | | | | 34 | | | | 37 | | | | 39 | | | | 43 | | | | 43 | | | | 44 | | | | 36 | | | | 34 | | | | 37 | | | | 39 | | | | 39 | | | | 35 | | | | 44 | | | | 40 | |
| Provincial administration | | | 28 | | | | 29 | | | | 30 | | | | 29 | | | | 26 | | | | 26 | | | | 26 | | | | 27 | | | | 27 | | | | 25 | | | | 28 | | | | 30 | | | | 31 | | | | 29 | | | | 34 | | | | 33 | | | | 36 | | | | 37 | | | | 37 | |
| Local administration | | | 29 | | | | 29 | | | | 35 | | | | 32 | | | | 28 | | | | 33 | | | | 37 | | | | 40 | | | | 36 | | | | 38 | | | | 31 | | | | 37 | | | | 38 | | | | 34 | | | | 36 | | | | 37 | | | | 38 | | | | 39 | | | | 43 | |
| | | | | | | | | | | | | | | | | | | | | | | | | | | | | | | | | | | | | | | | | | | | | | | | | | | | | | | | | | | | | | | | | | | | | | | | | | | | | |
| Other service industries | | | 918 | | | | 924 | | | | 944 | | | | 974 | | | | 1,007 | | | | 1,014 | | | | 1,039 | | | | 1,037 | | | | 1,053 | | | | 1,072 | | | | 1,112 | | | | 1,111 | | | | 1,127 | | | | 1,163 | | | | 1,200 | | | | 1,246 | | | | 1,279 | | | | 1,324 | | | | 1,215 | |
| Education & related services | | | 137 | | | | 137 | | | | 132 | | | | 143 | | | | 153 | | | | 154 | | | | 152 | | | | 149 | | | | 153 | | | | 154 | | | | 167 | | | | 171 | | | | 172 | | | | 170 | | | | 171 | | | | 172 | | | | 174 | | | | 184 | | | | 179 | |
| Health & welfare services | | | 211 | | | | 214 | | | | 217 | | | | 213 | | | | 229 | | | | 231 | | | | 240 | | | | 255 | | | | 261 | | | | 261 | | | | 272 | | | | 266 | | | | 277 | | | | 298 | | | | 304 | | | | 316 | | | | 338 | | | | 335 | | | | 325 | |
| Professional, scientific & technical | | | 134 | | | | 136 | | | | 143 | | | | 159 | | | | 165 | | | | 166 | | | | 166 | | | | 161 | | | | 163 | | | | 175 | | | | 170 | | | | 183 | | | | 187 | | | | 191 | | | | 199 | | | | 203 | | | | 215 | | | | 231 | | | | 231 | |
| Information, culture & recreation | | | 105 | | | | 105 | | | | 110 | | | | 109 | | | | 111 | | | | 114 | | | | 116 | | | | 111 | | | | 113 | | | | 108 | | | | 111 | | | | 110 | | | | 111 | | | | 118 | | | | 133 | | | | 140 | | | | 130 | | | | 134 | | | | 110 | |
| Services to business management | | | 72 | | | | 79 | | | | 80 | | | | 90 | | | | 96 | | | | 95 | | | | 103 | | | | 98 | | | | 95 | | | | 94 | | | | 97 | | | | 99 | | | | 90 | | | | 97 | | | | 108 | | | | 107 | | | | 103 | | | | 116 | | | | 98 | |
| Accommodation & food services | | | 163 | | | | 159 | | | | 170 | | | | 172 | | | | 166 | | | | 168 | | | | 167 | | | | 169 | | | | 172 | | | | 184 | | | | 183 | | | | 180 | | | | 186 | | | | 181 | | | | 176 | | | | 191 | | | | 195 | | | | 201 | | | | 168 | |
| Miscellaneous services | | | 96 | | | | 94 | | | | 93 | | | | 88 | | | | 87 | | | | 86 | | | | 95 | | | | 94 | | | | 96 | | | | 98 | | | | 111 | | | | 102 | | | | 105 | | | | 109 | | | | 109 | | | | 118 | | | | 123 | | | | 124 | | | | 104 | |
Source: Statistics Canada, Labour Force Survey (Table: 14-10-0023-01 and unpublished data - accessed July 2021). Totals may not add due to rounding.
| x | Suppressed to meet the confidentiality requirements of the Statistics Act. |
| 84 | 2021 FINANCIAL AND ECONOMIC REVIEW – JULY 2021 | |
| | | |
APPENDIX 1 – ECONOMIC REVIEW SUPPLEMENTARY TABLES
Table A1.6 Capital Investment by Industry
| | | | | | | | | | | | | | | Preliminary | | | | | | 2019 | | | 2020 | |
| | | Actual | | | Actual | | | Actual | | | Actual | | | Actual | | | Intentions | | | to | | | to | |
| | | 2016 | | | 2017 | | | 2018 | | | 2019 | | | 2020 | | | 2021 | | | 2020 | | | 2021 | |
| | | | | | | | | | | | | | | | | | | | | | | | | |
| | | | | | | | | ($ millions) | | | | | | | | | (per cent) | |
| Agriculture, forestry, fishing and hunting | | | 511.3 | | | | 696.8 | | | | 979.9 | | | | 1,128.3 | | | | | x | | | 975.5 | | | | - | | | | - | |
| Mining, quarrying, and oil and gas extraction | | | 4,573.3 | | | | 6,250.8 | | | | 4,449.5 | | | | 4,558.3 | | | | 3,012.1 | | | | 3,448.0 | | | | (33.9 | ) | | | 14.5 | |
| Manufacturing | | | | x | | | 1,370.5 | | | | 1,831.4 | | | | 2,164.8 | | | | 1,644.1 | | | | 1,673.7 | | | | (24.1 | ) | | | 1.8 | |
| Construction | | | 832.9 | | | | 978.2 | | | | 1,063.1 | | | | 1,066.7 | | | | 995.8 | | | | 1,048.6 | | | | (6.6 | ) | | | 5.3 | |
| Transportation and warehousing | | | 4,215.0 | | | | 4,822.1 | | | | 6,251.5 | | | | 12,286.5 | | | | 15,278.0 | | | | 15,848.8 | | | | 24.3 | | | | 3.7 | |
| Utilities | | | 3,698.0 | | | | 3,535.0 | | | | 4,203.6 | | | | 4,944.5 | | | | 5,398.5 | | | | 5,458.8 | | | | 9.2 | | | | 1.1 | |
| Wholesale trade | | | | x | | | 421.4 | | | | 514.5 | | | | 697.2 | | | | | x | | | 421.6 | | | | - | | | | - | |
| Retail trade | | | 809.7 | | | | 713.9 | | | | | x | | | 932.7 | | | | | x | | | 856.0 | | | | - | | | | - | |
| Finance and insurance | | | 341.9 | | | | 250.6 | | | | 318.6 | | | | 394.9 | | | | 345.2 | | | | 338.1 | | | | (12.6 | ) | | | (2.1 | ) |
| Real estate, rental and leasing | | | 1,638.5 | | | | 1,629.1 | | | | 1,953.4 | | | | 2,472.1 | | | | 1,882.4 | | | | 1,973.5 | | | | (23.9 | ) | | | 4.8 | |
| Information and cultural industries | | | 1,579.9 | | | | 1,631.0 | | | | 1,617.1 | | | | 1,510.7 | | | | 1,635.9 | | | | 1,652.0 | | | | 8.3 | | | | 1.0 | |
| Professional, scientific and technical services | | | 318.8 | | | | 307.5 | | | | 424.1 | | | | 509.9 | | | | 438.7 | | | | 569.0 | | | | (14.0 | ) | | | 29.7 | |
| Management of companies and enterprises | | | | x | | | | F | | | | x | | | 62.4 | | | | | x | | | 33.7 | | | | - | | | | - | |
| Admin, waste and remediation services | | | 194.2 | | | | 200.8 | | | | 220.5 | | | | | F | | | 277.4 | | | | 261.3 | | | | - | | | | (5.8 | ) |
| Arts, entertainment and recreation | | | 275.6 | | | | 305.8 | | | | 338.7 | | | | 482.0 | | | | 387.5 | | | | | F | | | (19.6 | ) | | | - | |
| Accommodation and food services | | | 665.9 | | | | 581.3 | | | | 721.2 | | | | 751.7 | | | | 432.8 | | | | 256.7 | | | | (42.4 | ) | | | (40.7 | ) |
| Educational services | | | 980.1 | | | | 1,087.3 | | | | 1,499.2 | | | | 1,377.2 | | | | 1,723.4 | | | | 1,920.1 | | | | 25.1 | | | | 11.4 | |
| Health care and social assistance | | | 1,198.1 | | | | 1,050.7 | | | | 1,158.5 | | | | 1,067.2 | | | | 1,581.8 | | | | 1,840.5 | | | | 48.2 | | | | 16.4 | |
| Public administration | | | 2,172.2 | | | | 2,965.5 | | | | 3,407.2 | | | | 4,290.9 | | | | 4,766.9 | | | | 5,386.6 | | | | 11.1 | | | | 13.0 | |
| Other services | | | | x | | | 171.2 | | | | 249.4 | | | | 248.2 | | | | | x | | | | F | | | - | | | | - | |
| Total | | | 26,357.8 | | | | 28,999.9 | | | | 32,037.9 | | | | 41,257.4 | | | | 42,253.5 | | | | 44,643.9 | | | | 2.4 | | | | 5.7 | |
| | | | | | | | | | | | | | | | | | | | | | | | | | | | | | | | | |
| Public | | | 8,423.1 | | | | 9,173.3 | | | | 10,350.2 | | | | 13,086.5 | | | | 16,259.8 | | | | 18,345.0 | | | | 24.2 | | | | 12.8 | |
| Private | | | 17,934.7 | | | | 19,826.6 | | | | 21,687.8 | | | | 28,170.9 | | | | 25,993.6 | | | | 26,298.9 | | | | (7.7 | ) | | | 1.2 | |
| Total | | | 26,357.8 | | | | 28,999.9 | | | | 32,037.9 | | | | 41,257.4 | | | | 42,253.5 | | | | 44,643.9 | | | | 2.4 | | | | 5.7 | |
| | | | | | | | | | | | | | | | | | | | | | | | | | | | | | | | | |
| Machinery and equipment | | | 10,180.1 | | | | 10,183.1 | | | | 11,714.3 | | | | 13,277.0 | | | | 11,184.0 | | | | 11,274.4 | | | | (15.8 | ) | | | 0.8 | |
| Construction | | | 16,177.7 | | | | 18,816.8 | | | | 20,323.6 | | | | 27,980.4 | | | | 31,069.5 | | | | 33,369.5 | | | | 11.0 | | | | 7.4 | |
| Total | | | 26,357.8 | | | | 28,999.9 | | | | 32,037.9 | | | | 41,257.4 | | | | 42,253.5 | | | | 44,643.9 | | | | 2.4 | | | | 5.7 | |
| | | | | | | | | | | | | | | | | | | | | | | | | | | | | | | | | |
| Housing | | | 18,543.6 | | | | 19,605.2 | | | | 22,080.2 | | | | 22,232.7 | | | | 22,144.2 | | | | n/a | | | | (0.4 | ) | | | n/a | |
Source: Statistics Canada (Tables: 34-10-0035-01, 34-10-0038-01, 34-10-0175-01 – accessed May 2021).
| x | Suppressed to meet the confidentiality requirements of the Statistics Act. |
| F | Too unreliable to be published. |
Note: Totals may not add due to rounding or due to some data not being disclosed for confidentiality reasons.
| | 2021 FINANCIAL AND ECONOMIC REVIEW – JULY 2021 | 85 |
| | | |
APPENDIX 1 – ECONOMIC REVIEW SUPPLEMENTARY TABLES
Table A1.7 British Columbia International Goods Exports by Major Market and Selected Commodities, 2020
| | | | | | | | | European | | | Mainland | | | Other | | | Total - | |
| Commodity | | U.S. | | | Japan | | | Union 1 | | | China | | | Markets | | | All Countries | |
| | | | | | | | | ($ millions) | | | | | | | |
| Wood products | | | 5,797 | | | | 666 | | | | 167 | | | | 760 | | | | 689 | | | | 8,080 | |
| Lumber (softwood) | | | 3,960 | | | | 475 | | | | 77 | | | | 552 | | | | 369 | | | | 5,433 | |
| Cedar shakes and shingles | | | 167 | | | | 0 | | | | 6 | | | | 0 | | | | 12 | | | | 186 | |
| Plywood and veneer (softwood) | | | 375 | | | | 0 | | | | 1 | | | | 2 | | | | 9 | | | | 386 | |
| Other panel products | | | 470 | | | | 8 | | | | 0 | | | | 15 | | | | 12 | | | | 505 | |
| Selected value-added wood products | | | 675 | | | | 13 | | | | 2 | | | | 0 | | | | 7 | | | | 698 | |
| Logs | | | 27 | | | | 63 | | | | 0 | | | | 190 | | | | 38 | | | | 317 | |
| Other | | | 124 | | | | 106 | | | | 80 | | | | 1 | | | | 243 | | | | 554 | |
| | | | | | | | | | | | | | | | | | | | | | | | | |
| Pulp and paper products | | | 667 | | | | 164 | | | | 29 | | | | 2,017 | | | | 548 | | | | 3,425 | |
| Pulp | | | 340 | | | | 157 | | | | 27 | | | | 1,887 | | | | 424 | | | | 2,835 | |
| Newsprint | | | 16 | | | | 0 | | | | 0 | | | | 17 | | | | 34 | | | | 68 | |
| Paper, paperboard – excluding newsprint | | | 215 | | | | 8 | | | | 1 | | | | 95 | | | | 65 | | | | 383 | |
| Other | | | 96 | | | | 0 | | | | 0 | | | | 17 | | | | 26 | | | | 139 | |
| | | | | | | | | | | | | | | | | | | | | | | | | |
| Agriculture and food other than fish | | | 2,731 | | | | 116 | | | | 38 | | | | 154 | | | | 445 | | | | 3,483 | |
| Fruit and nuts | | | 352 | | | | 21 | | | | 3 | | | | 24 | | | | 43 | | | | 442 | |
| Vegetables | | | 469 | | | | 10 | | | | 3 | | | | 1 | | | | 1 | | | | 483 | |
| Vegetable oils | | | 4 | | | | 1 | | | | 0 | | | | 2 | | | | 0 | | | | 6 | |
| Bread, pastry, prepared cereals, pasta, etc. | | | 359 | | | | 3 | | | | 1 | | | | 0 | | | | 3 | | | | 367 | |
| Meat and prepared meat products | | | 26 | | | | 44 | | | | 0 | | | | 59 | | | | 58 | | | | 187 | |
| Other | | | 1,522 | | | | 37 | | | | 31 | | | | 69 | | | | 339 | | | | 1,997 | |
| | | | | | | | | | | | | | | | | | | | | | | | | |
| Fish products | | | 828 | | | | 70 | | | | 24 | | | | 234 | | | | 136 | | | | 1,292 | |
| Whole fish; fresh, chilled, frozen – excluding salmon | | | 47 | | | | 17 | | | | 13 | | | | 32 | | | | 73 | | | | 183 | |
| Whole salmon; fresh, chilled, frozen | | | 517 | | | | 22 | | | | 4 | | | | 7 | | | | 8 | | | | 558 | |
| Salmon; fillets, canned, smoked, etc | | | 103 | | | | 1 | | | | 2 | | | | 0 | | | | 6 | | | | 113 | |
| Other | | | 160 | | | | 30 | | | | 5 | | | | 194 | | | | 49 | | | | 438 | |
| | | | | | | | | | | | | | | | | | | | | | | | | |
| Metallic mineral products | | | 1,314 | | | | 1,085 | | | | 255 | | | | 1,245 | | | | 1,570 | | | | 5,469 | |
| Copper ores and concentrates | | | 0 | | | | 1,065 | | | | 0 | | | | 1,045 | | | | 1,331 | | | | 3,440 | |
| Molybdenum ores and concentrates | | | 27 | | | | 0 | | | | 28 | | | | 4 | | | | 0 | | | | 60 | |
| Zinc ores and concentrates | | | 0 | | | | 0 | | | | 18 | | | | 0 | | | | 69 | | | | 87 | |
| Unwrought aluminum | | | 405 | | | | 0 | | | | 204 | | | | 0 | | | | 6 | | | | 615 | |
| Unwrought zinc | | | 693 | | | | 0 | | | | 0 | | | | 5 | | | | 106 | | | | 805 | |
| Unwrought lead | | | 169 | | | | 0 | | | | 0 | | | | 0 | | | | 4 | | | | 173 | |
| Other | | | 19 | | | | 20 | | | | 4 | | | | 191 | | | | 54 | | | | 289 | |
| | | | | | | | | | | | | | | | | | | | | | | | | |
| Fabricated metal products | | | 961 | | | | 8 | | | | 20 | | | | 36 | | | | 178 | | | | 1,202 | |
| | | | | | | | | | | | | | | | | | | | | | | | | |
| Energy products | | | 4,465 | | | | 1,288 | | | | 284 | | | | 758 | | | | 2,020 | | | | 8,816 | |
| Natural gas | | | 2,555 | | | | 0 | | | | 0 | | | | 2 | | | | 0 | | | | 2,556 | |
| Coal | | | 39 | | | | 1,104 | | | | 284 | | | | 705 | | | | 1,974 | | | | 4,105 | |
| Electricity | | | 930 | | | | 0 | | | | 0 | | | | 0 | | | | 0 | | | | 930 | |
| Other | | | 942 | | | | 184 | | | | 0 | | | | 52 | | | | 46 | | | | 1,224 | |
| | | | | | | | | | | | | | | | | | | | | | | | | |
| Machinery and equipment | | | 3,251 | | | | 97 | | | | 369 | | | | 379 | | | | 972 | | | | 5,068 | |
| Motor vehicles and parts | | | 343 | | | | 7 | | | | 6 | | | | 151 | | | | 246 | | | | 752 | |
| Electrical/electronic/communications | | | 600 | | | | 26 | | | | 143 | | | | 73 | | | | 206 | | | | 1,048 | |
| Scientific/photographic/measuring equipment, etc. | | | 479 | | | | 34 | | | | 105 | | | | 97 | | | | 183 | | | | 898 | |
| Aircraft and parts | | | 194 | | | | 16 | | | | 2 | | | | 0 | | | | 70 | | | | 283 | |
| Other | | | 1,634 | | | | 15 | | | | 113 | | | | 58 | | | | 267 | | | | 2,086 | |
| | | | | | | | | | | | | | | | | | | | | | | | | |
| Plastics and articles of plastic | | | 503 | | | | 1 | | | | 10 | | | | 73 | | | | 72 | | | | 659 | |
| Chemicals and chemical products | | | 524 | | | | 53 | | | | 86 | | | | 75 | | | | 216 | | | | 954 | |
| Apparel and accessories | | | 45 | | | | 1 | | | | 6 | | | | 1 | | | | 4 | | | | 58 | |
| Textiles | | | 42 | | | | 1 | | | | 1 | | | | 1 | | | | 24 | | | | 70 | |
| | | | | | | | | | | | | | | | | | | | | | | | | |
| All other commodities | | | 938 | | | | 22 | | | | 25 | | | | 21 | | | | 345 | | | | 1,351 | |
| Total | | | 22,065 | | | | 3,573 | | | | 1,313 | | | | 5,756 | | | | 7,218 | | | | 39,925 | |
| 1 | The European Union is the membership as of February 1, 2020: Austria, Belgium, Bulgaria, Croatia, Cyprus, Czech Republic, Denmark, Estonia, Finland, France, Germany, Greece, Hungary, Ireland, Italy, Latvia, Lithuania, Luxembourg, Malta, Netherlands, Poland, Portugal, Romania, Slovakia, Slovenia, Spain, and Sweden. |
Source: Statistics Canada, International Trade Statistics custom extract, May 2021. Figures may not add due to rounding.
| 86 | 2021 FINANCIAL AND ECONOMIC REVIEW – JULY 2021 | |
| | | |
APPENDIX 1 – ECONOMIC REVIEW SUPPLEMENTARY TABLES
Table A1.8 British Columbia International Goods Exports by Market Area
| | | | | | | | | | | | % Change | | | Percent of Total | |
| | | 2018 | | | 2019 | | | 2020 | | | 2019-2020 | | | 2019 | | | 2020 | |
| | | | | | ($ millions) | | | | | | | | | (per cent) | | | | |
| United Kingdom | | | 501 | | | | 468 | | | | 471 | | | | 0.7 | | | | 1.1 | | | | 1.2 | |
| Germany | | | 339 | | | | 365 | | | | 244 | | | | (33.3 | ) | | | 0.8 | | | | 0.6 | |
| Mainland China | | | 6,723 | | | | 6,480 | | | | 5,756 | | | | (11.2 | ) | | | 14.9 | | | | 14.4 | |
| Hong Kong | | | 247 | | | | 190 | | | | 192 | | | | 1.2 | | | | 0.4 | | | | 0.5 | |
| Taiwan | | | 956 | | | | 826 | | | | 745 | | | | (9.7 | ) | | | 1.9 | | | | 1.9 | |
| Japan | | | 5,081 | | | | 4,533 | | | | 3,573 | | | | (21.2 | ) | | | 10.4 | | | | 8.9 | |
| South Korea | | | 2,941 | | | | 2,637 | | | | 2,123 | | | | (19.5 | ) | | | 6.1 | | | | 5.3 | |
| India | | | 1,583 | | | | 1,581 | | | | 951 | | | | (39.8 | ) | | | 3.6 | | | | 2.4 | |
| Australia | | | 252 | | | | 246 | | | | 250 | | | | 1.7 | | | | 0.6 | | | | 0.6 | |
| Mexico | | | 198 | | | | 180 | | | | 134 | | | | (25.3 | ) | | | 0.4 | | | | 0.3 | |
| United States | | | 22,666 | | | | 21,959 | | | | 22,065 | | | | 0.5 | | | | 50.6 | | | | 55.3 | |
| Other | | | 4,792 | | | | 3,968 | | | | 3,421 | | | | (13.8 | ) | | | 9.1 | | | | 8.6 | |
| Total | | | 46,280 | | | | 43,432 | | | | 39,925 | | | | (8.1 | ) | | | 100.0 | | | | 100.0 | |
| | | | | | | | | | | | | | | | | | | | | | | | | |
| Market Areas: | | | | | | | | | | | | | | | | | | | | | | | | |
| Western Europe 1 | | | 2,313 | | | | 2,098 | | | | 2,005 | | | | (4.4 | ) | | | 4.8 | | | | 5.0 | |
| Pacific Rim 2 | | | 17,824 | | | | 16,138 | | | | 13,705 | | | | (15.1 | ) | | | 37.2 | | | | 34.3 | |
| 1 | Austria, Belgium, Denmark, Finland, France, Germany, Greece, Iceland, Ireland, Italy, Luxembourg, Netherlands, Norway, Portugal, Spain, Sweden, Switzerland and the United Kingdom. |
| 2 | Australia, Brunei Darussalam, China, Fiji, Hong Kong, Indonesia, Japan, Laos, Macau, Malaysia, Mongolia, New Zealand, North Korea, Philippines, Singapore, South Korea, Taiwan, Thailand and Vietnam. |
Source: Statistics Canada, International Trade Statistics custom extract, May 2021. Figures may not add due to rounding.
| | 2021 FINANCIAL AND ECONOMIC REVIEW – JULY 2021 | 87 |
| | | |
APPENDIX 1 – ECONOMIC REVIEW SUPPLEMENTARY TABLES
Table A1.9 Historical Commodity Prices (in US Dollars)
| | | 2010 | | | 2011 | | | 2012 | | | 2013 | | | 2014 | | | 2015 | | | 2016 | | | 2017 | | | 2018 | | | 2019 | | | 2020 | |
| Metals | | | | | | | | | | | | | | | | | | | | | | | | | | | | | | | | | | | | | | | | | | | | |
| Copper (London; $/lb) | | | 3.42 | | | | 4.00 | | | | 3.61 | | | | 3.32 | | | | 3.11 | | | | 2.49 | | | | 2.21 | | | | 2.80 | | | | 2.96 | | | | 2.73 | | | | 2.80 | |
| Lead (London; $/lb) | | | 0.97 | | | | 1.09 | | | | 0.93 | | | | 0.97 | | | | 0.95 | | | | 0.81 | | | | 0.85 | | | | 1.05 | | | | 1.02 | | | | 0.91 | | | | 0.83 | |
| Zinc (London; $/lb) | | | 0.98 | | | | 0.99 | | | | 0.88 | | | | 0.86 | | | | 0.98 | | | | 0.87 | | | | 0.95 | | | | 1.31 | | | | 1.33 | | | | 1.16 | | | | 1.03 | |
| Gold (London; $/troy oz) | | | 1,225 | | | | 1,572 | | | | 1,667 | | | | 1,407 | | | | 1,266 | | | | 1,159 | | | | 1,251 | | | | 1,257 | | | | 1,269 | | | | 1,391 | | | | 1,769 | |
| Silver (London; $/troy oz) | | | 20.17 | | | | 35.12 | | | | 31.12 | | | | 23.72 | | | | 19.07 | | | | 15.68 | | | | 17.16 | | | | 17.05 | | | | 15.71 | | | | 16.19 | | | | 20.50 | |
| Molybdenum ($/lb) | | | 15.68 | | | | 15.47 | | | | 12.80 | | | | 10.33 | | | | 11.40 | | | | 6.74 | | | | 6.56 | | | | 7.21 | | | | 10.52 | | | | 11.34 | | | | 8.62 | |
| Aluminum (London; $/lb) | | | 0.99 | | | | 1.09 | | | | 0.92 | | | | 0.84 | | | | 0.85 | | | | 0.75 | | | | 0.73 | | | | 0.89 | | | | 0.96 | | | | 0.81 | | | | 0.77 | |
| Forest Products | | | | | | | | | | | | | | | | | | | | | | | | | | | | | | | | | | | | | | | | | | | | |
| Lumber (Madison's Lumber Reporter; WSPF, 2x4, $/1000 bd ft) | | | 255 | | | | 254 | | | | 299 | | | | 358 | | | | 353 | | | | 281 | | | | 308 | | | | 411 | | | | 496 | | | | 372 | | | | 570 | |
| Pulp (Northern Europe; $/tonne; transaction price) | | | 937 | | | | 955 | | | | 813 | | | | 864 | | | | 928 | | | | 849 | | | | 803 | | | | 898 | | | | 1,184 | | | | 955 | | | | 849 | |
| Newsprint (US Eastcoast; $/tonne) | | | 596 | | | | 637 | | | | 637 | | | | 593 | | | | 583 | | | | 517 | | | | 540 | | | | 557 | | | | 669 | | | | 667 | | | | 559 | |
| Cedar (Madison's Lumber Reporter 2x4, $/1000 bd ft) | | | 650 | | | | 636 | | | | 769 | | | | 895 | | | | 957 | | | | 986 | | | | 1,004 | | | | 1,299 | | | | 1,396 | | | | 1,386 | | | | 1,509 | |
| Other | | | | | | | | | | | | | | | | | | | | | | | | | | | | | | | | | | | | | | | | | | | | |
| Oil (West Texas Intermediate; $/barrel) | | | 79 | | | | 95 | | | | 94 | | | | 98 | | | | 93 | | | | 49 | | | | 43 | | | | 51 | | | | 65 | | | | 57 | | | | 39 | |
| Natural Gas (Plant Inlet; $C/GJ) | | | 2.95 | | | | 2.46 | | | | 1.35 | | | | 2.04 | | | | 3.12 | | | | 1.37 | | | | 0.99 | | | | 1.14 | | | | 0.79 | | | | 0.79 | | | | 0.96 | |
| Coal (Japan-Australia FOB $/t) Metallurgical | | | 204 | | | | 282 | | | | 204 | | | | 155 | | | | 124 | | | | 101 | | | | 112 | | | | 201 | | | | 207 | | | | 183 | | | | 136 | |
| Low Volatile PCl | | | 170 | | | | 222 | | | | 153 | | | | 125 | | | | 104 | | | | 84 | | | | 88 | | | | 142 | | | | 146 | | | | 131 | | | | 97 | |
| Thermal | | | 98 | | | | 130 | | | | 114 | | | | 95 | | | | 82 | | | | 68 | | | | 62 | | | | 85 | | | | 110 | | | | 99 | | | | 74 | |
Sources: Ministry of Finance; Ministry of Energy, Mines and Low Carbon Innovation; Ministry of Forests, Lands, Natural Resource Operations and Rural Development; US Department of Energy.
| 88 | 2021 FINANCIAL AND ECONOMIC REVIEW – JULY 2021 | |
| | | |
Appendix 1 – Economic Review Supplementary Tables
Table A1.10 British Columbia Forest Sector Economic Activity Indicators
| | | | | | | | | | | | | | | | | | | | | | | | | | | | | | | | | Change 1 | |
| Indicator | | 2011 | | | 2012 | | | 2013 | | | 2014 | | | 2015 | | | 2016 | | | 2017 | | | 2018 | | | 2019 | | | 2020 | | | 2019-2020 | |
| | | | | | | | | | | | | | | | | | | | | | | | | | | | | | | | | | |
| | | | | | | | | | | | | | | (million cubic meters) | | | | | | | | | | | | | | | (per cent) | |
| Wood production | | | | | | | | | | | | | | | | | | | | | | | | | | | | | | | | | | | | | | | | | | | | |
| Lumber | | | 28.4 | | | | 29.2 | | | | 30.0 | | | | 29.6 | | | | 30.6 | | | | 31.4 | | | | 30.3 | | | | 29.2 | | | | 22.8 | | | | 21.1 | | | | (7.8 | ) |
| Timber Scaled by species | | | | | | | | | | | | | | | | | | | | | | | | | | | | | | | | | | | | | | | | | | | | |
| Lodgepole pine | | | 29.8 | | | | 27.7 | | | | 26.7 | | | | 23.4 | | | | 24.1 | | | | 20.3 | | | | 15.9 | | | | 15.1 | | | | 11.1 | | | | 10.0 | | | | (9.4 | ) |
| Spruce | | | 10.5 | | | | 11.5 | | | | 12.6 | | | | 11.6 | | | | 13.3 | | | | 13.1 | | | | 15.8 | | | | 15.3 | | | | 12.3 | | | | 12.5 | | | | 1.1 | |
| Hemlock | | | 8.6 | | | | 7.7 | | | | 8.5 | | | | 8.1 | | | | 7.2 | | | | 7.6 | | | | 7.1 | | | | 8.1 | | | | 6.6 | | | | 6.1 | | | | (7.2 | ) |
| Douglas fir | | | 9.2 | | | | 8.9 | | | | 9.8 | | | | 10.1 | | | | 9.7 | | | | 10.7 | | | | 10.9 | | | | 13.3 | | | | 11.0 | | | | 9.9 | | | | (10.1 | ) |
| Balsam | | | 5.1 | | | | 5.5 | | | | 6.1 | | | | 6.1 | | | | 6.3 | | | | 6.8 | | | | 7.7 | | | | 8.7 | | | | 7.2 | | | | 7.4 | | | | 2.8 | |
| Cedar | | | 3.7 | | | | 4.3 | | | | 4.6 | | | | 4.4 | | | | 4.8 | | | | 4.9 | | | | 4.2 | | | | 4.4 | | | | 3.7 | | | | 3.7 | | | | 0.4 | |
| All others | | | 2.7 | | | | 2.6 | | | | 2.7 | | | | 2.7 | | | | 3.2 | | | | 2.8 | | | | 2.9 | | | | 3.0 | | | | 2.2 | | | | 2.0 | | | | (12.9 | ) |
| Total 2 | | | 69.6 | | | | 68.1 | | | | 71.1 | | | | 66.4 | | | | 68.7 | | | | 66.2 | | | | 64.5 | | | | 67.9 | | | | 54.3 | | | | 51.6 | | | | (5.0 | ) |
| | | | | | | | | | | | | | | | | | | | | | | | | | | | | | | | | | | | | | | | | | | | | |
| | | | | | | | | | | | | | | | | | | | (million tonnes) | | | | | | | | | | | | | | | | | | | | | |
| Pulp and paper production | | | 6.1 | | | | 5.9 | | | | 5.7 | | | | 5.7 | | | | 5.6 | | | | 5.4 | | | | 5.3 | | | | 5.1 | | | | 5.1 | | | | 4.5 | | | | (11.3 | ) |
| Market pulp | | | 4.5 | | | | 4.4 | | | | 4.3 | | | | 4.3 | | | | 4.3 | | | | 4.2 | | | | 4.2 | | | | 4.1 | | | | 4.1 | | | | 3.9 | | | | (4.2 | ) |
| Newsprint, paper and paperboard | | | 1.6 | | | | 1.4 | | | | 1.4 | | | | 1.4 | | | | 1.3 | | | | 1.1 | | | | 1.1 | | | | 1.0 | | | | 1.0 | | | | 0.6 | | | | (41.1 | ) |
| | | | | | | | | | | | | | | | | | | | | | | | | | | | | | | | | | | | | | | | | | | | | |
| Industrial product price indices | | | | | | | | | | | | | | | | | | | (Jan 2020=100) | | | | | | | | | | | | | | | | | | | | | |
| Softwood lumber (Canada) | | | 61.5 | | | | 68.0 | | | | 80.1 | | | | 85.2 | | | | 86.4 | | | | 90.3 | | | | 103.7 | | | | 114.2 | | | | 97.0 | | | | 134.4 | | | | 38.6 | |
| Spruce-Pine-Fir lumber (BC) | | | 64.3 | | | | 70.1 | | | | 82.3 | | | | 87.3 | | | | 88.1 | | | | 93.6 | | | | 104.0 | | | | 114.5 | | | | 99.4 | | | | 133.8 | | | | 34.7 | |
| Hemlock lumber (BC) | | | 49.9 | | | | 56.5 | | | | 70.6 | | | | 75.8 | | | | 75.5 | | | | 81.3 | | | | 102.0 | | | | 111.4 | | | | 92.6 | | | | 145.3 | | | | 56.9 | |
| Douglas fir and Western larch (BC) | | | 67.6 | | | | 70.2 | | | | 78.3 | | | | 85.0 | | | | 88.0 | | | | 92.0 | | | | 102.1 | | | | 109.4 | | | | 100.4 | | | | 129.9 | | | | 29.4 | |
| Veneer and plywood (Canada) | | | 79.6 | | | | 86.4 | | | | 87.1 | | | | 93.5 | | | | 95.6 | | | | 96.8 | | | | 106.5 | | | | 112.1 | | | | 104.8 | | | | 126.7 | | | | 20.8 | |
| Wood pulp (Canada) | | | 78.7 | | | | 77.9 | | | | 81.0 | | | | 80.5 | | | | 80.5 | | | | 79.7 | | | | 91.5 | | | | 112.2 | | | | 106.3 | | | | 101.1 | | | | (4.9 | ) |
| Newsprint for export (Canada) | | | 70.5 | | | | 70.9 | | | | 72.2 | | | | 74.1 | | | | 81.9 | | | | 88.3 | | | | 91.2 | | | | 111.1 | | | | 109.6 | | | | 98.6 | | | | (10.0 | ) |
| 1 | Percentage change based on unrounded numbers. |
| 2 | Totals may not add due to rounding. |
Sources: Wood Production: Lumber and Timber scaled by species – Ministry of Forests, Lands, Natural Resource Operations, and Rural Development.
Pulp and paper production – Pulp and Paper Products Council.
Industrial product price indices – Statistics Canada (Tables: 18-10-0026 with custom tabulations – accessed June 2021).
Timber scaled data includes all logs, special forest products, species and grades billed to crown, private and federal land. Waste, reject, and Christmas trees are excluded.
For all scale invoiced as of date of reporting – May 2021
| | 2021 Financial and Economic Review – July 2021 | 89 |
| | | |
Appendix 1 – Economic Review Supplementary Tables
Table A1.11 Historical Value of Mineral, Petroleum and Natural Gas Shipments
| | | | | | Industrial | | | Construction | | | | | | | | | Natural Gas | | | Other Oil | | | | |
| Year | | Metals | | | Minerals 1 | | | Aggregates 2 | | | Coal | | | Crude Oil 3 | | | to Pipeline | | | and Gas 4 | | | Total | |
| | | | | | | | | | | | | | | | | | | | | | | | | |
| | | ($ millions) | |
| 1991 | | | 1,511 | | | | 290 | | | | 159 | | | | 990 | | | | 260 | | | | 562 | | | | 36 | | | | 3,808 | |
| 1992 | | | 1,502 | | | | 212 | | | | 157 | | | | 706 | | | | 260 | | | | 592 | | | | 38 | | | | 3,467 | |
| 1993 | | | 1,198 | | | | 229 | | | | 166 | | | | 822 | | | | 233 | | | | 814 | | | | 42 | | | | 3,504 | |
| 1994 | | | 1,354 | | | | 237 | | | | 180 | | | | 861 | | | | 235 | | | | 991 | | | | 44 | | | | 3,902 | |
| 1995 | | | 2,016 | | | | 249 | | | | 204 | | | | 968 | | | | 272 | | | | 710 | | | | 58 | | | | 4,478 | |
| 1996 | | | 1,537 | | | | 251 | | | | 189 | | | | 1,027 | | | | 441 | | | | 817 | | | | 75 | | | | 4,337 | |
| 1997 | | | 1,495 | | | | 249 | | | | 195 | | | | 1,107 | | | | 403 | | | | 1,087 | | | | 98 | | | | 4,635 | |
| 1998 | | | 1,484 | | | | 245 | | | | 208 | | | | 956 | | | | 373 | | | | 1,154 | | | | 47 | | | | 4,467 | |
| 1999 | | | 1,183 | | | | 246 | | | | 219 | | | | 797 | | | | 461 | | | | 1,577 | | | | 53 | | | | 4,536 | |
| 2000 | | | 1,571 | | | | 284 | | | | 224 | | | | 812 | | | | 843 | | | | 3,826 | | | | 114 | | | | 7,674 | |
| 2001 | | | 1,394 | | | | 296 | | | | 217 | | | | 959 | | | | 729 | | | | 4,834 | | | | 103 | | | | 8,533 | |
| 2002 | | | 1,288 | | | | 310 | | | | 231 | | | | 1,035 | | | | 714 | | | | 3,458 | | | | 79 | | | | 7,115 | |
| 2003 | | | 1,353 | | | | 336 | | | | 226 | | | | 972 | | | | 718 | | | | 5,396 | | | | 116 | | | | 9,117 | |
| 2004 | | | 1,956 | | | | 355 | | | | 239 | | | | 1,191 | | | | 824 | | | | 5,827 | | | | 133 | | | | 10,524 | |
| 2005 | | | 2,442 | | | | 364 | | | | 278 | | | | 2,300 | | | | 973 | | | | 7,821 | | | | 173 | | | | 14,351 | |
| 2006 | | | 3,248 | | | | 363 | | | | 274 | | | | 2,105 | | | | 1,013 | | | | 5,956 | | | | 179 | | | | 13,139 | |
| 2007 | | | 2,887 | | | | 424 | | | | 351 | | | | 1,949 | | | | 989 | | | | 5,745 | | | | 200 | | | | 12,546 | |
| 2008 | | | 2,590 | | | | 696 | | | | 379 | | | | 3,738 | | | | 1,215 | | | | 7,525 | | | | 524 | | | | 16,667 | |
| 2009 | | | 1,837 | | | | 278 | | | | 303 | | | | 3,204 | | | | 720 | | | | 3,284 | | | | 115 | | | | 9,742 | |
| 2010 | | | 2,191 | | | | 349 | | | | 373 | | | | 4,253 | | | | 930 | | | | 3,437 | | | | 161 | | | | 11,694 | |
| 2011 | | | 2,131 | | | | 454 | | | | 325 | | | | 6,073 | | | | 1,194 | | | | 3,444 | | | | 307 | | | | 13,926 | |
| 2012 | | | 2,360 | | | | 461 | | | | 370 | | | | 4,635 | | | | 1,208 | | | | 1,934 | | | | 273 | | | | 11,241 | |
| 2013 | | | 2,578 | | | | 450 | | | | 388 | | | | 3,696 | | | | 1,295 | | | | 3,129 | | | | 251 | | | | 11,787 | |
| 2014 | | | 3,302 | | | | | x | | | 312 | | | | | x | | | 1,517 | | | | 5,170 | | | | 310 | | | | 13,812 | |
| 2015 | | | 3,250 | | | | | x | | | 338 | | | | | x | | | 952 | | | | 2,445 | | | | 139 | | | | 9,722 | |
| 2016 | | | 2,942 | | | | | x | | | 339 | | | | | x | | | 1,053 | | | | 1,919 | | | | 105 | | | | 9,781 | |
| 2017 | | | 3,351 | | | | | x | | | 464 | | | | | x | | | 1,520 | | | | 2,206 | | | | 237 | | | | 13,141 | |
| 2018 | | | 3,694 | | | | | x | | | 537 | | | | | x | | | 2,528 | | | | 1,742 | | | | 480 | | | | 14,534 | |
| 2019 | | | 3,416 | | | | | x | | | 543 | | | | | x | | | 2,447 | | | | 1,652 | | | | 169 | | | | 13,068 | |
| 2020 | | | - | | | | - | | | | - | | | | - | | | | 1,616 | | | | 2,198 | | | | 200 | | | | - | |
| 1 | Shipments of gypsum and silica to Canadian cement, lime and clay plants are not included in this table. |
| 2 | Sand and gravel; stone. |
| 3 | Includes pentanes and condensate. |
| 4 | Liquefied petroleum gases and sulphur. |
| x | Suppressed to meet the confidentiality requirements of the Statistics Act. |
Sources: Natural Resources Canada; Ministry of Energy, Mines and Low Carbon Innovation.
| 90 | 2021 Financial and Economic Review – July 2021 | |
| | | |
Appendix 1 – Economic Review Supplementary Tables
Table A1.12 Petroleum and Natural Gas Activity Indicators
| | | | | | | | | | | | | | | Provincial Reserves | | | Provincial
Government | |
| | | Natural gas | | | Crude oil and | | | | | | | | | Raw gas | | | Oil | | | petroleum | |
| | | production | | | wellhead condensate | | | | | | | | | (remaining | | | (remaining | | | and natural | |
| | | (wellhead) | | | production | | | Wells Authorized | | | Wells Drilled | | | reserves) | | | reserves) | | | gas revenue 1 | |
| | | (billion cubic m) | | | (million cubic m) | | | (number) | | | (number) | | | (billion cubic m) | | | (million cubic m) | | | ($ millions) | |
| 2004 | | | 32.0 | | | | 2.2 | | | | 1,700 | | | | 1,282 | | | | 389.7 | | | | 21.9 | | | | 1,794.4 | |
| 2005 | | | 32.8 | | | | 2.0 | | | | 1,790 | | | | 1,429 | | | | 444.6 | | | | 20.9 | | | | 2,559.0 | |
| 2006 | | | 32.8 | | | | 1.9 | | | | 1,730 | | | | 1,435 | | | | 462.4 | | | | 18.2 | | | | 2,139.1 | |
| 2007 | | | 31.9 | | | | 1.8 | | | | 1,207 | | | | 909 | | | | 482.9 | | | | 19.7 | | | | 2,352.8 | |
| 2008 | | | 33.5 | | | | 1.6 | | | | 1,408 | | | | 929 | | | | 605.3 | | | | 18.5 | | | | 4,093.9 | |
| 2009 | | | 32.9 | | | | 1.5 | | | | 829 | | | | 626 | | | | 657.9 | | | | 19.3 | | | | 1,464.2 | |
| 2010 | | | 35.0 | | | | 1.6 | | | | 871 | | | | 714 | | | | 932.0 | | | | 18.7 | | | | 1,384.0 | |
| 2011 | | | 41.4 | | | | 1.5 | | | | 1,133 | | | | 661 | | | | 974.9 | | | | 18.2 | | | | 735.0 | |
| 2012 | | | 41.0 | | | | 1.6 | | | | 647 | | | | 484 | | | | 1,138.5 | | | | 19.1 | | | | 440.0 | |
| 2013 | | | 44.6 | | | | 1.5 | | | | 907 | | | | 571 | | | | 1,197.2 | | | | 19.3 | | | | 723.0 | |
| 2014 | | | 47.2 | | | | 1.8 | | | | 1,253 | | | | 706 | | | | 1,443.9 | | | | 18.1 | | | | 1,230.5 | |
| 2015 | | | 49.0 | | | | 1.9 | | | | 913 | | | | 546 | | | | 1,504.7 | | | | 17.6 | | | | 345.5 | |
| 2016 | | | 50.7 | | | | 2.3 | | | | 479 | | | | 356 | | | | 1,485.1 | | | | 16.5 | | | | 282.3 | |
| 2017 | | | 51.5 | | | | 2.5 | | | | 870 | | | | 621 | | | | 1,354.8 | | | | 18.2 | | | | 486.3 | |
| 2018 | | | 58.9 | | | | 3.6 | | | | 897 | | | | 446 | | | | 1,434.1 | | | | 18.3 | | | | 423.1 | |
| 2019 | | | 58.8 | | | | 3.7 | | | | 673 | | | | 365 | | | | 1,818.7 | | | | 16.6 | | | | 331.6 | |
| 2020 | | | 61.6 | | | | 3.1 | | | | 519 | | | | 371 | | | | n/a | | | | n/a | | | | 271.5 | |
| per cent change | | | | | | | | | | | | | | | | | | | | | | | | | | | | |
| 2019-2020 | | | 4.7 | | | | (17.3 | ) | | | (22.9 | ) | | | 1.6 | | | | - | | | | - | | | | (18.1 | ) |
| 1 | Includes Crown royalties, Crown reserve disposition bonuses, fees and rentals. |
Sources: Ministry of Energy, Mines and Low Carbon Innovation and BC Oil and Gas Commission.
| | 2021 Financial and Economic Review – July 2021 | 91 |
| | | |
APPENDIX 1 – ECONOMIC REVIEW SUPPLEMENTARY TABLES
Table A1.13 Supply and Consumption of Electrical Energy in British Columbia
| | | | Supply | | | | | | | |
| | | | Net Generation | | | | | | | | | Consumption | | | | |
| | | | | | | All Other | | | | | | Receipts | | | | | | Delivered | | | | | | | | | | |
| | | | | | | Types Of | | | Total | | | From Other | | | | | | To Other | | | Total | | | | | | | |
| | | | | | | Electricity | | | Provincial | | | Provinces | | | Total | | | Provinces | | | Provincial | | | Total | | | | |
| Year | | | Hydro | | | Generation2 | | | Generation | | | and Imports | | | Supply | | | and Exports | | | Consumption | | | Demand | | | Net Exports | |
| | | | | | | | | | | | | | | | (gigawatt-hours)1 | | | | | | | | | | | | | |
| 1989 | | | | 51,082 | | | | 6,573 | | | | 57,655 | | | | 4,500 | | | | 62,155 | | | | 6,583 | | | | 55,572 | | | | 62,155 | | | | 2,083 | |
| 1990 | | | | 57,245 | | | | 3,417 | | | | 60,662 | | | | 3,233 | | | | 63,895 | | | | 6,689 | | | | 57,206 | | | | 63,895 | | | | 3,456 | |
| 1991 | | | | 60,149 | | | | 2,832 | | | | 62,981 | | | | 2,272 | | | | 65,253 | | | | 7,725 | | | | 57,528 | | | | 65,253 | | | | 5,454 | |
| 1992 | | | | 60,555 | | | | 3,503 | | | | 64,058 | | | | 2,685 | | | | 66,743 | | | | 9,473 | | | | 57,270 | | | | 66,743 | | | | 6,788 | |
| 1993 | | | | 53,057 | | | | 5,716 | | | | 58,774 | | | | 5,691 | | | | 64,465 | | | | 5,605 | | | | 58,860 | | | | 64,465 | | | | (86 | ) |
| 1994 | | | | 53,979 | | | | 7,036 | | | | 61,015 | | | | 7,836 | | | | 68,851 | | | | 9,541 | | | | 59,311 | | | | 68,851 | | | | 1,705 | |
| 1995 | | | | 49,814 | | | | 8,192 | | | | 58,006 | | | | 6,385 | | | | 64,391 | | | | 3,972 | | | | 60,419 | | | | 64,391 | | | | (2,413 | ) |
| 1996 | | | | 67,329 | | | | 4,436 | | | | 71,765 | | | | 3,289 | | | | 75,053 | | | | 10,390 | | | | 64,664 | | | | 75,053 | | | | 7,101 | |
| 1997 | | | | 61,772 | | | | 5,189 | | | | 66,961 | | | | 4,316 | | | | 71,278 | | | | 12,114 | | | | 59,163 | | | | 71,278 | | | | 7,798 | |
| 1998 | | | | 60,849 | | | | 6,861 | | | | 67,710 | | | | 5,056 | | | | 72,766 | | | | 10,619 | | | | 62,147 | | | | 72,766 | | | | 5,563 | |
| 1999 | | | | 61,588 | | | | 6,457 | | | | 68,045 | | | | 6,807 | | | | 74,852 | | | | 12,529 | | | | 62,323 | | | | 74,852 | | | | 5,722 | |
| 2000 | | | | 59,754 | | | | 8,487 | | | | 68,241 | | | | 6,039 | | | | 74,280 | | | | 10,698 | | | | 63,582 | | | | 74,280 | | | | 4,659 | |
| 2001 | | | | 48,338 | | | | 8,994 | | | | 57,332 | | | | 10,154 | | | | 67,486 | | | | 6,408 | | | | 61,079 | | | | 67,486 | | | | (3,747 | ) |
| 2002 | | | | 58,627 | | | | 6,318 | | | | 64,945 | | | | 5,769 | | | | 70,714 | | | | 8,078 | | | | 62,636 | | | | 70,714 | | | | 2,309 | |
| 2003 | | | | 56,689 | | | | 6,362 | | | | 63,051 | | | | 7,084 | | | | 70,135 | | | | 9,599 | | | | 60,535 | | | | 70,135 | | | | 2,515 | |
| 2004 | | | | 53,281 | | | | 7,214 | | | | 60,496 | | | | 8,261 | | | | 68,757 | | | | 6,791 | | | | 61,966 | | | | 68,757 | | | | (1,470 | ) |
| 2005* | | | | 60,327 | | | | 7,447 | | | | 67,774 | | | | 7,206 | | | | 74,980 | | | | 9,247 | | | | 65,732 | | | | 74,980 | | | | 2,042 | |
| 2006 | | | | 54,247 | | | | 7,350 | | | | 61,598 | | | | 12,687 | | | | 74,284 | | | | 6,133 | | | | 68,151 | | | | 74,284 | | | | (6,554 | ) |
| 2007 | | | | 64,287 | | | | 7,543 | | | | 71,830 | | | | 8,390 | | | | 80,220 | | | | 11,198 | | | | 69,022 | | | | 80,220 | | | | 2,808 | |
| 2008 | | | | 58,699 | | | | 7,373 | | | | 66,072 | | | | 12,431 | | | | 78,503 | | | | 9,956 | | | | 68,546 | | | | 78,503 | | | | (2,474 | ) |
| 2009 | | | | 56,462 | | | | 8,594 | | | | 65,057 | | | | 12,075 | | | | 77,132 | | | | 8,304 | | | | 68,827 | | | | 77,132 | | | | (3,771 | ) |
| 2010 | | | | 54,152 | | | | 10,072 | | | | 64,224 | | | | 10,767 | | | | 74,991 | | | | 7,566 | | | | 67,425 | | | | 74,991 | | | | (3,201 | ) |
| 2011 | | | | 61,037 | | | | 8,220 | | | | 69,257 | | | | 10,973 | | | | 80,230 | | | | 15,552 | | | | 64,679 | | | | 80,230 | | | | 4,579 | |
| 2012 | | | | 65,141 | | | | 8,444 | | | | 73,584 | | | | 9,738 | | | | 83,323 | | | | 16,929 | | | | 66,394 | | | | 83,323 | | | | 7,191 | |
| 2013 | | | | 59,223 | | | | 8,628 | | | | 67,851 | | | | 10,466 | | | | 78,317 | | | | 13,576 | | | | 64,741 | | | | 78,317 | | | | 3,110 | |
| 2014 | | | | 57,573 | | | | 9,435 | | | | 67,008 | | | | 10,941 | | | | 77,949 | | | | 13,734 | | | | 64,215 | | | | 77,949 | | | | 2,793 | |
| 2015 | | | | 64,999 | | | | 6,772 | | | | 71,771 | | | | 9,591 | | | | 81,361 | | | | 14,123 | | | | 67,238 | | | | 81,361 | | | | 4,533 | |
| 2016 | | | | 61,840 | | | | 7,863 | | | | 69,703 | | | | 8,758 | | | | 78,461 | | | | 14,476 | | | | 63,986 | | | | 78,461 | | | | 5,718 | |
| 2017 | | | | 66,503 | | | | 7,972 | | | | 74,476 | | | | 8,943 | | | | 83,419 | | | | 15,139 | | | | 68,281 | | | | 83,419 | | | | 6,195 | |
| 2018 | | | | 61,791 | | | | 8,133 | | | | 69,924 | | | | 10,531 | | | | 80,455 | | | | 10,703 | | | | 69,752 | | | | 80,455 | | | | 172 | |
| 2019 | | | | 56,108 | | | | 8,905 | | | | 65,013 | | | | 12,086 | | | | 77,099 | | | | 9,434 | | | | 67,665 | | | | 77,099 | | | | (2,652 | ) |
| 2020 | | | | n/a | | | | n/a | | | | n/a | | | | n/a | | | | n/a | | | | n/a | | | | n/a | | | | n/a | | | | n/a | |
| 1 | Gigawatt-hour = one million kilowatt-hours |
| 2 | All other types of electricity generation includes steam, nuclear, combustion turbine, tidal, wind and solar. |
| * | Note: Starting from 2005, annual survey values (25-10-0020-01 and 25-10-0021-01) are used since more extensive information is available from companies' annual performance reviews. |
Source: Statistics Canada (Tables: 25-10-0001-01, 25-10-0015-01, 25-10-0016-01, 25-10-0020-01 and 25-10-0021-01 – accessed May 2021) and BC Stats.
| 92 | 2021 FINANCIAL AND ECONOMIC REVIEW – JULY 2021 | |
| | | |
APPENDIX 1 – ECONOMIC REVIEW SUPPLEMENTARY TABLES
Table A1.14 Components of British Columbia Population Change
| | | | Net Migration | | | Natural Increase | | | Total | | | Total | |
| | | | Inter- | | | Inter- | | | | | | | | | | | | | | | Population | | | Population | |
| Year | | | provincial | | | national | | | Total | | | Births | | | Deaths | | | Total | | | Increase 1 | | | at July 1 | |
| 1975 | | | | (2,864 | ) | | | 25,342 | | | | 22,478 | | | | 36,281 | | | | 19,151 | | | | 17,130 | | | | 39,608 | | | | 2,499,564 | |
| 1976 | | | | (464 | ) | | | 16,288 | | | | 15,824 | | | | 35,848 | | | | 18,788 | | | | 17,060 | | | | 32,884 | | | | 2,533,899 | |
| 1977 | | | | 12,452 | | | | 11,224 | | | | 23,676 | | | | 36,691 | | | | 18,596 | | | | 18,095 | | | | 41,771 | | | | 2,570,315 | |
| 1978 | | | | 20,106 | | | | 7,699 | | | | 27,805 | | | | 37,231 | | | | 19,058 | | | | 18,173 | | | | 45,978 | | | | 2,615,162 | |
| 1979 | | | | 32,541 | | | | 14,012 | | | | 46,553 | | | | 38,432 | | | | 19,204 | | | | 19,228 | | | | 65,781 | | | | 2,665,238 | |
| 1980 | | | | 38,773 | | | | 23,522 | | | | 62,295 | | | | 40,104 | | | | 19,371 | | | | 20,733 | | | | 83,028 | | | | 2,745,861 | |
| 1981 | | | | 23,270 | | | | 22,143 | | | | 45,413 | | | | 41,474 | | | | 19,857 | | | | 21,617 | | | | 67,030 | | | | 2,826,558 | |
| 1982 | | | | (1,129 | ) | | | 14,175 | | | | 13,046 | | | | 42,747 | | | | 20,707 | | | | 22,040 | | | | 35,086 | | | | 2,876,513 | |
| 1983 | | | | 3,000 | | | | 10,639 | | | | 13,639 | | | | 42,919 | | | | 19,827 | | | | 23,092 | | | | 36,731 | | | | 2,907,502 | |
| 1984 | | | | 3,867 | | | | 8,674 | | | | 12,541 | | | | 43,911 | | | | 20,686 | | | | 23,225 | | | | 35,766 | | | | 2,947,181 | |
| 1985 | | | | (3,430 | ) | | | 9,374 | | | | 5,944 | | | | 43,127 | | | | 21,302 | | | | 21,825 | | | | 27,769 | | | | 2,975,131 | |
| 1986 | | | | (772 | ) | | | 12,290 | | | | 11,518 | | | | 41,967 | | | | 21,213 | | | | 20,754 | | | | 32,272 | | | | 3,003,621 | |
| 1987 | | | | 16,588 | | | | 21,078 | | | | 37,666 | | | | 41,814 | | | | 21,814 | | | | 20,000 | | | | 57,666 | | | | 3,048,651 | |
| 1988 | | | | 25,829 | | | | 28,704 | | | | 54,533 | | | | 42,930 | | | | 22,546 | | | | 20,384 | | | | 74,917 | | | | 3,114,761 | |
| 1989 | | | | 35,711 | | | | 31,042 | | | | 66,753 | | | | 43,769 | | | | 22,997 | | | | 20,772 | | | | 87,525 | | | | 3,196,725 | |
| 1990 | | | | 40,088 | | | | 28,585 | | | | 68,673 | | | | 45,617 | | | | 23,577 | | | | 22,040 | | | | 90,713 | | | | 3,292,111 | |
| 1991 | | | | 34,600 | | | | 21,274 | | | | 55,874 | | | | 45,612 | | | | 23,977 | | | | 21,635 | | | | 77,509 | | | | 3,373,787 | |
| 1992 | | | | 39,578 | | | | 29,477 | | | | 69,055 | | | | 46,156 | | | | 24,615 | | | | 21,541 | | | | 90,596 | | | | 3,468,802 | |
| 1993 | | | | 37,595 | | | | 34,679 | | | | 72,274 | | | | 46,026 | | | | 25,764 | | | | 20,262 | | | | 92,536 | | | | 3,567,772 | |
| 1994 | | | | 34,449 | | | | 42,667 | | | | 77,116 | | | | 46,998 | | | | 25,939 | | | | 21,059 | | | | 98,175 | | | | 3,676,075 | |
| 1995 | | | | 23,414 | | | | 43,644 | | | | 67,058 | | | | 46,820 | | | | 26,375 | | | | 20,445 | | | | 87,503 | | | | 3,777,390 | |
| 1996 | | | | 17,798 | | | | 47,617 | | | | 65,415 | | | | 46,138 | | | | 27,538 | | | | 18,600 | | | | 84,015 | | | | 3,874,317 | |
| 1997 | | | | 1,980 | | | | 38,318 | | | | 40,298 | | | | 44,577 | | | | 27,412 | | | | 17,165 | | | | 57,463 | | | | 3,948,583 | |
| 1998 | | | | (17,521 | ) | | | 24,380 | | | | 6,859 | | | | 43,072 | | | | 27,978 | | | | 15,094 | | | | 21,953 | | | | 3,983,113 | |
| 1999 | | | | (12,413 | ) | | | 28,644 | | | | 16,231 | | | | 41,939 | | | | 28,017 | | | | 13,922 | | | | 30,153 | | | | 4,011,375 | |
| 2000 | | | | (14,783 | ) | | | 29,266 | | | | 14,483 | | | | 40,672 | | | | 27,461 | | | | 13,211 | | | | 27,694 | | | | 4,039,230 | |
| 2001 | | | | (7,028 | ) | | | 34,217 | | | | 27,189 | | | | 40,575 | | | | 28,362 | | | | 12,213 | | | | 39,402 | | | | 4,076,950 | |
| 2002 | | | | (4,445 | ) | | | 28,575 | | | | 24,130 | | | | 40,065 | | | | 28,884 | | | | 11,181 | | | | 35,311 | | | | 4,100,564 | |
| 2003 | | | | 3,025 | | | | 27,762 | | | | 30,787 | | | | 40,497 | | | | 29,320 | | | | 11,177 | | | | 41,964 | | | | 4,124,482 | |
| 2004 | | | | 7,785 | | | | 28,015 | | | | 35,800 | | | | 40,490 | | | | 29,924 | | | | 10,566 | | | | 46,366 | | | | 4,155,651 | |
| 2005 | | | | 7,212 | | | | 38,399 | | | | 45,611 | | | | 40,827 | | | | 30,235 | | | | 10,592 | | | | 56,203 | | | | 4,196,062 | |
| 2006 | | | | 12,799 | | | | 34,670 | | | | 47,469 | | | | 41,729 | | | | 30,688 | | | | 11,041 | | | | 58,510 | | | | 4,241,794 | |
| 2007 | | | | 16,776 | | | | 35,714 | | | | 52,490 | | | | 43,649 | | | | 31,308 | | | | 12,341 | | | | 64,831 | | | | 4,290,984 | |
| 2008 | | | | 10,849 | | | | 49,678 | | | | 60,527 | | | | 44,276 | | | | 32,097 | | | | 12,179 | | | | 72,706 | | | | 4,349,336 | |
| 2009 | | | | 9,672 | | | | 46,775 | | | | 56,447 | | | | 44,993 | | | | 31,440 | | | | 13,553 | | | | 70,000 | | | | 4,410,506 | |
| 2010 | | | | 6,212 | | | | 32,717 | | | | 38,929 | | | | 43,826 | | | | 31,324 | | | | 12,502 | | | | 51,431 | | | | 4,465,546 | |
| 2011 | | | | 711 | | | | 31,692 | | | | 32,403 | | | | 44,129 | | | | 31,966 | | | | 12,163 | | | | 44,566 | | | | 4,502,104 | |
| 2012 | | | | (4,322 | ) | | | 34,895 | | | | 30,573 | | | | 44,008 | | | | 32,524 | | | | 11,484 | | | | 42,057 | | | | 4,566,769 | |
| 2013 | | | | 2,514 | | | | 35,381 | | | | 37,895 | | | | 43,779 | | | | 33,200 | | | | 10,579 | | | | 48,474 | | | | 4,630,077 | |
| 2014 | | | | 15,859 | | | | 32,178 | | | | 48,037 | | | | 44,376 | | | | 33,791 | | | | 10,585 | | | | 58,622 | | | | 4,707,103 | |
| 2015 | | | | 22,827 | | | | 14,059 | | | | 36,886 | | | | 44,298 | | | | 35,246 | | | | 9,052 | | | | 45,938 | | | | 4,776,388 | |
| 2016 | | | | 23,586 | | | | 40,012 | | | | 63,598 | | | | 45,268 | | | | 36,627 | | | | 8,641 | | | | 72,239 | | | | 4,859,250 | |
| 2017 | | | | 15,293 | | | | 55,118 | | | | 70,411 | | | | 44,648 | | | | 38,486 | | | | 6,162 | | | | 76,573 | | | | 4,929,384 | |
| 2018 | | | | 12,723 | | | | 61,311 | | | | 74,034 | | | | 43,592 | | | | 38,471 | | | | 5,121 | | | | 79,155 | | | | 5,010,476 | |
| 2019 | | | | 13,926 | | | | 65,961 | | | | 79,887 | | | | 43,490 | | | | 38,378 | | | | 5,112 | | | | 84,999 | | | | 5,090,955 | |
| 2020 | | | | 20,994 | | | | (599 | ) | | | 20,395 | | | | 42,056 | | | | 40,987 | | | | 1,069 | | | | 21,464 | | | | 5,147,712 | |
| 1 | Components may not add to totals due to the revision of population statistics based on information collected during subsequent census years. The revisions are not distributed back to relevant components due to insufficient data. |
Sources: Statistics Canada (Tables: 17-10-0020-01, 17-10-0040-01 and 17-10-0059-01 – accessed May 2021) and BC Stats.
| | 2021 FINANCIAL AND ECONOMIC REVIEW – JULY 2021 | 93 |
| | | |
| Appendix 2 Financial Review Supplementary Tables | |
| 2021 Financial and Economic Review – July 2021 | |
| | | |
Appendix 2 – Financial Review Supplementary Tables
Table A2.1 Operating Statement – 2009/10 to 2020/21 1
| | | | | | | | | | | | | | | | | | | | | | | | | | | | | | | | | | | | | | | Average | |
| | | Actual | | | Actual | | | Actual | | | Actual | | | Actual | | | Actual | | | Actual | | | Actual | | | Actual | | | Actual | | | Actual | | | Actual | | | annual | |
| ($ millions) | | 2009/10 | | | 2010/11 | | | 2011/12 | | | 2012/13 | | | 2013/14 | | | 2014/15 | | | 2015/16 | | | 2016/17 | | | 2017/18 | | | 2018/19 | | | 2019/20 | | | 2020/21 | | | change | |
| | | | | | | | | | | | | | | | | | | | | | | | | | | | | | | | | | | | | | | (per cent) | |
| Revenue | | | 37,978 | | | | 40,680 | | | | 41,805 | | | | 42,057 | | | | 43,715 | | | | 46,099 | | | | 47,601 | | | | 51,449 | | | | 52,020 | | | | 57,128 | | | | 58,660 | | | | 62,156 | | | 3.8 | |
| Expense | | | (39,791 | ) | | | (40,927 | ) | | | (43,647 | ) | | | (43,205 | ) | | | (43,402 | ) | | | (44,440 | ) | | | (46,832 | ) | | | (48,684 | ) | | | (51,707 | ) | | | (55,597 | ) | | | (58,982 | ) | | | (67,624 | ) | | 3.9 | |
| Surplus (deficit) | | | (1,813 | ) | | | (247 | ) | | | (1,842 | ) | | | (1,148 | ) | | | 313 | | | | 1,659 | | | | 769 | | | | 2,765 | | | | 313 | | | | 1,531 | | | | (322 | ) | | | (5,468 | ) | | | |
| Accumulated surplus (deficit) beginning of year, excluding other comprehensive income . | | | 5,949 | | | | 4,136 | | | | 3,889 | | | | 2,047 | | | | 899 | | | | 1,212 | | | | 2,871 | | | | 3,640 | | | | 6,405 | | | | 6,718 | | | | 8,249 | | | | 7,927 | | | | |
| Accumulated surplus (deficit) end of year, before other comprehensive income | | | 4,136 | | | | 3,889 | | | | 2,047 | | | | 899 | | | | 1,212 | | | | 2,871 | | | | 3,640 | | | | 6,405 | | | | 6,718 | | | | 8,249 | | | | 7,927 | | | | 2,459 | | | | |
| Accumulated other comprehensive income of commercial Crown corporations | | | 456 | | | | 360 | | | | 73 | | | | 154 | | | | 481 | | | | 206 | | | | (441 | ) | | | (205 | ) | | | (169 | ) | | | 97 | | | | (158 | ) | | | 748 | | | | |
| Accumulated surplus (deficit), end of year | | | 4,592 | | | | 4,249 | | | | 2,120 | | | | 1,053 | | | | 1,693 | | | | 3,077 | | | | 3,199 | | | | 6,200 | | | | 6,549 | | | | 8,346 | | | | 7,769 | | | | 3,207 | | | | |
| | | | | | | | | | | | | | | | | | | | | | | | | | | | | | | | | | | | | | | | | | | | | | | | | | | | |
| Per cent of Nominal GDP: 2 | | | | | | | | | | | | | | | | | | | | | | | | | | | | | | | | | | | | | | | | | | | | | | | | | | | |
| Surplus (deficit) | | | -0.9 | | | | -0.1 | | | | -0.8 | | | | -0.5 | | | | 0.1 | | | | 0.7 | | | | 0.3 | | | | 1.0 | | | | 0.1 | | | | 0.5 | | | | -0.1 | | | | -1.9 | | | | |
| Per cent of revenue: | | | | | | | | | | | | | | | | | | | | | | | | | | | | | | | | | | | | | | | | | | | | | | | | | | | |
| Surplus (deficit) | | | -4.8 | | | | -0.6 | | | | -4.4 | | | | -2.7 | | | | 0.7 | | | | 3.6 | | | | 1.6 | | | | 5.4 | | | | 0.6 | | | | 2.7 | | | | -0.5 | | | | -8.8 | | | | |
| Per capita ($): 3 | | | | | | | | | | | | | | | | | | | | | | | | | | | | | | | | | | | | | | | | | | | | | | | | | | | |
| Surplus (deficit) | | | (411 | ) | | | (55 | ) | | | (409 | ) | | | (251 | ) | | | 68 | | | | 352 | | | | 161 | | | | 569 | | | | 63 | | | | 306 | | | | (63 | ) | | | (1,062 | ) | | | |
| | | | | | | | | | | | | | | | | | | | | | | | | | | | | | | | | | | | | | | | | | | | | | | | | | | | |
| 1 | Figures have been restated to reflect government accounting policies in effect at March 31, 2021. |
| 2 | Revenue and expense as a per cent of GDP is calculated using GDP for the calendar year ending in the fiscal year (e.g. 2020/21 amounts divided by GDP for the 2020 calendar year). As nominal GDP for the calendar year ending 2020 is not yet available, the 2020 GDP projected in the April 2021 budget has been used for the fiscal year ended March 31, 2021 for demonstration purposes. |
| 3 | Per capita revenue and expense is calculated using July 1 population (e.g. 2020/21 amounts divided by population on July 1, 2020). |
| | 2021 Financial and Economic Review – July 2021 | 97 |
| | | |
Appendix 2 – Financial Review Supplementary Tables
Table A2.2 Statement of Financial Position - 2009/10 to 2020/21 1
| | | | | | | | | | | | | | | | | | | | | | | | | | | | | | | | | | | | | | | Average | |
| | | Actual | | | Actual | | | Actual | | | Actual | | | Actual | | | Actual | | | Actual | | | Actual | | | Actual | | | Actual | | | Actual | | | Actual | | | annual | |
| ($ millions) | | 2009/10 | | | 2010/11 | | | 2011/12 | | | 2012/13 | | | 2013/14 | | | 2014/15 | | | 2015/16 | | | 2016/17 | | | 2017/18 | | | 2018/19 | | | 2019/20 | | | 2020/21 | | | change | |
| | | | | | | | | | | | | | | | | | | | | | | | | | | | | | | | | | | | | | | (per cent) | |
| Financial assets: | | | | | | | | | | | | | | | | | | | | | | | | | | | | | | | | | | | | | | | |
| Cash and temporary investments | | | 2,911 | | | | 3,060 | | | | 3,235 | | | | 3,173 | | | | 2,801 | | | | 3,675 | | | | 3,892 | | | | 4,232 | | | | 3,440 | | | | 3,029 | | | | 3,985 | | | | 6,560 | | | 7.7 | |
| Other financial assets | | | 7,226 | | | | 8,045 | | | | 7,993 | | | | 8,241 | | | | 9,389 | | | | 9,170 | | | | 9,691 | | | | 10,198 | | | | 11,729 | | | | 12,625 | | | | 12,394 | | | | 15,399 | | | 7.1 | |
| Sinking funds | | | 1,329 | | | | 1,410 | | | | 1,491 | | | | 1,778 | | | | 835 | | | | 977 | | | | 1,580 | | | | 1,087 | | | | 1,348 | | | | 752 | | | | 692 | | | | 492 | | | -8.6 | |
| Investments in commercial Crown corporations: | | | | | | | | | | | | | | | | | | | | | | | | | | | | | | | | | | | | | | | | | | | | | | | | | | | |
| Retained earnings | | | 7,473 | | | | 7,107 | | | | 7,013 | | | | 7,556 | | | | 7,854 | | | | 8,269 | | | | 7,529 | | | | 7,509 | | | | 6,126 | | | | 5,732 | | | | 6,515 | | | | 9,623 | | | 2.3 | |
| Recoverable capital loans | | | 11,596 | | | | 13,142 | | | | 15,167 | | | | 17,208 | | | | 19,255 | | | | 20,624 | | | | 22,041 | | | | 23,809 | | | | 20,534 | | | | 22,547 | | | | 24,768 | | | | 26,301 | | | 7.7 | |
| | | | 19,069 | | | | 20,249 | | | | 22,180 | | | | 24,764 | | | | 27,109 | | | | 28,893 | | | | 29,570 | | | | 31,318 | | | | 26,660 | | | | 28,279 | | | | 31,283 | | | | 35,924 | | | 5.9 | |
| Total financial assets | | | 30,535 | | | | 32,764 | | | | 34,899 | | | | 37,956 | | | | 40,134 | | | | 42,715 | | | | 44,733 | | | | 46,835 | | | | 43,177 | | | | 44,685 | | | | 48,354 | | | | 58,375 | | | 6.1 | |
| Liabilities: | | | | | | | | | | | | | | | | | | | | | | | | | | | | | | | | | | | | | | | | | | | | | | | | | | | |
| Accounts payable & accrued liabilities | | | 7,412 | | | | 8,046 | | | | 9,247 | | | | 9,278 | | | | 8,428 | | | | 8,443 | | | | 8,618 | | | | 9,031 | | | | 9,751 | | | | 10,573 | | | | 11,497 | | | | 13,092 | | | 5.3 | |
| Deferred revenue | | | 10,080 | | | | 10,827 | | | | 10,527 | | | | 9,942 | | | | 9,775 | | | | 9,885 | | | | 9,857 | | | | 9,639 | | | | 10,042 | | | | 10,517 | | | | 10,626 | | | | 12,185 | | | 1.7 | |
| Debt: | | | | | | | | | | | | | | | | | | | | | | | | | | | | | | | | | | | | | | | | | | | | | | | | | | | |
| Taxpayer-supported debt | | | 29,968 | | | | 31,821 | | | | 34,659 | | | | 38,182 | | | | 41,068 | | | | 41,880 | | | | 42,719 | | | | 41,499 | | | | 43,607 | | | | 42,681 | | | | 46,229 | | | | 59,750 | | | 6.5 | |
| Self-supported debt | | | 11,917 | | | | 13,333 | | | | 15,534 | | | | 17,634 | | | | 19,625 | | | | 21,040 | | | | 22,532 | | | | 24,338 | | | | 21,312 | | | | 23,281 | | | | 25,932 | | | | 27,350 | | | 7.8 | |
| Total provincial debt | | | 41,885 | | | | 45,154 | | | | 50,193 | | | | 55,816 | | | | 60,693 | | | | 62,920 | | | | 65,251 | | | | 65,837 | | | | 64,919 | | | | 65,962 | | | | 72,161 | | | | 87,100 | | | 6.9 | |
| Add: debt offset by sinking funds | | | 1,329 | | | | 1,410 | | | | 1,491 | | | | 1,778 | | | | 835 | | | | 977 | | | | 1,580 | | | | 1,087 | | | | 1,348 | | | | 752 | | | | 692 | | | | 492 | | | -8.6 | |
| Less: guarantees and non-guaranteed debt | | | (546 | ) | | | (455 | ) | | | (730 | ) | | | (755 | ) | | | (726 | ) | | | (739 | ) | | | (820 | ) | | | (835 | ) | | | (896 | ) | | | (850 | ) | | | (1,337 | ) | | | (1,335 | ) | | 8.5 | |
| Financial statement debt | | | 42,668 | | | | 46,109 | | | | 50,954 | | | | 56,839 | | | | 60,802 | | | | 63,158 | | | | 66,011 | | | | 66,089 | | | | 65,371 | | | | 65,864 | | | | 71,516 | | | | 86,257 | | | 6.6 | |
| Total liabilities | | | 60,160 | | | | 64,982 | | | | 70,728 | | | | 76,059 | | | | 79,005 | | | | 81,486 | | | | 84,486 | | | | 84,759 | | | | 85,164 | | | | 86,954 | | | | 93,639 | | | | 111,534 | | | 5.8 | |
| Net liabilities | | | (29,625 | ) | | | (32,218 | ) | | | (35,829 | ) | | | (38,103 | ) | | | (38,871 | ) | | | (38,771 | ) | | | (39,753 | ) | | | (37,924 | ) | | | (41,987 | ) | | | (42,269 | ) | | | (45,285 | ) | | | (53,159 | ) | | 5.5 | |
| Capital and other assets: | | | | | | | | | | | | | | | | | | | | | | | | | | | | | | | | | | | | | | | | | | | | | | | | | | | |
| Tangible capital assets | | | 32,219 | | | | 34,278 | | | | 35,692 | | | | 36,762 | | | | 37,778 | | | | 39,028 | | | | 40,282 | | | | 41,303 | | | | 45,836 | | | | 47,829 | | | | 50,023 | | | | 52,781 | | | 4.6 | |
| Restricted assets | | | 1,241 | | | | 1,312 | | | | 1,377 | | | | 1,442 | | | | 1,493 | | | | 1,553 | | | | 1,631 | | | | 1,695 | | | | 1,768 | | | | 1,834 | | | | 1,931 | | | | 2,003 | | | 4.4 | |
| Other assets | | | 757 | | | | 877 | | | | 880 | | | | 952 | | | | 1,293 | | | | 1,267 | | | | 1,039 | | | | 1,126 | | | | 932 | | | | 952 | | | | 1,100 | | | | 1,582 | | | 6.9 | |
| Total capital and other assets | | | 34,217 | | | | 36,467 | | | | 37,949 | | | | 39,156 | | | | 40,564 | | | | 41,848 | | | | 42,952 | | | | 44,124 | | | | 48,536 | | | | 50,615 | | | | 53,054 | | | | 56,366 | | | 4.6 | |
| Accumulated surplus (deficit) | | | 4,592 | | | | 4,249 | | | | 2,120 | | | | 1,053 | | | | 1,693 | | | | 3,077 | | | | 3,199 | | | | 6,200 | | | | 6,549 | | | | 8,346 | | | | 7,769 | | | | 3,207 | | | -3.2 | |
| Per cent of Nominal GDP: 2 | | | | | | | | | | | | | | | | | | | | | | | | | | | | | | | | | | | | | | | | | | | | | | | | | | | |
| Net liabilities | | | 14.9 | | | | 15.6 | | | | 16.4 | | | | 17.1 | | | | 16.8 | | | | 15.9 | | | | 15.9 | | | | 14.4 | | | | 14.9 | | | | 14.3 | | | | 14.7 | | | | 18.0 | | | 1.7 | |
| Capital and other assets | | | 17.3 | | | | 17.6 | | | | 17.3 | | | | 17.5 | | | | 17.6 | | | | 17.2 | | | | 17.1 | | | | 16.7 | | | | 17.2 | | | | 17.1 | | | | 17.2 | | | | 19.1 | | | 0.9 | |
| Growth rates: | | | | | | | | | | | | | | | | | | | | | | | | | | | | | | | | | | | | | | | | | | | | | | | | | | | |
| Net liabilities | | | 12.2 | | | | 8.8 | | | | 11.2 | | | | 6.3 | | | | 2.0 | | | | -0.3 | | | | 2.5 | | | | -4.6 | | | | 10.7 | | | | 0.7 | | | | 7.1 | | | | 17.4 | | | n/a | |
| Capital and other assets | | | 5.8 | | | | 6.6 | | | | 4.1 | | | | 3.2 | | | | 3.6 | | | | 3.2 | | | | 2.6 | | | | 2.7 | | | | 10.0 | | | | 4.3 | | | | 4.8 | | | | 6.2 | | | n/a | |
| Per capita: 3 | | | | | | | | | | | | | | | | | | | | | | | | | | | | | | | | | | | | | | | | | | | | | | | | | | | |
| Net liabilities | | | 6,717 | | | | 7,215 | | | | 7,958 | | | | 8,344 | | | | 8,395 | | | | 8,237 | | | | 8,323 | | | | 7,804 | | | | 8,518 | | | | 8,436 | | | | 8,895 | | | | 10,327 | | | 4.0 | |
| Capital and other assets | | | 7,758 | | | | 8,166 | | | | 8,429 | | | | 8,574 | | | | 8,761 | | | | 8,890 | | | | 8,993 | | | | 9,080 | | | | 9,846 | | | | 10,102 | | | | 10,421 | | | | 10,950 | | | 3.2 | |
| 1 | Figures have been restated to reflect government accounting policies in effect at March 31, 2021 |
| 2 | Net liabilities as a per cent of GDP is calculated using GDP for the calendar year ending in the fiscal year (e.g. 2020/21 amount divided by GDP for the 2020 calendar year). As nominal GDP for the calendar year ending 2020 is not available, the 2020 GDP projected in the April 2021 budget has been used for the fiscal year ended March 31, 2021 for demonstration purposes. Figures have been restated to reflect government accounting policies in effect at March 31, 2021. |
| 3 | Per capita net liabilities is calculated using July 1 population (e.g. 2020/21 amount divided by population on July 1, 2020). |
| 98 | 2021 Financial and Economic Review – July 2021 | |
| | | |
Appendix 2 – Financial Review Supplementary Tables
Table A2.3 Changes in Financial Position – 2009/10 to 2020/21
| | | Actual | | | Actual | | | Actual | | | Actual | | | Actual | | | Actual | | | Actual | | | Actual | | | Actual | | | Actual | | | Actual | | | Actual | | | 12-Year | |
| ($ millions) | | 2009/10 | | | 2010/11 | | | 2011/12 | | | 2012/13 | | | 2013/14 | | | 2014/15 | | | 2015/16 | | | 2016/17 | | | 2017/18 | | | 2018/19 | | | 2019/20 | | | 2020/21 | | | Total | |
| (Surplus) deficit for the year | | | 1,813 | | | | 247 | | | | 1,842 | | | | 1,148 | | | | (313 | ) | | | (1,659 | ) | | | (769 | ) | | | (2,765 | ) | | | (313 | ) | | | (1,531 | ) | | | 322 | | | | 5,468 | | | | 3,490 | |
| Comprehensive income (increase) decrease | | | (481 | ) | | | 96 | | | | 287 | | | | (81 | ) | | | (327 | ) | | | 275 | | | | 647 | | | | (236 | ) | | | (36 | ) | | | (266 | ) | | | 255 | | | | (906 | ) | | | (773 | ) |
| Change in accumulated (surplus) deficit | | | 1,332 | | | | 343 | | | | 2,129 | | | | 1,067 | | | | (640 | ) | | | (1,384 | ) | | | (122 | ) | | | (3,001 | ) | | | (349 | ) | | | (1,797 | ) | | | 577 | | | | 4,562 | | | | 2,717 | |
| Capital and other asset changes: | | | | | | | | | | | | | | | | | | | | | | | | | | | | | | | | | | | | | | | | | | | | | | | | | | | | |
| Taxpayer-supported capital investments | | | 3,719 | | | | 4,110 | | | | 3,565 | | | | 3,279 | | | | 3,151 | | | | 3,407 | | | | 3,459 | | | | 3,659 | | | | 3,908 | | | | 4,452 | | | | 4,772 | | | | 5,428 | | | | 46,909 | |
| Less: amortization and other accounting changes | | | (2,039 | ) | | | (2,051 | ) | | | (2,151 | ) | | | (2,209 | ) | | | (2,135 | ) | | | (2,157 | ) | | | (2,205 | ) | | | (2,638 | ) | | | 625 | | | | (2,459 | ) | | | (2,578 | ) | | | (2,670 | ) | | | (24,667 | ) |
| Increase in net capital assets | | | 1,680 | | | | 2,059 | | | | 1,414 | | | | 1,070 | | | | 1,016 | | | | 1,250 | | | | 1,254 | | | | 1,021 | | | | 4,533 | | | | 1,993 | | | | 2,194 | | | | 2,758 | | | | 22,242 | |
| Increase (decrease) in restricted assets | | | 63 | | | | 71 | | | | 65 | | | | 65 | | | | 51 | | | | 60 | | | | 78 | | | | 64 | | | | 73 | | | | 66 | | | | 97 | | | | 72 | | | | 825 | |
| Increase (decrease) in other assets | | | 144 | | | | 120 | | | | 3 | | | | 72 | | | | 341 | | | | (26 | ) | | | (228 | ) | | | 87 | | | | (194 | ) | | | 20 | | | | 148 | | | | 482 | | | | 969 | |
| | | | 1,887 | | | | 2,250 | | | | 1,482 | | | | 1,207 | | | | 1,408 | | | | 1,284 | | | | 1,104 | | | | 1,172 | | | | 4,412 | | | | 2,079 | | | | 2,439 | | | | 3,312 | | | | 24,036 | |
| Increase (decrease) in net liabilities | | | 3,219 | | | | 2,593 | | | | 3,611 | | | | 2,274 | | | | 768 | | | | (100 | ) | | | 982 | | | | (1,829 | ) | | | 4,063 | | | | 282 | | | | 3,016 | | | | 7,874 | | | | 26,753 | |
| Investment and working capital changes: | | | | | | | | | | | | | | | | | | | | | | | | | | | | | | | | | | | | | | | | | | | | | | | | | | | | |
| Investment in commercial Crown corporations: | | | | | | | | | | | | | | | | | | | | | | | | | | | | | | | | | | | | | | | | | | | | | | | | | | | | |
| Increase (decrease) in retained earnings) | | | 1,506 | | | | (366 | ) | | | (94 | ) | | | 543 | | | | 298 | | | | 415 | | | | (740 | ) | | | (20 | ) | | | (1,383 | ) | | | (394 | ) | | | 783 | | | | 3,108 | | | | 3,656 | |
| Self-supported capital investments | | | 3,362 | | | | 2,470 | | | | 2,744 | | | | 2,765 | | | | 2,519 | | | | 2,488 | | | | 2,573 | | | | 2,725 | | | | 2,729 | | | | 4,106 | | | | 4,386 | | | | 3,475 | | | | 36,342 | |
| Less: loan repayments and other accounting changes | | | (1,046 | ) | | | (924 | ) | | | (719 | ) | | | (724 | ) | | | (472 | ) | | | (1,119 | ) | | | (1,156 | ) | | | (957 | ) | | | (6,004 | ) | | | (2,093 | ) | | | (2,165 | ) | | | (1,942 | ) | | | (19,321 | ) |
| Change in investment | | | 3,822 | | | | 1,180 | | | | 1,931 | | | | 2,584 | | | | 2,345 | | | | 1,784 | | | | 677 | | | | 1,748 | | | | (4,658 | ) | | | 1,619 | | | | 3,004 | | | | 4,641 | | | | 20,677 | |
| Increase (decrease) in cash and temporary investments | | | (2,274 | ) | | | 149 | | | | 175 | | | | (62 | ) | | | (372 | ) | | | 874 | | | | 217 | | | | 340 | | | | (792 | ) | | | (411 | ) | | | 956 | | | | 2,575 | | | | 1,375 | |
| Increase (decrease) in warehouse | | | | | | | | | | | | | | | | | | | | | | | | | | | | | | | | | | | | | | | | | | | | | | | | | | | | |
| borrowing investments | | | (2,081 | ) | | | - | | | | - | | | | - | | | | - | | | | - | | | | - | | | | - | | | | - | | | | - | | | | - | | | | - | | | | (2,081 | ) |
| Other working capital changes 1 | | | 330 | | | | (481 | ) | | | (872 | ) | | | 1,089 | | | | 1,222 | | | | (202 | ) | | | 977 | | | | (181 | ) | | | 669 | | | | (997 | ) | | | (1,324 | ) | | | (349 | ) | | | (119 | ) |
| | | | (203 | ) | | | 848 | | | | 1,234 | | | | 3,611 | | | | 3,195 | | | | 2,456 | | | | 1,871 | | | | 1,907 | | | | (4,781 | ) | | | 211 | | | | 2,636 | | | | 6,867 | | | | 19,852 | |
| Increase (decrease) in financial statement debt | | | 3,016 | | | | 3,441 | | | | 4,845 | | | | 5,885 | | | | 3,963 | | | | 2,356 | | | | 2,853 | | | | 78 | | | | (718 | ) | | | 493 | | | | 5,652 | | | | 14,741 | | | | 46,605 | |
| (Increase) decrease in sinking fund debt | | | 805 | | | | (81 | ) | | | (81 | ) | | | (287 | ) | | | 943 | | | | (142 | ) | | | (603 | ) | | | 493 | | | | (261 | ) | | | 596 | | | | 60 | | | | 200 | | | | 1,642 | |
| Increase (decrease) in guarantees | | | (20 | ) | | | 39 | | | | 99 | | | | (34 | ) | | | 27 | | | | (33 | ) | | | 6 | | | | (23 | ) | | | (188 | ) | | | (2 | ) | | | 57 | | | | 113 | | | | 41 | |
| Increase (decrease) in non-guaranteed debt | | | 70 | | | | (130 | ) | | | 176 | | | | 59 | | | | (56 | ) | | | 46 | | | | 75 | | | | 38 | | | | 249 | | | | (44 | ) | | | 430 | | | | (115 | ) | | | 798 | |
| Increase (decrease) in total provincial debt | | | 3,871 | | | | 3,269 | | | | 5,039 | | | | 5,623 | | | | 4,877 | | | | 2,227 | | | | 2,331 | | | | 586 | | | | (918 | ) | | | 1,043 | | | | 6,199 | | | | 14,939 | | | | 49,086 | |
| | | | | | | | | | | | | | | | | | | | | | | | | | | | | | | | | | | | | | | | | | | | | | | | | | | | | |
| Represented by increase (decrease) in: | | | | | | | | | | | | | | | | | | | | | | | | | | | | | | | | | | | | | | | | | | | | | | | | | | | | |
| Taxpayer-supported debt | | | 3,566 | | | | 1,853 | | | | 2,838 | | | | 3,523 | | | | 2,886 | | | | 812 | | | | 839 | | | | (1,220 | ) | | | 2,108 | | | | (926 | ) | | | 3,548 | | | | 13,521 | | | | 33,348 | |
| Self-supported debt | | | 305 | | | | 1,416 | | | | 2,201 | | | | 2,100 | | | | 1,991 | | | | 1,415 | | | | 1,492 | | | | 1,806 | | | | (3,026 | ) | | | 1,969 | | | | 2,651 | | | | 1,418 | | | | 15,738 | |
| Total provincial debt | | | 3,871 | | | | 3,269 | | | | 5,039 | | | | 5,623 | | | | 4,877 | | | | 2,227 | | | | 2,331 | | | | 586 | | | | (918 | ) | | | 1,043 | | | | 6,199 | | | | 14,939 | | | | 49,086 | |
| 1 | Includes changes in other financial assets, sinking funds, accounts payable, and deferred revenue. |
| | 2021 Financial and Economic Review – July 2021 | 99 |
| | | |
Appendix 2 – Financial Review Supplementary Tables
Table A2.4 Revenue by Source – 2009/10 to 2020/21
| | | | | | | | | | | | | | | | | | | | | | | | | | | | | | | | | | | | | | | Average | |
| | | Actual | | | Actual | | | Actual | | | Actual | | | Actual | | | Actual | | | Actual | | | Actual | | | Actual | | | Actual | | | Actual | | | Actual | | | annual | |
| ($ millions) | | 2009/10 | | | 2010/11 | | | 2011/12 | | | 2012/13 | | | 2013/14 | | | 2014/15 | | | 2015/16 | | | 2016/17 | | | 2017/18 | | | 2018/19 | | | 2019/20 | | | 2020/21 | | | change | |
| | | | | | | | | | | | | | | | | | | | | | | | | | | | | | | | | | | | | | | | (per cent) |
| Taxation revenue: | | | | | | | | | | | | | | | | | | | | | | | | | | | | | | | | | | | | | | | | | | | | | | | | | | | | |
| Personal income | | | 5,769 | | | | 5,805 | | | | 6,427 | | | | 6,977 | | | | 6,862 | | | | 8,076 | | | | 8,380 | | | | 9,704 | | | | 8,923 | | | | 11,364 | | | | 10,657 | | | | 11,118 | | | | 6.1 | |
| Corporate income | | | 1,625 | | | | 2,026 | | | | 2,002 | | | | 2,204 | | | | 2,427 | | | | 2,635 | | | | 2,787 | | | | 3,003 | | | | 4,165 | | | | 5,180 | | | | 5,011 | | | | 4,805 | | | | 10.4 | |
| Employer health | | | - | | | | - | | | | - | | | | - | | | | - | | | | - | | | | - | | | | - | | | | - | | | | 464 | | | | 1,897 | | | | 2,156 | | | | n/a | |
| Harmonized sales | | | - | | | | 4,176 | | | | 5,779 | | | | 5,950 | | | | (226 | ) | | | (91 | ) | | | (55 | ) | | | 6 | | | | 13 | | | | 7 | | | | - | | | | - | | | | n/a | |
| Other sales 1 | | | 4,945 | | | | 1,438 | | | | 151 | | | | 118 | | | | 5,529 | | | | 5,853 | | | | 6,045 | | | | 6,600 | | | | 7,118 | | | | 7,362 | | | | 7,374 | | | | 7,694 | | | | 4.1 | |
| Fuel | | | 884 | | | | 940 | | | | 928 | | | | 890 | | | | 917 | | | | 932 | | | | 973 | | | | 969 | | | | 1,010 | | | | 1,015 | | | | 1,008 | | | | 936 | | | | 0.5 | |
| Carbon | | | 541 | | | | 741 | | | | 959 | | | | 1,120 | | | | 1,222 | | | | 1,198 | | | | 1,190 | | | | 1,220 | | | | 1,255 | | | | 1,465 | | | | 1,682 | | | | 1,683 | | | | 10.9 | |
| Tobacco | | | 683 | | | | 735 | | | | 636 | | | | 614 | | | | 724 | | | | 752 | | | | 734 | | | | 737 | | | | 727 | | | | 781 | | | | 729 | | | | 711 | | | | 0.4 | |
| Property | | | 1,887 | | | | 1,920 | | | | 1,913 | | | | 1,985 | | | | 2,080 | | | | 2,154 | | | | 2,219 | | | | 2,279 | | | | 2,367 | | | | 2,617 | | | | 2,608 | | | | 2,313 | | | | 1.9 | |
| Property transfer | | | 887 | | | | 855 | | | | 944 | | | | 758 | | | | 937 | | | | 1,065 | | | | 1,533 | | | | 2,026 | | | | 2,141 | | | | 1,826 | | | | 1,609 | | | | 2,098 | | | | 8.1 | |
| Corporation capital | | | 95 | | | | (3 | ) | | | (5 | ) | | | 1 | | | | - | | | | (1 | ) | | | - | | | | - | | | | - | | | | - | | | | - | | | | - | | | | n/a | |
| Insurance premium | | | 389 | | | | 399 | | | | 411 | | | | 433 | | | | 458 | | | | 483 | | | | 520 | | | | 549 | | | | 602 | | | | 633 | | | | 691 | | | | 652 | | | | 4.8 | |
| | | | 17,705 | | | | 19,032 | | | | 20,145 | | | | 21,050 | | | | 20,930 | | | | 23,056 | | | | 24,326 | | | | 27,093 | | | | 28,321 | | | | 32,714 | | | | 33,266 | | | | 34,166 | | | | 6.2 | |
| Natural resource revenue: | | | | | | | | | | | | | | | | | | | | | | | | | | | | | | | | | | | | | | | | | | | | | | | | | | | | |
| Natural gas royalties | | | 406 | | | | 313 | | | | 339 | | | | 169 | | | | 445 | | | | 493 | | | | 139 | | | | 152 | | | | 161 | | | | 199 | | | | 118 | | | | 196 | | | | -6.4 | |
| Crown land tenures | | | 867 | | | | 923 | | | | 928 | | | | 868 | | | | 859 | | | | 834 | | | | 765 | | | | 633 | | | | 276 | | | | 279 | | | | 225 | | | | 162 | | | | -14.1 | |
| Columbia River Treaty | | | 168 | | | | 136 | | | | 110 | | | | 89 | | | | 170 | | | | 130 | | | | 116 | | | | 111 | | | | 111 | | | | 202 | | | | 119 | | | | 117 | | | | -3.2 | |
| Other energy and minerals | | | 421 | | | | 514 | | | | 529 | | | | 306 | | | | 269 | | | | 267 | | | | 226 | | | | 403 | | | | 619 | | | | 557 | | | | 386 | | | | 191 | | | | -6.9 | |
| Forests | | | 387 | | | | 436 | | | | 482 | | | | 562 | | | | 719 | | | | 754 | | | | 865 | | | | 913 | | | | 1,065 | | | | 1,406 | | | | 988 | | | | 1,304 | | | | 11.7 | |
| Other resources | | | 398 | | | | 406 | | | | 424 | | | | 479 | | | | 493 | | | | 459 | | | | 460 | | | | 499 | | | | 463 | | | | 465 | | | | 432 | | | | 433 | | | | 0.8 | |
| | | | 2,647 | | | | 2,728 | | | | 2,812 | | | | 2,473 | | | | 2,955 | | | | 2,937 | | | | 2,571 | | | | 2,711 | | | | 2,695 | | | | 3,108 | | | | 2,268 | | | | 2,403 | | | | -0.9 | |
| Other revenue: | | | | | | | | | | | | | | | | | | | | | | | | | | | | | | | | | | | | | | | | | | | | | | | | | | | | |
| Medical Services Plan premiums | | | 1,666 | | | | 1,787 | | | | 1,919 | | | | 2,047 | | | | 2,158 | | | | 2,254 | | | | 2,434 | | | | 2,558 | | | | 2,266 | | | | 1,360 | | | | 1,063 | | | | (4 | ) | | | n/a | |
| Post-secondary education fees | | | 1,123 | | | | 1,235 | | | | 1,291 | | | | 1,345 | | | | 1,445 | | | | 1,544 | | | | 1,666 | | | | 1,828 | | | | 2,034 | | | | 2,275 | | | | 2,451 | | | | 2,418 | | | | 7.2 | |
| Other healthcare related fees | | | 267 | | | | 308 | | | | 324 | | | | 327 | | | | 333 | | | | 358 | | | | 374 | | | | 404 | | | | 429 | | | | 441 | | | | 475 | | | | 372 | | | | 3.1 | |
| Motor vehicle licences and permits | | | 449 | | | | 467 | | | | 479 | | | | 489 | | | | 504 | | | | 499 | | | | 521 | | | | 529 | | | | 557 | | | | 568 | | | | 579 | | | | 571 | | | | 2.2 | |
| Other fees and licences | | | 616 | | | | 643 | | | | 722 | | | | 699 | | | | 770 | | | | 770 | | | | 841 | | | | 894 | | | | 963 | | | | 949 | | | | 1,004 | | | | 972 | | | | 4.2 | |
| Investment earnings | | | 930 | | | | 843 | | | | 1,022 | | | | 1,189 | | | | 1,203 | | | | 1,171 | | | | 1,213 | | | | 1,232 | | | | 1,101 | | | | 1,243 | | | | 1,263 | | | | 1,264 | | | | 2.8 | |
| Sales of goods and services | | | 728 | | | | 759 | | | | 930 | | | | 942 | | | | 946 | | | | 967 | | | | 1,011 | | | | 1,131 | | | | 1,133 | | | | 1,164 | | | | 1,162 | | | | 741 | | | | 0.2 | |
| Miscellaneous | | | 1,887 | | | | 1,929 | | | | 1,746 | | | | 1,673 | | | | 2,256 | | | | 1,893 | | | | 2,287 | | | | 2,377 | | | | 2,410 | | | | 2,249 | | | | 2,676 | | | | 2,395 | | | | 2.2 | |
| | | | 7,666 | | | | 7,971 | | | | 8,433 | | | | 8,711 | | | | 9,615 | | | | 9,456 | | | | 10,347 | | | | 10,953 | | | | 10,893 | | | | 10,249 | | | | 10,673 | | | | 8,729 | | | | 1.2 | |
| Contributions from the federal government: | | | | | | | | | | | | | | | | | | | | | | | | | | | | | | | | | | | | | | | | | | | | | | | | | | | | |
| Canada Health Transfer | | | 3,450 | | | | 3,689 | | | | 3,858 | | | | 3,887 | | | | 4,280 | | | | 4,186 | | | | 4,454 | | | | 4,744 | | | | 4,994 | | | | 5,182 | | | | 5,523 | | | | 5,701 | | | | 4.7 | |
| Canada Social Transfer | | | 1,433 | | | | 1,487 | | | | 1,526 | | | | 1,555 | | | | 1,589 | | | | 1,641 | | | | 1,695 | | | | 1,751 | | | | 1,854 | | | | 1,908 | | | | 1,971 | | | | 2,042 | | | | 3.3 | |
| Harmonized sales tax transition payments | | | 250 | | | | 769 | | | | 580 | | | | - | | | | - | | | | - | | | | - | | | | - | | | | - | | | | - | | | | - | | | | - | | | | n/a | |
| Other cost shared agreements | | | 1,794 | | | | 2,064 | | | | 1,760 | | | | 1,605 | | | | 1,645 | | | | 1,452 | | | | 1,498 | | | | 1,672 | | | | 2,207 | | | | 1,962 | | | | 2,041 | | | | 5,151 | | | | 10.1 | |
| | | | 6,927 | | | | 8,009 | | | | 7,724 | | | | 7,047 | | | | 7,514 | | | | 7,279 | | | | 7,647 | | | | 8,167 | | | | 9,055 | | | | 9,052 | | | | 9,535 | | | | 12,894 | | | | 5.8 | |
| Commercial Crown corporation net income: | | | | | | | | | | | | | | | | | | | | | | | | | | | | | | | | | | | | | | | | | | | | | | | | | | | | |
| BC Hydro2 | | | 447 | | | | 591 | | | | 558 | | | | 509 | | | | 549 | | | | 581 | | | | 655 | | | | 684 | | | | 683 | | | | (428 | ) | | | 705 | | | | 688 | | | | 4.0 | |
| Liquor Distribution Branch | | | 877 | | | | 891 | | | | 909 | | | | 930 | | | | 877 | | | | 935 | | | | 1,031 | | | | 1,083 | | | | 1,119 | | | | 1,104 | | | | 1,107 | | | | 1,161 | | | | 2.6 | |
| BC Lottery Corp (net of payments to federal gov’t) | | | 1,070 | | | | 1,097 | | | | 1,102 | | | | 1,116 | | | | 1,165 | | | | 1,245 | | | | 1,304 | | | | 1,329 | | | | 1,391 | | | | 1,405 | | | | 1,336 | | | | 420 | | | | -8.2 | |
| BC Railway Company | | | 2 | | | | 15 | | | | 14 | | | | 6 | | | | 13 | | | | 5 | | | | 6 | | | | 7 | | | | 53 | | | | 10 | | | | 13 | | | | 10 | | | | 15.8 | |
| ICBC | | | 601 | | | | 315 | | | | 84 | | | | 231 | | | | 136 | | | | 657 | | | | (293 | ) | | | (612 | ) | | | (1,327 | ) | | | (1,153 | ) | | | (376 | ) | | | 1,528 | | | | 8.9 | |
| Transportation Investment Corp. | | | (4 | ) | | | (7 | ) | | | (17 | ) | | | (60 | ) | | | (88 | ) | | | (89 | ) | | | (80 | ) | | | (81 | ) | | | (29 | ) | | | - | | | | - | | | | - | | | | n/a | |
| Other | | | 40 | | | | 38 | | | | 41 | | | | 44 | | | | 49 | | | | 37 | | | | 87 | | | | 115 | | | | 116 | | | | 117 | | | | 133 | | | | 157 | | | | 13.2 | |
| Accounting adjustments 2 | | | - | | | | - | | | | - | | | | - | | | | - | | | | - | | | | - | | | | - | | | | (950 | ) | | | 950 | | | | - | | | | - | | | | n/a | |
| | | | 3,033 | | | | 2,940 | | | | 2,691 | | | | 2,776 | | | | 2,701 | | | | 3,371 | | | | 2,710 | | | | 2,525 | | | | 1,056 | | | | 2,005 | | | | 2,918 | | | | 3,964 | | | | 2.5 | |
| Total revenue | | | 37,978 | | | | 40,680 | | | | 41,805 | | | | 42,057 | | | | 43,715 | | | | 46,099 | | | | 47,601 | | | | 51,449 | | | | 52,020 | | | | 57,128 | | | | 58,660 | | | | 62,156 | | | | 4.6 | |
| 1 | Includes social service tax, hotel room tax, provincial sales tax, tax on designated properties and housing transition tax. |
| 2 | BC Hydro’s loss for 2018/19 includes a write-off of a regulatory account. At the summary level, the Province recognized a $950 million adjustment in fiscal 2017/18 with respect to BC Hydro’s deferred regulatory accounts. |
| 100 | 2021 Financial and Economic Review – July 2021 | |
| | | |
Appendix 2 – Financial Review Supplementary Tables
Table A2.5 Revenue by Source Supplementary Information – 2009/10 to 2020/21
| | | | | | | | | | | | | | | | | | | | | | | | | | | | | | | | | | | | | | | Average | |
| | | Actual | | | Actual | | | Actual | | | Actual | | | Actual | | | Actual | | | Actual | | | Actual | | | Actual | | | Actual | | | Actual | | | Actual | | | annual | |
| | | 2009/10 | | | 2010/11 | | | 2011/12 | | | 2012/13 | | | 2013/14 | | | 2014/15 | | | 2015/16 | | | 2016/17 | | | 2017/18 | | | 2018/19 | | | 2019/20 | | | 2020/21 | | | change | |
| | | | | | | | | | | | | | | | | | | | | | | | | | | | | | | | | | | | | | | | | | | | | | | | | | | | (per cent) | |
| Per cent of Nominal GDP: 1 | | | | | | | | | | | | | | | | | | | | | | | | | | | | | | | | | | | | | | | | | | | | | | | | | | | | |
| Taxation | | | 8.9 | | | | 9.2 | | | | 9.2 | | | | 9.4 | | | | 9.1 | | | | 9.5 | | | | 9.7 | | | | 10.3 | | | | 10.0 | | | | 11.0 | | | | 10.8 | | | | 11.6 | | | | 2.4 | |
| Natural resources | | | 1.3 | | | | 1.3 | | | | 1.3 | | | | 1.1 | | | | 1.3 | | | | 1.2 | | | | 1.0 | | | | 1.0 | | | | 1.0 | | | | 1.1 | | | | 0.7 | | | | 0.8 | | | | -4.4 | |
| Other | | | 3.9 | | | | 3.9 | | | | 3.9 | | | | 3.9 | | | | 4.2 | | | | 3.9 | | | | 4.1 | | | | 4.2 | | | | 3.9 | | | | 3.5 | | | | 3.5 | | | | 3.0 | | | | -2.4 | |
| Contributions from the federal government | | | 3.5 | | | | 3.9 | | | | 3.5 | | | | 3.2 | | | | 3.3 | | | | 3.0 | | | | 3.0 | | | | 3.1 | | | | 3.2 | | | | 3.1 | | | | 3.1 | | | | 4.4 | | | | 2.0 | |
| Commercial Crown corporation net income | | | 1.5 | | | | 1.4 | | | | 1.2 | | | | 1.2 | | | | 1.2 | | | | 1.4 | | | | 1.1 | | | | 1.0 | | | | 0.4 | | | | 0.7 | | | | 0.9 | | | | 1.3 | | | | -1.2 | |
| Total revenue | | | 19.2 | | | | 19.7 | | | | 19.1 | | | | 18.8 | | | | 18.9 | | | | 18.9 | | | | 19.0 | | | | 19.5 | | | | 18.4 | | | | 19.3 | | | | 19.0 | | | | 21.1 | | | | 0.9 | |
| | | | | | | | | | | | | | | | | | | | | | | | | | | | | | | | | | | | | | | | | | | | | | | | | | | | | |
| Growth rates (per cent): | | | | | | | | | | | | | | | | | | | | | | | | | | | | | | | | | | | | | | | | | | | | | | | | | | | | |
| Taxation | | | -5.4 | | | | 7.5 | | | | 5.8 | | | | 4.5 | | | | -0.6 | | | | 10.2 | | | | 5.5 | | | | 11.4 | | | | 4.5 | | | | 15.5 | | | | 1.7 | | | | 2.7 | | | | n/a | |
| Natural resources | | | -30.5 | | | | 3.1 | | | | 3.1 | | | | -12.1 | | | | 19.5 | | | | -0.6 | | | | -12.5 | | | | 5.4 | | | | -0.6 | | | | 15.3 | | | | -27.0 | | | | 6.0 | | | | n/a | |
| Other | | | 4.6 | | | | 4.0 | | | | 5.8 | | | | 3.3 | | | | 10.4 | | | | -1.7 | | | | 9.4 | | | | 5.9 | | | | -0.5 | | | | -5.9 | | | | 4.1 | | | | -18.2 | | | | n/a | |
| Contributions from the federal government | | | 15.5 | | | | 15.6 | | | | -3.6 | | | | -8.8 | | | | 6.6 | | | | -3.1 | | | | 5.1 | | | | 6.8 | | | | 10.9 | | | | 0.0 | | | | 5.3 | | | | 35.2 | | | | n/a | |
| Commercial Crown corporation net income | | | 5.3 | | | | -3.1 | | | | -8.5 | | | | 3.2 | | | | -2.7 | | | | 24.8 | | | | -19.6 | | | | -6.8 | | | | -58.2 | | | | 89.9 | | | | 45.5 | | | | 35.8 | | | | n/a | |
| Total revenue | | | -1.9 | | | | 7.1 | | | | 2.8 | | | | 0.6 | | | | 3.9 | | | | 5.5 | | | | 3.3 | | | | 8.1 | | | | 1.1 | | | | 9.8 | | | | 2.7 | | | | 6.0 | | | | n/a | |
| | | | | | | | | | | | | | | | | | | | | | | | | | | | | | | | | | | | | | | | | | | | | | | | | | | | | |
| Per capita ($): 2 | | | | | | | | | | | | | | | | | | | | | | | | | | | | | | | | | | | | | | | | | | | | | | | | | | | | |
| Taxation | | | 4,014 | | | | 4,262 | | | | 4,475 | | | | 4,609 | | | | 4,520 | | | | 4,898 | | | | 5,093 | | | | 5,576 | | | | 5,745 | | | | 6,529 | | | | 6,534 | | | | 6,637 | | | | 4.7 | |
| Natural resources | | | 600 | | | | 611 | | | | 625 | | | | 542 | | | | 638 | | | | 624 | | | | 538 | | | | 558 | | | | 547 | | | | 620 | | | | 445 | | | | 467 | | | | -2.3 | |
| Other | | | 1,738 | | | | 1,785 | | | | 1,873 | | | | 1,907 | | | | 2,077 | | | | 2,009 | | | | 2,166 | | | | 2,254 | | | | 2,210 | | | | 2,046 | | | | 2,096 | | | | 1,696 | | | | -0.2 | |
| Contributions from the federal government | | | 1,571 | | | | 1,794 | | | | 1,716 | | | | 1,543 | | | | 1,623 | | | | 1,546 | | | | 1,601 | | | | 1,681 | | | | 1,837 | | | | 1,807 | | | | 1,873 | | | | 2,505 | | | | 4.3 | |
| Commercial Crown corporation net income | | | 688 | | | | 658 | | | | 598 | | | | 608 | | | | 583 | | | | 716 | | | | 567 | | | | 520 | | | | 214 | | | | 400 | | | | 573 | | | | 770 | | | | 1.0 | |
| Total revenue | | | 8,611 | | | | 9,110 | | | | 9,286 | | | | 9,209 | | | | 9,442 | | | | 9,793 | | | | 9,966 | | | | 10,588 | | | | 10,553 | | | | 11,402 | | | | 11,522 | | | | 12,074 | | | | 3.1 | |
| | | | | | | | | | | | | | | | | | | | | | | | | | | | | | | | | | | | | | | | | | | | | | | | | | | | | |
| Real Per Capita Revenue (2020 $) 3 | | | 10,152 | | | | 10,599 | | | | 10,553 | | | | 10,351 | | | | 10,621 | | | | 10,905 | | | | 10,977 | | | | 11,453 | | | | 11,178 | | | | 11,757 | | | | 11,610 | | | | 12,074 | | | | 1.6 | |
| Growth rate (per cent) | | | -3.3 | | | | 4.4 | | | | -0.4 | | | | -1.9 | | | | 2.6 | | | | 2.7 | | | | 0.7 | | | | 4.3 | | | | -2.4 | | | | 5.2 | | | | -1.2 | | | | 4.0 | | | | n/a | |
| 1 | Revenue as a per cent of GDP is calculated using GDP for the calendar year ending in the fiscal year (e.g. 2020/21 revenue divided by GDP for the 2020 calendar year). As nominal GDP for the calendar year ending 2020 is not available, the 2020 GDP projected in the April 2021 budget has been used for the fiscal year ended March 31, 2021 for demonstration purposes. Totals may not add due to rounding. |
| 2 | Per capita revenue is calculated using July 1 population (e.g. 2020/21 revenue divided by population on July 1, 2020). Totals may not add due to rounding. |
| 3 | Revenue is converted to real (inflation-adjusted) terms using the consumer price index (CPI) for the corresponding calendar year (e.g. 2020 CPI for 2020/21 revenue). |
| | 2021 FINANCIAL AND ECONOMIC REVIEW – JULY 2021 | 101 |
| | | |
Appendix 2 – Financial Review Supplementary Tables
Table A2.6 Expense by Function – 2009/10 to 2020/211
| | | | | | | | | | | | | | | | | | | | | | | | | | | | | | | | | | | | | | | Average | |
| | | Actual | | | Actual | | | Actual | | | Actual | | | Actual | | | Actual | | | Actual | | | Actual | | | Actual | | | Actual | | | Actual | | | Actual | | | annual | |
| ($ millions) | | 2009/10 | | | | 2010/11 | | | | 2011/12 | | | | 2012/13 | | | | 2013/14 | | | | 2014/15 | | | | 2015/16 | | | | 2016/17 | | | | 2017/18 | | | | 2018/19 | | | | 2019/20 | | | | 2020/21 | | | | change | |
| | | | | | | | | | | | | | | | | | | | | | | | | | | | | | | | | | | | | | | | | | | | | | | | | | | (per cent) | |
| Function: | | | | | | | | | | | | | | | | | | | | | | | | | | | | | | | | | | | | | | | | | | | | | | | | | | |
| Health: | | | | | | | | | | | | | | | | | | | | | | | | | | | | | | | | | | | | | | | | | | | | | | | | | | | |
| Medical Services Plan | | 3,407 | | | | 3,641 | | | | 3,873 | | | | 3,906 | | | | 4,114 | | | | 4,136 | | | | 4,345 | | | | 4,573 | | | | 4,623 | | | | 4,861 | | | | 5,013 | | | | 5,145 | | | | 3.8 | |
| Pharmacare | | 1,053 | | | | 1,129 | | | | 1,147 | | | | 1,122 | | | | 1,130 | | | | 1,120 | | | | 1,335 | | | | 1,284 | | | | 1,400 | | | | 1,494 | | | | 1,517 | | | | 1,501 | | | | 3.3 | |
| Regional services | | 10,273 | | | | 10,597 | | | | 11,255 | | | | 11,784 | | | | 11,960 | | | | 12,410 | | | | 12,811 | | | | 13,079 | | | | 14,094 | | | | 14,996 | | | | 16,047 | | | | 18,282 | | | | 5.4 | |
| Other healthcare expenses | | 597 | | | | 625 | | | | 642 | | | | 690 | | | | 658 | | | | 704 | | | | 712 | | | | 753 | | | | 810 | | | | 800 | | | | 872 | | | | 677 | | | | 1.2 | |
| | | 15,330 | | | | 15,992 | | | | 16,917 | | | | 17,502 | | | | 17,862 | | | | 18,370 | | | | 19,203 | | | | 19,689 | | | | 20,927 | | | | 22,151 | | | | 23,449 | | | | 25,605 | | | | 4.8 | |
| Education: | | | | | | | | | | | | | | | | | | | | | | | | | | | | | | | | | | | | | | | | | | | | | | | | | | | |
| Elementary and secondary | | 5,778 | | | | 5,802 | | | | 5,885 | | | | 6,002 | | | | 6,133 | | | | 6,064 | | | | 6,303 | | | | 6,422 | | | | 6,918 | | | | 7,253 | | | | 7,583 | | | | 7,443 | | | | 2.3 | |
| Post-secondary | | 4,733 | | | | 4,860 | | | | 4,908 | | | | 5,104 | | | | 5,285 | | | | 5,350 | | | | 5,503 | | | | 5,673 | | | | 5,998 | | | | 6,394 | | | | 6,842 | | | | 6,868 | | | | 3.4 | |
| Other education expenses | | 528 | | | | 504 | | | | 436 | | | | 423 | | | | 410 | | | | 414 | | | | 407 | | | | 374 | | | | 176 | | | | 442 | | | | 310 | | | | 632 | | | | 1.6 | |
| | | 11,039 | | | | 11,166 | | | | 11,229 | | | | 11,529 | | | | 11,828 | | | | 11,828 | | | | 12,213 | | | | 12,469 | | | | 13,092 | | | | 14,089 | | | | 14,735 | | | | 14,943 | | | | 2.8 | |
| Social services: | | | | | | | | | | | | | | | | | | | | | | | | | | | | | | | | | | | | | | | | | | | | | | | | | | | |
| Social assistance | | 1,454 | | | | 1,506 | | | | 1,550 | | | | 1,552 | | | | 1,572 | | | | 1,589 | | | | 1,641 | | | | 1,692 | | | | 1,988 | | | | 2,202 | | | | 2,342 | | | | 3,141 | | | | 7.3 | |
| Child welfare | | 1,077 | | | | 1,118 | | | | 1,112 | | | | 1,098 | | | | 1,097 | | | | 1,129 | | | | 1,301 | | | | 1,358 | | | | 1,507 | | | | 1,652 | | | | 1,940 | | | | 2,226 | | | | 6.8 | |
| Low income tax credit transfers | | 216 | | | | 408 | | | | 509 | | | | 534 | | | | 279 | | | | 248 | | | | 247 | | | | 244 | | | | 239 | | | | 414 | | | | 435 | | | | 1,131 | | | | 16.2 | |
| Community living and other services | | 729 | | | | 754 | | | | 769 | | | | 806 | | | | 857 | | | | 881 | | | | 917 | | | | 949 | | | | 1,003 | | | | 1,075 | | | | 1,170 | | | | 1,291 | | | | 5.3 | |
| | | 3,476 | | | | 3,786 | | | | 3,940 | | | | 3,990 | | | | 3,805 | | | | 3,847 | | | | 4,106 | | | | 4,243 | | | | 4,737 | | | | 5,343 | | | | 5,887 | | | | 7,789 | | | | 7.6 | |
| Protection of persons and property | | 1,380 | | | | 1,448 | | | | 1,512 | | | | 1,539 | | | | 1,520 | | | | 1,451 | | | | 1,572 | | | | 1,655 | | | | 1,930 | | | | 2,004 | | | | 2,126 | | | | 2,258 | | | | 4.6 | |
| Transportation | | 1,453 | | | | 1,580 | | | | 1,545 | | | | 1,555 | | | | 1,580 | | | | 1,608 | | | | 1,670 | | | | 1,784 | | | | 1,931 | | | | 2,021 | | | | 2,126 | | | | 3,360 | | | | 7.9 | |
| Natural resources & economic development | | 2,159 | | | | 2,349 | | | | 1,873 | | | | 2,092 | | | | 1,755 | | | | 2,191 | | | | 2,477 | | | | 2,465 | | | | 3,374 | | | | 3,825 | | | | 3,778 | | | | 4,191 | | | | 6.2 | |
| Other | | 1,382 | | | | 1,208 | | | | 1,414 | | | | 1,346 | | | | 1,184 | | | | 1,288 | | | | 1,264 | | | | 2,260 | | | | 1,553 | | | | 1,810 | | | | 2,501 | | | | 2,841 | | | | 6.8 | |
| General government | | 1,375 | | | | 1,146 | | | | 1,235 | | | | 1,262 | | | | 1,386 | | | | 1,359 | | | | 1,501 | | | | 1,532 | | | | 1,540 | | | | 1,670 | | | | 1,653 | | | | 3,915 | | | | 10.0 | |
| Debt servicing | | 2,197 | | | | 2,252 | | | | 2,383 | | | | 2,390 | | | | 2,482 | | | | 2,498 | | | | 2,826 | | | | 2,587 | | | | 2,623 | | | | 2,684 | | | | 2,727 | | | | 2,722 | | | | 2.0 | |
| Operating expense | | 39,791 | | | | 40,927 | | | | 42,048 | | | | 43,205 | | | | 43,402 | | | | 44,440 | | | | 46,832 | | | | 48,684 | | | | 51,707 | | | | 55,597 | | | | 58,982 | | | | 67,624 | | | | 4.9 | |
| Unusual items: | | | | | | | | | | | | | | | | | | | | | | | | | | | | | | | | | | | | | | | | | | | | | | | | | | | |
| HST transition funding repayment | | - | | | | - | | | | 1,599 | | | | - | | | | - | | | | - | | | | - | | | | - | | | | - | | | | - | | | | - | | | | - | | | | n/a | |
| Total expense | | 39,791 | | | | 40,927 | | | | 43,647 | | | | 43,205 | | | | 43,402 | | | | 44,440 | | | | 46,832 | | | | 48,684 | | | | 51,707 | | | | 55,597 | | | | 58,982 | | | | 67,624 | | | | 4.9 | |
| Per cent of operating expense: | | | | | | | | | | | | | | | | | | | | | | | | | | | | | | | | | | | | | | | | | | | | | | | | | | | |
| Health | | 38.5 | | | | 39.1 | | | | 40.2 | | | | 40.5 | | | | 41.2 | | | | 41.3 | | | | 41.0 | | | | 40.4 | | | | 40.5 | | | | 39.8 | | | | 39.8 | | | | 37.9 | | | | -0.2 | |
| Education | | 27.7 | | | | 27.3 | | | | 26.7 | | | | 26.7 | | | | 27.3 | | | | 26.6 | | | | 26.1 | | | | 25.6 | | | | 25.3 | | | | 25.3 | | | | 25.0 | | | | 22.1 | | | | -2.0 | |
| Social services and housing | | 8.7 | | | | 9.3 | | | | 9.4 | | | | 9.2 | | | | 8.8 | | | | 8.7 | | | | 8.8 | | | | 8.7 | | | | 9.2 | | | | 9.6 | | | | 10.0 | | | | 11.5 | | | | 2.5 | |
| Protection of persons and property | | 3.5 | | | | 3.5 | | | | 3.6 | | | | 3.6 | | | | 3.5 | | | | 3.3 | | | | 3.4 | | | | 3.4 | | | | 3.7 | | | | 3.6 | | | | 3.6 | | | | 3.3 | | | | -0.3 | |
| Transportation | | 3.7 | | | | 3.9 | | | | 3.7 | | | | 3.6 | | | | 3.6 | | | | 3.6 | | | | 3.6 | | | | 3.7 | | | | 3.7 | | | | 3.6 | | | | 3.6 | | | | 5.0 | | | | 2.8 | |
| Natural resources & economic development | | 5.4 | | | | 5.7 | | | | 4.5 | | | | 4.8 | | | | 4.0 | | | | 4.9 | | | | 5.3 | | | | 5.1 | | | | 6.5 | | | | 6.9 | | | | 6.4 | | | | 6.2 | | | | 1.2 | |
| Other | | 3.5 | | | | 3.0 | | | | 3.4 | | | | 3.1 | | | | 2.7 | | | | 2.9 | | | | 2.7 | | | | 4.6 | | | | 3.0 | | | | 3.3 | | | | 4.2 | | | | 4.2 | | | | 1.7 | |
| General government | | 3.5 | | | | 2.8 | | | | 2.9 | | | | 2.9 | | | | 3.2 | | | | 3.1 | | | | 3.2 | | | | 3.1 | | | | 3.0 | | | | 3.0 | | | | 2.8 | | | | 5.8 | | | | 4.8 | |
| Debt servicing | | 5.5 | | | | 5.5 | | | | 5.7 | | | | 5.5 | | | | 5.7 | | | | 5.6 | | | | 6.0 | | | | 5.3 | | | | 5.1 | | | | 4.8 | | | | 4.6 | | | | 4.0 | | | | -2.8 | |
| | | 100.0 | | | | 100.0 | | | | 100.0 | | | | 100.0 | | | | 100.0 | | | | 100.0 | | | | 100.0 | | | | 100.0 | | | | 100.0 | | | | 100.0 | | | | 100.0 | | | | 100.0 | | | | | |
| 1 | Figures have been restated to reflect government accounting policies in effect at March 31, 2021. |
| 102 | 2021 FINANCIAL AND ECONOMIC REVIEW – JULY 2021 | |
| | | |
APPENDIX 2 – FINANCIAL REVIEW SUPPLEMENTARY TABLES
Table A2.7 Expense by Function Supplementary Information – 2009/10 to 2020/21 1
| | | | | | | | | | | | | | | | | | | | | | | | | | | | | | | | | | | | | | | Average | |
| | | Actual | | | Actual | | | Actual | | | Actual | | | Actual | | | Actual | | | Actual | | | Actual | | | Actual | | | Actual | | | Actual | | | Actual | | | annual | |
| | | 2009/10 | | | 2010/11 | | | 2011/12 | | | 2012/13 | | | 2013/14 | | | 2014/15 | | | 2015/16 | | | 2016/17 | | | 2017/18 | | | 2018/19 | | | 2019/20 | | | 2020/21 | | | change | |
| Per cent of nominal GDP: 2 | | | | | | | | | | | | | | | | | | | | | | | | | | | | | | | | | | | | | | | | | | | | | | | | | | | (per cent) | |
| Health | | | 7.7 | | | | 7.7 | | | | 7.7 | | | | 7.8 | | | | 7.7 | | | | 7.5 | | | | 7.7 | | | | 7.5 | | | | 7.4 | | | | 7.5 | | | | 7.6 | | | | 8.7 | | | | 1.0 | |
| Education | | | 5.6 | | | | 5.4 | | | | 5.1 | | | | 5.2 | | | | 5.1 | | | | 4.9 | | | | 4.9 | | | | 4.7 | | | | 4.6 | | | | 4.8 | | | | 4.8 | | | | 5.1 | | | | -0.9 | |
| Social services | | | 1.8 | | | | 1.8 | | | | 1.8 | | | | 1.8 | | | | 1.6 | | | | 1.6 | | | | 1.6 | | | | 1.6 | | | | 1.7 | | | | 1.8 | | | | 1.9 | | | | 2.6 | | | | 3.8 | |
| Protection of persons and property | | | 0.7 | | | | 0.7 | | | | 0.7 | | | | 0.7 | | | | 0.7 | | | | 0.6 | | | | 0.6 | | | | 0.6 | | | | 0.7 | | | | 0.7 | | | | 0.7 | | | | 0.8 | | | | 0.9 | |
| Transportation | | | 0.7 | | | | 0.8 | | | | 0.7 | | | | 0.7 | | | | 0.7 | | | | 0.7 | | | | 0.7 | | | | 0.7 | | | | 0.7 | | | | 0.7 | | | | 0.7 | | | | 1.1 | | | | 4.1 | |
| Natural resources & economic development | | | 1.1 | | | | 1.1 | | | | 0.9 | | | | 0.9 | | | | 0.8 | | | | 0.9 | | | | 1.0 | | | | 0.9 | | | | 1.2 | | | | 1.3 | | | | 1.2 | | | | 1.4 | | | | 2.4 | |
| Other | | | 0.7 | | | | 0.6 | | | | 0.6 | | | | 0.6 | | | | 0.5 | | | | 0.5 | | | | 0.5 | | | | 0.9 | | | | 0.6 | | | | 0.6 | | | | 0.8 | | | | 1.0 | | | | 3.0 | |
| General government | | | 0.7 | | | | 0.6 | | | | 0.6 | | | | 0.6 | | | | 0.6 | | | | 0.6 | | | | 0.6 | | | | 0.6 | | | | 0.5 | | | | 0.6 | | | | 0.5 | | | | 1.3 | | | | 6.1 | |
| Debt servicing | | | 1.1 | | | | 1.1 | | | | 1.1 | | | | 1.1 | | | | 1.1 | | | | 1.0 | | | | 1.1 | | | | 1.0 | | | | 0.9 | | | | 0.9 | | | | 0.9 | | | | 0.9 | | | | -1.7 | |
| Operating expense | | | 20.1 | | | | 19.8 | | | | 19.2 | | | | 19.3 | | | | 18.8 | | | | 18.2 | | | | 18.7 | | | | 18.4 | | | | 18.3 | | | | 18.8 | | | | 19.1 | | | | 22.9 | | | | 1.2 | |
| | | | | | | | | | | | | | | | | | | | | | | | | | | | | | | | | | | | | | | | | | | | | | | | | | | | | |
| Growth rates (per cent): | | | | | | | | | | | | | | | | | | | | | | | | | | | | | | | | | | | | | | | | | | | | | | | | | | | | |
| Health | | | 2.7 | | | | 4.3 | | | | 5.8 | | | | 3.5 | | | | 2.1 | | | | 2.8 | | | | 4.5 | | | | 2.5 | | | | 6.3 | | | | 5.8 | | | | 5.9 | | | | 9.2 | | | | n/a | |
| Education | | | 5.4 | | | | 1.2 | | | | 0.6 | | | | 2.7 | | | | 2.6 | | | | 0.0 | | | | 3.3 | | | | 2.1 | | | | 5.0 | | | | 7.6 | | | | 4.6 | | | | 1.4 | | | | n/a | |
| Social services | | | 4.6 | | | | 8.9 | | | | 4.1 | | | | 1.3 | | | | -4.6 | | | | 1.1 | | | | 6.7 | | | | 3.3 | | | | 11.6 | | | | 12.8 | | | | 10.2 | | | | 32.3 | | | | n/a | |
| Protection of persons and property | | | -3.4 | | | | 4.9 | | | | 4.4 | | | | 1.8 | | | | -1.2 | | | | -4.5 | | | | 8.3 | | | | 5.3 | | | | 16.6 | | | | 3.8 | | | | 6.1 | | | | 6.2 | | | | n/a | |
| Transportation | | | 3.7 | | | | 8.7 | | | | -2.2 | | | | 0.6 | | | | 1.6 | | | | 1.8 | | | | 3.9 | | | | 6.8 | | | | 8.2 | | | | 4.7 | | | | 5.2 | | | | 58.0 | | | | n/a | |
| Natural resources & economic development | | | 14.5 | | | | 8.8 | | | | -20.3 | | | | 11.7 | | | | -16.1 | | | | 24.8 | | | | 13.1 | | | | -0.5 | | | | 36.9 | | | | 13.4 | | | | -1.2 | | | | 10.9 | | | | n/a | |
| Other | | | -16.2 | | | | -12.6 | | | | 17.1 | | | | -4.8 | | | | -12.0 | | | | 8.8 | | | | -1.9 | | | | 78.8 | | | | -31.3 | | | | 16.5 | | | | 38.2 | | | | 13.6 | | | | n/a | |
| General government | | | -3.5 | | | | -16.7 | | | | 7.8 | | | | 2.2 | | | | 9.8 | | | | -1.9 | | | | 10.4 | | | | 2.1 | | | | 0.5 | | | | 8.4 | | | | -1.0 | | | | 136.8 | | | | n/a | |
| Debt servicing | | | 1.8 | | | | 2.5 | | | | 5.8 | | | | 0.3 | | | | 3.8 | | | | 0.6 | | | | 13.1 | | | | -8.5 | | | | 1.4 | | | | 2.3 | | | | 1.6 | | | | -0.2 | | | | n/a | |
| Operating expense | | | 2.9 | | | | 2.9 | | | | 2.7 | | | | 2.8 | | | | 0.5 | | | | 2.4 | | | | 5.4 | | | | 4.0 | | | | 6.2 | | | | 7.5 | | | | 6.1 | | | | 14.7 | | | | n/a | |
| | | | | | | | | | | | | | | | | | | | | | | | | | | | | | | | | | | | | | | | | | | | | | | | | | | | | |
| Per capita ($): 3 | | | | | | | | | | | | | | | | | | | | | | | | | | | | | | | | | | | | | | | | | | | | | | | | | | | | |
| Health | | | 3,476 | | | | 3,581 | | | | 3,758 | | | | 3,832 | | | | 3,858 | | | | 3,903 | | | | 4,020 | | | | 4,052 | | | | 4,245 | | | | 4,421 | | | | 4,606 | | | | 4,974 | | | | 3.3 | |
| Education | | | 2,503 | | | | 2,500 | | | | 2,494 | | | | 2,525 | | | | 2,555 | | | | 2,513 | | | | 2,557 | | | | 2,566 | | | | 2,656 | | | | 2,812 | | | | 2,894 | | | | 2,903 | | | | 1.4 | |
| Social services | | | 788 | | | | 848 | | | | 875 | | | | 874 | | | | 822 | | | | 817 | | | | 860 | | | | 873 | | | | 961 | | | | 1,066 | | | | 1,156 | | | | 1,513 | | | | 6.1 | |
| Protection of persons and property | | | 313 | | | | 324 | | | | 336 | | | | 337 | | | | 328 | | | | 308 | | | | 329 | | | | 341 | | | | 392 | | | | 400 | | | | 418 | | | | 439 | | | | 3.1 | |
| Transportation | | | 329 | | | | 354 | | | | 343 | | | | 341 | | | | 341 | | | | 342 | | | | 350 | | | | 367 | | | | 392 | | | | 403 | | | | 418 | | | | 653 | | | | 6.4 | |
| Natural resources & economic development | | | 490 | | | | 526 | | | | 416 | | | | 458 | | | | 379 | | | | 465 | | | | 519 | | | | 507 | | | | 684 | | | | 763 | | | | 742 | | | | 814 | | | | 4.7 | |
| Other | | | 313 | | | | 271 | | | | 314 | | | | 295 | | | | 256 | | | | 274 | | | | 265 | | | | 465 | | | | 315 | | | | 361 | | | | 491 | | | | 552 | | | | 5.3 | |
| General government | | | 312 | | | | 257 | | | | 274 | | | | 276 | | | | 299 | | | | 289 | | | | 314 | | | | 315 | | | | 312 | | | | 333 | | | | 325 | | | | 761 | | | | 8.4 | |
| Debt servicing | | | 498 | | | | 504 | | | | 529 | | | | 523 | | | | 536 | | | | 531 | | | | 592 | | | | 532 | | | | 532 | | | | 536 | | | | 536 | | | | 529 | | | | 0.6 | |
| Operating expense | | | 9,022 | | | | 9,165 | | | | 9,339 | | | | 9,461 | | | | 9,374 | | | | 9,442 | | | | 9,806 | | | | 10,018 | | | | 10,489 | | | | 11,095 | | | | 11,586 | | | | 13,138 | | | | 3.5 | |
| Real Per Capita Operating Expense (2020 $) 4 | | | 10,637 | | | | 10,663 | | | | 10,614 | | | | 10,633 | | | | 10,545 | | | | 10,513 | | | | 10,800 | | | | 10,837 | | | | 11,111 | | | | 11,442 | | | | 11,674 | | | | 13,138 | | | | 1.9 | |
| Growth rate (per cent) | | | 1.5 | | | | 0.2 | | | | -0.5 | | | | 0.2 | | | | -0.8 | | | | -0.3 | | | | 2.7 | | | | 0.3 | | | | 2.5 | | | | 3.0 | | | | 2.0 | | | | 12.5 | | | | n/a | |
| 1 | Numbers may not add due to rounding. |
| 2 | Expense as a per cent of GDP is an estimate calculated using nominal GDP for the calendar year ending in the fiscal year (e.g. 2020/21 expense divided by nominal GDP for the 2020 calendar year); as nominal GDP for the calendar year ending 2020 is not available, the 2020 GDP projected in the April 2021 budget has been used for the fiscal year ended March 31, 2021 for demonstration purposes. |
| 3 | Per capita expense is calculated using July 1 population (e.g. 2020/21 expense divided by population on July 1, 2020). |
| 4 | Expense is converted to real (inflation-adjusted) terms using the consumer price index (CPI) for the corresponding calendar year (e.g. 2020 CPI for 2020/21 expense). |
| | 2021 FINANCIAL AND ECONOMIC REVIEW – JULY 2021 | 103 |
| | | |
APPENDIX 2 – FINANCIAL REVIEW SUPPLEMENTARY TABLES
Table A2.8 Full-Time Equivalents (FTEs) – 2009/10 to 2020/21
| | | | | | | | | | | | | | | | | | | | | | | | | | | | | | | | | | | | | | | Average | |
| | | Actual | | | Actual | | | Actual | | | Actual | | | Actual | | | Actual | | | Actual | | | Actual | | | Actual | | | Actual | | | Actual | | | Actual | | | annual | |
| | | 2009/10 | | | 2010/11 | | | 2011/12 | | | 2012/13 | | | 2013/14 | | | 2014/15 | | | 2015/16 | | | 2016/17 | | | 2017/18 | | | 2018/19 | | | 2019/20 | | | 2020/21 | | | change | |
| | | | | | | | | | | | | | | | | | | | | | | | | | | | | | | | | | | | | | | | | | | | | | | | | | | | (per cent) | |
| Taxpayer-supported programs and agencies: | | | | | | | | | | | | | | | | | | | | | | | | | | | | | | | | | | | | | | | | | | | | | | | | | | | | |
| Ministries and special offices (CRF) | | | 31,353 | | | | 30,221 | | | | 27,228 | | | | 27,326 | | | | 26,526 | | | | 26,679 | | | | 27,192 | | | | 27,940 | | | | 29,291 | | | | 30,891 | | | | 31,774 | | | | 32,444 | | | | 0.3 | |
| Service delivery agencies 1 | | | 4,508 | | | | 4,295 | | | | 4,346 | | | | 4,508 | | | | 4,640 | | | | 4,798 | | | | 4,803 | | | | 4,850 | | | | 5,076 | | | | 5,258 | | | | 5,985 | | | | 6,042 | | | | 2.7 | |
| Total FTEs | | | 35,861 | | | | 34,516 | | | | 31,574 | | | | 31,834 | | | | 31,166 | | | | 31,477 | | | | 31,995 | | | | 32,790 | | | | 34,367 | | | | 36,149 | | | | 37,759 | | | | 38,486 | | | | 0.6 | |
| | | | | | | | | | | | | | | | | | | | | | | | | | | | | | | | | | | | | | | | | | | | | | | | | | | | | |
| Growth rates: | | | | | | | | | | | | | | | | | | | | | | | | | | | | | | | | | | | | | | | | | | | | | | | | | | | | |
| Ministries and special offices (CRF) | | | -1.6 | | | | -3.6 | | | | -9.9 | | | | 0.4 | | | | -2.9 | | | | 0.6 | | | | 1.9 | | | | 2.8 | | | | 4.8 | | | | 5.5 | | | | 2.9 | | | | 2.1 | | | | n/a | |
| Service delivery agencies | | | 2.4 | | | | -4.7 | | | | 1.2 | | | | 3.7 | | | | 2.9 | | | | 3.4 | | | | 0.1 | | | | 1.0 | | | | 4.7 | | | | 3.6 | | | | 13.8 | | | | 1.0 | | | | n/a | |
| Population per FTE: 2 | | | | | | | | | | | | | | | | | | | | | | | | | | | | | | | | | | | | | | | | | | | | | | | | | | | | |
| Total FTEs | | | 123.0 | | | | 129.4 | | | | 142.6 | | | | 143.5 | | | | 148.6 | | | | 149.5 | | | | 149.3 | | | | 148.2 | | | | 143.4 | | | | 138.6 | | | | 134.8 | | | | 133.8 | | | | 0.8 | |
| 1 | Service delivery agency FTE figures do not include SUCH sector staff employment. |
| 2 | Population per FTE is calculated using July 1 population (e.g. population on July 1, 2020 divided by 2020/21 FTEs). |
| 104 | 2021 FINANCIAL AND ECONOMIC REVIEW – JULY 2021 | |
| | | |
Appendix 2 – Financial Review Supplementary Tables
Table A2.9 Capital Spending - 2009/10 to 2020/21
| | | | | | | | | | | | | | | | | | | | | | | | | | | | | | | | | | | | | | | Average | |
| | | Actual | | | Actual | | | Actual | | | Actual | | | Actual | | | Actual | | | Actual | | | Actual | | | Actual | | | Actual | | | Actual | | | Actual | | | annual | |
| ($ millions) | | 2009/10 | | | 2010/11 | | | 2011/12 | | | 2012/13 | | | 2013/14 | | | 2014/15 | | | 2015/16 | | | 2016/17 | | | 2017/18 | | | 2018/19 | | | 2019/20 | | | 2020/21 | | | change | |
| | | | | | | | | | | | | | | | | | | | | | | | | | | | | | | | | | | | | | | (per cent) | |
| Taxpayer-supported: | | | | | | | | | | | | | | | | | | | | | | | | | | | | | | | | | | | | | | | | | | | | | | | | | | | | |
| Education | | | | | | | | | | | | | | | | | | | | | | | | | | | | | | | | | | | | | | | | | | | | | | | | | | | | |
| Schools (K-12) | | | 449 | | | | 433 | | | | 560 | | | | 509 | | | | 466 | | | | 420 | | | | 430 | | | | 474 | | | | 578 | | | | 626 | | | | 877 | | | | 944 | | | | 7.0 | |
| Post-secondary | | | 669 | | | | 924 | | | | 655 | | | | 591 | | | | 507 | | | | 718 | | | | 746 | | | | 792 | | | | 968 | | | | 1,024 | | | | 936 | | | | 904 | | | | 2.8 | |
| Health | | | 927 | | | | 916 | | | | 732 | | | | 742 | | | | 690 | | | | 900 | | | | 923 | | | | 1,004 | | | | 890 | | | | 904 | | | | 1,009 | | | | 1,162 | | | | 2.1 | |
| BC Transportation Financing Authority | | | 918 | | | | 1,080 | | | | 921 | | | | 1,005 | | | | 1,017 | | | | 822 | | | | 867 | | | | 823 | | | | 717 | | | | 853 | | | | 955 | | | | 1,285 | | | | 3.1 | |
| BC Transit | | | 150 | | | | 39 | | | | 37 | | | | 48 | | | | 80 | | | | 83 | | | | 51 | | | | 41 | | | | 115 | | | | 85 | | | | 73 | | | | 107 | | | | -3.0 | |
| Vancouver Convention Centre expansion | | | 41 | | | | 10 | | | | 1 | | | | - | | | | - | | | | - | | | | - | | | | - | | | | - | | | | - | | | | - | | | | - | | | | -100.0 | |
| BC Place redevelopment | | | 75 | | | | 197 | | | | 194 | | | | 6 | | | | - | | | | - | | | | - | | | | - | | | | - | | | | - | | | | - | | | | - | | | | -100.0 | |
| Government direct (ministries) | | | 306 | | | | 261 | | | | 245 | | | | 267 | | | | 298 | | | | 326 | | | | 290 | | | | 301 | | | | 430 | | | | 421 | | | | 520 | | | | 389 | | | | 2.2 | |
| Housing | | | 137 | | | | 230 | | | | 196 | | | | 92 | | | | 65 | | | | 107 | | | | 127 | | | | 184 | | | | 169 | | | | 483 | | | | 355 | | | | 572 | | | | 13.9 | |
| Other | | | 47 | | | | 20 | | | | 24 | | | | 19 | | | | 28 | | | | 31 | | | | 25 | | | | 40 | | | | 41 | | | | 56 | | | | 47 | | | | 65 | | | | 3.0 | |
| | | | 3,719 | | | | 4,110 | | | | 3,565 | | | | 3,279 | | | | 3,151 | | | | 3,407 | | | | 3,459 | | | | 3,659 | | | | 3,908 | | | | 4,452 | | | | 4,772 | | | | 5,428 | | | | 3.5 | |
| Self-supported: | | | | | | | | | | | | | | | | | | | | | | | | | | | | | | | | | | | | | | | | | | | | | | | | | | | | |
| BC Hydro | | | 2,406 | | | | 1,519 | | | | 1,703 | | | | 1,929 | | | | 2,036 | | | | 2,169 | | | | 2,306 | | | | 2,444 | | | | 2,473 | | | | 3,826 | | | | 3,082 | | | | 3,207 | | | | 2.6 | |
| BC Transmission Corporation | | | 12 | | | | - | | | | - | | | | - | | | | - | | | | - | | | | - | | | | - | | | | - | | | | - | | | | - | | | | - | | | | -100.0 | |
| Columbia Basin power projects | | | 16 | | | | 67 | | | | 108 | | | | 94 | | | | 52 | | | | 28 | | | | 15 | | | | 2 | | | | 1 | | | | 2 | | | | 994 | | | | 7 | | | | -7.2 | |
| Transportation Invest. Corp. | | | 778 | | | | 730 | | | | 734 | | | | 540 | | | | 202 | | | | 76 | | | | 25 | | | | 38 | | | | 4 | | | | - | | | | - | | | | - | | | | -100.0 | |
| BC Railway Company | | | 14 | | | | 6 | | | | 9 | | | | 10 | | | | 8 | | | | 5 | | | | 23 | | | | 4 | | | | 11 | | | | 33 | | | | 6 | | | | 1 | | | | -21.3 | |
| ICBC | | | 22 | | | | 48 | | | | 92 | | | | 73 | | | | 82 | | | | 88 | | | | 90 | | | | 62 | | | | 54 | | | | 66 | | | | 62 | | | | 100 | | | | 14.8 | |
| BC Lottery Corporation | | | 92 | | | | 81 | | | | 74 | | | | 97 | | | | 100 | | | | 69 | | | | 68 | | | | 86 | | | | 82 | | | | 75 | | | | 102 | | | | 73 | | | | -2.1 | |
| Liquor Distribution Branch | | | 19 | | | | 18 | | | | 19 | | | | 10 | | | | 13 | | | | 25 | | | | 23 | | | | 27 | | | | 48 | | | | 60 | | | | 36 | | | | 22 | | | | 1.3 | |
| Other | | | 3 | | | | 1 | | | | 5 | | | | 12 | | | | 26 | | | | 28 | | | | 23 | | | | 62 | | | | 56 | | | | 44 | | | | 104 | | | | 65 | | | | 32.3 | |
| | | | 3,362 | | | | 2,470 | | | | 2,744 | | | | 2,765 | | | | 2,519 | | | | 2,488 | | | | 2,573 | | | | 2,725 | | | | 2,729 | | | | 4,106 | | | | 4,386 | | | | 3,475 | | | | 0.3 | |
| Total capital spending | | | 7,081 | | | | 6,580 | | | | 6,309 | | | | 6,044 | | | | 5,670 | | | | 5,895 | | | | 6,032 | | | | 6,384 | | | | 6,637 | | | | 8,558 | | | | 9,158 | | | | 8,903 | | | | 2.1 | |
| | | | | | | | | | | | | | | | | | | | | | | | | | | | | | | | | | | | | | | | | | | | | | | | | | | | | |
| Per cent of Nominal GDP: 1 | | | | | | | | | | | | | | | | | | | | | | | | | | | | | | | | | | | | | | | | | | | | | | | | | | | | |
| Taxpayer-supported | | | 1.9 | | | | 2.0 | | | | 1.6 | | | | 1.5 | | | | 1.4 | | | | 1.4 | | | | 1.4 | | | | 1.4 | | | | 1.4 | | | | 1.5 | | | | 1.5 | | | | 1.8 | | | | -0.2 | |
| Self-supported | | | 1.7 | | | | 1.2 | | | | 1.3 | | | | 1.2 | | | | 1.1 | | | | 1.0 | | | | 1.0 | | | | 1.0 | | | | 1.0 | | | | 1.4 | | | | 1.4 | | | | 1.2 | | | | -3.3 | |
| Total | | | 3.6 | | | | 3.2 | | | | 2.9 | | | | 2.7 | | | | 2.5 | | | | 2.4 | | | | 2.4 | | | | 2.4 | | | | 2.4 | | | | 2.9 | | | | 3.0 | | | | 3.0 | | | | -1.5 | |
| Growth rates: | | | | | | | | | | | | | | | | | | | | | | | | | | | | | | | | | | | | | | | | | | | | | | | | | | | | |
| Taxpayer-supported | | | -0.6 | | | | 10.5 | | | | -13.3 | | | | -8.0 | | | | -3.9 | | | | 8.1 | | | | 1.5 | | | | 5.8 | | | | 6.8 | | | | 13.9 | | | | 7.2 | | | | 13.7 | | | | n/a | |
| Self-supported | | | 85.7 | | | | -26.5 | | | | 11.1 | | | | 0.8 | | | | -8.9 | | | | -1.2 | | | | 3.4 | | | | 5.9 | | | | 0.1 | | | | 50.5 | | | | 6.8 | | | | -20.8 | | | | n/a | |
| Total | | | 27.5 | | | | -7.1 | | | | -4.1 | | | | -4.2 | | | | -6.2 | | | | 4.0 | | | | 2.3 | | | | 5.8 | | | | 4.0 | | | | 28.9 | | | | 7.0 | | | | -2.8 | | | | n/a | |
| Per capita: 2 | | | | | | | | | | | | | | | | | | | | | | | | | | | | | | | | | | | | | | | | | | | | | | | | | | | | |
| Taxpayer-supported | | | 843 | | | | 920 | | | | 792 | | | | 718 | | | | 681 | | | | 724 | | | | 724 | | | | 753 | | | | 793 | | | | 889 | | | | 937 | | | | 1,054 | | | | 2.1 | |
| Self-supported | | | 762 | | | | 553 | | | | 609 | | | | 605 | | | | 544 | | | | 529 | | | | 539 | | | | 561 | | | | 554 | | | | 819 | | | | 862 | | | | 675 | | | | -1.1 | |
| Total | | | 1,605 | | | | 1,474 | | | | 1,401 | | | | 1,323 | | | | 1,225 | | | | 1,252 | | | | 1,263 | | | | 1,314 | | | | 1,346 | | | | 1,708 | | | | 1,799 | | | | 1,730 | | | | 0.7 | |
| | | | | | | | | | | | | | | | | | | | | | | | | | | | | | | | | | | | | | | | | | | | | | | | | | | | | |
| Real Per Capita Capital Spending (2020 $) 3 | | | 1,893 | | | | 1,714 | | | | 1,593 | | | | 1,488 | | | | 1,378 | | | | 1,395 | | | | 1,391 | | | | 1,421 | | | | 1,426 | | | | 1,761 | | | | 1,813 | | | | 1,730 | | | | -0.8 | |
| Growth rate (per cent) | | | 25.7 | | | | -9.4 | | | | -7.1 | | | | -6.6 | | | | -7.4 | | | | 1.2 | | | | -0.3 | | | | 2.2 | | | | 0.4 | | | | 23.5 | | | | 2.9 | | | | -4.6 | | | | n/a | |
| 1 | Capital spending as a per cent of GDP is calculated using GDP for the calendar year ending in the fiscal year (e.g. 2020/21 amounts divided by GDP for the 2020 calendar year). As nominal GDP for the calendar year ending 2020 is not available, the 2020 GDP projected in the April 2021 budget has been used for the fiscal year ended March 31, 2021 for demonstration purposes. Totals may not add due to rounding. |
| 2 | Per capita capital spending is calculated using July 1 population (e.g. 2020/21 amounts divided by population on July 1, 2020). Totals may not add due to rounding. |
| 3 | Capital spending is converted to real (inflation-adjusted) terms using the consumer price index (CPI) for the corresponding calendar year (e.g. 2020 CPI for 2020/21 capital spending). |
| | 2021 Financial and Economic Review – July 2021 | 105 |
| | | |
Appendix 2 – Financial Review Supplementary Tables
Table A2.10 Provincial Debt – 2009/10 to 2020/21
| | | | | | | | | | | | | | | | | | | | | | | | | | | | | | | | | | | | | | | Average | |
| | | Actual | | | Actual | | | Actual | | | Actual | | | Actual | | | Actual | | | Actual | | | Actual | | | Actual | | | Actual | | | Actual | | | Actual | | | annual | |
| ($ millions) | | 2009/10 | | | 2010/11 | | | 2011/12 | | | 2012/13 | | | 2013/14 | | | 2014/15 | | | 2015/16 | | | 2016/17 | | | 2017/18 | | | 2018/19 | | | 2019/20 | | | 2020/21 | | | change | |
| | | | | | | | | | | | | | | | | | | | | | | | | | | | | | | | | | | | | | | (per cent) | |
| Taxpayer-supported debt: | | | | | | | | | | | | | | | | | | | | | | | | | | | | | | | | | | | | | | | | | | | | | | | | | | | | |
| Provincial government direct operating | | | 7,359 | | | | 6,964 | | | | 7,813 | | | | 9,408 | | | | 10,223 | | | | 9,280 | | | | 8,034 | | | | 4,644 | | | | 1,156 | | | | - | | | | - | | | | 8,746 | | | | 1.6 | |
| Other taxpayer-supported debt (mainly capital): | | | | | | | | | | | | | | | | | | | | | | | | | | | | | | | | | | | | | | | | | | | | | | | | | | | | |
| Education facilities | | | | | | | | | | | | | | | | | | | | | | | | | | | | | | | | | | | | | | | | | | | | | | | | | | | | |
| Post-secondary institutions | | | 3,824 | | | | 4,092 | | | | 4,185 | | | | 4,315 | | | | 4,386 | | | | 4,518 | | | | 4,731 | | | | 4,984 | | | | 5,328 | | | | 5,370 | | | | 5,670 | | | | 6,308 | | | | 4.7 | |
| Schools | | | 5,777 | | | | 6,016 | | | | 6,407 | | | | 6,830 | | | | 7,245 | | | | 7,600 | | | | 8,033 | | | | 8,473 | | | | 8,908 | | | | 8,904 | | | | 9,775 | | | | 10,553 | | | | 5.6 | |
| | | | 9,601 | | | | 10,108 | | | | 10,592 | | | | 11,145 | | | | 11,631 | | | | 12,118 | | | | 12,764 | | | | 13,457 | | | | 14,236 | | | | 14,274 | | | | 15,445 | | | | 16,861 | | | | 5.3 | |
| Health facilities | | | 4,389 | | | | 4,895 | | | | 5,293 | | | | 5,691 | | | | 6,038 | | | | 6,522 | | | | 6,998 | | | | 7,552 | | | | 7,903 | | | | 7,968 | | | | 8,507 | | | | 9,359 | | | | 7.1 | |
| Highways, ferries and public transit | | | | | | | | | | | | | | | | | | | | | | | | | | | | | | | | | | | | | | | | | | | | | | | | | | | | |
| BC Transit | | | 140 | | | | 158 | | | | 183 | | | | 163 | | | | 143 | | | | 123 | | | | 106 | | | | 94 | | | | 84 | | | | 73 | | | | 65 | | | | 60 | | | | -7.4 | |
| BC Transportation Financing Authority | | | 5,211 | | | | 5,785 | | | | 6,287 | | | | 7,084 | | | | 7,912 | | | | 8,428 | | | | 9,177 | | | | 9,974 | | | | 10,388 | | | | 11,293 | | | | 12,193 | | | | 13,321 | | | | 8.9 | |
| Port Mann Bridge | | | - | | | | - | | | | - | | | | - | | | | - | | | | - | | | | - | | | | - | | | | 3,508 | | | | 3,510 | | | | 3,510 | | | | 3,510 | | | | 0.0 | |
| Public transit | | | 997 | | | | 997 | | | | 1,000 | | | | 1,000 | | | | 1,000 | | | | 1,000 | | | | 1,000 | | | | 1,000 | | | | 1,000 | | | | 870 | | | | 870 | | | | 870 | | | | -1.2 | |
| SkyTrain extension | | | 1,154 | | | | 1,155 | | | | 1,174 | | | | 1,174 | | | | 1,174 | | | | 1,174 | | | | 1,174 | | | | 1,174 | | | | 1,174 | | | | 1,021 | | | | 1,021 | | | | 1,021 | | | | -1.1 | |
| | | | 7,502 | | | | 8,095 | | | | 8,644 | | | | 9,421 | | | | 10,229 | | | | 10,725 | | | | 11,457 | | | | 12,242 | | | | 16,154 | | | | 16,767 | | | | 17,659 | | | | 18,782 | | | | 8.7 | |
| Other | | | | | | | | | | | | | | | | | | | | | | | | | | | | | | | | | | | | | | | | | | | | | | | | | | | | |
| BC Immigration Investment Fund | | | 289 | | | | 347 | | | | 398 | | | | 363 | | | | 440 | | | | 414 | | | | 304 | | | | 217 | | | | 161 | | | | 70 | | | | 45 | | | | 37 | | | | -17.0 | |
| BC Pavilion Corporation | | | 49 | | | | 250 | | | | 383 | | | | 383 | | | | 382 | | | | 381 | | | | 389 | | | | 376 | | | | 374 | | | | 371 | | | | 378 | | | | 375 | | | | 20.3 | |
| Homeowner Protection Office | | | 144 | | | | - | | | | - | | | | - | | | | - | | | | - | | | | - | | | | - | | | | - | | | | - | | | | - | | | | - | | | | n/a | |
| Provincial government general capital | | | 294 | | | | 570 | | | | 808 | | | | 1,073 | | | | 1,372 | | | | 1,698 | | | | 1,987 | | | | 2,288 | | | | 2,718 | | | | 2,363 | | | | 3,133 | | | | 3,702 | | | | 25.9 | |
| Social Housing | | | 305 | | | | 511 | | | | 674 | | | | 658 | | | | 719 | | | | 715 | | | | 760 | | | | 695 | | | | 878 | | | | 844 | | | | 1,027 | | | | 1,832 | | | | 17.7 | |
| Other | | | 36 | | | | 81 | | | | 54 | | | | 40 | | | | 34 | | | | 27 | | | | 26 | | | | 28 | | | | 27 | | | | 24 | | | | 35 | | | | 56 | | | | 4.1 | |
| | | | 1,117 | | | | 1,759 | | | | 2,317 | | | | 2,517 | | | | 2,947 | | | | 3,235 | | | | 3,466 | | | | 3,604 | | | | 4,158 | | | | 3,672 | | | | 4,618 | | | | 6,002 | | | | 16.5 | |
| Total other taxpayer-supported debt | | | 22,609 | | | | 24,857 | | | | 26,846 | | | | 28,774 | | | | 30,845 | | | | 32,600 | | | | 34,685 | | | | 36,855 | | | | 42,451 | | | | 42,681 | | | | 46,229 | | | | 51,004 | | | | 7.7 | |
| Total taxpayer-supported debt | | | 29,968 | | | | 31,821 | | | | 34,659 | | | | 38,182 | | | | 41,068 | | | | 41,880 | | | | 42,719 | | | | 41,499 | | | | 43,607 | | | | 42,681 | | | | 46,229 | | | | 59,750 | | | | 6.5 | |
| Self-supported debt: | | | | | | | | | | | | | | | | | | | | | | | | | | | | | | | | | | | | | | | | | | | | | | | | | | | | |
| Commercial Crown corporations and agencies | | | | | | | | | | | | | | | | | | | | | | | | | | | | | | | | | | | | | | | | | | | | | | | | | | | | |
| BC Hydro | | | 10,792 | | | | 11,710 | | | | 12,978 | | | | 14,167 | | | | 15,559 | | | | 16,544 | | | | 17,929 | | | | 19,685 | | | | 19,990 | | | | 22,064 | | | | 23,238 | | | | 24,650 | | | | 7.8 | |
| BC Liquor Distribution Branch | | | - | | | | - | | | | - | | | | - | | | | - | | | | - | | | | - | | | | - | | | | - | | | | | | | | 210 | | | | 233 | | | | 11.0 | |
| BC Lottery Corporation | | | 60 | | | | 85 | | | | 90 | | | | 132 | | | | 155 | | | | 140 | | | | 150 | | | | 145 | | | | 155 | | | | 100 | | | | 233 | | | | 228 | | | | 12.9 | |
| BC Transmission Corporation | | | 70 | | | | - | | | | - | | | | - | | | | - | | | | - | | | | - | | | | - | | | | - | | | | - | | | | - | | | | - | | | | n/a | |
| Columbia Power Corporation | | | - | | | | - | | | | - | | | | - | | | | - | | | | 300 | | | | 296 | | | | 291 | | | | 286 | | | | 282 | | | | 276 | | | | 271 | | | | -1.4 | |
| Columbia Basin power projects | | | 196 | | | | 183 | | | | 481 | | | | 475 | | | | 470 | | | | 464 | | | | 459 | | | | 448 | | | | 433 | | | | 418 | | | | 1,387 | | | | 1,349 | | | | 19.2 | |
| Post-secondary institutions’ subsidiaries | | | 220 | | | | 173 | | | | 173 | | | | 215 | | | | 198 | | | | 222 | | | | 310 | | | | 340 | | | | 418 | | | | 387 | | | | 504 | | | | 520 | | | | 8.1 | |
| Transportation Investment Corp. | | | 544 | | | | 1,148 | | | | 1,779 | | | | 2,610 | | | | 3,209 | | | | 3,335 | | | | 3,355 | | | | 3,398 | | | | - | | | | - | | | | - | | | | - | | | | n/a | |
| Other | | | 35 | | | | 34 | | | | 33 | | | | 35 | | | | 34 | | | | 35 | | | | 33 | | | | 31 | | | | 30 | | | | 30 | | | | 84 | | | | 99 | | | | 9.9 | |
| | | | 11,917 | | | | 13,333 | | | | 15,534 | | | | 17,634 | | | | 19,625 | | | | 21,040 | | | | 22,532 | | | | 24,338 | | | | 21,312 | | | | 23,281 | | | | 25,932 | | | | 27,350 | | | | 7.8 | |
| Warehouse borrowing program | | | - | | | | - | | | | - | | | | - | | | | - | | | | - | | | | - | | | | - | | | | - | | | | - | | | | - | | | | - | | | | | |
| Total self-supported debt | | | 11,917 | | | | 13,333 | | | | 15,534 | | | | 17,634 | | | | 19,625 | | | | 21,040 | | | | 22,532 | | | | 24,338 | | | | 21,312 | | | | 23,281 | | | | 25,932 | | | | 27,350 | | | | 7.8 | |
| Total provincial debt | | | 41,885 | | | | 45,154 | | | | 50,193 | | | | 55,816 | | | | 60,693 | | | | 62,920 | | | | 65,251 | | | | 65,837 | | | | 64,919 | | | | 65,962 | | | | 72,161 | | | | 87,100 | | | | 6.9 | |
| 106 | 2021 Financial and Economic Review – July 2021 | |
| | | |
Appendix 2 – Financial Review Supplementary Tables
Table A2.11 Provincial Debt Supplementary Information – 2009/1 to 2020/21
| | | | | | | | | | | | | | | | | | | | | | | | | | | | | | | | | | | | | | | Average | |
| | | Actual | | | Actual | | | Actual | | | Actual | | | Actual | | | Actual | | | Actual | | | Actual | | | Actual | | | Actual | | | Actual | | | Actual | | | annual | |
| ($ millions) | | 2009/10 | | | 2010/11 | | | 2011/12 | | | 2012/13 | | | 2013/14 | | | 2014/15 | | | 2015/16 | | | 2016/17 | | | 2017/18 | | | 2018/19 | | | 2019/20 | | | 2020/21 | | | change | |
| | | | | | | | | | | | | | | | | | | | | | | | | | | | | | | | | | | | | | | (per cent) | |
| Per cent of Nominal GDP: 1 | | | | | | | | | | | | | | | | | | | | | | | | | | | | | | | | | | | | | | | |
| Taxpayer-supported debt: | | | | | | | | | | | | | | | | | | | | | | | | | | | | | | | | | | | | | | | | | | | | | | | | | | | |
| Provincial government direct operating | | | 3.7 | | | | 3.4 | | | | 3.6 | | | | 4.2 | | | | 4.4 | | | | 3.8 | | | | 3.2 | | | | 1.8 | | | | 0.4 | | | | - | | | | - | | | | 3.0 | | | -2.0 | |
| Education facilities | | | 4.8 | | | | 4.9 | | | | 4.8 | | | | 5.0 | | | | 5.0 | | | | 5.0 | | | | 5.1 | | | | 5.1 | | | | 5.0 | | | | 4.8 | | | | 5.0 | | | | 5.7 | | | 1.5 | |
| Health facilities | | | 2.2 | | | | 2.4 | | | | 2.4 | | | | 2.5 | | | | 2.6 | | | | 2.7 | | | | 2.8 | | | | 2.9 | | | | 2.8 | | | | 2.7 | | | | 2.8 | | | | 3.2 | | | 3.3 | |
| Highways, ferries and public transit | | | 3.8 | | | | 3.9 | | | | 4.0 | | | | 4.2 | | | | 4.4 | | | | 4.4 | | | | 4.6 | | | | 4.6 | | | | 5.7 | | | | 5.7 | | | | 5.7 | | | | 6.4 | | | 4.8 | |
| Other | | | 0.6 | | | | 0.9 | | | | 1.1 | | | | 1.1 | | | | 1.3 | | | | 1.3 | | | | 1.4 | | | | 1.4 | | | | 1.5 | | | | 1.2 | | | | 1.5 | | | | 2.0 | | | 12.4 | |
| Total taxpayer-supported debt | | | 15.1 | | | | 15.4 | | | | 15.8 | | | | 17.1 | | | | 17.8 | | | | 17.2 | | | | 17.0 | | | | 15.7 | | | | 15.4 | | | | 14.4 | | | | 15.0 | | | | 20.2 | | | 2.7 | |
| Self-supported debt: | | | | | | | | | | | | | | | | | | | | | | | | | | | | | | | | | | | | | | | | | | | | | | | | | | | |
| Commercial Crown corporations & agencies | | | 6.0 | | | | 6.4 | | | | 7.1 | | | | 7.9 | | | | 8.5 | | | | 8.6 | | | | 9.0 | | | | 9.2 | | | | 7.6 | | | | 7.9 | | | | 8.4 | | | | 9.3 | | | 4.0 | |
| Total self-supported debt | | | 6.0 | | | | 6.4 | | | | 7.1 | | | | 7.9 | | | | 8.5 | | | | 8.6 | | | | 9.0 | | | | 9.2 | | | | 7.6 | | | | 7.9 | | | | 8.4 | | | | 9.3 | | | 4.0 | |
| Total provincial debt | | | 21.1 | | | | 21.8 | | | | 22.9 | | | | 25.0 | | | | 26.3 | | | | 25.8 | | | | 26.0 | | | | 24.9 | | | | 23.0 | | | | 22.3 | | | | 23.3 | | | | 29.5 | | | 3.1 | |
| Growth rates: | | | | | | | | | | | | | | | | | | | | | | | | | | | | | | | | | | | | | | | | | | | | | | | | | | | |
| Taxpayer-supported debt: | | | | | | | | | | | | | | | | | | | | | | | | | | | | | | | | | | | | | | | | | | | | | | | | | | | |
| Provincial government direct operating | | | 28.1 | | | | -5.4 | | | | 12.2 | | | | 20.4 | | | | 8.7 | | | | -9.2 | | | | -13.4 | | | | -42.2 | | | | -75.1 | | | | -100.0 | | | | - | | | | n/a | | | n/a | |
| Education facilities | | | 5.1 | | | | 5.3 | | | | 4.8 | | | | 5.2 | | | | 4.4 | | | | 4.2 | | | | 5.3 | | | | 5.4 | | | | 5.8 | | | | 0.3 | | | | 8.2 | | | | 9.2 | | | n/a | |
| Health facilities | | | 11.5 | | | | 11.5 | | | | 8.1 | | | | 7.5 | | | | 6.1 | | | | 8.0 | | | | 7.3 | | | | 7.9 | | | | 4.6 | | | | 0.8 | | | | 6.8 | | | | 10.0 | | | n/a | |
| Highways, ferries and public transit | | | 9.8 | | | | 7.9 | | | | 6.8 | | | | 9.0 | | | | 8.6 | | | | 4.8 | | | | 6.8 | | | | 6.9 | | | | 32.0 | | | | 3.8 | | | | 5.3 | | | | 6.4 | | | n/a | |
| Other | | | 47.4 | | | | 57.5 | | | | 31.7 | | | | 8.6 | | | | 17.1 | | | | 9.8 | | | | 7.1 | | | | 4.0 | | | | 15.4 | | | | -11.7 | | | | 25.8 | | | | 30.0 | | | n/a | |
| Total taxpayer-supported debt | | | 13.5 | | | | 6.2 | | | | 8.9 | | | | 10.2 | | | | 7.6 | | | | 2.0 | | | | 2.0 | | | | -2.9 | | | | 5.1 | | | | -2.1 | | | | 8.3 | | | | 29.2 | | | n/a | |
| Self-supported debt: | | | | | | | | | | | | | | | | | | | | | | | | | | | | | | | | | | | | | | | | | | | | | | | | | | | |
| Commercial Crown corporations & agencies | | | 25.0 | | | | 11.9 | | | | 16.5 | | | | 13.5 | | | | 11.3 | | | | 7.2 | | | | 7.1 | | | | 8.0 | | | | -12.4 | | | | 9.2 | | | | 11.4 | | | | 5.5 | | | n/a | |
| Warehouse borrowing program | | | -100.0 | | | | - | | | | - | | | | - | | | | - | | | | - | | | | - | | | | - | | | | - | | | | - | | | | - | | | | - | | | n/a | |
| Total self-supported debt | | | 2.6 | | | | 11.9 | | | | 16.5 | | | | 13.5 | | | | 11.3 | | | | 7.2 | | | | 7.1 | | | | 8.0 | | | | -12.4 | | | | 9.2 | | | | 11.4 | | | | 5.5 | | | n/a | |
| Total provincial debt | | | 10.2 | | | | 7.8 | | | | 11.2 | | | | 11.2 | | | | 8.7 | | | | 3.7 | | | | 3.7 | | | | 0.9 | | | | -1.4 | | | | 1.6 | | | | 9.4 | | | | 20.7 | | | n/a | |
| Per capita: 2 | | | | | | | | | | | | | | | | | | | | | | | | | | | | | | | | | | | | | | | | | | | | | | | | | | | |
| Taxpayer-supported debt: | | | | | | | | | | | | | | | | | | | | | | | | | | | | | | | | | | | | | | | | | | | | | | | | | | | |
| Provincial government direct operating | | | 1,669 | | | | 1,559 | | | | 1,735 | | | | 2,060 | | | | 2,208 | | | | 1,971 | | | | 1,682 | | | | 956 | | | | 235 | | | | - | | | | - | | | | 1,699 | | | 0.2 | |
| Education facilities | | | 2,177 | | | | 2,264 | | | | 2,353 | | | | 2,440 | | | | 2,512 | | | | 2,574 | | | | 2,672 | | | | 2,769 | | | | 2,888 | | | | 2,849 | | | | 3,034 | | | | 3,275 | | | 3.8 | |
| Health facilities | | | 995 | | | | 1,096 | | | | 1,176 | | | | 1,246 | | | | 1,304 | | | | 1,386 | | | | 1,465 | | | | 1,554 | | | | 1,603 | | | | 1,590 | | | | 1,671 | | | | 1,818 | | | 5.6 | |
| Highways, ferries and public transit | | | 1,701 | | | | 1,813 | | | | 1,920 | | | | 2,063 | | | | 2,209 | | | | 2,278 | | | | 2,399 | | | | 2,519 | | | | 3,277 | | | | 3,346 | | | | 3,469 | | | | 3,649 | | | 7.2 | |
| Other | | | 253 | | | | 394 | | | | 515 | | | | 551 | | | | 636 | | | | 687 | | | | 726 | | | | 742 | | | | 844 | | | | 733 | | | | 907 | | | | 1,166 | | | 14.9 | |
| Total taxpayer-supported debt | | | 6,795 | | | | 7,126 | | | | 7,698 | | | | 8,361 | | | | 8,870 | | | | 8,897 | | | | 8,944 | | | | 8,540 | | | | 8,846 | | | | 8,518 | | | | 9,081 | | | | 11,607 | | | 5.0 | |
| Self-supported debt: | | | | | | | | | | | | | | | | | | | | | | | | | | | | | | | | | | | | | | | | | | | | | | | | | | | |
| Commercial Crown corporations & agencies | | | 2,702 | | | | 2,986 | | | | 3,450 | | | | 3,861 | | | | 4,239 | | | | 4,470 | | | | 4,717 | | | | 5,009 | | | | 4,323 | | | | 4,646 | | | | 5,094 | | | | 5,313 | | | 6.3 | |
| Warehouse borrowing program | | | - | | | | - | | | | - | | | | - | | | | - | | | | - | | | | - | | | | - | | | | - | | | | - | | | | - | | | | - | | | n/a | |
| Total self-supported debt | | | 2,702 | | | | 2,986 | | | | 3,450 | | | | 3,861 | | | | 4,239 | | | | 4,470 | | | | 4,717 | | | | 5,009 | | | | 4,323 | | | | 4,646 | | | | 5,094 | | | | 5,313 | | | 6.3 | |
| Total provincial debt | | | 9,497 | | | | 10,112 | | | | 11,149 | | | | 12,222 | | | | 13,108 | | | | 13,367 | | | | 13,661 | | | | 13,549 | | | | 13,170 | | | | 13,165 | | | | 14,174 | | | | 16,920 | | | 5.4 | |
| Real Per Capita Provincial Debt (2020 $) 3 | | | 11,196 | | | | 11,764 | | | | 12,670 | | | | 13,737 | | | | 14,746 | | | | 14,885 | | | | 15,048 | | | | 14,656 | | | | 13,949 | | | | 13,575 | | | | 14,282 | | | | 16,920 | | | 3.8 | |
| Growth rate (per cent) | | | 8.7 | | | | 5.1 | | | | 7.7 | | | | 8.4 | | | | 7.3 | | | | 0.9 | | | | 1.1 | | | | -2.6 | | | | -4.8 | | | | -2.7 | | | | 5.2 | | | | 18.5 | | | 7.1 | |
| 1 | Debt as a per cent of GDP is calculated using GDP for the calendar year ending in the fiscal year (e.g. 2020/21 debt divided by GDP for the 2020 calendar year). As nominal GDP for the calendar year ending in 2020 is not available, the 2020 GDP projected in the April 2021 budget has been used for the fiscal year ended March 31, 2021 for demonstration purposes. Totals may not add due to rounding. |
| 2 | Per capita debt is calculated using July 1 population (e.g. 2020/21 debt divided by population on July 1, 2020). Totals may not add due to rounding. |
| 3 | Debt is converted to real (inflation-adjusted) terms using the consumer price index (CPI) for the corresponding calendar year (e.g. 2020 CPI for 2020/21 debt). |
| | 2021 Financial and Economic Review – July 2021 | 107 |
| | | |
Appendix 2 – Financial Review Supplementary Tables
Table A2.12 Key Provincial Debt Indicators – 2009/10 to 2020/21 1
| | | | | | | | | | | | | | | | | | | | | | | | | | | | | | | | | | | | | | | Average | |
| | | Actual | | | Actual | | | Actual | | | Actual | | | Actual | | | Actual | | | Actual | | | Actual | | | Actual | | | Actual | | | Actual | | | Actual | | | annual | |
| | | 2009/10 | | | 2010/11 | | | 2011/12 | | | 2012/13 | | | 2013/14 | | | 2014/15 | | | 2015/16 | | | 2016/17 | | | 2017/18 | | | 2018/19 | | | 2019/20 | | | 2020/21 | | | change | |
| | | | | | | | | | | | | | | | | | | | | | | | | | | | | | | | | | | | | | | (per cent) | |
| Debt to revenue (per cent) | | | | | | | | | | | | | | | | | | | | | | | | | | | | | | | | | | | | | | | | | | | | | | | | | | | |
| Total provincial | | | 86.5 | | | | 88.5 | | | | 94.7 | | | | 104.1 | | | | 107.8 | | | | 106.6 | | | | 105.9 | | | | 99.3 | | | | 94.7 | | | | 89.5 | | | | 95.9 | | | | 115.1 | | | 2.6 | |
| Taxpayer-supported | | | 82.6 | | | | 78.8 | | | | 85.1 | | | | 93.6 | | | | 96.4 | | | | 94.1 | | | | 91.3 | | | | 81.8 | | | | 82.5 | | | | 75.0 | | | | 80.6 | | | | 101.2 | | | 1.9 | |
| Debt per capita ($) 2 | | | | | | | | | | | | | | | | | | | | | | | | | | | | | | | | | | | | | | | | | | | | | | | | | | | |
| Total provincial | | | 9,497 | | | | 10,112 | | | | 11,149 | | | | 12,222 | | | | 13,108 | | | | 13,367 | | | | 13,661 | | | | 13,549 | | | | 13,171 | | | | 13,166 | | | | 14,174 | | | | 16,919 | | | 5.4 | |
| Taxpayer-supported | | | 6,795 | | | | 7,126 | | | | 7,698 | | | | 8,361 | | | | 8,870 | | | | 8,897 | | | | 8,944 | | | | 8,540 | | | | 8,847 | | | | 8,519 | | | | 9,081 | | | | 11,606 | | | 5.0 | |
| Debt to nominal GDP (per cent) 3 | | | | | | | | | | | | | | | | | | | | | | | | | | | | | | | | | | | | | | | | | | | | | | | | | | | |
| Total provincial | | | 21.1 | | | | 21.8 | | | | 22.9 | | | | 25.0 | | | | 26.3 | | | | 25.8 | | | | 26.0 | | | | 24.9 | | | | 23.0 | | | | 22.3 | | | | 23.3 | | | | 29.5 | | | 3.1 | |
| Taxpayer-supported | | | 15.1 | | | | 15.4 | | | | 15.8 | | | | 17.1 | | | | 17.8 | | | | 17.2 | | | | 17.0 | | | | 15.7 | | | | 15.4 | | | | 14.4 | | | | 15.0 | | | | 20.2 | | | 2.7 | |
| Interest bite (cents per dollar of revenue) 4 | | | | | | | | | | | | | | | | | | | | | | | | | | | | | | | | | | | | | | | | | | | | | | | | | | | |
| Total provincial | | | 4.6 | | | | 4.2 | | | | 4.3 | | | | 4.4 | | | | 4.3 | | | | 4.3 | | | | 4.7 | | | | 3.8 | | | | 4.0 | | | | 3.8 | | | | 3.8 | | | | 3.7 | | | -1.8 | |
| Taxpayer-supported | | | 4.2 | | | | 4.0 | | | | 4.0 | | | | 3.9 | | | | 3.7 | | | | 3.7 | | | | 4.1 | | | | 3.2 | | | | 3.3 | | | | 3.2 | | | | 3.1 | | | | 3.1 | | | -2.8 | |
| Interest costs ($ millions) | | | | | | | | | | | | | | | | | | | | | | | | | | | | | | | | | | | | | | | | | | | | | | | | | | | |
| Total provincial | | | 2,205 | | | | 2,155 | | | | 2,300 | | | | 2,339 | | | | 2,444 | | | | 2,525 | | | | 2,919 | | | | 2,521 | | | | 2,759 | | | | 2,786 | | | | 2,872 | | | | 2,817 | | | 2.3 | |
| Taxpayer-supported | | | 1,534 | | | | 1,596 | | | | 1,625 | | | | 1,600 | | | | 1,583 | | | | 1,651 | | | | 1,932 | | | | 1,644 | | | | 1,725 | | | | 1,793 | | | | 1,807 | | | | 1,832 | | | 1.6 | |
| Interest rate (per cent) 5 | | | | | | | | | | | | | | | | | | | | | | | | | | | | | | | | | | | | | | | | | | | | | | | | | | | |
| Taxpayer-supported | | | 5.4 | | | | 5.2 | | | | 4.9 | | | | 4.4 | | | | 4.0 | | | | 4.0 | | | | 4.6 | | | | 3.9 | | | | 4.1 | | | | 4.2 | | | | 4.0 | | | | 3.5 | | | -3.9 | |
| Revenue Factor for Key Indicators ($ millions) | | | | | | | | | | | | | | | | | | | | | | | | | | | | | | | | | | | | | | | | | | | | | | | | | | | |
| Total provincial 6 | | | 48,438 | | | | 51,041 | | | | 53,001 | | | | 53,637 | | | | 56,279 | | | | 59,018 | | | | 61,589 | | | | 66,334 | | | | 68,551 | | | | 73,734 | | | | 75,283 | | | | 75,691 | | | 4.1 | |
| Taxpayer-supported 7 | | | 36,272 | | | | 40,391 | | | | 40,742 | | | | 40,775 | | | | 42,611 | | | | 44,514 | | | | 46,805 | | | | 50,726 | | | | 52,866 | | | | 56,881 | | | | 57,386 | | | | 59,033 | | | 4.5 | |
| Debt ($ millions) | | | | | | | | | | | | | | | | | | | | | | | | | | | | | | | | | | | | | | | | | | | | | | | | | | | |
| Total provincial | | | 41,885 | | | | 45,154 | | | | 50,193 | | | | 55,816 | | | | 60,693 | | | | 62,920 | | | | 65,251 | | | | 65,837 | | | | 64,919 | | | | 65,962 | | | | 72,161 | | | | 87,100 | | | 6.9 | |
| Taxpayer-supported 8 | | | 29,968 | | | | 31,821 | | | | 34,659 | | | | 38,182 | | | | 41,068 | | | | 41,880 | | | | 42,719 | | | | 41,499 | | | | 43,607 | | | | 42,681 | | | | 46,229 | | | | 59,750 | | | 6.5 | |
| Provincial nominal GDP ($ millions) 9 | | | 198,179 | | | | 206,990 | | | | 218,771 | | | | 223,328 | | | | 230,981 | | | | 243,872 | | | | 250,784 | | | | 263,912 | | | | 282,283 | | | | 296,135 | | | | 309,059 | | | | 295,282 | | | 3.7 | |
| Population (thousands at July 1)10 | | | 4,411 | | | | 4,466 | | | | 4,502 | | | | 4,567 | | | | 4,630 | | | | 4,707 | | | | 4,776 | | | | 4,859 | | | | 4,929 | | | | 5,010 | | | | 5,091 | | | | 5,148 | | | 1.4 | |
| 1 | Figures for prior years have been restated to conform with the presentation used for 2020/21 and to include the effects of changes in underlying data and statistics. |
| 2 | The ratio of debt to population (e.g. 2020/21 debt divided by population at July 1, 2020). |
| 3 | The ratio of debt outstanding at fiscal year end to provincial nominal gross domestic product (GDP) for the calendar year ending in the fiscal year (e.g.2020/21 debt divided by 2020 nominal GDP). As nominal GDP for the calendar year ending is not available, the 2020 GDP projected in the April 2021 budget has been used for the fiscal year ended March 31, 2021 for demonstration purposes. |
| 4 | The ratio of interest costs (less sinking fund interest) to revenue. Figures include capitalized interest expense in order to provide a more comparable measure to outstanding debt. |
| 5 | Weighted average of all outstanding debt issues. |
| 6 | Includes revenue of the consolidated revenue fund (excluding dividends from enterprises) plus revenue of all government organizations and enterprises. |
| 7 | Excludes revenue of government enterprises, but includes dividends from enterprises paid to the consolidated revenue fund. |
| 8 | Excludes debt of commercial Crown corporations and agencies and funds held under the province’s warehouse borrowing program. |
| 9 | Nominal GDP for the calendar year ending in the fiscal year (e.g. Nominal GDP for 2020 is used for the fiscal year ended March 31, 2021). As nominal GDP for the calendar year ending 2020 is not available, the 2020 GDP projected in the April 2021 budget has been used for the fiscal year ended March 31, 2021 for demonstration purposes. |
| 10 | Population at July 1st within the fiscal year (e.g. population at July 1, 2020 is used for the fiscal year ended March 31, 2021). |
| 108 | 2021 Financial and Economic Review – July 2021 | |
| | | |
Appendix 2 – Financial Review Supplementary Tables
Table A2.13 Historical Operating Statement Surplus (Deficit)
| | | | | | Crown | | | | | | | | | | | | Surplus | |
| | | | | | Corporations | | | | | | | | | | | | (Deficit) as | |
| | | Consolidated Revenue Fund | | | and | | | SUCH | | | Other | | | Surplus | | | a Per Cent | |
| ($ millions) | | Revenue | | | Expenditure | | | Balance | | | Agencies | | | Sector | | | Adjustments | | | (Deficit) 1 | | | of GDP | |
| 1969/70 | | | 1,248 | | | | 1,244 | | | | 4 | | | | - | | | | - | | | | - | | | | - | | | | 0.0 | |
| 1970/71 | | | 1,373 | | | | 1,274 | | | | 99 | | | | - | | | | - | | | | - | | | | - | | | | 1.0 | |
| 1971/72 | | | 1,558 | | | | 1,474 | | | | 84 | | | | - | | | | - | | | | - | | | | - | | | | 0.8 | |
| 1972/73 | | | 1,772 | | | | 1,675 | | | | 97 | | | | - | | | | - | | | | - | | | | - | | | | 0.8 | |
| 1973/74 | | | 2,217 | | | | 2,071 | | | | 146 | | | | - | | | | - | | | | - | | | | - | | | | 0.9 | |
| 1974/75 | | | 2,769 | | | | 2,779 | | | | (10 | ) | | | - | | | | - | | | | - | | | | - | | | | (0.1 | ) |
| 1975/76 | | | 3,124 | | | | 3,534 | | | | (410 | ) | | | - | | | | - | | | | - | | | | - | | | | (2.1 | ) |
| 1976/77 | | | 3,785 | | | | 3,691 | | | | 94 | | | | - | | | | - | | | | - | | | | - | | | | 0.4 | |
| 1977/78 | | | 4,372 | | | | 4,168 | | | | 204 | | | | - | | | | - | | | | - | | | | - | | | | 0.8 | |
| 1978/79 | | | 4,853 | | | | 4,582 | | | | 271 | | | | - | | | | - | | | | - | | | | - | | | | 0.9 | |
| 1979/80 1 | | | 5,860 | | | | 5,318 | | | | 542 | | | | (88 | ) | | | - | | | | - | | | | 454 | | | | 1.3 | |
| 1980/81 | | | 5,982 | | | | 6,239 | | | | (257 | ) | | | 45 | | | | - | | | | - | | | | (212 | ) | | | (0.5 | ) |
| 1981/82 | | | 7,139 | | | | 7,323 | | | | (184 | ) | | | 43 | | | | - | | | | - | | | | (141 | ) | | | (0.3 | ) |
| 1982/83 | | | 7,678 | | | | 8,662 | | | | (984 | ) | | | (257 | ) | | | - | | | | - | | | | (1,241 | ) | | | (2.7 | ) |
| 1983/84 | | | 8,335 | | | | 9,347 | | | | (1,012 | ) | | | 49 | | | | - | | | | - | | | | (963 | ) | | | (2.0 | ) |
| 1984/85 | | | 8,807 | | | | 9,801 | | | | (994 | ) | | | 172 | | | | - | | | | - | | | | (822 | ) | | | (1.6 | ) |
| 1985/86 | | | 9,160 | | | | 10,127 | | | | (967 | ) | | | 110 | | | | - | | | | - | | | | (857 | ) | | | (1.5 | ) |
| 1986/87 | | | 9,463 | | | | 10,624 | | | | (1,161 | ) | | | 526 | | | | - | | | | - | | | | (635 | ) | | | (1.1 | ) |
| 1987/88 | | | 11,007 | | | | 11,055 | | | | (48 | ) | | | 119 | | | | - | | | | - | | | | 71 | | | | 0.1 | |
| 1988/89 | | | 12,570 | | | | 11,834 | | | | 736 | | | | 194 | | | | - | | | | - | | | | 930 | | | | 1.3 | |
| 1989/90 | | | 13,656 | | | | 13,200 | | | | 456 | | | | 40 | | | | - | | | | - | | | | 496 | | | | 0.6 | |
| 1990/91 | | | 14,236 | | | | 15,010 | | | | (774 | ) | | | 107 | | | | - | | | | - | | | | (667 | ) | | | (0.8 | ) |
| 1991/92 | | | 14,570 | | | | 17,101 | | | | (2,531 | ) | | | 192 | | | | - | | | | - | | | | (2,339 | ) | | | (2.8 | ) |
| 1992/93 | | | 16,172 | | | | 17,858 | | | | (1,686 | ) | | | 210 | | | | - | | | | - | | | | (1,476 | ) | | | (1.6 | ) |
| 1993/94 | | | 17,923 | | | | 18,833 | | | | (910 | ) | | | 11 | | | | - | | | | - | | | | (899 | ) | | | (0.9 | ) |
| 1994/95 | | | 19,506 | | | | 19,953 | | | | (447 | ) | | | 219 | | | | - | | | | - | | | | (228 | ) | | | (0.2 | ) |
| 1995/96 | | | 19,698 | | | | 20,054 | | | | (356 | ) | | | 38 | | | | - | | | | - | | | | (318 | ) | | | (0.3 | ) |
| 1996/97 | | | 20,126 | | | | 20,241 | | | | (115 | ) | | | (270 | ) | | | - | | | | - | | | | (385 | ) | | | (0.3 | ) |
| 1997/98 | | | 20,216 | | | | 20,368 | | | | (152 | ) | | | (258 | ) | | | - | | | | - | | | | (410 | ) | | | (0.3 | ) |
| 1998/99 | | | 20,312 | | | | 20,526 | | | | (214 | ) | | | (689 | ) | | | (55 | ) | | | - | | | | (958 | ) | | | (0.8 | ) |
| 1999/2000 | | | 21,836 | | | | 22,157 | | | | (321 | ) | | | 345 | | | | (40 | ) | | | - | | | | (16 | ) | | | 0.0 | |
| 2000/01 | | | 23,948 | | | | 22,671 | | | | 1,277 | | | | (171 | ) | | | 138 | | | | (52 | ) 3 | | | 1,192 | | | | 0.9 | |
| 2001/02 | | | 22,987 | | | | 24,977 | | | | (1,990 | ) 2 | | | (711 | ) 2 | | | 180 | | | | 1,464 | 3 | | | (1,057 | ) | | | (0.8 | ) |
| 2002/03 | | | 22,205 | | | | 25,164 | | | | (2,959 | ) | | | (216 | ) | | | 526 | | | | - | | | | (2,649 | ) | | | (1.8 | ) |
| 2003/04 | | | 23,408 | | | | 25,477 | | | | (2,069 | ) | | | 347 | | | | 369 | | | | - | | | | (1,353 | ) | | | (0.9 | ) |
| 2004/05 | | | 27,562 | | | | 26,306 | | | | 1,256 | | | | 1,035 | | | | 393 | | | | - | | | | 2,684 | | | | 1.6 | |
| 2005/06 | | | 29,711 | | | | 27,174 | | | | 2,537 | | | | 550 | | | | 594 | | | | (710 | ) 4 | | | 2,971 | | | | 1.7 | |
| 2006/07 | | | 31,506 | | | | 28,506 | | | | 3,000 | | | | 841 | | | | 404 | | | | (264 | ) 4 | | | 3,981 | | | | 2.1 | |
| 2007/08 | | | 32,317 | | | | 30,565 | | | | 1,752 | | | | 995 | | | | 442 | | | | (444 | ) 4,5 | | | 2,745 | | | | 1.4 | |
| 2008/09 | | | 30,926 | | | | 32,032 | | | | (1,106 | ) | | | 975 | | | | 185 | | | | 18 | 4,5 | | | 72 | | | | 0.0 | |
| 2009/10 | | | 29,133 | | | | 32,273 | | | | (3,140 | ) | | | 803 | | | | 524 | | | | - | | | | (1,813 | ) | | | (0.9 | ) |
| 2010/11 | | | 32,807 | | | | 33,577 | | | | (770 | ) | | | (219 | ) | | | 742 | | | | - | | | | (247 | ) | | | (0.1 | ) |
| 2011/12 | | | 33,269 | | | | 34,590 | | | | (1,321 | ) | | | 239 | | | | 839 | | | | (1,599 | ) 6 | | | (1,842 | ) | | | (0.8 | ) |
| 2012/13 | | | 33,363 | | | | 35,120 | | | | (1,757 | ) | | | 95 | | | | 514 | | | | - | | | | (1,148 | ) | | | (0.5 | ) |
| 2013/14 | | | 34,657 | | | | 34,891 | | | | (234 | ) | | | 155 | | | | 392 | | | | - | | | | 313 | | | | 0.1 | |
| 2014/15 | | | 36,802 | | | | 36,058 | | | | 744 | | | | 199 | | | | 716 | | | | - | | | | 1,659 | | | | 0.7 | |
| 2015/16 | | | 38,313 | | | | 37,717 | | | | 596 | | | | (621 | ) | | | 794 | | | | - | | | | 769 | | | | 0.3 | |
| 2016/17 | | | 41,850 | | | | 39,664 | | | | 2,186 | | | | (168 | ) | | | 747 | | | | - | | | | 2,765 | | | | 1.0 | |
| 2017/18 | | | 43,659 | | | | 45,733 | | | | (2,074 | ) | | | 1,270 | | | | 1,117 | | | | - | | | | 313 | | | | 0.1 | |
| 2018/19 | | | 47,104 | | | | 45,157 | | | | 1,947 | | | | (1,289 | ) | | | 873 | | | | - | | | | 1,531 | | | | 0.5 | |
| 2019/20 | | | 46,746 | | | | 47,820 | | | | (1,074 | ) | | | (416 | ) | | | 1,168 | | | | - | | | | (322 | ) | | | (0.1 | ) |
| 2020/21 | | | 48,317 | | | | 57,882 | | | | (9,565 | ) | | | 1,847 | | | | 2,250 | | | | - | | | | (5,468 | ) | | | (1.9 | ) |
| 1 | The provincial government began publishing summary financial statements in 1979/80. Figures for prior years are unavailable. For 1969/70 to 1978/79, the CRF balance is used in place of the summary accounts surplus/(deficit). |
| 2 | Does not include the $256 million transfer to the CRF for the wind-up of Forest Renewal BC and Fisheries Renewal BC. |
| 3 | Impact of move to joint trusteeship for public service pension plans. |
| 4 | Negotiating framework incentive payments. |
| 5 | Climate Action Dividend. |
| 6 | One-time HST transition repayment. |
| | 2021 Financial and Economic Review – July 2021 | 109 |
| | | |
Appendix 2 – Financial Review Supplementary Tables
Table A2.14 Historical Provincial Debt Summary 1
| | | Taxpayer-Supported Debt | | | | | | | | | | | | Taxpayer- | |
| | | Provincial | | | Education | | | Health | | | | | | | | | Total | | | | | | | | | Total Debt | | | Supported | |
| | | Government | | | Facilities | | | Facilities | | | Highways, | | | | | | Taxpayer- | | | Self- | | | Total | | | as a | | | Debt | |
| | | Direct | | | Capital | | | Capital | | | Ferries and | | | | | | Supported | | | Supported | | | Provincial | | | Per Cent | | | as a Per | |
| Year | | Operating | | | Financing | | | Financing | | | Public Transit | | | Other 2 | | | Debt | | | Debt 3 | | | Debt | | | of GDP | | | Cent of GDP | |
| | | | | | | | | | | | | | | | | | | | | | | | | | | | | | | |
| | | ($ millions) | | | (per cent) | |
| 1969/70 | | | - | | | | 338 | | | | 42 | | | | 142 | | | | 100 | | | | 622 | | | | 1,661 | | | | 2,283 | | | | 24.7 | | | | 6.7 | |
| 1970/71 | | | - | | | | 362 | | | | 64 | | | | 172 | | | | 99 | | | | 697 | | | | 1,808 | | | | 2,505 | | | | 25.6 | | | | 7.1 | |
| 1971/72 | | | - | | | | 380 | | | | 85 | | | | 233 | | | | 95 | | | | 793 | | | | 1,948 | | | | 2,741 | | | | 24.9 | | | | 7.2 | |
| 1972/73 | | | - | | | | 408 | | | | 105 | | | | 288 | | | | 87 | | | | 888 | | | | 2,062 | | | | 2,950 | | | | 23.8 | | | | 7.2 | |
| 1973/74 | | | - | | | | 425 | | | | 117 | | | | 340 | | | | 145 | | | | 1,027 | | | | 2,228 | | | | 3,255 | | | | 21.1 | | | | 6.7 | |
| 1974/75 | | | - | | | | 485 | | | | 133 | | | | 386 | | | | 149 | | | | 1,153 | | | | 2,650 | | | | 3,803 | | | | 21.3 | | | | 6.5 | |
| 1975/76 | | | - | | | | 557 | | | | 178 | | | | 544 | | | | 145 | | | | 1,424 | | | | 3,144 | | | | 4,568 | | | | 23.1 | | | | 7.2 | |
| 1976/77 | | | 261 | | | | 658 | | | | 236 | | | | 649 | | | | 188 | | | | 1,992 | | | | 3,787 | | | | 5,779 | | | | 24.4 | | | | 8.4 | |
| 1977/78 | | | 261 | | | | 710 | | | | 291 | | | | 656 | | | | 215 | | | | 2,133 | | | | 4,464 | | | | 6,597 | | | | 24.9 | | | | 8.1 | |
| 1978/79 | | | 261 | | | | 778 | | | | 334 | | | | 653 | | | | 91 | | | | 2,117 | | | | 4,838 | | | | 6,955 | | | | 23.3 | | | | 7.1 | |
| 1979/80 | | | 235 | | | | 836 | | | | 401 | | | | 730 | | | | 195 | | | | 2,397 | | | | 5,704 | | | | 8,101 | | | | 23.3 | | | | 6.9 | |
| 1980/81 | | | 209 | | | | 919 | | | | 461 | | | | 729 | | | | 270 | | | | 2,588 | | | | 5,956 | | | | 8,544 | | | | 21.6 | | | | 6.5 | |
| 1981/82 | | | 183 | | | | 1,067 | | | | 561 | | | | 844 | | | | 291 | | | | 2,946 | | | | 7,227 | | | | 10,173 | | | | 21.8 | | | | 6.3 | |
| 1982/83 | | | 883 | | | | 1,204 | | | | 660 | | | | 1,024 | | | | 894 | | | | 4,665 | | | | 7,692 | | | | 12,357 | | | | 26.5 | | | | 10.0 | |
| 1983/84 | | | 1,596 | | | | 1,321 | | | | 712 | | | | 1,392 | | | | 1,174 | | | | 6,195 | | | | 8,440 | | | | 14,635 | | | | 29.7 | | | | 12.6 | |
| 1984/85 | | | 2,476 | | | | 1,308 | | | | 717 | | | | 691 | | | | 1,276 | | | | 6,468 | | | | 9,082 | | | | 15,550 | | | | 30.0 | | | | 12.5 | |
| 1985/86 | | | 3,197 | | | | 1,276 | | | | 680 | | | | 1,034 | | | | 1,376 | | | | 7,563 | | | | 8,990 | | | | 16,553 | | | | 29.7 | | | | 13.6 | |
| 1986/87 | | | 4,802 | | | | 1,268 | | | | 681 | | | | 1,097 | | | | 812 | | | | 8,660 | | | | 8,485 | | | | 17,145 | | | | 29.1 | | | | 14.7 | |
| 1987/88 | | | 5,017 | | | | 1,278 | | | | 716 | | | | 1,192 | | | | 660 | | | | 8,863 | | | | 8,149 | | | | 17,012 | | | | 26.1 | | | | 13.6 | |
| 1988/89 | | | 4,919 | | | | 1,322 | | | | 763 | | | | 1,213 | | | | 842 | | | | 9,059 | | | | 7,396 | | | | 16,455 | | | | 22.8 | | | | 12.6 | |
| 1989/90 | | | 4,209 | | | | 1,367 | | | | 837 | | | | 1,244 | | | | 1,262 | | | | 8,919 | | | | 7,340 | | | | 16,259 | | | | 20.7 | | | | 11.4 | |
| 1990/91 | | | 4,726 | | | | 1,565 | | | | 959 | | | | 1,287 | | | | 1,281 | | | | 9,818 | | | | 7,444 | | | | 17,262 | | | | 21.0 | | | | 11.9 | |
| 1991/92 | | | 6,611 | | | | 1,939 | | | | 1,040 | | | | 1,527 | | | | 1,431 | | | | 12,548 | | | | 7,493 | | | | 20,041 | | | | 23.6 | | | | 14.8 | |
| 1992/93 | | | 8,969 | | | | 2,426 | | | | 1,141 | | | | 1,719 | | | | 1,641 | | | | 15,896 | | | | 7,526 | | | | 23,422 | | | | 25.9 | | | | 17.6 | |
| 1993/94 | | | 10,257 | | | | 3,054 | | | | 1,181 | | | | 1,862 | | | | 1,627 | | | | 17,981 | | | | 7,946 | | | | 25,927 | | | | 26.7 | | | | 18.5 | |
| 1994/95 | | | 10,181 | | | | 3,631 | | | | 1,318 | | | | 2,158 | | | | 1,749 | | | | 19,037 | | | | 8,013 | | | | 27,050 | | | | 26.1 | | | | 18.4 | |
| 1995/96 | | | 10,237 | | | | 3,990 | | | | 1,399 | | | | 2,598 | | | | 1,695 | | | | 19,919 | | | | 8,847 | | | | 28,766 | | | | 26.3 | | | | 18.2 | |
| 1996/97 | | | 11,030 | | | | 4,230 | | | | 1,431 | | | | 3,144 | | | | 1,440 | | | | 21,275 | | | | 8,096 | | | | 29,371 | | | | 26.1 | | | | 18.9 | |
| 1997/98 | | | 11,488 | | | | 4,352 | | | | 1,417 | | | | 3,463 | | | | 1,431 | | | | 22,151 | | | | 8,204 | | | | 30,355 | | | | 25.6 | | | | 18.7 | |
| 1998/99 | | | 11,707 | | | | 5,023 | | | | 1,494 | | | | 3,678 | | | | 1,330 | | | | 23,232 | | | | 8,910 | | | | 32,142 | | | | 26.8 | | | | 19.4 | |
| 1999/2000 | | | 13,295 | | | | 5,429 | | | | 1,679 | | | | 3,527 | | | | 1,276 | | | | 25,206 | | | | 9,232 | | | | 34,438 | | | | 27.4 | | | | 20.1 | |
| 2000/01 | | | 11,578 | | | | 5,737 | | | | 2,028 | | | | 4,234 | | | | 1,527 | | | | 25,104 | | | | 8,684 | | | | 33,788 | | | | 24.8 | | | | 18.4 | |
| 2001/02 | | | 13,319 | | | | 6,118 | | | | 2,186 | | | | 4,685 | | | | 1,196 | | | | 27,504 | | | | 8,578 | | | | 36,082 | | | | 26.0 | | | | 19.8 | |
| 2002/03 | | | 14,957 | | | | 6,394 | | | | 2,265 | | | | 4,835 | | | | 919 | | | | 29,370 | | | | 7,487 | | | | 36,857 | | | | 25.6 | | | | 20.4 | |
| 2003/04 | | | 15,180 | | | | 6,829 | | | | 2,343 | | | | 4,931 | | | | 717 | | | | 30,000 | | | | 7,775 | | | | 37,775 | | | | 24.9 | | | | 19.7 | |
| 2004/05 | | | 13,969 | | | | 7,122 | | | | 2,253 | | | | 4,644 | | | | 660 | | | | 28,648 | | | | 7,221 | | | | 35,869 | | | | 21.8 | | | | 17.4 | |
| 2005/06 | | | 11,343 | | | | 7,612 | | | | 2,635 | | | | 4,883 | | | | 742 | | | | 27,215 | | | | 7,242 | | | | 34,457 | | | | 19.4 | | | | 15.4 | |
| 2006/07 | | | 8,889 | | | | 8,026 | | | | 3,053 | | | | 5,436 | | | | 533 | | | | 25,937 | | | | 7,502 | | | | 33,439 | | | | 17.6 | | | | 13.6 | |
| 2007/08 | | | 7,604 | | | | 8,638 | | | | 3,511 | | | | 6,143 | | | | 653 | | | | 26,549 | | | | 8,088 | | | | 34,637 | | | | 17.3 | | | | 13.2 | |
| 2008/09 | | | 5,744 | | | | 9,133 | | | | 3,936 | | | | 6,831 | | | | 758 | | | | 26,402 | | | | 11,612 | | | | 38,014 | | | | 18.4 | | | | 12.8 | |
| 2009/10 | | | 7,359 | | | | 9,601 | | | | 4,389 | | | | 7,502 | | | | 1,117 | | | | 29,968 | | | | 11,917 | | | | 41,885 | | | | 21.1 | | | | 15.1 | |
| 2010/11 | | | 6,964 | | | | 10,108 | | | | 4,895 | | | | 8,095 | | | | 1,759 | | | | 31,821 | | | | 13,333 | | | | 45,154 | | | | 21.8 | | | | 15.4 | |
| 2011/12 | | | 7,813 | | | | 10,592 | | | | 5,293 | | | | 8,644 | | | | 2,317 | | | | 34,659 | | | | 15,534 | | | | 50,193 | | | | 22.9 | | | | 15.8 | |
| 2012/13 | | | 9,408 | | | | 11,145 | | | | 5,691 | | | | 9,421 | | | | 2,517 | | | | 38,182 | | | | 17,634 | | | | 55,816 | | | | 25.0 | | | | 17.1 | |
| 2013/14 | | | 10,223 | | | | 11,631 | | | | 6,038 | | | | 10,229 | | | | 2,947 | | | | 41,068 | | | | 19,625 | | | | 60,693 | | | | 26.3 | | | | 17.8 | |
| 2014/15 | | | 9,280 | | | | 12,118 | | | | 6,522 | | | | 10,725 | | | | 3,235 | | | | 41,880 | | | | 21,040 | | | | 62,920 | | | | 25.8 | | | | 17.2 | |
| 2015/16 | | | 8,034 | | | | 12,764 | | | | 6,998 | | | | 11,457 | | | | 3,466 | | | | 42,719 | | | | 22,532 | | | | 65,251 | | | | 26.0 | | | | 17.0 | |
| 2016/17 | | | 4,644 | | | | 13,457 | | | | 7,552 | | | | 12,242 | | | | 3,604 | | | | 41,499 | | | | 24,338 | | | | 65,837 | | | | 24.9 | | | | 15.7 | |
| 2017/18 | | | 1,156 | | | | 14,236 | | | | 7,903 | | | | 16,154 | | | | 4,158 | | | | 43,607 | | | | 21,312 | | | | 64,919 | | | | 23.0 | | | | 15.4 | |
| 2018/19 | | | - | | | | 14,274 | | | | 7,968 | | | | 16,767 | | | | 3,672 | | | | 42,681 | | | | 23,281 | | | | 65,962 | | | | 22.3 | | | | 14.4 | |
| 2019/20 | | | - | | | | 15,445 | | | | 8,507 | | | | 17,659 | | | | 4,618 | | | | 46,229 | | | | 25,932 | | | | 72,161 | | | | 23.3 | | | | 15.0 | |
| 2020/21 | | | 8,746 | | | | 16,861 | | | | 9,359 | | | | 18,782 | | | | 6,002 | | | | 59,750 | | | | 27,350 | | | | 87,100 | | | | 29.5 | | | | 20.2 | |
| 1 | Provincial debt is prepared in accordance with Generally Accepted Accounting Principles and presented consistent with the Debt Summary Report included in the Public Accounts. Debt is shown net of sinking funds and unamortized discounts, excludes accrued interest, and includes non-guaranteed debt directly incurred by commercial Crown corporations and debt guaranteed by the Province. |
| 2 | Includes BC Buildings, BC Housing Management Commission, Provincial Rental Housing Corporation, other taxpayer-supported Crown agencies, and loan guarantee provisions. |
| 3 | Includes commercial Crown corporations and agencies and funds held under the province’s warehouse borrowing program. |
| 110 | 2021 Financial and Economic Review – July 2021 | |
| | | |
