Exhibit 99.4


Second Quarterly Report
2021/22 Financial Update,
Economic Outlook
&
Six Month Financial Results
April - September 2021

| British Columbia Cataloguing in Publication Data British Columbia. Ministry of Finance. Quarterly report on the economy, fiscal situation and Crown corporations. — ongoing– Quarterly. Title on cover: Quarterly report. Continues: British Columbia. Ministry of Finance. Quarterly financial report. ISSN 0833-1375. ISSN 1192-2176 — Quarterly Report on the economy, fiscal situation and Crown corporations. 1. Finance, Public — British Columbia — Accounting — Periodicals. 2. British Columbia — Economic conditions — 1945– —Periodicals.* 3. Corporations, Government — British Columbia — Accounting — Periodicals. I. Title. HJ13.B77 354.711’007231’05 | |
2021/22 Second Quarterly Report November 22, 2021 | | TABLE OF CONTENTS |
| Part One — Updated Financial Forecast | |
| | |
| | Introduction | 3 |
| | | |
| | Revenue | 5 |
| | | |
| | Expense | 8 |
| | | Consolidated Revenue Fund (CRF) Spending | 8 |
| | | Service Delivery Agency Spending | 10 |
| | | | |
| | Full-Time Equivalents for the BC Public Service | 10 |
| | | |
| | Provincial Capital Spending | 11 |
| | | Projects Over $50 Million | 12 |
| | | | |
| | Provincial Debt | 13 |
| | | |
| | Risks to the Fiscal Forecast | 15 |
| | | |
| | COVID-19 Pandemic Response Measures | 16 |
| | | |
| | Supplementary Schedules | 19 |
| | | |
| | Tables: | | |
| | | 1.1 | Forecast Update | 3 |
| | | 1.2 | Financial Forecast Changes | 4 |
| | | 1.3 | Pandemic and Recovery Contingencies | 9 |
| | | 1.4 | Capital Spending Update | 11 |
| | | 1.5 | Provincial Debt Update | 13 |
| | | 1.6 | Operating Statement | 19 |
| | | 1.7 | Revenue by Source | 20 |
| | | 1.8 | Expense by Ministry, Program and Agency | 21 |
| | | 1.9 | Expense by Function | 22 |
| | | 1.10 | Capital Spending | 23 |
| | | 1.11 | Capital Expenditure Projects Greater Than $50 million | 24 |
| | | 1.12 | Provincial Debt | 27 |
| | | 1.13 | Statement of Financial Position | 28 |
| | | 1.14 | Material Assumptions – Revenue | 29 |
| | | 1.15 | Material Assumptions – Expense | 35 |
| | | 1.16 | Full-Time Equivalents (FTEs) | 38 |
| | SECOND QUARTERLY REPORT 2021/22 | | i |
TABLE OF CONTENTS
| Part Two — Economic Review and Outlook | |
| | |
| | Summary | 39 |
| | | |
| | British Columbia Economic Activity and Outlook | 40 |
| | | Labour Market | 40 |
| | | Consumer Spending and Housing | 42 |
| | | Inflation | 45 |
| | | Business | 45 |
| | | External Trade and Commodity Markets | 46 |
| | | Demographics | 47 |
| | | | |
| | Risks to the Economic Outlook | 47 |
| | | |
| | External Outlook | 48 |
| | | United States | 48 |
| | | Canada | 50 |
| | | Asia | 53 |
| | | Europe | 53 |
| | | | |
| | Financial Markets | 54 |
| | | Interest Rates | 54 |
| | | Exchange Rate | 55 |
| | | | |
| | Tables: | |
| | | 2.1 | British Columbia Economic Indicators | 40 |
| | | 2.2 | Private Sector Canadian Interest Rate Forecasts | 55 |
| | | 2.3 | Private Sector Exchange Rate Forecasts | 56 |
| | | | | |
| | Topic Box: | |
| | | Provincial Economic Accounts Update | 57 |
| ii | | SECOND QUARTERLY REPORT 2021/22 | |
PART 1 | UPDATED FINANCIAL FORECAST
Introduction
Table 1.1 2021/22 Forecast Update
| | | | | | First | | | Second | |
| | | Budget | | | Quarterly | | | Quarterly | |
| ($ millions) | | 2021 | | | Report | | | Report | |
| Revenue | | | 58,929 | | | | 65,154 | | | | 68,207 | |
| Expense | | | (64,377 | ) | | | (65,738 | ) | | | (65,689 | ) |
| Pandemic and Recovery Contingencies | | | (3,250 | ) | | | (3,250 | ) | | | (3,250 | ) |
| Forecast allowance | | | (1,000 | ) | | | (1,000 | ) | | | (1,000 | ) |
| Deficit | | | (9,698 | ) | | | (4,834 | ) | | | (1,732 | ) |
| Capital Spending: | | | | | | | | | | | | |
| Taxpayer-supported capital spending | | | 8,479 | | | | 8,166 | | | | 8,141 | |
| Self-supported capital spending | | | 4,976 | | | | 4,588 | | | | 4,582 | |
| | | | 13,455 | | | | 12,754 | | | | 12,723 | |
| Provincial Debt: | | | | | | | | | | | | |
| Taxpayer-supported debt | | | 71,642 | | | | 65,205 | | | | 62,348 | |
| Self-supported debt | | | 30,238 | | | | 29,649 | | | | 29,653 | |
| Total debt (including forecast allowance) | | | 102,880 | | | | 95,854 | | | | 93,001 | |
| Taxpayer-supported debt to GDP ratio | | | 22.8 | % | | | 19.6 | % | | | 18.2 | % |
| Taxpayer-supported debt to revenue ratio | | | 125.9 | % | | | 103.8 | % | | | 95.0 | % |
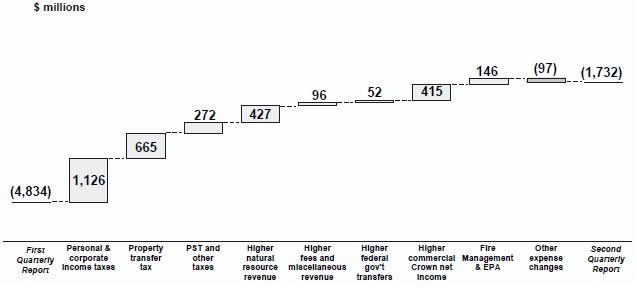
The Second Quarterly Report shows further improvements to the 2021/22 fiscal forecast, in addition to the changes reported in the First Quarterly Report in September. The reduction of the deficit forecast from $4.8 billion to $1.7 billion is mainly based on updated revenue forecasts incorporating year-to-date information.
The total change to the deficit projection from budget amounts to almost $8.0 billion, in line with changes reported in other Canadian jurisdictions. This follows the release of stronger 2020 economic data by Statistics Canada and improved economic activity during the year, as more data became available to better illuminate the pandemic impacts over the past year and a half.
The fiscal forecast reflects increases in most of the government’s revenue streams, including personal and corporate income taxes, sales taxes, and property transfer taxes. Higher revenues are also forecasted in natural resources from the mining and natural gas sectors, and Crown corporations’ net income.
It is unclear the extent to which the 2021/22 revenue improvements will carry forward, as there continues to be a high degree of uncertainty regarding the evolution of the pandemic and the path of the economic recovery, particularly for high-contact industries, which contributes to the potential volatility of future fiscal outlooks.
Expenses are lower by $49 million due to a lower forecast for fire management costs and lower debt-servicing costs, partly offset by higher expenses in other areas. (Note that spending projections in the Second Quarterly Report were finalized before the flooding events that have impacted several areas of British Columbia; updated expense forecasts will be included in the third quarterly report.)
Details of the revenue and expense forecast changes are shown in Table 1.2 and Chart 1.1.
(continued on page 5)
| | Second Quarterly Report 2021/22 | | 3 |
| | | |
Updated Financial Forecast
| Table 1.2 2021/22 Financial Forecast Changes | | | | | | | | | |
| | | | | | | | | | |
| | | ($ millions) | |
| 2021/22 deficit at Budget 2021 (April 20, 2021) | | (9,698) | | | | | | (9,698) | |
| 2021/22 deficit at the First Quarterly Report (September 13, 2021) | | | | | (4,834) | | | | |
| | | Q1 | | | Q2 | | | Total | |
| | | Update | | | Update | | | Changes | |
| Revenue changes: | | | | | | | | | | | | |
| Personal income tax – stronger preliminary 2020 tax assessment and an improvement in 2021 household income | | | 2,170 | | | | 912 | | | | 3,082 | |
| Corporate income tax – increase in installments reflecting an improved federal government outlook for 2021 national corporate taxable income, and a higher prior year settlement payment reflecting stronger 2020 tax assessments | | | 1,234 | | | | 214 | | | | 1,448 | |
| Provincial sales tax – higher year-to-date results, retail sales and consumer expenditures | | | 64 | | | | 200 | | | | 264 | |
| Property transfer tax – higher year-to-date activity reflecting strong housing market and demand | | | 360 | | | | 665 | | | | 1,025 | |
| Fuel and carbon taxes – higher volume sales in most fuel types | | | 94 | | | | 36 | | | | 130 | |
| Employer health tax – mainly expected improvement in employee compensation | | | 127 | | | | 35 | | | | 162 | |
| Other taxation sources – mainly lower insurance premium tax, reflecting the impacts of the 2020/21 Public Accounts, partly offset by higher property tax revenues | | | (23 | ) | | | 1 | | | | (22 | ) |
| Natural gas royalties – higher natural gas prices and natural gas liquids royalties, partly offset by increased utilization of royalty and infrastructure programs/credits | | | 172 | | | | 209 | | | | 381 | |
| Mining – higher coal and copper prices and changes in production and mining costs | | | 92 | | | | 242 | | | | 334 | |
| Electricity sales under the Columbia River Treaty – changes in Mid-C electricity prices | | | 149 | | | | (16 | ) | | | 133 | |
| Forests – higher stumpage rates partly offset by impacts of deferrals in old-growth forests | | | 230 | | | | (1 | ) | | | 229 | |
| Other natural resources – changes in water rentals and petroleum royalties, lower Oil and Gas Commission levies | | | 4 | | | | (7 | ) | | | (3 | ) |
| Fees, licences, investment earnings and miscellaneous revenue: | | | | | | | | | | | | |
| Post-secondary institutions | | | 126 | | | | 165 | | | | 291 | |
| Other sources – mainly higher revenue from motor vehicles fees, changes in health authorities and taxpayer-supported Crowns forecasts | | | 42 | | | | (69 | ) | | | (27 | ) |
| Canada health and social transfers – mainly additional pandemic relief one-time funding supporting the recovery of health care systems and a higher B.C. share of national population | | | 557 | | | | 38 | | | | 595 | |
| Other federal government transfers – higher transfers relating to the Canada-Wide Early Learning and Child Care Agreement and long term care as well as transfers to taxpayer-supported entities | | | 356 | | | | 14 | | | | 370 | |
| Commercial Crown corporation net income – mainly due to improvements in BCLC and ICBC | | | 471 | | | | 415 | | | | 886 | |
| Total revenue changes | | | 6,225 | | | | 3,053 | | | | 9,278 | |
| | | | | | | | | | | | | |
| Less : expense increases (decreases): | | | | | | | | | | | | |
| Consolidated Revenue Fund changes: | | | | | | | | | | | | |
| Statutory spending: | | | | | | | | | | | | |
| Fire management costs | | | 745 | | | | (169 | ) | | | 576 | |
| Emergency Program Act | | | 33 | | | | 23 | | | | 56 | |
| B.C. Recovery Benefit 1 | | | - | | | | 28 | | | | 28 | |
| Increased Employment Incentive tax credit 2 | | | - | | | | 9 | | | | 9 | |
| Other statutory spending | | | 52 | | | | (25 | ) | | | 27 | |
| Refundable tax credits – mainly reflects preliminary 2020 tax assessment information | | | 44 | | | | 17 | | | | 61 | |
| Management of public debt (net) | | | (31 | ) | | | (36 | ) | | | (67 | ) |
| Spending funded by third party recoveries: | | | | | | | | | | | | |
| Canada-Wide Early Learning and Child Care Agreement and health initiatives | | | 221 | | | | - | | | | 221 | |
| Other spending funded by third party recoveries | | | 27 | | | | 18 | | | | 45 | |
| Changes in spending profile of service delivery agencies: | | | | | | | | | | | | |
| School districts | | | 19 | | | | - | | | | 19 | |
| Universities | | | 162 | | | | 168 | | | | 330 | |
| Colleges | | | 28 | | | | 7 | | | | 35 | |
| Health authorities and hospital societies | | | 1,412 | | | | 756 | | | | 2,168 | |
| Other service delivery agencies 3 | | | 98 | | | | (93 | ) | | | 5 | |
| (Increase) decrease in transfers to service delivery agencies (elimination) | | | (1,449 | ) | | | (752 | ) | | | (2,201 | ) |
| Total expense changes | | | 1,361 | | | | (49 | ) | | | 1,312 | |
| | | | | | | | | | | | | |
| Total changes | | | 4,864 | | | | 3,102 | | | | 7,966 | |
| 2021/22 deficit at the First Quarterly Report | | | (4,834 | ) | | | | | | | | |
| 2021/22 deficit at the Second Quarterly Report | | | | | | | (1,732 | ) | | | (1,732 | ) |
| 1 | Total program spending for the B.C. Recovery Benefit is forecast at $62 million, however $34 million is included in the Pandemic and Recovery Contingencies. Spending in 2020/21 was $1.297 billion, bringing the total program spending to $1.359 billion. |
| 2 | Total program spending for the Increased Employment Incentive tax credit is forecast at $13 million, however $9 million is included in the Pandemic and Recovery Contingencies. |
| 3 | Includes BC Transportation Financing Authority, BC Transit, BC Housing Management Commission, Community Living BC, and other entities. |
| 4 | | Second Quarterly Report 2021/22 | |
| | | |
Updated Financial Forecast
Projected taxpayer-supported capital spending in 2021/22 is $8.141 billion, with minimal changes from the forecast in the First Quarterly Report. The self-supported capital spending forecast is $4.582 billion, which is $6 million lower than forecast in the First Quarterly Report.
As a result of higher revenues and lower deficit forecasts, taxpayer-supported debt at the end of 2021/22 is forecast at $62.3 billion, lower by $2.9 billion compared to the First Quarterly Report. The lower debt balance, combined with a restated GDP baseline reported by Statistics Canada, results in improved debt metrics. B.C.’s taxpayer-supported debt-to-GDP ratio is now forecast to be 18.2 per cent, with debt-to-revenue at 95 per cent.
Chart 1.1 2021/22 Deficit – Major Changes from the First Quarterly Report
Deficit decreased by $3.1 billion
Revenue
Revenue for 2021/22 is forecast to be $68.2 billion — $3.1 billion higher than the projection in the First Quarterly Report. The forecast for taxation revenues has increased $2.1 billion, accounting for more than two-thirds of the total improvement, reflecting higher than expected 2020 income tax assessments and strong year-to-date activity in retail sales and the housing market. The remaining $1.0 billion increase in the revenue forecast is mainly due to an improved outlook for commodity prices and higher expected net income from ICBC and BC Lottery Corporation.
Preliminary 2020 personal and corporate income tax assessments for all provinces, territories and Canada have been stronger than anticipated, resulting from higher-than-expected economic activity in 2020, as shown in the recently released Provincial Economic Accounts by Statistics Canada (see topic box beginning on page 57).
Detailed revenue projections are disclosed in Table 1.7, and key assumptions and sensitivities relating to revenue are provided in Table 1.14. An analysis on historical volatility of major economic drivers can be found in the 2021 B.C. Financial and Economic Review (pages 16-17).
| | Second Quarterly Report 2021/22 | | 5 |
| | | |
Updated Financial Forecast
For 2021/22, the major changes from the First Quarterly Report forecast include the following:
Income Taxation Revenues
The personal income tax revenue forecast is up $912 million reflecting stronger 2020 preliminary tax assessment information. These 2020 preliminary income tax assessment results show strong increases in earnings of high-income individuals from investments, capital gains and dividends. In addition, household income growth in 2020 was 7.0 per cent, compared to 5.5 per cent assumed in the First Quarterly Report. The increased revenue includes a one-time $548 million prior year adjustment relating to 2020/21 and a $364 million ongoing base impact beginning in 2021/22.
Corporate income tax revenue is up $214 million mainly due to an improvement in the prior year settlement payment, reflecting stronger assessments of the 2020 preliminary corporate income tax results. Growth in corporate net operating surplus (corporate profits) in 2020 was 19.1 per cent compared to a decline of 8.1 per cent assumed in the First Quarterly Report.
Employer health tax is up $35 million reflecting increases in year-to-date results.
Other Taxation Revenues
Provincial sales tax revenue is up $200 million mainly reflecting higher year-to-date taxable sales.
Property transfer tax revenue is up $665 million due to the strong housing market and demand with limited inventory. The revised forecast includes the 20-per-cent-foreign buyers’ tax revenue forecast at $105 million (unchanged from the First Quarterly Report).
Other taxation revenues are up $37 million mainly due to higher fuel tax revenue, reflecting higher year-to-date sales volumes on most fuel types.
Natural Resource Revenue
Revenue from natural gas royalties is up $209 million mainly due to higher prices for natural gas and natural gas liquids, partially offset by increased utilization of royalty program credits. The updated natural gas price forecast is $2.28 ($Cdn/gigajoule, plant inlet), up from the First Quarterly Report estimate ($1.79). Natural gas gross royalty rates are very sensitive to higher prices within the range of $1.20 and $2.60.
Revenue from coal, metals, minerals and other mining-related sources is up $242 million mainly due to higher year-to-date mineral tax instalment payments reflecting increased metallurgical coal prices attributable to strong global steel production, increased demand from China and higher mining tax rates as mine profitability improves.
Revenue from electricity sales under the Columbia River Treaty is down $16 million mainly due to lower Mid-C electricity prices reflecting reduced concerns regarding potential supply shortages in the western United States.
| 6 | | Second Quarterly Report 2021/22 | |
| | | |
Updated Financial Forecast
The impacts of the deferrals of harvesting in old-growth forests is expected to reduce revenue by $50 million. This is mainly offset by the effects of higher stumpage rates and logging taxes, resulting in a $1 million overall decline. Harvest volumes of Crown land timber are now forecast to be 42.5 million cubic metres, compared to 46 million cubic metres assumed in the First Quarterly Report. Total stumpage rates are now forecast to be $31.23 Cdn/cubic metre in 2021/22, compared to $29.21 assumed in the First Quarterly Report.
Revenue from other natural resources is down $7 million mainly due to reduced water rentals collected under the Water Sustainability Act.
Other Revenue
Other revenue consists of revenue from fees, licences, investment earnings and miscellaneous sources. These revenue sources are now expected to total $9.5 billion, up $96 million from the First Quarterly Report. The updated forecast for fee revenues totals $4.7 billion, down $16 million mainly due to lower projections from post-secondary institutions and health authorities. The revised forecast for investment earnings is $1.3 billion, up $47 million mainly due to higher investment returns in post-secondary institutions. The miscellaneous revenue outlook of $3.5 billion is up $65 million mainly due to higher revenue forecasts provided by post-secondary institutions.
Federal Government Transfers
Federal government contributions are expected to be $11.5 billion, up $52 million.
Canada health and social transfers have improved by $38 million, mainly due to an increased B.C. share of the national population. The changes to the estimates include $9 million related to 2020/21 and $29 million for 2021/22.
Other federal government contributions are up $14 million mainly reflecting higher transfers to post-secondary institutions.
Commercial Crown Corporations
The outlook for commercial Crown corporation net income is $415 million higher than the projections in the First Quarterly Report, mainly due to the following:
| · | ICBC’s operating results improved by $226 million due to higher investment income, in addition to lower claims and operating costs; and |
| · | BC Lottery Corporation’s net income forecast is $188 million higher (net of payments to the federal government and the gaming revenue sharing agreement with First Nations) due to casinos performing better than expected since pandemic restrictions were lifted. |
| | Second Quarterly Report 2021/22 | | 7 |
| | | |
Updated Financial Forecast
Expense
The Second Quarterly Report expense forecast for 2021/22 is $49 million lower than the First Quarterly Report mainly due to lower spending for wildfires and interest costs, partly offset by higher net spending by service delivery agencies.
Consolidated Revenue Fund (CRF) Spending
Statutory spending is projected to be $117 million lower than in the First Quarterly Report due to the following:
| · | $169 million decrease for fire management and preparedness costs — total spending forecast remains at a historic high of $712 million; |
| · | $23 million increase for Emergency Program Act expenses primarily related to wildfires and prior-year floods — total spending forecast of $92 million; |
| · | $28 million increase for the B.C. Recovery Benefit program — total spending forecast is $62 million, of which $34 million is funded through the Pandemic and Recovery Contingencies. The previous forecast for the program was $90 million; and |
| · | $1 million net increase in other statutory spending. |
Other changes in CRF spending is $36 million of forecasted savings in interest costs due to lower debt levels.
Contingencies
Budget 2021 includes a Contingencies vote of $4.25 billion in 2021/22, with $3.25 billion in the Pandemic and Recovery sub-vote, and $1.0 billion allocated to General Programs and CleanBC sub-votes. Contingencies are intended to help manage unexpected cost pressures and fund priority initiatives as they arise. These total allocations remain unchanged in the Second Quarterly Report.
Pandemic and Recovery Contingencies
Budget 2021 allocated $3.25 billion to support ongoing measures related to the pandemic and short-term funding initiatives or new programs where the demand and costs may fluctuate as the pandemic and related health orders continue to evolve. This section provides an update on the notional allocations of the Province’s pandemic measures as of September 30, 2021 (Table 1.3) as well as actual spending through the second quarter.
The total allocations to support pandemic and recovery initiatives remain unchanged at $3.25 billion; however the forecasts for various initiatives have been revised to reflect updated information available. Major changes in the forecast allocations include:
| · | $875 million increase to respond to the fourth wave of the pandemic including vaccine booster programs and preparation for child vaccines; and |
| · | $377 million decrease in various support measures to reflect lower than expected program uptake. These measures include the Increased Employment Incentive tax credit, B.C. Recovery Benefit and the COVID-19 Paid Sick Leave program. |
| 8 | | Second Quarterly Report 2021/22 | |
| | | |
Updated Financial Forecast
| Table 1.3 | 2021/22 Pandemic and Recovery Contingencies |
| $ millions | | Updated Forecast | |
| Category | | Measures | | Q1 | | | Q2 | |
| Health and | | Health related COVID-19 management | | | 900 | | | | 900 | |
| Safety | | Contingencies for additional health measures | | | - | | | | 875 | |
| | | Temporary housing, meals and supports for vulnerable | | | | | | | | |
| | | populations | | | 265 | | | | 265 | |
| | | Small and Medium Sized Business Recovery Grant Program | | | | | | | | |
| | | (including Circuit Breaker Business Relief Grant) | | | | | | | | |
| Supports for | | Tourism, Art and other sector supports | | | 130 | | | | 130 | |
| Businesses | | Increased Employment Incentive tax credit | | | 15 | | | | 4 | 1 |
| and People | | B.C. Recovery Benefit | | | 90 | | | | 34 | 2 |
| | | COVID-19 Paid Sick Leave | | | 325 | | | | 15 | |
| | | Childcare health & safety grants and K-12 Recovery Plan | | | 46 | | | | 46 | |
| | | Essential services including justice services, agriculture/food | | | | | | | | |
| | | security, and temporary assistance for vulnerable populations | | | 179 | | | | 129 | |
| | | Skills training and youth employment initiatives | | | 70 | | | | 70 | |
| Preparing for | | Community infrastructure programs and CleanBC recovery | | | | | | | | |
| Recovery | | investments | | | 70 | | | | 70 | |
| Unallocated | | Reserve for additional health or recovery measures | | | 690 | | | | 242 | |
| Total | | | | | 3,250 | | | | 3,250 | |
| 1 | Total program spending for the Increased Employment Incentive tax credit is forecast at $13 million, however $9 million is funded through statutory authority. |
| 2 | Total program spending for the B.C. Recovery Benefit is forecast at $62 million, however $28 million is funded through statutory authority. |
Actual expenditures in the first two quarters for Pandemic and Recovery Contingencies measures totalled $1.2 billion. This included:
| · | $570 million for ongoing health measures to respond to the COVID-19 pandemic; |
| · | $440 million for the Small and Medium Sized Business Grant Program, including the Circuit Breaker Grants, the Increased Employment Incentive, and the B.C. Recovery Benefit; and |
| · | $190 million across a number of other measures including the provision of COVID-19 related paid sick leave for workers, temporary housing, improving child care and K-12 health and safety, and initiatives to support the safe delivery of court services. |
Note that the actual year-to-date spending (April -September, 2021) is based on unaudited ministry reports and subject to normal changes from quarterly estimation and adjustment processes.
An overview and description of the Province’s COVID-19 pandemic response measures is provided starting on page 16.
| | Second Quarterly Report 2021/22 | | 9 |
| | | |
Updated Financial Forecast
Spending Recovered from Third Parties
Expenses funded by third parties are forecast to increase by $18 million mainly to reflect the increase in grants as a result of higher net income of the BC Lottery Corporation.
Operating Transfers to Service Delivery Agencies
Operating transfers to service delivery agencies are forecast to be $752 million higher than the First Quarterly Report mainly due to a $756 million increase in allocations to health organizations to fund additional expenses related to the COVID-19 pandemic. These funding increases are related to spending forecast changes noted below.
Service Delivery Agency Spending
Service delivery agency expenses are forecast to increase by $838 million in 2021/22 compared to the First Quarterly Report.
| · | Post-secondary sector expenses are forecast to increase by $175 million mainly due to higher operating costs to support increased student activities on campus, which are recovering to pre-pandemic levels. The higher spending is partially offset by external revenue sources. |
| · | The health authority and hospital society expense forecast is $756 million higher than the First Quarterly Report, better reflecting updated funding allocations from the province. The additional spending is related to COVID-19, primary care, the surgical and MRI strategy, mental health and addictions care, and the Health Career Access Program. |
| · | Other service delivery agency spending is forecast to be $93 million lower than the First Quarterly Report due to various updates across a number of agencies. |
Detailed expense projections are in Table 1.8. Key spending assumptions and sensitivities are provided in Table 1.15.
Full-Time Equivalents for the BC Public Service
The projection of full-time equivalent (FTE) staff utilization for 2021/22 remains unchanged from the First Quarterly Report at 33,400 FTEs.
| 10 | | Second Quarterly Report 2021/22 | |
| | | |
Updated Financial Forecast
Provincial Capital Spending
Capital spending is projected to total $12.7 billion in 2021/22 — $31 million lower than the forecast in the First Quarterly Report (see Tables 1.4 and 1.10).
| Table 1.4 | 2021/22 Capital Spending Update |
| | | ($ millions) | |
| | | Q1 | | | Q2 | | | Total | |
| | | Update | | | Update | | | Changes | |
| Taxpayer-supported capital spending at Budget 2021 | | | 8,479 | | | | | | | | 8,479 | |
| Taxpayer-supported capital spending at the First Quarterly Report | | | | | | | 8,166 | | | | | |
| Taxpayer-supported changes | | | | | | | | | | | | |
| School districts | | | (17 | ) | | | (5 | ) | | | (22 | ) |
| Post-secondary institutions | | | (213 | ) | | | (1 | ) | | | (214 | ) |
| Health sector | | | 97 | | | | 73 | | | | 170 | |
| Transportation sector | | | (206 | ) | | | (61 | ) | | | (267 | ) |
| Social housing | | | 29 | | | | (25 | ) | | | 4 | |
| Other net adjustments | | | (3 | ) | | | (6 | ) | | | (9 | ) |
| Total taxpayer-supported changes | | | (313 | ) | | | (25 | ) | | | (338 | ) |
| Taxpayer-supported capital spending - updated forecast | | | 8,166 | | | | 8,141 | | | | 8,141 | |
| Self-supported capital spending at Budget 2021 | | | 4,976 | | | | | | | | 4,976 | |
| Self-supported capital spending at the First Quarterly Report | | | | | | | 4,588 | | | | | |
| BC Hydro | | | (367 | ) | | | - | | | | (367 | ) |
| Liquor Distribution Branch | | | (18 | ) | | | (4 | ) | | | (22 | ) |
| Other net adjustments | | | (3 | ) | | | (2 | ) | | | (5 | ) |
| Total self-supported changes | | | (388 | ) | | | (6 | ) | | | (394 | ) |
| Self-supported capital spending - updated forecast | | | 4,588 | | | | 4,582 | | | | 4,582 | |
| 2021/22 total capital spending at the First Quarterly Report | | | 12,754 | | | | | | | | | |
| 2021/22 total capital spending at the Second Quarterly Report | | | | | | | 12,723 | | | | 12,723 | |
Taxpayer-supported capital spending is projected at $8.1 billion. The $25 million decrease since the First Quarterly Report is mainly due to changes in the timing of capital spending in the social housing and transportation sectors. This is partially offset by higher planned spending on health projects by health authorities compared to the First Quarterly Report.
At $4.6 billion, self-supported capital spending is $6 million lower than the First Quarterly Report, primarily due to changes in the timing of Liquor Distribution Branch expenditures.
These changes do not represent a reduction in capital spending; rather the spending has been shifted to future years within the capital plan.
| | Second Quarterly Report 2021/22 | | 11 |
| | | |
Updated Financial Forecast
Projects Over $50 Million
Capital spending on projects greater than $50 million is presented in Table 1.11. Two projects have been added to the table since the First Quarterly Report:
| · | Crosstown – Supportive Housing Fund project ($72 million); and |
| · | BC Hydro’s Natal – 60-138 kV switchyard upgrade project ($84 million). |
Since the First Quarterly Report, the Highway 1 widening and 216th Street Interchange project was completed and is no longer listed in the table.
Changes for existing projects since the First Quarterly Report include:
| · | 6585 Sussex Ave – Affordable Rental Housing project’s year of completion was amended from 2022 to 2021 to align with the revised project schedule; |
| · | Peace Region Electricity Supply (PRES) project’s anticipated total cost decreased from $220 million to $216 million primarily due to lower costs for completion of civil works; |
| · | Sperling substation (SPG) metalclad switchgear replacement project’s year of completion was amended from 2024 to 2025 to reflect delays in the site preparation work due to unexpected conditions; and |
| · | ICBC’s Enhanced Care Coverage Program project’s anticipated total cost decreased from $97 million to $93 million due to the reallocation of contingency funds from capital to expense based on the nature of the remaining work. |
| 12 | | Second Quarterly Report 2021/22 | |
| | | |
Updated Financial Forecast
Provincial Debt
The provincial debt, including a $1.0 billion forecast allowance, is projected to total $93 billion by the end of the fiscal year — $2.9 billion lower than the forecast in the First Quarterly Report.
| Table 1.5 2021/22 Provincial Debt Update 1 | | | | | | | | | |
| | ($ millions) |
| | | Q1 | | | Q2 | | | Total | |
| | | Update | | | Update | | | Changes | |
| Taxpayer-supported debt at Budget 2021 | | | 71,642 | | | | | | | | 71,642 | |
| Taxpayer supported debt at First Quarterly Report | | | | | | | 65,205 | | | | | |
| Taxpayer-supported changes: | | | | | | | | | | | | |
| Lower debt level from 2020/21 | | | (206 | ) | | | - | | | | (206 | ) |
| Annual deficit (before forecast allowance) | | | (4,864 | ) | | | (3,102 | ) | | | (7,966 | ) |
| Non-cash items | | | (55 | ) | | | 3 | | | | (52 | ) |
| Changes in cash balances 2 | | | (1,523 | ) | | | (67 | ) | | | (1,590 | ) |
| Changes in other working capital balances 3 | | | 524 | | | | 334 | | | | 858 | |
| Taxpayer-supported capital spending | | | (313 | ) | | | (25 | ) | | | (338 | ) |
| Total taxpayer-supported changes | | | (6,437 | ) | | | (2,857 | ) | | | (9,294 | ) |
| Taxpayer-supported debt - updated forecast | | | 65,205 | | | | 62,348 | | | | 62,348 | |
| Self-supported debt at Budget 2021 | | | 30,238 | | | | | | | | 30,238 | |
| Self-supported debt at the First Quarterly Report | | | - | | | | 29,649 | | | | | |
| Self-supported changes: | | | | | | | | | | | | |
| Lower debt level from 2020/21 | | | (174 | ) | | | - | | | | (174 | ) |
| Lower capital spending | | | (388 | ) | | | (6 | ) | | | (394 | ) |
| Changes in internal financing | | | (27 | ) | | | 10 | | | | (17 | ) |
| Total self-supported changes | | | (589 | ) | | | 4 | | | | (585 | ) |
| Self-supported debt - updated forecast | | | 29,649 | | | | 29,653 | | | | 29,653 | |
| Forecast Allowance - updated forecast | | | 1,000 | | | | 1,000 | | | | 1,000 | |
| 2021/22 provincial debt forecast at the First Quarterly Report | | | 95,854 | | | | | | | | | |
| 2021/22 provincial debt forecast at the Second Quarterly Report | | | | | | | 93,001 | | | | 93,001 | |
| 1 | Provincial debt is prepared in accordance with Generally Accepted Accounting Principles and presented consistent with the Debt Summary Report included in the Public Accounts. Debt is shown net of sinking funds and unamortized discounts, excludes accrued interest, and includes non-guaranteed debt directly incurred by commercial Crown corporations and debt guaranteed by the Province. |
| 2 | Reflects changes in cash balances at April 1, 2021 and includes all cash balances from the Consolidated Revenue Fund, School Districts, Universities, Colleges, Health Authorities, Hospital Societies and other taxpayer-supported agencies. |
| 3 | Changes in other working capital balances include changes in accounts receivables, accounts payable, accrued liabilities, deferred revenue, investments, restricted assets and other assets. |
Taxpayer-supported debt is forecast to be $62.3 billion at the end of 2021/22 — $2.9 billion lower than the forecast in the First Quarterly Report. The reduction is due to the change in operating results of $3.1 billion and $245 million net increase of cash and other working capital balances.
The lower debt forecast along with a higher GDP level has resulted in a 1.4 percentage point reduction in the taxpayer-supported debt-to-GDP ratio since the First Quarterly Report, now forecast to end the year at 18.2 per cent. The taxpayer-supported debt-to-revenue ratio is forecast to end the fiscal year at 95 per cent — 8.85 percentage points lower than forecast in the First Quarterly Report.
Self-supported debt is forecast to be $29.6 billion at the end of 2021/22, not materially different from the First Quarterly Report.
The forecast allowance of $1.0 billion remains unchanged to mirror the operating statement forecast allowance.
| | Second Quarterly Report 2021/22 | | 13 |
| | | |
Updated Financial Forecast
While the Province’s taxpayer-supported debt is expected to increase by $2.6 billion over the year, the B.C. government is able to borrow at low interest rates, with debt affordability remaining at levels that are lower than they have been historically, as shown on Chart 1.4 below.
Chart 1.4 Debt Affordability
Interest bite for Taxpayer-Supported Debt
(cents per dollar of revenue) 1

1 The ratio of interest costs (less sinking fund interest) to revenue. Figures include capitalized interest expense in order to provide a more comparable measure to outstanding debt.
Further details on provincial debt are shown in Table 1.12.
Total provincial debt is presented consistent with the Debt Summary Report included in the Public Accounts. Debt is shown net of sinking fund investments and unamortized discounts, excludes accrued interest, and includes non-guaranteed debt directly incurred by commercial Crown corporations and debt guaranteed by the Province.
The reconciliation between provincial debt and the financial statement debt is shown in Table 1.13.
| 14 | | Second Quarterly Report 2021/22 | |
| | | |
Updated Financial Forecast
Risks to the Fiscal Forecast
The major risks to the updated fiscal forecast are the emergence of COVID-19 variants of concern in B.C., Canada and among B.C.’s trading partners; delays in the vaccination rollouts among B.C.’s major trading partners; and the behaviour and confidence of individuals, consumers and businesses during BC’s Restart Plan. The uncertainty regarding the evolution of the pandemic as well as the path of economic recovery contributes to the volatility in the updated fiscal outlook.
It is not clear at this time whether the strength in the preliminary assessments of the 2020 income tax returns reflects changes in the timing of assessments by the Canada Revenue Agency, changes in the behaviour of taxpayers, or includes one-time effects. Personal and corporate income tax assessments for the 2020 tax year will not be finalized until March 2022. Property transfer tax and provincial sales tax revenues are impacted by the number of residential transactions, average home sale prices and the amount of taxable purchases of goods and services. Natural resource revenues are affected by international commodity prices and the health of B.C.’s major trading partners. The global COVID-19 pandemic continues to pose heightened risks to these and other factors affecting own source revenues, including net income of commercial Crown corporations.
Recently, the Supreme Court of B.C. issued a judgement ruling that the cumulative impacts of industrial development, authorized by the Province of British Columbia, infringed Blueberry River First Nations’ ability to exercise their Treaty 8 rights. The impact of this judgement on the Province’s economic and fiscal outlooks are uncertain at this point, as the process for permitting industrial development in the impacted area over the long term is still being negotiated.
The spending forecast contained in the fiscal plan is based on ministry and service delivery agency plans. Risks include the extent of the spread of the COVID-19 virus, in addition to changes in planning assumptions such as utilization or demand rates for government services in the health care, education, community social services sectors, as well as costs associated with fighting forest fires and responding to floods and other natural disasters.
Capital spending may be influenced by several factors including physical distancing on work sites, design development, procurement activity, weather, geotechnical conditions and interest rates. Risks associated with operating results and capital spending could also affect debt levels.
As a result of these uncertainties, the actual operating result, capital spending and debt figures may differ from the current forecast. Government will update the fiscal outlook in the third quarterly report.
The potential fiscal impacts from these risks may be partly offset by the Contingencies vote allocation and the forecast allowance.
| | Second Quarterly Report 2021/22 | | 15 |
| | | |
Updated Financial Forecast
COVID-19 Pandemic Response Measures
The following provides an overview of the Province’s pandemic response measures.
Health and Safety of British Columbians
COVID-19 Management ($1.8 billion): Funding for health related COVID-19 response measures includes:
| · | Storage, distribution, and administration of COVID-19 vaccines to British Columbians; |
| · | Population health measures such as contact tracing, flu immunization, laboratory testing and research costs, and a rural and remote response framework to ensure people in rural, remote, and Indigenous communities have access to critical health care during the pandemic; |
| · | Additional funding for long-term care and assisted living facilities, including addressing increased COVID-19 related costs, implementing single-site work orders to help prevent the spread of disease between facilities, and hiring of up to three full-time equivalent staff at each of the 584 facilities; and |
| · | Implementing the Hospital at Home model of care, which allows British Columbians to receive health services outside of a hospital; and other increased operating costs including personal protective equipment, continuing support for HealthLinkBC, overtime salary costs in the healthcare system, and additional human resources capacity for health authorities to respond to COVID-19. |
Supports for Businesses and People
Temporary housing, meals and health supports for vulnerable populations ($265 million): Spaces at hotels, motels and community centres are providing shelter to assist a range of people, including people experiencing homelessness, to self-isolate and follow health orders as well as receive food and support services. Nearly 2,200 leased spaces are currently secured at sites throughout B.C.’s health regions to enable safe physical distancing in homeless shelters and help people self-isolate, with close to 100 spaces in communities secured for women and children leaving violent or unstable situations.
Small and Medium Sized Business Recovery Grant (incl. Circuit Breaker Business Relief Grant) ($470 million): Funding to provide relief for businesses affected by the March 30, 2021 provincial health orders and to help position themselves for a strong recovery. The Small and Medium Sized Business Recovery Grant Program supported businesses to diversify their services and products, modify physical space, move online, or offset fixed costs. The Circuit Breaker Business Relief Grant provided funding to affected businesses to help offset expenses such as rent, insurance, employee wages, maintenance and utilities or other unexpected costs that resulted from the ‘circuit breaker’ restrictions. As of September 30, 2021 over 32,000 grants to businesses have been awarded through these programs in fiscal 2020/21 and 2021/22.
| 16 | | Second Quarterly Report 2021/22 | |
| | | |
Updated Financial Forecast
Tourism, Art and other sector supports ($130 million): Funding that helps to improve destinations by investing in tourism infrastructure, such as multi-use trails and wayfinding signage; supports for major anchor attractions and companies that service tourism attractions; funding to support the safe restart of fairs, festivals and events; and financial relief for B.C. Pavilion Corporation to maintain operations during prolonged closures and health restrictions on major events.
Increased Employment Incentive ($13 million): A refundable tax credit incentive to employers intended to help B.C. businesses that were affected by the COVID-19 pandemic to recover and help create good jobs for people. Employers were able to increase their payroll by hiring new employees, increasing the hours of existing employees, or giving existing employees a raise. As of September 30, 2021, over 2,100 applications have been approved, benefiting over 2,000 British Columbians.
B.C. Recovery Benefit ($62 million): A one-time tax-free payment of up to $1,000 for eligible families and single parents with annual household incomes under $175,000 and up to $500 for eligible individuals earning less than $87,500 annually. The benefit helped individuals and families, including those in receipt of income and disability assistance. The program closed on June 30, 2021 and nearly 2 million applications were approved, benefiting over 2.7 million British Columbians.
COVID-19 Paid Sick Leave ($15 million): Supports for workers to provide three days of paid sick leave related to COVID-19. The Province reimburses employers without an existing sick leave program up to $200 per day for each worker to cover costs. As of September 30, 2021, over 2,883 applications have been approved, benefiting over 7,212 British Columbians. The initial estimates for this program were done at a time of great uncertainty around the pandemic and the effectiveness of the vaccine campaign. The effectiveness of the vaccines and other response measures have resulted in a lower than anticipated demand for this program.
Childcare Health and Safety Grants and K-12 Recovery Plan ($46 million):
| · | Health and safety grants to child-care providers for increased cleaning supplies, personal protective equipment, or space enhancement to ensure child-care centres remain safe; and |
| · | Funding to support health and safety measures, First Nations and Métis students, mental health services, rapid response teams, and to address learning impacts on students in the K-12 sector. |
Other Essential Services ($129 million): Funding to ensure continuity of services includes:
| · | Continued supports for increased access to overdose prevention services and outreach teams, as well as enhanced drug checking services throughout B.C. |
| · | Funding to ensure income assistance to people impacted by the pandemic; |
| · | Justice sector initiatives to support the safe operations of courts through facilitating virtual court proceedings, electronic filing solutions and other system enhancements; and |
| · | Continued supports for food, agriculture and seafood sectors to safely access and accommodate temporary foreign workers. |
| | Second Quarterly Report 2021/22 | | 17 |
| | | |
Updated Financial Forecast
Preparing for Recovery
Skills Training and Youth Employment Initiatives ($70 million): Funding to support work-integrated learning, micro-credential training and short-term skills training programs to help re-train people to secure good-paying jobs and strengthen B.C.’s labour force. Funding also supports Indigenous people to gain new skills, transfer their training knowledge to other jobs, and participate in the labour market. Funding is also provided to create targeted employment opportunities for youth including: expansion of the Innovator Skills Initiative; the Recreation Sites and Trails B.C. youth program; the Clean Coast, Clean Waters program; and natural resource sector employment opportunities.
Community Infrastructure Programs and CleanBC Recovery Investments ($70 million): Funding to support CleanBC recovery investments and invest in community infrastructure, including The Centre for Innovation and Clean Energy and the B.C. Parks Infrastructure Investment and Campsite Expansion.
| 18 | | Second Quarterly Report 2021/22 | |
| | | |
Updated Financial Forecast
Supplementary Schedules
The following tables provide the financial results for the six months ended September 30, 2021 and the 2021/22 full-year forecast.
Table 1.6 2021/22 Operating Statement
| | | Year-to-Date to September 30 | | | Full Year | |
| | | 2021/22 | | | Actual | | | 2021/22 | | | Actual | |
| ($ millions) | | Budget | | | Actual | | | Variance | | | 2020/21 | | | Budget | | | Forecast | | | Variance | | | 2020/21 | |
| Revenue | | | 29,692 | | | | 33,818 | | | | 4,126 | | | | 29,144 | | | | 58,929 | | | | 68,207 | | | | 9,278 | | | | 62,156 | |
| Expense | | | (29,877 | ) | | | (31,453 | ) | | | (1,576 | ) | | | (29,570 | ) | | | (67,627 | ) | | | (68,939 | ) | | | (1,312 | ) | | | (67,624 | ) |
| Surplus (deficit) before forecast allowance | | | (185 | ) | | | 2,365 | | | | 2,550 | | | | (426 | ) | | | (8,698 | ) | | | (732 | ) | | | 7,966 | | | | (5,468 | ) |
| Forecast allowance | | | - | | | | - | | | | - | | | | - | | | | (1,000 | ) | | | (1,000 | ) | | | - | | | | - | |
| Surplus (deficit) | | | (185 | ) | | | 2,365 | | | | 2,550 | | | | (426 | ) | | | (9,698 | ) | | | (1,732 | ) | | | 7,966 | | | | (5,468 | ) |
| Accumulated surplus (deficit) beginning of the year | | | (38 | ) | | | 2,459 | | | | 2,497 | | | | 8,106 | | | | (38 | ) | | | 2,459 | | | | 2,497 | | | | 7,927 | |
| Accumulated surplus(deficit) before comprehensive income | | | (223 | ) | | | 4,824 | | | | 5,047 | | | | 7,680 | | | | (9,736 | ) | | | 727 | | | | 10,463 | | | | 2,459 | |
| | | | | | | | | | | | | | | | | | | | | | | | | | | | | | | | |
| Accumulated other comprehensive income from self-supported Crown agencies | | | 821 | | | | 958 | | | | 138 | | | | 808 | | | | 280 | | | | 975 | | | | 695 | | | | 748 | |
| Accumulated surplus (deficit) end of period | | | 598 | | | | 5,782 | | | | 5,185 | | | | 8,488 | | | | (9,456 | ) | | | 1,702 | | | | 11,158 | | | | 3,207 | |
| Second Quarterly Report 2021/22 | | 19 |
| | | |
Updated Financial Forecast
Table 1.7 2021/22 Revenue by Source
| | | Year-to-Date to September 30 | | | Full Year | |
| | | 2021/22 | | | Actual | | | 2021/22 | | | Actual | |
| ($ millions) | | Budget | | | Actual | | | Variance | | | 2020/21 | | | Budget | | | Forecast | | | Variance | | | 2020/21 | |
| Taxation | | | | | | | | | | | | | | | | | | | | | | | | | | | | | | | | |
| Personal income | | | 5,538 | | | | 6,476 | | | | 938 | | | | 5,342 | | | | 11,170 | | | | 14,252 | | | | 3,082 | | | | 11,118 | |
| Corporate income | | | 2,789 | | | | 3,105 | | | | 316 | | | | 2,934 | | | | 3,409 | | | | 4,857 | | | | 1,448 | | | | 4,805 | |
| Employer health | | | 965 | | | | 1,047 | | | | 82 | | | | 913 | | | | 1,923 | | | | 2,085 | | | | 162 | | | | 2,156 | |
| Sales 1 | | | 4,249 | | | | 4,387 | | | | 138 | | | | 3,684 | | | | 7,872 | | | | 8,136 | | | | 264 | | | | 7,694 | |
| Fuel | | | 491 | | | | 557 | | | | 66 | | | | 467 | | | | 983 | | | | 1,030 | | | | 47 | | | | 936 | |
| Carbon | | | 913 | | | | 943 | | | | 30 | | | | 727 | | | | 1,985 | | | | 2,068 | | | | 83 | | | | 1,683 | |
| Tobacco | | | 417 | | | | 411 | | | | (6 | ) | | | 411 | | | | 780 | | | | 780 | | | | - | | | | 711 | |
| Property | | | 1,472 | | | | 1,496 | | | | 24 | | | | 1,228 | | | | 2,970 | | | | 3,013 | | | | 43 | | | | 2,313 | |
| Property transfer | | | 1,177 | | | | 1,800 | | | | 623 | | | | 871 | | | | 1,975 | | | | 3,000 | | | | 1,025 | | | | 2,098 | |
| Insurance premium | | | 357 | | | | 321 | | | | (36 | ) | | | 330 | | | | 715 | | | | 650 | | | | (65 | ) | | | 652 | |
| | | | 18,368 | | | | 20,543 | | | | 2,175 | | | | 16,907 | | | | 33,782 | | | | 39,871 | | | | 6,089 | | | | 34,166 | |
| Natural resource | | | | | | | | | | | | | | | | | | | | | | | | | | | | | | | | |
| Natural gas royalties | | | 136 | | | | 197 | | | | 61 | | | | 46 | | | | 286 | | | | 667 | | | | 381 | | | | 196 | |
| Forests | | | 563 | | | | 806 | | | | 243 | | | | 388 | | | | 1,204 | | | | 1,433 | | | | 229 | | | | 1,304 | |
| Other natural resource revenues 2 | | | 532 | | | | 768 | | | | 236 | | | | 445 | | | | 1,042 | | | | 1,506 | | | | 464 | | | | 903 | |
| | | | 1,231 | | | | 1,771 | | | | 540 | | | | 879 | | | | 2,532 | | | | 3,606 | | | | 1,074 | | | | 2,403 | |
| Other revenue | | | | | | | | | | | | | | | | | | | | | | | | | | | | | | | | |
| Post-secondary education fees | | | 881 | | | | 968 | | | | 87 | | | | 849 | | | | 2,508 | | | | 2,544 | | | | 36 | | | | 2,418 | |
| Fees and licenses 3 | | | 1,012 | | | | 1,009 | | | | (3 | ) | | | 932 | | | | 2,129 | | | | 2,178 | | | | 49 | | | | 1,911 | |
| Investment earnings | | | 579 | | | | 580 | | | | 1 | | | | 616 | | | | 1,174 | | | | 1,283 | | | | 109 | | | | 1,264 | |
| Miscellaneous 4 | | | 1,618 | | | | 1,627 | | | | 9 | | | | 1,635 | | | | 3,409 | | | | 3,479 | | | | 70 | | | | 3,136 | |
| | | | 4,090 | | | | 4,184 | | | | 94 | | | | 4,032 | | | | 9,220 | | | | 9,484 | | | | 264 | | | | 8,729 | |
| | | | | | | | | | | | | | | | | | | | | | | | | | | | | | | | | |
| Contributions from the federal government | | | | | | | | | | | | | | | | | | | | | | | | | | | | | | | | |
| Health and social transfers | | | 3,970 | | | | 4,515 | | | | 545 | | | | 3,840 | | | | 7,939 | | | | 8,534 | | | | 595 | | | | 7,743 | |
| COVID-19 related funding | | | 152 | | | | 210 | | | | 58 | | | | 1,378 | | | | 175 | | | | 322 | | | | 147 | | | | 2,603 | |
| Other federal government contributions 5 | | | 953 | | | | 914 | | | | (39 | ) | | | 832 | | | | 2,416 | | | | 2,639 | | | | 223 | | | | 2,548 | |
| | | | 5,075 | | | | 5,639 | | | | 564 | | | | 6,050 | | | | 10,530 | | | | 11,495 | | | | 965 | | | | 12,894 | |
| Commercial Crown corporation net income | | | | | | | | | | | | | | | | | | | | | | | | | | | | | | | | |
| BC Hydro | | | 40 | | | | 43 | | | | 3 | | | | 10 | | | | 712 | | | | 689 | | | | (23 | ) | | | 688 | |
| Liquor Distribution Branch | | | 588 | | | | 616 | | | | 28 | | | | 613 | | | | 1,099 | | | | 1,124 | | | | 25 | | | | 1,161 | |
| BC Lottery Corporation 6 | | | 268 | | | | 525 | | | | 257 | | | | 186 | | | | 771 | | | | 1,095 | | | | 324 | | | | 420 | |
| ICBC 7 | | | (28 | ) | | | 444 | | | | 472 | | | | 383 | | | | 154 | | | | 697 | | | | 543 | | | | 1,528 | |
| Other 8 | | | 60 | | | | 53 | | | | (7 | ) | | | 84 | | | | 129 | | | | 146 | | | | 17 | | | | 167 | |
| | | | 928 | | | | 1,681 | | | | 753 | | | | 1,276 | | | | 2,865 | | | | 3,751 | | | | 886 | | | | 3,964 | |
| Total revenue | | | 29,692 | | | | 33,818 | | | | 4,126 | | | | 29,144 | | | | 58,929 | | | | 68,207 | | | | 9,278 | | | | 62,156 | |
| 1 | Includes provincial sales tax and social services tax/hotel room tax related to prior years. |
| 2 | Columbia River Treaty, other energy and minerals, water rental and other resources. |
| 3 | Healthcare-related, motor vehicle, and other fees. |
| 4 | Includes reimbursements for health care and other services provided to external agencies, and other recoveries. |
| 5 | Includes contributions for health, education, community development, housing and social service programs, and transportation projects. |
| 6 | Net of payments to the federal government and 2021/22 is also net of payments under the gaming revenue sharing agreement with First Nations. |
| 7 | Does not include non-controlling interest. |
| 8 | Includes Columbia Power Corporation, BC Railway Company, Columbia Basin power projects, and post-secondary institutions’ self-supported subsidiaries. |
| 20 | | Second Quarterly Report 2021/22 | |
| | | |
Updated Financial Forecast
Table 1.8 2021/22 Expense by Ministry, Program and Agency
| | | Year-to-Date to September 30 | | | Full Year | |
| | | 2021/22 | | | Actual | | | 2021/22 | | | Actual | |
| ($ millions) | | Budget | | | Actual | | | Variance | | | 2020/21 1 | | | Budget | | | Forecast | | | Variance | | | 2020/21 1 | |
| Office of the Premier | | | 8 | | | | 7 | | | | (1 | ) | | | 6 | | | | 15 | | | | 15 | | | | - | | | | 11 | |
| Advanced Education and Skills Training | | | 1,319 | | | | 1,298 | | | | (21 | ) | | | 1,135 | | | | 2,592 | | | | 2,592 | | | | - | | | | 2,412 | |
| Agriculture, Food and Fisheries | | | 60 | | | | 44 | | | | (16 | ) | | | 57 | | | | 100 | | | | 100 | | | | - | | | | 150 | |
| Attorney General | | | 625 | | | | 650 | | | | 25 | | | | 352 | | | | 1,272 | | | | 1,272 | | | | - | | | | 1,495 | |
| Children and Family Development | | | 1,103 | | | | 1,078 | | | | (25 | ) | | | 886 | | | | 2,393 | | | | 2,393 | | | | - | | | | 2,440 | |
| Citizens’ Services | | | 285 | | | | 305 | | | | 20 | | | | 290 | | | | 604 | | | | 604 | | | | - | | | | 665 | |
| Education | | | 3,635 | | | | 3,679 | | | | 44 | | | | 3,541 | | | | 7,132 | | | | 7,132 | | | | - | | | | 6,756 | |
| Energy, Mines and Low Carbon Innovation | | | 37 | | | | 39 | | | | 2 | | | | 41 | | | | 109 | | | | 109 | | | | - | | | | 252 | |
| Environment and Climate Change Strategy | | | 106 | | | | 132 | | | | 26 | | | | 153 | | | | 301 | | | | 328 | | | | 27 | | | | 708 | |
| Finance | | | 518 | | | | 460 | | | | (58 | ) | | | 526 | | | | 990 | | | | 1,027 | | | | 37 | | | | 1,781 | |
| Forests, Lands, Natural Resource Operations and Rural Development | | | 402 | | | | 817 | | | | 415 | | | | 456 | | | | 888 | | | | 1,464 | | | | 576 | | | | 1,077 | |
| Health | | | 11,384 | | | | 11,192 | | | | (192 | ) | | | 10,539 | | | | 23,873 | | | | 23,873 | | | | - | | | | 24,155 | |
| Indigenous Relations and Reconciliation | | | 52 | | | | 74 | | | | 22 | | | | 56 | | | | 179 | | | | 179 | | | | - | | | | 314 | |
| Jobs, Economic Recovery and Innovation | | | 40 | | | | 38 | | | | (2 | ) | | | 44 | | | | 79 | | | | 79 | | | | - | | | | 251 | |
| Labour | | | 8 | | | | 10 | | | | 2 | | | | 9 | | | | 17 | | | | 17 | | | | - | | | | 35 | |
| Mental Health and Addictions | | | 6 | | | | 5 | | | | (1 | ) | | | 4 | | | | 13 | | | | 13 | | | | - | | | | 42 | |
| Municipal Affairs | | | 225 | | | | 227 | | | | 2 | | | | 487 | | | | 308 | | | | 308 | | | | - | | | | 526 | |
| Public Safety and Solicitor General | | | 443 | | | | 471 | | | | 28 | | | | 449 | | | | 901 | | | | 957 | | | | 56 | | | | 1,057 | |
| Social Development and Poverty Reduction | | | 2,132 | | | | 2,121 | | | | (11 | ) | | | 1,821 | | | | 4,360 | | | | 4,360 | | | | - | | | | 4,483 | |
| Tourism, Arts, Culture and Sport | | | 94 | | | | 91 | | | | (3 | ) | | | 101 | | | | 162 | | | | 162 | | | | - | | | | 352 | |
| Transportation and Infrastructure | | | 473 | | | | 470 | | | | (3 | ) | | | 466 | | | | 949 | | | | 949 | | | | - | | | | 1,232 | |
| Total ministries and Office of the Premier | | | 22,955 | | | | 23,208 | | | | 253 | | | | 21,419 | | | | 47,237 | | | | 47,933 | | | | 696 | | | | 50,194 | |
| Management of public funds and debt | | | 667 | | | | 641 | | | | (26 | ) | | | 635 | | | | 1,340 | | | | 1,273 | | | | (67 | ) | | | 1,246 | |
| Contingencies - General programs and CleanBC | | | - | | | | - | | | | - | | | | - | | | | 1,000 | | | | 1,000 | | | | - | | | | - | |
| Pandemic and Recovery Contingencies | | | - | | | | 1,259 | | | | 1,259 | | | | 1,664 | | | | 3,250 | | | | 3,250 | | | | - | | | | 2,041 | |
| Funding to agencies for capital expenditures | | | 1,075 | | | | 775 | | | | (300 | ) | | | 617 | | | | 3,448 | | | | 3,125 | | | | (323 | ) | | | 1,974 | |
| Refundable tax credit transfers | | | 930 | | | | 935 | | | | 5 | | | | 1,202 | | | | 1,871 | | | | 1,932 | | | | 61 | | | | 2,358 | |
| Legislative Assembly and other appropriations | | | 84 | | | | 76 | | | | (8 | ) | | | 75 | | | | 174 | | | | 174 | | | | - | | | | 207 | |
| Total appropriations | | | 25,711 | | | | 26,894 | | | | 1,183 | | | | 25,612 | | | | 58,320 | | | | 58,687 | | | | 367 | | | | 58,020 | |
| Elimination of transactions between appropriations 2 | | | (4 | ) | | | (7 | ) | | | (3 | ) | | | (8 | ) | | | (14 | ) | | | (14 | ) | | | - | | | | (15 | ) |
| Prior year liability adjustments | | | - | | | | - | | | | - | | | | - | | | | - | | | | - | | | | - | | | | (123 | ) |
| Consolidated revenue fund expense | | | 25,707 | | | | 26,887 | | | | 1,180 | | | | 25,604 | | | | 58,306 | | | | 58,673 | | | | 367 | | | | 57,882 | |
| Expenses recovered from external entities | | | 1,386 | | | | 1,624 | | | | 238 | | | | 1,451 | | | | 3,535 | | | | 3,801 | | | | 266 | | | | 4,557 | |
| Elimination of funding provided to service delivery agencies | | | (16,039 | ) | | | (16,360 | ) | | | (321 | ) | | | (15,262 | ) | | | (33,682 | ) | | | (35,560 | ) | | | (1,878 | ) | | | (34,096 | ) |
| Total direct program spending | | | 11,054 | | | | 12,151 | | | | 1,097 | | | | 11,793 | | | | 28,159 | | | | 26,914 | | | | (1,245 | ) | | | 28,343 | |
| Service delivery agency expense | | | | | | | | | | | | | | | | | | | | | | | | | | | | | | | | |
| School districts | | | 3,220 | | | | 3,205 | | | | (15 | ) | | | 2,970 | | | | 7,482 | | | | 7,501 | | | | 19 | | | | 7,083 | |
| Universities | | | 2,595 | | | | 2,612 | | | | 17 | | | | 2,463 | | | | 5,510 | | | | 5,840 | | | | 330 | | | | 5,272 | |
| Colleges and institutes | | | 718 | | | | 716 | | | | (2 | ) | | | 673 | | | | 1,497 | | | | 1,532 | | | | 35 | | | | 1,431 | |
| Health authorities and hospital societies | | | 9,231 | | | | 9,652 | | | | 421 | | | | 8,727 | | | | 18,271 | | | | 20,439 | | | | 2,168 | | | | 19,252 | |
| Other service delivery agencies | | | 3,059 | | | | 3,117 | | | | 58 | | | | 2,944 | | | | 6,708 | | | | 6,713 | | | | 5 | | | | 6,243 | |
| Total service delivery agency expense | | | 18,823 | | | | 19,302 | | | | 479 | | | | 17,777 | | | | 39,468 | | | | 42,025 | | | | 2,557 | | | | 39,281 | |
| Total expense | | | 29,877 | | | | 31,453 | | | | 1,576 | | | | 29,570 | | | | 67,627 | | | | 68,939 | | | | 1,312 | | | | 67,624 | |
| 1 | Restated to reflect government’s current organization and accounting policies. |
| 2 | Reflects payments made under an agreement where an expense from a voted appropriation is recorded as revenue by a special account. |
| Second Quarterly Report 2021/22 | | 21 |
| | | |
Updated Financial Forecast
Table 1.9 2021/22 Expense by Function
| | | Year-to-Date to September 30 | | | Full Year | |
| | | | | | 2021/22 | | | | | | Actual | | | | | | 2021/22 | | | | | | Actual | |
| ($ millions) | | Budget | | | Actual | | | Variance | | | 2020/21 | | | Budget | | | Forecast | | | Variance | | | 2020/21 | |
| Health 1 | | | 12,563 | | | | 12,546 | | | | (17 | ) | | | 11,652 | | | | 26,106 | | | | 26,258 | | | | 152 | | | | 25,605 | |
| Education 2 | | | 7,058 | | | | 7,027 | | | | (31 | ) | | | 6,293 | | | | 15,805 | | | | 16,122 | | | | 317 | | | | 14,943 | |
| Social services | | | 3,450 | | | | 3,395 | | | | (55 | ) | | | 3,308 | | | | 7,172 | | | | 7,242 | | | | 70 | | | | 7,789 | |
| Protection of persons and property | | | 935 | | | | 988 | | | | 53 | | | | 935 | | | | 1,935 | | | | 1,993 | | | | 58 | | | | 2,258 | |
| Transportation | | | 1,062 | | | | 1,080 | | | | 18 | | | | 1,043 | | | | 2,336 | | | | 2,345 | | | | 9 | | | | 3,360 | |
| Natural resources and economic development | | | 1,435 | | | | 1,860 | | | | 425 | | | | 1,465 | | | | 3,467 | | | | 3,979 | | | | 512 | | | | 4,191 | |
| Other | | | 1,370 | | | | 1,097 | | | | (273 | ) | | | 968 | | | | 2,218 | | | | 2,316 | | | | 98 | | | | 2,841 | |
| Contingencies - General programs and CleanBC | | | - | | | | - | | | | - | | | | - | | | | 1,000 | | | | 1,000 | | | | - | | | | - | |
| Pandemic and Recovery Contingencies | | | - | | | | 1,259 | | | | 1,259 | | | | 1,664 | | | | 3,250 | | | | 3,250 | | | | - | | | | - | |
| General government | | | 643 | | | | 853 | | | | 210 | | | | 879 | | | | 1,531 | | | | 1,703 | | | | 172 | | | | 3,915 | |
| Debt servicing | | | 1,361 | | | | 1,347 | | | | (14 | ) | | | 1,363 | | | | 2,807 | | | | 2,731 | | | | (76 | ) | | | 2,722 | |
| Total expense | | | 29,877 | | | | 31,453 | | | | 1,576 | | | | 29,570 | | | | 67,627 | | | | 68,939 | | | | 1,312 | | | | 67,624 | |
| 1 | Payments for healthcare services by the Ministry of Social Development and Poverty Reduction and the Ministry of Children and Family Development made on behalf of their clients are reported in the Health function. |
| 2 | Payments for training costs by the Ministry of Social Development and Poverty Reduction made on behalf of its clients are reported in the Education function. |
| 22 | | Second Quarterly Report 2021/22 | |
| | | |
Updated Financial Forecast
Table 1.10 2021/22 Capital Spending
| | | Year-to-Date to September 30 | | | Full Year | |
| | | 2021/22 | | | Actual | | | 2021/22 | | | Actual | |
| ($ millions) | | Budget | | | Actual | | | Variance | | | 2020/21 | | | Budget | | | Forecast | | | Variance | | | 2020/21 | |
| Taxpayer-supported | | | | | | | | | | | | | | | | | | | | | | | | | | | | | | | | |
| Education | | | | | | | | | | | | | | | | | | | | | | | | | | | | | | | | |
| School districts | | | 612 | | | | 501 | | | | (111 | ) | | | 483 | | | | 1,197 | | | | 1,175 | | | | (22 | ) | | | 944 | |
| Post-secondary institutions | | | 485 | | | | 390 | | | | (95 | ) | | | 347 | | | | 1,263 | | | | 1,049 | | | | (214 | ) | | | 904 | |
| Health | | | 651 | | | | 402 | | | | (249 | ) | | | 337 | | | | 2,245 | | | | 2,415 | | | | 170 | | | | 1,162 | |
| BC Transportation Financing Authority | | | 1,023 | | | | 788 | | | | (235 | ) | | | 608 | | | | 2,162 | | | | 1,922 | | | | (240 | ) | | | 1,285 | |
| BC Transit | | | 58 | | | | 37 | | | | (21 | ) | | | 55 | | | | 113 | | | | 86 | | | | (27 | ) | | | 107 | |
| Government ministries | | | 163 | | | | 149 | | | | (14 | ) | | | 99 | | | | 641 | | | | 638 | | | | (3 | ) | | | 389 | |
| Social housing 1 | | | 292 | | | | 382 | | | | 90 | | | | 249 | | | | 671 | | | | 675 | | | | 4 | | | | 572 | |
| Other | | | 66 | | | | 24 | | | | (42 | ) | | | 23 | | | | 187 | | | | 181 | | | | (6 | ) | | | 65 | |
| Total taxpayer-supported | | | 3,350 | | | | 2,673 | | | | (677 | ) | | | 2,201 | | | | 8,479 | | | | 8,141 | | | | (338 | ) | | | 5,428 | |
| Self-supported | | | | | | | | | | | | | | | | | | | | | | | | | | | | | | | | |
| BC Hydro | | | 2,336 | | | | 1,704 | | | | (632 | ) | | | 1,552 | | | | 4,738 | | | | 4,371 | | | | (367 | ) | | | 3,207 | |
| Columbia Basin power projects 2 | | | 2 | | | | 4 | | | | 2 | | | | 1 | | | | 9 | | | | 7 | | | | (2 | ) | | | 7 | |
| BC Railway Company | | | 2 | | | | 2 | | | | (0 | ) | | | 1 | | | | 11 | | | | 8 | | | | (3 | ) | | | 1 | |
| ICBC | | | 33 | | | | 27 | | | | (6 | ) | | | 47 | | | | 68 | | | | 68 | | | | - | | | | 100 | |
| BC Lottery Corporation | | | 48 | | | | 13 | | | | (35 | ) | | | 18 | | | | 96 | | | | 96 | | | | - | | | | 73 | |
| Liquor Distribution Branch | | | 14 | | | | 11 | | | | (3 | ) | | | 10 | | | | 54 | | | | 32 | | | | (22 | ) | | | 22 | |
| Other 3 | | | - | | | | - | | | | - | | | | - | | | | - | | | | - | | | | - | | | | 65 | |
| Total self-supported | | | 2,434 | | | | 1,760 | | | | (674 | ) | | | 1,629 | | | | 4,976 | | | | 4,582 | | | | (394 | ) | | | 3,475 | |
| Total capital spending | | | 5,784 | | | | 4,433 | | | | (1,351 | ) | | | 3,830 | | | | 13,455 | | | | 12,723 | | | | (732 | ) | | | 8,903 | |
| 1 | Includes BC Housing Management Commission and Provincial Rental Housing Corporation. |
| 2 | Joint ventures of the Columbia Power Corporation and Columbia Basin Trust. |
| 3 | Includes post-secondary institutions’ self-supported subsidiaries. |
| Second Quarterly Report 2021/22 | | 23 |
| | | |
Updated Financial Forecast
Table 1.11 Capital Expenditure Projects Greater Than $50 million 1
Note: Information in bold type denotes changes from the 2021/22 First Quarterly Report released on September 13, 2021.
| | | | | Project | | | Estimated | | | Anticipated | | | Project Financing | |
| | | Year of | | Cost to | | | Cost to | | | Total | | | Internal/ | | | P3 | | | Federal | | | Other | |
| ($ millions) | | Completion | | Sept. 30, 2021 | | | Complete | | | Cost | | | Borrowing | | | Liability | | | Gov’t | | | Contrib’ns | |
| | | Taxpayer-supported | | | | | | | | | | | | | |
| Schools | | | | | | | | | | | | | | | | | | | | | | | | | | | | | | |
| Centennial Secondary 2 | | 2017 | | | 59 | | | | 2 | | | | 61 | | | | 61 | | | | - | | | | - | | | | - | |
| Grandview Heights Secondary | | 2021 | | | 73 | | | | 10 | | | | 83 | | | | 63 | | | | - | | | | - | | | | 20 | |
| New Westminster Secondary | | 2021 | | | 89 | | | | 18 | | | | 107 | | | | 107 | | | | - | | | | - | | | | - | |
| Handsworth Secondary | | 2022 | | | 57 | | | | 12 | | | | 69 | | | | 69 | | | | - | | | | - | | | | - | |
| Pexsisen Elementary and | | | | | | | | | | | | | | | | | | | | | | | | | | | | | | |
| Centre Mountain Lellum Middle | | 2022 | | | 39 | | | | 50 | | | | 89 | | | | 89 | | | | - | | | | - | | | | - | |
| Quesnel Junior School | | 2022 | | | 15 | | | | 37 | | | | 52 | | | | 52 | | | | - | | | | - | | | | - | |
| Sheffield Elementary | | 2022 | | | 8 | | | | 44 | | | | 52 | | | | 47 | | | | - | | | | - | | | | 5 | |
| Stitó:s Lá:lém totí:lt Elementary Middle School | | 2022 | | | 30 | | | | 24 | | | | 54 | | | | 49 | | | | | | | | | | | | 5 | |
| Burnaby North Secondary | | 2023 | | | 37 | | | | 71 | | | | 108 | | | | 99 | | | | - | | | | - | | | | 9 | |
| Eric Hamber Secondary | | 2023 | | | 22 | | | | 84 | | | | 106 | | | | 94 | | | | - | | | | - | | | | 12 | |
| Victoria High School | | 2023 | | | 27 | | | | 53 | | | | 80 | | | | 77 | | | | - | | | | - | | | | 3 | |
| Cowichan Secondary | | 2024 | | | 7 | | | | 75 | | | | 82 | | | | 80 | | | | | | | | | | | | 2 | |
| Seismic mitigation program 3 | | 2030 | | | 955 | | | | 1,071 | | | | 2,026 | | | | 2,026 | | | | - | | | | - | | | | - | |
| Total schools | | | | | 1,418 | | | | 1,551 | | | | 2,969 | | | | 2,913 | | | | - | | | | - | | | | 56 | |
| | | | | | | | | | | | | | | | | | | | | | | | | | | | | | | |
| Post-secondary institutions | |
| Simon Fraser University – Energy Systems Engineering Building 2,4 | | 2019 | | | 125 | | | | 1 | | | | 126 | | | | 45 | | | | - | | | | 45 | | | | 36 | |
| British Columbia Institute of Technology – Health Sciences Centre for Advanced Simulation | | 2022 | | | 60 | | | | 28 | | | | 88 | | | | 66 | | | | - | | | | - | | | | 22 | |
| Simon Fraser University – Student Housing | | 2022 | | | 42 | | | | 62 | | | | 104 | | | | 73 | | | | - | | | | - | | | | 31 | |
| Okanagan College – Student Housing | | 2023 | | | - | | | | 68 | | | | 68 | | | | 67 | | | | - | | | | - | | | | 1 | |
| University of Victoria – Student Housing | | 2023 | | | 89 | | | | 140 | | | | 229 | | | | 128 | | | | - | | | | - | | | | 101 | |
| University of Victoria – Engineering & Computer Science Building Expansion | | 2023 | | | 3 | | | | 87 | | | | 90 | | | | 65 | | | | - | | | | - | | | | 25 | |
| British Columbia Institute of Technology – Student Housing | | 2024 | | | 2 | | | | 112 | | | | 114 | | | | 108 | | | | - | | | | - | | | | 6 | |
| Total post-secondary institutions | | | | | 321 | | | | 498 | | | | 819 | | | | 552 | | | | - | | | | 45 | | | | 222 | |
| | | | | | | | | | | | | | | | | | | | | | | | | | | | | | | |
| Health facilities | |
| Children’s and Women’s Hospital2 | | | | | | | | | | | | | | | | | | | | | | | | | | | | | | |
| – Direct procurement | | 2020 | | | 289 | | | | 9 | | | | 298 | | | | 168 | | | | - | | | | - | | | | 130 | |
| – P3 contract | | 2018 | | | 368 | | | | - | | | | 368 | | | | 167 | | | | 187 | | | | - | | | | 14 | |
| Royal Columbian Hospital – Phase 12 | | 2020 | | | 245 | | | | 6 | | | | 251 | | | | 242 | | | | - | | | | - | | | | 9 | |
| Red Fish Healing Centre for Mental Health and Addiction - θəqiʔ ɫəwʔənəq leləm | | 2021 | | | 124 | | | | 7 | | | | 131 | | | | 131 | | | | - | | | | - | | | | - | |
| Vancouver General Hospital – Operating Rooms | | | | | | | | | | | | | | | | | | | | | | | | | | | | | | |
| Renewal – Phase 1 | | 2021 | | | 93 | | | | 9 | | | | 102 | | | | 35 | | | | - | | | | - | | | | 67 | |
| Dogwood Complex Residential Care | | 2022 | | | 11 | | | | 47 | | | | 58 | | | | - | | | | - | | | | - | | | | 58 | |
| Peace Arch Hospital Renewal | | 2022 | | | 65 | | | | 26 | | | | 91 | | | | 8 | | | | - | | | | - | | | | 83 | |
| Penticton Regional Hospital – Patient Care Tower | | | | | | | | | | | | | | | | | | | | | | | | | | | | | | |
| – Direct procurement | | 2022 | | | 51 | | | | 25 | | | | 76 | | | | 18 | | | | - | | | | - | | | | 58 | |
| – P3 contract | | 2019 | | | 232 | | | | - | | | | 232 | | | | - | | | | 139 | | | | - | | | | 93 | |
| Lions Gate Hospital – New Acute Care Facility | | 2024 | | | 4 | | | | 306 | | | | 310 | | | | 144 | | | | - | | | | - | | | | 166 | |
| Stuart Lake Hospital | | 2024 | | | 4 | | | | 112 | | | | 116 | | | | 98 | | | | - | | | | - | | | | 18 | |
| Royal Inland Hospital Patient Care Tower | | | | | | | | | | | | | | | | | | | | | | | | | | | | | | |
| – Direct procurement | | 2025 | | | 20 | | | | 109 | | | | 129 | | | | 39 | | | | - | | | | - | | | | 90 | |
| – P3 contract | | 2022 | | | 267 | | | | 21 | | | | 288 | | | | - | | | | 164 | | | | - | | | | 124 | |
| Cariboo Memorial Hospital | | 2026 | | | 4 | | | | 214 | | | | 218 | | | | 131 | | | | - | | | | - | | | | 87 | |
| Cowichan District Hospital | | 2026 | | | 13 | | | | 874 | | | | 887 | | | | 605 | | | | - | | | | - | | | | 282 | |
| Dawson Creek & District Hospital | | 2026 | | | 2 | | | | 376 | | | | 378 | | | | 247 | | | | - | | | | - | | | | 131 | |
| Health facilities continued on the next page | |

| 24 | | Second Quarterly Report 2021/22 | |
| | | |
Updated Financial Forecast
Table 1.11 Capital Expenditure Projects Greater Than $50 million 1
Note: Information in bold type denotes changes from the 2021/22 First Quarterly Report released on September 13, 2021.
| | | | | Project | | | Estimated | | | Anticipated | | | Project Financing | |
| | | Year of | | Cost to | | | Cost to | | | Total | | | Internal/ | | | P3 | | | Federal | | | Other | |
| ($ millions) | | Completion | | Sept. 30, 2021 | | | Complete | | | Cost | | | Borrowing | | | Liability | | | Gov’t | | | Contrib’ns | |
| | | | | | | | | | | | | | | | | | | | | | | | |
| Health facilities continued | |
| Mills Memorial Hospital | | 2026 | | | 80 | | | | 543 | | | | 623 | | | | 513 | | | | - | | | | - | | | | 110 | |
| Royal Columbian Hospital – Phases 2 & 3 | | 2026 | | | 146 | | | | 1,098 | | | | 1,244 | | | | 1,182 | | | | - | | | | - | | | | 62 | |
| Burnaby Hospital Redevelopment - Phase 1 5 | | 2027 | | | 8 | | | | 604 | | | | 612 | | | | 578 | | | | - | | | | - | | | | 34 | |
| New Surrey Hospital and Cancer Centre | | 2027 | | | 1 | | | | 1,659 | | | | 1,660 | | | | 1,660 | | | | - | | | | - | | | | - | |
| St Paul’s Hospital | | 2027 | | | 28 | | | | 2,146 | | | | 2,174 | | | | 1,327 | | | | - | | | | - | | | | 847 | |
| Richmond Hospital | | 2031 | | | - | | | | 861 | | | | 861 | | | | 791 | | | | - | | | | - | | | | 70 | |
| Clinical and Systems Transformation | | 2025 | | | 548 | | | | 155 | | | | 703 | | | | 702 | | | | - | | | | - | | | | 1 | |
| iHealth Project – Vancouver Island Health | | | | | | | | | | | | | | | | | | | | | | | | | | | | | | |
| Authority | | 2025 | | | 111 | | | | 44 | | | | 155 | | | | 55 | | | | - | | | | - | | | | 100 | |
| Total health facilities | | | | | 2,714 | | | | 9,251 | | | | 11,965 | | | | 8,841 | | | | 490 | | | | - | | | | 2,634 | |
| | | | | | | | | | | | | | | | | | | | | | | | | | | | | | | |
| Transportation | |
| Highway 91 Alex Fraser Bridge Capacity | | | | | | | | | | | | | | | | | | | | | | | | | | | | | | |
| Improvements 2 | | 2019 | | | 66 | | | | 4 | | | | 70 | | | | 37 | | | | - | | | | 33 | | | | - | |
| Highway 1 Illecillewaet Four-Laning and Brake Check improvements | | 2021 | | | 66 | | | | 19 | | | | 85 | | | | 69 | | | | - | | | | 16 | | | | - | |
| Highway 1 Lower Lynn Corridor | | | | | | | | | | | | | | | | | | | | | | | | | | | | | | |
| improvements | | 2021 | | | 172 | | | | 26 | | | | 198 | | | | 77 | | | | - | | | | 66 | | | | 55 | |
| Highway 99 10-Mile Slide | | 2021 | | | 67 | | | | 17 | | | | 84 | | | | 84 | | | | - | | | | - | | | | - | |
| Highway 4 Kennedy Hill Safety Improvements | | 2022 | | | 40 | | | | 14 | | | | 54 | | | | 40 | | | | - | | | | 14 | | | | - | |
| Highway 14 Corridor improvements | | 2022 | | | 37 | | | | 40 | | | | 77 | | | | 48 | | | | - | | | | 29 | | | | - | |
| Highway 1 Chase Four-Laning | | 2023 | | | 54 | | | | 166 | | | | 220 | | | | 208 | | | | - | | | | 12 | | | | - | |
| Highway 1 Quartz Creek Bridge Replacement | | 2023 | | | 22 | | | | 99 | | | | 121 | | | | 71 | | | | - | | | | 50 | | | | - | |
| Highway 1 RW Bruhn Bridge | | 2023 | | | 28 | | | | 197 | | | | 225 | | | | 134 | | | | - | | | | 91 | | | | - | |
| Highway 1 Salmon Arm West | | 2023 | | | 64 | | | | 91 | | | | 155 | | | | 124 | | | | - | | | | 31 | | | | - | |
| Highway 91 to Highway 17 and Deltaport Way Corridor improvements | | 2023 | | | 147 | | | | 113 | | | | 260 | | | | 87 | | | | - | | | | 82 | | | | 91 | |
| Kootenay Lake ferry service upgrade | | 2023 | | | 26 | | | | 59 | | | | 85 | | | | 68 | | | | - | | | | 17 | | | | - | |
| West Fraser Road Realignment | | 2023 | | | 30 | | | | 73 | | | | 103 | | | | 103 | | | | - | | | | - | | | | - | |
| Highway 1 216th - 264th Street widening | | 2024 | | | 21 | | | | 214 | | | | 235 | | | | 99 | | | | - | | | | 109 | | | | 27 | |
| Highway 1 Ford Road to Tappen Valley Road Four-Laning | | 2024 | | | - | | | | 243 | | | | 243 | | | | 161 | | | | - | | | | 82 | | | | - | |
| Highway 1 Kicking Horse Canyon Phase 4 6 | | 2024 | | | 215 | | | | 386 | | | | 601 | | | | 386 | | | | - | | | | 215 | | | | - | |
| Pattullo Bridge Replacement 7 | | 2024 | | | 370 | | | | 1,007 | | | | 1,377 | | | | 1,076 | | | | 301 | | | | - | | | | - | |
| Broadway Subway 8 | | 2025 | | | 511 | | | | 2,316 | | | | 2,827 | | | | 1,380 | | | | 450 | | | | 897 | | | | 100 | |
| Highway 99 Improvements/Steveston Interchange | | 2025 | | | 2 | | | | 135 | | | | 137 | | | | 137 | | | | - | | | | - | | | | - | |
| George Massey Crossing | | 2030 | | | - | | | | 4,148 | | | | 4,148 | | | | 4,148 | | | | - | | | | - | | | | - | |
| Total transportation | | | | | 1,938 | | | | 9,367 | | | | 11,305 | | | | 8,537 | | | | 751 | | | | 1,744 | | | | 273 | |
| | | | | | | | | | | | | | | | | | | | | | | | | | | | | | | |
| Other taxpayer-supported | |
| Nanaimo Correctional Centre Replacement | | 2024 | | | 22 | | | | 145 | | | | 167 | | | | 167 | | | | - | | | | - | | | | - | |
| 6585 Sussex Ave (Affordable Rental Housing) | | 2021 | | | 41 | | | | 34 | | | | 75 | | | | 43 | | | | - | | | | - | | | | 32 | |
| Stanley New Fountain Hotel (Affordable Rental Housing) | | 2022 | | | 45 | | | | 24 | | | | 69 | | | | 19 | | | | - | | | | - | | | | 50 | |
| 13583 81st Ave (Affordable Rental Housing) | | 2023 | | | 6 | | | | 44 | | | | 50 | | | | 37 | | | | - | | | | - | | | | 13 | |
| Crosstown (Supportive Housing Fund) | | 2023 | | | 3 | | | | 69 | | | | 72 | | | | 61 | | | | - | | | | - | | | | 11 | |
| 58 W Hastings (Supportive Housing Fund) | | 2024 | | | 1 | | | | 157 | | | | 158 | | | | 61 | | | | - | | | | 19 | | | | 78 | |
| Clark & 1st Ave (Affordable Rental Housing) | | 2024 | | | 6 | | | | 103 | | | | 109 | | | | 75 | | | | - | | | | - | | | | 34 | |
| Royal BC Museum – Collections and Research Building | | 2025 | | | 19 | | | | 206 | | | | 224 | | | | 224 | | | | - | | | | - | | | | - | |
| Total other | | | | | 143 | | | | 782 | | | | 924 | | | | 687 | | | | - | | | | 19 | | | | 218 | |
| Total taxpayer-supported | | | | | 6,534 | | | | 21,449 | | | | 27,982 | | | | 21,530 | | | | 1,241 | | | | 1,808 | | | | 3,403 | |
| | Second Quarterly Report 2021/22 | | 25 |
| | | |
Updated Financial Forecast
Table 1.11 Capital Expenditure Projects Greater Than $50 million 1
Note: Information in bold type denotes changes from the 2021/22 First Quarterly Report released on September 13, 2021.
| | | | Project | | | Estimated | | | Anticipated | | | Project Financing | |
| | | Year of | | Cost to | | | Cost to | | | Total | | | Internal/ | | | P3 | | | Federal | | | Other | |
| ($ millions) | | Completion | | Sept. 30, 2021 | | | Complete | | | Cost | | | Borrowing | | | Liability | | | Gov’t | | | Contrib’ns | |
| | | | | | | | | | | | | | | | | | | | | | | | |
| Power generation and transmission | |
| BC Hydro | | | | | | | | | | | | | | | | | | | | | | | | | | | | | | |
| –John Hart generating station replacement 2 | | 2019 | | | 978 | | | | 1 | | | | 979 | | | | 979 | | | | - | | | | - | | | | - | |
| –Bridge River 2 units 5 and 6 upgrade project 2 | | 2019 | | | 75 | | | | - | | | | 75 | | | | 75 | | | | - | | | | - | | | | - | |
| –South Fraser transmission relocation project 9 | | TBD | | | 27 | | | | 49 | | | | 76 | | | | 76 | | | | - | | | | - | | | | - | |
| –Supply Chain Applications project 2 | | 2020 | | | 68 | | | | 1 | | | | 69 | | | | 69 | | | | - | | | | - | | | | - | |
| –Fort St. John and Taylor Electric Supply 2 | | 2020 | | | 51 | | | | 1 | | | | 52 | | | | 52 | | | | - | | | | - | | | | - | |
| –UBC load increase stage 2 project 2 | | 2020 | | | 51 | | | | 5 | | | | 56 | | | | 56 | | | | - | | | | - | | | | - | |
| –Peace Region Electricity Supply (PRES) project 2,10 | | 2021 | | | 212 | | | | 4 | | | | 216 | | | | 216 | | | | - | | | | TBD | | | | - | |
| –LNG Canada load interconnection project 2 | | .2021 | | | 77 | | | | 5 | | | | 82 | | | | 58 | | | | - | | | | - | | | | 24 | |
| – Downtown Vancouver Electricity Supply: West End strategic property purchase | | 2021 | | | 68 | | | | 13 | | | | 81 | | | | 81 | | | | - | | | | - | | | | - | |
| – Bridge River 2 upgrade units 7 and 8 project | | 2021 | | | 69 | | | | 16 | | | | 85 | | | | 85 | | | | - | | | | - | | | | - | |
| – Wahleach refurbish generator project | | 2022 | | | 32 | | | | 19 | | | | 51 | | | | 51 | | | | - | | | | - | | | | - | |
| – Mica replace units 1 to 4 generator transformers project | | 2022 | | | 55 | | | | 25 | | | | 80 | | | | 80 | | | | - | | | | - | | | | - | |
| – G.M. Shrum G1 to 10 control system upgrade | | 2022 | | | 58 | | | | 17 | | | | 75 | | | | 75 | | | | - | | | | - | | | | - | |
| – Mount Lehman substation upgrade project | | 2023 | | | 37 | | | | 21 | | | | 58 | | | | 58 | | | | - | | | | - | | | | - | |
| – Street light replacement program | | 2023 | | | 21 | | | | 54 | | | | 75 | | | | 75 | | | | - | | | | - | | | | - | |
| – 5L063 Telkwa relocation project | | 2023 | | | 21 | | | | 45 | | | | 66 | | | | 66 | | | | - | | | | - | | | | - | |
| – Mica modernize controls project | | 2023 | | | 35 | | | | 21 | | | | 56 | | | | 56 | | | | - | | | | - | | | | - | |
| – Capilano substation upgrade project | | 2024 | | | 22 | | | | 65 | | | | 87 | | | | 87 | | | | - | | | | - | | | | - | |
| – Vancouver Island radio system project | | 2024 | | | 29 | | | | 24 | | | | 53 | | | | 53 | | | | - | | | | - | | | | - | |
| – Sperling substation (SPG) metalclad switchgear | | | | | | | | | | | | | | | | | | | | | | | | | | | | | | |
| replacement project | | 2025 | | | 10 | | | | 44 | | | | 54 | | | | 54 | | | | - | | | | - | | | | - | |
| –Natal - 60-138 kV switchyard upgrade project | | 2025 | | | 4 | | | | 80 | | | | 84 | | | | 84 | | | | - | | | | - | | | | - | |
| –Site C project 11 | | 2025 | | | 7,857 | | | | 8,143 | | | | 16,000 | | | | 16,000 | | | | - | | | | - | | | | - | |
| Total power generation and transmission | | | | | 9,857 | | | | 8,653 | | | | 18,510 | | | | 18,486 | | | | - | | | | - | | | | 24 | |
| | | | | | | | | | | | | | | | | | | | | | | | | | | | | | | |
| Other self-supported | | | | | | | | | | | | | | | | | | | | | | | | | | | | | | |
| Enhanced Care Coverage Program (ICBC) | | 2022 | | | 89 | | | | 4 | | | | 93 | | | | 93 | | | | - | | | | - | | | | - | |
| Total self-supported | | | | | 9,946 | | | | 8,657 | | | | 18,603 | | | | 18,579 | | | | - | | | | - | | | | 24 | |
| Total $50 million projects | | | | | 16,480 | | | | 30,106 | | | | 46,585 | | | | 40,109 | | | | 1,241 | | | | 1,808 | | | | 3,427 | |
| 1 | Only projects that receive provincial funding and have been approved by Treasury Board and/or Crown corporation boards are included in this table. Ministry service plans may highlight projects that still require final approval. Capital costs reflect current government accounting policy. |
| 2 | Assets have been put into service and only trailing costs remain. |
| 3 | The Seismic Mitigation Program consists of all spending to date on Phase 2 of the program and may include spending on projects greater than $50 million included in the table above. |
| 4 | Simon Fraser University and private donors contributed $26 million toward the project, and the university also contributed land valued at $10 million. |
| 5 | The concept plan for Phase 2 of the Burnaby Hospital Redevelopment has been approved. Financial information will be added to the table upon business case approval. |
| 6 | Kicking Horse Canyon Project costs exclude $11 million of past planning costs which are expensed. |
| 7 | Pattullo Bridge forecasted to open to the public in 2024 with old bridge decommissioning to follow. Forecasted amount reflects total expenditures including capitalized and expensed items. |
| 8 | The Broadway Subway Project forecast and value of costs incurred to date include the City of Vancouver in-kind contribution of land rights, in keeping with the approved project budget. Under current government accounting, purchased intangible assets are given accounting recognition, and contributed intangible assets, such as land use rights or licenses are not. |
| 9 | BC Hydro is assessing crossing options given the recent Government announcement regarding the replacement of the George Massey tunnel. |
| 10 | The total cost represents the gross cost of the project and has not been netted for Federal Government contributions. The Federal Government’s contribution amount is dependent on the final actual project costs and what costs are eligible under the agreement. |
| 11 | The approved updated cost estimate for the Site C project is $16 billion, with a one year delay to 2025 for the project full in-service date. BC Hydro continues to review the updated cost estimate, along with risks, further to recommendations in the Milburn Report. Site C project total anticipated cost and project cost to date include capital costs, charges subject to regulatory deferral and certain operating expenditures. |
| 26 | | Second Quarterly Report 2021/22 | |
| | | |
Updated Financial Forecast
Table 1.12 2021/22 Provincial Debt 1
| | | Year-to-Date to September 30 | | | Full Year | |
| | | 2021/22 | | | Actual | | | 2021/22 | | | Actual | |
| ($ millions) | | Budget | | | Actual | | | Variance | | | 2020/21 | | | Budget | | | Forecast | | | Variance | | | 2020/21 | |
| Taxpayer-supported debt | | | | | | | | | | | | | | | | | | | | | | | | | | | | | | | | |
| Provincial government | | | | | | | | | | | | | | | | | | | | | | | | | | | | | | | | |
| Operating | | | 11,869 | | | | 6,745 | | | | (5,124 | ) | | | 5,338 | | | | 14,939 | | | | 6,044 | | | | (8,895 | ) | | | 8,746 | |
| Capital 2 | | | 35,510 | | | | 34,724 | | | | (786 | ) | | | 34,518 | | | | 37,180 | | | | 37,216 | | | | 36 | | | | 33,872 | |
| Total provincial government | | | 47,379 | | | | 41,469 | | | | (5,910 | ) | | | 39,856 | | | | 52,119 | | | | 43,260 | | | | (8,859 | ) | | | 42,618 | |
| Taxpayer-supported entities | | | | | | | | | | | | | | | | | | | | | | | | | | | | | | | | |
| BC Transportation Financing Authority | | | 14,490 | | | | 13,951 | | | | (539 | ) | | | 12,759 | | | | 15,538 | | | | 15,104 | | | | (434 | ) | | | 13,321 | |
| Health authorities and hospital societies | | | 1,844 | | | | 1,847 | | | | 3 | | | | 1,808 | | | | 1,841 | | | | 1,870 | | | | 29 | | | | 1,875 | |
| Post-secondary institutions | | | 850 | | | | 929 | | | | 79 | | | | 808 | | | | 858 | | | | 906 | | | | 48 | | | | 882 | |
| Social housing 3 | | | 922 | | | | 849 | | | | (73 | ) | | | 274 | | | | 990 | | | | 916 | | | | (74 | ) | | | 770 | |
| Other | | | 294 | | | | 267 | | | | (27 | ) | | | 299 | | | | 296 | | | | 292 | | | | (4 | ) | | | 284 | |
| Total taxpayer-supported entities | | | 18,400 | | | | 17,843 | | | | (557 | ) | | | 15,948 | | | | 19,523 | | | | 19,088 | | | | (435 | ) | | | 17,132 | |
| Total taxpayer-supported debt | | | 65,779 | | | | 59,312 | | | | (6,467 | ) | | | 55,804 | | | | 71,642 | | | | 62,348 | | | | (9,294 | ) | | | 59,750 | |
| Self-supported debt | | | 28,905 | | | | 28,111 | | | | (794 | ) | | | 26,934 | | | | 30,238 | | | | 29,653 | | | | (585 | ) | | | 27,350 | |
| Total debt before forecast allowance | | | 94,684 | | | | 87,423 | | | | (7,261 | ) | | | 82,738 | | | | 101,880 | | | | 92,001 | | | | (9,879 | ) | | | 87,100 | |
| Forecast allowance | | | - | | | | - | | | | - | | | | - | | | | 1,000 | | | | 1,000 | | | | - | | | | - | |
| Total provincial debt | | | 94,684 | | | | 87,423 | | | | (7,261 | ) | | | 82,738 | | | | 102,880 | | | | 93,001 | | | | (9,879 | ) | | | 87,100 | |
| 1 | Provincial debt is prepared in accordance with Generally Accepted Accounting Principles and presented consistent with the Debt Summary Report included in the Public Accounts. Debt is shown net of sinking funds and unamortized discounts, excludes accrued interest, and includes non-guaranteed debt directly incurred by commercial Crown corporations and debt guaranteed by the Province. |
| 2 | Includes debt incurred by the government to fund the building of capital assets in the education, health, social housing and other sectors. |
| 3 | Includes the BC Housing Management Commission and the Provincial Rental Housing Corporation. BC Housing Management Commission has been approved for up to $2 billion for future borrowing to fund investments in affordable housing through HousingHub. The debt forecast reflects projects that have been approved as of September 2021. |
| | Second Quarterly Report 2021/22 | | 27 |
| | | |
Updated Financial Forecast
Table 1.13 2021/22 Statement of Financial Position
| | | Actual | | | Year-to-Date | | | Forecast | |
| | | March 31, | | | September 30, | | | March 31, | |
| ($ millions) | | 2021 | | | 2021 | | | 2022 | |
| Financial assets: | | | | | | | | | | | | |
| Cash and temporary investments | | | 6,560 | | | | 5,935 | | | | 2,454 | |
| Other financial assets | | | 15,399 | | | | 16,634 | | | | 16,113 | |
| Sinking funds | | | 492 | | | | 507 | | | | 515 | |
| Investments in commercial Crown corporations: | | | | | | | | | | | | |
| Retained earnings | | | 9,623 | | | | 10,336 | | | | 11,241 | |
| Recoverable capital loans | | | 26,301 | | | | 27,098 | | | | 28,420 | |
| | | | 35,924 | | | | 37,434 | | | | 39,661 | |
| Total financial assets | | | 58,375 | | | | 60,510 | | | | 58,743 | |
| Liabilities: | | | | | | | | | | | | |
| Accounts payable and accrued liabilities | | | 13,092 | | | | 11,613 | | | | 13,426 | |
| Deferred revenue | | | 12,185 | | | | 14,322 | | | | 12,935 | |
| Debt: | | | | | | | | | | | | |
| Taxpayer-supported debt | | | 59,750 | | | | 59,312 | | | | 62,348 | |
| Self-supported debt | | | 27,350 | | | | 28,111 | | | | 29,653 | |
| Forecast allowance | | | - | | | | - | | | | 1,000 | |
| Total provincial debt | | | 87,100 | | | | 87,423 | | | | 93,001 | |
| Add: debt offset by sinking funds | | | 492 | | | | 507 | | | | 515 | |
| Less: guarantees and non-guaranteed debt | | | (1,335 | ) | | | (1,314 | ) | | | (1,237 | ) |
| Financial statement debt | | | 86,257 | | | | 86,616 | | | | 92,279 | |
| Total liabilities | | | 111,534 | | | | 112,551 | | | | 118,640 | |
| Net liabilities | | | (53,159 | ) | | | (52,041 | ) | | | (59,897 | ) |
| Capital and other non-financial assets: | | | | | | | | | | | | |
| Tangible capital assets | | | 52,781 | | | | 54,172 | | | | 58,237 | |
| Other non-financial assets | | | 3,585 | | | | 3,651 | | | | 3,362 | |
| Total capital and other non-financial assets | | | 56,366 | | | | 57,823 | | | | 61,599 | |
| Accumulated surplus (deficit) | | | 3,207 | | | | 5,782 | | | | 1,702 | |
| Changes in Financial Position | | | | | | |
| | | Year-to-Date | | | Forecast | |
| | | September 30, | | | March 31, | |
| ($ millions) | | 2021 | | | 2022 | |
| Deficit/(Surplus) for the period | | (2,365 | ) | | 1,732 | |
| Comprehensive income (increase) decrease | | (210 | ) | | (227 | ) |
| Decrease (increase) in accumulated surplus | | (2,575 | ) | | 1,505 | |
| Capital and other non-financial asset changes: | | | | | | |
| Taxpayer-supported capital investments | | 2,673 | | | 8,141 | |
| Less: amortization and other accounting changes | | (1,282 | ) | | (2,685 | ) |
| Increase in net capital assets | | 1,391 | | | 5,456 | |
| Increase (decrease) in other non-financial assets | | 66 | | | (223 | ) |
| Increase in capital and other non-financial assets | | 1,457 | | | 5,233 | |
| Increase (decrease) in net liabilities | | (1,118 | ) | | 6,738 | |
| Investment and working capital changes: | | | | | | |
| Investment in commercial Crown corporations: | | | | | | |
| Increase in retained earnings | | 713 | | | 1,618 | |
| Self-supported capital investments | | 1,760 | | | 4,582 | |
| Less: loan repayments and other accounting changes | | (963 | ) | | (2,463 | ) |
| Increase in investment in commercial Crown corporations | | 1,510 | | | 3,737 | |
| Increase (decrease) in cash and temporary investments | | (625 | ) | | (4,106 | ) |
| Increase (decrease) in other working capital | | 592 | | | (347 | ) |
| Increase (decrease) in Investment and working capital | | 1,477 | | | (716 | ) |
| Increase in financial statement debt | | 359 | | | 6,022 | |
| Decrease in sinking fund debt | | (15 | ) | | (23 | ) |
| Decrease in guarantees and non-guaranteed debt | | (21 | ) | | (98 | ) |
| Increase in total provincial debt | | 323 | | | 5,901 | |
| 28 | | Second Quarterly Report 2021/22 | |
| | | |
Updated Financial Forecast
Table 1.14 Material Assumptions – Revenue
| | Budget | | First | | Second | | |
| Revenue Source and Assumptions | Estimate | | Quarter | | Quarter | | |
| ($ millions unless otherwise specified) | | 2021/22 | | | Forecast | | | Forecast | | 2021/22 Sensitivities |
| Personal income tax * | | 11,170 | | | 13,340 | | | 14,252 | | |
| Current calendar year assumptions | | | | | | | | | | |
| Household income growth | | 0.8 | % | | 4.4 | % | | 4.4 | % | +/- 1 percentage point change in |
| Compensation of employees growth | | 4.5 | % | | 8.6 | % | | 8.6 | % | 2021 B.C. household income growth |
| Tax base growth | | 0.0 | % | | 4.0 | % | | 3.5 | % | equals +/- $100 to $120 million |
| Average tax yield | | 5.53 | % | | 5.81 | % | | 6.03 | % | |
| Current-year tax | | 10,819 | | | 11,978 | | | 12,343 | | |
| Prior year’s tax assessments | | 450 | | | 450 | | | 460 | | |
| Unapplied taxes | | 100 | | | 100 | | | 100 | | |
| B.C. Tax Reduction | | (185 | ) | | (190 | ) | | (195 | ) | |
| Non-refundable B.C. tax credits | | (114 | ) | | (114 | ) | | (115 | ) | |
| Policy neutral elasticity ** | | 1.2 | | | 1.1 | | | 0.9 | | +/- 0.5 change in 2021 B.C. |
| Fiscal year assumptions | | | | | | | | | | policy neutral elasticity |
| Prior-year adjustment | | | | | 1,009 | | | 1,557 | | equals -/+ $40 to $50 million |
| 2020 Tax-year | | 2020 Assumptions | | |
| Household income growth | | 4.9 | % | | 5.5 | % | | 7.0 | % | +/- 1 percentage point change in 2020 |
| Tax base growth | | 4.9 | % | | 6.3 | % | | 6.1 | % | B.C. household or taxable income |
| Average 2020 tax yield | | 5.48 | % | | 5.76 | % | | 6.00 | % | growth equals +/- $120 to $140 million |
| 2020 tax | | 10,720 | | | 11,420 | | | 11,870 | | one-time effect |
| 2019 & prior year’s tax assessments | | 470 | | | 500 | | | 530 | | (prior-year adjustment) |
| Unapplied taxes | | 100 | | | 100 | | | 100 | | and could result in an |
| B.C. Tax Reduction | | (190 | ) | | (200 | ) | | (205 | ) | additional +/- $100 to $120 million |
| Non-refundable B.C. tax credits | | (104 | ) | | (104 | ) | | (123 | ) | base change in 2021/22 |
| Policy neutral elasticity ** | | 1.0 | | | 2.1 | | | 2.3 | | |
| * Reflects information as at November 9, 2021 | | | | | | | | | | |
| ** Per cent growth in current year tax revenue (excluding policy measures) relative to per cent growth in household income (calendar year). |
| Corporate income tax * | | 3,409 | | | 4,643 | | | 4,857 | | |
| Components of revenue (fiscal year) | | | | | | | | | | |
| Installments – subject to general rate | | 4,226 | | | 4,965 | | | 4,968 | | |
| Installments – subject to small business rate | | 257 | | | 302 | | | 307 | | |
| Non-refundable B.C. tax credits | | (112 | ) | | (112 | ) | | (128 | ) | |
| Advance installments | | 4,371 | | | 5,155 | | | 5,147 | | |
| Prior-year settlement payment | | (962 | ) | | (512 | ) | | (290 | ) | |
| Current calendar year assumptions | | | | | | | | | | |
| National tax base ($ billions) | | 356.4 | | | 376.8 | | | 376.8 | | +/- 1% change in the 2021 |
| B.C. installment share of national tax base | | 13.3 | % | | 14.3 | % | | 14.4 | % | national tax base equals |
| Effective percentage tax rates (% general/small business) | | 12.0 / 2.0 | | | 12.0 / 2.0 | | | 12.0 / 2.0 | | +/- $40 to $50 million |
| Share of the B.C. tax base subject to the | | | | | | | | | | |
| small business rate | | 26.8 | % | | 26.8 | % | | 27.1 | % | +/- 1 percentage point change in the |
| B.C. tax base growth (post federal measures) | | 10.1 | % | | 10.0 | % | | 10.0 | % | 2021 small business share equals |
| B.C. net operating surplus growth | | 9.2 | % | | 14.9 | % | | 14.9 | % | -/+ $40 to $50 million |
| 2020 Tax-year | | 2020 Assumptions | | |
| B.C. tax base growth (post federal measures) | | -4.0 | % | | 6.0 | % | | 6.4 | % | |
| Share of the B.C. tax base subject to | | | | | | | | | | |
| small business rate | | 27.3 | % | | 27.3 | % | | 27.6 | % | +/- 1% change in the 2020 B.C. tax base |
| B.C. net operating surplus growth | | -13.6 | % | | -8.1 | % | | 19.1 | % | equals +/- $40 to $50 million one-time effect |
| Gross 2020 tax | | 4,378 | | | 4,829 | | | 4,862 | | (prior-year adjustment) and could result in an |
| Prior-year settlement payment | | (962 | ) | | (512 | ) | | (290 | ) | additional installments payments of |
| Prior years losses/gains (included in above) | | (300 | ) | | (300 | ) | | (100 | ) | +/- $60 to $70 million in 2021/22 |
| Non-refundable B.C. tax credits | | (105 | ) | | (105 | ) | | (117 | ) | |
| | | | | | | | | | | |
| * Reflects information as at November 9, 2021 | | | | | | | | | | |
| | | | | | | | | | | |
| Cash received from the federal government is used as the basis for estimating revenue. Due to lags in the federal collection and installment systems, changes to the B.C. net operating surplus and tax base forecasts affect revenue in the succeeding year. The 2021/22 installments from the federal government reflects two-third of payments related to the 2021 tax year (paid during Apr-July 2021 and adjusted in Sept and Dec) and one-third of 2022 payments. Installments for the 2021 (2022) tax year are based on B.C.’s share of the national tax base for the 2020 (2021) tax year and a forecast of the 2021 (2022) national tax base. B.C.’s share of the 2019 national tax base was 14.1%, based on tax assessments as of December 31, 2020. Cash adjustments for any under/over payments from the federal government in respect of 2020 will be received/paid on March 31, 2022. |
ð
| Second Quarterly Report 2021/22 | | 29 |
| | | |
Updated Financial Forecast
Table 1.14 Material Assumptions – Revenue (continued)
| | Budget | | First | | Second | | |
| Revenue Source and Assumptions | Estimate | | Quarter | | Quarter | | |
| ($ millions unless otherwise specified) | 2021/22 | | | Forecast | | | Forecast | | 2021/22 Sensitivities |
| Employer health tax | | 1,923 | | | 2,050 | | | 2,085 | | |
| Compensation of employees growth | | 4.5 | % | | 8.6 | % | | 8.6 | % | +/- 1 percentage point change in the 2021 compensation |
| | | | | | | | | | | of employees growth equals up to +/- $20 million |
| Provincial sales tax | | 7,872 | | | 7,936 | | | 8,136 | | |
| Provincial sales tax base growth (fiscal year) | | 5.0 | % | | 10.3 | % | | 10.3 | % | +/- 1 percentage point change in the |
| Calendar Year nominal expenditure | | | | | | | | | | 2021 consumer expenditure growth |
| Consumer expenditures on durable goods | | 2.6 | % | | 17.9 | % | | 17.9 | % | equals up to +/- $20 million |
| Consumer expenditures on goods and services | | 5.3 | % | | 6.6 | % | | 6.6 | % | |
| Business investment | | 5.6 | % | | 15.9 | % | | 15.9 | % | |
| Other | | 7.8 | % | | 12.0 | % | | 12.0 | % | |
| Components of Provincial sales tax revenue | | | | | | | | | | +/- 1 percentage point change in the |
| Consolidated Revenue Fund | | 7,867 | | | 7,931 | | | 8,131 | | 2021 business investment growth |
| BC Transportation Financing Authority | | 5 | | | 5 | | | 5 | | equals up to +/- $10 million |
| Fuel and carbon taxes | | 2,968 | | | 3,062 | | | 3,098 | | |
| Calendar Year | | | | | | | | | | |
| Real GDP | | 4.4 | % | | 6.0 | % | | 6.0 | % | |
| Gasoline volumes | | 5.0 | % | | 5.0 | % | | 8.0 | % | |
| Diesel volumes | | 5.0 | % | | 5.0 | % | | 10.0 | % | |
| Natural gas volumes | | 5.0 | % | | 5.0 | % | | 5.0 | % | |
| Carbon tax rates (April 1) | | | | | | | | | | |
| Carbon dioxide equivalent emissions ($/tonne) | | 45 | | | 45 | | | 45 | | |
| Natural gas (cents/gigajoule) | | 223.47¢ | | | 223.47¢ | | | 223.47¢ | | |
| Gasoline (cents/litre) | | 9.96¢ | | | 9.96¢ | | | 9.96¢ | | |
| Light fuel oil (cents/litre) | | 11.71¢ | | | 11.710¢ | | | 11.71¢ | | |
| | | | | | | | | | | |
| Components of revenue * | | | | | | | | | | |
| Consolidated Revenue Fund | | 528 | | | 539 | | | 559 | | |
| BC Transit | | 18 | | | 17 | | | 18 | | |
| BC Transportation Financing Authority | | 437 | | | 438 | | | 453 | | |
| Fuel tax revenue | | 983 | | | 994 | | | 1,030 | | |
| Carbon tax revenue | | 1,985 | | | 2,068 | | | 2,068 | | |
| Property taxes | | 2,970 | | | 3,012 | | | 3,013 | | |
| Calendar Year | | | | | | | | | | |
| Consumer Price Index | | 1.7 | % | | 2.4 | % | | 2.4 | % | +/- 1 percentage point change in |
| Housing starts (units) | | 34,500 | | | 46,000 | | | 46,000 | | 2021 new construction & inflation |
| Home owner grants (fiscal year) | | 887 | | | 873 | | | 873 | | growth equals up to +/- $20 million in |
| Components of revenue | | | | | | | | | | residential property taxation revenue |
| Residential (net of home owner grants) | | 1,167 | | | 1,184 | | | 1,184 | | |
| Speculation and vacancy | | 80 | | | 80 | | | 80 | | |
| Non-residential | | 1,371 | | | 1,367 | | | 1,367 | | +/- 1% change in 2021 total |
| Rural area | | 129 | | | 129 | | | 129 | | business property assessment |
| Police | | 36 | | | 36 | | | 36 | | value equals up to +/- $15 million |
| BC Assessment Authority | | 101 | | | 126 | | | 126 | | in non-residential property |
| BC Transit | | 86 | | | 90 | | | 91 | | taxation revenue |
| Other taxes | | 3,470 | | | 3,765 | | | 4,430 | | |
| Calendar Year | | | | | | | | | | |
| Population | | 0.6 | % | | 0.9 | % | | 0.9 | % | |
| Residential sales value | | 8.0 | % | | 38.7 | % | | 38.7 | % | |
| Real GDP | | 4.4 | % | | 6.0 | % | | 6.0 | % | |
| Nominal GDP | | 6.4 | % | | 11.0 | % | | 11.0 | % | |
| Components of revenue | | | | | | | | | | +/- 1% change to 2021 residential |
| Property transfer | | 1,975 | | | 2,335 | | | 3,000 | | sales value equals +/- $15 million |
| Additional Property Transfer Tax (included in above) | | 99 | | | 105 | | | 105 | | in property transfer revenue, |
| Tobacco | | 780 | | | 780 | | | 780 | | depending on property values |
| Insurance premium | | 715 | | | 650 | | | 650 | | |
| | | | | | | | | | | |
ð
| 30 | | Second Quarterly Report 2021/22 | |
| | | |
Updated Financial Forecast
Table 1.14 Material Assumptions – Revenue (continued)
| | Budget | | First | | Second | | |
| Revenue Source and Assumptions | Estimate | | Quarter | | Quarter | | |
| ($ millions unless otherwise specified) | | 2021/22 | | | Forecast | | | Forecast | | 2021/22 Sensitivities |
| Energy, sales of Crown land tenures, | | | | | | | | | | |
| metals, minerals and other * | | 825 | | | 1,242 | | | 1,674 | | |
| Natural gas price | | | | | | | | | | +/- $0.25 change in the natural gas |
| Plant inlet, $C/gigajoule | | 1.48 | | | 1.79 | | | 2.28 | | price equals +/- $40 to $60 million, |
| Sumas, $US/MMBtu | | 2.79 | | | 2.89 | | | 3.20 | | including impacts on production |
| Natural gas production volumes | | | | | | | | | | volumes and royalty program |
| Billions of cubic metres | | 60.3 | | | 56.9 | | | 58.5 | | credits, but excluding any |
| Petajoules | | 2,505 | | | 2,362 | | | 2,428 | | changes from natural gas liquids |
| Annual per cent change | | 8.9 | % | | 2.6 | % | | 5.5 | % | revenue (e.g. butane, pentanes) |
| | | | | | | | | | | Sensitivities can also vary |
| Oil price ($US/bbl at Cushing, OK) | | 48.38 | | | 68.11 | | | 69.31 | | significantly at different price levels |
| | | | | | | | | | | +/- 1% change in natural gas |
| Auctioned land base (000 hectares) | | - | | | 6 | | | 6 | | volumes equals +/- $3 million |
| Average bid price/hectare ($) | | - | | | 660 | | | 660 | | in natural gas royalties |
| Cash sales of Crown land tenures | | - | | | 4 | | | 4 | | +/- 1 cent change in the exchange rate |
| Metallurgical coal price ($US/tonne, fob Australia) | | 136 | | | 158 | | | 192 | | equals +/-$3 million in natural gas royalties |
| Copper price ($US/lb) | | 3.52 | | | 4.17 | | | 4.17 | | |
| Annual electricity volumes set by treaty | | 3.8 | | | 3.8 | | | 3.8 | | +/- $10/bbl change in petroleum price |
| (million mega-watt hours) | | | | | | | | | | equals +/- $6 million in petroleum royalties |
| Mid-Columbia electricity price | | 36.98 | | | 69.89 | | | 65.18 | | +/- 21% change in natural gas liquids |
| ($US/mega-watt hour) | | | | | | | | | | (equivalent to +/- $10/bbl oil price) prices |
| | | | | | | | | | | equals +/- $40 to $50 million in natural gas |
| Exchange rate (US¢/C$, calendar year) | | 79.0 | | | 81.1 | | | 79.8 | | liquids royalties |
| Components of revenue | | | | | | | | | | |
| Bonus bid auctions: | | | | | | | | | | +/- US$20 change in the average |
| Deferred revenue | | 91 | | | 91 | | | 91 | | metallurgical coal price |
| Current-year cash (one-tenth) | | - | | | - | | | - | | equals +/- $50 to $80 million |
| Fees and rentals | | 50 | | | 52 | | | 50 | | +/- 10% change in the average |
| Total bonus bids, fees and rentals | | 141 | | | 143 | | | 141 | | Mid-Columbia electricity price |
| Natural gas royalties after deductions and allowances | | 286 | | | 458 | | | 667 | | equals +/- $15 million |
| Petroleum royalties | | 21 | | | 31 | | | 30 | | |
| Columbia River Treaty electricity sales | | 161 | | | 310 | | | 294 | | Based on a recommendation |
| Oil and Gas Commission fees and levies | | 71 | | | 63 | | | 63 | | from the Auditor General to be |
| Coal, metals and other minerals revenue: | | | | | | | | | | consistent with generally |
| Coal tenures | | 8 | | | 8 | | | 5 | | accepted accounting principles, |
| Net coal mineral tax | | 29 | | | 84 | | | 323 | | bonus bid revenue recognition |
| Net metals and other minerals tax | | 49 | | | 86 | | | 92 | | reflects ten-year deferral of |
| Recoveries relating to revenue sharing payments to First Nations | | 41 | | | 41 | | | 41 | | cash receipts from the sale of Crown land tenures |
| Miscellaneous mining revenue | | 18 | | | 18 | | | 18 | | |
| Total coal, metals and other minerals revenue | | 145 | | | 237 | | | 479 | | |
| | | | | | | | | | | |
| Gross royalties prior to deductions and allowances | | | | | | | | | | |
| Gross natural gas revenue | | 625 | | | 882 | | | 1,360 | | |
| Gross natural gas liquids royalties revenue | | 439 | | | 639 | | | 741 | | |
| | | | | | | | | | | |
| Royalty programs and infrastructure credits | | | | | | | | | | |
| Deep drilling | | (514 | ) | | (782 | ) | | (1,109 | ) | |
| Road, pipeline, Clean Growth Infrastructure Royalty and other infrastructure programs | | (71 | ) | | (72 | ) | | (83 | ) | |
| Total | | (585 | ) | | (854 | ) | | (1,192 | ) | |
| Implicit average natural gas royalty rate | | 7.7 | % | | 10.8 | % | | 12.0 | % | |
| | | | | | | | | | | |
| Royalty program (marginal, low productivity and ultra marginal drilling) adjustments reflect reduced royalty rates. |
| Natural gas royalties incorporate royalty programs and Treasury Board approved infrastructure credits. |
| * Reflects information as at October 28, 2021. |
ð
| Second Quarterly Report 2021/22 | | 31 |
| | | |
Updated Financial Forecast
Table 1.14 Material Assumptions – Revenue (continued)
| | Budget | | First | | Second | | |
| Revenue Source and Assumptions | Estimate | | Quarter | | Quarter | | |
| ($ millions unless otherwise specified) | | 2021/22 | | | Forecast | | | Forecast | | 2021/22 Sensitivities |
| Forests * | | 1,204 | | | 1,434 | | | 1,433 | | |
| Prices (calendar year average) | | | | | | | | | | +/- US$50 change in SPF |
| SPF 2x4 ($US/thousand board feet) | | 650 | | | 900 | | | 870 | | price equals +/- $125 to $175 million |
| | | | | | | | | | | |
| Crown harvest volumes (million cubic metres) | | | | | | | | | | |
| Interior | | 35.0 | | | 35.0 | | | 33.1 | | +/- 10% change in Interior |
| Coast | | 11.0 | | | 11.0 | | | 9.4 | | harvest volumes equals |
| Total | | 46.0 | | | 46.0 | | | 42.5 | | +/- $80 to $90 million |
| B.C. Timber Sales (included in above) | | 10.0 | | | 10.0 | | | 9.9 | | +/- 10% change in Coastal |
| | | | | | | | | | | harvest volumes equals |
| Stumpage rates ($Cdn/cubic metre) | | | | | | | | | | +/- $20 to $25 million |
| Total stumpage rates | | 24.21 | | | 29.21 | | | 31.23 | | +/- 1 cent change in |
| | | | | | | | | | | exchange rate equals |
| Components of revenue | | | | | | | | | | +/- $20 to $30 million in |
| Timber tenures (net of revenue sharing recoveries) | | 744 | | | 925 | | | 889 | | stumpage revenue |
| Recoveries relating to revenue sharing payments | | | | | | | | | | |
| to First Nations | | 46 | | | 46 | | | 46 | | |
| B.C. Timber Sales | | 344 | | | 393 | | | 413 | | The above sensitivities relate |
| Logging tax | | 30 | | | 30 | | | 45 | | to stumpage revenue only. |
| Other CRF revenue | | 30 | | | 30 | | | 30 | | |
| Recoveries | | 10 | | | 10 | | | 10 | | |
| * Reflects information as at November 3, 2021 | | | | | | | | | | |
| | | | | | | | | | | |
| Other natural resource | | 503 | | | 503 | | | 499 | | |
| Components of revenue | | | | | | | | | | |
| Water rental and licences* | | 430 | | | 431 | | | 427 | | +/- 5% change in water |
| Recoveries | | 50 | | | 50 | | | 50 | | power production equals |
| Angling and hunting permits and licences | | 10 | | | 9 | | | 9 | | +/- $15 to $20 million |
| Recoveries | | 13 | | | 13 | | | 13 | | |
| * Water rentals for power purposes are indexed to Consumer Price Index. |
| Total natural resource recoveries relating to revenue sharing payments to First Nations | | 88 | | | 88 | | | 88 | | Revenue sharing from natural gas royalties, mineral tax and forest stumpage revenues. |
| Other revenue | | 9,220 | | | 9,388 | | | 9,484 | | |
| Components of revenue | | | | | | | | | | |
| Fees and licences | | | | | | | | | | |
| Motor vehicle licences and permits | | 578 | | | 602 | | | 607 | | |
| International student health fees | | 70 | | | 66 | | | 65 | | |
| Other Consolidated Revenue Fund | | 448 | | | 453 | | | 465 | | |
| Summary consolidation eliminations | | (14 | ) | | (14 | ) | | (15 | ) | |
| Ministry vote recoveries | | 187 | | | 187 | | | 187 | | |
| Taxpayer-supported Crown corporations | | 155 | | | 171 | | | 175 | | |
| Post-secondary education fees | | 2,508 | | | 2,563 | | | 2,544 | | |
| Other healthcare-related fees | | 437 | | | 442 | | | 426 | | |
| School Districts | | 268 | | | 268 | | | 268 | | |
| Investment earnings | | | | | | | | | | |
| Consolidated Revenue Fund | | 98 | | | 94 | | | 85 | | |
| Fiscal agency loans & sinking funds earnings | | 863 | | | 865 | | | 869 | | |
| Summary consolidation eliminations | | (43 | ) | | (40 | ) | | (41 | ) | |
| Taxpayer-supported Crown corporations | | 30 | | | 31 | | | 38 | | |
| SUCH sector agencies | | 226 | | | 286 | | | 332 | | |
| Sales of goods and services | | | | | | | | | | |
| SUCH sector agencies | | 704 | | | 686 | | | 809 | | |
| BC Infrastructure Benefits Inc | | 120 | | | 120 | | | 57 | | |
| Other taxpayer-supported Crown corporations | | 180 | | | 183 | | | 186 | | |
| Miscellaneous | | 2,405 | | | 2,425 | | | 2,427 | | |
ð
| 32 | | Second Quarterly Report 2021/22 | |
| | | |
Updated Financial Forecast
Table 1.14 Material Assumptions – Revenue (continued)
| | Budget | | First | | Second | | |
| Revenue Source and Assumptions | Estimate | | Quarter | | Quarter | | |
| ($ millions unless otherwise specified) | | 2021/22 | | | Forecast | | | Forecast | | 2021/22 Sensitivities |
| Health and social transfers | | 7,939 | | | 8,496 | | | 8,534 | | |
| National Cash Transfers | | | | | | | | | | |
| Canada Health Transfer (CHT) | | 43,126 | | | 43,126 | | | 43,126 | | |
| Annual growth | | 3.0 | % | | 3.0 | % | | 3.0 | % | |
| Canada Social Transfer (CST) | | 15,474 | | | 15,474 | | | 15,474 | | |
| B.C.’s share of national population (June 1) | | 13.548 | % | | 13.573 | % | | 13.622 | % | +/- 0.1 percentage point change in B.C.’s population share equals |
| B.C. health and social transfers revenue | | | | | | | | | | +/- $60 million |
| CHT | | 5,843 | | | 5,854 | | | 5,875 | | |
| CST | | 2,096 | | | 2,100 | | | 2,108 | | |
| Prior-year adjustments: | | | | | | | | | | |
| CHT | | - | | | - | | | 7 | | |
| CST | | - | | | - | | | 2 | | |
| Helping Health Care Systems Recover funding | | - | | | 542 | | | 542 | | |
| | | | | | | | | | | |
| Other federal contributions | | 2,591 | | | 2,947 | | | 2,961 | | |
| Components of revenue | | | | | | | | | | |
| COVID-19 related funding: | | | | | | | | | | |
| Financial Assistance Agreement to Support Closure and Restoration of Oil and Gas | | | | | | | | | | |
| Sites in British Columbia | | 40 | | | 53 | | | 53 | | |
| Long term care facilities | | | | | 134 | | | 134 | | |
| Canada’s COVID-19 Immunization Plan | | 135 | | | 135 | | | 135 | | |
| Total | | 175 | | | 322 | | | 322 | | |
| Disaster Financial Assistance Arrangements | | - | | | - | | | 3 | | |
| B.C.’s share of the federal cannabis excise tax | | 50 | | | 60 | | | 60 | | |
| Low Carbon Economy Leadership Fund | | 13 | | | 13 | | | 13 | | |
| Other Consolidated Revenue Fund | | 153 | | | 152 | | | 149 | | |
| Vote Recoveries: | | | | | | | | | | |
| Labour Market Development Agreement | | 339 | | | 339 | | | 339 | | |
| Labour Market and Skills Training Program | | 191 | | | 191 | | | 191 | | |
| Home Care | | 122 | | | 122 | | | 122 | | |
| Mental Health | | 81 | | | 81 | | | 81 | | |
| Low Carbon Economy Leadership Fund | | 28 | | | 28 | | | 28 | | |
| Canada-Wide Early Learning and Child Care Agreement | | - | | | 87 | | | 87 | | |
| Early Childhood Development and Child Care Services | | 41 | | | 41 | | | 41 | | |
| Child Safety, Family Support, Children in Care and with special needs | | 93 | | | 93 | | | 93 | | |
| Policing and Security | | 10 | | | 10 | | | 10 | | |
| Public Transit | | 88 | | | 88 | | | 88 | | |
| Local government services and transfers | | 191 | | | 191 | | | 191 | | |
| Other recoveries | | 110 | | | 110 | | | 110 | | |
| Taxpayer-supported Crown corporations | | 265 | | | 290 | | | 288 | | |
| Post-secondary institutions | | 527 | | | 610 | | | 625 | | |
| Other SUCH sector agencies | | 114 | | | 119 | | | 120 | | |
| Service delivery agency direct revenue | | 7,682 | | | 7,988 | | | 8,118 | | |
| School districts | | 705 | | | 719 | | | 719 | | |
| Post-secondary institutions | | 4,189 | | | 4,400 | | | 4,595 | | |
| Health authorities and hospital societies | | 1,023 | | | 1,047 | | | 1,042 | | |
| BC Transportation Financing Authority | | 531 | | | 522 | | | 523 | | |
| Other service delivery agencies | | 1,234 | | | 1,300 | | | 1,239 | | |
ð
| Second Quarterly Report 2021/22 | | 33 |
| | | |
Updated Financial Forecast
Table 1.14 Material Assumptions – Revenue (continued)
| | Budget | | First | | Second | | |
| Revenue Source and Assumptions | Estimate | | Quarter | | Quarter | | |
| ($ millions unless otherwise specified) | | 2021/22 | | | Forecast | | | Forecast | | 2021/22 Sensitivities |
| Commercial Crown corporation net income | | 2,865 | | | 3,336 | | | 3,751 | | |
| BC Hydro | | 712 | | | 704 | | | 689 | | Sensitivities impacts shown below are before regulatory account transfers |
| Reservoir water inflows | | 100 | % | | 102 | % | | 102 | % | +/-1% in hydro generation equals +/- $10 million |
| Mean gas price | | 3.08 | | | 2.99 | | | 2.99 | | +/-10% equals +/-$0.4 million |
| (Sumas, $US/MMbtu – BC Hydro forecast based on NYMEX forward selling prices) | | | | | | | | | | |
| Electricity prices | | 30.83 | | | 36.47 | | | 36.47 | | +/-10% change in electricity trade margin equals |
| (Mid-C, $US/MWh) | | | | | | | | | | +/- $15 million |
| | | | | | | | | | | |
| ICBC | | 154 | | | 471 | | | 697 | | |
| Vehicle growth | | 1.8 | % | | 1.8 | % | | 2.6 | % | +/-1% equals +/-$51 million |
| Current claims cost percentage change | | -13.0 | % | | 7.2 | % | | 4.5 | % | +/-1% equals +/-$39 million |
| Unpaid claims balance ($ billions) | | 14.0 | | | 13.7 | | | 14.2 | | +/-1% equals +/-$142 to $155 million |
| Investment return | | 2.3 | % | | 3.8 | % | | 4.1 | % | +/-1% return equals +/-$206 to $212 million |
| Loss ratio | | 86.3 | % | | 86.2 | % | | 83.3 | % | |
ð
| 34 | | Second Quarterly Report 2021/22 | |
| | | |
Updated Financial Forecast
| Table 1.15 Material Assumptions – Expense |
| |
| | Budget | First | Second | |
| Ministry Programs and Assumptions | Estimate | Quarter | Quarter | |
| ($ millions unless otherwise specified) | 2021/22 | Forecast | Forecast | 2021/22 Sensitivities |
| Advanced Education and Skills Training | 2,592 | 2,592 | 2,592 | |
| Student spaces in public institutions | 206,513 | 206,513 | 206,513 | Student enrolments may fluctuate due to a number of factors including economic changes and labour market needs. Current year forecast to be updated at Q3 to align with PSI reporting, consistent with past practice. |
| | | | |
| | | | |
| | | | |
| Attorney General | 1,272 | 1,272 | 1,272 | |
| New cases filed/processed | 242,000 | 210,000 | 216,000 | The number of criminal cases proceeded on by the provincial and federal Crown (does NOT include Court Appeal), the number of civil and family litigation cases, the number of violation tickets disputed, and the number of municipal bylaw tickets disputed which would go to court for resolution. |
| (# for all courts) | | | |
| | | | |
| | | | |
| | | | |
| Crown Proceeding Act (CPA) | 25 | 25 | 25 | The number of new cases, and the difference between estimated settlements and actual settlements. |
| | | | | |
| Children and Family Development | 2,393 | 2,393 | 2,393 | |
| Average children-in-care | 5,160 | 5,124 | 5,124 | The average number of children-in-care is decreasing as a result of ministry efforts to keep children in family settings where safe and feasible. The average cost per child in care is projected to increase based on the higher cost of contracted residential services and an increasing acuity of need for children in care. A 1% increase in the cost per case or a 1% increase in the average caseload will affect expenditures by $2.4 million (excluding Delegated Aboriginal Agencies). |
| caseload (#) | | | |
| Average annual residential | 92,137 | 94,547 | 94,547 |
| cost per child in care ($) | | | |
| | | | |
| | | | |
| | | | |
| | | | |
| Education | 7,132 | 7,132 | 7,132 | |
| Public School Enrolment (# of FTEs) | 567,675 | 571,838 | 571,839 | Updated forecast enrolment figures are based on submissions from school districts of their actual enrolment as at September 30, 2020 for the 2020/21 school year and projected enrolment for February and May 2021 for Distributed Learning and Adults. Projections for 2021/22 and 2022/23 are based on the Ministry of Education’s enrolment forecasting model as at July 2021. |
| School age (K-12) | 541,741 | 546,997 | 546,997 |
| Continuing Education | 962 | 917 | 917 |
| Distributed Learning (online) | 15,460 | 14,357 | 14,357 |
| Summer | 7,279 | 7,279 | 7,279 |
| Adults | 2,233 | 2,288 | 2,288 |
| | | | | |
| Forests, Lands, Natural Resource | | | | |
| Operations and Rural Development | 888 | 1,633 | 1,464 | |
| BC Timber Sales | 234 | 234 | 234 | Targets can be impacted by changes to actual inventory costs incurred. There is a lag of approximately 1.5 years between when inventory costs are incurred and when they are expensed. Volume harvested can also impact targets. For example, if volume harvested is less than projected in any year, then capitalized expenses will also be reduced in that year. |
| | | | |
| | | | |
| | | | |
| | | | |
| | | | |
| | | | |
| Fire Management | 136 | 881 | 712 | Costs are driven by length of season and severity of weather conditions, severity of fires, proportion of interface fires and size of fires |
| | | | |
| | | | |
| Health | 23,873 | 23,873 | 23,873 | |
| Pharmacare | 1,470 | 1,470 | 1,470 | A 1% change in PharmaCare utilization or prices affects costs by approximately $13 million. |
| | | | |
| Medical Services Plan (MSP) | 5,550 | 5,550 | 5,550 | A 1% increase in volume of services provided by fee-for-service physicians affects costs by approximately $35 million. |
| | | | |
| Regional Services | 16,536 | 16,536 | 16,536 | |
ð
| Second Quarterly Report 2021/22 | | 35 |
| | | |
Updated Financial Forecast
Table 1.15 Material Assumptions - Expense (continued) | |
| | Budget | First | Second | |
| Ministry Programs and Assumptions | Estimate | Quarter | Quarter | |
| ($ millions unless otherwise specified) | 2021/22 | Forecast | Forecast | 2021/22 Sensitivities |
| Public Safety and Solicitor General | 901 | 934 | 957 | |
| Policing, Victim Services and Corrections | 744 | 744 | 744 | Policing, Victim Services and Corrections costs are sensitive to the volume and severity of criminal activity, the number of inmate beds occupied and the number of offenders under community supervision. |
| | | | |
| | | | |
| | | | |
| Emergency Program Act (EPA) | 36 | 69 | 92 | For authorized expenditures under the EPA, including those for further disasters, and the difference between initial estimates for disaster response and recovery costs and final project costs. |
| | | | |
| | | | |
| | | | | |
| Social Development and Poverty Reduction | 4,360 | 4,360 | 4,360 | |
| Temporary Assistance | 43,800 | 60,189 | 54,823 | The expected-to-work caseload is sensitive to fluctuations in economic and employment trends. Costs are driven by changes to cost per case and caseload. Cost per case fluctuations result from changes in the needed supports required by clients, as well as caseload composition. |
| annual average caseload (#) | | | |
| | | | |
| | | | |
| | | | |
| Disability Assistance | 116,800 | 119,207 | 118,526 | The caseload for persons with disabilities is sensitive to the aging of the population and longer life expectancy for individuals with disabilities. Cost per case fluctuations are driven primarily by earnings exemptions which is dependent on the level of income earned by clients. |
| annual average caseload (#) | | | |
| | | | |
| | | | |
| | | | |
| Adult Community Living: | | | | |
| Developmental Disabilities Programs | | | | |
| Average caseload (#) | 22,470 | 22,460 | 22,450 | The adult community living caseload is sensitive to an aging population and to the level of service required. Cost per case fluctuations are driven by the proportion of clients receiving certain types of services at differing costs. For example, residential care services are significantly more costly than day programs. |
| Average cost per client ($) | 52,800 | 52,800 | 52,800 |
| Personal Supports Initiative (PSI) | | | |
| Average caseload (#) | 2,690 | 2,680 | 2,650 |
| Average cost per client ($) | 15,100 | 15,100 | 15,200 |
| | | | | |
ð
| 36 | | Second Quarterly Report 2021/22 | |
| | | |
Updated Financial Forecast
Table 1.15 Material Assumptions - Expense (continued) | |
| | Budget | First | Second | |
| Ministry Programs and Assumptions | Estimate | Quarter | Quarter | |
| ($ millions unless otherwise specified) | 2021/22 | Forecast | Forecast | 2021/22 Sensitivities |
| Tax Transfers | 1,871 | 1,915 | 1,932 | |
| Individuals | 876.0 | 918.0 | 988.0 | |
| Climate Action Tax Credit | 312.0 | 312.0 | 325.0 | These tax transfers are now expensed as required under generally accepted accounting principles. |
| BC Child Opportunity Benefit | 410.0 | 410.0 | 425.0 |
| Sales Tax | 57.5 | 57.5 | 12.5 |
| Small Business Venture Capital | 30.0 | 30.0 | 35.0 | |
| BC Senior’s Home Renovation | 3.0 | 3.0 | 3.0 | Changes in 2020 tax transfers will result in one-time effect (prior-year adjustment) and could result in an additional base change in 2021/22. Production services tax credit is the most volatile of all tax transfers and is influenced by several factors including delay in filing returns and assessment of claims, length of projects and changes in the exchange rates. |
| Other tax transfers to individuals | 63.5 | 105.5 | 187.5 |
| | | | |
| Corporations | 995.0 | 997.0 | 944.0 |
| Film and Television | 117.5 | 117.5 | 91.3 |
| Production Services | 666.7 | 668.5 | 666.8 |
| Scientific Research & Experimental | | | |
| Development | 101.3 | 101.3 | 101.2 |
| Interactive Digital Media | 71.3 | 71.3 | 35.0 |
| Mining Exploration | 20.0 | 20.0 | 31.3 | |
| Other tax transfers to corporations | 18.2 | 18.4 | 18.4 | |
| | | | | |
| Prior-year adjustment (included above)* | | | | |
| Individuals | | 34.5 | 38.5 | |
| Corporations | | - | (42.5) | |
| | | | | |
| 2020 Tax-year | 2020 Assumptions | |
| Tax Transfers | 1,670.0 | 1,702.0 | 1,657.0 | |
| Individuals | 647.0 | 679.0 | 674.0 | |
| Corporations | 1,023.0 | 1,023.0 | 983.0 | |
| Film and Television | 120.0 | 120.0 | 100.0 | |
| Production Services | 695.0 | 695.0 | 695.0 | |
| Scientific Research & Experimental | | | | |
| Development | 95.0 | 95.0 | 95.0 | |
| Interactive Digital Media | 75.0 | 75.0 | 50.0 | |
| Other tax transfers to corporations | 38.0 | 38.0 | 43.0 | |
| | | | | |
| *2021/22 tax transfer forecast incorporates adjustments relating to prior years. | |
| Management of Public Funds and Debt | 1,340 | 1,309 | 1,273 | |
| Interest rates for new provincial borrowing: | | | | Full year impact on MoPD on interest costs of a 1% change in interest rates equals $30.9 million; $100 million increase in debt level equals $2.1 million. |
| Short-term | 0.20% | 0.21% | 0.19% |
| Long-term | 2.53% | 2.96% | 2.76% |
| CDN/US exchange rate (cents) | 126.2 | 122.2 | 124.9 | |
| Service delivery agency net spending | 7,888 | 8,160 | 8,243 | |
| School districts | 576 | 574 | 574 | |
| Post-secondary institutions | 4,181 | 4,306 | 4,444 | |
| Health authorities and hospital societies | 965 | 1,025 | 1,024 | Agency expenses, net of Provincial funding. These are mainly funded through revenue from other sources. |
| BC Transportation Financing Authority | 1,467 | 1,459 | 1,459 |
| BC Infrastructure Benefits Inc. | 120 | 120 | 57 | |
| Other service delivery agencies | 579 | 676 | 685 | |
| Second Quarterly Report 2021/22 | | 37 |
| | | |
Updated Financial Forecast
Table 1.16 Full-Time Equivalents (FTEs) 1
| | | Budget | | | Updated | | | | | | | |
| | | Estimate | | | Forecast | | | | | | Actual | |
| | | 2021/22 | | | 2021/22 | | | Change | | | 2020/21 | |
| Taxpayer-supported programs and agencies: | | | | | | | | | | | | | | | | |
| Ministries and special offices (CRF) | | | 32,750 | | | | 33,400 | | | | 650 | | | | 32,444 | |
| Service delivery agencies 2 | | | 6,910 | | | | 7,019 | | | | 109 | | | | 6,042 | |
| Total FTEs | | | 39,660 | | | | 40,419 | | | | 759 | | | | 38,486 | |
| 1 | Full-time equivalents (FTEs) are a measure of staff employment. FTEs are calculated by dividing the total hours of employment paid for in a given period by the number of hours an individual, full-time person would normally work in that period. This does not equate to the physical number of employees. For example, two half-time employees would equal one FTE, or alternatively, three FTEs may represent two full-time employees who have worked sufficient overtime hours to equal an additional FTE. |
| 2 | Service delivery agency FTE amounts do not include SUCH sector staff employment. |
| 38 | | Second Quarterly Report 2021/22 | |
| | | |
PART 2 | ECONOMIC REVIEW AND OUTLOOK 1
Summary
The economy has continued to rebound from last year’s 3.4 per cent decline, supported by the continued reopening of the economy, easing of restrictions, a strong vaccination program, and ongoing government emergency response programs. However, the economy has faced headwinds since the release of the First Quarterly Report. Movement to Step 4 of BC’s Restart Plan has been delayed and there continues to be a high degree of uncertainty regarding the path of recovery for high-contact industries and the evolution of the pandemic. The Ministry of Finance (Ministry) will update its economic outlook in Budget 2022.
At the time of the First Quarterly Report, an average of six private sector forecasters (a subset of the Economic Forecast Council) anticipated that B.C.’s real GDP would expand by 6.3 per cent in 2021 and 4.3 per cent in 2022. The Ministry’s forecast from the First Quarterly Report for B.C. economic growth of 6.0 per cent in 2021 and 4.0 per cent in 2022 was prudent compared to the private sector outlook at the time.
The private sector outlook for B.C. in 2021 and 2022 has weakened since August, when the First Quarterly Report was developed. As of November 9, 2021, the private sector now projects B.C.’s annual real GDP growth to be 5.5 per cent in 2021 and 4.2 per cent in 2022. Private sector analysts have downgraded the outlooks of all Canadian provinces since August; however, B.C. is still expected to be among the leaders in provincial economic growth in 2021 and 2022.
Chart 2.1 Ministry’s Outlook for B.C. Compared to Private Sector

The reduction in the private sector outlook reflects weaker than expected Canadian GDP data for the April to June quarter, supply-chain disruptions and rising inflation, lower expected growth among major international trading partners, as well as rising COVID-19 case counts and targeted health restrictions in B.C.
1 Reflects data available as of November 9, 2021, unless otherwise indicated.
| Second Quarterly Report 2021/22 | | 39 |
| | | |
ECONOMIC REVIEW AND OUTLOOK
In preparation for Budget 2022, the Minister of Finance will meet with members of the independent Economic Forecast Council on December 3, 2021 to obtain their views on the economic outlook. A revised economic forecast will then be developed by the Ministry and published in Budget 2022.
British Columbia Economic Activity
B.C.’s economic performance in 2021 has recovered from the worst effects of the pandemic on the economy, but the recovery has been uneven and has faced challenges such as supply-chain disruptions, slow non-residential permitting activity, and elevated COVID-19 case counts. Year-to-date data indicates strong growth in retail sales, housing activity, exports and manufacturing shipments, and strengthening of the labour market. Despite year-to-date strength, housing activity and manufacturing shipments have both moderated in recent months.
Table 2.1 British Columbia Economic Indicators
| | | | | | | | Year-to-Date |
| | | Apr. to Jun. 2021 | | Jul. to Sep. 2021 | | | Jan. to Sep. 2021 |
| | | change from | | change from | | | change from |
| All data seasonally adjusted | | Jan. to Mar. 2021 | | Apr. to Jun. 2021 | | | Jan. to Sep. 2020 |
| | | | | Per cent change | | | |
| Employment | | +0.1 | | | +1.4 | | | +7.4 |
| Manufacturing shipments1 | | +5.5 | | | -9.0 | | | +27.0 |
| Exports | | +12.4 | | | -0.6 | | | +37.5 |
| Retail sales1 | | +0.4 | | | -0.2 | | | +17.9 |
| Housing starts | | -6.4 | | | -9.0 | | | +34.0 |
| Non-residential building permits | | +4.5 | | | -19.8 | | | -9.0 |
Labour Market
The labour market continued to strengthen throughout the summer and fall since total employment surpassed pre-pandemic levels in June; however, the rebound remains uneven across industries. Year-to-date to October, B.C. employment was up by 7.1 per cent (+176,360 jobs) compared to the same period one year ago, led by job gains in the service sector (+8.7 per cent). While there were 64,400 more people employed in the service sector in October 2021 than in February 2020 (+3.0 per cent), some service industries that were heavily impacted by social distancing and travel restrictions have not regained their job losses, such as accommodation and food services (-26,500 jobs), other services (-11,600 jobs), and business, building and other support services (-10,500 jobs). Similarly, the goods sector has not fully recovered from its employment losses due to the pandemic, with 13,500 fewer jobs (-2.7 per cent) in October 2021 compared to February 2020 driven by lower employment in construction (-31,300 jobs). Compared to February 2020, full-time employment in October 2021 surpassed pre-pandemic levels for the first time (+1.1 per cent) and part-time employment was 5.1 per cent (+28,300 jobs) higher.
| 40 | | Second Quarterly Report 2021/22 | |
| | | |
ECONOMIC REVIEW AND OUTLOOK
The unemployment rate in B.C. was 5.6 per cent in October 2021, down from 13.4 per cent following the onset of the COVID-19 pandemic, but was still higher than February 2020’s 5.1 per cent. Year-to-date to October, B.C.’s unemployment rate averaged 6.7 per cent, which was 2.7 percentage points lower than its average over the same period last year. Supplemental Labour Force Survey data available since July 2020 shows that visible minorities in B.C. have experienced persistently higher unemployment rates than British Columbians who are neither Indigenous nor part of a group designated as a visible minority.
B.C.’s long-term unemployment has trended down since the peak observed in February 2021, but long-term unemployment remains high by historical standards. Long-term unemployment is associated with the risks of skill erosion and labour market detachment. Meanwhile, B.C.’s labour force rose by 4.1 per cent year-to-date to October 2021, reflecting population growth and an increase in the year-to-date labour force participation rate to 65.4 per cent from 63.5 per cent.
Chart 2.2 B.C. Employment
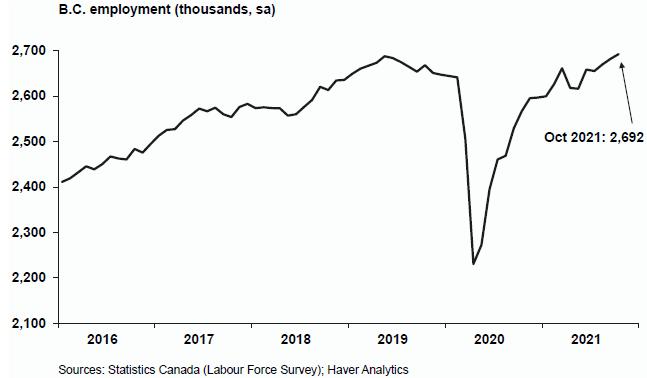
Employee compensation (aggregate wages, salaries and employers’ social contributions) in B.C. in the first six months of 2021 was 10.2 per cent higher than the same period of 2020 and was 5.2 per cent higher in June 2021 relative to February 2020. This reflects base-year2 effects of pandemic lows in 2020 and improvements in the labour market, while employment levels for high-wage workers have remained strong in 2020 and 2021.
| 2 | Year-to-date and year-over-year growth rates compare economic activity in 2021 to 2020. For many economic indicators, activity was low at the onset of the COVID-19 pandemic in 2020. The base year effect refers to the higher than normal growth rates observed when comparing 2021 activity levels against the 2020 lows. |
| Second Quarterly Report 2021/22 | | 41 |
| | | |
ECONOMIC REVIEW AND OUTLOOK
Consumer Spending and Housing
Consumer spending on goods expanded modestly through the spring and summer of 2021, following rapid growth in the winter months. Housing activity remains above historical levels but has tapered off from record highs observed in the spring of this year. Spending activity continued to be supported by extended government emergency response programs, low interest rates, and rising vaccination rates. In addition, higher-wage workers were more likely to retain employment and maintain their income levels during the pandemic, which also supported housing activity. Base-year effects also contributed to the strong performance against low activity levels observed last year at the onset of the pandemic.
Year-to-date to August 2021, B.C. nominal retail sales were up 17.9 per cent compared to the same period in 2020. Underlying the headline growth figure were increases in all major categories, driven by purchases at motor vehicles and parts dealers (+33.6 per cent), building material and garden equipment and supplies dealers (+27.1 per cent), as well as gasoline stations (+23.6 per cent). Growth of sales at food and beverage stores (+0.9 per cent), a category that led last year’s rebound, has softened in the first eight months of 2021 compared to the same period a year earlier.
Chart 2.3 B.C. Retail Sales
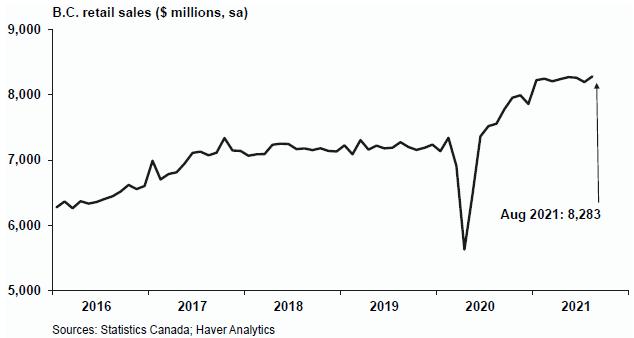
While retail trade data offers a clear and detailed indication of consumer spending on goods, there is a lack of timely comprehensive data for consumer spending on services at the provincial level. In 2020, nominal consumer spending on services in B.C. declined by 5.2 per cent, and more recent national data and sector-specific data show continued weakness in 2021, with some signs of improvement at the end of the summer. National data shows that nominal consumer spending on services in the April to June quarter (second quarter) of 2021 was still below pre-pandemic levels. However, sales at food services and drinking places in B.C., a component of the service sector, rebounded from June to August 2021, as venues reopened. In August 2021, sales at food services and drinking places were 1.5 per cent above pre-pandemic levels.
| 42 | | Second Quarterly Report 2021/22 | |
| | | |
ECONOMIC REVIEW AND OUTLOOK
Similar to the strength and resilience observed in spending on goods, surveys suggest an improvement in consumer confidence, despite increased COVID-19 cases in the fall months and targeted restrictions in parts of the province. The Conference Board of Canada’s consumer confidence index for B.C. averaged 129.0 points in the first ten months of this year and was 36.3 points higher than the same period one year ago. The consumer confidence reading in October is the second time the index has surpassed pre-pandemic levels. The Bank of Canada’s latest Canadian Survey of Consumer Expectations, released in October 2021, noted that Canadian consumer expectations for spending growth remained high, reflecting comfort in resuming regular activities, as well as extra savings and pent-up demand.
Monthly B.C. home sales reached a record high in March 2021, but have declined by 35.2 per cent in the following six months as the housing market began to ease from significant increases in activity observed in prior months. Despite the decline, monthly B.C. MLS home sales in September 2021 remained at higher levels than were seen in any month in 2018 or 2019. Housing market activity in B.C. has been supported by resilient higher-wage employment, low interest rates and increased demand for larger dwellings by remote workers. Year-to-date to September, home sales were up by 55.9 per cent compared to the same period last year. Underlying this year-to-date rise were higher sales in every region, including the four largest: Greater Vancouver (+64.7 per cent), Fraser Valley (+70.2 per cent), Okanagan-Mainline (+50.9 per cent), and Victoria (+36.6 per cent).
Meanwhile, the average home sale price in B.C. increased by 19.6 per cent in the first nine months of 2021 compared to the same period a year earlier. Strong average sale price growth was observed in all regions.
Chart 2.4 B.C. Home Sales and Price
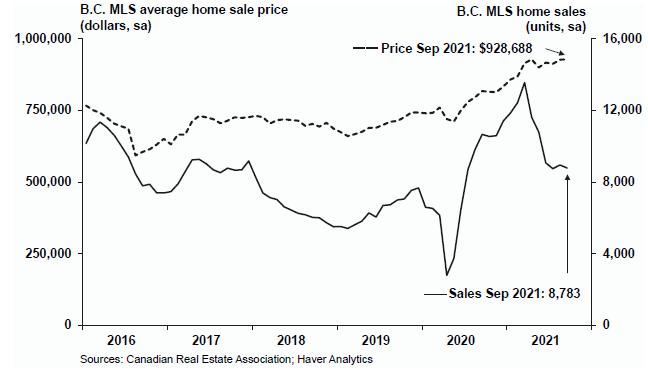
Regional MLS composite benchmark house prices for Greater Vancouver and the Fraser Valley were higher than last year, with year-to-date to September increases of 11.5 per cent and 19.5 per cent, respectively. Price increases were observed across all dwelling types, but were strongest for single-family detached dwellings.
| Second Quarterly Report 2021/22 | | 43 |
| | | |
ECONOMIC REVIEW AND OUTLOOK
Chart 2.5 Greater Vancouver HPI Benchmark Price
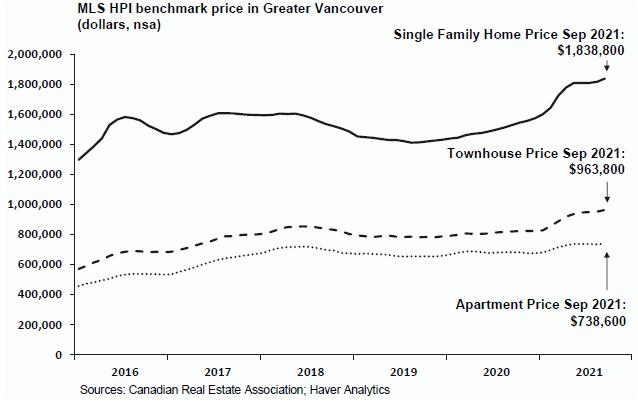
Housing starts have continued to be strong in 2021. Although housing starts have trended down from a record high in March, they have averaged 49,138 annualized units over the January to September period of 2021 — well above the ten-year historical average of 35,025 annualized units (January 2011 to December 2020). Year-to-date to September, housing starts were 34.0 per cent higher compared to the same period last year. The value of residential building permits, a leading indicator of home construction, rose by 18.1 per cent year-to-date to September, led by gains in single-detached dwellings.
Chart 2.6 B.C. Housing Starts
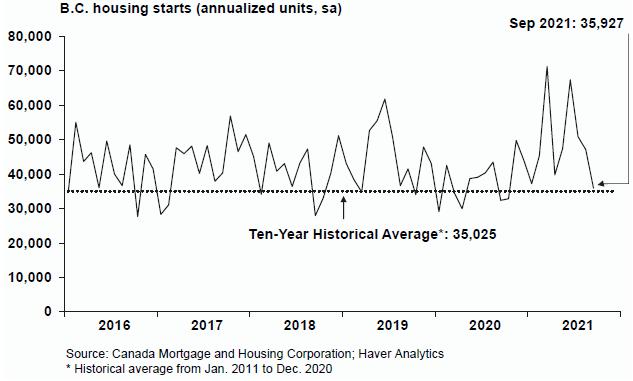
| 44 | | Second Quarterly Report 2021/22 | |
| | | |
ECONOMIC REVIEW AND OUTLOOK
Inflation
Supply-chain constraints and resilient demand for goods and services have continued to put upward pressure on prices. Even as the base-year effects of lower prices at the early stage of the COVID-19 pandemic have waned, the B.C. Consumer Price Index (CPI) has been elevated in recent months. The year-over-year B.C. CPI inflation rate in September 2021 was 3.5 per cent, the third consecutive month the index grew more than 3.0 per cent year-over-year, and consumer prices are up 2.5 per cent on a year-to-date basis. Provincial price gains have been led by rising prices for shelter, transportation, and food. Higher shelter prices primarily reflect increased prices in housing markets, while transportation costs have been driven up by both higher gasoline prices and vehicle purchase costs. In October, the Bank of Canada commented that the factors pushing Canadian prices up are stronger and more persistent than expected, but expect inflation to ease to around 2 per cent by the end of 2022.
Chart 2.7 B.C. Inflation
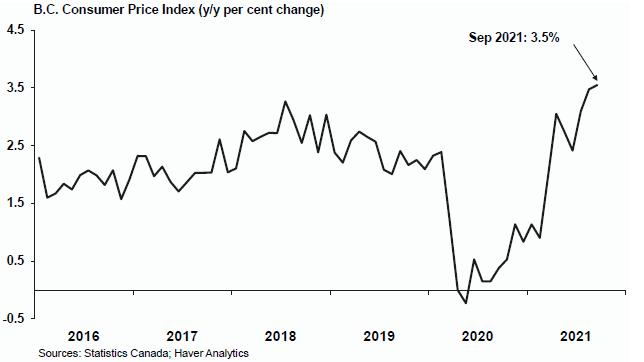
Business
Non-residential construction permitting has slowed so far this year. The total value of non-residential building permits fell by 9.0 per cent year-to-date to September compared to the same period last year. Underlying this were declines in permit issuance for institutional and government buildings (-24.3 per cent) and commercial buildings (-5.1 per cent) relative to the first nine months of 2020. Meanwhile, the value of permits for industrial buildings increased (+7.7 per cent).
Small business confidence in B.C. has recovered since the initial months of the pandemic. The Canadian Federation of Independent Business small business confidence index was 64.4 in October, 8.2 points higher than February 2020. Small businesses’ short-term outlook (over the next few months) was more subdued, but their long-term outlook (more than 12 months) remained expansionary.
| Second Quarterly Report 2021/22 | | 45 |
| | | |
ECONOMIC REVIEW AND OUTLOOK
B.C.’s tourism sector continued to be severely impacted by COVID-19, as the number of international travelers arriving in B.C. has been quite low since April 2020. Although the lifting of some travel restrictions in August 2021 resulted in a substantial increase in international travelers (77,441 persons in August compared to 28,317 in July), the number of international travelers to B.C. in August was still 83.1 per cent below pre-pandemic levels.
External Trade and Commodity Markets
As many economies around the world reopened, B.C. merchandise goods exports benefitted from a recovery in global demand and higher commodity prices. Provincial merchandise goods exports rose by 37.5 per cent in the first nine months of 2021 compared to the same period of 2020. Most of the gain was driven by higher exports of forestry products and building and packaging materials (+60.1 per cent), energy products (+52.7 per cent, mainly coal and natural gas) and metal and non-metallic mineral products (+39.7 per cent). A large proportion of the strength was due to significant increases in commodity prices, including softwood lumber, natural gas, copper, and coal. B.C. merchandise exports in September 2021 were 45.9 per cent higher than February 2020.
The value of B.C. merchandise exports to the U.S. increased by 43.9 per cent during the January to September period of 2021 compared to the same period last year, led by advances in exports of forestry products and building and packaging materials, as well as energy products. Meanwhile, the same categories were the main drivers of a 29.9 per cent year-to-date to September increase in B.C. merchandise exports to non-U.S. destinations.
Chart 2.8 B.C. Exports
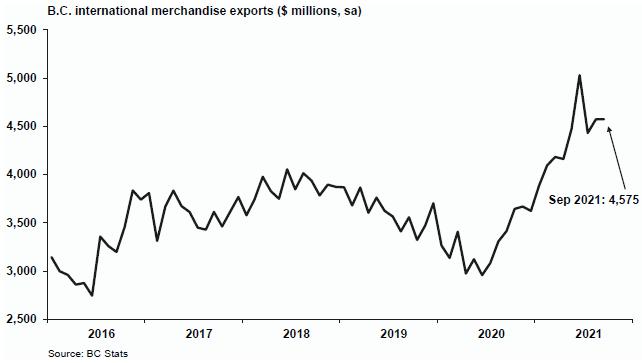
Compared to 2020, B.C.’s manufacturing shipments have rebounded, supported by the same factors driving the export recovery. Year-to-date to August, B.C.’s manufacturing shipments increased by 27.0 per cent compared to the same period of 2020. Higher shipments of wood products (+88.9 per cent) have driven the year-to-date increase in 2021.
| 46 | | Second Quarterly Report 2021/22 | |
| | | |
ECONOMIC REVIEW AND OUTLOOK
B.C. tourism data and national export data suggest that B.C.’s nominal international exports of services have largely not recovered from a sharp decline of 22.8 per cent in 2020. National-level data shows that Canadian exports of services were still 4.8 per cent lower in September 2021 than pre-pandemic levels.
After reaching a record high in May due to a surge in demand ahead of the reopening of the U.S. and Canadian economies, lumber prices have dropped significantly since June as demand softened amid excess supply from high inventory levels. The price of Western spruce-pine-fir (SPF) 2x4 lumber averaged $595 US/000 board feet in October, down from $1,618 in May, but was still 36.8 per cent higher than February 2020’s pre-pandemic level. The SPF 2x4 monthly lumber price averaged $917 US/000 board feet in the first ten months of 2021, 67.1 per cent higher than the same period in 2020.
Increasing energy demand as economies reopened and limited supply due to ongoing lower production between OPEC nations led to higher crude oil prices in the first ten months of 2021. The West Texas Intermediate (WTI) price averaged $66.50 US/barrel in the January to October period of 2021, up from $38.28 US/barrel averaged in the same period of 2020. Meanwhile, the plant inlet price of natural gas averaged $1.99 C/GJ in the first ten months of 2021, up from $0.84 C/GJ averaged in the same period of 2020. Natural gas prices have been supported by temporary increases in demand due to extreme weather events and reduced domestic supply in the U.S.
Base metal and mineral prices increased as global demand recovered. Following declines in the first half of 2020, prices for molybdenum, zinc, lead, silver, copper, and metallurgical coal all recorded increases year-to-date to October 2021. Prices for gold moderated from earlier peaks and posted a modest gain on a year-to-date basis.
Demographics
B.C.’s population on July 1, 2021 was 5.21 million people, up by 1.1 per cent from the same date in 2020. During the January to June period of 2021, the province welcomed 50,756 new immigrants, an increase of 146.1 per cent compared to the same period of 2020, when lockdown measures restricted the flow of people. The underlying increase in immigration in the first half of 2021 was due to both increased net interprovincial migration (from +12,394 persons to +24,546 persons) and net international migration (from +8,232 persons to +26,210 persons) compared to the first half of 2020.
Risks to the Economic Outlook
B.C.’s economy, like other provincial, national and global economies, has been significantly impacted by the COVID-19 pandemic. There are various elements of uncertainty that will influence the duration and extent of B.C.’s economic recovery. Downside risks to B.C.’s economic outlook include the following:
| · | emergence of COVID-19 variants of concern and future outbreaks in B.C., Canada or among B.C.’s trading partners, and delays in the global vaccination rollout; |
| · | medium- to long-term damage to the economy due to the pandemic through channels such as persistent unemployment and labour market detachment, higher precautionary saving by households, business closures, or lower private capital investment; |
| · | persistent inflation leading to earlier than expected interest rate increases in Canada and internationally; |
| Second Quarterly Report 2021/22 | | 47 |
| | | |
ECONOMIC REVIEW AND OUTLOOK
| · | weakening global economic activity, exacerbated by COVID-19, resulting in reduced demand for B.C.’s commodity exports; |
| · | ongoing global trade tensions and broader economic challenges in Asia, Europe, and the U.K.; |
| · | higher volatility in international foreign exchange, stock, and bond markets; |
| · | lower commodity prices, particularly for lumber, pulp, natural gas, and coal; and |
| · | timing of investment and hiring related to the LNG Canada project, similar to the risks that exist for other major capital projects. |
External Outlook
The external outlook has moderated for most of B.C.’s major trading partners amid uncertainty on the ongoing impacts of the pandemic. While many countries have reached high vaccination rates, the pace of vaccine rollouts varies globally, with some countries lagging behind and variants of concern increasing uncertainty. As some countries reopened their economies and removed containment measures, others continued to experience rising COVID-19 cases driven by the Delta variant and imposed stricter pandemic restrictions. Recovery prospects vary with the progress of vaccination, as well as the pandemic’s continued impact on labour supply and manufacturing supply-chains, and the extent to which countries are able reopen their economies without creating additional pressures on their healthcare systems.
United States
The reopening of the economy, as well as ongoing supportive monetary and fiscal policy have contributed to the recovery of economic activity in the U.S. in 2021, but growth has tapered in recent months. Following annualized growth of 6.7 per cent in the second quarter of 2021, U.S. real GDP grew slower at an annualized rate of 2.0 per cent in the July to September quarter (third quarter), bringing total economic activity to 1.4 per cent above its pre-pandemic level. Growth through the year reflected strength in consumption of goods and services, investment, and exports. Consumption in services continued to expand in the third quarter, but declines in consumption of goods, exports, and residential investment dragged on growth.
Chart 2.9 U.S. Real GDP
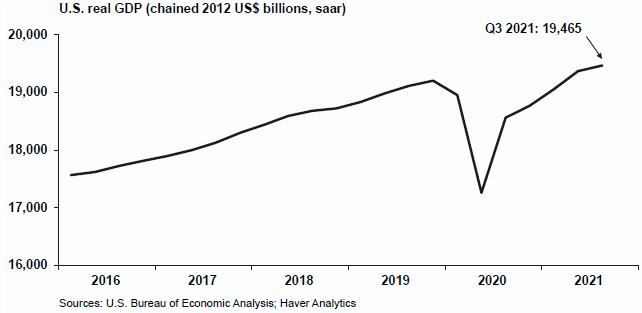
| 48 | | Second Quarterly Report 2021/22 | |
| | | |
ECONOMIC REVIEW AND OUTLOOK
The U.S. labour market recovery slowed from August to October, adding an average of around 442,000 jobs each month, following rapid expansion in June and July, where the U.S. economy added an average of around 1,027,000 jobs per month. As of October 2021, there were 4.2 million fewer jobs (-2.8 per cent) relative to February 2020. On a year-to-date basis, employment was 3.4 million jobs (+2.4 per cent) above the first ten months of last year, largely due to the low levels in the base-year.
The unemployment rate was 4.6 per cent in October 2021, higher than the pre-pandemic rate of 3.5 per cent. Despite recent declines, the number of long-term unemployed remained elevated at approximately two times higher than pre-pandemic levels. Meanwhile, the U.S. labour force participation rate of 61.6 per cent in October 2021 was 1.7 percentage points lower than February 2020.
U.S. home building activity has moderated since June, but remained resilient. Compared to pre-pandemic levels in February 2020, housing starts were down by 2.1 per cent in September 2021. Meanwhile, housing starts in the first nine months of 2021 were 18.5 per cent higher than the same period of 2020, which includes the declines during the early months of the pandemic. Residential building permits (a leading indicator of building activity) were 7.3 per cent above pre-pandemic levels in September 2021.
Chart 2.10 U.S. Housing Starts
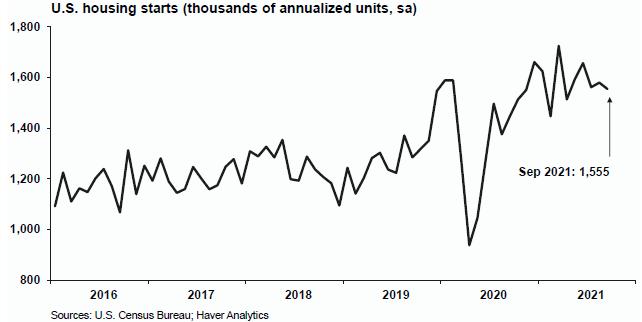
U.S. home sales activity remained strong throughout 2021. Although there were some signs of moderation over the spring and summer, new and existing home sales were well above pre-pandemic levels in September 2021. Reflecting the strength of demand, the median sales price for new homes was up by 23.2 per cent compared to February 2020 while existing home prices rose by 30.5 per cent.
U.S. nominal retail sales have been well above pre-pandemic (February 2020) levels so far this year. Year-to date to September 2021, sales were up by 20.1 per cent compared to the first nine months of 2020. All major components of retail sales were above pre-pandemic levels, with the largest gain continuing to come from non-store (i.e., online) retailers.
| Second Quarterly Report 2021/22 | | 49 |
| | | |
ECONOMIC REVIEW AND OUTLOOK
U.S. consumer confidence picked up in the first half of the year but has trended downward since then. The Conference Board consumer confidence index’s 128.9 reading in June 2021 was its highest level since the start of the pandemic, but has since fallen to 113.8 in October 2021, which is 18.8 points below pre-pandemic levels.
While the COVID-19 pandemic and supply-chain issues continued to pose challenges to international trade conditions, U.S. merchandise exports have recovered and remained strong as global demand and oil prices rebounded. In September 2021, the value of U.S. merchandise exports rose by 5.2 per cent compared to February 2020’s pre-pandemic levels and was up by 23.1 per cent on a year-to-date basis.
Chart 2.11 Consensus Outlook for the U.S. in 2021
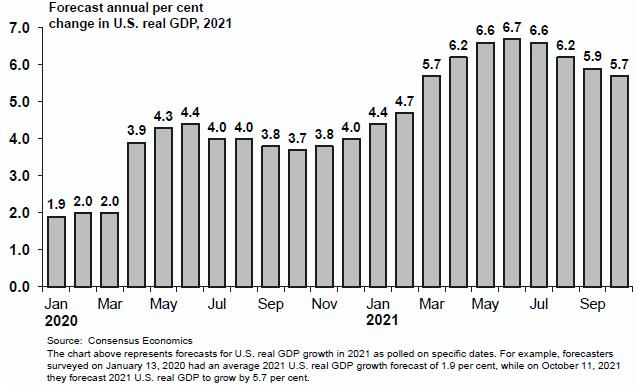
In October 2021, the Consensus survey projected U.S. economic growth of 5.7 per cent in 2021, 0.9 percentage points lower from the July 2021 Consensus survey, which was cited in the First Quarterly Report. For 2022, Consensus forecasts growth of 4.1 per cent, which is 0.3 percentage points lower than the July 2021 Consensus survey. These downgrades reflect supply-chain and labour shortage issues, surging Delta variant cases, and weaker than expected employment reports.
Canada
The Canadian economy faltered in the second quarter as sectors that had been supporting the recovery so far (housing, retail trade and goods exports) contracted; however, more recent data suggests that economic activity has picked up in the third quarter. Following an annualized growth rate of 5.5 per cent in the January to March quarter (first quarter) of 2021, Canadian real GDP fell by 1.1 per cent in the second quarter. Goods exports, household spending on goods, and residential investment dragged on growth, and was partially offset by household spending on services, government spending, and investment in machinery and equipment. Canadian real GDP was still 2.0 per cent lower than pre-pandemic levels in the second quarter of 2021.
| 50 | | Second Quarterly Report 2021/22 | |
| | | |
ECONOMIC REVIEW AND OUTLOOK
Chart 2.12 Canadian Real GDP
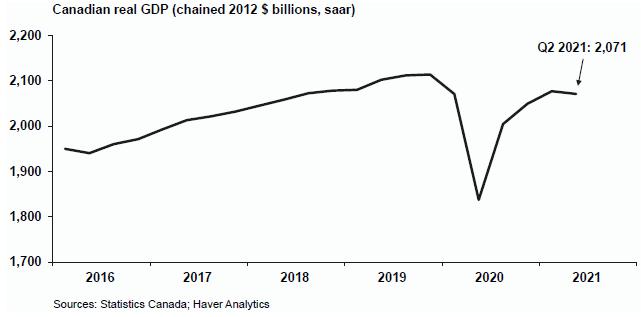
Canadian employment surpassed pre-pandemic employment levels for the first time in September 2021, 17 months after losing nearly 3 million jobs in March and April of 2020. In October 2021, there were 32,100 more Canadians employed relative to pre-pandemic (February 2020) levels. Year-to-date to October 2021, employment was up by 4.9 per cent compared to the first ten months of 2020.
Meanwhile, October’s 6.7 per cent unemployment rate was still 1.0 percentage point higher than February 2020. The labour force participation rate averaged 65.0 per cent from January to October of 2021, up 1.1 percentage points relative to the same period of 2020, and October’s participation rate was 0.2 percentage points lower than pre-pandemic levels. Despite overall labour market improvements in recent months, employment in high-contact service industries and construction have not returned to pre-pandemic levels. Furthermore, elevated long-term unemployment continued to weigh on the Canadian labour market’s recovery. The unemployment rate for youth remains higher than for core-age workers, and the unemployment rate for visible minorities remains higher than for people who are neither Indigenous nor part of a designated visible minority group.
The strength observed last year in the Canadian housing market had continued into early 2021, with both construction and sales reaching record-high levels in March. Since then, housing starts and home sales have retreated from their peaks by 24.6 per cent and 27.5 per cent, respectively. Nevertheless, activity remained elevated from historical levels. September 2021 housing starts were 19.6 per cent higher than pre-pandemic (February 2020) levels. Housing starts were up by 33.3 per cent on a year-to-date basis with growth largely driven by strong numbers in the urban centers of Montreal, Vancouver, and Calgary. Meanwhile, MLS home sales in the January to September period of 2021 increased by 32.9 per cent year-to-date and by 10.1 per cent relative to February 2020. Year-to-date sales growth was broad-based, with double-digit gains in 9 of 10 provinces, though September 2021 sales were lower than pre-pandemic levels in Ontario, Quebec, and PEI. Year-to-date to September, the average home sale price rose by 24.6 per cent and was 28.7 per cent higher than pre-pandemic levels.
| Second Quarterly Report 2021/22 | | 51 |
| | | |
ECONOMIC REVIEW AND OUTLOOK
Canadian nominal retail sales had returned to their pre-pandemic levels by early summer of last year and had continued strength throughout 2021. Year-to-date to August 2021, retail sales were 14.9 per cent higher than the first eight months of 2020 and were up by 10.1 per cent compared to February 2020. Strength in retail sales was largely due to strong sales at motor vehicle and parts dealers, gasoline stations, and building material and garden equipment supplies stores.
Canadian merchandise exports have recovered from the sharp declines experienced at the early stages of the COVID-19 pandemic as global economies reopened and commodity prices rebounded. The value of Canadian merchandise exports in the first nine months of 2021 rose by 21.5 per cent relative to the same period of 2020 and were 8.3 per cent above pre-pandemic levels in September 2021. Services exports, on the other hand, were still down 4.8 per cent in September 2021 compared to February 2020. Shipments of Canadian manufactured goods in the first eight months of 2021 were 19.4 per cent higher than the same period of last year (partly due to base-year effects and high commodity prices).
Chart 2.13 Consensus Outlook for Canada in 2021

In October 2021, the Consensus survey projected Canadian economic growth of 5.1 per cent in 2021, 1.1 percentage points lower from the July 2021 Consensus survey. For 2022, Consensus forecasts growth of 4.1 per cent, which is 0.1 percentage point lower than the July 2021 Consensus survey. The downgrades were due to lower outlooks among trading partners, weak GDP data, supply-chain disruptions, and rising Delta variant cases.
| 52 | | Second Quarterly Report 2021/22 | |
| | | |
ECONOMIC REVIEW AND OUTLOOK
Asia
China’s economy continued to recover this year, but faced challenges in the summer months. In the third quarter of 2021, China real GDP grew by an annualized 3.6 per cent, which was slower than expectations and below the 6.1 per cent annualized growth in the second quarter. Growth in the third quarter was held back by COVID-19 containment measures and floods, while stronger consumer spending provided support.
The COVID-19 pandemic continued to weigh on Japan’s economy in 2021. Japan real GDP increased by an annualized growth rate of 1.9 per cent in the second quarter of 2021, following a 4.2 per cent decrease in annualized growth in the first quarter of this year. Strong government spending and private investment contributed to grow the economy in the second quarter, but Japan real GDP remained below pre-pandemic levels. On October 27, 2021, the Bank of Japan held its policy targets unchanged, and voted to maintain their current asset purchase program.
The October 2021 Consensus survey projected economic growth for China to be 8.2 per cent in 2021, 0.4 percentage points lower from the July 2021 Consensus survey. For 2022, Consensus forecasts growth of 5.5 per cent, which is 0.1 percentage points lower than the July 2021 Consensus survey. The downgrade to growth in 2021 was due to China’s targeted lockdowns amid spread of Delta variant cases, and floods in the summer.
In October 2021, the Consensus survey projected economic growth for Japan to be 2.3 per cent in 2021, 0.2 percentage points lower than the July 2021 Consensus survey. For 2022, Consensus forecasts growth of 3.0 per cent, which is unchanged from the July 2021 Consensus survey.
Europe
As vaccination rollouts continued to progress after a slow start and with restrictions being eased in euro zone countries, economic activity has strengthened in the region. Real GDP in the euro zone increased by an annualized 9.1 per cent in the third quarter of 2021, following an annualized growth rate of 8.7 per cent in the second quarter. The region is expected to face headwinds going forward, including price and supply pressures, and the spread of the Delta variant, which could dampen economic recovery, especially for tourist-dependent countries in southern Europe.
The European Central Bank (ECB) has maintained rates and policy since they enacted a new monetary policy strategy on July 8, 2021, which allowed for inflation to run temporarily above 2.0 per cent over the medium-term. In September 2021, the ECB slowed the pace of net asset purchases under its pandemic emergency purchase program, while maintaining a total program envelope of €1.85 trillion and committing to continue the program until at least March 2022. These policies were left unchanged at the ECB meeting on October 28, 2021.
In October 2021, the Consensus survey forecasted the euro zone economy to grow by 5.1 per cent in 2021, 0.5 percentage points higher than the July 2021 Consensus survey. For 2022, Consensus forecasts growth of 4.4 per cent, which is unchanged from the July 2021 Consensus survey. Upgrades to growth for 2021 reflect high vaccination rates, increased mobility throughout the region, and higher consumer spending on services.
| Second Quarterly Report 2021/22 | | 53 |
| | | |
ECONOMIC REVIEW AND OUTLOOK
Financial Markets
Interest Rates
The COVID-19 pandemic continues to weigh on economic recoveries around the globe, prompting central banks to continue their extraordinary monetary policy responses.
On November 3, 2021, the US Federal Reserve (Fed) left the target range for the federal funds rate unchanged at 0.00 to 0.25 per cent. The Fed also provided its forward guidance by reiterating its intention to keep interest rates at current levels until the economy has recovered, which includes labour market improvements and inflation that averages 2.0 per cent over time. The latter policy allows for inflation to run above its long-standing target of 2.0 per cent for some time. The Fed noted that the U.S. economy has made substantial progress towards the goals of maximum employment and price stability, and they announced they will slow the pace of large-scale asset purchases (i.e. quantitative easing).
On October 27, 2021, the Bank of Canada maintained its target for the overnight interest rate at its stated effective lower bound of 0.25 per cent. It also provided forward guidance, committing to maintain the current policy rate until its inflation target of 2.0 per cent is sustainably achieved and the recovery is well underway, which the Bank expects to happen in the middle quarters of 2022. Further, the Bank will be ending quantitative easing in light of the progress made in the economic recovery and will keep its overall holdings of Government of Canada bonds roughly constant. The Bank judged that the main forces pushing up prices (higher energy prices and pandemic-related supply disruptions) appeared to be stronger and more persistent than expected, but still viewed these factors as transitory. This messaging responds to recent months of Canadian CPI, which have seen two consecutive months over 4.0 per cent growth year-over-year, following four consecutive months of over 3.0 per cent growth. The Bank expected CPI inflation to be elevated into next year, and ease back to around 2 per cent by late 2022.
Chart 2.14 Interest Rate Forecasts
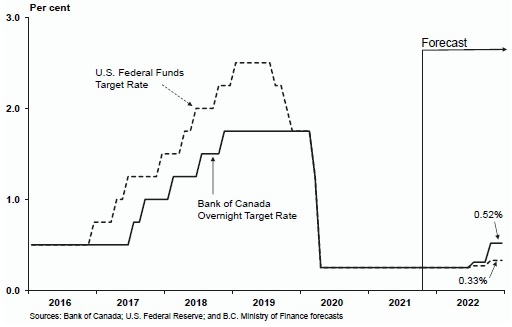
| 54 | | Second Quarterly Report 2021/22 | |
| | | |
ECONOMIC REVIEW AND OUTLOOK
The benchmark conventional mortgage rate on a 5-year term mortgage held steady at 4.79 per cent in September 2021, the same level since August 2020.
As of October 8, 2021, an average of six private sector forecasters projected the Canadian three-month Treasury bill to average 0.13 per cent in 2021 and 0.31 per cent in 2022. Meanwhile, the ten-year Government of Canada bond rate is forecast to average 1.35 per cent in 2021 and 1.83 per cent in 2022.
Table 2.2 Private Sector Canadian Interest Rate Forecasts
| | | 3-month Treasury Bill | | | 10-year Government Bond | |
| Average annual interest rate (per cent) | | 2021 | | | 2022 | | | 2021 | | | 2022 | |
| BMO | | | 0.12 | | | | 0.16 | | | | 1.34 | | | | 1.74 | |
| CIBC | | | 0.13 | | | | 0.28 | | | | 1.34 | | | | 1.70 | |
| National Bank | | | 0.13 | | | | 0.33 | | | | 1.35 | | | | 1.79 | |
| RBC | | | 0.13 | | | | 0.40 | | | | 1.35 | | | | 1.86 | |
| Scotiabank | | | 0.13 | | | | 0.41 | | | | 1.34 | | | | 1.86 | |
| TD | | | 0.13 | | | | 0.29 | | | | 1.37 | | | | 2.03 | |
| Average (as of Oct 8, 2021) | | | 0.13 | | | | 0.31 | | | | 1.35 | | | | 1.83 | |
Exchange Rate
The value of the Canadian dollar has largely moved in step with energy prices during the pandemic. The Canadian dollar gradually appreciated and reached a six-year high in early June 2021, supported by recovering oil prices, strong commodity prices, and a downward trending U.S. dollar. Since June, the dollar tapered down in July and August, but appreciated to similar levels in June by the end of October. The Canadian dollar averaged 80.0 US cents during the first ten months of 2021.
Chart 2.15 Private Sector Expectations for the Canadian Dollar
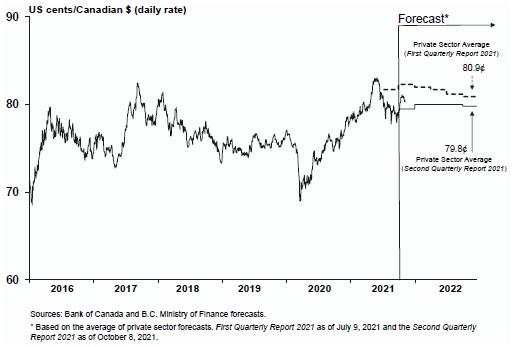
| Second Quarterly Report 2021/22 | | 55 |
| | | |
ECONOMIC REVIEW AND OUTLOOK
Based on the average of six private forecasters as of October 8, 2021, the Canadian dollar is expected to average 79.8 US cents in 2021 and 79.9 US cents in 2022.
Table 2.3 Private Sector Exchange Rate Forecasts
| Average annual exchange rate (US cents/Canadian $) | | 2021 | | | 2022 | |
| BMO | | | 80.0 | | | | 82.2 | |
| CIBC | | | 79.6 | | | | 77.6 | |
| National Bank | | | 79.9 | | | | 82.0 | |
| RBC | | | 79.8 | | | | 79.0 | |
| Scotiabank | | | 80.1 | | | | 80.6 | |
| TD | | | 79.6 | | | | 78.2 | |
| Average (as of Oct 8, 2021) | | | 79.8 | | | | 79.9 | |
| 56 | | Second Quarterly Report 2021/22 | |
| | | |
ECONOMIC REVIEW AND OUTLOOK
Provincial Economic Accounts Update
Statistics Canada released its estimates of provincial annual GDP for 2020 on November 9, 2021.
British Columbia’s economy declined in 2020, as the negative impacts from the COVID-19 pandemic pushed economies all over the world into recession. In 2020, B.C.’s real GDP contraction of 3.4 per cent was the fourth smallest among provinces (behind Prince Edward Island, Nova Scotia, and New Brunswick), following growth of 3.1 per cent in 2019. Overall, the Canadian economy fell by 5.2 per cent in 2020, following an increase of 1.9 per cent in 2019.
Chart 1 – Real GDP in Canadian provinces
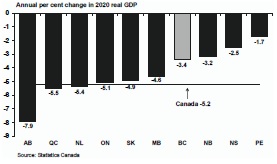
The decline in B.C.’s economic activity in 2020 was driven by decreases in consumption of services, exports and business investment. Restrictions to
movement, mandatory shutdowns and concerns over COVID-19 transmission led to significant declines in B.C.’s service GDP categories. Household consumption of services, which makes up over half of all consumer spending, fell by 6.8 per cent in the year. Service exports1 also declined by 15.1 per cent and B.C. residents purchased fewer services from outside the province (-8.7 per cent). Exports of goods fell by 5.0 per cent, driven by export volume declines in wood products, paper products and coal. Business investment in machinery and equipment fell sharply in 2020 (-21.4 per cent) and investment in inventories was negative, which is common in uncertain times.
Declines were partially offset by resilient economic activity in goods expenditures, structure investment and government activity. Household expenditure on goods expanded by 1.6 per cent in 2020, as consumers shifted spending away from unavailable services. Imports of goods contracted in 2020 (-7.6 per cent), which contributed positively to B.C.’s GDP. Investment in residential structures increased 3.4 per cent in 2020, as housing construction activity remained elevated. Non-residential structure investment also increased (+10.6 per cent), a sharp contrast to the 10.0 per cent decline seen at the national level. Finally, general government (Federal, Provincial,
Chart 2 – B.C. GDP by Expenditure
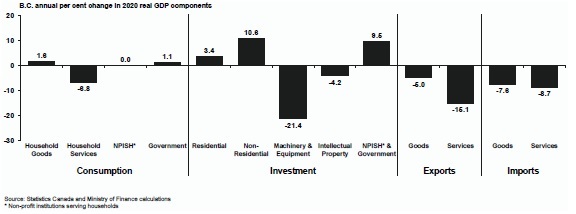
| 1 | Service exports includes expenditures by tourists visiting B.C. as well as commercial services provided to individuals and firms from outside of the province. |
| Second Quarterly Report 2021/22 | | 57 |
| | | |
ECONOMIC REVIEW AND OUTLOOK
Local and Aboriginal) economic activity saw increases in both expenditure (+1.1 per cent) and investment (+9.9 per cent).
Real GDP
Annual growth in B.C.’s real GDP from 2017 to 2020 is illustrated in Chart 3. The latest data incorporate historical revisions back to 2018. The revised level of B.C.’s 2019 real GDP is now estimated to be $275.0 billion, 1.2 per cent higher than the previous estimate of $271.8 billion.
Chart 3 – B.C. real GDP
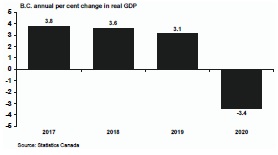
Nominal GDP
Chart 4 depicts B.C.’s nominal GDP levels in recent years. Nominal GDP decreased by $1.7 billion (or 0.5 per cent) in 2020, after growing by $13.6 billion (or 4.6 per cent) the previous year. Statistics Canada’s latest release also incorporated historical revisions. The revised level of nominal GDP in 2019 is now estimated to be $311.0 billion, 0.6 per cent higher than the previous estimate of $309.1 billion.
Chart 4 – B.C. nominal GDP
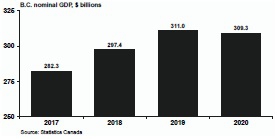
| 58 | | Second Quarterly Report 2021/22 | |
| | | |