Exhibit 99.5

Budget and Fiscal Plan
2022/23 – 2024/25
February 22, 2022

National Library of Canada Cataloguing in Publication Data
British Columbia.
Budget and fiscal plan. –- 2002/03/2004/05-
Annual
Also available on the Internet.
Continues: British Columbia. Ministry of Finance and
Corporate Relations. Budget ... reports. ISSN 1207-5841
ISSN 1705-6071 = Budget and fiscal plan — British Columbia.
1. Budget — British Columbia — Periodicals. 2. British
Columbia — Appropriations and expenditures — Periodicals.
I. British Columbia. Ministry of Finance. II. Title.
HJ12.B742 352.48’09711’05 C2003-960048-3
| BUDGET AND FISCAL PLAN 2022/23 to 2024/25 | | | TABLE OF CONTENTS |
| February 22, 2022 | | |
| Attestation by the Secretary to Treasury Board | |
| | |
| Summary | 1 |
| | |
| Part 1: Three Year Fiscal Plan | |
| Introduction | 7 |
| Expense | 9 |
| Consolidated Revenue Fund Spending | 9 |
| Building a Stronger Society by Putting People First | 9 |
| A Healthy British Columbia | 9 |
| Investing in Mental Health and Responding to the Overdose Crisis | 11 |
| Supports for Individuals Experiencing Homelessness | 11 |
| Affordable, Accessible, and High-Quality Child Care | 13 |
| Putting People First | 15 |
| Building a Stronger Economy for Everyone | 18 |
| Government’s Economic Plan | 18 |
| Addressing the Housing Challenge | 18 |
| Connecting Communities | 20 |
| Transitioning to a Sustainable Economy | 20 |
| Building the Skills for Tomorrow’s Economy | 22 |
| Working Together Towards Reconciliation | 24 |
| Building a Stronger Environment for Our Future | 24 |
| CleanBC | 24 |
| Protecting People and Communities from Climate-Related Disasters | 28 |
| COVID-19 Response and Recovery | 30 |
| BC Public Service | 52 |
| BC Public Sector Compensation | 52 |
| Spending Recovered from Third Parties | 52 |
| Transfers to Service Delivery Agencies | 53 |
| Service Delivery Agency Spending | 53 |
| Revenue | 56 |
| Major Revenue Sources | 58 |
| Capital Spending | 63 |
| Taxpayer-Supported Capital Spending | 63 |
| Self-Supported Capital Spending | 72 |
| Projects Over $50 Million | 73 |
| Provincial Debt | 78 |
| Risks to the Fiscal Plan | 81 |
Budget and Fiscal Plan - 2022/23 to 2024/25
i
Table of Contents
Tables:
| 1.1 | Three Year Fiscal Plan | 7 |
| 1.2.1 | Support for Individuals Experiencing or At Risk of Homelessness | 13 |
| 1.2.2 | Investments for a Strong Economy | 22 |
| 1.2.3 | Investments for CleanBC (including Contingencies Allocations) | 25 |
| 1.2.4 | Investments to Support Communities Against Climate Events | 29 |
| 1.2.5 | Pandemic Recovery Contingencies 2022/23 | 30 |
| 1.3 | Expense by Ministry, Program and Agency | 54 |
| 1.4 | Revenue by Source | 55 |
| 1.5.1 | Comparison of Major Factors Underlying Revenue | 57 |
| 1.5.2 | Corporate Income Tax Revenue | 58 |
| 1.5.3 | Sales Tax Revenue | 58 |
| 1.5.4 | Federal Government Contributions | 62 |
| 1.6 | Capital Spending | 63 |
| 1.7 | Provincial Transportation Investments | 71 |
| 1.8 | Capital Expenditure Projects Greater Than $50 Million | 75 |
| 1.9 | Provincial Debt Summary | 78 |
| 1.10 | Provincial Borrowing Requirements | 79 |
| 1.11 | Provincial Debt Changes | 80 |
| 1.12 | Key Fiscal Sensitivities | 81 |
| | | |
| Topic Boxes: | |
| Flood Response and Recovery | 31 |
| Committed to Building for the Future | 35 |
| A Responsible Approach to Budgeting and Fiscal Planning | 37 |
| A New Vision for Health Care Funding | 44 |
| B.C.’s Environmental, Social and Governance Values | 46 |
| | | |
| Part 2: Tax Measures |
| Tax Measures – Supplementary Information | 88 |
| | | |
| Tables: | | |
| 2.1 | Summary of Tax Measures | 87 |
Budget and Fiscal Plan - 2022/23 to 2024/25
ii
Table of Contents
| | | |
| Part 3: British Columbia Economic Review and Outlook | |
| Summary | 95 |
| British Columbia Economic Activity and Outlook | 96 |
| Labour Market | 97 |
| Consumer Spending and Inflation | 98 |
| Housing | 101 |
| Business and Government | 103 |
| External Trade and Commodity Markets | 104 |
| Demographics | 106 |
| Risks to the Economic Outlook | 106 |
| External Outlook | 107 |
| United States | 107 |
| Canada | 110 |
| Asia | 112 |
| Europe | 113 |
| Financial Markets | 113 |
| Interest Rates | 113 |
| Exchange Rate | 115 |
| | | |
| Tables: | | |
| 3.1 | British Columbia Economic Indicators | 96 |
| 3.2 | U.S. Real GDP Forecast: Consensus versus B.C. Ministry of Finance | 109 |
| 3.3 | Canadian Real GDP Forecast: Consensus versus B.C. Ministry of Finance | 111 |
| 3.4 | Private Sector Canadian Interest Rate Forecasts | 115 |
| 3.5 | Private Sector Exchange Rate Forecasts | 116 |
| 3.6.1 | Gross Domestic Product (GDP): British Columbia | 117 |
| 3.6.2 | Selected Nominal Income and Other Indicators: British Columbia | 118 |
| 3.6.3 | Labour Market Indicators: British Columbia | 118 |
| 3.6.4 | Major Economic Assumptions | 119 |
| | | |
| Topic Box: | | |
| The Economic Forecast Council, Budget 2022 | 120 |
Budget and Fiscal Plan - 2022/23 to 2024/25
iii
Table of Contents
| | | |
| Part 4: 2021/22 Updated Financial Forecast (Third Quarterly Report) | |
| Introduction | 125 |
| Revenue | 127 |
| Expense | 128 |
| Government Employment (FTEs) | 129 |
| COVID-19 Pandemic Response Measures | 130 |
| Provincial Capital Spending | 133 |
| Provincial Debt | 134 |
| Risks to the Fiscal Forecast | 135 |
| Supplementary Schedules | 135 |
| | |
| Tables: | |
| 4.1 | 2021/22 Forecast Update | 125 |
| 4.2 | 2021/22 Financial Forecast Changes | 126 |
| 4.3 | 2021/22 Pandemic and Recovery Contingencies | 129 |
| 4.4 | 2021/22 Capital Spending Update | 133 |
| 4.5 | 2021/22 Provincial Debt Update | 134 |
| 4.6 | 2021/22 Operating Statement | 135 |
| 4.7 | 2021/22 Revenue by Source | 136 |
| 4.8 | 2021/22 Expense by Ministry, Program and Agency | 137 |
| 4.9 | 2021/22 Expense by Function | 138 |
| 4.10 | 2021/22 Capital Spending | 139 |
| 4.11 | 2021/22 Provincial Debt | 140 |
| 4.12 | 2021/22 Statement of Financial Position | 141 |
| | | |
| Appendix | 143 |
Budget and Fiscal Plan - 2022/23 to 2024/25
iv
 | February 22, 2022 |
As required by Section 7(1)(d) of the Budget Transparency and Accountability Act, I confirm that Budget 2022 contains the following elements:
| • | Fiscal forecasts for 2022/23 to 2024/25 (provided in Part 1) and economic forecasts for 2022 to 2026 (provided in Part 3). |
| • | A report on the advice received from the Economic Forecast Council (EFC) in December 2021 (updated in January 2022) on the economic growth outlook for British Columbia, including a range of forecasts for 2022 and 2023 (see Part 3, page 121). |
| • | Material economic, demographic, fiscal, accounting policy, and other assumptions and risks underlying Budget 2022 economic and fiscal forecasts. In particular: |
| − | The economic forecast reflects an improved outlook for British Columbia amidst ongoing uncertainty associated with the global COVID-19 pandemic. In recognition of downside risks, the economic projections assumed in Budget 2022 are prudent relative to the average of the forecasts provided by the Economic Forecast Council. |
| − | The economic forecast does not fully incorporate fiscal policy measures announced in the current budget (Budget 2022), since the timing of budget decisions generally coincides with the development of the economic forecast. However, a preliminary estimate of government spending for the current budget was included to improve completeness. The full budget policy measures will be incorporated into the economic outlook in the updated forecast included in the First Quarterly Report. |
| − | The corporate income tax revenue forecast is based on projections for national corporate taxable income provided by the federal government. |
| − | Natural gas royalty forecasts continue to adopt a lower natural gas price forecast compared to the private sector average in order to maintain prudence against volatility. |
| − | The fiscal plan includes three-year financial projections for school districts, post-secondary institutions and health authorities, based on plans submitted by those entities to the Ministries of Education and Child Care, Advanced Education and Skills Training, and Health, respectively, and for the other service delivery agencies and the commercial Crown corporations. |
| − | The fiscal plan includes a Pandemic Recovery Contingencies allocation of $2.0 billion in 2022/23 and $1.0 billion in 2023/24, as part of the Contingencies vote totalling $4.848 billion in 2022/23, $4.412 billion in 2023/24, and $3.987 billion in 2024/25. The forecast allowance is $1.0 billion in each year of the fiscal plan. Government’s economic and fiscal prudence measures generally have resulted in government exceeding its budget targets. |
To the best of my knowledge, the three-year fiscal plan contained in Budget 2022 conforms to the standards and guidelines of generally accepted accounting principles for senior governments as outlined in Note 1 of the 2020/21 Public Accounts.
I would like to recognize staff in government ministries and agencies for their contribution to this document. I would especially like to acknowledge staff in the Ministry of Finance, whose professionalism, commitment and expertise were essential to the completion of this budget and fiscal plan.
| | /s/ Heather Wood |
| | Heather Wood |
| | Deputy Minister and Secretary to Treasury Board |
Budget and Fiscal Plan - 2022/23 to 2024/25

SUMMARY | BUDGET AND FISCAL PLAN - 2022/23 to 2024/25
| | | | | | | | | | | | | |
| ($ millions) | | Updated
Forecast
2021/22 | | | Budget
Estimate
2022/23 | | | Plan
2023/24 | | | Plan
2024/25 | |
| Revenue | | | 70,220 | | | | 68,552 | | | | 70,177 | | | | 72,325 | |
| Expense | | | (66,453 | ) | | | (71,013 | ) | | | (72,359 | ) | | | (74,506 | ) |
| Pandemic Recovery Contingencies | | | (3,250 | ) | | | (2,000 | ) | | | (1,000 | ) | | | — | |
| Forecast allowance | | | (1,000 | ) | | | (1,000 | ) | | | (1,000 | ) | | | (1,000 | ) |
| Deficit | | | (483 | ) | | | (5,461 | ) | | | (4,182 | ) | | | (3,181 | ) |
| | | | | | | | | | | | | | | | | |
| Capital spending: | | | | | | | | | | | | | | | | |
| Taxpayer-supported capital spending | | | 7,157 | | | | 9,279 | | | | 9,333 | | | | 8,815 | |
| Self-supported capital spending | | | 3,828 | | | | 4,374 | | | | 4,437 | | | | 3,144 | |
| Total capital spending | | | 10,985 | | | | 13,653 | | | | 13,770 | | | | 11,959 | |
| Provincial Debt: | | | | | | | | | | | | | | | | |
| Taxpayer-supported debt | | | 61,731 | | | | 73,475 | | | | 83,302 | | | | 90,846 | |
| Self-supported debt | | | 28,814 | | | | 30,956 | | | | 33,004 | | | | 33,930 | |
| Total debt (including forecast allowance) | | | 91,545 | | | | 105,431 | | | | 117,306 | | | | 125,776 | |
| Taxpayer-supported debt to GDP ratio | | | 17.8 | % | | | 20.0 | % | | | 21.8 | % | | | 22.8 | % |
| Taxpayer-supported debt to revenue ratio | | | 92.9 | % | | | 110.9 | % | | | 122.7 | % | | | 129.8 | % |
| | | | | | | | | | | | | | | | | |
| | | 2021 | | | | 2022 | | | | 2023 | | | | 2024 | |
| Economic Forecast: | | | | | | | | | | | | | | | | |
| Real GDP growth | | | 5.0 | % | | | 4.0 | % | | | 2.5 | % | | | 2.1 | % |
| Nominal GDP growth | | | 12.4 | % | | | 5.8 | % | | | 4.1 | % | | | 4.0 | % |
Building a Stronger BC Together
The province has been challenged by the COVID-19 pandemic and weather events that have been fueled by climate change. Through these emergencies, British Columbians have stood together, supported each other, and have demonstrated the province’s collective strength. There is more to be done: the pandemic and recent climate-related disasters have highlighted the need to continue to strengthen the public services that people rely on, from health care and education to child care and housing. In addition, they have shown the need to continue to build a stronger B.C. with an economy that meets the needs of tomorrow, while fighting climate change.
Budget 2022 expands on historic investments made since 2017 to build a stronger society, a stronger economy, and a stronger environment. This includes $6.6 billion in new operating funding over the three-year fiscal plan period.
There remains ongoing uncertainty regarding the course of the COVID- 19 pandemic and natural disaster recovery costs. Budget 2022 provides Pandemic Recovery Contingencies funding of $2 billion in 2022/23, and $1 billion in 2023/24 to ensure the Province can continue to provide ongoing health responses and can continue to help people, businesses and communities that are still recovering from the pandemic’s impacts. Additionally, more than $1.1 billion is earmarked in General Programs Contingencies for disaster recovery costs over the next three years in recognition of the need to have the flexibility to be responsive and support communities as the costs of recovery become better known. This is in addition to $400 million in 2022/23 provided for disaster recovery in the Emergency Program Act budget and the $5 billion expected from the Government of Canada that is designated for disaster recovery in B.C.
Budget and Fiscal Plan - 2022/23 to 2024/25
1
Summary
Building a Stronger Society
The health and safety of British Columbians continues to remain government’s top priority. The pandemic has shown the need to continue work to strengthen the health care system that so many British Columbians have relied on. Budget 2022 continues to prioritize the health and safety of British Columbians with more than $3.2 billion in new funding over the fiscal plan period for B.C.’s health care system. This includes funding to expand primary care services and First Nations’ primary care in all regions of the province, to address wait lists for surgeries and diagnostic imaging, to support cancer care services and to strengthen B.C.’s ambulance system in order to improve response times. In addition, $875 million is allocated in Pandemic Recovery Contingencies in 2022/23 to support ongoing COVID-19 health response needs.
The Province is investing more than $633 million over the next three years to implement a cross-government approach to prevent homelessness and respond quickly to assist people experiencing homelessness to become stably housed. This includes supports for youth aging out of care who are at increased risk of becoming homeless, rent supplements with wraparound supports for individuals who are experiencing homelessness, complex care housing for individuals with significant mental health and/or substance use challenges, and a continuation of strategies to provide permanent housing options for people that are temporarily housed as part of the response to the COVID-19 pandemic.
Budget 2022 builds on the $2.4 billion in investments made in the first four years of the ChildCareBC plan by investing $284 million in new provincial funding on top of previous investments. In addition, a historic agreement has been signed with the Government of Canada which delivers over $3.2 billion over five years. Combined, federal and provincial spending will total $4.4 billion over the fiscal plan period to continue to build a child care system that will provide more affordable, accessible, inclusive and high quality child care to support families. This will lower fees for before- and after-school care and preschool beginning in 2023/24, expand wage enhancements to more early childhood educators, and create more child care spaces across the province.
Significant new funding to support other essential public services includes: $664 million in the K-12 education sector; $259 million for children, youth and family services, and $326 million for justice and public safety services.
Building a Stronger Economy
Government’s economic plan, ‘StrongerBC: A Plan for Today, a Vision for Tomorrow’ outlines how we can grow an economy that works for everyone by preparing for jobs of the future, closing the digital divide, and driving new innovation. It includes a generational commitment to develop the talent B.C. needs to support growth in the future. Budget 2022 makes progress on the StrongerBC plan with $50 million to support inclusive and sustainable growth by delivering additional, targeted strategies and investments, including those that grow B.C.’s life sciences, manufacturing and agricultural sectors and to support reconciliation through economic development. An additional $195 million is targeted to the B.C. life sciences sector in 2021/22.
More than $289 million in new funding over the next five years will be provided to expand high-speed internet access throughout the province, bringing total investments to expand connectivity to remote, rural, and Indigenous communities to over $509 million by 2026/27. Through this investment, more than 280 communities will be connected to high-speed internet, improving access to education and health care, and expanding the ability for local businesses to reach the international marketplace.
The Province is also developing a comprehensive workforce readiness plan titled Future Ready: Skills for the Jobs of Tomorrow, to proactively address both systemic and emerging workforce challenges, such as shifting demographics and climate adaptation. This plan will help to fill the one million job openings forecasted by 2031. Budget 2022
Budget and Fiscal Plan - 2022/23 to 2024/25
2
Summary
provides more than $67 million in funding for skills and jobs training. This funding will create more training seats for health care assistants and in the skilled trades, in addition to more training seats for early childhood educators funded under ChildCareBC.
Funding of more than $185 million is provided over the fiscal plan to support communities through the deferral of logging in old growth forests. This includes funding to connect workers to employment opportunities, to provide skills training to community members, and to forge partnerships with businesses and communities to transition and create jobs through diversified economies and infrastructure projects.
A stronger British Columbia requires moving forward together through true and lasting reconciliation with Indigenous Peoples. In 2021, the Province released a draft Action Plan to support ongoing consultation and further collaboration with Indigenous Peoples. Once finalized, the Action Plan will help advance reconciliation by defining a set of long-term goals and outcomes, and identifying specific actions covering the whole of government. The budget continues to support a number of measures that promote reconciliation with Indigenous Peoples. This includes funding for the creation of a Declaration Act Secretariat to implement the Declaration on the Rights of Indigenous Peoples Act, and funding for Indigenous primary care and Aboriginal Head Start. Establishing a new Ministry of Land, Water and Resource Stewardship will also support reconciliation by helping to bring the Province’s natural resource policy framework in line with the UN Declaration on the Rights of Indigenous Peoples.
A Stronger Environment
Government reaffirmed its role as a global leader in climate action with the launch of the CleanBC Roadmap to 2030. In addition, the devastating climate-related disasters in the past year have highlighted the importance of protecting people and communities from the effects of the changing climate. More than $1 billion in new funding is provided over the fiscal plan period to continue the fight against climate change and to implement new initiatives identified in the CleanBC Roadmap to 2030. This includes $651 million in new operating funding to support clean transportation, energy efficient buildings, and to support industry and communities to manage the transition to a low-carbon economy.
Budget 2022 also includes significant investments to help the Province protect people and communities from climate-related disasters. In addition to the $1.5 billion in allocations to support community recovery from disaster events, $600 million in operating and capital funding is provided to continue the response to climate-related disasters, for local government and First Nation disaster and recovery projects, and to begin to implement the Climate Preparedness and Adaptation Strategy to support British Columbians through future emergencies.
Capital Investments
Budget 2022 makes significant capital commitments in the health, transportation, and education sectors. Taxpayer-supported infrastructure spending on hospitals, schools, post-secondary facilities, transit, and roads is forecast to be $27.4 billion, the highest level ever, over the three-year fiscal plan.
Capital spending of self-supported Crown corporations is expected to total $12.0 billion over three years, relating primarily to electrical generation, transmission and distribution projects.
Economic Outlook
B.C.’s economy rebounded in 2021 from the initial impacts of the COVID-19 pandemic, despite significant pandemic and climate-related disruptions. The economy has proven resilient to pandemic interruptions, aided by government emergency response programs, cooperation with public health orders and a strong vaccination program, and easing of restrictions. While the recovery has broadened over the past year, it remains uneven with sectors like tourism,
Budget and Fiscal Plan - 2022/23 to 2024/25
3
Summary
hospitality, recreation, and live events yet to fully recover. The path of the ongoing economic recovery in B.C. and its trading partners remains highly uncertain amid the evolution of the pandemic and supply-chain disruptions. However, expenditures and hiring to permanently rebuild damaged infrastructure from the November 2021 floods and landslides will have a positive effect on jobs and economic activity in the province.
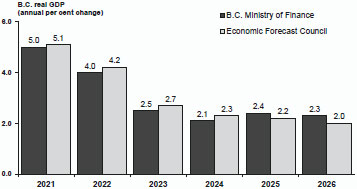
It is estimated that the B.C. economy expanded by 5.0 per cent in 2021, following a 3.4 per cent decline in 2020. The economy is forecast to expand by 4.0 per cent in 2022 and 2.5 per cent in 2023. Over the medium-term (2024 to 2026), growth is expected to range between 2.1 per cent and 2.4 per cent annually.
The Budget 2022 B.C. real GDP forecast over the three-year fiscal plan is below the average outlook provided by the Economic Forecast Council (EFC). This is one of the levels of prudence built into the fiscal plan. The outlook for 2025 and 2026 is slightly higher than the average EFC forecast as LNG production is anticipated to provide more support to the economy over that period.
Prudent Economic Forecast
Debt Affordability
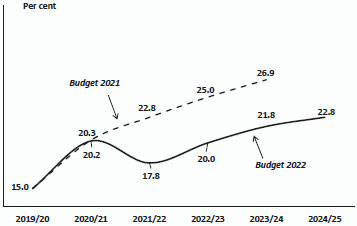
Debt affordability metrics have improved from Budget 2021 due to significantly better operating results in the current fiscal year. The taxpayer-supported debt at the end of 2021/22 is forecast to be $61.7 billion, which is almost $10 billion less than forecast in Budget 2021. However, the debt is expected to increase over the fiscal plan to finance the operating and capital investment needs of the province, with taxpayer-supported debt forecast to be $90.8 billion at the end of 2024/25, and the debt-to-GDP ratio rising to 22.8 per cent.
Debt to GDP
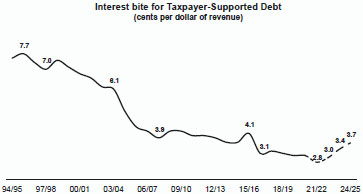
The Province’s debt-servicing costs remain at a historically low level due to prevailing low interest rates. A common metric of financing affordability is the “interest bite,” representing the taxpayer-supported interest costs as a percentage of provincial government revenue, which is at 2.8 cents per dollar in 2021/22, lower than it has been in the past, as shown below.
Risks to the Fiscal Plan
The main risks to the government’s fiscal plan include:
| • | Ongoing health-related uncertainty relating to the pandemic, including the extent of the spread and containment of the virus in BC and across the world; |
| • | Uncertainty relating to the pace and timing of full recovery from the pandemic, which contributes to the potential volatility in the economic and fiscal outlooks; |
| • | Increased demands for government services, such as health care, COVID-19 response or recovery; |
| • | Demands to support the rebuild and recovery from the climate-related disasters; and |
Budget and Fiscal Plan - 2022/23 to 2024/25
4
Summary
| • | Changes in timing of capital projects and related spending which may be influenced by several factors, such as COVID-19 safety measures, market conditions, and weather. |
To mitigate the risks to the fiscal plan, government has the following levels of prudence in its projections:
| • | Forecast allowance of $1.0 billion in each year of the fiscal plan; |
| • | Pandemic Recovery Contingencies of $2.0 billion in 2022/23 and $1.0 billion in 2023/24; |
| • | General Programs Contingencies of $2.8 billion in 2022/23, $3.4 billion in 2023/24, and $4.0 billion in 2024/25; and |
| • | A forecast for B.C.’s real GDP growth that is lower than the outlook provided by the Economic Forecast Council (0.2 percentage points lower in 2022, 2023 and 2024). |
Conclusion
Budget 2022 helps to build a stronger B.C. by prioritizing investments that make a stronger society, a stronger economy, and a stronger environment. These investments harness the collective energy, spirit, and strength of all British Columbians to overcome the pandemic, recover from climate-related disasters, create new jobs, and strengthen the important public services that people rely on throughout the province. There is much reason for hope and optimism in the future. B.C. enters into this next period from a position of strength and government will continue to work with people, businesses, communities, and Indigenous Peoples to build a stronger B.C. together.
Budget and Fiscal Plan - 2022/23 to 2024/25
5

| | PART 1 | THREE YEAR FISCAL PLAN |
| Table 1.1 Three Year Fiscal Plan | | | | | | | | | | | | | | | | |
| | | | | | | | | | | | | | | | | |
| ($ millions) | | Updated
Forecast
2021/22 | | | Budget
Estimate
2022/23 | | | Plan
2023/24 | | | Plan
2024/25 | |
| Revenue | | | 70,220 | | | | 68,552 | | | | 70,177 | | | | 72,325 | |
| Expense | | | (66,453 | ) | | | (71,013 | ) | | | (72,359 | ) | | | (74,506 | ) |
| Pandemic Recovery Contingencies | | | (3,250 | ) | | | (2,000 | ) | | | (1,000 | ) | | | — | |
| Forecast allowance | | | (1,000 | ) | | | (1,000 | ) | | | (1,000 | ) | | | (1,000 | ) |
| Deficit | | | (483 | ) | | | (5,461 | ) | | | (4,182 | ) | | | (3,181 | ) |
| Capital spending: | | | | | | | | | | | | | | | | |
| Taxpayer-supported capital spending | | | 7,157 | | | | 9,279 | | | | 9,333 | | | | 8,815 | |
| Self-supported capital spending | | | 3,828 | | | | 4,374 | | | | 4,437 | | | | 3,144 | |
| Total capital spending | | | 10,985 | | | | 13,653 | | | | 13,770 | | | | 11,959 | |
| Provincial Debt: | | | | | | | | | | | | | | | | |
| Taxpayer-supported debt | | | 61,731 | | | | 73,475 | | | | 83,302 | | | | 90,846 | |
| Self-supported debt | | | 28,814 | | | | 30,956 | | | | 33,004 | | | | 33,930 | |
| Total debt (including forecast allowance) | | | 91,545 | | | | 105,431 | | | | 117,306 | | | | 125,776 | |
| Taxpayer-supported debt to GDP ratio | | | 17.8 | % | | | 20.0 | % | | | 21.8 | % | | | 22.8 | % |
| Taxpayer-supported debt to revenue ratio | | | 92.9 | % | | | 110.9 | % | | | 122.7 | % | | | 129.8 | % |
Introduction
Budget 2022 builds on historic investments made since 2017 to continue building a stronger society, a stronger economy and a stronger environment. Projected deficits will decline over the fiscal plan period from $5.5 billion in 2022/23 to $3.2 billion in 2024/25, and debt-to-GDP ratios are below 25 per cent in each year of the fiscal plan. By taking a responsible and thoughtful approach to budgeting and fiscal planning, government continues to help British Columbians and communities overcome the pandemic, build back better from climate events and prepare for future challenges together.
Government’s consolidated operating expense totals $73.0 billion in 2022/23, $73.4 billion in 2023/24, and $74.5 billion in 2024/25. This includes ministry operating budget increases of almost $6.6 billion over the fiscal plan period and a $3.0 billion time-limited allocation in Pandemic Recovery Contingencies ($2.0 billion in 2022/23 and $1.0 billion in 2023/24). More than $10.0 billion in funding is provided over the next three years in General Programs Contingencies for: expected flood-related costs ($1.15 billion currently allocated), uncertain costs related to collective bargaining, and other spending uncertainties for new and existing programs. The revenue forecast rises from $68.6 billion in 2022/23 to $72.3 billion in 2024/25. Revenue growth reflects increased economic activity and policy measures introduced and implemented in Budget 2022, partly offset by declining natural resource revenues over the next three years and the effects of assumed one-time revenues recorded in 2021/22 that will not carry forward.
Capital spending on schools, universities, hospitals, affordable housing, long-term care facilities, highways, bridges, and other taxpayer-supported infrastructure is expected to reach a record $27.4 billion over the three-year fiscal plan period. These investments will support future growth while helping to ensure that people and communities fully recover from the experience of the past two years, and harness the opportunities of a clean and inclusive economy. These investments will also create jobs in communities throughout the province, contributing to a strong and sustainable economy.
Budget and Fiscal Plan - 2022/23 to 2024/25
6
Three Year Fiscal Plan
The new operating funding initiatives are discussed in the expense section starting on page 9. Details on the Province’s revenue forecasts are provided in the revenue section, starting on page 55. The capital investments section begins on page 63. This is followed by the debt section on page 78 and a discussion on the risks to the fiscal plan on page 81.
Budget 2022 demonstrates government’s ongoing commitment to incorporate Gender Based Analysis Plus (GBA+) into its policy and budget processes. Since 2018, the Province has used GBA+ to ensure that comprehensive, evidence-based policy advice is provided to decision makers to achieve better results for all British Columbians. Budget 2022 uses GBA+ analysis to monitor economic trends and inform all spending and tax decisions. This analytical tool helps to assess, where appropriate, the effect of different spending or tax measures on different groups, including people of different genders, incomes, ethnicities, geographic locations, ages, abilities, or sexual orientations.
The use of the GBA+ lens informed many budget priorities. The pandemic brought to light many disparities in the provision of services and the lived experiences of different populations around the province. Rural, remote and Indigenous communities are disconnected from necessary services and the global marketplace. Budget 2022 addresses this divide through accelerated investments in internet connectivity, the continuation of health care service improvements for rural and remote communities, and investments in Indigenous primary care. Analysis showed that homeless populations are not a singular entity and that services must be tailored towards the needs of different individuals. The cross-government approach funded through Budget 2022 provides an array of services along the continuum of individuals who experience homelessness in order to meet intended outcomes. In 2018 almost one in three women and just over one in eight men over the age of 15 felt unsafe or uncomfortable as a result of unwanted sexual behaviour they experienced. The rate of self-reported sexual assault among Indigenous women is three times the rate among non-Indigenous women. These experiences are informing the government’s approach to the delivery of resources and supports for victims of violence and sexual assault - with long-term dedicated funding for these services provided in this budget. These examples show how the GBA+ lens helps to build a province where everyone has equal access to opportunities and services that are inclusive, respectful, and representative of the diverse population of British Columbia.
Meaningful reconciliation with Indigenous Peoples is embedded into government’s decision making processes. Budget 2022 includes new investments to support reconciliation and stronger Indigenous communities. This includes funding for a Declaration Act Secretariat, expanded Indigenous primary care, continued investments under the Homes for BC housing plan to deliver culturally appropriate social housing in Indigenous communities and off- reserve, increased access to justice for Indigenous People through a virtual Indigenous Justice Centre, Indigenous -led emergency management priorities, and culturally- based child care through the Aboriginal Head Start program. Funding is provided in 2021/22 to support Indigenous communities and First Nations to repatriate cultural belongings from museums and institutions, both in B.C. and globally. These new initiatives are further discussed throughout this document and are in addition to other priorities that support Indigenous Peoples and communities, such as accelerating the connection of homes to high-speed internet and the creation of the Ministry of Land, Water and Resource Stewardship.
Budget and Fiscal Plan - 2022/23 to 2024/25
7
Three Year Fiscal Plan
Expense
Consolidated Revenue Fund Spending
Consolidated Revenue Fund (core government) planned spending over the fiscal plan period is $62.5 billion in 2022/23, $62.9 billion in 2023/24, and $64.2 billion in 2024/25 as shown in Table 1.3 on page 54. This includes incremental expenses of $2.2 billion in 2022/23, $1.7 billion in 2023/24, and $2.7 billion in 2024/25, totaling $6.6 billion across the three-year fiscal plan. Government remains committed to investing in ways that build a stronger society, a stronger economy and a stronger environment. Funding decisions are underpinned by government’s five foundational principles: to put people first; to engage in lasting and meaningful reconciliation with Indigenous Peoples; to support equity and anti -racism in the province; to build a better future through fighting climate change; and to build a strong, sustainable economy that works for everyone.
Building a Stronger Society by Putting People First
A Healthy British Columbia
Improving the quality of health care services and keeping British Columbians safe from the COVID-19 pandemic remains the Province’s highest priority, with over $3.2 billion provided for health care spending over the next three years. This is comprised of over $2.9 billion to increase accessibility and quality of health and mental health services throughout the province and $299 million for other health-related costs that are part of strategies such as complex care housing; expanding services for homeless individuals; climate preparedness and adaptation in the health care system; and ChildCareBC. These strategies are discussed in other sections of this document.
In addition, Budget 2022 provides $875 million in 2022/23 from Pandemic Recovery Contingencies for the Ministry of Health to continue to manage the COVID-19 pandemic. This includes funding for ongoing COVID-19 and influenza vaccination programs, the provision of personal protective equipment for health care workers, and COVID-19 testing. This improves care through enhanced screenings and additional measures to limit the risk of spreading COVID-19 to vulnerable residents in long-term care facilities, assisted living facilities, and provincial mental health facilities. Initiatives will continue to ensure that people living in rural, remote, and Indigenous communities in B.C. have access to critical health care. This includes funding to improve medical transportation options, access to virtual care, and increased mental health supports for Indigenous and non -Indigenous communities. Funding is also allocated for the BC Centre for Disease Control to produce real-time data, modelling, and epidemiological analysis; support decision making to manage the pandemic; provide educational materials to the public; and maintain enhanced lab testing throughout the province.
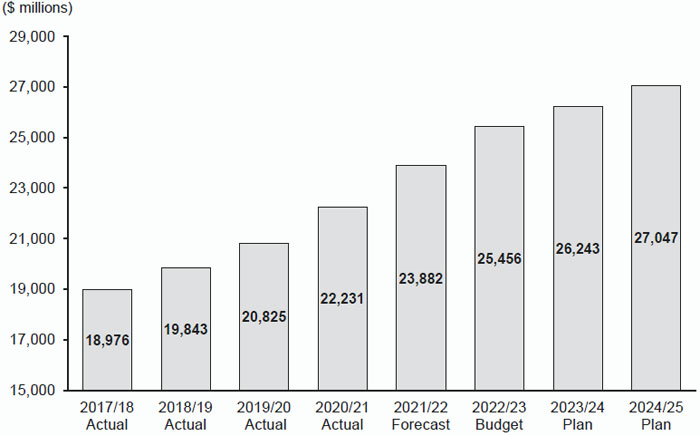
Budget 2022 builds upon investments since Budget 2017 Update by increasing base budget health funding to $27 billion by 2024/25. This includes funding to manage the growing demand for all health services including cancer care, surgical care and primary care in British Columbia. Capital spending on health sector infrastructure in Budget 2022 totals $8.6 billion over three years as detailed on page 63.
Budget and Fiscal Plan - 2022/23 to 2024/25
8
Three Year Fiscal Plan
Effective primary care helps patients to manage complex medical conditions and determine specialist referral requirements. Primary care also minimizes the number of patients who enter emergency departments for routine health care issues. Budget 2022 provides $102 million over three years to continue advancing the Primary Care Strategy, including:
| • | $57 million to increase the number of Urgent and Primary Care Centres throughout the province. There are currently 26 centres that provide urgent and primary care services which have been instrumental in responding to the COVID-19 pandemic, administering influenza immunization campaigns, and providing patient care during extreme weather events. |
| • | $45 million to implement primary care networks and bring additional traditional wellness providers closer to Indigenous communities, which will provide culturally safe care for these populations. Funding supports the operations of up to 15 First Nations Primary Health Care Centres. These centres will improve access to primary care for Indigenous Peoples and attachment to a team of care providers supporting both western and Indigenous health and wellness practices. |
Budget 2022 provides $303 million in funding over the next three years to continue a strategy to support timely surgeries and diagnostic imaging. Additional dedicated funding will continue this progress and help to address increased wait lists resulting from postponed surgeries due to the COVID-19 pandemic and the province’s growing and aging population.
The COVID-19 pandemic and recent extreme weather events have demonstrated the need for additional resources for the ambulance system’s emergency dispatchers and responders. The Province is providing $148 million over the fiscal plan period to continue to implement the BC Emergency Health Services Action Plan. This provides funding to reduce call wait times and emergency response times by increasing the number of paramedics and dispatchers to respond to emergencies throughout the province.
Government is committed to providing people in acute care facilities with more consistent, safe, and stable patient care. Budget 2022 provides $231 million over the next three years to bring thousands of service and support service workers back to working directly for health authorities after 20 years of contracting this work through private companies. This will improve the ability to recruit workers, while improving wages and benefits, working conditions, job security and stability for over 2,900 workers — a large majority of whom are racialized women — that patients count on daily.
Budget and Fiscal Plan - 2022/23 to 2024/25
9
Three Year Fiscal Plan
Chart 1.1.1 Investments in People’s Health and Mental Health*
* Funding for the Ministry of Health. Does not include time-limited funding initiatives related to pandemic response and economic recovery.
Investing in Mental Health and Responding to the Overdose Crisis
This past year has been very difficult for people in British Columbia. People have endured two public health emergencies — the pandemic and the opioid crisis — as well as floods, wildfires and heat waves. These devastating events have taken a toll on individual and collective mental health.
Since Budget 2017 Update, government has prioritized expanding mental health and addictions services throughout the province. Budget 2022 provides $10 million across three years to the Ministry of Mental Health and Addictions for staffing to continue advancing the expansion of services, including support services for the complex care housing initiative discussed on page 12. This will bring the incremental annual funding for mental health and addictions services since the Budget 2017 Update to more than $375 million.
Supports for Individuals Experiencing Homelessness
The Province is implementing a collaborative cross-government approach to focus on the root causes of homelessness. The approach includes both preventing homelessness from occurring and responding quickly to assist people experiencing homelessness to become stably housed. Government is investing more than $633 million over the fiscal plan period towards providing services and supports for people experiencing or at risk of homelessness. This builds on previous investments and begins implementation of the new, more coordinated approach which recognizes the importance of consistent, accessible, and integrated services.
Budget and Fiscal Plan - 2022/23 to 2024/25
10
Three Year Fiscal Plan
Supporting Youth at Risk of Homelessness
There is clear evidence that youth who have interacted with the government care system are more likely to experience homelessness relative to their peers, with almost 50 per cent of former youth in care experiencing homelessness at some point in their lives. Budget 2022 provides $35 million over the next three years to change this situation by supporting these youth beyond their 19th birthday to decrease their risk of becoming homeless. This funding will expand upon the supports available to young adults as they age out of the government care system. Beginning in 2022/23, temporary housing and support arrangements that had been provided in 2020 will be made permanent and new rent supplements will be introduced for program participants. Over the course of 2023/24 and 2024/25, dedicated provincial funding grows to facilitate expanded income supports and enhancements to the Agreement with Young Adults program to include counselling, medical benefits and expanded life-skills programming. Funding will also support new Youth Transitions navigators who will assist up to 8,830 youth up to their 27th birthday. Navigators will help successfully transition these youth from government care by facilitating access to this better-designed continuum of services.
Expanded Response to Support People Experiencing Homelessness
Budget 2022 provides $170 million to begin implementation of enhanced and expanded responses to homelessness. In partnership with the Government of Canada, Budget 2022 includes a program offering rent supplements of up to $600 per month to help people access market housing. By 2024/25, more than 3,000 clients will be supported through this program, providing additional housing options to build on existing and ongoing government investments in supportive housing. Recipients of rent supplements and those in supportive housing will be provided an integrated range of provincial supports through partnerships with community organizations. These will include supports to address physical health, mental wellness, substance use, personal care, and food security in a culturally safe, gender and trauma-informed environment.
Funding of $4 million is included for BC Housing to provide supports for individuals experiencing homelessness at encampments around the province. These supports include site management, engagement, and support for food, sanitation, storage, and the safety of those living in the encampments, while reducing the impact on people in surrounding communities. In addition, the Province will provide funding to support the 2023 provincial homelessness count, and research to identify the unique needs of women experiencing homelessness including: Indigenous women, women of colour, transgender women, and women who are homeless with children. The response will also double the number of community integration specialists throughout the province to help individuals navigate government programs and supports.
Complex Care Housing
In January 2022, the Province launched a first-of-its-kind complex-care housing program. Complex care housing goes beyond the current housing model. It is a ground-breaking approach to address the needs of people who often have overlapping mental-health challenges, substance-use issues, trauma and acquired brain injuries, and who often end up facing the most significant housing barriers. This program will provide an enhanced level of integrated health and social supports to serve people where they live.
Budget and Fiscal Plan - 2022/23 to 2024/25
11
Three Year Fiscal Plan
Budget 2022 builds on this initial investment by providing $164 million for at least 20 additional sites across B.C. with plans underway to support approximately 500 individuals. Services will be health-focused and will seek to meet the individual needs of participants, ranging from intensive supportive housing, interim housing for those transitioning out of hospitals or correctional facilities, and high-intensity housing for those with the most complex needs.
Continued Response to COVID-19 for People Experiencing Homelessness
At the outset of the pandemic, some of the province’s most vulnerable residents risked being without housing, shelter and other living arrangements as a result of necessary provincial health orders related to physical distancing. Government responded by leasing and purchasing over 3,000 spaces at hotels, motels, and community centres to provide alternative shelter for these individuals in need.
Budget 2022 allocates $264 million over the next three years to continue housing arrangements for these residents as they are transitioned to permanent housing. This includes more than $63 million in capital funding and $50 million in operating funding over the next three years to acquire and implement permanent housing solutions for a portion of those now temporarily housed. It also includes $150 million in Pandemic Recovery Contingencies to continue to extend the temporary spaces for remaining individuals while permanent housing options become available and maintains support, safety, and outreach services for those who will continue to be housed in temporary arrangements.
Table 1.2.1 Support for Individuals Experiencing or At Risk of Homelessness
| ($ millions) | | 2022/23 | | | 2023/24 | | | 2024/25 | | | Total | |
| Youth Transitions Program | | 5 | | | 10 | | | 20 | | | 35 | |
| Homelessness Supports | | 94 | | | 37 | | | 39 | | | 170 | |
| Complex Care Housing | | 55 | | | 54 | | | 54 | | | 164 | |
| Permanent Housing Plan (COVID-19) | | 230 | * | | 17 | | | 17 | | | 264 | |
| | | | | | | | | | | | | |
| Total | | 384 | | | 119 | | | 130 | | | 633 | |
Note: Table may not sum due to rounding
*Includes Pandemic and Recovery Contingencies allocation
Affordable, Accessible, and High-Quality Child Care
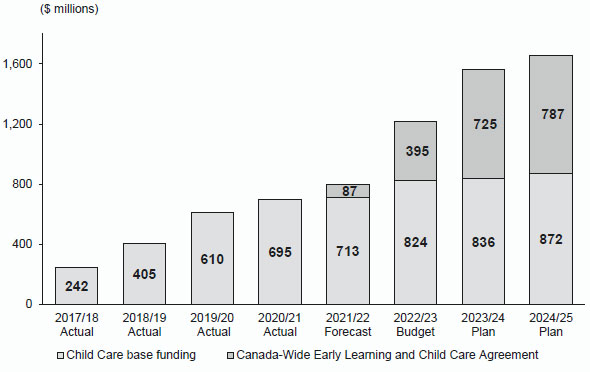
Since launching the ChildCareBC plan in Budget 2018, government has invested over $2.4 billion toward building affordable, accessible, and high-quality child care services to ensure that more people – especially women - can participate in the workforce.
In 2021, B.C. signed a historic agreement with the Government of Canada that will deliver more than $3.2 billion over five years to build on the progress made under ChildCareBC. This complements the Province’s plan and accelerates improved access to quality, affordable, flexible, and inclusive child care services. By the end of 2022, British Columbians will see a 50 per cent reduction in average parent fees, resulting in fees of approximately $20 per day on average, for children under the age of six in licensed child care.
Budget and Fiscal Plan - 2022/23 to 2024/25
12
Three Year Fiscal Plan
Budget 2022 invests $284 million more in provincial funding for child care services over the fiscal plan. This includes over $118 million to reduce parent fees for preschool and before- and after-school care to be more consistent with the fee reduction under the federal-provincial agreement. These fee reductions will be in place for the beginning of the 2023/24 school year and will benefit over 50,000 children and their families. These investments, including those under the federal-provincial agreement, are displayed on Chart 1.1.2.
Chart 1.1.2 Child Care Services*
* Does not include time-limited funding initiatives related to pandemic response and economic recovery.
The goal of ChildCareBC is to ensure that child care services are available for anyone who wants or needs them. This goal will be achieved through child care facilities built to a standard for quality, accessibility and inclusivity, and to ensure long-lasting infrastructure investments. To date, more than 26,000 spaces have been funded and announced through provincial investments. The new shared agreement with the federal government will lead to the creation of 30,000 new licensed child care spaces within five years, and 40,000 spaces within seven years. Budget 2022 further builds on these investments and includes $33 million to create more before- and after-school spaces, and more than $11 million to enable an increase in the number of school districts providing the Seamless Day program from 24 to 44. Building on Budget 2021 investments, $11 million is also provided to support the Aboriginal Head Start program and engagement, community planning, and capacity building with Indigenous stakeholders.
Budget 2022 invests $80 million to continue to ensure that the workforce behind child care is highly trained and fairly compensated. This includes expanding the wage enhancement program for certified early childhood educators who spend under 50 per cent of their time in direct child care functions but are still working within child care services. To keep up with the pace of new space creation, Budget 2022 provides $7 million for more licensing officers to ensure that more child care facilities can be permitted to open once they are complete. In addition, Budget 2022 invests $8 million to expand the dual credit program to 150 students and to create 130 more training seats in
Budget and Fiscal Plan - 2022/23 to 2024/25
13
Three Year Fiscal Plan
post-secondary institutions. This will increase the number of early childhood educators that are trained to meet the needs of the growing sector. An additional $16 million is devoted to several additional targeted measures to improve program delivery and to support the integration of child care into the broader learning environment.
Finally, starting next fiscal year, the delivery of child care programs will be moved from the Ministry of Children and Family Development to be administered within the Ministry of Education and Child Care.
Putting People First
Investing in K-12 Education
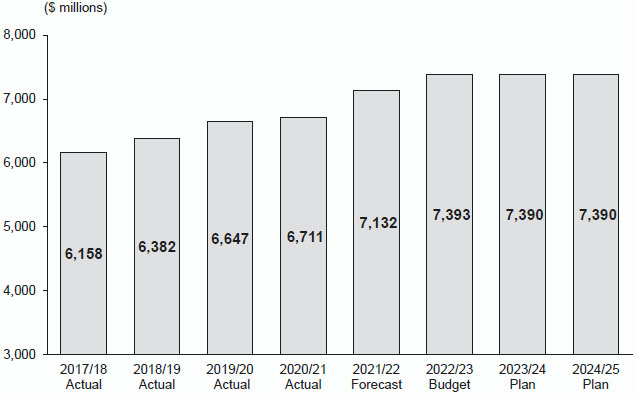
Budget 2022 invests more than $664 million over the fiscal plan to respond to growing K-12 enrolment in British Columbia’s public and independent school systems. This funding will help students acquire the foundations that support a strong economy into the future. It will also continue supplements to school districts for children and youth in care, Indigenous learners, rural school districts, and students with support needs. This funding includes $105 million for the Classroom Enhancement Fund which supports nearly 4,500 teachers, including over 700 special education teachers, and more than 200 teacher psychologists and counsellors. These investments will bring the total annual funding for K-12 education to over $7.3 billion by 2024/25 as indicated in Chart 1.1.3. In addition, the Province’s capital plan includes $3.1 billion over the next three years to build new schools to respond to enrolment growth, and to maintain and seismically upgrade schools throughout the province. This is further discussed on page 64.
Chart 1.1.3 Investing in K-12 Education*
* Does not include time-limited funding initiatives related to pandemic response and economic recovery.
Budget and Fiscal Plan - 2022/23 to 2024/25
14
Three Year Fiscal Plan
Improving the Lives of Children and Youth
Budget 2022 provides more than $259 million across the fiscal plan period to improve the lives of children and youth throughout the province. More than $87 million of this funding is dedicated to support children and youth in ministry care or in the care of a family member. Government continues to implement its strategy of reducing the number of children in care and keeping families together through the promotion of adoption services, family reunification arrangements, and provision of other custody options. Incremental funding will ensure the continued care and support for more than 10,000 children and youth in government care, or in alternatives to care. Funding will also support the Devices for Youth in Care program, which provides youth in care access to a smartphone to help caregivers, who otherwise would be responsible for this cost, enhance communication and safety.
Funding includes more than $172 million over the fiscal plan for ongoing assistance for children and youth with support needs, and for the transition to a more responsive, flexible, and needs-based system for children, youth, and their families. Of this, $58 million is dedicated to increases in anticipated demand growth costs for children and youth with support needs. Funding of $114 million is provided to begin the transition of services to a needs-based system throughout the province and, beginning on April 1, 2022, to fully cover the cost of essential medical equipment and supplies, such as wheelchairs. This transition of services begins with the establishment of early implementation in two regions of the province in 2023. These will offer accessible and inclusive services through a community agency to all families, regardless of whether they have a diagnosis, based on their child or youth’s unique needs. Consultation will continue with families, service providers and Indigenous leaders and rights holders to ensure a smooth transition for all families. Findings from the early implementation will inform a full provincial roll-out in 2024.
Supporting Vulnerable British Columbians
From the outset of the pandemic, the Province has provided the most vulnerable British Columbians with income and disability financial assistance and other resources to access medical services, support their children to start the school year, and access transportation, while navigating the challenges of COVID-19. Budget 2022 provides $36 million over the fiscal plan period to provide for anticipated growth in demand and ensure that these financial supports remain strong in uncertain times. This funding builds on the historic investments made as part of TogetherBC, B.C.’s first poverty reduction strategy. These investments have provided: $325 per month in total increases to income and disability assistance rates since 2017; a $50 monthly increase to the Senior’s Supplement benefiting over 80,000 seniors; and other family supports like the Child Care Fee Reduction Initiative, the Affordable Child Care Benefit, and the B.C. Child Opportunity Benefit.
Budget 2022 provides more than $3 million in new funding over the fiscal plan period to support greater accessibility of services throughout the province. In June 2021, British Columbia passed the Accessible British Columbia Act. This legislation commits to the development of an accessibility plan and regulations, to build a tool to provide feedback to government, and to establish a Provincial Accessibility Committee to support the government in these actions.
Budget and Fiscal Plan - 2022/23 to 2024/25
15
Three Year Fiscal Plan
Almost $49 million across the next three years is dedicated to Community Living BC, which provides critical services and supports to approximately 25,000 adults with developmental disabilities and their families. This includes funding for residential and employment supports, initiatives to develop skills so that participants can be more involved with their communities, and respite supports to allow families and caregivers the opportunity to rest and recharge. Maintaining the quality of life for all British Columbians is a government priority, including adults with developmental disabilities who are in home-sharing arrangements with Community Living BC. Budget 2022 provides funding to improve monitoring of home-sharing providers and provide issues management, critical response, and ensure the quality of services that they provide.
A Responsive Justice System
Budget 2022 provides more than $46 million over the fiscal plan period to support timely access to justice services, alleviate wait time to trials, and help victims and their families resolve disputes more quickly. An additional $12 million is provided to continue the digitization of justice services that were implemented during the COVID-19 pandemic, including online traffic court, virtual bail, and a virtual Indigenous Justice Centre. The expansion of these services has reduced court backlogs, saved residents of rural and remote communities extensive travel time, and helped to build a more responsive justice system.
Keeping British Columbians Safe
Budget 2022 allocates $233 million over the fiscal plan period to fund public safety initiatives and negotiated wage enhancements for Royal Canadian Mounted Police to continue public safety measures, especially in rural and remote regions of the province. This includes funding to make B.C.’s communities safer, and to assist youth by giving them tools to avoid a life of gang and drug violence. Government is providing $5 million of dedicated funding over three years for the Expect Respect and a Safe Education, and Gang Intervention and Exiting Programs. These programs have been successful in their intent to divert youth from gang-associated activities through the education system, and to support youth to voluntarily exit from gangs.
Incremental funding totaling $22 million over three years is budgeted to provide services to victims of sexual assault and exploitation. Through this allocation, the Province will create dedicated and ongoing funding to support approximately 50 service centres that provide crisis response, counselling, preventative medication, forensic exams, mechanisms to report to the police, and child protection services.
More than $12 million is provided to increase capacity and reduce backlogs in the BC Coroners Service stemming from pressures related to the COVID-19 pandemic, the overdose crisis, and recent climate-related events. This funding will increase the number of annual autopsies performed by 250 per year, increase the number of coroner investigations by 2,850 per year, and will provide staff support to address call volumes that bring information and closure to the families and communities that are impacted by cases brought to the BC Coroners Service.
Budget and Fiscal Plan - 2022/23 to 2024/25
16
Three Year Fiscal Plan
Building a Stronger Economy for Everyone
Government’s Economic Plan
In February 2022, government released an economic plan with a vision for B.C.’s economic future: an inclusive, sustainable, and innovative economy that works for everyone. StrongerBC: A Plan for Today, a Vision for Tomorrow charts the path to meeting two big goals — inclusive growth and clean growth — to build a strong economy that works for more people and establishes sustainability as the foundation for the economy of tomorrow.
Inclusive growth means investing in actions that expand economic opportunity for all British Columbians, such as the development of a workforce readiness plan and closing the digital divide. New priorities include the development of the Future Ready: Skills for the Jobs of Tomorrow, a workforce readiness plan that will address the challenge of filling more than one million job openings in B.C. over the next ten years. More information on Budget 2022 investments in skills and job training can be found on page 22. The pandemic has highlighted how important internet connectivity is to access job training, to connect families, and to foster economic growth. The plan also highlights the need to provide more communities with high-speed internet to connect to the digital economy. Budget 2022 investments in connectivity are further highlighted on page 20.
Clean growth means achieving government’s climate commitments through innovative economic growth, leveraging B.C.’s position as a leader in environmental and social responsibility, and the creation of high-value, sustainable resource jobs. Further discussion on government’s Budget 2022 investments for CleanBC can be found on page 24.
Budget 2022 provides an allocation of $50 million over the fiscal plan to deliver additional, targeted strategies and investments to support both clean and inclusive growth. Funding will help grow B.C.’s life sciences, manufacturing and agricultural sectors, and support reconciliation through economic development. Budget 2022 also provides funding to support ongoing tracking and reporting on the progress of the plan’s intended outcomes. The funding will include support for an Integrated Marketplace to speed up the adoption of made-in-B.C. clean technologies and establishing a world leading standard for Environmental, Social and Governance reporting. In addition, the Province has provided funding of $195 million in 2021/22 to support B.C.’s growing life sciences sector, which is further highlighted on page 21.
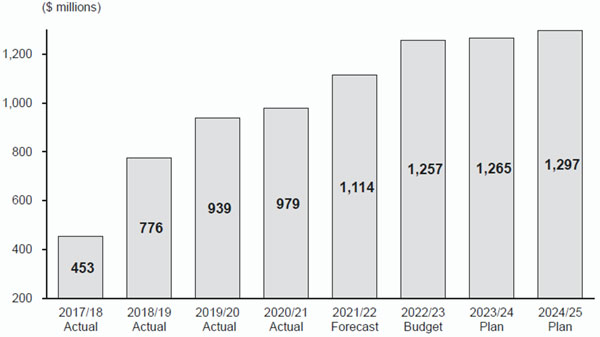
Addressing the Housing Challenge
In addition to funding for the Province’s plan to combat homelessness in British Columbia, Budget 2022 builds on investments made in Budget 2021 with an additional $166 million across the fiscal plan period to continue and accelerate progress towards building 114,000 affordable housing units in British Columbia over 10 years. This brings the level of housing investments and homelessness supports to over $1.2 billion per year by 2024/25 as indicated in Chart 1.1.4. More than 32,000 new homes have been completed or are underway since Homes for BC was launched in Budget 2018.
Budget and Fiscal Plan - 2022/23 to 2024/25
17
Three Year Fiscal Plan
This includes funding for Building BC, a suite of programs that have increased permanent supportive housing for those experiencing homelessness, housing for women and children fleeing abuse, housing for Indigenous People, and mixed-income rental housing for families and individuals. As a component of the $166 million, Budget 2022 accelerates funding of $100 million into 2022/23 for Building BC’s Community Housing Fund, which will support the development of mixed-income rental housing for low-income families and seniors sooner than originally planned.
Budget 2021 provided $2 billion in new low-interest financing for HousingHub, which works with community, government, non-profit and private sector partners to create new affordable rental housing and homeownership options for middle-income British Columbians. This new funding has led to a significant increase in participation in the program, with 4,200 units now underway or completed under HousingHub. To respond to the heightened interest, Budget 2022 provides $8 million of funding to support HousingHub’s project development capacity.
Chart 1.1.4 Investments in Housing Affordability and Homelessness Supports*
* Does not include time-limited funding initiatives related to pandemic response and economic recovery.
Budget and Fiscal Plan - 2022/23 to 2024/25
18
Three Year Fiscal Plan
Connecting Communities
Enhancing Digital Connectivity
Budget 2022 provides more than $289 million in new funding over the next five years to aggressively accelerate the connection of homes to high-speed internet and further close the digital divide. Through Budget 2022 investments more than 280 rural, remote and Indigenous communities will be connected to high-speed internet, improving access to education and health care, diversifying their economies, and expanding the ability for local businesses to reach the international marketplace. Coupled with previous investments of $220 million since 2017, this funding will bring the total provincial spending to expand connectivity to over $509 million by 2026/27.
Moving British Columbians and Goods
Recent supply interruptions have reinforced how critical infrastructure and transportation services are to ensuring the movement of people and goods. Beyond capital funding that will invest in building and strengthening critical transportation infrastructure around the province as outlined on page 69, Budget 2022 provides more than $78 million across the fiscal plan to keep British Columbians moving. An allocation of $30 million is provided to keep provincial highways and roads in good repair and in safe conditions for the traveling public — including road and bridge maintenance, electrical maintenance on highways and pavement markings. Funding of $48 million over three years is provided to BC Transit and BC Ferries services, ensuring that more than 1.8 million British Columbians have access to local and regional transit services in over 130 communities. The Province has also responded with funding to address the severe damage to the provincial highway network that occurred during the November 2021 storms, to ensure that people and goods continue to move as quickly as possible. This is further discussed on page 31.
Transitioning to a Sustainable Economy
Old Growth Strategic Review
In November 2021, the Province announced its intention to work in partnership with First Nations to defer the harvest of ancient, rare and priority large stands of old growth within 2.6 million hectares of B.C.’s most at-risk old-growth forests. Logging deferrals were established to prevent irreversible biodiversity loss while First Nations, the Province, and industry develop a new approach to sustainable forest management that prioritizes ecosystem health and community prosperity throughout British Columbia.
Budget 2022 provides more than $185 million over the next three years to bring forth coordinated and comprehensive supports to help forest workers and contractors, industry, communities, and First Nations to adapt and respond to the impacts of deferrals. This includes connecting workers with short-term employment opportunities, and education and skills training for community members. It also includes funding of partnerships with businesses and communities to assist them through the transition to create jobs through diversified economies and infrastructure projects. Funding will also support the Bridging to Retirement program, which will support eligible forestry workers and contractors 55 years or older to transition to retirement.
Budget and Fiscal Plan - 2022/23 to 2024/25
19
Three Year Fiscal Plan
Sustainable Lands, Water and Resource Management
The stewardship of British Columbia’s land and marine environments has become increasingly important and complex. These environments are impacted by climate change, increased demands to access natural resources and the need to ensure British Columbia’s biodiversity is well managed. Budget 2022 provides over $44 million in new funding to support the creation of the Ministry of Land, Water and Resource Stewardship and support government’s goals of economic activity, environmental sustainability, and reconciliation with Indigenous Peoples. The new ministry will incorporate programs that are currently housed in other ministries, including: land use policy and planning; fisheries and coastal policy and planning; and aquatic and terrestrial habitat management. In addition, the ministry will have a leadership role working with Indigenous governments and organizations to develop a new vision and policies for land, water and resource management to bring government’s natural resource policy framework in line with the Declaration on the Rights of Indigenous Peoples Act.
Advancing Mining Opportunities
British Columbia’s mining sector can play a critical role supporting the transition to a low-carbon future both locally and globally. Metals and minerals found within B.C. are used to create green technology, such as electric vehicles and wind turbines, and B.C. mining operations stand out as having a lower greenhouse gas intensity than most global competitors. In addition, B.C.’s mining sector saw near record levels of investment in mineral exploration in 2021, totalling nearly $700 million. Budget 2022 provides $18 million over the next three years to continue the Regulatory Excellence in Mining strategy and support robust and efficient decision-making processes across regulatory agencies. This funding will help to attract investment in mining and create jobs, advance reconciliation, and enhance environmental outcomes in support of a safe and thriving mining sector in British Columbia.
Investing in Life Sciences Research
The province’s life sciences sector is made up of more than 2,000 companies, employing 18,000 British Columbians and creating medical innovations and research that improve health care delivery around the world. The pandemic has displayed the importance of a thriving life sciences sector. In 2021/22, government is investing in further developing and providing training opportunities in B.C.’s expanding life sciences sector through $195 million in grant funding to Genome BC and Michael Smith Health Research BC. This funding represents a significant increase in the Province’s investments in these organizations and will enable them to increase funding provided for researchers and research projects in B.C.
Grant funding will provide significant benefit to workforce readiness and job creation in B.C. Since its inception in 2000, Genome BC has generated over $1.2 billion of investments in more than 450 B.C.-based research and innovation projects, brought in more than $900 million in funding to B.C. researchers, and created over 32,000 jobs in the province. Funding provided to Genome BC will enable it to invest in research projects, supporting researchers in applying genomics to new and improved products, services and commercial opportunities.
Budget and Fiscal Plan - 2022/23 to 2024/25
20
Three Year Fiscal Plan
Michael Smith Health Research BC has a mandate to develop, retain and attract people whose research improves the health of British Columbians, address health system priorities, create jobs, and add to the knowledge economy. Researchers funded by the organization leverage government investments by attracting additional funding from both public and private organizations, resulting in further job creation and economic benefits. In 2020/21, researchers received eight times the value of their award in additional research funding, totalling $730,000 per scholar.
Through the research it funds, Michael Smith Health Research BC trains the next generation of health researchers, many of whom stay in B.C. Funding provided to the organization will enable it to provide grants to researchers to develop their talent, advance patient-orientated research and address B.C.-specific health and health system priorities.
Table 1.2.2 Investments for a Strong Economy
| ($ millions) | | | 2021/22 | | | | 2022/23 | | | | 2023/24 | | | | 2024/25 | | | | Total | |
| Stronger BC Economic Plan | | | — | | | | 11 | | | | 21 | | | | 21 | | | | 54 | |
| Addressing the Housing Challenge | | | — | | | | 111 | | | | 12 | | | | 43 | | | | 166 | |
| Enhancing Digital Connectivity* | | | — | | | | 5 | | | | 7 | | | | 91 | | | | 104 | |
| Moving British Columbians and Goods | | | — | | | | 26 | | | | 26 | | | | 26 | | | | 78 | |
| Old Growth Supports | | | — | | | | 112 | | | | 44 | | | | 31 | | | | 185 | |
| Land, Water and Resource Stewardship | | | — | | | | 10 | | | | 17 | | | | 17 | | | | 44 | |
| Advancing Mining Opportunities | | | — | | | | 8 | | | | 8 | | | | 2 | | | | 18 | |
| Life Sciences Research | | | 195 | | | | — | | | | — | | | | — | | | | 195 | |
| Job Training and Skills Development | | | — | | | | 39 | | | | 14 | | | | 14 | | | | 67 | |
| Declaration Act Secretariat | | | — | | | | 4 | | | | 4 | | | | 4 | | | | 12 | |
| | | | | | | | | | | | | | | | | | | | | |
| Total | | | 195 | | | | 326 | | | | 154 | | | | 250 | | | | 925 | |
Table may not sum due to rounding. Table includes Contingencies allocations.
*Funding to enhance digital connectivity builds on $40 million of new funding in Budget 2021 , and includes funding commitments to 2026/27. The total Budget 2022 investment is $289 million through 2026/27.
Building the Skills for Tomorrow’s Economy
Strengthening B.C.’s Training System
The pandemic has demonstrated the importance of a diverse workforce supply to meet the challenges caused by skills shortages and business volatility, and to continue to ensure a strong and sustainable recovery. The BC Labour Market Outlook forecasts that B.C.’s economy will be strong over the next decade, with over one million job openings forecasted by 2031. Almost 80 per cent of these jobs are in high-growth sectors such as health care and technology and will require post-secondary education or training.
Since 2017, government has been actively investing in new post-secondary education and skills training initiatives and has created nearly 2,900 new technology student spaces at public post-secondary institutions, provided new funding for hiring and training critical health care workers, expanded access to short-term education and skills training, and provided additional funding for Indigenous skills training.
Government is now developing a comprehensive workforce readiness plan titled Future Ready: Skills for the Jobs of Tomorrow, to proactively address both systemic and emerging workforce challenges, such as shifting demographics and climate adaptation. This strategy will build upon StrongerBC investments of $48 million in 2020/21 and Budget 2021 investments of $32 million in 2021/22 that have provided short-term skills training for unemployed or precariously employed people, and Indigenous-led training with an aim to prepare participants for long-term jobs in tomorrow’s economy.
Budget and Fiscal Plan - 2022/23 to 2024/25
21
Three Year Fiscal Plan
An early component of the action plan is the inclusion of $25 million in 2022/23 as part of Budget 2022 to continue to expand training for health care assistants to address critical staffing shortages in the long-term care, assisted living and home care sectors. This builds on previous investments of $75 million in Budget 2021 and will enable the Province to create 2,000 post-secondary seats for health care assistants in 2022/23, which will enable the Province to hire more than 5,000 new health care assistants by 2022/23. In addition, the Province’s capital plan includes $4.3 billion over the next three years for capital investments at post-secondary institutions. This is further discussed on page 66.
An additional $21 million of funding is provided over the next three years to meet the growing demand for adult education through the Graduated Adult Program. In September 2017, government announced the restoration of tuition-free Academic Upgrading and Literacy Foundations that provides for pre-post-secondary programs designed to improve learners’ literacy, numeracy, language, and academic skills. This enables learners to continue into post-secondary education and find new or better employment.
Skilled Trades Certification
In 2021, government introduced a Skilled Trades Certification policy that will initially apply to 10 electrical, mechanical, and automotive trades. This policy will require tradespeople to be either a certified journeyperson or a registered apprentice to practice their trade. Uncertified workers are often paid less and have lower rates of employment stability and mobility. This policy will raise skill levels in the trades to enhance productivity, increase the prestige of the trades to attract workers, and provide more opportunities for trades workers to benefit from post-secondary training.
To support these goals, government is investing $21 million over three years to create trades training seats, expand targeted programs and services to support uncertified workers to become apprentices or obtain certifications, and engage in monitoring and compliance activities at worksites. Funding will be provided to the Industry Training Authority.
Community Benefits Agreements
Community Benefit Agreements (CBAs) allow government to leverage record levels of capital project investments in transportation, post-secondary, and health care projects to deliver community benefits in the form of training the next generation of skilled workers, increase opportunities for locals and underrepresented groups, and expand the construction workforce. This encourages the adoption of trades skills by a broader cross section of British Columbians and helps address the anticipated skilled labour needs of the construction sector.
CBAs provide priority hiring to reduce inequality by increasing employment for women, Indigenous Peoples, young people, locals and other underrepresented groups. They also increase apprenticeship opportunities, offer apprentices a clearer path to Red Seal trades certification, and make the industry more attractive to new entrants by improving the workplace environment. The Respectful Onsight Initiative is a combination of diversity and inclusion education and training, and workplace cultural awareness. This initiative supports the retention of new entrants to the construction workforce. BC Infrastructure Benefits Inc. (a provincial Crown corporation) has been successful in attracting individuals who have not previously participated in the construction sector, helping to
Budget and Fiscal Plan - 2022/23 to 2024/25
22
Three Year Fiscal Plan
grow the province’s workforce. There are currently 12 approved projects using the CBA, representing $6.8 billion in capital investment. More information on CBAs can be found in the topic box on page 35.
Working Together Towards Reconciliation
A stronger British Columbia requires moving forward together through true and lasting reconciliation with Indigenous Peoples. The Province passed the Declaration on the Rights of Indigenous Peoples Act (Declaration Act) into law in November 2019. The Act sets a framework for reconciliation in B.C. and to ensure the human rights of Indigenous Peoples are respected. The legislation also sets out a requirement to align B.C.’s laws with the UN Declaration on the Rights of Indigenous Peoples and enables new approaches to decision-making that will lead to more predictability and transparency in work done together.
Budget 2022 provides $12 million over the next three years to create and support the work of the Declaration Act Secretariat. The Secretariat will provide guidance on consultation and consistency of laws with the Declaration Act, help to inform government’s legislative agenda, and engage with Indigenous Peoples on ways to ensure that the Declaration Act is consistently applied. This funding is in addition to the $77 million in funding provided in Budget 2021 to support the implementation of the Declaration Act, engagement on legislation, negotiation capacity, and initiatives to increase Indigenous participation in land and resource activities within Indigenous territories.
Building a Stronger Environment for Our Future
CleanBC
Government reaffirmed its role as a global leader in climate action with the launch of the CleanBC Roadmap to 2030. Budget 2022 builds on $2.3 billion allocated to date for CleanBC and provides over $1 billion in new funding to continue existing CleanBC measures and implement new initiatives identified in the Roadmap. This includes over $651 million in new operating funding to support clean transportation, energy efficient buildings and communities, and support industry to manage the transition to a low-carbon economy. It also includes funding to support the development and enhancement of regulatory measures such as the Low Carbon Fuel Standard and a cap on natural gas emissions from utilities. These are critical to supporting the province in meeting its emission targets.
Budget 2022 includes funding for a new Clean Transportation Action Plan that will establish future actions to reduce transportation emissions, such as mode shifting and active transportation. Other initiatives from the Roadmap that are funded through the budget include developing the highest efficiency standards for space and water heating, a new Local Government Climate Action Program, and measures to reduce emissions in industry such as methane and make new industrial operations ‘net zero ready’. These are further outlined below.
Budget and Fiscal Plan - 2022/23 to 2024/25
23
Three Year Fiscal Plan
Table 1.2.3 Investments for CleanBC (including Contingencies Allocations)
| ($ millions) | | | 2022/23 | | | | 2023/24 | | | | 2024/25 | | | | Total | |
| New Investments for CleanBC | | | | | | | | | | | | | | | | |
| Low Carbon Energy | | | 4 | | | | 3 | | | | 3 | | | | 9 | |
| Clean Transportation | | | 35 | | | | 56 | | | | 34 | | | | 125 | |
| Energy Efficient Buildings | | | 11 | | | | 24 | | | | 11 | | | | 46 | |
| Communities and Land Based Activities | | | 39 | | | | 37 | | | | 37 | | | | 113 | |
| Clean Industry | | | 6 | | | | 7 | | | | 298 | | | | 310 | |
| Circular Economy | | | 11 | | | | 1 | | | | 1 | | | | 13 | |
| Climate Strategy Resourcing and Outreach | | | 4 | | | | 4 | | | | 1 | | | | 9 | |
| Cleantech Innovation | | | 25 | | | | — | | | | — | | | | 25 | |
| Subtotal | | | 135 | | | | 131 | | | | 385 | | | | 651 | |
| | | | | | | | | | | | | | | | | |
| Other Investments | | | | | | | | | | | | | | | | |
| Continuation of Climate Action Tax Credit | | | — | | | | — | | | | 120 | | | | 120 | |
| Light-Duty ZEV Rebates Funded by | | | | | | | | | | | | | | | | |
| Low Carbon Fuel Standard Credits | | | 67 | | | | 88 | | | | 94 | | | | 249 | |
| Clean Buildings Tax Credit | | | 2 | | | | 20 | | | | 20 | | | | 42 | |
| Equity Tax Credit for Clean Technology Investments | | | 3 | | | | 3 | | | | 3 | | | | 9 | |
| Expansion of Hydrogen Motor Fuel Exemption | | | — | | | | 1 | | | | 1 | | | | 2 | |
| PST Exemption for Used ZEVs | | | 21 | | | | 29 | | | | 38 | | | | 88 | |
| Increase Passenger Vehicle Surtax Threshold for ZEVs | | | 12 | | | | 15 | | | | 20 | | | | 47 | |
| PST Exemption for Heat Pumps | | | 8 | | | | 8 | | | | 8 | | | | 24 | |
| Subtotal | | | 113 | | | | 164 | | | | 304 | | | | 581 | |
| | | | | | | | | | | | | | | | | |
| Total | | | 248 | | | | 295 | | | | 689 | | | | 1,232 | |
Notes: Table may not sum due to rounding
These investments are in addition to the Province’s other climate-related spending that are designed to support the fight against climate change, including public transit projects such as investments in Vancouver’s Broadway Subway, energy efficiency spending on public sector buildings, the Innovative Clean Energy Fund and the First Nations Clean Energy Business Fund. Additional funding may be available through BC Hydro programs, including its Electrification Plan, subject to approval by the British Columbia Utilities Commission.
Low Carbon Energy
Budget 2022 provides $9 million over three years to develop policies and regulations to expand the Low Carbon Fuel Standard and to implement a new emissions cap on natural gas utilities — two of the most impactful measures in reducing emissions and helping B.C. meet its legislated emissions reduction requirements.
Cleaner Transportation
Government is committing $125 million over three years to continue investments in clean transportation. This includes $79 million to continue Go Electric programming to provide rebates for electric vehicle charging systems, fund hydrogen refueling infrastructure, and support commercial vehicle pilot projects. There is also $7 million provided over the fiscal plan to support the development of a Clean Transportation Action Plan, which will detail specific actions to reduce emissions in the transportation sector.
Budget and Fiscal Plan - 2022/23 to 2024/25
24
Three Year Fiscal Plan
Additionally, Budget 2022 transitions the funding of Go Electric light-duty vehicle rebates to BC Hydro. Rebates will be funded by revenues BC Hydro generates from selling Low Carbon Fuel Standard credits, as it provides clean hydroelectricity as a transportation fuel. Funding available each year may differ as credit prices are determined within the market but are estimated at $249 million over three years.
Grant funding of $30 million over the fiscal plan will support local governments to improve active transportation infrastructure, such as bike lanes and multi-use pathways. Budget 2022 also provides $5 million over two years to continue the Heavy-Duty Vehicle Efficiency Program, which partners with industry to educate drivers and install fuel efficiency measures in heavy-duty vehicles.
Energy Efficient Buildings
Budget 2022 invests $46 million to support the adoption of energy efficiency measures in buildings. Over three years, $43 million is provided to continue energy efficiency incentives and market supports under the CleanBC Better Homes, Better Buildings program — this includes $16 million over three years to provide new top-up incentives, such as heat pump incentives for rural and northern homeowners. Additionally, $3 million is provided over three years to develop the highest efficiency standards for space and water heating, and a new home energy rating system to support home buyers identify the energy efficiency of homes.
Clean Industry
Budget 2022 provides $310 million to support the decarbonization of industry, including funding to identify ways to reduce methane emissions; develop a province-wide approach to carbon capture, utilization, and storage; and assist emission-intensive and trade-exposed industry to remain competitive while preparing for the requirements to be net zero by 2050. This funding also provides $174 million in 2024/25 to continue the CleanBC Program for Industry, which directs a portion of the carbon taxes paid by industry into two streams:
| 1. | The CleanBC Industrial Incentive Program: provides incentives to large regulated industrial operations upon reducing emissions to world-leading benchmark levels; and |
| 2. | The CleanBC Industry Fund: finances emissions reduction projects identified by industry. |
Budget 2022 provides an additional $111 million in 2024/25 to enhance the CleanBC Industry Fund to support the further decarbonization of industry. As committed to in the Roadmap, future enhancements to the program will be based on consultations with industry, the Government of Canada, and Indigenous Peoples to redesign the program to align with new federal carbon pricing rules, while continuing to promote a competitive business environment and significant emissions reductions.
Budget and Fiscal Plan - 2022/23 to 2024/25
25
Three Year Fiscal Plan
Communities and Land Based Activities
Budget 2022 provides $76 million over three years to establish a new Local Government Climate Action Program that will help local governments take action to reduce emissions and adapt to climate change.
Funding of $22 million over three years is allocated to promote emissions reductions in B.C.’s forests. This includes $15 million over the fiscal plan to strengthen B.C. forests to improve their ability to sequester carbon, and $4 million over the fiscal plan to expand the Indigenous Forest Bioeconomy Program to include a new Accelerator Program, which will help participants commercialize and scale-up innovative forest-based products.
In support of agricultural climate action, Budget 2022 includes $15 million over three years to support increased intakes under the Beneficial Management Practices program, which supports on-farm upgrades to adopt sustainable and climate-resilient agriculture practices.
Circular Economy
Budget 2022 provides $13 million to advance a circular economy, including funding to develop a new Circular Economy Strategy that will advance B.C.’s Plastics Action Plan. This includes $10 million in 2022/23 to recapitalize the CleanBC Plastics Action Fund, originally funded through StrongerBC, which supports the diversion of plastics from landfills and the environment and repurposes them for use as recycled material.
Climate Strategy Resourcing and Outreach
Budget 2022 provides $9 million over three years to enhance the performance tracking of CleanBC initiatives. This will enhance the Province’s ability to report on progress through the annual Climate Change Accountability Report, support public awareness, and increase uptake of CleanBC programs.
Cleantech Innovation
One-time funding of $25 million is provided in 2022/23 to support clean energy and technology investments and partnership opportunities with the federal government to support CleanBC objectives.
Other Measures
Budget 2022 provides an additional $120 million to continue the Climate Action Tax Credit in 2024/25, which helps offset the impact of the carbon taxes paid by low to moderate-income individuals and families. B.C. will continue to look at the effects of the carbon tax on household affordability as the federal carbon price requirements increase. In addition, Budget 2022 includes tax measures that support CleanBC objectives by incentivizing cleaner choices. These include a temporary tax credit for retrofits that improve energy efficiency of multi-unit residential and commercial buildings, the expansion of the exemption of hydrogen fuel from motor fuel tax, and provincial sales tax exemptions for used ZEVs. A PST exemption on heat pumps, paired with an increase to the PST on fossil fuel alternatives to 12 per cent is also included. A description of all tax measures that support CleanBC initiatives begins on page 87.
Budget and Fiscal Plan - 2022/23 to 2024/25
26
Three Year Fiscal Plan
Protecting People and Communities from Climate-Related Disasters
Responding to Climate Events
The devastating weather events in the past year have highlighted the importance of preparing for and adapting to the changing climate. Budget 2022 includes over $1.5 billion in funding over the next three years to support people and communities in responding to and recovering from the November 2021 flooding events. This includes $400 million in 2022/23 for Emergency Management BC to support people and communities and more than $1.1 billion earmarked in General Programs Contingencies over the next three years in anticipation of investments that will need to be made to help communities recover. The Province will be working with impacted communities and residents to assess the extent of the damage to critical infrastructure and identify what will be required to increase resilience against future events. This funding is in addition to the $5 billion allocated by the Government of Canada to help response and recovery efforts in B.C.
In addition, over $600 million in operating and capital funding is allocated for continuing the response to climate-related disasters, disaster prevention and recovery projects, and to support British Columbians through future emergencies. These are detailed further below. A “Flood Recovery and Response” topic box on page 31 provides more discussion about the Budget 2022 investments to support communities to prepare for and respond to climate-related disasters.
Essential Foundations for Climate Preparedness and Adaptation
In June 2021, government released a draft Climate Preparedness and Adaptation Strategy to seek public feedback on actions to help prepare British Columbia for the impacts of climate change. Budget 2022 provides the essential foundations to continue the work of preparing the province for a changing climate, guided by the province’s experience with climate-related disasters over the past year. Funding of $83 million is provided to expand climate monitoring networks, support Indigenous-led initiatives to build climate adaptation capacity, develop an extreme heat response framework, expand the River Forecast Centre and provincial floodplain mapping program, and build data collection and expertise that are necessary to understand where and how to mitigate climate risks.
This includes $30 million in 2021/22 to help safeguard B.C.’s watersheds which will further mitigate the impacts of a changing climate on community health, water security, and the economy. An additional $65 million in capital funding is provided across the fiscal plan period to make improvements to existing road, bridge and culvert infrastructure to improve resilience and reduce the impact of extreme environmental events as part of a ten year commitment. The total ten-year investment for these transportation improvements will be $295 million.
Budget and Fiscal Plan - 2022/23 to 2024/25
27
Three Year Fiscal Plan
Protecting Communities from Climate Risks
The Province is making significant changes to protect people and communities from the risks associated with a changing climate. This includes $90 million in community grants provided in 2021/22 to complete FireSmart initiatives and fuel management activities that will make homes and communities safer from wildfire risk. An allocation of $120 million provided in 2021/22 gives years of additional support to the Community Emergency Preparedness Fund and to support emergency management and preparedness in First Nations communities. Since September 2017, over $75 million has been provided to Indigenous communities and local governments through the Community Emergency Preparedness Fund to support 961 projects for local emergency operations centres, emergency support services, evacuation route planning, and flood risk assessments, among others.
Budget 2022 includes $145 million over the fiscal plan for the BC Wildfire Service and Emergency Management BC. Funding will move the BC Wildfire Service from its current reactive model of wildfire response to a more proactive approach and allow it to work on all four pillars of emergency management (prevention and mitigation, preparedness, response, and recovery). This funding will also improve Emergency Management BC’s ability to prepare and respond to climate-related events, ensure impacted communities are supported during and after events, improve the public alerting system, and help communities with emergency planning.
Funding of $98 million over three years is also provided to fund wildfire prevention work and projects and to maintain forest service roads to help the BC Wildfire Service respond to future forest fires. To meet the growing demands on the BC Wildfire Service, more than $26 million in capital funding will be invested over three years to upgrade the agency’s facilities. These investments will increase capacity, address maintenance needs, and equip firebases for future wildfire seasons.
Table 1.2.4 Investments to Support Communities Against Climate Events
| ($ millions) | | | 2021/22 | | | | 2022/23 | | | | 2023/24 | | | | 2024/25 | | | | Total | |
| Supports to Communities – Emergency Preparedness | | | 120 | | | | — | | | | — | | | | — | | | | 120 | |
| Supports for Communities – Wildfire Prevention | | | 90 | | | | — | | | | — | | | | — | | | | 90 | |
| Wildfire Prevention Projects and Services | | | — | | | | 52 | | | | 23 | | | | 23 | | | | 98 | |
| EMBC and Wildfire Service Resources | | | — | | | | 45 | | | | 50 | | | | 51 | | | | 145 | |
| Climate Preparedness and Adaptation Strategy | | | 30 | | | | 13 | | | | 20 | | | | 20 | | | | 83 | |
| Climate-Ready Transportation Networks* | | | — | | | | 15 | | | | 20 | | | | 30 | | | | 65 | |
| Emergency Program Act – Flooding Recovery | | | — | | | | 400 | | | | — | | | | — | | | | 400 | |
| Contingencies – Flooding Recovery | | | — | | | | 400 | | | | 500 | | | | 250 | | | | 1,150 | |
| | | | | | | | | | | | | | | | | | | | | |
| Total | | | 240 | | | | 925 | | | | 613 | | | | 374 | | | | 2,152 | |
Tables may not sum due to rounding.
* Capital Funding
Budget and Fiscal Plan - 2022/23 to 2024/25
28
Three Year Fiscal Plan
COVID-19 Response and Recovery
Budget 2022 provides $2.0 billion in 2022/23 and $1.0 billion in 2023/24 to maintain the Pandemic Recovery Contingencies to support ongoing measures and emergent needs related to the pandemic. The Pandemic Recovery Contingencies will be used to continue short-term funding initiatives and for new programs where the demand and costs may fluctuate as the pandemic and related health orders continue to evolve. This includes ongoing support such as the COVID-19 closure relief grant, continued support to the tourism sector, and support for vulnerable populations impacted by the pandemic.
The Pandemic Recovery Contingencies will ensure government remains nimble to support people and business through unanticipated urgent health or targeted recovery measures. Consistent with Budget 2021, unallocated funding will be directed to reduce the operating deficit. Notional allocations for 2022/23 Pandemic Recovery Contingencies are shown in Table 1.2.5 below.
Table 1.2.5 Pandemic Recovery Contingencies 2022/23
| Initiative | | Notional Allocations* |
| Health COVID-19 Management | | $875 million |
| Supports for Vulnerable Populations | | $175 million |
| Tourism Initiative Envelope | | $25 million |
| Other Recovery Initiatives | | $10 million |
| Unallocated: available for additional health or recovery measures | | $915 million |
| Total | | $2.0 billion |
* Notional allocations are based on current forecasts, with any changes communicated in Quarterly Reports.
Budget and Fiscal Plan - 2022/23 to 2024/25
29
Three Year Fiscal Plan
Flood Response and Recovery
In mid-November 2021, two days of heavy rainfall resulted in widespread flooding and mudslides across the province. Nearly 20,000 people were evacuated from towns in southern B.C. with significant damage to highways and other critical infrastructure. On November 17, 2021, the Minister of Public Safety and Solicitor General declared a provincial state of emergency to mitigate the immediate impacts on transportation networks and the movement of essential goods and supplies, and to support the province-wide response and recovery from the widespread damage caused by flooding and landslides in B.C.
The flooding followed other climate-related disasters that occurred including a heat dome and a severe wildfire season resulting in tragic consequences in the Village of Lytton. Those impacted by the 2021 wildfires received temporary lodging, food, clothing and incidentals. Financial assistance was provided to people whose primary residences were placed on evacuation order. Support for the Village of Lytton includes provincial funding to support the local government recovery team, assistance with safe return and re-entry, and Disaster Financial Assistance to facilitate the recovery of public infrastructure. The Province has allocated over $27 million so far to support Lytton with additional response costs, lost revenue, and operational needs as the community recovers from the wildfire disaster.
These exemplify the impacts of climate change and are expected to increase in frequency over time. In response, governments, communities, businesses and people will need to rebuild in ways that are smarter and more resilient to the impacts of climate change, and take steps to better understand and reduce risks moving forward.
The Government of Canada has committed to providing federal support for the flood recovery and other recent natural disasters in B.C. This financial assistance will help the Province with the significant costs associated with the emergency response and support recovery of individuals and communities from the impacts of the flooding.
Immediate support in response to the Floods
The Province worked with the Canadian Red Cross to provide immediate support to individuals directly impacted by flooding. This included temporary lodging, food, clothing, and incidentals; specialized services such as emotional support, first aid, and transportation; and financial assistance to people whose primary residences were placed on evacuation orders due to flooding.
As of the third quarter, the Province is expecting to spend over $500 million on disaster and emergency response this year. This includes funding to support evacuees through the Emergency Support Service program; financial assistance to impacted First Nation and local governments for incremental response costs; and costs associated with immediate repair to critical infrastructure, such as highways and bridges.
The Government of Canada and the Province of British Columbia committed to matching donations to the Canadian Red Cross Floods and Extreme Weather Appeal and raised more than $30 million in donations. This brings the total available to support those people who are impacted to over $90 million. This will provide for case management and informed recovery support for people impacted by flooding to assist with interim housing, basic needs, mental-health supports and navigation of the recovery process.
Looking ahead
As part of its fiscal update in December 2021, the federal government allocated $ 5 billion for its share of flood recovery costs and other recent natural disasters in British Columbia,
Budget and Fiscal Plan - 2022/23 to 2024/25
30
Three Year Fiscal Plan
such as the 2021 wildfires. This includes the federal costs under the Disaster Financial Assistance Arrangements as well as other federal cost share programs, such as Agri-Recovery. The funding is an initial provision of federal funding and assessing the full costs of rebuilding remains an ongoing process. The Province and Government of Canada, along with Indigenous partners and local partners, will continue to work together to support British Columbians through this crisis and as communities rebuild.
In addition to this funding, Budget 2022 allocates more than $1.5 billion over three years to address the Province’s ongoing response and recovery efforts. This includes $400 million for costs under the Emergency Program Act to support ongoing disaster response and recovery activities, such as debris removal and clean-up. Funding will also support programs such as Disaster Financial Assistance, which provides local governments, people, businesses, farms and charitable organizations with assistance to recover. Another $100 million is provided for capital costs related to damage to provincial public sector buildings.
The total cost and necessary supports are not yet known as work to evaluate the damage is ongoing. Budget 2022 sets aside over $1.1 billion in Contingencies over the fiscal plan period as a starting point to accommodate anticipated costs and additional supports for people, communities and businesses impacted by the floods. This includes funding for specific programs such as Agri-Recovery — a federal-provincial cost program that helps farmers recover, thereby supporting the province’s food security — but it will also support the rebuilding process more generally. This will also include options to supplement existing programs, such as Disaster Financial Assistance, housing supports for communities that need to rebuild, and efforts to modernize emergency management in British Columbia.
Importantly, this funding will support the province in building back better, consistent with the Sendai Disaster Framework, which was adopted by B.C. in October 2018. The Sendai Framework marks a shift from focusing on emergency preparedness and response to recognizing that risk identification and mitigation are key to managing hazards
Table 1 - Increased Funding for Emergency Management
| ($ millions) | | 2022/23 | | | 2023/24 | | | 2024/25 | |
| Fire Management | | | | | | | | | |
| Existing Funding | | 136 | | | 136 | | | 136 | |
| Budget 2022 increase | | 58 | | | 63 | | | 63 | |
| | | | | | | | | | |
| Fire Management - new base budget | | 194 | | | 199 | | | 199 | |
| | | | | | | | | | |
| Emergency Management BC | | | | | | | | | |
| Existing Funding | | 38 | | | 38 | | | 38 | |
| Budget 2022 increase | | 7 | | | 7 | | | 8 | |
| | | | | | | | | | |
| Emergency Management BC - new base budget | | 45 | | | 44 | | | 45 | |
| | | | | | | | | | |
| Emergency Program Act | | | | | | | | | |
| Existing Funding | | 36 | | | 36 | | | 36 | |
| Budget 2022 increase | | 400 | | | — | | | — | |
| | | | | | | | | | |
| Emergency Program Act - new base budget | | 436 | | | 36 | | | 36 | |
Note: Table may not sum due to rounding
Budget and Fiscal Plan - 2022/23 to 2024/25
31
Three Year Fiscal Plan
and reducing the impact of events. It aims for substantial reduction of disaster risk and losses in life. It aims to safeguard livelihoods, health and the economic, physical, social, cultural and environmental assets of persons, businesses and communities. It also calls for all of society to share responsibility for reducing disaster risk. As such, the Province will be focusing on how rebuilding occurs to ensure that British Columbians are better prepared for climate-related disasters in future.
Climate change adaptation and mitigation
Preparing for climate change means improving the Province’s ability to anticipate, respond to and recover from climate-related disasters and emergencies, as well as dealing with more gradual changes like water shortages, changes in growing seasons and sea level rise. It involves building the capacity to reduce and manage risks from climate change to protect people, buildings and infrastructure; restore habitat and strengthen ecosystems; maintain community health and wellbeing; and decrease costs associated with climate impacts and ensure B.C.’s economy continues to thrive.
The Province is providing over $600 million in funding to protect people and communities from climate-related disasters.
Within this, $83 million is provided in new investments that will help build essential foundations to better plan for climate-related disasters, including flooding, wildfires and extreme heat.
Funding of $210 million is provided in 2021/22 to support local governments and Indigenous-led emergency management priorities, mitigate risk and prepare for wildfires, flooding, and other emergencies.
| • | $90 million to support the FireSmart program and other wildlife measures, contributing to improved community and ecological resiliency; and |
| • | $120 million to add years of funding to the Community Emergency Preparedness Fund and support Indigenous-led emergency management priorities. These will support communities to build more resilient dikes and undertake other risk reduction activities, including significant investments in floodplain mapping. |
Table 2 - Supporting Communities to Respond and Adapt to Climate Events
| ($ millions) | | 2021/22 | | | 2022/23 | | | 2023/24 | | | 2024/25 | | | Total | |
| Flood Response and Recovery | | | | | | | | | | | | | | | |
| Emergency Program Act – Flooding Recovery | | — | | | 400 | | | — | | | — | | | 400 | |
| Contingencies – Flooding Recovery | | — | | | 400 | | | 500 | | | 250 | | | 1,150 | |
| | | | | | | | | | | | | | | | |
| Total Flood Response and Recovery | | — | | | 800 | | | 500 | | | 250 | | | 1,550 | |
| | | | | | | | | | | | | | | | |
| Climate Response and Adaptation | | | | | | | | | | | | | | | |
| Supports to Communities – Emergency Preparedness | | 120 | | | — | | | — | | | — | | | 120 | |
| Supports for Communities – Wildfire Prevention | | 90 | | | — | | | — | | | — | | | 90 | |
| Wildfire Prevention Projects and Services | | — | | | 52 | | | 23 | | | 23 | | | 98 | |
| EMBC and Wildfire Service Resources | | — | | | 45 | | | 50 | | | 51 | | | 145 | |
| Climate Preparedness and Adaptation Strategy | | 30 | | | 13 | | | 20 | | | 20 | | | 83 | |
| Climate-Ready Transportation Networks* | | — | | | 15 | | | 20 | | | 30 | | | 65 | |
| | | | | | | | | | | | | | | | |
| Total Climate Response and Adaptation | | 240 | | | 125 | | | 113 | | | 124 | | | 602 | |
| | | | | | | | | | | | | | | | |
| Total | | 240 | | | 925 | | | 613 | | | 374 | | | 2,152 | |
*Capital Funding
Table may not sum due to rounding
Budget and Fiscal Plan - 2022/23 to 2024/25
32
Three Year Fiscal Plan
These investments will support better information to assess and target areas of acute risk (e.g., floodplain and climate risk mapping), as well as provide for increased structural mitigation, improved infrastructure standards and other risk mitigation efforts to better adapt to a changing climate.
Despite these efforts, the Province will need to be able to better respond to disasters as they arise. Budget 2022 provides increased funding to support preparedness and response, with $145 million over three years for additional staffing to support agencies on the front lines, such as Emergency Management BC and BC Wildfire Services. Capital funding is also provided for facilities and equipment to respond to disasters. Funding will move the BC Wildfire Service to a more proactive model, with significant increases in permanent year-round staffing.
While this budget includes investments to prepare for and adapt to the impacts of climate change, it remains critical that government continue to lead in efforts to fight climate change. Budget 2022 also commits more than $1 billion to continue existing CleanBC measures and implement new initiatives to help British Columbia meet its emissions reductions targets and mitigate the worst impacts of climate change. CleanBC initiatives are discussed further on page 24.
Budget and Fiscal Plan - 2022/23 to 2024/25
33
Three Year Fiscal Plan
Committed to Building for the Future
Strengthening the Infrastructure People Rely On
Budget 2022 provides historic investments to build the critical infrastructure that people rely on through a record $27.4 billion in infrastructure investments in the three-year fiscal plan. Planning is underway for the major infrastructure projects that will come in the years ahead. These investments will help B.C. build back better with low-carbon, climate resilient infrastructure, and will directly and indirectly create over 100,000 jobs over three years, supporting the Province’s Economic Plan and helping drive the clean and inclusive economic growth which is critical to B.C.’s long-term prosperity.
The Budget 2022 capital plan ensures that the Province continues to build for the needs of today and tomorrow. There are currently 42 major projects (i.e. projects costing over $50 million) in construction, totalling $14.4 billion. A further 15 major projects are currently in or preparing for procurement totalling $9.4 billion. In all, 17 major projects have been approved since the start of the pandemic. Altogether, government is moving project planning forward to ensure that the momentum of the record capital spending continues in the three-year fiscal plan period and beyond.
In order to be ready for design, procurement and construction, major projects require significant planning to assess the options, schedule, cost and scope of the project. This planning and due diligence ensures projects are successful and deliver not only the services British Columbians rely on, but also strategic priorities such as reducing greenhouse gas emissions, using more mass timber in construction, increasing child care spaces and growing the skilled construction workforce. Some examples of projects in planning in the public sector are shown in the table below.
Progress on Highway 1: The section of highway between Langley and Abbotsford is a vital trade corridor of national importance, and an artery for the communities of the Fraser Valley. In order to increase mobility along this important corridor for people and goods, government has projects in various stages of development. The 6-laning of the highway from 202 St. to a new interchange at 216th St. in Langley was completed in 2020. Currently in design is a widening project from 216th St. to 264th St., scheduled to complete in 2024. To deliver on government’s commitment, the project to widen Highway 1 from 264th St to Whatcom Rd. is in the planning phase.
CleanBC: In November 2020, British Columbia launched the CleanBC Roadmap to 2030, an ambitious climate plan to deliver on its commitment to reduce greenhouse gas (GHG) emissions and build a stronger, cleaner B.C. Transportation is the province’s largest single source of GHG emissions, accounting for approximately 40 per cent of the annual total in British Columbia. Reducing GHG emissions from transport means ensuring that people are able to choose cleaner, more efficient ways to get around including transit. This keeps B.C. on the path to a sustainable future, through shorter commute times and greener transportation.
Update on Project Status
| Project | Status |
| Highway 1: 264th St. to Whatcom Rd. | Preliminary Planning |
| Millennium Line Extension to UBC | Preliminary Planning |
| Surrey-Langley SkyTrain | Business Planning |
| Long-Term Care: Health Authority Facility Renewal and Expansion | Business Planning |
| New Cancer Centres | Preliminary Planning, Business Planning and Procurement |
Budget and Fiscal Plan - 2022/23 to 2024/25
34
Three Year Fiscal Plan
Families rely on public transit to connect to housing, employment, schools, and government’s investment to make transit free for children under 13 will only increase the number of families choosing public transit as their mode of transportation. South of the Fraser River, the Surrey Langley SkyTrain project will meet the transit needs of this growing region, which represents 25 per cent of the population of Metro Vancouver. In 2021, the federal government announced its funding commitment of up to $1.3 billion for the project, and it is now in the business plan development stage.
Preliminary planning on the Millennium Line extension to UBC is underway with funding support for planning costs from the federal and provincial governments, City of Vancouver, University of British Columbia, and the Musqueam, Squamish and Tsleil-Waututh Development Corporation. This project will provide SkyTrain service to one of the largest employers in the region. The project would extend the Millennium Line past Arbutus Street following completion of the Broadway Subway in 2025.
Recovering and Renewing Critical Infrastructure: The November 2021 storms caused significant damage to provincial infrastructure and reinforced the importance of transportation links and trade corridors. Government is dedicated to recovering and strengthening the provincial highway system in this region which connects B.C. goods to the international market and connects B.C. businesses and families. Planning is underway to rebuild highways and ensure the province’s transportation system is resilient to future weather events. For more information, see the topic box on Flood Response and Recovery, page 31.
Long-Term Care: The pandemic has highlighted the need for better conditions and levels of care for residents in long-term care facilities. In the health sector, project planning is underway to renew and expand health authority-owned long-term care facilities, with the first business plans expected to complete this year. By building facilities with modern, single-bed rooms, residents will be safer, healthier, more comfortable and live with more dignity.
Cancer Care: The Province is committed to improving cancer care in regions around the province. New state-of-the-art cancer care centres are coming to more communities so that patients and their caregivers can access care closer to home. The new cancer care centre in Surrey is in procurement as part of the new Surrey hospital project, while the new cancer centre in Burnaby is in business planning as part of Phase 2 of the Burnaby Hospital redevelopment. To support patients and caregivers on Vancouver Island and in the Interior, new cancer centres in Kamloops and Nanaimo are now in preliminary planning.
Government’s capital investments are also helping to achieve its environmental and social goals. Through the planning process, government is applying an Environmental, Social and Governance lens to all projects, which means: demonstrating to the world the opportunities of innovative mass timber construction; creating more child care spaces; incorporating energy efficient and low-carbon design; creating a safer and more resilient network of infrastructure; and creating more apprenticeship and training opportunities in local communities, particularly for traditionally under-represented groups who want to build a career in the trades. Since 2018, Community Benefit Agreements on 12 approved projects are growing the skilled trades workforce in high-demand careers. Supporting these projects, the B.C. Infrastructure Benefits Inc. Crown corporation effectively recruits and retains workers from traditionally under-represented groups, with 14 per cent of its workforce identifying as Indigenous compared to 6 per cent in the general population and over double the industry average of women in construction. For more information, please refer to the topic box on B.C.’s Environmental, Social and Governance Values on page 46.
Budget and Fiscal Plan - 2022/23 to 2024/25
35
Three Year Fiscal Plan
A Responsible Approach to Budgeting and Fiscal Planning
The COVID-19 pandemic and the flooding events of 2021 required a swift and significant fiscal response to ensure the health, safety and well-being of British Columbians. This ongoing response continues to make sure British Columbia’s people, businesses and communities recover together. The events of the past several years have also highlighted the need for new and ongoing investments to strengthen society, the economy and the environment.
Budget 2022 responds to these challenges with investments of $6.6 billion over the fiscal plan period to improve health care, support people experiencing homelessness, continue the development of a universal child care system, train workers for the future economy, and fight climate change while protecting people and communities from climate-related disasters.
During consultations with the Economic Forecast Council for Budget 2021, members noted that adaptive and targeted government supports are needed through the pandemic with careful consideration about when and how they are withdrawn in B.C. and Canada. It was agreed that in the long-term the B.C. government should remain disciplined in its fiscal planning to maintain the solid fiscal position with which it entered the pandemic. In alignment with this consultation, Budget 2021 implemented fiscal guardrails to guide ongoing financial planning. These guardrails included:
Year-over-year declining deficits – Budget 2022 presents declining deficits over time from $5.5 billion in 2022/23 to $3.2 billion in 2024/25.
Targeted spending criteria – Budget invitations were limited to the highest of government priorities to continue to respond to the pandemic and address gaps and growing inequality that were exposed or accelerated by the pandemic and recent climate-related disasters.
Prudence levels – Budget 2022 maintains prudence levels such as a prudent economic forecast compared to the Economic Forecast Council and an elevated forecast allowance.
Pandemic Recovery Contingencies – Time-limited funding is provided for COVID-19 response and is expected to taper off when the pandemic passes.
Debt metrics and debt affordability – The Province continues to monitor debt-to-GDP and debt-to-revenue measures as measures of overall sustainability of debt.
Transparent and timely reporting – As demonstrated since the beginning of the pandemic, government is committed to transparent and timely reporting and will continue to provide updated economic forecasts as well as detailed reporting of pandemic measures.
These guardrails are further discussed in a topic box on page 30 of the Budget 2021 document.
During Budget 2022 consultations, the Economic Forecast Council noted that fiscal discipline helps maintain and strengthen B.C.’s economic resilience. To align with this advice, the broad fiscal planning guardrails continue to guide budgeting and fiscal planning in the midst of ongoing uncertainty and the additional need to rebuild from the flood damages over the medium-term. This is further discussed in the “Flood Response and Recovery” Topic Box on page 31.
A responsible approach to budgeting and fiscal planning recognizes that there are other key indicators needed to guide government’s decisions as it strives to meet the needs of British Columbians while maintaining fiscal discipline. In order to ensure this broader perspective was considered in the development of Budget 2022, the Minister of Finance also consulted with an ESG Advisory
Budget and Fiscal Plan - 2022/23 to 2024/25
36
Three Year Fiscal Plan
Council following the meeting with the Economic Forecast Council. They noted the importance of carefully monitoring a range of environmental and socioeconomic outcomes, both across regional and demographic groups, in assessing the province’s well-being. More information on this council and its discussions can be found on page 47. As part of current budget and fiscal planning, the Province monitors key fiscal and economic indicators. This set of indicators will be expanded in order to ensure a balanced approach over the longer term as government reduces the deficit over time and returns to balanced operating budgets. As part of each annual budget process an overall assessment of the following indicators will be used to update the long-term fiscal outlook described below. This assessment will explain how the outlook may shift in response to changes in the economy or the need to respond to public health or other emergencies such as flood and wildfire response and recovery.
| • | Health Indicators – The global pandemic continues to play a key role in assumptions of economic, financial, and expenditure decisions. The Province will continue to monitor case counts, vaccination rates, hospitalization rates and the Province’s position on the BC’s Restart Plan to guide economic forecasts and the decisions about ongoing health response and supports for B.C. businesses, communities, and people. |
| • | Debt Affordability Indicators – Budget 2022 makes progress on important new and existing infrastructure projects and related programs and services (see the topic box titled “Committed to Building for the Future” on page 35). After investments in health care, flood response and recovery, and necessary investments in schools, housing and transportation, the debt-to-GDP ratio is projected to remain below 25 per cent in each year of the fiscal plan at 20 per cent in 2022/23, 21.8 per cent in 2023/24 and 22.8 per cent in 2024/25. Debt-to-revenue is projected to be 110.9 per cent in 2022/23, 122.7 per cent in 2023/24, and 129.8 per cent in 2024/25. These metrics continue to compare favourably to debt metrics in peer jurisdictions and the Province will continue to use them to guide financial planning. In addition to debt metrics, government will continue to monitor the Province’s access to affordable financing in the credit market. |
| • | Economic and Business Indicators – Budget 2022 continues to monitor the performance of B.C.’s economy by tracking labour force developments, reporting on the health of B.C.’s economic sectors, and providing updates on factors affecting affordability and growth prospects in the province. In addition, the Province monitors business indicators such as small business confidence, the number of active businesses, and tax competitiveness compared to other jurisdictions. Some of these are further discussed in the Economic Section starting on page 95, and advice from the Economic Forecast Council is provided in the topic box on page 121. |
| • | Community Recovery Indicators – The climate-related disasters of 2021 damaged communities and provincial infrastructure, and will require additional spending in the near-term to help communities recover. Fiscal planning will consider qualitative indicators on community recovery including the status of highway rebuilding projects and the state of agriculture in impacted regions. |
| • | Environmental, Social and Governance Indicators – In addition, government continues to broadly monitor and report on progress towards its commitments to improving environmental and social measures through progress reports on various strategies. These include annual reporting on the Province’s implementation of the Declaration on the Rights of Indigenous Peoples Act, CleanBC, TogetherBC, ChildCareBC, among others. These are further discussed in the topic box titled “BC’s Environmental, Social and Governance Values” on page 46. |
State of Economic Recovery
B.C.’s economy has proven broadly resilient following the downturn at the onset of the COVID-19 pandemic, but many people,
Budget and Fiscal Plan - 2022/23 to 2024/25
37
Three Year Fiscal Plan
communities and businesses continue to face challenges.
Budget 2022 estimates that B.C. achieved pre-pandemic levels of economic activity in 2021 and is expected to return to pre-pandemic trend levels of real GDP in 2022 and beyond (Chart 1). At a broad level, many major macroeconomic indicators have surpassed their pre-pandemic levels, including total employment, retail sales, exports, and housing market activity. The labour market has recovered substantially: following the onset of the pandemic, the unemployment rate increased to an all-time high but has trended lower, and was below pre-pandemic levels in January 2022.
Chart 1 - B.C. Real GDP
(chained 2012 $ millions)
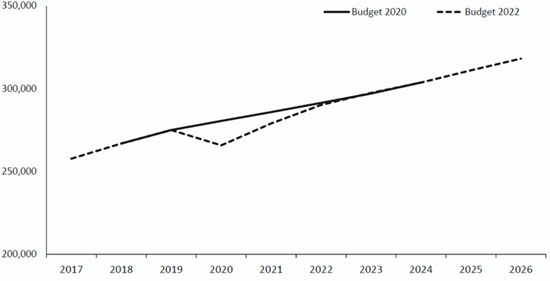
Sources: B.C. Ministry of Finance; Haver Analytics; Statistics Canada
Despite these improvements, the recovery remains uneven across industries and groups of people. The recovery has been considerably slower for high-contact and travel-related industries. Sales at restaurants and bars have only recently returned to pre-pandemic levels, and the hospitality and travel industries remain depressed (Chart 2). Furthermore, tightening labour markets have made it difficult for these industries to rehire, with increased job vacancies concentrated in the accommodation and food services and retail trade sectors.
Chart 2 - COVID-19 Impacted Sectors
(2019 average = 100)
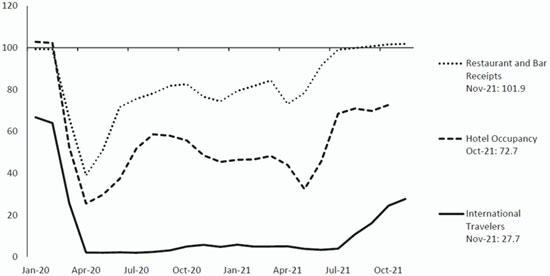
Sources: BC Stats; B.C. Ministry of Finance; Haver Analytics; Statistics Canada
While the number of unemployed people has returned to near pre-pandemic levels, the number of people who have been looking for work for longer than 27 weeks remains high (See Chart 3). Furthermore, employment in some industries is still below pre-pandemic levels. To address this as well as the significant number of job openings forecast over the next decade, government is developing Future Ready: Skills for the Jobs of Tomorrow, a workforce readiness plan which will expand training opportunities in various sectors and expand supports for Indigenous and non-Indigenous workers and communities through economic transition. The recovery is expected to broaden as public health orders, travel advisories and restrictions, and private concerns over high-contact services ease. In addition, expenditures and hiring to rebuild damaged infrastructure from November’s floods will have a positive impact on jobs and economic activity in the province.
Chart 3 - B.C. Unemployment Rate
(per cent)

Note: Long-term unemployment is 27 weeks or more, whereas short-term is less than 27 weeks. Short- and long-term unemployment rates do not sum to the total due to unemployment of unknown duration.
Sources: B.C. Ministry of Finance; Haver Analytics; Statistics Canada
Meanwhile, rising costs for goods, services and housing are challenging for many households. In the last quarter of 2021, B.C. consumer prices have increased at a pace not seen since the early 1990s. While B.C.’s inflation rate has been lower than the national average and rates seen in other G7 countries, increasing prices for essentials like food and gasoline can present
Budget and Fiscal Plan - 2022/23 to 2024/25
38
Three Year Fiscal Plan
a real challenge. Housing costs have also been increasing, driven by low interest rates and low inventory of homes for sale or rent. The Bank of Canada expects inflation to moderate over the course of 2022, and the government will continue to monitor the impacts of inflation on affordability. Government is committed to addressing affordability through measures like ChildCareBC, continued investment in Homes for B.C., and CleanBC measures to support British Columbians with upgrades to reduce home heating costs.
Private sector forecasters (the Economic Forecast Council) generally expect B.C.’s economic growth to be broadly in line with the national average this year and next year. In the medium-to-long term B.C. is expected to grow faster than the Canadian economy. However, over the longer-term, provincial and national economic growth is expected to slow somewhat as labour supply growth shifts down, reflecting the aging population. Economists generally agree that attracting skilled labour, boosting immigration, and investing in productivity enhancing policies are important for stronger economic growth in the long-term. This is why the Province has a range of strategies and plans to improve B.C.’s economic prospects (see topic box on BC’s Environmental, Social and Governance Values on page 46).
State of Fiscal Recovery
Budget 2021 was presented at the height of the pandemic and projected a deficit of $9.698 billion for the 2021/22 fiscal year. In September 2021, the First Quarterly Report revised the projected deficit to $4.834 billion. Most of this improvement was due to personal and corporate income tax revenue strength as reported by the federal government. The Second Quarterly Report was released in November 2021 and forecast a deficit of $1.732 billion. This was due to further revenue improvements in-line with changes reported in other Canadian jurisdictions and following the release of stronger 2020 economic data by Statistics Canada. Statistics Canada had also reported improved economic activity through the fiscal year. The deficit projection is now $483 million as detailed in the Third Quarterly Report beginning on page 125. These results are not final as there remains much uncertainty in the last quarter of the fiscal year. As well, most of the improvement in the third quarter is from a higher net income projection from the Insurance Corporation of BC, partly resulting from higher than projected investment earnings, which may fluctuate with volatility in the investment market. The forecast allowance for 2021/22 remains at $1.0 billion in light of these uncertainties.
Table 1 - Key Fiscal Metrics, Budget 2021 and Budget 2022
| | | 2021/22 | | 2022/23 | | 2023/24 | | 2024/25 |
| Budget 2021 | | | | | | | | |
| Projected Deficit | | $9.698 billion | | $5.484 billion | | $4.323 billion | | N/A |
| Projected Debt-to-GDP Ratio | | 22.8% | | 25.0% | | 26.9% | | N/A |
| Budget 2022 | | | | | | | | |
| Projected Deficit | | $483 million | | $5.461 billiion | | $4.182 billion | | $3.181 billion |
| Projected Debt-to-GDP Ratio | | 17.7% | | 20.0% | | 21.8% | | 22.8% |
Table 2 - Budget Prudence Measures
| ($ billions) | | | 2021/22 | | | | 2022/23 | | | | 2023/24 | | | | 2024/25 | |
| General Programs Contingencies including CleanBC ($ billions) | | | 1.000 | | | | 2.848 | | | | 3.412 | | | | 3.987 | |
| Pandemic Recovery Contingencies ($ billions) | | | 3.250 | | | | 2.000 | | | | 1.000 | | | | — | |
| Forecast Allowance ($ billions) | | | 1.000 | | | | 1.000 | | | | 1.000 | | | | 1.000 | |
| Real GDP Growth Below EFC (percentage points, pp)* | | | 0.1pp | | | | 0.2pp | | | | 0.2pp | | | | 0.2pp | |
*Calendar Year
Budget and Fiscal Plan - 2022/23 to 2024/25
39
Three Year Fiscal Plan
A significant portion of the revenue improvements experienced during fiscal 2021/22, as described above, are one-time in nature, and are not expected to carry into future years. This includes taxation revenue adjustments from the early forecasts that had assumed a steeper pandemic recession, and significant investment gains reported by ICBC. Going forward, the Ministry of Finance continues to employ prudence in forecasting, however, improvements in the range experienced in 2021/22 are not expected.
These fiscal improvements from the time Budget 2021 was presented have placed B.C. in a stronger financial position to respond to the ongoing pandemic and flood recovery needs. A lower overall debt level reduces government cost for debt servicing and improves debt metrics (such as debt-to-GDP ratio), thereby maintaining access to affordable credit markets.
Budget 2021 included elevated levels of Contingencies vote funding totalling $4.25 billion. This included $3.25 billion in Pandemic and Recovery Contingencies in 2021/22 to reflect that the nature of the COVID-19 pandemic required a unique response that will taper off when the pandemic passes. Budget 2022 provides Pandemic Recovery Contingencies allocations of $2.0 billion in 2022/23 and $1.0 billion in 2023/24.
The General Programs Contingencies are used to accommodate the financial consequences of unanticipated and contingent events. It also accounts for potential increases in uptake for core government services as the provincial population grows, such as K-12 enrolment and income and disability assistance. General Programs Contingencies are also used to prepare for the costs of collective agreements once they have been completed.
The General Programs and CleanBC Contingencies allocations in Budget 2022 are $2.848 billion in 2022/23, $3.412 billion in 2023/24, and $3.987 billion in 2024/25. This includes more than $1.1 billion over the next three years for disaster recovery costs to reflect the one-time nature of these costs and the uncertainty of the timing of these costs as communities continue to assess recovery needs.
Over the medium term, total contingencies allocations will decline as time-limited funding requirements begin to taper off.
Long-Term Fiscal Outlook
General economic policy encourages governments to provide supports and stimulus to address economic downturns and extraordinary events, even if these supports result in time-limited deficits. While there are signs for optimism with respect to COVID-19, the ongoing health response and near-term costs associated with disaster recovery require that spending exceed anticipated revenues in the near term.
Government spending in the near-term includes the cost of health measures to respond to the pandemic and more than $1.5 billion in additional provincial operating spending over the next three years to support recovery from the November 2021 flood event. This consists of $400 million in the voted appropriation for the Emergency Program Act in 2022/23 and more than $1.1 billion in General Programs Contingencies over the three year fiscal plan period.
In the medium to long-term, as temporary funding for the pandemic and the November 2021 flooding events are no longer required, the Province will return to a practice of increasing expenditures within the bounds of the increase in revenues that are available for each budget cycle — gradually decreasing deficits over time. While it is difficult to forecast revenues and expenses beyond the three-year fiscal plan, the Ministry of Finance’s longer-term revenue growth assumptions are 3.2 per cent annually (based on a prudent economic scenario), and government spending growth is assumed to be roughly the same rate of spending as there is revenue growth. Maintaining a prudent economic scenario underscores government’s commitment to responsible financial management practices. Any additional increase in government
Budget and Fiscal Plan - 2022/23 to 2024/25
40
Three Year Fiscal Plan
spending may become possible in years with greater than projected increases in revenues through economic activity or additional transfers from the federal government.
With respect to the long-term revenue outlook, the Ministry of Finance has begun work to improve revenue resiliency and adapt individual revenue sources and the overall revenue mix to keep pace with ongoing structural economic changes and demographic shifts. Measures introduced in Budget 2022 include tax collection, remittance, and reporting obligations for online marketplace facilitators; removing the sales tax exemption for tobacco products; and the adjustment of the purchase price of private vehicle sales for tax purposes. Together, these measures better adapt B.C.’s consumption taxes to the rapid expansion of e-commerce during the pandemic, close tax compliance gaps, and help the Province capture additional revenue when tobacco companies raise prices. These measures are further discussed beginning on page 87.
B.C.’s health care system continues to require additional resources due to a growing and aging population. The COVID-19 pandemic has also highlighted gaps in the health care system. Maintaining the system while also improving the delivery of care for British Columbians will require investments that will challenge the Province’s long-term fiscal outlook. This is not an experience unique to B.C. as all provinces will require growth in federal health spending to sustain their health care systems in a fiscally sustainable manner. This is further discussed in a topic box titled “A New Vision for Health Care Funding” on page 44.
Legislation Changes
The government continues to review its financial management and oversight legislation and practices to address evolving economic and fiscal priorities. Budget 2022 includes the following proposed non-tax legislative changes:
| • | With the onset of the pandemic in 2020/21, the Legislature passed an amendment to the Balanced Budget and Ministerial Accountability Act (BBMAA) to temporarily suspend the prohibition against presenting deficit budgets for fiscal years 2021/22, 2022/23 and 2023/24. Budget 2022 proposes to extend this suspension to 2024/25 and the government will continue to annually review this suspension for each fiscal plan presented, in parallel with annual updates to the long-term fiscal outlook. |
| • | Under the BBMAA, members of the Executive Council forfeit one-half of their annual salary holdback during years that deficits are allowed — this amounts to 10 per cent of a ministerial salary. During 2019/20 and 2020/21, Cabinet ministers forfeited this holdback even though deficits were the result of unprecedented events outside of Cabinet’s direct control and were necessary in order to respond to the needs of British Columbians and return the economy to stable footing. |
Budget 2022 includes a proposed amendment to the BBMAA, to repeal the collective 10 per cent salary holdback provision applicable to a minister in respect of Cabinet’s collective responsibilities to avoid annual deficits or achieve a surplus. Individual ministers will, however, continue to be subject to the 10 per cent salary holdback applicable to achieving individual ministerial responsibilities. This means that individual ministers will remain accountable for ensuring that their ministry remains within approved spending targets set out in the annual Estimates for their ministry, in order to receive their 10 per cent salary holdback.
| • | Under the Financial Administration Act, Treasury Board has overall responsibility for financial administration and budget management on behalf of government. To assist Treasury Board in efficiently addressing evolving priorities and responding to day-to-day urgent matters before government — such as pandemic recovery and other priorities — an amendment to the Financial Administration Act is proposed to enable Treasury Board to delegate some of its functions to the chair or vice-chair of |
Budget and Fiscal Plan - 2022/23 to 2024/25
41
Three Year Fiscal Plan
Treasury Board. The proposed amendment also ensures that matters delegated to the chair or vice-chair remain confidential and privileged, consistent with matters that come before Cabinet, Treasury Board and other Cabinet committees.
| • | A number of minor housekeeping amendments are proposed to the Budget Transparency and Accountability Act, to update and clarify various sections. |
| − | An unused exemption provision for reporting capital projects over $50 million for education and health sector organizations will be removed to reflect existing practice and help ensure that all provincial public sector projects over $50 million are consistently reported. |
| − | Where final funding commitments for major projects are made within 30 days before the date of presenting the government’s annual budget and Estimates, immediate BTAA reporting requirements will be deferred and reporting will be included as part of the government’s First Quarterly Report in the next fiscal year. This change recognizes the information cut-off requirements necessary for preparing and presenting the government’s budget, Estimates, and annual service plans while still maintaining reporting principles of the BTAA. |
Budget and Fiscal Plan - 2022/23 to 2024/25
42
Three Year Fiscal Plan
A New Vision for Health Care Funding
Budget 2022 re-affirms the Province’s commitment to prioritizing the health and safety of British Columbians by investing to meet demand for all health services, including primary, surgical, and cancer care. Government’s long-term fiscal outlook will be challenged by the increased health needs of a growing and aging population. The COVID-19 pandemic has also highlighted gaps in Canada’s health care system. Meeting the shared priority of ensuring the health and safety of Canadians requires additional support in ongoing health funding from the federal government.
“Now is the time for a new long-term funding partnership for health care in Canada. First Ministers must meet and have a meaningful discussion in order to find a sustainable solution to this situation as soon as possible.… A new vision for health care, supported by a significant, long-term increase in federal funding, is needed to ensure we emerge stronger from the COVID-19 pandemic and ready to respond to the needs of our citizens.”
February 4, 2022
Council of the
Federation Press Release
To illustrate the challenges faced in funding Canada’s health care system, the Conference Board of Canada’s recent report on health care cost drivers pointed to a need for an ongoing increase of an additional 4.5 per cent in health care spending annually to meet annual caseload demands on the system. This is further illustrated below.
| Table 1 - Drivers of Health Care Caseload Costs – Canada-Wide |
| |
| Inflation | | | 2.5 | % |
| Aging Demographics | | | 1.0 | % |
| Population Growth | | | 1.0 | % |
| | | | | |
| TOTAL | | | 4.5 | % |
In B.C., both population growth and the aging population are higher than the Canadian average. In addition, improvements are needed to make health care more responsive to the needs of British Columbians by expanding primary care networks, supporting those with mental health and addictions issues, improving long-term care services, modernizing hospital care, and meeting the ongoing demand for pharmaceutical, diagnostic, imaging, and cancer care services. In addition, British Columbia must be able to recruit and retain the health care workforce required to respond to ongoing challenges.
The COVID-19 pandemic has accelerated the need for these broad systems changes. Many of the measures adopted during the pandemic, such as the Rural and Remote Framework, the Hospital at Home program, and service improvements at long-term care facilities will need to become permanent beyond the pandemic to help address these challenges.
Under scenarios where health care costs increase at a higher annual rate of 5.5%, in the absence of the change to federal funding the Province’s deficits are expected to continue to grow.
The federal government provides ongoing support for health care through the Canada
Budget and Fiscal Plan - 2022/23 to 2024/25
43
Three Year Fiscal Plan
Health Transfer (CHT), which represents 22.3 per cent of B.C.’s health care costs in 2022/23. This does not include any additional spending by the Province (or transfers from the federal government) related to the COVID-19 pandemic. While it may not be a direct comparison to B.C., it is expected that over the next decade the CHT will fall to less than one dollar out of every five dollars that provinces and territories spend on health care.
A significant factor in this reduction in federal support as a share of health care spending is that growth in the federal CHT was reduced in 2017/18 from 6 per cent to the higher of either 3 per cent or a moving average of nominal economic growth. While the CHT will grow by 4.8 per cent percent nationally in 2022/23, that is the highest growth since the new formula was put in place. The average over the five preceding years was just 3.6 per cent. Over the five years prior to COVID-19, B.C.’s health care spending increased by an average of over $1 billion per year, while B.C.’s share of the CHT increased by an average of about $250 million per year. Outside of the CHT, the federal government has been providing funding to address COVID-19, but that funding has only been provided on a one-time or short-term basis and will not support health care expenditures over the long term.
Health care sustainability has been an ongoing issue and is expected to continue to be a significant concern across the country. Projections by the Conference Board of Canada and the Parliamentary Budget Office suggest that despite large short-term deficits, the federal government is positioned to be in surplus over the long term, while provinces and territories collectively are projected to experience increasing deficits. Resourcing B.C.’s health care system in a fiscally sustainable manner will require more robust growth in federal health funding for B.C. and all provinces in the long term.
Since 2015, the Council of the Federation (Canada’s Premiers) has been actively calling on the federal government to become a full partner in health care funding. In September 2020, Premiers called on the Government of Canada to increase the Canada Health Transfer to 35 per cent of health care spending. Following a First Ministers Meeting that December, the Prime Minister stated, “It’s going to be important that the federal government steps up and increases its share of the cost of health care with the Canada Health Transfer. We are going to do that, and I look forward to conversations over the coming months about how we can increase it.”1
This year, B.C. has taken on a leadership role in support of enhanced health care funding. On September 16, 2021, Premier John Horgan became chair of Canada’s Premiers and the Honourable Selina Robinson became chair of the provincial and territorial Finance Ministers’ table. In December, the Honourable Adrian Dix became chair of the provincial and territorial Health Ministers’ table. They are working closely together as well as with their federal, provincial, and territorial counterparts toward a First Ministers’ Meeting on health care sustainability. A stronger federal partnership will improve long-term sustainability for health systems and provide funding for ongoing enhancements to health care for all Canadians.
1 Source: https://www.cbc.ca/news/politics/trudeau-premiers-post-meeting-press-conference-1.5836535
Budget and Fiscal Plan - 2022/23 to 2024/25
44
Three Year Fiscal Plan
B.C.’s Environmental, Social and Governance Values
Government is focused on building a strong, expanding economy, where the benefits are shared more equally, and where environmental sustainability is the basis for future growth.
The most common measurement of economic growth and prosperity is Gross Domestic Product (GDP). However, GDP only measures a subset of human activity and does not measure many important aspects relating to health, education, inequality, poverty, governance and the environment. There is a growing body of research that supports an overall shift to more comprehensive approaches for assessing growth and prosperity. Proponents of this shift include the Organization for Economic Cooperation and Development (OECD), the United Nations and Statistics Canada. The monitoring and reporting on these measures are discussed further below in the section titled ‘ESG Values in Action’.
Environmental, Social and Governance (ESG) factors are important considerations that impact B.C.’s long-term sustainability, growth opportunities and material risks. Financial and investor communities are increasingly applying ESG information as part of their analysis to identify growth opportunities and risks. B.C. seeks to be a leader in this field to attract more investment and to grow the economy, while more accurately measuring how this growth translates to improvements in the quality of life for people and communities. Government’s economic plan, StrongerBC: A Plan for Today, a Vision for Tomorrow, includes developing ESG tools that will allow government to measure progress towards achieving those goals. Incorporating ESG values into long-term strategic planning and communicating ESG outcomes to stakeholders and investors will enable the Province to meet its goal to lead in this field and attract investment. This is further discussed in the section below.
BC’s Environmental, Social & Governance Report
Budget 2022 is presented alongside BC’s Environmental, Social and Governance (ESG) Report. The Report provides a broad overview of government’s important programs, policies and projects and highlights the ongoing progress that the Province is making to embed ESG values in the core work of ministries across government. The Report also provides a picture of how the province contributes to a better quality of life through climate action, improved social conditions, and more transparent governance. The report also supports investors with ESG questions about investing in B.C.
Feedback from the financial and investor communities, which are eager to learn about B.C.’s ESG values and actions, along with collaboration across ministries, prompted the creation of the Report. The approach to the Report was developed from consultations with financial market stakeholders. The contents of the Report were informed by engagement with Indigenous partners. The initiatives included in the Report showcase the strong alignment of ESG principles and the core values of government.
BC’s ESG Report outlines the selected programs, policies, frameworks, organizations and projects which support and augment government’s commitment to sustainable and socially responsible work across the province.
| • | Environmental: The report discusses the impacts and benefits which government actions have on the environment; the contribution government makes in the fight against climate change through greenhouse gas emissions, waste management, energy efficiency and actions to decarbonize and cut emissions; and how government works to achieve natural resource goals, such as land and resource management, biodiversity, air and water quality, and reducing deforestation. |
Budget and Fiscal Plan - 2022/23 to 2024/25
45
Three Year Fiscal Plan
| • | Social: The report discusses how government supports people and culture in B.C., including discussion of inclusivity, gender equity and diversity, race and multiculturalism, community relationships, human rights and labour standards. |
| • | Governance: The report discusses how government’s practices, systems and procedures affect leadership, data protection, privacy and transparency. There is also discussion of B.C.’s planning, budgeting, and reporting processes that ensure government’s finances are fiscally sustainable and transparent. |
BC’s ESG Report recognizes and emphasizes the important work that government does to serve British Columbians every day while also providing crucial information on risks and opportunities to investors. In addition to BC’s ESG Report, a topic box on “A Responsible Approach to Budgeting and Fiscal Planning” can be found on page 37. This discusses how government uses health, disaster recovery, debt affordability and economic metrics as part of fiscal planning.
ESG Advisory Council
In preparation for Budget 2022, the Minister of Finance consulted with a new ESG Advisory Council in addition to the Economic Forecast Council to further explore how the provincial government can continue to support well-being in B.C. Feedback from the two councils was used to inform fiscal planning. See the topic box on page 121 for further information about the Economic Forecast Council.
The ESG Advisory Council was comprised of the following members:
| • | Christine Bergeron, Vancity |
| • | David Green, University of British Columbia |
| • | Jim Stanford, Centre for Future Work |
| • | Mark Podlasly, First Nations Major Projects Coalition |
| • | Nancy Olewiler, Simon Fraser University |
Key themes throughout the ESG Advisory Council meeting were reconciliation with Indigenous Peoples as well as climate change mitigation and adaptation. Many ideas were shared about standards of living, poverty and inequality, including issues around housing and child care affordability. The Council also highlighted the importance of inclusive access to education, skills training and financial capital. Other pressing topics of discussion included B.C.’s evolving labour market, policies and measures that build shared prosperity, sustainable natural resource development, and opportunities for innovation across B.C.’s economy.
In general, members of the ESG Advisory Council highlighted the need to partner with Indigenous Peoples and affected groups in private and public sector decision-making processes in order to diversify discussions, improve implementation and foster inclusive prosperity. They further noted that careful consideration and monitoring of environmental and socioeconomic outcomes (particularly across regions and diverse GBA+ population groups) contributes to supporting strong communities in B.C.
ESG Values in Action
B.C.’s Economic Plan
Government has released the Stronger BC Economic Plan: A Plan for Today, A Vision for Tomorrow. The long-term plan sets out an approach to creating a more inclusive, sustainable, and innovative economy that works for more British Columbians. The plan charts the path to meeting two big goals — inclusive growth and clean growth — and identifies six missions and new priorities that achieve the overarching goals of inclusive and clean growth.
To achieve inclusive growth the economic plan focuses on missions to support people and families, build resilient communities, and to advance true, lasting and meaningful reconciliation with Indigenous Peoples. Government has made much progress on this respect through implementation of its
Budget and Fiscal Plan - 2022/23 to 2024/25
46
Three Year Fiscal Plan
child care plan, the elimination of student loan interest, ongoing investments to provide high-speed internet connectivity to communities, transit expansion, and through ongoing collaboration to implement the Declaration on the Rights of Indigenous Peoples Act (Declaration Act). The Plan identifies new priorities that include the development of the Province’s workforce readiness strategy to address the challenge of filling of more than one million job openings in B.C. over the next ten years, working with Indigenous communities to secure new economic opportunities, and closing the digital divide.
The Plan highlights three missions to achieve clean growth: meeting B.C.’s climate commitments, leading on environmental and social responsibility, and fostering innovation across the economy. There is significant work underway on initiatives that support these missions including the establishment of a new $500 million strategic investment fund with InBC Investment Corporation, investing in the development of clean energy through initiatives such as the Centre for Innovation and Clean Energy, and through the creation of 2,000 new tech-relevant spaces in B.C.’s public post-secondary institutions. New initiatives, such as the establishment of integrated marketplaces, will help drive innovation by supporting companies to scale up efficiently and develop and market new products. The development of a Mass Timber Action Plan will also help foster low-carbon innovation to responsibly grow an emerging industry. Further strategies will be developed to create more domestic manufacturing capability, and a strategy to promote cleaner and more efficient movement of B.C. goods within the province and internationally.
As part of the Plan, the Province will track economic progress in conjunction with other key indicators, such as health, equality, education, reconciliation with Indigenous Peoples, and social connectedness. These indicators will be tracked to measure progress towards achieving these missions and to adjust course as necessary.
Climate Action and Accountability
Government has legislated targets to reduce greenhouse gas (GHG) emissions to 40 per cent below 2007 levels by 2030, 60 per cent by 2040 and 80 per cent by 2050. Sector-specific emission reduction targets have also been established for four sectors: transportation, industry, oil and gas, and buildings and communities.
The Province established an accountability framework under the Climate Change Accountability Act, which requires the Province to produce an annual Climate Change Accountability Report on or after October 1st each year. The 2021 report included a range of information detailing significant progress across a suite of policies, programs and legislation implemented over previous years.
In 2021, B.C. developed new actions and released the CleanBC Roadmap 2030 to meet emission reduction targets through accelerated and expanded actions in pathways including: low carbon energy, cleaner transportation, better buildings and communities, and cleaner industry, among others. The CleanBC Roadmap meets government’s commitment to build and implement a credible plan to achieve B.C.’s target and was informed by new emissions projections showing greater action to meet its 2030 GHG targets is required.
Budget 2022 builds on CleanBC investments of over $2.3 billion to provide over $1 billion over the next three years to accelerate climate action in B.C. This includes funding to maintain the province’s economic competitiveness while taking steps to reduce emissions. It will support the expansion of the Low Carbon Fuel Standard and establish a new emissions cap on natural gas utilities, which are anticipated to support significant reductions in greenhouse gas emissions. It also includes funding for a new Clean Transportation Action Plan, which will encourage mode shifting such as active transportation, developing the highest efficiency standards for space and water heating, and a new Local Government Climate Action Plan that will help local governments
Budget and Fiscal Plan - 2022/23 to 2024/25
47
Three Year Fiscal Plan
take action to reduce emissions and adapt to climate change. Budget 2022 features continued investment in the Climate Action Tax Credit to ensure the transition to a low-carbon economy is affordable. Over the next year, government will be reviewing the carbon tax to ensure it continues to drive emissions reductions while protecting affordability and economic competitiveness and will lay out a plan to continue to meet or exceed the federal benchmark in line with the increasing federal price requirements.
Reconciliation with Indigenous Peoples
A core part of the Province’s approach to ESG is the advancement of reconciliation with Indigenous Peoples through respect and recognition of Indigenous People’s inherent rights, including the right to self-determination and self-government. Work is ongoing to implement the Declaration Act which requires government to consult and cooperate with Indigenous Peoples to align B.C.’s laws with the UN Declaration on the Rights of Indigenous Peoples (UN Declaration), develop and implement an Action Plan to achieve the objectives of the UN Declaration, and prepare an annual report on progress made on aligning laws and achieving the goals in the action plan.
In 2021, the Province released a draft Action Plan to support ongoing consultation and further collaboration with Indigenous Peoples. Once finalized, the Action Plan will help advance reconciliation by defining a set of long-term goals and outcomes, and identifying specific actions covering the whole of government. Government also produces an annual report on progress. The 2020/21 Annual Report highlighted progress government has made at addressing anti-Indigenous racism in the health care system, long-term revenue sharing, Indigenous justice initiatives, among other steps taken to implement the UN Declaration.
ChildCareBC
ChildCareBC was launched in 2018 to bring affordable, accessible, inclusive and quality child care to families that want or need it. Since 2018, government has introduced the Affordable Child Care Benefit, an income-tested benefit to help eligible families with child care costs. Government has also introduced the Child Care Fee Reduction Initiative that lowers the cost of child care for families by up to $350 per month, per child. The Province’s New Spaces Fund is B.C.’s key space creation program, supporting organizations to create new licensed child care spaces across the province. Government has also sought to improve quality by investing in the child care workforce. This has included the provision of bursaries to individuals seeking to become certified early childhood educators, the expansion of professional development opportunities for early childhood educators and child care providers, and a $4 per hour wage enhancement for those certified early childhood educators. Budget 2022 includes further investments to continue the development of this important system.
As stipulated under an agreement with the Government of Canada, the Province publishes an annual report on progress and results achieved on shared child care priorities between the Province and the federal government.
Poverty Reduction Strategy
TogetherBC is the Province’s first poverty reduction strategy to reduce overall poverty in B.C over five years. Specifically, the strategy set out to reduce overall poverty rate in B.C. by 25 per cent and the child poverty rate by 50 per cent below 2016 levels by 2024. The Poverty Reduction Strategy Act establishes government’s accountability to the people of B.C., providing a clearly defined scope and legislated targets, a framework for ongoing community involvement, and an annual progress report that is published by October 1 each year.
Budget and Fiscal Plan - 2022/23 to 2024/25
48
Three Year Fiscal Plan
The 2020 Annual Report showed that, as of 2019, B.C.’s overall poverty rate had decreased 29 per cent and the child poverty rate decreased 58 per cent below 2016 levels, thereby exceeding the province’s legislated targets. The Province continues to work collaboratively, with community organizations, Indigenous communities and all orders of government to chart an inclusive and equitable path towards poverty reduction.
Affordable Housing
In Budget 2018, B.C. government launched Homes for BC, its 10-year housing plan. Through the plan’s 30 actions, all of which have been implemented or are under way, government is working with its partners towards building 114,000 affordable homes for British Columbians by 2028. Since Homes for BC was launched, more than 32,000 new homes are complete, under construction or in the approvals process.
BC Housing reports on its progress and sets out performance indicators and targets for its housing programs through its Annual Service Plan Report. The 2020/21 Annual Service Plan Report highlighted the creation of 4,222 new homes in 46 communities across the province, surpassing its target of 3,500 homes. Government monitors housing data to inform future policy actions and measure progress. For example, the December 2021 New Homes Registry Report shows that 53,189 new homes were registered in B.C. in 2021, the highest yearly total since data was collected in 2002. The Province will keep working with municipalities to streamline development processes and build homes faster and is looking at other potential measures to ensure prospective buyers are protected in a volatile market.
Multiculturalism and Anti-Racism
As the most ethnically diverse province in Canada, B.C. has typically welcomed more than 40,000 new immigrants annually, in recent years. Cultural diversity and increased participation and engagement by all cultures is important to create a strong and vibrant social and economic future for British Columbians. The Multiculturalism Act recognizes the crucial role that ministries and Crown corporations play in promoting multiculturalism and fostering a society in which there are no impediments to the full and free participation of all British Columbians.
The Annual Report on Multiculturalism provides an overview of government actions, while also ensuring accountability and allowing for the sharing of leading practices. Over 40 government agencies are integrating anti-racism, diversity and inclusion into policies, programs and service delivery.
Governance and Transparency
BC’s ESG Report provides an overview of government’s internal practices, systems and procedures that lead to greater levels of transparency, especially in financial planning and budgeting. These are codified in legislation and regulations.
Budget 2021 established a framework of fiscal guardrails to guide financial decisions that continue to be used in Budget 2022. These guardrails include a Pandemic and Recovery Contingencies Vote to fund time-limited initiatives to respond to the pandemic. The guardrails also included transparent and timely reporting to provide updated economic forecasts as well as detailed reporting of pandemic measures. The 2021/22 Third Quarterly Report can be found on page 125.
Further information is provided in the topic box on “A Responsible Approach to Budgeting and Fiscal Planning” which begins on page 37. The topic box discusses how government intends to take a responsible approach to budgeting and fiscal planning as part of the long-term work to reduce annual deficits over time.
Budget and Fiscal Plan - 2022/23 to 2024/25
49
Three Year Fiscal Plan
ESG Framework for Capital
Government applies an Environmental, Social and Governance Framework for Capital that guides the delivery of key government priorities through the development of Provincial public sector projects. In this context, applying an Environmental, Social and Governance lens to capital plan investments supports:
Labour Objectives – Government leverages public sector infrastructure investments to provide employment and apprentice training opportunities for traditionally under-represented groups who want to build a career in the trades. Using project labour agreements, such as the Community Benefits Agreement, public sector projects can help accelerate the development of the next generation of skilled workers and close current skills gaps.
New Child Care Spaces – Building new licenced child care spaces alongside existing public sector projects capitalizes on existing construction resources that are in place to achieve an additional government objective. B.C. has committed to creating 30,000 new licensed child care spaces within five years, and 40,000 spaces within seven years, through a partnership with the federal government. Creating new spaces within new public sector buildings will support this commitment.
Mass Timber Construction – By using mass timber as a structural component in new public sector buildings, government is demonstrating leadership in the use of this innovative building material, helping to mainstream the use of this value-added product and support the province’s forestry industry.
CleanBC Objectives – By developing clear requirements for public sector buildings in terms of both emissions standards and climate resiliency measures, new provincial assets will be prepared for the climate of the future and contribute less to the causes of climate change today.
Governance – The Capital Asset Management Framework sets out government’s expectations for the delivery and management of capital assets. It is composed of best practice guidelines and tools to support public sector agencies by describing the Province’s principles, standards, policies and processes for managing capital assets such as schools, hospitals and transportation infrastructure. It highlights roles and responsibilities, risk management, financial and accounting considerations, reporting, procurement and planning processes that govern the management, review and approval of all of government’s capital projects.
Established in 2002, the Framework was released as part of a series of initiatives to strengthen fiscal sustainability. While the overarching principles of the Framework remain relevant, an update is required to reflect changes in policy, procedures and industry practices as well as to ensure capital projects are meeting expectations about the delivery of key government priorities.
To this end, the Province is updating the Framework under the direction of the Deputy Ministers and Industry Infrastructure Forum to reaffirm and reinforce the vision of the Framework throughout the lifecycle of public capital assets.
The Deputy Ministers and Industry Infrastructure Forum was created in 2013 and is composed of senior executives from ministries involved in capital asset construction and management, and senior representatives from the construction industry. It is co-chaired by the Deputy Minister of Finance and a representative from the BC Construction Association. Its main functions are to promote relationship building, development and sharing of information and best practices related to capital asset construction and management in B.C. The work of this Forum highlights the importance of collaboration between government and the construction industry in the delivery of public infrastructure.
Budget and Fiscal Plan - 2022/23 to 2024/25
50
Three Year Fiscal Plan
BC Public Service
Full-time equivalent (FTE) staff utilization in core government ministries is projected to be 34,400 FTEs across the fiscal plan period. This is an increase of 1,000 FTEs compared to the 2021/22 forecast. The anticipated FTE growth is mainly due to expansions of child care programming, wildfire and emergency management services, and additional staffing requirements for the implementation of CleanBC. Additional FTEs are forecasted for the Ministry of Land, Water and Resource Stewardship and to staff the Declaration Act Secretariat.
BC Public Sector Compensation
There are more than 500,000 people in British Columbia’s public sector working in the core Public Service, at Crown corporations and agencies, in health and community social services, K-12 public education and post-secondary institutions and research universities. Of those people, approximately 394,000 are unionized employees. Fiscal year 2022/23 marks the transition between the 2019 Sustainable Services Negotiating Mandate (SSNM) and the Province’s public sector bargaining mandate for the 2022 round of negotiations. Budget 2022 supports the final compensation adjustments pursuant to the SSNM as well as collective agreements as they are reached under the new mandate in the future. Funding is held in General Programs Contingencies to prepare for the ratification of collective agreements throughout the fiscal plan period.
Spending Recovered from Third Parties
Government projects that, over the fiscal plan period, it will incur over $11 billion in program spending which will be recovered from third parties.
A total of $4.5 billion of programs will be delivered with funding from the federal government, such as the Labour Market Development Agreement, the Canada Job Grant, public transit, health, and child and family support programs.
Recovered costs include an estimated $2.9 billion in interest payments from commercial Crown corporations through the fiscal agency loan program and from sinking fund investment returns.
$4 billion in government spending is supported by various recovery sources, primarily other jurisdictions, other levels of government, agencies, and fees and licenses. Expenses that relate to these recoveries include health care, PharmaCare, transportation projects, and grants to various organizations in the community, and employee health benefits costs collected from participating government agencies.
Program spending from recoveries have no net impact to the government’s fiscal plan as the recoveries are reported as revenue and the spending is expensed as it is incurred.
Budget and Fiscal Plan - 2022/23 to 2024/25
52
Three Year Fiscal Plan
Transfers to Service Delivery Agencies
Around 61 per cent of ministry spending takes the form of transfers (both operating and capital) to service delivery agencies for the provision of services on behalf of government. These transfers will total $109 billion over the three-year fiscal plan period and will support education, health care, social services, housing, and transportation programs delivered by the agencies. These service delivery agencies include the SUCH sector (schools, universities, colleges and health organizations), Community Living BC, BC Housing Management Commission, BC Transit, and the BC Transportation Financing Authority.
Service Delivery Agency Spending
Service delivery agency spending is projected to increase from $42.2 billion in 2021/22 to $43.5 billion by 2024/25, an increase of $1.3 billion. Additional funding may be allocated to agencies during the year from Pandemic Recovery Contingencies, which may result in higher actual spending in 2022/23.
School district spending is projected to increase from $7.48 billion in 2021/22 to $7.75 billion in 2024/25, an increase of over $266 million. This increase is primarily due to increasing staffing and operating costs related to higher projected student enrolment.
Post-secondary institution spending is projected to rise from $7.32 billion in 2021/22 to $8.2 billion by 2024/25 — an increase of $879 million. The spending increase is primarily due to higher staffing and operating costs related to higher enrolment.
Health authority and hospital society spending, after adjusting for approximately $2 billion in pandemic spending in the current year, is projected to increase from $18.7 billion in 2021/22 to $20.5 billion in 2024/25 an increase of $1.8 billion over the fiscal plan period. This spending increase is to fund increasing staffing and operating costs incurred to meet the projected volume growth in healthcare services delivered by these organizations.
Projected spending by other service delivery agencies is forecast to remain stable around $7 billion over the fiscal plan. This spending relates mainly to services in the transportation, social services, and housing sectors.
For a presentation of the government’s consolidated spending in various sectors please see Table A11 Expense by Function on page 174. The expense by function table combines the spending by ministries and service delivery agencies in sectors such as health, education, social services, transportation, and others.
Budget and Fiscal Plan - 2022/23 to 2024/25
53
Three Year Fiscal Plan
Table 1.3 Expense by Ministry, Program and Agency
| ($ millions) | | Updated
Forecast
2021/22 1 | | | Budget
Estimate
2022/23 | | | Plan
2023/24 | | | Plan
2024/25 | |
| Office of the Premier | | | 15 | | | | 15 | | | | 15 | | | | 15 | |
| Advanced Education and Skills Training | | | 2,577 | | | | 2,613 | | | | 2,597 | | | | 2,598 | |
| Agriculture and Food | | | 99 | | | | 107 | | | | 108 | | | | 108 | |
| Attorney General | | | 1,273 | | | | 1,374 | | | | 1,402 | | | | 1,428 | |
| Children and Family Development | | | 1,662 | | | | 1,742 | | | | 1,756 | | | | 1,768 | |
| Citizens’ Services | | | 604 | | | | 657 | | | | 663 | | | | 663 | |
| Education and Child Care | | | 7,845 | | | | 8,217 | | | | 8,226 | | | | 8,262 | |
| Energy, Mines and Low Carbon Innovation | | | 108 | | | | 112 | | | | 121 | | | | 113 | |
| Environment and Climate Change Strategy | | | 313 | | | | 368 | | | | 415 | | | | 551 | |
| Finance | | | 1,399 | | | | 1,221 | | | | 966 | | | | 973 | |
| Forests | | | 1,453 | | | | 832 | | | | 846 | | | | 865 | |
| Health | | | 23,882 | | | | 25,456 | | | | 26,243 | | | | 27,047 | |
| Indigenous Relations and Reconciliation | | | 177 | | | | 178 | | | | 194 | | | | 186 | |
| Jobs, Economic Recovery and Innovation | | | 107 | | | | 111 | | | | 111 | | | | 111 | |
| Labour | | | 17 | | | | 17 | | | | 17 | | | | 17 | |
| Land, Water and Resource Stewardship | | | 82 | | | | 92 | | | | 99 | | | | 99 | |
| Mental Health and Addictions | | | 21 | | | | 25 | | | | 25 | | | | 25 | |
| Municipal Affairs | | | 308 | | | | 260 | | | | 262 | | | | 261 | |
| Public Safety and Solicitor General | | | 1,423 | | | | 1,394 | | | | 1,007 | | | | 1,008 | |
| Social Development and Poverty Reduction | | | 4,360 | | | | 4,456 | | | | 4,490 | | | | 4,511 | |
| Tourism, Arts, Culture and Sport | | | 171 | | | | 173 | | | | 173 | | | | 173 | |
| Transportation and Infrastructure | | | 916 | | | | 956 | | | | 956 | | | | 953 | |
| Total ministries and Office of the Premier | | | 48,812 | | | | 50,376 | | | | 50,692 | | | | 51,735 | |
| Management of public funds and debt | | | 1,285 | | | | 1,378 | | | | 1,555 | | | | 1,751 | |
| Contingencies - General Programs and CleanBC | | | 1,000 | | | | 2,848 | | | | 3,412 | | | | 3,987 | |
| Pandemic Recovery Contingencies | | | 3,250 | | | | 2,000 | | | | 1,000 | | | | — | |
| Funding for capital expenditures | | | 2,595 | | | | 3,734 | | | | 3,910 | | | | 4,353 | |
| Refundable tax credit transfers | | | 1,846 | | | | 2,044 | | | | 2,142 | | | | 2,224 | |
| Legislative Assembly and other appropriations | | | 175 | | | | 185 | | | | 180 | | | | 177 | |
| Total appropriations | | | 58,963 | | | | 62,565 | | | | 62,891 | | | | 64,227 | |
| Elimination of transactions between appropriations 2 | | | (15 | ) | | | (17 | ) | | | (20 | ) | | | (21 | ) |
| Prior year liability adjustments | | | (13 | ) | | | — | | | | — | | | | — | |
| Consolidated revenue fund expense | | | 58,935 | | | | 62,548 | | | | 62,871 | | | | 64,206 | |
| Expenses recovered from external entities | | | 3,864 | | | | 4,011 | | | | 3,739 | | | | 3,641 | |
| Funding provided to service delivery agencies | | | (35,303 | ) | | | (35,863 | ) | | | (36,307 | ) | | | (36,830 | ) |
| Total direct program spending | | | 27,496 | | | | 30,696 | | | | 30,303 | | | | 31,017 | |
| Service delivery agency expense 3: | | | | | | | | | | | | | | | | |
| School districts | | | 7,484 | | | | 7,733 | | | | 7,742 | | | | 7,750 | |
| Universities | | | 5,812 | | | | 6,154 | | | | 6,383 | | | | 6,559 | |
| Colleges and institutes | | | 1,512 | | | | 1,528 | | | | 1,590 | | | | 1,644 | |
| Health authorities and hospital societies | | | 20,675 | | | | 19,644 | | | | 20,434 | | | | 20,511 | |
| Other service delivery agencies | | | 6,724 | | | | 7,258 | | | | 6,907 | | | | 7,025 | |
| Total service delivery agency expense | | | 42,207 | | | | 42,317 | | | | 43,056 | | | | 43,489 | |
| Total expense | | | 69,703 | | | | 73,013 | | | | 73,359 | | | | 74,506 | |
| 1 | Restated to reflect government’s current organization and accounting policies. There are a number of ministry reorganizations effective April 1, 2022, with major changes including the transfer of Child Care programs to the Ministry of Education and Child Care (formerly Education), and the establishment of the Ministry of Land, Water and Resource Stewardship with programs transferred from other ministries. For a presentation of 2021/22 expense forecasts before the reorganization, please see Table 4.8 on page 137. |
| 2 | Reflects payments made under an agreement where an expense from a voted appropriation is recorded as revenue by a special account. |
| 3 | The 2021/22 spending for service delivery agencies includes funding that was provided during the year from ministries’ budget and contingencies. Similarly, spending forecasts for 2022/23 and future years may also be revised as ministry funding amounts are updated in-year. |
Budget and Fiscal Plan - 2022/23 to 2024/25
54
Three Year Fiscal Plan
Table 1.4 Revenue by Source
| ($ millions) | | Updated
Forecast
2021/22 | | | Budget
Estimate
2022/23 | | | Plan
2023/24 | | | Plan
2024/25 | |
| Taxation revenue | | | | | | | | | | | | | | | | |
| Personal income | | | 13,680 | | | | 12,848 | | | | 13,360 | | | | 13,955 | |
| Corporate income | | | 5,064 | | | | 5,501 | | | | 5,827 | | | | 6,455 | |
| Employer health | | | 2,130 | | | | 2,257 | | | | 2,349 | | | | 2,441 | |
| Sales 1 | | | 8,441 | | | | 9,009 | | | | 9,546 | | | | 9,928 | |
| Fuel | | | 1,039 | | | | 1,051 | | | | 1,059 | | | | 1,068 | |
| Carbon | | | 2,048 | | | | 2,311 | | | | 2,348 | | | | 2,384 | |
| Tobacco | | | 740 | | | | 760 | | | | 760 | | | | 760 | |
| Property | | | 3,020 | | | | 3,173 | | | | 3,354 | | | | 3,514 | |
| Property transfer | | | 3,250 | | | | 2,500 | | | | 2,406 | | | | 2,461 | |
| Insurance premium | | | 640 | | | | 660 | | | | 670 | | | | 680 | |
| | | | 40,052 | | | | 40,070 | | | | 41,679 | | | | 43,646 | |
| Natural resource revenue | | | | | | | | | | | | | | | | |
| Natural gas royalties | | | 749 | | | | 911 | | | | 691 | | | | 580 | |
| Forests | | | 1,847 | | | | 1,121 | | | | 887 | | | | 909 | |
| Other natural resources 2 | | | 1,527 | | | | 1,355 | | | | 1,220 | | | | 1,117 | |
| | | | 4,123 | | | | 3,387 | | | | 2,798 | | | | 2,606 | |
| Other revenue | | | | | | | | | | | | | | | | |
| Post-secondary education fees | | | 2,539 | | | | 2,679 | | | | 2,779 | | | | 2,859 | |
| Other fees and licences 3 | | | 2,185 | | | | 2,207 | | | | 2,203 | | | | 2,166 | |
| Investment earnings | | | 1,369 | | | | 1,298 | | | | 1,344 | | | | 1,344 | |
| Miscellaneous 4 | | | 3,457 | | | | 3,807 | | | | 3,884 | | | | 3,945 | |
| | | | 9,550 | | | | 9,991 | | | | 10,210 | | | | 10,314 | |
| Contributions from the federal government | | | | | | | | | | | | | | | | |
| Health and social transfers | | | 8,534 | | | | 8,363 | | | | 8,932 | | | | 9,343 | |
| COVID-19 related funding | | | 322 | | | | 40 | | | | — | | | | — | |
| Other federal government contributions 5 | | | 2,626 | | | | 2,937 | | | | 2,810 | | | | 2,589 | |
| | | | 11,482 | | | | 11,340 | | | | 11,742 | | | | 11,932 | |
| Commercial Crown corporation net income | | | | | | | | | | | | | | | | |
| BC Hydro | | | 681 | | | | 712 | | | | 712 | | | | 712 | |
| Liquor Distribution Branch | | | 1,153 | | | | 1,166 | | | | 1,198 | | | | 1,225 | |
| BC Lottery Corporation 6 | | | 1,129 | | | | 1,415 | | | | 1,450 | | | | 1,457 | |
| ICBC | | | 1,904 | | | | 327 | | | | 240 | | | | 280 | |
| Other 7 | | | 146 | | | | 144 | | | | 148 | | | | 153 | |
| | | | 5,013 | | | | 3,764 | | | | 3,748 | | | | 3,827 | |
| Total revenue | | | 70,220 | | | | 68,552 | | | | 70,177 | | | | 72,325 | |
| 1 | Includes provincial sales tax and HST/PST housing transition tax related to prior years. |
| 2 | Columbia River Treaty, Crown land tenures, other energy and minerals, water rental, and other resources. |
| 3 | Health-care-related, motor vehicle, and other fees. |
| 4 | Includes reimbursements for health care and other services provided to external agencies, and other recoveries. |
| 5 | Includes contributions for health, education, community development, housing and social service programs, and transportation projects. |
| 6 | Net of payments to the federal government and payments under the gaming revenue sharing agreement with First Nations. |
| 7 | Includes Columbia Power Corporation, BC Railway Company, Columbia Basin power projects, and other agencies’ self-supported subsidiaries. |
Budget and Fiscal Plan - 2022/23 to 2024/25
55
Three Year Fiscal Plan
Revenue
Total revenue is expected to decline 2.3 per cent in 2022/23 followed by an increase of 2.3 per cent in 2023/24 and 3.0 per cent in 2024/25. This reflects the effects of one-time revenues recorded in 2021/22 and steadily declining natural resource revenues over the three-year fiscal plan, following higher than usual commodity prices in 2021. Taxation revenues incorporate the impact of revenue measures detailed in Part 2: Tax Measures. Revenue growth in taxation, federal government contributions and other sources is partly offset by declining revenue from natural resources and commercial Crown corporations.
Chart 1.2 Revenue Forecast
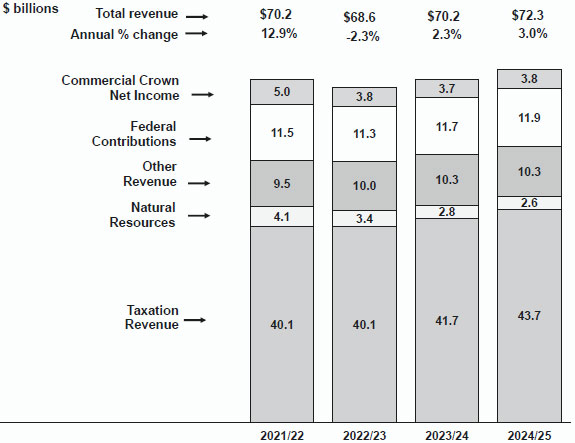
Revenue growth in taxation sources averages 2.9 per cent over the three-year fiscal plan period. B.C. and the federal government continue to support business competitiveness in the face of ongoing global developments through corporate income tax relief. B.C. continues to provide incentives for investment in capital assets, such as buildings, machinery and equipment. Taxation revenue is projected to be flat in 2022/23 as the impacts of economic growth and policy measures are offset by one-time revenues that are assumed to not carry forward. Taxation revenue is forecast to average 4.4 per cent annual growth over the last two years of the plan, in line with nominal GDP growth.
Natural resource revenue is forecast to decline by 17.9 per cent in 2022/23 as lower revenues from forests, mining, bonus bids and rents on drilling licences and leases are partly offset by increased revenue from natural gas royalties, electricity sales under the Columbia River Treaty and water rentals. Revenue is expected to decline on average over the next two years by 12.3 per cent mainly reflecting the effects of declining commodity prices and forest harvest volumes. The forecast incorporates estimates of the old-growth deferral and the recent Supreme Court of B.C. decision that the cumulative impacts of industrial development infringed Blueberry River First Nations’ ability to exercise their Treaty 8 rights.
Budget and Fiscal Plan - 2022/23 to 2024/25
56
Three Year Fiscal Plan
Table 1.5.1 Comparison of Major Factors Underlying Revenue
| Calendar Year | | February 22, 2022 | | | April 20, 2021 | |
| Per cent growth unless otherwise indicated | | 2021 | | | 2022 | | | 2023 | | | 2024 | | | 2021 | | | 2022 | | | 2023 | | | 2024 | |
| Real GDP | | | 5.0 | | | | 4.0 | | | | 2.5 | | | | 2.1 | | | | 4.4 | | | | 3.8 | | | | 2.2 | | | | 2.1 | |
| Nominal GDP | | | 12.4 | | | | 5.8 | | | | 4.1 | | | | 4.0 | | | | 6.4 | | | | 5.4 | | | | 4.0 | | | | 3.9 | |
| Household income | | | 4.9 | | | | 3.6 | | | | 3.9 | | | | 3.7 | | | | 0.8 | | | | 2.8 | | | | 3.4 | | | | 3.6 | |
| Wages and salaries | | | 10.7 | | | | 6.0 | | | | 4.1 | | | | 3.9 | | | | 4.5 | | | | 4.0 | | | | 3.7 | | | | 3.6 | |
| Corporations net operating surplus | | | 13.6 | | | | 0.8 | | | | 4.3 | | | | 4.0 | | | | 9.2 | | | | 8.8 | | | | 3.3 | | | | 3.0 | |
| Employment | | | 6.6 | | | | 2.8 | | | | 1.6 | | | | 1.2 | | | | 4.7 | | | | 2.4 | | | | 1.6 | | | | 1.3 | |
| Consumer expenditures on durable goods | | | 17.9 | | | | 3.4 | | | | 1.3 | | | | 2.1 | | | | 2.6 | | | | 3.1 | | | | 2.8 | | | | 3.0 | |
| Consumer expenditures on goods and services | | | 7.7 | | | | 8.1 | | | | 6.6 | | | | 5.2 | | | | 5.3 | | | | 5.9 | | | | 5.7 | | | | 4.9 | |
| Business investment | | | 16.9 | | | | 3.9 | | | | 6.2 | | | | 4.8 | | | | 5.6 | | | | 6.4 | | | | 6.3 | | | | 6.1 | |
| Residential investment | | | 23.2 | | | | 0.9 | | | | 5.8 | | | | 3.8 | | | | 3.5 | | | | 4.6 | | | | 4.8 | | | | 3.0 | |
| Retail sales | | | 12.8 | | | | 4.0 | | | | 3.7 | | | | 3.6 | | | | 3.7 | | | | 3.4 | | | | 3.4 | | | | 3.2 | |
| Residential sales value | | | 57.7 | | | | -19.6 | | | | -5.1 | | | | 2.2 | | | | 8.0 | | | | -3.3 | | | | -2.7 | | | | 2.2 | |
| B.C. Housing starts | | | 25.6 | | | | -20.1 | | | | -5.3 | | | | -2.7 | | | | -8.6 | | | | -3.0 | | | | -1.3 | | | | -3.0 | |
| U.S. Housing starts | | | 15.6 | | | | -7.2 | | | | -5.4 | | | | -1.4 | | | | 3.6 | | | | -1.4 | | | | -2.1 | | | | -2.2 | |
| SPF 2x4 price ($US/thousand board feet) | | $ | 883 | | | $ | 575 | | | $ | 475 | | | $ | 450 | | | $ | 650 | | | $ | 475 | | | $ | 450 | | | $ | 400 | |
| Exchange rate (US cents/Canadian dollar) | | | 79.8 | | | | 79.9 | | | | 79.3 | | | | 78.9 | | | | 79.0 | | | | 79.0 | | | | 78.0 | | | | 78.0 | |
| Fiscal Year | | 2021/22 | | | 2022/23 | | | 2023/24 | | | 2024/25 | | | 2021/22 | | | 2022/23 | | | 2023/24 | | | 2024/25 | |
| Natural gas price ($Cdn/GJ at plant inlet) | | $ | 2.38 | | | $ | 2.09 | | | $ | 1.67 | | | $ | 1.55 | | | $ | 1.48 | | | $ | 1.48 | | | $ | 1.50 | | | $ | 1.55 | |
| Bonus bid average bid price per hectare ($) | | $ | 660 | | | $ | 275 | | | $ | 275 | | | $ | 300 | | | $ | 0 | | | $ | 200 | | | $ | 300 | | | $ | 300 | |
| Electricity price ($US/mega-watt hour, Mid-C) | | $ | 53 | | | $ | 58 | | | $ | 57 | | | $ | 51 | | | $ | 37 | | | $ | 34 | | | $ | 33 | | | $ | 32 | |
| Metallurgical coal price ($US/tonne, fob Australia ) | | $ | 223 | | | $ | 202 | | | $ | 163 | | | $ | 158 | | | $ | 136 | | | $ | 145 | | | $ | 148 | | | $ | 150 | |
| Copper price ($US/lb) | | $ | 4.30 | | | $ | 3.95 | | | $ | 3.73 | | | $ | 3.57 | | | $ | 3.52 | | | $ | 3.35 | | | $ | 3.20 | | | $ | 3.18 | |
| Average stumpage rates ($Cdn/cubic metre) | | $ | 37.14 | | | $ | 25.04 | | | $ | 20.71 | | | $ | 20.75 | | | $ | 24.21 | | | $ | 19.05 | | | $ | 18.36 | | | $ | 18.27 | |
| Crown harvest volumes (million cubic metres) | | | 45.0 | | | | 40.0 | | | | 38.5 | | | | 39.5 | | | | 46.0 | | | | 45.0 | | | | 45.0 | | | | 45.0 | |
Other revenue consists of fees, licences, investment earnings and other miscellaneous sources, incorporating estimates provided by ministries and taxpayer-supported agencies. Over the next three years, these revenues are projected to average 2.6 per cent annual growth, slightly above the Budget 2022 real GDP outlook.
Federal government contributions are forecast to decline by 1.2 per cent in 2022/23 mainly due to the inclusion of pandemic relief one-time federal government funding in the 2021/22 forecast. Federal contributions are expected to increase by 2.6 per cent annually over the next two years mainly due to expected increases in the Canada Health Transfer (CHT) and the Canada Social Transfer (CST) disbursements. The combined CHT and CST contributions are forecast to average 5.7 per cent annual growth over next two years in the fiscal plan and represent about 76 per cent of total federal government contributions. Other federal government transfers are projected to decline at an average of 4.2 per cent annually over the three-year fiscal plan.
Budget and Fiscal Plan - 2022/23 to 2024/25
57
Three Year Fiscal Plan
Major Revenue Sources
Key assumptions and sensitivities relating to revenue are provided in Appendix Table A5. The assumptions and factors that are the major drivers for preparing projections of individual revenue sources include sensitivities which provide a sense of potential impacts to revenue projections if there are changes to these underlying assumptions and factors. The following text references the forecasts of these assumptions and factors in explaining individual revenue sources. An analysis of historical volatility of the economic variables related to revenue sources can be found in the 2021 British Columbia Financial and Economic Review (pages 16-17). The major revenue components are detailed below.
Taxation revenue
Personal income tax revenue declines 6.1 per cent in 2022/23 mainly due to an unusual high prior year accounting adjustment ($1.3 billion) included in the 2021/22 forecast. The revenue growth is expected to average 4.2 per cent over the next two years, in line with projected increases in wages and salaries and household income.
Table 1.5.2 Corporate Income Tax Revenue
| ($ millions) | | 2021/22 | | | 2022/23 | | | 2023/24 | | | 2024/25 | |
| Advance installments: | | | | | | | | | | | | | | | | |
| – Payment share | | | 14.17 | % | | | 14.43 | % | | | 14.33 | % | | | 14.08 | % |
| – Installments | | | 5,235 | | | | 5,508 | | | | 5,968 | | | | 6,504 | |
| Prior-years’ settlement payment | | | (171 | ) | | | (7 | ) | | | (141 | ) | | | (49 | ) |
| Corporate income tax revenue | | | 5,064 | | | | 5,501 | | | | 5,827 | | | | 6,455 | |
| Annual per cent growth | | | 5.4 | % | | | 8.6 | % | | | 5.9 | % | | | 10.8 | % |
Corporate income tax revenue is mainly based on cash installments and settlement adjustments for prior years. Revenue is expected to grow 8.6 per cent in 2022/23 mainly due to increase in installments reflecting higher national corporate tax base and settlement payment for prior years. Average annual growth over the next two years is forecast to be 8.3 per cent due to annual increases in installments reflecting the federal government’s projection of national corporate taxable income as well as annual changes in settlement payments relating to prior years.
Table 1.5.3 Sales Tax Revenue
| ($ millions) | | 2021/22 | | | 2022/23 | | | 2023/24 | | | 2024/25 | |
| Provincial sales taxes | | | 8,441 | | | | 9,009 | | | | 9,546 | | | | 9,928 | |
| Annual per cent change (calendar year) | | | 2021 | | | | 2022 | | | | 2023 | | | | 2024 | |
| Consumer expenditures on durable goods | | | 17.9 | % | | | 3.4 | % | | | 1.3 | % | | | 2.1 | % |
| Consumer expenditures on goods and services | | | 7.7 | % | | | 8.1 | % | | | 6.6 | % | | | 5.2 | % |
| Residential investment | | | 23.2 | % | | | 0.9 | % | | | 5.8 | % | | | 3.8 | % |
| Government expenditures | | | 6.5 | % | | | 4.0 | % | | | 1.0 | % | | | 2.0 | % |
| Nominal GDP | | | 12.4 | % | | | 5.8 | % | | | 4.1 | % | | | 4.0 | % |
| Retail sales | | | 12.8 | % | | | 4.0 | % | | | 3.7 | % | | | 3.6 | % |
Provincial sales tax revenue is expected to average 5.6 per cent growth annually over the three-year fiscal plan, in line with expected increases in nominal GDP and consumer expenditures on taxable goods and services. The forecast incorporates various tax measures, outlined in Part 2: Tax Measures.
Budget and Fiscal Plan - 2022/23 to 2024/25
58
Three Year Fiscal Plan
Motor fuel tax revenue growth is expected to average 0.9 per cent annually over the three-year plan. Diesel volumes are forecast to grow 3.0 per cent in 2022 and 2.0 per cent annually from 2023 onwards. The forecast assumes that gasoline purchases are flat over the fiscal plan, while other fuel volumes rise in line with real GDP growth.
Carbon tax revenue is forecast to rise an average of 5.2 per cent annually over the next three years as the carbon tax rate increases from $45/tonne of CO2 equivalent emissions in 2021/22 to $50 in 2022/23. Over the last two years of the fiscal plan, carbon tax revenue is projected to average 1.6 per cent growth, reflecting volume growth and no change in tax rates. The Province has committed to meeting or exceeding growth in the federal benchmark, and will evaluate the effects of the carbon tax on household affordability in line with the increasing federal carbon price requirements.
Tobacco tax revenue is projected to be relatively flat over the next three years.
Property tax revenue is expected to grow by an average of 5.2 per cent annually over the following three years, consistent with housing starts, non-residential investment and inflation.
Property transfer tax revenue is expected to decline at an average of 8.9 per cent annually over the three-year fiscal plan, consistent with the expected annual changes in residential sales values. In addition, due to the high market activity seen this year, $450 million (slightly less than 15 per cent) is assumed to be one-time in 2021/22 and not expected to carry forward.
Employer health tax revenue is forecast at $2.3 billion in 2022/23. Over the next two years, revenue growth is expected to average 4.0 per cent annually, consistent with growth in wages and salaries.
More information on tax measures is detailed in Part 2: Tax Measures.
Natural resource revenue
Natural gas royalties are expected to increase 21.6 per cent in 2022/23 mainly due to increased royalties from natural gas liquids, an improved outlook for natural gas production volumes and decreased utilization of royalty credit programs, partially offset by lower natural gas prices. Over the next two years, royalties are expected to decrease at a 20.2 per cent average annual rate as the effects of declining natural gas prices and decreased royalties from natural gas liquids are partially offset by increased production volumes and decreased utilization of royalty credit programs. The forecast is based on the existing royalty structure with no policy changes incorporated.
The forecast assumes an average price of $2.09 ($Cdn/gigajoule, plant inlet) in 2022/23, down from $2.38 in 2021/22. This assumption is within the 20th percentile of the private sector forecasters, continuing the prudence incorporated since 2013/14. Prices are expected to decline over the next two years, averaging $1.67 in 2023/24 and $1.55 in 2024/25, consistent with the growth of the average of the private-sector forecasts. Over the three-year fiscal plan period, the projected natural gas prices average 32 cents lower than the average of the private-sector forecasters.
See Appendix Table A6 for more details regarding natural gas price forecasts.
Revenue from bonus bids and rents on drilling licences and leases is forecast to decline over the next three years, from $141 million in 2021/22 to $79 million in 2024/25. The decrease is due to declining deferred revenue. The bonus bid revenue recognition
Budget and Fiscal Plan - 2022/23 to 2024/25
59
Three Year Fiscal Plan
Chart 1.3 Revenue from Energy, Metals, and Minerals
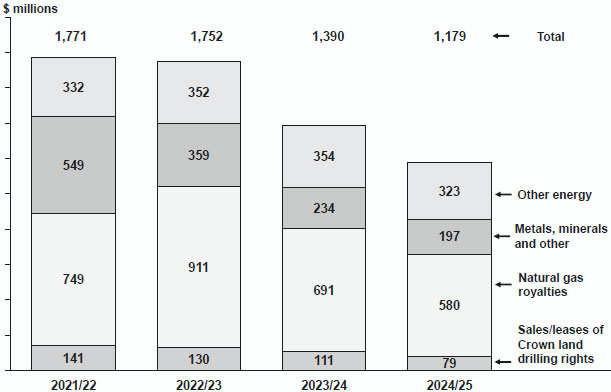
reflects ten-year deferral of cash receipts from the sale of Crown land tenures. Cash sales are expected to increase from $2 million in 2022/23 to $6 million in 2023/24 and 2024/25. More detail is provided in Appendix Table A5.
Mining and minerals: Revenue from mineral tax, fees and miscellaneous mining receipts is forecast to decline 34.6 percent in 2022/23 mainly due to lower metallurgical coal and copper prices compared to the elevated prices experienced in 2021/22. Declining coal and copper price forecasts reflect improved global access to supply in the post-pandemic period and assumed decreasing Chinese demand for coal. Over the next two years revenue is projected to average a 25.9 per cent annual decline mainly reflecting an assumed continuation of falling prices.
Other energy revenue is comprised of electricity sales under the Columbia River Treaty, petroleum royalties, and fees collected by the Oil and Gas Commission. These revenues are expected to decrease by an average of 0.9 per cent annually over the three-year fiscal plan mainly due to lower Mid-Columbia electricity prices.
Forest revenue is expected to decline 39.3 per cent in 2022/23 due to the impacts of lower Crown harvest volumes as well as lower overall stumpage rates and logging tax revenue mainly reflecting an assumed decrease in lumber prices from the historically high levels experienced in 2021. Forest revenue is expected to decline an average of 10 per cent over the next two years mainly due to lower overall stumpage rates and logging tax revenue, reflecting a lower outlook for lumber prices. Total harvest levels on Crown land are projected to decrease from 45 million cubic metres in 2021/22 to 39.5 million cubic metres in 2024/25. The reduction in harvest incorporates the impact of logging deferrals in old-growth forests. Over the four years to 2024/25, the forecast assumes that the Ministry of Indigenous Relations and Reconciliation will recover $194 million of stumpage revenue in support of funding the Forest Consultation and Revenue Sharing Agreements with First Nations.
Budget and Fiscal Plan - 2022/23 to 2024/25
60
Three Year Fiscal Plan
Other natural resource revenue is comprised of water rentals and fees for hunting and fishing licences collected under the Wildlife Act. These revenues are expected to increase an average of 0.9 per cent annually over the next three years mainly reflecting higher water rentals collected under the Water Sustainability Act.
Other Taxpayer-supported Revenue
Fees and licences: Over the three-year fiscal plan, revenue from fees and licences is expected to average 2.1 per cent annual growth mainly due to increasing projections for post-secondary institutions, the K-12 sector and health authorities. Over the next three years, fee revenue projections from schools, universities, colleges, and health authorities (SUCH sector) account for 70 per cent of the total fee revenue forecast.
Investment earnings are expected to decline by 5.2 per cent in 2022/23 mainly due to decreased investment income earnings from universities, partly offset by higher recoveries through the fiscal agency loan program. Over the next two years investment income is expected to average 1.8 per cent annual growth mainly due to higher recoveries, which has an equal and offsetting lower expense, resulting in no net impact on the projected annual deficit. These recoveries are expected to comprise approximately 70 per cent of total investment earnings.
Miscellaneous revenue is projected to average 4.5 per cent annual growth over the fiscal plan period. Over 58 per cent of the total miscellaneous revenue of approximately $3.8 billion is expected to be contributed by SUCH sector entities.
Federal Government Transfers
Canada Health Transfer and Canada Social Transfer contributions are expected to decline 2.0 percent in 2022/23 mainly due to an additional one-time $542 million Canada Health Transfer (CHT) included in 2021/22 forecast, supporting the recovery of the health care systems following the pandemic. Over the next two years, contributions are expected to increase at a 5.7 per cent average annual rate mainly reflecting increasing national cash transfers and a rising B.C. population share of the national total. The plan assumes the national CHT cash disbursement increases 4.8 and 7.8 per cent in the first two years of the plan, followed by an increase of 4.9 per cent in 2024/25. The national CHT cash disbursement in 2022/23 is based on a three-year average (2020 to 2022) of Canada’s nominal GDP growth. The forecast adopts the most recent federal government outlook for national nominal GDP. The national Canada Social Transfer cash disbursement is projected to increase 3.0 per cent annually, consistent with the federal government forecast.
Other federal government contributions are expected to remain flat in 2022/23 as the effects of the new Canada-Wide Early Learning and Child Care Agreement (incorporated as ministry vote recovery) is offset by the elimination of one-time COVID pandemic-related funding in 2021/22. Over the next two years of the plan the forecast is expected to decline an average of 6.7 per cent mainly due to funding changes in support of local government, public transit, and under the Disaster Financial Assistance Arrangements.
Budget and Fiscal Plan - 2022/23 to 2024/25
61
Three Year Fiscal Plan
Table 1.5.4 Federal Government Contributions
| ($ millions) | | 2021/22 | | | 2022/23 | | | 2023/24 | | | 2024/25 | |
| Canada Health Transfer | | | 6,424 | | | | 6,183 | | | | 6,681 | | | | 7,021 | |
| Canada Social Transfer | | | 2,110 | | | | 2,180 | | | | 2,251 | | | | 2,322 | |
| Total Health and Social Transfers | | | 8,534 | | | | 8,363 | | | | 8,932 | | | | 9,343 | |
| COVID-19 related funding | | | 322 | | | | 40 | | | | — | | | | — | |
| Disaster Financial Assistance Agreements | | | 3 | | | | 28 | | | | 162 | | | | 17 | |
| Low Carbon Economy Leadership Fund | | | 13 | | | | 2 | | | | — | | | | — | |
| BC Housing Management Commission | | | 171 | | | | 159 | | | | 163 | | | | 153 | |
| Ministry Vote Recoveries | | | 1,381 | | | | 1,612 | | | | 1,449 | | | | 1,394 | |
| Other Transfers to Ministries and Agencies | | | 1,058 | | | | 1,136 | | | | 1,036 | | | | 1,025 | |
| Total Other Contributions | | | 2,626 | | | | 2,937 | | | | 2,810 | | | | 2,589 | |
| Total Federal Government Contributions | | | 11,482 | | | | 11,340 | | | | 11,742 | | | | 11,932 | |
| BC share of national population (June 1) | | | 13.62 | % | | | 13.68 | % | | | 13.71 | % | | | 13.74 | % |
Commercial Crown Corporations
British Columbia Hydro and Power Authority (BC Hydro): BC Hydro’s net income is set by regulation at $712 million in 2022/23, and is forecast at $712 million in 2023/24 and 2024/25. The payment of dividends was phased out to assist with stabilizing rate increases and improve BC Hydro’s capital structure to a 60:40 debt-to-equity ratio (currently 80:20). No dividend payments are forecast during the fiscal plan period.
British Columbia Liquor Distribution Branch (LDB): LDB is projecting a net income of $1.166 billion in 2022/23 and growing to $1.225 billion by 2024/25, an average annual increase of 2.1 per cent.
British Columbia Lottery Corporation (BCLC): BCLC’s net income is forecast to recover to pre-pandemic levels over the fiscal plan, from $1.1 billion in 2021/22, to $1.5 billion in 2024/25 (net of payments under the Province’s gaming revenue sharing agreement with First Nations, and $11 million in annual payments to the federal government). BCLC’s forecasts are subject to an increased level of uncertainty due to the pandemic, and operations would be impacted by future health orders for reduced seating capacity in gaming facilities. Government will distribute approximately 23 per cent of its gaming income to charities, First Nations, and local governments.
Insurance Corporation of British Columbia (ICBC): ICBC is forecasting a net income of $327 million in 2022/23, $240 million in 2023/24, and $280 million in 2024/25. On May 1, 2021 the corporation transitioned from a tort-based insurance model to the new enhanced care-based system. The forecast is subject to a number of financial and behavioural assumptions relating to the implementation of changes to the insurance model, and actual results could vary from these projections.
For more information relating to commercial Crown corporations, please see Service Plans listed on the Budget 2022 website or the corporations’ respective websites.
Budget and Fiscal Plan - 2022/23 to 2024/25
62
Three Year Fiscal Plan
Capital Spending
In Budget 2022, capital spending on schools, hospitals, roads, bridges, hydro-electric projects and other infrastructure around the province is expected to total $39.4 billion over the three-year fiscal plan period. These investments will help ensure that the necessary infrastructure is in place to deliver the services that people count on in communities around the province and create jobs that support a strong and sustainable economy.
Taxpayer-Supported Capital Spending
Taxpayer-supported capital spending over the next three years will total $27.4 billion. This includes completion of existing approved projects along with new investments to expand and sustain provincial infrastructure including schools, post-secondary facilities, roads, bridges and hospitals. The Budget 2022 three-year total is $1.1 billion higher than Budget 2021 mainly due to increasing capital spending on major projects in the health and transportation sectors, as well as revised timing for capital projects.
Table 1.6 Capital Spending
| ($ millions) | | Updated
Forecast
2021/22 | | | Budget
Estimate
2022/23 | | | Plan
2023/24 | | | Plan
2024/25 | |
| Taxpayer-supported | | | | | | | | | | | | | | | | |
| Education | | | | | | | | | | | | | | | | |
| Schools (K–12) | | | 1,036 | | | | 1,082 | | | | 1,063 | | | | 955 | |
| Post-secondary institutions | | | 1,054 | | | | 1,237 | | | | 1,539 | | | | 1,482 | |
| Health | | | 2,051 | | | | 2,584 | | | | 2,818 | | | | 3,164 | |
| BC Transportation Financing Authority | | | 1,716 | | | | 2,644 | | | | 2,528 | | | | 2,038 | |
| BC Transit | | | 82 | | | | 178 | | | | 291 | | | | 293 | |
| Government ministries | | | 457 | | | | 755 | | | | 492 | | | | 441 | |
| Social housing 1 | | | 672 | | | | 572 | | | | 426 | | | | 254 | |
| Other 2 | | | 89 | | | | 227 | | | | 176 | | | | 188 | |
| Total taxpayer-supported | | | 7,157 | | | | 9,279 | | | | 9,333 | | | | 8,815 | |
| Self-supported | | | | | | | | | | | | | | | | |
| BC Hydro | | | 3,632 | | | | 4,131 | | | | 4,244 | | | | 2,967 | |
| Columbia Basin power projects 3 | | | 9 | | | | 11 | | | | 11 | | | | 17 | |
| BC Railway Company | | | 4 | | | | 12 | | | | 3 | | | | 4 | |
| ICBC | | | 68 | | | | 60 | | | | 45 | | | | 41 | |
| BC Lottery Corporation | | | 83 | | | | 120 | | | | 103 | | | | 90 | |
| Liquor Distribution Branch | | | 32 | | | | 40 | | | | 31 | | | | 25 | |
| Total self-supported commercial | | | 3,828 | | | | 4,374 | | | | 4,437 | | | | 3,144 | |
| Total capital spending | | | 10,985 | | | | 13,653 | | | | 13,770 | | | | 11,959 | |
| 1 | Includes BC Housing Management Commission and Provincial Rental Housing Corporation. |
| 2 | Includes BC Pavilion Corporation, Royal BC Museum and other service delivery agencies. |
| 3 | Joint ventures of the Columbia Power Corporation and Columbia Basin Trust. |
For more information on infrastructure investments and projects in planning, please see the topic box on page 35.
Budget and Fiscal Plan - 2022/23 to 2024/25
63
Three Year Fiscal Plan
Investments in Schools
Over the three years of the fiscal plan, approximately $3.1 billion will be invested to maintain, replace, renovate, or expand K-12 facilities. This includes continued investment in new school space to accommodate increasing enrolment in growth districts, as well as in the program to seismically upgrade or replace schools.
Examples of K-12 capital investments in Budget 2022 include:
| • | Cowichan Secondary in the Cowichan Valley School District is being replaced under the Ministry of Education and Child Care’s Seismic Mitigation Program. The 1,100-student-capacity secondary school will be located on a new site at Cowichan Place, roughly 400m from the existing school. The $86-million replacement school is scheduled to be complete in 2024 and will be partially funded by the Cowichan Valley School District. The neighbourhood learning centre will include an Indigenous Language and Cultural Centre, Health and Wellness Centre, and School District 79 facilitation space. |
| | | |
| | • | Henry Hudson Elementary in the Vancouver School District is being replaced under the ministry’s Seismic Mitigation Program and will provide a 390-student-capacity replacement school, which is scheduled to complete in 2024. The new school has a total budget of $40.7 million, which includes a $1.1-million contribution from the Vancouver School District and $10.0 million from the City of Vancouver. The replacement school will include low-carbon design features, neighbourhood learning centre space for before-and-after school care and a preschool, as well as a facility for child care services funded by the City of Vancouver. |
| | | |
| | • | The new Regent Road Elementary School is currently under construction in the Surrey School District and will provide 655 new spaces for students in Grade K to 7. This new school has a total budget of $33.3 million, which includes a $5.8-million contribution from the Surrey School District. The school is designed to meet LEED gold standards and is scheduled to be complete in September 2022. |
| | | |
| | • | The new Ta’talu Elementary School in the Surrey School District will provide 655 new spaces for students in Grade K to 7. This new school has a total budget of $44.1 million, which includes a $5.0-million contribution from the Surrey School District. The school will be designed to meet LEED gold standards and is scheduled to be complete in 2023. It will feature mass timber elements and a neighbourhood learning centre with space for child care services. |
| • | The new Snokomish Elementary School in the Surrey School District will provide 655 new spaces for students in Grade K to 7. This new school has a total budget of $43.9 million, which includes a $5.0-million contribution from the Surrey School District. The school will be designed to exceed LEED gold standards and is scheduled to be complete in 2025. |
| • | Cedar Hill Middle in the Greater Victoria School District is being replaced through the ministry’s Seismic Mitigation Program. The $46.5-million replacement will deliver a 575-capacity middle school by early 2025. The project budget includes $3.6 million in additional funding from the Greater Victoria School Board. The replacement school will include low-carbon design features and neighbourhood learning centre space. |
Budget and Fiscal Plan - 2022/23 to 2024/25
64
Three Year Fiscal Plan
| | • | The upgraded and renovated Gudangaay Tlaats’gaa Naay School in the Haida Gwaii School District will be made seismically safe, creating a Grade K to 12 school at the existing secondary school. The upgrades and new tsunami evacuation tower have a total budget of $16.5 million and are scheduled to be complete in winter 2022. The project will reduce district costs associated with operating two separate facilities and will ensure that students are in safe seats. |
| | | |
| • | The new Parkcrest Elementary School in the Kamloops-Thompson School District will replace the previous school that was destroyed by a fire in 2019 and will provide 510 spaces for students in Grade K to 6. This new school has a budget of $37.3 million, will be designed to reduce greenhouse gas emissions and annual energy costs and is scheduled to be complete in September 2024. It will feature a neighbourhood learning centre with space for child care services. The school will also feature a larger gymnasium funded by the City of Kamloops. |
| | | |
| | • | Two new schools are currently being constructed for the Sooke School District. The $89-million project is delivering a new 500-student-capacity Pexsisen Elementary and a new 700-student-capacity Centre Mountain Lellum Middle school. The elementary school will feature a neighbourhood learning centre, with space for child care services. The two new schools are scheduled to open in September 2022. |
| • | The new Stride Avenue Elementary School in the Burnaby School District will replace the existing seismically vulnerable school and provide 390 safe seats when it is completed in January 2024. The new school has a total budget of $25.8 million and will include greenhouse gas emission reduction strategies and feature a neighbourhood learning centre, with space for a Community Hub for Indigenous Learning and child care services. |
| • | The new Glenmerry Elementary School in the Kootenay-Columbia School District will replace the existing facility and provide 435 spaces for students in Grade K to 7. This new school has a budget of $33.6 million and will deliver a safe learning environment with more space to learn, while reducing the school’s carbon footprint with a design that follows modern energy efficiency strategies. The school is scheduled to be complete in 2024. To further benefit families in Trail, the new Glenmerry will be home to a neighbourhood learning centre that will provide community programming, as well as before- and after-school child care services. |
| | | |
| | • | The new Moody Elementary in the Coquitlam School District will be replaced under the ministry’s Seismic Mitigation Program, will provide 385 safe seats for Grades K to 5 and will include enhanced greenhouse gas reduction strategies when it is completed in September 2024. The new school has a total budget of $37.2 million, which includes a $5.0-million contribution from the Coquitlam School District. Included in the project is a neighbourhood learning centre that will feature space for child care services. |
Budget and Fiscal Plan - 2022/23 to 2024/25
65
Three Year Fiscal Plan
Spending to Support Post-Secondary Education
Budget 2022 includes $4.3 billion in total capital spending over the next three years by post-secondary institutions throughout the province. Investments in priority projects will build capacity and help meet the province’s future workforce and economic development needs in key sectors, including health, science, trades and technology. A significant portion of this capital investment is funded through other sources, including foundations, donations, internal sources, revenues generated from services, and federal funding.
Current and planned investments in the post-secondary sector include:
| • | Construction of the $163-million Trades and Technology Complex at the Burnaby campus of the British Columbia Institute of Technology. This project will modernize the tools and spaces needed to help meet the growing demand for skilled tradespeople in B.C. |
| • | Construction of a new $19-million Centre for Childhood Studies at Capilano University’s North Vancouver campus. |
| • | $90 million for the expansion of the Engineering and Computer Science Building and construction of a new Engineering laboratory building at the University of Victoria supporting 500 additional tech-related seats for students in computer science and engineering programs. |
| • | Construction of a new $88-million health science building at British Columbia Institute of Technology’s Burnaby campus. The new building will provide flexible simulation space for health education. |
| • | $27 million for the National Centre for Indigenous Laws as an addition to the Fraser Law building at the University of Victoria that will be home to the world’s first joint degree in Indigenous legal orders and Canadian common law, as well as the Indigenous Law Research Unit. |
| • | $18 million for a new First Peoples Gathering House at Simon Fraser University’s Burnaby campus, which contains a large Ceremonial Hall for ceremonies and learning events. |
| • | The provincial student housing program, announced in 2018, to build approximately 5,000 new student housing beds at B.C.’s public post-secondary institutions. Examples of approved projects include: |
| – | $25 million to construct two new student housing buildings with 148 beds at Selkirk College at the Nelson and Castlegar campuses; |
| – | $68 million to construct five new mass timber student housing buildings with 376 beds at Okanagan College, across three campuses – Kelowna, Vernon and Salmon Arm; |
| – | $114 million to build a 12-storey mass timber student housing building with 464 beds at the British Columbia Institute of Technology Burnaby campus; |
| – | $229 million to construct two student housing buildings at the University of Victoria. The buildings include 621 net-new beds, a dining facility and multi-purpose program space; and |
| – | $104 million to build a student housing building with 386 beds and to renovate and expand the current dining facility at the Simon Fraser University Burnaby campus. |
Budget and Fiscal Plan - 2022/23 to 2024/25
66
Three Year Fiscal Plan
| • | The B.C. Knowledge Development Fund provides capital investment funding for vital research infrastructure for public post-secondary institutions, teaching hospitals and affiliated non-profit agencies across the province, enabling institutions to attract researchers and skilled technicians. Examples of approved projects include: |
| | – | $8.7 million in B.C. Knowledge Development funding for specialized equipment to add isotope production capabilities at TRIUMF’s ARIEL facility at the University of British Columbia campus. The project will support the development of the next generation of medical isotopes and pioneer new approaches to conventional isotope production, which will advance medical imaging and targeted tumor therapy for cancer patients; expand B.C.-based commercialization of accelerator technologies; and attract world-class talent to B.C. This project, known as ARIEL II, is led by the University of Victoria in partnership with three other B.C. and 15 out-of-province universities. |
| | – | $2.2 million in B.C. Knowledge Development funding for specialized equipment to upgrade the Compute Canada’s CEDAR supercomputer located at Simon Fraser University’s Burnaby campus. The Tier-1 Data Centre is one of ten around the world that are part of the Worldwide Large Hadron Collider Computing Grid, an international network of high-performance computing facilities that store and process the massive volume of data from the ATLAS experiment at CERN, in Switzerland. The ATLAS experiment is an international collaborative particle physics experiment encompassing more than 3,000 scientists from 183 institutions in 38 countries. The computing facilities at Simon Fraser University are a vital component of the ATLAS research program and essential for breakthrough discoveries in particle physics research. |
| | – | $4.6 million in B.C. Knowledge Development funding to develop infrastructure to convert one block on the University of British Columbia Point Grey campus into an integrated energy system – the Clean Connected and Safe Transportation Testbed. The Testbed, a city-scale living laboratory, will emulate critical links between energy, transportation, information and communications technology and urban design that will be used to test how interactions between vehicles, infrastructure and pedestrians can be optimized to improve energy efficiency and reduce greenhouse gas emissions. The project is the first of its kind in the world. |
Expanding and Upgrading Health Facilities
Capital spending on infrastructure in the health sector will total $8.6 billion over the next three years. These investments support new major construction projects and upgrading of health facilities, medical and diagnostic equipment, and information management/technology systems. These investments are supported by funding from the Province as well as other sources, such as regional hospital districts and foundations.
Key capital investments in the health sector include:
| • | A new St. Paul’s Hospital at the Station Street site in Vancouver, which will include capacity for 548 inpatient beds, a new and larger emergency department, a surgical suite, consolidated specialty outpatient clinics and an underground parkade ($2,174 million project budget). Construction started in March 2021 and the new hospital is expected to be open for patients in 2027. |
Budget and Fiscal Plan - 2022/23 to 2024/25
67
Three Year Fiscal Plan
| • | A net-new integrated hospital and cancer centre in Surrey to help meet the needs of a growing and aging population in the region ($1,660 million total cost). The new hospital will include 168 inpatient beds, emergency department, medical imaging department including computed tomography (CT) and magnetic resonance imaging (MRI), surgical suite, pharmacy, laboratory, and academic space. The new cancer centre will include an oncology ambulatory care unit, chemotherapy, radiation therapy, functional imaging, and a new cyclotron. Construction is planned to begin in summer 2023 and the new facility is expected to be open for patients in summer 2027. |
| | | |
| | • | Phase 2 of the Royal Columbian Hospital Redevelopment, which includes a new 348-bed acute care tower with six floors of inpatient beds, including critical care and maternity, a new and expanded emergency department, a new surgical and interventional suite with 18 operating rooms and an underground parkade ($1,244 million total cost including Phase 3). Procurement started in fall 2018 and completed in 2020. Construction started in December 2020 and the new acute care tower is expected to open for patients in 2025 with final project costs in 2026. |
| • | Replacement of the 54-year-old Cowichan District Hospital in Duncan with a new hospital on a greenfield site in North Cowichan ($887 million total cost). The replacement hospital will increase inpatient beds from 134 to 201 and increase emergency department treatment spaces from 17 to 36. The facility will also increase the number of operating rooms, replace the mobile MRI with a fixed MRI, and add a helipad to the roof of the inpatient tower. Construction is expected to start in spring 2022 and be completed in 2026. |
| • | Replacement of the Mills Memorial Hospital in Terrace, which was originally built in 1959 ($623 million total cost). The new hospital will include 78 inpatient beds, an increase of 34 beds. Construction started in July 2021 and is expected to be completed in fall 2024. Demolition and site redevelopment will continue until 2026. |
| | | |
| | • | Phase 1 of the Burnaby Hospital Redevelopment, which involves construction of a new patient care tower, new energy centre, renovation and expansion of the Support Facilities Building, minor renovation of the nursing tower and demolition of the West Wing and Cascade Buildings ($612 million total cost). The new six-storey tower will accommodate relocated services, including medical and surgical inpatient services, outpatient services, a consolidated maternity/labour and delivery unit, and a mental health and substance use patient unit. Renovations and expansion of the support facilities building will improve access to care by providing additional operating rooms, a new medical device reprocessing department, additional parking, and renovations to key support services. Construction started in 2021 with construction of the new tower expected to be completed in 2025 and renovations to the Support Facilities Building and Nursing Tower expected to be completed in 2026 with final project costs in 2027. |
| • | Replacement of the Dawson Creek and District Hospital on a 10-acre greenfield site on the north-west corner of the Northern Lights College campus in Dawson Creek ($378 million total cost). The new hospital will include 70 inpatient beds, an increase of 24 beds. The emergency department, surgical and operating room space and ambulatory care services will also be expanded. Construction of the new hospital is expected to start in 2022 and be completed in 2026. |
| • | Redevelopment of the Cariboo Memorial Hospital in Williams Lake ($218 million total cost). The project includes construction of a three-storey addition and renovation of vacated spaces in the existing hospital. Once the project is complete, the redeveloped hospital will include 53 inpatient beds, an increase of 25 beds, and |
Budget and Fiscal Plan - 2022/23 to 2024/25
68
Three Year Fiscal Plan
a new and larger emergency department. Construction of the three-storey addition is planned to start in 2022 and expected to be completed in 2024. The renovations are planned to begin in 2024 and be completed in 2026.
| • | Replacement of the Stuart Lake Hospital in Fort St. James ($116 million total cost). The hospital will be built on the same site as the existing one. Once complete, the existing facility will be demolished to make way for parking. The new hospital will be three times larger than the current facility. The project scope includes an emergency department with two treatment rooms, a trauma bay and ambulance bay, and a primary care centre that will consolidate services currently offered in Fort St. James. A preferred proponent was selected in 2021. Construction is expected to begin in 2022 and complete in 2024. |
| | | |
| | • | Redevelopment of Richmond Hospital ($861 million total cost). The redevelopment is a multi-phased project on the hospital site that includes a new acute care tower. The new acute care tower will replace the original North Tower, which opened in 1964. The redevelopment will result in 353 inpatient beds on the campus for an increase of 113 beds. The new acute care tower will include 216 beds (of the 353 beds), all of which will be single occupancy. Construction of the tower is expected to begin in 2024 and open for patients in 2028 with the renovations to the South Tower and demolition of the North Tower completing in 2031. |
Supporting the Transportation Investment Plan
Budget 2022 includes further investments in government’s Transportation Investment Plan. The Province has secured federal cost sharing on projects and has also leveraged investments through partnerships with private organizations. B.C. continues to work with federal and municipal governments to confirm priorities for funding under the Investing in Canada Infrastructure Program and the recently announced permanent public transit fund.
Over the three years of the fiscal plan, transportation capital investments totaling $8.0 billion will maintain the flow of people and goods to support the B.C. economy. Timing of capital spending on these projects is subject to several factors, including funding from partners such as the federal government infrastructure programs and market conditions.
Examples of key capital investments in the transportation sector include:
| • | Constructing the new eight-lane immersed tube Fraser River Tunnel that will replace the George Massey Tunnel on Highway 99, providing a toll-free crossing that aligns with regional interests and improves transit, cycling and walking connections across the Fraser River as part of the Highway 99 Tunnel Program. |
| • | Constructing the Broadway Subway, which will add 5.7 kilometres of SkyTrain line and six stations, to provide frequent and reliable access to one of the most congested transit corridors in Metro Vancouver, meet current and future transportation needs, reduce traffic congestion and air pollution, and improve livability. |
| • | Replacing the Pattullo Bridge with a new four-lane bridge (expandable to six-lanes) that meets current seismic and road design standards and the removal of the existing bridge. It will provide a safe and reliable crossing for vehicles, pedestrians and cyclists, and network connections in Surrey and New Westminster. |
Budget and Fiscal Plan - 2022/23 to 2024/25
69
Three Year Fiscal Plan
| • | Continuing to move ahead with the business plan of the Surrey-Langley SkyTrain project and advancing planning for the Highway 1 widening from Langley to Whatcom Road in Abbotsford project, to meet the needs of growing regions and ease congestion in key corridors. |
| • | Four-laning the final 4.8 kilometres of the 26-kilometre section of Highway 1 through the Kicking Horse Canyon between Highway 95 and the western boundary of Yoho National Park to improve safety and reliability, and facilitate the movement of goods. |
| • | Four-laning several sections of Highway 1 between Kamloops and Golden to improve safety and traffic flow and renew aging infrastructure, including: Chase Creek Road to Chase Creek Bridge (Chase); 1st Avenue SW to 10th Street SW (Salmon Arm); Quartz Creek Bridge replacement (west of Golden); and Ford Road to Tappen Valley Road and R.W. Bruhn Bridge replacement (Sicamous). |
| • | Widening ten kilometres of Highway 1 through Langley between 216th Street and 264th Street to accommodate new high-occupancy vehicle lanes, including reconfiguring the 232nd Street interchange, new underpasses at Glover Road and the CP Rail crossing and a truck parking lot near Highways 1 and 17 for up to 150 commercial trucks and 45 passenger vehicles. |
| | • | Improvements along highway corridors in Delta to increase travel safety and efficiency, including: upgrading the Highway 91 at Nordel Interchange; Highway 91 Connector at Nordel Way intersection; Highway 17 at 80th Street intersection (Tilbury); 27B Avenue On-Ramp to Deltaport Way and 27B Avenue between Deltaport Way and 41B Street; and a new interchange at Highway 17 and Highway 91 Connector (Sunbury). |
| • | Improvements to Highway 14 along the southern coast of Vancouver Island to improve safety and traffic flow and facilitate transit usage, including: widening and realigning 1.5 kilometres between Glinz Lake Road and Connie Road; a new park-and-ride facility on Gillespie Road; and wider shoulders between Otter Point Road and Woodhaven Road. |
| • | Construction of a flyover from Highway 17 northbound to Keating Cross Road westbound in Central Saanich to improve safety by eliminating left turn across highway traffic onto Keating Cross Road and realigning the southbound highway on-ramp. |
| | • | Constructing an electric-ready ferry vessel for service on Kootenay Lake and upgrading the Balfour and Kootenay Bay terminals. The new vessel will have almost twice the capacity of the existing MV Balfour and be able to carry between 50 and 60 vehicles. |
| | • | Constructing a 5.4 kilometre two-lane realignment of West Fraser Road to bypass a section through active slides that was washed-out in 2018 and provide a safe, reliable, and efficient roadway to get local people to and from their homes, schools, jobs and appointments, including a new bridge over Narcosli Creek and rock stabilization work. |
| • | Upgrading intersections and providing passing lanes on provincial highway corridors to improve safety and traffic flow, improvements along Highway 97 between Racing and Quesnel-Hydraulic Roads in Quesnel and westbound passing lanes on Highway 16 near Broman Lake east of Topley and Toboggan Lake west of Smithers. |
| • | Expansion of SkyTrain fleet and upgrades to stations and facilities in Metro Vancouver to serve rapidly growing transit demand and to support the Broadway Subway project. |
| • | Procurement and delivery of the first 10 battery electric buses for use by BC Transit in Victoria to reduce carbon emissions and improve rider experience. |
Budget and Fiscal Plan - 2022/23 to 2024/25
70
Three Year Fiscal Plan
| • | Construction of the Victoria HandyDART Centre for use by BC Transit, which will facilitate growth of Victoria’s bus system and support introducing a low-carbon fleet of vehicles that will enhance HandyDART services. |
The public and private sectors will provide about $8.0 billion for transportation operating and capital investments over the next three years, including:
| • | $6.4 billion of provincial investment in transportation infrastructure; and |
| • | $1.6 billion of investment leveraged through federal cost sharing and partnerships with private organizations, local governments and other agencies. |
Table 1.7 Provincial Transportation Investments
| | | Updated
Forecast
2021/22 | | | Budget
Estimate
2022/23 | | | Plan
2023/24 | | | Plan
2024/25 | | | Fiscal Plan
Total | |
| Provincial investments: | | | | | | | | | | | | | | | | | | | | |
| – Highway corridor rehabilitation | | | 305 | | | | 343 | | | | 232 | | | | 233 | | | | 808 | |
| – Side road improvements | | | 153 | | | | 183 | | | | 119 | | | | 122 | | | | 424 | |
| – Pattullo Bridge replacement | | | 267 | | | | 300 | | | | 206 | | | | 191 | | | | 697 | |
| – Highway 1 to Alberta border | | | 177 | | | | 283 | | | | 277 | | | | 172 | | | | 732 | |
| – Broadway Subway | | | 260 | | | | 411 | | | | 374 | | | | 136 | | | | 921 | |
| –Highway 99 Tunnel Program 1 | | | 34 | | | | 91 | | | | 149 | | | | 318 | | | | 558 | |
| –Transit Infrastructure 2 | | | 119 | | | | 290 | | | | 442 | | | | 316 | | | | 1,048 | |
| – Transportation and Trade Network Reliability | | | 230 | | | | 420 | | | | 397 | | | | 218 | | | | 1,035 | |
| – Safety improvements | | | 45 | | | | 42 | | | | 30 | | | | 30 | | | | 102 | |
| – Community and other programs | | | 22 | | | | 13 | | | | 26 | | | | 19 | | | | 58 | |
| Total provincial investments | | | 1,612 | | | | 2,376 | | | | 2,252 | | | | 1,755 | | | | 6,383 | |
| Investments funded through contributions from other partners | | | 335 | | | | 551 | | | | 521 | | | | 590 | | | | 1,662 | |
| Total investments in transportation infrastructure 3 | | | 1,947 | | | | 2,927 | | | | 2,773 | | | | 2,345 | | | | 8,045 | |
| 1 | Includes the Fraser River Tunnel Project and Highway 99/Steveston Interchange, Transit and Cycling Improvements project. |
| 2 | Includes notional funding for Surrey-Langley SkyTrain. |
| 3 | Total investments include operating and capital spending. |
Ministry Capital Spending
Budget 2022 includes $1.7 billion in capital spending by government ministries over the fiscal plan period. This will support investments in maintaining, upgrading and expanding infrastructure, such as provincial park amenities, courthouses, correctional centres, office buildings and information systems.
Current and planned capital investments made by government ministries include:
| • | A new Nanaimo Correctional Centre will be completed in 2024, replacing the existing 190-bed outdated correctional centre and increasing capacity with a 12-room unit for women. The centre will accommodate culturally responsive programming and is designed to the LEED gold standard. |
| • | As part of the modernization and renewal of the Royal BC Museum, a new collections and research building will break ground in Colwood in 2022 with anticipated completion in 2025. The building will preserve, protect and provide better access to the human and natural history collections of British Columbia. |
Budget and Fiscal Plan - 2022/23 to 2024/25
71
Three Year Fiscal Plan
Capital Project Reserves
The Province has included $245 million in project reserves in its three-year capital plan as a prudent planning measure. In addition to covering risks from unforeseen costs for ministry capital projects, the reserves may be used to fund emerging capital priorities of government ministries.
Financing Capital Projects
Provincial capital infrastructure spending is financed through a combination of sources:
| • | direct borrowing (debt financing); |
| • | cost sharing with partners (e.g. federal government, regional hospital districts); and |
| • | partnerships with the private sector (public-private partnerships, or P3s). |
Self-Supported Capital Spending
Capital investments of self-supported commercial Crown agencies are projected to total almost $12 billion over the fiscal plan period. Self-supported capital investments mainly include:
| | • | $11.3 billion (95 per cent) of total self-supported capital spending is for electrical generation, transmission and distribution projects to meet growing customer demand and to enhance reliability. Included in this total is construction of a third dam and hydroelectric generating station on the Peace River through the Site C project. BC Hydro’s electricity system was largely built in the 1960s, 1970s, and 1980s and B.C.’s population and economy continue to grow. BC Hydro is upgrading and maintaining aging assets and building new infrastructure so that British Columbians continue to receive reliable and clean electricity. |
| • | $313 million will be used for BC Lottery Corporation projects, including replacement of key legacy business systems, expansion of the lottery distribution network, and acquisition of gaming equipment to support lottery, PlayNow internet gaming, casino and community gaming activities. |
| • | $146 million will be used for ICBC projects, including investment in information technology and facility maintenance and upgrades. |
| • | $96 million will be used for Liquor Distribution Branch projects, including investments for updates and improvements to liquor stores, expansion of cannabis stores, technology-related projects and ongoing operating equipment replacements. |
Table 1.8 provides information on major capital projects, and further details on provincial capital investments are shown in the service plans of ministries and Crown agencies.
Budget and Fiscal Plan - 2022/23 to 2024/25
72
Three Year Fiscal Plan
Projects Over $50 Million
Approved major capital projects with multi-year budgets totaling $50 million or more, including provincial funding, are shown in Table 1.8. Annual allocations of the budget for these projects are included as part of the provincial government’s capital investment spending shown in Table 1.6.
In addition to financing through provincial sources, major projects may be cost-shared with the federal government, municipalities and regional districts, and/or the private sector. Total capital spending for these major projects is $46.6 billion, reflecting provincial financing of $41.3 billion, including internal sources and P3 liabilities, as well as $5.3 billion in contributions from the federal government and other sources, including private donations.
Major capital investments include $3.0 billion for K-12 school projects; $982 million for post-secondary institutions; $12.0 billion for health facilities; $11.3 billion for major transportation capital infrastructure; $924 million for projects in other sectors; $18.4 billion for power generation and transmission capital projects by BC Hydro; and $92 million for ICBC’s Enhanced Care Coverage Program.
Since the Second Quarterly Report, the British Columbia Institute of Technology – Trades and Technology Complex project ($163 million) was added to the table.
BC Hydro’s Bridge River 2 units 5 and 6 upgrade project has been completed and is no longer listed in the table.
Other changes since the Second Quarterly Report include:
| • | Sheffield Elementary project’s name changed to Coast Salish Elementary; |
| • | Cowichan Secondary’s anticipated total project cost increased from $82 million to $86 million to reflect updated costing. Internal borrowing increased from $80 million to $84 million; |
| • | University of Victoria – Engineering and Computer Science Building Expansion project’s year of completion was amended from 2023 to 2024 to reflect the revised project schedule; |
| • | Highway 1 Quartz Creek Bridge Replacement project’s year of completion was amended from 2023 to 2024 to reflect the revised project schedule; |
| • | Highway 1 R.W. Bruhn Bridge project’s year of completion was amended from 2023 to 2025 to reflect the revised project schedule; |
| • | Highway 99 Improvements/Steveston Interchange project’s name changed to Highway 99/Steveston Interchange, Transit and Cycling Improvements; |
| • | George Massey Crossing project’s name changed to Fraser River Tunnel Project; |
| • | 6585 Sussex Ave – Affordable Rental Housing project’s year of completion was amended from 2021 to 2022 to reflect the revised project schedule; |
| • | BC Hydro’s South Fraser transmission relocation project’s anticipated total cost and internal borrowing amounts decreased from $76 million to $27 million to reflect the revised project cost; |
Budget and Fiscal Plan - 2022/23 to 2024/25
73
Three Year Fiscal Plan
| • | Supply Chain Applications project’s anticipated total cost decreased from $69 million to $68 million due to a shorter system stabilization period than forecast; |
| • | Bridge River 2 upgrade units 7 and 8 project’s anticipated total cost decreased from $85 million to $78 million due to cost savings and incorporating project efficiencies learned from the Bridge River upgrade units 5 and 6 project; |
| • | Downtown Vancouver Electricity Supply: West End strategic property purchase project’s year of completion was amended from 2021 to 2022 due to a delay in acquiring rights-of-way; and |
| • | ICBC’s Enhanced Care Coverage Program’s anticipated total project capital cost decreased from $93 million to $92 million based on the nature of the remaining work. |
Budget and Fiscal Plan - 2022/23 to 2024/25
74
Three Year Fiscal Plan
Table 1.8 Capital Expenditure Projects Greater Than $50 million 1
Note: Information in bold type denotes changes from the 2021/22 Second Quarterly Report released on November 22, 2021.
| | | | | | Project | | | Estimated | | | Anticipated | | | Project Financing | |
| ($ millions) | | Year of
Completion | | | Cost to
Dec. 31, 2021 | | | Cost to
Complete | | | Total
Cost | | | Internal/
Borrowing | | | P3
Liability | | | Federal
Gov’t | | | Other
Contrib’ns | |
| | | | | | Taxpayer-supported | | | | | | | | | | | | | | | | |
| Schools | | | | | | | | | | | | | | | | | | | | | | | | |
| Centennial Secondary 2 | | 2017 | | | | 59 | | | | 2 | | | | 61 | | | | 61 | | | | — | | | | — | | | | — | |
| Grandview Heights Secondary 2 | | 2021 | | | | 74 | | | | 9 | | | | 83 | | | | 63 | | | | — | | | | — | | | | 20 | |
| New Westminster Secondary 2 | | 2021 | | | | 89 | | | | 18 | | | | 107 | | | | 107 | | | | — | | | | — | | | | — | |
| Handsworth Secondary | | 2022 | | | | 61 | | | | 8 | | | | 69 | | | | 69 | | | | — | | | | — | | | | — | |
| Pexsisen Elementary and Centre Mountain Lellum Middle | | 2022 | | | | 48 | | | | 41 | | | | 89 | | | | 89 | | | | — | | | | — | | | | — | |
| Quesnel Junior School | | 2022 | | | | 23 | | | | 29 | | | | 52 | | | | 52 | | | | — | | | | — | | | | — | |
| Coast Salish Elementary | | 2022 | | | | 11 | | | | 41 | | | | 52 | | | | 47 | | | | — | | | | — | | | | 5 | |
| Stitó:s Lá:lém totí:lt Elementary Middle School | | 2022 | | | | 36 | | | | 18 | | | | 54 | | | | 49 | | | | | | | | | | | | 5 | |
| Burnaby North Secondary | | 2023 | | | | 41 | | | | 67 | | | | 108 | | | | 99 | | | | — | | | | — | | | | 9 | |
| Eric Hamber Secondary | | 2023 | | | | 28 | | | | 78 | | | | 106 | | | | 94 | | | | — | | | | — | | | | 12 | |
| Victoria High School | | 2023 | | | | 33 | | | | 47 | | | | 80 | | | | 77 | | | | — | | | | — | | | | 3 | |
| Cowichan Secondary | | 2024 | | | | 7 | | | | 79 | | | | 86 | | | | 84 | | | | | | | | | | | | 2 | |
| Seismic mitigation program 3 | | 2030 | | | | 1,032 | | | | 994 | | | | 2,026 | | | | 2,026 | | | | — | | | | — | | | | — | |
| Total schools | | | | | | 1,542 | | | | 1,431 | | | | 2,973 | | | | 2,917 | | | | — | | | | — | | | | 56 | |
| Post-secondary institutions | | | | | | | | | | | | | | | | | | | | | | | | | | | | | | | |
| Simon Fraser University – Energy Systems Engineering Building 2,4 | | 2019 | | | | 125 | | | | 1 | | | | 126 | | | | 45 | | | | — | | | | 45 | | | | 36 | |
| British Columbia Institute of Technology – Health Sciences Centre for Advanced Simulation | | 2022 | | | | 61 | | | | 27 | | | | 88 | | | | 66 | | | | — | | | | — | | | | 22 | |
| Simon Fraser University – Student Housing | | 2022 | | | | 49 | | | | 55 | | | | 104 | | | | 73 | | | | — | | | | — | | | | 31 | |
| Okanagan College – Student Housing | | 2023 | | | | — | | | | 68 | | | | 68 | | | | 67 | | | | — | | | | — | | | | 1 | |
| University of Victoria – Student Housing | | 2023 | | | | 102 | | | | 127 | | | | 229 | | | | 128 | | | | — | | | | — | | | | 101 | |
| University of Victoria – Engineering and Computer Science Building Expansion | | 2024 | | | | 3 | | | | 87 | | | | 90 | | | | 65 | | | | — | | | | — | | | | 25 | |
| British Columbia Institute of Technology – Student Housing | | 2024 | | | | 2 | | | | 112 | | | | 114 | | | | 108 | | | | — | | | | — | | | | 6 | |
| British Columbia Institute of Technology – Trades and Technology Complex | | 2027 | | | | — | | | | 163 | | | | 163 | | | | 137 | | | | — | | | | — | | | | 26 | |
| Total post-secondary institutions | | | | | | 342 | | | | 640 | | | | 982 | | | | 689 | | | | — | | | | 45 | | | | 248 | |
| Health facilities | | | | | | | | | | | | | | | | | | | | | | | | | | | | | | | |
| Children’s and Women’s Hospital 2 | | | | | | | | | | | | | | | | | | | | | | | | | | | | | | | |
| – Direct procurement | | 2020 | | | | 289 | | | | 9 | | | | 298 | | | | 168 | | | | — | | | | — | | | | 130 | |
| – P3 contract | | 2018 | | | | 368 | | | | — | | | | 368 | | | | 167 | | | | 187 | | | | — | | | | 14 | |
| Royal Columbian Hospital – Phase 1 2 | | 2020 | | | | 245 | | | | 6 | | | | 251 | | | | 242 | | | | — | | | | — | | | | 9 | |
| Red Fish Healing Centre for Mental Health and Addiction - θəqiʔ ɫəwʔənəq leləm 2 | | 2021 | | | | 124 | | | | 7 | | | | 131 | | | | 131 | | | | — | | | | — | | | | — | |
| Vancouver General Hospital – Operating Rooms Renewal – Phase 1 2 | | 2021 | | | | 93 | | | | 9 | | | | 102 | | | | 35 | | | | — | | | | — | | | | 67 | |
| Dogwood Complex Residential Care | | 2022 | | | | 11 | | | | 47 | | | | 58 | | | | — | | | | — | | | | — | | | | 58 | |
| Peace Arch Hospital Renewal | | 2022 | | | | 67 | | | | 24 | | | | 91 | | | | 8 | | | | — | | | | — | | | | 83 | |
| Penticton Regional Hospital – Patient Care Tower | | | | | | | | | | | | | | | | | | | | | | | | | | | | | | | |
| – Direct procurement | | 2022 | | | | 51 | | | | 25 | | | | 76 | | | | 18 | | | | — | | | | — | | | | 58 | |
| – P3 contract | | 2019 | | | | 232 | | | | — | | | | 232 | | | | — | | | | 139 | | | | — | | | | 93 | |
| Lions Gate Hospital – New Acute Care Facility | | 2024 | | | | 4 | | | | 306 | | | | 310 | | | | 144 | | | | — | | | | — | | | | 166 | |
| Stuart Lake Hospital | | 2024 | | | | 5 | | | | 111 | | | | 116 | | | | 98 | | | | — | | | | — | | | | 18 | |
| Royal Inland Hospital Patient Care Tower | | | | | | | | | | | | | | | | | | | | | | | | | | | | | | | |
| – Direct procurement | | 2025 | | | | 20 | | | | 109 | | | | 129 | | | | 39 | | | | — | | | | — | | | | 90 | |
| – P3 contract | | 2022 | | | | 278 | | | | 10 | | | | 288 | | | | — | | | | 164 | | | | — | | | | 124 | |
| Cariboo Memorial Hospital | | 2026 | | | | 4 | | | | 214 | | | | 218 | | | | 131 | | | | — | | | | — | | | | 87 | |
| Health facilities continued on the next page | | | | | | | | | | | | | | | | | | | | | | | | | | | | | | | |

Budget and Fiscal Plan - 2022/23 to 2024/25
75
Three Year Fiscal Plan
Table 1.8 Capital Expenditure Projects Greater Than $50 million 1
Note: Information in bold type denotes changes from the 2021/22 Second Quarterly Report released on November 22, 2021.
| | | | | | Project | | | Estimated | | | Anticipated | | | Project Financing | |
| ($ millions) | | Year of
Completion | | | Cost to
Dec. 31, 2021 | | | Cost to
Complete | | | Total
Cost | | | Internal/
Borrowing | | | P3
Liability | | | Federal
Gov’t | | | Other
Contrib’ns | |
| Health facilities continued | | | | | | | | | | | | | | | | | | | | | | | | | | | | | | | |
| Cowichan District Hospital | | 2026 | | | | 15 | | | | 872 | | | | 887 | | | | 605 | | | | — | | | | — | | | | 282 | |
| Dawson Creek and District Hospital | | 2026 | | | | 3 | | | | 375 | | | | 378 | | | | 247 | | | | — | | | | — | | | | 131 | |
| Mills Memorial Hospital | | 2026 | | | | 98 | | | | 525 | | | | 623 | | | | 513 | | | | — | | | | — | | | | 110 | |
| Royal Columbian Hospital – Phases 2 & 3 | | 2026 | | | | 186 | | | | 1,058 | | | | 1,244 | | | | 1,182 | | | | — | | | | — | | | | 62 | |
| Burnaby Hospital Redevelopment - Phase 1 5 | | 2027 | | | | 14 | | | | 598 | | | | 612 | | | | 578 | | | | — | | | | — | | | | 34 | |
| New Surrey Hospital and Cancer Centre | | 2027 | | | | 2 | | | | 1,658 | | | | 1,660 | | | | 1,660 | | | | — | | | | — | | | | — | |
| St Paul’s Hospital | | 2027 | | | | 30 | | | | 2,144 | | | | 2,174 | | | | 1,327 | | | | — | | | | — | | | | 847 | |
| Richmond Hospital | | 2031 | | | | — | | | | 861 | | | | 861 | | | | 791 | | | | — | | | | — | | | | 70 | |
| Clinical and Systems Transformation | | 2025 | | | | 573 | | | | 130 | | | | 703 | | | | 702 | | | | — | | | | — | | | | 1 | |
| iHealth Project – Vancouver Island Health Authority | | 2025 | | | | 113 | | | | 42 | | | | 155 | | | | 55 | | | | — | | | | — | | | | 100 | |
| Total health facilities | | | | | | 2,825 | | | | 9,140 | | | | 11,965 | | | | 8,841 | | | | 490 | | | | — | | | | 2,634 | |
| Transportation | | | | | | | | | | | | | | | | | | | | | | | | | | | | | | | |
| Highway 91 Alex Fraser Bridge Capacity Improvements 2 | | 2019 | | | | 66 | | | | 4 | | | | 70 | | | | 37 | | | | — | | | | 33 | | | | — | |
| Highway 1 Illecillewaet Four-Laning and Brake Check improvements 2 | | 2021 | | | | 71 | | | | 14 | | | | 85 | | | | 69 | | | | — | | | | 16 | | | | — | |
| Highway 1 Lower Lynn Corridor improvements 2 | | 2021 | | | | 173 | | | | 25 | | | | 198 | | | | 77 | | | | — | | | | 66 | | | | 55 | |
| Highway 99 10-Mile Slide 2 | | 2021 | | | | 70 | | | | 14 | | | | 84 | | | | 84 | | | | — | | | | — | | | | — | |
| Highway 4 Kennedy Hill Safety Improvements | | 2022 | | | | 41 | | | | 13 | | | | 54 | | | | 40 | | | | — | | | | 14 | | | | — | |
| Highway 14 Corridor improvements | | 2022 | | | | 43 | | | | 34 | | | | 77 | | | | 48 | | | | — | | | | 29 | | | | — | |
| Highway 1 Chase Four-Laning | | 2023 | | | | 59 | | | | 161 | | | | 220 | | | | 208 | | | | — | | | | 12 | | | | — | |
| Highway 1 Salmon Arm West | | 2023 | | | | 67 | | | | 88 | | | | 155 | | | | 124 | | | | — | | | | 31 | | | | — | |
| Highway 91 to Highway 17 and Deltaport Way Corridor improvements | | 2023 | | | | 157 | | | | 103 | | | | 260 | | | | 87 | | | | — | | | | 82 | | | | 91 | |
| Kootenay Lake ferry service upgrade | | 2023 | | | | 36 | | | | 49 | | | | 85 | | | | 68 | | | | — | | | | 17 | | | | — | |
| West Fraser Road Realignment | | 2023 | | | | 33 | | | | 70 | | | | 103 | | | | 103 | | | | — | | | | — | | | | — | |
| Highway 1 216th - 264th Street widening | | 2024 | | | | 24 | | | | 211 | | | | 235 | | | | 99 | | | | — | | | | 109 | | | | 27 | |
| Highway 1 Ford Road to Tappen Valley Road Four-Laning | | 2024 | | | | 5 | | | | 238 | | | | 243 | | | | 161 | | | | — | | | | 82 | | | | — | |
| Highway 1 Kicking Horse Canyon Phase 4 6 | | 2024 | | | | 256 | | | | 345 | | | | 601 | | | | 386 | | | | — | | | | 215 | | | | — | |
| Highway 1 Quartz Creek Bridge Replacement | | 2024 | | | | 26 | | | | 95 | | | | 121 | | | | 71 | | | | — | | | | 50 | | | | — | |
| Pattullo Bridge Replacement 7 | | 2024 | | | | 419 | | | | 958 | | | | 1,377 | | | | 1,076 | | | | 301 | | | | — | | | | — | |
| Highway 1 R.W. Bruhn Bridge | | 2025 | | | | 28 | | | | 197 | | | | 225 | | | | 134 | | | | — | | | | 91 | | | | — | |
| Broadway Subway 8 | | 2025 | | | | 633 | | | | 2,194 | | | | 2,827 | | | | 1,380 | | | | 450 | | | | 897 | | | | 100 | |
| Highway 99 / Steveston Interchange, Transit & Cycling Improvements 9, 10 | | 2025 | | | | 2 | | | | 135 | | | | 137 | | | | 137 | | | | — | | | | — | | | | — | |
| Fraser River Tunnel Project 9, 11 | | 2030 | | | | 3 | | | | 4,145 | | | | 4,148 | | | | 4,148 | | | | — | | | | — | | | | — | |
| Total transportation | | | | | | 2,212 | | | | 9,093 | | | | 11,305 | | | | 8,537 | | | | 751 | | | | 1,744 | | | | 273 | |
| Other taxpayer-supported | | | | | | | | | | | | | | | | | | | | | | | | | | | | | | | |
| Nanaimo Correctional Centre Replacement | | 2024 | | | | 29 | | | | 138 | | | | 167 | | | | 167 | | | | — | | | | — | | | | — | |
| 6585 Sussex Ave | | | | | | | | | | | | | | | | | | | | | | | | | | | | | | | |
| (Affordable Rental Housing) | | 2022 | | | | 43 | | | | 32 | | | | 75 | | | | 43 | | | | — | | | | — | | | | 32 | |
| Stanley New Fountain Hotel | | | | | | | | | | | | | | | | | | | | | | | | | | | | | | | |
| (Affordable Rental Housing) | | 2022 | | | | 51 | | | | 18 | | | | 69 | | | | 19 | | | | — | | | | — | | | | 50 | |
| 13583 81st Ave | | | | | | | | | | | | | | | | | | | | | | | | | | | | | | | |
| (Affordable Rental Housing) | | 2023 | | | | 19 | | | | 31 | | | | 50 | | | | 37 | | | | — | | | | — | | | | 13 | |
| Crosstown | | | | | | | | | | | | | | | | | | | | | | | | | | | | | | | |
| (Supportive Housing Fund and Community Housing Fund) | | 2023 | | | | 7 | | | | 65 | | | | 72 | | | | 61 | | | | — | | | | — | | | | 11 | |
| 58 W Hastings | | | | | | | | | | | | | | | | | | | | | | | | | | | | | | | |
| (Supportive Housing Fund) | | 2024 | | | | 1 | | | | 157 | | | | 158 | | | | 61 | | | | — | | | | 19 | | | | 78 | |
| Clark & 1st Ave | | | | | | | | | | | | | | | | | | | | | | | | | | | | | | | |
| (Affordable Rental Housing) | | 2024 | | | | 7 | | | | 102 | | | | 109 | | | | 75 | | | | — | | | | — | | | | 34 | |
| Royal BC Museum – | | | | | | | | | | | | | | | | | | | | | | | | | | | | | | | |
| Collections and Research Building | | 2025 | | | | 19 | | | | 206 | | | | 224 | | | | 224 | | | | — | | | | — | | | | — | |
| Total other | | | | | | 176 | | | | 749 | | | | 924 | | | | 687 | | | | — | | | | 19 | | | | 218 | |
| Total taxpayer-supported | | | | | | 7,097 | | | | 21,053 | | | | 28,149 | | | | 21,671 | | | | 1,241 | | | | 1,808 | | | | 3,429 | |
Budget and Fiscal Plan - 2022/23 to 2024/25
76
Three Year Fiscal Plan
Table 1.8 Capital Expenditure Projects Greater Than $50 million 1
Note: Information in bold type denotes changes from the 2021/22 Second Quarterly Report released on November 22, 2021.
| | | | | | Project | | | Estimated | | | Anticipated | | | Project Financing | |
| ($ millions) | | Year of
Completion | | | Cost to
Dec. 31, 2021 | | | Cost to
Complete | | | Total
Cost | | | Internal/
Borrowing | | | P3
Liability | | | Federal
Gov’t | | | Other
Contrib’ns | |
| Power generation and transmission | | | | | | | | | | | | | | | | | | | | | | | | | | | | | | | |
| BC Hydro | | | | | | | | | | | | | | | | | | | | | | | | | | | | | | | |
| – John Hart generating station replacement 2 | | 2019 | | | | 978 | | | | 1 | | | | 979 | | | | 979 | | | | — | | | | — | | | | — | |
| – South Fraser transmission relocation project 12 | | TBD | | | | 27 | | | | — | | | | 27 | | | | 27 | | | | — | | | | — | | | | — | |
| – Supply Chain Applications project 2 | | 2020 | | | | 68 | | | | — | | | | 68 | | | | 68 | | | | — | | | | — | | | | — | |
| – Fort St. John and Taylor Electric Supply 2 | | 2020 | | | | 51 | | | | 1 | | | | 52 | | | | 52 | | | | — | | | | — | | | | — | |
| – UBC load increase stage 2 project 2 | | 2020 | | | | 52 | | | | 4 | | | | 56 | | | | 56 | | | | — | | | | — | | | | — | |
| – Peace Region Electricity Supply (PRES) project 2,13 | | 2021 | | | | 214 | | | | 2 | | | | 216 | | | | 216 | | | | — | | | | TBD | | | | — | |
| – LNG Canada load interconnection project 2 | | 2021 | | | | 79 | | | | 3 | | | | 82 | | | | 58 | | | | — | | | | — | | | | 24 | |
| – Bridge River 2 upgrade units 7 and 8 project 2 | | 2021 | | | | 71 | | | | 7 | | | | 78 | | | | 78 | | | | — | | | | — | | | | — | |
| – Downtown Vancouver Electricity Supply: West End strategic property purchase | | 2022 | | | | 68 | | | | 13 | | | | 81 | | | | 81 | | | | — | | | | — | | | | — | |
| – Wahleach refurbish generator project | | 2022 | | | | 35 | | | | 16 | | | | 51 | | | | 51 | | | | — | | | | — | | | | — | |
| – Mica replace units 1 to 4 generator transformers project | | 2022 | | | | 57 | | | | 23 | | | | 80 | | | | 80 | | | | — | | | | — | | | | — | |
| – G.M. Shrum G1 to 10 control system upgrade | | 2022 | | | | 60 | | | | 15 | | | | 75 | | | | 75 | | | | — | | | | — | | | | — | |
| – Mount Lehman substation upgrade project | | 2023 | | | | 40 | | | | 18 | | | | 58 | | | | 58 | | | | — | | | | — | | | | — | |
| – Street light replacement program | | 2023 | | | | 27 | | | | 48 | | | | 75 | | | | 75 | | | | — | | | | — | | | | — | |
| – 5L063 Telkwa relocation project | | 2023 | | | | 25 | | | | 41 | | | | 66 | | | | 66 | | | | — | | | | — | | | | — | |
| – Mica modernize controls project | | 2023 | | | | 37 | | | | 19 | | | | 56 | | | | 56 | | | | — | | | | — | | | | — | |
| – Capilano substation upgrade project | | 2024 | | | | 26 | | | | 61 | | | | 87 | | | | 87 | | | | — | | | | — | | | | — | |
| – Vancouver Island radio system project | | 2024 | | | | 31 | | | | 22 | | | | 53 | | | | 53 | | | | — | | | | — | | | | — | |
| – Sperling substation (SPG) metalclad switchgear replacement project | | 2025 | | | | 11 | | | | 43 | | | | 54 | | | | 54 | | | | — | | | | — | | | | — | |
| – Natal - 60-138 kV switchyard upgrade project | | 2025 | | | | 5 | | | | 79 | | | | 84 | | | | 84 | | | | — | | | | — | | | | — | |
| – Site C project 14 | | 2025 | | | | 8,359 | | | | 7,641 | | | | 16,000 | | | | 16,000 | | | | — | | | | — | | | | — | |
| Total power generation and transmission | | | | | | 10,321 | | | | 8,057 | | | | 18,378 | | | | 18,354 | | | | — | | | | — | | | | 24 | |
| Other self-supported | | | | | | | | | | | | | | | | | | | | | | | | | | | | | | | |
| Enhanced Care Coverage Program (ICBC) | | 2022 | | | | 91 | | | | 1 | | | | 92 | | | | 92 | | | | — | | | | — | | | | — | |
| Total self-supported | | | | | | 10,412 | | | | 8,058 | | | | 18,470 | | | | 18,446 | | | | — | | | | — | | | | 24 | |
| Total $50 million projects | | | | | | 17,509 | | | | 29,111 | | | | 46,619 | | | | 40,117 | | | | 1,241 | | | | 1,808 | | | | 3,453 | |
| 1 | Only projects that receive provincial funding and have been approved by Treasury Board and/or Crown corporation boards are included in this table. Ministry service plans may highlight projects that still require final approval. Capital costs reflect current government accounting policy. |
| 2 | Assets have been put into service and only trailing costs remain. |
| 3 | The Seismic Mitigation Program consists of all spending to date on Phase 2 of the program and may include spending on projects greater than $50 million included in the table above. |
| 4 | Simon Fraser University and private donors contributed $26 million toward the project, and the university also contributed land valued at $10 million. |
| 5 | The concept plan for Phase 2 of the Burnaby Hospital Redevelopment has been approved. Financial information will be added to the table upon business case approval. |
| 6 | Kicking Horse Canyon Project costs exclude $11 million of past planning costs which are expensed. |
| 7 | Pattullo Bridge forecasted to open to the public in 2024 with old bridge decommissioning to follow. Forecasted amount reflects total expenditures including capitalized and expensed items. |
| 8 | The Broadway Subway Project forecast and value of costs incurred to date include the City of Vancouver in-kind contribution of land rights, in keeping with the approved project budget. Under current government accounting, purchased intangible assets are given accounting recognition, and contributed intangible assets, such as land use rights or licenses are not. |
| 9 | Project is part of the Highway 99 Tunnel Program. |
| 10 | Previously shown as the Highway 99 Improvements/Steveston Interchange project. |
| 11 | Previously shown as the George Massey Crossing project. The Fraser River Tunnel is forecasted to open to the public in 2030 with the removal of the existing tunnel to follow. |
| 12 | The anticipated total cost was previously reported as $76 million. As a result of the announcement regarding Government’s Fraser River Tunnel Project on August 18, 2021, BC Hydro is reassessing crossing options. Once this reassessment is complete, a revised estimate of the anticipated total cost for the resulting project will be provided. |
| 13 | The total cost represents the gross cost of the project and has not been netted for Federal Government contributions. The Federal Government’s contribution amount is dependent on the final actual project costs and what costs are eligible under the agreement. |
| 14 | The approved updated project cost estimate is $16 billion, with a project full in-service date of 2025 (first unit of power in-service December 2024). The anticipated project cost and cost to date include capital costs, charges subject to regulatory deferral and certain operating expenditures. |
Budget and Fiscal Plan - 2022/23 to 2024/25
77
Three Year Fiscal Plan
Provincial Debt
Table 1.9 Provincial Debt Summary1
| | | Updated | | | Budget | | | | | | | |
| | | Forecast | | | Estimate | | | Plan | | | Plan | |
| ($ millions unless otherwise indicated) | | 2021/22 | | | 2022/23 | | | 2023/24 | | | 2024/25 | |
| Taxpayer-supported debt | | | | | | | | | | | | | | | | |
| Provincial government | | | | | | | | | | | | | | | | |
| Operating | | | 5,719 | | | | 10,411 | | | | 12,644 | | | | 13,741 | |
| Capital 2 | | | 37,058 | | | | 40,573 | | | | 44,578 | | | | 49,360 | |
| Total provincial government | | | 42,777 | | | | 50,984 | | | | 57,222 | | | | 63,101 | |
| Taxpayer-supported entities | | | | | | | | | | | | | | | | |
| BC Transportation Financing Authority | | | 14,956 | | | | 17,512 | | | | 20,262 | | | | 22,479 | |
| Health Authorities and Hospital Societies | | | 1,869 | | | | 1,831 | | | | 1,787 | | | | 1,739 | |
| Post Secondary institutions | | | 899 | | | | 888 | | | | 966 | | | | 950 | |
| Social Housing 3 | | | 958 | | | | 1,932 | | | | 2,665 | | | | 2,113 | |
| Other | | | 272 | | | | 328 | | | | 400 | | | | 465 | |
| Total taxpayer-supported entities | | | 18,954 | | | | 22,491 | | | | 26,080 | | | | 27,745 | |
| Total taxpayer-supported debt | | | 61,731 | | | | 73,475 | | | | 83,302 | | | | 90,846 | |
| Self-supported debt | | | 28,814 | | | | 30,956 | | | | 33,004 | | | | 33,930 | |
| Total debt before forecast allowance | | | 90,545 | | | | 104,431 | | | | 116,306 | | | | 124,776 | |
| Forecast allowance 4 | | | 1,000 | | | | 1,000 | | | | 1,000 | | | | 1,000 | |
| Total provincial debt | | | 91,545 | | | | 105,431 | | | | 117,306 | | | | 125,776 | |
| Taxpayer-supported debt to GDP ratio | | | 17.8 | % | | | 20.0 | % | | | 21.8 | % | | | 22.8 | % |
| Total provincial debt to GDP ratio | | | 26.3 | % | | | 28.7 | % | | | 30.6 | % | | | 31.6 | % |
| Taxpayer-supported debt per capita ($) | | | 11,838 | | | | 13,823 | | | | 15,418 | | | | 16,562 | |
| Taxpayer-supported interest bite (cents per dollar of revenue) | | | 2.8 | | | | 3.0 | | | | 3.4 | | | | 3.7 | |
| 1 | Provincial debt is prepared in accordance with Generally Accepted Accounting Principles and presented consistent with the Debt Summary Report included in the Public Accounts . Debt is shown net of sinking funds and unamortized discounts, excludes accrued interest, and includes non-guaranteed debt directly incurred by commercial Crown corporations and debt guaranteed by the Province. |
| 2 | Includes debt incurred by the government to fund the building of capital assets in the education, health, social housing and other sectors. |
| 3 | Includes the BC Housing Management Commission and the Provincial Rental Housing Corporation. BC Housing Management Commission has been approved for up to $2 billion for future borrowing to fund investments in affordable housing through HousingHub. The debt forecast reflects projects that have been approved as of December 2021. |
| 4 | Reflects the operating statement forecast allowance for each year (amounts are not cumulative). Since it is unknown as to which agency would require this debt, the forecast allowance is shown as a separate item over the plan. |
Government obtains financing from outside sources mainly through debt instruments that are to be repaid on future dates. Total provincial debt is projected to increase by $34.2 billion over the fiscal plan period to reach $125.8 billion by 2024/25.
Taxpayer-supported debt is forecast to increase by $29.1 billion to $90.8 billion by 2024/25 to finance the annual operating deficits and to fund significant investments in capital infrastructure over the next three years, including $4.2 billion borrowed for education projects (K-12 and post-secondary), $5.6 billion for health facilities, $7.7 billion for transportation sector projects, $1.9 billion for social housing and $1.7 billion for other service delivery agencies and general government.
Increasing debt levels are expected to result in increased debt metrics, with taxpayer-supported debt-to-GDP rising from 17.8% in 2021/22 to 22.8% at the end of the fiscal plan period. Despite the projected increase, B.C.’s debt metrics have improved significantly from Budget 2021 due to a significantly reduced deficit in 2021/22 (see Chart 1.4).
Budget and Fiscal Plan - 2022/23 to 2024/25
78
Three Year Fiscal Plan
The Province’s operating results have generally been better than forecast, reflecting the prudence built into the budget and fiscal plan; as a result, actual debt levels have been lower than projected. Furthermore, changes in the timing of capital project spending may reduce borrowing requirements and debt needed to fund capital investments in the near term.
The self-supported debt of commercial Crown corporations is forecast to increase by $5.1 billion over the fiscal plan period, ending at $33.9 billion. This increase is mainly for capital investments related to improving and expanding British Columbia’s hydroelectric generation assets.
In spite of the debt level increase, debt servicing costs remain at a historically low level due to prevailing low interest rates. A common metric of affordability is the interest bite, or the taxpayer-supported interest costs as a percentage of revenue, which is forecast at 2.8 per cent in 2021/22 and 3.7 per cent by 2024/25.
Chart 1.4 Debt to GDP

Chart 1.5 Debt Affordability
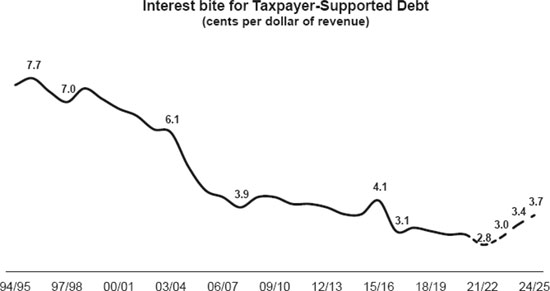
Government’s borrowing requirements over the fiscal plan period are anticipated to total $49.4 billion, which will finance government’s operating and capital investments, as well as refinancing of debt maturities (see Table 1.10).
Table 1.10 Provincial Borrowing Requirements
| | | Updated | | | Budget | | | | | | | |
| | | Forecast | | | Estimate | | | Plan | | | Plan | |
| ($ millions) | | 2021/22 | | | 2022/23 | | | 2023/24 | | | 2024/25 | |
| Total provincial debt1 at beginning of year | | | 87,100 | | | | 91,545 | | | | 105,431 | | | | 117,306 | |
| New borrowing 2 | | | 8,025 | | | | 19,013 | | | | 16,402 | | | | 13,994 | |
| Direct borrowing by Crown corporations and agencies | | | 449 | | | | 31 | | | | 90 | | | | 2 | |
| Retirement of debt 3 | | | (5,029 | ) | | | (5,158 | ) | | | (4,617 | ) | | | (5,526 | ) |
| Change in forecast allowance | | | 1,000 | | | | — | | | | — | | | | — | |
| Net change in total debt | | | 4,445 | | | | 13,886 | | | | 11,875 | | | | 8,470 | |
| Total provincial debt1 at year end | | | 91,545 | | | | 105,431 | | | | 117,306 | | | | 125,776 | |
| Annual growth in debt (per cent) | | | 5.1 | | | | 15.2 | | | | 11.3 | | | | 7.2 | |
| 1 | Provincial debt is prepared in accordance with Generally Accepted Accounting Principles and presented consistent with the Debt Summary Report included in the Public Accounts . Debt is shown net of sinking funds and unamortized discounts, excludes accrued interest, and includes non-guaranteed debt directly incurred by commercial Crown corporations and debt guaranteed by the Province. |
| 2 | New long-term borrowing plus net change in short-term debt. |
| 3 | Sinking fund contributions, sinking fund earnings and net maturities of long-term debt (after deduction of sinking fund balances for maturing issues). |
Budget and Fiscal Plan - 2022/23 to 2024/25
79
Three Year Fiscal Plan
Total provincial debt is presented consistent with the Debt Summary Report included in the Public Accounts. Debt is shown net of sinking fund investments and unamortized discounts, excludes accrued interest, and includes non-guaranteed debt directly incurred by commercial Crown corporations and debt guaranteed by the Province. The reconciliation between provincial debt and the financial statement debt is shown in Appendix Table A16.
Additional details on government’s outstanding debt are provided in Appendix Tables A17 to A19.
Relationship Between Surplus (Deficit) and Debt
In addition to operating results, the change in debt is affected by cash balance changes and other working capital changes, as well as the debt financing requirements of government’s capital plan. Table 1.11 reconciles the forecast deficits with changes in debt.
Table 1.11 Provincial Debt Changes
| | | Updated | | | Budget | | | | | | | |
| | | Forecast | | | Estimate | | | Plan | | | Plan | |
| ($ millions) | | 2021/22 | | | 2022/23 | | | 2023/24 | | | 2024/25 | |
| Total provincial debt1 at beginning of year | | | 87,100 | | | | 91,545 | | | | 105,431 | | | | 117,306 | |
| Taxpayer-supported debt changes | | | | | | | | | | | | | | | | |
| Annual deficit | | | 483 | | | | 5,461 | | | | 4,182 | | | | 3,181 | |
| Non-cash items | | | (2,619 | ) | | | (2,813 | ) | | | (3,001 | ) | | | (3,068 | ) |
| Changes in cash balances 2 | | | (3,271 | ) | | | (599 | ) | | | 79 | | | | 126 | |
| Changes in other working capital balances 3 | | | 231 | | | | 416 | | | | (766 | ) | | | (1,510 | ) |
| Taxpayer-supported capital spending | | | 7,157 | | | | 9,279 | | | | 9,333 | | | | 8,815 | |
| Annual change in total taxpayer-supported debt | | | 1,981 | | | | 11,744 | | | | 9,827 | | | | 7,544 | |
| Self-supported debt changes | | | | | | | | | | | | | | | | |
| Net operating cash flows | | | (2,364 | ) | | | (2,232 | ) | | | (2,389 | ) | | | (2,218 | ) |
| Commercial crown capital spending | | | 3,828 | | | | 4,374 | | | | 4,437 | | | | 3,144 | |
| Annual change in total self-supported debt | | | 1,464 | | | | 2,142 | | | | 2,048 | | | | 926 | |
| Annual change in forecast allowance | | | 1,000 | | | | — | | | | — | | | | — | |
| Annual change in total provincial debt | | | 4,445 | | | | 13,886 | | | | 11,875 | | | | 8,470 | |
| Total provincial debt1 at year end | | | 91,545 | | | | 105,431 | | | | 117,306 | | | | 125,776 | |
| 1 | Provincial debt is prepared in accordance with Generally Accepted Accounting Principles and presented consistent with the Debt Summary Report included in the Public Accounts . Debt is shown net of sinking funds and unamortized discounts, excludes accrued interest, and includes non-guaranteed debt directly incurred by commercial Crown corporations and debt guaranteed by the Province. |
| 2 | Changes in cash balances include all cash balances from the Consolidated Revenue Fund, School Districts, Universities, Colleges, Health Authorities, Hospital Societies and other taxpayer-supported agencies. |
| 3 | Changes in other working capital balances include changes in accounts receivables, accounts payable, accrued liabilities, deferred revenue, investments, restricted assets and other assets. |
Budget and Fiscal Plan - 2022/23 to 2024/25
80
Three Year Fiscal Plan
Risks to the Fiscal Plan
Table 1.12 provides the estimated fiscal impacts of the identified sensitivities for some of the key variables in the fiscal plan projections on an individual basis. However, inter-relationships between the variables may cause the actual variances to be higher or lower than the estimates shown in the table. For example, an increase in the US/CDN dollar exchange rate may be partly offset by higher commodity prices.
The assumptions and risk sensitivities for individual revenue sources and major program areas can be found in Appendix Tables A5 and A6, beginning on page 160.
Table 1.12 Key Fiscal Sensitivities
| Variable | | Increases of | | ($ millions)
Annual Fiscal Impact |
| Nominal GDP | | 1% | | $200 – $300 |
| Lumber prices (US$/thousand board feet) | | $50 | | $100 – $150 1 |
| Natural gas prices (Cdn$/gigajoule) | | 25 cents | | $130 – $150 2 |
| US exchange rate (US cent/Cdn $) | | 1 cent | | -$25 to -$50 |
| Interest rates | | 1 percentage point | | -$185 |
| Debt | | $500 million | | -$11 to -$13 |
| 1 | Sensitivity relates to stumpage revenue only. |
| 2 | Sensitivities can vary significantly especially at lower prices. |
Own Source Revenue
The main areas that may affect own source revenue forecasts are B.C.’s overall economic performance, the relative health of its major trading partners, the exchange rate and commodity prices.
Revenues are sensitive to economic performance. For example, taxation and other revenue sources are driven by economic factors, such as household income, consumer expenditures, housing starts, employment, population growth and the exchange rate. The revenue forecast contained in the fiscal plan is based on the economic forecast detailed in Part 3: British Columbia Economic Review and Outlook. As well, it incorporates commodity price forecasts developed by the Ministry of Forests and the Ministry of Energy, Mines and Low Carbon Innovation based on private sector information.
The continuation of investment incentives provided over the four years starting in 2019/20 due to B.C. joining with the federal government to enhance competitiveness assumes a behavioural response from businesses in acquisition of capital assets. Changes in the timing or strength of the B.C. business response could result in different impacts. Income-tax revenue forecasts are based on projections of household income and net operating surpluses of corporations. The forecasts are updated from reports on tax assessments provided by the Canada Revenue Agency. As a result, revenue estimates and tax credits can be affected by timing lags in the reporting of current and prior year tax assessments by the Canada Revenue Agency as well as the federal government estimates of national taxable income.
Budget and Fiscal Plan - 2022/23 to 2024/25
81
Three Year Fiscal Plan
Natural resource revenues in British Columbia can also be volatile, largely due to the influence of the cyclical natural resource sector in the economy and the effects of the old growth strategy and the recent Supreme Court of B.C. decision on stakeholders. Changes in commodity prices, such as natural gas, lumber or coal may have a significant effect on natural resource revenues and economic growth.
Recently, the Supreme Court of B.C. issued a decision ruling that the cumulative impacts of industrial development, authorized by the Province of British Columbia, infringed Blueberry River First Nations’ ability to exercise their Treaty 8 rights. The impact of this judgement on the Province’s economic and fiscal outlooks are uncertain at this point, as the process for permitting industrial development in the impacted area over the long term is still being negotiated. There is uncertainty of the impacts on B.C.’s forest industry, First Nations and other sectors from the implementation of the old growth deferral strategy announced in the fall. There are risks to the natural resource revenue forecast from these developments, depending on the long-term reaction of affected industries and First Nations.
The economic and revenue forecasts could be affected by trade related issues, such as the ongoing U.S.-Canada softwood lumber dispute. The imposition of countervailing and anti-dumping duties by the U.S. on Canadian softwood lumber exports has the effects of increasing market uncertainty and volatility as well as increasing costs for Canadian producers. B.C. disagrees with the views that the lumber industry is subsidized or that it sells lumber into the U.S. at below cost or sales value in Canada, and is supporting the federal government in its appeals of the application of duties to the World Trade Organization and under Chapter 19 of the North American Free Trade Agreement and under Chapter 10 of the Canada US Mexico Free Trade Agreement.
Over the fiscal plan period, the outlook for forest revenue incorporates declining stumpage rates and rising interest rates. The impacts of the mountain pine beetle infestation, forest fires and the old-growth deferral strategy have reduced the supply of timber available to the forest industry. In addition, the industry continues to pay duties on their exports of softwood lumber products into the United States. As a result, some B.C. communities and residents that are reliant on the forest sector have been adversely affected by the continuing uncertainty and volatility. Actual results for a number of factors including assumptions for lumber prices, harvest volumes, interest and exchange rates could pose risks to the fiscal plan.
Details on major assumptions and sensitivities resulting from changes to those assumptions are outlined in Appendix Table A5.
Federal Government Contributions
Potential policy changes regarding federal government allocations, including health and social transfers and cost-sharing agreements, could affect the revenue and the expenditure forecasts. The expense incorporates preliminary estimates of the cost associated with the severe flooding experienced in November 2021. However, the forecast of federal government contributions does not include any support for these costs. Revenues could be higher depending on the timing of the determination of the expenses by the province and federal validation.
Budget and Fiscal Plan - 2022/23 to 2024/25
82
Three Year Fiscal Plan
Crown Corporations
Crown corporations provided financial forecasts and statements of assumptions approved by their boards, which were used to prepare the fiscal plan. These forecasts, along with further details on assumptions and risks, are also included in the service plans of these corporations and agencies, being released with the budget.
SUCH Sector
The fiscal plan incorporates three-year projections for school districts, post-secondary institutions, and health authorities, based on plans submitted by those entities.
Health authorities have submitted an overall balanced financial plan for 2022/23 to 2024/25. The individual plans have been signed off by the board chairs of the respective health authorities. The Ministry of Health will continue to work with the health authorities to manage any emerging revenue and spending pressures.
Forecasts for the universities, colleges, and institutions have been signed off by chairs of the board or audit committee and lead financial officers.
Forecasts for the combined school districts have been compiled by the Ministry of Education and Child Care based on the requirements of the School Act, the current year plans developed by the school districts, and ministry policy assumptions respecting future funding allocations. Variances from these assumptions could impact the fiscal plan.
Spending
Government funds several demand-driven programs, including those delivered through third-party delivery agencies, such as health care, K-12 and post-secondary education, income assistance and community social services. The budgets for these programs reflect reasonable estimates of demand and other factors such as price inflation. If demand is higher than estimated, this will result in a spending pressure to be managed.
The spending plans for the Ministry of Forests and the Ministry of Public Safety and Solicitor General include base amounts to fight wildfires and deal with floods and other public emergencies. Unanticipated or unpredictable occurrences may affect expenses in these ministries.
Increasing levels of debt result in a higher potential impact from the risk of interest rate increases.
Details on major assumptions and sensitivities resulting from changes to those assumptions are shown in Appendix Table A7 and in ministry service plans.
Capital Risks
The capital spending forecasts included in the fiscal plan may be affected by subsequent planning (i.e. design development) and procurement activities (i.e. receipt/review of construction bids) resulting in project costs that are higher than the initial approved budgets. For large capital projects, government will review the budget and scope risks, and the strategies to mitigate these risks.
Budget and Fiscal Plan - 2022/23 to 2024/25
83
Three Year Fiscal Plan
Other risks affecting capital spending forecasts include:
| • | changes in the timing of capital project spending, which may reduce borrowing requirements and debt needed to fund capital investments in the near term; |
| • | weather and geotechnical conditions, including the outcome of environmental impact studies, causing project delays and/or unexpected costs; |
| • | changes in market conditions, including service demand, the impact of inflation on building material costs, the availability of, and wage rates for, skilled workers, and borrowing costs; |
| • | the accuracy of capital project budget and construction schedule forecasts; |
| • | the successful negotiation/timing of cost-sharing agreements with the federal government and other funding partners; and |
| • | the timing and outcomes of public-private sector partnership negotiations. |
Pending Litigation
The spending plan for the Ministry of the Attorney General contains provisions for payments under the Crown Proceeding Act based on estimates of expected claims, judgments and related costs of settlements likely to be incurred. Litigation developments may occur that are beyond the assumptions used in the plan (for example, higher-than-expected volumes, or size of claim amounts and timing of judgments and settlements). These developments may affect government revenues and/or expenditures in other ministries. Litigation may also impact government agencies and corporations.
Write-downs and Other Adjustments
Ministry budgets provide for anticipated levels of asset or loan write-downs where these expenses can be reasonably estimated. The overall spending forecast does not make allowance for extraordinary items other than the amount provided in the contingencies vote.
Prudence and Risk
The economic, financial, and external variables and factors that impact the estimates of revenues, expenditures, capital spending and debt will change throughout the year as new information becomes available with potentially material impacts. As a result, the actual operating surplus/deficit, capital expenditure and debt figures may differ from the current forecast. Government will continue to update the fiscal plan throughout the year.
Government incorporates four main levels of prudence to help mitigate risks to the budget plan projections. These prudence measures generally have resulted in government positively exceeding its budget targets.
| • | The Budget 2022 economic outlook is lower than the average of the forecasts provided by the members of the Economic Forecast Council (EFC). The Budget 2022 plan assumes annual real GDP growth of 4.0 per cent in 2022, 2.5 per cent in 2023, and range between 2.1 per cent and 2.4 per cent annually over the 2024 to 2026 period. This is lower than the EFC average by 0.2 percentage points in 2022, 2023 and 2024. The prudent outlook compared to the private sector acknowledges the downside risks to the economic forecast over the forecast horizon. |
Budget and Fiscal Plan - 2022/23 to 2024/25
84
Three Year Fiscal Plan
| • | The Budget 2022 natural gas price forecast is lower than the private sector average over the next three years, reflecting the recommendation of Dr. Tim O’Neill in 2013 to adopt more caution in preparing the natural gas royalty forecast. Over the ensuing three years, the Budget 2022 natural gas price projection averages 32 cents lower than the average of the private sector forecasters (see Appendix Table A6 for details). |
| • | Budget 2022 includes higher than normal forecast allowances, recognizing the increased forecasting uncertainty, with $1.0 billion in each year of the fiscal plan. The forecast allowance helps offset the impacts of revenue volatility and statutory spending such as additional costs to fight wildfires and to deal with floods and other public emergencies. |
| • | The Budget 2022 expense forecast includes a General Programs Contingencies allocation of $2.8 billion in 2022/23, $3.4 billion in 2023/24 and $4.0 million 2024/25. The contingencies allocation is a prudent measure to provide for unforeseen and unbudgeted costs that may arise, and to fund priority initiatives as well as CleanBC. Higher than normal contingency provisions is in recognition of the expected flood-related costs and public sector wage negotiations. In addition, Budget 2022 includes Pandemic Recovery Contingencies of $2.0 billion in 2022/23 and $1.0 billion in 2023/24. |
The EFC provides advice to the Minister of Finance annually on issues facing the global economy and B.C.’s economic outlook, including areas of concern, risks and opportunities for the B.C. economy. The Minister of Finance receives advice from staff and colleagues on the various levels of prudence incorporated in the fiscal plan, tax policy initiatives for consideration and the potential risks that could arise over the next three years. Since the risks could be ongoing or one-time in nature and could impact both revenues and expenditures, consideration is given to both the forecast allowance and contingencies vote allocations. However, since a number of these risks are not readily quantifiable, there is no specific formulaic approach in the determination of the forecast allowance and contingencies vote allocations.
Budget and Fiscal Plan - 2022/23 to 2024/25
85

PART 2 | TAX MEASURES
Table 2.1 Summary of Tax Measures
| | | | | | Taxpayer Impacts | |
| | | | Effective Date | | 2022/23 | | | | 2023/24 | |
| | | | | | ($ millions) | |
| Income Tax Act | | | | | | | | | |
| • | Extend scientific research and experimental development tax credit | | September 1, 2022 | | (120 | ) | | | (216 | ) |
| • | Extend training tax credits | | January 1, 2023 | | (6 | ) | | | (22 | ) |
| • | Extend shipbuilding and ship repair industry tax credit | | January 1, 2023 | | * | | | | (1 | ) |
| • | Introduce temporary clean buildings tax credit | | February 23, 2022 | | (2 | ) | | | (20 | ) |
| | | | | | | | | | | |
| Small Business Venture Capital Act | | | | | | | | | |
| • | Increase equity tax credit budget by $2.5 million per year for investments in eligible | | 2022 tax year | | (3 | ) | | | (3 | ) |
| | clean technology businesses for three years | | | | | | | | | |
| | | | | | | | | | | |
| Speculation and Vacancy Tax Act | | | | | | | | | |
| • | Make exemption for strata accommodation properties permament | | January 1, 2022 | | — | | | | — | |
| • | Expand exemption for hazardous or damaged residential property temporarily | | 2021 tax year | | — | | | | — | |
| | | | | | | | | | | |
| Motor Fuel Tax Act | | | | | | | | | |
| • | Expand hydrogen exemption | | February 23, 2022 | | (1 | ) | | | (1 | ) |
| | | | | | | | | | | |
| Provincial Sales Tax Act | | | | | | | | | |
| • | Introduce exemption for used zero-emission vehicles | | February 23, 2022 | | (21 | ) | | | (29 | ) |
| • | Increase passenger vehicle surtax threshold for zero-emission vehicles | | February 23, 2022 | | (12 | ) | | | (15 | ) |
| • | Introduce exemption for heat pumps | | April 1, 2022 | | (8 | ) | | | (8 | ) |
| • | Increase tax rate on fossil fuel heating equipment | | April 1, 2022 | | 9 | | | | 9 | |
| • | Remove exemption for tobacco | | July 1, 2022 | | 78 | | | | 84 | |
| • | Adjust purchase price of private vehicle sales for tax purposes | | October 1, 2022 | | 15 | | | | 30 | |
| • | Introduce tax collection, remittance, and reporting obligations for marketplace facilitators | | July 1, 2022 | | 100 | | | | 120 | |
| | | | | | | | | | | |
| Home Owner Grant Act | | | | | | | | | |
| • | Increase threshold for home owner grant phase-out to $1.975 million from $1.625 million | | January 1, 2022 | | * | | | | * | |
| | | | | | | | | | | |
| School Act | | | | | | | | | |
| • | Set provincial residential class school property tax rates | | January 1, 2022 | | * | | | | * | |
| • | Set provincial non-residential class school property tax rates | | January 1, 2022 | | * | | | | * | |
| | | | | | | | | | | |
| Taxation (Rural Area) Act | | | | | | | | | |
| • | Set provincial rural area property tax rates | | January 1, 2022 | | * | | | | * | |
| | | | | | | | | | | |
| Various Acts | | | | | | | | | |
| • | Various technical measures | | Various | | * | | | | * | |
| | | | | | | | | | | |
| Total | | | | 29 | | | | (72 | ) |
| * | Denotes measures that have no material impact on taxpayers. |
Budget and Fiscal Plan - 2022/23 to 2024/25
86
Tax Measures
Tax Measures — Supplementary Information
For more details on tax changes see:
www.gov.bc.ca/budgettaxchanges
Income Tax Act
Scientific Research and Experimental Development Tax Credit Extended
The scientific research and experimental development tax credit is extended for five years to August 31, 2027.
The credit provides tax relief for businesses of all sizes and sectors that conduct research and development. Long-term economic growth resulting from research and development is expected to benefit all British Columbians. The majority of specified shareholders of corporations that receive the credit are individuals, of which 76 per cent are male.
Clean Buildings Tax Credit Introduced
Effective February 23, 2022, a new temporary tax credit for retrofits that improve the energy efficiency of multi-unit residential buildings with four or more dwellings and prescribed types of commercial buildings is introduced.
Taxpayers who improve the energy efficiency of the buildings to meet prescribed energy use targets after the retrofit is completed can receive a refundable tax credit of 5 per cent of eligible expenditures paid. The energy use targets have been developed specifically for B.C. and are generally comparable to ASHRAE Standard 100 target values, with variations in building categories. Eligible expenditures must be made before April 1, 2025, and under a contract entered into after February 22, 2022.
The temporary credit supports government’s CleanBC plan by incentivizing energy efficiency upgrades that go above and beyond minimum requirements for existing buildings. Many existing buildings are expected to remain in use beyond 2050. Reducing a building’s energy use can reduce its environmental impact. Improved energy efficiency can provide additional benefits such as increased affordability through reduced heating and cooling costs and improved health and comfort.
Training Tax Credits Extended
The training tax credits are extended for two years to the end of 2024. Most trades apprenticeship programs are male-dominated. An enhanced tax credit is available for First Nations individuals or persons with disabilities for all trade programs.
Shipbuilding and Ship Repair Industry Tax Credit Extended
The shipbuilding and ship repair industry tax credit is extended for two years to the end of 2024. The credit supports an industry with a predominantly male workforce. An enhanced tax credit is available for First Nations individuals or persons with disabilities for eligible trade programs.
Budget and Fiscal Plan - 2022/23 to 2024/25
87
Tax Measures
Small Business Venture Capital Act
Equity Tax Credit Budget for Clean Technology Temporarily Increased
Effective for the 2022 to 2024 years, the total tax credit budget is also temporarily increased to $41 million from $38.5 million for the 2022 to 2024 calendar years. This $2.5 million increase is being allocated to investments in clean technology businesses. Since the tax credit provides investors up to 30 per cent of equity investment, this change supports up to $8.3 million in additional equity financing for qualifying corporations annually.
Seventy per cent of individuals who claim the small business venture capital tax credit are men. Approximately 33 per cent of credit recipients have a total income over $200,000. The majority of credit recipients are between the ages of 30 and 70.
Speculation and Vacancy Tax Act
Exemption for Strata Accommodation Properties Made Permanent
The exemption for strata accommodation properties applies to a residential property that is defined in the Assessment Act as a strata accommodation property. The exemption was set to expire at the end of the 2021 tax year but is now made permanent.
A higher percentage of corporations claim the strata accommodation property exemption compared to the average of other exemptions. When the exemption is claimed by individual owners, these owners are older and are more likely to be male compared to the average for all exempt owners.
Exemption for Hazardous or Damaged Residential Property Temporarily Expanded
Effective for the 2021 tax year only, the exemption for hazardous or damaged residential property is expanded to apply to properties that were damaged by the floods in late 2021 in Abbotsford, Chilliwack and Mission. The exemption for hazardous or damaged residential property requires that a property is uninhabitable for a period of at least 60 days. The exemption is temporarily expanded to allow properties in Abbotsford, Chilliwack and Mission to claim the exemption, even if the property was uninhabitable for less than 60 days, if the disaster prevented them from claiming another exemption under the Act. The exemption is available in the following calendar year after the damage occurs if the residence is still not inhabitable before March 1.
Motor Fuel Tax Act
Hydrogen Exemption Expanded
Effective February 23, 2022, hydrogen fuel is classified as a Category 1 alternative motor fuel and is exempt from motor fuel tax provided that:
| • | the hydrogen is purchased for use in an internal combustion engine vehicle; and |
| • | the hydrogen is not produced by electrolysis using coal-generated electricity, unless the carbon dioxide emitted as a result of the process is captured and stored or captured and sequestered. |
While B.C. uses the carbon tax to put a price on emissions, the alternative motor fuel designation provides another framework for incentivizing the use of lower-emission
Budget and Fiscal Plan - 2022/23 to 2024/25
88
Tax Measures
fuels. An alternative motor fuel exemption has been available for hydrogen used in fuel cell vehicles since 2009. Expanding the hydrogen exemption to include use in internal combustion engine vehicles recognizes that hydrogen produces no carbon when combusted and will help support the decarbonization of the transport sector.
The designation of any fuel as an alternative motor fuel is intended to be transitional in nature and subject to periodic review. Designations and/or tax rates may change as fuels gain market share.
The use of hydrogen in internal combustion engine vehicles is limited at this time. The initial beneficiaries will likely be businesses in the transportation sector employing heavy duty trucks. B.C.’s transportation and warehousing workforce is 79 per cent male. However, marginalized and equity-seeking groups will see long-term benefits from decarbonization, as research suggests that the effects of climate change put these groups at higher risk.
Provincial Sales Tax Act
Exemption for Used Zero-Emission Vehicles Introduced and Passenger Vehicle Surtax Threshold for Zero-Emission Vehicles Increased
Effective February 23, 2022, used zero-emission vehicles are exempt from provincial sales tax. The exemption applies to sales of all used zero-emission vehicles from motor dealers, as well as private sales of used zero-emission vehicles that have been driven for at least 6,000 kilometres. The exemption applies for five years to encourage consumers to adopt zero-emission vehicles and is scheduled to end on February 22, 2027.
Additionally, effective February 23, 2022, the passenger vehicle surtax threshold for zero-emission vehicles is increased to $75,000 from $55,000. This measure reflects that the capital cost of zero-emission vehicles is greater than the cost of comparable internal combustion engine models. The increased surtax threshold for zero-emission vehicles applies for five years to encourage consumers to adopt zero-emission vehicles and is scheduled to end on February 22, 2027.
The prevalence of zero-emission vehicle ownership is greatest among households with annual incomes over $150,000. However, the majority of individuals from all income groups are considering buying a zero-emission vehicle in the future, including over 70 per cent of individuals with household incomes over $50,000. Currently, zero-emission vehicle ownership is more common in the Vancouver Island/Coastal region and the Lower Mainland.
Exemption for Heat Pumps Introduced and Tax Rate on Fossil Fuel Heating Equipment Increased
Effective April 1, 2022, heat pumps are exempt from provincial sales tax. Most heat pump systems are electric and can heat or cool buildings or water by moving heat from one location to another. Switching a building from a fossil fuel heating system to a heat pump can significantly reduce greenhouse gas emissions. If a heat pump is purchased before April 1, 2022 to fulfil a contract where the heat pump is affixed or installed into real property on or after April 1, 2022, the person who paid the provincial sales tax on the heat pump will be eligible to apply for a refund of that tax.
Budget and Fiscal Plan - 2022/23 to 2024/25
89
Tax Measures
To further incentivize the switch to heat pumps, effective April 1, 2022, the provincial sales tax on a fossil fuel combustion system that heats or cools buildings or water is increased from 7 per cent to 12 per cent. Transitionally, fossil fuel combustion systems will generally be subject to an effective tax rate of 7 per cent where, in relation to contracts entered into before February 23, 2022, a fossil fuel combustion system is affixed or installed into real property on or after April 1, 2022. For contracts entered into on or after February 23, 2022, fossil fuel combustion systems will be subject to the 12 per cent rate if they are affixed or installed into real property on or after April 1, 2022. Detailed transition rules will be published by the Ministry of Finance.
Residential property makes up approximately 80 per cent of the sales value of space heating/cooling and water heating equipment. Because younger and lower-income individuals are less likely to own their own home, these individuals are less likely to be directly affected by these changes. However, marginalized and equity-seeking groups will see long-term benefits from decarbonization, as research suggests that the effects of climate change put these groups at higher risk.
Exemption for Tobacco Removed
Effective July 1, 2022, provincial sales tax is applied to tobacco. Applying provincial sales tax to tobacco will align B.C.’s tax policy with the majority of other provinces which, in addition to imposing a specific tobacco tax, apply either a provincial sales tax or the provincial portion of the harmonized sales tax to tobacco.
Tobacco companies have increased pre-tax prices on cigarettes by approximately 220 per cent over the last 20 years. Applying provincial sales tax to tobacco will help government capture additional revenue when tobacco companies raise their prices. This additional revenue will help B.C. offset the costs to the healthcare system that result from tobacco consumption.
This measure will create an added incentive to reduce tobacco consumption, thus improving health outcomes. Smoking rates are higher among men and lower-income individuals. These populations will bear a greater proportion of the tax increase.
Purchase Price of Private Vehicle Sales for Tax Purposes Adjusted
Effective October 1, 2022, tax on private sales of motor vehicles will be based on the greater of the reported purchase price and the average wholesale value of the vehicle. This approach would align B.C.’s treatment of private vehicle sales with the majority of other provinces and is intended to address tax avoidance arising from the underreporting of the price of motor vehicles from private sales. The measure will not apply for motor vehicles involved in a trade-in.
Individuals involved in private vehicle transactions are more likely to be low to medium income, living in a rural area, and male.
Budget and Fiscal Plan - 2022/23 to 2024/25
90
Tax Measures
Tax Collection, Remittance, and Reporting Obligations for Marketplace Facilitators Introduced
Effective July 1, 2022, businesses that facilitate sales or leases of certain goods, services or software for third parties through their online platform, including accepting payment from a consumer (“marketplace facilitators”), will be required to collect and remit tax on those sales and leases made in B.C. This obligation will apply to sales of taxable goods shipped from within Canada, taxable services (including short-term rentals and other taxable accommodation, but not including legal services), software, and leases of goods made through a marketplace facilitator. Sellers will be relieved of their obligation to collect and remit tax on sales and leases made through a marketplace facilitator.
Also effective July 1, 2022, marketplace facilitators will be required to charge provincial sales tax on marketplace facilitation services they provide to sellers.
The government will work over the coming months to expand the collection obligations to the sales of goods shipped from outside Canada to consumers in B.C.
The changes introduced in Budget 2022 do not introduce new taxes on taxable goods, software or taxable services obtained by consumers through online platforms. The provincial sales tax already applied to these transactions. However, in some circumstances, the obligation to pay that tax to the government fell solely on the consumer and there were no matching obligations for sellers or marketplace facilitators to collect and remit that tax to the government. To the extent that consumers were unaware of, or did not fulfil, their obligation to pay provincial sales tax directly to the government, the new tax collection requirements will increase the effective cost of some transactions.
A similar proportion of men and women internet users purchased a good or service online in 2018. Over 93 per cent of internet users with annual household income greater than $125,000 purchased goods online in 2018, compared to 70 per cent of those with annual household income of less than $40,000.
School Act
Provincial Residential Class School Property Tax Rates Set
The longstanding rate-setting policy is that average residential class school property taxes, before application of the home owner grant, increase by the previous year’s provincial inflation rate. This rate-setting policy has been in place since 2003 and continues in 2022.
The tax rate policy seeks to achieve an equitable balance between taxpayers in different areas of the province. Tax rates are lower in school districts that have the highest average assessed values. Still, a residential taxpayer with an average home value in a school district with low average values pays less school tax on their home than a taxpayer with an average home value in a school district with higher average assessed values.
Provincial Non-Residential Class School Property Tax Rates Set
A single province-wide school property tax rate is set for each of the non-residential property classes. Consistent with longstanding policy, the rates for 2022, except for the rate for the industrial property classes, will be set so that non-residential class school
Budget and Fiscal Plan - 2022/23 to 2024/25
91
Tax Measures
tax revenue will increase by inflation plus tax on new construction from the 2021 tax revenues. The major industry class tax rate and the light industry class tax rate will be set at the same rate as the business class tax rate, consistent with the policy announced in Budget 2008.
This rate-setting policy has been in place since 2005, except for the 2020 tax year when significant property tax relief was delivered to commercial property classes through a reduction in school property tax rates.
Effective for the 2023 taxation year, the provincial industrial property tax credit for class 4 major industry is removed. The 2023 major industry school tax rate will be reduced to offset the removal of the credit.
The industrial property tax credit was introduced for the 2009 tax year and has the same effect as simply setting a lower school tax rate for class 4 major industry. The credit mechanism is a trade irritant.
The personal characteristics of the owners of non-residential property are generally not collected or available through the property tax system. Businesses most affected by a property tax are those that rely on brick and mortar operations.
Taxation (Rural Area) Act
Provincial Rural Area Property Tax Rates Set
A single rural area residential property tax rate applies province-wide. The longstanding rate-setting policy that average residential rural property taxes increase by the previous year’s provincial inflation rate continues for 2022.
Consistent with longstanding policy, non-residential rural area property tax rates are set so that total non-residential rural area tax revenue increases by inflation plus tax on new construction.
With the exception of utility and industrial properties in the Peace River Regional District, there is one rural tax rate per property class, province-wide. This means the tax falls more heavily in areas where average values are higher. The effect is relatively minor because average values do not vary widely in rural areas across B.C.
Various Acts
Various Technical Measures
Budget 2022 introduces a number of technical amendments to various enactments including the Carbon Tax Act, Income Tax Act, Land Tax Deferment Act, Motor Fuel Tax Act, Property Transfer Tax Act, Provincial Sales Tax Act, and the Speculation and Vacancy Tax Act for clarity and certainty:
| • | Effective February 23, 2022, the Carbon Tax Act and Motor Fuel Tax Act are amended to authorize the director to establish an annual period for tax reporting. |
| • | Effective February 22, 2022, the Income Tax Act’s production services tax credit is amended to extend the pre-certification filing deadline to 120 days after the production’s first eligible accredited labour expenditure. Corporations intending to claim the production services tax credit will now have an additional 60 days to |
Budget and Fiscal Plan - 2022/23 to 2024/25
92
Tax Measures
notify the certifying authority of their intention to claim the tax credit. This will only apply to film productions incurring their first eligible accredited labour expenditure on or after February 22, 2022.
| • | Effective on royal assent, the Income Tax Act is amended to clarify the authority to disclose taxpayer information for the purposes of administering the Employee Investment Act and Small Business Venture Capital Act. |
| • | The Land Tax Deferment Act is amended: |
| – | effective on royal assent, to allow the minister to delegate authority to a class of persons; and |
| – | effective April 1, 2022, to create a statutory appropriation for concessionary grant expenses. |
| • | Effective on royal assent, the Motor Fuel Tax Act is amended to authorize the director to specify the form to be used as an application for a carrier licence under the International Fuel Tax Agreement. |
| • | Effective April 1, 2022, the Property Transfer Tax Act is amended to clarify the authority of the administrator to make payments out of the consolidated revenue fund for refunds determined under the regulations. |
| • | The Provincial Sales Tax Act is amended: |
| – | effective February 23, 2022, to clarify that gift cards and gift certificates are not subject to provincial sales tax when acquired; |
| – | effective April 1, 2013, to clarify the evidentiary requirements for real property contracts where the customer and the contractor agree that the customer is responsible for paying the provincial sales tax; and |
| – | effective on a date to be specified by regulation, to make minor changes to provisions related to tax payment agreements. |
| • | Effective November 27, 2018, the Speculation and Vacancy Tax Act is amended to extend the deadlines to apply for a tax credit for eligible taxpayer by 90 days when a notice of assessment or a minister’s notice of decision is given after the end of the normal application period. |
| • | Effective October 1, 2022, the Carbon Tax Act, Employer Health Tax Act, Home Owner Grant Act, Insurance Premium Tax Act, Logging Tax Act, Mineral Tax Act, Motor Fuel Tax Act, Net Profit Royalty Regulation, Petroleum and Natural Gas Royalty and Freehold Production Tax Regulation, Property Transfer Tax Act, Provincial Sales Tax Act, Speculation and Vacancy Tax Act and Tobacco Tax Act are amended to standardize and clarify rules on filing appeals to the Minister of Finance. |
Budget and Fiscal Plan - 2022/23 to 2024/25
93
PART 3 | BRITISH COLUMBIA ECONOMIC REVIEW AND OUTLOOK 1
Summary
B.C.’s economy rebounded in 2021 from the initial impacts of the COVID-19 pandemic, despite significant pandemic and climate-related disruptions. The economy has proven resilient to pandemic interruptions, aided by government emergency response programs, cooperation with public health orders and a strong vaccination program, and easing of restrictions. While the recovery has broadened over the past year, it remains uneven with sectors like tourism, hospitality, recreation, and live events yet to fully recover. The path of the ongoing economic recovery in B.C. and its trading partners remains highly uncertain amid the evolution of the pandemic and supply-chain disruptions.
The November 2021 floods and landslides significantly impacted the lives and livelihoods of British Columbians, and exacerbated supply-chain disruptions. However, rapid infrastructure repairs quickly re-established important commercial transportation routes. Looking ahead, expenditures and hiring to permanently rebuild damaged infrastructure from the floods will have a positive effect on jobs and economic activity in the province.
The Ministry of Finance (Ministry) estimates that the economy expanded by 5.0 per cent in 2021, following a 3.4 per cent decline in 2020. The Ministry forecasts that the economy will expand by 4.0 per cent in 2022 and then 2.5 per cent in 2023. Over the medium-term (2024 to 2026), growth is expected to range between 2.1 per cent and 2.4 per cent annually. Underpinning the projected near-term recovery are the assumptions that large-scale immunization campaigns continue to be effective at preventing serious illness and the need for containment measures continues to abate, with responses varying by jurisdiction.
Chart 3.1 Ministry’s Outlook for B.C. Prudent Compared to Private Sector

| 1 | Reflects information available as of February 8, 2022, unless otherwise indicated. |
Budget and Fiscal Plan - 2022/23 to 2024/25
94
British Columbia Economic Review and Outlook
The Ministry’s forecast for B.C. real GDP growth is lower than the outlook provided by the Economic Forecast Council (EFC) from 2022 to 2024, with 0.2 percentage points of prudence in each year. This differential is one of the levels of prudence built into the fiscal plan. The Ministry’s outlook for 2025 and 2026 is slightly higher than the average EFC forecast as LNG production is anticipated to provide more support to the economy over that period.
The main downside risk to B.C.’s economic outlook continues to be the uncertainty regarding the evolution of the COVID-19 pandemic and the degree to which it will have lasting effects on provincial, national, and global economies. Other risks include rising inflation, supply-chain disruptions, climate change impacts, global trade policies, and lower commodity prices.
British Columbia Economic Activity and Outlook
The province’s economic outlook remains strong over the forecast horizon, although estimates of aggregate economic activity for last year are lower than previously forecast. The Ministry’s estimate for B.C. real GDP growth in 2021 has been revised down to 5.0 per cent from the First Quarterly Report forecast of 6.0 per cent. This is due to weaker than expected growth among trading partners, weaker service sector activity, higher prices linked to supply-chain disruptions, and various public health restrictions through the fall delaying full reopening of the economy. Furthermore, the November floods and the spread of the Omicron variant weighed on economic activity at the end of 2021. While real GDP growth was revised down, nominal GDP growth for 2021 has been revised up, to 12.4 per cent from 11.0 per cent in the First Quarterly Report, due to inflationary pressures and elevated commodity prices.
Table 3.1 British Columbia Economic Indicators
| | | Third Quarter | | Fourth Quarter | | Annual1 |
| All data seasonally adjusted, per cent change | | Jul. to Sep. 2021
change from
Apr. to Jun. 2021 | | Oct. to Dec. 2021
change from
Jul. to Sep. 2021 | | Jan. to Dec. 2021
change from
Jan. to Dec. 2020 |
| Employment | | +1.3 | | +1.2 | | +6.6 |
| Manufacturing shipments2 | | -9.0 | | +1.0 | | +21.9 |
| Exports | | +0.3 | | +5.2 | | +36.1 |
| Retail sales2 | | -1.0 | | +0.4 | | +13.6 |
| Consumer price index1,3 | | +3.4 | | +3.8 | | +2.8 |
| Housing starts | | -9.0 | | -5.8 | | +25.6 |
| Residential sales units | | -15.1 | | +8.5 | | +32.8 |
| Residential average sale price | | +1.7 | | +6.6 | | +18.7 |
| Non-residential building permits | | -20.2 | | +52.6 | | -1.4 |
1 Non-seasonally adjusted data
2 Data to November
3 Quarterly calculations for CPI are year-over-year, e.g. Third Quarter is Jul. to Sep. 2021 change from Jul. to Sep. 2020
Over the next two years, B.C. real GDP growth is forecast to be strong due to the continued reopening of the economy, recovery of the service sector, and increased economic activity associated with the flood rebuilding efforts. Strength in the labour market is expected to continue and the housing market is projected to be somewhat stronger, partly supported by stronger migration. Retail sales growth is expected to be somewhat lower as consumers rotate their spending away from goods towards services as the economy opens up further. On the trade front, exports are expected to see continued
Budget and Fiscal Plan - 2022/23 to 2024/25
95
British Columbia Economic Review and Outlook
growth as the global economic recovery continues. Overall, private sector forecasters2 project that B.C. will be one of the top performers in real GDP growth among the provinces in 2022 and 2023.
Labour Market
The labour market in B.C. strengthened significantly throughout 2021. Employment grew by 6.6 per cent in 2021, remaining above pre-pandemic levels since June, and was 2.4 per cent higher in January 2022 compared to pre-pandemic February 2020. Of the total 164,600 net new jobs created in 2021, 105,000 were full-time. The number of jobs created were mostly in the private sector (+152,700 jobs) with significant gains in the public sector (+38,500 jobs), whereas self-employed jobs declined (-26,600 jobs) for the second consecutive year. Employment gains were almost entirely due to a rebound in services-producing sectors (+162,800 jobs), where gains were broad-based, led by the health care and social assistance sector (+35,100 jobs), the wholesale and retail trade sector (+27,800 jobs), and the professional, scientific, and technical services sector (+24,100 jobs). The goods-producing sector grew modestly (+1,900 jobs) in 2021, where growth in the manufacturing sector (+11,400 jobs) offset declines in the agriculture sector (-7,900 jobs) and the construction sector (-5,800 jobs). In January 2022, employment grew by 4,200 jobs month-over-month (m/m), but as Omicron spread widely the proportion of employees absent from work due to illness or disability was 4.0 percentage points higher than a typical January.
B.C.’s unemployment rate averaged 6.5 per cent in 2021, following an average unemployment rate of 8.9 per cent in 2020, and the unemployment rate in January 2022 (5.1 per cent) was 0.1 percentage point below pre-pandemic levels (February 2020). B.C.’s long-term unemployment has also trended down since the peak observed in February 2021, but remains high by historical standards. Long-term unemployment is associated with the risks of skill erosion and labour market detachment.
Chart 3.2 B.C. Employment
Sources: Statistics Canada (Labour Force Survey); Haver Analytics
| 2 | A subset of the Economic Forecast Council that regularly forecasts economic performance in all provinces (BMO, CIBC, National Bank, RBC, Scotiabank, and TD) as of February 8, 2022. |
Budget and Fiscal Plan - 2022/23 to 2024/25
96
British Columbia Economic Review and Outlook
Meanwhile, the labour force grew 3.9 per cent in 2021, more than offsetting the 2.2 per cent decline in the labour force in 2020. The total labour force participation rate recovered throughout 2021, averaging 65.3 per cent in the year, but labour force participation among the 55+ age group was lower than pre-pandemic levels.
Visible minorities in B.C. experienced higher unemployment rates than British Columbians who are neither Indigenous nor part of a group designated as a visible minority since the onset of the COVID-19 pandemic, but the gap in the unemployment rates between these groups has significantly narrowed in recent months. The pandemic has affected employment in sectors overrepresented by women and youth, significantly impacting employment rates for these groups in 2020 and much of 2021, but employment among women and youth in B.C. had recovered to pre-pandemic levels by the end of the year.
Employee compensation (aggregate wages, salaries and employers’ social contributions) in B.C. in the first nine months of 2021 was 11.2 per cent higher than the same period of 2020 and was 10.1 per cent higher in September 2021 relative to February 2020. This reflects base-year3 effects of pandemic lows in 2020 and improvements in the labour market, while employment levels for high-wage workers have remained strong in 2020 and 2021.
Outlook
The outlook for B.C.’s labour market remains strong, but still faces uncertainty amid the degree and duration of pandemic restrictions due to variants of concern and the path of recovery in consumer demand for high-contact services. The Ministry forecasts employment in B.C. to increase by 2.8 per cent in 2022 (approximately +73,000 jobs), followed by annual growth of 1.6 per cent in 2023 (approximately +44,000 jobs). Growth is then expected to moderate over the medium-term slowing to 1.1 per cent by 2026.
The province’s unemployment rate is expected to average 5.5 per cent in 2022, 5.4 per cent in 2023, and decline to 5.2 per cent by 2025.
Consumer Spending and Inflation
Consumer spending on goods in 2021 has been relatively flat at a very high level following rapid growth in the second half of 2020. Spending activity continued to be supported by extended government emergency response programs, low interest rates, rising vaccination rates, and easing of restrictions. Year-to-date to November 2021 B.C. nominal retail sales were up 13.6 per cent compared to the same period in 2020. Underlying the headline growth figure were increases in all major categories, driven by purchases at motor vehicles and parts dealers (+23.4 per cent), gasoline stations (+22.9 per cent), and building material and garden equipment and supplies dealers (+18.9 per cent). Overall consumer spending on goods was not impacted by the floods and landslides, as nominal retail trade increased by 0.8 per cent (m/m) in November. However, according Statistics Canada’s Retail Trade Survey, 21 per cent of retail businesses surveyed indicated that they were impacted by the floods and evacuations in both British Columbia and the Atlantic provinces, largely due to transportation disruptions.
| 3 | Year-to-date and year-over-year growth rates compare economic activity in 2021 to 2020. For many economic indicators, activity was low at the onset of the COVID-19 pandemic in 2020. The base-year effect refers to the higher than normal growth rates observed when comparing 2021 activity levels against the 2020 lows. |
Budget and Fiscal Plan - 2022/23 to 2024/25
97
British Columbia Economic Review and Outlook
While retail trade data offers a detailed indication of consumer spending on goods, there is a lack of timely comprehensive data for consumer spending on services at the provincial level. In 2020, nominal consumer spending on services in B.C. declined 5.2 per cent, and more recent national data and sector-specific data showed continued weakness in 2021, with some signs of recovery at the end of summer and during the fall. National data shows that nominal consumer spending on services in the July to September quarter (third quarter) of 2021 was still 1.9 per cent below pre-pandemic levels. However, sales at food services and drinking places in B.C., a component of the service sector, rebounded throughout 2021 as venues reopened. In November 2021, sales at food services and drinking places were 2.6 per cent above pre-pandemic levels. Yet, broader tourism activities in B.C. remain well below their pre-pandemic levels according to Statistics Canada’s Canadian Tourism Activity Tracker, which combines hotel occupancy, aviation, and spending counts for each province.
Chart 3.3 B.C. Retail Sales
Sources: Statistics Canada; Haver Analytics
Consumer confidence strengthened through most of 2021 but faced some setbacks at the end of the year and into the start of 2022. The Conference Board of Canada’s consumer confidence index for B.C. averaged 129.7 points in 2021, 37.0 points higher than 2020. In January 2022, the index fell to 126.3 following floods and landslides in November, as well as increased public health restrictions due to the Omicron wave in December and January. The Bank of Canada’s latest Canadian Survey of Consumer Expectations released in January 2022 (reflecting survey responses prior to the Omicron variant spreading broadly in Canada) noted that Canadian consumers are anticipating stronger spending and have confidence in the labour market but are concerned about higher inflation in the near-term.
Prices have continued to face upward pressure from supply-chain disruptions, resilient demand for goods and services, and high energy prices. The year-over-year growth rate of the B.C. Consumer Price Index (CPI) has remained above 3.0 per cent since July 2021, reaching a rate of 3.9 per cent in December 2021. The annual CPI inflation rate in 2021 was 2.8 per cent. Provincial price gains in 2021 have been led by rising prices for shelter, transportation, and food. Higher shelter prices primarily reflect
Budget and Fiscal Plan - 2022/23 to 2024/25
98
British Columbia Economic Review and Outlook
increased prices in housing markets while transportation costs have been driven up by both higher gasoline prices and vehicle purchase costs. In the Bank of Canada’s (BoC) Monetary Policy Statement on January 26, 2022, the BoC expects ongoing supply-chain constraints to keep price growth elevated, primarily in the first half of 2022. As supply shortages diminish in the second half of 2022, the BoC expects CPI growth to taper throughout the rest of the year.
Chart 3.4 B.C. Inflation
Sources: Statistics Canada; Haver Analytics
Outlook
Consumer spending is expected to continue its strength as employment prospects remain strong and households spend more on services as pandemic restrictions on high-contact services subside. The Ministry estimates that real household consumer spending picked up in 2021, with growth of 4.8 per cent, following a 3.5 per cent decline in 2020. The Ministry forecasts real household consumption to grow by 5.2 per cent in 2022 and 4.4 per cent in 2023. Growth is then expected to moderate to around 2.1 per cent annually in 2025 and 2026.
The Ministry expects nominal retail sales to continue to grow, expanding by 4.0 per cent in 2022 and then 3.7 per cent in 2023. It is expected to average 3.5 per cent growth over the 2024 to 2026 period.
Consumer price inflation in B.C. is forecast to be 2.9 per cent in 2022 and is expected to moderate to 2.2 per cent in 2023, as supply-chain disruptions are resolved and central bank rates increase. Over the 2024 to 2026 period, inflation is expected to remain around the 2.0 per cent Bank of Canada target. For Canada, annual inflation rates are expected to be higher in 2022 and 2023 at 3.3 per cent and 2.3 per cent respectively, before slowing to reach 2.0 per cent in 2025 and 2026.
Budget and Fiscal Plan - 2022/23 to 2024/25
99
British Columbia Economic Review and Outlook
Housing
B.C. housing markets and residential construction activity reached record levels last year. Resilient higher-wage employment, low interest rates, increased demand for larger dwellings, and low inventories fueled record high volumes of sales and higher prices. MLS home sales increased by 32.8 per cent in 2021 compared to 2020. At the regional level, annual MLS home sales rose in every region including the five largest: Greater Vancouver (+42.0 per cent), Fraser Valley (+40.7 per cent), Okanagan-Mainline (+27.0 per cent), Vancouver Island (+18.5 per cent), and Victoria (+18.0 per cent).
Record-low supply and strong demand for homes led to large price gains in 2021. In 2021, the MLS average home sale price increased by 18.7 per cent, following 11.6 per cent growth in 2020. Average sale price growth was strong across the province with each region seeing price growth above 10.0 per cent.
Chart 3.5 B.C. Home Sales and Price
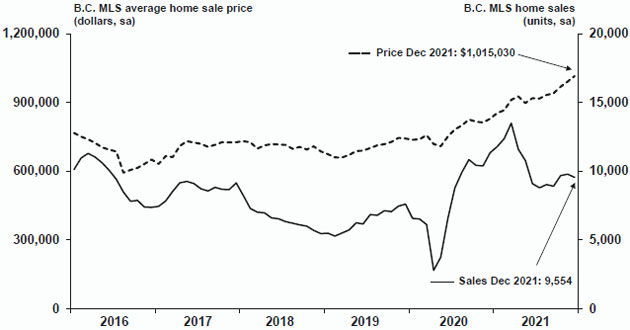
Sources: Canadian Real Estate Association; Haver Analytics
Regional MLS composite benchmark house prices (which incorporate all dwelling types) for Greater Vancouver and the Fraser Valley rose by 12.0 per cent and 21.0 per cent, respectively, in 2021. Significant price increases were observed across all major regions for all dwelling types, and was strongest for single-family detached dwellings, followed by townhouses and then apartments.
Budget and Fiscal Plan - 2022/23 to 2024/25
101
British Columbia Economic Review and Outlook
Chart 3.6 Greater Vancouver HPI Benchmark Price
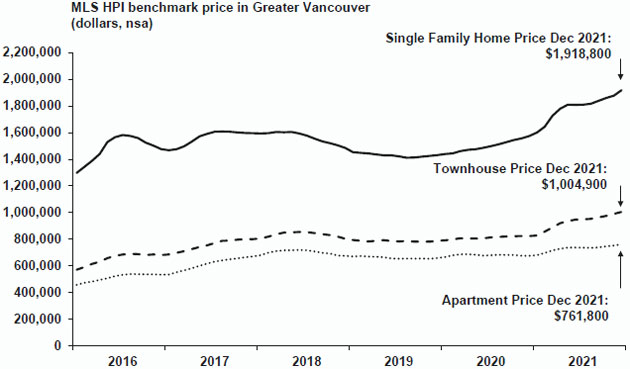
Sources: Canadian Real Estate Association; Haver Analytics
In 2021, housing starts increased by 25.6 per cent to 47,607 units, a record high for annual housing starts, and also a record high year for multi-unit housing starts. Housing starts throughout 2021 were above the ten-year historical average in each month. The value of residential building permits, a leading indicator of home construction, rose 23.9 per cent in 2021, reflecting a 35.2 per cent increase in permitting for single-detached dwellings and a 19.8 per cent increase for multiple dwelling buildings.
Chart 3.7 B.C. Housing Starts
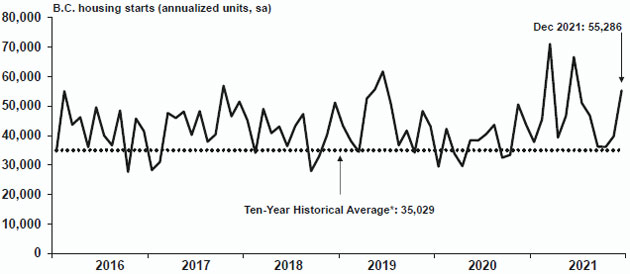
Sources: Canada Mortgage and Housing Corporation; Haver Analytics
* Historical average from Jan. 2011 to Dec. 2020
Budget and Fiscal Plan - 2022/23 to 2024/25
102
British Columbia Economic Review and Outlook
Outlook
The Ministry expects rising interest rates to temper the housing market from the record highs in the market in 2021. The Ministry forecasts unit home sales to decrease 22.2 per cent in 2022, decline by 7.1 per cent in 2023, and then remain relatively flat over 2024 to 2026. Average home sale prices in B.C. are expected to grow steadily over the forecast horizon, rising 3.4 per cent in 2022, and then average 2.2 per cent growth in the medium-term. Putting unit sales and prices together, the total value of home sales is forecast to fall 19.6 per cent in 2022, decrease by 5.1 per cent in 2023, then average 2.3 per cent over the 2024 to 2026 period.
While actual B.C. housing starts have exceeded the ten-year historical average in recent years, the Ministry prudently expects starts to total approximately 38,000 units in 2022, 36,000 units in 2023, and average 35,000 units per year over the 2024 to 2026 period, in-line with the historical average.
Business and Government
Non-residential construction permitting continued to slow last year, falling by 1.4 per cent in 2021, following a decrease of 14.8 per cent in 2020. Underlying the decline was lower permit issuance for institutional and government buildings (-10.9 per cent) whereas permit issuance increased for commercial buildings (+2.0 per cent) and industrial buildings (+3.7 per cent).
Businesses in B.C. have faced significant challenges and have been resilient to pandemic impacts. The number of active businesses in the province in October 2021 was 2.7 per cent higher compared to pre-pandemic levels. The Canadian Federation of Independent Business (CFIB) small business confidence index strengthened in 2021, reflecting business’ adaptability, strong pandemic supports for businesses, an extensive vaccination campaign, and the reopening of much of the economy. However, in recent months the index has been subdued, averaging levels 11.6 per cent lower in the September 2021 to January 2022 period compared to the recent peak in August 2021. Despite the drop in confidence, the overall index remains expansionary.
B.C.’s tourism sector continues to be severely impacted by COVID-19, as the number of international travelers arriving in B.C. has been very low since April 2020. The lifting of restrictions since August 2021 resulted in substantial increases in international travelers in recent months (198,703 in November compared to 28,315 in July), but the number of international travelers to B.C. in November was still well below the 700,000 travelers usually seen on average per month prior to the pandemic. The tourism sector is expected to see a more substantial recovery with the easing of travel restrictions.
Outlook
Following an estimated increase of 11.2 per cent in 2021 (after 2.5 per cent growth in 2020), the Ministry forecasts total real investment in B.C. to rise by 1.9 per cent in 2022, 0.8 per cent in 2023, and range between 0.4 and 2.3 per cent growth annually over the 2024 to 2026 period.
Real business investment is estimated to have grown by 9.5 per cent last year (following 1.3 per cent growth in 2020) and is projected to grow by 1.0 per cent in 2022, with increases expected in most segments (non-residential, machinery and equipment, and intellectual property). Over the 2023 to 2026 period, growth is forecast to range from 1.1 per cent and 3.0 per cent annually. The LNG Canada project is expected
Budget and Fiscal Plan - 2022/23 to 2024/25
103
British Columbia Economic Review and Outlook
to generate a significant amount of economic activity which will support B.C.’s economy over the forecast horizon.
Real expenditure on goods and services by all levels of government is estimated to have increased by 3.5 per cent in 2021 (following 1.1 per cent growth in 2020), driven by the ongoing provincial and federal responses to the COVID-19 pandemic. Real government spending is forecast to moderate to 0.8 per cent growth in 2022 and decline in 2023 as some of the temporary extraordinary supports are phased out. Over the 2024 to 2026 period, government expenditures are expected to be relatively flat in real terms. Nominal government spending on goods and services is expected to grow annually over the forecast horizon.
Following an estimated increase of 13.6 per cent in 2021 and 19.1 per cent growth in 2020, the Ministry expects the nominal net operating surplus of corporations (an approximation of corporate profits) to increase by 0.8 per cent in 2022 and then by 4.3 per cent in 2023. Over 2024 to 2026, the net operating surplus is expected to grow between 4.0 per cent and 6.8 per cent annually.
External Trade and Commodity Markets
Throughout 2021 B.C. merchandise goods exports benefitted from a recovery in global demand and higher commodity prices and are well above pre-pandemic levels. Annual B.C. merchandise exports increased 36.1 per cent in 2021. Most of the gain was driven by higher exports of energy products (+75.7 per cent), forestry products and building and packaging materials (+42.2 per cent), and metal and non-metallic mineral products (+36.3 per cent).
In November and December, B.C. merchandise goods exports were impacted by floods and landslides that caused substantial damage to infrastructure. While the total value of goods exports declined by 11.0 per cent in November and December, exports to the U.S. were up 6.4 per cent, but exports to non-U.S. destinations (which relies on road and rail transportation to the Port of Vancouver) fell 27.9 per cent over the two months. Most of the decline in exports in November and December was in energy products (-31.1 per cent). In the past few months, some of B.C.’s main highways have been temporarily repaired and rail access has been restored, allowing for the flow of goods and services.
In 2021, the value of B.C. merchandise exports to the U.S. increased by 37.9 per cent compared to 2020, led by exports of energy products (+76.0 per cent), forestry products and building materials (+50.6 per cent), and metal and non-metallic mineral products (+32.3 per cent). The same categories, along with metal ores and non-metallic mineral exports, were the main drivers of a 33.9 per cent annual increase in B.C. merchandise exports to non-U.S. destinations.
Like merchandise exports, B.C.’s manufacturing shipments have strengthened throughout 2021 as demand in the global economy increased. Year-to-date to November, B.C.’s manufacturing shipments increased 21.9 per cent compared to the same period of 2020. Higher shipments of wood products (+59.5 per cent) have driven the year-to-date increase in 2021.
B.C. tourism data and national export data suggest that B.C.’s nominal international exports of services have largely not recovered from a sharp decline of 22.8 per cent in 2020. National-level data shows that Canadian exports of services were still 5.6 per cent lower in December 2021 than pre-pandemic levels.
Budget and Fiscal Plan - 2022/23 to 2024/25
104
British Columbia Economic Review and Outlook
Chart 3.8 B.C. Exports
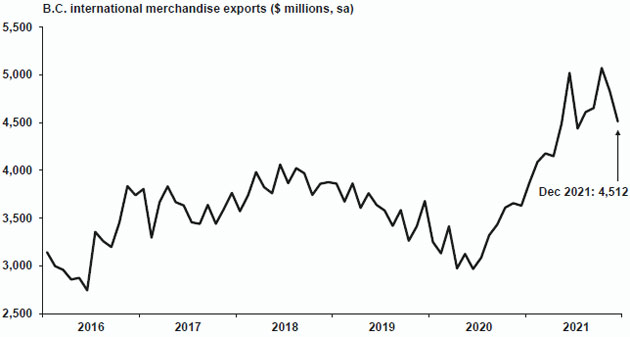
Source: BC Stats
Lumber prices reached a record high in 2021, where the price of Western spruce-pine-fir (SPF) 2x4 averaged $883 US/000 board feet, driven by surging prices in the first half of 2021 and again in December 2021. These recent elevated prices reflect resilient demand amid ongoing supply-chain disruptions which include flooding and landslides on major transportation routes in B.C.
The looming global spread of Omicron softened the West Texas Intermediate (WTI) oil price at the end of the year, but the price remained strong compared to recent years. In 2021, the WTI price averaged $67.99 per barrel, an increase of 73.3 per cent from the previous year. The plant inlet price of natural gas increased sharply in the second half of 2021 due to recovering economies and extreme weather events causing high demand for natural gas products. The plant inlet price averaged $2.22 C/GJ in 2021, up from an average of $0.96 C/GJ in 2020.
Base metal and mineral prices continued their strength throughout 2021, where average annual prices for molybdenum, zinc, lead, silver, copper, and metallurgical coal all recorded growth exceeding 20.0 per cent in 2021 compared to 2020. The price of gold grew modestly on average in 2021 at 1.7 per cent compared to the average price in 2020, and remains at an elevated level.
Outlook
Real exports of goods and services are estimated to have grown by 1.7 per cent in 2021, following a contraction of 9.7 per cent in 2020. Growth in real exports of goods and services is projected to be 2.7 per cent in 2022, 2.5 per cent in 2023, and range between 3.3 per cent and 5.2 per cent annually in the 2024 to 2026 period. The anticipated production of LNG toward the end of the forecast horizon provides support to the outlook.
The price of lumber is forecast to average $575 US/000 board feet in 2022 and $475 US/000 board feet in 2023, before moderating to $450 US/000 board feet over the 2024 to 2026 period. The plant inlet price for natural gas is expected to average $2.09 C/GJ in 2022/23, $1.67 C/GJ in 2023/24, and $1.55 C/GJ in 2024/25. The outlook is subject to considerable uncertainty, as commodity prices can be volatile.
Budget and Fiscal Plan - 2022/23 to 2024/25
105
British Columbia Economic Review and Outlook
Demographics
B.C.’s population on July 1, 2021 was 5.21 million people, up by 1.1 per cent from the same date in 2020. During the January to September period of 2021, the province welcomed 84,858 net migrants, a significant increase compared to the 17,325 net migrants in the same period of 2020, when lockdown measures restricted the flow of people. The increase in immigration in the first nine months of 2021 was due to both increased net international migration (from +167 persons to +54,535 persons) and net interprovincial migration (from +17,158 persons to +30,323 persons) compared to the same period of 2020. In Budget 2021, total net migration was expected to be about 58,500 persons in 2021, which has been significantly surpassed already in the first nine months of 2021 (+84,858 persons), reflecting pent-up movement that was restricted in 2020 and earlier in 2021 along with the federal government exceeding immigration targets.
Outlook
B.C.’s July 1 population is projected to increase by 1.9 per cent in 2022 and then by around 1.5 per cent on average over the 2023 to 2026 period.
Total net migration is expected to be about 107,000 persons in 2022, and 86,600 persons in 2023. Looking beyond, total net migration is projected to taper down to around 75,500 persons by 2026. Over the forecast horizon, international migrants are expected to average around 80 per cent of total migrants, which is similar to recent years. The fall 2020 increase in federal immigration targets, along with increased movement across the globe, are supporting the forecast.
Risks to the Economic Outlook
Despite significant challenges in 2021, B.C.’s economic recovery from the COVID-19 pandemic has proceeded rapidly and is broadening. However, there are various elements of uncertainty that will influence the future path of B.C.’s economic recovery. While there are upside risks (such as resiliency of the economy amidst future variants, a quicker recovery in the service sector, and a faster than expected global recovery), risks continue to be weighted to the downside. Downside risks to B.C.’s economic outlook include the following:
| • | emergence of COVID-19 variants of concern and future outbreaks in B.C., Canada, or among B.C.’s trading partners, and delays in the global vaccination rollout; |
| • | medium- to long-term damage to the economy due to the pandemic through channels such as persistent long-term unemployment and labour market detachment, higher precautionary saving by households, business closures, or lower private capital investment; |
| • | persistent inflation leading to a faster than expected pace of interest rate increases in Canada and internationally; |
| • | climate-related disasters disrupting the lives and livelihoods of British Columbians, destroying productive capital, and impacting economic activity; |
| • | ongoing global trade tensions and broader economic challenges in Asia, Europe, and the U.K.; |
| • | higher volatility in international foreign exchange, stock, and bond markets; |
Budget and Fiscal Plan - 2022/23 to 2024/25
106
British Columbia Economic Review and Outlook
| • | lower commodity prices, particularly for lumber, pulp, natural gas, and coal; and |
| • | timing of investment and hiring related to the LNG Canada project, similar to the risks that exist for other major capital projects. |
External Outlook
The external outlook has moderated for most of B.C.’s major trading partners since the First Quarterly Report. While many countries experienced rebounds in economic activity and employment after reopening their economies and removing containment measures, the continued strength of their recoveries has been mixed. Many countries have imposed new restrictions in response to the fast-spreading Omicron variant, which could worsen existing supply-chain disruptions, tight labour markets, and high material costs. The impacts of floods and landslides in B.C. on Canada’s economy continue to unfold, as the Province works to reopen and rebuild critical infrastructure that shippers across Canada rely on for international trade. Rising inflation will pressure central banks to raise interest rates, which may weigh on continued recovery prospects for households and businesses.
United States
Easing of restrictions and supportive monetary and fiscal policy contributed to the recovery of the U.S. economy in 2021, which accelerated at the end of the year. Following slower annualized growth of 2.3 per cent in the third quarter of 2021, GDP growth rebounded in the October to December quarter (fourth quarter) at an annualized rate of 6.9 per cent. However, the majority of this quarterly growth was due to inventory effects from businesses restocking their shelves, while domestic demand grew at a more modest pace. Overall, U.S. GDP in 2021 increased 5.7 per cent compared to 2020, the highest growth rate in nearly 40 years. All major components of GDP grew on an annual basis, including consumption of goods and services, investment, exports, and government spending.
Chart 3.9 U.S. Real GDP
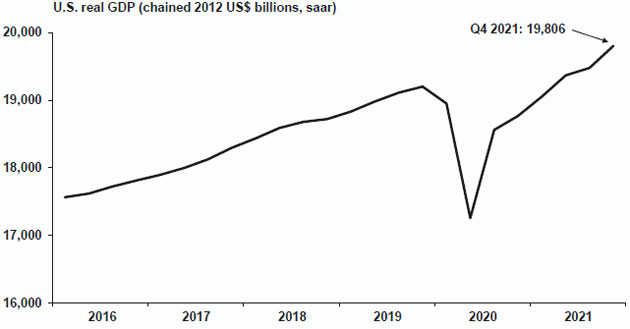
Sources: U.S. Bureau of Economic Analysis; Haver Analytics
Budget and Fiscal Plan - 2022/23 to 2024/25
107
British Columbia Economic Review and Outlook
The U.S. labour market recovery strengthened throughout 2021, adding a monthly average of around 611,000 jobs in the fourth quarter. In 2021, U.S. employment was up 2.8 per cent compared to 2020. Job growth slowed only slightly in Omicron-disrupted January 2022, adding 467,000 jobs (m/m). However, U.S. employment remained 1.9 per cent (or 2.9 million jobs) below pre-pandemic (February 2020) levels as of January 2022. The U.S. unemployment rate was 4.0 per cent in January 2022, above the pre-pandemic rate of 3.5 per cent. The number of long-term unemployed has improved in recent months but remains well above the pre-pandemic level. January 2022’s labour force participation rate of 62.2 per cent was 1.2 percentage points lower than in February 2020.
U.S. home building activity remains resilient, driven by strong housing demand. Housing starts in 2021 were 15.6 per cent above 2020 levels and in December 2021 were 7.1 per cent above pre-pandemic levels. Residential building permits, a leading indicator of building activity, increased 9.8 per cent in December 2021 and were up 17.2 per cent in 2021 as a whole compared to 2020.
Chart 3.10 U.S. Housing Starts
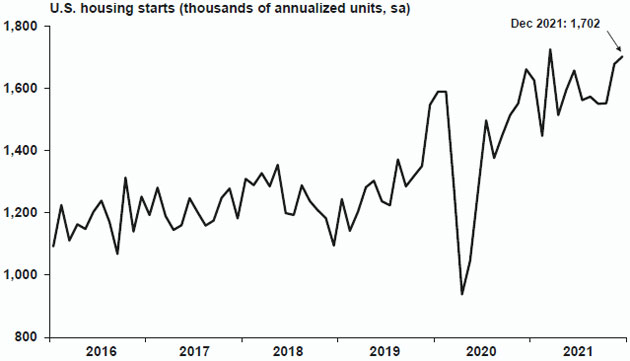
Sources: U.S. Census Bureau; Haver Analytics
U.S. home sales were robust in 2021, driven partly by low mortgage rates. Existing home sales hit a 15-year high in 2021 and were up 8.4 per cent compared to the previous year. New home sales, however, declined by 7.3 per cent in 2021 following strong sales in 2020. The median sales price for existing homes was up 16.9 per cent over 2020, while new home prices rose by 16.6 per cent.
U.S. nominal retail sales showed strength in 2021 and exceeded pre-pandemic (February 2020) levels in every month of the year. Although spending slowed in December due to the Omicron variant and elevated inflation, sales for the year were up by 19.3 per cent compared to 2020. All major categories of retail sales were above 2020 levels, with notable gains at motor vehicles and parts dealers, food services and drinking places, and gasoline stations. Year-over-year, inflation increased by 7.0 per cent in December 2021, the highest in nearly 40 years, driven by increases in prices for gasoline and used cars and trucks. The annual CPI inflation rate in the U.S. was 4.7 per cent in 2021.
Budget and Fiscal Plan - 2022/23 to 2024/25
108
British Columbia Economic Review and Outlook
U.S. consumer confidence trended upward in the first half of 2021 but faltered in the second half of the year due to COVID-19 concerns and rising prices. The Conference Board consumer confidence index averaged 112.7 for 2021, which was 11.7 points above 2020. However, in January 2022, the index remained 18.8 points below pre-pandemic levels.
U.S. merchandise exports recovered from pandemic lows despite challenges created by new COVID-19 variants and ongoing supply-chain disruptions. The value of U.S. merchandise exports in December 2021 was 16.6 per cent above February 2020 and up 23.3 per cent for the year compared to 2020.
Outlook
In January 2022, Consensus Economics (Consensus) forecasters projected U.S. economic growth of 3.9 per cent in 2022, 0.2 percentage points lower than the October 2021 Consensus survey. Meanwhile, for 2023, Consensus forecasts growth of 2.6 per cent (Table 3.2).
Table 3.2 U.S. Real GDP Forecast: Consensus versus B.C. Ministry of Finance
| | | 2022 | | | 2023 | |
| | | Per cent change in real GDP | |
| B.C. Ministry of Finance | | | 3.6 | | | | 2.3 | |
| Consensus Economics (January 2022*) | | | 3.9 | | | | 2.6 | |
| * Comparable month to B.C. Ministry of Finance forecast. |
A surge in Omicron cases and persistent labour shortages could weigh on economic growth in 2022. Recognizing these uncertainties, the Ministry prudently assumes that U.S. real GDP will grow by 3.6 per cent in 2022 and by 2.3 per cent in 2023, with growth gradually tapering off to 1.7 per cent annually over the medium-term.
Chart 3.11 Consensus Outlook for the U.S. in 2022
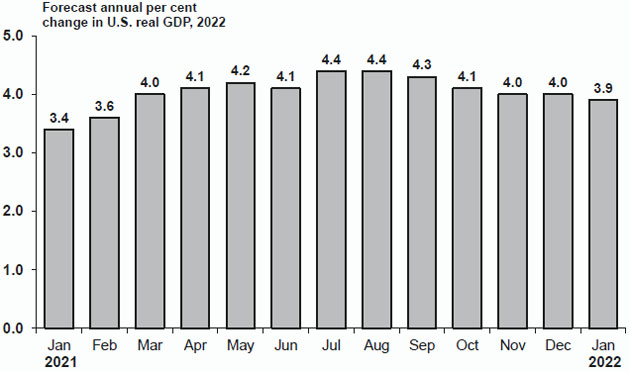
Source: Consensus Economics
The chart above represents forecasts for U.S. real GDP growth in 2022 as polled on specific dates. For example, forecasters surveyed on January 11, 2021 had an average 2022 U.S. real GDP growth forecast of 3.4 per cent, while on January 10, 2022 they forecast 2022 U.S. real GDP to grow by 3.9 per cent.
Budget and Fiscal Plan - 2022/23 to 2024/25
109
British Columbia Economic Review and Outlook
Canada
The Canadian economy rebounded in the third quarter of 2021 to grow at an annualized rate of 5.4 per cent, following a contraction (-3.2 per cent annualized) in the second quarter (April to June quarter). GDP growth was driven by gains in consumer spending as consumption of services and semi-durable goods (e.g., clothing and footwear) increased with the easing of restrictions. Exports also contributed to growth, led by crude oil. However, increases were softened by weaker business investment, a pullback in housing investment, and a drawdown of inventories. Canadian real GDP remained 1.4 per cent below pre-pandemic levels in the third quarter of 2021.
Chart 3.12 Canadian Real GDP
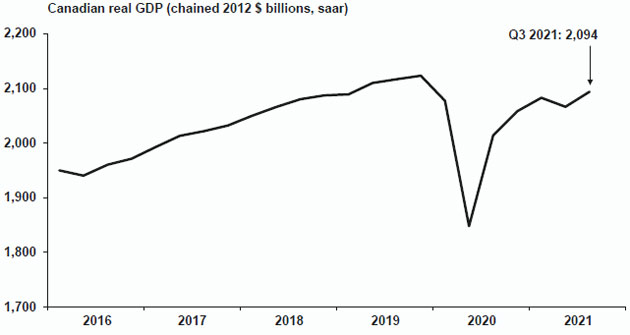
Sources: Statistics Canada; Haver Analytics
Consumer price inflation accelerated throughout 2021, driven in part by supply-chain disruptions, resilient demand for goods and services, and high energy prices. Year-over-year, inflation advanced from 1.0 per cent in January to 4.8 per cent in December, reaching levels not seen in 30 years. Price growth in December was broad-based, with the largest increases in transportation, shelter, and food. On average, prices were up by 3.4 per cent in 2021 compared to 2020.
Although Canadian employment has remained above pre-pandemic levels, employment fell by 1.0 per cent (m/m) in January 2022 and the unemployment rate increased to 6.5 per cent, as the spread of Omicron weighed on the labour market. In 2021, Canadian employment grew by 4.8 per cent (+866,200 jobs) compared to 2020. Several industries had not returned to pre-pandemic levels by January 2022, with accommodation and food services being the hardest-hit industry.
The average unemployment rate for 2021 (7.5 per cent) was a 2.0 percentage point improvement over 2020. January 2022’s unemployment rate of 6.5 per cent was 0.8 percentage points higher than pre-pandemic levels. January’s labour force participation rate of 65.0 per cent was lower (-0.6 percentage points) than February 2020, but was up on a year-over-year basis. The unemployment rate for youth remains
Budget and Fiscal Plan - 2022/23 to 2024/25
110
British Columbia Economic Review and Outlook
higher than for core-age workers, and despite significant improvement since its peak in May 2020 remained above pre-pandemic levels in January 2022. The unemployment rate for visible minorities improved in 2021 but remained higher than for people who are neither Indigenous nor part of a designated visible minority group.
The Canadian housing market surged in 2021, finishing the year with record sales and prices, and strong housing starts. Total MLS home sales in 2021 increased by 20.7 per cent over the previous sales record in 2020, with double-digit growth in 9 of the 10 provinces. A lack of housing supply and strong demand pushed the average sale price up by 21.3 per cent over the previous record set in 2020. Months of inventory, which measures the number of months to sell the existing inventory of homes, was 1.6 in December 2021, the lowest level ever recorded in data going back to 2003. Housing starts in 2021 reached heights not seen since 1976, despite a pullback in December. In 2021, housing starts were 25.2 per cent higher than the previous year, driven by construction in Calgary, Montréal, and Vancouver.
Canadian nominal retail sales recovered to their pre-pandemic levels in June 2020 and gained momentum through 2021. In the first eleven months of 2021, retail sales were 11.9 per cent higher compared to the same period of 2020. Strong sales at motor vehicle and parts dealers and gasoline stations have contributed to increases in total retail sales.
Canadian merchandise exports rose in 2021, despite global supply-chain issues and transportation disruptions caused by November’s flooding and landslides in B.C. The value of Canadian merchandise exports in 2021 was 21.5 per cent higher than the previous year and December’s value was above pre-pandemic levels by 17.2 per cent. Canada recorded surplus trade balances for nine months of the year and registered its first annual trade surplus since 2014, even as energy exports fell at the end of the year. Service exports, which trended upward in recent months, were still down 5.6 per cent in December 2021 relative to pre-pandemic levels.
Outlook
The January 2022 Consensus forecasts Canadian real GDP to rise by 3.9 per cent in 2022 (0.2 percentage points lower than the October survey) and by 3.0 per cent in 2023 (Table 3.3).
Table 3.3 Canadian Real GDP Forecast: Consensus versus B.C. Ministry of Finance
| | | 2022 | | | 2023 | |
| | | Per cent change in real GDP | |
| B.C. Ministry of Finance | | | 3.6 | | | | 2.6 | |
| Consensus Economics (January 2022*) | | | 3.9 | | | | 3.0 | |
| * Comparable month to B.C. Ministry of Finance forecast. |
Uncertainty regarding new restrictions triggered by the Omicron variant and ongoing price pressures could create headwinds for economic activity in 2022. Accordingly, the Ministry’s outlook is lower than the January 2022 Consensus. The Ministry assumes that the Canadian economy will grow by 3.6 per cent in 2022, 2.6 per cent in 2023, and then moderate over the medium-term to reach 1.6 per cent annual growth.
Budget and Fiscal Plan - 2022/23 to 2024/25
111
British Columbia Economic Review and Outlook
Chart 3.13 Consensus Outlook for Canada in 2022
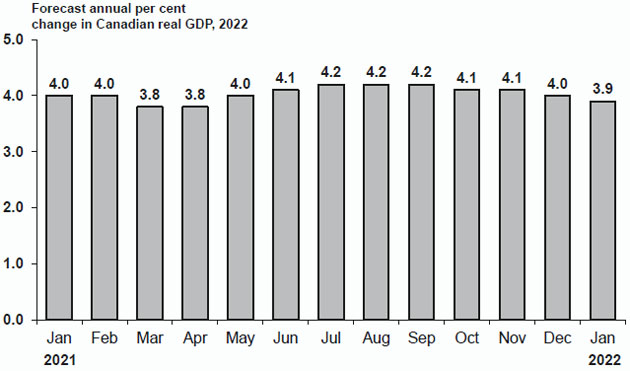
Source: Consensus Economics
The chart above represents forecasts for Canadian real GDP growth in 2022 as polled on specific dates. For example, forecasters surveyed on January 11, 2021 had an average 2022 Canadian real GDP growth forecast of 4.0 per cent, while on January 10, 2022 they forecast 2022 Canadian real GDP to grow by 3.9 per cent.
Asia
China’s economy continued to expand in 2021, increasing by 8.1 per cent compared to 2020. Growth accelerated in the fourth quarter of last year to an annualized rate of 9.4 per cent, following weaker growth in the third quarter. China’s economy faced numerous challenges in the second half of the year from rises in COVID-19 infections, supply-chain disruptions, shortages of semiconductors, high commodity prices, power outages, and a slowdown in property investment. On January 17, 2022, the Chinese central bank cut several key lending rates, which was mainly attributed to concerns over slowing economic growth.
Supply-chain disruptions and lower consumer spending weighed on Japan’s economy in the third quarter of 2021. Japan real GDP decreased by an annualized growth rate of 3.6 per cent in the third quarter of 2021, following an annualized growth rate of 2.0 per cent in the second quarter. Shortages of semiconductors and other parts forced automobile manufacturers to curtail production and a COVID-related state of emergency limited spending in major Japanese cities. On January 18, 2022, the Bank of Japan held its target interest rates unchanged and maintained its current asset purchase program.
Outlook
The January 2022 Consensus forecasts China real GDP to grow by 5.0 per cent in 2022 and 5.3 per cent in 2023. Strict lockdowns from China’s zero-COVID policy, continued border restrictions, and the worsening real estate situation could create headwinds for China’s economic growth. The Ministry’s prudent assumption is that China’s economy will expand by 4.7 per cent in 2022 and 5.0 per cent in 2023, before moderating to 4.8 per cent growth in 2026.
Budget and Fiscal Plan - 2022/23 to 2024/25
112
British Columbia Economic Review and Outlook
The January 2022 Consensus forecasts Japan real GDP to grow by 3.1 per cent in 2022 and 1.5 per cent in 2023. In recognition of the growing risks represented by the Omicron variant and the strict border restrictions imposed by Japan, the Ministry assumes that Japan’s real GDP will grow more slowly. The Ministry forecasts economic activity to rise by 2.8 per cent in 2022, pulling back to 1.2 per cent growth in 2023 and then gradually softening to 0.5 per cent annual growth over the medium-term.
Europe
Economic activity strengthened in the euro zone in 2021 with the easing of restrictions in many member countries. Real GDP in the euro zone grew by 5.2 per cent in 2021, following a decline of 6.5 per cent in 2020. Growth slowed towards the end of the year, as many countries imposed new containment measures to reduce infections from the Omicron variant. Real GDP in the fourth quarter grew at an annualized rate of 1.2 per cent, down from 9.4 per cent growth in the third quarter. The region is expected to have a slow start to 2022, with growth resuming as coronavirus restrictions lift and supply-chain disruptions improve.
On February 3, 2022, the European Central Bank (ECB) maintained key interest rates at current levels and kept to its December 2021 commitment to scale back bond purchases in response to high inflation. The ECB will reduce and reconfigure its net asset purchases from near €90 billion per month to €40 billion in the second quarter of 2022 and €30 billion in the third quarter, and continue making purchases until at least October 2022. The ECB expects to end asset purchases before raising key interest rates, which might occur as early as 2022.
Outlook
The January 2022 Consensus forecasts the euro zone economy to grow by 4.0 per cent in 2022, which is 0.4 percentage points lower than the October 2021 Consensus survey. Downgrades to growth for 2022 reflect tighter restrictions following an increase in COVID-19 cases and increasing price pressures. For 2023, Consensus forecasts growth of 2.5 per cent. The Ministry forecasts more prudent growth of 3.7 per cent in 2022, 2.1 per cent in 2023, and then a gradual deceleration over the medium-term toward 1.2 per cent growth in 2026.
Financial Markets
Interest Rates
In response to strong economic growth, recovery in labour markets, and increased inflationary pressures, central banks have signalled their intention to raise interest rates in 2022.
On January 26, 2022 the Federal Open Market Committee (The Fed) held its target range for the federal funds rate unchanged at 0.00 to 0.25 per cent. The Fed did not provide specifics on the pace and timing of rate increases but instead stated these increases are expected soon given elevated inflation levels and the strong labour market. The Fed also announced an expected end to its quantitative easing (asset purchases) program. The Fed had previously reduced its monthly asset purchases in half, from US$120 billion prior to November 2021 to US$60 billion in January 2022. The Fed plans to further reduce monthly purchases from February onward, bringing them to an end in early March.
Budget and Fiscal Plan - 2022/23 to 2024/25
113
British Columbia Economic Review and Outlook
The Fed is closely monitoring the economy and will adjust monetary policy for emergent risks to its goals of maximum employment and a long-term inflation rate of 2 per cent.
Chart 3.14 Interest Rate Forecasts
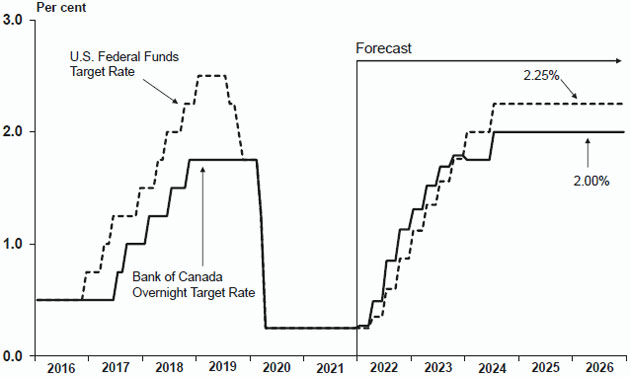
Sources: Bank of Canada; U.S. Federal Reserve; and B.C. Ministry of Finance forecasts
On January 26, 2022, the Bank of Canada (BoC) kept its target for the overnight interest rate at 0.25 per cent and maintained its holdings of Government of Canada bonds roughly constant. Although the BoC opted not to raise rates, it ended its commitment to holding its policy rate at the lower bound as Canada’s economy is now operating at full capacity. The BoC stopped short of providing a timeline for rate increases and instead stated that the timing and pace of increases will be guided by its 2 per cent inflation target. The BoC noted an uneven economic recovery from COVID-19, with robust growth in the U.S., a rebound in oil prices, and stronger than expected growth in Canada’s economy in 2021 with momentum heading into 2022. However, growth was more moderate in China, and inflation in most regions has risen due to strong demand and supply-chain disruptions. The BoC expects inflation to remain elevated at around 5 per cent in the first half of 2022 before easing to 3 per cent by the end of the year.
Outlook
The US Federal Reserve and the Bank of Canada have signalled raising interest rates in 2022 to ease inflationary pressures. Based on the average of six private sector forecasts as of January 4, 2022, the Ministry assumes the U.S. federal funds rate to average 0.52 per cent in 2022 and 1.45 per cent in 2023. By comparison, the Bank of Canada’s overnight target rate is expected to average 0.69 per cent in 2022 and 1.58 per cent in 2023.
The Canadian three-month treasury bill interest rate is expected to average 0.65 per cent in 2022 and 1.56 per cent in 2023, according to the same six private sector forecasters. Meanwhile, the 10-year Government of Canada bond rate is assumed to be 1.82 per cent in 2022 and 2.14 per cent in 2023.
Budget and Fiscal Plan - 2022/23 to 2024/25
114
British Columbia Economic Review and Outlook
Table 3.4 Private Sector Canadian Interest Rate Forecasts
| | | 3-month Treasury Bill | | | 10-year Government Bond | |
| Average annual interest rate (per cent) | | | 2022 | | | | 2023 | | | | 2022 | | | | 2023 | |
| BMO | | | 0.61 | | | | 1.54 | | | | 1.79 | | | | 2.13 | |
| CIBC | | | 0.43 | | | | 1.24 | | | | 1.83 | | | | 2.20 | |
| National Bank | | | 0.67 | | | | 1.52 | | | | 1.79 | | | | 1.98 | |
| RBC | | | 0.55 | | | | 1.50 | | | | 1.76 | | | | 2.08 | |
| Scotiabank | | | 0.85 | | | | 1.86 | | | | 1.83 | | | | 2.23 | |
| TD | | | 0.78 | | | | 1.67 | | | | 1.92 | | | | 2.24 | |
| Average (as of January 4, 2022) | | | 0.65 | | | | 1.56 | | | | 1.82 | | | | 2.14 | |
Exchange Rate
The value of the Canadian dollar has generally moved in step with energy prices during the pandemic and recovery. The Canadian dollar experienced a small pullback in the last two months of 2021 as oil prices softened. However, the Canadian dollar averaged 79.8 US cents in 2021 as a whole, higher than the 74.6 US cents in 2020.
Chart 3.15 Private Sector Expectations for the Canadian Dollar
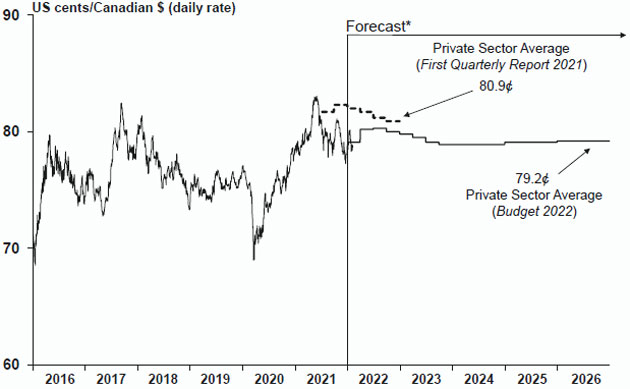
Sources: Bank of Canada and B.C. Ministry of Finance forecasts.
* Based on the average of private sector forecasts. First Quarterly Report 2021 as of July 9, 2021 and Budget 2022 as of January 4, 2022.
Outlook
Based on the average of six private sector forecasts as of January 4, 2022, the Ministry assumes the Canadian dollar will average 79.9 US cents in 2022 and 79.3 US cents in 2023.
Budget and Fiscal Plan - 2022/23 to 2024/25
115
British Columbia Economic Review and Outlook
Table 3.5 Private Sector Exchange Rate Forecasts
| Average annual exchange rate (US cents/Canadian $) | | 2022 | | | 2023 | |
| BMO | | | 79.8 | | | | 80.5 | |
| CIBC | | | 76.9 | | | | 76.6 | |
| National Bank | | | 81.3 | | | | 80.2 | |
| RBC | | | 78.8 | | | | 76.9 | |
| Scotiabank | | | 82.2 | | | | 81.8 | |
| TD | | | 80.4 | | | | 80.0 | |
| Average (as of January 4, 2022) | | | 79.9 | | | | 79.3 | |
Budget and Fiscal Plan - 2022/23 to 2024/25
116
British Columbia Economic Review and Outlook
Table 3.6.1 Gross Domestic Product (GDP): British Columbia
| | | | | | | | | Forecast | |
| | | 2020 | | | 2021 e | | | 2022 | | | 2023 | | | 2024 | | | 2025 | | | 2026 | |
| Gross Domestic Product at Market Prices: | | | | | | | | | | | | | | | | | | | | | | | | | | | | |
| – Real (chained 2012 $ billions) | | | 265.8 | | | | 279.0 | | | | 290.1 | | | | 297.4 | | | | 303.6 | | | | 311.1 | | | | 318.1 | |
| (% change) | | | -3.4 | | | | 5.0 | | | | 4.0 | | | | 2.5 | | | | 2.1 | | | | 2.4 | | | | 2.3 | |
| – Nominal (current prices, $ billions) | | | 309.3 | | | | 347.7 | | | | 368.0 | | | | 382.9 | | | | 398.1 | | | | 415.1 | | | | 432.8 | |
| (% change) | | | -0.5 | | | | 12.4 | | | | 5.8 | | | | 4.1 | | | | 4.0 | | | | 4.3 | | | | 4.3 | |
| – GDP price deflator (2012 = 100) | | | 116.4 | | | | 124.6 | | | | 126.8 | | | | 128.7 | | | | 131.1 | | | | 133.4 | | | | 136.0 | |
| (% change) | | | 2.9 | | | | 7.1 | | | | 1.8 | | | | 1.5 | | | | 1.8 | | | | 1.8 | | | | 2.0 | |
| Real GDP per person (chained 2012 $) | | | 51,518 | | | | 53,502 | | | | 54,585 | | | | 55,050 | | | | 55,359 | | | | 55,909 | | | | 56,387 | |
| (% change) | | | -4.6 | | | | 3.9 | | | | 2.0 | | | | 0.9 | | | | 0.6 | | | | 1.0 | | | | 0.9 | |
| Real GDP per employed person | | | | | | | | | | | | | | | | | | | | | | | | | | | | |
| (% change) | | | 3.4 | | | | -1.5 | | | | 1.2 | | | | 0.9 | | | | 0.8 | | | | 1.2 | | | | 1.2 | |
| Unit labour cost1 (% change) | | | 3.5 | | | | 5.5 | | | | 1.9 | | | | 1.5 | | | | 1.8 | | | | 1.3 | | | | 1.3 | |
| | | | | | | | | | | | | | | | | | | | | | | | | | | | | |
| Components of Real GDP at Market Prices (chained 2012 $ billions) |
| Household expenditure on goods and services | | | 170.1 | | | | 178.4 | | | | 187.6 | | | | 195.8 | | | | 202.0 | | | | 206.1 | | | | 210.4 | |
| (% change) | | | -3.5 | | | | 4.8 | | | | 5.2 | | | | 4.4 | | | | 3.2 | | | | 2.0 | | | | 2.1 | |
| – Goods | | | 72.2 | | | | 78.1 | | | | 78.9 | | | | 80.1 | | | | 81.4 | | | | 82.6 | | | | 83.9 | |
| (% change) | | | 1.6 | | | | 8.3 | | | | 1.0 | | | | 1.5 | | | | 1.6 | | | | 1.5 | | | | 1.5 | |
| – Services | | | 98.1 | | | | 100.4 | | | | 108.9 | | | | 115.9 | | | | 120.8 | | | | 123.6 | | | | 126.7 | |
| (% change) | | | -6.8 | | | | 2.4 | | | | 8.4 | | | | 6.4 | | | | 4.2 | | | | 2.3 | | | | 2.4 | |
| NPISH2 expenditure on goods and services | | | 4.3 | | | | 4.4 | | | | 4.6 | | | | 4.7 | | | | 4.8 | | | | 4.8 | | | | 4.9 | |
| (% change) | | | 0.0 | | | | 2.4 | | | | 4.1 | | | | 1.6 | | | | 1.5 | | | | 1.5 | | | | 1.4 | |
| Government expenditure on goods and services | | | 48.3 | | | | 49.9 | | | | 50.4 | | | | 49.7 | | | | 49.6 | | | | 49.8 | | | | 50.0 | |
| (% change) | | | 1.1 | | | | 3.5 | | | | 0.8 | | | | -1.4 | | | | -0.1 | | | | 0.5 | | | | 0.4 | |
| Investment in fixed capital | | | 70.4 | | | | 78.3 | | | | 79.8 | | | | 80.5 | | | | 80.8 | | | | 82.5 | | | | 84.4 | |
| (% change) | | | 2.5 | | | | 11.2 | | | | 1.9 | | | | 0.8 | | | | 0.4 | | | | 2.1 | | | | 2.3 | |
| | | | | | | | | | | | | | | | | | | | | | | | | | | | | |
| Final domestic demand | | | 293.6 | | | | 311.8 | | | | 322.9 | | | | 330.8 | | | | 337.0 | | | | 343.1 | | | | 349.6 | |
| (% change) | | | -1.2 | | | | 6.2 | | | | 3.6 | | | | 2.4 | | | | 1.9 | | | | 1.8 | | | | 1.9 | |
| Exports of goods and services | | | 95.0 | | | | 96.6 | | | | 99.2 | | | | 101.7 | | | | 105.1 | | | | 110.5 | | | | 115.4 | |
| (% change) | | | -9.7 | | | | 1.7 | | | | 2.7 | | | | 2.5 | | | | 3.3 | | | | 5.2 | | | | 4.4 | |
| Imports of goods and services | | | 119.8 | | | | 127.1 | | | | 131.0 | | | | 134.8 | | | | 138.4 | | | | 142.4 | | | | 146.6 | |
| (% change) | | | -8.0 | | | | 6.0 | | | | 3.1 | | | | 2.9 | | | | 2.7 | | | | 2.9 | | | | 2.9 | |
| Inventory change | | | -2.0 | | | | -1.1 | | | | 0.1 | | | | 0.5 | | | | 0.4 | | | | 0.3 | | | | 0.2 | |
| Statistical discrepancy | | | -0.1 | | | | -0.1 | | | | -0.1 | | | | -0.1 | | | | -0.1 | | | | -0.1 | | | | -0.1 | |
| | | | | | | | | | | | | | | | | | | | | | | | | | | | | |
| Real GDP at market prices | | | 265.8 | | | | 279.0 | | | | 290.1 | | | | 297.4 | | | | 303.6 | | | | 311.1 | | | | 318.1 | |
| (% change) | | | -3.4 | | | | 5.0 | | | | 4.0 | | | | 2.5 | | | | 2.1 | | | | 2.4 | | | | 2.3 | |
1 Unit labour cost is the nominal cost of labour incurred to produce one unit of real output.
2 Non-profit institutions serving households.
e B.C. Ministry of Finance estimate.
Budget and Fiscal Plan - 2022/23 to 2024/25
117
British Columbia Economic Review and Outlook
Table 3.6.2 Selected Nominal Income and Other Indicators: British Columbia
| | | | | | | | | Forecast | |
| | | 2020 | | | 2021 | | | 2022 | | | 2023 | | | 2024 | | | 2025 | | | 2026 | |
| Compensation of employees1 ($ millions) | | | 152,516 | | | | 168,867 | e | | | 178,935 | | | | 186,201 | | | | 193,499 | | | | 200,817 | | | | 208,090 | |
| (% change) | | | 0.0 | | | | 10.7 | | | | 6.0 | | | | 4.1 | | | | 3.9 | | | | 3.8 | | | | 3.6 | |
| | | | | | | | | | | | | | | | | | | | | | | | | | | | | |
| Household income ($ millions) | | | 291,244 | | | | 305,645 | e | | | 316,499 | | | | 328,808 | | | | 341,095 | | | | 354,104 | | | | 367,538 | |
| (% change) | | | 7.0 | | | | 4.9 | | | | 3.6 | | | | 3.9 | | | | 3.7 | | | | 3.8 | | | | 3.8 | |
| | | | | | | | | | | | | | | | | | | | | | | | | | | | | |
| Net operating surplus ($ millions) | | | 38,180 | | | | 43,376 | e | | | 43,705 | | | | 45,605 | | | | 47,415 | | | | 50,275 | | | | 53,712 | |
| (% change) | | | 19.1 | | | | 13.6 | | | | 0.8 | | | | 4.3 | | | | 4.0 | | | | 6.0 | | | | 6.8 | |
| | | | | | | | | | | | | | | | | | | | | | | | | | | | | |
| Retail sales ($ millions) | | | 87,513 | | | | 98,711 | e | | | 102,692 | | | | 106,498 | | | | 110,328 | | | | 114,192 | | | | 118,243 | |
| (% change) | | | 1.3 | | | | 12.8 | | | | 4.0 | | | | 3.7 | | | | 3.6 | | | | 3.5 | | | | 3.5 | |
| | | | | | | | | | | | | | | | | | | | | | | | | | | | | |
| Housing starts (units) | | | 37,903 | | | | 47,607 | | | | 38,022 | | | | 36,001 | | | | 35,032 | | | | 35,078 | | | | 35,147 | |
| (% change) | | | -15.6 | | | | 25.6 | | | | -20.1 | | | | -5.3 | | | | -2.7 | | | | 0.1 | | | | 0.2 | |
| | | | | | | | | | | | | | | | | | | | | | | | | | | | | |
| Residential sales ($ millions) | | | 73,469 | | | | 115,858 | | | | 93,172 | | | | 88,417 | | | | 90,393 | | | | 92,579 | | | | 94,782 | |
| (% change) | | | 35.6 | | | | 57.7 | | | | -19.6 | | | | -5.1 | | | | 2.2 | | | | 2.4 | | | | 2.4 | |
| | | | | | | | | | | | | | | | | | | | | | | | | | | | | |
| Residential sales (units) | | | 94,001 | | | | 124,877 | | | | 97,101 | | | | 90,160 | | | | 90,194 | | | | 90,387 | | | | 90,544 | |
| (% change) | | | 21.5 | | | | 32.8 | | | | -22.2 | | | | -7.1 | | | | 0.0 | | | | 0.2 | | | | 0.2 | |
| | | | | | | | | | | | | | | | | | | | | | | | | | | | | |
| Residential average sale price ($) | | | 781,572 | | | | 927,779 | | | | 959,540 | | | | 980,665 | | | | 1,002,196 | | | | 1,024,262 | | | | 1,046,806 | |
| (% change) | | | 11.6 | | | | 18.7 | | | | 3.4 | | | | 2.2 | | | | 2.2 | | | | 2.2 | | | | 2.2 | |
| | | | | | | | | | | | | | | | | | | | | | | | | | | | | |
| Consumer price index (2002 = 100) | | | 132.4 | | | | 136.1 | | | | 140.0 | | | | 143.1 | | | | 146.0 | | | | 149.0 | | | | 152.0 | |
| (% change) | | | 0.8 | | | | 2.8 | | | | 2.9 | | | | 2.2 | | | | 2.0 | | | | 2.0 | | | | 2.0 | |
1 Domestic basis; wages, salaries and employers’ social contributions.
e B.C. Ministry of Finance estimate.
Table 3.6.3 Labour Market Indicators: British Columbia
| | | | | | | | | Forecast | |
| | | 2020 | | | 2021 | | | 2022 | | | 2023 | | | 2024 | | | 2025 | | | 2026 | |
| Population (thousands at July 1) | | | 5,159 | | | | 5,215 | | | | 5,316 | | | | 5,403 | | | | 5,485 | | | | 5,564 | | | | 5,642 | |
| (% change) | | | 1.3 | | | | 1.1 | | | | 1.9 | | | | 1.6 | | | | 1.5 | | | | 1.4 | | | | 1.4 | |
| | | | | | | | | | | | | | | | | | | | | | | | | | | | | |
| Net migration (thousands) | | | | | | | | | | | | | | | | | | | | | | | | | | | | |
| | | | | | | | | | | | | | | | | | | | | | | | | | | | | |
| –International1,4 | | | 3.6 | | | | 73.2 | e | | | 71.6 | | | | 67.8 | | | | 64.1 | | | | 64.5 | | | | 63.5 | |
| | | | | | | | | | | | | | | | | | | | | | | | | | | | | |
| –Interprovincial4 | | | 22.1 | | | | 33.7 | e | | | 15.0 | | | | 15.0 | | | | 12.0 | | | | 12.0 | | | | 12.0 | |
| | | | | | | | | | | | | | | | | | | | | | | | | | | | | |
| – Total | | | 25.8 | | | | 107.0 | e | | | 86.6 | | | | 82.8 | | | | 76.1 | | | | 76.5 | | | | 75.5 | |
| | | | | | | | | | | | | | | | | | | | | | | | | | | | | |
| Labour force population2 (thousands) | | | 4,300 | | | | 4,350 | | | | 4,436 | | | | 4,516 | | | | 4,592 | | | | 4,665 | | | | 4,736 | |
| (% change) | | | 1.4 | | | | 1.2 | | | | 2.0 | | | | 1.8 | | | | 1.7 | | | | 1.6 | | | | 1.5 | |
| | | | | | | | | | | | | | | | | | | | | | | | | | | | | |
| Labour force (thousands) | | | 2,735 | | | | 2,841 | | | | 2,888 | | | | 2,930 | | | | 2,965 | | | | 2,998 | | | | 3,030 | |
| (% change) | | | -2.2 | | | | 3.9 | | | | 1.7 | | | | 1.5 | | | | 1.2 | | | | 1.1 | | | | 1.1 | |
| | | | | | | | | | | | | | | | | | | | | | | | | | | | | |
| Participation rate3 (%) | | | 63.6 | | | | 65.3 | | | | 65.1 | | | | 64.9 | | | | 64.6 | | | | 64.3 | | | | 64.0 | |
| | | | | | | | | | | | | | | | | | | | | | | | | | | | | |
| Employment (thousands) | | | 2,491 | | | | 2,656 | | | | 2,729 | | | | 2,773 | | | | 2,807 | | | | 2,842 | | | | 2,873 | |
| (% change) | | | -6.6 | | | | 6.6 | | | | 2.8 | | | | 1.6 | | | | 1.2 | | | | 1.2 | | | | 1.1 | |
| | | | | | | | | | | | | | | | | | | | | | | | | | | | | |
| Unemployment rate (%) | | | 8.9 | | | | 6.5 | | | | 5.5 | | | | 5.4 | | | | 5.3 | | | | 5.2 | | | | 5.2 | |
1 International migration includes net non-permanent residents and returning emigrants less net temporary residents abroad.
2 The civilian, non-institutionalized population 15 years of age and over.
3 Percentage of the labour force population in the labour force.
4 Components may not sum to total due to rounding.
e BC Stats estimate.
Budget and Fiscal Plan - 2022/23 to 2024/25
118
British Columbia Economic Review and Outlook
Table 3.6.4 Major Economic Assumptions
| | | | | | | | | Forecast | |
| | | 2020 | | | 2021 | | | 2022 | | | 2023 | | | 2024 | | | 2025 | | | 2026 | |
| Real GDP | | | | | | | | | | | | | | | | | | | | | | | | | | | | |
| Canada (chained 2012 $ billions) | | | 1,999 | | | | 2,089 | e | | | 2,165 | | | | 2,221 | | | | 2,261 | | | | 2,297 | | | | 2,334 | |
| (% change) | | | -5.2 | | | | 4.5 | | | | 3.6 | | | | 2.6 | | | | 1.8 | | | | 1.6 | | | | 1.6 | |
| U.S. (chained 2012 US$ billions) | | | 18,385 | | | | 19,427 | | | | 20,127 | | | | 20,590 | | | | 20,960 | | | | 21,316 | | | | 21,679 | |
| (% change) | | | -3.4 | | | | 5.7 | | | | 3.6 | | | | 2.3 | | | | 1.8 | | | | 1.7 | | | | 1.7 | |
| Japan (chained 2015 Yen trillions) | | | 528 | | | | 536 | e | | | 551 | | | | 558 | | | | 562 | | | | 564 | | | | 567 | |
| (% change) | | | -4.5 | | | | 1.5 | | | | 2.8 | | | | 1.2 | | | | 0.7 | | | | 0.5 | | | | 0.5 | |
| China (constant 2010 US$ billions) | | | 11,793 | | | | 12,748 | | | | 13,347 | | | | 14,014 | | | | 14,715 | | | | 15,421 | | | | 16,162 | |
| (% change) | | | 2.3 | | | | 8.1 | | | | 4.7 | | | | 5.0 | | | | 5.0 | | | | 4.8 | | | | 4.8 | |
| Euro zone1 (chained 2015 Euro billions) | | | 10,644 | | | | 11,195 | | | | 11,609 | | | | 11,853 | | | | 12,031 | | | | 12,187 | | | | 12,333 | |
| (% change) | | | -6.5 | | | | 5.2 | | | | 3.7 | | | | 2.1 | | | | 1.5 | | | | 1.3 | | | | 1.2 | |
| | | | | | | | | | | | | | | | | | | | | | | | | | | | | |
| Industrial production index (% change) | | | | | | | | | | | | | | | | | | | | | | | | | | | | |
| U.S. | | | -7.2 | | | | 5.5 | | | | 3.7 | | | | 2.3 | | | | 1.8 | | | | 1.7 | | | | 1.7 | |
| Japan | | | -10.1 | | | | 5.5 | | | | 4.6 | | | | 1.8 | | | | 1.0 | | | | 0.7 | | | | 0.7 | |
| China | | | 1.8 | | | | 10.9 | | | | 4.6 | | | | 4.9 | | | | 4.8 | | | | 4.4 | | | | 4.4 | |
| Euro zone1 | | | -7.9 | | | | 7.3 | e | | | 3.0 | | | | 2.5 | | | | 1.5 | | | | 1.3 | | | | 1.2 | |
| | | | | | | | | | | | | | | | | | | | | | | | | | | | | |
| Housing starts (thousands) | | | | | | | | | | | | | | | | | | | | | | | | | | | | |
| Canada | | | 217 | | | | 271 | | | | 215 | | | | 195 | | | | 190 | | | | 190 | | | | 190 | |
| (% change) | | | 3.8 | | | | 25.2 | | | | -20.7 | | | | -9.3 | | | | -2.6 | | | | 0.0 | | | | 0.0 | |
| U.S. | | | 1,380 | | | | 1,595 | | | | 1,480 | | | | 1,400 | | | | 1,380 | | | | 1,350 | | | | 1,300 | |
| (% change) | | | 6.9 | | | | 15.6 | | | | -7.2 | | | | -5.4 | | | | -1.4 | | | | -2.2 | | | | -3.7 | |
| Japan | | | 815 | | | | 856 | | | | 860 | | | | 870 | | | | 880 | | | | 880 | | | | 880 | |
| (% change) | | | -9.9 | | | | 5.0 | | | | 0.4 | | | | 1.2 | | | | 1.1 | | | | 0.0 | | | | 0.0 | |
| | | | | | | | | | | | | | | | | | | | | | | | | | | | | |
| Consumer price index | | | | | | | | | | | | | | | | | | | | | | | | | | | | |
| Canada (2002 = 100) | | | 137.0 | | | | 141.6 | | | | 146.3 | | | | 149.6 | | | | 152.8 | | | | 155.8 | | | | 159.0 | |
| (% change) | | | 0.7 | | | | 3.4 | | | | 3.3 | | | | 2.3 | | | | 2.1 | | | | 2.0 | | | | 2.0 | |
| | | | | | | | | | | | | | | | | | | | | | | | | | | | | |
| Canadian interest rates (%) | | | | | | | | | | | | | | | | | | | | | | | | | | | | |
| 3-month treasury bills | | | 0.45 | | | | 0.12 | | | | 0.65 | | | | 1.56 | | | | 1.88 | | | | 2.00 | | | | 2.00 | |
| 10-year government bonds | | | 0.75 | | | | 1.36 | | | | 1.82 | | | | 2.14 | | | | 2.25 | | | | 2.25 | | | | 2.25 | |
| | | | | | | | | | | | | | | | | | | | | | | | | | | | | |
| United States interest rates (%) | | | | | | | | | | | | | | | | | | | | | | | | | | | | |
| 3-month treasury bills | | | 0.37 | | | | 0.04 | | | | 0.39 | | | | 1.34 | | | | 1.88 | | | | 2.00 | | | | 2.00 | |
| 10-year government bonds | | | 0.89 | | | | 1.44 | | | | 1.87 | | | | 2.25 | | | | 2.50 | | | | 2.50 | | | | 2.50 | |
| | | | | | | | | | | | | | | | | | | | | | | | | | | | | |
| Exchange rate (US cents / Canadian $) | | | 74.6 | | | | 79.8 | | | | 79.9 | | | | 79.3 | | | | 78.9 | | | | 79.1 | | | | 79.2 | |
| | | | | | | | | | | | | | | | | | | | | | | | | | | | | |
| British Columbia goods and services | | | | | | | | | | | | | | | | | | | | | | | | | | | | |
| Export price deflator (% change) | | | 0.5 | | | | 14.6 | e | | | -0.3 | | | | 0.1 | | | | 1.5 | | | | 1.3 | | | | 1.7 | |
| 1 | Euro zone (19) is Austria, Belgium, Cyprus, Estonia, Finland, France, Germany, Greece, Ireland, Italy, Latvia, Lithuania, Luxembourg, Malta, Netherlands, Portugal, Slovakia, Slovenia and Spain. |
| e | B.C. Ministry of Finance estimate. |
Budget and Fiscal Plan - 2022/23 to 2024/25
119
British Columbia Economic Review and Outlook
The Economic Forecast Council, Budget 2022
Introduction
In accordance with the Budget Transparency and Accountability Act, the Minister of Finance, in preparing the provincial budget, consults the Economic Forecast Council (the Council or EFC) on British Columbia’s economic outlook. The 13-member Council is comprised of leading economists from several of Canada’s major financial and private research institutions.
The most recent meeting between the Minister and the EFC was on December 3, 2021, with Council members presenting their estimates for economic performance in 2021 and their forecasts for 2022 through 2026 and over the long-term. Key topics of discussion included: the impacts of the COVID-19 pandemic and recent floods on B.C.’s outlook; climate change; B.C.’s labour market; the outlook for inflation and immigration; and issues around economic competitiveness and well-being. Discussions on many of these topics continued in a separate meeting of an Environmental, Social, Governance (ESG) Advisory Council later that day (see topic box on page 46).
EFC members were welcome to revise their forecasts following the meeting until January 10, 2022 (10 of the 13 members chose to resubmit). Forecast details from the Council’s surveys are summarized in the table at the end of this topic box.
British Columbia Outlook
On average, the Council estimates that B.C.’s economy rebounded by 5.1 per cent in 2021, more than recovering from the pandemic related contraction of 3.4 per cent in 2020. The Council’s estimate for 2021 was 0.2 percentage points higher than its prior projection in March 2021. Members’ latest forecasts call for B.C. economic growth of 4.2 per cent in 2022 and 2.7 per cent in 2023, down 0.1 percentage point in 2022 and up 0.3 percentage points in 2023 from their March outlook. Over the medium-term, the Council forecasts B.C.’s economy to grow by 2.3 per cent in 2024, 2.2 per cent in 2025 and 2.0 per cent in 2026. Over the long-term, members forecast average growth of 1.9 per cent (see Chart 1).
Chart 1 – EFC Outlook for B.C.
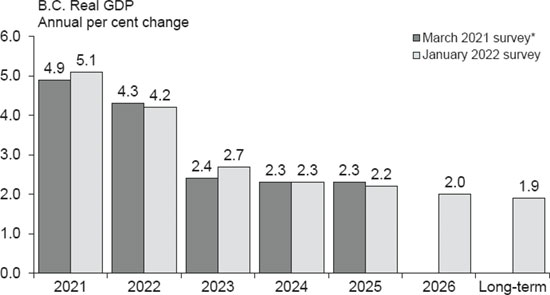
Source: Average of Economic Forecast Council forecasts.
*Forecasts for 2026 and the long-term were not part of the March 2021 survey.
The Council estimates that B.C.’s economy grew faster than Canada’s in 2021, and forecasts relatively higher growth again in B.C. in 2022 partly due to expected recovery in the tourism sector and rebuilding work after the floods in late 2021. Except for 2023, B.C.’s economy is expected to grow faster than the national average throughout the forecast horizon (see Chart 2).
Chart 2 – EFC Outlook for B.C. and Canada
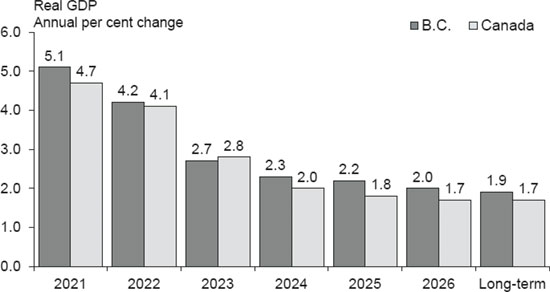
Source: Average of Economic Forecast Council forecasts.
The COVID-19 pandemic continued to be a main issue underlying the Council’s forecasts, with uncertainty about the economic impacts of Omicron and future variants. However, the Council agrees that consumer spending will continue to shift from goods to services as the pandemic fades over time, which will strengthen the still-struggling tourism sector.
Budget and Fiscal Plan - 2022/23 to 2024/25
120
British Columbia Economic Review and Outlook
B.C.’s floods in November 2021 were another key topic of discussion. There was some debate about whether the severe regional effects would result in reduced aggregate GDP growth in 2021 but there was consensus that rebuilding activity would add to growth in 2022. The Council advised building resilience via upgraded infrastructure and broader climate change adaptation, which will require substantial investments and careful planning. On the climate change mitigation side, the Council noted B.C.’s leadership and generally supported carbon pricing in B.C., although they acknowledged the need for a global framework to address climate change (and continued support for B.C.’s trade-exposed industries in the meantime). Some members also highlighted opportunities in B.C.’s mining sector on the path to a lower carbon economy.
The EFC noted the swift (albeit uneven) recovery in B.C. employment following the onset of the pandemic. While they agreed that B.C.’s labour market has generally outperformed other provinces, they identified labour shortages as an issue in the province with the potential to limit growth (particularly in hospitality, technology and high-skilled sectors). Looking ahead, the Council expects labour supply challenges to persist due to rising retirement rates amid aging demographics. However, increasing immigration is expected to provide some offset as international mobility and the global public health situation improves. As such, members highlighted the ongoing need to continue to increase housing supply and improve housing affordability to attract talent and support shared prosperity in the province.
The Council also discussed B.C.’s competitiveness in attracting capital investment over the medium and long term, as well as how to measure the province’s well-being and progress. It was noted that continued improvements to ESG policies and outcomes (as well as marketing B.C.’s strong performance to date) are critical to attracting capital. Members noted that continued reconciliation with Indigenous Peoples would bring more certainty to the investment community and create meaningful opportunities for Indigenous communities. Meanwhile, productivity growth was highlighted as a fundamental way to improve overall well-being, while measures like GDP per capita, cost of living, income inequality and unemployment rates across GBA+ identity factors are useful for assessing progress. The Council also pointed to economic diversification and fiscal discipline as ways to maintain and strengthen B.C.’s economic resilience.
British Columbia Economic Forecast Council:
Summary of B.C. real GDP forecasts, annual per cent change
| Participant | | Organization | | 2021 | | | 2022 | | | 2023 | | | 2024 | | | 2025 | | | 2026 | | | Long-term | |
| Douglas Porter | | Bank of Montreal1 | | | 4.8 | | | | 4.6 | | | | 3.7 | | | | 2.3 | | | | 2.2 | | | | 2.0 | | | | 2.0 | |
| Brendon Ogmundson | | BC Real Estate Association1 | | | 5.5 | | | | 3.8 | | | | 3.1 | | | | 2.6 | | | | 2.5 | | | | 2.5 | | | | 2.5 | |
| Ken Peacock | | Business Council of BC1 | | | 5.3 | | | | 3.8 | | | | 2.5 | | | | 2.2 | | | | 2.9 | | | | 2.2 | | | | 2.5 | |
| Bryan Yu | | Central 1 Credit Union1 | | | 5.0 | | | | 4.3 | | | | 2.6 | | | | 2.3 | | | | 2.2 | | | | 1.9 | | | | n/a | |
| Avery Shenfeld | | CIBC1 | | | 4.2 | | | | 3.4 | | | | 2.9 | | | | n/a | | | | n/a | | | | n/a | | | | n/a | |
| Pedro Antunes | | Conference Board of Canada | | | 6.0 | | | | 4.6 | | | | 1.5 | | | | 1.7 | | | | 1.8 | | | | 1.8 | | | | 1.7 | |
| Arlene Kish | | IHS Markit | | | 5.1 | | | | 4.5 | | | | 2.4 | | | | 2.4 | | | | 2.3 | | | | 1.9 | | | | 1.8 | |
| Sébastien Lavoie | | Laurentian Bank Securities1 | | | 5.0 | | | | 3.2 | | | | 2.7 | | | | 2.0 | | | | 1.8 | | | | 1.8 | | | | 1.7 | |
| Stéfane Marion | | National Bank1 | | | 4.4 | | | | 4.7 | | | | 2.4 | | | | 1.9 | | | | 1.7 | | | | 1.4 | | | | 1.3 | |
| Craig Wright | | RBC1 | | | 5.6 | | | | 4.2 | | | | 2.2 | | | | n/a | | | | n/a | | | | n/a | | | | n/a | |
| Jean-François Perrault | | Scotiabank1 | | | 4.0 | | | | 4.7 | | | | 3.8 | | | | n/a | | | | n/a | | | | n/a | | | | n/a | |
| Aaron Stokes | | Stokes Economics | | | 5.7 | | | | 5.1 | | | | 2.9 | | | | 3.2 | | | | 2.9 | | | | 2.2 | | | | n/a | |
| Derek Burleton | | TD1 | | | 5.2 | | | | 3.9 | | | | 2.5 | | | | 1.9 | | | | 1.9 | | | | 1.9 | | | | 1.9 | |
| Average | | | | | 5.1 | | | | 4.2 | | | | 2.7 | | | | 2.3 | | | | 2.2 | | | | 2.0 | | | | 1.9 | |
| Standard Deviation | | | | | 0.6 | | | | 0.6 | | | | 0.6 | | | | 0.4 | | | | 0.4 | | | | 0.3 | | | | 0.4 | |
| 1 | Updated subsequent to the December 3, 2021 meeting. |
Budget and Fiscal Plan - 2022/23 to 2024/25
121
British Columbia Economic Review and Outlook
Canadian Outlook
After an estimated gain of 4.7 per cent in 2021, the EFC expects Canadian real GDP to grow by 4.1 per cent in 2022. Similar to B.C., economic growth is forecast to continue slowing down thereafter, with the economy expanding by 2.8 per cent, 2.0 per cent, 1.8 per cent and 1.7 per cent each year from 2023 to 2026, respectively. The Council pegs average long-term economic growth in Canada at 1.7 per cent.
Consumer price inflation in Canada (and abroad) was a key topic of discussion and the Council’s views were mixed. Most members pointed to supply chain disruptions and transportation bottlenecks as the main reasons for high inflation in recent months, while others highlighted demand pressures. Most members see inflation trending lower and approaching 2 per cent in late 2022 or 2023. However, members noted uncertainty in the inflation outlook, which depends in part on price expectations, wage growth and the Bank of Canada’s response with interest rate hikes.
International Outlook
The Council forecasts U.S. real GDP growth of 3.9 per cent in 2022, following growth of 5.6 per cent the previous year. The EFC is calling for 2.7 per cent growth in 2023, 2.3 per cent in 2024, then 2.1 per cent annually in 2025 and 2026, and 1.9 per cent growth over the long-term.
EFC members discussed disruption and evolution in global supply chains, and potential opportunities for B.C. exporters to further diversify in international markets alongside continued protectionism in the U.S. The Council also noted slowing growth in China as a risk to the outlook.
Canadian Dollar
Council members’ projections for the Canadian dollar ranged from 77.2 US cents to 82.8 US cents in 2022 and from 76.0 US cents to 82.8 US cents in 2023. Over the medium-term, EFC forecasts ranged from lows of around 77 to 78 US cents to highs of around 83 US cents, while long-term forecasts ranged from 77.0 US cents to 80.0 US cents (see Chart 3).
Chart 3 – EFC Outlook for the Dollar
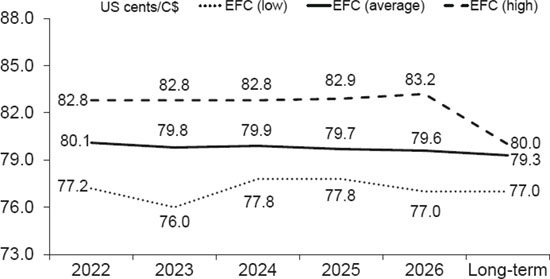
Source: Economic Forecast Council forecasts.
Budget and Fiscal Plan - 2022/23 to 2024/25
122
British Columbia Economic Review and Outlook
Forecast Survey – Participants’ Opinions
| | 2021 | | 2022 | | 2023 | | 2024 | | 2025 | | 2026 | | Long-term | |
| All figures are based on annual averages | | Range | | Average 1 | | Range | | Average 1 | | Range | | Average 1 | | Range | | Average 1 | | Range | | Average 1 | | Range | | Average 1 | | Range | | Average 1 | |
| British Columbia | | | | | | | | | | | | | | | | | | | | | | | | | | | | | |
| | | | | | | | | | | | | | | | | | | | | | | | | | | | | | |
| Real GDP (% change) | | 4.0 – 6.0 | | 5.1 (13) | | 3.2 – 5.1 | | 4.2 (13) | | 1.5 – 3.8 | | 2.7 (13) | | 1.7 – 3.2 | | 2.3 (10) | | 1.7 – 2.9 | | 2.2 (10) | | 1.4 – 2.5 | | 2.0 (10) | | 1.3 – 2.5 | | 1.9 (8) | |
| Nominal GDP (% change) | | 9.0 – 14.2 | | 11.6 (13) | | 3.5 – 8.7 | | 6.1 (13) | | 2.5 – 7.4 | | 4.7 (13) | | 3.2 – 5.0 | | 4.3 (10) | | 3.3 – 5.4 | | 4.3 (10) | | 3.2 – 4.7 | | 4.0 (10) | | 3.1 – 5.0 | | 4.0 (8) | |
| GDP Deflator (% change) | | 3.5 – 9.0 | | 6.4 (13) | | -1.0 – 4.0 | | 1.9 (13) | | 1.0 – 3.6 | | 2.0 (13) | | 1.5 – 3.0 | | 2.0 (10) | | 1.5 – 3.0 | | 2.1 (10) | | 1.5 – 2.7 | | 2.1 (10) | | 1.6 – 2.6 | | 2.0 (8) | |
| Real business non-residential investment (% change) | | -8.6 – 19.3 | | 3.9 (6) | | 2.1 – 13.0 | | 7.2 (6) | | -0.9 – 3.8 | | 1.9 (6) | | -5.0 – 4.0 | | -0.5 (6) | | -6.8 – 4.1 | | 0.5 (6) | | -6.8 – 4.0 | | -0.7 (6) | | 1.9 – 3.0 | | 2.3 (3) | |
| Real business machinery and equipment investment (% change) | | 2.0 – 15.4 | | 8.2 (5) | | 4.5 – 14.3 | | 8.6 (5) | | -3.3 – 6.8 | | 3.2 (5) | | -5.3 – 3.0 | | 0.4 (5) | | -5.4 – 4.0 | | 0.8 (5) | | -6.0 – 3.0 | | -1.5 (5) | | 2.1 – 3.0 | | 2.6 (2) | |
| Household Income (% change) | | 3.1 – 9.0 | | 5.4 (9) | | 3.0 – 5.7 | | 4.5 (9) | | 3.0 – 5.4 | | 4.1 (9) | | 2.8 – 5.8 | | 4.0 (8) | | 2.8 – 5.1 | | 3.8 (8) | | 2.8 – 4.6 | | 3.7 (8) | | 3.0 – 4.0 | | 3.6 (5) | |
| Net Migration (thousand persons) | | 55.0 – 90.0 | | 69.8 (10) | | 35.0 – 111.0 | | 77.7 (10) | | 47.5 – 95.0 | | 79.8 (10) | | 50.3 – 80.0 | | 72.3 (9) | | 51.0 – 80.0 | | 69.9 (9) | | 51.8 – 80.0 | | 68.4 (9) | | 54.0 – 80.0 | | 68.4 (6) | |
| Employment (% change) | | 6.4 – 7.2 | | 6.6 (12) | | 2.2 – 4.5 | | 3.0 (12) | | 0.8 – 2.5 | | 1.7 (12) | | 0.4 – 2.2 | | 1.3 (10) | | 0.4 – 2.4 | | 1.2 (10) | | 0.7 – 2.4 | | 1.1 (10) | | 0.7 – 1.7 | | 1.0 (7) | |
| Unemployment rate (%) | | 6.5 – 6.7 | | 6.5 (13) | | 4.2 – 5.8 | | 5.1 (13) | | 3.7 – 5.5 | | 4.7 (13) | | 4.0 – 5.2 | | 4.6 (10) | | 3.9 – 5.1 | | 4.6 (10) | | 3.9 – 5.3 | | 4.6 (10) | | 3.8 – 5.0 | | 4.5 (7) | |
| Net operating surplus of corporations (% change) | | -4.4 – 31.5 | | 15.3 (7) | | -17.8 – 10.0 | | 0.5 (7) | | -7.9 – 6.0 | | 0.5 (7) | | -6.3 – 5.0 | | 0.9 (7) | | 1.8 – 11.5 | | 5.4 (7) | | 2.3 – 10.7 | | 5.3 (7) | | 2.5 – 5.0 | | 3.8 (3) | |
| Housing starts (thousand units) | | 45.0 – 47.9 | | 46.8 (13) | | 35.0 – 45.0 | | 40.0 (13) | | 34.8 – 45.7 | | 38.7 (13) | | 31.6 – 43.0 | | 37.7 (11) | | 29.1 – 43.0 | | 37.0 (11) | | 28.0 – 42.0 | | 35.6 (10) | | 25.0 – 38.0 | | 32.6 (7) | |
| MLS residential unit sales (thousand units) | | 112.0 – 125.1 | | 121.9 (7) | | 80.0 – 109.7 | | 101.0 (7) | | 80.0 – 104.3 | | 91.9 (7) | | 80.0 – 105.4 | | 91.8 (7) | | 85.0 – 106.3 | | 92.9 (7) | | 85.0 – 107.6 | | 92.9 (6) | | 85.0 – 109.2 | | 92.3 (4) | |
| MLS residential average sale price ($ thousand) | | 915 – 946 | | 924 (7) | | 960 – 995 | | 976 (7) | | 950 – 1,015 | | 984 (7) | | 930 – 1,030 | | 996 (7) | | 950 – 1,077 | | 1,022 (7) | | 985 – 1,061 | | 1,028 (6) | | 1,000 – 1,039 | | 1,013 (3) | |
| Retail sales (% change) | | 9.3 – 15.0 | | 12.7 (8) | | -1.4 – 7.1 | | 4.1 (8) | | 1.9 – 6.2 | | 4.7 (8) | | 2.8 – 6.0 | | 4.4 (7) | | 1.9 – 5.0 | | 3.9 (7) | | 1.6 – 5.0 | | 3.8 (7) | | 1.8 – 4.5 | | 3.5 (4) | |
| Consumer price index (% change) | | 2.7 – 3.1 | | 2.8 (11) | | 2.4 – 3.3 | | 2.8 (11) | | 1.9 – 2.9 | | 2.2 (11) | | 1.9 – 2.9 | | 2.1 (9) | | 1.9 – 2.5 | | 2.0 (9) | | 1.9 – 2.5 | | 2.0 (9) | | 2.0 – 2.0 | | 2.0 (6) | |
| | | | | | | | | | | | | | | | | | | | | | | | | | | | | | |
| United States | | | | | | | | | | | | | | | | | | | | | | | | | | | | | |
| | | | | | | | | | | | | | | | | | | | | | | | | | | | | | |
| Real GDP (% change) | | 5.4 – 5.9 | | 5.6 (13) | | 3.5 – 4.3 | | 3.9 (13) | | 2.1 – 3.2 | | 2.7 (13) | | 1.8 – 2.7 | | 2.3 (9) | | 1.6 – 2.7 | | 2.1 (9) | | 1.6 – 2.7 | | 2.1 (9) | | 1.5 – 2.2 | | 1.9 (6) | |
| Intended Federal Funds rate (%) | | 0.08 – 0.25 | | 0.18 (12) | | 0.09 – 1.00 | | 0.55 (12) | | 0.37 – 2.00 | | 1.33 (12) | | 0.97 – 2.25 | | 1.69 (9) | | 1.50 – 2.38 | | 1.96 (9) | | 1.50 – 2.50 | | 2.05 (8) | | 1.50 – 2.63 | | 2.13 (6) | |
| Housing starts (million units) | | 1.56 – 1.62 | | 1.59 (12) | | 1.39 – 1.69 | | 1.58 (12) | | 1.33 – 1.71 | | 1.53 (12) | | 1.32 – 1.80 | | 1.54 (9) | | 1.33 – 1.75 | | 1.51 (9) | | 1.30 – 1.77 | | 1.51 (9) | | 1.22 – 1.80 | | 1.53 (6) | |
| | | | | | | | | | | | | | | | | | | | | | | | | | | | | | |
| Canada | | | | | | | | | | | | | | | | | | | | | | | | | | | | | |
| | | | | | | | | | | | | | | | | | | | | | | | | | | | | | |
| Real GDP (% change) | | 4.5 – 5.1 | | 4.7 (13) | | 3.5 – 4.4 | | 4.1 (13) | | 1.6 – 3.5 | | 2.8 (13) | | 1.6 – 2.3 | | 2.0 (10) | | 1.4 – 2.2 | | 1.8 (10) | | 1.5 – 2.0 | | 1.7 (10) | | 1.5 – 1.8 | | 1.7 (7) | |
| Bank of Canada overnight target rate (%) | | 0.20 – 0.25 | | 0.25 (12) | | 0.30 – 1.00 | | 0.72 (12) | | 0.85 – 1.88 | | 1.53 (12) | | 1.35 – 2.25 | | 1.90 (10) | | 1.71 – 2.25 | | 2.01 (10) | | 1.75 – 2.25 | | 2.00 (9) | | 1.75 – 2.25 | | 1.96 (7) | |
| Exchange rate (US cents/C$) | | 79.0 – 81.0 | | 79.9 (13) | | 77.2 – 82.8 | | 80.1 (13) | | 76.0 – 82.8 | | 79.8 (13) | | 77.8 – 82.8 | | 79.9 (10) | | 77.8 – 82.9 | | 79.7 (10) | | 77.0 – 83.2 | | 79.6 (9) | | 77.0 – 80.0 | | 79.3 (6) | |
| Housing starts (thousand units) | | 261 – 280 | | 272 (13) | | 216 – 254 | | 232 (13) | | 199 – 230 | | 216 (13) | | 181 – 236 | | 212 (11) | | 165 – 246 | | 210 (11) | | 160 – 230 | | 206 (10) | | 159 – 225 | | 200 (7) | |
| Consumer price index (% change) | | 3.3 – 3.5 | | 3.4 (13) | | 2.4 – 4.5 | | 3.2 (13) | | 1.8 – 3.0 | | 2.3 (13) | | 2.0 – 2.8 | | 2.1 (11) | | 1.9 – 2.5 | | 2.0 (11) | | 2.0 – 2.2 | | 2.0 (11) | | 2.0 – 2.0 | | 2.0 (8) | |
1 Based on responses from participants providing forecasts. Number of respondents shown in parentheses.
Budget and Fiscal Plan - 2022/23 to 2024/25
123

PART 4 | 2021/22 UPDATED FINANCIAL FORECAST (THIRD QUARTERLY REPORT)
Table 4.1 2021/22 Forecast Update
| ($ millions) | | Budget
2020 | | | First
Quarterly
Report | | | Second
Quarterly
Report | | | Third
Quarterly
Report | |
| Revenue | | | 58,929 | | | | 65,154 | | | | 68,207 | | | | 70,220 | |
| Expense | | | (64,377 | ) | | | (65,738 | ) | | | (65,689 | ) | | | (66,453 | ) |
| Pandemic and Recovery Contingencies | | | (3,250 | ) | | | (3,250 | ) | | | (3,250 | ) | | | (3,250 | ) |
| Forecast allowance | | | (1,000 | ) | | | (1,000 | ) | | | (1,000 | ) | | | (1,000 | ) |
| Deficit | | | (9,698 | ) | | | (4,834 | ) | | | (1,732 | ) | | | (483 | ) |
| Capital Spending: | | | | | | | | | | | | | | | | |
| Taxpayer-supported capital spending | | | 8,479 | | | | 8,166 | | | | 8,141 | | | | 7,157 | |
| Self-supported capital spending | | | 4,976 | | | | 4,588 | | | | 4,582 | | | | 3,828 | |
| | | 13,455 | | | | 12,754 | | | | 12,723 | | | | 10,985 | |
| Provincial Debt: | | | | | | | | | | | | | | | | |
| Taxpayer-supported debt | | | 71,642 | | | | 65,205 | | | | 62,348 | | | | 61,731 | |
| Self-supported debt | | | 30,238 | | | | 29,649 | | | | 29,653 | | | | 28,814 | |
| Total debt (including forecast allowance) | | | 102,880 | | | | 95,854 | | | | 93,001 | | | | 91,545 | |
| Taxpayer-supported debt to GDP ratio | | | 22.8 | % | | | 19.6 | % | | | 18.2 | % | | | 17.8 | % |
| Taxpayer-supported debt to revenue ratio | | | 125.9 | % | | | 103.8 | % | | | 95.0 | % | | | 92.9 | % |
Introduction
The third-quarter fiscal outlook for 2021/22 forecasts a deficit of $483 million, which is an improvement of $1.2 billion from the second-quarter outlook reported last November. The largest change is in the net income projection for ICBC, up $1.2 billion, which includes investment earnings and thus are not expected to carry forward to future periods. Higher revenues from taxation and natural resources are partly offset by higher statutory spending (wildfire, floods and other).
Operating forecast changes are illustrated in Chart 4.1, and additional detail is provided in Table 4.2, including changes in each quarter since budget.
The Province’s operating results have improved significantly from the budget projection of a $9.7 billion deficit. However, these results are not final as there remains much uncertainty in the last quarter of the fiscal year; as a result, the forecast allowance is unchanged at $1.0 billion.
Capital spending for the year is lower by $1.7 billion due to scheduling changes in taxpayer-supported and self-supported projects.
Due to the changes in operating results and capital spending, the taxpayer-supported debt forecast is lower by $617 million from the Second Quarterly Report (see Table 4.5 on page 134 for details on the debt forecast).
Budget and Fiscal Plan - 2022/23 to 2024/25
125
2021/22 Updated Financial Forecast (Third Quarterly Report)
Table 4.2 2021/22 Financial Forecast Changes
| | | ($ millions) | |
| 2021/22 deficit at Budget 2021 (April 20, 2021) | | | (9,698 | ) | | | | | | | | | | | (9,698 | ) |
| 2021/22 deficit at the First Quarterly Report (September 13, 2021) | | | | | | | (4,834 | ) | | | | | | | | |
| 2021/22 deficit at the Second Quarterly Report (November 22, 2021) | | | | | | | | | | | (1,732 | ) | | | | |
| | | | | | | | | | | | | | | | | |
| | | Q1
Update | | | Q2
Update | | | Q3
Update | | | Total
Changes | |
| Revenue changes: | | | | | | | | | | | | | | | | |
| Personal income tax – changes in preliminary 2020 tax assessment, an improvement in household income and adjustments in 2021 relating to one-time gains in 2020 tax results | | | 2,170 | | | | 912 | | | | (572 | ) | | | 2,510 | |
| Corporate income tax – increase in installments reflecting an improved federal government outlook for 2021 national corporate taxable income, and a higher prior year settlement payment reflecting stronger 2020 tax assessments | | | 1,234 | | | | 214 | | | | 207 | | | | 1,655 | |
| Provincial sales tax – higher year-to-date results, retail sales, consumer expenditures and lower take up on tax measure relating to rebates on machinery & equipment | | | 64 | | | | 200 | | | | 305 | | | | 569 | |
| Property transfer tax – higher year-to-date activity reflecting strong housing market and demand | | | 360 | | | | 665 | | | | 250 | | | | 1,275 | |
| Fuel and carbon taxes – higher volume sales in most fuel types | | | 94 | | | | 36 | | | | (11 | ) | | | 119 | |
| Employer health tax – mainly expected improvement in employee compensation | | | 127 | | | | 35 | | | | 45 | | | | 207 | |
| Other taxation sources – mainly lower tobacco and insurance premium tax, reflecting year-to-date results partly offset by higher property tax revenues | | | (23 | ) | | | 1 | | | | (43 | ) | | | (65 | ) |
| Natural gas royalties – higher natural gas prices and natural gas liquids royalties, partly offset by increased utilization of royalty and infrastructure programs/credits | | | 172 | | | | 209 | | | | 82 | | | | 463 | |
| Mining – higher coal and copper prices and improved mine profitability | | | 92 | | | | 242 | | | | 70 | | | | 404 | |
| Electricity sales under the Columbia River Treaty – changes in Mid-C electricity prices | | | 149 | | | | (16 | ) | | | (57 | ) | | | 76 | |
| Forests – higher stumpage rates partly offset by impacts of deferrals in old-growth forests | | | 230 | | | | (1 | ) | | | 414 | | | | 643 | |
| Other natural resources – higher petroleum royalties, lower Oil and Gas Commission levies and changes in water rentals revenue | | | 4 | | | | (7 | ) | | | 8 | | | | 5 | |
| Fees, licences, investment earnings and miscellaneous revenue: | | | | | | | | | | | | | | | | |
| Post-secondary institutions | | | 126 | | | | 165 | | | | 73 | | | | 364 | |
| Other sources – mainly higher revenue from motor vehicles fees, changes in health authorities and taxpayer-supported Crowns forecasts | | | 42 | | | | (69 | ) | | | (7 | ) | | | (34 | ) |
| Canada health and social transfers – mainly additional pandemic relief one-time funding supporting the recovery of health care systems and a higher B.C. share of national population | | | 557 | | | | 38 | | | | — | | | | 595 | |
| Other federal government transfers – higher transfers relating to the Canada-Wide Early Learning and Child Care Agreement and long term care as well as transfers to taxpayer-supported entities | | | 356 | | | | 14 | | | | (13 | ) | | | 357 | |
| Commercial Crown corporation net income – mainly due to improvements in BCLC and ICBC | | | 471 | | | | 415 | | | | 1,262 | | | | 2,148 | |
| Total revenue changes | | | 6,225 | | | | 3,053 | | | | 2,013 | | | | 11,291 | |
| | | | | | | | | | | | | | | | | |
| Less: expense increases (decreases): | | | | | | | | | | | | | | | | |
| Consolidated Revenue Fund changes: | | | | | | | | | | | | | | | | |
| Statutory spending: | | | | | | | | | | | | | | | | |
| Fire management costs | | | 745 | | | | (169 | ) | | | 89 | | | | 665 | |
| Emergency Program Act | | | 33 | | | | 23 | | | | 466 | | | | 522 | |
| B.C. Recovery Benefit and Increased Employment Incentive tax credit1 | | | — | | | | 37 | | | | 12 | | | | 49 | |
| Housing and shelter related costs to support vulnerable populations during the pandemic | | | 25 | | | | (25 | ) | | | 181 | | | | 181 | |
| Sustainable Services Negotiating Mandate and RCMP Collective Agreement | | | — | | | | — | | | | 163 | | | | 163 | |
| Other statutory spending | | | 27 | | | | — | | | | 16 | | | | 43 | |
| Refundable tax credits – mainly reflects preliminary 2020 tax assessment information | | | 44 | | | | 17 | | | | (86 | ) | | | (25 | ) |
| Management of public debt (net) and other expense changes | | | (31 | ) | | | (36 | ) | | | (1 | ) | | | (68 | ) |
| Spending funded by third party recoveries: | | | | | | | | | | | | | | | | |
| Canada-Wide Early Learning and Child Care Agreement and health initiatives | | | 221 | | | | — | | | | — | | | | 221 | |
| Other spending funded by third party recoveries | | | 27 | | | | 18 | | | | 16 | | | | 61 | |
| Changes in spending profile of service delivery agencies: | | | | | | | | | | | | | | | | |
| School districts | | | 19 | | | | — | | | | (17 | ) | | | 2 | |
| Universities | | | 162 | | | | 168 | | | | (28 | ) | | | 302 | |
| Colleges | | | 28 | | | | 7 | | | | (20 | ) | | | 15 | |
| Health authorities and hospital societies | | | 1,412 | | | | 756 | | | | 236 | | | | 2,404 | |
| Other service delivery agencies 2 | | | 98 | | | | (93 | ) | | | 11 | | | | 16 | |
| (Increase) decrease in transfers to service delivery agencies (elimination) | | | (1,449 | ) | | | (752 | ) | | | (274 | ) | | | (2,475 | ) |
| Total expense changes | | | 1,361 | | | | (49 | ) | | | 764 | | | | 2,076 | |
| Total changes | | | 4,864 | | | | 3,102 | | | | 1,249 | | | | 9,215 | |
| 2021/22 deficit at the First Quarterly Report | | | (4,834 | ) | | | | | | | | | | | | |
| 2021/22 deficit at the Second Quarterly Report | | | | | | | (1,732 | ) | | | | | | | | |
| 2021/22 deficit at the Third Quarterly Report | | | | | | | | | | | (483 | ) | | | (483 | ) |
| 1 | Total program spending for the B.C. Recovery Benefit is forecast at $62 million, however $28 million is included in the Pandemic and Recovery Contingencies. Spending in 2020/21 was $1.297 billion, bringing the total program spending to $1.359 billion. |
Total program spending for the Increased Employment Incentive tax credit is forecast at $22 million, however $7 million is included in the Pandemic and Recovery Contingencies.
| 2 | Includes BC Transportation Financing Authority, BC Transit, BC Housing Management Commission, Community Living BC, and other entities. |
Budget and Fiscal Plan - 2022/23 to 2024/25
126
2021/22 Updated Financial Forecast (Third Quarterly Report)
Chart 4.1 2021/22 Deficit – Major Changes from the Second Quarterly Report
Deficit decreased by $1.2 billion
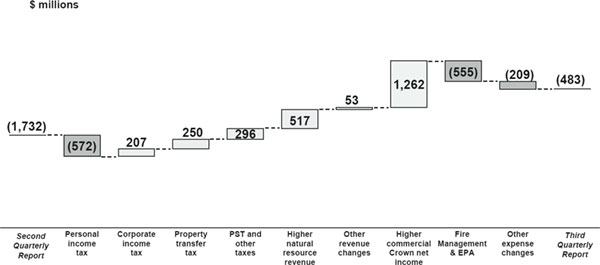
Revenue
Total government revenue is now forecast to be $2,013 million higher than the Second Quarterly Report. Major changes include:
| • | $572 million decrease in personal income tax revenue, mainly reflecting weaker 2020 preliminary personal tax assessments results partly offset by an improvement in household income, |
| • | $207 million higher corporate income tax revenues mainly due to stronger 2020 preliminary corporate tax assessments results and higher corporate income tax payments from the federal government, |
| • | $546 million higher other taxation revenue sources mainly reflecting year-to-date information; |
| • | $517 million increase in natural resource revenue mainly due to the effects of higher stumpage rates and higher natural gas, coal and metal prices; |
| • | $66 million increase in revenue from fees, licences, investment earnings and miscellaneous sources mainly due to improvements in post-secondary institutions projections; |
| • | $13 million decrease in federal government contributions mainly due to reduced transfers to post-secondary institutions; and |
| • | $1,262 million increase in commercial Crown corporations’ net income mainly due to higher net income projections from the Insurance Corporation of BC ($1,207 million) as a result of higher investment earnings, and lower claims and operating costs. |
Budget and Fiscal Plan - 2022/23 to 2024/25
127
2021/22 Updated Financial Forecast (Third Quarterly Report)
Expense
Total government spending is now forecast to be $764 million higher than the Second Quarterly Report. Major changes include:
| • | $466 million statutory spending under the Emergency Program Act mainly for flood relief from the extreme weather events of November 2021; |
| • | $181 million statutory spending through the Housing Priority Initiatives Special Account to fund housing and shelter related costs to support vulnerable populations during the pandemic; |
| • | $163 million for the signed agreements under the Sustainable Services Negotiating Mandate and the RCMP Collective Agreement; |
| • | $89 million in statutory spending for wildfires management; and |
| • | $43 million increase in other expenses. |
These spending increases are partly offset by
| • | $86 million in lower refundable tax transfers mainly reflecting stronger 2020 tax assessments; and |
| • | $92 million in lower net spending by various service delivery agencies. |
Table 4.2 provides a detailed breakdown of changes in the operating results by quarter from Budget 2021.
Pandemic and Recovery Contingencies
Budget 2021 allocated $3.25 billion to support ongoing measures related to the pandemic and short-term funding initiatives or new programs where the demand and costs may fluctuate as the pandemic and related health orders continue to evolve. This section provides an update on the notional allocations of the Province’s pandemic measures as of December 31, 2021 (Table 4.3) as well as actual spending through the third quarter.
The total allocations to support pandemic and recovery initiatives remain unchanged at $3.25 billion; however the forecasts for various initiatives have been revised to reflect updated information available. Major changes in the forecast allocations include:
| • | $269 million increase to respond to additional waves of the pandemic including vaccine booster programs, preparation for child vaccines, and deployment of rapid testing; and |
| • | $191 million decrease to reflect internal ministry savings to accommodate costs associated with child care health and safety grants ($18 million) and the K-12 Recovery Plan ($18 million). The decrease is also a result of actual costs for temporary housing measures for vulnerable populations that are now funded through other appropriations ($155 million). |
Actual expenditures in the three quarters for Pandemic and Recovery Contingencies measures totalled $1.79 billion. This includes:
| • | $880 million for ongoing health-related measures to respond to the COVID-19 pandemic; |
Budget and Fiscal Plan - 2022/23 to 2024/25
128
2021/22 Updated Financial Forecast (Third Quarterly Report)
| • | $499 million for the Small and Medium Sized Business Grant Program, including the Circuit Breaker Grants; the Increased Employment Incentive; and the BC Recovery Benefit; and |
| • | $408 million across a number of other measures including the provision of COVID-19 related paid sick leave for workers, temporary housing, improving child care and K-12 health and safety, and initiatives to support the safe delivery of court services. |
Note that the actual spending (April – December 2021) is based on unaudited ministry reports and subject to normal changes from quarterly estimation and adjustment processes.
An overview and description of the Province’s COVID-19 pandemic response measures is provided starting on page 130.
Table 4.3 2021/22 Pandemic and Recovery Contingencies
| $ millions | | | | Updated Forecast | |
| Category | | Measures | | Q2 | | | Q3 | |
| Health and Safety | | Health related COVID-19 management | | | 1,775 | | | | 2,044 | |
| | | Temporary housing, meals and supports for vulnerable populations | | | 265 | | | | 40 | 1 |
| | | Small and Medium Sized Business Grants Program (Including Circuit Breaker Business Relief Grant and COVID-19 Closure Relief Grant) | | | 470 | | | | 477 | |
| | | Tourism, Art and other sector supports | | | 130 | | | | 164 | |
| | | Increased Employment Incentive tax credit | | | 4 | | | | 7 | 2 |
| Supports for Businesses and People | | B.C. Recovery Benefit | | | 34 | | | | 28 | 3 |
| | | COVID-19 Paid Sick Leave | | | 15 | | | | 15 | |
| | | Childcare health & safety grants and K-12 Recovery Plan | | | 46 | | | | 8 | 4 |
| | | Non-Profit Recovery and Resiliency Fund | | | — | �� | | | 30 | |
| | | Essential services including justice services, agriculture/food security, and temporary assistance for vulnerable populations | | | 129 | | | | 77 | 5 |
| | | Skills training and youth employment initiatives | | | 70 | | | | 70 | |
| Preparing for Recovery | | Community infrastructure programs and CleanBC recovery investments | | | 70 | | | | 40 | 6 |
| Unallocated | | Reserve for additional health or recovery measures | | | 242 | | | | 250 | |
| Total | | | | | 3,250 | | | | 3,250 | |
| 1 | Total notional allocation for temporary housing measures was at $225 million. Based on actual spending, $155 million of this has been accommodated through the Housing Priority Initiatives Special Account . |
| 2 | Total program spending is forecast at $22 million, however $15 million is funded through statutory authority. |
| 3 | Total program spending is forecast at $62 million, however $34 million is funded through statutory authority. |
| 4 | These programs have been funded in full and $36 million is funded through internal ministry savings. |
| 5 | Reduced allocation reflects lower than projected funding requirements for temporary income assistance. |
| 6 | Total spending reflects reallocation of funding for programming that has been reprofiled to 2022/23. |
Government Employment (FTEs)
The projection of full-time equivalent (FTE) staff utilization in core government remains unchanged since the Second Quarterly Report at 33,400 FTEs. Further details on FTEs are provided in Table A13 in the appendix.
Budget and Fiscal Plan - 2022/23 to 2024/25
129
2021/22 Updated Financial Forecast (Third Quarterly Report)
COVID-19 Pandemic Response Measures
The following provides an overview of the Province’s pandemic response measures.
Health and Safety of British Columbians
COVID-19 Management ($2,044 million): Funding related to health related COVID-19 response measures includes:
| • | Storage, distribution, and administration of COVID-19 vaccines to British Columbians; |
| • | Population health measures such as contact tracing, flu immunization, laboratory testing and research costs, and a rural and remote response framework to ensure people in rural, remote, and Indigenous communities have access to critical health care during the pandemic; |
| • | Additional funding for long-term care and assisted living facilities, including addressing increased COVID-19 related costs, implementing single-site work orders to help prevent the spread of disease between facilities, and hiring of up to three full-time equivalent staff at each of the 584 facilities; |
| • | Implementing the Hospital at Home model of care, which allows British Columbians to receive health services outside of a hospital; and other increased operating costs including personal protective equipment, continuing support for HealthLinkBC, overtime salary costs in the healthcare system, and additional human resources capacity for health authorities to respond to COVID-19. |
Supports for People and Businesses
Temporary housing, meals and health supports for vulnerable populations ($40 million): Spaces at hotels, motels and community centres are providing shelter to assist a range of people, including people experiencing homelessness, to self-isolate and follow health orders as well as receive food and support services. Nearly 2,200 leased spaces are currently secured at sites throughout B.C.’s health regions to enable safe physical distancing in homeless shelters and help people self-isolate, with close to 100 spaces in communities secured for women and children leaving violent or unstable situations.
Small and Medium Sized Business Recovery Grant (incl. Circuit Breaker Business Relief Grant and COVID-19 Closure Relief Grant) ($477 million): Funding to provide relief for businesses affected by the March 30, 2021 provincial health orders and to help them position themselves for a strong recovery. The Small and Medium Sized Business Recovery Grant Program supported businesses to diversify their services and products, modify physical space, move online, or offset fixed costs. The Circuit Breaker Business and COVID-19 Closure Relief Grants are providing funding to affected businesses to help offset expenses such as rent, insurance, employee wages, maintenance and utilities or other unexpected costs that resulted from the ‘circuit breaker’ restrictions. As of December 31, over 32,000 grants to businesses have been awarded through these programs in fiscal 2020/21 and 2021/22.
Budget and Fiscal Plan - 2022/23 to 2024/25
130
2021/22 Updated Financial Forecast (Third Quarterly Report)
Tourism, Art, and other sector supports ($164 million): Funding that helps to improve destinations by investing in tourism infrastructure, such as multi-use trails and wayfinding signage; supports for major anchor attractions and companies that service tourism attractions; and supports the safe restart of fairs, festivals and events. Funding provides financial relief for B.C. Pavilion Corporation to maintain operations during prolonged closures and health restrictions on major events. There are also supports to help the arts, culture and music sectors to manage through the pandemic by providing additional funding for the Arts Impacts and Amplify BC programs, as well as Resilience Supplement grants to existing BC Arts Council clients.
Increased Employment Incentive ($7 million): A refundable tax credit incentive to employers intended to help B.C. businesses that were affected by the COVID-19 pandemic to recover and help create good jobs for people. Employers were able to increase their payroll by hiring new employees, increasing the hours of existing employees, or giving existing employees a raise. As of December 31, 2021, over 3,200 applications have been approved, benefiting over 51,000 British Columbians.
B.C. Recovery Benefit ($28 million): A one-time tax-free payment of up to $1,000 for eligible families and single parents with annual household incomes under $175,000 and up to $500 for eligible individuals earning less than $87,500 annually. The benefit helped individuals and families, including those in receipt of income and disability assistance. The program closed on June 30, 2021 and nearly 2 million applications were approved, benefiting over 2.7 million British Columbians.
COVID-19 Paid Sick Leave ($15 million): Supports for workers to provide three days of paid sick leave related to COVID-19. The province reimburses employers without an existing sick leave program up to $200 per day for each worker to cover costs. As of December 31, 2021, over 7,752 applications have been approved, benefiting over 20,118 British Columbians.
Child Care Health and Safety Grants and K-12 Recovery Plan ($8 million): Funding for health and safety grants to child care providers for increased cleaning supplies, personal protective equipment, or space enhancement to ensure child care centres remain safe.
Funding also supports health and safety measures, First Nations and Métis students, mental health services, rapid response teams, and addressing learning impacts on students in the K-12 sector.
Non-Profit Recovery and Resilience Fund ($30 million): Funding to provide support to charitable organizations that have been disproportionately affected by the COVID-19 pandemic. The Fund will be administered by the Vancouver Foundation and the United Way BC to support organizations across B.C.
Budget and Fiscal Plan - 2022/23 to 2024/25
131
2021/22 Updated Financial Forecast (Third Quarterly Report)
Other Essential services ($77 million): Funding to ensure continuity of services includes:
| • | Continued supports for increased access to overdose prevention services and outreach teams, as well as enhanced drug checking services throughout B.C.; |
| • | Justice sector initiatives to support the safe operations of courts through facilitating virtual court proceedings, electronic filing solutions and other system enhancements; and |
| • | Continued supports for farmers and agricultural sector workers to safely access and accommodate temporary foreign workers. |
Preparing for Recovery
Skills Training and Youth Employment Initiatives ($70 million): Funding to support work-integrated learning, micro-credential training and short-term skills training programs to help re-train people to secure good-paying jobs and strengthen B.C.’s labour force. Funding also supports Indigenous People to gain new skills, transfer their training knowledge to other jobs, and participate in the labour market. Funding is also provided to create targeted employment opportunities for youth including: expansion of the Innovator Skills Initiative; the Recreation Sites and Trails B.C. youth program; the Clean Coast, Clean Waters program; and natural resource sector employment opportunities.
Community Infrastructure Programs ($40 million): Funding to support CleanBC and cleantech jobs and invest in community infrastructure, including the Centre for Innovation and Clean Energy and the B.C. Parks Infrastructure Investment and Campsite Expansion.
Budget and Fiscal Plan - 2022/23 to 2024/25
132
2021/22 Updated Financial Forecast (Third Quarterly Report)
Provincial Capital Spending
Capital spending is projected to total $11.0 billion in 2021/22 — $1.7 billion lower than the Second Quarterly Report forecast (see Table 4.4).
The forecast for taxpayer-supported capital spending is $984 million lower than in the Second Quarterly Report, mainly due to changes in the timing of capital project spending in the health and transportation sectors, and timing of maintenance and acquisition of core government assets.
Self-supported capital spending is expected to be $754 million lower than the forecast in the Second Quarterly Report, primarily due to updates to BC Hydro’s capital plan to reflect timing of Site C cash flows. Project completion is forecast to meet the project in-service date in 2025 and within the approved budget of $16 billion.
Table 4.4 2021/22 Capital Spending Update
| | | ($ millions) | |
| | | Q1 | | | Q2 | | | Q3 | | | Total | |
| | | Update | | | Update | | | Update | | | Changes | |
| Taxpayer-supported capital spending at Budget 2021 | | | 8,479 | | | | | | | | | | | | 8,479 | |
| Taxpayer-supported capital spending at the First Quarterly Report | | | | | | | 8,166 | | | | | | | | | |
| Taxpayer-supported capital spending at the Second Quarterly Report | | | | | | | | | | | 8,141 | | | | | |
| Taxpayer-supported changes | | | | | | | | | | | | | | | | |
| School districts | | | (17 | ) | | | (5 | ) | | | (139 | ) | | | (161 | ) |
| Post-secondary institutions | | | (213 | ) | | | (1 | ) | | | 5 | | | | (209 | ) |
| Health sector | | | 97 | | | | 73 | | | | (364 | ) | | | (194 | ) |
| Transportation sector | | | (206 | ) | | | (61 | ) | | | (210 | ) | | | (477 | ) |
| Social housing | | | 29 | | | | (25 | ) | | | (3 | ) | | | 1 | |
| Other net adjustments | | | (3 | ) | | | (6 | ) | | | (273 | ) | | | (282 | ) |
| Total taxpayer-supported changes | | | (313 | ) | | | (25 | ) | | | (984 | ) | | | (1,322 | ) |
| | | | | | | | | | | | | | | | | |
| Taxpayer-supported capital spending - updated forecast | | | 8,166 | | | | 8,141 | | | | 7,157 | | | | 7,157 | |
| | | | | | | | | | | | | | | | | |
| Self-supported capital spending at Budget 2021 | | | 4,976 | | | | | | | | | | | | 4,976 | |
| Self-supported capital spending at the First Quarterly Report | | | | | | | 4,588 | | | | | | | | | |
| Self-supported capital spending at the Second Quarterly Report | | | | | | | | | | | 4,582 | | | | | |
| BC Hydro | | | (367 | ) | | | — | | | | (739 | ) | | | (1,106 | ) |
| Liquor Distribution Branch | | | (18 | ) | | | (4 | ) | | | — | | | | (22 | ) |
| Other net adjustments | | | (3 | ) | | | (2 | ) | | | (15 | ) | | | (20 | ) |
| Total self-supported changes | | | (388 | ) | | | (6 | ) | | | (754 | ) | | | (1,148 | ) |
| | | | | | | | | | | | | | | | | |
| Self-supported capital spending - updated forecast | | | 4,588 | | | | 4,582 | | | | 3,828 | | | | 3,828 | |
| | | | | | | | | | | | | | | | | |
| 2021/22 total capital spending at the First Quarterly Report | | | 12,754 | | | | | | | | | | | | | |
| 2021/22 total capital spending at the Second Quarterly Report | | | | | | | 12,723 | | | | | | | | | |
| 2021/22 total capital spending at the Third Quarterly Report | | | | | | | | | | | 10,985 | | | | 10,985 | |
Budget and Fiscal Plan - 2022/23 to 2024/25
133
2021/22 Updated Financial Forecast (Third Quarterly Report)
Provincial Debt
The provincial debt is projected to total $91.5 billion by the end of the fiscal year — $11.3 billion lower than the projection at Budget 2021, and $1.5 billion lower than the projection in the Second Quarterly Report.
Taxpayer-supported debt is projected to be $61.7 billion — $9.9 billion lower than the projection in Budget 2021 largely due to improved operating results. The forecast is $617 million lower than the Second Quarterly Report due to improved operating results as well as lower capital spending, partially offset by changes in working capital balances.
Self-supported debt is projected to be $28.8 billion — $1.4 billion lower than the projection in Budget 2021, and $839 million lower than in the Second Quarterly Report mainly due mainly to lower capital spending.
Details on changes in provincial debt by quarter are shown in Table 4.5.
Table 4.5 2021/22 Provincial Debt Update 1
| | | ($ millions) | |
| | | Q1 | | | Q2 | | | Q3 | | | Total | |
| | | Update | | | Update | | | Update | | | Changes | |
| Taxpayer-supported debt at Budget 2021 | | | 71,642 | | | | | | | | | | | | 71,642 | |
| Taxpayer supported debt at the First Quarterly Report | | | | | | | 65,205 | | | | | | | | | |
| Taxpayer supported debt at the Second Quarterly Report | | | | | | | | | | | 62,348 | | | | | |
| Taxpayer-supported changes: | | | | | | | | | | | | | | | | |
| Lower debt level from 2020/21 | | | (206 | ) | | | — | | | | | | | | (206 | ) |
| Annual deficit (before forecast allowance) | | | (4,864 | ) | | | (3,102 | ) | | | (1,249 | ) | | | (9,215 | ) |
| Non-cash items | | | (55 | ) | | | 3 | | | | 66 | | | | 14 | |
| Changes in cash balances 2 | | | (1,523 | ) | | | (67 | ) | | | 835 | | | | (755 | ) |
| Changes in other working capital balances 3 | | | 524 | | | | 334 | | | | 715 | | | | 1,573 | |
| Taxpayer-supported capital spending | | | (313 | ) | | | (25 | ) | | | (984 | ) | | | (1,322 | ) |
| Total taxpayer-supported changes | | | (6,437 | ) | | | (2,857 | ) | | | (617 | ) | | | (9,911 | ) |
| Taxpayer-supported debt - updated forecast | | | 65,205 | | | | 62,348 | | | | 61,731 | | | | 61,731 | |
| | | | | | | | | | | | | | | | | |
| Self-supported debt at Budget 2021 | | | 30,238 | | | | | | | | | | | | 30,238 | |
| Self-supported debt at the First Quarterly Report | | | | | | | 29,649 | | | | | | | | | |
| Self-supported debt at the Second Quarterly Report | | | | | | | | | | | 29,653 | | | | | |
| Self-supported changes: | | | | | | | | | | | | | | | | |
| Lower debt level from 2020/21 | | | (174 | ) | | | — | | | | — | | | | (174 | ) |
| Lower capital spending | | | (388 | ) | | | (6 | ) | | | (754 | ) | | | (1,148 | ) |
| Changes in internal financing | | | (27 | ) | | | 10 | | | | (85 | ) | | | (102 | ) |
| Total self-supported changes | | | (589 | ) | | | 4 | | | | (839 | ) | | | (1,424 | ) |
| Self-supported debt - updated forecast | | | 29,649 | | | | 29,653 | | | | 28,814 | | | | 28,814 | |
| | | | | | | | | | | | | | | | | |
| Forecast Allowance - updated forecast | | | 1,000 | | | | 1,000 | | | | 1,000 | | | | 1,000 | |
| 2021/22 provincial debt forecast at the First Quarterly Report | | | 95,854 | | | | | | | | | | | | | |
| 2021/22 provincial debt forecast at the Second Quarterly Report | | | | | | | 93,001 | | | | | | | | | |
| 2021/22 provincial debt forecast at the Third Quarterly Report | | | | | | | | | | | 91,545 | | | | 91,545 | |
| 1 | Provincial debt is prepared in accordance with Generally Accepted Accounting Principles and presented consistent with the Debt Summary Report included in the Public Accounts . Debt is shown net of sinking funds and unamortized discounts, excludes accrued interest, and includes non-guaranteed debt directly incurred by commercial Crown corporations and debt guaranteed by the Province. |
| 2 | Reflects changes in cash balances at April 1, 2021 and includes all cash balances from the Consolidated Revenue Fund, School Districts, Universities, Colleges, Health Authorities, Hospital Societies and other taxpayer-supported agencies. |
| 3 | Changes in other working capital balances include changes in accounts receivables, accounts payable, accrued liabilities, deferred revenue, investments, restricted assets and other assets. |
Budget and Fiscal Plan - 2022/23 to 2024/25
134
2021/22 Updated Financial Forecast (Third Quarterly Report)
Risks to the Fiscal Forecast
The forecasts of revenues, expenditures, capital spending and debt are estimates based on multiple economic, financial and external factors. In addition, capital spending and debt figures may be influenced by several factors including design development, procurement activity, weather, geotechnical conditions and interest rates. As a result, the actual operating results, capital expenditure and debt figures may differ from the current forecast.
Revenues can be volatile due in part to the influence of the cyclical nature of the natural resource sector in the economy. Changes in energy or commodity prices, such as natural gas and lumber, may have a significant effect on revenue and the fiscal forecast.
The spending forecast in the fiscal plan is based on ministry and service delivery agency plans and strategies. The main risks are changes to planning assumptions, such as utilization or demand rates for government services in the health care, education, or community social services sectors, and costs associated with natural disaster responses.
Supplementary Schedules
The following tables provide the financial results for the nine months ended December 31, 2021, and the 2021/22 full-year forecast.
Table 4.6 2021/22 Operating Statement
| | | Year-to-Date to December 31 | | | Full Year | |
| | | 2021/22 | | | Actual | | | 2021/22 | | | Actual | |
| ($ millions) | | Budget | | | Actual | | | Variance | | | 2020/21 | | | Budget | | | Forecast | | | Variance | | | 2020/21 | |
| Revenue | | | 43,917 | | | | 52,716 | | | | 8,799 | | | | 44,159 | | | | 58,929 | | | | 70,220 | | | | 11,291 | | | | 62,156 | |
| Expense | | | (45,425 | ) | | | (48,265 | ) | | | (2,840 | ) | | | (47,161 | ) | | | (67,627 | ) | | | (69,703 | ) | | | (2,076 | ) | | | (67,624 | ) |
| Surplus (deficit) before forecast allowance | | | (1,508 | ) | | | 4,451 | | | | 5,959 | | | | (3,002 | ) | | | (8,698 | ) | | | 517 | | | | 9,215 | | | | (5,468 | ) |
| Forecast allowance | | | — | | | | — | | | | — | | | | — | | | | (1,000 | ) | | | (1,000 | ) | | | — | | | | — | |
| Surplus (deficit) | | | (1,508 | ) | | | 4,451 | | | | 5,959 | | | | (3,002 | ) | | | (9,698 | ) | | | (483 | ) | | | 9,215 | | | | (5,468 | ) |
| Accumulated surplus (deficit) beginning of the year | | | (38 | ) | | | 2,525 | | | | 2,563 | | | | 7,993 | | | | (38 | ) | | | 2,525 | | | | 2,563 | | | | 7,993 | |
| Accumulated surplus(deficit) before comprehensive income | | | (1,546 | ) | | | 6,976 | | | | 8,522 | | | | 4,991 | | | | (9,736 | ) | | | 2,042 | | | | 11,778 | | | | 2,525 | |
| Accumulated other comprehensive income from self-supported Crown agencies | | | 210 | | | | 475 | | | | 265 | | | | 965 | | | | 280 | | | | 995 | | | | 715 | | | | 682 | |
| Accumulated surplus (deficit) end of period | | | (1,336 | ) | | | 7,451 | | | | 8,787 | | | | 5,956 | | | | (9,456 | ) | | | 3,037 | | | | 12,493 | | | | 3,207 | |
Budget and Fiscal Plan - 2022/23 to 2024/25
135
2021/22 Updated Financial Forecast (Third Quarterly Report)
Table 4.7 2021/22 Revenue by Source
| | | Year-to-Date to December 31 | | | Full Year | |
| | | 2021/22 | | | Actual | | | 2021/22 | | | Actual | |
| ($ millions) | | Budget | | | Actual | | | Variance | | | 2020/21 | | | Budget | | | Forecast | | | Variance | | | 2020/21 | |
| Taxation | | | | | | | | | | | | | | | | | | | | | | | | | | | | | | | | |
| Personal income | | | 8,308 | | | | 10,671 | | | | 2,363 | | | | 8,142 | | | | 11,170 | | | | 13,680 | | | | 2,510 | | | | 11,118 | |
| Corporate income | | | 2,789 | | | | 3,482 | | | | 693 | | | | 3,408 | | | | 3,409 | | | | 5,064 | | | | 1,655 | | | | 4,805 | |
| Employer health | | | 1,451 | | | | 1,575 | | | | 124 | | | | 1,369 | | | | 1,923 | | | | 2,130 | | | | 207 | | | | 2,156 | |
| Sales 1 | | | 6,325 | | | | 6,621 | | | | 296 | | | | 5,743 | | | | 7,872 | | | | 8,441 | | | | 569 | | | | 7,694 | |
| Fuel | | | 757 | | | | 798 | | | | 41 | | | | 693 | | | | 983 | | | | 1,039 | | | | 56 | | | | 936 | |
| Carbon | | | 1,400 | | | | 1,441 | | | | 41 | | | | 1,156 | | | | 1,985 | | | | 2,048 | | | | 63 | | | | 1,683 | |
| Tobacco | | | 622 | | | | 588 | | | | (34 | ) | | | 577 | | | | 780 | | | | 740 | | | | (40 | ) | | | 711 | |
| Property | | | 2,208 | | | | 2,245 | | | | 37 | | | | 1,709 | | | | 2,970 | | | | 3,020 | | | | 50 | | | | 2,313 | |
| Property transfer | | | 1,599 | | | | 2,573 | | | | 974 | | | | 1,493 | | | | 1,975 | | | | 3,250 | | | | 1,275 | | | | 2,098 | |
| Insurance premium | | | 536 | | | | 482 | | | | (54 | ) | | | 495 | | | | 715 | | | | 640 | | | | (75 | ) | | | 652 | |
| | | | 25,995 | | | | 30,476 | | | | 4,481 | | | | 24,785 | | | | 33,782 | | | | 40,052 | | | | 6,270 | | | | 34,166 | |
| Natural resource | | | | | | | | | | | | | | | | | | | | | | | | | | | | | | | | |
| Natural gas royalties | | | 210 | | | | 484 | | | | 274 | | | | 93 | | | | 286 | | | | 749 | | | | 463 | | | | 196 | |
| Forests | | | 894 | | | | 1,474 | | | | 580 | | | | 705 | | | | 1,204 | | | | 1,847 | | | | 643 | | | | 1,304 | |
| Other natural resource revenues2 | | | 785 | | | | 1,169 | | | | 384 | | | | 655 | | | | 1,042 | | | | 1,527 | | | | 485 | | | | 903 | |
| | | | 1,889 | | | | 3,127 | | | | 1,238 | | | | 1,453 | | | | 2,532 | | | | 4,123 | | | | 1,591 | | | | 2,403 | |
| Other revenue | | | | | | | | | | | | | | | | | | | | | | | | | | | | | | | | |
| Post-secondary education fees | | | 1,664 | | | | 1,750 | | | | 86 | | | | 1,604 | | | | 2,508 | | | | 2,539 | | | | 31 | | | | 2,418 | |
| Fees and licenses 3 | | | 1,502 | | | | 1,480 | | | | (22 | ) | | | 1,373 | | | | 2,129 | | | | 2,185 | | | | 56 | | | | 1,911 | |
| Investment earnings | | | 858 | | | | 920 | | | | 62 | | | | 930 | | | | 1,174 | | | | 1,369 | | | | 195 | | | | 1,264 | |
| Miscellaneous 4 | | | 2,415 | | | | 2,628 | | | | 213 | | | | 2,353 | | | | 3,409 | | | | 3,457 | | | | 48 | | | | 3,136 | |
| | | | 6,439 | | | | 6,778 | | | | 339 | | | | 6,260 | | | | 9,220 | | | | 9,550 | | | | 330 | | | | 8,729 | |
| Contributions from the federal government | | | | | | | | | | | | | | | | | | | | | | | | | | | | | | | | |
| Health and social transfers | | | 5,954 | | | | 6,529 | | | | 575 | | | | 5,799 | | | | 7,939 | | | | 8,534 | | | | 595 | | | | 7,743 | |
| COVID-19 related funding | | | 155 | | | | 213 | | | | 58 | | | | 1,783 | | | | 175 | | | | 322 | | | | 147 | | | | 2,603 | |
| Other federal government contributions 5 | | 1,555 | | | | 1,631 | | | | 76 | | | | 1,148 | | | | 2,416 | | | | 2,626 | | | | 210 | | | | 2,548 | |
| | | | 7,664 | | | | 8,373 | | | | 709 | | | | 8,730 | | | | 10,530 | | | | 11,482 | | | | 952 | | | | 12,894 | |
| Commercial Crown corporation net income | | | | | | | | | | | | | | | | | | | | | | | | | | | | | | | | |
| BC Hydro | | | 304 | | | | 306 | | | | 2 | | | | 309 | | | | 712 | | | | 681 | | | | (31 | ) | | | 688 | |
| Liquor Distribution Branch | | | 897 | | | | 960 | | | | 63 | | | | 929 | | | | 1,099 | | | | 1,153 | | | | 54 | | | | 1,161 | |
| BC Lottery Corporation 6 | | | 516 | | | | 900 | | | | 384 | | | | 301 | | | | 771 | | | | 1,129 | | | | 358 | | | | 420 | |
| ICBC 7 | | | 165 | | | | 1,692 | | | | 1,527 | | | | 1,265 | | | | 154 | | | | 1,904 | | | | 1,750 | | | | 1,528 | |
| Other 8 | | | 48 | | | | 104 | | | | 56 | | | | 127 | | | | 129 | | | | 146 | | | | 17 | | | | 167 | |
| | | | 1,930 | | | | 3,962 | | | | 2,032 | | | | 2,931 | | | | 2,865 | | | | 5,013 | | | | 2,148 | | | | 3,964 | |
| Total revenue | | | 43,917 | | | | 52,716 | | | | 8,799 | | | | 44,159 | | | | 58,929 | | | | 70,220 | | | | 11,291 | | | | 62,156 | |
| 1 | Includes provincial sales tax and HST/PST housing transition tax related to prior years. |
| 2 | Columbia River Treaty, other energy and minerals, water rental and other resources. |
| 3 | Healthcare-related, motor vehicle, and other fees. |
| 4 | Includes reimbursements for health care and other services provided to external agencies, and other recoveries. |
| 5 | Includes contributions for health, education, community development, housing and social service programs, and transportation projects. |
| 6 | Net of payments to the federal government and 2021/22 is also net of payments under the gaming revenue sharing agreement with First Nations. |
| 7 | Does not include non-controlling interest. |
| 8 | Includes Columbia Power Corporation, BC Railway Company, Columbia Basin power projects, and post-secondary institutions’ self-supported subsidiaries. |
Budget and Fiscal Plan - 2022/23 to 2024/25
136
2021/22 Updated Financial Forecast (Third Quarterly Report)
Table 4.8 2021/22 Expense by Ministry, Program and Agency
| | | Year-to-Date to December 31 | | | Full Year | |
| | | 2021/22 | | | Actual | | | 2021/22 | | | Actual | |
| ($ millions) | | Budget | | | Actual | | | Variance | | | 2020/21 1 | | | Budget | | | Forecast | | | Variance | | | 2020/21 1 | |
| Office of the Premier | | | 11 | | | | 10 | | | | (1 | ) | | | 8 | | | | 15 | | | | 15 | | | | — | | | | 11 | |
| Advanced Education and Skills Training | | | 1,940 | | | | 1,902 | | | | (38 | ) | | | 1,770 | | | | 2,592 | | | | 2,592 | | | | — | | | | 2,412 | |
| Agriculture, Food and Fisheries | | | 88 | | | | 102 | | | | 14 | | | | 93 | | | | 100 | | | | 100 | | | | — | | | | 150 | |
| Attorney General | | | 947 | | | | 975 | | | | 28 | | | | 860 | | | | 1,272 | | | | 1,272 | | | | — | | | | 1,495 | |
| Children and Family Development | | | 1,704 | | | | 1,542 | | | | (162 | ) | | | 1,498 | | | | 2,393 | | | | 2,393 | | | | — | | | | 2,440 | |
| Citizens’ Services | | | 441 | | | | 475 | | | | 34 | | | | 522 | | | | 604 | | | | 604 | | | | — | | | | 665 | |
| Education | | | 5,338 | | | | 5,340 | | | | 2 | | | | 5,074 | | | | 7,132 | | | | 7,132 | | | | — | | | | 6,756 | |
| Energy, Mines and Low Carbon Innovation | | | 64 | | | | 110 | | | | 46 | | | | 67 | | | | 109 | | | | 109 | | | | — | | | | 252 | |
| Environment and Climate Change Strategy | | | 187 | | | | 235 | | | | 48 | | | | 214 | | | | 301 | | | | 328 | | | | 27 | | | | 708 | |
| Finance | | | 716 | | | | 601 | | | | (115 | ) | | | 953 | | | | 990 | | | | 1,399 | | | | 409 | | | | 1,781 | |
| Forests, Lands, Natural Resource Operations and Rural Development | | | 613 | | | | 1,139 | | | | 526 | | | | 678 | | | | 888 | | | | 1,553 | | | | 665 | | | | 1,077 | |
| Health | | | 17,116 | | | | 17,371 | | | | 255 | | | | 16,179 | | | | 23,873 | | | | 23,873 | | | | — | | | | 24,155 | |
| Indigenous Relations and Reconciliation | | | 95 | | | | 170 | | | | 75 | | | | 92 | | | | 179 | | | | 179 | | | | — | | | | 314 | |
| Jobs, Economic Recovery and Innovation | | | 60 | | | | 53 | | | | (7 | ) | | | 49 | | | | 79 | | | | 79 | | | | — | | | | 251 | |
| Labour | | | 13 | | | | 14 | | | | 1 | | | | 13 | | | | 17 | | | | 17 | | | | — | | | | 35 | |
| Mental Health and Addictions | | | 10 | | | | 7 | | | | (3 | ) | | | 5 | | | | 13 | | | | 13 | | | | — | | | | 42 | |
| Municipal Affairs | | | 250 | | | | 305 | | | | 55 | | | | 150 | | | | 308 | | | | 308 | | | | — | | | | 526 | |
| Public Safety and Solicitor General | | | 670 | | | | 781 | | | | 111 | | | | 702 | | | | 901 | | | | 1,423 | | | | 522 | | | | 1,057 | |
| Social Development and Poverty Reduction | | | 3,237 | | | | 3,195 | | | | (42 | ) | | | 2,752 | | | | 4,360 | | | | 4,360 | | | | — | | | | 4,483 | |
| Tourism, Arts, Culture and Sport | | | 125 | | | | 118 | | | | (7 | ) | | | 131 | | | | 162 | | | | 162 | | | | — | | | | 352 | |
| Transportation and Infrastructure | | | 708 | | | | 704 | | | | (4 | ) | | | 695 | | | | 949 | | | | 949 | | | | — | | | | 1,232 | |
| | | | | | | | | | | | | | | | | | | | | | | | | | | | | | | | | |
| Total ministries and Office of the Premier | | | 34,333 | | | | 35,150 | | | | 817 | | | | 32,505 | | | | 47,237 | | | | 48,860 | | | | 1,623 | | | | 50,194 | |
| Management of public funds and debt | | | 1,005 | | | | 970 | | | | (35 | ) | | | 944 | | | | 1,340 | | | | 1,285 | | | | (55 | ) | | | 1,246 | |
| Contingencies - General Programs and CleanBC 2 | | | — | | | | — | | | | — | | | | — | | | | 1,000 | | | | 1,000 | | | | — | | | | — | |
| Pandemic and Recovery Contingencies 2 | | — | | | | 1,787 | | | | 1,787 | | | | 4,250 | | | | 3,250 | | | | 3,250 | | | | — | | | | 2,041 | |
| Funding to agencies for capital expenditures | | | 1,978 | | | | 1,306 | | | | (672 | ) | | | 1,188 | | | | 3,448 | | | | 2,595 | | | | (853 | ) | | | 1,974 | |
| Refundable tax credit transfers | | | 1,396 | | | | 1,447 | | | | 51 | | | | 1,678 | | | | 1,871 | | | | 1,846 | | | | (25 | ) | | | 2,358 | |
| Legislative Assembly and other appropriations | | | 128 | | | | 115 | | | | (13 | ) | | | 148 | | | | 174 | | | | 174 | | | | — | | | | 207 | |
| Total appropriations | | | 38,840 | | | | 40,775 | | | | 1,935 | | | | 40,713 | | | | 58,320 | | | | 59,010 | | | | 690 | | | | 58,020 | |
| | | | | | | | | | | | | | | | | | | | | | | | | | | | | | | | | |
| Elimination of transactions between appropriations 3 | | | (11 | ) | | | (10 | ) | | | 1 | | | | (11 | ) | | | (14 | ) | | | (15 | ) | | | (1 | ) | | | (15 | ) |
| Prior year liability adjustments | | | — | | | | — | | | | — | | | | — | | | | — | | | | (13 | ) | | | (13 | ) | | | (123 | ) |
| Consolidated revenue fund expense | | | 38,829 | | | | 40,765 | | | | 1,936 | | | | 40,702 | | | | 58,306 | | | | 58,982 | | | | 676 | | | | 57,882 | |
| Expenses recovered from external entities | | | 2,211 | | | | 2,614 | | | | 403 | | | | 2,691 | | | | 3,535 | | | | 3,817 | | | | 282 | | | | 4,557 | |
| Elimination of funding provided to service delivery agencies | | | (24,771 | ) | | | (25,128 | ) | | | (357 | ) | | | (24,092 | ) | | | (33,682 | ) | | | (35,303 | ) | | | (1,621 | ) | | | (34,096 | ) |
| Total direct program spending | | | 16,269 | | | | 18,251 | | | | 1,982 | | | | 19,301 | | | | 28,159 | | | | 27,496 | | | | (663 | ) | | | 28,343 | |
| | | | | | | | | | | | | | | | | | | | | | | | | | | | | | | | | |
| Service delivery agency expense | | | | | | | | | | | | | | | | | | | | | | | | | | | | | | | | |
| School districts | | | 5,301 | | | | 5,272 | | | | (29 | ) | | | 4,980 | | | | 7,482 | | | | 7,484 | | | | 2 | | | | 7,083 | |
| Universities | | | 3,943 | | | | 3,988 | | | | 45 | | | | 3,761 | | | | 5,510 | | | | 5,812 | | | | 302 | | | | 5,272 | |
| Colleges and institutes | | | 1,089 | | | | 1,088 | | | | (1 | ) | | | 1,024 | | | | 1,497 | | | | 1,512 | | | | 15 | | | | 1,431 | |
| Health authorities and hospital societies | | | 14,192 | | | | 15,008 | | | | 816 | | | | 13,755 | | | | 18,271 | | | | 20,675 | | | | 2,404 | | | | 19,252 | |
| Other service delivery agencies | | | 4,631 | | | | 4,658 | | | | 27 | | | | 4,340 | | | | 6,708 | | | | 6,724 | | | | 16 | | | | 6,243 | |
| Total service delivery agency expense | | | 29,156 | | | | 30,014 | | | | 858 | | | | 27,860 | | | | 39,468 | | | | 42,207 | | | | 2,739 | | | | 39,281 | |
| Total expense | | | 45,425 | | | | 48,265 | | | | 2,840 | | | | 47,161 | | | | 67,627 | | | | 69,703 | | | | 2,076 | | | | 67,624 | |
| 1 | Restated to reflect government’s current organization and accounting policies. |
| 2 | Contingencies for the prior fiscal year are reported in the relevant ministries’ spending; the current year forecast is not yet allocated to ministry lines. |
| 3 | Reflects payments made under an agreement where an expense from a voted appropriation is recorded as revenue by a special account. |
Budget and Fiscal Plan - 2022/23 to 2024/25
137
2021/22 Updated Financial Forecast (Third Quarterly Report)
Table 4.9 2021/22 Expense by Function
| | | Year-to-Date to December 31 | | | Full Year | |
| | | 2021/22 | | | Actual | | | 2021/22 | | | Actual | |
| ($ millions) | | Budget | | | Actual | | | Variance | | | 2020/21 | | | Budget | | | Forecast | | | Variance | | | 2020/21 | |
| Health 1 | | | 18,820 | | | | 19,264 | | | | 445 | | | | 17,601 | | | | 26,106 | | | | 26,268 | | | | 162 | | | | 25,605 | |
| Education 2 | | | 11,326 | | | | 11,060 | | | | (266 | ) | | | 10,270 | | | | 15,805 | | | | 16,061 | | | | 256 | | | | 14,943 | |
| Social services | | | 5,265 | | | | 5,112 | | | | (153 | ) | | | 4,403 | | | | 7,172 | | | | 7,242 | | | | 70 | | | | 7,789 | |
| Protection of persons and property | | | 1,422 | | | | 1,625 | | | | 203 | | | | 1,387 | | | | 1,935 | | | | 2,454 | | | | 519 | | | | 2,258 | |
| Transportation | | | 1,623 | | | | 1,658 | | | | 35 | | | | 1,571 | | | | 2,336 | | | | 2,373 | | | | 37 | | | | 3,360 | |
| Natural resources and economic development | | | 2,188 | | | | 2,739 | | | | 550 | | | | 2,195 | | | | 3,467 | | | | 4,008 | | | | 541 | | | | 4,191 | |
| Other | | | 1,640 | | | | 1,655 | | | | 15 | | | | 1,166 | | | | 2,218 | | | | 2,446 | | | | 228 | | | | 2,841 | |
| Contingencies - General Programs and CleanBC 3 | | | — | | | | — | | | | — | | | | — | | | | 1,000 | | | | 1,000 | | | | — | | | | — | |
| Pandemic and Recovery Contingencies 3 | | | — | | | | 1,787 | | | | 1,787 | | | | 4,250 | | | | 3,250 | | | | 3,250 | | | | — | | | | — | |
| General government | | | 1,098 | | | | 1,326 | | | | 228 | | | | 2,288 | | | | 1,531 | | | | 1,905 | | | | 374 | | | | 3,915 | |
| Debt servicing | | | 2,043 | | | | 2,039 | | | | (4 | ) | | | 2,030 | | | | 2,807 | | | | 2,696 | | | | (111 | ) | | | 2,722 | |
| Total expense | | | 45,425 | | | | 48,265 | | | | 2,839 | | | | 47,161 | | | | 67,627 | | | | 69,703 | | | | 2,076 | | | | 67,624 | |
| 1 | Payments for healthcare services by the Ministry of Social Development and Poverty Reduction and the Ministry of Children and Family Development made on behalf of their clients are reported in the Health function. |
| 2 | Payments for training costs by the Ministry of Social Development and Poverty Reduction made on behalf of its clients are reported in the Education function. |
| 3 | Contingencies for the prior fiscal year are reported in the relevant functions; the current year forecast is not yet allocated to functions. |
Budget and Fiscal Plan - 2022/23 to 2024/25
138
2021/22 Updated Financial Forecast (Third Quarterly Report)
Table 4.10 2021/22 Capital Spending
| | | Year-to-Date to December 31 | | | Full Year | |
| | | 2021/22 | | | Actual | | | 2021/22 | | | Actual | |
| ($ millions) | | Budget | | | Actual | | | Variance | | | 2020/21 | | | Budget | | | Forecast | | | Variance | | | 2020/21 | |
| Taxpayer-supported | | | | | | | | | | | | | | | | | | | | | | | | | | | | | | | | |
| Education | | | | | | | | | | | | | | | | | | | | | | | | | | | | | | | | |
| School districts | | | 902 | | | | 722 | | | | (180 | ) | | | 711 | | | | 1,197 | | | | 1,036 | | | | (161 | ) | | | 944 | |
| Post-secondary institutions | | | 792 | | | | 596 | | | | (196 | ) | | | 567 | | | | 1,263 | | | | 1,054 | | | | (209 | ) | | | 904 | |
| Health | | | 1,153 | | | | 699 | | | | (454 | ) | | | 597 | | | | 2,245 | | | | 2,051 | | | | (194 | ) | | | 1,162 | |
| BC Transportation Financing Authority | | | 1,740 | | | | 1,142 | | | | (598 | ) | | | 1,034 | | | | 2,162 | | | | 1,716 | | | | (446 | ) | | | 1,285 | |
| BC Transit | | | 97 | | | | 48 | | | | (49 | ) | | | 92 | | | | 113 | | | | 82 | | | | (31 | ) | | | 107 | |
| Government ministries | | | 270 | | | | 257 | | | | (13 | ) | | | 194 | | | | 641 | | | | 457 | | | | (184 | ) | | | 389 | |
| Social housing 1 | | | 416 | | | | 487 | | | | 71 | | | | 355 | | | | 671 | | | | 672 | | | | 1 | | | | 572 | |
| Other | | | 150 | | | | 42 | | | | (108 | ) | | | 52 | | | | 187 | | | | 89 | | | | (98 | ) | | | 65 | |
| Total taxpayer-supported | | | 5,520 | | | | 3,993 | | | | (1,527 | ) | | | 3,602 | | | | 8,479 | | | | 7,157 | | | | (1,322 | ) | | | 5,428 | |
| | | | | | | | | | | | | | | | | | | | | | | | | | | | | | | | | |
| Self-supported | | | | | | | | | | | | | | | | | | | | | | | | | | | | | | | | |
| BC Hydro | | | 3,530 | | | | 2,587 | | | | (943 | ) | | | 2,383 | | | | 4,738 | | | | 3,632 | | | | (1,106 | ) | | | 3,207 | |
| Columbia Basin power projects 2 | | | 7 | | | | 5 | | | | (2 | ) | | | 3 | | | | 9 | | | | 9 | | | | — | | | | 7 | |
| BC Railway Company | | | 8 | | | | 2 | | | | (6 | ) | | | 1 | | | | 11 | | | | 4 | | | | (7 | ) | | | 1 | |
| ICBC | | | 49 | | | | 41 | | | | (8 | ) | | | 72 | | | | 68 | | | | 68 | | | | — | | | | 100 | |
| BC Lottery Corporation | | | 72 | | | | 31 | | | | (41 | ) | | | 31 | | | | 96 | | | | 83 | | | | (13 | ) | | | 73 | |
| Liquor Distribution Branch | | | 40 | | | | 16 | | | | (24 | ) | | | 14 | | | | 54 | | | | 32 | | | | (22 | ) | | | 22 | |
| Other3 | | | — | | | | — | | | | — | | | | — | | | | — | | | | — | | | | — | | | | 65 | |
| Total self-supported | | | 3,706 | | | | 2,682 | | | | (1,024 | ) | | | 2,504 | | | | 4,976 | | | | 3,828 | | | | (1,148 | ) | | | 3,475 | |
| Total capital spending | | | 9,226 | | | | 6,675 | | | | (2,551 | ) | | | 6,106 | | | | 13,455 | | | | 10,985 | | | | (2,470 | ) | | | 8,903 | |
| 1 | Includes BC Housing Management Commission and Provincial Rental Housing Corporation. |
| 2 | Joint ventures of the Columbia Power Corporation and Columbia Basin Trust. |
| 3 | Includes post-secondary institutions’ self-supported subsidiaries. |
Budget and Fiscal Plan - 2022/23 to 2024/25
139
2021/22 Updated Financial Forecast (Third Quarterly Report)
Table 4.11 2021/22 Provincial Debt 1
| | | Year-to-Date to December 31 | | | Full Year | |
| | | 2021/22 | | | Actual | | | 2021/22 | | | Actual | |
| ($ millions) | | Budget | | | Actual | | | Variance | | | 2020/21 | | | Budget | | | Forecast | | | Variance | | | 2020/21 | |
| Taxpayer-supported debt | | | | | | | | | | | | | | | | | | | | | | | | | | | | | | | | |
| Provincial government | | | | | | | | | | | | | | | | | | | | | | | | | | | | | | | | |
| Operating | | | 13,404 | | | | 6,063 | | | | (7,341 | ) | | | 4,312 | | | | 14,939 | | | | 5,719 | | | | (9,220 | ) | | | 8,746 | |
| Capital2 | | | 36,219 | | | | 35,716 | | | | (503 | ) | | | 35,827 | | | | 37,180 | | | | 37,058 | | | | (122 | ) | | | 33,872 | |
| Total provincial government | | | 49,623 | | | | 41,779 | | | | (7,844 | ) | | | 40,139 | | | | 52,119 | | | | 42,777 | | | | (9,342 | ) | | | 42,618 | |
| Taxpayer-supported entities | | | | | | | | | | | | | | | | | | | | | | | | | | | | | | | | |
| BC Transportation Financing Authority | | | 15,014 | | | | 14,410 | | | | (604 | ) | | | 13,205 | | | | 15,538 | | | | 14,956 | | | | (582 | ) | | | 13,321 | |
| Health authorities and hospital societies | | | 1,842 | | | | 1,846 | | | | 4 | | | | 1,811 | | | | 1,841 | | | | 1,869 | | | | 28 | | | | 1,875 | |
| Post-secondary institutions | | | 857 | | | | 930 | | | | 73 | | | | 854 | | | | 858 | | | | 899 | | | | 41 | | | | 882 | |
| Social housing 3 | | | 1,002 | | | | 1,026 | | | | 24 | | | | 1,364 | | | | 990 | | | | 958 | | | | (32 | ) | | | 770 | |
| Other | | | 350 | | | | 257 | | | | (94 | ) | | | 281 | | | | 296 | | | | 272 | | | | (24 | ) | | | 284 | |
| Total taxpayer-supported entities | | | 19,065 | | | | 18,469 | | | | (596 | ) | | | 17,515 | | | | 19,523 | | | | 18,954 | | | | (569 | ) | | | 17,132 | |
| Total taxpayer-supported debt | | | 68,688 | | | | 60,248 | | | | (8,440 | ) | | | 57,654 | | | | 71,642 | | | | 61,731 | | | | (9,911 | ) | | | 59,750 | |
| Self-supported debt | | | 29,595 | | | | 28,725 | | | | (870 | ) | | | 27,559 | | | | 30,238 | | | | 28,814 | | | | (1,424 | ) | | | 27,350 | |
| Total debt before forecast allowance | | | 98,283 | | | | 88,973 | | | | (9,310 | ) | | | 85,213 | | | | 101,880 | | | | 90,545 | | | | (11,335 | ) | | | 87,100 | |
| Forecast allowance | | | — | | | | — | | | | — | | | | — | | | | 1,000 | | | | 1,000 | | | | — | | | | — | |
| Total provincial debt | | | 98,283 | | | | 88,973 | | | | (9,310 | ) | | | 85,213 | | | | 102,880 | | | | 91,545 | | | | (11,335 | ) | | | 87,100 | |
| 1 | Provincial debt is prepared in accordance with Generally Accepted Accounting Principles and presented consistent with the Debt Summary Report included in the Public Accounts . Debt is shown net of sinking funds and unamortized discounts, excludes accrued interest, and includes non-guaranteed debt directly incurred by commercial Crown corporations and debt guaranteed by the Province. |
| 2 | Includes debt incurred by the government to fund the building of capital assets in the education, health, social housing and other sectors. |
| 3 | Includes the BC Housing Management Commission and the Provincial Rental Housing Corporation. BC Housing Management Commission has been approved for up to $2 billion for future borrowing to fund investments in affordable housing through HousingHub. The debt forecast reflects projects that have been approved as of December 2021. |
Budget and Fiscal Plan - 2022/23 to 2024/25
140
2021/22 Updated Financial Forecast (Third Quarterly Report)
Table 4.12 2021/22 Statement of Financial Position
| | | Actual | | | Year-to-Date | | | Forecast | |
| | | March 31, | | | December 31, | | | March 31, | |
| ($ millions) | | 2021 | | | 2021 | | | 2022 | |
| Financial assets: | | | | | | | | | | | | |
| Cash and temporary investments | | | 6,560 | | | | 5,359 | | | | 3,289 | |
| Other financial assets | | | 15,399 | | | | 17,017 | | | | 15,748 | |
| Sinking funds | | | 492 | | | | 509 | | | | 513 | |
| Investments in commercial Crown corporations: | | | | | | | | | | | | |
| Retained earnings | | | 9,623 | | | | 11,462 | | | | 12,529 | |
| Recoverable capital loans | | | 26,301 | | | | 27,690 | | | | 27,540 | |
| Total investments in commercial Crown corporations | | | 35,924 | | | | 39,152 | | | | 40,069 | |
| Total financial assets | | | 58,375 | | | | 62,037 | | | | 59,619 | |
| Liabilities: | | | | | | | | | | | | |
| Accounts payable and accrued liabilities | | | 13,092 | | | | 11,298 | | | | 13,506 | |
| Deferred revenue | | | 12,185 | | | | 13,731 | | | | 12,956 | |
| Debt: | | | | | | | | | | | | |
| Taxpayer-supported debt | | | 59,750 | | | | 60,248 | | | | 61,731 | |
| Self-supported debt | | | 27,350 | | | | 28,725 | | | | 28,814 | |
| Forecast allowance | | | — | | | | — | | | | 1,000 | |
| Total provincial debt | | | 87,100 | | | | 88,973 | | | | 91,545 | |
| Add: debt offset by sinking funds | | | 492 | | | | 509 | | | | 513 | |
| Less : guarantees and non-guaranteed debt | | | (1,335 | ) | | | (1,332 | ) | | | (1,278 | ) |
| Financial statement debt | | | 86,257 | | | | 88,150 | | | | 90,780 | |
| Total liabilities | | | 111,534 | | | | 113,179 | | | | 117,242 | |
| Net liabilities | | | (53,159 | ) | | | (51,142 | ) | | | (57,623 | ) |
| Capital and other non-financial assets: | | | | | | | | | | | | |
| Tangible capital assets | | | 52,781 | | | | 54,838 | | | | 57,319 | |
| Other non-financial assets | | | 3,585 | | | | 3,755 | | | | 3,341 | |
| Total capital and other non-financial assets | | | 56,366 | | | | 58,593 | | | | 60,660 | |
| Accumulated surplus (deficit) | | | 3,207 | | | | 7,451 | | | | 3,037 | |
Changes in Financial Position
| | | Year-to-Date | | | Forecast | |
| | | December 31, | | | March 31, | |
| ($ millions) | | 2021 | | | 2022 | |
| Deficit/(Surplus) for the period | | | (4,451 | ) | | | 483 | |
| Comprehensive income (increase) decrease | | | 207 | | | | (313 | ) |
| Decrease (increase) in accumulated surplus | | | (4,244 | ) | | | 170 | |
| | | | | | | | | |
| Capital and other non-financial asset changes: | | | | | | | | |
| Taxpayer-supported capital investments | | | 3,993 | | | | 7,157 | |
| Less: amortization and other accounting changes | | | (1,936 | ) | | | (2,619 | ) |
| Increase in net capital assets | | | 2,057 | | | | 4,538 | |
| Increase (decrease) in other non-financial assets | | | 170 | | | | (244 | ) |
| Increase in capital and other non-financial assets | | | 2,227 | | | | 4,294 | |
| | | | | | | | | |
| Increase (decrease) in net liabilities | | | (2,017 | ) | | | 4,464 | |
| | | | | | | | | |
| Investment and working capital changes: | | | | | | | | |
| Investment in commercial Crown corporations: | | | | | | | | |
| Increase in retained earnings | | | 1,839 | | | | 2,906 | |
| Self-supported capital investments | | | 2,682 | | | | 3,828 | |
| Less: loan repayments and other accounting changes | | | (1,293 | ) | | | (2,589 | ) |
| Increase in investment in commercial Crown corporations | | | 3,228 | | | | 4,145 | |
| Increase (decrease) in cash and temporary investments | | | (1,201 | ) | | | (3,271 | ) |
| Increase (decrease) in other working capital | | | 1,883 | | | | (815 | ) |
| Increase (decrease) in Investment and working capital | | | 3,910 | | | | 59 | |
| | | | | | | | | |
| Increase in financial statement debt | | | 1,893 | | | | 4,523 | |
| Decrease in sinking fund debt | | | (17 | ) | | | (21 | ) |
| Decrease in guarantees and non-guaranteed debt | | | (3 | ) | | | (57 | ) |
| Increase in total provincial debt | | | 1,873 | | | | 4,445 | |
Budget and Fiscal Plan - 2022/23 to 2024/25
141

APPENDIX
| A1 | Tax Expenditures | 145 |
| A1.1.1 | Personal Income Tax – Tax Expenditures (Refundable Tax Credits) | 147 |
| A1.1.2 | Corporate Income Tax – Tax Expenditures (Refundable Tax Credits) | 148 |
| A1.2.1 | Personal Income Tax – Tax Expenditures (Deductions and Non-Refundable Tax Credits) | 149 |
| A1.2.2 | Corporate Income Tax – Tax Expenditures (Deductions and Non-Refundable Tax Credits) | 151 |
| A1.3 | Property Taxes – Tax Expenditures | 151 |
| A1.4 | Consumption Taxes – Tax Expenditures | 153 |
| A1.5 | Employer Health Tax – Tax Expenditures | 154 |
| A1.6 | Insurance Premium Tax – Tax Expenditures | 154 |
| A2 | Interprovincial Comparisons of Tax Rates – 2022 | 155 |
| A3 | Comparison of Provincial and Federal Taxes by Province – 2022 | 156 |
| A4 | Interprovincial Comparisons of Provincial Personal Income Taxes Payable – 2022 | 158 |
| A4.1 | Net Provincial Taxes Since Budget 2016 | 159 |
| A5 | Material Assumptions – Revenue | 160 |
| A6 | Natural Gas Price Forecasts – 2022/23 to 2024/25 | 166 |
| A7 | Material Assumptions – Expense | 168 |
| A8 | Operating Statement – 2015/16 to 2024/25 | 171 |
| A9 | Revenue by Source – 2015/16 to 2024/25 | 172 |
| A10 | Revenue by Source Supplementary Information – 2015/16 to 2024/25 | 173 |
| A11 | Expense by Function – 2015/16 to 2024/25 | 174 |
| A12 | Expense by Function Supplementary Information – 2015/16 to 2024/25 | 175 |
| A13 | Full-Time Equivalents (FTEs) 2015/16 to 2024/25 | 176 |
| A14 | Capital Spending – 2015/16 to 2024/25 | 177 |
| A15 | Statement of Financial Position – 2015/16 to 2024/25 | 178 |
| A16 | Changes in Financial Position – 2015/16 to 2024/25 | 179 |
| A17 | Provincial Debt – 2015/16 to 2024/25 | 180 |
| A18 | Provincial Debt Supplementary Information – 2015/16 to 2024/25 | 181 |
| A19 | Key Provincial Debt Indicators – 2015/16 to 2024/25 | 182 |
Budget and Fiscal Plan - 2022/23 to 2024/25
143

Appendix
A1: Tax Expenditures
Introduction
Tax expenditures reduce the amount of tax a taxpayer pays and are used to deliver government programs or benefits through the tax system. Tax expenditures are usually made by offering special tax rates, exemptions or credits. Governments introduce tax expenditures primarily to achieve social policy objectives such as transfers to lower-income families or to promote economic development and job creation.
Reporting tax expenditures improves government accountability by providing a more complete picture of government activities. Beginning with Budget 2012, refundable tax transfers are accounted for in a voted appropriation. For transparency and consistency with previous tax expenditure reports, Tables A1.1.1 and A1.1.2 also report on these tax transfers.
The Role of Tax Expenditure Programs
Using the tax system to deliver programs can reduce administration costs and compliance costs for recipients. In certain situations, the tax system allows intended beneficiaries to be readily identified from information that is already collected. In these cases, setting up a separate expenditure program would result in costly overlap and duplication of effort. An example is the climate action tax credit, which is delivered through the income tax system by the Canada Revenue Agency. If this were a direct provincial expenditure program, a provincial agency or office would have to be established to duplicate much of the work already done by the Canada Revenue Agency. In addition, it would require individuals to undertake a separate, time-consuming application process to qualify for the benefit.
There are several potential drawbacks to tax expenditure programs. First, their overall cost often receives less public scrutiny than is the case for spending programs because annual budget appropriations by the legislature are not typically required. Second, tax expenditure programs do not always effectively target those who are intended to benefit from them. Some tax expenditure programs that are intended to provide tax relief for lower-income earners may, in reality, provide the greatest benefit to higher-income earners who pay the most taxes. Finally, costs are often more difficult to control under a tax expenditure program because the benefits tend to be more open-ended and enforcement is often more difficult than for spending programs.
Tax Expenditure Reporting
Not all tax reductions, credits, exemptions and refunds are classed as tax expenditures.
The emphasis is on tax reductions, credits, exemptions and refunds that are close equivalents to spending programs. By implication, the list does not include tax measures designed to meet broad tax policy objectives such as improving fairness in the tax system or measures designed to simplify the administration of a tax. The list also does not include anything that is not intended to be part of a tax base.
Tax expenditures that cost less than $2 million annually are generally not included. Where practical, smaller items have been presented together as an aggregate figure or have been excluded to ensure taxpayer confidentiality is maintained.
Budget and Fiscal Plan - 2022/23 to 2024/25
144
Appendix
British Columbia Tax Expenditures
Tables A1.1.1 to A1.6 report tax expenditure estimates.
The cost of individual tax expenditures cannot be added together to reach a total tax expenditure figure for two reasons: in some cases, the programs interact with one another so that eliminating one program could increase or decrease the cost of another; and eliminating certain tax expenditure programs could change the choices taxpayers make, which in turn would affect the cost estimates.
The estimates for each tax expenditure are based on a static analysis of the costs and do not consider any behavioural changes, which could change the costs over time.
In addition, estimates are generally recalculated each year using current data sources and using refinements to the methods of estimation, which can result in significant changes to the value of a given tax expenditure from prior years’ reports.
Tables A1.1.1 and A1.1.2 list tax programs delivered through refundable personal and corporate income tax credits, respectively. Refundable tax credits can be used to reduce income tax liabilities with any remainder refunded to the taxpayer. These tax credits are reported in a voted appropriation.
Tables A1.2.1 and A1.2.2 list tax expenditures that are deductions, exemptions or non-refundable tax credits for personal and corporate income tax, respectively. Deductions reduce taxable income, whereas non-refundable tax credits can only be used to reduce income taxes payable. The tables include both provincial measures and federal measures. Federal measures are deductions and exemptions that reduce British Columbia income tax. Under the tax collection agreement between British Columbia and the federal government, the federal government has sole responsibility for determining income subject to tax, including British Columbia tax.
Table A1.3 lists property tax exemptions and grants. Property tax exemptions can reduce the tax owing or remove a property from tax. Grants reduce the final tax owing and may be refunded after full payment has been received. Exemptions are used to define the tax base; estimates for property tax expenditures for government entities, municipalities, colleges, schools, hospitals and similar public facilities are not shown.
Table A1.4 lists consumption tax exemptions. Fuel tax estimates include point-of-sale exemptions for certain individuals and businesses, and refunds if fuel is purchased then subsequently used for an exempt purpose. Provincial sales tax exemptions are typically point-of-sale exemptions and either apply to everyone at the point of sale or apply in certain circumstances with appropriate documentation.
Table A1.5 reports employer health tax expenditures.
Table A1.6 reports an insurance premium tax exemption for marine insurance.
More information on British Columbia tax expenditures in Tables A1.1.1 to A1.6 can be found at https://www2.gov.bc.ca/gov/content/taxes. Information on federal tax expenditures in Tables A1.2.1 and A1.2.2 can be found at https://www.canada.ca/en/ services/taxes/income-tax.html.
Budget and Fiscal Plan - 2022/23 to 2024/25
145
Appendix
Table A1.1.1 Personal Income Tax – Tax Expenditures (Refundable Tax Credits)
| | | | 2020/21 | | 2021/22 | | 2022/23 | |
| | | | Actual Cost1 | | Estimated Cost2 | | Planned Cost | |
| | | | ($ millions) | | ($ millions) | | ($ millions) | |
| BC Child Opportunity Benefit | | 146 | | 425 | | 425 | |
| • | Tax-free monthly payment made to eligible families to help with the cost of raising children under age 18. | | | | | | | |
| • | The maximum benefit is $1,600 for a family's first child, $1,000 for a second child and $800 for each subsequent child. | | | | | | | |
| • | Started October 1, 2020. | | | | | | | |
| BC Recovery Benefit | | 1,307 | | 52 | | — | |
| • | Provided a one-time tax-free payment to British Columbians of $500 per individual or $1,000 per family. | | | | | | | |
| • | The benefit was reduced between $62,500 and $87,500 of net income for individuals and $125,000 and $175,000 of family net income for families. | | | | | | | |
| Climate action tax credit | | 783 | | 330 | | 363 | |
| • | Helps offset the impact of the carbon taxes paid by low- to moderate-income individuals and families. | | | | | | | |
| • | The benefit varies based on the composition of the family and their family net income. | | | | | | | |
| • | Includes a one-time enhanced payment in July 2020 made as part of B.C.'s COVID-19 Action Plan. | | | | | | | |
| • | Introduced in 2008 with the carbon tax. | | | | | | | |
| Early childhood tax benefit | | 137 | | — | | — | |
| • | Tax-free monthly payment made to eligible families to help with the cost of raising children under age 6. | | | | | | | |
| • | The maximum benefit was $660 per year per child under the age of 6 and was reduced between family net income of $100,000 and $150,000. | | | | | | | |
| • | The early childhood tax benefit was replaced with the BC Child Opportunity Benefit effective October 1, 2020. | | | | | | | |
| Emergency Benefit for Workers | | 645 | | — | | — | |
| • | Provided a one-time tax-free payment of $1,000 to British Columbians who lost income or employment between March 1, 2020 and September 26, 2020 due to the COVID-19 pandemic. | | | | | | | |
| • | Introduced as part of B.C.'s COVID-19 Action Plan and ended on December 2, 2020. | | | | | | | |
| Home renovation tax credit for seniors and persons with disabilities | | 4 | | 2 | | 3 | |
| • | Assists eligible individuals 65 and over and persons with disabilities with the cost of certain permanent home renovations to improve accessibility or be more functional or mobile at home. | | | | | | | |
| • | Recipients may receive up to 10 per cent of qualifying renovation expenses, up to a maximum of $10,000 of qualifying renovation expenses or $1,000. | | | | | | | |
| • | Introduced in 2012. | | | | | | | |
| Sales tax credit | | 65 | | 9 | | 50 | |
| • | Helps offset the cost of provincial sales tax for low-income individuals and families. | | | | | | | |
| • | The maximum benefit is $75 for individuals and $150 for couples. | | | | | | | |
| • | Reintroduced in 2013 in conjunction with reimplementation of the provincial sales tax. | | | | | | | |
| Small business venture capital tax credit | | 29 | | 33 | | 33 | |
| • | Encourages investors to make early-stage equity investments that help B.C. small businesses develop and grow. | | | | | | | |
| • | Individuals receive a credit of up to 30 per cent of their investment and may claim a benefit of up to $120,000 per tax year. | | | | | | | |
| • | A temporary tax credit budget increase of $2.5 million for the 2022 to 2024 years supports additional investments in clean technology. | | | | | | | |
| • | Introduced in 1979. | | | | | | | |
| Training tax credits 3 | | 12 | | 8 | | 12 | |
| • | Provides refundable income tax credits for apprentices based on the apprenticeship level completed. | | | | | | | |
| • | Provides refundable income tax credits for employers of up to 15 per cent of apprentices' salaries. | | | | | | | |
| • | Includes shipbuilding and ship repair industry tax credit. | | | | | | | |
| • | Introduced in 2007. Sunset date of December 31, 2024. | | | | | | | |
| 1 | Figures include prior year adjustments of $1 million for the early childhood tax benefit, $1 million for the home renovation tax credit for seniors and persons with disabilities, -$3 million for the sales tax credit and -$1 million for the small business venture capital tax credit. |
| 2 | Figures include prior year adjustments of -$1 million for the home renovation tax credit for seniors and persons with disabilities, -$41 million for the sales tax credit, -$1 million for the small business venture capital tax credit and -$4 million for the training tax credits. |
| 3 | Training tax credits for corporations are listed in Table A1.1.2. The training tax credit for individuals includes tax credits for apprentices and unincorporated employers. |
Budget and Fiscal Plan - 2022/23 to 2024/25
146
Appendix
Table A1.1.2 Corporate Income Tax – Tax Expenditures (Refundable Tax Credits)
| | | | 2020/21 | | 2021/22 | | 2022/23 | |
| | | | Actual Cost1 | | Estimated Cost2 | | Planned Cost | |
| | | | ($ millions) | | ($ millions) | | ($ millions) | |
| Book publishing tax credit | | 2 | | 2 | | 3 | |
| • | Supports book publishers that carry out business primarily in B.C. | | | | | | | |
| • | Introduced in 2003. | | | | | | | |
| • | Sunset date of March 31, 2026. | | | | | | | |
| Film Incentive BC tax credit | | 171 | | 73 | | 120 | |
| • | Supports the production of film or television productions in B.C. The Film Incentive BC tax credit is for domestic productions meeting Canadian content requirements. | | | | | | | |
| • | Basic, regional location and film training tax credits were introduced in 1998. | | | | | | | |
| • | Digital animation and visual effects (DAVE) tax credit was introduced in 2008, and expanded to post-production activities in 2015. | | | | | | | |
| • | Distant location tax credit was introduced in 2009. | | | | | | | |
| • | B.C.-based scriptwriters tax credit was introduced in 2018. | | | | | | | |
| • | Tax credit does not have a sunset date. | | | | | | | |
| Production services tax credit | | 704 | | 582 | | 715 | |
| • | Supports the production of film or video productions in B.C. The production services tax credit is available to both domestic and foreign producers. | | | | | | | |
| • | Introduced in 1998. | | | | | | | |
| • | Regional location tax credit and digital animation and visual effects (DAVE) tax credit introduced in 2008. Post-production activities became eligible for the DAVE credit in 2015. | | | | | | | |
| • | Distant location tax credit was introduced in 2009. | | | | | | | |
| • | Tax credit does not have a sunset date. | | | | | | | |
| Interactive digital media tax credit | | 91 | | 86 | | 80 | |
| • | Supports the development of interactive digital media products in B.C. | | | | | | | |
| • | In 2017, eligibility was expanded to small business venture capital corporations, and principal business requirements were relaxed for corporations with annual qualifying B.C. labour expenditures greater than $2 million. | | | | | | | |
| • | Introduced in September 2010. Sunset date of August 31, 2023. | | | | | | | |
| International business activity program tax refunds | | 2 | | 10 | | - | |
| • | Provided eligible corporations, certain foreign banks authorized to carry on business in Canada and specialists employed by these entities a refund of B.C. income tax paid on income related to the corporation’s international business carried on in B.C. | | | | | | | |
| • | Program eliminated effective September 12, 2017. The cost represents refunds paid in respect of eligible income earned before September 12, 2017. | | | | | | | |
| Mining exploration tax credit | | 29 | | 28 | | 25 | |
| • | Supports eligible corporations conducting grassroots mineral exploration in B.C. | | | | | | | |
| • | Introduced for expenditures incurred after July 31, 1998; expanded to active partners in partnerships effective after March 31, 2003 and enhanced tax credit for prescribed areas introduced effective after February 20, 2007. | | | | | | | |
| • | Tax credit does not have a sunset date. | | | | | | | |
| Scientific research and experimental development tax credit 3 | | 121 | | 81 | | 97 | |
| • | Supports research and development carried on in B.C. | | | | | | | |
| • | Capital expenditures removed from qualifying expenditures effective after 2013 and taxable income removed from calculation of refundable tax credit expenditure limit for taxation years ending after March 18, 2019. | | | | | | | |
| • | Introduced effective September 1, 1999. Sunset date of August 31, 2027. | | | | | | | |
| 1 | Figures include prior year adjustments of -$1 million for the book publishing tax credit, $53 million for the Film Incentive BC tax credit, $18 million for the production services tax credit, $17 million for the interactive digital media tax credit, $9 million for the mining exploration tax credit, $25 million for the scientific research and experimental development tax credit and $2 million for the training tax credits. |
| 2 | Figures include prior year adjustments of -$39 million for the Film Incentive BC tax credit, -$88 million for the production services tax credit, $6 million for the interactive digital media tax credit, $3 million for the mining exploration tax credit, -$11 million for the refundable portion of the scientific research and experimental development tax credit and $1 million for the training tax credits. |
| 3 | The scientific research and experimental development tax credit has a non-refundable component, which is reported in Table A1.2.2. |

Budget and Fiscal Plan - 2022/23 to 2024/25
147
Appendix
Table A1.1.2 Corporate Income Tax – Tax Expenditures (Refundable Tax Credits) (continued)
| | | | 2020/21 | | 2021/22 | | 2022/23 | |
| | | | Actual Cost | | Estimated Cost | | Planned Cost | |
| | | | ($ millions) | | ($ millions) | | ($ millions) | |
| Training tax credits 4 | | 12 | | 12 | | 11 | |
| • | Provides refundable income tax credits for employers of up to 15 per cent of apprentices' salaries. | | | | | | | |
| • | Includes shipbuilding and ship repair industry tax credit. | | | | | | | |
| • | Introduced in 2007. Sunset date of December 31, 2024. | | | | | | | |
| 4 | Training tax credits for individuals are reported in Table A1.1.1. |
Table A1.2.1 Personal Income Tax – Tax Expenditures (Deductions and Non-Refundable Tax Credits)
| | | | 2020/21 | | 2021/22 | | 2022/23 | |
| | | | Actual Cost | | Estimated Cost | | Planned Cost | |
| | | | ($ millions) | | ($ millions) | | ($ millions) | |
| Provincial Measures | | | | | | | |
| Age tax credit | | 108 | | 112 | | 116 | |
| • | Provides an income-tested tax credit to elderly British Columbians. | | | | | | | |
| • | Introduced in 2000. | | | | | | | |
| BC caregiver tax credit | | 6 | | 6 | | 6 | |
| • | Provides a tax credit to individuals who care for family members with a disability. | | | | | | | |
| • | Introduced in 2018 in response to changes to the federal caregiver tax credit. | | | | | | | |
| Canada Pension Plan tax credit | | 199 | | 209 | | 214 | |
| • | Provides a tax credit to individuals who make Canada Pension Plan contributions. | | | | | | | |
| • | Introduced in 2000. | | | | | | | |
| Charitable donations tax credit | | 300 | | 302 | | 307 | |
| • | Provides a tax credit to individuals who make charitable donations to registered charities and eligible donees. | | | | | | | |
| • | Introduced in 2000. | | | | | | | |
| Disability tax credit | | 40 | | 42 | | 43 | |
| • | Provides a tax credit to persons with a disability. | | | | | | | |
| • | Introduced in 2000. | | | | | | | |
| Employment Insurance tax credit | | 59 | | 62 | | 63 | |
| • | Provides a tax credit to individuals who pay Employment Insurance premiums. | | | | | | | |
| • | Introduced in 2000. | | | | | | | |
| Medical expense tax credit | | 68 | | 69 | | 70 | |
| • | Provides a tax credit to individuals who make sufficient qualifying medical expenditures. | | | | | | | |
| • | Introduced in 2000. | | | | | | | |
| Mining flow-through share tax credit | | 20 | | 25 | | 25 | |
| • | Provides a tax credit to individuals who invest in flow-through shares on renounced mining expenditures. | | | | | | | |
| • | Introduced in 2001. | | | | | | | |
| Pension tax credit | | 30 | | 30 | | 31 | |
| • | Provides a tax credit to individuals who receive amounts from private pension plans. | | | | | | | |
| • | Introduced in 2000. | | | | | | | |
| Political contribution tax credit | | 3 | | 4 | | 4 | |
| • | Provides a tax credit to individuals who donate to provincial political parties, constitutency associations or candidates. | | | | | | | |
| • | Introduced in 2000. Prior to 2000, B.C. had a similar deduction, rather than a credit. | | | | | | | |
Budget and Fiscal Plan - 2022/23 to 2024/25
148
Appendix
Table A1.2.1 Personal Income Tax – Tax Expenditures (Deductions and Non-Refundable Tax Credits)
(continued)
| | | | 2020/21 | | 2021/22 | | 2022/23 | |
| | | | Actual Cost | | Estimated Cost | | Planned Cost | |
| | | | ($ millions) | | ($ millions) | | ($ millions) | |
| Provincial Measures (continued) | | | | | | | |
| Spousal and eligible dependant tax credits | | 85 | | 86 | | 87 | |
| • | Provides a tax credit to individuals who have a low-income spouse, or to single parents who support a minor child. | | | | | | | |
| • | Introduced in 2000. | | | | | | | |
| Tuition tax credit | | 70 | | 71 | | 72 | |
| • | Provides a tax credit for tuition paid to a post-secondary institution. | | | | | | | |
| • | Costs also include education tax credit amounts in respect of studies prior to the elimination of that tax credit in 2019, which have been carried forward. | | | | | | | |
| • | Unused tax credits may be carried forward to future years. | | | | | | | |
| • | Introduced in 2000. | | | | | | | |
| Federal Measures 1 | | | | | | | |
| Child care expense deduction | | 51 | | 60 | | 72 | |
| • | Allows families to deduct child care costs from taxable income. | | | | | | | |
| • | Introduced in 1972. | | | | | | | |
| Non-taxation of business-paid health and dental benefits | | 181 | | 190 | | 200 | |
| • | Allows for private health and dental benefits to not be taxed. | | | | | | | |
| • | Introduced in 1948. | | | | | | | |
| Northern residents deduction | | 15 | | 17 | | 17 | |
| • | Provides a deduction to individuals living in northern communities. | | | | | | | |
| • | Introduced in 1987. | | | | | | | |
| Pension income splitting | | 92 | | 107 | | 115 | |
| • | Allows for spouses to split pension income, other than income from the Canada Pension Plan and Old Age Security. | | | | | | | |
| • | Introduced in 2007. | | | | | | | |
| Registered pension plans | | 1,395 | | 1,422 | | 1,481 | |
| • | Allows amounts contributed to a pension plan to be deducted from taxable income. | | | | | | | |
| • | Introduced in 1919. | | | | | | | |
| Registered retirement savings plans (RRSPs) | | 826 | | 810 | | 851 | |
| • | Allows amounts contributed to an RRSP to be deducted from taxable income. | | | | | | | |
| • | Introduced in 1957. | | | | | | | |
| Tax-free savings accounts (TFSAs) | | 66 | | 67 | | 85 | |
| • | Allows for investment income to be earned tax-free within a TFSA. | | | | | | | |
| • | Introduced in 2009. | | | | | | | |
| 1 | These measures show the foregone provincial revenue resulting from federal measures. Each measure is calculated from the 2021 federal cost projections as reported in the Government of Canada's Report on Federal Tax Expenditures 2021 by applying British Columbia residents' share of the measure and the relevant tax rates. Certain tax expenditure items have been excluded where no data is available or the amounts are immaterial. |
Budget and Fiscal Plan - 2022/23 to 2024/25
149
Appendix
Table A1.2.2 Corporate Income Tax – Tax Expenditures (Deductions and Non-Refundable Tax Credits)
| | | | 2020/21 | | 2021/22 | | 2022/23 | |
| | | | Actual Cost | | Estimated Cost | | Planned Cost | |
| | | | ($ millions) | | ($ millions) | | ($ millions) | |
| Provincial Measures | | | | | | | |
| Small business venture capital tax credit | | 3 | | 3 | | 3 | |
| • | See description under Table A1.1.1. | | | | | | | |
| • | Corporations receive a credit of up to 30 per cent of their investment. There is no annual limit on the benefit that can be claimed. | | | | | | | |
| Scientific research and experimental development tax credit 1 | | 77 | | 110 | | 109 | |
| • | See description under Table A1.1.2. | | | | | | | |
| Small business corporate income tax rate | | 1,445 | | 1,560 | | 1,610 | |
| • | Provides a reduced income tax rate for Canadian-controlled private corporations on active business income up to $500,000. | | | | | | | |
| • | The small business corporate income tax rate was reduced to 2 per cent from2.5 per cent effective April 1, 2017. | | | | | | | |
| • | Includes savings for credit unions, which are also reported below. | | | | | | | |
| • | Introduced in 1975. | | | | | | | |
| Small business corporate income tax rate for credit unions | | 26 | | 28 | | 29 | |
| • | Provides a reduced income tax rate for credit unions on a portion of taxable income. | | | | | | | |
| • | Introduced in 1977. | | | | | | | |
| • | This tax credit expenditure reflects the savings provided to credit unions from the small business rate. These expenditures are a subcomponent of the small business corporate income tax rate expenditure. | | | | | | | |
| • | In 2017, expanded access for credit unions to the provincial small business rate continued despite the phase-out of the corresponding federal measure. | | | | | | | |
| Federal Measure 2 | | | | | | | |
| Charitable donations deduction | | 82 | | 82 | | 92 | |
| • | Generally permits corporations to deduct charitable donations made to registered charities up to a maximum of 75 per cent of the corporation’s taxable income. The limit may be exceeded for donations of certain items. | | | | | | | |
| • | Encourages corporations to make donations to charities. | | | | | | | |
| • | Introduced in 1929 for certain charities, and expanded to all charities by 1933. | | | | | | | |
| 1 | The scientific research and experimental development tax credit has a refundable component, which is reported in Table A1.1.2. |
| 2 | The deduction for corporate charitable donations is a federal measure but the estimate shows only the foregone provincial revenue. This is calculated from the 2021 federal cost projection as reported in the Government of Canada's Report on Federal Tax Expenditures 2021 by applying British Columbia's share of corporate taxable income and the relevant tax rates to the federal estimate. |
Table A1.3 Property Taxes – Tax Expenditures
| | | | 2020/21 | | 2021/22 | | 2022/23 | |
| | | | Actual Cost | | Estimated Cost | | Planned Cost | |
| | | | ($ millions) | | ($ millions) | | ($ millions) | |
| School and Rural Area Property Tax | | | | | | | |
| Assessment exemption of $10,000 for business properties 1 | | 6 | | 5 | | 5 | |
| • | Assessed improvement values for property tax are reduced by $10,000 for each industrial and business property. | | | | | | | |
| • | Introduced in 1984. | | | | | | | |
| Overnight tourist accommodation assessment relief 1 | | 2 | | 2 | | 2 | |
| • | Reduces the taxable assessed value of smaller tourist accommodation properties. | | | | | | | |
| • | Introduced in 1988. Assessment reductions for properties in rural areas were increased in 2016. | | | | | | | |
| Home owner grant | | 857 | | 874 | | 892 | |
| • | Reduces property taxes for Canadians and permanent residents of Canada who use the property as their principal residence. The benefit relative to tax paid is greater for lower-valued homes. | | | | | | | |
| • | The grant is phased out on properties with an assessed value above a threshold value. Low-income seniors and some other low-income individuals may be eligible for a low-income grant supplement if some or all of the grant is reduced because of the phase-out. | | | | | | | |
| • | The grant is up to $275 higher for seniors, eligible veterans and people with disabilities. | | | | | | | |
| • | The northern and rural area home owner benefit was introduced in 2011, which provides a $200 higher grant outside the Metro Vancouver, Capital and Fraser Valley regional districts. | | | | | | | |
| • | Introduced in 1957. | | | | | | | |
| 1 | Estimates are for the most recent calendar year of the fiscal year and include only school and rural area property taxes levied by the Province. |
Budget and Fiscal Plan - 2022/23 to 2024/25
150
Appendix
Table A1.3 Property Taxes – Tax Expenditures (continued)
| | | | 2020/21 | | 2021/22 | |
| | | | Actual Cost | | Estimated Cost1 | |
| | | | ($ millions) | | ($ millions) | |
| Property Transfer Tax | | | | | |
| Exemptions for the following: | | | | | |
| First time home buyers | | 74 | | 72 | |
| • | Exempts Canadian citizens and permanent residents of Canada who purchase their first home. | | | | | |
| • | The homeowner must live in the home as their principal residence for at least one year after purchase and the property must have a fair market value of $500,000 or less. A phase-out applies for homes up to $525,000. | | | | | |
| • | Introduced in 1994. | | | | | |
| Newly built home | | 80 | | 89 | |
| • | Exempts Canadian citizens and permanent residents of Canada from property transfer tax for a newly built home with a fair market value of up to $750,000. A partial exemption applies up to $800,000. | | | | | |
| • | The homeowner must live in the home for at least one year after purchase. There is no requirement to live in B.C. before the purchase. | | | | | |
| • | Introduced in 2016. | | | | | |
| Property transfers between related individuals | | 148 | | 179 | |
| • | Long-standing exemption for spousal and intergenerational transfers for principal residences, recreational properties and family farms and in the event of a division of property due to divorce or marital breakdown. Available to Canadian citizens and permanent residents of Canada. | | | | | |
| Property transfers to municipalities, regional districts, hospital districts, library boards, school boards, water districts | | 16 | | 22 | |
| • | Long-standing exemption for transfers to specified public bodies. | | | | | |
| Property transfers to charities registered under the Income Tax Act (Canada) | | 16 | | 12 | |
| • | Long-standing exemption for transfers of properties to a registered charity or a specified individual where the land will be used for a charitable purpose. | | | | | |
| Speculation and Vacancy Tax 2 | | | | | |
| $2,000 tax credit for B.C. residents | | 5 | | | |
| • | Provides a tax credit of up to $2,000 for owners who are B.C. residents on the first $400,000 of their property value subject to the tax. | | | | | |
| Income tax credit for non-B.C. residents who pay B.C. income tax | | 3 | | | |
| • | Provides a tax credit to reduce a non-B.C. resident's tax payable based on their B.C. income. | | | | | |
| Exemptions for the following: 3 | | | | | |
| Recently acquired or inherited property | | 104 | | | |
| • | Provides an exemption from tax for a property that is purchased or acquired in the calendar year. | | | | | |
| Temporary extended absence. | | 4 | | | |
| • | Provides an exemption from tax when an owner is absent from their principal residence. | | | | | |
| Separation or divorce | | 5 | | | |
| • | Provides an exemption from tax for owners who are going through a separation or divorce. | | | | | |
| Death of an owner | | 18 | | | |
| • | Provides an exemption from tax for owners in the calendar year of an owner's death and the following year. | | | | | |
| Rental restricted property | | 28 | | | |
| • | Provides a temporary exemption from tax for property with a rental restriction bylaw or covenant until 2022. | | | | | |
| Hazardous or damaged residential property | | 12 | | | |
| • | Provides an exemption from tax for property that is damaged by natural disaster or is uninhabitable. | | | | | |
| Strata accommodation property | | 3 | | | |
| • | Provides an exemption from tax for property that is a strata hotel. | | | | | |
| Daycares | | 2 | | | |
| • | Provides an exemption from tax for property that is used as a licenced daycare. | | | | | |
| 1 | Future costs for first time home buyers’ program and newly built home exemption will vary depending on completion and sale of new homes below the threshold value and by activity of first-time buyers in the market. Other property transfer tax exemptions will be more stable over time. |
| 2 | Certain exemptions such as the principal residence exemption, occupied by a tenant exemption and land under development exemption, are intended to exclude principal residences, rental properties and properties under development from the tax base. |
Costs are for the 2020 calendar year. In calculating the cost of the expenditure no credits have been applied that an owner may have been entitled to receive had they been assessed tax. The calculations are based on actual exemptions claimed, not what an owner would have otherwise been entitled to claim had they not chosen this particular exemption and are based on a 50 per cent ownership share which may not reflect the true mixture of owner types who jointly own property. All measures were introduced when the tax was introduced in 2018.
| 3 | This is the value of the exemptions without applying any credits. Ownership percentage is assumed to be split into equal parts based on the number of owners on title (i.e., if a property has 3 owners, each owner is assumed to have 1/3 ownership). The tax rate of either 0.5 per cent or 2 per cent based on their ownership type is then applied to their ownership percentage. |
Budget and Fiscal Plan - 2022/23 to 2024/25
151
Appendix
Table A1.4 Consumption Taxes – Tax Expenditures
| | | | 2020/21 | | 2021/22 | | 2022/23 | |
| | | | Estimated Cost1 | | Estimated Cost | | Planned Cost | |
| | | | ($ millions) | | ($ millions) | | ($ millions) | |
| Fuel Taxes 2 | | | | | | | |
| Exemption for alternative fuels 3 | | 3 | | 4 | | 5 | |
| • | Exempts hydrogen, natural gas, and gasoline and diesel that contains at least85 per cent methanol from motor fuel tax. | | | | | | | |
| • | Introduced in 1982. | | | | | | | |
| Exemption for international flights (jet fuel) | | 12 | | 9 | | 11 | |
| • | Exempts fuel purchased by interjurisdictional airlines from motor fuel tax. | | | | | | | |
| • | Introduced in 2012. | | | | | | | |
| Exemptions for farmers 2 | | 11 | | 10 | | 10 | |
| • | Exempts coloured gasoline and coloured diesel purchased by qualifying farmers from motor fuel and carbon tax. | | | | | | | |
| • | Introduced in 2008 for motor fuel tax and 2014 for carbon tax. | | | | | | | |
| Provincial Sales Tax 4 | | | | | | | |
| Rebate for select machinery and equipment | | 4 | | 70 | | 126 | |
| • | Provides, as part of B.C.'s Economic Recovery Plan, a temporary rebate to encourage business investment. | | | | | | | |
| Exemptions for the following: | | | | | | | |
| Food for human consumption 5 | | 1,584 | | 1,563 | | 1,688 | |
| • | Provides an exemption to reduce the cost of basic necessities. | | | | | | | |
| Production machinery and equipment | | 175 | | 186 | | 186 | |
| • | Provides an exemption to help reduce the cost of certain machinery and equipment for businesses in the manufacturing, oil and gas, mining and logging industries. | | | | | | | |
| Residential energy (e.g., electricity, natural gas, fuel oil) | | 276 | | 278 | | 289 | |
| • | Provides an exemption to reduce the cost of residential energy. | | | | | | | |
| Non-residential electricity | | 198 | | 198 | | 197 | |
| • | Provides an exemption to help businesses become more competitive and support increased investment, growth and job creation. Phased in starting January 1, 2018 and fully implemented on April 1, 2019. | | | | | | | |
| Prescription and non-prescription drugs, vitamins and certain other health care products | | 259 | | 293 | | 302 | |
| • | Provides exemptions to reduce the cost of certain drugs, vitamins and health care products. | | | | | | | |
| Children's clothing and footwear | | 37 | | 37 | | 37 | |
| • | Provides an exemption to reduce the cost of clothing and footwear for children under 15. | | | | | | | |
| Clothing patterns, fabrics and notions | | 8 | | 8 | | 8 | |
| • | Provides an exemption to reduce the cost of patterns, yarns, natural fibres, threads and fabric that are commonly used in making or repairing clothing. | | | | | | | |
| Specified school supplies | | 46 | | 38 | | 39 | |
| • | Provides an exemption to reduce the cost of school supplies. | | | | | | | |
| Books, magazines and newspapers | | 46 | | 45 | | 46 | |
| • | Provides an exemption to reduce the cost of reading material. | | | | | | | |
| Basic land-line telephone and cable service | | 54 | | 54 | | 54 | |
| • | Provides exemptions to reduce the cost of basic land-line telephone and basic cable television service. | | | | | | | |
| "1-800" and equivalent telephone services | | 4 | | 4 | | 4 | |
| • | Provides an exemption to reduce the cost of offering toll-free telephone services. | | | | | | | |
| Specified safety equipment | | 42 | | 42 | | 42 | |
| • | Provides exemptions to reduce the cost of specified work-related and general- use protective gear and safety equipment. | | | | | | | |
| 1 | Exemptions are largely point-of-sale exemptions - they can only be estimated unlike expenditures provided through the income or property tax systems. |
| 2 | Estimate is for both motor fuel tax and carbon tax. |
| 3 | Exemption for natural gas began in 1982. The exemption was expanded to include gasoline and diesel with at least 85 per cent methanol in 1992, hydrogen used in a fuel cell vehicle in 2009, and hydrogen used in an internal combustion engine vehicle in 2022. |
| 4 | Estimates are based on internal data, publicly-available industry data and Statistics Canada data. All exemptions for provincial sales tax existed prior to the implementation of the Provincial Sales Tax Act in 2013 except for the exemption for non-residential electricity, which was introduced in 2018, and the expansion of the exemption for bicycles and tricycles in 2021 to include electric bicycles and tricycles. |
| 5 | Effective April 1, 2021, carbonated sodas and certain other beverages became subject to provincial sales tax. |
Budget and Fiscal Plan - 2022/23 to 2024/25
152
Appendix
Table A1.4 Consumption Taxes – Tax Expenditures (continued)
| | | | 2020/21 | | 2021/22 | | 2022/23 | |
| | | | Estimated Cost1 | �� | Estimated Cost | | Planned Cost | |
| | | | ($ millions) | | ($ millions) | | ($ millions) | |
| Provincial Sales Tax 2 | | | | | | | |
| Exemptions for the following: | | | | | | | |
| Labour to repair major household appliances, clothing and footwear | | 15 | | 15 | | 16 | |
| • | Provides exemptions to reduce the cost of repairing certain essentials. | | | | | | | |
| Livestock for human consumption and feed, seed and fertilizer | | 67 | | 67 | | 68 | |
| • | Provides exemptions to reduce the cost of animals that are part of the food system. | | | | | |
| Specified energy conservation equipment | | 22 | | 22 | | 23 | |
| • | Provides exemptions to reduce the cost of certain energy conservation equipment. | | | | | |
| Bicycles and adult-sized tricycles | | 15 | | 20 | | 22 | |
| • | Provides exemptions to reduce the cost of non-motorized bicycles, adult-sized tricycles and parts and services. Expanded on April 21, 2021 to include electric bicycles and adult-sized tricycles, conversion kits and parts and services. | | | | | | | |
| Used zero-emission vehicles | | — | | 2 | | 21 | |
| • | Provides an exemption to reduce the cost of used zero-emission vehicles. Introduced on February 23, 2022. Sunset date of February 22, 2027. | | | | | | | |
| Heat pumps | | — | | — | | 8 | |
| • | Provides an exemption to reduce the cost of heat pumps. Introduced on April 1, 2022. | | | | | | | |
| 1 | Exemptions are largely point-of-sale exemptions - they can only be estimated unlike expenditures provided through the income or property tax systems. |
| 2 | Estimates are based on internal data, publicly-available industry data and Statistics Canada data. All exemptions for provincial sales tax existed prior to the implementation of the Provincial Sales Tax Act in 2013 unless otherwise noted. |
Table A1.5 Employer Health Tax – Tax Expenditures
| | | | 2020/21 | | 2021/22 | | 2022/23 | |
| | | | Actual Cost | | Estimated Cost | | Planned Cost | |
| | | | ($ millions) | | ($ millions) | | ($ millions) | |
| Increased Employment Incentive | | — | | 33 | | — | |
| • | Provides a refundable tax credit to employers who increase their payroll for low- to middle-income workers between the third and fourth quarters of 2020. | | | | | | | |
| • | Introduced for the quarter ended December 31, 2020 as part of B.C.'s Economic Recovery Plan. | | | | | | | |
| Relief for small businesses, charities and non-profits | | 464 | | 458 | | 486 | |
| • | Provides a tax exemption for employers with B.C. remuneration of $500,000 or less, and a lower effective tax rate for employers with B.C. remuneration up to $1.5 million. | | | | | | | |
| • | Charities and not-for-profit employers are exempt on their first $1.5 million of B.C. remuneration at a qualifying location, and receive a lower effective tax rate on B.C. remuneration of up to $4.5 million at a qualifying location. | | | | | | | |
| • | Introduced in 2019 with the employer health tax. | | | | | | | |
Table A1.6 Insurance Premium Tax – Tax Expenditures
| | | | 2020/21 | | 2021/22 | | 2022/23 | |
| | | | Actual Cost | | Estimated Cost | | Planned Cost | |
| | | | ($ millions) | | ($ millions) | | ($ millions) | |
| Marine Insurance Exemption | | 3 | | 3 | | 3 | |
| • | Provides an exemption for marine insurance other than pleasure craft insurance. | | | | | | | |
| • | Introduced in 1957. | | | | | | | |
Budget and Fiscal Plan - 2022/23 to 2024/25
153
Appendix
| Table A2 | Interprovincial Comparisons of Tax Rates – 2022
(Rates known and in effect as of February 1, 2022) |
| Tax | | British
Columbia | | | Alberta | | | Saskat-
chewan | | | Manitoba | | | Ontario | | | Quebec | | | New
Brunswick | | | Nova
Scotia | | | Prince
Edward
Island | | | Newfound-
land and
Labrador | |
Corporate income tax
(per cent of taxable income) | | | | | | | | | | | | | | | | | | | | | | | | | | | | | | |
| General rate | | 12 | | | 8 | | | 12 | | | 12 | | | 11.5 | | | 11.5 | | | 14 | | | 14 | | | 16 | | | 15 | |
| Manufacturing rate 1 | | 12 | | | 8 | | | 10 | | | 12 | | | 10 | | | 11.5 | | | 14 | | | 14 | | | 16 | | | 15 | |
| Small business rate | | 2 | | | 2 | | | 0 | | | 0 | | | 3.2 | | | 3.2 | | | 2.5 | | | 2.5 | | | 2 | | | 3 | |
| Small business threshold ($000s) | | 500 | | | 500 | | | 600 | | | 500 | | | 500 | | | 500 | | | 500 | | | 500 | | | 500 | | | 500 | |
| Corporation capital tax (per cent) Financial 2 | | Nil | | | Nil | | | 0.7/4 | | | 6 | | | Nil | | | 1.25 | | | 4/5 | | | 4 | | | 5 | | | 6 | |
| Payroll tax (per cent) 3 | | 1.95 | | | Nil | | | Nil | | | 2.15 | | | 1.95 | | | 4.26 | | | Nil | | | Nil | | | Nil | | | 2 | |
| Insurance premium tax (per cent) 4 | | 2/7 | | | 3/4 | | | 3/4 | | | 2/4 | | | 2/3.5 | | | 9 | | | 2/3 | | | 3/4 | | | 3.75/4 | | | 5 | |
| Fuel tax (cents per litre) 5 | | | | | | | | | | | | | | | | | | | | | | | | | | | | | | |
| Gasoline | | 24.46 | | | 21.84 | | | 23.84 | | | 22.84 | | | 33.14 | | | 32.1 | | | 31.84 | | | 26.76 | | | 26.72 | | | 36.47 | |
| Diesel | | 26.71 | | | 23.73 | | | 25.73 | | | 24.73 | | | 34.95 | | | 32.99 | | | 38.69 | | | 26.77 | | | 34.75 | | | 40.99 | |
| Sales tax (per cent) 6 | | | | | | | | | | | | | | | | | | | | | | | | | | | | | | |
| General rate | | 7 | | | Nil | | | 6 | | | 7 | | | 8 | | | 9.975 | | | 10 | | | 10 | | | 10 | | | 10 | |
| Tobacco tax ($ per carton of 200 cigarettes) 7 | | 65 | | | 55 | | | 62.38 | | | 70.19 | | | 46.76 | | | 29.80 | | | 64.71 | | | 73.51 | | | 69.11 | | | 80.06 | |
| 1 | In British Columbia (and some other provinces), the general rate applies to income from manufacturing and processing. |
| 2 | Tax rates differ for smaller financial corporations in Manitoba and Saskatchewan. Quebec’s tax only applies to life insurance companies. In New Brunswick, taxable capital of financial institutions in excess of $10 million are subject to a 4 per cent tax, while banks are subject to the rate of 5 per cent. Financial institutions in Prince Edward Island pay tax on their paid-up capital exceeding $2 million. |
| 3 | Provinces with payroll taxes provide payroll tax relief for small businesses. Quebec also levies a compensation tax of up to 4.14 per cent on salaries and wages paid by financial institutions. |
| 4 | Lower rates apply to premiums for life, sickness and accident insurance; higher rates apply to premiums for property insurance including automobile insurance. In British Columbia, the highest rate applies to unlicensed insurance. In Manitoba, Ontario, Quebec and Newfoundland and Labrador, sales taxes also apply to certain insurance premiums except, generally, those related to individual life and health. |
| 5 | Tax rates are for regular fuel used on highways and include all provincial taxes payable by consumers at the pump. The British Columbia rates include 6.75 cents per litre dedicated to the BC Transportation Financing Authority and the carbon tax rates of 9.96 cents per litre for gasoline and 11.71 cents per litre for diesel. The British Columbia rates do not include regional taxes that increase the gasoline and diesel rates by 12.5 cents per litre in the South Coast British Columbia Transportation Authority service region and by 5.5 cents per litre in the Capital Regional District. The rates for Ontario, Quebec, New Brunswick, Nova Scotia, Prince Edward Island, and Newfoundland and Labrador include provincial sales tax based on average pump prices as of December 2021. The rates for Alberta, Saskatchewan, Manitoba, and Ontario include federal carbon pricing backstop rates of 8.84 cents per litre for gasoline and 10.73 cents per litre for diesel. The rates for New Brunswick and Newfoundland and Labrador include provincial carbon tax rates of 8.84 cents per litre for gasoline and 10.73 cents per litre for diesel. The rates for Prince Edward Island include a provincial carbon tax rate of 6.63 cents per litre for gasoline and 8.05 cents per litre for diesel. Quebec’s rates do not include increased or reduced regional tax rates, such as an additional 3 cents per litre on gasoline in the Montreal area |
| 6 | Tax rates shown are statutory rates. Ontario, Quebec, New Brunswick, Nova Scotia, Prince Edward Island and Newfoundland and Labrador have harmonized their sales taxes with the federal GST. Alberta imposes a 4 per cent tax on short-term rental accommodation. |
| 7 | Includes estimated provincial sales tax in all provinces except British Columbia, Alberta and Quebec. British Columbia will apply provincial sales tax to tobacco effective July 1, 2022. |
Budget and Fiscal Plan - 2022/23 to 2024/25
154
Appendix
Table A3 Comparison of Provincial and Federal Taxes by Province – 2022
| Tax | | British Columbia | | | Alberta | | | Saskat-
chewan | | | Manitoba | | | Ontario | | | Quebec | | | New
Brunswick | | | Nova
Scotia | | | Prince
Edward
Island | | | New-
foundland
and
Labrador | |
| Two Income Family of Four - $120,000 | | ( $ ) | |
| 1. Provincial Income Tax | | 5,078 | | | 6,750 | | | 6,909 | | | 9,324 | | | 6,567 | | | 10,927 | | | 9,592 | | | 11,283 | | | 10,550 | | | 9,624 | |
| Net Child Benefits | | (113 | ) | | 0 | | | 0 | | | — | | | 0 | | | (2,861 | ) | | 0 | | | 0 | | | — | | | (425 | ) |
| 2. Property Tax - Gross | | 6,844 | | | 4,033 | | | 4,323 | | | 4,519 | | | 7,790 | | | 5,394 | | | 4,998 | | | 5,164 | | | 5,435 | | | 2,339 | |
| - Net | | 6,274 | | | 4,033 | | | 4,323 | | | 4,519 | | | 7,790 | | | 5,394 | | | 4,998 | | | 5,164 | | | 5,435 | | | 2,339 | |
| 3. Sales Tax | | 1,920 | | | 0 | | | 1,692 | | | 1,828 | | | 2,738 | | | 3,348 | | | 3,355 | | | 3,174 | | | 3,203 | | | 3,374 | |
| 4. Fuel Tax | | 218 | | | 195 | | | 225 | | | 210 | | | 221 | | | 288 | | | 163 | | | 233 | | | 127 | | | 218 | |
| 5. Net Carbon Tax | | 389 | | | (319 | ) | | (347 | ) | | (120 | ) | | 66 | | | — | | | 157 | | | — | | | 157 | | | 157 | |
| 6. Total Provincial Tax | | 13,766 | | | 10,658 | | | 12,802 | | | 15,761 | | | 17,381 | | | 17,096 | | | 18,266 | | | 19,853 | | | 19,472 | | | 15,288 | |
| 7. Federal Income Tax | | 13,105 | | | 13,105 | | | 13,105 | | | 13,105 | | | 13,105 | | | 13,074 | | | 13,105 | | | 13,105 | | | 13,105 | | | 13,105 | |
| 8. Net Federal GST | | 1,785 | | | 1,748 | | | 1,745 | | | 1,695 | | | 1,752 | | | 1,774 | | | 1,689 | | | 1,654 | | | 1,669 | | | 1,697 | |
| 9. Total Tax | | 28,657 | | | 25,511 | | | 27,652 | | | 30,561 | | | 32,238 | | | 31,944 | | | 33,060 | | | 34,613 | | | 34,247 | | | 30,090 | |
| Two Income Family of Four - $90,000 | | | | | | | | | | | | | | | | | | | | | | | | | | | | | | |
| 1. Provincial Income Tax | | 2,950 | | | 4,016 | | | 3,474 | | | 5,513 | | | 2,991 | | | 6,211 | | | 5,492 | | | 6,708 | | | 6,406 | | | 5,608 | |
| Net Child Benefits | | (1,247 | ) | | 0 | | | 0 | | | — | | | 0 | | | (3,995 | ) | | 0 | | | 0 | | | — | | | (425 | ) |
| 2. Property Tax - Gross | | 3,236 | | | 2,234 | | | 2,462 | | | 3,162 | | | 4,523 | | | 4,108 | | | 2,911 | | | 4,232 | | | 3,166 | | | 2,259 | |
| - Net | | 2,666 | | | 2,234 | | | 2,462 | | | 3,162 | | | 4,523 | | | 4,108 | | | 2,911 | | | 4,232 | | | 3,166 | | | 2,259 | |
| 3. Sales Tax | | 1,606 | | | 0 | | | 1,413 | | | 1,525 | | | 2,292 | | | 2,861 | | | 2,810 | | | 2,666 | | | 2,678 | | | 2,825 | |
| 4. Fuel Tax | | 218 | | | 195 | | | 225 | | | 210 | | | 221 | | | 288 | | | 163 | | | 233 | | | 127 | | | 218 | |
| 5. Net Carbon Tax | | 342 | | | (380 | ) | | (410 | ) | | (183 | ) | | (3 | ) | | — | | | 157 | | | — | | | 157 | | | 157 | |
| 6. Total Provincial Tax | | 6,534 | | | 6,065 | | | 7,164 | | | 10,228 | | | 10,023 | | | 9,472 | | | 11,534 | | | 13,839 | | | 12,535 | | | 10,643 | |
| 7. Federal Income Tax | | 7,633 | | | 7,633 | | | 7,633 | | | 7,633 | | | 7,633 | | | 7,617 | | | 7,633 | | | 7,633 | | | 7,633 | | | 7,633 | |
| 8. Net Federal GST | | 1,493 | | | 1,445 | | | 1,456 | | | 1,414 | | | 1,466 | | | 1,516 | | | 1,415 | | | 1,389 | | | 1,396 | | | 1,421 | |
| 9. Total Tax | | 15,659 | | | 15,143 | | | 16,253 | | | 19,275 | | | 19,123 | | | 18,606 | | | 20,581 | | | 22,862 | | | 21,563 | | | 19,696 | |
| Single Parent with One Child - $60,000 | | | | | | | | | | | | | | | | | | | | | | | | | | | | | | |
| 1. Provincial Income Tax | | 1,996 | | | 1,445 | | | 1,489 | | | 3,182 | | | 2,527 | | | 3,018 | | | 3,539 | | | 4,811 | | | 4,276 | | | 4,110 | |
| Net Child Benefits | | (700 | ) | | (38 | ) | | 0 | | | — | | | 0 | | | (2,442 | ) | | 0 | | | 0 | | | — | | | (206 | ) |
| 2. Property Tax | | 0 | | | 0 | | | 0 | | | 0 | | | 0 | | | 0 | | | 0 | | | 0 | | | 0 | | | 0 | |
| 3. Sales Tax | | 1,180 | | | 0 | | | 1,060 | | | 1,141 | | | 1,674 | | | 2,135 | | | 1,844 | | | 1,965 | | | 1,916 | | | 2,073 | |
| 4. Fuel Tax | | 218 | | | 195 | | | 225 | | | 210 | | | 221 | | | 288 | | | 163 | | | 233 | | | 127 | | | 218 | |
| 5. Net Carbon Tax | | 215 | | | (278 | ) | | (302 | ) | | (108 | ) | | 59 | | | — | | | 157 | | | — | | | 157 | | | 157 | |
| 6. Total Provincial Tax | | 2,909 | | | 1,324 | | | 2,472 | | | 4,425 | | | 4,480 | | | 2,999 | | | 5,703 | | | 7,008 | | | 6,476 | | | 6,351 | |
| 7. Federal Income Tax | | 4,341 | | | 4,341 | | | 4,341 | | | 4,341 | | | 4,341 | | | 4,330 | | | 4,341 | | | 4,341 | | | 4,341 | | | 4,341 | |
| 8. Net Federal GST | | 1,097 | | | 1,094 | | | 1,093 | | | 1,058 | | | 1,071 | | | 1,131 | | | 1,055 | | | 1,024 | | | 1,036 | | | 1,043 | |
| 9. Total Tax | | 8,346 | | | 6,759 | | | 7,905 | | | 9,823 | | | 9,892 | | | 8,460 | | | 11,099 | | | 12,373 | | | 11,853 | | | 11,735 | |
| Unattached Individual - $30,000 | | | | | | | | | | | | | | | | | | | | | | | | | | | | | | |
| 1. Provincial Income Tax | | 562 | | | 778 | | | 760 | | | 1,107 | | | (298 | ) | | 99 | | | 1,161 | | | 1,160 | | | 1,577 | | | 1,509 | |
| 2. Property Tax | | 0 | | | 0 | | | 0 | | | 0 | | | 0 | | | 0 | | | 0 | | | 0 | | | 0 | | | 0 | |
| 3. Sales Tax | | 474 | | | 0 | | | 428 | | | 470 | | | 575 | | | 863 | | | 562 | | | 823 | | | 702 | | | 405 | |
| 4. Fuel Tax | | 218 | | | 195 | | | 225 | | | 210 | | | 221 | | | 288 | | | 163 | | | 233 | | | 127 | | | 218 | |
| 5. Net Carbon Tax | | (22 | ) | | (251 | ) | | (275 | ) | | (176 | ) | | (93 | ) | | — | | | 157 | | | — | | | 157 | | | 157 | |
| 6. Total Provincial Tax | | 1,232 | | | 722 | | | 1,138 | | | 1,611 | | | 404 | | | 1,250 | | | 2,044 | | | 2,216 | | | 2,564 | | | 2,289 | |
| 7. Federal Income Tax | | 1,971 | | | 1,971 | | | 1,971 | | | 1,971 | | | 1,971 | | | 1,966 | | | 1,971 | | | 1,971 | | | 1,971 | | | 1,971 | |
| 8. Net Federal GST | | (22 | ) | | (26 | ) | | (26 | ) | | (32 | ) | | (5 | ) | | (7 | ) | | (28 | ) | | (33 | ) | | (38 | ) | | (31 | ) |
| 9. Total Tax | | 3,181 | | | 2,667 | | | 3,083 | | | 3,550 | | | 2,370 | | | 3,209 | | | 3,987 | | | 4,154 | | | 4,497 | | | 4,229 | |
Budget and Fiscal Plan - 2022/23 to 2024/25
155
Appendix
Table A3 Comparison of Provincial and Federal Taxes by Province – 2022
| Tax | | British Columbia | | | Alberta | | | Saskat-
chewan | | | Manitoba | | | Ontario | | | Quebec | | | New
Brunswick | | | Nova
Scotia | | | Prince
Edward
Island | | | New-
foundland
and
Labrador | |
| Unattached Individual - $80,000 | | | | | | | | | | | | | | ( $ ) | | | | | | | | | | | | | | | | |
| 1. Provincial Income Tax | | 4,035 | | | 5,386 | | | 6,553 | | | 7,048 | | | 5,156 | | | 8,763 | | | 7,619 | | | 8,976 | | | 8,313 | | | 7,726 | |
| 2. Property Tax - Gross | | 2,520 | | | 1,930 | | | 1,870 | | | 2,589 | | | 3,926 | | | 2,952 | | | 4,097 | | | 4,232 | | | 4,455 | | | 1,918 | |
| - Net | | 1,950 | | | 1,930 | | | 1,870 | | | 2,589 | | | 3,926 | | | 2,952 | | | 4,097 | | | 4,232 | | | 4,455 | | | 1,918 | |
| 3. Sales Tax | | 1,038 | | | 0 | | | 899 | | | 993 | | | 1,472 | | | 1,731 | | | 1,784 | | | 1,679 | | | 1,699 | | | 1,781 | |
| 4. Fuel Tax | | 218 | | | 195 | | | 225 | | | 210 | | | 221 | | | 288 | | | 163 | | | 233 | | | 127 | | | 218 | |
| 5. Net Carbon Tax | | 305 | | | (18 | ) | | (26 | ) | | 69 | | | 194 | | | — | | | 157 | | | — | | | 157 | | | 157 | |
| 6. Total Provincial Tax | | 7,546 | | | 7,493 | | | 9,522 | | | 10,910 | | | 10,969 | | | 13,733 | | | 13,820 | | | 15,119 | | | 14,751 | | | 11,800 | |
| 7. Federal Income Tax | | 10,369 | | | 10,369 | | | 10,369 | | | 10,369 | | | 10,369 | | | 10,345 | | | 10,369 | | | 10,369 | | | 10,369 | | | 10,369 | |
| 8. Net Federal GST | | 960 | | | 936 | | | 916 | | | 907 | | | 940 | | | 912 | | | 897 | | | 873 | | | 885 | | | 895 | |
| 9. Total Tax | | 18,876 | | | 18,799 | | | 20,807 | | | 22,186 | | | 22,279 | | | 24,990 | | | 25,087 | | | 26,362 | | | 26,006 | | | 23,065 | |
| | | | | | | | | | | | | | | | | | | | | | | | | | | | | | | |
| Senior Couple with Equal Pension Incomes - $40,000 | | | | | | | | | | | | | | | | | | | | | | | | | | | | | | |
| 1. Provincial Income Tax | | 0 | | | 0 | | | (464 | ) | | (277 | ) | | (1,618 | ) | | (1,051 | ) | | 0 | | | 366 | | | 849 | | | 5 | |
| 2. Property Tax - Gross | | 3,236 | | | 2,234 | | | 2,462 | | | 3,162 | | | 4,523 | | | 4,108 | | | 2,911 | | | 4,232 | | | 3,166 | | | 2,259 | |
| - Net | | 2,391 | | | 2,234 | | | 2,462 | | | 3,162 | | | 4,523 | | | 4,108 | | | 2,911 | | | 4,232 | | | 3,166 | | | 2,259 | |
| 3. Sales Tax | | 856 | | | 0 | | | 783 | | | 851 | | | 1,005 | | | 1,476 | | | 1,100 | | | 1,447 | | | 1,256 | | | 1,178 | |
| 4. Fuel Tax | | 218 | | | 195 | | | 225 | | | 210 | | | 221 | | | 288 | | | 163 | | | 233 | | | 127 | | | 218 | |
| 5. Net Carbon Tax | | 21 | | | (115 | ) | | (131 | ) | | 30 | | | 191 | | | — | | | 157 | | | — | | | 157 | | | 157 | |
| 6. Total Provincial Tax | | 3,486 | | | 2,314 | | | 2,875 | | | 3,975 | | | 4,321 | | | 4,821 | | | 4,332 | | | 6,278 | | | 5,555 | | | 3,818 | |
| 7. Federal Income Tax | | 0 | | | 0 | | | 0 | | | 0 | | | 0 | | | 0 | | | 0 | | | 0 | | | 0 | | | 0 | |
| 8. Net Federal GST | | 267 | | | 271 | | | 275 | | | 257 | | | 262 | | | 254 | | | 267 | | | 223 | | | 239 | | | 279 | |
| 9. Total Tax | | 3,753 | | | 2,584 | | | 3,150 | | | 4,233 | | | 4,583 | | | 5,075 | | | 4,599 | | | 6,500 | | | 5,794 | | | 4,097 | |
Personal Income Tax
| • | Income tax is based on basic personal credits, applicable credits and typical major deductions at each income level. Quebec residents pay federal income tax less an abatement of 16.5 per cent of basic federal tax. This abatement has been used to reduce Quebec provincial tax rather than federal tax, for comparative purposes. |
| • | The amounts noted for each family is their family total income. Total income is used for these tables as it provides a more accurate view of the taxes paid by a family at a particular level of earnings. The two income family of four with $120,000 income is assumed to have one spouse earning $80,000 and the other $40,000, the family with $90,000 income is assumed to have one spouse earning $50,000 and the other $40,000 and each spouse in the senior couple is assumed to receive $20,000. The senior couple is assumed to be between the ages of 65 and 74 and to have pension income and the remaining representative families are assumed to have employment income. |
Net Child Benefits
| • | Net child benefits are provincial measures affecting payments to families with children. Provincial child benefit measures are available in British Columbia (BC Child Opportunity Benefit), Alberta (Alberta Child and Family Benefit), Ontario (Child Benefit), Quebec (Child Assistance Payments), New Brunswick (Child Tax Benefit), Nova Scotia (Child Benefit) and Newfoundland and Labrador (Child Benefit). |
| • | The single parent is assumed to have one child aged 5. The family earning $90,000 income is assumed to have two children aged 5 and 7. The family earning $120,000 income is assumed to have two children aged 15 and 17. |
Property Tax
| • | Property taxes are based on a representative two storey home, townhouse or condominium in a major city in each respective province. |
| • | It is assumed that the single parent and the individual at $30,000 income rent accommodation, the family at $90,000 income and senior couple own townhouses, the family at $120,000 income owns a single family detached home, and the individual at $80,000 income owns a condominium in a major city for each province. Net local and provincial property taxes are estimated as taxes owing after credits provided through the property tax system are subtracted. |
Sales Tax
| • | Estimates are based on expenditure patterns from the Survey of Household Spending. In estimating individual and family taxable consumption, disposable income is reduced by estimated federal income taxes and provincial income taxes. In addition, the single individual with $80,000 income, family with $90,000 income and family with $120,000 income are assumed to have savings equal to 5 per cent of their income. For each family, disposable income is distributed among expenditures using the consumption pattern of a typical family with the relevant characteristics as estimated using family expenditure data, and the relevant sales tax component is extracted. Sales tax includes: provincial retail sales taxes in British Columbia, Saskatchewan, and Manitoba; Quebec’s value added tax; the provincial component of the HST in Ontario, New Brunswick, Nova Scotia, Prince Edward Island and Newfoundland and Labrador; and Alberta’s Tourism Levy. Sales tax estimates have been reduced by sales tax credits where applicable. |
Fuel and Carbon Taxes
| • | Fuel tax is based on annual consumption: all families are assumed to consume 1,500 litres of gasoline. |
| • | Net carbon tax is estimated as carbon tax liabilities minus rebates such as B.C.’s climate action tax credit, where applicable. Carbon tax liabilities are based on direct fuel charges on gasoline, natural gas and home heating fuel where such charges apply (fuel charges do not apply to home heating fuel in New Brunswick, Prince Edward Island and Newfoundland and Labrador). Estimated carbon tax liabilities are based on natural gas and home heating fuel consumption amounts from household energy consumption data produced by Statistics Canada and Natural Resources Canada. Carbon tax liabilities do not include the effect of cap-and-trade or output-based pricing systems. |
| • | The federal government requires provinces to implement a price on carbon of at least $50/tonne starting April 2022. Provinces that do not have a carbon pricing program will have the federal carbon pricing backstop rates applied to the price of the fuel. As at December 31, 2021, Ontario, Manitoba, Saskatchewan and Alberta are subject to the federal carbon pricing on fuel purchases. Families in these provinces receive the federal climate action incentive to offset the cost of the carbon pricing. The amount of the climate action incentive for 2022/23 has been estimated using the amount of the climate action incentive for 2021/22. |
Effective Tax Rates
| • | British Columbia taxes have been calculated using rates in effect for 2022. Taxes for other provinces were calculated using rates that were announced prior to January 31, 2022, and that come into effect during 2022. |
Budget and Fiscal Plan - 2022/23 to 2024/25
156
Appendix
| Table A4 | Interprovincial Comparisons of Provincial Personal Income Taxes Payable 1 – 2022
(Rates known as of February 1, 2022) |
| Taxable income | | | British
Columbia | | | Alberta | | | Saskat-
chewan | | | Manitoba | | | Ontario | | | Quebec 2 | | | New
Brunswick | | | Nova
Scotia | | | Prince
Edward
Island | | | New-
foundland
and
Labrador | |
| | | | | Annual provincial taxes payable 3 ($) | |
| $ | 10,000 | | | | 0 | | | | 0 | | | | 0 | | | | 0 | | | | 0 | | | | 0 | | | | 0 | | | | 0 | | | | 0 | | | | 0 | |
| $ | 20,000 | | | | 0 | | | | 0 | | | | 223 | | | | 870 | | | | 0 | | | | 0 | | | | 99 | | | | 593 | | | | 440 | | | | 0 | |
| $ | 30,000 | | | | 637 | | | | 865 | | | | 1,197 | | | | 1,901 | | | | 302 | | | | 1,249 | | | | 1,269 | | | | 1,509 | | | | 1,662 | | | | 1,584 | |
| $ | 40,000 | | | | 1,315 | | | | 1,792 | | | | 2,171 | | | | 3,005 | | | | 1,770 | | | | 2,553 | | | | 2,438 | | | | 2,995 | | | | 2,888 | | | | 2,425 | |
| $ | 50,000 | | | | 1,958 | | | | 2,719 | | | | 3,202 | | | | 4,200 | | | | 2,529 | | | | 4,144 | | | | 3,618 | | | | 4,480 | | | | 4,201 | | | | 3,807 | |
| $ | 60,000 | | | | 2,689 | | | | 3,646 | | | | 4,374 | | | | 5,395 | | | | 3,404 | | | | 5,825 | | | | 5,028 | | | | 5,972 | | | | 5,514 | | | | 5,189 | |
| $ | 70,000 | | | | 3,444 | | | | 4,618 | | | | 5,593 | | | | 6,639 | | | | 4,303 | | | | 7,487 | | | | 6,481 | | | | 7,667 | | | | 7,030 | | | | 6,612 | |
| $ | 80,000 | | | | 4,214 | | | | 5,618 | | | | 6,843 | | | | 8,152 | | | | 5,368 | | | | 9,148 | | | | 7,963 | | | | 9,363 | | | | 8,700 | | | | 8,079 | |
| $ | 100,000 | | | | 6,140 | | | | 7,618 | | | | 9,343 | | | | 11,632 | | | | 7,734 | | | | 12,703 | | | | 11,093 | | | | 12,751 | | | | 12,040 | | | | 11,239 | |
| $ | 125,000 | | | | 9,320 | | | | 10,118 | | | | 12,468 | | | | 15,982 | | | | 12,087 | | | | 17,826 | | | | 15,223 | | | | 17,126 | | | | 16,587 | | | | 15,189 | |
| $ | 150,000 | | | | 12,995 | | | | 12,984 | | | | 15,911 | | | | 20,332 | | | | 16,439 | | | | 23,191 | | | | 19,400 | | | | 21,501 | | | | 21,179 | | | | 19,285 | |
| | | | | | | | | | | | | | | | | | | | | | | | | | | | | | | | | | | | | | | | | | | |
| | | | | Provincial personal income taxes as a per cent of taxable income (%) |
| $ | 10,000 | | | | 0.0 | | | | 0.0 | | | | 0.0 | | | | 0.0 | | | | 0.0 | | | | 0.0 | | | | 0.0 | | | | 0.0 | | | | 0.0 | | | | 0.0 | |
| $ | 20,000 | | | | 0.0 | | | | 0.0 | | | | 1.1 | | | | 4.3 | | | | 0.0 | | | | 0.0 | | | | 0.5 | | | | 3.0 | | | | 2.2 | | | | 0.0 | |
| $ | 30,000 | | | | 2.1 | | | | 2.9 | | | | 4.0 | | | | 6.3 | | | | 1.0 | | | | 4.2 | | | | 4.2 | | | | 5.0 | | | | 5.5 | | | | 5.3 | |
| $ | 40,000 | | | | 3.3 | | | | 4.5 | | | | 5.4 | | | | 7.5 | | | | 4.4 | | | | 6.4 | | | | 6.1 | | | | 7.5 | | | | 7.2 | | | | 6.1 | |
| $ | 50,000 | | | | 3.9 | | | | 5.4 | | | | 6.4 | | | | 8.4 | | | | 5.1 | | | | 8.3 | | | | 7.2 | | | | 9.0 | | | | 8.4 | | | | 7.6 | |
| $ | 60,000 | | | | 4.5 | | | | 6.1 | | | | 7.3 | | | | 9.0 | | | | 5.7 | | | | 9.7 | | | | 8.4 | | | | 10.0 | | | | 9.2 | | | | 8.6 | |
| $ | 70,000 | | | | 4.9 | | | | 6.6 | | | | 8.0 | | | | 9.5 | | | | 6.1 | | | | 10.7 | | | | 9.3 | | | | 11.0 | | | | 10.0 | | | | 9.4 | |
| $ | 80,000 | | | | 5.3 | | | | 7.0 | | | | 8.6 | | | | 10.2 | | | | 6.7 | | | | 11.4 | | | | 10.0 | | | | 11.7 | | | | 10.9 | | | | 10.1 | |
| $ | 100,000 | | | | 6.1 | | | | 7.6 | | | | 9.3 | | | | 11.6 | | | | 7.7 | | | | 12.7 | | | | 11.1 | | | | 12.8 | | | | 12.0 | | | | 11.2 | |
| $ | 125,000 | | | | 7.5 | | | | 8.1 | | | | 10.0 | | | | 12.8 | | | | 9.7 | | | | 14.3 | | | | 12.2 | | | | 13.7 | | | | 13.3 | | | | 12.2 | |
| $ | 150,000 | | | | 8.7 | | | | 8.7 | | | | 10.6 | | | | 13.6 | | | | 11.0 | | | | 15.5 | | | | 12.9 | | | | 14.3 | | | | 14.1 | | | | 12.9 | |
| 1 | Calculated for a single individual with wage income and claiming credits for Canada Pension Plan and Quebec Pension Plan contributions, Employment Insurance premiums, Quebec Parental Insurance Plan premiums, and the basic personal amount. |
| 2 | Quebec residents pay federal tax less an abatement of 16.5 per cent of federal tax. In the table, the Quebec abatement has been used to reduce Quebec provincial personal income tax for comparative purposes. |
| 3 | Includes provincial low income reductions, surtaxes payable in Ontario and Prince Edward Island, and the Ontario Health Premium tax. Excludes credits for sales and property tax credits. |
Budget and Fiscal Plan - 2022/23 to 2024/25
157
Appendix
Table A4.1 Net Provincial Taxes Since Budget 2016
| Tax | | 2016 | | | 2017 | | | 2018 | | | 2019 | | | 2020 | | | 2021 | | | 2022 | |
| $30,000 of Family Net Income | | ($) | |
| 1. MSP Premiums | | 0 | | | 0 | | | 0 | | | 0 | | | — | | | — | | | — | |
| 2. Provincial Income Tax | | 0 | | | 0 | | | 0 | | | 0 | | | (1,000 | ) | | 0 | | | 0 | |
| 3. Early Childhood Tax Benefit | | (660 | ) | | (660 | ) | | (660 | ) | | (660 | ) | | (495 | ) | | — | | | — | |
| 4. BC Child Opportunity Benefit | | — | | | — | | | — | | | — | | | (600 | ) | | (2,406 | ) | | (2,422 | ) |
| 5. Carbon Tax | | (126 | ) | | (126 | ) | | (129 | ) | | (150 | ) | | (645 | ) | | (193 | ) | | (187 | ) |
| 6. Sales Tax | | 818 | | | 830 | | | 839 | | | 845 | | | 940 | | | 1,022 | | | 1,022 | |
| 7. Fuel Tax | | 145 | | | 145 | | | 145 | | | 145 | | | 145 | | | 145 | | | 145 | |
| 8. Net Provincial Tax | | 177 | | | 189 | | | 195 | | | 180 | | | (1,655 | ) | | (1,432 | ) | | (1,442 | ) |
| | | | | | | | | | | | | | | | | | | | | | |
| $60,000 of Family Net Income | | | | | | | | | | | | | | | | | | | | | |
| 1. MSP Premiums | | 1,800 | | | 1,800 | | | 900 | | | 900 | | | — | | | — | | | — | |
| 2. Provincial Income Tax | | 1,714 | | | 1,663 | | | 1,595 | | | 1,505 | | | 416 | | | 1,361 | | | 1,274 | |
| 3. Early Childhood Tax Benefit | | (660 | ) | | (660 | ) | | (660 | ) | | (660 | ) | | (495 | ) | | — | | | — | |
| 4. BC Child Opportunity Benefit | | — | | | — | | | — | | | — | | | (345 | ) | | (1,380 | ) | | (1,380 | ) |
| 5. Carbon Tax | | 208 | | | 208 | | | 233 | | | 261 | | | (224 | ) | | 217 | | | 214 | |
| 6. Sales Tax | | 958 | | | 969 | | | 1,003 | | | 1,025 | | | 1,164 | | | 1,210 | | | 1,213 | |
| 7. Fuel Tax | | 218 | | | 218 | | | 218 | | | 218 | | | 218 | | | 218 | | | 218 | |
| 8. Net Provincial Tax | | 4,238 | | | 4,198 | | | 3,289 | | | 3,249 | | | 734 | | | 1,626 | | | 1,539 | |
| | | | | | | | | | | | | | | | | | | | | | |
| $80,000 of Family Net Income | | | | | | | | | | | | | | | | | | | | | |
| 1. MSP Premiums | | 1,800 | | | 1,800 | | | 900 | | | 900 | | | — | | | — | | | — | |
| 2. Provincial Income Tax | | 2,869 | | | 2,824 | | | 2,761 | | | 2,713 | | | 1,682 | | | 2,662 | | | 2,630 | |
| 3. Early Childhood Tax Benefit | | (660 | ) | | (660 | ) | | (660 | ) | | (660 | ) | | (495 | ) | | — | | | — | |
| 4. BC Child Opportunity Benefit | | — | | | — | | | — | | | — | | | (345 | ) | | (1,380 | ) | | (1,380 | ) |
| 5. Carbon Tax | | 236 | | | 236 | | | 265 | | | 305 | | | (59 | ) | | 348 | | | 386 | |
| 6. Sales Tax | | 1,174 | | | 1,184 | | | 1,215 | | | 1,245 | | | 1,357 | | | 1,491 | | | 1,488 | |
| 7. Fuel Tax | | 218 | | | 218 | | | 218 | | | 218 | | | 218 | | | 218 | | | 218 | |
| 8. Net Provincial Tax | | 5,637 | | | 5,602 | | | 4,699 | | | 4,721 | | | 2,358 | | | 3,339 | | | 3,342 | |
| | | | | | | | | | | | | | | | | | | | | | |
| $100,000 of Family Net Income | | | | | | | | | | | | | | | | | | | | | |
| 1. MSP Premiums | | 1,800 | | | 1,800 | | | 900 | | | 900 | | | — | | | — | | | — | |
| 2. Provincial Income Tax | | 4,340 | | | 4,298 | | | 4,234 | | | 4,148 | | | 3,062 | | | 4,004 | | | 3,916 | |
| 3. Early Childhood Tax Benefit | | (660 | ) | | (660 | ) | | (660 | ) | | (660 | ) | | (495 | ) | | — | | | — | |
| 4. BC Child Opportunity Benefit | | — | | | — | | | — | | | — | | | (145 | ) | | (598 | ) | | (649 | ) |
| 5. Carbon Tax | | 269 | | | 269 | | | 303 | | | 348 | | | 86 | | | 397 | | | 440 | |
| 6. Sales Tax | | 1,434 | | | 1,447 | | | 1,480 | | | 1,527 | | | 1,633 | | | 1,659 | | | 1,661 | |
| 7. Fuel Tax | | 290 | | | 290 | | | 290 | | | 290 | | | 290 | | | 290 | | | 290 | |
| 8. Net Provincial Tax | | 7,473 | | | 7,444 | | | 6,547 | | | 6,553 | | | 4,431 | | | 5,752 | | | 5,658 | |
Personal Income Tax
| • | For each family, the amount noted is the family net income. Net income forms the basis of many benefits provided through the tax system and, therefore, will provide a more accurate illustration of benefits received and premiums paid by a family at their respective family net income level. Income tax is calculated based on applicable tax rates and credits. All families are assumed to have each spouse earning an equal amount of employment income. |
| • | Families are assumed to have two children aged 5 and 12. |
Net Child Benefits
| • | Net child benefits are provincial measures affecting payments to families with children. The BC early childhood tax benefit was in effect until September 2020. The BC Child Opportunity Benefit was effective October 1, 2020. |
Sales, Fuel and Carbon Tax Estimates
| • | Disposable income is estimated based on the total amounts received in 2016 and then adjusted for inflation. In estimating taxable consumption, disposable income is reduced by 20 per cent to reflect rent. Cost of groceries and utilities are estimated based on the Survey of Household Spending and subtracted, thereafter. |
| • | For each family, income after rent, groceries and utilities is distributed among the remaining expenditures using the consumption pattern of a typical family with two children estimated based on expenditure patterns from the Survey of Household Spending. The relevant sales tax component is extracted based on the estimates. |
| • | Fuel tax is based on annual consumption: 1,000 litres of fuel for the family at $30,000; 1,500 litres of fuel for the family at $60,000 and at $80,000; and 2,000 of fuel for the family at $100,000. |
| • | Net carbon tax is estimated using the same methodology as Table A3. |
Health Care Premiums
| • | B.C. Medical Services Plan premiums were eliminated January 1, 2020. This table assumes that the full Medical Services Plan premium was paid by the family and not paid by the employer. |
COVID-19 Relief in 2020
| • | As part of COVID-19 relief, a one-time enhancement to the climate action tax credit was paid with the July 2020 payment. The amount of the benefit is included in net carbon taxes. |
| • | The BC Recovery Benefit provided families up to $1,000 per family reduced by family net income over $125,000. Payments for the benefit commenced in December 2020. The amount of the benefit is net against provincial income taxes for 2020. |
Budget and Fiscal Plan - 2022/23 to 2024/25
158
Appendix
Table A5 Material Assumptions – Revenue
Revenue Source and Assumptions
($ millions unless otherwise specified) | | Updated
Forecast
2021/22 | | | Budget
Estimate
2022/23 | | | Plan
2023/24 | | | Plan
2024/25 | | | 2022/23 Sensitivities |
| Personal income tax * | | 13,680 | | | 12,848 | | | 13,360 | | | 13,955 | | | |
| Current calendar year assumptions | | | | | | | | | | | | | | |
| Household income growth | | 4.9 | % | | 3.6 | % | | 3.9 | % | | 3.7 | % | | +/- 1 percentage point change in |
| Compensation of employees growth | | 10.7 | % | | 6.0 | % | | 4.1 | % | | 3.9 | % | | 2022 B.C. household income growth |
| Tax base growth | | 3.1 | % | | 2.2 | % | | 2.9 | % | | 3.5 | % | | equals +/- $100 to $120 million |
| Average tax yield | | 5.92 | % | | 5.98 | % | | 6.03 | % | | 6.09 | % | | |
| Current-year tax | | 12,056 | | | 12,439 | | | 12,921 | | | 13,500 | | | |
| Prior year’s tax assessments | | 460 | | | 470 | | | 480 | | | 490 | | | |
| Unapplied taxes | | 100 | | | 100 | | | 100 | | | 100 | | | |
| B.C. Tax Reduction | | (195 | ) | | (180 | ) | | (184 | ) | | (188 | ) | | |
| Non-refundable B.C. tax credits | | (110 | ) | | (110 | ) | | (110 | ) | | (110 | ) | | |
| Policy neutral elasticity ** | | 0.7 | | | 0.9 | | | 1.0 | | | 1.2 | | | +/- 0.5 change in 2022 B.C. |
| Fiscal year assumptions | | | | | | | | | | | | | | policy neutral elasticity |
| Prior-year adjustment | | 1,260 | | | | | | | | | | | | equals +/- $210 to $230 million |
| | | | | | | | | | | | | | | |
| 2020 Tax-year | | 2020 Assumptions | | | | | | | | | |
| Household income growth | | 7.0 | % | | | | | | | | | | | +/- 1 percentage point change in 2021 |
| Tax base growth | | 5.9 | % | | | | | | | | | | | B.C. household or taxable income |
| Average 2020 tax yield | | 5.89 | % | | | | | | | | | | | growth equals +/- $140 to $160 million |
| 2020 tax | | 11,635 | | | | | | | | | | | | one-time effect (prior-year adjustment) |
| 2019 & prior year’s tax assessments | | 521 | | | | | | | | | | | | and could result in an additional +/- $110 to $130 million |
| Unapplied taxes | | 100 | | | | | | | | | | | | base change in 2022/23 |
| B.C. Tax Reduction | | (202 | ) | | | | | | | | | | | |
| Non-refundable B.C. tax credits | | (108 | ) | | | | | | | | | | | |
| Policy neutral elasticity ** | | 1.0 | | | | | | | | | | | | |
| | | | | | | | | | | | | | | |
| * Reflects information as at January 20, 2022 |
| ** Per cent growth in current year tax revenue (excluding policy measures) relative to per cent growth in household income (calendar year). |
| | | | | | | | | | | | | | | |
| Corporate income tax * | | 5,064 | | | 5,501 | | | 5,827 | | | 6,455 | | | |
| Components of revenue (fiscal year) | | | | | | | | | | | | | | |
| Installments – subject to general rate | | 5,052 | | | 5,318 | | | 5,764 | | | 6,284 | | | |
| Installments – subject to small business rate | | 312 | | | 322 | | | 341 | | | 362 | | | |
| Non-refundable B.C. tax credits | | (129 | ) | | (132 | ) | | (137 | ) | | (142 | ) | | |
| Advance installments | | 5,235 | | | 5,508 | | | 5,968 | | | 6,504 | | | |
| Prior-year settlement payment | | (171 | ) | | (7 | ) | | (141 | ) | | (49 | ) | | |
| Current calendar year assumptions | | | | | | | | | | | | | | |
| National tax base ($ billions) | | 390.6 | | | 406.0 | | | 435.0 | | | 495.7 | | | +/- 1% change in the 2022 |
| B.C. installment share of national tax base | | 14.2 | % | | 14.4 | % | | 14.3 | % | | 14.1 | % | | national tax base equals |
| Effective percentage tax rates (% general/small business) | | 12.0 / 2.0 | | | 12.0 / 2.0 | | | 12.0 / 2.0 | | | 12.0 / 2.0 | | | +/- $50 to $60 million |
| Share of the B.C. tax base subject to the small business rate | | 27.1 | % | | 26.7 | % | | 26.5 | % | | 25.7 | % | | +/- 1 percentage point change in the |
| B.C. tax base growth (post federal measures) | | 8.9 | % | | 1.4 | % | | 5.3 | % | | 9.7 | % | | 2022 small business share equals |
| B.C. net operating surplus growth | | 13.6 | % | | 0.8 | % | | 4.3 | % | | 4.0 | % | | -/+ $50 to $70 million |
| | | | | | | | | | | | | | | |
| 2020 Tax-year | | 2020 Assumptions | | | | | | | | | |
| B.C. tax base growth (post federal measures) | | 8.3 | % | | | | | | | | | | | |
| Share of the B.C. tax base subject to small business rate | | 27.5 | % | | | | | | | | | | | +/- 1% change in the 2021 B.C. tax base |
| B.C. net operating surplus growth | | 19.1 | % | | | | | | | | | | | equals +/- $40 to $60 million one-time effect |
| Gross 2020 tax | | 4,947 | | | | | | | | | | | | (prior-year adjustment) and could result in an |
| Prior-year settlement payment | | (171 | ) | | | | | | | | | | | additional installments payments of |
| Prior years losses/gains (included in above) | | (62 | ) | | | | | | | | | | | +/- $60 to $80 million in 2022/23 |
| Non-refundable B.C. tax credits | | (120 | ) | | | | | | | | | | | |
* Reflects information as at January 20, 2022
Cash received from the federal government is used as the basis for estimating revenue. Due to lags in the federal collection and installment systems, changes to the B.C. net operating surplus and tax base forecasts affect revenue in the succeeding year. The 2022/23 installments from the federal government reflects two-third of payments related to the 2022 tax year (paid during Apr-July 2022 and adjusted in Sept and Dec) and one-third of 2023 payments. Installments for the 2022 (2023) tax year are based on B.C.’s share of the national tax base for the 2021 (2022) tax year and a forecast of the 2022 (2023) national tax base. B.C.’s share of the 2020 national tax base was 14.1%, based on tax assessments as of December 31, 2021. Cash adjustments for any under/over payments from the federal government in respect of 2021 will be received/paid on March 31, 2023.
Budget and Fiscal Plan - 2022/23 to 2024/25
159
Appendix
Table A5 Material Assumptions – Revenue (continued)
Revenue Source and Assumptions
($ millions unless otherwise specified) | | Updated
Forecast
2021/22 | | | Budget
Estimate
2022/23 | | | Plan
2023/24 | | | Plan
2024/25 | | | 2022/23 Sensitivities |
| Employer health tax | | 2,130 | | | 2,257 | | | 2,349 | | | 2,441 | | | |
| Compensation of employees growth | | 10.7 | % | | 6.0 | % | | 4.1 | % | | 3.9 | % | | +/- 1 percentage point change in the 2022 compensation |
| | | | | | | | | | | | | | | of employees growth equals up to +/- $22 million |
| | | | | | | | | | | | | | | |
| Provincial sales tax | | 8,441 | | | 9,009 | | | 9,546 | | | 9,928 | | | |
| Provincial sales tax base growth (fiscal year) | | 11.6 | % | | 4.7 | % | | 4.3 | % | | 4.2 | % | | +/- 1 percentage point change in the |
| Calendar Year nominal expenditure | | | | | | | | | | | | | | 2022 consumer expenditure growth |
| Consumer expenditures on durable goods | | 17.9 | % | | 3.4 | % | | 1.3 | % | | 2.1 | % | | equals up to +/- $20 to $30 million |
| Consumer expenditures on goods and services | | 7.7 | % | | 8.1 | % | | 6.6 | % | | 5.2 | % | | |
| Business investment | | 16.9 | % | | 3.9 | % | | 6.2 | % | | 4.8 | % | | |
| Other | | 16.1 | % | | 3.3 | % | | 2.2 | % | | 3.8 | % | | |
| Components of Provincial sales tax revenue | | | | | | | | | | | | | | +/- 1 percentage point change in the |
| Consolidated Revenue Fund | | 8,436 | | | 9,002 | | | 9,539 | | | 9,921 | | | 2022 business investment growth |
| BC Transportation Financing Authority | | 5 | | | 7 | | | 7 | | | 7 | | | equals up to +/- $10 to $20 million |
| | | | | | | | | | | | | | | |
| Fuel and carbon taxes | | 3,087 | | | 3,362 | | | 3,407 | | | 3,452 | | | |
| Calendar Year | | | | | | | | | | | | | | |
| Real GDP | | 5.0 | % | | 4.0 | % | | 2.5 | % | | 2.1 | % | | |
| Gasoline volumes | | 7.0 | % | | 0.0 | % | | 0.0 | % | | 0.0 | % | | |
| Diesel volumes | | 8.0 | % | | 3.0 | % | | 2.0 | % | | 2.0 | % | | |
| Natural gas volumes | | 4.0 | % | | 2.0 | % | | 2.0 | % | | 2.0 | % | | |
| Carbon tax rates (April 1) | | | | | | | | | | | | | | |
| Carbon dioxide equivalent emissions ($/tonne) | | 45 | | | 50 | | | 50 | | | 50 | | | |
| Natural gas (cents/gigajoule) | | 223.47 | ¢ | | 248.30 | ¢ | | 248.30 | ¢ | | 248.30 | ¢ | | |
| Gasoline (cents/litre) | | 9.96 | ¢ | | 11.05 | ¢ | | 11.05 | ¢ | | 11.05 | ¢ | | |
| Light fuel oil (cents/litre) | | 11.71 | ¢ | | 13.01 | ¢ | | 13.01 | ¢ | | 13.01 | ¢ | | |
| | | | | | | | | | | | | | | |
| Components of revenue * | | | | | | | | | | | | | | |
| Consolidated Revenue Fund | | 559 | | | 566 | | | 571 | | | 577 | | | |
| BC Transit | | 18 | | | 18 | | | 18 | | | 18 | | | |
| BC Transportation Financing Authority | | 462 | | | 467 | | | 470 | | | 473 | | | |
| Fuel tax revenue | | 1,039 | | | 1,051 | | | 1,059 | | | 1,068 | | | |
| Carbon tax revenue | | 2,048 | | | 2,311 | | | 2,348 | | | 2,384 | | | |
| | | | | | | | | | | | | | | |
| Property taxes | | 3,020 | | | 3,173 | | | 3,354 | | | 3,514 | | | |
| Calendar Year | | | | | | | | | | | | | | |
| Consumer Price Index | | 2.8 | % | | 2.9 | % | | 2.2 | % | | 2.0 | % | | +/- 1 percentage point change in |
| Housing starts (units) | | 47,607 | | | 38,022 | | | 36,001 | | | 35,032 | | | 2022 new construction & inflation |
| Home owner grants (fiscal year) | | 874 | | | 892 | | | 909 | | | 928 | | | growth equals up to +/- $30 million in |
| Components of revenue | | | | | | | | | | | | | | residential property taxation revenue |
| Residential (net of home owner grants) | | 1,188 | | | 1,261 | | | 1,337 | | | 1,404 | | | |
| Speculation and vacancy | | 80 | | | 80 | | | 80 | | | 80 | | | |
| Non-residential | | 1,367 | | | 1,448 | | | 1,530 | | | 1,617 | | | +/- 1% change in 2022 total |
| Rural area | | 131 | | | 134 | | | 140 | | | 146 | | | business property assessment |
| Police | | 36 | | | 37 | | | 38 | | | 39 | | | value equals up to +/- $20 million |
| BC Assessment Authority | | 127 | | | 103 | | | 103 | | | 104 | | | in non-residential property |
| BC Transit | | 91 | | | 110 | | | 126 | | | 124 | | | taxation revenue |
| | | | | | | | | | | | | | | |
| Other taxes | | 4,630 | | | 3,920 | | | 3,836 | | | 3,901 | | | |
| Calendar Year | | | | | | | | | | | | | | |
| Population | | 1.1 | % | | 1.9 | % | | 1.6 | % | | 1.5 | % | | |
| Residential sales value | | 57.7 | % | | -19.6 | % | | -5.1 | % | | 2.2 | % | | |
| Real GDP | | 5.0 | % | | 4.0 | % | | 2.5 | % | | 2.1 | % | | |
| Nominal GDP | | 12.4 | % | | 5.8 | % | | 4.1 | % | | 4.0 | % | | |
| Components of revenue | | | | | | | | | | | | | | +/- 1% change to 2022 residential |
| Property transfer | | 3,250 | | | 2,500 | | | 2,406 | | | 2,461 | | | sales value equals +/- $30 million |
| Additional Property Transfer Tax (included in above) | | 105 | | | 104 | | | 100 | | | 101 | | | in property transfer revenue, |
| Tobacco | | 740 | | | 760 | | | 760 | | | 760 | | | depending on property values |
| Insurance premium | | 640 | | | 660 | | | 670 | | | 680 | | | |
Budget and Fiscal Plan - 2022/23 to 2024/25
160
Appendix
Table A5 Material Assumptions – Revenue (continued)
Revenue Source and Assumptions
($ millions unless otherwise specified) | | Updated
Forecast
2021/22 | | | Budget
Estimate
2022/23 | | | Plan
2023/24 | | | Plan
2024/25 | | | 2022/23 Sensitivities |
| Energy, sales of Crown land tenures, metals, minerals and other * | | 1,771 | | | 1,752 | | | 1,390 | | | 1,179 | | | |
| Natural gas price | | | | | | | | | | | | | | +/- $0.25 change in the natural gas |
| Plant inlet, $C/gigajoule | | 2.38 | | | 2.09 | | | 1.67 | | | 1.55 | | | price equals +/- $130 to $150 million, |
| Sumas, $US/MMBtu | | 3.33 | | | 3.09 | | | 2.70 | | | 2.60 | | | including impacts on production |
| Natural gas production volumes | | | | | | | | | | | | | | volumes and royalty program |
| Billions of cubic metres | | 60.1 | | | 62.4 | | | 63.7 | | | 65.6 | | | credits, but excluding any |
| Petajoules | | 2,496 | | | 2,588 | | | 2,644 | | | 2,723 | | | changes from natural gas liquids |
| Annual per cent change | | 8.4 | % | | 3.7 | % | | 2.2 | % | | 3.0 | % | | revenue (e.g. butane, pentanes) |
| | | | | | | | | | | | | | | Sensitivities can also vary |
| Oil price ($US/bbl at Cushing, OK) | | 71.20 | | | 70.66 | | | 67.54 | | | 66.05 | | | significantly at different price levels |
| | | | | | | | | | | | | | | +/- 1% change in natural gas |
| Auctioned land base (000 hectares) | | 6 | | | 7 | | | 22 | | | 20 | | | volumes equals +/- $9 million |
| Average bid price/hectare ($) | | 660 | | | 275 | | | 275 | | | 300 | | | in natural gas royalties |
| Cash sales of Crown land tenures | | 4 | | | 2 | | | 6 | | | 6 | | | +/- 1 cent change in the exchange rate |
| Metallurgical coal price ($US/tonne, fob Australia) | | 223 | | | 202 | | | 163 | | | 158 | | | equals +/-$1 million in natural gas royalties |
| Copper price ($US/lb) | | 4.30 | | | 3.95 | | | 3.73 | | | 3.57 | | | |
| Annual electricity volumes set by treaty | | 3.8 | | | 3.8 | | | 3.9 | | | 3.8 | | | +/- $10/bbl change in petroleum price |
| (million mega-watt hours) | | | | | | | | | | | | | | equals +/- $5 million in petroleum royalties |
| Mid-Columbia electricity price | | 53.20 | | | 57.50 | | | 57.33 | | | 51.03 | | | +/- 14% change in natural gas liquids |
| ($US/mega-watt hour) | | | | | | | | | | | | | | (equivalent to +/- $10/bbl oil price) prices |
| | | | | | | | | | | | | | | equals +/- $70 to $80 million in natural gas |
| Exchange rate (US¢/C$, calendar year) | | 79.8 | | | 79.9 | | | 79.3 | | | 78.9 | | | liquids royalties |
| Components of revenue | | | | | | | | | | | | | | |
| Bonus bid auctions: | | | | | | | | | | | | | | +/- US$20 change in the average |
| Deferred revenue | | 91 | | | 81 | | | 61 | | | 29 | | | metallurgical coal price |
| Current-year cash (one-tenth) | | — | | | — | | | 1 | | | 1 | | | equals +/- $50 to $80 million |
| Fees and rentals | | 50 | | | 49 | | | 49 | | | 49 | | | +/- 10% change in the average |
| Total bonus bids, fees and rentals | | 141 | | | 130 | | | 111 | | | 79 | | | Mid-Columbia electricity price |
| Natural gas royalties after deductions and allowances | | 749 | | | 911 | | | 691 | | | 580 | | | equals +/- $26 million |
| Petroleum royalties | | 32 | | | 30 | | | 28 | | | 26 | | | |
| Columbia River Treaty electricity sales | | 237 | | | 257 | | | 260 | | | 230 | | | Based on a recommendation |
| Oil and Gas Commission fees and levies | | 63 | | | 65 | | | 66 | | | 67 | | | from the Auditor General to be |
| Coal, metals and other minerals revenue: | | | | | | | | | | | | | | consistent with generally |
| Coal tenures | | 5 | | | 8 | | | 8 | | | 8 | | | accepted accounting principles, |
| Net coal mineral tax | | 371 | | | 212 | | | 80 | | | 59 | | | bonus bid revenue recognition |
| Net metals and other minerals tax | | 114 | | | 61 | | | 65 | | | 59 | | | reflects ten-year deferral of |
| Recoveries relating to revenue sharing payments | | | | | | | | | | | | | | cash receipts from the sale of |
| to First Nations | | 41 | | | 60 | | | 63 | | | 53 | | | Crown land tenures |
| Miscellaneous mining revenue | | 18 | | | 18 | | | 18 | | | 18 | | | |
| Total coal, metals and other minerals revenue | | 549 | | | 359 | | | 234 | | | 197 | | | |
| | | | | | | | | | | | | | | |
| Gross royalties prior to deductions and allowances | | | | | | | | | | | | | | |
| Gross natural gas revenue | | 1,481 | | | 1,268 | | | 850 | | | 748 | | | |
| Gross natural gas liquids royalties revenue | | 756 | | | 766 | | | 700 | | | 694 | | | |
| | | | | | | | | | | | | | | |
| Royalty programs and infrastructure credits | | | | | | | | | | | | | | |
| Deep drilling | | (1,162 | ) | | (778 | ) | | (527 | ) | | (505 | ) | | |
| Road, pipeline, Clean Growth Infrastructure Royalty and other infrastructure programs | | (78 | ) | | (85 | ) | | (107 | ) | | (135 | ) | | |
| Total | | (1,240 | ) | | (863 | ) | | (634 | ) | | (640 | ) | | |
| Implicit average natural gas royalty rate | | 12.5 | % | | 16.9 | % | | 15.7 | % | | 13.7 | % | | |
Royalty program (marginal, low productivity and ultra marginal drilling) adjustments reflect reduced royalty rates.
Natural gas royalties incorporate royalty programs and Treasury Board approved infrastructure credits.
* Reflects information as at January 11, 2022.
Budget and Fiscal Plan - 2022/23 to 2024/25
161
Appendix
Table A5 Material Assumptions – Revenue (continued)
Revenue Source and Assumptions
($ millions unless otherwise specified) | | Updated
Forecast
2021/22 | | | Budget
Estimate
2022/23 | | | Plan
2023/24 | | | Plan
2024/25 | | | 2022/23 Sensitivities |
| Forests * | | 1,847 | | | 1,121 | | | 887 | | | 909 | | | |
| Prices (calendar year average) | | | | | | | | | | | | | | +/- US$50 change in SPF |
| SPF 2x4 ($US/thousand board feet) | | 883 | | | 575 | | | 475 | | | 450 | | | price equals +/- $100 to $150 million |
| | | | | | | | | | | | | | | |
| Crown harvest volumes (million cubic metres) | | | | | | | | | | | | | | |
| Interior | | 35.7 | | | 31.4 | | | 30.2 | | | 31.1 | | | +/- 10% change in Interior |
| Coast | | 9.3 | | | 8.6 | | | 8.3 | | | 8.4 | | | harvest volumes equals |
| Total | | 45.0 | | | 40.0 | | | 38.5 | | | 39.5 | | | +/- $70 to $80 million |
| B.C. Timber Sales (included in above) | | 9.7 | | | 6.5 | | | 6.7 | | | 7.6 | | | +/- 10% change in Coastal |
| | | | | | | | | | | | | | | harvest volumes equals |
| Stumpage rates ($Cdn/cubic metre) | | | | | | | | | | | | | | +/- $20 to $30 million |
| Total stumpage rates | | 37.14 | | | 25.04 | | | 20.71 | | | 20.75 | | | +/- 1 cent change in |
| | | | | | | | | | | | | | | exchange rate equals |
| Components of revenue | | | | | | | | | | | | | | +/- $20 to $30 million in |
| Timber tenures (net of revenue sharing recoveries) | | 1,229 | | | 715 | | | 505 | | | 499 | | | stumpage revenue |
| Recoveries relating to revenue sharing payments to First Nations | | 46 | | | 46 | | | 53 | | | 49 | | | |
| B.C. Timber Sales | | 417 | | | 260 | | | 258 | | | 290 | | | The above sensitivities relate |
| Logging tax | | 110 | | | 60 | | | 30 | | | 30 | | | to stumpage revenue only. |
| Other CRF revenue | | 35 | | | 30 | | | 30 | | | 30 | | | |
| Recoveries | | 10 | | | 10 | | | 11 | | | 11 | | | |
| | | | | | | | | | | | | | | |
| * Reflects information as at January 7, 2022 | | | | | | |
| | | | | | | | | | | | | | | |
| Other natural resource | | 505 | | | 514 | | | 521 | | | 518 | | | |
| Components of revenue | | | | | | | | | | | | | | |
| Water rental and licences* | | 433 | | | 441 | | | 448 | | | 445 | | | +/- 5% change in water |
| Recoveries | | 50 | | | 50 | | | 50 | | | 50 | | | power production equals |
| Angling and hunting permits and licences | | 9 | | | 10 | | | 10 | | | 10 | | | +/- $20 to $25 million |
| Recoveries | | 13 | | | 13 | | | 13 | | | 13 | | | |
| * Water rentals for power purposes are indexed to Consumer Price Index. | | | | | | |
| | | | | | | | | | | | | | | |
| Total natural resource recoveries relating to revenue sharing payments to First Nations | | 88 | | | 118 | | | 124 | | | 109 | | | Revenue sharing from natural gas royalties, mineral tax and forest stumpage revenues. |
| | | | | | | | | | | | | | | |
| | | | | | | | | | | | | | | |
| Other revenue | | 9,550 | | | 9,991 | | | 10,210 | | | 10,314 | | | |
| Components of revenue | | | | | | | | | | | | | | |
| Fees and licences | | | | | | | | | | | | | | |
| Motor vehicle licences and permits | | 608 | | | 614 | | | 625 | | | 635 | | | |
| International student health fees | | 65 | | | 70 | | | 70 | | | 70 | | | |
| Other Consolidated Revenue Fund | | 470 | | | 449 | | | 473 | | | 467 | | | |
| Summary consolidation eliminations | | (15 | ) | | (16 | ) | | (15 | ) | | (15 | ) | | |
| Ministry vote recoveries | | 187 | | | 190 | | | 143 | | | 96 | | | |
| Taxpayer-supported Crown corporations | | 181 | | | 192 | | | 191 | | | 193 | | | |
| Post-secondary education fees | | 2,539 | | | 2,679 | | | 2,779 | | | 2,859 | | | |
| Other healthcare-related fees | | 421 | | | 437 | | | 441 | | | 441 | | | |
| School Districts | | 268 | | | 271 | | | 275 | | | 279 | | | |
| Investment earnings | | | | | | | | | | | | | | |
| Consolidated Revenue Fund | | 103 | | | 95 | | | 96 | | | 90 | | | |
| Fiscal agency loans & sinking funds earnings | | 855 | | | 944 | | | 991 | | | 1,010 | | | |
| Summary consolidation eliminations | | (41 | ) | | (48 | ) | | (52 | ) | | (68 | ) | | |
| Taxpayer-supported Crown corporations | | 45 | | | 27 | | | 27 | | | 27 | | | |
| SUCH sector agencies | | 407 | | | 280 | | | 282 | | | 285 | | | |
| Sales of goods and services | | | | | | | | | | | | | | |
| SUCH sector agencies | | 789 | | | 987 | | | 1,103 | | | 1,176 | | | |
| BC Infrastructure Benefits Inc | | 68 | | | 227 | | | 298 | | | 246 | | | |
| Other taxpayer-supported Crown corporations | | 185 | | | 205 | | | 220 | | | 228 | | | |
| Miscellaneous | | 2,415 | | | 2,388 | | | 2,263 | | | 2,295 | | | |
Budget and Fiscal Plan - 2022/23 to 2024/25
162
Appendix
Table A5 Material Assumptions – Revenue (continued)
Revenue Source and Assumptions
($ millions unless otherwise specified) | | Updated
Forecast
2021/22 | | | Budget
Estimate
2022/23 | | | Plan
2023/24 | | | Plan
2024/25 | | | 2022/23 Sensitivities |
| Health and social transfers | | 8,534 | | | 8,363 | | | 8,932 | | | 9,343 | | | |
| National Cash Transfers | | | | | | | | | | | | | | |
| Canada Health Transfer (CHT) | | 43,126 | | | 45,208 | | | 48,720 | | | 51,120 | | | |
| Annual growth | | 3.0 | % | | 4.8 | % | | 7.8 | % | | 4.9 | % | | |
| Canada Social Transfer (CST) | | 15,474 | | | 15,938 | | | 16,416 | | | 16,909 | | | |
| B.C.’s share of national population (June 1) | | 13.622 | % | | 13.678 | % | | 13.713 | % | | 13.735 | % | | +/- 0.1 percentage point change in |
| | | | | | | | | | | | | | | B.C.’s population share equals |
| B.C. health and social transfers revenue | | | | | | | | | | | | | | +/- $60 million |
| CHT | | 5,875 | | | 6,183 | | | 6,681 | | | 7,021 | | | |
| CST | | 2,108 | | | 2,180 | | | 2,251 | | | 2,322 | | | |
| Prior-year adjustments: | | | | | | | | | | | | | | |
| CHT | | 7 | | | — | | | — | | | — | | | |
| CST | | 2 | | | — | | | — | | | — | | | |
| Helping Health Care Systems Recover funding | | 542 | | | | | | — | | | — | | | |
| | | | | | | | | | | | | | | |
| Other federal contributions | | 2,948 | | | 2,977 | | | 2,810 | | | 2,589 | | | |
| Components of revenue | | | | | | | | | | | | | | |
| COVID-19 related funding: | | | | | | | | | | | | | | |
| Long term care facilities | | 134 | | | | | | | | | | | | |
| Canada’s COVID-19 Immunization Plan | | 135 | | | | | | | | | | | | |
| Financial Assistance Agreement to Support Closure and Restoration of Oil and Gas | | | | | | | | | | | | | | |
| Sites in British Columbia | | 53 | | | 40 | | | — | | | — | | | |
| Total | | 322 | | | 40 | | | — | | | — | | | |
| Disaster Financial Assistance Arrangements | | 3 | | | 28 | | | 162 | | | 17 | | | |
| B.C.’s share of the federal cannabis excise tax | | 68 | | | 70 | | | 70 | | | 70 | | | |
| Low Carbon Economy Leadership Fund | | 13 | | | 2 | | | — | | | — | | | |
| Other Consolidated Revenue Fund | | 150 | | | 222 | | | 102 | | | 101 | | | |
| Vote Recoveries: | | | | | | | | | | | | | | |
| Labour Market Development Agreement | | 339 | | | 345 | | | 297 | | | 299 | | | |
| Labour Market and Skills Training Program | | 191 | | | 124 | | | 124 | | | 124 | �� | | |
| Home Care | | 122 | | | 82 | | | 83 | | | 83 | | | |
| Mental Health | | 81 | | | 82 | | | 82 | | | 82 | | | |
| Low Carbon Economy Leadership Fund | | 28 | | | — | | | — | | | — | | | |
| Child Care * | | 128 | | | 464 | | | 464 | | | 464 | | | |
| Child Safety, Family Support, Children in Care and with special needs | | 93 | | | 83 | | | 83 | | | 83 | | | |
| Public Transit | | 88 | | | 82 | | | 162 | | | 105 | | | |
| Local government services and transfers | | 191 | | | 195 | | | 1 | | | 1 | | | |
| Other recoveries | | 120 | | | 155 | | | 153 | | | 153 | | | |
| Taxpayer-supported Crown corporations | | 288 | | | 278 | | | 298 | | | 276 | | | |
| Post-secondary institutions | | 603 | | | 603 | | | 607 | | | 610 | | | |
| Other SUCH sector agencies | | 120 | | | 122 | | | 122 | | | 121 | | | |
| | | | | | | | | | | | | | | |
| * This includes recovery amounts provided under two agreements with the Government of Canada: the Canada-Wide Early Learning and Childcare agreement and the Early Learning and Childcare agreement. Amounts for the Canada-Wide Early Learning and Childcare agreement for 2023/24 and beyond will be adjusted upon completion and acceptance of the Province’s Action Plan for those years by the Government of Canada. |
| | | | | | | | | | | | | | | |
| Service delivery agency direct revenue | | 8,179 | | | 8,518 | | | 8,868 | | | 9,002 | | | |
| School districts | | 719 | | | 678 | | | 680 | | | 684 | | | |
| Post-secondary institutions | | 4,642 | | | 4,856 | | | 5,093 | | | 5,264 | | | |
| Health authorities and hospital societies | | 1,028 | | | 1,051 | | | 1,050 | | | 1,050 | | | |
| BC Transportation Financing Authority | | 546 | | | 562 | | | 560 | | | 570 | | | |
| Other service delivery agencies | | 1,244 | | | 1,371 | | | 1,485 | | | 1,434 | | | |
Budget and Fiscal Plan - 2022/23 to 2024/25
163
Appendix
Table A5 Material Assumptions – Revenue (continued)
Revenue Source and Assumptions
($ millions unless otherwise specified) | | Updated
Forecast
2021/22 | | | Budget
Estimate
2022/23 | | | Plan
2023/24 | | | Plan
2024/25 | | | 2022/23 Sensitivities |
| Commercial Crown corporation net income | | 5,013 | | | 3,764 | | | 3,748 | | | 3,827 | | | |
| BC Hydro | | 681 | | | 712 | | | 712 | | | 712 | | | Sensitivities impacts shown below are before regulatory account transfers |
| Reservoir water inflows | | 99.5 | % | | 100 | % | | 100 | % | | 100 | % | | +/-1% in hydro generation equals +/- $20 million |
| Mean gas price | | 5.08 | | | 4.07 | | | 3.32 | | | 3.22 | | | +/-10% equals +/-$1.0 million |
| (Sumas, $US/MMbtu – BC Hydro forecast based on NYMEX forward selling prices) | | | | | | | | | | | | | | |
| Electricity prices | | 62.77 | | | 51.18 | | | 47.57 | | | 45.43 | | | +/-10% change in electricity/gas trade margins equals |
| (Mid-C, $US/MWh) | | | | | | | | | | | | | | +/- $30 million |
| | | | | | | | | | | | | | | |
| ICBC | | 1,904 | | | 327 | | | 240 | | | 280 | | | |
| Vehicle growth | | 2.0 | % | | 2.0 | % | | 1.5 | % | | 1.5 | % | | +/-1% equals +/-$53 million |
| Current claims cost percentage change | | -2.8 | % | | 14.5 | % | | 4.9 | % | | 3.3 | % | | +/-1% equals +/-$41 million |
| Unpaid claims balance ($ billions) | | 14.0 | | | 11.9 | | | 10.0 | | | 8.5 | | | +/-1% equals +/-$119 to $140 million |
| Investment return | | 7.0 | % | | 3.1 | % | | 2.9 | % | | 3.0 | % | | +/-1% return equals +/-$204 to $214 million |
| Loss ratio | | 71.8 | % | | 86.7 | % | | 86.7 | % | | 86.1 | % | | |
Budget and Fiscal Plan - 2022/23 to 2024/25
164
Appendix
Table A6 Natural Gas Price Forecasts – 2022/23 to 2024/25
| Private sector forecasts (calendar year) | | 2022 | | | 2023 | | | 2024 | | | 2022/23 | | | 2023/24 | | | 2024/25 | |
| GLJ Henry Hub US$/MMBtu (Jan 1, 2022) | | | 3.80 | | | | 3.50 | | | | 3.15 | | | | 2.37 | | | | 1.90 | | | | 1.63 | |
| Sproule Henry Hub US$/MMBtu (Dec 31, 2021) | | | 4.00 | | | | 3.50 | | | | 3.25 | | | | 2.39 | | | | 1.94 | | | | 1.75 | |
| McDaniel Henry Hub US$/MMBtu (Jan 1, 2022) | | | 3.75 | | | | 3.32 | | | | 3.12 | | | | 2.12 | | | | 1.73 | | | | 1.60 | |
| Deloitte Henry Hub US$/Mcf (Dec 31, 2021) | | | 4.00 | | | | 3.55 | | | | 3.40 | | | | 2.25 | | | | 1.88 | | | | 1.78 | |
| GLJ Alberta AECO-C Spot CDN$/MMBtu (Jan 1, 2022) | | | 3.40 | | | | 3.10 | | | | 3.15 | | | | 1.98 | | | | 1.82 | | | | 1.87 | |
| Sproule Alberta AECO-C Spot CDN$/MMBtu (Dec 31, 2021) | | | 3.88 | | | | 3.36 | | | | 3.02 | | | | 2.41 | | | | 1.96 | | | | 1.75 | |
| McDaniel AECO-C Spot C$/MMBtu (Jan 1, 2022) | | | 3.40 | | | | 3.16 | | | | 2.97 | | | | 2.03 | | | | 1.82 | | | | 1.70 | |
| Deloitte AECO-C Spot C$/Mcf (Dec 31, 2021) | | | 3.65 | | | | 3.25 | | | | 3.15 | | | | 2.11 | | | | 1.82 | | | | 1.78 | |
| GLJ Sumas Spot US$/MMBtu (Jan 1, 2022) | | | 3.70 | | | | 3.40 | | | | 3.05 | | | | 2.85 | | | | 2.38 | | | | 2.11 | |
| Sproule Sumas Spot CDN$/MMBtu (Dec 31, 2021) | | | 4.53 | | | | 4.02 | | | | 3.70 | | | | 2.58 | | | | 2.15 | | | | 1.95 | |
| GLJ BC Spot Plant Gate CDN$/MMBtu (Jan 1, 2022) | | | 3.06 | | | | 2.81 | | | | 2.86 | | | | 1.92 | | | | 1.81 | | | | 1.86 | |
| Sproule BC Station 2 CDN$/MMBtu (Dec 31, 2021) | | | 3.78 | | | | 3.25 | | | | 2.92 | | | | 2.37 | | | | 1.93 | | | | 1.71 | |
| McDaniel BC Avg Plant Gate C$MMBtu (Jan 1, 2022) | | | 3.15 | | | | 2.91 | | | | 2.71 | | | | 2.06 | | | | 1.84 | | | | 1.71 | |
| Deloitte BC Station 2 C$MMBtu (Dec 31, 2021) | | | 3.15 | | | | 3.05 | | | | 3.15 | | | | 2.28 | | | | 1.99 | | | | 1.95 | |
| GLJ Midwest Chicago US$/MMBtu (Jan 1, 2022) | | | 3.35 | | | | 3.00 | | | | 3.06 | | | | 2.82 | | | | 2.35 | | | | 2.08 | |
| Sproule Alliance Plant Gate CDN$/MMBtu (Dec 31, 2021) | | | 4.85 | | | | 4.22 | | | | 3.91 | | | | 3.30 | | | | 2.79 | | | | 2.60 | |
| EIA Henry Hub US$/MMBtu (Dec 2, 2021) | | | 4.13 | | | | | | | | | | | | | | | | | | | | | |
| TD Economics Henry Hub FuturesUS$/MMBtu (Dec 2021) | | | 4.29 | | | | 3.70 | | | | | | | | 3.80 | | | | | | | | | |
| Scotiabank Group Henry Hub US$/MMBtu (Dec 2021) | | | 4.70 | | | | 3.28 | | | | | | | | 3.96 | | | | | | | | | |
| BMO Henry Hub US$/MMBtu (Dec 2021) | | | 4.00 | | | | | | | | | | | | | | | | | | | | | |
| InSite Petroleum Consultants Ltd BC Spot C$/Mcf (Dec 31, 2021) | | | 3.55 | | | | 3.25 | | | | 3.05 | | | | 2.16 | | | | 1.90 | | | | 1.79 | |
| NYMEX Forward Market converted to Plant Inlet CDN$/GJ (Jan 3, 2022) | | | | | | | | | | | | | | | 2.37 | | | | 1.79 | | | | 1.60 | |
| | | | | | | | | | | | | | | | | | | | | | | | | |
| Average all minus high/low | | | | | | | | | | | | | | | 2.46 | | | | 1.97 | | | | 1.83 | |
| | | | | | | | | | | | | | | | | | | | | | | | | |
| Average one forecast per consultant minus high/low | | | | | | | | | | | | | | | 2.53 | | | | 1.89 | | | | 1.79 | |
| | | | | | | | | | | | | | | | | | | | | | | | | |
| Natural gas royalty price forecast | | | | | | | | | | | | | | | 2.09 | | | | 1.67 | | | | 1.55 | |
GLJ: Gilbert Laustsen Jung Petroleum Consultants Ltd US EIA: US Energy Information Administration AECO: Alberta Energy Company Deloitte/AJM: Deloitte L.L.P acquired Ashton Jenkins Mann Petroleum Consultants McDaniel: McDaniel & Associates Consultants Ltd
Budget and Fiscal Plan - 2022/23 to 2024/25
166
Appendix
Natural Gas Prices
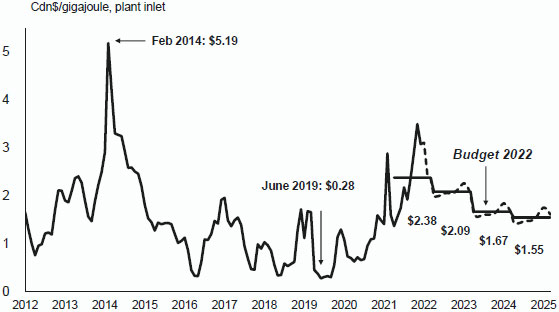
Budget and Fiscal Plan - 2022/23 to 2024/25
167
Appendix
Table A7 Material Assumptions – Expense
Ministry Programs and Assumptions
($ millions unless otherwise specified) | | Updated
Forecast
2021/22 | | | Budget
Estimate
2022/23 | | | Plan
2023/24 | | | Plan
2024/25 | | | 2022/23 Sensitivities |
| Advanced Education and Skills Training | | | 2,577 | | | | 2,613 | | | | 2,597 | | | | 2,598 | | | |
| Student spaces in public institutions | | | 204,895 | | | | 205,148 | | | | 204,989 | | | | 205,004 | | | Student enrolments may fluctuate due to a number of |
| | | | | | | | | | | | | | | | | | | factors including economic changes and labour market needs. |
| | | | | | | | | | | | | | | | | | | |
| Attorney General | | | 1,273 | | | | 1,374 | | | | 1,402 | | | | 1,428 | | | |
| New cases filed/processed | | | 216,000 | | | | 242,000 | | | | 242,000 | | | | 242,000 | | | The number of criminal cases proceeded on by the |
| (# for all courts) | | | | | | | | | | | | | | | | | | provincial and federal Crown (including appeals to higher |
| | | | | | | | | | | | | | | | | | | courts in BC), the number of civil and family litigation |
| | | | | | | | | | | | | | | | | | | cases, the number of violation tickets disputed, and the |
| | | | | | | | | | | | | | | | | | | number of municipal bylaw tickets disputed which would |
| | | | | | | | | | | | | | | | | | | go to court for resolution. |
| | | | | | | | | | | | | | | | | | | |
| Crown Proceeding Act (CPA) | | | 25 | | | | 25 | | | | 25 | | | | 25 | | | The number of new cases and the difference between |
| | | | | | | | | | | | | | | | | | | estimated settlements and actual settlements and in |
| | | | | | | | | | | | | | | | | | | some cases, the impact of potential legislative changes. |
| | | | | | | | | | | | | | | | | | | |
| Children and Family Development | | | 1,662 | | | | 1,742 | | | | 1,756 | | | | 1,768 | | | |
| Average children-in-care | | | 5,109 | | | | 4,852 | | | | 4,686 | | | | 4,599 | | | |
| caseload (#) | | | | | | | | | | | | | | | | | | |
| Average annual residential | | | 94,565 | | | | 105,337 | | | | 116,832 | | | | 128,943 | | | |
| cost per child in care ($) | | | | | | | | | | | | | | | | | | The average number of children-in-care is decreasing as |
| | | | | | | | | | | | | | | | | | | a result of ministry efforts to keep children in family |
| | | | | | | | | | | | | | | | | | | settings where safe and feasible. The average cost per |
| | | | | | | | | | | | | | | | | | | child in care is projected to increase based on the higher |
| | | | | | | | | | | | | | | | | | | cost of contracted residential services and an increasing |
| | | | | | | | | | | | | | | | | | | acuity of need for children in care. A 1% increase in the |
| | | | | | | | | | | | | | | | | | | cost per case or a 1% increase in the average caseload |
| | | | | | | | | | | | | | | | | | | will affect expenditures by $2.5 million (excluding |
| | | | | | | | | | | | | | | | | | | Delegated Aboriginal Agencies). |
| | | | | | | | | | | | | | | | | | | |
| Education and Child Care | | | 7,845 | | | | 8,217 | | | | 8,226 | | | | 8,262 | | | |
| Public School Enrolment (# of FTEs) | | | 574,434 | | | | 584,227 | | | | 592,074 | | | | 597,870 | | | Updated forecast enrolment figures are based on |
| School age (K–12) | | | 547,296 | | | | 558,717 | | | | 566,459 | | | | 572,176 | | | submissions from school districts of their actual |
| Continuing Education | | | 812 | | | | 1,062 | | | | 1,062 | | | | 1,062 | | | enrolment as at September 30, 2021 for the 2021/22 |
| Distributed Learning (online) | | | 16,975 | | | | 14,607 | | | | 14,714 | | | | 14,793 | | | school year and projected enrolment for February and |
| Summer | | | 7,279 | | | | 7,279 | | | | 7,279 | | | | 7,279 | | | May 2022 for Distributed Learning and Adults. |
| Adults | | | 2,071 | | | | 2,562 | | | | 2,559 | | | | 2,559 | | | Projections for 2022/23 and 2023/24 are based on the |
| | | | | | | | | | | | | | | | | | | Ministry of Education’s enrolment forecasting model. |
| Forests | | | 1,453 | | | | 832 | | | | 846 | | | | 865 | | | |
| BC Timber Sales | | | 234 | | | | 207 | | | | 213 | | | | 232 | | | Targets can be impacted by changes to actual inventory |
| | | | | | | | | | | | | | | | | | | costs incurred. There is a lag of approximately 1.5 years |
| | | | | | | | | | | | | | | | | | | between when inventory costs are incurred and when |
| | | | | | | | | | | | | | | | | | | they are expensed. Volume harvested can also impact |
| | | | | | | | | | | | | | | | | | | targets. For example, if volume harvested is less than |
| | | | | | | | | | | | | | | | | | | projected in any year, then capitalized expenses will also |
| | | | | | | | | | | | | | | | | | | be reduced in that year. |
| | | | | | | | | | | | | | | | | | | |
| Fire Management | | | 801 | | | | 194 | | | | 199 | | | | 199 | | | Costs are driven by length of season and severity of |
| | | | | | | | | | | | | | | | | | | weather conditions, severity of fires, proportion of |
| | | | | | | | | | | | | | | | | | | interface fires and size of fires. |
| | | | | | | | | | | | | | | | | | | |
| Health | | | 23,882 | | | | 25,456 | | | | 26,243 | | | | 27,047 | | | |
| Pharmacare | | | 1,470 | | | | 1,514 | | | | 1,539 | | | | 1,564 | | | A 1% change in PharmaCare utilization or prices affects |
| | | | | | | | | | | | | | | | | | | costs by approximately $13 million. |
| Medical Services Plan (MSP) | | | 5,550 | | | | 6,069 | | | | 6,306 | | | | 6,495 | | | A 1% increase in volume of services provided by fee-for- |
| | | | | | | | | | | | | | | | | | | service physicians affects costs by approximately $35 |
| | | | | | | | | | | | | | | | | | | million. |
| | | | | | | | | | | | | | | | | | | |
| Regional Services | | | 16,548 | | | | 17,540 | | | | 18,053 | | | | 18,627 | | | |
Budget and Fiscal Plan - 2022/23 to 2024/25
168
Appendix
Table A7 Material Assumptions – Expense (continued)
Ministry Programs and Assumptions
($ millions unless otherwise specified) | | Updated
Forecast
2021/22 | | | Budget
Estimate
2022/23 | | | Plan
2023/24 | | | Plan
2024/25 | | | 2022/23 Sensitivities |
| Public Safety and Solicitor General | | | 1,423 | | | | 1,394 | | | | 1,007 | | | | 1,008 | | | |
| Policing, Victim Services and Corrections | | | 742 | | | | 807 | | | | 820 | | | | 820 | | | Policing, Victim Services and Corrections costs are |
| | | | | | | | | | | | | | | | | | | sensitive to the volume and severity of criminal activity, |
| | | | | | | | | | | | | | | | | | | the number of inmate beds occupied and the number of |
| | | | | | | | | | | | | | | | | | | offenders under community supervision. |
| | | | | | | | | | | | | | | | | | | |
| Emergency Program Act (EPA) | | | 558 | | | | 436 | | | | 36 | | | | 36 | | | For authorized expenditures under the EPA, including |
| | | | | | | | | | | | | | | | | | | those for further disasters, and the difference between |
| | | | | | | | | | | | | | | | | | | initial estimates for disaster response and recovery |
| | | | | | | | | | | | | | | | | | | costs and final project costs. |
| | | | | | | | | | | | | | | | | | | |
| Social Development and Poverty Reduction | | | 4,360 | | | | 4,456 | | | | 4,490 | | | | 4,511 | | | |
| Temporary Assistance | | | 48,601 | | | | 47,300 | | | | 46,000 | | | | 45,600 | | | The expected-to-work caseload is sensitive to |
| annual average caseload (#) | | | | | | | | | | | | | | | | | | fluctuations in economic and employment trends. Costs |
| | | | | | | | | | | | | | | | | | | are driven by changes to cost per case and caseload. |
| | | | | | | | | | | | | | | | | | | Cost per case fluctuations result from changes in the |
| | | | | | | | | | | | | | | | | | | needed supports required by clients, as well as caseload |
| | | | | | | | | | | | | | | | | | | composition. |
| | | | | | | | | | | | | | | | | | | |
| Disability Assistance | | | 116,761 | | | | 121,900 | | | | 122,700 | | | | 123,200 | | | The caseload for persons with disabilities is sensitive to |
| annual average caseload (#) | | | | | | | | | | | | | | | | | | the aging of the population and longer life expectancy for |
| | | | | | | | | | | | | | | | | | | individuals with disabilities. Cost per case fluctuations |
| | | | | | | | | | | | | | | | | | | are driven primarily by earnings exemptions which is |
| | | | | | | | | | | | | | | | | | | dependent on the level of income earned by clients. |
| | | | | | | | | | | | | | | | | | | |
| Adult Community Living: | | | | | | | | | | | | | | | | | | |
| Developmental Disabilities Programs | | | | | | | | | | | | | | | | | | |
| Average caseload (#) | | | 22,450 | | | | 23,370 | | | | 24,330 | | | | 25,300 | | | The adult community living caseload is sensitive to an |
| Average cost per client ($) | | | 53,000 | | | | 52,400 | | | | 51,100 | | | | 49,300 | | | aging population and to the level of service required. |
| | | | | | | | | | | | | | | | | | | Cost per case fluctuations are driven by the proportion |
| | | | | | | | | | | | | | | | | | | of clients receiving certain types of services at differing |
| Personal Supports Initiative (PSI) | | | | | | | | | | | | | | | | | | |
| Average caseload (#) | | | 2,650 | | | | 2,960 | | | | 3,290 | | | | 3,620 | | | costs. For example, residential care services are |
| Average cost per client ($) | | | 15,700 | | | | 14,700 | | | | 133,300 | | | | 12,100 | | | significantly more costly than day programs. |
Budget and Fiscal Plan - 2022/23 to 2024/25
169
Appendix
Table A7 Material Assumptions – Expense (continued)
Ministry Programs and Assumptions
($ millions unless otherwise specified) | | Updated
Forecast
2021/22 | | | Budget
Estimate
2022/23 | | | Plan
2023/24 | | | Plan
2024/25 | | | 2022/23 Sensitivities |
| Tax Transfers | | | 1,846 | | | | 2,044 | | | | 2,142 | | | | 2,224 | | | |
| Individuals | | | 983.0 | | | | 987.0 | | | | 997.0 | | | | 997.0 | | | |
| Climate Action Tax Credit | | | 330.0 | | | | 363.0 | | | | 373.0 | | | | 373.0 | | | These tax transfers are now expensed as |
| BC Child Opportunity Benefit | | | 425.0 | | | | 425.0 | | | | 425.0 | | | | 425.0 | | | required under generally accepted accounting |
| Sales Tax | | | 8.7 | | | | 50.0 | | | | 50.0 | | | | 50.0 | | | principles. |
| Small Business Venture Capital | | | 33.4 | | | | 33.0 | | | | 33.0 | | | | 33.0 | | | |
| BC Senior’s Home Renovation | | | 2.2 | | | | 3.0 | | | | 3.0 | | | | 3.0 | | | Changes in 2021 tax transfers will result in |
| Other tax transfers to individuals | | | 183.7 | | | | 113.0 | | | | 113.0 | | | | 113.0 | | | one-time effect (prior-year adjustment) and |
| | | | | | | | | | | | | | | | | | | could result in an additional base change |
| Corporations | | | 863.0 | | | | 1,057.0 | | | | 1,145.0 | | | | 1,227.0 | | | in 2022/23. Production services tax credit is |
| Film and Television | | | 73.0 | | | | 120.0 | | | | 122.5 | | | | 130.0 | | | the most volatile of all tax transfers and is |
| Production Services | | | 581.6 | | | | 714.8 | | | | 779.0 | | | | 848.3 | | | influenced by several factors including delay |
| Scientific Research & Experimental | | | | | | | | | | | | | | | | | | in filing returns and assessment of claims, |
| Development | | | 81.3 | | | | 97.3 | | | | 102.3 | | | | 107.3 | | | length of projects and changes in the |
| Interactive Digital Media | | | 85.9 | | | | 80.0 | | | | 80.0 | | | | 80.0 | | | exchange rates. |
| Mining Exploration | | | 28.3 | | | | 25.0 | | | | 25.0 | | | | 25.0 | | | |
| Other tax transfers to corporations | | | 12.9 | | | | 19.9 | | | | 36.2 | | | | 36.4 | | | |
| | | | | | | | | | | | | | | | | | | |
| Prior-year adjustment (included above)* | | | | | | | | | | | | | | | | | | |
| | | | | | | | | | | | | | | | | | | |
| Individuals | | | 27.6 | | | | | | | | | | | | | | | |
| Corporations | | | (132.7 | ) | | | | | | | | | | | | | | |
| | | | | | | | | | | | | | | | | | | |
| 2020 Tax-year | | | | | | | 2020 Assumptions | | | | | | | |
| Tax Transfers | | | 1,554.0 | | | | | | | | | | | | | | | |
| Individuals | | | 663.0 | | | | | | | | | | | | | | | |
| Corporations | | | 891.0 | | | | | | | | | | | | | | | |
| Film and Television | | | 82.0 | | | | | | | | | | | | | | | |
| Production Services | | | 607.0 | | | | | | | | | | | | | | | |
| Scientific Research & Experimental | | | | | | | | | | | | | | | | | | |
| Development | | | 86.0 | | | | | | | | | | | | | | | |
| Interactive Digital Media | | | 78.0 | | | | | | | | | | | | | | | |
| Other tax transfers to corporations | | | 38.0 | | | | | | | | | | | | | | | |
*2021/22 tax transfer forecast incorporates adjustments relating to prior years.
| Management of Public Funds and Debt | | | 1,285 | | | | 1,378 | | | | 1,555 | | | | 1,751 | | | |
| Interest rates for new provincial borrowing: | | | 0.20 | % | | | 0.97 | % | | | 1.72 | % | | | 1.99 | % | | Full year impact on MoPD on interest costs of a 1% |
| Short-term | | | | | | | | | | | | | | | | | | change in interest rates equals $74.2 million; |
| Long-term | | | 2.75 | % | | | 3.03 | % | | | 3.23 | % | | | 3.44 | % | | $100 million increase in debt level equals $2.5 million. |
| CDN/US exchange rate (cents) | | | 125.3 | | | | 124.9 | | | | 126.5 | | | | 126.7 | | | |
| | | | | | | | | | | | | | | | | | | |
| Service delivery agency net spending | | | 8,250 | | | | 8,765 | | | | 9,372 | | | | 9,728 | | | |
| School districts | | | 574 | | | | 619 | | | | 566 | | | | 561 | | | |
| Post-secondary institutions | | | 4,419 | | | | 4,759 | | | | 4,995 | | | | 5,164 | | | |
| Health authorities and hospital societies | | | 1,011 | | | | 989 | | | | 986 | | | | 986 | | | Agency expenses, net of Provincial funding. These are |
| BC Transportation Financing Authority | | | 1,454 | | | | 1,598 | | | | 1,670 | | | | 1,898 | | | mainly funded through revenue from other sources. |
| BC Infrastructure Benefits Inc. | | | 68 | | | | 226 | | | | 298 | | | | 246 | | | |
| Other service delivery agencies | | | 724 | | | | 574 | | | | 857 | | | | 873 | | | |
Budget and Fiscal Plan - 2022/23 to 2024/25
170
Appendix
Table A8 Operating Statement – 2015/16 to 2024/25
| | | | | | | | | | | | | | | Updated | | Budget | | | | | | Average | |
| | | Actual | | Actual | | Actual | | Actual | | Actual | | Actual | | Forecast | | Estimate | | Plan | | Plan | | annual | |
| ($ millions) | | 2015/16 | | 2016/17 | | 2017/18 | | 2018/19 | | 2019/20 | | 2020/21 | | 2021/22 | | 2022/23 | | 2023/24 | | 2024/25 | | change | |
| | | | | | | | | | | | | | | | | | | | | | | | | | | | | | | | | (per cent) | |
| Revenue | | | 47,601 | | | 51,449 | | | 52,020 | | | 57,128 | | | 58,660 | | | 62,156 | | | 70,220 | | | 68,552 | | | 70,177 | | | 72,325 | | | 4.8 | |
| Expense | | | (46,832 | ) | | (48,684 | ) | | (51,707 | ) | | (55,597 | ) | | (58,982 | ) | | (67,624 | ) | | (69,703 | ) | | (73,013 | ) | | (73,359 | ) | | (74,506 | ) | | 5.3 | |
| Surplus (deficit) before forecast allowance | | | 769 | | | 2,765 | | | 313 | | | 1,531 | | | (322 | ) | | (5,468 | ) | | 517 | | | (4,461 | ) | | (3,182 | ) | | (2,181 | ) | | | |
| Forecast allowance | | | — | | | — | | | — | | | — | | | — | | | — | | | (1,000 | ) | | (1,000 | ) | | (1,000 | ) | | (1,000 | ) | | | |
| Surplus (deficit) | | | 769 | | | 2,765 | | | 313 | | | 1,531 | | | (322 | ) | | (5,468 | ) | | (483 | ) | | (5,461 | ) | | (4,182 | ) | | (3,181 | ) | | | |
| | | | | | | | | | | | | | | | | | | | | | | | | | | | | | | | | | | |
| Per cent of nominal GDP: 1 | | | | | | | | | | | | | | | | | | | | | | | | | | | | | | | | | | |
| Surplus (deficit) | | | 0.3 | | | 1.0 | | | 0.1 | | | 0.5 | | | -0.1 | | | -1.8 | | | -0.1 | | | -1.5 | | | -1.1 | | | -0.8 | | | | |
| Per cent of revenue: | | | | | | | | | | | | | | | | | | | | | | | | | | | | | | | | | | |
| Surplus (deficit) | | | 1.6 | | | 5.4 | | | 0.6 | | | 2.7 | | | -0.5 | | | -8.8 | | | -0.7 | | | -8.0 | | | -6.0 | | | -4.4 | | | | |
| Per capita ($): 2 | | | | | | | | | | | | | | | | | | | | | | | | | | | | | | | | | | |
| Surplus (deficit) | | | 161 | | | 569 | | | 63 | | | 306 | | | (63 | ) | | (1,060 | ) | | (93 | ) | | (1,027 | ) | | (774 | ) | | (580 | ) | | | |
| 1 | Surplus (deficit) as a per cent of nominal GDP is calculated using nominal GDP for the calendar year ending in the fiscal year (e.g. 2022/23 amounts divided by nominal GDP for the 2022 calendar year). |
| 2 | Per capita revenue and expense is calculated using July 1 population (e.g. 2022/23 amounts divided by population on July 1, 2022). |
Budget and Fiscal Plan - 2022/23 to 2024/25
171
Appendix
Table A9 Revenue by Source – 2015/16 to 2024/25
| | | | | | | | | | | | | | | Updated | | Budget | | | | | | Average | |
| | Actual | | Actual | | Actual | | Actual | | Actual | | Actual | | Forecast | | Estimate | | Plan | | Plan | | annual | |
| ($ millions) | | 2015/16 | | 2016/17 | | 2017/18 | | 2018/19 | | 2019/20 | | 2020/21 | | 2021/22 | | 2022/23 | | 2023/24 | | 2024/25 | | change | |
| | | | | | | | | | | | | | | | | | | | | | | | | | | | | | | | | (per cent) | |
| Taxation revenue: | | | | | | | | | | | | | | | | | | | | | | | | | | | | | | | | | |
| Personal income | | | 8,380 | | | 9,704 | | | 8,923 | | | 11,364 | | | 10,657 | | | 11,118 | | | 13,680 | | | 12,848 | | | 13,360 | | | 13,955 | | | 5.8 | |
| Corporate income | | | 2,787 | | | 3,003 | | | 4,165 | | | 5,180 | | | 5,011 | | | 4,805 | | | 5,064 | | | 5,501 | | | 5,827 | | | 6,455 | | | 9.8 | |
| Employer health | | | — | | | — | | | — | | | 464 | | | 1,897 | | | 2,156 | | | 2,130 | | | 2,257 | | | 2,349 | | | 2,441 | | | n/a | |
| Sales | | | 5,990 | | | 6,606 | | | 7,131 | | | 7,369 | | | 7,374 | | | 7,694 | | | 8,441 | | | 9,009 | | | 9,546 | | | 9,928 | | | 5.8 | |
| Fuel | | | 973 | | | 969 | | | 1,010 | | | 1,015 | | | 1,008 | | | 936 | | | 1,039 | | | 1,051 | | | 1,059 | | | 1,068 | | | 1.0 | |
| Carbon | | | 1,190 | | | 1,220 | | | 1,255 | | | 1,465 | | | 1,682 | | | 1,683 | | | 2,048 | | | 2,311 | | | 2,348 | | | 2,384 | | | 8.0 | |
| Tobacco | | | 734 | | | 737 | | | 727 | | | 781 | | | 729 | | | 711 | | | 740 | | | 760 | | | 760 | | | 760 | | | 0.4 | |
| Property | | | 2,219 | | | 2,279 | | | 2,367 | | | 2,617 | | | 2,608 | | | 2,313 | | | 3,020 | | | 3,173 | | | 3,354 | | | 3,514 | | | 5.2 | |
| Property transfer | | | 1,533 | | | 2,026 | | | 2,141 | | | 1,826 | | | 1,609 | | | 2,098 | | | 3,250 | | | 2,500 | | | 2,406 | | | 2,461 | | | 5.4 | |
| Insurance premium | | | 520 | | | 549 | | | 602 | | | 633 | | | 691 | | | 652 | | | 640 | | | 660 | | | 670 | | | 680 | | | 3.0 | |
| | | | 24,326 | | | 27,093 | | | 28,321 | | | 32,714 | | | 33,266 | | | 34,166 | | | 40,052 | | | 40,070 | | | 41,679 | | | 43,646 | | | 6.7 | |
| Natural resource revenue: | | | | | | | | | | | | | | | | | | | | | | | | | | | | | | | | | | |
| Natural gas royalties | | | 139 | | | 152 | | | 161 | | | 199 | | | 118 | | | 196 | | | 749 | | | 911 | | | 691 | | | 580 | | | 17.2 | |
| Bonus bids, rents on drilling rights and leases | | | 765 | | | 633 | | | 276 | | | 279 | | | 225 | | | 162 | | | 141 | | | 130 | | | 111 | | | 79 | | | -22.3 | |
| Columbia River Treaty | | | 116 | | | 111 | | | 111 | | | 202 | | | 119 | | | 117 | | | 237 | | | 257 | | | 260 | | | 230 | | | 7.9 | |
| Other energy and minerals | | | 226 | | | 403 | | | 619 | | | 557 | | | 386 | | | 191 | | | 644 | | | 454 | | | 328 | | | 290 | | | 2.8 | |
| Forests | | | 865 | | | 913 | | | 1,065 | | | 1,406 | | | 988 | | | 1,304 | | | 1,847 | | | 1,121 | | | 887 | | | 909 | | | 0.6 | |
| Other resources | | | 460 | | | 499 | | | 463 | | | 465 | | | 432 | | | 433 | | | 505 | | | 514 | | | 521 | | | 518 | | | 1.3 | |
| | | | 2,571 | | | 2,711 | | | 2,695 | | | 3,108 | | | 2,268 | | | 2,403 | | | 4,123 | | | 3,387 | | | 2,798 | | | 2,606 | | | 0.2 | |
| Other revenue: | | | | | | | | | | | | | | | | | | | | | | | | | | | | | | | | | | |
| Medical Services Plan premiums | | | 2,434 | | | 2,558 | | | 2,266 | | | 1,360 | | | 1,063 | | | (4 | ) | | — | | | — | | | — | | | — | | | n/a | |
| Post-secondary education fees | | | 1,666 | | | 1,828 | | | 2,034 | | | 2,275 | | | 2,451 | | | 2,418 | | | 2,539 | | | 2,679 | | | 2,779 | | | 2,859 | | | 6.2 | |
| Other health-care related fees | | | 374 | | | 404 | | | 429 | | | 441 | | | 475 | | | 372 | | | 421 | | | 437 | | | 441 | | | 441 | | | 1.8 | |
| Motor vehicle licences and permits | | | 521 | | | 529 | | | 557 | | | 568 | | | 579 | | | 571 | | | 608 | | | 614 | | | 625 | | | 635 | | | 2.2 | |
| Other fees and licences | | | 841 | | | 894 | | | 963 | | | 949 | | | 1,004 | | | 972 | | | 1,156 | | | 1,156 | | | 1,137 | | | 1,090 | | | 2.9 | |
| Investment earnings | | | 1,213 | | | 1,232 | | | 1,101 | | | 1,243 | | | 1,263 | | | 1,264 | | | 1,369 | | | 1,298 | | | 1,344 | | | 1,344 | | | 1.1 | |
| Sales of goods and services | | | 1,011 | | | 1,131 | | | 1,133 | | | 1,164 | | | 1,162 | | | 741 | | | 1,042 | | | 1,419 | | | 1,621 | | | 1,650 | | | 5.6 | |
| Miscellaneous | | | 2,287 | | | 2,377 | | | 2,410 | | | 2,249 | | | 2,676 | | | 2,395 | | | 2,415 | | | 2,388 | | | 2,263 | | | 2,295 | | | 0.0 | |
| | | | 10,347 | | | 10,953 | | | 10,893 | | | 10,249 | | | 10,673 | | | 8,729 | | | 9,550 | | | 9,991 | | | 10,210 | | | 10,314 | | | 0.0 | |
| Contributions from the federal government: | | | | | | | | | | | | | | | | | | | | | | | | | | | | | | | | | | |
| Canada Health Transfer | | | 4,454 | | | 4,744 | | | 4,994 | | | 5,182 | | | 5,523 | | | 5,701 | | | 6,424 | | | 6,183 | | | 6,681 | | | 7,021 | | | 5.2 | |
| Canada Social Transfer | | | 1,695 | | | 1,751 | | | 1,854 | | | 1,908 | | | 1,971 | | | 2,042 | | | 2,110 | | | 2,180 | | | 2,251 | | | 2,322 | | | 3.6 | |
| Other cost shared agreements | | | 1,498 | | | 1,672 | | | 2,207 | | | 1,962 | | | 2,041 | | | 5,151 | | | 2,948 | | | 2,977 | | | 2,810 | | | 2,589 | | | 6.3 | |
| | | | 7,647 | | | 8,167 | | | 9,055 | | | 9,052 | | | 9,535 | | | 12,894 | | | 11,482 | | | 11,340 | | | 11,742 | | | 11,932 | | | 5.1 | |
| Commercial Crown corporation net income: | | | | | | | | | | | | | | | | | | | | | | | | | | | | | | | | | | |
| BC Hydro 1 | | | 655 | | | 684 | | | 683 | | | (428 | ) | | 705 | | | 688 | | | 681 | | | 712 | | | 712 | | | 712 | | | 0.9 | |
| Liquor Distribution Branch | | | 1,031 | | | 1,083 | | | 1,119 | | | 1,104 | | | 1,107 | | | 1,161 | | | 1,153 | | | 1,166 | | | 1,198 | | | 1,225 | | | 1.9 | |
| BC Lottery Corporation 2 | | | 1,304 | | | 1,329 | | | 1,391 | | | 1,405 | | | 1,336 | | | 420 | | | 1,129 | | | 1,415 | | | 1,450 | | | 1,457 | | | 1.2 | |
| ICBC | | | (293 | ) | | (612 | ) | | (1,327 | ) | | (1,153 | ) | | (376 | ) | | 1,528 | | | 1,904 | | | 327 | | | 240 | | | 280 | | | -199.5 | |
| BC Railway Company | | | 6 | | | 7 | | | 53 | | | 10 | | | 13 | | | 10 | | | 9 | | | 8 | | | 8 | | | 8 | | | 3.2 | |
| Transportation Investment Corporation | | | (80 | ) | | (81 | ) | | (29 | ) | | — | | | — | | | — | | | — | | | — | | | — | | | — | | | n/a | |
| Other | | | 87 | | | 115 | | | 116 | | | 117 | | | 133 | | | 157 | | | 137 | | | 136 | | | 140 | | | 145 | | | 5.8 | |
| Accounting adjustment 1 | | | — | | | — | | | (950 | ) | | 950 | | | — | | | — | | | — | | | — | | | — | | | — | | | n/a | |
| | | | 2,710 | | | 2,525 | | | 1,056 | | | 2,005 | | | 2,918 | | | 3,964 | | | 5,013 | | | 3,764 | | | 3,748 | | | 3,827 | | | 3.9 | |
| Total revenue | | | 47,601 | | | 51,449 | | | 52,020 | | | 57,128 | | | 58,660 | | | 62,156 | | | 70,220 | | | 68,552 | | | 70,177 | | | 72,325 | | | 4.8 | |
| 1 | BC Hydro's loss for 2018/19 includes a write-off of a regulatory account. At the summary level, the Province recognized a $950 million adjustment in fiscal 2017/18 with respect to BC Hydro's deferred regulatory accounts. |
| 2 | Net of payments to the federal government and beginning in 2021/22 , is also net of payments under the gaming revenue sharing agreement with First Nations. |
Budget and Fiscal Plan - 2022/23 to 2024/25
172
Appendix
Table A10 Revenue by Source Supplementary Information – 2015/16 to 2024/251
| | | | | | | | | | | | | | | Updated | | Budget | | | | | | Average | |
| | | Actual | | Actual | | Actual | | Actual | | Actual | | Actual | | Forecast | | Estimate | | Plan | | Plan | | annual | |
| | | 2015/16 | | 2016/17 | | 2017/18 | | 2018/19 | | 2019/20 | | 2020/21 | | 2021/22 | | 2022/23 | | 2023/24 | | 2024/25 | | change | |
| | | | | | | | | | | | | | | | | | | | | | | | | | | | | | | | | (per cent) | |
| Per cent of nominal GDP: 2 | | | | | | | | | | | | | | | | | | | | | | | | | | | | | | | | | |
| Taxation and Medical Services Plan premiums | | | 10.7 | | | 11.2 | | | 10.8 | | | 11.5 | | | 11.0 | | | 11.0 | | | 11.5 | | | 10.9 | | | 10.9 | | | 11.0 | | | 0.3 | |
| Taxation | | | 9.7 | | | 10.3 | | | 10.0 | | | 11.0 | | | 10.7 | | | 11.0 | | | 11.5 | | | 10.9 | | | 10.9 | | | 11.0 | | | 1.4 | |
| Medical Services Plan premiums | | | 1.0 | | | 1.0 | | | 0.8 | | | 0.5 | | | 0.3 | | | (0 | ) | | — | | | — | | | — | | | — | | | n/a | |
| Natural resources | | | 1.0 | | | 1.0 | | | 1.0 | | | 1.0 | | | 0.7 | | | 0.8 | | | 1.2 | | | 0.9 | | | 0.7 | | | 0.7 | | | -4.9 | |
| Other | | | 4.1 | | | 4.2 | | | 3.9 | | | 3.4 | | | 3.4 | | | 2.8 | | | 2.7 | | | 2.7 | | | 2.7 | | | 2.6 | | | -5.0 | |
| Other excluding Medical Services Plan premiums | | | 3.2 | | | 3.2 | | | 3.1 | | | 3.0 | | | 3.1 | | | 2.8 | | | 2.7 | | | 2.7 | | | 2.7 | | | 2.6 | | | -2.2 | |
| Contributions from the federal government | | | 3.0 | | | 3.1 | | | 3.2 | | | 3.0 | | | 3.1 | | | 4.2 | | | 3.3 | | | 3.1 | | | 3.1 | | | 3.0 | | | -0.2 | |
| Commercial Crown corporation net income | | | 1.1 | | | 1.0 | | | 0.4 | | | 0.7 | | | 0.9 | | | 1.3 | | | 1.4 | | | 1.0 | | | 1.0 | | | 1.0 | | | -1.3 | |
| Total revenue | | | 19.0 | | | 19.5 | | | 18.4 | | | 19.2 | | | 18.9 | | | 20.1 | | | 20.2 | | | 18.6 | | | 18.3 | | | 18.2 | | | -0.5 | |
| Growth rates (per cent): | | | | | | | | | | | | | | | | | | | | | | | | | | | | | | | | | | |
| Taxation and Medical Services Plan premiums | | | 5.7 | | | 10.8 | | | 3.2 | | | 11.4 | | | 0.7 | | | -0.5 | | | 17.2 | | | 0.0 | | | 4.0 | | | 4.7 | | | n/a | |
| Taxation | | | 5.5 | | | 11.4 | | | 4.5 | | | 15.5 | | | 1.7 | | | 2.7 | | | 17.2 | | | 0.0 | | | 4.0 | | | 4.7 | | | n/a | |
| Medical Services Plan premiums | | | 8.0 | | | 5.1 | | | -11.4 | | | -40.0 | | | -21.8 | | | -100.4 | | | n/a | | | n/a | | | n/a | | | n/a | | | n/a | |
| Natural resources | | | -12.5 | | | 5.4 | | | -0.6 | | | 15.3 | | | -27.0 | | | 6.0 | | | 71.6 | | | -17.9 | | | -17.4 | | | -6.9 | | | n/a | |
| Other | | | 9.4 | | | 5.9 | | | -0.5 | | | -5.9 | | | 4.1 | | | -18.2 | | | 9.4 | | | 4.6 | | | 2.2 | | | 1.0 | | | n/a | |
| Other excluding Medical Services Plan premiums | | | 9.9 | | | 6.1 | | | 2.8 | | | 3.0 | | | 8.1 | | | -9.1 | | | 9.4 | | | 4.6 | | | 2.2 | | | 1.0 | | | n/a | |
| Contributions from the federal government | | | 5.1 | | | 6.8 | | | 10.9 | | | 0.0 | | | 5.3 | | | 35.2 | | | -11.0 | | | -1.2 | | | 3.5 | | | 1.6 | | | n/a | |
| Commercial Crown corporation net income | | | -19.6 | | | -6.8 | | | -58.2 | | | 89.9 | | | 45.5 | | | 35.8 | | | 26.5 | | | -24.9 | | | -0.4 | | | 2.1 | | | n/a | |
| Total revenue | | | 3.3 | | | 8.1 | | | 1.1 | | | 9.8 | | | 2.7 | | | 6.0 | | | 13.0 | | | -2.4 | | | 2.4 | | | 3.1 | | | n/a | |
| Per capita ($): 3 | | | | | | | | | | | | | | | | | | | | | | | | | | | | | | | | | | |
| Taxation and Medical Services Plan premiums | | | 5,603 | | | 6,102 | | | 6,205 | | | 6,801 | | | 6,738 | | | 6,622 | | | 7,680 | | | 7,538 | | | 7,714 | | | 7,957 | | | 4.0 | |
| Taxation | | | 5,093 | | | 5,576 | | | 5,745 | | | 6,529 | | | 6,529 | | | 6,623 | | | 7,680 | | | 7,538 | | | 7,714 | | | 7,957 | | | 5.1 | |
| Medical Services Plan premiums | | | 510 | | | 526 | | | 460 | | | 271 | | | 209 | | | (1 | ) | | — | | | — | | | — | | | — | | | n/a | |
| Natural resources | | | 538 | | | 558 | | | 547 | | | 620 | | | 445 | | | 466 | | | 791 | | | 637 | | | 518 | | | 475 | | | -1.4 | |
| Other | | | 2,166 | | | 2,254 | | | 2,210 | | | 2,046 | | | 2,095 | | | 1,692 | | | 1,831 | | | 1,880 | | | 1,890 | | | 1,880 | | | -1.6 | |
| Other excluding Medical Services Plan premiums | | | 1,657 | | | 1,728 | | | 1,750 | | | 1,774 | | | 1,886 | | | 1,693 | | | 1,831 | | | 1,880 | | | 1,890 | | | 1,880 | | | 1.4 | |
| Contributions from the federal government | | | 1,601 | | | 1,681 | | | 1,837 | | | 1,807 | | | 1,872 | | | 2,499 | | | 2,202 | | | 2,133 | | | 2,173 | | | 2,175 | | | 3.5 | |
| Commercial Crown corporation net income | | | 567 | | | 520 | | | 214 | | | 400 | | | 573 | | | 768 | | | 961 | | | 708 | | | 694 | | | 698 | | | 2.3 | |
| Total revenue | | | 9,966 | | | 10,588 | | | 10,553 | | | 11,402 | | | 11,514 | | | 12,049 | | | 13,466 | | | 12,896 | | | 12,988 | | | 13,186 | | | 3.2 | |
| | | | | | | | | | | | | | | | | | | | | | | | | | | | | | | | | | | |
| Real Per Capita Revenue (2021 $) 4 | | | 11,281 | | | 11,769 | | | 11,487 | | | 12,082 | | | 11,922 | | | 12,382 | | | 13,466 | | | 12,538 | | | 12,353 | | | 12,292 | | | 1.0 | |
| Growth rate (per cent) | | | 3.4 | | | 4.3 | | | -2.4 | | | 5.2 | | | -1.3 | | | 3.9 | | | 8.8 | | | -6.9 | | | -1.5 | | | -0.5 | | | 1.3 | |
| 1 | Numbers may not add due to rounding. |
| 2 | Revenue as a per cent of GDP is calculated using nominal GDP for the calendar year ending in the fiscal year (e.g. 2022/23 revenue divided by nominal GDP for the 2022 calendar year). |
| 3 | Per capita revenue is calculated using July 1 population (e.g. 2022/23 revenue divided by population on July 1, 2022). |
| 4 | Revenue is converted to real (inflation-adjusted) terms using the consumer price index (CPI) for the corresponding calendar year (e.g. 2022 CPI for 2022/23 revenue). |
Budget and Fiscal Plan - 2022/23 to 2024/25
173
Appendix
Table A11 Expense by Function – 2015/16 to 2024/25 1,2
| | | | | | | | | | | | | | | Updated | | Budget | | | | | | Average | |
| | Actual | | Actual | | Actual | | Actual | | Actual | | Actual | | Forecast | | Estimate | | Plan | | Plan | | annual | |
| ($ millions) | | 2015/16 | | 2016/17 | | 2017/18 | | 2018/19 | | 2019/20 | | 2020/21 | | 2021/22 | | 2022/23 | | 2023/24 | | 2024/25 | | change | |
| | | | | | | | | | | | | | | | | | | | | | | | | | | | | | | | | (per cent) | |
| Function: | | | | | | | | | | | | | | | | | | | | | | | | | | | | | | | | | |
| Health: | | | | | | | | | | | | | | | | | | | | | | | | | | | | | | | | | | |
| Medical Services Plan | | | 4,345 | | | 4,573 | | | 4,623 | | | 4,861 | | | 5,013 | | | 5,145 | | | 5,589 | | | 6,111 | | | 6,348 | | | 6,537 | | | 4.6 | |
| Pharmacare | | | 1,335 | | | 1,284 | | | 1,400 | | | 1,494 | | | 1,517 | | | 1,501 | | | 1,620 | | | 1,664 | | | 1,689 | | | 1,714 | | | 2.8 | |
| Regional services | | | 12,811 | | | 13,079 | | | 14,094 | | | 14,996 | | | 16,047 | | | 18,282 | | | 18,067 | | | 18,839 | | | 19,308 | | | 19,822 | | | 5.0 | |
| Other healthcare expenses | | | 712 | | | 753 | | | 810 | | | 800 | | | 872 | | | 677 | | | 992 | | | 1,071 | | | 1,116 | | | 1,174 | | | 5.7 | |
| Total health | | | 19,203 | | | 19,689 | | | 20,927 | | | 22,151 | | | 23,449 | | | 25,605 | | | 26,268 | | | 27,685 | | | 28,461 | | | 29,247 | | | 4.8 | |
| Education: | | | | | | | | | | | | | | | | | | | | | | | | | | | | | | | | | | |
| Elementary and secondary | | | 6,303 | | | 6,422 | | | 6,918 | | | 7,253 | | | 7,583 | | | 7,443 | | | 8,059 | | | 8,332 | | | 8,335 | | | 8,338 | | | 3.2 | |
| Post-secondary | | | 5,503 | | | 5,673 | | | 5,998 | | | 6,394 | | | 6,842 | | | 6,868 | | | 7,563 | | | 7,887 | | | 8,146 | | | 8,375 | | | 4.8 | |
| Other education expenses | | | 407 | | | 374 | | | 176 | | | 442 | | | 310 | | | 632 | | | 439 | | | 454 | | | 406 | | | 404 | | | -0.1 | |
| Total education | | | 12,213 | | | 12,469 | | | 13,092 | | | 14,089 | | | 14,735 | | | 14,943 | | | 16,061 | | | 16,673 | | | 16,887 | | | 17,117 | | | 3.8 | |
| Social services: | | | | | | | | | | | | | | | | | | | | | | | | | | | | | | | | | | |
| Social assistance | | | 1,641 | | | 1,692 | | | 1,988 | | | 2,202 | | | 2,342 | | | 3,141 | | | 2,887 | | | 2,964 | | | 2,976 | | | 2,986 | | | 6.9 | |
| Child welfare | | | 1,301 | | | 1,358 | | | 1,507 | | | 1,652 | | | 1,940 | | | 2,226 | | | 2,583 | | | 3,082 | | | 3,096 | | | 3,141 | | | 10.3 | |
| Low income tax credit transfers | | | 247 | | | 244 | | | 239 | | | 414 | | | 435 | | | 1,131 | | | 370 | | | 413 | | | 423 | | | 423 | | | 6.2 | |
| Community living and other services | | | 917 | | | 949 | | | 1,003 | | | 1,075 | | | 1,170 | | | 1,291 | | | 1,402 | | | 1,457 | | | 1,477 | | | 1,482 | | | 5.5 | |
| Total social services | | | 4,106 | | | 4,243 | | | 4,737 | | | 5,343 | | | 5,887 | | | 7,789 | | | 7,242 | | | 7,916 | | | 7,972 | | | 8,032 | | | 7.7 | |
| Protection of persons and property | | | 1,572 | | | 1,655 | | | 1,930 | | | 2,004 | | | 2,126 | | | 2,258 | | | 2,454 | | | 2,479 | | | 2,094 | | | 2,097 | | | 3.3 | |
| Transportation | | | 1,670 | | | 1,784 | | | 1,931 | | | 2,021 | | | 2,126 | | | 3,360 | | | 2,373 | | | 2,454 | | | 2,379 | | | 2,446 | | | 4.3 | |
| Natural resources & economic development | | | 2,477 | | | 2,465 | | | 3,374 | | | 3,825 | | | 3,778 | | | 4,191 | | | 4,008 | | | 3,748 | | | 3,954 | | | 4,054 | | | 5.6 | |
| Other | | | 1,264 | | | 2,260 | | | 1,553 | | | 1,810 | | | 2,501 | | | 2,841 | | | 2,446 | | | 2,636 | | | 2,299 | | | 2,316 | | | 7.0 | |
| Contingencies - general programs and CleanBC | | | — | | | — | | | — | | | — | | | — | | | — | | | 1,000 | | | 2,848 | | | 3,412 | | | 3,987 | | | n/a | |
| Pandemic Recovery Contingencies | | | — | | | — | | | — | | | — | | | — | | | — | | | 3,250 | | | 2,000 | | | 1,000 | | | — | | | n/a | |
| General government | | | 1,501 | | | 1,532 | | | 1,540 | | | 1,670 | | | 1,653 | | | 3,915 | | | 1,905 | | | 1,648 | | | 1,646 | | | 1,644 | | | 1.0 | |
| Debt servicing | | | 2,826 | | | 2,587 | | | 2,623 | | | 2,684 | | | 2,727 | | | 2,722 | | | 2,696 | | | 2,926 | | | 3,255 | | | 3,566 | | | 2.6 | |
| Total expense | | | 46,832 | | | 48,684 | | | 51,707 | | | 55,597 | | | 58,982 | | | 67,624 | | | 69,703 | | | 73,013 | | | 73,359 | | | 74,506 | | | | |
| Per cent of operating expense: | | | | | | | | | | | | | | | | | | | | | | | | | | | | | | | | | | |
| Health | | | 41.0 | | | 40.4 | | | 40.5 | | | 39.8 | | | 39.8 | | | 37.9 | | | 37.7 | | | 37.9 | | | 38.8 | | | 39.3 | | | -0.5 | |
| Education | | | 26.1 | | | 25.6 | | | 25.3 | | | 25.3 | | | 25.0 | | | 22.1 | | | 23.0 | | | 22.8 | | | 23.0 | | | 23.0 | | | -1.4 | |
| Social services | | | 8.8 | | | 8.7 | | | 9.2 | | | 9.6 | | | 10.0 | | | 11.5 | | | 10.4 | | | 10.8 | | | 10.9 | | | 10.8 | | | 2.3 | |
| Protection of persons and property | | | 3.4 | | | 3.4 | | | 3.7 | | | 3.6 | | | 3.6 | | | 3.3 | | | 3.5 | | | 3.4 | | | 2.9 | | | 2.8 | | | -1.9 | |
| Transportation | | | 3.6 | | | 3.7 | | | 3.7 | | | 3.6 | | | 3.6 | | | 5.0 | | | 3.4 | | | 3.4 | | | 3.2 | | | 3.3 | | | -0.9 | |
| Natural resources & economic development | | | 5.3 | | | 5.1 | | | 6.5 | | | 6.9 | | | 6.4 | | | 6.2 | | | 5.8 | | | 5.1 | | | 5.4 | | | 5.4 | | | 0.3 | |
| Other | | | 2.7 | | | 4.6 | | | 3.0 | | | 3.3 | | | 4.2 | | | 4.2 | | | 3.5 | | | 3.6 | | | 3.1 | | | 3.1 | | | 1.6 | |
| Contingencies - general programs and CleanBC | | | — | | | — | | | — | | | — | | | — | | | — | | | 1.4 | | | 3.9 | | | 4.7 | | | 5.4 | | | n/a | |
| Pandemic and Recovery Contingencies | | | — | | | — | | | — | | | — | | | — | | | — | | | 4.7 | | | 2.7 | | | 1.4 | | | — | | | n/a | |
| General government | | | 3.2 | | | 3.1 | | | 3.0 | | | 3.0 | | | 2.8 | | | 5.8 | | | 2.7 | | | 2.3 | | | 2.2 | | | 2.2 | | | -4.1 | |
| Debt servicing | | | 6.0 | | | 5.3 | | | 5.1 | | | 4.8 | | | 4.6 | | | 4.0 | | | 3.9 | | | 4.0 | | | 4.4 | | | 4.8 | | | -2.5 | |
| Operating expense | | | 100.0 | | | 100.0 | | | 100.0 | | | 100.0 | | | 100.0 | | | 100.0 | | | 100.0 | | | 100.0 | | | 100.0 | | | 100.0 | | | | |
| 1 | Figures reflect government accounting policies used in the 2020/21 Public Accounts audited financial statements. |
| 2 | Numbers may not add due to rounding. |
Budget and Fiscal Plan - 2022/23 to 2024/25
174
Appendix
Table A12 Expense by Function Supplementary Information – 2015/16 to 2024/25 1
| | | | | | | | | | | | | | | Updated | | Budget | | | | | | Average | |
| | | Actual | | Actual | | Actual | | Actual | | Actual | | Actual | | Forecast | | Estimate | | Plan | | Plan | | annual | |
| | | 2015/16 | | 2016/17 | | 2017/18 | | 2018/19 | | 2019/20 | | 2020/21 | | 2021/22 | | 2022/23 | | 2023/24 | | 2024/25 | | change | |
| | | | | | | | | | | | | | | | | | | | | | | | | | | | | | | | | (per cent) | |
| Per cent of nominal GDP: 2 | | | | | | | | | | | | | | | | | | | | | | | | | | | | | | | | | |
| Health | | | 7.7 | | | 7.5 | | | 7.4 | | | 7.4 | | | 7.5 | | | 8.3 | | | 7.6 | | | 7.5 | | | 7.4 | | | 7.3 | | | -0.5 | |
| Education | | | 4.9 | | | 4.7 | | | 4.6 | | | 4.7 | | | 4.7 | | | 4.8 | | | 4.6 | | | 4.5 | | | 4.4 | | | 4.3 | | | -1.4 | |
| Social services | | | 1.6 | | | 1.6 | | | 1.7 | | | 1.8 | | | 1.9 | | | 2.5 | | | 2.1 | | | 2.2 | | | 2.1 | | | 2.0 | | | 2.4 | |
| Protection of persons and property | | | 0.6 | | | 0.6 | | | 0.7 | | | 0.7 | | | 0.7 | | | 0.7 | | | 0.7 | | | 0.7 | | | 0.5 | | | 0.5 | | | -1.9 | |
| Transportation | | | 0.7 | | | 0.7 | | | 0.7 | | | 0.7 | | | 0.7 | | | 1.1 | | | 0.7 | | | 0.7 | | | 0.6 | | | 0.6 | | | -0.9 | |
| Natural resources & economic development | | | 1.0 | | | 0.9 | | | 1.2 | | | 1.3 | | | 1.2 | | | 1.4 | | | 1.2 | | | 1.0 | | | 1.0 | | | 1.0 | | | 0.3 | |
| Other | | | 0.5 | | | 0.9 | | | 0.6 | | | 0.6 | | | 0.8 | | | 0.9 | | | 0.7 | | | 0.7 | | | 0.6 | | | 0.6 | | | 1.6 | |
| Contingencies - general programs and CleanBC | | | — | | | — | | | — | | | — | | | — | | | — | | | 0.3 | | | 0.8 | | | 0.9 | | | 1.0 | | | n/a | |
| Pandemic and Recovery Contingencies | | | — | | | — | | | — | | | — | | | — | | | — | | | 0.9 | | | 0.5 | | | 0.3 | | | — | | | n/a | |
| General government | | | 0.6 | | | 0.6 | | | 0.5 | | | 0.6 | | | 0.5 | | | 1.3 | | | 0.5 | | | 0.4 | | | 0.4 | | | 0.4 | | | -4.0 | |
| Debt servicing | | | 1.1 | | | 1.0 | | | 0.9 | | | 0.9 | | | 0.9 | | | 0.9 | | | 0.8 | | | 0.8 | | | 0.9 | | | 0.9 | | | -2.5 | |
| Operating expense | | | 18.7 | | | 18.4 | | | 18.3 | | | 18.7 | | | 19.0 | | | 21.9 | | | 20.1 | | | 19.8 | | | 19.2 | | | 18.7 | | | 0.0 | |
| Growth rates (per cent): | | | | | | | | | | | | | | | | | | | | | | | | | | | | | | | | | | |
| Health | | | 4.5 | | | 2.5 | | | 6.3 | | | 5.8 | | | 5.9 | | | 9.2 | | | 2.6 | | | 5.4 | | | 2.8 | | | 2.8 | | | n/a | |
| Education | | | 3.3 | | | 2.1 | | | 5.0 | | | 7.6 | | | 4.6 | | | 1.4 | | | 7.5 | | | 3.8 | | | 1.3 | | | 1.4 | | | n/a | |
| Social services | | | 6.7 | | | 3.3 | | | 11.6 | | | 12.8 | | | 10.2 | | | 32.3 | | | -7.0 | | | 9.3 | | | 0.7 | | | 0.8 | | | n/a | |
| Protection of persons and property | | | 8.3 | | | 5.3 | | | 16.6 | | | 3.8 | | | 6.1 | | | 6.2 | | | 8.7 | | | 1.0 | | | -15.5 | | | 0.1 | | | n/a | |
| Transportation | | | 3.9 | | | 6.8 | | | 8.2 | | | 4.7 | | | 5.2 | | | 58.0 | | | -29.4 | | | 3.4 | | | -3.1 | | | 2.8 | | | n/a | |
| Natural resources & economic development | | | 13.1 | | | -0.5 | | | 36.9 | | | 13.4 | | | -1.2 | | | 10.9 | | | -4.4 | | | -6.5 | | | 5.5 | | | 2.5 | | | n/a | |
| Other | | | -1.9 | | | 78.8 | | | -31.3 | | | 16.5 | | | 38.2 | | | 13.6 | | | -13.9 | | | 7.8 | | | -12.8 | | | 0.7 | | | n/a | |
| General government | | | 10.4 | | | 2.1 | | | 0.5 | | | 8.4 | | | -1.0 | | | 136.8 | | | -51.3 | | | -13.5 | | | -0.1 | | | -0.1 | | | n/a | |
| Debt servicing | | | 13.1 | | | -8.5 | | | 1.4 | | | 2.3 | | | 1.6 | | | -0.2 | | | -1.0 | | | 8.5 | | | 11.2 | | | 9.6 | | | n/a | |
| Operating expense | | | 5.4 | | | 4.0 | | | 6.2 | | | 7.5 | | | 6.1 | | | 14.7 | | | 3.1 | | | 4.7 | | | 0.5 | | | 1.6 | | | n/a | |
| Per capita ($): 3 | | | | | | | | | | | | | | | | | | | | | | | | | | | | | | | | | | |
| Health | | | 4,020 | | | 4,052 | | | 4,245 | | | 4,421 | | | 4,603 | | | 4,963 | | | 5,037 | | | 5,208 | | | 5,268 | | | 5,332 | | | 3.2 | |
| Education | | | 2,557 | | | 2,566 | | | 2,656 | | | 2,812 | | | 2,892 | | | 2,897 | | | 3,080 | | | 3,137 | | | 3,125 | | | 3,121 | | | 2.2 | |
| Social services | | | 860 | | | 873 | | | 961 | | | 1,066 | | | 1,155 | | | 1,510 | | | 1,389 | | | 1,489 | | | 1,475 | | | 1,464 | | | 6.1 | |
| Protection of persons and property | | | 329 | | | 341 | | | 392 | | | 400 | | | 417 | | | 438 | | | 471 | | | 466 | | | 388 | | | 382 | | | 1.7 | |
| Transportation | | | 350 | | | 367 | | | 392 | | | 403 | | | 417 | | | 651 | | | 455 | | | 462 | | | 440 | | | 446 | | | 2.7 | |
| Natural resources & economic development | | | 519 | | | 507 | | | 684 | | | 763 | | | 742 | | | 812 | | | 769 | | | 705 | | | 732 | | | 739 | | | 4.0 | |
| Other | | | 265 | | | 465 | | | 315 | | | 361 | | | 491 | | | 551 | | | 469 | | | 496 | | | 425 | | | 422 | | | 5.3 | |
| Contingencies - general programs and CleanBC | | | — | | | — | | | — | | | — | | | — | | | — | | | 192 | | | 536 | | | 631 | | | 727 | | | n/a | |
| Pandemic and Recovery Contingencies | | | — | | | — | | | — | | | — | | | — | | | — | | | 623 | | | 376 | | | 185 | | | — | | | n/a | |
| General government | | | 314 | | | 315 | | | 312 | | | 333 | | | 324 | | | 759 | | | 365 | | | 310 | | | 305 | | | 300 | | | -0.5 | |
| Debt servicing | | | 592 | | | 532 | | | 532 | | | 536 | | | 535 | | | 528 | | | 517 | | | 550 | | | 602 | | | 650 | | | 1.0 | |
| Operating expense | | | 9,806 | | | 10,018 | | | 10,489 | | | 11,095 | | | 11,576 | | | 13,109 | | | 13,367 | | | 13,735 | | | 13,576 | | | 13,583 | | | 3.7 | |
| Real Per Capita Operating Expense (2021 $) 4 | | | 11,098 | | | 11,137 | | | 11,417 | | | 11,758 | | | 11,987 | | | 13,472 | | | 13,366 | | | 13,354 | | | 12,913 | | | 12,663 | | | 1.5 | |
| Growth rate (per cent) | | | 2.7 | | | 0.3 | | | 2.5 | | | 3.0 | | | 2.0 | | | 12.4 | | | 13.7 | | | -0.1 | | | -3.3 | | | -1.9 | | | 3.1 | |
| 1 | Numbers may not add due to rounding. |
| 2 | Expense as a per cent of GDP is calculated using nominal GDP for the calendar year ending in the fiscal year (e.g. 2022/23 expense divided by nominal GDP for the 2022 calendar year). |
| 3 | Per capita expense is calculated using July 1 population (e.g. 2022/23 expense divided by population on July 1, 2022). |
| 4 | Expense is converted to real (inflation-adjusted) terms using the consumer price index (CPI) for the corresponding calendar year (e.g. 2022 CPI for 2022/23 expense). |
Budget and Fiscal Plan - 2022/23 to 2024/25
175
Appendix
Table A13 Full-Time Equivalents (FTEs) – 2015/16 to 2024/2025 1
| | | | | | | | | | | | | | | Updated | | Budget | | | | | | Average | |
| | | Actual | | Actual | | Actual | | Actual | | Actual | | Actual | | Forecast | | Estimate | | Plan | | Plan | | annual | |
| | | 2015/16 | | 2016/17 | | 2017/18 | | 2018/19 | | 2019/20 | | 2020/21 | | 2021/22 | | 2022/23 | | 2023/24 | | 2024/25 | | change | |
| | | | | | | | | | | | | | | | | | | | | | | | | | | | | | | | | (per cent) | |
| Taxpayer-supported programs and agencies: | | | | | | | | | | | | | | | | | | | | | | | | | | | | | | | | | |
| Ministries and special offices (CRF) | | | 27,192 | | | 27,940 | | | 29,291 | | | 30,891 | | | 31,774 | | | 32,444 | | | 33,400 | | | 34,400 | | | 34,400 | | | 34,400 | | | 2.6 | |
| Service delivery agencies 2 | | | 4,803 | | | 4,850 | | | 5,076 | | | 5,258 | | | 5,985 | | | 6,042 | | | 6,698 | | | 8,108 | | | 8,670 | | | 8,194 | | | 6.1 | |
| Total FTEs | | | 31,995 | | | 32,790 | | | 34,367 | | | 36,149 | | | 37,759 | | | 38,486 | | | 40,098 | | | 42,508 | | | 43,070 | | | 42,594 | | | 3.2 | |
| Growth rates (per cent): | | | | | | | | | | | | | | | | | | | | | | | | | | | | | | | | | | |
| Ministries and special offices (CRF) | | | 1.9 | | | 2.8 | | | 4.8 | | | 5.5 | | | 2.9 | | | 2.1 | | | 2.9 | | | 3.0 | | | 0.0 | | | 0.0 | | | 2.6 | |
| Service delivery agencies | | | 0.1 | | | 1.0 | | | 4.7 | | | 3.6 | | | 13.8 | | | 1.0 | | | 10.9 | | | 21.1 | | | 6.9 | | | -5.5 | | | 5.7 | |
| Population per FTE: 3 | | | | | | | | | | | | | | | | | | | | | | | | | | | | | | | | | | |
| Total FTEs | | | 149.3 | | | 148.2 | | | 143.4 | | | 138.6 | | | 134.9 | | | 134.0 | | | 130.1 | | | 125.0 | | | 125.4 | | | 128.8 | | | -1.6 | |
| 1 | Full-time equivalents (FTEs) are a measure of staff employment. FTEs are calculated by dividing the total hours of employment paid for in a given period by the number of hours an individual, full-time person would normally work in that period. This does not equate to the physical number of employees. For example, two half-time employees would equal one FTE, or alternatively, three FTEs may represent two full-time employees who have worked sufficient overtime hours to equal an additional FTE. |
| 2 | Service delivery agency FTE amounts do not include SUCH sector staff employment. |
| 3 | Population per FTE is calculated using July 1 population (e.g. population on July 1, 2022 divided by 2022/23 FTEs). |
Budget and Fiscal Plan - 2022/23 to 2024/25
176
Appendix
Table A14 Capital Spending – 2015/16 to 2024/25
| | | | | | | | | | | | | | | | | | | | | Updated | | | Budget | | | | | | | | | Average | |
| | | Actual | | | Actual | | | Actual | | | Actual | | | Actual | | | Actual | | | Forecast | | | Estimate | | | Plan | | | Plan | | | annual | |
| ($ millions) | | 2015/16 | | | 2016/17 | | | 2017/18 | | | 2018/19 | | | 2019/20 | | | 2020/21 | | | 2021/22 | | | 2022/23 | | | 2023/24 | | | 2024/25 | | | change | |
| | | | | | | | | | | | | | | | | | | | | | | | | | | | | | | | | (per cent) | |
| Taxpayer-supported: | | | | | | | | | | | | | | | | | | | | | | | | | | | | | | | | | | | | | | | | | | | | |
| Education | | | | | | | | | | | | | | | | | | | | | | | | | | | | | | | | | | | | | | | | | | | | |
| Schools districts | | | 430 | | | | 474 | | | | 578 | | | | 626 | | | | 877 | | | | 944 | | | | 1,036 | | | | 1,082 | | | | 1,063 | | | | 955 | | | | 9.3 | |
| Post-secondary institutions | | | 746 | | | | 792 | | | | 968 | | | | 1,024 | | | | 936 | | | | 904 | | | | 1,054 | | | | 1,237 | | | | 1,539 | | | | 1,482 | | | | 7.9 | |
| Health | | | 923 | | | | 1,004 | | | | 890 | | | | 904 | | | | 1,009 | | | | 1,162 | | | | 2,051 | | | | 2,584 | | | | 2,818 | | | | 3,164 | | | | 14.7 | |
| BC Transportation Financing Authority 1 | | | 867 | | | | 823 | | | | 717 | | | | 853 | | | | 955 | | | | 1,285 | | | | 1,716 | | | | 2,644 | | | | 2,528 | | | | 2,038 | | | | 10.0 | |
| BC Transit | | | 51 | | | | 41 | | | | 115 | | | | 85 | | | | 73 | | | | 107 | | | | 82 | | | | 178 | | | | 291 | | | | 293 | | | | 21.4 | |
| Government direct (ministries) | | | 290 | | | | 301 | | | | 430 | | | | 421 | | | | 520 | | | | 389 | | | | 457 | | | | 755 | | | | 492 | | | | 441 | | | | 4.8 | |
| Social Housing | | | 127 | | | | 184 | | | | 169 | | | | 483 | | | | 355 | | | | 572 | | | | 672 | | | | 572 | | | | 426 | | | | 254 | | | | 8.0 | |
| Other | | | 25 | | | | 40 | | | | 41 | | | | 56 | | | | 47 | | | | 65 | | | | 89 | | | | 227 | | | | 176 | | | | 188 | | | | 25.1 | |
| Total taxpayer-supported | | | 3,459 | | | | 3,659 | | | | 3,908 | | | | 4,452 | | | | 4,772 | | | | 5,428 | | | | 7,157 | | | | 9,279 | | | | 9,333 | | | | 8,815 | | | | 11.0 | |
| Self-supported: | | | | | | | | | | | | | | | | | | | | | | | | | | | | | | | | | | | | | | | | | | | | |
| BC Hydro | | | 2,306 | | | | 2,444 | | | | 2,473 | | | | 3,826 | | | | 3,082 | | | | 3,207 | | | | 3,632 | | | | 4,131 | | | | 4,244 | | | | 2,967 | | | | 2.8 | |
| Columbia Basin power projects | | | 15 | | | | 2 | | | | 1 | | | | 2 | | | | 994 | | | | 7 | | | | 9 | | | | 11 | | | | 11 | | | | 17 | | | | 1.4 | |
| Transportation Investment Corporation 1 | | | 25 | | | | 38 | | | | 4 | | | | — | | | | — | | | | — | | | | — | | | | — | | | | — | | | | — | | | | n/a | |
| BC Railway Company | | | 23 | | | | 4 | | | | 11 | | | | 33 | | | | 6 | | | | 1 | | | | 4 | | | | 12 | | | | 3 | | | | 4 | | | | -17.7 | |
| ICBC | | | 90 | | | | 62 | | | | 54 | | | | 66 | | | | 62 | | | | 100 | | | | 68 | | | | 60 | | | | 45 | | | | 41 | | | | -8.4 | |
| BC Lottery Corporation | | | 68 | | | | 86 | | | | 82 | | | | 75 | | | | 102 | | | | 73 | | | | 83 | | | | 120 | | | | 103 | | | | 90 | | | | 3.2 | |
| Liquor Distribution Branch | | | 23 | | | | 27 | | | | 48 | | | | 60 | | | | 36 | | | | 22 | | | | 32 | | | | 40 | | | | 31 | | | | 25 | | | | 0.9 | |
| Other 2 | | | 23 | | | | 62 | | | | 56 | | | | 44 | | | | 104 | | | | 65 | | | | — | | | | — | | | | — | | | | — | | | | n/a | |
| Total self-supported | | | 2,573 | | | | 2,725 | | | | 2,729 | | | | 4,106 | | | | 4,386 | | | | 3,475 | | | | 3,828 | | | | 4,374 | | | | 4,437 | | | | 3,144 | | | | 2.3 | |
| Total capital spending | | | 6,032 | | | | 6,384 | | | | 6,637 | | | | 8,558 | | | | 9,158 | | | | 8,903 | | | | 10,985 | | | | 13,653 | | | | 13,770 | | | | 11,959 | | | | 7.9 | |
| Per cent of nominal GDP: 3 | | | | | | | | | | | | | | | | | | | | | | | | | | | | | | | | | | | | | | | | | | | | |
| Taxpayer-supported | | | 1.4 | | | | 1.4 | | | | 1.4 | | | | 1.5 | | | | 1.5 | | | | 1.8 | | | | 2.1 | | | | 2.5 | | | | 2.4 | | | | 2.2 | | | | 5.4 | |
| Self-supported | | | 1.0 | | | | 1.0 | | | | 1.0 | | | | 1.4 | | | | 1.4 | | | | 1.1 | | | | 1.1 | | | | 1.2 | | | | 1.2 | | | | 0.8 | | | | -2.9 | |
| Total | | | 2.4 | | | | 2.4 | | | | 2.4 | | | | 2.9 | | | | 2.9 | | | | 2.9 | | | | 3.2 | | | | 3.7 | | | | 3.6 | | | | 3.0 | | | | 2.5 | |
| Growth rates: | | | | | | | | | | | | | | | | | | | | | | | | | | | | | | | | | | | | | | | | | | | | |
| Taxpayer-supported | | | 1.5 | | | | 5.8 | | | | 6.8 | | | | 13.9 | | | | 7.2 | | | | 13.7 | | | | 31.9 | | | | 29.6 | | | | 0.6 | | | | -5.6 | | | | 10.6 | |
| Self-supported | | | 3.4 | | | | 5.9 | | | | 0.1 | | | | 50.5 | | | | 6.8 | | | | -20.8 | | | | 10.2 | | | | 14.3 | | | | 1.4 | | | | -29.1 | | | | 4.3 | |
| Total | | | 2.3 | | | | 5.8 | | | | 4.0 | | | | 28.9 | | | | 7.0 | | | | -2.8 | | | | 23.4 | | | | 24.3 | | | | 0.9 | | | | -13.2 | | | | 8.1 | |
| Per capita: 4 | | | | | | | | | | | | | | | | | | | | | | | | | | | | | | | | | | | | | | | | | | | | |
| Taxpayer-supported | | | 724 | | | | 753 | | | | 793 | | | | 889 | | | | 937 | | | | 1,052 | | | | 1,372 | | | | 1,746 | | | | 1,727 | | | | 1,607 | | | | 9.3 | |
| Self-supported | | | 539 | | | | 561 | | | | 554 | | | | 819 | | | | 861 | | | | 674 | | | | 734 | | | | 823 | | | | 821 | | | | 573 | | | | 0.7 | |
| Total | | | 1,263 | | | | 1,314 | | | | 1,346 | | | | 1,708 | | | | 1,798 | | | | 1,726 | | | | 2,107 | | | | 2,568 | | | | 2,549 | | | | 2,180 | | | | 6.3 | |
| Real Per Capita Capital Spending (2021 $) 5 | | | 1,429 | | | | 1,460 | | | | 1,466 | | | | 1,810 | | | | 1,861 | | | | 1,773 | | | | 2,107 | | | | 2,497 | | | | 2,424 | | | | 2,032 | | | | 4.0 | |
| Growth rate (per cent) | | | -0.3 | | | | 2.2 | | | | 0.4 | | | | 23.5 | | | | 2.8 | | | | -4.7 | | | | 13.2 | | | | 18.5 | | | | -2.9 | | | | -16.1 | | | | 3.7 | |
| 1 | Includes Transportation Investment Plan capital spending and, beginning in 2017/18, Transportation Investment Corporation rehabilitation costs for the Port Mann Bridge due to reclassification from self-supported commercial Crown corporation to a taxpayer-supported agency in response to the cancellation of tolls. Effective April 1, 2018, Transportation Investment Corporation became a subsidiary of BCTFA. |
| 2 | Includes post-secondary institutions' self-supported subsidiaries. |
| 3 | Capital spending as a per cent of GDP is calculated using nominal GDP for the calendar year ending in the fiscal year (e.g. 2022/23 amounts divided by nominal GDP for the 2022 calendar year). |
| 4 | Per capita capital spending is calculated using July 1 population (e.g. 2022/23 amounts divided by population on July 1, 2022). |
| 5 | Capital spending is converted to real (inflation-adjusted) terms using the consumer price index (CPI) for the corresponding calendar year (e.g. 2022 CPI for 2022/23 capital spending). |
Budget and Fiscal Plan - 2022/23 to 2024/25
177
Appendix
Table A15 Statement of Financial Position – 2015/16 to 2024/25
| | | | | | | | | | | | | | | | | | | | | Updated | | | Budget | | | | | | | | | Average | |
| | | Actual | | | Actual | | | Actual | | | Actual | | | Actual | | | Actual | | | Forecast | | | Estimate | | | Plan | | | Plan | | | annual | |
| ($ millions) | | 2015/16 | | | 2016/17 | | | 2017/18 | | | 2018/19 | | | 2019/20 | | | 2020/21 | | | 2021/22 | | | 2022/23 | | | 2023/24 | | | 2024/25 | | | change | |
| | | | | | | | | | | | | | | | | | | | | | | | | | | | | | | | | (per cent) | |
| Financial assets: | | | | | | | | | | | | | | | | | | | | | | | | | | | | | | | | | | | | | | | | | | | | |
| Cash and temporary investments | | | 3,892 | | | | 4,232 | | | | 3,440 | | | | 3,029 | | | | 3,985 | | | | 6,560 | | | | 3,289 | | | | 2,690 | | | | 2,769 | | | | 2,895 | | | | -3.2 | |
| Other financial assets | | | 9,691 | | | | 10,198 | | | | 11,729 | | | | 12,625 | | | | 12,394 | | | | 15,399 | | | | 15,748 | | | | 17,540 | | | | 18,550 | | | | 18,410 | | | | 7.4 | |
| Sinking funds | | | 1,580 | | | | 1,087 | | | | 1,348 | | | | 752 | | | | 692 | | | | 492 | | | | 513 | | | | 529 | | | | 518 | | | | 563 | | | | -10.8 | |
| Investments in commercial Crown corporations: | | | | | | | | | | | | | | | | | | | | | | | | | | | | | | | | | | | | | | | | | | | | |
| Retained earnings | | | 7,529 | | | | 7,509 | | | | 6,126 | | | | 5,732 | | | | 6,515 | | | | 9,623 | | | | 12,529 | | | | 13,603 | | | | 14,740 | | | | 15,985 | | | | 8.7 | |
| Recoverable capital loans | | | 22,041 | | | | 23,809 | | | | 20,534 | | | | 22,547 | | | | 24,768 | | | | 26,301 | | | | 27,540 | | | | 29,692 | | | | 31,737 | | | | 32,672 | | | | 4.5 | |
| Total investments in commercial Crown corporations | | | 29,570 | | | | 31,318 | | | | 26,660 | | | | 28,279 | | | | 31,283 | | | | 35,924 | | | | 40,069 | | | | 43,295 | | | | 46,477 | | | | 48,657 | | | | 5.7 | |
| Total financial assets | | | 44,733 | | | | 46,835 | | | | 43,177 | | | | 44,685 | | | | 48,354 | | | | 58,375 | | | | 59,619 | | | | 64,054 | | | | 68,314 | | | | 70,525 | | | | 5.2 | |
| Liabilities: | | | | | | | | | | | | | | | | | | | | | | | | | | | | | | | | | | | | | | | | | | | | |
| Accounts payable & accrued liabilities | | | 8,618 | | | | 9,031 | | | | 9,751 | | | | 10,573 | | | | 11,497 | | | | 13,092 | | | | 13,506 | | | | 14,664 | | | | 16,007 | | | | 17,383 | | | | 8.1 | |
| Deferred revenue | | | 9,857 | | | | 9,639 | | | | 10,042 | | | | 10,517 | | | | 10,626 | | | | 12,185 | | | | 12,956 | | | | 14,310 | | | | 15,782 | | | | 16,851 | | | | 6.1 | |
| Debt: | | | | | | | | | | | | | | | | | | | | | | | | | | | | | | | | | | | | | | | | | | | | |
| Taxpayer-supported debt | | | 42,719 | | | | 41,499 | | | | 43,607 | | | | 42,681 | | | | 46,229 | | | | 59,750 | | | | 61,731 | | | | 73,475 | | | | 83,302 | | | | 90,846 | | | | 8.7 | |
| Self-supported debt | | | 22,532 | | | | 24,338 | | | | 21,312 | | | | 23,281 | | | | 25,932 | | | | 27,350 | | | | 28,814 | | | | 30,956 | | | | 33,004 | | | | 33,930 | | | | 4.7 | |
| Forecast allowance | | | — | | | | — | | | | — | | | | — | | | | — | | | | — | | | | 1,000 | | | | 1,000 | | | | 1,000 | | | | 1,000 | | | | n/a | |
| Total provincial debt | | | 65,251 | | | | 65,837 | | | | 64,919 | | | | 65,962 | | | | 72,161 | | | | 87,100 | | | | 91,545 | | | | 105,431 | | | | 117,306 | | | | 125,776 | | | | 7.6 | |
| Add: debt offset by sinking funds | | | 1,580 | | | | 1,087 | | | | 1,348 | | | | 752 | | | | 692 | | | | 492 | | | | 513 | | | | 529 | | | | 518 | | | | 563 | | | | -10.8 | |
| Less: guarantees and non-guaranteed debt | | | (820 | ) | | | (835 | ) | | | (896 | ) | | | (850 | ) | | | (1,337 | ) | | | (1,335 | ) | | | (1,278 | ) | | | (1,269 | ) | | | (1,271 | ) | | | (1,261 | ) | | | 4.9 | |
| Financial statement debt | | | 66,011 | | | | 66,089 | | | | 65,371 | | | | 65,864 | | | | 71,516 | | | | 86,257 | | | | 90,780 | | | | 104,691 | | | | 116,553 | | | | 125,078 | | | | 7.4 | |
| Total liabilities | | | 84,486 | | | | 84,759 | | | | 85,164 | | | | 86,954 | | | | 93,639 | | | | 111,534 | | | | 117,242 | | | | 133,665 | | | | 148,342 | | | | 159,312 | | | | 7.3 | |
| Net liabilities | | | (39,753 | ) | | | (37,924 | ) | | | (41,987 | ) | | | (42,269 | ) | | | (45,285 | ) | | | (53,159 | ) | | | (57,623 | ) | | | (69,611 | ) | | | (80,028 | ) | | | (88,787 | ) | | | 9.3 | |
| | | | | | | | | | | | | | | | | | | | | | | | | | | | | | | | | | | | | | | | | | | | | |
| Capital and other assets: | | | | | | | | | | | | | | | | | | | | | | | | | | | | | | | | | | | | | | | | | | | | |
| Tangible capital assets | | | 40,282 | | | | 41,303 | | | | 45,836 | | | | 47,829 | | | | 50,023 | | | | 52,781 | | | | 57,319 | | | | 63,785 | | | | 70,117 | | | | 75,864 | | | | 7.3 | |
| Restricted assets | | | 1,631 | | | | 1,695 | | | | 1,768 | | | | 1,834 | | | | 1,931 | | | | 2,003 | | | | 2,126 | | | | 2,192 | | | | 2,260 | | | | 2,327 | | | | 4.0 | |
| Other assets | | | 1,039 | | | | 1,126 | | | | 932 | | | | 952 | | | | 1,100 | | | | 1,582 | | | | 1,215 | | | | 1,220 | | | | 1,220 | | | | 1,221 | | | | 1.8 | |
| Total capital and other non-financial assets | | | 42,952 | | | | 44,124 | | | | 48,536 | | | | 50,615 | | | | 53,054 | | | | 56,366 | | | | 60,660 | | | | 67,197 | | | | 73,597 | | | | 79,412 | | | | 7.1 | |
| Accumulated surplus (deficit) | | | 3,199 | | | | 6,200 | | | | 6,549 | | | | 8,346 | | | | 7,769 | | | | 3,207 | | | | 3,037 | | | | (2,414 | ) | | | (6,431 | ) | | | (9,375 | ) | | | -212.7 | |
| Per cent of nominal GDP: 1 | | | | | | | | | | | | | | | | | | | | | | | | | | | | | | | | | | | | | | | | | | | | |
| Net liabilities | | | 15.9 | | | | 14.4 | | | | 14.9 | | | | 14.2 | | | | 14.6 | | | | 17.2 | | | | 16.6 | | | | 18.9 | | | | 20.9 | | | | 22.3 | | | | 3.9 | |
| Capital and other assets | | | 17.1 | | | | 16.7 | | | | 17.2 | | | | 17.0 | | | | 17.1 | | | | 18.2 | | | | 17.4 | | | | 18.3 | | | | 19.2 | | | | 19.9 | | | | 1.7 | |
| Growth rates (per cent): | | | | | | | | | | | | | | | | | | | | | | | | | | | | | | | | | | | | | | | | | | | | |
| Net liabilities | | | 2.5 | | | | -4.6 | | | | 10.7 | | | | 0.7 | | | | 7.1 | | | | 17.4 | | | | 8.4 | | | | 20.8 | | | | 15.0 | | | | 10.9 | | | | 17.7 | |
| Capital and other assets | | | 2.4 | | | | 2.7 | | | | 10.0 | | | | 4.3 | | | | 4.8 | | | | 6.2 | | | | 7.6 | | | | 10.8 | | | | 9.5 | | | | 7.9 | | | | 14.4 | |
| Per capita: 2 | | | | | | | | | | | | | | | | | | | | | | | | | | | | | | | | | | | | | | | | | | | | |
| Net liabilities | | | 8,323 | | | | 7,804 | | | | 8,518 | | | | 8,436 | | | | 8,888 | | | | 10,305 | | | | 11,050 | | | | 13,096 | | | | 14,812 | | | | 16,187 | | | | 7.7 | |
| Capital and other assets | | | 8,993 | | | | 9,080 | | | | 9,846 | | | | 10,102 | | | | 10,413 | | | | 10,926 | | | | 11,632 | | | | 12,642 | | | | 13,621 | | | | 14,478 | | | | 5.4 | |
| 1 | Net liabilities as a per cent of nominal GDP is calculated using nominal GDP for the calendar year ending in the fiscal year (e.g. 2022/23 amount divided by nominal GDP for the 2022 calendar year). |
| 2 | Per capita net liabilities is calculated using July 1 population (e.g. 2022/23 amount divided by population on July 1, 2022). |
Budget and Fiscal Plan - 2022/23 to 2024/25
178
Appendix
Table A16 Changes in Financial Position – 2015/16 to 2024/25
| | | | | | | | | | | | | | | | | | | | | Updated | | | Budget | | | | | | | | | | |
| | | Actual | | | Actual | | | Actual | | | Actual | | | Actual | | | Actual | | | Forecast | | | Estimate | | | Plan | | | Plan | | | 10-Year | |
| ($ millions) | | 2015/16 | | | 2016/17 | | | 2017/18 | | | 2018/19 | | | 2019/20 | | | 2020/21 | | | 2021/22 | | | 2022/23 | | | 2023/24 | | | 2024/25 | | | Total | |
| (Surplus) deficit for the year | | | (769 | ) | | | (2,765 | ) | | | (313 | ) | | | (1,531 | ) | | | 322 | | | | 5,468 | | | | 483 | | | | 5,461 | | | | 4,182 | | | | 3,181 | | | | 13,719 | |
| Comprehensive income (increase) decrease | | | 647 | | | | (236 | ) | | | (36 | ) | | | (266 | ) | | | 255 | | | | (906 | ) | | | (313 | ) | | | (10 | ) | | | (165 | ) | | | (237 | ) | | | (1,267 | ) |
| Change in accumulated (surplus) deficit | | | (122 | ) | | | (3,001 | ) | | | (349 | ) | | | (1,797 | ) | | | 577 | | | | 4,562 | | | | 170 | | | | 5,451 | | | | 4,017 | | | | 2,944 | | | | 12,452 | |
| Capital and other asset changes: | | | | | | | | | | | | | | | | | | | | | | | | | | | | | | | | | | | | | | | | | | | | |
| Taxpayer-supported capital investments | | | 3,459 | | | | 3,659 | | | | 3,908 | | | | 4,452 | | | | 4,772 | | | | 5,428 | | | | 7,157 | | | | 9,279 | | | | 9,333 | | | | 8,815 | | | | 60,262 | |
| Less: amortization and other accounting changes | | | (2,205 | ) | | | (2,638 | ) | | | 625 | | | | (2,459 | ) | | | (2,578 | ) | | | (2,670 | ) | | | (2,619 | ) | | | (2,813 | ) | | | (3,001 | ) | | | (3,068 | ) | | | (23,426 | ) |
| Increase in net capital assets | | | 1,254 | | | | 1,021 | | | | 4,533 | | | | 1,993 | | | | 2,194 | | | | 2,758 | | | | 4,538 | | | | 6,466 | | | | 6,332 | | | | 5,747 | | | | 36,836 | |
| Increase (decrease) in restricted assets | | | 78 | | | | 64 | | | | 73 | | | | 66 | | | | 97 | | | | 72 | | | | 123 | | | | 66 | | | | 68 | | | | 67 | | | | 774 | |
| Increase (decrease) in other assets | | | (228 | ) | | | 87 | | | | (194 | ) | | | 20 | | | | 148 | | | | 482 | | | | (367 | ) | | | 5 | | | | — | | | | 1 | | | | (46 | ) |
| Change in capital and other assets | | | 1,104 | | | | 1,172 | | | | 4,412 | | | | 2,079 | | | | 2,439 | | | | 3,312 | | | | 4,294 | | | | 6,537 | | | | 6,400 | | | | 5,815 | | | | 37,564 | |
| Increase (decrease) in net liabilities | | | 982 | | | | (1,829 | ) | | | 4,063 | | | | 282 | | | | 3,016 | | | | 7,874 | | | | 4,464 | | | | 11,988 | | | | 10,417 | | | | 8,759 | | | | 50,016 | |
| | | | | | | | | | | | | | | | | | | | | | | | | | | | | | | | | | | | | | | | | | | | | |
| Investment and working capital changes: | | | | | | | | | | | | | | | | | | | | | | | | | | | | | | | | | | | | | | | | | | | | |
| Investment in commercial Crown corporations: | | | | | | | | | | | | | | | | | | | | | | | | | | | | | | | | | | | | | | | | | | | | |
| Increase (decrease) in retained earnings | | | (740 | ) | | | (20 | ) | | | (1,383 | ) | | | (394 | ) | | | 783 | | | | 3,108 | | | | 2,906 | | | | 1,074 | | | | 1,137 | | | | 1,245 | | | | 7,716 | |
| Self-supported capital investments | | | 2,573 | | | | 2,725 | | | | 2,729 | | | | 4,106 | | | | 4,386 | | | | 3,475 | | | | 3,828 | | | | 4,374 | | | | 4,437 | | | | 3,144 | | | | 35,777 | |
| Less: loan repayments and other accounting changes | | | (1,156 | ) | | | (957 | ) | | | (6,004 | ) | | | (2,093 | ) | | | (2,165 | ) | | | (1,942 | ) | | | (2,589 | ) | | | (2,222 | ) | | | (2,392 | ) | | | (2,209 | ) | | | (23,729 | ) |
| Change in investment | | | 677 | | | | 1,748 | | | | (4,658 | ) | | | 1,619 | | | | 3,004 | | | | 4,641 | | | | 4,145 | | | | 3,226 | | | | 3,182 | | | | 2,180 | | | | 19,764 | |
| Increase (decrease) in cash and temporary investments | | | 217 | | | | 340 | | | | (792 | ) | | | (411 | ) | | | 956 | | | | 2,575 | | | | (3,271 | ) | | | (599 | ) | | | 79 | | | | 126 | | | | (780 | ) |
| Other working capital changes | | | 977 | | | | (181 | ) | | | 669 | | | | (997 | ) | | | (1,324 | ) | | | (349 | ) | | | (815 | ) | | | (704 | ) | | | (1,816 | ) | | | (2,540 | ) | | | (7,080 | ) |
| Changes in investment and working capital | | | 1,871 | | | | 1,907 | | | | (4,781 | ) | | | 211 | | | | 2,636 | | | | 6,867 | | | | 59 | | | | 1,923 | | | | 1,445 | | | | (234 | ) | | | 11,904 | |
| | | | | | | | | | | | | | | | | | | | | | | | | | | | | | | | | | | | | | | | | | | | | |
| Increase (decrease) in financial statement debt | | | 2,853 | | | | 78 | | | | (718 | ) | | | 493 | | | | 5,652 | | | | 14,741 | | | | 4,523 | | | | 13,911 | | | | 11,862 | | | | 8,525 | | | | 61,920 | |
| (Increase) decrease in sinking fund debt | | | (603 | ) | | | 493 | | | | (261 | ) | | | 596 | | | | 60 | | | | 200 | | | | (21 | ) | | | (16 | ) | | | 11 | | | | (45 | ) | | | 414 | |
| Increase (decrease) in guarantees | | | 6 | | | | (23 | ) | | | (188 | ) | | | (2 | ) | | | 57 | | | | 113 | | | | (282 | ) | | | 1 | | | | (1 | ) | | | (1 | ) | | | (320 | ) |
| Increase (decrease) in non-guaranteed debt | | | 75 | | | | 38 | | | | 249 | | | | (44 | ) | | | 430 | | | | (115 | ) | | | 225 | | | | (10 | ) | | | 3 | | | | (9 | ) | | | 842 | |
| Increase (decrease) in total provincial debt | | | 2,331 | | | | 586 | | | | (918 | ) | | | 1,043 | | | | 6,199 | | | | 14,939 | | | | 4,445 | | | | 13,886 | | | | 11,875 | | | | 8,470 | | | | 62,856 | |
| | | | | | | | | | | | | | | | | | | | | | | | | | | | | | | | | | | | | | | | | | | | | |
| Represented by increase (decrease) in: | | | | | | | | | | | | | | | | | | | | | | | | | | | | | | | | | | | | | | | | | | | | |
| Taxpayer-supported debt | | | 839 | | | | (1,220 | ) | | | 2,108 | | | | (926 | ) | | | 3,548 | | | | 13,521 | | | | 1,981 | | | | 11,744 | | | | 9,827 | | | | 7,544 | | | | 48,966 | |
| Self-supported debt | | | 1,492 | | | | 1,806 | | | | (3,026 | ) | | | 1,969 | | | | 2,651 | | | | 1,418 | | | | 1,464 | | | | 2,142 | | | | 2,048 | | | | 926 | | | | 12,890 | |
| Forecast allowance | | | — | | | | — | | | | — | | | | — | | | | — | | | | — | | | | 1,000 | | | | — | | | | — | | | | — | | | | 1,000 | |
| Total provincial debt | | | 2,331 | | | | 586 | | | | (918 | ) | | | 1,043 | | | | 6,199 | | | | 14,939 | | | | 4,445 | | | | 13,886 | | | | 11,875 | | | | 8,470 | | | | 62,856 | |
Budget and Fiscal Plan - 2022/23 to 2024/25
179
Appendix
Table A17 Provincial Debt – 2015/16 to 2024/25
| | | | | | | | | | | | | | | | | | | | | Updated | | | Budget | | | | | | | | | Average | |
| | | Actual | | | Actual | | | Actual | | | Actual | | | Actual | | | Actual | | | Forecast | | | Estimate | | | Plan | | | Plan | | | annual | |
| ($ millions) | | 2015/16 | | | 2016/17 | | | 2017/18 | | | 2018/19 | | | 2019/20 | | | 2020/21 | | | 2021/22 | | | 2022/23 | | | 2023/24 | | | 2024/25 | | | change | |
| | | | | | | | | | | | | | | | | | | | | | | | | | | | | | | | | (per cent) | |
| Taxpayer-supported debt: | | | | | | | | | | | | | | | | | | | | | | | | | | | | | | | | | | | | | | | | | | | | |
| Provincial government | | | | | | | | | | | | | | | | | | | | | | | | | | | | | | | | | | | | | | | | | | | | |
| Operating | | | 8,034 | | | | 4,644 | | | | 1,156 | | | | — | | | | — | | | | 8,746 | | | | 5,719 | | | | 10,411 | | | | 12,644 | | | | 13,741 | | | | 6.1 | |
| Capital 2 | | | | | | | | | | | | | | | | | | | | | | | | | | | | | | | | | | | | | | | | | | | | |
| K-12 education | | | 8,012 | | | | 8,454 | | | | 8,891 | | | | 8,885 | | | | 9,757 | | | | 10,529 | | | | 11,456 | | | | 12,225 | | | | 13,077 | | | | 13,900 | | | | 6.3 | |
| Post-secondary institutions | | | 4,063 | | | | 4,285 | | | | 4,584 | | | | 4,607 | | | | 4,917 | | | | 5,426 | | | | 5,783 | | | | 6,238 | | | | 6,833 | | | | 7,502 | | | | 7.1 | |
| Health facilities | | | 5,416 | | | | 5,835 | | | | 6,141 | | | | 6,173 | | | | 6,705 | | | | 7,484 | | | | 8,449 | | | | 9,791 | | | | 11,571 | | | | 14,120 | | | | 11.2 | |
| Ministries general capital | | | 1,987 | | | | 2,288 | | | | 2,718 | | | | 2,363 | | | | 3,133 | | | | 3,702 | | | | 4,246 | | | | 4,793 | | | | 5,224 | | | | 5,605 | | | | 12.2 | |
| Transportation | | | 2,174 | | | | 2,174 | | | | 5,682 | | | | 5,401 | | | | 5,401 | | | | 5,401 | | | | 5,401 | | | | 5,403 | | | | 5,405 | | | | 5,406 | | | | 10.7 | |
| Social housing | | | 428 | | | | 449 | | | | 619 | | | | 619 | | | | 805 | | | | 1,062 | | | | 1,451 | | | | 1,797 | | | | 2,024 | | | | 2,232 | | | | 20.1 | |
| Other | | | 242 | | | | 242 | | | | 242 | | | | 242 | | | | 252 | | | | 259 | | | | 273 | | | | 327 | | | | 446 | | | | 595 | | | | 10.5 | |
| Total capital | | | 22,322 | | | | 23,727 | | | | 28,877 | | | | 28,290 | | | | 30,970 | | | | 33,863 | | | | 37,058 | | | | 40,573 | | | | 44,578 | | | | 49,360 | | | | 9.2 | |
| Total provincial government | | | 30,356 | | | | 28,371 | | | | 30,033 | | | | 28,290 | | | | 30,970 | | | | 42,609 | | | | 42,777 | | | | 50,984 | | | | 57,222 | | | | 63,101 | | | | 8.5 | |
| | | | | | | | | | | | | | | | | | | | | | | | | | | | | | | | | | | | | | | | | | | | | |
| Taxpayer-supported entities: | | | | | | | | | | | | | | | | | | | | | | | | | | | | | | | | | | | | | | | | | | | | |
| BC Pavilion Corporation | | | 156 | | | | 143 | | | | 141 | | | | 138 | | | | 135 | | | | 132 | | | | 129 | | | | 126 | | | | 123 | | | | 119 | | | | -2.9 | |
| BC Transit | | | 106 | | | | 94 | | | | 84 | | | | 73 | | | | 65 | | | | 60 | | | | 57 | | | | 110 | | | | 182 | | | | 242 | | | | 9.6 | |
| BC Transportation Financing Authority | | | 9,177 | | | | 9,974 | | | | 10,388 | | | | 11,293 | | | | 12,193 | | | | 13,321 | | | | 14,956 | | | | 17,512 | | | | 20,262 | | | | 22,479 | | | | 10.5 | |
| Health Authorities and Hospital Societies | | | 1,582 | | | | 1,717 | | | | 1,762 | | | | 1,795 | | | | 1,802 | | | | 1,875 | | | | 1,869 | | | | 1,831 | | | | 1,787 | | | | 1,739 | | | | 1.1 | |
| InBC Investment Corp | | | 304 | | | | 217 | | | | 161 | | | | 70 | | | | 45 | | | | 37 | | | | 19 | | | | 29 | | | | 29 | | | | 29 | | | | -23.0 | |
| Post-secondary institutions | | | 668 | | | | 699 | | | | 744 | | | | 763 | | | | 753 | | | | 882 | | | | 899 | | | | 888 | | | | 966 | | | | 950 | | | | 4.0 | |
| School districts | | | 21 | | | | 19 | | | | 17 | | | | 19 | | | | 18 | | | | 24 | | | | 31 | | | | 36 | | | | 40 | | | | 45 | | | | 8.8 | |
| Social housing | | | 332 | | | | 246 | | | | 259 | | | | 225 | | | | 222 | | | | 770 | | | | 958 | | | | 1,932 | | | | 2,665 | | | | 2,113 | | | | 22.8 | |
| Other | | | 17 | | | | 19 | | | | 18 | | | | 15 | | | | 26 | | | | 40 | | | | 36 | | | | 27 | | | | 26 | | | | 29 | | | | 6.2 | |
| Total taxpayer-supported entities | | | 12,363 | | | | 13,128 | | | | 13,574 | | | | 14,391 | | | | 15,259 | | | | 17,141 | | | | 18,954 | | | | 22,491 | | | | 26,080 | | | | 27,745 | | | | 9.4 | |
| Total taxpayer-supported debt | | | 42,719 | | | | 41,499 | | | | 43,607 | | | | 42,681 | | | | 46,229 | | | | 59,750 | | | | 61,731 | | | | 73,475 | | | | 83,302 | | | | 90,846 | | | | 8.7 | |
| | | | | | | | | | | | | | | | | | | | | | | | | | | | | | | | | | | | | | | | | | | | | |
| Self-supported debt: | | | | | | | | | | | | | | | | | | | | | | | | | | | | | | | | | | | | | | | | | | | | |
| Commercial Crown corporations and agencies | | | | | | | | | | | | | | | | | | | | | | | | | | | | | | | | | | | | | | | | | | | | |
| BC Hydro | | | 17,929 | | | | 19,685 | | | | 19,990 | | | | 22,064 | | | | 23,238 | | | | 24,650 | | | | 26,128 | | | | 28,290 | | | | 30,432 | | | | 31,397 | | | | 6.4 | |
| BC Liquor Distribution Branch | | | — | | | | — | | | | — | | | | — | | | | 210 | | | | 233 | | | | 204 | | | | 213 | | | | 236 | | | | 247 | | | | 2.7 | |
| BC Lottery Corporation | | | 150 | | | | 145 | | | | 155 | | | | 100 | | | | 233 | | | | 228 | | | | 207 | | | | 202 | | | | 110 | | | | 86 | | | | -6.0 | |
| Columbia Basin power projects | | | 459 | | | | 448 | | | | 433 | | | | 418 | | | | 1,387 | | | | 1,349 | | | | 1,325 | | | | 1,300 | | | | 1,273 | | | | 1,244 | | | | 11.7 | |
| Columbia Power Corporation | | | 296 | | | | 291 | | | | 286 | | | | 282 | | | | 276 | | | | 271 | | | | 266 | | | | 261 | | | | 255 | | | | 249 | | | | -1.9 | |
| Post-secondary institution subsidiaries | | | 310 | | | | 340 | | | | 418 | | | | 387 | | | | 504 | | | | 520 | | | | 575 | | | | 575 | | | | 574 | | | | 575 | | | | 7.1 | |
| Transportation Investment Corporation 1 | | | 3,355 | | | | 3,398 | | | | — | | | | — | | | | — | | | | | | | | — | | | | — | | | | — | | | | — | | | | n/a | |
| Other | | | 33 | | | | 31 | | | | 30 | | | | 30 | | | | 84 | | | | 99 | | | | 109 | | | | 116 | | | | 124 | | | | 132 | | | | 16.6 | |
| Total self-supported debt | | | 22,532 | | | | 24,338 | | | | 21,312 | | | | 23,281 | | | | 25,932 | | | | 27,350 | | | | 28,814 | | | | 30,956 | | | | 33,004 | | | | 33,930 | | | | 4.7 | |
| Forecast allowance | | | — | | | | — | | | | — | | | | — | | | | — | | | | — | | | | 1,000 | | | | 1,000 | | | | 1,000 | | | | 1,000 | | | | n/a | |
| Total provincial debt | | | 65,251 | | | | 65,837 | | | | 64,919 | | | | 65,962 | | | | 72,161 | | | | 87,100 | | | | 91,545 | | | | 105,431 | | | | 117,306 | | | | 125,776 | | | | 7.6 | |
| 1 | Beginning in 2017/18, debt related to the Port Mann Bridge was reclassified as taxpayer-supported due to the elimination of tolls effective September 1, 2017. |
| 2 | Includes debt incurred by the government to fund the building and construction of capital assets in the education, health, social housing and other sectors. |
Budget and Fiscal Plan - 2022/23 to 2024/25
180
Appendix
Table A18 Provincial Debt Supplementary Information – 2015/16 to 2024/25 1
| | | | | | | | | | | | | | | | | | | | | Updated | | | Budget | | | | | | | | | Average | |
| | | Actual | | | Actual | | | Actual | | | Actual | | | Actual | | | Actual | | | Forecast | | | Estimate | | | Plan | | | Plan | | | annual | |
| ($ millions) | | 2015/16 | | | 2016/17 | | | 2017/18 | | | 2018/19 | | | 2019/20 | | | 2020/21 | | | 2021/22 | | | 2022/23 | | | 2023/24 | | | 2024/25 | | | change | |
| | | | | | | | | | | | | | | | | | | | | | | | | | | | | | | | | (per cent) | |
| Per cent of nominal GDP: 2 | | | | | | | | | | | | | | | | | | | | | | | | | | | | | | | | | | | | | | | | | | | | |
| Taxpayer-supported debt: | | | | | | | | | | | | | | | | | | | | | | | | | | | | | | | | | | | | | | | | | | | | |
| Provincial government direct operating | | | 3.2 | | | | 1.8 | | | | 0.4 | | | | — | | | | — | | | | 2.8 | | | | 1.6 | | | | 2.8 | | | | 3.3 | | | | 3.5 | | | | 0.8 | |
| Provincial government capital | | | 8.9 | | | | 9.0 | | | | 10.2 | | | | 9.5 | | | | 10.0 | | | | 10.9 | | | | 10.7 | | | | 11.0 | | | | 11.6 | | | | 12.4 | | | | 3.8 | |
| Total provincial government | | | 12.1 | | | | 10.8 | | | | 10.6 | | | | 9.5 | | | | 10.0 | | | | 13.8 | | | | 12.3 | | | | 13.9 | | | | 14.9 | | | | 15.9 | | | | 3.0 | |
| Taxpayer-supported entities | | | 4.9 | | | | 5.0 | | | | 4.8 | | | | 4.8 | | | | 4.9 | | | | 5.5 | | | | 5.5 | | | | 6.1 | | | | 6.8 | | | | 7.0 | | | | 3.9 | |
| Total taxpayer-supported debt | | | 17.0 | | | | 15.7 | | | | 15.4 | | | | 14.4 | | | | 14.9 | | | | 19.3 | | | | 17.8 | | | | 20.0 | | | | 21.8 | | | | 22.8 | | | | 3.3 | |
| Self-supported debt: | | | | | | | | | | | | | | | | | | | | | | | | | | | | | | | | | | | | | | | | | | | | |
| Commercial Crown corporations & agencies | | | 9.0 | | | | 9.2 | | | | 7.6 | | | | 7.8 | | | | 8.3 | | | | 8.8 | | | | 8.3 | | | | 8.4 | | | | 8.6 | | | | 8.5 | | | | -0.6 | |
| Total provincial debt | | | 26.0 | | | | 24.9 | | | | 23.0 | | | | 22.2 | | | | 23.2 | | | | 28.2 | | | | 26.3 | | | | 28.7 | | | | 30.6 | | | | 31.6 | | | | 2.2 | |
| Growth rates (per cent): | | | | | | | | | | | | | | | | | | | | | | | | | | | | | | | | | | | | | | | | | | | | |
| Taxpayer-supported debt: | | | | | | | | | | | | | | | | | | | | | | | | | | | | | | | | | | | | | | | | | | | | |
| Provincial government direct operating | | | -13.4 | | | | -42.2 | | | | -75.1 | | | | -100.0 | | | | — | | | | — | | | | -34.6 | | | | 82.0 | | | | 21.4 | | | | 8.7 | | | | -15.3 | |
| Provincial government capital | | | 6.0 | | | | 6.3 | | | | 21.7 | | | | -2.0 | | | | 9.5 | | | | 9.3 | | | | 9.4 | | | | 9.5 | | | | 9.9 | | | | 10.7 | | | | 9.0 | |
| Taxpayer-supported entities | | | 7.2 | | | | 6.2 | | | | 3.4 | | | | 6.0 | | | | 6.0 | | | | 12.3 | | | | 10.6 | | | | 18.7 | | | | 16.0 | | | | 6.4 | | | | 9.3 | |
| Total taxpayer-supported debt | | | 2.0 | | | | -2.9 | | | | 5.1 | | | | -2.1 | | | | 8.3 | | | | 29.2 | | | | 3.3 | | | | 19.0 | | | | 13.4 | | | | 9.1 | | | | 8.4 | |
| Self-supported debt: | | | | | | | | | | | | | | | | | | | | | | | | | | | | | | | | | | | | | | | | | | | | |
| Commercial Crown corporations & agencies | | | 7.1 | | | | 8.0 | | | | -12.4 | | | | 9.2 | | | | 11.4 | | | | 5.5 | | | | 5.4 | | | | 7.4 | | | | 6.6 | | | | 2.8 | | | | 5.1 | |
| Total provincial debt | | | 3.7 | | | | 0.9 | | | | -1.4 | | | | 1.6 | | | | 9.4 | | | | 20.7 | | | | 5.1 | | | | 15.2 | | | | 11.3 | | | | 7.2 | | | | 7.4 | |
| Per capita: 3 | | | | | | | | | | | | | | | | | | | | | | | | | | | | | | | | | | | | | | | | | | | | |
| Taxpayer-supported debt: | | | | | | | | | | | | | | | | | | | | | | | | | | | | | | | | | | | | | | | | | | | | |
| Provincial government direct operating | | | 1,682 | | | | 956 | | | | 235 | | | | — | | | | — | | | | 1,695 | | | | 1,097 | | | | 1,959 | | | | 2,340 | | | | 2,505 | | | | 4.5 | |
| Provincial government capital | | | 4,673 | | | | 4,883 | | | | 5,858 | | | | 5,646 | | | | 6,079 | | | | 6,564 | | | | 7,106 | | | | 7,633 | | | | 8,251 | | | | 8,999 | | | | 7.6 | |
| Taxpayer-supported entities | | | 2,588 | | | | 2,702 | | | | 2,754 | | | | 2,872 | | | | 2,995 | | | | 3,323 | | | | 3,635 | | | | 4,231 | | | | 4,827 | | | | 5,058 | | | | 7.7 | |
| Total taxpayer-supported debt | | | 8,944 | | | | 8,540 | | | | 8,846 | | | | 8,518 | | | | 9,074 | | | | 11,582 | | | | 11,838 | | | | 13,823 | | | | 15,418 | | | | 16,562 | | | | 7.1 | |
| Self-supported debt: | | | | | | | | | | | | | | | | | | | | | | | | | | | | | | | | | | | | | | | | | | | | |
| Commercial Crown corporations & agencies | | | 4,717 | | | | 5,009 | | | | 4,323 | | | | 4,646 | | | | 5,090 | | | | 5,302 | | | | 5,525 | | | | 5,824 | | | | 6,108 | | | | 6,186 | | | | 3.1 | |
| Total provincial debt | | | 13,661 | | | | 13,549 | | | | 13,170 | | | | 13,165 | | | | 14,164 | | | | 16,884 | | | | 17,555 | | | | 19,834 | | | | 21,711 | | | | 22,931 | | | | 5.9 | |
| Real Per Capita Provincial Debt (2021 $) 4 | | | 15,463 | | | | 15,061 | | | | 14,335 | | | | 13,950 | | | | 14,666 | | | | 17,350 | | | | 17,555 | | | | 19,284 | | | | 20,649 | | | | 21,376 | | | | 3.7 | |
| Growth rate (per cent) | | | 1.1 | | | | -2.6 | | | | -4.8 | | | | -2.7 | | | | 5.1 | | | | 18.3 | | | | 1.2 | | | | 9.8 | | | | 7.1 | | | | 3.5 | | | | 3.6 | |
| 1 | Numbers may not add due to rounding. |
| 2 | Debt as a per cent of GDP is calculated using nominal GDP for the calendar year ending in the fiscal year (e.g. 2022/23 debt divided by nominal GDP for the 2022 calendar year). |
| 3 | Per capita debt is calculated using July 1 population (e.g. 2022/23 debt divided by population on July 1, 2022). |
| 4 | Debt is converted to real (inflation-adjusted) terms using the consumer price index (CPI) for the corresponding calendar year (e.g. 2022 CPI for 2022/23 debt). |
Budget and Fiscal Plan - 2022/23 to 2024/25
181
Appendix
Table A19 Key Provincial Debt Indicators – 2015/16 to 2024/25
| | | | | | | | | | | | | | | | | | | | | Updated | | | Budget | | | | | | | | | Average | |
| | | Actual | | | Actual | | | Actual | | | Actual | | | Actual | | | Actual | | | Forecast | | | Estimate | | | Plan | | | Plan | | | annual | |
| | | 2015/16 | | | 2016/17 | | | 2017/18 | | | 2018/19 | | | 2019/20 | | | 2020/21 | | | 2021/22 | | | 2022/23 | | | 2023/24 | | | 2024/25 | | | change | |
| | | | | | | | | | | | | | | | | | | | | | | | | | | | | | | | | (per cent) | |
| Debt to revenue (per cent) | | | | | | | | | | | | | | | | | | | | | | | | | | | | | | | | | | | | | | | | | | | | |
| Total provincial | | | 105.9 | | | | 99.3 | | | | 94.7 | | | | 89.5 | | | | 95.9 | | | | 115.1 | | | | 107.4 | | | | 124.5 | | | | 135.1 | | | | 140.8 | | | | 3.2 | |
| Taxpayer-supported | | | 91.3 | | | | 81.8 | | | | 82.5 | | | | 75.0 | | | | 80.6 | | | | 101.2 | | | | 92.9 | | | | 110.9 | | | | 122.7 | | | | 129.8 | | | | 4.0 | |
| Debt per capita ($) 1 | | | | | | | | | | | | | | | | | | | | | | | | | | | | | | | | | | | | | | | | | | | | |
| Total provincial | | | 13,661 | | | | 13,549 | | | | 13,170 | | | | 13,165 | | | | 14,164 | | | | 16,884 | | | | 17,555 | | | | 19,834 | | | | 21,711 | | | | 22,931 | | | | 5.9 | |
| Taxpayer-supported | | | 8,944 | | | | 8,540 | | | | 8,846 | | | | 8,518 | | | | 9,074 | | | | 11,582 | | | | 11,838 | | | | 13,823 | | | | 15,418 | | | | 16,562 | | | | 7.1 | |
| Debt to nominal GDP (per cent) 2 | | | | | | | | | | | | | | | | | | | | | | | | | | | | | | | | | | | | | | | | | | | | |
| Total provincial | | | 26.0 | | | | 24.9 | | | | 23.0 | | | | 22.2 | | | | 23.2 | | | | 28.2 | | | | 26.3 | | | | 28.7 | | | | 30.6 | | | | 31.6 | | | | 2.2 | |
| Taxpayer-supported | | | 17.0 | | | | 15.7 | | | | 15.4 | | | | 14.4 | | | | 14.9 | | | | 19.3 | | | | 17.8 | | | | 20.0 | | | | 21.8 | | | | 22.8 | | | | 3.3 | |
| Interest bite (cents per dollar of revenue) 3 | | | | | | | | | | | | | | | | | | | | | | | | | | | | | | | | | | | | | | | | | | | | |
| Total provincial | | | 4.7 | | | | 3.8 | | | | 4.0 | | | | 3.8 | | | | 3.8 | | | | 3.7 | | | | 3.5 | | | | 3.5 | | | | 3.8 | | | | 4.1 | | | | -1.5 | |
| Taxpayer-supported | | | 4.1 | | | | 3.2 | | | | 3.3 | | | | 3.2 | | | | 3.1 | | | | 3.1 | | | | 2.8 | | | | 3.0 | | | | 3.4 | | | | 3.7 | | | | -1.1 | |
| Interest costs ($ millions) | | | | | | | | | | | | | | | | | | | | | | | | | | | | | | | | | | | | | | | | | | | | |
| Total provincial | | | 2,919 | | | | 2,521 | | | | 2,759 | | | | 2,786 | | | | 2,893 | | | | 2,817 | | | | 2,965 | | | | 2,967 | | | | 3,341 | | | | 3,683 | | | | 2.6 | |
| Taxpayer-supported | | | 1,932 | | | | 1,644 | | | | 1,725 | | | | 1,793 | | | | 1,807 | | | | 1,832 | | | | 1,852 | | | | 2,012 | | | | 2,329 | | | | 2,615 | | | | 3.4 | |
| Interest rate (per cent) 4 | | | | | | | | | | | | | | | | | | | | | | | | | | | | | | | | | | | | | | | | | | | | |
| Taxpayer-supported | | | 4.6 | | | | 3.9 | | | | 4.1 | | | | 4.2 | | | | 4.1 | | | | 3.5 | | | | 3.0 | | | | 3.0 | | | | 3.0 | | | | 3.0 | | | | -4.6 | |
| Background Information: | | | | | | | | | | | | | | | | | | | | | | | | | | | | | | | | | | | | | | | | | | | | |
| Revenue ($ millions) | | | | | | | | | | | | | | | | | | | | | | | | | | | | | | | | | | | | | | | | | | | | |
| Total provincial 5 | | | 61,589 | | | | 66,334 | | | | 68,551 | | | | 73,734 | | | | 75,283 | | | | 75,691 | | | | 85,258 | | | | 84,672 | | | | 86,809 | | | | 89,347 | | | | 4.2 | |
| Taxpayer-supported 6 | | | 46,805 | | | | 50,726 | | | | 52,866 | | | | 56,881 | | | | 57,386 | | | | 59,033 | | | | 66,483 | | | | 66,226 | | | | 67,884 | | | | 69,977 | | | | 4.6 | |
| Debt ($ millions) | | | | | | | | | | | | | | | | | | | | | | | | | | | | | | | | | | | | | | | | | | | | |
| Total provincial | | | 65,251 | | | | 65,837 | | | | 64,919 | | | | 65,962 | | | | 72,161 | | | | 87,100 | | | | 91,545 | | | | 105,431 | | | | 117,306 | | | | 125,776 | | | | 7.6 | |
| Taxpayer-supported 7 | | | 42,719 | | | | 41,499 | | | | 43,607 | | | | 42,681 | | | | 46,229 | | | | 59,750 | | | | 61,731 | | | | 73,475 | | | | 83,302 | | | | 90,846 | | | | 8.7 | |
| Provincial nominal GDP ($ millions) 8 | | | 250,784 | | | | 263,912 | | | | 282,283 | | | | 297,392 | | | | 310,978 | | | | 309,327 | | | | 347,653 | | | | 367,966 | | | | 382,899 | | | | 398,108 | | | | 5.3 | |
| Population (thousands at July 1) 9 | | | 4,776 | | | | 4,859 | | | | 4,929 | | | | 5,010 | | | | 5,095 | | | | 5,159 | | | | 5,215 | | | | 5,316 | | | | 5,403 | | | | 5,485 | | | | 1.5 | |
| 1 | The ratio of debt to population (e.g. 2022/23 debt divided by population at July 1, 2022). |
| 2 | The ratio of debt outstanding at fiscal year end to provincial nominal gross domestic product (GDP) for the calendar year ending in the fiscal year (e.g. 2022/23 debt divided by 2022 nominal GDP). |
| 3 | The ratio of interest costs (less sinking fund interest) to revenue. Figures include capitalized interest expense in order to provide a more comparable measure to outstanding debt. |
| 4 | Weighted average of all outstanding debt issues. |
| 5 | Includes revenue of the consolidated revenue fund (excluding dividends from enterprises) plus revenue of all government organizations and enterprises. |
| 6 | Excludes revenue of government enterprises, but includes dividends from enterprises paid to the consolidated revenue fund. |
| 7 | Excludes debt of commercial Crown corporations and agencies and funds held under the province’s warehouse borrowing program. |
| 8 | Nominal GDP for the calendar year ending in the fiscal year (e.g. nominal GDP for 2022 is used for the fiscal year ended March 31, 2023). |
| 9 | Population at July 1st within the fiscal year (e.g. population at July 1, 2022 is used for the fiscal year ended March 31, 2023). |
Budget and Fiscal Plan - 2022/23 to 2024/25
182