Exhibit 99.5
This page
intentionally left blank.
Budget and Fiscal Plan
2023/24 - 2025/26
February 28, 2023

| National Library of Canada Cataloguing in Publication Data | |
| British Columbia. | |
| Budget and fiscal plan. -- 2002/03/2004/05- | |
| Annual | |
| Also available on the Internet. | |
| Continues: British Columbia. Ministry of Finance and | |
| Corporate Relations. Budget ... reports. ISSN 1207-5841 | |
| ISSN 1705-6071 = Budget and fiscal plan — British Columbia. | |
| 1. Budget — British Columbia — Periodicals. 2. British | |
| Columbia — Appropriations and expenditures — Periodicals. | |
| I. British Columbia. Ministry of Finance. II. Title. | |
| HJ12.B742 352.48'09711'05 C2003-960048-3 |
| BUDGET AND FISCAL PLAN 2023/24 to 2025/26 | | TABLE OF CONTENTS | |
| February 28, 2023 |
| Attestation by the Secretary to Treasury Board | |
| Summary | 1 |
| Part 1: Three Year Fiscal Plan | |
| Introduction | 5 |
| Expense | 7 |
| Consolidated Revenue Fund Spending | 7 |
| Improved Health and Mental Health Care | 7 |
| Affordable and Attainable Housing | 11 |
| Helping British Columbians to Reduce Costs | 14 |
| Safe and Healthy Communities for Everyone | 17 |
| Sustainable and Clean Economy | 20 |
| 2022 Shared Recovery Mandate | 26 |
| Other Essential Services | 27 |
| Pandemic Recovery Contingencies | 28 |
| BC Public Service | 32 |
| Spending Recovered from Third Parties | 32 |
| Transfers to Service Delivery Agencies | 32 |
| Service Delivery Agency Spending | 33 |
| Revenue | 36 |
| Major Revenue Sources | 38 |
| Capital Spending | 43 |
| Taxpayer-Supported Capital Spending | 43 |
| Projects Over $50 Million | 55 |
| Provincial Debt | 64 |
| Risks to the Fiscal Plan | 67 |
| Tables: | |
| 1.1 Three Year Fiscal Plan | 5 |
| 1.2.1 Investing in Health and Mental Health Care | 7 |
| 1.2.2 Investing in Affordable and Attainable Housing | 12 |
| 1.2.3 New Measures to Reduce Costs | 15 |
| 1.2.4 New Investments for Safe and Healthy Communities | 18 |
| 1.2.5 Sustainable and Clean Economy | 20 |
| 1.2.6 Wage Mandate Costs over the Budget 2023 Fiscal Period | 26 |
| 1.2.7 Pandemic Recovery Contingencies 2023/24 | 29 |
| 1.3 Expense by Ministry, Program and Agency | 34 |
| 1.4 Revenue by Source | 35 |
| Budget and Fiscal Plan - 2023/24 to 2025/26
| | i |
Table of Contents
| 1.5.1 Comparison of Major Factors Underlying Revenue | 37 |
| 1.5.2 Corporate Income Tax Revenue | 38 |
| 1.5.3 Sales Tax Revenue | 38 |
| 1.5.4 Federal Government Contributions | 42 |
| 1.6 Capital Spending | 43 |
| 1.7 Provincial Transportation Investments | 52 |
| 1.8 Capital Expenditure Projects Greater Than $50 Million | 58 |
| 1.9 Provincial Debt Summary | 64 |
| 1.10 Provincial Borrowing Requirements | 66 |
| 1.11 Provincial Debt Changes | 66 |
| 1.12 Key Fiscal Sensitivities | 67 |
| Topic Boxes: | |
| Fiscal Sustainability | 30 |
| Building a Sustainable Province | 61 |
| Part 2: Tax Measures | |
| Tax Measures — Supplementary Information | 72 |
| Tables: | |
| 2.1 Summary of Tax Measures | 71 |
| Topic Boxes: | |
| New Carbon Pricing Model | 80 |
| ii | | Budget and Fiscal Plan - 2023/24 to 2025/26
|
Table of Contents
| Part 3: British Columbia Economic Review and Outlook | |
| Summary | 83 |
| British Columbia Economic Activity and Outlook | 84 |
| Labour Market | 85 |
| Consumer Spending and Inflation | 86 |
| Housing | 88 |
| Business and Government | 91 |
| External Trade and Commodity Markets | 92 |
| Demographics | 93 |
| Risks to the Economic Outlook | 94 |
| External Outlook | 95 |
| United States | 95 |
| Canada | 98 |
| Asia | 100 |
| Europe | 101 |
| Financial Markets | 101 |
| Interest Rates | 101 |
| Exchange Rate | 103 |
| Tables: | |
| 3.1 British Columbia Economic Indicators | 84 |
| 3.2 U.S. Real GDP Forecast: Consensus versus B.C. Ministry of Finance | 97 |
| 3.3 Canadian Real GDP Forecast: Consensus versus B.C. Ministry of Finance | 99 |
| 3.4 Private Sector Canadian Interest Rate Forecasts | 103 |
| 3.5 Private Sector Exchange Rate Forecasts | 104 |
| 3.6.1 Gross Domestic Product (GDP): British Columbia | 105 |
| 3.6.2 Selected Nominal Income and Other Indicators: British Columbia | 106 |
| 3.6.3 Labour Market Indicators: British Columbia | 106 |
| 3.6.4 Major Economic Assumptions | 107 |
| Topic Box: | |
| The Economic Forecast Council, Budget 2023 | 108 |
| Budget and Fiscal Plan - 2023/24 to 2025/26
| | iii |
Table of Contents
| Part 4: 2022/23 Updated Financial Forecast (Third Quarterly Report) | |
| Introduction | 113 |
| Revenue | 115 |
| Expense | 116 |
| 2022/23 Supplementary Estimates | 116 |
| Contingencies | 119 |
| Government Employment (FTEs) | 119 |
| Provincial Capital Spending | 120 |
| Provincial Debt | 121 |
| Risks to the Fiscal Forecast | 122 |
| Supplementary Schedules | 123 |
| Tables: | |
| 4.1 2022/23 Forecast Update | 113 |
| 4.2 2022/23 Financial Forecast Changes | 114 |
| 4.3 2022/23 Supplementary Estimates | 116 |
| 4.4 2022/23 Capital Spending Update | 120 |
| 4.5 2022/23 Provincial Debt Update | 121 |
| 4.6 2022/23 Operating Statement | 123 |
| 4.7 2022/23 Expense by Ministry, Program and Agency | 124 |
| 4.8 2022/23 Revenue by Source | 125 |
| 4.9 2022/23 Expense by Function | 126 |
| 4.10 2022/23 Capital Spending | 127 |
| 4.11 2022/23 Provincial Debt | 128 |
| 4.12 2022/23 Statement of Financial Position | 129 |
| Appendix | 131 |
| iv | | Budget and Fiscal Plan - 2023/24 to 2025/26
|
 | February 28, 2023 |
As required by Section 7(1)(d) of the Budget Transparency and Accountability Act, I confirm that Budget 2023 contains the following elements:
| ● | Fiscal forecasts for 2023/24 to 2025/26 (provided in Part 1) and economic forecasts for 2023 to 2027 (provided in Part 3). |
| ● | A report on the advice received from the Economic Forecast Council (EFC) in December 2022 (updated in January 2023) on the economic growth outlook for British Columbia, including a range of forecasts for 2023 and 2024 (see Part 3, page 108). |
| ● | Material economic, demographic, fiscal, accounting policy, and other assumptions and risks underlying Budget 2023 economic and fiscal forecasts. In particular: |
| – | The near-term economic outlook for British Columbia is weaker, reflecting the combined effects of elevated price pressures and tighter monetary policy working their way through domestic and global economies. In recognition of downside risks, the economic projections assumed in Budget 2023 are prudent relative to the average of the forecasts provided by the Economic Forecast Council. |
| – | The economic forecast incorporates some fiscal policy measures announced in Budget 2023, and the full budget policy measures will be incorporated in the updated economic forecast in the First Quarterly Report. This practice reflects that budget policy measures are generally not finalized while the economic forecast is being developed. |
| – | The corporate income tax revenue forecast is based on projections for national corporate taxable income provided by the federal government. |
| – | Natural gas royalty forecasts continue to adopt a lower natural gas price forecast compared to the private sector average in order to maintain prudence against volatility. |
| – | The fiscal plan includes three-year financial projections for school districts, post-secondary institutions and health authorities, based on plans submitted by those entities to the Ministries of Education and Child Care, Post-Secondary Education and Future Skills, and Health, respectively, and for other service delivery agencies and commercial Crown corporations. |
| – | The fiscal plan includes a Contingencies vote totalling $5.5 billion in 2023/24, $4.8 billion in 2024/25, and $4.7 billion in 2025/26, with allocations for pandemic recovery funding, costs for agreements expected to be signed under the Shared Recovery Mandate, costs for climate and emergency response, funding for CleanBC, and a provision in 2025/26 for future initiatives and caseload pressures. The forecast allowance is $700 million in 2023/24, $500 million in 2024/25, and $500 million in 2025/26. Government's economic and fiscal prudence measures generally have resulted in government exceeding its budget targets. |
To the best of my knowledge, the three-year fiscal plan contained in Budget 2023 conforms to the standards and guidelines of generally accepted accounting principles for senior governments as outlined in Note 1 of the 2021/22 Public Accounts.
I would like to recognize staff in government ministries and agencies for their contribution to this document. I would especially like to acknowledge staff in the Ministry of Finance, whose professionalism, commitment and expertise were essential to the completion of this budget and fiscal plan.
| /s/ Heather Wood | |
| Heather Wood | |
| Deputy Minister and Secretary to Treasury Board |
Budget and Fiscal Plan - 2023/24 to 2025/26
This page
intentionally left blank.
SUMMARY | BUDGET AND FISCAL PLAN - 2023/24 to 2025/26
| Updated Forecast | Budget Estimate | Plan | Plan | |||||||||||||
| ($ millions) | 2022/23 | 2023/24 | 2024/25 | 2025/26 | ||||||||||||
| Revenue | 82,700 | 77,690 | 79,724 | 82,223 | ||||||||||||
| Expense | (74,393 | ) | (80,206 | ) | (82,978 | ) | (84,766 | ) | ||||||||
| Pandemic Recovery Contingencies | (2,000 | ) | (1,000 | ) | - | - | ||||||||||
| Supplementary Estimates | (2,715 | ) | - | - | - | |||||||||||
| Forecast allowance | - | (700 | ) | (500 | ) | (500 | ) | |||||||||
| Surplus (Deficit) | 3,592 | (4,216 | ) | (3,754 | ) | (3,043 | ) | |||||||||
| Capital spending: | ||||||||||||||||
| Taxpayer-supported capital spending | 8,117 | 11,813 | 12,634 | 13,098 | ||||||||||||
| Self-supported capital spending | 4,055 | 4,027 | 4,116 | 2,853 | ||||||||||||
| Total capital spending | 12,172 | 15,840 | 16,750 | 15,951 | ||||||||||||
| Provincial Debt: | ||||||||||||||||
| Taxpayer-supported debt | 63,701 | 75,617 | 88,436 | 99,395 | ||||||||||||
| Self-supported debt | 29,788 | 31,607 | 33,671 | 34,405 | ||||||||||||
| Total debt (including forecast allowance) | 93,489 | 107,924 | 122,607 | 134,300 | ||||||||||||
| Taxpayer-supported debt to GDP ratio | 16.4 | % | 18.9 | % | 21.3 | % | 23.0 | % | ||||||||
| Taxpayer-supported debt to revenue ratio | 78.7 | % | 100.1 | % | 114.8 | % | 124.9 | % | ||||||||
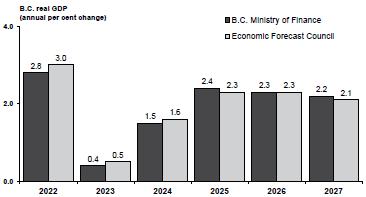
| Economic Forecast: | 2022 | 2023 | 2024 | 2025 | ||||||||||||
| Real GDP growth | 2.8 | % | 0.4 | % | 1.5 | % | 2.4 | % | ||||||||
| Nominal GDP growth | 11.0 | % | 2.8 | % | 3.7 | % | 4.2 | % | ||||||||
Building a Stronger BC Together
Government is focused on making smart investments today to build a stronger, more secure future for everyone who calls B.C. home. Budget 2023 invests $8.7 billion more in operating funding across the fiscal plan to support new priority measures. This includes funding to help with rising costs, build more affordable homes, strengthen health care and mental health care, and fight climate change, while training people for good-paying jobs in a cleaner economy. The budget also provides $7.6 billion over three years in ministry base funding for public-sector wage increases under the Shared Recovery Mandate for recently signed agreements. This historic investment provides fair and reasonable wage increases, including significant inflation protection to public servants, to support the ongoing delivery of essential services people rely on — such as public health care and K-12 education.
The Province continues to build prudence into its fiscal plan, including providing significant contingencies for emerging and unknown costs. This includes $1 billion in Pandemic Recovery Contingencies funding for 2023/24 to ensure the Province can continue to provide ongoing health responses and to help people, businesses and communities that are still recovering from the pandemic’s impacts. There is also $750 million in Contingencies over the next two years earmarked for climate and emergency response to support continued recovery efforts from recent climate emergencies, including the November 2021 floodings.
Improved Health and Mental Health Care
Improving health care for British Columbians remains a top priority for the Province.
Budget 2023 provides more than $6.4 billion over three years (including contingencies funding) to strengthen services across the health-care system. This includes targeted investments of $270 million for cancer care to enhance access to screening, early detection, and diagnostic and treatment services. Funding also includes more than $1 billion over three years to support the Province's new health workforce strategy that aims to recruit, retain and support more doctors, nurses, allied health and health science professionals into the system. There is also $1.1 billion allocated over the fiscal plan to support B.C.'s new payment model for family doctors, as announced in October 2022, as well as funding to support ongoing pandemic health response measures.
| Budget and Fiscal Plan - 2023/24 to 2025/26 | | 1 | |
Summary
The Province is also investing $867 million more across the fiscal plan to strengthen mental health, addictions and treatment services so people have care they can count on. This includes new investments across the full continuum of care from prevention, harm reduction, safe supply, withdrawl management to treatment and recovery.
Affordable and Attainable Housing
Government is taking action to tackle the housing crisis through its upcoming refreshed housing strategy. Budget 2023 will support this strategy by investing $4.2 billion in new operating and capital funding over three years to build and unlock more homes, provide more supports and protections for renters, and to help reduce homelessness. This includes new capital funding to support new transit-oriented development, more complex care housing and thousands of new units of student housing.
Helping British Columbians to Reduce Costs
To help British Columbians with rising costs, Budget 2023 will introduce new measures targeted to support people hardest hit, including those with lower incomes and families with children. The budget includes $1.3 billion over three years to help expand existing K-12 school food programs and provide more financial supports for students, people on income and disability assistance, and to support foster families and other caregivers. Funding will also provide free prescription contraception for all B.C. residents starting April 1, 2023. Government is also making permanent increases to the Climate Action Tax Credit and enhancements the BC Family Benefit to provide ongoing supports for families and individuals with low-to-middle incomes. Budget 2023 also introduces the income-tested Renter's Tax Credit, which will save renters up to $400 annually.
Safe and Healthy Communities for Everyone
To support the Safer Communities Action Plan, the Province will provide $462 million over three years to improve public safety and access to justice services. Funding will support more policing and enforcement services, expand Indigenous Justice Centres to 10 additional locations, and provide more resources for the B.C. Human Rights Tribunal and the Independent Investigations Office. There is also funding to support public safety initiatives, such as the modernization of the Police Act and to support the new decriminalization program.
Sustainable and Clean Economy
The Province remains committed to building a sustainable and clean economy that works for everyone. Through Budget 2023, government is investing nearly $1.4 billion in new operating and capital funding to support inclusive economic development and climate resiliency. This includes $480 million over three years to support the new job skills plan that provides a pathway for B.C. to have the most inclusive and talent-driven workforce in Canada, while addressing short and longer-term skills and labour gaps.
Funding will also support sustainable economic growth by helping to speed up natural resource permitting, develop a new critical minerals strategy and support more forest landscape planning tables. Central to this work is partnerships with Indigenous Peoples in alignment with government's commitment under the Declaration on the Rights of Indigenous Peoples Act. The budget includes $567 million in operating and capital funding over three years for climate resiliency, including funding to support active transportation, CleanBC initiatives and for emergency management programs. This includes building capacity across B.C. to support disaster risk assessment, preparedness and mitigation, and working collaboratively with local government and First Nations to make communities more resilient.
| 2 | | Budget and Fiscal Plan - 2023/24 to 2025/26 | |
Summary
Capital Investments
Budget 2023 makes significant capital commitments in the health, transportation, housing and education sectors. Taxpayer-supported infrastructure spending is forecast to be $37.5 billion, the highest level ever, over the three-year fiscal plan.
Capital spending of self-supported Crown corporations is expected to total $11.0 billion over three years, relating primarily to electrical generation, transmission and distribution projects.
Economic Outlook
B.C.’s economy has been resilient to pandemic, geopolitical, and climate-related disruptions. However, higher interest rates are expected to weigh on the economy in the near-term. Following a rapid recovery from the economic impacts of the COVID-19 pandemic, central banks raised interest rates sharply in 2022 in response to high inflation. Russia's invasion of Ukraine increased inflationary pressures and caused renewed supply disruptions, energy insecurity in Europe, and volatile commodity prices. In 2022, the impact of higher interest rates was evident in housing markets, with ongoing uncertainty over the impacts to other sectors of the economy. Still, B.C.'s labour market has shown continued strength. Despite a high degree of global uncertainty, B.C. has maintained a low unemployment rate and is relatively well positioned to face potential economic challenges.
It is estimated that the B.C. economy expanded by 2.8 per cent in 2022, following 6.1 per cent growth in 2021. Economic growth is forecast to slow to 0.4 per cent in 2023 before rising to 1.5 per cent in 2024. The slower near-term growth projection largely reflects the combined effects of elevated price pressures and tighter monetary policy working their way through the economy. In addition, economic weakness among B.C.'s major trading partners is expected to weigh on export demand. Over the medium-term (2025 to 2027), growth is expected to range between 2.2 per cent and 2.4 per cent annually.
Budget 2023 Economic Forecast
Debt Affordability
Due to a high operating surplus, the Province's taxpayer-supported debt at the end of 2022/23 is forecast to be $63.7 billion, which is almost $9.8 billion less than forecast in Budget 2022, and taxpayer-supported debt-to-GDP is 16.4 per cent this year, compared to 20 per cent forecasted in the last budget. The debt level is expected to increase over the fiscal plan to finance the operating and capital investment needs of the Province, with taxpayer-supported debt forecast to reach $99.4 billion by 2025/26, and the debt-to-GDP ratio rising to 23 per cent.
Debt to GDP

Despite higher interest rates, B.C.'s debt-servicing costs remain at low levels, both historically and compared to other jurisdictions. A common metric of financing affordability is the "interest bite," representing the taxpayer-supported interest costs as a percentage of provincial government revenue, which is at 2.4 cents per dollar in 2022/23.
| Budget and Fiscal Plan - 2023/24 to 2025/26 | | 3 | |
Summary
Risks to the Fiscal Plan
The main risks to the government's fiscal plan include:
| ● | The degree to which elevated inflation and restrictive monetary policy affect economic activity, government revenues, program costs, and borrowing costs; |
| ● | The emergence of new COVID-19 variants of concern and ongoing geopolitical conflict, which contribute to the potential volatility in the economic and fiscal outlooks; |
| ● | Increased costs and demands for government services, such as health care, social assistance programs, COVID-19 response measures or recovery from climate-related disasters; and |
| ● | Changes in timing of capital projects and related spending, which may be influenced by several factors, such as market conditions and weather. |
To mitigate the risks to the fiscal plan, government has the following levels of prudence in its projections:
| ● | Forecast allowance of $700 million in 2023/24 and $500 million in 2024/25 and $500 million in 2025/26; |
| ● | Contingencies of $2.3 billion in 2023/24, $2.2 billion in 2024/25, and $1.2 billion in 2025/26, which include allocations for CleanBC, Climate and Emergency Response, and general programs; |
| ● | Pandemic Recovery Contingencies of $1.0 billion in 2023/24; |
| ● | Contingencies for the costs of the Shared Recovery Mandate of $2.2 billion in 2023/24, $2.6 billion in 2024/25, and $2.7 billion in 2025/26, as well as an additional $800 million allocated in 2025/26 for future cost pressures; and |
| ● | A forecast for B.C.'s real GDP growth that is lower than the outlook provided by the Economic Forecast Council (0.1 percentage points lower in 2023 and 2024). |
Conclusion
Budget 2023 makes smart investments to tackle today's biggest challenges and help build a stronger and more secure future for B.C. This includes record new investments in health, housing, and cost-of-living measures, as well as fighting climate change and building an economy for everyone. The Province will continue to work with people, businesses, communities, and Indigenous Peoples to address challenges and work on the things that matter most.
| 4 | | Budget and Fiscal Plan - 2023/24 to 2025/26 | |
| PART 1 | THREE YEAR FISCAL PLAN |
| Table 1.1 Three Year Fiscal Plan | ||||||||||||||||
| ($ millions) | Updated Forecast 2022/23 | Budget Estimate 2023/24 | Plan 2024/25 | Plan 2025/26 | ||||||||||||
| Revenue | 82,700 | 77,690 | 79,724 | 82,223 | ||||||||||||
| Expense | (74,393 | ) | (80,206 | ) | (82,978 | ) | (84,766 | ) | ||||||||
| Pandemic Recovery Contingencies | (2,000 | ) | (1,000 | ) | - | - | ||||||||||
| Supplementary Estimates | (2,715 | ) | - | - | - | |||||||||||
| Forecast allowance | - | (700 | ) | (500 | ) | (500 | ) | |||||||||
| Surplus (Deficit) | 3,592 | (4,216 | ) | (3,754 | ) | (3,043 | ) | |||||||||
| Capital spending: | ||||||||||||||||
| Taxpayer-supported capital spending | 8,117 | 11,813 | 12,634 | 13,098 | ||||||||||||
| Self-supported capital spending | 4,055 | 4,027 | 4,116 | 2,853 | ||||||||||||
| Total capital spending | 12,172 | 15,840 | 16,750 | 15,951 | ||||||||||||
| Provincial Debt: | ||||||||||||||||
| Taxpayer-supported debt | 63,701 | 75,617 | 88,436 | 99,395 | ||||||||||||
| Self-supported debt | 29,788 | 31,607 | 33,671 | 34,405 | ||||||||||||
| Total debt (including forecast allowance) | 93,489 | 107,924 | 122,607 | 134,300 | ||||||||||||
| Taxpayer-supported debt to GDP ratio | 16.4 | % | 18.9 | % | 21.3 | % | 23.0 | % | ||||||||
| Taxpayer-supported debt to revenue ratio | 78.7 | % | 100.1 | % | 114.8 | % | 124.9 | % | ||||||||
Introduction
Budget 2023 builds on historic investments made since 2017 to help build a stronger, more secure B.C. for everyone. Projected deficits decline over the fiscal plan period from $4.2 billion in 2023/24 to $3.0 billion in 2025/26, and taxpayer-supported debt-to-GDP ratios are below 25 per cent in each year of the fiscal plan. By making smart investments to tackle today’s biggest challenges — including health care, housing, reducing costs and a clean economy — government continues to help British Columbians and communities create a brighter future.
Government’s consolidated operating expense totals $81.2 billion in 2023/24, $83.0 billion in 2024/25, and $84.8 billion in 2025/26. Budget 2023 provides almost $16.3 billion over the fiscal plan period in operating budget increases to ministries, including funding for programs and the wage mandate. There is a $1.0 billion time-limited allocation in Pandemic Recovery Contingencies in 2023/24, and $14.0 billion in contingencies funding over the next three years for Climate and Emergency Response, CleanBC, wage increases under the Shared Recovery Mandate, and other spending uncertainties for new and existing programs. The revenue forecast rises from $77.7 billion in 2023/24 to $82.2 billion in 2025/26, with a modest growth projection reflecting the economic forecast and natural-resource activity projections. The higher revenue forecast for 2022/23 includes the effects of one-time, prior-year adjustments that do not carry forward.
| Budget and Fiscal Plan - 2023/24 to 2025/26 | | 5 | |
Three Year Fiscal Plan
Capital spending on schools, post-secondary facilities, housing, health-care facilities, highways, bridges, and other taxpayer-supported infrastructure, is expected to reach a record $37.5 billion over the three-year fiscal plan period. These investments will support future growth while contributing to a clean and inclusive economy.
The new operating funding initiatives are discussed in the expense section starting on page 7. Details on the Province's revenue forecasts are provided in the revenue section, starting on page 36. The capital investments section begins on page 43. This is followed by the debt section on page 64 and a discussion on the risks to the fiscal plan on page 67.
Government remains committed to incorporating Gender Based Analysis (GBA+) into its policy and budget processes. Since 2018, the Province has used GBA+ to ensure that comprehensive, evidence-based policy advice is provided to decision makers to achieve better results for all British Columbians. Budget 2023 uses GBA+ analysis to monitor economic trends and inform all spending and tax decisions. This analytical tool helps to assess the effect of different spending or tax measures on different groups, including people of different genders, incomes, ethnicities, geographic locations, ages, abilities, or sexual orientations.
The use of the GBA+ lens informed many Budget 2023 priorities that support the Province's commitment to diversity, inclusion and equity. This includes new investments that prioritize culturally safe services in health, justice and housing, as well as reducing barriers for women, trans and non-binary people by providing free prescription contraception. The budget also makes significant investments to provide more opportunities for lower-income individuals and families — from targeted training opportunities, to new cost-of-living measures. These are just a few examples that show how the GBA+ lens has supported government decision making to ensure services and opportunities are representative of the diverse population of British Columbia. Benefits for people are outlined in more detail throughout the expense and tax sections of the document.
Government remains committed to meaningful reconciliation with Indigenous Peoples, as enshrined in the Declaration on the Rights of Indigenous Peoples Act. On March 30, 2022, the Declaration Act Action Plan was released, which includes collectively identified goals and outcomes that support the long-term vision for implementing the UN Declaration on the Rights of Indigenous Peoples in B.C. New Budget 2023 investments support the goals and priority actions as identified in the Declaration Act Action Plan, including goals to end Indigenous-specific racism and discrimination and prioritizing the social, cultural and economic well-being of Indigenous people in B.C. Further information on how initiatives are being developed or enhanced in alignment with the Declaration Act and to advance supports and opportunities for Indigenous people are discussed throughout this document.
| 6 | | Budget and Fiscal Plan - 2023/24 to 2025/26 | |
Three Year Fiscal Plan
Expense
Consolidated Revenue Fund Spending
Consolidated Revenue Fund (core government) planned spending over the fiscal plan period is $70.1 billion in 2023/24, $73.0 billion in 2024/25, and $74.9 billion in 2025/26 as shown in Table 1.3 on page 34. This includes incremental ministry budget increases of $4.7 billion in 2023/24, $5.4 billion in 2024/25, and $6.2 billion in 2025/26, totaling $16.3 billion across the three-year fiscal plan. These budget increases include funding for signed agreements under the Shared Recovery Mandate —see Table 1.2.6 on page 26 for details.
Government remains committed to investing in ways that make life better for people in B.C., improve the services people rely on, and ensure a sustainable province for future generations. Funding decisions are underpinned by government's commitment to tangible reconciliation through the implementation of the UN Declaration on the Rights of Indigenous Peoples by prioritizing opportunities for Indigenous Peoples to be full partners in the inclusive and sustainable province we are building together.
Improved Health and Mental Health Care
Improving health and mental health care for British Columbians remains a top priority for the Province. Budget 2023 provides $6.4 billion over three years in new investments to strengthen the public health care system. This includes:
| · | $2.6 billion over three years to support services across the health care system, including $270 million more for cancer care; |
| · | $1 billion over three years for the new health workforce strategy that includes actions focused on retention, redesign, recruitment and training; |
| · | Nearly $1.1 billion over three years for the refreshed primary care strategy that provides a new compensation model for family practitioners and incentives to attract recent graduates into family practice, and to retain those approaching retirement; |
| · | $867 million for mental health, addictions and treatment services across the spectrum of services and supports for people struggling with substance use disorder; and |
| · | $875 million in 2023/24 for ongoing COVID-19 health response measures. |
Table 1.2.1 Investing in Health and Mental Health Care |
| ($ millions) | 2023/24 | 2024/25 | 2025/26 | Total | |||||||||
| Health services | 556 | 611 | 1,440 | 2,607 | |||||||||
| Health workforce strategy | 273 | 350 | 373 | 995 | |||||||||
| New primary care compensation model* | 399 | 388 | 264 | 1,051 | |||||||||
| Mental health, addictions and treatment services* | 199 | 297 | 371 | 867 | |||||||||
| Ongoing health response to COVID-19* | 875 | - | - | 875 | |||||||||
| Total | 2,301 | 1,645 | 2,447 | 6,394 | |||||||||
Note: Table may not sum due to rounding.
*Includes allocations funded from the Contingencies Vote.
Budget and Fiscal Plan - 2023/24 to 2025/26
| | 7 |
Three Year Fiscal Plan
Health services including cancer care
The government is committing $2.6 billion more over three years across the health system to support the growing demand for health services in B.C., which includes caring for a growing and aging population and to address inflationary costs on supplies and equipment. This includes the range of health services delivered under the Medical Services Plan, PharmaCare, and in hospitals and cancer centres, surgical care, and in urgent and primary care clinics.
Funding also includes $270 million more for cancer care to enhance access to screening and early detection and expand access to diagnostic imaging and treatments like radiation therapy. New investments will also provide more supports to oncologists through the implementation of team-based care and a boost to compensation to promote recruitment and retention.
Health workforce strategy
Budget 2023 also provides targeted investments of $1 billion over three years to support the Province's health workforce strategy as announced in September 2022. The strategy will support patients who rely on the public health care system by improving workforce retention and optimizing the system to help with workload. It will add more doctors, nurses, allied health and health sciences professionals, and new education and training seats, while streamlining entry for professionals educated outside of Canada.
The strategy has four key focus areas:
| · | Retain: Foster healthy, safe and inspired workplaces, supporting workforce health and wellness, embedding reconciliation, diversity, inclusion and cultural safety and better supporting and retaining workers in high-need areas, building clinical leadership capacity and increasing engagement. |
| · | Redesign: Balance workloads and staffing levels to optimize quality of care by optimizing scope of practice, expanding and enhancing team-based care, redesigning workflows and adopting enabling technologies. |
| · | Recruit: Attract and onboard thousands of workers by reducing barriers for international health-care professionals, and promoting health-care careers to young people. |
| · | Train: Strengthening employer-supported training models, enhancing earn and learn programs to support staff to advance their skills and qualifications, expanding the use of bursaries, and expanding education seats for new and existing employees. |
Over the next three years, new funding will create new training programs and nearly 3,000 new post-secondary training seats, provide nearly 12,000 bursaries and more than 9,000 other training grants. It will also create over 1,700 new health-care positions and provide targeted financial incentives for health-care staff to address critical staffing needs. Funding is also anticipated to address workplace violence in the health care sector, promote diversity and inclusion, and address discrimination against Indigenous people —including boosting recruitment and retention of Indigenous health-care employees.
| 8 | | Budget and Fiscal Plan - 2023/24 to 2025/26
|
Three Year Fiscal Plan
More supports for family doctors
To support the health system and workforce strategy, government is providing nearly $1.1 billion over three years to implement B.C.'s new payment model for family doctors to help protect, support and strengthen B.C.'s primary health-care system and patient care. Full-service family doctors are those who work in communities to provide ongoing primary care services to their patients. The new payment model, which was announced in October 2022 and co-developed by Doctors of BC, BC Family Doctors and the Province, is available to family doctors beginning February 2023, and provides an alternative to the current fee-for-service model. The new model takes into account factors including:
| · | the time a doctor spends with a patient; |
| · | the number of patients a doctor sees in a day; |
| · | the number of patients a doctor supports through their office; |
| · | the complexity of the issues a patient is facing; and |
| · | administrative costs currently paid directly by family doctors. |
This provides a more equitable payment for the work of family doctors and better recognizes their value in providing full-service primary care to patients. It will help maintain their business autonomy and give them more flexibility to create the kind of practice that works best for them and their patients.
The Province and Doctors of BC have also reached a new physician master agreement (PMA), which includes several commitments that will better support doctors as they care for their patients. The new three-year tentative PMA drives continued collaboration by the Ministry of Health, physicians, Doctors of BC, and regional health authorities to achieve key priorities that improve health care, including gender equity, Indigenous reconciliation and workplace safety.
Mental health, addictions and treatment services
Government continues to provide significant new investments to support mental health, addictions and treatment services with $867 million in new funding over the fiscal plan. These new investments bring total spending on mental health and addictions to $2 billion over the next three years.
Treatment and Recovery Services
Budget 2023 invests $586 million across the spectrum of services and supports for people struggling with substance use disorder. This will focus on expansion of treatment and recovery beds, the development of new recovery communities to support the long-term recovery of those who have gone through treatment, Indigenous treatment centres, and wraparound services for youth.
Government will also develop and roll out a new model of seamless care to support people through their entire recovery journey from detox to treatment to aftercare. This initiative will begin with new investments in Road to Recovery in partnership with Vancouver Coastal Health and Providence Health with the goal of expanding to other regions.
The Province will also expand on the Red Fish Healing Centre model of care to other regions of the province so that more people can receive care for complex mental health and substance use issues closer to home.
Budget and Fiscal Plan - 2023/24 to 2025/26
| | 9 |
Three Year Fiscal Plan
Responding to the Toxic Drug Crisis
Acting on the unanimous recommendations of the Select Standing Committee on Health, government continues to take action to accelerate B.C.'s response to the illicit drug toxicity crisis. Budget 2023 provides $184 million more over three years to support safer substance use for those living with mental health and addictions. This includes providing safe prescription alternatives, like diacetylmorphine, to help reduce the harmful effects of the toxic drug supply and to connect people with supports and treatment. Funding also supports services for children, youth, and young adults, focusing on prevention and early intervention. New integrated community crisis response teams include an expansion of mobile response programs (also known as Car Programs) that combine police and health workers, and Peer Assisted Care Teams (PACT), which are civilian-led. Planning is also underway for Indigenous-led PACT teams. Together these response teams will help ensure people in crisis are met early on by health-care workers and community members.
Complex Care Supports
Government also continues to invest in complex care housing, which provides enhanced health, mental health and substance use services to support people with complex mental health and substance use issues, including those who are homeless or whose needs are not met by existing supportive housing. Complex care housing provides permanent housing with ongoing services. Budget 2023 provides $97 million in operating funding to support health-focused services and resources at complex care sites. The Province is also providing $169 million in capital funds (which is included in Table 1.2.2 under Building BC and BC Housing Programs) over the fiscal plan to deliver more units of complex care housing.
Ongoing COVID-19 Health Response
To support the ongoing management and health response to COVID-19, Budget 2023 provides $875 million in 2023/24 from the Pandemic Recovery Contingencies for the Ministry of Health. This includes funding for ongoing COVID-19 and influenza vaccination programs, the provision of personal protective equipment for health-care workers, COVID-19 testing and other preventative measures, including screening staff that work with vulnerable health care residents. Initiatives will continue to ensure that people living in rural, remote and Indigenous communities in B.C. have access to critical health care through medical transportation options, access to virtual care, and increased mental health supports for Indigenous and non-Indigenous communities.
As the funding for pandemic contingencies are set to wind down by the end of 2023/24, it is anticipated that the Ministry of Health will wind down or integrate any services into ministry operations, as appropriate, to support the ongoing health and well-being of British Columbians.
Overall Health and Mental Health Investments
As shown in Chart 1.1.1, government's annual investments since 2017 have increased health and mental health care funding by over $10 billion. This includes funding for new initiatives as well as wage increases related to the Shared Recovery Mandate in the health sector, which is described further on page 26.
Budget 2023 also provides $11.2 billion in new health capital investments over the next three years. Health capital spending is discussed further on page 48 of this document.
| 10 | | Budget and Fiscal Plan - 2023/24 to 2025/26
|
Three Year Fiscal Plan
Chart 1.1.1 Investing In Health and Mental Health Care*
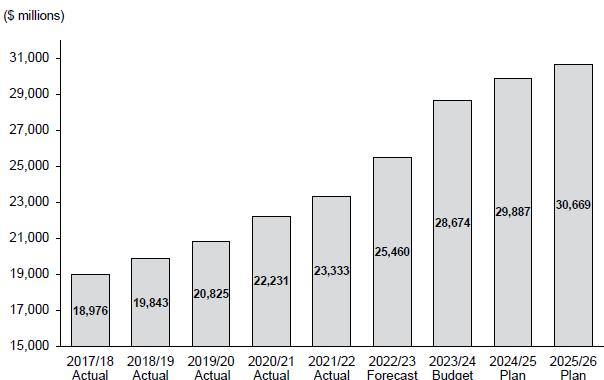
*Chart represents operating funding for the Ministry of Health. It does not include one-time funding, such as time-limited initiatives funded through the Pandemic Recovery Contingencies Vote or Supplementary Estimates.
Affordable and Attainable Housing
As part of Budget 2018, government released its affordable housing strategy, Homes for B.C.: A 30 Point Plan for Housing Affordability in British Columbia. Since the strategy's release in 2018, government has committed $7 billion in capital and operating funding as well as a $2 billion dedicated borrowing facility to support thousands of new affordable homes over 10 years. The strategy includes a range of measures to help moderate the housing market, crack down on tax fraud and close loopholes, build the homes people need, provide security for renters and landlords, and support partners to build and preserve affordable housing.
The Province continues to take action on affordable and attainable housing by investing an additional $4.2 billion over three years as part of Budget 2023. This includes $2.2 billion in operating funding, and $2 billion in capital funding as outlined in Table 1.2.2. In addition to these investments, government is increasing BC Housing's debt facility by $839 million (bringing the total debt facility to over $3.6 billion) to support housing programming. Through Budget 2023, the Province is also introducing a new income-tested Renter's Tax Credit, described further on page 74. Together, these investments will help support several actions in a refreshed housing strategy, set to be released by the Province in spring 2023. Key investments that will support this strategy are highlighted in the following section.
Budget and Fiscal Plan - 2023/24 to 2025/26
| | 11 |
Three Year Fiscal Plan
Table 1.2.2 Investing in Affordable and Attainable Housing
| ($ millions) | 2023/24 | 2024/25 | 2025/26 | Total | ||||||||
| New Operating Investments | ||||||||||||
| More homes through Building BC* | 396 | 346 | 277 | 1,019 | ||||||||
| Unlocking more homes and supporting people | 119 | 160 | 101 | 380 | ||||||||
| Supports to reduce homelessness** | 229 | 284 | 310 | 823 | ||||||||
| Sub-total | 744 | 790 | 688 | 2,222 | ||||||||
| New Capital Investments | ||||||||||||
| Building BC and BC Housing Programs | 54 | 73 | 141 | 268 | ||||||||
| Student housing beds | 45 | 192 | 338 | 575 | ||||||||
| Supports to reduce homelessness | 155 | 282 | 295 | 732 | ||||||||
| Transit-oriented development | 83 | 133 | 178 | 394 | ||||||||
| Sub-total | 337 | 680 | 952 | 1,969 | ||||||||
| Total | 1,081 | 1,470 | 1,640 | 4,191 | ||||||||
Table may not sum due to rounding;
*Includes capital grants for non-profit partners through the Housing Priority Initiatives Special Account.
**Includes allocations funded from the Contingencies Vote.
More Homes for British Columbians
The Province is providing $1.7 billion in operating and capital funding over three years to support building thousands of new homes for British Columbians through Building BC and BC Housing programs as well as transit-oriented development. This includes targeted new investments for the Community Housing Fund and funding to help double the number of units created through the Indigenous Housing Fund. It also includes $394 million in new capital funding to acquire lands for future affordable and market housing development projects along main transit corridors.
Government is also committing $575 million over 3 years (or $1.1 billion over 10 years) to enable post-secondary institutions to create thousands more student housing spaces in high demand areas throughout B.C.
Funding also includes $66 million in annual operating funding to support new housing developed through the Rapid Housing Initiative. This federal-provincial cost-shared program was launched in 2020 to help address urgent housing needs of vulnerable Canadians, through the rapid construction of affordable housing.
Through Budget 2023, the Province is also introducing a new property transfer tax incentive to encourage the construction of new purpose-built rentals. This builds on the revitalization property tax exemption provided in Budget 2018 as part of Government's 30-point housing plan.
Unlocking More Homes and Supporting People
In addition to investments to build and unlock new rental homes, Budget 2023 provides further new supports and protections for renters. This includes a new Renter's Tax Credit estimated to save low-and-moderate income renters in B.C. up to $400 a year. Budget 2023 also provides $230 million in operating and capital funding over the next 10 years to help revitalize and expand BC Housing's aging rental stock. This will improve and preserve existing aging rentals units for low-income households while adding thousands of new, more affordable purpose-built rental units. This funding is in addition to the new $500 million Rental Protection Fund (announced in January 2023) that will provide one-time capital grants to non-profit housing organizations to purchase affordable residential rental buildings and ownership co-operatives listed for sale to safeguard those rental units for the longer term.
| 12 | | Budget and Fiscal Plan - 2023/24 to 2025/26
|
Three Year Fiscal Plan
Renters will also benefit from over $7 million to support the BC Rent Bank that helps provide renters with financial support to prevent eviction and homelessness, and up to $15.6 million over three years for the Residential Tenancy Branch to strengthen service delivery and support timely resolution of landlord/tenant disputes.
Budget 2023 provides up to $11 million over the fiscal plan to support implementing legislation, including the new Housing Supply Act, passed in November 2022, which allows the Province to set housing targets for communities. Another $57 million over the fiscal plan will help to unlock more homes through new residential zoning measures and by reducing the time and cost associated with local government approval processes.
Government is also providing up to $91 million over three years toward a new pilot project that will provide financing incentives to encourage homeowners to develop new secondary suites on the property of their principal residence to rent to long-term renters. The pilot is anticipated to facilitate thousands of more housing opportunities across British Columbia.
Supports to Reduce Homelessness
Government continues to take new actions to respond to and reduce homelessness, including strategies to prioritize cultural safety, Indigenous and community partnerships, and the inclusion of people with diverse identities and needs. Budget 2023 provides over $1.5 billion in operating and capital funding over three years to further this work. These actions build on the Province's Rapid Response to Homelessness program launched in 2017 and significant new investments of $633 million through Budget 2022 to deliver thousands of supportive housing units along with integrated health, social, cultural, community and housing stability supports for people.
Budget 2023 provides $228 million over three years to establish new regional multi-disciplinary teams to support rapid response for regions responding to substantive encampments. There is also $44 million to help people who are living in encampments to access temporary modular housing. Funding will also help to provide more on-site supports at encampments, including enhancing fire prevention and safety, site management, sanitation, non-profit service-provider support, capacity and training, peer workers and to acquire rapid deployment housing.
The Province will also provide additional funding to increase support for existing housing programs. This includes up to $440 million over three years in operating and capital funding for the Supportive Housing Fund to deliver more supportive homes. There is also $109 million more over the fiscal plan for other BC Housing programs that provide other shelter and low-income assistance programs, such as emergency shelters, rental assistance and shelter aid programs for seniors, and transition houses. There is also up to $182 million in operating and capital funding over three years to provide ongoing supports for those housed in temporary leased spaces as part of government's pandemic response, including finding more permanent housing solutions.
Budget and Fiscal Plan - 2023/24 to 2025/26
| | 13 |
Three Year Fiscal Plan
As noted earlier, the Province will also provide $169 million in capital funds over the fiscal plan to create additional complex care housing units. This funding is augmented by $97 million in health-related resources (included in funding amounts in Table 1.2.1) provided at complex care sites.
Chart 1.1.2 shows the growth in operating funding for housing since 2017.
Chart 1.1.2 Investing in Housing*

* Chart represents operating funding for housing initiatives. It does not include time-limited funding through the Pandemic Recovery Contingencies.
Helping British Columbians to Reduce Costs
With global inflation continuing to drive costs up, government remains focused on reducing the burden for families and individuals struggling with the cost of living. Since the summer of 2022, government has been delivering temporary cost-of-living supports that include ICBC rebates, BC Hydro bill credits, support with back-to-school expenses for K-12 families and capping rent increases below inflation at 2 per cent for 2023. The Province has also provided temporary increases to the Climate Action Tax Credit in October 2022, the Affordability Credit in January and April 2023, and increases to the BC Family Benefit from January to March 2023. These temporary measures provide targeted financial supports to families and individuals with low to middle incomes.
Budget 2023 builds on these measures by making new permanent investments that will help make life more affordable for British Columbians. This includes over $1.3 billion in new spending measures to support students, foster families and those on income and disability assistance, as well as introducing universal access to free prescription contraception in B.C. In addition to these measures, there is an estimated $3.2 billion for new and enhanced tax credits over the fiscal plan including increases to the Climate Action Tax Credit and BC Family Benefit, and for the new income-tested Renter's Tax Credit. Together, these measures will help to reduce costs for those most in need.
| 14 | | Budget and Fiscal Plan - 2023/24 to 2025/26
|
Three Year Fiscal Plan
Spending measures are discussed in more details below; more information on the tax credits are outlined in Part 2, starting on page 71.
Table 1.2.3 New Measures to Reduce Costs
| ($ millions) | 2023/24 | 2024/25 | 2025/26 | Total | |||||||||
| New Spending Measures | |||||||||||||
| K-12 school food programs | 59 | 78 | 77 | 214 | |||||||||
| Free prescription contraception | 39 | 46 | 33 | 119 | |||||||||
| Increased supports for income and disability assistance clients | 147 | 205 | 207 | 558 | |||||||||
| Student financial aid allowance increases1 | 36 | 57 | 59 | 151 | |||||||||
| Increased financial supports for foster families | 88 | 88 | 88 | 264 | |||||||||
| Sub-total | 368 | 473 | 464 | 1,306 | |||||||||
| Tax Measures | |||||||||||||
| Climate Action Tax Credit enhancements (starting July 2023)2 | 412 | 687 | 978 | 2,077 | |||||||||
| Renter’s Tax Credit | 307 | 313 | 319 | 939 | |||||||||
| BC Family Benefit enhancements | 58 | 77 | 80 | 215 | |||||||||
| Sub-total | 777 | 1,077 | 1,377 | 3,231 | |||||||||
| Total | 1,145 | 1,550 | 1,841 | 4,537 |
Table may not sum due to rounding.
| 1 | Includes allocations funded from the Contingencies Vote. |
| 2 | Figures include tax measures tabled with this budget (see table 2.1) and assume that increased Carbon Tax revenues after 2023/24 will also be redispersed through increased Climate Action Tax Credit. |
K-12 school food programs
It is estimated that 17 per cent of B.C. families with children under 18 experience food insecurity. To support K-12 students and their families with accessing healthy foods at school, government is expanding its existing school food programs. This will ensure that school age children in the K-12 school system have consistent and reliable access to local, nutritious, and culturally preferred foods in all school districts. New investments will help reduce food insecurity and provide supports that enable student success through reduced absenteeism and improved health and academic outcomes.
Budget 2023 provides $214 million over three years to expand existing food programs. The program will work with Feed BC to supply healthy options to schools using locally produced and/or processed food. Feed BC supports jobs and businesses for local farmers, fishers, ranchers and food processors across B.C. to strengthen the provincial food supply and food system resilience. Together these programs will support educational success for students and economic development in all regions of the province.
Free prescription contraception
Through Budget 2023, government delivers on its commitment to make prescription contraception free for all B.C. residents. Free contraception ensures the cost of these prescriptions for women, trans and non-binary people are not a barrier to an individual's informed choices about their own sexual and reproductive health. This commitment aligns with key government priorities to deliver better health-care services and make life more affordable for everyone. It supports a range of population health benefits such as improving reproductive autonomy, decreasing health and other risks from unplanned pregnancies and births, improving management of chronic gynecologic conditions like endometriosis, and increasing accessibility of gender-affirming care.
| Budget and Fiscal Plan - 2023/24 to 2025/26
| | 15 |
Three Year Fiscal Plan
The budget provides $119 million over three years for the program starting April 1, 2023, which will fully cover prescription contraception products, copper IUDs and Plan B®. This will make British Columbia the first jurisdiction in Canada to provide free prescription contraception to its residents. To support access, government is also working with the College of Pharmacists of BC on regulations that will expand the ability of pharmacists to prescribe medications, including contraception, by spring 2023.
Increased supports for income and disability assistance clients
Poverty reduction continues to be a key government priority, with significant investments to help lift families and children out of poverty. Government has increased the income and disability rate by $100 a month in September 2017, $50 a month in April 2019, and $175 per month in April 2021 for income and disability assistance clients.
Budget 2023 continues this trend by providing $558 million more over three years to increase supports to income and disability assistance clients. This includes increasing the shelter rate (a component of the income and disability assistance rate) by $125 per month, which is anticipated to benefit approximately 161,000 individuals, including 33,000 children. This represents a 33 per cent increase to the maximum shelter rate for a single person, and is the first time that the shelter rate has been increased since 2007.
Income and disability assistance clients will also benefit from increases to supplements, which provide additional supports to clients who face an emergency need, have specific health needs, or to address other additional costs. This includes general food and clothing needs, specific diet-related supplements like natal supplements and baby formula, and event-driven needs, such as medical transportation, school start-up, and Christmas supplements.
Clients will also see an increase in their earnings exemption by $100 per month for an individual on income assistance and $1,200 per year for an individual on disability assistance. This means people on income and disability assistance can keep more of the money they earn from wages without having their assistance payments reduced. Increasing the earnings exemptions creates more opportunities to offer people a chance to increase their household income, remain connected to the workforce, and build valuable work experience that can lead to a good-paying, long-term job. This builds on previous earning exemption increases in Budget 2017 Update and Budget 2020, and is anticipated to immediately benefit more than 10,000 clients who are currently exceeding their earnings exemption limits.
In addition to increasing the shelter rate for the first time since 2007, Budget 2023 continues to support vulnerable British Columbians by providing $388 million more over the fiscal plan to support the anticipated growth in demand for income and disability assistance, as well as supporting clients served by Community Living BC.
Student financial aid allowance increases
Budget 2023 improves access to post-secondary education by doubling student loan maximums from $110 to $220 per week for individuals and from $140 to $280 per week for students with dependents, the first increase since 2006, targeted for implementation in June 2023. Government will also change student loan repayment terms to align with the federal government's Repayment Assistance Program, increasing the income level from $25,000 to $40,000 under which a student does not have to repay their loan, and also lowering the affordable payment amount from 20 per cent of annual family income to 10 per cent, both coming into effect August 1, 2023. These changes will make it easier for British Columbians to pursue education opportunities that were out of reach due to financial challenges and support the Province's Future Ready Plan. This builds on recent changes as part of Budget 2019 to make student loans interest free. Costs related to this initiative are estimated at $151 million over the fiscal plan period with expected increased loan uptake.
| 16 | | Budget and Fiscal Plan - 2023/24 to 2025/26
|
Three Year Fiscal Plan
Increased financial supports for foster families and relief and respite rates
Government is investing $264 million over the next three years to increase financial supports for foster and extended family caregivers and for those caring for children, youth, and adults with support needs. This includes increases to care provider rates by up to 47 per cent to address cost-of-living increases, including recognizing the costs of housing and internet access; it also provides funding to increase service and relief rates accordingly. This support recognizes the important role that foster and extended family care providers play in nurturing children in their care, and ensuring the Province can continue to recruit and retain these families across B.C. to give children continuity of care close to their home communities.
Respite supports are equally critical to families and caregivers. This funding will also increase the annual respite rates by over 34 per cent for those caring for people with support needs. This includes families of children and youth with supports needs and of adults living with developmental disabilities served through Community Living BC.
Safe and Healthy Communities for Everyone
As part of government's Safer Communities Action Plan, B.C. is implementing new programs to address repeat violent offending, strengthen intervention services, and make sure people have the support and treatment they need. The Safer Communities Action Plan lays out concrete steps at the provincial level to make communities safer under two tracks: enforcement and intervention services. Each initiative is structured to improve coordination between law enforcement, community service organizations, the justice system, health providers and people who are recovering from addiction and mental-health crises in a collaborative, coordinated approach to address the issues people are seeing in their communities.
Budget 2023 provides $462 million over three years toward public safety initiatives to help build safe and healthy communities for everyone. This includes actions to increase policing, enforcement and public safety, and improve access to justice that are detailed further below. Safe and healthy communities are also supported by new health and mental health investments, including treatment services, safe supply, complex care housing and new integrated community response teams, described further starting on page 9.
| Budget and Fiscal Plan - 2023/24 to 2025/26 | | 17 |
Three Year Fiscal Plan
Table 1.2.4 New Investments for Safe and Healthy Communities*
| ($ millions) | 2023/24 | 2024/25 | 2025/26 | Total | |||||||||||||
| Policing, including specialized, rural police services | 55 | 80 | 96 | 230 | |||||||||||||
| Corrections and enforcement programs | 33 | 33 | 21 | 87 | |||||||||||||
| Police modernization | 8 | 9 | 9 | 25 | |||||||||||||
| Cannabis licensing | 7 | 7 | 7 | 21 | |||||||||||||
| Implementing decriminalization | 7 | 6 | 6 | 19 | |||||||||||||
| Indigenous Justice Centres expansion | 16 | 15 | 13 | 44 | |||||||||||||
| BC Human Rights Tribunal | 5 | 5 | 5 | 14 | |||||||||||||
| Independent Investigations Office | 2 | 2 | 2 | 6 | |||||||||||||
| Virtual and after-hours bail | 5 | 6 | 6 | 16 | |||||||||||||
| Total | 137 | 162 | 164 | 462 |
Tables may not sum due to rounding.
*Table includes allocations funded from the Contingencies Vote.
Policing, enforcement and public safety
As part of Budget 2023, the Province will provide $230 million over three years to enhance investments in provincial police services that will sustain and strengthen enforcement and crime prevention capacity throughout British Columbia. This funding will support more effective levels of policing and law enforcement, particularly in rural, remote and Indigenous communities. Provincial police services cover a wide variety of specialized teams that support safe protest and injunctions, as well as teams to investigate and prevent complex, violent and organized crimes. It is anticipated that funding will help recruit up to 256 more RCMP members to British Columbia. This will enable more supports for police to focus on violent crimes and other pressing public safety issues, as well as initiatives under the Safer Communities Action Plan.
The Province is also providing $87 million over three years to support B.C. Corrections core operations and to fund two new enforcement programs: a program to address repeat violent offending and the Special Investigation & Targeted Enforcement (SITE) Program. Together, the programs will help to provide co-ordinated response teams made up of police, and dedicated prosecutors and probation officers, to respond to public safety concerns related to repeat, violent offenders in B.C. communities. The programs aim to reduce crime rates attributable to repeat offending, improve criminal justice response and information sharing amongst justice partners, and provide better outcomes for individuals through improved connection to health, housing and social supports.
Government is also moving forward with recommendations from the Special Committee on Reforming the Police Act, with particular focus on improving community-based mental health and addictions crisis response. Budget 2023 provides $25 million over three years to support the first phase of modernization of the Police Act. Funding will be used to support community engagement and consultations to help inform new policing and police oversight legislation.
Government is also providing $7 million per year to support cannabis operations, including licensing, compliance and enforcement, and upgrades to existing systems and processes. This will support the continued growth of the legal cannabis industry, which is an important factor in reducing illicit sales and activity. Under the Declaration Act Action Plan and reconciliation more broadly, government continues to work with the First Nations Leadership Council and Indigenous people to support the health, safety and economic opportunities of Indigenous communities in the emerging cannabis industry.
| 18 | | Budget and Fiscal Plan - 2023/24 to 2025/26 |
Three Year Fiscal Plan
Decriminalization
On January 31, 2023, British Columbia became the first province to decriminalize simple possession of small amounts of illicit drugs for personal use. As part of a three-year program, Health Canada has granted the Province of B.C. an exemption under the federal Controlled Drugs and Substances Act. While these substances remain illegal, adults who have 2.5 grams or less of certain illicit substances (i.e., an amount deemed for personal use only) will no longer be arrested, charged or have their drugs seized. Instead, police will be equipped with resources and information on available health and social supports and will help with referrals when requested. Budget 2023 provides $19 million over three years to prepare for the change, including providing training and additional health resources. Decriminalization is intended to reduce the barriers and stigma that prevent people from accessing life-saving supports and services. Together, the federal and provincial governments will work closely to evaluate and monitor the implementation of this exemption and ensure that this exemption continues to be the right decision for the people of B.C.
Improved access to justice and services
In 2020, a partnership between the Province and the BC First Nations Justice Council (BCFNJC) launched the first Indigenous Justice Centre in B.C. to improve access to supports and help individuals more easily navigate the justice system. The model offers culturally safe and welcoming places that provide legal help and early resolution programs, as well as support services for healing and wellness. This includes providing culturally appropriate information, advice, support and representation for Indigenous people at the community level. The goal is to support services that address the root causes that bring people into the justice system.
There are currently Indigenous Justice Centres in operation in Prince George, Prince Rupert, and Merritt, and one virtual centre. Budget 2020 provided for two additional centres and Budget 2023 provides $44 million over three years to expand to 10 more locations over the next two years. This funding fulfills the commitment under Strategy 4 of the BC First Nations Justice Strategy to "expand and invest in a comprehensive network of Indigenous Justice Centres" by establishing "a network of 15 Justice Centres across British Columbia within 5 years". The centres support the important work and shared commitment of the Province with the BCFNJC to address the over-representation of Indigenous Peoples in the criminal justice system, which has its roots in long-standing systemic racism and the impacts of intergenerational trauma.
As part of Budget 2023, the Province is also committing up to $4.5 million more per year to improve access to services at the B.C. Human Rights Tribunal (BCHRT), which is responsible for accepting, screening, mediating and adjudicating human rights complaints. The funding will also support people accessing free legal services from the Community Legal Assistance Society, which helps disadvantaged people bring claims to the BCHRT. The BCHRT and Community Legal Assistance Society will also be able to provide additional resources, including lawyers, legal advocates, adjudicative members and support staff, to address the growing volume of claims, and provide more timely responses and resolution of matters before them. Funding will also support the Tribunal's ongoing work to improve access for Indigenous Peoples through the onboarding of Indigenous navigators who will provide support through the Tribunal's process. The investment is part of government's work to address systemic and Indigenous-specific racism and discrimination as outlined in the Declaration Act Action Plan.
| Budget and Fiscal Plan - 2023/24 to 2025/26 | | 19 |
Three Year Fiscal Plan
Other new justice investments includes:
| · | $2 million more per year for the Independent Investigations Office, a civilian-led police oversight agency responsible for conducting investigations into incidents of death or serious harm that may have been the result of the actions or inactions of a police officer, whether on or off duty; and | |
| · | $16 million over the fiscal plan for virtual and after-hours bail hearings, to help expedite court hearings and reduce community displacement, particularly in rural and remote communities. |
Sustainable and Clean Economy
The Province is committed to building a stronger British Columbia for everyone by continuing to invest in an inclusive, sustainable and innovative economy. Building on the StrongerBC Economic Plan: A plan for today, a vision for tomorrow, the Province continues to make new investments to develop and attract the talent B.C. needs to grow the economy. At the same time, the Province remains focused on building inclusive and clean growth and helping communities build climate resiliency. Budget 2023 provides nearly $1.4 billion over three years in new operating and capital funding to support the Province's economic development objectives. These investments are outlined in Table 1.2.5 and further described below.
Table 1.2.5 Sustainable and Clean Economy
| ($ millions) | 2023/24 | 2024/25 | 2025/26 | Total | ||||||||||||
| New Operating Investments* | ||||||||||||||||
| Future Ready Plan | 126 | 171 | 183 | 480 | ||||||||||||
| Settlement services and foreign credential recognition | 15 | 21 | 23 | 58 | ||||||||||||
| Anti-racism legislation | 4 | 4 | 2 | 9 | ||||||||||||
| Natural resource permitting | 18 | 30 | 29 | 77 | ||||||||||||
| B.C. Critical Minerals Strategy | 2 | 2 | 2 | 6 | ||||||||||||
| Forest Landscape Planning | 12 | 4 | 4 | 21 | ||||||||||||
| CleanBC Enhancements | 11 | 11 | 21 | 44 | ||||||||||||
| Forest Service Roads | 12 | 12 | 12 | 35 | ||||||||||||
| BC Parks and Recreation Sites & Trails | 15 | 27 | 28 | 70 | ||||||||||||
| Emergency management and climate resiliency | 19 | 28 | 38 | 85 | ||||||||||||
| Operating Sub-total | 235 | 310 | 342 | 886 | ||||||||||||
| New Capital Investments | ||||||||||||||||
| Active Transportation | 10 | 40 | 50 | 100 | ||||||||||||
| Forest Service Roads | 5 | 5 | 5 | 14 | ||||||||||||
| BC Parks and Recreation Sites & Trails | 6 | 12 | 12 | 31 | ||||||||||||
| B.C. Wildfire infrastructure improvements | 13 | 13 | 11 | 38 | ||||||||||||
| Climate and Emergency Response | 100 | 100 | 100 | 300 | ||||||||||||
| Capital Sub-total | 134 | 170 | 178 | 482 | ||||||||||||
| Total | 369 | 480 | 519 | 1,368 | ||||||||||||
| Note: Table may not sum due to rounding. |
| *Includes allocations funded from the Contingencies Vote. |
| 20 | | Budget and Fiscal Plan - 2023/24 to 2025/26 |
Three Year Fiscal Plan
Future Skills & Inclusive Growth
Future Ready: Skills for the Jobs of Tomorrow
Building a strong, secure, and sustainable economy that works for everyone means ensuring British Columbians have the skills and opportunity to build a good career in B.C. now and in the future. Through key investments, the Province is taking action to make sure everyone, no matter their financial status, background, or location, has the opportunity to get the skills they need to find a good-paying meaningful job that works for them and their families and to support employers to access the talent they need.
Budget 2023 invests $480 million over three years to support the Future Ready Plan. The plan brings together several actions to help close the immediate and long-term skills and labour supply gaps, while providing more opportunities for people to get ahead and providing employers with the employees of the future. The plan is set to be released by the Province in spring 2023.
One cornerstone of this plan is $39 million over three years for a new short-term skills training grant. This program will enable people to get the ready-made and relevant skills needed to succeed in good-paying, high-demand jobs. The details for this grant will be made available later this year.
The plan's initiatives are designed to maximize workforce participation throughout British Columbia by offering supports, programming and access to training that is more affordable and recognizes the needs of individual learners. The suite of training supports will be oriented to labour market demands and delivered in alignment with the Province's commitment to reconciliation.
In addition to its focus on individual skills development, the Future Ready Plan will include mechanisms and funding to assist small and medium-sized businesses in finding and implementing practical solutions to current labour market challenges and prepare for a changing global economy.
Further funding within the Future Ready Plan will help increase the number of trained early childhood educators, health-care workers, and tech workers. It will also support upgrading the skills of workers in areas that support innovative and clean growth, such as manufacturing and mass timber.
Funding and initiatives for the Future Ready Plan are in addition to government's complementary health workforce strategy as described on page 8 and additional financial supports for students as discussed on page 16.
| Budget and Fiscal Plan - 2023/24 to 2025/26 | | 21 |
Three Year Fiscal Plan
Settlement services and foreign credential recognition
Attracting and supporting newcomers to B.C. is an important part of the Future Ready Plan and will help fill job vacancies now and in the future. Already, record numbers of people are choosing to move to British Columbia, with net migration into B.C. estimated at over 100,000 in 2022. This positions B.C. as a leader across the country in attracting new talent to fill an anticipated one million job openings over the next decade. To help attract professionals and support the influx of new residents, Government is investing $58 million over three years to expand supports for newcomers and speed up foreign credential recognitions for qualified professionals.
New funding for settlement support services will help the increasing number of people arriving in the province, including international students, temporary workers, as well as refugees from Afghanistan and Ukraine. Settlement and integration support services include orientation, information and referrals; support with work permitting and permanent residency applications; community connections; short-term crisis support; trauma counselling for refugees; and referrals to WorkBC. Funding will also support expanded supports for newcomers, such as formal language training and temporary housing for refugees.
New investments in the foreign credential recognition program will help improve standards, such as processing timelines, for all B.C. professional regulators to help reduce barriers to newcomers entering their field. This builds on recent changes to the Provincial Nominee Program that enables immigrants who received international training in health care and child care to more easily get their credentials recognized in B.C. and begin working in these high-demand fields.
Anti-racism legislation
Budget 2023 invests $9 million over three years to support government's implementation of the Anti-racism Data Act established in 2022, and to support policy development and engagement that will lead to the introduction of a new anti-racism act. These steps further B.C.'s progress toward dismantling systemic racism and discrimination in British Columbia.
Clean and Sustainable Economic Development
Forest Landscape Planning
In 2021, the Province began its work in partnership with First Nations to defer the harvest of ancient, rare and priority large stands of old growth for 2.6 million hectares of B.C.'s most at-risk old growth forests. Logging deferrals were established to prevent irreversible biodiversity loss while First Nations, the Province, and industry develop a new approach to sustainable forest management that balances ecosystem health and community prosperity throughout British Columbia.
Ecosystem health will be a key area of focus as part of the Province's continued work in advancing Forest Landscape Planning and Land Use Planning processes that are being undertaken in partnership with First Nations and full engagement of local governments, stakeholders and the public. Forest Landscape Planning is an important venue and process for collaborative discussions, including the management of old growth forests and logging deferrals. Budget 2023 provides $21 million over three years to initiate eight more regional Forest Landscape Planning tables, expanding on the existing four. This will support implementation of the recommendations from the Old Growth Strategic Review, and help the Province achieve its target to temporarily defer 2.6 million hectares of old growth forests.
| 22 | | Budget and Fiscal Plan - 2023/24 to 2025/26 |
Three Year Fiscal Plan
Natural resource permitting
British Columbia's natural resources are an enormous economic advantage for the province, and will continue to be a key factor in B.C.'s economic success in the long-term. Ninety-four per cent of B.C.'s land base is provincial public land on which activities and resource use must be permitted by the Province under a variety of natural resource statutes. This includes permits for recreation, disaster recovery and rebuilding, telecommunications sites, housing development, fish and wildlife harvesting, forest harvesting and mining exploration, amongst others.
Budget 2023 builds on the Permitting Strategy for Housing, and provides $77 million over three years to help speed up natural-resource permitting and begin work to modernize the permitting service delivery model. As a first step, government recently announced an initial investment of 42 new full-time positions that will form a dedicated, cross-ministry team prioritizing provincial authorizations required for housing. Budget 2023 funding will be used to support an additional 160 staff across several ministries to reduce permit backlogs, allow projects to move forward and unlock economic potential. In addition to supporting government's housing commitments, speeding up permitting is key to delivering on priorities such as bringing connectivity to remote communities and supporting the CleanBC Roadmap to 2030 regarding electrification and hydrogen technology.
Over the medium term, government will modernize provincial permitting processes and enhance the service delivery model through improvements to policy, legislation, and information management systems. Central to this work is adopting processes which better enable co-management and decision-making with Indigenous Peoples, in alignment with government's commitment under the Declaration on the Rights of Indigenous Peoples Act. Modernizing government's permitting framework is necessary to ensure that B.C.'s natural resources support economic prosperity in a way that aligns with environmental, social and cultural objectives.
B. C. Critical Minerals Strategy
To support future development in critical minerals extraction and value chain opportunities, government is committing $6 million over three years to develop the B.C. Critical Minerals Strategy. The strategy aims to drive potential future clean economic development through increased access to geoscience to facilitate critical mineral exploration, and assess potential for critical minerals processing and manufacturing. Funding will be used to support geoscience inventory work and economic analysis of B.C.'s critical mineral value chain potential. Funding will also support an engagement process, including working with Indigenous communities, consistent with the Declaration Act, and engagement with industry, academia and other stakeholders.
| Budget and Fiscal Plan - 2023/24 to 2025/26 | | 23 |
Three Year Fiscal Plan
CleanBC Enhancements
The CleanBC Go Electric Program is helping B.C. make the shift to cleaner transportation. The program makes it easier for people and businesses to buy and own an electric vehicle by bringing down the price, making it easier to charge or fuel, and by supporting research, job training and economic development in B.C.'s electric vehicle sector. Budget 2023 provides $44 million over three years to continue to support British Columbia to transition to zero-emission economy. This includes $40 million more for the CleanBC Go Electric Commercial Vehicle Pilots (CVP) Program which supports B.C.-based businesses, non-profits and eligible public entities looking to deploy commercial zero-emission vehicles, including medium- and heavy-duty on-road vehicles, rail, marine, aircraft and off-road equipment, along with supporting infrastructure. This builds on existing CleanBC programs, such as $49 million invested to date in the CVP program, and is in addition to over $200 million for light-duty zero-emission vehicle rebates announced in Budget 2022 that BC Hydro will deliver on behalf of government. Funding will also be used to support implementation of new regulations and the B.C. Hydrogen Office to continue to advance hydrogen projects and facilitate hydrogen's role across B.C.'s energy systems. For more information on CleanBC, see the New Carbon Pricing Model topic box on page 80.
Enhancing Outdoor and Community Infrastructure
Active Transportation
In 2019, the Province launched B.C.'s Active Transportation Strategy as part of the CleanBC Plan to create community-specific active transportation networks that are safe, accessible and convenient for pedestrians, cyclists, transit riders and motorists — of all ages and abilities. The strategy aims to double the percentage of trips taken with active transportation by 2030, and reduce vehicle transportation. As part of Budget 2023, government is investing $100 million in capital funding over three years to support more active transportation investments across B.C. This builds on the $48 million provided as part of Budget 2021 and Budget 2022 to help local governments improve active transportation infrastructure, such as building connecting sidewalks, installing bike lanes, and building multi-use paths in parks. Research shows that behaviours will change when options for cleaner transportation are safe and convenient. New investments will help improve connections between various active transportation networks along provincial corridors, as well as improve connections to public transit. This will improve access and convenience to help people connect to communities, schools, work and other services using active transportation.
Enhancing Forest Service Roads
There are over 60,000 kilometres of forest service roads across the province. Forest service roads act as critical connection points, providing the sole access to some rural, remote and Indigenous communities and to many of B.C.'s parks and recreation sites. The road network allows rural residents to access essential services and provides outdoor recreation opportunities to all British Columbians. Budget 2023 provides an additional $35 million in operating funding and $14 million in capital funding to maintain and upgrade forest service roads. Funding will support better road conditions to communities and recreation areas to ensure safe and reliable access.
| 24 | | Budget and Fiscal Plan - 2023/24 to 2025/26 |
Three Year Fiscal Plan
BC Parks and Recreation Sites & Trails
To preserve and enhance the quality of outdoor recreational opportunities in B.C., government is investing $70 million in operating funding and $31 million in capital funding over three years at provincial parks and other outdoor recreation sites and trails. The funding will provide British Columbians and visitors with higher quality experiences when they visit these natural assets by providing for improved maintenance and upgrading of facilities and sites, ensuring more provincial parks meet basic accessibility requirements, and enhancing funding that supports both routine and critical repair and maintenance work. This builds off recent Budget 2021 investments of $36 million operating and $47 million in capital funding for BC Parks and campsite expansions in recognition of the higher demand in B.C.'s public outdoor spaces since the pandemic.
Climate Resiliency and Emergency Response
Around the globe, the frequency and severity of climate-related emergencies continues to increase. Likewise, British Columbia has seen an increase in extreme, weather-related disasters including wildfires, the 2021 summer heat dome, and the November 2021 atmospheric river and subsequent flooding across B.C. To support recovery efforts for the people and communities that continue to rebuild from these disasters, Budget 2023 includes over $1 billion in operating and capital funding over the fiscal plan.
As previously committed in Budget 2022, the Province will provide $750 million in operating funding over the next two years for ongoing disaster response and recovery activities, such as debris removal and clean-up. Funding will support programs such as Disaster Financial Assistance, which provides local governments, people, small businesses, farms and charitable organizations with assistance to recover. Budget 2023 also provides $100 million in capital funding in each year of the fiscal plan to support repair or replacement of provincial public-sector infrastructure damaged from climate emergencies. This is in addition to funding through the BC Transportation Financing Authority to rebuild provincial highways and bridges.
The Province created the new Ministry of Emergency Management and Climate Readiness to ensure B.C. is ready to address the impacts climate change will have on communities. Budget 2023 provides $85 million over three years to increase emergency management capacity in the province and provide new investments in disaster risk assessment, preparedness and mitigation. Funding will also support more cross-ministry coordination, including working collaboratively with local governments and First Nations to make communities more resilient to climate and disaster risks.
The Province is also committing additional capital funding to support the B.C. Wildfire Service. Through a provincial-federal cost share arrangement, the B.C. Wildfire Service will receive $64 million in capital funding over five years (2022/23 to 2026/27) for firefighting equipment. This funding builds on $359 million provided through Budget 2022 to protect British Columbians from wildfire, including through year-round staffing of the B.C. Wildfire Service and expanded wildfire prevention.
| Budget and Fiscal Plan - 2023/24 to 2025/26 | | 25 |
Three Year Fiscal Plan
2022 Shared Recovery Mandate
Government relies on people to deliver the essential services British Columbians rely on. There are just over 500,000 people working across the provincial public sector, including the core Public Service, Crown corporations, health, community social services, K-12 public education, post-secondary institutions, and research universities. Of those people, approximately 393,000 are unionized employees paid under collective agreements or professionals paid through negotiated compensation agreements.
The new Shared Recovery Mandate applies to all public-sector employers with unionized employees whose collective agreements expire on or after December 31, 2021. Negotiations are focused on providing a fair and reasonable offer to public-sector workers that includes significant inflation protection, while ensuring that government has the resources to continue to invest in building a stronger province for everyone.
Key priorities of the 2022 Shared Recovery Mandate include:
| · | Protecting the services that people in British Columbia depend on | |
| · | Improving health care and preparing for future needs and challenges | |
| · | Supporting a strong economic recovery that includes everyone in B.C. |
Elements of the 2022 Shared Recovery Mandate include:
| · | Three-year term | |
| · | General wage increases | |
| - Year 1 – a flat increase of $0.25/hour which provides a greater percentage increase for lower paid employees, plus 3.24 per cent | ||
| - Year 2 – 5.5 per cent plus a potential Cost of Living Adjustment to a maximum of 6.75 per cent | ||
| - Year 3 – 2 per cent plus a potential Cost of Living Adjustment to a maximum of 3 per cent | ||
| · | A negotiable Flexibility Allocation of up to 0.25 per cent in years 1 and 2 to support mutually beneficial outcomes for both parties. |
The 2022 Shared Recovery Mandate is estimated to cost $10.8 billion over the three-year mandate term (2022/23 to 2024/25), with an annual ongoing cost of $5.4 billion.
Over the three-year Budget 2023 fiscal plan period, wage mandate costs are estimated at $15 billion. This includes new base funding to support wage increases for signed agreements as of December 31, 2022, and contingencies funding for pending agreements and potential cost of living adjustments.
Table 1.2.6 Wage Mandate Costs over the Budget 2023 Fiscal Period
| ($ millions) | 2023/24 | 2024/25 | Ongoing (2025/26) | Total | ||||||||||||
| Ministry Base Budget Increases | 2,141 | 2,701 | 2,742 | 7,584 | ||||||||||||
| Wage Mandate Contingencies | 2,200 | 2,600 | 2,700 | 7,500 | ||||||||||||
| Total | 4,341 | 5,301 | 5,442 | 15,084 |
Tables may not sum due to rounding.
| 26 | | Budget and Fiscal Plan - 2023/24 to 2025/26 |
Three Year Fiscal Plan
Other Essential Services
K-12 Enrolment Growth
Budget 2023 invests more than $218 million over the fiscal plan to respond to growing K-12 enrolment in British Columbia's public and independent school systems. Government will also continue to provide supplemental funding to school districts based upon children and youth in care, Indigenous learners, rural school districts, and students with support needs. This funding includes $161 million for the Classroom Enhancement Fund which supports more than 4,800 teachers, including over 700 special education teachers, and more than 200 teacher psychologists and counsellors. There is also over $13 million over the fiscal plan to increase the existing Learning Improvement Fund which supports classrooms that have students with complex learning needs through the provision of additional Education Assistant support times.
These investments will bring the total annual funding for K-12 education to $8.3 billion by 2025/26 as shown in Chart 1.1.3. These investments include wage increases for the K-12 education sector under the Shared Recovery Mandate. In addition, the Province's capital plan includes $3.4 billion over the next three years to build new schools to respond to enrolment growth, and to maintain and seismically upgrade schools throughout the province. A summary of education capital spending begins on page 44.
Chart 1.1.3 Investing in K-12 Education*

* Chart represents K-12 education operating funding for the Ministry of Education and Child Care. It does not include one-time funding, such as time-limited initiatives funded through the Pandemic Recovery Contingencies.
Budget and Fiscal Plan - 2023/24 to 2025/26
| | 27 |
Three Year Fiscal Plan
Supporting Children and Youth with Special Needs
The Province remains committed to ensuring that children and youth with support needs receive the services and support that they need. Budget 2023 provides $95 million over three years to engage in deeper consultation regarding the funding and service model for children and youth with support needs and, in the interim, support families of children with fetal alcohol spectrum disorders (known as FASD), Down syndrome and other neuro-cognitive developmental disabilities who are underserved under the current service models.
This includes new workforce investments to create the necessary resources at Child Development Centres across the province that specialize in supporting families of children with FASD and general family support, and for more respite hours for families caring for a child or youth with support needs. This funding will also double the reimbursement thresholds that families can access under the School Age Extended Therapy funding in the At Home program from $80 to $160 per hour, and remove financial barriers to accessing support. Finally, the Province is also investing in strategies to strengthen the workforce, like bursary and recruitment programs, to attract the workers needed now and in the future.
Pandemic Recovery Contingencies
Budget 2023 provides $1.0 billion in 2023/24 to maintain the Pandemic Recovery Contingencies to support ongoing measures and emergent needs related to the pandemic. The Pandemic Recovery Contingencies will be used to continue short-term funding initiatives and for new programs where the demand and costs may fluctuate as the pandemic and related health orders continue to evolve.
Notional allocations for Pandemic Recovery Contingencies are shown in Table 1.2.7. This includes funding for the following initiatives:
| · | Health COVID-19 management: funding for ongoing COVID-19 and influenza vaccination programs; the provision of personal protective equipment for health-care workers; transportation and access options for rural, remote and Indigenous communities; and COVID-19 testing and other preventative measures including screening staff that work with vulnerable health-care residents. |
| · | Supports for Vulnerable Populations: funding for leased spaces at hotels, motels and community centres that provided temporary housing to enable safe physical distancing for those previously living at encampments or shelters. |
| · | Tourism Initiative Envelope: funding to support ongoing economic recovery efforts for the tourism sector based on priority initiatives as identified by the Ministry of Tourism, Arts, Culture and Sport. |
| 28 | | Budget and Fiscal Plan - 2023/24 to 2025/26
|
Three Year Fiscal Plan
With the Pandemic Recovery Contingencies set to end after 2023/24, it is anticipated that most initiatives will wind-down or be integrated into existing government programs. Government will assess the need to provide any ongoing funding to support recovery initiatives through the Budget 2024 process.
Table 1.2.7 Pandemic Recovery Contingencies 2023/24
| Initiative | Notional Allocations* | ||
| Health COVID-19 Management | $ | 875 million | |
| Supports for Vulnerable Populations | $ | 20 million | |
| Tourism Initiative Envelope | $ | 20 million | |
| Unallocated: available for additional health or recovery measures | $ | 85 million | |
| Total | $ | 1.0 billion | |
* Notional allocations are based on current forecasts, with any changes communicated in Quarterly Reports.
Budget and Fiscal Plan - 2023/24 to 2025/26
| | 29 |
Three Year Fiscal Plan
Fiscal Sustainability
Since Budget 2021, government's fiscal approach has focused on long-term fiscal sustainability, while continuing to invest in near-term needs and priorities. This approach has supported the Province in managing its response to the pandemic to make sure British Columbia's people, businesses and communities recover together.
Government remains committed to making life better for people in B.C., improving the services we all rely on, and ensuring a sustainable province for future generations. To support government's fiscal objectives, Budget 2023 is guided by the following fiscal guardrails:
| · | Year-over-year declining deficits – Budget 2023 presents declining deficits over time from $4.2 billion in 2023/24 to $3.0 billion in 2025/26. |
| · | Targeted spending criteria – Spending criteria was limited to the highest of government priorities focused on health, public safety, housing, affordability and continued investments to support a sustainable and fair economic recovery. |
| · | Prudence levels – Budget 2023 continues to build additional prudence into the plan to support government in responding to unexpected events. This includes higher amounts of contingencies and forecast allowance that is planned to taper over time as the economy stabilizes post-pandemic. The near-term economic projections assumed in Budget 2023 are prudent relative to the average of the forecasts provided by the Economic Forecast Council. |
| · | Pandemic Recovery & Climate and Emergency Response Contingencies – Budget 2023 provides pandemic recovery contingencies to support ongoing health response measures; this funding is anticipated to wind down or be integrated into government operations over the next year. There is also $500 million in 2023/24, and $250 million in 2024/25 to support ongoing recovery efforts from climate-related disasters including the November 2021 flooding and other extreme-weather events. |
| · | Debt metrics and debt affordability – The Province continues to monitor debt-to-GDP and debt-to-revenue ratios as measures of overall sustainability of debt. B.C.'s debt burden remains affordable relative to peer jurisdictions. |
| · | Transparent and timely reporting – Government remains committed to transparent and timely financial reporting including meeting all requirements under the Budget Transparency and Accountability Act. |
Please refer to the Budget 2021 document (starting on page 30) and Budget 2022 (starting on page 37) for more information on government's fiscal guardrails.
Prudence in the Budget and Fiscal Plan
| ($ millions) | 2023/24 | 2024/25 | 2025/26 | |||||||||
| General Contingencies | 1,500 | 1,500 | 1,000 | |||||||||
| CleanBC | 300 | 450 | 200 | |||||||||
| Pandemic Recovery Contingencies | 1,000 | – | – | |||||||||
| Climate & Emergency Response Contingencies | 500 | 250 | – | |||||||||
| Shared Recovery Mandate Contingencies | 2,200 | 2,600 | 2,700 | |||||||||
| Priority spending initiatives and caseload pressures | – | – | 800 | |||||||||
| Forecast Allowance | 700 | 500 | 500 |
| 30 | | Budget and Fiscal Plan - 2023/24 to 2025/26 |
Three Year Fiscal Plan
A Responsive Approach to Budgeting
Responsible and responsive budgeting means planning for potential outcomes and adapting to the realities of changing circumstances. The world continues to adjust from the economic shocks and volatility caused by the pandemic and the war in Ukraine, including persistent inflation and rising interest rates. Government recognizes that macro-economic, environmental, and other external factors can have a significant effect on the B.C. economy and the lives of British Columbians. The Economic Forecast Council (refer to page 108) projects that B.C. is headed into a period of slower economic growth, with some economists signaling the potential for recession.
As demonstrated through the pandemic and recent climate emergencies, government is prepared to take swift fiscal response as needed to support the health, safety and well-being of British Columbians. The Province will continue to closely monitor the economy, the environment and the needs of its people and provide a balanced approach in its fiscal and economic strategies.
Long-term Planning for Revenue Resiliency
The Ministry of Finance continues to work to improve revenue resiliency and adapt various revenue sources and the overall revenue mix to keep pace with ongoing economic changes and demographic shifts. For example, the CleanBC Roadmap to 2030 outlines initiatives to reduce use of light-duty vehicles, shift to more energy efficient forms of transport, and increase adoption of zero-emissions vehicles, all of which will reduce revenue from various sources, such as motor fuel tax revenue, for the Province, Translink, B.C. Transportation Financing Authority, and BC Transit. In the future, as CleanBC targets are met, government will need to ensure funding and service standards can be maintained and improved. Other active areas of work surround the rising digital economy and changing nature of work, and includes topics such as the gig economy, rules on where businesses and employees are considered to be located, and how, where, and what goods and services are provided.
Budget and Fiscal Plan - 2023/24 to 2025/26
| | 31 |
Three Year Fiscal Plan
BC Public Service
Full-time equivalent (FTE) staff utilization in core government ministries is projected to increase from a forecast of 33,800 in 2022/23 to 34,400 in 2023/24, an increase of 600 FTEs. The anticipated FTE growth is mainly due to newly approved resources as part of Budget 2023. This includes resources to support the refreshed housing strategy, the Future Ready Plan, and public safety initiatives. There are also new FTEs to support natural resource permitting, the Employment Standards Branch, the Residential Tenancy Branch, as well as expected growth for continued hiring for initiatives approved in Budget 2022, such as child care and CleanBC program expansion. FTE utilization across the fiscal is expected to increase and stabilize in 2024/25 at 35,000 due to continued implementation of these programs.
Spending Recovered from Third Parties
Government projects that, over the fiscal plan period, it will incur over $13.8 billion in program spending which will be recovered from third parties.
A total of $5.9 billion of programs will be delivered with funding from the federal government, such as the Canada-Wide Early Learning and Child Care Agreement, the Labour Market Development Agreement, the Canada Job Grant, public transit, health, and other social programs.
Recovered costs include an estimated $3.3 billion in interest payments from commercial Crown corporations through the fiscal agency loan program and from sinking fund investment returns.
$4.6 billion in government spending is supported by various recovery sources, primarily other jurisdictions, other levels of government, agencies, and fees and licenses. Expenses that relate to these recoveries include health care, PharmaCare, transportation projects, and grants to various organizations in the community, and employee health benefits costs collected from participating government agencies.
Program spending from recoveries have no net impact to the government's fiscal plan as the recoveries are reported as revenue and the spending is expensed as it is incurred.
Transfers to Service Delivery Agencies
Approximately 64 per cent of ministry spending takes the form of transfers (both operating and capital) to service delivery agencies for the provision of services on behalf of government. These transfers will total $130 billion over the three-year fiscal plan period and will support education, health care, social services, housing, and transportation programs delivered by the agencies. These service delivery agencies include the SUCH sector (schools, universities, colleges and health organizations), Community Living BC, BC Housing Management Commission, BC Transit, and the BC Transportation Financing Authority.
| 32 | | Budget and Fiscal Plan - 2023/24 to 2025/26 |
|
Three Year Fiscal Plan
Service Delivery Agency Spending
Service delivery agency spending is projected to increase from $44.9 billion in 2022/23 to $50.3 billion by 2025/26, an increase of $5.4 billion. Additional funding may be allocated to agencies during the year from Pandemic Recovery Contingencies, which may result in higher actual spending in 2023/24.
School district spending is projected to increase from $7.98 billion in 2022/23 to $8.59 billion in 2025/26, an increase of over $614 million. This increase includes funding for teachers and support staff (including excluded and management) negotiated salaries, and is also due to increasing staffing and operating costs related to higher projected student enrolment.
Post-secondary institution spending is projected to rise from $7.65 billion in 2022/23 to $8.42 billion by 2025/26 — an increase of $772 million. The spending increase is primarily due to higher staffing and operating costs.
Health authority and hospital society spending, after adjusting for approximately $875 million in pandemic spending in the current year, is projected to increase from $21.2 billion in 2022/23 to $24.3 billion in 2025/26, an increase of $3.1 billion over the fiscal plan period. This spending includes funding for negotiated salaries, and increasing staffing and operating costs incurred to meet the projected volume and service growth in health-care services delivered by these organizations.
Other service delivery agencies relates mainly to services in the transportation, social services, and housing sectors. Projected spending by other service delivery agencies is expected to increase from $7.2 billion in 2022/23 to $8.9 billion in 2025/26, an increase of $1.7 billion. This increase is primarily due to higher spending of $597 million by the BC Housing Management Commission and $810 million by the BC Transportation Financing Authority.
For a presentation of the government's consolidated spending in various sectors, please see Table A11 Expense by Function on page 162. The expense-by-function table combines the spending by ministries and service delivery agencies in sectors such as health, education, social services, transportation, and others.
Budget and Fiscal Plan - 2023/24 to 2025/26
| | 33 |
Three Year Fiscal Plan
| Table 1.3 Expense by Ministry, Program and Agency | ||||||||||||||||
| Updated Forecast | Budget Estimate | Plan | Plan | |||||||||||||
| ($ millions) | 2022/23 1 | 2023/24 | 2024/25 | 2025/26 | ||||||||||||
| Office of the Premier | 15 | 16 | 16 | 16 | ||||||||||||
| Agriculture and Food | 107 | 112 | 113 | 113 | ||||||||||||
| Attorney General | 708 | 773 | 781 | 778 | ||||||||||||
| Children and Family Development | 1,741 | 1,912 | 1,930 | 1,926 | ||||||||||||
| Citizens' Services | 657 | 683 | 686 | 686 | ||||||||||||
| Education and Child Care | 8,217 | 8,874 | 9,133 | 9,172 | ||||||||||||
| Emergency Management and Climate Readiness | 479 | 101 | 111 | 120 | ||||||||||||
| Energy, Mines and Low Carbon Innovation | 152 | 129 | 121 | 122 | ||||||||||||
| Environment and Climate Change Strategy | 383 | 255 | 263 | 263 | ||||||||||||
| Finance | 2,306 | 1,578 | 1,502 | 1,387 | ||||||||||||
| Forests | 1,048 | 925 | 905 | 913 | ||||||||||||
| Health | 25,460 | 28,674 | 29,887 | 30,669 | ||||||||||||
| Housing | 669 | 897 | 979 | 1,001 | ||||||||||||
| Indigenous Relations and Reconciliation | 171 | 188 | 177 | 179 | ||||||||||||
| Jobs, Economic Development and Innovation | 111 | 113 | 114 | 114 | ||||||||||||
| Labour | 17 | 21 | 22 | 23 | ||||||||||||
| Mental Health and Addictions | 25 | 27 | 27 | 27 | ||||||||||||
| Municipal Affairs | 256 | 269 | 282 | 283 | ||||||||||||
| Post-Secondary Education and Future Skills | 2,616 | 2,770 | 2,815 | 2,837 | ||||||||||||
| Public Safety and Solicitor General | 913 | 1,028 | 1,034 | 1,033 | ||||||||||||
| Social Development and Poverty Reduction | 4,451 | 4,745 | 4,861 | 4,927 | ||||||||||||
| Tourism, Arts, Culture and Sport | 173 | 182 | 183 | 183 | ||||||||||||
| Transportation and Infrastructure | 956 | 1,021 | 1,021 | 1,021 | ||||||||||||
| Water, Land and Resource Stewardship | 104 | 124 | 128 | 128 | ||||||||||||
| Total ministries and Office of the Premier | 51,735 | 55,417 | 57,091 | 57,921 | ||||||||||||
| Management of public funds and debt | 1,268 | 1,309 | 1,593 | 1,866 | ||||||||||||
| Contingencies - Shared Recovery Mandate | 700 | 2,200 | 2,600 | 2,700 | ||||||||||||
| Contingencies - General, CleanBC and Climate & Emergency Response | 2,148 | 2,300 | 2,200 | 1,200 | ||||||||||||
| Pandemic Recovery Contingencies | 2,000 | 1,000 | — | — | ||||||||||||
| Priority spending initiatives and caseload pressures | — | — | — | 800 | ||||||||||||
| Funding for capital expenditures | 3,225 | 4,540 | 5,800 | 6,234 | ||||||||||||
| Refundable tax credit transfers 2 | 4,066 | 3,159 | 3,561 | 3,964 | ||||||||||||
| Legislative Assembly and other appropriations | 196 | 214 | 193 | 194 | ||||||||||||
| Supplementary Estimates | 2,715 | — | — | — | ||||||||||||
| Total appropriations | 68,053 | 70,139 | 73,038 | 74,879 | ||||||||||||
| Elimination of transactions between appropriations 3 | (25 | ) | (32 | ) | (27 | ) | (24 | ) | ||||||||
| Prior year liability adjustments | (21 | ) | — | — | — | |||||||||||
| Consolidated revenue fund expense | 68,007 | 70,107 | 73,011 | 74,855 | ||||||||||||
| Expenses recovered from external entities | 4,152 | 4,909 | 4,450 | 4,391 | ||||||||||||
| Funding provided to service delivery agencies | (37,951 | ) | (41,212 | ) | (43,611 | ) | (44,745 | ) | ||||||||
| Total direct program spending | 34,208 | 33,804 | 33,850 | 34,501 | ||||||||||||
| Service delivery agency expense 4 | ||||||||||||||||
| School districts | 7,980 | 8,356 | 8,583 | 8,594 | ||||||||||||
| Universities | 6,076 | 6,369 | 6,538 | 6,713 | ||||||||||||
| Colleges and institutes | 1,572 | 1,574 | 1,652 | 1,707 | ||||||||||||
| Health authorities and hospital societies | 22,077 | 22,645 | 23,610 | 24,349 | ||||||||||||
| Other service delivery agencies | 7,195 | 8,458 | 8,745 | 8,902 | ||||||||||||
| Total service delivery agency expense | 44,900 | 47,402 | 49,128 | 50,265 | ||||||||||||
| Total expense | 79,108 | 81,206 | 82,978 | 84,766 | ||||||||||||
1 Restated to reflect government’s current organization and accounting policies.
2 Includes $1.6 billion in 2022/23 for cost of living measures provided through the Climate Action Tax Credit and the BC Family Benefit.
3 Reflects payments made under an agreement where an expense from a voted appropriation is recorded as revenue by a special account.
4 The 2022/23 spending for service delivery agencies includes funding that was provided during the year from ministries' budget and contingencies. Similarly, spending forecasts for 2023/24 and future years may also be revised as ministry funding amounts are updated in-year.
| 34 | | Budget and Fiscal Plan - 2023/24 to 2025/26
|
Three Year Fiscal Plan
| Table 1.4 Revenue by Source | ||||||||||||||||
| Updated | Budget | |||||||||||||||
| Forecast | Estimate | Plan | Plan | |||||||||||||
| ($ millions) | 2022/23 | 2023/24 | 2024/25 | 2025/26 | ||||||||||||
| Taxation revenue | ||||||||||||||||
| Personal income | 17,712 | 15,953 | 16,705 | 17,519 | ||||||||||||
| Corporate income | 10,519 | 5,938 | 6,451 | 6,503 | ||||||||||||
| Employer health | 2,675 | 2,731 | 2,874 | 3,000 | ||||||||||||
| Sales | 9,693 | 10,187 | 10,584 | 11,038 | ||||||||||||
| Fuel | 1,061 | 1,072 | 1,073 | 1,063 | ||||||||||||
| Carbon | 2,211 | 2,811 | 3,034 | 3,383 | ||||||||||||
| Tobacco | 565 | 565 | 565 | 565 | ||||||||||||
| Property | 3,253 | 3,488 | 3,644 | 3,827 | ||||||||||||
| Property transfer | 2,250 | 1,799 | 2,101 | 2,254 | ||||||||||||
| Insurance premium | 775 | 780 | 790 | 800 | ||||||||||||
| 50,714 | 45,324 | 47,821 | 49,952 | |||||||||||||
| Natural resource revenue | ||||||||||||||||
| Natural gas royalties | 2,206 | 2,016 | 1,648 | 1,518 | ||||||||||||
| Forests | 1,855 | 846 | 830 | 939 | ||||||||||||
| Other natural resources 1 | 2,003 | 1,902 | 1,673 | 1,548 | ||||||||||||
| 6,064 | 4,764 | 4,151 | 4,005 | |||||||||||||
| Other revenue | ||||||||||||||||
| Post-secondary education fees | 2,641 | 2,770 | 2,899 | 2,984 | ||||||||||||
| Other fees and licences 2 | 2,358 | 2,412 | 2,241 | 2,272 | ||||||||||||
| Investment earnings | 1,290 | 1,349 | 1,369 | 1,389 | ||||||||||||
| Miscellaneous 3 | 3,835 | 3,989 | 4,074 | 4,121 | ||||||||||||
| 10,124 | 10,520 | 10,583 | 10,766 | |||||||||||||
| Contributions from the federal government | ||||||||||||||||
| Health and social transfers | 8,613 | 8,970 | 9,422 | 9,745 | ||||||||||||
| Other federal government contributions 4 | 3,872 | 4,623 | 3,762 | 3,736 | ||||||||||||
| 12,485 | 13,593 | 13,184 | 13,481 | |||||||||||||
| Commercial Crown corporation net income | ||||||||||||||||
| BC Hydro | 712 | 712 | 712 | 712 | ||||||||||||
| Liquor Distribution Branch | 1,179 | 1,150 | 1,170 | 1,194 | ||||||||||||
| BC Lottery Corporation 5 | 1,574 | 1,456 | 1,478 | 1,484 | ||||||||||||
| ICBC | (298 | ) | — | 450 | 450 | |||||||||||
| Other6 | 146 | 171 | 175 | 179 | ||||||||||||
| 3,313 | 3,489 | 3,985 | 4,019 | |||||||||||||
| Total revenue | 82,700 | 77,690 | 79,724 | 82,223 | ||||||||||||
1 Columbia River Treaty, Crown land tenures, other energy and minerals, water rental, and other resources.
2 Health-care-related, motor vehicle, and other fees.
3 Includes reimbursements for health care and other services provided to external agencies, and other recoveries.
4 Includes contributions for health, education, community development, housing and social service programs, and transportation projects.
5 Net of payments to the federal government and payments to the BC First Nations Gaming Revenue Sharing Limited Partnership in accordance with section 14.3 of the Gaming Control Act (B.C.)
6 Includes Columbia Power Corporation, BC Railway Company, Columbia Basin power projects, and other agencies' self-supported subsidiaries.
Budget and Fiscal Plan - 2023/24 to 2025/26
| | 35 |
Three Year Fiscal Plan
Revenue
Total revenue is expected to decline 6.0 per cent in 2023/24 due to the effects of one-time revenues recorded in 2022/23, followed by an increase of 2.6 per cent in 2024/25 and 3.1 per cent in 2025/26. The forecast also reflects steadily declining natural resource revenues over the three-year fiscal plan, following higher commodity prices in 2022. Taxation revenues incorporate the impact of revenue measures detailed in Part 2: Tax Measures. Revenue growth in taxation, commercial Crown corporations, and other sources is partly offset by declining revenue from natural resources and contributions from the federal government.
Chart 1.2 Revenue Forecast
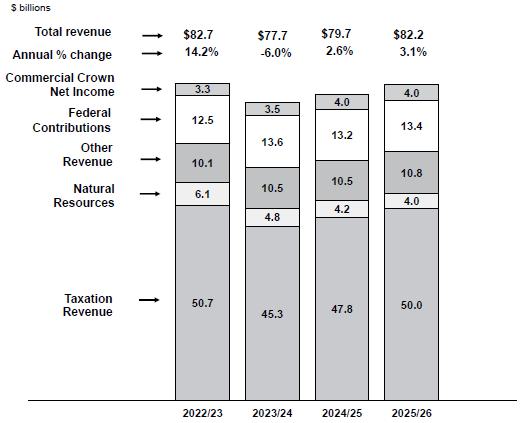
Taxation revenue is projected to decline in 2023/24 as the impacts of economic growth are offset by one-time revenues in 2022/23 that are assumed to not carry forward. Taxation revenue is forecast to average 5.0 per cent annual growth over the last two years of the plan, supported by nominal GDP growth. The forecast incorporates the increase in carbon tax revenue from annual carbon tax rate increases of $15 per tonne of CO2 equivalent emissions, effective April 1, 2023. The rates will align with federal carbon pricing backstop rates.
Natural resource revenue is forecast to decline by 21.4 per cent in 2023/24 as lower revenues from natural gas royalties, forests, mining, bonus bids and rents on drilling licences and leases are partly offset by increased revenue from electricity sales under the Columbia River Treaty and water rentals. Revenue is expected to decline on average over the next two years by 8.3 per cent mainly reflecting the effects of declining commodity prices and relatively flat forest harvest volumes. The forecast incorporates estimates of the old growth deferral. Budget 2022 included a downward revision of revenue forecast in response to the Supreme Court of B.C. decision that the cumulative impacts of industrial development infringed Blueberry River First Nations' ability to exercise their Treaty 8 rights. Subsequently, this January the Province and four Treaty 8 First Nations reached consensus on a collaborative approach to land and resource planning; the impacts of these recent agreements will be assessed and incorporated in future updates.
| 36 | | Budget and Fiscal Plan - 2023/24 to 2025/26
|
Three Year Fiscal Plan
Other revenue consists of fees, licences, investment earnings and other miscellaneous sources, incorporating estimates provided by ministries and taxpayer-supported agencies. Over the next three years, these revenues are projected to average 2.1 per cent annual growth, slightly higher than the Budget 2023 real GDP outlook.
Table 1.5.1 Comparison of Major Factors Underlying Revenue
| Calendar Year | February 28, 2023 | February 22, 2022 | ||||||||||||||||||||||||||||||
| Per cent growth unless otherwise indicated | 2022 | 2023 | 2024 | 2025 | 2022 | 2023 | 2024 | 2025 | ||||||||||||||||||||||||
| Real GDP | 2.8 | 0.4 | 1.5 | 2.4 | 4.0 | 2.5 | 2.1 | 2.4 | ||||||||||||||||||||||||
| Nominal GDP | 11.0 | 2.8 | 3.7 | 4.2 | 5.8 | 4.1 | 4.0 | 4.3 | ||||||||||||||||||||||||
| Household income | 7.1 | 6.1 | 4.3 | 4.1 | 3.6 | 3.9 | 3.7 | 3.8 | ||||||||||||||||||||||||
| Wages and salaries | 11.3 | 6.3 | 5.2 | 4.4 | 6.0 | 4.1 | 3.9 | 3.8 | ||||||||||||||||||||||||
| Corporations net operating surplus | 13.5 | -14.5 | -7.0 | 2.3 | 0.8 | 4.3 | 4.0 | 6.0 | ||||||||||||||||||||||||
| Employment | 3.2 | 0.4 | 1.0 | 1.2 | 2.8 | 1.6 | 1.2 | 1.2 | ||||||||||||||||||||||||
| Consumer expenditures on durable goods | -4.3 | -3.6 | 0.1 | 2.6 | 3.4 | 1.3 | 2.1 | 3.1 | ||||||||||||||||||||||||
| Consumer expenditures on goods and services | 9.6 | 6.9 | 4.9 | 4.2 | 8.1 | 6.6 | 5.2 | 4.0 | ||||||||||||||||||||||||
| Business investment | 11.5 | 1.4 | 5.5 | 7.0 | 3.9 | 6.2 | 4.8 | 5.8 | ||||||||||||||||||||||||
| Residential investment | 8.2 | -1.5 | 4.7 | 5.3 | 0.9 | 5.8 | 3.8 | 3.7 | ||||||||||||||||||||||||
| Retail sales | 3.0 | 1.8 | 2.9 | 3.4 | 4.0 | 3.7 | 3.6 | 3.5 | ||||||||||||||||||||||||
| Residential sales value | -30.3 | -19.8 | 20.5 | 8.2 | -19.6 | -5.1 | 2.2 | 2.4 | ||||||||||||||||||||||||
| B.C. Housing starts | -1.9 | -16.5 | -5.1 | 2.7 | -20.1 | -5.3 | -2.7 | 0.1 | ||||||||||||||||||||||||
| U.S. Housing starts | -3.0 | -16.6 | 3.9 | 0.4 | -7.2 | -5.4 | -1.4 | -2.2 | ||||||||||||||||||||||||
| SPF 2x4 price ($US/thousand board feet) | $ | 814 | $ | 400 | $ | 450 | $ | 500 | $ | 575 | $ | 475 | $ | 450 | $ | 450 | ||||||||||||||||
| Exchange rate (US cents/Canadian dollar) | 76.8 | 74.7 | 77.4 | 78.6 | 79.9 | 79.3 | 78.9 | 79.1 | ||||||||||||||||||||||||
| Fiscal Year | 2022/23 | 2023/24 | 2024/25 | 2025/26 | 2022/23 | 2023/24 | 2024/25 | 2025/26 | ||||||||||||||||||||||||
| Natural gas price ($Cdn/GJ at plant inlet) | $ | 3.81 | $ | 3.04 | $ | 2.69 | $ | 2.55 | $ | 2.09 | $ | 1.67 | $ | 1.55 | $ | 1.60 | ||||||||||||||||
| Bonus bid average bid price per hectare ($) | $ | 200 | $ | 275 | $ | 300 | $ | 200 | $ | 275 | $ | 275 | $ | 300 | $ | 200 | ||||||||||||||||
| Electricity price ($US/mega-watt hour, Mid-C) | $ | 93 | $ | 108 | $ | 99 | $ | 95 | $ | 58 | $ | 57 | $ | 51 | $ | 49 | ||||||||||||||||
| Metallurgical coal price ($US/tonne, fob Australia) | $ | 318 | $ | 252 | $ | 223 | $ | 204 | $ | 202 | $ | 163 | $ | 158 | $ | 155 | ||||||||||||||||
| Copper price ($US/lb) | $ | 3.74 | $ | 3.56 | $ | 3.73 | $ | 3.85 | $ | 3.95 | $ | 3.73 | $ | 3.57 | $ | 3.63 | ||||||||||||||||
| Average stumpage rates ($Cdn/cubic metre) | $ | 36.20 | $ | 18.07 | $ | 18.96 | $ | 21.82 | $ | 25.04 | $ | 20.71 | $ | 20.75 | $ | 19.94 | ||||||||||||||||
| Crown harvest volumes (million cubic metres) | 39.0 | 38.0 | 38.0 | 38.0 | 40.0 | 38.5 | 39.5 | 40.5 | ||||||||||||||||||||||||
Federal government contributions are forecast to increase by 8.9 per cent in 2023/24 mainly due to a significant increase in funding to support childcare. Federal contributions are expected to decrease at an average of 0.4 per cent annually over the next two years as expected increases in the existing Canada Health Transfer (CHT) and Canada Social Transfer (CST) disbursements are offset by declines in other program area funding. The combined CHT and CST contributions are forecast to average 4.2 per cent annual growth over next two years in the fiscal plan and represent about 70 per cent of total federal government contributions. Other federal government transfers are projected to decline at an average of 10.1 per cent annually over the two-year fiscal plan, mainly due to forecasts of payments under the Disaster Financial Assistance Agreements and for public transit; funding for these programs is generally updated annually and increases in future years will be shown in future budgets.
On February 13, 2023, provincial premiers and Canada's Prime Minister agreed on a health care funding proposal. The funding details will be finalized in bilateral agreements. The additional funding is not incorporated in Budget 2023.
Budget and Fiscal Plan - 2023/24 to 2025/26
| | 37 |
Three Year Fiscal Plan
Major Revenue Sources
Key assumptions and sensitivities relating to revenue are provided in Appendix Table A5. The table includes sensitivities which provide a sense of potential impacts to revenue projections if there are changes to underlying assumptions and factors that are the major drivers for preparing projections of individual revenue sources. The following text references the forecasts of these assumptions and factors in explaining individual revenue sources. An analysis of historical volatility of the economic variables related to revenue sources can be found in the 2022 British Columbia Financial and Economic Review (pages 17-18). The major revenue components are detailed below.
Taxation revenue
Personal income tax revenue declines 9.9 per cent in 2023/24 mainly due to an unusual high prior year accounting adjustment ($2.6 billion) included in the 2022/23 forecast. The revenue is expected to average 4.8 per cent growth over the next two years, in line with projected increases in wages and salaries and household income.
Corporate income tax revenue is mainly based on cash installments and settlement adjustments for prior years. Revenue is expected to decline 43.5 per cent in 2023/24 mainly due to a decrease in installments reflecting lower national corporate tax base, and settlement payment for prior years. Average annual growth over the next two years is forecast to be 4.6 per cent due to annual increases in installments reflecting the federal government's projection of national corporate taxable income, as well as annual changes in settlement payments relating to prior years.
Table 1.5.2 Corporate Income Tax Revenue
| ($ millions) | 2022/23 | 2023/24 | 2024/25 | 2025/26 | ||||||||||||
| Advance installments: | ||||||||||||||||
| – Payment share | 13.99 | % | 13.60 | % | 13.04 | % | 12.74 | % | ||||||||
| – Installments | 8,731 | 7,042 | 6,898 | 6,916 | ||||||||||||
| Prior-years' settlement payment | 1,788 | (1,104 | ) | (447 | ) | (413 | ) | |||||||||
| Corporate income tax revenue | 10,519 | 5,938 | 6,451 | 6,503 | ||||||||||||
| Annual per cent growth | 108.2 | % | -43.5 | % | 8.6 | % | 0.8 | % | ||||||||
Provincial sales tax revenue is expected to average 4.4 per cent growth annually over the three-year fiscal plan, in line with expected increases in nominal GDP and consumer expenditures on taxable goods and services. The forecast incorporates a tax measure, which has minimal impact and is outlined in Part 2: Tax Measures.
Table 1.5.3 Sales Tax Revenue
| ($ millions) | 2022/23 | 2023/24 | 2024/25 | 2025/26 | ||||||||||||
| Provincial sales taxes | 9,693 | 10,187 | 10,584 | 11,038 | ||||||||||||
| Annual per cent change (calendar year) | 2022 | 2023 | 2024 | 2025 | ||||||||||||
| Consumer expenditures on durable goods | -4.3 | % | -3.6 | % | 0.1 | % | 2.6 | % | ||||||||
| Consumer expenditures on goods and services | 9.6 | % | 6.9 | % | 4.9 | % | 4.2 | % | ||||||||
| Residential investment | 8.2 | % | -1.5 | % | 4.7 | % | 5.3 | % | ||||||||
| Government expenditures | 6.5 | % | 3.9 | % | 2.9 | % | 3.1 | % | ||||||||
| Nominal GDP | 11.0 | % | 2.8 | % | 3.7 | % | 4.2 | % | ||||||||
| Retail sales | 3.0 | % | 1.8 | % | 2.9 | % | 3.4 | % | ||||||||
| 38 | | Budget and Fiscal Plan - 2023/24 to 2025/26
|
Three Year Fiscal Plan
Motor fuel tax revenue growth is expected to remain relatively flat over the three-year plan, as lower gasoline volumes are offset by higher diesel and other fuel purchases. Diesel volumes are forecast to grow 3.0 per cent in 2023/24 and 2.0 per cent in the following two years. The forecast assumes that gasoline purchases will decline over the fiscal plan, while other fuel volumes rise in line with real GDP growth.
Carbon tax revenue is forecast to rise an average of 15.2 per cent annually over the next three years to 2025/26, mainly reflecting carbon tax rate increases. Starting on April 1, 2023, British Columbia will align with the federal carbon pricing requirements of $170 per tonne by 2030, with annual increases of $15 per tonne of CO2 equivalent emissions. The carbon tax rate increases from $50 per tonne in 2022/23 to $95 per tonne of CO2 equivalent emissions in 2025/26. The forecast also assumes the implementation of a output-based pricing system for large industrial operations, effective April 1, 2024 and this is outlined in Part 2: Tax Measures. A large portion of the revenue generated from the tax rate increases will be returned to individuals through the enhancement of the Climate Action Tax Credit.
Property tax revenue is expected to grow by an average of 5.6 per cent annually over the following three years, consistent with non-residential investment and inflation. The forecast incorporates a police tax measure , which has minimal impact and is outlined in Part 2: Tax Measures.
Property transfer tax revenue is expected to decline by 20 per cent in 2023/24 mainly due to a slower housing market, reflecting expected decline in number of home sales and the effects of higher mortgage rates. Over the last two-years of the fiscal plan property transfer tax is expected to increase at an average of 11.9 per cent annually, consistent with the expected annual changes in residential sales values. The forecast also incorporates a tax measure which partly exempts new purpose-built rental buildings and is outlined in Part 2: Tax Measures.
Employer health tax revenue is forecast at $2.7 billion in 2023/24. Over the next two years, revenue growth is expected to average 4.8 per cent annually, consistent with growth in wages and salaries.
Natural resource revenue
Natural gas royalties are expected to decrease 8.6 per cent in 2023/24 mainly due to decreased royalties from natural gas liquids and lower natural gas prices, partially offset by an improved outlook for natural gas production volumes and decreased utilization of royalty programs. Over the next two years, royalties are expected to decrease at a 13.2 per cent average annual rate as the effects of declining natural gas prices are partially offset by increased production volumes, increased royalties from natural gas liquids and decreased utilization of royalty programs.
The forecast assumes an average price of $3.04 ($Cdn/gigajoule, plant inlet) in 2023/24, down from $3.81 in 2022/23. This assumption is within the 20th percentile of the private sector forecasters, continuing the prudence the province has incorporated since 2013/14. Prices are expected to decline over the next two years, averaging $2.69 in 2024/25 and $2.55 in 2025/26, consistent with the growth of the average of the private-sector forecasts. Over the three-year fiscal plan period, the projected natural gas prices average 44 cents lower than the average of the private-sector forecasters.
See Appendix Table A6 for more details regarding natural gas price forecasts.
Budget and Fiscal Plan - 2023/24 to 2025/26
| | 39 |
Three Year Fiscal Plan
Chart 1.3 Revenue from Energy, Metals, and Minerals

Revenue from bonus bids and rents on drilling licences and leases is forecast to decline over the next three years, from $131 million in 2022/23 to $77 million in 2025/26. The bonus bid revenue recognition reflects ten-year deferral of cash receipts from the sale of Crown land tenures. Over the three-year fiscal plan period, cash sales are expected to average $4 million per year. The decrease in revenue over the fiscal plan reflects the low sales in recent years and the depletion of the deferred revenue remaining from earlier cash sales. More detail is provided in Appendix Table A5.
Mining and minerals: Revenue from mineral tax, fees and miscellaneous mining receipts is forecast to decline 19 per cent in 2023/24 mainly due to lower metallurgical coal and copper prices compared to the elevated prices experienced in 2022/23. Declining coal and copper price forecasts reflect improved global access to supply in the post-pandemic period and the effects of global inflationary and recessionary pressures. Metallurgical coal prices are assumed to continue to fall over the next two years, and revenue is projected to average a 24 per cent annual decline.
Other energy revenue is comprised of electricity sales under the Columbia River Treaty, petroleum royalties, and fees collected by the Oil and Gas Commission. These revenues are expected to decrease by an average of 1.9 per cent annually over the three-year fiscal plan mainly due lower Mid-Columbia electricity and petroleum prices.
Forest revenue is expected to decline 54.4 per cent in 2023/24 due to the impacts of lower Crown harvest volumes as well as lower overall stumpage rates and logging tax revenue mainly reflecting an assumed decrease in lumber prices from the high levels experienced in 2022. Forest revenue is expected to increase an average of 5.4 per cent over the next two years mainly due to higher overall stumpage rates reflecting an improved outlook for lumber prices. Total harvest levels on Crown land are projected to decrease from 39 million cubic metres in 2022/23 to 38 million cubic metres in 2023/24. The reduction in harvest incorporates the impact of logging deferrals in old growth forests and reduced fibre supply. Over the four years to 2025/26, the forecast assumes that the Ministry of Indigenous Relations and Reconciliation will recover $483 million of stumpage revenue in support of funding the Forest Consultation and Revenue Sharing Agreements with First Nations.
| 40 | | Budget and Fiscal Plan - 2023/24 to 2025/26
|
Three Year Fiscal Plan
Other natural resource revenue is comprised of water rentals and fees for hunting and fishing licences collected under the Wildlife Act. These revenues are expected to increase an average of 2.3 per cent annually over the next three years mainly reflecting higher water rentals collected under the Water Sustainability Act.
Other Taxpayer-supported Revenue
Fees and licences: Over the three-year fiscal plan, revenue from fees and licences is expected to average 1.7 per cent annual growth mainly due to increasing projections for post-secondary institutions and health authorities. Over the next three years, fee revenue projections from schools, universities, colleges, and health authorities (SUCH sector) account for 70 per cent of the total fee revenue forecast.
Investment earnings are expected to increase by 4.6 per cent in 2023/24 mainly due to higher recoveries through the fiscal agency loan program. Over the next two years investment income is expected to average 1.5 per cent annual growth mainly due to higher recoveries, which has an equal and offsetting higher expense, resulting in no net impact on the projected annual deficit. These recoveries are expected to comprise approximately 80 per cent of total investment earnings.
Miscellaneous revenue is projected to average 2.4 per cent annual growth over the fiscal plan period. Around 56 per cent of the annual miscellaneous revenue of approximately $4.0 billion is expected to be contributed by SUCH sector entities.
Federal Government Transfers
Canada Health Transfer and Canada Social Transfer contributions are expected to average 4.2 per cent annual growth over the three years of the fiscal plan, mainly reflecting increasing national cash transfers, partially offset by a decreasing BC population share of the national total. The plan assumes the national CHT cash disbursement increases 9.3 and 6.0 per cent in the first two years of the plan, followed by an increase of 3.5 per cent in 2025/26. The national CHT cash disbursement in 2023/24 is based on a three-year average (2021 to 2023) of Canada's nominal GDP growth. The forecast adopts the most recent published federal government outlook for national nominal GDP. The national Canada Social Transfer cash disbursement is projected to increase 3.0 per cent annually, consistent with the federal government forecast.
Other federal government contributions are expected to increase 19.4 per cent in 2023/24 mainly due to higher funding in support of childcare, public transit and transfers under the Disaster Financial Assistance Arrangements. Over the next two years other federal government contributions are expected to decrease by an average of 10.1 per cent annually mainly due to reduced program funding under Disaster Financial Assistance Arrangements and public transportation.
Budget and Fiscal Plan - 2023/24 to 2025/26
| | 41 |
Three Year Fiscal Plan
Table 1.5.4 Federal Government Contributions
| ($ millions) | 2022/23 | 2023/24 | 2024/25 | 2025/26 | ||||||||||||
| Canada Health Transfer | 6,439 | 6,733 | 7,123 | 7,377 | ||||||||||||
| Canada Social Transfer | 2,174 | 2,237 | 2,299 | 2,368 | ||||||||||||
| Total Health and Social Transfers | 8,613 | 8,970 | 9,422 | 9,745 | ||||||||||||
| COVID-19 related funding | 176 | - | - | - | ||||||||||||
| Disaster Financial Assistance Arrangements | 745 | 1,268 | 643 | 592 | ||||||||||||
| BC Housing Management Commission | 162 | 163 | 153 | 163 | ||||||||||||
| Ministry Vote Recoveries | 1,686 | 2,102 | 1,890 | 1,872 | ||||||||||||
| Other Transfers to Ministries and Agencies | 1,103 | 1,090 | 1,076 | 1,109 | ||||||||||||
| Total Other Contributions | 3,696 | 4,623 | 3,762 | 3,736 | ||||||||||||
| Total Federal Government Contributions | 12,485 | 13,593 | 13,184 | 13,481 | ||||||||||||
| BC share of national population (June 1) | 13.66 | % | 13.62 | % | 13.60 | % | 13.60 | % |
Commercial Crown Corporations
British Columbia Hydro and Power Authority (BC Hydro): BC Hydro's net income is set by regulation at $712 million in 2023/24 and 2024/25, and is forecast at $712 million in 2025/26. The payment of dividends was phased out to assist with stabilizing rate increases and improve BC Hydro's capital structure to a 60:40 debt-to-equity ratio (currently 78:22). No dividend payments are forecast during the fiscal plan period.
British Columbia Liquor Distribution Branch (LDB): LDB is projecting a net income of $1.15 billion in 2023/24, $1.17 billion in 2024/25, and $1.19 billion in 2025/26.
British Columbia Lottery Corporation (BCLC): BCLC's forecasted net income1 is $1.456 billion for 2023/24, $1.478 billion for 2024/25, and $1.484 billion for 2025/26. Approximately 23 per cent of net income is distributed to community gaming grants, First Nations, and host local governments.
Insurance Corporation of British Columbia (ICBC): ICBC is forecasting to break-even in 2023/24, followed by net income of $450 million in 2024/25 and 2025/26. On May 1, 2021 the corporation transitioned from a tort-based insurance model to the new enhanced care-based system. The forecast is subject to a number of financial and behavioural assumptions relating to the implementation of changes to the insurance model, and actual results could vary from these projections.
For more information relating to commercial Crown corporations, please see Service Plans listed on the Budget 2023 website or the corporations' respective websites.
1 Government reports BCLC's net income net of payments to the federal government and payments to the BC First Nations Gaming Revenue Sharing Limited Partnership in accordance with section 14.3 of the Gaming Control Act (B.C.)
| 42 | | Budget and Fiscal Plan - 2023/24 to 2025/26
|
Three Year Fiscal Plan
Capital Spending
In Budget 2023, capital spending on schools, hospitals, roads, bridges, hydro-electric projects and other infrastructure around the province is expected to total $48.5 billion over the three-year fiscal plan period. These investments will help ensure the necessary infrastructure is in place to deliver and improve services in communities throughout the province. Investments will also create jobs to support a sustainable, clean, secure, and fair economy.
Taxpayer-Supported Capital Spending
Taxpayer-supported capital spending over the next three years will total $37.5 billion. This includes completion of previously approved projects along with new investments to expand and sustain provincial infrastructure, including: schools, post-secondary facilities, roads, bridges, and hospitals. The Budget 2023 three-year total is $10.1 billion higher than Budget 2022 mainly due to progression of major infrastructure projects through the procurement and construction phases of development, increased housing investments, and additional funding for maintenance and upgrades of existing government assets.
Table 1.6 Capital Spending
| ($ millions) | Updated Forecast 2022/23 | Budget Estimate 2023/24 | Plan 2024/25 | Plan 2025/26 | ||||||||||||
| Taxpayer-supported | ||||||||||||||||
| Education | ||||||||||||||||
| Schools (K–12) | 877 | 1,019 | 1,134 | 1,238 | ||||||||||||
| Post-secondary institutions | 993 | 1,716 | 1,921 | 1,905 | ||||||||||||
| Health | 2,782 | 3,243 | 3,637 | 4,291 | ||||||||||||
| BC Transportation Financing Authority | 2,083 | 3,947 | 4,160 | 3,977 | ||||||||||||
| BC Transit | 111 | 232 | 485 | 495 | ||||||||||||
| Government ministries | 638 | 701 | 500 | 459 | ||||||||||||
| Social housing 1 | 430 | 808 | 665 | 686 | ||||||||||||
| Other 2 | 203 | 147 | 132 | 47 | ||||||||||||
| Total taxpayer-supported | 8,117 | 11,813 | 12,634 | 13,098 | ||||||||||||
| Self-supported | ||||||||||||||||
| BC Hydro | 3,878 | 3,815 | 3,924 | 2,653 | ||||||||||||
| Columbia Basin power projects 3 | 11 | 9 | 11 | 21 | ||||||||||||
| BC Railway Company | 8 | 7 | 5 | 3 | ||||||||||||
| ICBC | 43 | 65 | 42 | 49 | ||||||||||||
| BC Lottery Corporation | 90 | 103 | 100 | 100 | ||||||||||||
| Liquor Distribution Branch | 25 | 28 | 34 | 27 | ||||||||||||
| Total self-supported commercial | 4,055 | 4,027 | 4,116 | 2,853 | ||||||||||||
| Total capital spending | 12,172 | 15,840 | 16,750 | 15,951 | ||||||||||||
1 Includes BC Housing Management Commission and Provincial Rental Housing Corporation.
2 Includes BC Pavilion Corporation, Royal BC Museum and other service delivery agencies.
3 Joint ventures of the Columbia Power Corporation and Columbia Basin Trust.
For more information on infrastructure investments and projects in planning, please see the topic box on page 61.
| Budget and Fiscal Plan - 2023/24 to 2025/26
| | 43 |
Three Year Fiscal Plan
Investments in Schools
Over the three years of the fiscal plan, approximately $3.4 billion will be invested to maintain, replace, renovate or expand K-12 facilities. This includes continued investment to seismically upgrade or replace schools, as well as new school space to accommodate increasing enrolment in school districts.
Examples of K-12 capital investments in Budget 2023 include:
| · | Cowichan Secondary School in the Cowichan Valley School District is being replaced under the Ministry of Education and Child Care's Seismic Mitigation Program. The 1,100-student-capacity secondary school will be located on a new site at Cowichan Place, near the existing school. The $86 million replacement school is scheduled to be complete in 2024 and will be partially funded by the Cowichan Valley School District. The neighbourhood learning centre will include an Indigenous Language and Cultural Centre, Health and Wellness Centre, and School District 79 facilitation space. |
| · | Henry Hudson Elementary School in the Vancouver School District is being replaced under the ministry's Seismic Mitigation Program and will provide a 390-student-capacity replacement school, which is scheduled to complete in 2024. The new school has a total budget of $45.0 million, which includes a $1.1 million contribution from the Vancouver School District and $11.2 million from the City of Vancouver. The replacement school will include low-carbon design features, neighbourhood learning centre space for before-and-after school care and a preschool, as well as a facility for child care services funded by the City of Vancouver. |
| · | The new Snokomish Elementary School in the Surrey School District will provide 655 new spaces for students in Grade K to 7. This new school has a total budget of $43.9 million, which includes a $5.0 million contribution from the Surrey School District. The school will be designed to exceed LEED Gold standards and is scheduled to be complete in 2025. |
| · | Cedar Hill Middle School in the Greater Victoria School District is being replaced through the ministry's Seismic Mitigation Program. The $46.5 million replacement will deliver a 575-student-capacity middle school by early 2025. The project budget includes $3.6 million in additional funding from the Greater Victoria School Board. The replacement school will include low-carbon design features and an Indigenous space. |
| · | The new Glenmerry Elementary School in the Kootenay-Columbia School District will replace the existing facility and provide 435 spaces for students in Grade K to 7. This new school has a budget of $39.1 million and will deliver a safe learning environment with more space to learn, while reducing the school's carbon footprint with a design that follows modern energy efficiency strategies. The school is scheduled to be complete in 2024. To further benefit families in Trail, the new Glenmerry Elementary School will be home to a neighbourhood learning centre that will provide community programming, as well as before- and after-school child care services. |
| 44 | | Budget and Fiscal Plan - 2023/24 to 2025/26
|
Three Year Fiscal Plan
| · | Moody Elementary School in the Coquitlam School District will be replaced under the ministry's Seismic Mitigation Program. The replacement, scheduled to be finished in September 2024, will provide 385 safe seats for Grades K to 5, with an expanded core to support future additions, and an enhanced greenhouse gas reduction strategy. The new school has a total budget of $37.2 million, which includes a $5.0 million contribution from the Coquitlam School District. Included in the project is a neighbourhood learning centre that will feature space for child care services. |
| · | The new South Langford Elementary School in the Sooke School District will provide 480 new student spaces for students in Grades K to 5. This new school has a total budget of $40.6 million, which includes a $1.0 million contribution from the Sooke School District. The new three-storey school will be designed with full mass timber construction with greenhouse gas reduction strategies and will include a neighbourhood learning centre that will feature space for child care services. Construction of the school is scheduled to be complete in 2025. |
| · | Peter Ewart Middle School in the Langley School District will be seismically strengthened under the ministry's Seismic Mitigation Program and includes an internal renovation to increase capacity from 625 to 900 (275 seats) which is scheduled to complete in 2024. This school has a total budget of $38.8 million, which includes a $1 million contribution from the Langley School District. |
| · | The new Eric Langton Elementary School in Maple Ridge will replace the existing school, under the ministry's Seismic Mitigation Program. The new facility will provide 680 safe seats for Grades K to 7, and will also include an enhanced greenhouse gas reduction strategy, and a neighbourhood learning centre for child care. The replacement school has a project budget of $48.9 million, with a $2.5 million contribution from the Maple Ridge Pitt Meadows School District. The school is scheduled to be open for students in September 2025. |
| · | The new George Pringle Secondary School (formerly Westside Secondary School) in the Central Okanagan School District will provide 1,200 new spaces for students in Grade 9 to 12 in West Kelowna. This new school has a total budget of $106 million, which includes a $3 million contribution from the Central Okanagan School District. The school will be designed to include enhanced greenhouse gas reduction strategies and is scheduled to be complete in 2027. Included in the project is a neighbourhood learning centre that will include Indigenous cultural space, and a stand-alone space for child care services. |
| · | The new Burke Mountain Middle-Secondary School in Coquitlam will provide 1,000 new seats for Grades 6 to 12 students in the Burke Mountain area and will also incorporate an enlarged core to accommodate future additions to the school. The new school has a total budget of $160 million, which includes a $25 million contribution from the Coquitlam School District. The school will be built with enhanced greenhouse gas reduction strategies, and will also include neighbourhood learning centre facilities, which will be delivered in partnership with the City of Coquitlam, providing recreational space for both students and community members. The new school is anticipated to be ready for students in September 2026. |
| Budget and Fiscal Plan - 2023/24 to 2025/26
| | 45 |
Three Year Fiscal Plan
Spending to Support Post-Secondary Education
Budget 2023 includes $5.5 billion in total capital spending over the next three years by post-secondary institutions throughout the province. Investments in priority projects will build capacity and help meet the province's future workforce and economic development needs in key sectors, including health, science, trades and technology. A significant portion of this capital investment is funded through other sources, including foundations, donations, internal sources, revenues generated from services, and federal funding.
Examples of post-secondary capital investments in Budget 2023 include:
| · | $178 million for construction of the Trades and Technology Complex at the Burnaby campus of the British Columbia Institute of Technology. This project will modernize the tools and spaces needed to help meet the growing demand for skilled tradespeople in the construction sector. The project is set to start in late 2023 and complete in 2027. |
| · | $22 million for construction of the new Centre for Childhood Studies at Capilano University's North Vancouver campus, which is expected to complete in summer 2024. |
| · | $41 million for the National Centre for Indigenous Laws as an addition to the Fraser Law building at the University of Victoria that will be home to the world's first joint degree in Indigenous legal orders and Canadian common law, as well as the Indigenous Law Research Unit. Construction is underway and the project is anticipated to complete in fall 2024. |
| · | $27 million for a new First Peoples Gathering House at Simon Fraser University's Burnaby campus, which contains a large Ceremonial Hall for ceremonies and learning events. This project is underway with a target completion in summer 2024. |
| · | $100 million for a new five-storey West Shore Learning Centre campus for Royal Roads University, in collaboration with Camosun College, the University of Victoria and the Justice Institute of British Columbia. Construction is underway with a target completion by fall 2024. |
| · | The provincial student housing program, announced in 2018, to increase the number of student housing beds at B.C.'s public post-secondary institutions. Examples of approved projects include: |
| - | $34 million to construct two new student housing buildings with 150 beds at Selkirk College across two campuses - Nelson and Castlegar. This project is underway with a target completion in 2024; |
| - | $75 million to construct new mass timber student housing buildings with 376 beds at Okanagan College, across three campuses - Kelowna, Vernon and Salmon Arm. Construction is underway, anticipated to complete in 2024; |
| - | $120 million to build a 12-storey mass timber student housing building with 470 beds at the British Columbia Institute of Technology Burnaby campus. Construction is underway, anticipated to complete in 2024; |
| - | $231 million to construct two student housing buildings at the University of Victoria. The buildings include 621 net-new beds, a dining facility and multi-purpose program space. Construction is underway, anticipated to complete in 2023; |
| 46 | | Budget and Fiscal Plan - 2023/24 to 2025/26
|
Three Year Fiscal Plan
| - | $88 million to build a seven-storey mass timber student housing and dining building with 266 beds at the Vancouver Island University. This project is underway with a target completion in 2025; |
| - | $293 million to construct a 19-storey Academic and Student Housing building that includes 368 beds at Douglas College. This project is underway with a target completion in 2027; |
| - | $78 million to construct 2 new mass timber student housing buildings with a total of 217 beds at North Island College. This project is underway with a target completion in 2024; |
| - | $58 million to construct a new 6-storey, 362-bed student housing project with a mass timber Dining Hall at Capilano University. This project is underway with a target completion in 2024; and |
| - | $75 million to construct a new 6-storey, 398-bed hybrid mass timber student housing building at the University of the Fraser Valley. This project is underway with target completion in fall 2024. |
| · | B.C. Knowledge Development Fund provides capital investment funding for vital research infrastructure for public post-secondary institutions, teaching hospitals and affiliated non-profit agencies across the province, enabling institutions to attract researchers and skilled technicians. Examples of approved projects include: |
| - | $8.7 million in B.C. Knowledge Development funding for specialized equipment to add isotope production capabilities at TRIUMF's ARIEL facility at the University of British Columbia campus. The project will support the development of medical isotopes, which will advance medical imaging and targeted tumor therapy for cancer patients. This project, known as ARIEL II, is led by the University of Victoria in partnership with three other B.C. and 15 out-of-province universities. |
| - | $2.2 million in B.C. Knowledge Development funding for equipment to upgrade the Compute Canada's CEDAR supercomputer located at Simon Fraser University's Burnaby campus. The Tier-1 Data Centre is part of the Worldwide Large Hadron Collider Computing Grid, an international network of computing facilities that store and process data from the ATLAS experiment at CERN, in Switzerland. The computing facilities at Simon Fraser University are a vital component of the ATLAS research program and essential for breakthrough discoveries in particle physics research. |
| - | $1.6 million in BC Knowledge Development funding to the University of British Columbia to develop infrastructure and technologies essential to transform current used-water treatment systems. The development of sustainable water infrastructure will ensure more sustainable use of resources and access to cleaner water, reduction of waste and increase resilience to climate change. |
| Budget and Fiscal Plan - 2023/24 to 2025/26
| | 47 |
Three Year Fiscal Plan
Expanding and Upgrading Health Facilities
Capital spending on infrastructure in the health sector will total $11.2 billion over the next three years. These investments support new major construction projects and upgrading of health facilities, medical and diagnostic equipment, and information management/technology systems. These investments are supported by funding from the Province as well as other sources, such as regional hospital districts and foundations.
Examples of health sector capital investments in Budget 2023 include:
| · | $2,180 million toward a new St. Paul's Hospital at the Station Street site in Vancouver, which will include capacity for 548 inpatient beds, a new and larger emergency department, a surgical suite, consolidated specialty outpatient clinics and an underground parkade. Construction started in March 2021 and the new hospital is expected to be open for patients in 2027. |
| · | $1,724 million toward a net-new integrated hospital and cancer centre in Surrey to help meet the needs of a growing and aging population in the region. The new hospital will include 168 inpatient beds, an emergency department, a medical imaging department including computed tomography and magnetic resonance imaging (MRI), a surgical suite, a pharmacy, a laboratory and an academic space. The new cancer centre will include an oncology ambulatory care unit, chemotherapy, radiation therapy, functional imaging, a new cyclotron and space for six linear accelerators (five equipped at opening). Construction is planned to begin in 2023 and the new facility is expected to be open for patients in 2027. |
| · | $1,446 million to replace the Cowichan District Hospital in Duncan with a new hospital on a greenfield site in North Cowichan. The replacement hospital will increase inpatient beds from 134 to 204 and increase emergency department treatment spaces from 17 to 36. The facility will also increase the number of operating rooms, replace the mobile MRI with a fixed MRI, and add a helipad to the roof of the inpatient tower. Construction started in 2022 and the new hospital is expected to be open for patients in 2027. |
| · | $1,244 million for Phases 2 and 3 of the Royal Columbian Hospital Redevelopment. Phase 2 is an 11-storey, 348-bed, acute care tower including critical care and maternity, a new and expanded emergency department, a new surgical and interventional suite and an underground parkade. Phase 3 consists of critical enabling works to support the increased capacity and improve the delivery of patient care. Construction on the tower started in 2021 and the new acute care tower is expected to open for patients in 2025, with Phase 3 completing in 2026. |
| · | $861 million for the redevelopment of Richmond Hospital. The redevelopment is a multi-phased project on the hospital site that includes a new acute care tower, which will replace the original North Tower (opened in 1964). The redevelopment will result in 353 inpatient beds on the campus for an increase of 113 beds. The new acute care tower will include 216 beds (of the 353 beds), all of which will be single occupancy. Construction of the tower is expected to begin in 2025 and be open for patients in 2028, with the renovations to the South Tower and demolition of the North Tower completing in 2031. |
| · | $633 million toward the replacement of the Mills Memorial Hospital in Terrace, which was originally built in 1959. The new hospital will include 83 inpatient beds, an increase of 39 beds. There will be four operating rooms and 20 emergency department treatment spaces. The project also includes the relocation and expansion of the Seven Sisters facility, which accommodates a regional mental health rehabilitation and recovery program, on the Mills Memorial Hospital site. The new hospital will meet the needs of a Level 3 Trauma Centre. Construction started in 2021 and is expected to be completed in 2026. |
| 48 | | Budget and Fiscal Plan - 2023/24 to 2025/26
|
Three Year Fiscal Plan
| · | $612 million for Phase 1 of the Burnaby Hospital Redevelopment, which involves construction of a new six-storey, 83-bed patient care tower and a new energy centre, as well as renovation and expansion of the Support Facilities Building and renovation of the Nursing Tower. The new tower will accommodate relocated services, including medical and surgical inpatient services, outpatient services, a consolidated maternity/ labour and delivery unit, and a mental health and substance use inpatient unit. Renovations and expansion of the support facilities building will improve access to care by providing additional operating rooms, a medical device reprocessing department, additional parking and renovations to key support services. Construction started in 2021 and is expected to be complete in 2027. |
| · | $378 million for the Replacement of the Dawson Creek and District Hospital on a 10-acre greenfield site in Dawson Creek on the north-west corner of the Northern Lights College campus. The new hospital will include 70 inpatient beds, an increase of 24 beds. The project also includes an expansion of the emergency department, surgical and operating space, and ambulatory care services. Construction of the new hospital is expected to start in 2023 and be completed in 2027. |
| · | $367 million for the redevelopment of the Cariboo Memorial Hospital in Williams Lake, which includes construction of a three-storey addition and renovation of vacated spaces in the existing hospital. Once the project is complete, the redeveloped hospital will include 53 inpatient beds, an increase of 25 beds, and a larger emergency department. Construction of the three-storey addition is planned to start in 2023 and be completed in 2026. The renovations are planned to begin in 2026 and be completed in 2028. |
| · | $332 million toward Phase 2 of the Operating Rooms Renewal at Vancouver General Hospital includes renovations to the 2nd floor of the Jim Pattison Pavilion North, which will improve and expand the operating suite to two floors of highly functioning operating rooms including an additional 12 universal flexible operating rooms, two hybrid rooms and a 39-bay perioperative care unit. Construction is expected to start in 2023 and be completed in 2028. |
| · | $310 million for the construction of a new six-storey Acute Care Facility at Lions Gate Hospital will replace 108 inpatient beds, expand the perioperative suite (including eight new universal operating rooms), create a new surgical daycare and post-anesthetic recovery room to support new and existing operating rooms, and provide a new replacement medical device reprocessing department and new outpatient clinics and support services. Construction began in 2021 and is expected to complete in 2024. |
| · | $224 million toward the Western Communities Long-Term Care project, which will deliver a new, three-story, 306-bed long-term care home in the Royal Bay area of Colwood. It will include a hospice, a specialized unit for younger people suffering from brain injuries and an adult day program. Construction is expected to start in 2025 and be completed in 2027. |
| Budget and Fiscal Plan - 2023/24 to 2025/26
| | 49 |
Three Year Fiscal Plan
| · | $222 million for a new Centre for Children and Youth Living with Health Complexity will be built on the site at Slocan Street and 21st Avenue in Vancouver. The new centre will coordinate care by a multi-disciplinary team through a single point of contact, and train families, care givers and community care providers to comprehensively support their child within their home community. The facility will include 16 two-bedroom family suites for Staying Services which provide short stays in a home-like environment with a care-by-parent model while transitioning between the hospital and home, learning new care techniques, or adjusting to new equipment. Construction is expected to start in 2025 and the facility is expected to be open for patients in 2028. |
| · | $207 million toward the St. Vincent's Heather Long-Term Care project, which will deliver a new, 13-storey, 240-bed long-term care home in Vancouver on 33rd Avenue and Heather Street. It will include an adult day program with a community hall, sacred space, therapy space, hair salon, activity rooms and child care facility that can accommodate 37 children. The project is in the procurement phase with construction expected to start in 2025 and complete in 2028. |
| · | $158 million for the replacement of the Stuart Lake Hospital in Fort St. James. The new hospital will be three times larger than the current facility, with 27 beds, including 18 long-term care beds. There will also be an emergency department with two treatment rooms, a trauma bay and ambulance bay. Construction began in 2022 and is expected to complete in 2024. |
Supporting the Transportation Investment Plan
Budget 2023 includes further investments in government's Transportation Investment Plan. Over the three years of the fiscal plan, transportation capital investments totaling $13.3 billion will create and maintain a safe, reliable and equitable transportation network, support an inclusive and sustainable economy, and encourage mode shift to transit and active transportation in support of CleanBC goals. The Province is pursuing these goals with more integrated multi-modal transportation planning and projects.
The Province has secured federal cost sharing on projects and has also leveraged investments through other partnerships. B.C. continues to work with federal and municipal governments to confirm priorities for funding under various Government of Canada funding programs. Timing of capital spending on these projects is subject to several factors, including funding delivery from partners and market conditions.
The transportation capital plan includes investments in new programs alongside an array of transit, infrastructure and highway improvements, including:
| · | Constructing the $2.8 billion Broadway Subway, which will add 5.7 kilometres of SkyTrain line and six stations, to provide frequent and reliable access to one of the most congested transit corridors in Metro Vancouver, meet current and future transportation needs, reduce traffic congestion and air pollution, and improve livability. |
| · | Constructing the $4.0 billion Surrey Langley SkyTrain project that will add a 16-kilometre extension of the existing Expo Line that will run on an elevated guideway primarily along Fraser Highway from King George Station to 203 St. in Langley City. The Project includes eight new stations, three new transit exchanges, and enhanced active transportation to assist in meeting government's CleanBC targets. |
| 50 | | Budget and Fiscal Plan - 2023/24 to 2025/26
|
Three Year Fiscal Plan
| · | Constructing a new $60 million Victoria HandyDART Centre for use by BC Transit, which will facilitate growth of Victoria's bus system and support introducing a low-carbon fleet of vehicles that will enhance HandyDART services. |
| · | Replacing the Pattullo Bridge with a new $1.4 billion four-lane bridge (expandable to six-lanes) that meets current seismic and road design standards and the removal of the existing bridge. It will provide a safe and reliable crossing for vehicles, pedestrians and cyclists, and network connections in Surrey and New Westminster. |
| · | Continuing the $4.3 billion Highway 99 Tunnel Program, including constructing the new $4.2 billion eight-lane immersed tube Fraser River Tunnel that will replace the George Massey Tunnel on Highway 99, providing a toll-free crossing that aligns with regional interests and improves transit, and $137 million for cycling and walking connections across the Fraser River. |
| · | Widening a ten-kilometre section of Highway 1 through Langley between 216th Street and 264th Street to accommodate new high-occupancy vehicle lanes, including reconfiguring the 232nd Street interchange, new underpasses at Glover Road and the CP Rail crossing. The total cost of the improvements is $345 million. In addition, planning is moving ahead for the Highway 1 widening from Langley to Abbotsford, to meet the needs of the growing region, increase transit ridership, and ease congestion in key corridors. |
| · | Four-laning the final 4.8 kilometres of the 26-kilometre section of Highway 1 through the Kicking Horse Canyon between Highway 95 and the western boundary of Yoho National Park to improve safety and reliability, as well as facilitate the movement of goods for a total cost of $601 million. |
| · | Four-laning several sections of Highway 1 between Kamloops and Golden to improve safety and traffic flow and renew aging infrastructure, including: Chase Creek Road to Chase Creek Bridge (Chase – $220 million); 1st Avenue SW to 10th Street SW (Salmon Arm West – $155 million); Quartz Creek Bridge replacement (west of Golden – $121 million); Ford Road to Tappen Valley Road ($243 million) and R.W. Bruhn Bridge replacement (Sicamous – $225 million). |
| · | Constructing a $77 million flyover from Highway 17 northbound to Keating Cross Road westbound in Central Saanich to improve safety by eliminating left turn across highway traffic onto Keating Cross Road and realigning the southbound highway on-ramp. |
| · | Providing an $85 million upgrade to the Kootenay Lake ferry service including constructing an electric-ready ferry vessel for service on Kootenay Lake and upgrading the Balfour and Kootenay Bay terminals. The new vessel will have almost twice the capacity of the existing MV Balfour and be able to carry between 50 and 60 vehicles. |
| · | Providing $106 million of improvements along Highway 7 between 266th and 287th streets including a four kilometre road expansion from two to four lanes, construction of 2 metre wide shoulders, new sidewalks on 272 Street, River Road and 280 Street, new energy efficient lighting and pavement markings. |
| · | Investing $350 million to restore the Coquihalla Highway to its previous full four-lane capacity and improved resiliency at three sites including Bottletop Bridges (50 kilometres south of Merritt), Juliet Bridges (3 kilometres south of Bottletop) and Jessica Bridges (48 kilometres south of Juliet). |
| Budget and Fiscal Plan - 2023/24 to 2025/26
| | 51 |
Three Year Fiscal Plan
Approximately $13.2 billion for transportation operating and capital investments over the next three years includes:
| · | $11.5 billion of provincial investment in transportation infrastructure; and |
| · | $1.7 billion of investment leveraged through federal cost sharing and partnerships with local governments and other organizations. |
| Table 1.7 Provincial Transportation Investments |
| Updated Forecast 2022/23 | Budget Estimate 2023/24 | Plan 2024/25 | Plan 2025/26 | Fiscal Plan Total | ||||||||||||||||
| Provincial investments: | ||||||||||||||||||||
| – Highway corridor rehabilitation | 320 | 344 | 330 | 337 | 1,011 | |||||||||||||||
| – Side road improvements | 183 | 176 | 179 | 184 | 539 | |||||||||||||||
| – Pattullo Bridge replacement | 270 | 323 | 227 | 70 | 620 | |||||||||||||||
| – Highway 99 Tunnel Program 1 | 79 | 138 | 425 | 372 | 935 | |||||||||||||||
| – Transportation Infrastructure Recovery | 150 | 474 | 633 | 376 | 1,483 | |||||||||||||||
| – Highway 1 to Alberta border | 204 | 330 | 232 | 166 | 728 | |||||||||||||||
| – Broadway Subway | 245 | 372 | 332 | 468 | 1,172 | |||||||||||||||
| – Surrey Langley Skytrain 2 | 19 | 567 | 431 | 535 | 1,533 | |||||||||||||||
| – Transit Infrastructure | 90 | 236 | 388 | 420 | 1,044 | |||||||||||||||
| – Transportation and Trade Network Reliability | 340 | 624 | 796 | 777 | 2,197 | |||||||||||||||
| – Safety improvements | 40 | 52 | 57 | 54 | 163 | |||||||||||||||
| – Community and other programs | 24 | 18 | 26 | 19 | 63 | |||||||||||||||
| Total provincial investments | 1,964 | 3,654 | 4,056 | 3,778 | 11,488 | |||||||||||||||
| Investments funded through contributions from other partners | 352 | 565 | 558 | 558 | 1,681 | |||||||||||||||
| Total investments in transportation infrastructure 3 | 2,316 | 4,219 | 4,614 | 4,336 | 13,169 | |||||||||||||||
1 Includes the Fraser River Tunnel Project and Highway 99/Steveston Interchange Transit & Cycling Improvements.
2 Total project cost includes $3.939 billion capital costs and $0.071 billion operating costs.
3 Total investments include operating and capital spending.
Investments in Housing
Over the three years of the fiscal plan, approximately $2.2 billion in taxpayer-supported capital spending will be invested to develop provincially-owned housing across British Columbia. These projects are expected to create thousands of new homes over the next three years, providing a mix of shelter space, supportive housing, affordable housing, and market rental housing.
Housing projects are financed through a combination of government transfers for the development and purchase of provincially-owned assets and operating grants for the development and purchase of non-provincially-owned assets.
Examples of housing capital investments in Budget 2023 include:
| · | Through the Affordable Rental Housing (ARH) program, Stanley New Fountain Hotel, a five-storey, 142-unit mixed-use building, located at 23-51 West Cordova Street in Vancouver, is being developed under a three-party agreement between the Provincial Rental Housing Corporation, Westbank Corp. and non-profit organization PHS Community Services Society. This $69 million investment, through an innovative partnership will replace old, poorly functioning buildings with new social and market rental housing in Vancouver's Downtown Eastside and is expected to be complete in 2023. The ARH program provides rental housing for low-to-moderate income families that may not be eligible for subsidized housing, providing access to rents equal to, or lower than, average rates in the private market. |
| 52 | | Budget and Fiscal Plan - 2023/24 to 2025/26
|
Three Year Fiscal Plan
| · | BC Housing Management Commission is investing $50 million through the ARH program and other contributions and partnering with Habit Housing Society to develop 100 units of affordable rental housing for families and youth on their site at the corner of 81st Avenue and King George Boulevard in Surrey. The development, which is expected to be completed in 2023, will provide four floors of rental housing and two floors for programs in demand such as youth services, immigrant settlement services, mental health services, parent support services and services for local at-risk groups. |
| · | Cool Aid Society is redeveloping the Crosstown site, located at 3020 Douglas Street and 584 Burnside Road East in Victoria, in partnership with the Province, for a total investment of $72 million, funded through the Supportive Housing Fund (SHF) program and other contributions. The project will be a 6-storey mixed-use building with 54 SHF units, as well as commercial spaces and a child care centre. The project includes a number of studio and one-bedroom units which allow this mixed-use project to provide opportunities for SHF residents to move into independent rental units. The target for completion is 2024. |
| · | A partnership between BC Housing Management Commission, the Vancouver Chinatown Foundation, the City of Vancouver, Vancouver Coastal Health, and Canada Mortgage and Housing Corporation will create housing at 58 West Hastings Street, through a total investment of $158 million. The 231-unit mixed-use development, targeted for completion in 2024, will consist of income assistance and affordable rental units plus an integrated health unit and commercial retail space. The site is located on the southwest corner of East Hastings Street and Columbia Street in the Downtown Eastside area of Vancouver, close to transportation, commercial shops, and community facilities. The project addresses housing need for low and moderate-income singles and families in Vancouver's Downtown Eastside with a mix of mainly studios, 1-bedroom and 2-bedroom units. The building will be a 10-storey concrete mixed-use development with underground parking. Health services, commercial and office units will be located on the first three floors of the building and the remaining area will be housing units. |
| · | A 10-storey, 97-unit, mixed-use, ARH building at Clark & 1st Avenue is being developed by BC Housing Management Commission, for a total cost of $109 million, in partnership with Vancouver Coastal Health and the City of Vancouver. It will serve low-to moderate-income households, and include a social enterprise space for local residents, focusing on Indigenous healing and wellness through employment and alignment with culturally informed treatment. The building will be operated by S.U.C.C.E.S.S. Affordable Housing Society. Vancouver Coastal Health will also operate a Withdrawal Management Centre and 20 short-term transitional housing units, with the City of Vancouver operating a commercial retail unit focusing on Indigenous healing and wellness through employment. Completion is targeted for 2026. |
Budget and Fiscal Plan - 2023/24 to 2025/26
| | 53 |
Three Year Fiscal Plan
Ministry Capital Spending
Budget 2023 includes $1.7 billion in capital spending by government ministries over the fiscal plan period. This will support investments in maintaining, upgrading and expanding infrastructure, such as provincial park amenities, courthouses, correctional centres, office buildings and information systems.
Current and planned capital investments made by government ministries include:
| · | $181 million for the replacement of the Nanaimo Correctional Centre, which will be completed in 2024, replacing the existing 190-bed outdated correctional centre and increasing capacity with a 12-room unit for women. The centre will accommodate culturally responsive programming and is designed to the LEED Gold standard. |
| · | $224 million for the new Collections and Research Building of the Royal BC Museum, which will break ground in Colwood in 2023 with anticipated completion in 2025. The building will preserve, protect and provide better access to the human and natural history collections of British Columbia. |
Capital Project Reserves
The Province has included $300 million in project reserves in its three-year capital plan as a prudent planning measure. In addition to covering risks, the reserves may be used to fund emerging capital priorities of government ministries.
Financing Capital Projects
Provincial capital infrastructure spending is financed through a combination of sources:
| · | direct borrowing (debt financing); | |
| · | operating cash surplus; | |
| · | cost sharing with partners (e.g. federal government, regional hospital districts); and | |
| · | partnerships with the private sector (public-private-partnerships, or P3s). |
Self-Supported Capital Spending
Capital investments of self-supported commercial Crown agencies are projected to total $11 billion over the fiscal plan period. Self-supported investments mainly include:
| · | $10.4 billion (95 per cent) of total self-supported capital spending is for electrical generation, transmission and distribution projects to meet growing customer demand and to enhance reliability. Included in this total is construction of a third dam and hydroelectric generating station on the Peace River through the Site C project. BC Hydro's electricity system was largely built in the 1960s, 1970s, and 1980s and B.C.'s population and economy continue to grow. BC Hydro is upgrading and maintaining aging assets and building new infrastructure so that British Columbians continue to receive reliable and clean electricity. |
| 54 | | Budget and Fiscal Plan - 2023/24 to 2025/26
|
Three Year Fiscal Plan
| · | $303 million will be used for BC Lottery Corporation projects, including replacement of key legacy business systems, expansion of the lottery distribution network, and acquisition of gaming equipment to support lottery, PlayNow internet gaming, casino and community gaming activities. |
| · | $156 million will be used for ICBC projects, including investment in information technology and facility maintenance and upgrades. |
| · | $89 million will be used for Liquor Distribution Branch projects, including investments for updates and improvements to liquor stores, expansion of cannabis stores, technology-related projects and ongoing operating equipment replacements. |
Table 1.8 provides information on major capital projects, and further details on provincial capital investments are shown in the service plan of ministries and Crown agencies.
Projects Over $50 million
Approved major capital projects with multi-year budgets totaling $50 million or more, including provincial funding, are shown in Table 1.8. Annual allocations of the budget for these projects are included as part of the provincial government's capital investment spending shown in Table 1.6.
In addition to financing through provincial sources, major projects may be cost-shared with the federal government, municipalities and regional districts, and/ or the private sector. Total capital spending for these major projects is $52.7 billion, reflecting provincial financing of $45.5 billion, including internal sources and public-private-partnership liabilities, as well as $7.2 billion in contributions from the federal government and other sources, including private donations.
Major capital investments include: $3.3 billion for K-12 school projects; $1.7 billion for post-secondary institutions; $13.2 billion for health facilities; $16.0 billion for major transportation capital infrastructure; $863 million for projects in other sectors; and $17.6 billion for power generation and transmission capital projects by BC Hydro.
Since the Second Quarterly Report, six project have been added to the table:
| · | Pineview Valley Elementary ($65 million); | |
| · | Nanaimo Regional General Hospital ICU/High Acuity Unit (HAU) Redevelopment ($60 million); | |
| · | Western Communities Long Term Care ($224 million); | |
| · | Highway 5 Corridor ($350 million); | |
| · | BC Transit Victoria HandyDart Facility ($60 million); and | |
| · | BC Hydro - Mainwaring station upgrade project ($154 million). |
| The following two BC Hydro's projects have been completed since the Second Quarterly Report and no are longer listed in the table: |
| · | John Hart generating station replacement; and | |
| · | Downtown Vancouver Electricity Supply: West End strategic property purchase. |
Budget and Fiscal Plan - 2023/24 to 2025/26
| | 55 |
Three Year Fiscal Plan
Other changes since the Second Quarterly Report include:
| · | Coast Salish Elementary's year of completion was amended from 2022 to 2023 to reflect the revised project schedule; |
| · | Victoria High School's project costs increased from $80 million to $100 million due to higher project costs and scope revision. Internal borrowing increased from $77 million to $97 million. The project's year of completion was also amended from 2023 to 2024 to reflect the revised project schedule; |
| · | Burke Mountain Secondary's year of completion was amended from 2027 to 2026 to reflect the revised project schedule; |
| · | Westside Secondary project's name changed to George Pringle Secondary. The project's year of completion was also amended from 2028 to 2027 to reflect the revised project schedule; |
| · | British Columbia Institute of Technology's Health Science Centre for Advanced Simulation project costs increased from $88 million to $89 million to reflect final project costs. |
| · | Simon Fraser University's Student Housing project costs increased from $104 million to $112 million due to higher financing cost. The increase will be funded by the institution. The project's year of completion was also amended from 2022 to 2023 to reflect the revised project schedule; |
| · | Okanagan College Student Housing project costs increased from $70 million to $75 million due to updated project costing. Internal borrowing increased from $67 million to $74 million and contributions from other sources decreased by $2 million. The project's year of completion was also amended from 2023 to 2024 to reflect the revised project schedule; |
| · | North Island College Student Housing project costs increased from $66 million to $78 million due to updated project costing. Internal borrowing increased from $64 million to $76 million; |
| · | Royal Roads University West Shore Learning Centre project costs increased from $98 million to $100 million due to updated project costing. Internal borrowing increased from $78 million to $80 million; |
| · | University of the Fraser Valley Student Housing project costs increased from $74 million to $75 million due to updated project costing. Internal borrowing increased from $62 million to $63 million; |
| · | British Columbia Institute of Technology's Trades and Technology Complex project costs increased from $163 million to $178 million to reflect updated project costing. Internal borrowing increased from $137 million to $152 million; |
| · | Royal Inland Hospital Patient Care Tower project's name changed to Royal Inland Hospital Phil and Jennie Gaglardi Tower. The project's year of completion was amended from 2025 to 2026 to reflect the revised project schedule. |
| · | Dawson Creek and District Hospital Replacement project's year of completion was amended from 2026 to 2027 due to a change in procurement method. |
| 56 | | Budget and Fiscal Plan - 2023/24 to 2025/26
|
Three Year Fiscal Plan
| · | Cariboo Memorial Hospital Redevelopment project costs increased from $218 million to $367 million due to updated project costing. Internal borrowing increased from $131 million to $270 million and contributions from other funding sources increased from $87 million to $97 million. The project's year of completion was also amended from 2026 to 2028 due to a change in procurement method and a longer construction period than originally anticipated. |
| · | Highway 1 Lower Lynn Corridor Improvements project costs were amended from $198 million to $174 million to reflect final project costs. |
| · | Highway 14 Corridor Improvements year of completion was amended from 2022 to 2023 to reflect the revised project schedule; |
| · | Stanley New Fountain Hotel project's year of completion was amended from 2022 to 2023 to reflect the revised project schedule; |
| · | Crosstown project's year of completion was amended from 2023 to 2024 to reflect the revised project schedule; |
| · | Clark & 1st Ave project's year of completion was amended from 2024 to 2026 to reflect the revised project schedule; |
| · | Nanaimo Correctional Centre Replacement project costs increased from $167 million to $181 million due to higher project costs. Internal borrowing increased from $167 million to $181 million; |
| · | The anticipated total project cost of BC Hydro's Peace Region Electricity Supply (PRES) project increased from $217 million to $219 million due to additional deficiency work; |
| · | G.M. Shrum G1 to 10 control system upgrade project's year of completion was amended from 2022 to 2023 due to schedule delays caused by resource constraints; |
| · | Various Sites - NERC CIP-003v7 implementation project's name changed to Various Sites - NERC Critical Infrastructure Protection implementation project for cyber assets; and |
| · | Anticipated year of completion of the Mica modernize controls project was amended from 2023 to 2024 due to outage availability constraints. |
Budget and Fiscal Plan - 2023/24 to 2025/26
| | 57 |
Three Year Fiscal Plan
Table 1.8 Capital Expenditure Projects Greater Than $50 million 1
Note: Information in bold type denotes changes from the 2022/23 Second Quarterly Report released on November 25, 2022.
| Project | Estimated | Anticipated | ||||||||||||||||||||||
| Year of | Cost to | Cost to | Total | Internal/ | P3 | Federal | Other | |||||||||||||||||
| ($ millions) | Completion | Dec. 31, 2022 | Complete | Cost | Borrowing | Liability | Gov’t | Contrib'ns | ||||||||||||||||
| Schools | ||||||||||||||||||||||||
| Centennial Secondary 2 | 2017 | 59 | 2 | 61 | 61 | - | - | - | ||||||||||||||||
| Grandview Heights Secondary 2 | 2021 | 77 | 6 | 83 | 63 | - | - | 20 | ||||||||||||||||
| New Westminster Secondary 2 | 2021 | 90 | 17 | 107 | 107 | - | - | - | ||||||||||||||||
| Handsworth Secondary 2 | 2022 | 65 | 4 | 69 | 69 | - | - | - | ||||||||||||||||
| Pexsisen Elementary and Centre Mountain Lellum Middle 2 | 2022 | 87 | 2 | 89 | 89 | - | - | - | ||||||||||||||||
| Quesnel Junior School 2 | 2022 | 44 | 8 | 52 | 52 | - | - | - | ||||||||||||||||
| Stitó:s Lá:lém totí:It Elementary Middle School 2 | 2022 | 51 | 3 | 54 | 49 | - | - | 5 | ||||||||||||||||
| Burnaby North Secondary | 2023 | 81 | 27 | 108 | 99 | - | - | 9 | ||||||||||||||||
| Coast Salish Elementary 3 | 2023 | 19 | 24 | 43 | 38 | - | - | 5 | ||||||||||||||||
| Eric Hamber Secondary | 2024 | 53 | 53 | 106 | 94 | - | - | 12 | ||||||||||||||||
| Victoria High School | 2024 | 64 | 36 | 100 | 97 | - | - | 3 | ||||||||||||||||
| Cowichan Secondary | 2024 | 28 | 58 | 86 | 84 | - | - | 2 | ||||||||||||||||
| Burke Mountain Secondary | 2026 | 1 | 159 | 160 | 135 | - | - | 25 | ||||||||||||||||
| Pineview Valley Elementary | 2026 | - | 65 | 65 | 65 | - | - | - | ||||||||||||||||
| George Pringle Secondary (formerly Westside Secondary) | 2027 | 5 | 101 | 106 | 103 | - | - | 3 | ||||||||||||||||
| Seismic mitigation program 4 | 2030 | 1,293 | 733 | 2,026 | 2,026 | - | - | - | ||||||||||||||||
| Total schools | 2,017 | 1,298 | 3,315 | 3,231 | - | - | 84 | |||||||||||||||||
| Post-secondary institutions | ||||||||||||||||||||||||
| British Columbia Institute of Technology | ||||||||||||||||||||||||
| – Health Sciences Centre for Advanced Simulation 2 | 2022 | 82 | 7 | 89 | 66 | - | - | 23 | ||||||||||||||||
| Simon Fraser University – Student Housing | 2023 | 110 | 2 | 112 | 73 | - | - | 39 | ||||||||||||||||
| University of Victoria – Student Housing | 2023 | 143 | 88 | 231 | 128 | - | - | 103 | ||||||||||||||||
| Okanagan College – Student Housing | 2024 | 5 | 70 | 75 | 74 | - | - | 1 | ||||||||||||||||
| British Columbia Institute of Technology – Student Housing | 2024 | 14 | 106 | 120 | 108 | - | - | 12 | ||||||||||||||||
| Capilano University – Student Housing | 2024 | 3 | 55 | 58 | 41 | - | - | 17 | ||||||||||||||||
| North Island College – Student Housing | 2024 | 1 | 77 | 78 | 76 | - | - | 2 | ||||||||||||||||
| Royal Roads University – West Shore Learning Centre | 2024 | 24 | 76 | 100 | 80 | - | - | 20 | ||||||||||||||||
| University of the Fraser Valley- Student Housing | 2024 | - | 75 | 75 | 63 | - | - | 12 | ||||||||||||||||
| University of Victoria | ||||||||||||||||||||||||
| – Engineering and Computer Science Building Expansion | 2024 | 5 | 85 | 90 | 65 | - | - | 25 | ||||||||||||||||
| The University of British Columbia | ||||||||||||||||||||||||
| – School of Biomedical Engineering | 2025 | 10 | 129 | 139 | 25 | - | - | 114 | ||||||||||||||||
| Vancouver Island University – Student Housing and Dining | 2025 | - | 88 | 88 | 87 | - | - | 1 | ||||||||||||||||
| Douglas College – Academic and Student Housing | 2027 | - | 293 | 293 | 203 | - | - | 90 | ||||||||||||||||
| British Columbia Institute of Technology | ||||||||||||||||||||||||
| – Trades and Technology Complex | 2027 | - | 178 | 178 | 152 | - | - | 26 | ||||||||||||||||
| Total post-secondary institutions | 397 | 1,329 | 1,726 | 1,241 | - | - | 485 | |||||||||||||||||
| Health facilities | ||||||||||||||||||||||||
| Royal Columbian Hospital Redevelopment – Phase 1 2 | 2020 | 247 | 4 | 251 | 242 | - | - | 9 | ||||||||||||||||
| Red Fish Healing Centre for Mental Health and Addiction - θəqiʔ ɫəwʔənəq leləm 2 | 2021 | 127 | 4 | 131 | 131 | - | - | - | ||||||||||||||||
| Vancouver General Hospital – Operating Rooms Renewal – Phase 1 2 | 2021 | 101 | 1 | 102 | 35 | - | - | 67 | ||||||||||||||||
| Peace Arch Hospital Renewal 2 | 2022 | 85 | 6 | 91 | 8 | - | - | 83 | ||||||||||||||||
| Penticton Regional Hospital Patient Care Tower 2 | ||||||||||||||||||||||||
| – Direct procurement | 2022 | 63 | 13 | 76 | 18 | - | - | 58 | ||||||||||||||||
| – P3 contract | 2019 | 232 | - | 232 | - | 139 | - | 93 | ||||||||||||||||
| Dogwood Lodge Long-term Care Home Replacement | 2023 | 44 | 21 | 65 | - | - | - | 65 | ||||||||||||||||
| Lions Gate Hospital – New Acute Care Facility | 2024 | 86 | 224 | 310 | 144 | - | - | 166 | ||||||||||||||||
| Stuart Lake Hospital Replacement | 2024 | 38 | 120 | 158 | 140 | - | - | 18 | ||||||||||||||||
| Nanaimo Regional General Hospital ICU/HAU Redevelopment | 2024 | 20 | 40 | 60 | 22 | - | - | 38 | ||||||||||||||||
| Royal Inland Hospital Phil and Jennie Gaglardi Tower | ||||||||||||||||||||||||
| – Direct procurement | 2026 | 104 | 25 | 129 | 39 | - | - | 90 | ||||||||||||||||
| – P3 contract | 2022 | 286 | 2 | 288 | - | 164 | - | 124 | ||||||||||||||||
| Mills Memorial Hospital Replacement | 2026 | 303 | 330 | 633 | 513 | - | - | 120 | ||||||||||||||||
| Health facilities continued on the next page |
| 58 | | Budget and Fiscal Plan - 2023/24 to 2025/26 |
Three Year Fiscal Plan
Table 1.8 Capital Expenditure Projects Greater Than $50 million 1
Note: Information in bold type denotes changes from the 2022/23 Second Quarterly Report released on November 25, 2022.
| Project | Estimated | Anticipated | ||||||||||||||||||||||
| Year of | Cost to | Cost to | Total | Internal/ | P3 | Federal | Other | |||||||||||||||||
| ($millions) | Completion | Dec. 31, 2022 | Complete | Cost | Borrowing | Liability | Gov’t | Contrib'ns | ||||||||||||||||
| Health facilities continued | ||||||||||||||||||||||||
| Royal Columbian Hospital Redevelopment Phases 2 & 3 5 | 2026 | 338 | 906 | 1,244 | 1,182 | - | - | 62 | ||||||||||||||||
| Cowichan District Hospital Replacement | 2027 | 31 | 1,415 | 1,446 | 1,148 | - | - | 298 | ||||||||||||||||
| New St Paul's Hospital | 2027 | 437 | 1,743 | 2,180 | 1,327 | - | - | 853 | ||||||||||||||||
| Burnaby Hospital Redevelopment - Phase 1 6 | 2027 | 34 | 578 | 612 | 578 | - | - | 34 | ||||||||||||||||
| Dawson Creek and District Hospital Replacement | 2027 | 13 | 365 | 378 | 247 | - | - | 131 | ||||||||||||||||
| New Surrey Hospital and BC Cancer Centre | 2027 | 7 | 1,717 | 1,724 | 1,664 | - | - | 60 | ||||||||||||||||
| Western Communities Long Term Care | 2027 | - | 224 | 224 | 157 | - | - | 67 | ||||||||||||||||
| Centre for Children and Youth Living with Health Complexity | 2028 | 1 | 221 | 222 | 193 | - | - | 29 | ||||||||||||||||
| Cariboo Memorial Hospital Redevelopment | 2028 | 12 | 355 | 367 | 270 | - | - | 97 | ||||||||||||||||
| St. Vincent's Heather Long-Term Care | 2028 | - | 207 | 207 | 207 | - | - | - | ||||||||||||||||
| Vancouver General Hospital – Operating Rooms Renewal – Phase 2 | 2028 | - | 332 | 332 | 312 | - | - | 20 | ||||||||||||||||
| Richmond Hospital Redevelopment 7 | 2031 | 2 | 859 | 861 | 791 | - | - | 70 | ||||||||||||||||
| Clinical and Systems Transformation | 2025 | 650 | 104 | 754 | 702 | - | - | 52 | ||||||||||||||||
| iHealth Project – Vancouver Island Health Authority | 2025 | 131 | 24 | 155 | 55 | - | - | 100 | ||||||||||||||||
| Total health facilities | 3,392 | 9,840 | 13,232 | 10,125 | 303 | - | 2,804 | |||||||||||||||||
| Transportation | ||||||||||||||||||||||||
| Highway 91 Alex Fraser Bridge Capacity Improvements 2 | 2019 | 66 | 4 | 70 | 37 | - | 33 | - | ||||||||||||||||
| Highway 1 Illecillewaet Four-Laning and Brake Check improvements 2 | 2021 | 73 | 2 | 75 | 59 | - | 16 | - | ||||||||||||||||
| Highway 1 Lower Lynn Corridor improvements 2, 8 | 2021 | 174 | - | 174 | 77 | - | 66 | 31 | ||||||||||||||||
| Highway 99 10-Mile Slide 2 | 2021 | 72 | 12 | 84 | 84 | - | - | - | ||||||||||||||||
| Highway 4 Kennedy Hill Safety Improvements2 | 2022 | 52 | 2 | 54 | 40 | - | 14 | - | ||||||||||||||||
| Highway 14 Corridor improvements | 2023 | 62 | 15 | 77 | 48 | - | 29 | - | ||||||||||||||||
| Highway 1 Chase Four-Laning | 2023 | 84 | 136 | 220 | 208 | - | 12 | - | ||||||||||||||||
| Highway 1 Salmon Arm West | 2023 | 85 | 70 | 155 | 124 | - | 31 | - | ||||||||||||||||
| Highway 91 to Highway 17 and Deltaport Way Corridor improvements | 2023 | 235 | 25 | 260 | 87 | - | 82 | 91 | ||||||||||||||||
| Kootenay Lake ferry service upgrade | 2023 | 44 | 41 | 85 | 68 | - | 17 | - | ||||||||||||||||
| West Fraser Road Realignment | 2023 | 58 | 45 | 103 | 103 | - | - | - | ||||||||||||||||
| Highway 1 Quartz Creek Bridge Replacement | 2024 | 55 | 66 | 121 | 71 | - | 50 | - | ||||||||||||||||
| Highway 1 Ford Road to Tappen Valley Road Four-Laning | 2024 | 34 | 209 | 243 | 161 | - | 82 | - | ||||||||||||||||
| Highway 1 Kicking Horse Canyon Phase 4 9 | 2024 | 440 | 161 | 601 | 386 | - | 215 | - | ||||||||||||||||
| Pattullo Bridge Replacement 10 | 2024 | 638 | 739 | 1,377 | 1,076 | 301 | - | - | ||||||||||||||||
| Highway 5 Corridor | 2024 | 58 | 292 | 350 | 350 | - | - | - | ||||||||||||||||
| BC Transit Victoria HandyDART Facility | 2025 | 17 | 43 | 60 | 26 | - | 21 | 13 | ||||||||||||||||
| Highway 1 216th - 264th Street widening | 2025 | 45 | 300 | 345 | 226 | - | 96 | 23 | ||||||||||||||||
| Highway 1 R.W. Bruhn Bridge | 2025 | 33 | 192 | 225 | 134 | - | 91 | - | ||||||||||||||||
| Highway 7 Widening - 266th St to 287th St | 2025 | 16 | 90 | 106 | 77 | - | 29 | - | ||||||||||||||||
| Highway 99 / Steveston Interchange, Transit & Cycling Improvements 11 | 2025 | 30 | 107 | 137 | 137 | - | - | - | ||||||||||||||||
| Highway 17 Keating Cross Overpass | 2025 | 10 | 67 | 77 | 58 | - | 17 | 2 | ||||||||||||||||
| Broadway Subway 12 | 2026 | 983 | 1,844 | 2,827 | 1,380 | 450 | 897 | 100 | ||||||||||||||||
| Surrey Langley Skytrain Project 13 | 2028 | 53 | 3,957 | 4,010 | 2,476 | - | 1,306 | 228 | ||||||||||||||||
| Fraser River Tunnel Project 11, 14 | 2030 | 39 | 4,109 | 4,148 | 4,148 | - | - | - | ||||||||||||||||
| Total transportation | 3,456 | 12,528 | 15,984 | 11,641 | 751 | 3,104 | 488 | |||||||||||||||||
| Other taxpayer-supported | ||||||||||||||||||||||||
| Stanley New Fountain Hotel (Affordable Rental Housing) | 2023 | 69 | - | 69 | 19 | - | - | 50 | ||||||||||||||||
| 13583 81st Ave (Affordable Rental Housing) | 2023 | 37 | 13 | 50 | 37 | - | - | 13 | ||||||||||||||||
| Crosstown -Supportive Housing Fund and Community Housing Fund | 2024 | 32 | 40 | 72 | 61 | - | - | 11 | ||||||||||||||||
| 58 W Hastings (Supportive Housing Fund) | 2024 | 16 | 142 | 158 | 61 | - | 19 | 78 | ||||||||||||||||
| Clark & 1st Ave (Affordable Rental Housing) | 2026 | 7 | 102 | 109 | 75 | - | - | 34 | ||||||||||||||||
| Nanaimo Correctional Centre Replacement | 2024 | 74 | 107 | 181 | 181 | - | - | - | ||||||||||||||||
| Royal BC Museum – Collections and Research Building | 2025 | 21 | 203 | 224 | 224 | - | - | - | ||||||||||||||||
| Total other | 256 | 607 | 863 | 658 | - | 19 | 186 | |||||||||||||||||
| Total taxpayer-supported | 9,518 | 25,602 | 35,120 | 26,896 | 1,054 | 3,123 | 4,047 | |||||||||||||||||
| Budget and Fiscal Plan - 2023/24 to 2025/26 | | 59 |
Three Year Fiscal Plan
Table 1.8 Capital Expenditure Projects Greater Than $50 million 1
Note: Information In bold type denotes changes from the 2022/23 Second Quarterly Report released on November 25, 2022.
| Project | Estimated | Anticipated | ||||||||||||||||||||||
| Year of | Cost to | Cost to | Total | Internal/ | P3 | Federal | Other | |||||||||||||||||
| ($ millions) | Completion | Dec. 31, 2022 | Complete | Cost | Borrowing | Liability | Gov’t | Contrib'ns | ||||||||||||||||
| Power generation and transmission | ||||||||||||||||||||||||
| BC Hydro | ||||||||||||||||||||||||
| – UBC load increase stage 2 project 2 | 2020 | 53 | 3 | 56 | 56 | - | - | - | ||||||||||||||||
| – Bridge River 2 upgrade units 7 and 8 project 2 | 2021 | 74 | 4 | 78 | 78 | - | - | - | ||||||||||||||||
| – LNG Canada load interconnection project 2 | 2021 | 81 | 1 | 82 | 58 | - | - | 24 | ||||||||||||||||
| – Peace Region Electricity Supply (PRES) project 2, 15 | 2021 | 217 | 2 | 219 | 219 | - | - | - | ||||||||||||||||
| – Mica replace units 1 to 4 generator transformers project 2 | 2022 | 72 | 8 | 80 | 80 | - | TBD | - | ||||||||||||||||
| – G.M. Shrum G1 to 10 control system upgrade | 2023 | 67 | 8 | 75 | 75 | - | - | - | ||||||||||||||||
| – 5L063 Telkwa relocation project | 2023 | 44 | 22 | 66 | 66 | - | - | - | ||||||||||||||||
| – Lake Buntzen 1 Coquitlam Tunnel Gates Refurbishment project | 2023 | 38 | 29 | 67 | 67 | - | - | - | ||||||||||||||||
| – Mount Lehman substation upgrade project | 2023 | 51 | 7 | 58 | 58 | - | - | - | ||||||||||||||||
| – Street light replacement program | 2023 | 51 | 24 | 75 | 75 | - | - | - | ||||||||||||||||
| – Various Sites - NERC Critical Infrastructure Protection implementation project for cyber assets | 2023 | 36 | 24 | 60 | 60 | - | - | - | ||||||||||||||||
| – Wahleach refurbish generator project | 2023 | 41 | 10 | 51 | 51 | - | - | - | ||||||||||||||||
| – Capilano substation upgrade project | 2024 | 52 | 35 | 87 | 87 | - | - | - | ||||||||||||||||
| – Mica modernize controls project | 2024 | 44 | 12 | 56 | 56 | - | - | - | ||||||||||||||||
| – Vancouver Island radio system project | 2024 | 39 | 14 | 53 | 53 | - | - | - | ||||||||||||||||
| – Natal - 60-138 kV switchyard upgrade project | 2025 | 19 | 65 | 84 | 84 | - | - | - | ||||||||||||||||
| – Site C project 16 | 2025 | 10,464 | 5,536 | 16,000 | 16,000 | - | - | - | ||||||||||||||||
| – Sperling substation (SPG) metalclad switchgear replacement project | 2026 | 32 | 44 | 76 | 76 | - | - | - | ||||||||||||||||
| – Treaty Creek Terminal - Transmission Load Interconnection (KSM) project | 2026 | 25 | 84 | 109 | 72 | - | - | 37 | ||||||||||||||||
| – Mainwaring station upgrade project | 2026 | 10 | 144 | 154 | 154 | - | - | - | ||||||||||||||||
| Total power generation and transmission | 11,510 | 6,076 | 17,586 | 17,525 | - | - | 61 | |||||||||||||||||
| Total self-supported | 11,510 | 6,076 | 17,586 | 17,525 | - | - | 61 | |||||||||||||||||
| Total $50 million projects | 21,028 | 31,678 | 52,706 | 44,421 | 1,054 | 3,123 | 4,108 | |||||||||||||||||
| 1 | Only projects that receive provincial funding and have been approved by Treasury Board and/or Crown corporation boards are included in this table. Ministry service plans may highlight projects that still require final approval. Capital costs reflect current government accounting policy. |
| 2 | Assets have been put into service and only trailing costs remain. |
| 3 | The anticipated total cost was previously reported as $52 million and has been reduced to $43 million to reflect current estimates. |
| 4 | The Seismic Mitigation Program consists of all spending to date on Phase 2 of the program and may include spending on projects greater than $50 million included in the table above. |
| 5 | The Royal Columbian Hospital new acute care tower is expected to be available to patients in 2025. |
| 6 | The concept plan for Phase 2 of the Burnaby Hospital Redevelopment has been approved. Financial information will be added to the table upon business case approval. |
| 7 | The Richmond Hospital new acute care tower is expected to be available to patients in 2028. |
| 8 | The project scope and total cost previously included $24 million of corridor improvements that were completed on behalf of the District of North Vancouver. |
| 9 | Kicking Horse Canyon Project costs exclude $11 million of past planning costs which are expensed. |
| 10 | Pattullo Bridge forecasted to open to the public in 2024 with old bridge decommissioning to follow. Forecasted amount reflects total expenditures including capitalized and expensed items. |
| 11 | Project is part of the Highway 99 Tunnel Program. |
| 12 | The Broadway Subway Project forecast and value of costs incurred to date include the City of Vancouver in-kind contribution of land rights, in keeping with the approved project budget. Under current government accounting, purchased intangible assets are given accounting recognition, and contributed intangible assets, such as land use rights or licenses are not. |
| 13 | Total project cost includes $3.939 billion capital costs and $0.071 billion operating costs. |
| 14 | The Fraser River Tunnel is forecasted to open to the public in 2030 with the removal of the existing tunnel to follow. |
| 15 | The total cost represents the gross cost of the project and has not been netted for Federal Government contributions. The Federal Government's contribution amount is dependent on the final actual project costs and what costs are eligible under the agreement. |
| 16 | The approved updated project cost estimate is $16 billion, with a project in-service date of 2025 (first and last generating unit in-service in December 2024 and 2025, respectively). The anticipated project cost and cost to date include capital costs, charges subject to regulatory deferral and certain operating expenditures. |
| 60 | | Budget and Fiscal Plan - 2023/24 to 2025/26 |
Three Year Fiscal Plan
Building a Sustainable Province
Budget 2023 continues government’s commitment towards addressing critical infrastructure needs throughout the province. A record $37.5 billion in investments over the next three years will continue to deliver the infrastructure in health, education, housing and transportation that British Columbians rely on. These investments are expected to create approximately 125,000 direct and indirect jobs over three years.
The Budget 2023 capital plan funds the construction of critical infrastructure in the immediate term and also provides projects for the future. There are currently 39 major taxpayer-supported projects (i.e. projects over $50 million) in construction, totaling $15.4 billion. There are also 14 major taxpayer-supported projects in procurement, totaling $9.2 billion.
Planning the design, procurement and construction of major infrastructure requires significant time and due diligence. Several projects highlighted below are in planning stages with critical scope and budget in further development. The planning stage is completed with the approval of a business plan — at which point the budget for the project is confirmed and reported in quarterly financial reporting as shown in the table summarizing Capital Expenditures on Projects Greater Than $50 Million (see page 58).
Building a Better Health Care System
The Province continues to deliver on its commitment to construct new and modern health facilities with hospital projects in Dawson Creek, Terrace, the Cowichan Valley, and throughout the lower mainland, including the New St. Paul's Hospital in Vancouver. Additional hospital projects are in business planning to continue progress towards strengthening the province's health care system.
The COVID-19 pandemic highlighted a need to renew and expand health authority-owned long term care facilities. Procurement is under way for the Western Communities Long Term Care Centre in Colwood and the St. Vincent's Heather Long Term Care Centre in Vancouver. More facilities are in planning stages with additional business plans expected for approval over the coming year.
The Province also remains committed to improving access to cancer care in all regions of British Columbia. A new cancer care centre in Surrey is in procurement with an expected completion in 2027. New cancer centres in Kamloops and Nanaimo have advanced in planning.
The Province is establishing a continuum of treatment and recovery services for people to access when needed, in a timely manner and closer to home. This includes expansion of recovery community centres throughout the province and more beds that provide treatment for people with severe mental illness and chronic or severe substance abuse.
In addition to these facilities, the Province has provided funding to support the planning and development of a new medical school at Simon Fraser University. The new medical school is a key component of the Province's health human resource strategy.
New Homes for British Columbians
Government is delivering on its commitments to build more affordable housing for British Columbians. The capital plan includes $2.0 billion in new investments over three years to support BC Housing and Building BC programs, more student housing beds and transit-oriented development. More information on these initiatives can be found in the overview of government's housing strategy on page 11.
| Budget and Fiscal Plan - 2023/24 to 2025/26
| | 61 |
Three Year Fiscal Plan
Mobility for All British Columbians
Budget 2023 includes $13.3 billion in transportation investments over the next three years. In addition to highway rehabilitation and upgrades, funding is provided for regional improvements spanning all areas of the province. The capital plan supports the Highway 99 Tunnel Program, starting with the replacement of the Steveston Interchange which will improve connections for vehicles, transit users, pedestrians and cyclists and includes replacement of the current George Massey Tunnel. Budget 2023 also includes funding to complete the replacement of the Pattullo Bridge in 2024.
Government is delivering on commitments to facilitate goods movement through the vital Highway 1 trade corridor and to make sure British Columbians can travel with more safety and less delay. Over the fiscal plan period, highway widening and bridge replacement projects along Highway 1 from Kamloops to the Alberta border will be completed, including the Kicking Horse Canyon Phase 4 project. Work is ongoing to expand mobility for communities of the Fraser Valley and to prepare for the expected population increase in the region. Widening of Highway 1 from 216th Street to 264th Street is scheduled for completion in 2025 and will include high occupancy vehicle and electric vehicle lanes. This will build off of the 6-laning of the highway from 202nd Street to 216th Street which was completed in 2020. Government continues to plan mobility improvements along Highway 1 through the Fraser Valley.
Clean and Sustainable Transportation
The transportation sector contributes close to 40 per cent of the greenhouse gas emissions in the province. Government remains committed to delivering the means for British Columbians to choose cleaner, more efficient modes of transport. Procurement for the Surrey Langley SkyTrain began in August 2022 with major construction expected to begin in 2024. Once completed, the project will connect passengers from King George SkyTrain Station in Surrey to Langley City Centre in a span of 22 minutes.
Preliminary planning on the Millennium Line extension to UBC is ongoing. The project will better connect students, employees and residents who travel between UBC and other parts of Metro Vancouver with high speed and frequent SkyTrain service.
Budget 2023 also includes an additional $100 million in funding for infrastructure investments to expand active transportation options for British Columbians. These are in addition to annual grant funding the Province provides to partners to improve active transportation networks throughout the province.
Recovering Critical Infrastructure
The Province has prioritized the reinstatement of critical highway infrastructure with a $1.4 billion investment over three years for Transportation Infrastructure Recovery.
Flooding and washouts associated with the November 2021 flooding event damaged more than 20 sites along 130 kilometres of the Coquihalla between Hope and Merritt, including seven bridges where spans collapsed or were heavily damaged. In December 2022, the Coquihalla reopened to four lanes following completion of temporary repairs at three bridge sites. Work will continue into early 2024 to complete permanent repairs.
Flooding and washouts associated with the November rains damaged 18 sites along the Highway 1 corridor between Hope and Spences Bridge. Construction work to return the highway to its previous capacity began in Fall 2022.
In November 2022, Highway 8 between Merritt and Spences Bridge was open to all vehicle traffic, restoring connectivity to residents, Indigenous communities and the local forestry and mining industries. Flooding washed out more than 25 sections of the highway. More than seven kilometres of the highway was completely lost during the event. While the temporary repairs are complete, crews will continue to undertake permanent repairs on the corridor.
| 62 | | Budget and Fiscal Plan - 2023/24 to 2025/26
|
Three Year Fiscal Plan
Achieving Environmental Social and Governance Objectives
Government introduced the Environmental, Social and Governance (ESG) Framework for Capital as part of Budget 2022. Using this framework, investments in provincial infrastructure are now being leveraged to achieve additional benefits for British Columbians. These investments include opportunities for apprentices and traditionally underrepresented groups in the trades to gain valuable work experience on provincial construction projects; the creation of new child care spaces within public sector buildings; support for the growing mass timber industry in B.C. by building public sector buildings with engineered mass timber products; and the construction of low emission, climate resilient public sector buildings.
The ESG Framework for Capital provides guidance and resources for provincial project teams as they consider which investments are poised for success on their projects. While not all capital policy objectives are well suited to each project, when considered across the entire provincial capital plan, there are many benefits.
To date, the ESG Framework for Capital has:
| · | Enabled apprentices to work 202,658 hours on provincial construction projects. This represents 8.6 per cent of the total hours worked on provincial projects with a labour model in place. |
| · | Supported 286,091 hours worked by women on provincial construction projects, representing 12.1 per cent of the total hours worked on provincial projects with a labour model in place. This is more than double the average amount of construction labour performed by women in British Columbia (6 per cent) and Canada (5 per cent)1. |
| · | Supported 328,406 hours worked by Indigenous People on provincial construction projects, representing 13.9 per cent of the total hours worked on provincial projects with a labour model in place. This is more than double the average amount of construction labour performed by Indigenous Persons in Canada (5 per cent)2. |
| · | Supported the use of mass timber in 50 provincial construction projects, 23 of which are in planning, 16 are under construction, and 11 are complete. This includes hybrid projects which have combinations of mass timber and traditional construction materials. |
| · | Supported the creation of 829 new child care spaces across 17 provincial infrastructure projects. Currently there are 271 spaces in planning, 262 under construction, and 296 spaces have been completed. |
| · | Supported the Province's CleanBC goals for public sector buildings through the establishment of new minimum requirements for emissions and climate resilience. All new public sector buildings must perform a climate risk assessment and incorporate mitigation measures for identified climate risks. All new public sector buildings must also meet one of three emissions reduction pathways: |
| i) | use an electric heat and hot water source, |
| ii) | be built to the highest available energy step code level for the specific building type, or |
| iii) | achieve emissions reductions 50 per cent below a LEED Gold baseline using natural gas. |
There are currently 38 major provincially owned buildings in planning and a further 56 under construction that have confirmed they will meet these new standards.
1 BuildForce Canada. "2022-2027 Construction and Maintenance Looking Forward Forecast". 2022
2 Indigenous Construction Careers. "Why Focus on Indigenous Employment in Construction?". 2020
| Budget and Fiscal Plan - 2023/24 to 2025/26
| | 63 |
Three Year Fiscal Plan
Provincial Debt
Table 1.9 Provincial Debt Summary1
| Updated | Budget | |||||||||||||||
| Forecast | Estimate | Plan | Plan | |||||||||||||
| ($ millions unless otherwise indicated) | 2022/23 | 2023/24 | 2024/25 | 2025/26 | ||||||||||||
| Taxpayer-supported debt | ||||||||||||||||
| Provincial government | ||||||||||||||||
| Operating | - | 2,440 | 4,128 | 4,710 | ||||||||||||
| Capital 2 | 39,908 | 44,089 | 49,727 | 55,696 | ||||||||||||
| Total provincial government | 39,908 | 46,529 | 53,855 | 60,406 | ||||||||||||
| Taxpayer-supported entities | ||||||||||||||||
| BC Transportation Financing Authority | 19,505 | 23,171 | 27,764 | 32,305 | ||||||||||||
| Health Authorities and Hospital Societies | 2,019 | 2,381 | 2,334 | 2,279 | ||||||||||||
| Post Secondary institutions | 874 | 952 | 1,002 | 989 | ||||||||||||
| Social Housing | 1,125 | 2,227 | 2,957 | 2,644 | ||||||||||||
| Other | 270 | 357 | 524 | 772 | ||||||||||||
| Total taxpayer-supported entities | 23,793 | 29,088 | 34,581 | 38,989 | ||||||||||||
| Total taxpayer-supported debt | 63,701 | 75,617 | 88,436 | 99,395 | ||||||||||||
| Self-supported debt | 29,788 | 31,607 | 33,671 | 34,405 | ||||||||||||
| Total debt before forecast allowance | 93,489 | 107,224 | 122,107 | 133,800 | ||||||||||||
| Forecast allowance 3 | - | 700 | 500 | 500 | ||||||||||||
| Total provincial debt | 93,489 | 107,924 | 122,607 | 134,300 | ||||||||||||
| Taxpayer-supported debt to GDP ratio | 16.4 | % | 18.9 | % | 21.3 | % | 23.0 | % | ||||||||
| Total provincial debt to GDP ratio | 24.0 | % | 27.0 | % | 29.6 | % | 31.1 | % | ||||||||
| Taxpayer-supported debt per capita ($) | 11,975 | 13,878 | 15,929 | 17,600 | ||||||||||||
| Taxpayer-supported interest bite (cents per dollar of revenue) | 2.4 | 2.9 | 3.5 | 3.9 | ||||||||||||
1 Provincial debt is prepared in accordance with Generally Accepted Accounting Principles and presented consistent with the Debt Summary Report included in the Public Accounts. Debt is shown net of sinking funds and unamortized discounts, excludes accrued interest, and includes non-guaranteed debt directly incurred by commercial Crown corporations and debt guaranteed by the Province.
2 Includes debt incurred by the government to fund the building of capital assets in the education, health, social housing and other sectors.
3 Reflects the operating statement forecast allowance for each year (amounts are not cumulative). Since it is unknown as to which agency would require this debt, the forecast allowance is shown as a separate item over the plan.
Government obtains financing from outside sources mainly through debt instruments that are to be repaid on future dates. Total provincial debt is projected to increase by $40.8 billion over the fiscal plan period to $134.3 billion by 2025/26.
Taxpayer-supported debt is forecast to increase by $35.7 billion to $99.4 billion by 2025/26 to finance the operating deficits and significant investments in capital infrastructure over the next three years, including $8.9 billion for education projects, $11.2 billion for health facilities, $13.3 billion for transportation sector projects, $2.2 billion for social housing and $2.0 billion for other service delivery agencies and general government.
Increasing debt levels are expected to result in rising debt metrics, with taxpayer-supported debt-to-GDP rising from 16.4 per cent in 2022/23 to 23.0 per cent at the end of the fiscal plan period. Despite the projected increase, B.C.'s debt metrics have improved from Budget 2022 due to the 2022/23 surplus (see Chart 1.4).
The Province's operating results have generally been better than forecast, reflecting the prudence built into the budget and fiscal plan; as a result, actual debt levels have been lower than projected. Chart 1.4 shows the lower debt affordability metrics, compared to the projection in Budget 2022, which resulted from significantly better operating results in 2022/23. Borrowing requirements and debt are also affected by changes in the timing of capital project spending.
| 64 | | Budget and Fiscal Plan - 2023/24 to 2025/26
|
Three Year Fiscal Plan
The self-supported debt of commercial Crown corporations is forecast to increase by $4.6 billion over the fiscal plan period, ending at $34.4 billion. This increase is mainly for capital investments related to improving and expanding British Columbia's hydroelectric generation assets.
Chart 1.4 Debt to GDP
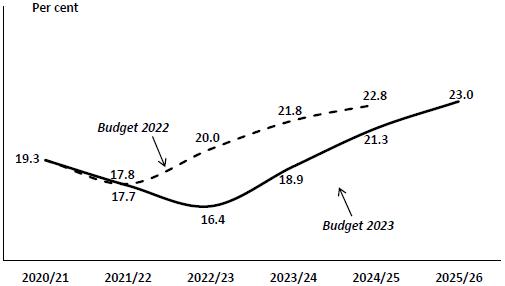
In spite of the debt level increase, debt servicing costs remain at a historically low level due to low interest rates, particularly in the past three years. However, with rising rates and debt levels, government’s debt servicing costs are expected to rise. A common metric of affordability is the interest bite, or the taxpayer-supported interest cost as a percentage of revenue, which is forecast at 2.4 per cent in 2022/23 and 3.9 per cent in 2025/26.
Chart 1.5 Debt Affordability
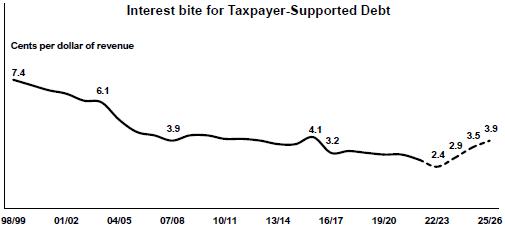
Government's borrowing requirements over the fiscal plan period are anticipated to total $58.7 billion, which will finance government's operating and capital investments, as well as refinancing of debt maturities (see Table 1.10).
Total provincial debt is presented consistent with the Debt Summary Report included in the Public Accounts. Debt is shown net of sinking fund investments and unamortized discounts, excludes accrued interest, and includes non-guaranteed debt directly incurred by commercial Crown corporations and debt guaranteed by the Province.
| Budget and Fiscal Plan - 2023/24 to 2025/26
| | 65 |
Three Year Fiscal Plan
The reconciliation between provincial debt and the financial statement debt is shown in Appendix Table A16.
Additional details on government's outstanding debt are provided in Appendix Tables A17 to A19.
Relationship Between Surplus (Deficit) and Debt
In addition to operating results, the change in debt is affected by cash balance changes and other working capital changes, as well as the debt financing requirements of government's capital plan. Table 1.11 reconciles the forecast deficits with changes in debt.
Table 1.10 Provincial Borrowing Requirements
| Updated | Budget | |||||||||||||||
| Forecast | Estimate | Plan | Plan | |||||||||||||
| ($ millions) | 2022/23 | 2023/24 | 2024/25 | 2025/26 | ||||||||||||
| Total provincial debt1 at beginning of year | 90,666 | 93,489 | 107,924 | 122,607 | ||||||||||||
| New borrowing 2 | 8,711 | 18,241 | 20,597 | 19,345 | ||||||||||||
| Direct borrowing by Crown corporations and agencies | 174 | 105 | 57 | 39 | ||||||||||||
| Retirement of debt 3 | (6,062 | ) | (4,611 | ) | (5,771 | ) | (7,691 | ) | ||||||||
| Change in forecast allowance | - | 700 | (200 | ) | - | |||||||||||
| Net change in total debt | 2,823 | 14,435 | 14,683 | 11,693 | ||||||||||||
| Total provincial debt1 at year end | 93,489 | 107,924 | 122,607 | 134,300 | ||||||||||||
| Annual growth in debt (per cent) | 3.1 | 15.4 | 13.6 | 9.5 | ||||||||||||
1 Provincial debt is prepared in accordance with Generally Accepted Accounting Principles and presented consistent with the Debt Summary Report included in the Public Accounts. Debt is shown net of sinking funds and unamortized discounts, excludes accrued interest, and includes non-guaranteed debt directly incurred by commercial Crown corporations and debt guaranteed by the Province.
2 New long-term borrowing plus net change in short-term debt.
3 Sinking fund contributions, sinking fund earnings and net maturities of long-term debt (after deduction of sinking fund balances for maturing issues).
Table 1.11 Provincial Debt Changes
| Updated | Budget | |||||||||||||||
| Forecast | Estimate | Plan | Plan | |||||||||||||
| ($ millions) | 2022/23 | 2023/24 | 2024/25 | 2025/26 | ||||||||||||
| Total provincial debt1 at beginning of year | 90,666 | 93,489 | 107,924 | 122,607 | ||||||||||||
| Taxpayer-supported debt changes | ||||||||||||||||
| Annual deficit (surplus) | (3,592 | ) | 4,216 | 3,754 | 3,043 | |||||||||||
| Non-cash items | (2,441 | ) | (3,016 | ) | (3,195 | ) | (3,374 | ) | ||||||||
| Changes in cash balances 2 | (2,496 | ) | (1,526 | ) | (493 | ) | (992 | ) | ||||||||
| Changes in other working capital balances 3 | 1,772 | 429 | 119 | (816 | ) | |||||||||||
| Taxpayer-supported capital spending | 8,117 | 11,813 | 12,634 | 13,098 | ||||||||||||
| Annual change in total taxpayer-supported debt | 1,360 | 11,916 | 12,819 | 10,959 | ||||||||||||
| Self-supported debt changes | ||||||||||||||||
| Net operating cash flows | (2,592 | ) | (2,208 | ) | (2,052 | ) | (2,119 | ) | ||||||||
| Commercial crown capital spending | 4,055 | 4,027 | 4,116 | 2,853 | ||||||||||||
| Annual change in total self-supported debt | 1,463 | 1,819 | 2,064 | 734 | ||||||||||||
| Annual change in forecast allowance | - | 700 | (200 | ) | - | |||||||||||
| Annual change in total provincial debt | 2,823 | 14,435 | 14,683 | 11,693 | ||||||||||||
| Total provincial debt1 at year end | 93,489 | 107,924 | 122,607 | 134,300 | ||||||||||||
1 Provincial debt is prepared in accordance with Generally Accepted Accounting Principles and presented consistent with the Debt Summary Report included in the Public Accounts. Debt is shown net of sinking funds and unamortized discounts, excludes accrued interest, and includes non-guaranteed debt directly incurred by commercial Crown corporations and debt guaranteed by the Province.
2 Changes in cash balances include all cash balances from the Consolidated Revenue Fund, School Districts, Universities, Colleges, Health Authorities, Hospital Societies and other taxpayer-supported agencies.
3 Changes in other working capital balances include changes in accounts receivables, accounts payable, accrued liabilities, deferred revenue, investments, restricted assets and other assets.
| 66 | | Budget and Fiscal Plan - 2023/24 to 2025/26
|
Three Year Fiscal Plan
Risks to the Fiscal Plan
Table 1.12 provides the estimated fiscal impacts of the identified sensitivities for some of the key variables in the fiscal plan projections on an individual basis. However, inter-relationships between the variables may cause the actual variances to be higher or lower than the estimates shown in the table. For example, an increase in the US/CDN dollar exchange rate may be partly offset by higher commodity prices.
The assumptions and risk sensitivities for individual revenue sources and major program areas can be found in Appendix Tables A5 and A6, beginning on page 148.
Table 1.12 Key Fiscal Sensitivities
| ($ millions) | ||||
| Variable | Increases of | Annual Fiscal Impact | ||
| Nominal GDP | 1% | $200 – $300 | ||
| Lumber prices (US$/thousand board feet) | $50 | $100 – $150 1 | ||
| Natural gas prices (Cdn$/gigajoule) | 25 cents | $130 – $150 2 | ||
| US exchange rate (US cent/Cdn $) | 1 cent | -$25 to -$50 | ||
| Interest rates | 1 percentage point | -$186 | ||
| Debt | $500 million | -$19 to -$20 |
1 Sensitivity relates to stumpage revenue only.
2 Sensitivities can vary significantly especially at lower prices.
Own Source Revenue
The main areas that may affect own source revenue forecasts are B.C.'s overall economic activity, the performance of its major trading partners, the exchange rate and commodity prices.
Revenues are sensitive to economic performance. For example, taxation and other revenue sources are driven by economic factors, such as household income, consumer expenditures, housing starts, employment, population growth and the exchange rate. The revenue forecast contained in the fiscal plan is based on the economic forecast detailed in Part 3: British Columbia Economic Review and Outlook. As well, it incorporates commodity price forecasts developed by the Ministry of Forests and the Ministry of Energy, Mines and Low Carbon Innovation based on private sector information.
Income tax revenue forecasts are based on projections of household income, net operating surpluses of corporations and the federal government estimates of national corporate taxable income. The forecasts are updated from reports on tax assessments provided by the Canada Revenue Agency. As a result, revenue estimates and tax credits can be affected by timing lags in the reporting of current and prior year tax assessments by the Canada Revenue Agency.
Natural resource revenues in British Columbia can also be volatile, largely due to the influence of the cyclical natural resource sector in the economy and the effects of the old growth strategy. Changes in commodity prices, such as natural gas, lumber or coal may have a significant effect on natural resource revenues and economic growth.
| Budget and Fiscal Plan - 2023/24 to 2025/26
| | 67 |
Three Year Fiscal Plan
The economic and revenue forecasts could be affected by trade related issues, such as the ongoing U.S.-Canada softwood lumber dispute. The imposition of countervailing and anti-dumping duties by the U.S. on Canadian softwood lumber exports has the effects of increasing market uncertainty and volatility as well as increasing costs for Canadian producers. B.C. disagrees with the views that the lumber industry is subsidized or that it sells lumber into the U.S. at below cost or sales value in Canada, and is supporting the federal government in its challenges of the application of duties to the World Trade Organization and under Chapter 19 of the North American Free Trade Agreement and under Chapter 10 of the Canada-United States-Mexico Agreement.
Over the fiscal plan period, the outlook for forest revenue incorporates lower stumpage rates from the higher rates experienced in 2022/23. The impacts of the mountain pine beetle infestation, forest fires and the old growth deferral strategy have reduced the supply of timber available to the forest industry. In addition, the industry continues to pay duties on their exports of softwood lumber products into the United States. As a result, some B.C. communities and residents that are reliant on the forest sector have been adversely affected by the continuing uncertainty and volatility. Actual results for a number of factors including assumptions for lumber prices, harvest volumes, interest and exchange rates could pose risks to the fiscal plan.
Details on major assumptions and sensitivities resulting from changes to those assumptions are outlined in Appendix Table A5.
Federal Government Contributions
Potential policy changes regarding federal government allocations, including health and social transfers and cost-sharing agreements, could affect the revenue and the expenditure forecasts. The forecast incorporates preliminary estimates of the cost associated with severe flooding and other events that are eligible for federal government contributions under the Disaster Financial Assistance Arrangements. Expenses and the related federal contributions could be higher depending on the timing of the determination of the expenses by the Province and federal validation.
Crown Corporations
Crown corporations provided financial forecasts and statements of assumptions approved by their boards, which were used to prepare the fiscal plan. These forecasts, along with further details on assumptions and risks, are also included in the service plans of these corporations and agencies, being released with the budget.
SUCH Sector
The fiscal plan incorporates three-year projections for school districts, post-secondary institutions, and health authorities, based on plans submitted by those entities.
Forecasts for the health authorities have been signed off by the board chairs of the respective health authorities. The Ministry of Health will continue to work with the health authorities to manage any emerging revenue and spending pressures.
Forecasts for the universities, colleges, and institutions have been signed off by chairs of the board or audit committee and lead financial officers.
Forecasts for the combined school districts have been compiled by the Ministry of Education based on the requirements of the School Act, the current year plans developed by the school districts, and ministry policy assumptions respecting future funding allocations. Variances from these assumptions could impact the fiscal plan.
| 68 | | Budget and Fiscal Plan - 2023/24 to 2025/26
|
Three Year Fiscal Plan
Spending
Government funds several demand-driven programs, including those delivered through third-party delivery agencies, such as health care, K-12 and post-secondary education, income assistance and community social services. The budgets for these programs reflect reasonable estimates of demand and other factors such as price inflation. If demand is higher than estimated, this will result in a spending pressure to be managed.
The spending plans for the Ministry of Forests and the Ministry of Emergency Management and Climate Readiness include base amounts to fight wildfires and deal with floods and other public emergencies. Unanticipated or unpredictable occurrences may affect expenses in these ministries.
Increasing levels of debt result in a higher potential impact from the risk of interest rate increases.
Details on major assumptions and sensitivities resulting from changes to those assumptions are shown in Appendix Table A7 and in ministry service plans.
Capital Risks
The capital spending forecasts included in the fiscal plan may be affected by subsequent planning (i.e. design development) and procurement activities (i.e. receipt/review of construction bids) resulting in project costs that are higher than the initial approved budgets. For large capital projects, government will review the budget and scope risks, and the strategies to mitigate these risks.
Other risks affecting capital spending forecasts include:
| · | changes in the timing of capital project spending, which may reduce borrowing requirements and debt needed to fund capital investments in the near term; |
| · | weather and geotechnical conditions, including the outcome of environmental impact studies, causing project delays and/or unexpected costs; |
| · | changes in market conditions, including service demand, the impact of inflation on building material costs, the availability of, and wage rates for, skilled workers, and borrowing costs; |
| · | the accuracy of capital project budget and construction schedule forecasts; |
| · | the successful negotiation/timing of cost-sharing agreements with the federal government and other funding partners; and |
| · | the timing and outcomes of public-private sector partnership negotiations. |
Pending Litigation
The spending plan for the Ministry of the Attorney General contains provisions for payments under the Crown Proceeding Act based on estimates of expected claims, judgments and related costs of settlements likely to be incurred. Litigation developments may occur that are beyond the assumptions used in the plan (for example, higher-than-expected volumes, or size of claim amounts and timing of judgments and settlements). These developments may affect government revenues and/or expenditures in other ministries. Litigation may also impact government agencies and corporations.
| Budget and Fiscal Plan - 2023/24 to 2025/26
| | 69 |
Three Year Fiscal Plan
Write-downs and Other Adjustments
Ministry budgets provide for anticipated levels of asset or loan write-downs where these expenses can be reasonably estimated. The overall spending forecast does not make allowance for extraordinary items other than the amount provided in the contingencies vote.
Prudence and Risk
The economic, financial, and external variables and factors that impact the estimates of revenues, expenditures, capital spending and debt will change throughout the year as new information becomes available with potentially material impacts. As a result, the actual operating surplus/deficit, capital expenditure and debt figures may differ from the current forecast. Government will continue to update the fiscal plan throughout the year.
Government incorporates four main levels of prudence to help mitigate risks to the budget plan projections. These prudence measures generally have resulted in government positively exceeding its budget targets.
| · | The Budget 2023 economic outlook is lower than the average of the forecasts provided by the members of the Economic Forecast Council (EFC). The Budget 2023 plan assumes annual real GDP growth of 0.4 per cent in 2023, 1.5 per cent in 2024, and between 2.2 per cent and 2.4 per cent annually over the 2025 to 2027 period. This is lower than the EFC average by 0.1 percentage points in 2023 and 2024. The prudent outlook compared to the private sector acknowledges the downside risks to the economic forecast in the near-term. |
| · | The Budget 2023 natural gas price forecast is lower than the private sector average over the next three years, reflecting the recommendation of Dr. Tim O'Neill in 2013 to adopt more caution in preparing the natural gas royalty forecast. Over the ensuing three years, the Budget 2023 natural gas price projection averages 44 cents lower than the average of the private sector forecasters (see Appendix Table A6 for details). |
| · | Budget 2023 includes forecast allowances of $700 million in 2023/24 and $500 million in 2024/25 and $500 million in 2025/26. The forecast allowance helps offset the impacts of revenue volatility and statutory spending such as additional costs to fight wildfires and to deal with floods and other public emergencies. |
| · | The Budget 2023 expense forecast includes a General Programs Contingencies allocation of $2.3 billion in 2023/24, $2.2 billion in 2024/25 and $1.2 billion in 2025/26. The contingencies allocation is a prudent measure to provide for unforeseen costs that may arise, and to fund priority initiatives as well as CleanBC. The contingency provision is higher than normal to also account for costs for climate related disasters. In addition, Budget 2023 also includes contingencies funding for pandemic recovery measures, the Shared Recovery Mandate, and future cost pressures. |
The EFC provides advice to the Minister of Finance annually on issues facing the global economy and B.C.'s economic outlook, including areas of concern, risks and opportunities for the B.C. economy. The Minister of Finance receives advice from staff and colleagues on the various levels of prudence incorporated in the fiscal plan, tax policy initiatives for consideration and the potential risks that could arise over the next three years. Since the risks could be ongoing or one-time in nature and could impact both revenues and expenditures, consideration is given to both the forecast allowance and contingencies vote allocations. However, since a number of these risks are not readily quantifiable, there is no specific formulaic approach in the determination of the forecast allowance and contingencies vote allocations.
| 70 | | Budget and Fiscal Plan - 2023/24 to 2025/26
|
PART 2 | TAX MEASURES
Table 2.1 Summary of Tax Measures
| Taxpayer Impacts | |||||||||||
| Effective Date | 2023/24 | 2024/25 | |||||||||
| ($ millions) | |||||||||||
| Carbon Tax Act | |||||||||||
| · | Increase carbon tax rates by $15 per tonne of CO2 equivalent emissions annually and implement an output-based pricing system for large industrial operations | April 1, 2023 | 584 | 780 | |||||||
| · | Introduce reduced tax on natural gas & propane for qualifying greenhouse growers | April 1, 2023 | (16 | ) | (20 | ) | |||||
| Income Tax Act | |||||||||||
| · | Increase BC Family Benefit | July 1, 2023 | (58 | ) | (77 | ) | |||||
| · | Increase climate action tax credit with carbon tax rate increase1 | July 1, 2023 | (412 | ) | (549 | ) | |||||
| · | Extend farmers' food donation tax credit | January 1, 2024 | * | * | |||||||
| · | Extend interactive digital media tax credit | September 1, 2023 | (46 | ) | (110 | ) | |||||
| · | Introduce an income-tested renter's tax credit | January 1, 2023 | (307 | ) | (313 | ) | |||||
| Provincial Sales Tax Act | |||||||||||
| · | Introduce exemption for automated external defibrillators | March 1, 2023 | * | * | |||||||
| · | Amend rules for online marketplace facilitators and online marketplace services | July 1, 2023 | 2 | 3 | |||||||
| Motor Fuel Tax Act | |||||||||||
| · | Increase refund rates for International Fuel Tax Agreement licensees | April 1, 2023 | * | * | |||||||
| Police Act | |||||||||||
| · | Set property tax rates | January 1, 2023 | 5 | 7 | |||||||
| Home Owner Grant Act | |||||||||||
| · | Increase threshold for home owner grant phase-out to $2.125 million from $1.975 million | January 1, 2023 | * | * | |||||||
| Property Transfer Tax Act | |||||||||||
| · | Partially exempt new purpose-built rental buildings | January 1, 2024 | (1 | ) | (5 | ) | |||||
| School Act | |||||||||||
| · | Set provincial residential class school property tax rates | January 1, 2023 | * | * | |||||||
| · | Set provincial non-residential class school property tax rates | January 1, 2023 | * | * | |||||||
| Taxation (Rural Area) Act | |||||||||||
| · | Set provincial rural area property tax rates | January 1, 2023 | * | * | |||||||
| Various Acts | |||||||||||
| · | Various technical measures | Various | * | * | |||||||
| Total | (249 | ) | (284 | ) | |||||||
* Denotes measures that have no material impact on taxpayers.
1 Amounts beyond 2023/24 are subject to further adjustments to align with carbon tax rate increases and government's policy decision that to protect affordability new carbon pricing revenues will be returned through the climate action tax credit.
Budget and Fiscal Plan - 2023/24 to 2025/26
| | 71 |
Tax Measures
Tax Measures — Supplementary Information
For more details on tax changes see:
www.gov.bc.calbudgettaxchanges
Carbon Tax Act
Carbon Tax Rates Increased by $15 Per Tonne of CO2Equivalent Emissions Annually and Output-Based Pricing System Implemented for Large Industrial Operations
Effective April 1, 2023, carbon tax rates are increased by $15 per tonne of carbon dioxide equivalent emissions (CO2e) annually until reaching $170 per tonne in 2030. Rates will generally align with the federal carbon pricing backstop rates, where applicable.
Government will review rates under the new carbon pricing framework prior to 2026 to ensure that B.C. is on track to achieve its emissions reduction targets.
Carbon tax applies broadly and does not specifically target individuals based on their gender, class, sexuality, race, ethnicity, religion, age, or ability status. Single-income female-led households have a higher carbon tax burden than single-income male-led households. Research suggests that B.C.'s carbon tax has no significant difference in direct carbon tax paid by rural versus urban households. However, rural communities may have higher indirect carbon tax burdens (e.g., through higher shipping costs resulting in a higher price of goods), and colder regions of the province may have higher carbon tax costs for home heating.
Effective April 1, 2024, large emitters will be exempt from tax imposed under the Carbon Tax Act. These operations will instead be subject to a made-in-B.C. output-based pricing system (OBPS), under which they will pay for emissions that exceed performance-based emissions limits. Certain operations that do not meet the threshold for being regulated under the OBPS will be able to opt in. These changes will ensure that B.C.'s carbon pricing regime meets federal stringency requirements. Further policy development and engagement to finalize the details of B.C.'s OBPS will be conducted over 2023 by the Ministries of Environment and Climate Change Strategy and Finance.
Reduced Tax on Natural Gas and Propane for Qualifying Greenhouse Growers Introduced
Effective April 1, 2023, qualifying commercial greenhouse growers can claim a point-of-sale reduced carbon tax for purchases of natural gas and propane used for heating and generating CO2for increased crop productivity.
The point-of-sale reduced tax will apply to greenhouse growers that grow vegetables, fruits, bedding plants, flowers, ornamental plants, tree seedlings, or nursery landscape plants. To qualify, greenhouse growers must grow the crops identified above and generate gross revenues of $20,000 or more in the previous 12 months and have a reasonable estimate that revenues will be $20,000 or more in the next 12 months.
| 72 | | Budget and Fiscal Plan - 2023/24 to 2025/26
|
Tax Measures
The point-of-sale reduced tax for greenhouse growers will help to reduce indirect carbon price costs on vegetables, fruits, and other crops. Generally, increases in food prices disproportionately impact low-income individuals and families where equity-seeking groups (e.g., women, single parents, racialized people, and newcomers) and Indigenous peoples are overrepresented.
Income Tax Act
BC Family Benefit Increased
BC Family Benefit amounts were increased for January, February, and March 2023, as part of a relief package for B.C. families to help deal with rising costs of living. For April 2023 and subsequent months, these benefits are set to return to their normal amounts.
Effective July 1, 2023, BC Family Benefit amounts are permanently increased based on the number of children under age 18 in a family.
The maximum annual benefit is increased to $1,750 for a family's first child, $1,100 for a second child, and $900 for each subsequent child. The maximum annual benefit is phased out for families with adjusted family net income over $27,354. So, a two-parent family with two children could receive up to an additional $250 per year.
The minimum benefit is increased to $775 for the family's first child, $750 for a second child, and $725 for each subsequent child for families earning up to an adjusted family net income of $87,533. So, a two-parent family with two children currently receiving the BC Family Benefit will receive at least an additional $145 per year.
Also, effective July 1, 2023, a maximum annual supplement of $500 will be provided to single parent families. The single parent supplement is added to the maximum annual benefit otherwise available to the parent. So, a single parent with two children could receive up to an additional $750 per year after the benefit increase and the additional supplement.
BC Family Benefit payments are provided on a family basis; therefore, the increase in benefit amounts will support a similar proportion of men and women with children. This permanent enhancement to the BC Family Benefit will help lower income families the most as the total benefits under the program are reduced for families with adjusted family net income greater than $27,354. The single parent supplement will benefit single parent households, which have a lower average income than two-parent families and are more likely to be female than male.
Climate Action Tax Credit Increased
Effective July 1, 2023, the maximum annual climate action tax credit is increased from $193.50 to $447 for an adult, from $193.50 to $223.50 for a spouse or common-law partner, and from $56.50 to $111.50 per child. Single parent families will continue to receive the spouse or common-law partner amount for the first child in the family.
The climate action tax credit helps offset the effects of carbon taxes paid by low- to moderate-income individuals and families. The climate action tax credit is being increased as a result of revenue generated by the scheduled carbon tax rate increase this year.
Budget and Fiscal Plan - 2023/24 to 2025/26
| | 73 |
Tax Measures
Single individuals comprise 75 per cent of the recipients, of which 57 per cent are female and 43 per cent are male. To provide greater equity between single individuals and families, the income thresholds for families will be increased at a higher rate.
An Income-Tested Renter's Tax Credit Introduced
Effective January 1, 2023, a new refundable renter's tax credit is introduced. Eligible households that rent and occupy living accommodation in B.C. for at least six months in a calendar year will be able to claim the credit. The credit will be income-tested with a maximum amount of $400 per year for households with adjusted income up to $60,000. Households with adjusted income above the $60,000 threshold will receive a gradually reduced credit, reaching zero at $80,000 based on the 2023 taxation year. The thresholds will be indexed to inflation each year.
Eligibility for the renter's tax credit will exclude amounts paid for a campsite, moorage or a manufactured home site, under a rent-to-own plan, or by employers for accommodation that is not required to be included as income. To qualify, rent must be paid to unrelated persons.
The credit will be available for individuals who have reached the age of 19 and are resident in B.C. on December 31 each year.
Relative to the general population, renters are more likely to be younger, have lower income, and be single. Approximately 30 per cent of renting households are families.
Farmers' Food Donation Tax Credit Extended
The farmers' food donation tax credit is extended for three years to the end of 2026.
The average farm operator is male, married or in a common-law relationship, and is 55 years of age or older. The tax credit provides indirect benefits to food bank clients, who are disproportionately low-income earners on income or disability assistance.
Interactive Digital Media Tax Credit Extended
The interactive digital media tax credit is extended for five years to August 31, 2028.
The interactive digital media tax credit supports an industry that has a predominantly male work force.
Provincial Sales Tax Act
Exemption for Automated External Defibrillators Introduced
Effective March 1, 2023, automated external defibrillators (AEDs) are exempt from provincial sales tax. In addition, kits containing AEDs, and parts and services for AEDs, including pads, are exempt from provincial sales tax. This exemption encourages a greater supply of AEDs in B.C. communities.
Over 60 per cent of out-of-hospital sudden cardiac arrests occur in individuals over the age of 65. Over two-thirds of these individuals are male; however, females are less likely to survive an out-of-hospital cardiac arrest.
| 74 | | Budget and Fiscal Plan - 2023/24 to 2025/26
|
Tax Measures
Lower income individuals are more likely to have an out-of-hospital sudden cardiac arrest than individuals in higher income quintiles. These disparities are greater for individuals under the age of 65. Out-of-hospital sudden cardiac arrest rates per capita are higher in the Northern, Vancouver Island, and Interior health regions than in the Vancouver Coastal and Fraser regions.
Rules on Online Marketplace Facilitators and Online Marketplace Services Amended
Effective July 1, 2023, the rules related to the collection obligations of online marketplace facilitators and the taxation of online marketplace services are amended for clarification, simplification, and consistency.
These changes reflect feedback the government has received from industry stakeholders since the announcement of the initial changes in Budget 2022.
In particular, the rules are amended so that online marketplace services are taxable when an online marketplace facilitator provides the service to facilitate the sale or provision of non-taxable services.
The rules establishing when an online marketplace service is taxable are amended to align more closely with the place-of-supply rules used to administer the federal goods and services tax.
Additional technical changes are made including changes to the tax collection obligations of online marketplace facilitators in respect of commercial sales, rules on when an online marketplace facilitator is considered to provide an online marketplace service, and to the definitions of online marketplace facilitator, online marketplace seller, and online marketplace service.
These changes do not impose new taxes on taxable goods, software, or taxable services obtained by consumers through online platforms. The changes will affect some purchases of services by online businesses.
Motor Fuel Tax Act
Refund Rates for International Fuel Tax Agreement Licensees Increased
Effective April 1, 2023, the refund rates for International Fuel Tax Agreement licensees are increased to reflect scheduled increases in the carbon tax each April 1 from 2023 through to 2030. This will ensure International Fuel Tax Agreement licensees pay correct carbon tax on fuel they use in B.C.
Police Act
Property Tax Rates Set
The police tax is a provincial property tax to help recover the province's costs of policing in rural areas and small municipalities with populations below 5,000.
Budget and Fiscal Plan - 2023/24 to 2025/26
| | 75 |
Tax Measures
The Police Act allows for up to 50 per cent of legislated costs to be recovered through the police tax. Additional policy-based deductions further reduce the revenue. Historically, 33 per cent of costs have been recovered through the tax. Due to how the tax is calculated, recent increases in property values have resulted in a reduction of tax revenues. This reduction has occurred despite steady provincial policing cost increases in recent years. Effective for the 2023 tax year, the rates will be set to recover 33 per cent of legislated costs, after policy-based reductions. On average, households will see an increased tax rate of up to $0.03/$1,000 of assessed value. This will return tax levels to previous norms, while keeping local contributions well below both the legislated maximum, as well as below levels for comparable services in areas not subject to the tax.
This change affects rural areas and municipalities with populations below 5,000.
Property Transfer Tax Act
Partial Exemption for New Purpose-built Rental Buildings Introduced
Effective for transactions that occur on or after January 1, 2024, purchases of new purpose-built rental buildings will be exempt from the further 2 per cent property transfer tax that is applied to the fair market value of the residential component of a taxable transaction that exceeds $3 million. Purpose-built rental buildings are those that are non-stratified and held as rental, on a monthly basis or longer, for at least 10 years. The residential portion of the building must be entirely for rental and have at least four apartments. This measure builds on the rental housing revitalization tax exemption provided in Budget 2018 to meet point 28 of Government's 30-point housing plan, i.e., encouraging more rentals via property tax exemptions. It further encourages the construction of new purpose-built rental buildings.
School Act
Provincial Residential Class School Property Tax Rates Set
The long-standing rate setting policy is that average residential class school property taxes, before application of the home owner grant, increase by the previous year's provincial inflation rate. This rate-setting policy has been in place since 2003 and continues in 2023.
The tax rate policy seeks to achieve an equitable balance between taxpayers in different areas of the province. Tax rates are lower in school districts that have the highest average assessed values. Still, a residential taxpayer with an average home value in a school district with low average values pays less school tax on their home than a taxpayer with an average home value in a school district with higher average assessed values.
Provincial Non-Residential Class School Property Tax Rates Set
A single province-wide school property tax rate is set for each of the non-residential property classes. Consistent with long-standing policy, the rates for 2023, except for the rate for the industrial property classes, will be set so that non-residential class school tax revenue will increase by inflation plus tax on new construction from the 2022 tax revenues. The light industry class tax rate will be set at the same rate as the business class tax rate, consistent with the policy announced in Budget 2008.
This rate-setting policy has been in place since 2005, except for the 2020 tax year when significant property tax relief was delivered to commercial property classes through a reduction in school property tax rates.
| 76 | | Budget and Fiscal Plan - 2023/24 to 2025/26
|
Tax Measures
Effective for the 2023 taxation year, the provincial industrial property tax credit for class 4 major industry is removed. The 2023 major industry school tax rate will be reduced to offset the removal of the credit.
The industrial property tax credit was introduced for the 2009 tax year and has the same effect as simply setting a lower school tax rate for class 4 major industry. The credit mechanism was a trade irritant.
Taxation (Rural Area) Act
Provincial Rural Area Property Tax Rates Set
A single rural area residential property tax rate applies province wide. The long-standing rate-setting policy that average residential rural property taxes increase by the previous year's provincial inflation rate continues for 2023.
Consistent with long-standing policy, non-residential rural area property tax rates are set so that total non-residential rural area tax revenue increases by inflation plus tax on new construction.
With the exception of utility and industrial properties in the Peace River Regional District, there is one rural tax rate per property class, province wide. This means the tax falls more heavily in areas where average values are higher. The effect is relatively minor because average values do not vary widely in rural areas across B.C.
Nisga'a Final Agreement Act
Ability to Exempt Nisga'a Citizens from Property Tax on Nisga'a Lands by the Nisga'a Nation Introduced
Effective on royal assent, the Nisga'a Nation will have the ability to establish property tax exemptions for Nisga'a citizens for property on Nisga'a Lands. This change will create flexibility for the Nisga'a Nation to broadly determine when, and if, it is appropriate for property taxation to apply to Nisga'a citizens on Nisga'a Lands. This measure is the result of collaborative engagement with the Nisga'a Nation and aligns with government's reconciliation commitments to self-determination and inherent right of self-government under the Declaration Act Action Plan.
Treaty First Nation Taxation Act
Ability to Exempt Treaty First Nation Members from Property Tax on Treaty Lands by Treaty First Nations Introduced
Effective on royal assent, Treaty First Nations will have the ability to establish property tax exemptions for Treaty First Nation members or constituents for property on their treaty lands. This will create flexibility for Treaty First Nations to broadly determine when, and if, it is appropriate for property taxation to apply to their members or constituents on their treaty lands. This measure is the result of collaborative engagement with Treaty First Nations and aligns with government's reconciliation commitments to self-determination and inherent right of self-government under the Declaration Act Action Plan.
Budget and Fiscal Plan - 2023/24 to 2025/26
| | 77 |
Tax Measures
Various Acts
Various Technical Measures
| · | The Provincial Sales Tax Act is amended: |
| – | effective April 1, 2013, to clarify that, for the purposes of the provincial sales tax, the federal goods and services tax does not form part of the taxable purchase price of goods brought or sent into B.C. for use; |
| – | effective September 1, 2022, to clarify that, for the purposes of the provincial sales tax, the federal luxury tax imposed under the Select Luxury Items Tax Act does not form part of the taxable purchase price or lease price; and |
| – | effective July 1, 2023, to ensure that heated tobacco products are not included in the definition of "vapour product". This change makes a temporary correction permanent, meaning that heated tobacco products will continue to be subject to tobacco tax as well as the base 7 per cent provincial sales tax. |
| · | Effective January 1, 2023, the Interest Rate under Various Statutes Regulation and the Interest on Overdue Accounts Payable Regulation are amended to calculate interest in accordance with the International Fuel Tax Agreement, on carriers' delinquent payments and overdue refunds payable by B.C. to carriers who claim refunds. |
| · | Effective on royal assent, the Carbon Tax Act, the Forest Act, the Home Owner Grant Act, the Insurance Premium Tax Act, the Land Tax Deferment Act, the Logging Tax Act, the Mineral Land Tax Act, the Mineral Tax Act, the Motor Fuel Tax Act, the Petroleum and Natural Gas Act, the Property Transfer Tax Act, the Provincial Sales Tax Act, and the Taxation (Rural Area) Act are each amended to harmonize the confidentiality provisions of those statutes with the confidentiality provisions in the Employer Health Tax Act, the Income Tax Act, and the Speculation and Vacancy Tax Act. |
| · | Effective July 1, 2020, the Income Tax Act's production services tax credit is amended to allow corporations to claim labour expenditures incurred up to 120 days prior to the pre-certification form submission date under the credit, regardless of how late the pre-certification form was filed. This will only apply to film productions that incurred their first eligible accredited labour expenditure between July 1, 2020, and February 21, 2022. |
| · | The Income Tax Act is amended effective the date of the relevant federal changes: |
| – | to clarify the references to the federal Act when determining extended assessment periods; |
| – | to clarify the application of federal provisions for the purposes of the foreign tax credit; |
| – | to clarify that certain references to Canada in the federal Act remain as references to Canada for the purposes of the provincial Act; |
| – | to adopt an extension to a taxpayer's reassessment period in certain circumstances; |
| – | to clarify the application of federal penalty provisions; |
| – | to clarify that the COVID-19 disability support deduction applies for the purposes of calculating the provincial credit for mental or physical impairment; |
| 78 | | Budget and Fiscal Plan - 2023/24 to 2025/26
|
Tax Measures
| – | to exclude certain federal programs from the application of the refund provisions; |
| – | to harmonize the application of the federal administrative provisions for foreign-based information or documents; and |
| – | as announced in Budget 2021, to extend the period to incur renounceable expenses for the purposes of the BC mining flow-through share tax credit in respect of agreements entered into after February 2018, and before 2021, and to exclude, for the purposes of the mining exploration tax credit, those renounced expenses. |
| · | The Income Tax Act is further amended: |
| – | effective February 23, 2022, to clarify the application of federal administrative provisions to the clean buildings tax credit; |
| – | effective on royal assent, to update references to the Canada Revenue Agency; and |
| – | effective on royal assent, to modernize the language for access to information held by other public bodies. |
| · | Effective March 15, 2020, the Insurance Premium Tax Act and the Logging Tax Act are amended to align the powers for the waiver or cancellation of penalties with the powers found in the Employer Health Tax Act. |
| · | Effective on royal assent, the Insurance Premium Tax Act and the Logging Tax Act are amended to harmonize the offence and penalty provisions with the provisions found in the Employer Health Tax Act. |
| · | Effective January 1, 2024, the Insurance Premium Tax Act is amended to make electronic filing and payments mandatory, to specify when an electronic payment is deemed to have been received, and to allow for electronic notices of assessment. |
| · | Effective on a date to be specified by regulation, the Insurance Premium Tax Act and the Logging Tax Act are amended to allow for a fee to be charged to taxpayers to recover costs associated with out-of-province audits. |
| · | Effective November 27, 2018, the Speculation and Vacancy Tax Act is amended to clarify who is a corporate interest holder in respect of a corporation that owns residential property when a receiver of the corporation is appointed. |
| · | The Speculation and Vacancy Tax Regulation is being amended to clarify geographic areas used to determine the annual fair market rent for residential property. The annual fair market rent is used for the purposes of applying the non-arm's length tenancy exemption if the owners are untaxed worldwide earners (satellite families) or foreign owners. |
Budget and Fiscal Plan - 2023/24 to 2025/26
| | 79 |
Tax Measures
New Carbon Pricing Model
Climate Action and Carbon Pricing
Government has legislated targets to reduce greenhouse gas (GHG) emissions to 40 per cent below 2007 levels by 2030, 60 per cent by 2040 and 80 per cent by 2050. Announced in October 2021, the CleanBC Roadmap to 2030 committed to strengthening B.C.’s efforts to meet legislated GHG emissions reduction targets through accelerated and expanded actions in pathways including: low carbon energy, cleaner transportation, better buildings and communities, and cleaner industry, among others. Carbon pricing is a key component in ensuring the Province meets its emissions targets.
B.C. implemented North America’s first broad-based carbon tax in 2008. In December 2016, B.C. joined the federal government and most other provinces and territories in agreeing to the Pan-Canadian Framework on Clean Growth and Climate Change. Provinces and territories were required to have a carbon price of $50 per tonne of CO2 equivalent emissions in place by 2022. In areas that did not meet federal requirements, the federal backstop carbon pricing system was imposed. In December 2020, the federal government announced that all provinces and territories must have a carbon price that increases by $15 per tonne annually starting in 2023 until it reaches $170 per tonne in 2030.
In Budget 2022, government announced it would review the carbon tax to ensure it continues to drive emissions reductions while protecting affordability and economic competitiveness. B.C. also committed to laying out a plan to continue to meet or exceed the federal benchmark in line with the increasing federal price requirements. Budget 2023 implements the review’s results through changes to annual carbon tax rates and how large industry participates in the tax model, and addresses affordability by increasing support for British Columbians.
Increasing B.C.’s Carbon Tax
Carbon pricing is recognized as an effective, transparent, and effcient way to encourage emissions reductions at the lowest cost to consumers, businesses, and government. B.C.’s carbon tax is currently at $50 per tonne, and starting April 1, 2023, carbon tax rates will increase annually by $15 per tonne until rates are equal to $170 per tonne in 2030:
Table 1 Carbon Tax Rates - 2023 to 2030
| BC Carbon Tax | ||||
| Rate ($/tonne | ||||
| Effective Date | CO2e) | |||
| Prior to 2023 | $ | 50 | ||
| April 1, 2023 | $ | 65 | ||
| April 1, 2024 | $ | 80 | ||
| April 1, 2025 | $ | 95 | ||
| April 1, 2026 | $ | 110 | ||
| April 1, 2027 | $ | 125 | ||
| April 1, 2028 | $ | 140 | ||
| April 1, 2029 | $ | 155 | ||
| April 1, 2030 | $ | 170 | ||
With these increases, British Columbia will be aligned with federal carbon pricing requirements, and the federal government confirmed this in November 2022. The Ministries of Finance and Environment and Climate Change Strategy will review the rates under the carbon pricing framework prior to 2026 to ensure it is working to achieve our emissions reduction targets.
Starting April 1, 2024, large emitters, such as pulp and paper mills, oil and gas operations, and large mines, will transition to a new carbon pricing model. This new, made-in-B.C. output-based pricing system (B.C. OBPS), will establish performance-based emissions limits and price operations’ emissions that exceed those limits. Rather than requiring emitters to pay the carbon tax up front and receiving industrial incentive payments under the CleanBC Program for Industry at the end of each year, this new system will exempt them from the carbon tax and instead evaluate emissions performance on the basis of required reporting at the end of each year and price their emissions under the OPBS accordingly. Certain operations that do not meet the requirements for being regulated under this system may opt-in, exempting them from the carbon tax but requiring annual reporting and pricing of their emissions under the OBPS. Further policy development and engagement to finalize B.C.’s OBPS will occur in 2023 by the Ministries of Environment and Climate Change Strategy and Finance.
| 80 | | Budget and Fiscal Plan - 2023/24 to 2025/26
|
Tax Measures
Support for British Columbians
Increasing carbon tax rates will increase the carbon tax paid by British Columbians, which will vary depending on family composition and household use of taxable fuels. To protect affordability, revenues generated by the new carbon tax increases will be directed to carbon tax relief for British Columbians through enhancements to the climate action tax credit. As noted in Part 2 – Tax Measures, effective July 1, 2023, the maximum annual climate action tax credit will increase from $193.50 to $447 for an adult, from $193.50 to $223.50 for a spouse or common-law partner, and from $56.50 to $111.50 per child. This means that the climate action tax credit will cover the cost of carbon tax for more families and individuals than before. Compared to the previous benefit year base amount, families with children and with income less than $60,000 will receive more through the climate action tax credit than carbon tax paid on average. The same is true for individuals with income less than $43,000. As carbon tax rates increase, B.C. will increase the amounts paid to adults and children and raise the threshold for eligibility, with the intent of providing a full or partial credit to over 80 per cent of households by 2030.
Table 2 shows the planned annual increases to the climate action tax credit for the next three benefit years. The planned increases are based on current estimated carbon tax revenues. The amounts for 2024/25 and 2025/26 are estimates only and are subject to change.
Table 2 Increases to climate action tax credit amounts 2023/24 to 2025/26
| Spouse or | ||||||||||||
| Benefit year | common- | |||||||||||
| (July to June) | Adult | law | Child | |||||||||
| 2023/24 | $ | 447.00 | $ | 223.50 | $ | 111.50 | ||||||
| 2024/25 | $ | 504.00 | $ | 252.00 | $ | 126.00 | ||||||
| 2025/26 | $ | 606.00 | $ | 303.00 | $ | 151.50 | ||||||
Government will monitor revenues from the new carbon pricing framework on an annual basis and prioritize directing incremental revenues to relief for people through the climate action tax credit.
Support for Industry
A portion of revenues paid by industry regulated by the made-in-B.C. OBPS will be directed to continuing the CleanBC Industry Fund, which supports the development, trial, and deployment of projects that reduce GHG emissions from large industrial operations. As further policy work and the design of the new model for industry emissions pricing is underway, future decisions will confirm revenues directed to this program after affordability measures are fully addressed. In the interim, the CleanBC Program for Industry will continue under its current funding model, until the made-in-B.C. OBPS is ready for implementation.The funding available to the CleanBC Industry Fund under OBPS is anticipated to be confirmed in Budget 2024.
CleanBC and Other Supports
Government continues to prioritize spending to support the Province’s role as a global leader in climate action, with CleanBC committing investments of over $3.5 billion since 2019. The Province is actively pursuing climate action initiatives that both mitigate and respond to the effects of the changing climate.
| Budget and Fiscal Plan - 2023/24 to 2025/26 | | 81 |
Tax Measures
Further to these investments, Budget 2023 enhances climate spending by providing additional funding of $44 million to support B.C.’s transition to a zero emission economy, including more funding for the CleanBC Go Electric Commercial Vehicle Pilots Program, support for the BC Hydrogen Office, and enhancements to regulatory compliance and enforcement tools for both light and medium/ heavy duty vehicles. As well, government is investing $100 million in capital over three years to improve active transportation infrastructure, improve connections between various active transportation networks, and improve connections to public transit. These investments are in addition to the approximately $2 billion over three years for the enhancements to the climate action tax credit identified above1.
Small businesses will continue to have access to existing supports to protect competitiveness and reduce emissions. These include a 2 per cent small business corporate income tax rate; eligibility for owners of sole proprietorships to receive the climate action tax credit; and various CleanBC programs to reduce emissions such as zero-emission vehicle (ZEV) incentives under the Go Electric program and energy effciency incentives offered through the Better Buildings program. These are in addition to various tax expenditures, such as the provincial sales tax exemptions for used ZEVs, electricity, heat pumps, and specified energy conservation equipment such as insulation and clean energy generation equipment; and tax credits such as the clean buildings tax credit for qualifying energy effciency upgrades and the small business venture capital tax credit for investments into eligible clean technology businesses. More information on these tax expenditures can be found in Table A1: Tax Expenditures.
| 1 | The fiscal impact of the climate action tax credit enhancements are based on current estimates. The impact may change as credit amounts are monitored and credit amounts may be adjusted on an annual basis. |
| 82 | | Budget and Fiscal Plan - 2023/24 to 2025/26 |
PART 3 | BRITISH COLUMBIA ECONOMIC REVIEW AND OUTLOOK1
Summary
B.C.’s economy has been resilient to pandemic, geopolitical, and climate-related disruptions. However, higher interest rates are expected to weigh on the economy in the near-term. Following a rapid recovery from the economic impacts of the COVID-19 pandemic, high inflation led to a sharp increase in interest rates by central banks in 2022. Russia’s invasion of Ukraine increased inflationary pressures and caused renewed supply disruptions, energy insecurity in Europe, and volatile commodity prices. In 2022, the impact of higher interest rates was evident in housing markets. Uncertainty remains over its transmission to other sectors of the economy (e.g., consumer spending, investment activity, and labour markets) in B.C. and B.C.’s trading partners. Despite a high degree of global uncertainty, B.C. has maintained a low unemployment rate and is relatively well-positioned to face potential economic challenges.
The Ministry of Finance (Ministry) estimates that the economy expanded by 2.8 per cent in 2022, following 6.1 per cent growth in 2021. The Ministry forecasts economic growth will slow to 0.4 per cent in 2023 before rising to 1.5 per cent in 2024. The slower near-term growth projection largely reflects the combined effects of elevated price pressures and tighter monetary policy working their way through the economy. In addition, economic weakness among B.C.’s major trading partners is expected to weigh on export demand. As these factors subside, economic growth is expected to strengthen, supported by steady employment growth, solid investment activity, and higher international migration. Over the medium-term (2025 to 2027), real GDP growth is expected to range between 2.2 per cent and 2.4 per cent annually.
Chart 3.1 Ministry’s Outlook for B.C. Compared to Private Sector

The Ministry’s near-term forecast for B.C. real GDP growth is lower than the outlook provided by the Economic Forecast Council (EFC), with 0.2 percentage points (pp) of prudence in 2022 and 0.1 pp in both 2023 and 2024. This differential is one of the levels of prudence built into the fiscal plan. The Ministry’s medium-term outlook is slightly higher than the average EFC forecast to account for the anticipated effects of LNG production over that period.
1 Reflects information available as of February 8, 2023, unless otherwise indicated.
| Budget and Fiscal Plan - 2023/24 to 2025/26 | | 83 |
British Columbia Economic Review And Outlook
The main downside risk to B.C.’s economic outlook is the degree to which elevated inflation and restrictive monetary policy affect domestic and global economic activity. Other risks include the emergence of new COVID-19 variants of concern and ongoing geopolitical conflict, as well as further supply-chain disruptions, climate events, global trade tensions, and lower commodity prices.
British Columbia Economic Activity and Outlook
B.C.’s economic performance was mixed at the end of 2022. Higher interest rates have brought about a sharp decline in home sales and prices. In the second half of the year, falling commodity prices led to a reversal of earlier gains in merchandise exports and contributed to a modest slowdown in inflation. Retail sales also slowed last year after strong growth in 2021. Meanwhile, employment saw strong growth in 2022 and home construction has remained at high levels.
Table 3.1 British Columbia Economic Indicators
| Third Quarter | Fourth Quarter | Annual1 | ||||||||||
| All data seasonally adjusted, per cent change | Jul. to Sep. 2022 change from Apr. to Jun. 2022 | Oct. to Dec. 2022 change from Jul. to Sep. 2022 | Jan. to Dec. 2022 change from Jan. to Dec. 2021 | |||||||||
| Employment | +0.2 | +0.1 | +3.2 | |||||||||
| Manufacturing shipments2 | -0.7 | -0.3 | +10.0 | |||||||||
| Exports | -10.9 | -11.9 | +19.6 | |||||||||
| Retail sales2 | 0.0 | +0.4 | +2.7 | |||||||||
| Consumer price index1,3 | +7.7 | +7.2 | +6.9 | |||||||||
| Housing starts | +8.8 | +2.4 | -1.9 | |||||||||
| Residential sales units | -23.3 | -3.9 | -35.2 | |||||||||
| Residential average sale price | -4.1 | -3.6 | +7.5 | |||||||||
| Non-residential building permits | -6.1 | -10.7 | +52.6 | |||||||||
1 Non-seasonally adjusted data 2 Data to November
3 Quarterly calculations for CPI are year-over-year, e.g. Third Quarter is Jul. to Sep. 2022 change from Jul. to Sep. 2021
The province’s economic outlook calls for slower growth in the near-term as higher interest rates cool domestic and global demand. B.C.’s economy is expected to move in line with broader global economic trends. The Ministry’s estimate for B.C. real GDP growth in 2023 was lowered to 0.4 per cent from the First Quarterly Report forecast of 1.5 per cent. This largely reflects the impact of higher borrowing costs on home sales, consumer spending, and investment amid slower global economic activity. The forecast for nominal GDP growth in 2023 was revised down to 2.8 per cent from 3.5 per cent in the First Quarterly Report, due to lower real GDP growth as well as lower prices for some of B.C.’s key commodities.
B.C. real GDP growth is forecast to improve in 2024 and the medium-term. Inflation is forecast to ease from the current elevated levels toward more typical rates. Retail sales and housing market activity are expected to strengthen as the effects of elevated prices and higher interest rates fade. Strong export growth is forecast to continue in B.C. as Canada’s first LNG terminal moves into production in the medium-term. Stable labour market conditions are expected to continue in B.C., with a relatively low unemployment rate over the forecast horizon.
| 84 | | Budget and Fiscal Plan - 2023/24 to 2025/26 |
British Columbia Economic Review And Outlook
Labour Market
B.C.’s labour market was a source of strength in 2022. Following a steady recovery in 2021, overall employment rose 3.2 per cent in 2022. The composition of jobs improved as well in 2022, with 96,600 net new full-time jobs offsetting a decline of 12,500 part-time jobs. Job creation was concentrated in the private sector (+58,600 jobs), along with solid gains in the public sector (+22,200 jobs), and an increase in self-employment (+3,200 jobs). Employment gains reflected broad-based growth in the service sector (+75,000 jobs), led by the wholesale and retail trade (+32,200 jobs); information, culture, and recreation (+17,600 jobs); and health care and social assistance (+17,200 jobs) sectors. Moderate job gains in the goods-producing sector (+9,000 jobs) reflected growth in the construction (+8,900 jobs), agriculture (+2,400 jobs), and manufacturing (+700 jobs) sectors, which offset declines in the utilities (-2,800 jobs) and forestry, fishing, mining, oil and gas (-200 jobs) sectors. The recovery from the pandemic has been uneven across sectors. As of December 2022, employment remained well below pre-pandemic (February 2020) levels for business, building, and other support services (-19,100 jobs) and accommodation and food services (-15,400 jobs).
Chart 3.2 B.C. Employment
Unemployment in the province fell to historically low levels in 2022 amid tight labour market conditions. B.C.’s unemployment rate averaged 4.6 per cent in 2022, down from 6.6 per cent in 2021. Long-term unemployment in B.C. also declined, reaching pre-pandemic levels by December 2022. Meanwhile, job vacancy growth slowed in recent quarters. B.C. was the only province with fewer vacancies in the third (July to September) quarter of 2022 compared to the same quarter of 2021. However, the level of job vacancies remains elevated and improvements have not been even across industries. For example, the construction and finance and insurance sectors saw large increases in job vacancies compared to the third quarter of 2021.
| Budget and Fiscal Plan - 2023/24 to 2025/26 | | 85 |
British Columbia Economic Review And Outlook
As businesses moved toward more typical operations following the major effects of the pandemic, employers faced labour shortages amid tight labour market conditions and aging demographics. The supply of available workers has slowed as B.C.’s labour force rose by 1.0 per cent in 2022, down from 3.3 per cent growth in 2021. The annual increase reflects continued growth for women entering the labour force (+2.2 per cent), while male labour force growth stalled (0.0 per cent). B.C.’s labour force participation rate fell to 65.1 per cent in 2022, down from 65.6 per cent in 2021. In 2022, the prime age (25 to 54 age group) labour force participation rate edged down 0.1 pp while the participation rate among the 55+ age group, who account for over 20 per cent of the labour force, fell by 1.4 pp. An increasing rate of retirement poses a challenge for labour markets across the country.
Employee compensation (aggregate wages, salaries, and employers’ social contributions) in B.C. in the first nine months of 2022 was 11.8 per cent higher than the same period of 2021, reflecting job gains and rising wages. The average hourly wage rate rose 4.1 per cent in 2022 compared to 2021. In 2022, wages grew slower than the consumer price index for B.C., which increased by 6.9 per cent on the year.
Outlook
The outlook for B.C.’s labour market remains stable but faces uncertainty in the near-term reflecting the broader economic slowdown. The Ministry forecasts employment in B.C. to increase by 0.4 per cent in 2023 (approximately +9,800 jobs), followed by annual growth of 1.0 per cent in 2024 (approximately +27,400 jobs). Growth is then expected to average 1.1 per cent over the medium-term.
The province’s unemployment rate is expected to average 5.7 per cent in 2023 and 5.6 per cent in 2024, before trending down to average 5.1 per cent by 2027.
Consumer Spending and Inflation
Consumer spending on goods was relatively flat in 2022. Modest nominal retail sales growth amid strong inflation pointed to weaker sales volumes as higher interest rates slowed demand. Year-to-date to November 2022, B.C. retail sales rose 2.7 per cent compared to the same period of 2021. Sales growth was led by increased spending at gasoline stations (+23.4 per cent), clothing and clothing accessories stores (+14.6 per cent), and general merchandise stores (+7.6 per cent). Sales declines were reported at building material and garden equipment and supplies dealers (-9.3 per cent), motor vehicle and parts dealers (-5.5 per cent), and health and personal care stores (-4.0 per cent) compared to the same period of 2021.
While retail trade data offers a detailed look at consumer spending on goods, timely comprehensive data for spending on services is limited at the provincial level. The most recent data from 2021 shows that total nominal consumer spending on services in B.C. rose by 7.8 per cent compared to the previous year. Further, nominal sales at B.C. food services and drinking places (a component of the service sector) continued to improve, rising 14.8 per cent above the pre-pandemic peak as of November 2022, partly due to higher prices. National data showed service sector growth through 2022, as Canadian consumers returned to in-person experiences and travel that had been postponed during the pandemic. Meanwhile, Statistics Canada’s Canadian Tourism Activity Tracker, which combines hotel occupancy, aviation, and spending counts for each province, showed steady improvement in a broad range of B.C. tourism activities through the first ten months of 2022.
| 86 | | Budget and Fiscal Plan - 2023/24 to 2025/26 |
British Columbia Economic Review And Outlook
Chart 3.3 B.C. Retail Sales
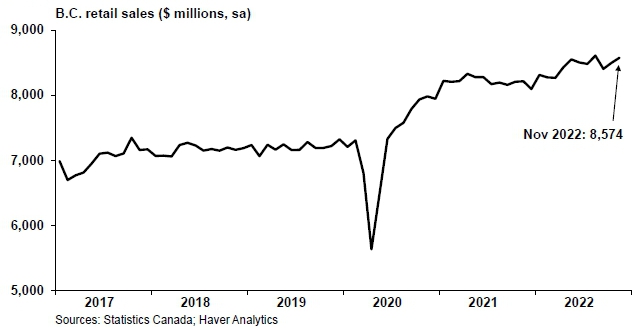
Consumer confidence trended lower in 2022 in response to high inflation, rising interest rates and slowing economic conditions. By December 2022, the Conference Board of Canada’s consumer confidence index for B.C. reached 66.2 points, well below 129.0 points reported in December 2021. Most recently, consumer confidence increased to 75.1 points in January 2023. Looking ahead, the Bank of Canada’s January 2023 report on the Canadian Survey of Consumer Expectations noted that Canadian consumers plan to reduce spending or postpone purchases in the coming months due to elevated inflation and tighter credit conditions.
Last year, prices rose dramatically across all provinces, as strong demand for goods and services was met with lingering supply-chain challenges and high prices for global commodities. Russia’s invasion of Ukraine increased global supply uncertainty, which added to inflationary pressures. In 2022, B.C.’s inflation rate averaged 6.9 per cent, the fastest annual rate since 1982, up from 2.8 per cent in 2021. Annual price growth was broad-based, led by higher prices for shelter (+7.6 per cent), transportation (+10.2 per cent), and food (+8.0 per cent). Increases in shelter prices reflect higher owned and rented accommodation costs, while transportation costs were driven up by higher gasoline prices and vehicle purchase costs. Prices for groceries rose at the fastest pace since 1981 as multiple factors including extreme weather, higher input costs, and supply-chain disruptions weighed on the supply of food.
Since peaking at 8.1 per cent in May 2022, consumer price growth in B.C. eased to 6.6 per cent as of December 2022. This was partly due to lower gasoline prices relative to recent months. However, inflation remains above the Bank of Canada’s target of about 2 per cent, with core inflation slowing more gradually.
| Budget and Fiscal Plan - 2023/24 to 2025/26 | | 87 |
British Columbia Economic Review And Outlook
Chart 3.4 B.C. Inflation
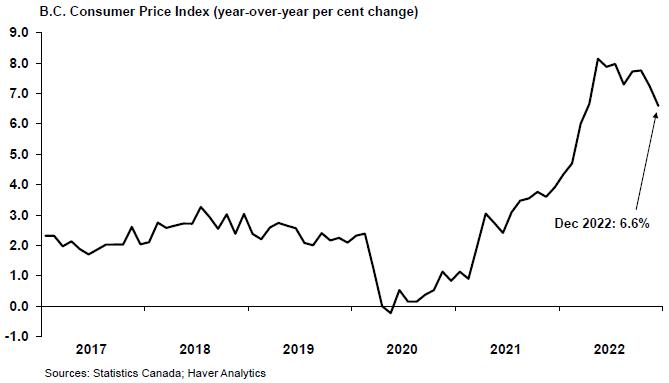
Outlook
Consumer spending is expected to moderate in the near-term as higher interest rates slow demand, following robust growth in recent years. The Ministry estimates that real household consumer spending advanced by 2.7 per cent in 2022, after growth of 7.3 per cent in 2021. The Ministry forecasts that real household consumption will increase by 2.8 per cent in 2023 and 2.3 per cent in 2024. Annual growth is then expected to be between 2.0 per cent and 2.5 per cent over the 2025 to 2027 period.
The Ministry estimates that nominal retail sales increased by 3.0 per cent in 2022. Retail sales are forecast to grow by 1.8 per cent in 2023, 2.9 per cent in 2024, and by 3.5 per cent on average over the 2025 to 2027 period.
Consumer price inflation in B.C. is forecast to be 3.9 per cent in 2023 and is expected to fall to 2.5 per cent in 2024 and 2.2 per cent in 2025, as the effects of elevated commodity prices and supply disruptions fade. Then, inflation is expected to return to the Bank of Canada’s target of around 2 per cent for the balance of the forecast horizon.
Housing
Home sales fell sharply last year as markets adjusted to a steep increase in lending rates, which raised mortgage rates to highs not seen since 2008. MLS home sales in B.C. fell by 35.2 per cent in 2022 and were well below average levels of activity in the second half of the year. Most of B.C.’s regional housing markets saw double-digit sales declines in 2022, including Greater Vancouver (-34.8 per cent), Fraser Valley (-44.9 per cent), Okanagan-Mainline (-32.7 per cent), Vancouver Island (-29.0 per cent), and Victoria (-31.7 per cent). In December 2022, total MLS home sales rose 2.9 per cent compared to the previous month, though it is too early to tell whether the downward trend in sales has subsided.
| 88 | | Budget and Fiscal Plan - 2023/24 to 2025/26 |
British Columbia Economic Review And Outlook
The MLS average home sale price in B.C. has receded from the February 2022 peak, due to muted demand amid higher mortgage rates, a compositional shift in sales and more balanced market conditions. Reflecting the high levels earlier in the year, the MLS average home sale price increased 7.5 per cent in 2022, following 18.7 per cent growth in 2021. On a monthly basis, B.C.’s average home sale price has decreased for ten consecutive months to reach $901,540 in December 2022.
Chart 3.5 B.C. Home Sales and Price
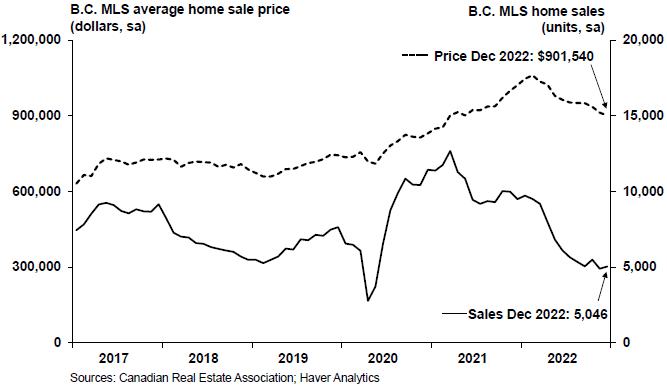
Regional MLS composite benchmark house prices (which incorporate all dwelling types) for Greater Vancouver and the Fraser Valley rose by 12.5 per cent and 24.3 per cent, respectively, in 2022. Double-digit price growth was observed in all major regions, across all dwelling types in 2022 relative to 2021.
Chart 3.6 Greater Vancouver HPI Benchmark Price
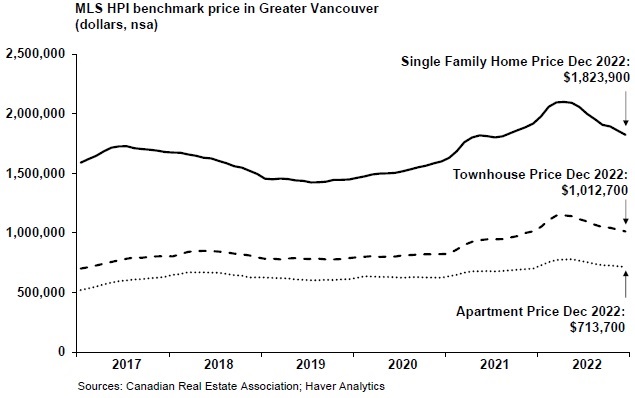
| Budget and Fiscal Plan - 2023/24 to 2025/26 | | 89 |
British Columbia Economic Review And Outlook
So far, higher interest rates have not weighed on new home construction to the same degree as home sales activity. In 2022, B.C. housing starts edged down 1.9 per cent from the record high of 47,607 units in 2021. Among segments, single-family housing starts fell 10.1 per cent and multi-family housing starts rose 0.6 per cent in 2022. Still, the annual pace of homebuilding activity remained strong and was the second-highest on record. The value of residential building permits, a leading indicator of home construction, rose by 24.2 per cent in 2022, with growth in single-detached dwellings (+1.1 per cent) and multiple dwelling buildings (+33.7 per cent). Also, the total number of residential building permits grew by 11.9 per cent, driven by an increase in multiple dwelling building permits compared to 2021.
Chart 3.7 B.C. Housing Starts

Outlook
Home sales activity is expected to decline in the near-term, constrained by higher mortgage rates amid slower economic growth. The Ministry forecasts unit home sales to decrease by 13.3 per cent in 2023, followed by growth of 17.0 per cent in 2024 as the effects of higher interest rates fade. Home sales are expected to average 2.4 per cent growth in the 2025 to 2027 period. The average home sale price in B.C. is expected to decrease by 7.4 per cent in 2023, followed by growth of 3.0 per cent in 2024, and then grow by 2.0 per cent annually in the medium-term. Putting unit sales and prices together, the total value of home sales is forecast to fall 19.8 per cent in 2023 and rebound with growth of 20.5 per cent in 2024, and average 4.5 per cent growth over the medium-term.
The Ministry prudently expects B.C. housing starts to total approximately 39,000 units in 2023, 37,000 units in 2024, and average 38,000 units per year over the 2025 to 2027 period, in line with the historical average.
| 90 | | Budget and Fiscal Plan - 2023/24 to 2025/26 |
British Columbia Economic Review And Outlook
Business and Government
In 2022, the value of non-residential construction permits increased by 52.6 per cent compared to 2021, partly due to a spike in February 2022 related to permitting for St. Paul’s Hospital. Growth in 2022 was led by permit issuance for institutional and governmental buildings (+113.1 per cent), along with solid gains in commercial building (+33.2 per cent) and industrial building (+17.0 per cent) permits.
Businesses in B.C. showed resilience last year as Canadian companies faced labour shortages, cost pressures, and lingering supply-chain issues. The number of active businesses in the province in the first ten months of 2022 was 2.8 per cent higher compared to the same period of 2021. However, small business optimism has faded since April 2022, as rising borrowing costs have amplified cost pressures. In January 2023, the Canadian Federation of Independent Business (CFIB) small business confidence index for B.C. fell to 46.9, down 12.9 points compared to January 2022, to reach a level not seen since April 2020.
B.C.’s tourism sector continued to recover in 2022 from the severe effects of the pandemic. During the first eleven months of 2022, the number of international travelers entering B.C. was more than five-times higher than the low levels observed in the same period of 2021. However, the 434,264 travelers entering B.C. in November 2022 was well below the 700,000 travelers usually seen in an average month prior to the pandemic. The tourism sector is expected to gradually improve as it continues to adjust to challenges such as higher costs and labour shortages, which have disrupted the industry’s economic recovery.
Outlook
Following estimated growth of 5.2 per cent in 2022, the Ministry expects total real investment in B.C. to slow in the near-term as higher borrowing costs trim investment spending. The Ministry forecasts total real investment to decrease by 1.7 per cent in 2023 and then increase by 0.4 per cent in 2024. The Ministry forecasts continued growth over the forecast horizon, rising by 2.9 per cent in 2025 and averaging around 2.0 per cent annually over the 2026 to 2027 period.
Real business investment is estimated to have grown by 2.3 per cent last year (following 9.8 per cent growth in 2021) and is projected to decrease by 3.3 per cent in 2023, with higher interest rates expected to weigh on most segments (machinery and equipment, non-residential and residential construction). Over the 2024 to 2027 period, growth is forecast to range from 1.9 per cent to 3.9 per cent annually.
Real expenditure on goods and services by all levels of government is estimated to have increased by 0.4 per cent in 2022, following 7.9 per cent growth in 2021. Real government spending is forecast to decrease by 1.4 per cent in 2023 and by 0.2 per cent in 2024, and then register annual growth between 0.5 per cent and 1.2 per cent over the 2025 to 2027 period.
Following an estimated increase of 13.5 per cent in 2022 and 26.3 per cent growth in 2021, the Ministry expects the nominal net operating surplus of corporations (an approximation of corporate profits) to decrease by 14.5 per cent in 2023 and by 7.0 per cent in 2024 as the economy slows. Net operating surplus is expected to return to growth over the 2025 to 2027 period, increasing between 2.3 per cent and 5.4 per cent annually.
| Budget and Fiscal Plan - 2023/24 to 2025/26 | | 91 |
British Columbia Economic Review And Outlook
External Trade and Commodity Markets
Strength in the first half of 2022 lifted annual growth in B.C. merchandise exports to 19.6 per cent, despite a sharp decline in the latter half of the year. B.C.’s export performance has generally followed commodity prices, while export volumes for lumber and coal have fallen in recent months. Annual growth was broad-based, led by a large increase in the value of energy products exports (+56.3 per cent). However, exports of solid wood products fell (-10.6 per cent) compared to 2021 amid weaker demand and lower lumber prices in the second half of 2022. Metallic mineral products exports also declined (-5.0 per cent).
Last year, the value of B.C. merchandise exports to the U.S. rose 23.5 per cent compared to 2021 and accounted for 57.3 per cent of B.C.’s total goods exports. B.C. goods exports to non-U.S. destinations increased 14.7 per cent compared to 2021 despite a 4.4 per cent decline in exports to China, B.C.’s second-largest trading partner. Energy exports to both the U.S. and non-U.S. destinations were a main driver of total exports growth in 2022, supported by higher prices for natural gas and coal.
Chart 3.8 B.C. Exports
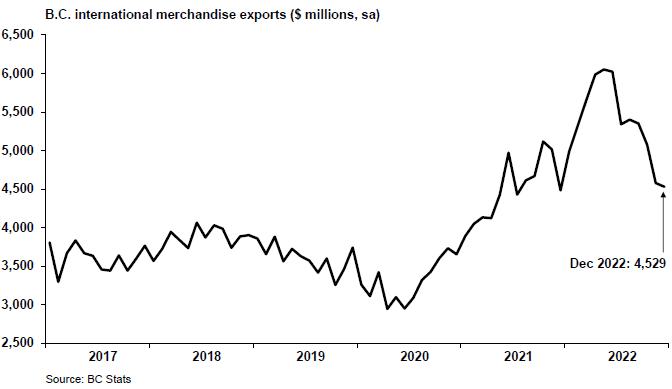
Like merchandise exports, B.C.’s manufacturing shipments showed strength early in the year. While activity has moderated somewhat since March 2022, B.C.’s manufacturing shipments rose 10.0 per cent in the first eleven months of 2022 compared to the same period of 2021. Year-to-date growth was broad-based, led by higher food manufacturing shipments (+11.7 per cent), while wood product manufacturing declined (-7.2 per cent) from the record levels seen in 2021.
B.C. tourism data and national export data suggest that B.C.’s nominal international exports of services continued to recover from a sharp decline in 2020 amid broad pandemic-related restrictions. National-level data shows that Canadian exports of services surpassed pre-pandemic levels in March 2022.
| 92 | | Budget and Fiscal Plan - 2023/24 to 2025/26 |
British Columbia Economic Review And Outlook
After a strong start to 2022, lumber prices have retreated toward more historical levels. The price of Western spruce-pine-fir (SPF) 2x4 averaged an elevated $814 US/000 board feet in 2022, boosted by supply pressures, transportation costs, and strong demand in the first half of that year. However, the effect of higher interest rates on housing market and construction activity in the U.S. has since weighed on lumber prices. In January 2023, SPF 2x4 lumber averaged $373 US/000 board feet, well below the high of $1,403 US/000 board feet reported back in March 2022.
Last year, the war in Ukraine fueled oil and energy prices as countries sought alternative supply amid uncertainty and strong global demand. The West Texas Intermediate (WTI) oil price hit a fourteen-year high of US$114.84 per barrel in June 2022 before easing somewhat through the balance of that year. Annually, the WTI price averaged US$94.79 per barrel in 2022, up 39.4 per cent from the previous year. Similarly, the plant inlet price of natural gas peaked at $5.59 C/GJ in June 2022 before falling back to $4.09 C/GJ by year end. The plant inlet price averaged $3.85 C/GJ overall in 2022, up from an average of $2.23 C/GJ in 2021.
Base metal and mineral prices fluctuated throughout 2022 amid concerns over Europe’s energy supply, COVID-19 lockdowns in China, monetary tightening across major central banks, and slower global economic activity. In 2022, the annual average price for metallurgical coal rose (+63.2 per cent), along with prices for molybdenum (+17.6 per cent), and zinc (+15.8 per cent) relative to 2021. The price for gold was flat (0.0 per cent), while prices for silver (-13.5 per cent), copper (-5.3 per cent), and lead (-2.3 per cent) declined from the elevated prices observed in 2021.
Outlook
Real exports of goods and services are estimated to have grown by 6.3 per cent in 2022, following an increase of 3.2 per cent in 2021. Growth in real exports of goods and services is projected to be 2.8 per cent in 2023, 3.0 per cent in 2024, and range between 2.6 per cent and 5.2 per cent annually in the 2025 to 2027 period. The anticipated production of LNG toward the end of the forecast horizon provides support to the outlook.
The price of lumber is forecast to average $400 US/000 board feet in 2023 before rising to $450 US/000 board feet in 2024, and then average $500 US/000 board feet over the 2025 to 2027 period. The plant inlet price for natural gas is expected to average $3.04 C/GJ in 2023/24, $2.69 C/GJ in 2024/25, and $2.55 C/GJ in 2025/26. The outlook is subject to considerable uncertainty, as commodity prices can be volatile.
Demographics
B.C.’s population on July 1, 2022 was 5.32 million people, up 2.2 per cent from the same date in 2021. During the January to September period of 2022, the province welcomed 118,535 net migrants, topping the sizable arrival of 80,642 net migrants in the same period of 2021. B.C. saw a large increase in net international migration (from +56,613 persons to +116,224 persons), while net interprovincial migration slowed (from +24,029 persons to +2,311 persons).
In the third quarter of 2022 alone, net international migration reached a new record (+53,603 persons) as the federal government streamlined systems to process applications for potential newcomers. However, net interprovincial migration fell (-4,799 persons) in the third quarter of 2022, marking the first quarterly decline since 2013 and the sharpest drop since 2000, largely due to higher out-migration to Alberta.
| Budget and Fiscal Plan - 2023/24 to 2025/26 | | 93 |
British Columbia Economic Review And Outlook
Outlook
B.C.’s July 1 population is projected to increase by 2.4 per cent in 2023, 1.9 per cent in 2024, and then by 1.6 per cent on average over the 2025 to 2027 period.
Total net migration is forecast to reach about 109,400 persons in 2023, and 90,700 persons in 2024, supported by strong international migration, with a smaller interprovincial contribution. Total net migration is projected to average around 88,800 persons annually in the 2025 to 2027 period. International migrants are expected to account for over 85 per cent of total migrants over the forecast horizon. This represents a larger share compared to recent years, reflecting increases to federal immigration targets announced in fall 2022.
Risks to the Economic Outlook
B.C.’s economy has been resilient to pandemic, geopolitical, and climate-related disruptions but higher interest rates are expected to weigh on the economy in the near-term. There are upside risks, such as inflationary pressures easing sooner than expected leading to less restrictive monetary policy and a less pronounced slowing of the global economy. However, risks continue to be weighted to the downside. Downside risks to B.C.’s economic outlook include:
| · | persistent high inflation reducing affordability and leading to higher interest rates over a longer period; |
| · | uncertainty around the extent of the impact of higher interest rates on consumer and business borrowing, as well as housing markets; |
| · | further inflationary pressures due to lingering supply-chain disruptions and restrictions associated with new COVID-19 variants in B.C., Canada, or among B.C.’s trading partners; |
| · | weaker than expected global economic activity, geopolitical conflict weighing on trade and commodity markets, and broader economic challenges in Europe and Asia; |
| · | lower prices for B.C.’s major commodity exports, such as lumber, pulp, natural gas, and coal, as well as a stronger U.S. dollar making imports more expensive; |
| · | aging demographics leading to tighter labour market conditions (an imbalance of the supply and demand of workers) and elevated job vacancies; |
| · | climate-related disasters disrupting the lives and livelihoods of British Columbians, destroying capital, and limiting economic activity; and |
| · | timing of investment and hiring related to the LNG Canada project, similar to the risks that exist for other major capital projects. |
| 94 | | Budget and Fiscal Plan - 2023/24 to 2025/26 |
British Columbia Economic Review And Outlook
External Outlook
Global economic growth decelerated in 2022 following a rapid recovery over the prior two years from the pandemic-related downturn. Strong demand for goods and services going into 2022 was met with lingering supply-chain problems and tight labour markets. This supply-demand imbalance pushed consumer price inflation well above the targets set by central banks in advanced economies. Russia’s invasion of Ukraine further increased inflationary pressures by causing renewed supply disruptions, energy insecurity in Europe, and volatile commodity prices. Many central banks responded with forceful monetary policy tightening to temper demand and thus inflation. By the end of the year, elevated interest rates coupled with improving supply chains and mild weather in Europe led to clear signs of slowing price inflation. Economic growth also slowed and forecasts for further slowing or recession are widespread heading into 2023 as the lagged effects of past interest rate hikes are expected to unfold in the months ahead. While the recent reversal of China’s zero-COVID policy may support near-term global growth, it also presents renewed pandemic-related risks to the outlook.
United States
Following outsized annual growth of 5.9 per cent in 2021, U.S. real GDP contracted in two of the four quarters of 2022. The first two quarters of the calendar year saw declining economic output partly due to falling consumer spending on goods and government spending. Growth resumed in the third quarter with higher government spending and an improved trade balance (exports minus imports). Despite the fluctuations, trends of rising consumer spending on services and falling residential investment continued throughout the first three quarters of the year. Most recently in the fourth quarter, real GDP advanced at an annualized rate of 2.9 per cent amid renewed growth in consumer spending on goods and further declines in residential investment. Overall, U.S. real GDP increased 2.1 per cent in 2022 compared to 2021.
Chart 3.9 U.S. Real GDP
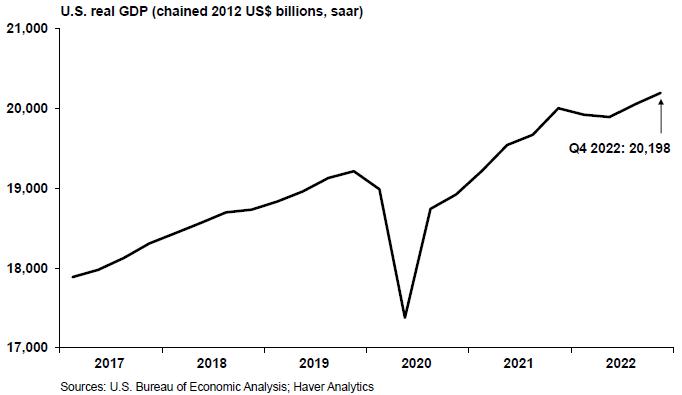
| Budget and Fiscal Plan - 2023/24 to 2025/26 | | 95 |
British Columbia Economic Review And Outlook
The U.S. labour market regained its pre-pandemic level of employment during 2022. Job gains were robust, although generally slowing through the year, and U.S. employment increased by 4.3 per cent annually. Meanwhile, the unemployment rate also returned to pre-pandemic levels in 2022 and averaged 3.7 per cent on the year, matching the historically low annual rate observed in 2019. Tight labour market conditions in 2022 contributed to the low unemployment rate and helped push annual average hourly earnings up 5.4 per cent compared to the previous year. In January 2023, monthly job gains accelerated and the U.S. unemployment rate fell to its lowest level since 1969 (at 3.4 per cent).
Similar to B.C. and Canada, U.S. home sales moderated in 2022. Sales of existing homes fell by 17.9 per cent compared to 2021 and sales of new single-family homes fell by 16.3 per cent. Rising interest rates were the main catalyst for lower sales, adding to affordability challenges. Median prices rose 10.4 per cent for existing homes and 14.6 per cent for new single-family homes in 2022.
U.S. homebuilding slid through most of the year after hitting a recent high in April 2022, driven lower partly by slowing housing demand and labour shortages. Housing starts fell by 3.0 per cent overall in 2022 compared to 2021 as a 10.6 per cent decline in single-family starts outweighed a 15.1 per cent increase in multi-family starts. Residential building permits, a leading indicator of building activity, also declined through most of the year and were down 5.0 per cent overall in 2022 due to decreased single-family permitting.
Chart 3.10 U.S. Housing Starts
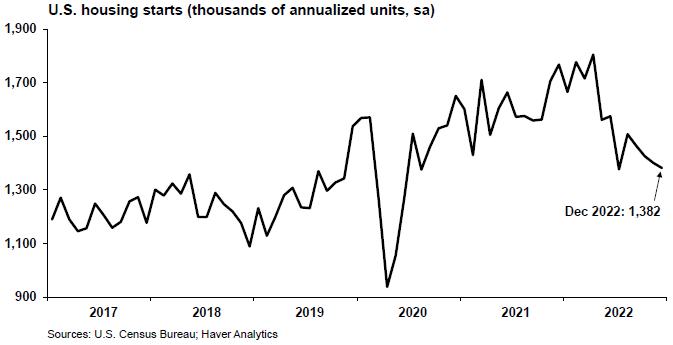
U.S. retail and food services sales rose 9.2 per cent in 2022 compared to 2021, led by growth at gasoline stations, food services and drinking places, and non-store (e.g., online) retailers. These sales, measured in nominal dollars, were inflated by rising prices. The U.S. consumer price index rose 8.0 per cent in 2022, with energy prices up 25.2 per cent, food prices up 9.9 per cent, and prices for all items excluding food and energy up 6.2 per cent on the year. Both total retail and food services sales and consumer price inflation eased by the end of 2022 from in-year peaks.
| 96 | | Budget and Fiscal Plan - 2023/24 to 2025/26 |
British Columbia Economic Review And Outlook
Consumer confidence remained relatively low through 2022, dampened by concerns about the pandemic, war in Ukraine, and rising prices. The Conference Board U.S. consumer confidence index averaged 104.5 on the year, 8.2 points lower than 2021 and still 23.8 points lower than pre-pandemic 2019.
U.S. nominal merchandise exports reached an all-time high in mid-2022 before retreating in the latter months of the year, following the general trends in commodity prices. Overall, U.S. exports were up 18.4 per cent in 2022 compared to 2021.
Outlook
In January 2023, Consensus Economics (Consensus) forecasters expected U.S. economic growth of 0.3 per cent in 2023, 0.1 percentage points higher than the October 2022 Consensus survey. Meanwhile for 2024, Consensus forecasted growth of 1.1 per cent.
Table 3.2 U.S. Real GDP Forecast: Consensus versus B.C. Ministry of Finance
| 2023 | 2024 | |||||||
| Per cent change in real GDP | ||||||||
| B.C. Ministry of Finance | 0.1 | 1.0 | ||||||
| Consensus Economics (January 2023*) | 0.3 | 1.1 | ||||||
* Comparable month to B.C. Ministry of Finance forecast.
Slowing activity in key economic sectors and expectations for continued interest rate increases are expected to weigh on U.S. growth in 2023. Given uncertainty in the outlook, the Ministry prudently assumes that U.S. real GDP will grow by 0.1 per cent in 2023 and by 1.0 per cent in 2024, with growth improving to average around 1.7 per cent annually over the medium-term.
Chart 3.11 Consensus Outlook for the U.S. in 2023
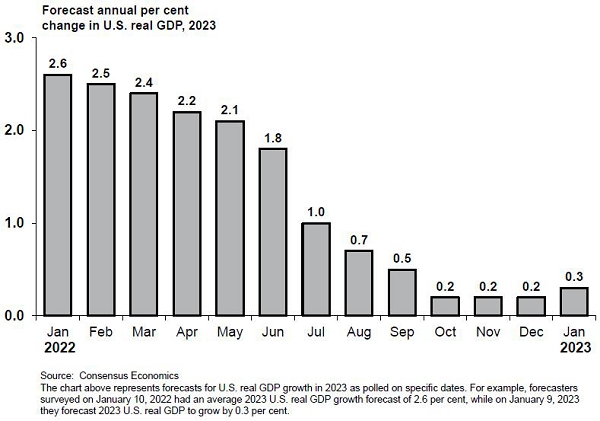
| Budget and Fiscal Plan - 2023/24 to 2025/26
| | 97 |
British Columbia Economic Review And Outlook
Canada
The Canadian economy grew at an annualized rate of 2.9 per cent in the third quarter of 2022, after a 3.2 per cent annualized expansion in the second (April to June) quarter. Exports of crude oil, crude bitumen, and wheat propelled growth in exports, and non-residential investment and inventories also posted gains. At the same time, interest rate sensitive areas of the economy struggled. Housing investment declined for a second consecutive quarter. Consumer spending also fell, with widespread declines in goods spending and waning growth on the services side. Overall in the first three quarters of 2022, Canadian real GDP grew by a robust 3.9 per cent on average compared to the same period in the previous year. However, broadening impacts of interest rate increases are expected in the fourth quarter and into 2023.
Chart 3.12 Canadian Real GDP
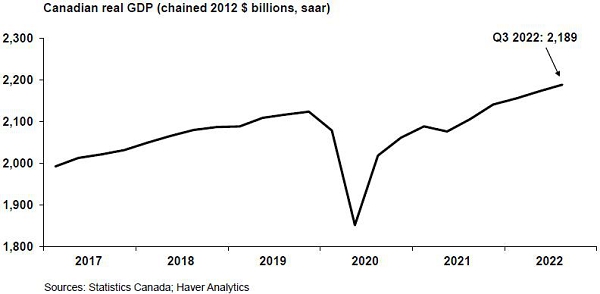
Employment gains continued in Canada in 2022, with healthy growth of 4.0 per cent (+750,700 jobs) compared to 2021. Despite the annual gain, employment in several industries – most notably accommodation and food services – had not returned to pre-pandemic levels as of December 2022, partly due to worker shortages following sectoral shifts by employees during the pandemic.
Worker shortages (due to pandemic disruptions as well as aging demographics) and strong demand have created a tight labour market in Canada, as shown by the unemployment rate that dropped from an average of 7.5 per cent in 2021 to 5.3 per cent in 2022. On a monthly basis, the unemployment rate fell to a record low of 4.9 per cent in June and July 2022 and stood at 5.0 per cent as of December. The unemployment rate for youths aged 15 to 24 years also reached a record low of 9.0 per cent in July before ending the year at 9.7 per cent. Meanwhile, the employment rate for women in the core working ages of 25 to 54 reached the highest annual rate on record in 2022 (at 81.4 per cent) largely due to an increase in the rate among women with young children.
The Canadian housing market cooled markedly in 2022 from the high levels of activity observed in the prior year, as rising interest rates weighed on the market. Total MLS home sales in 2022 fell 25.2 per cent from 2021, with double-digit declines in eight of the ten provinces. By the end of the year, home sales were at their lowest levels in over ten years, aside from the onset of the pandemic. Despite falling demand, peak prices early in the year and persistent supply constraints supported a 2.4 per cent increase in the national average home sale price, following cumulative home price growth of 37.0 per cent over the previous two years. Months of inventory, which measures the number of months to sell the existing inventory of homes, rose from a record low of 1.7 in January 2022 to 4.2 in December, indicating a return to more balanced market conditions. Housing starts were resilient in 2022, falling by only 3.4 per cent annually in 2022 after reaching a record high in 2021. Among segments, single-family housing starts fell 11.5 per cent and multi-family housing starts ticked up 0.1 per cent in 2022.
| 98 | | Budget and Fiscal Plan - 2023/24 to 2025/26
|
British Columbia Economic Review And Outlook
Consumer price inflation accelerated through the first half of 2022 due to continued supply-chain disruptions and robust demand, compounded by the outbreak of war in Europe. After rising throughout 2021, year-over-year price inflation climbed from 5.1 per cent in January 2022 to a nearly four-decade high of 8.1 per cent in June. Since then, falling gasoline prices have helped lower the inflation rate to 6.3 per cent in December, but it remained well above the Bank of Canada’s target range of 1 to 3 per cent. On an annual basis, Canadian consumer price inflation grew 6.8 per cent on the year.
Strong consumer price growth boosted nominal retail sales in Canada in 2022, while weakening consumer confidence weighed on real spending. In the first eleven months of 2022, nominal retail sales were up 8.3 per cent from the same period of 2021, but in real terms (which exclude price effects) they were up only 2.0 per cent. Sales at gasoline stations led growth on the year, growing almost twice as much as the next leading retail categories: general merchandise stores and clothing and clothing accessories stores.
Similar to retail sales, high commodity prices played a major role in Canadian merchandise exports in 2022. Nominal goods export values were up 24.4 per cent in 2022 compared to 2021, mainly due to gains in energy product exports. However, the value of goods exports fell through the second half of the year. Meanwhile, service exports grew steadily in 2022 and were up by 14.9 per cent compared to 2021, with travel service exports finally nearing their pre-pandemic levels by the end of the year.
Outlook
The January 2023 Consensus forecasted Canadian real GDP to rise by 0.4 per cent in 2023 (0.2 percentage points lower than the October 2022 survey) and by 1.6 per cent in 2024.
Table 3.3 Canadian Real GDP Forecast: Consensus versus B.C. Ministry of Finance
| 2023 | 2024 | |||||||
| Per cent change in real GDP | ||||||||
| B.C. Ministry of Finance | 0.2 | 1.4 | ||||||
| Consensus Economics (January 2023*) | 0.4 | 1.6 | ||||||
* Comparable month to B.C. Ministry of Finance forecast.
The outlook for consumer prices and interest rates in Canada is uncertain, as are the cumulative negative impacts of interest rate hikes on the economy. Accordingly, the Ministry’s outlook is lower than the January 2023 Consensus. The Ministry assumes that the Canadian economy will grow by 0.2 per cent in 2023, 1.4 per cent in 2024, and then strengthen to average around 1.7 per cent annual growth over the medium-term.
| Budget and Fiscal Plan - 2023/24 to 2025/26
| | 99 |
British Columbia Economic Review And Outlook
Chart 3.13 Consensus Outlook for Canada in 2023
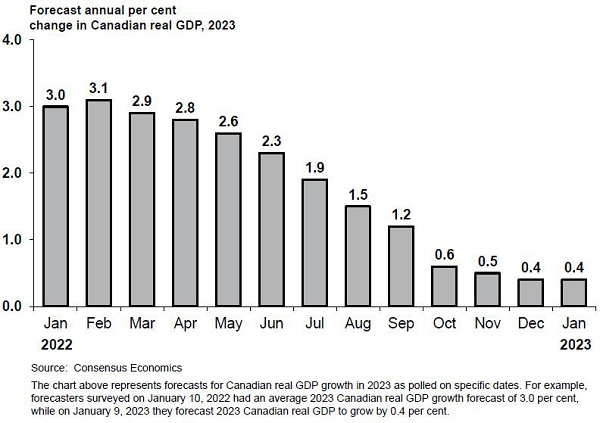
Asia
Despite increased government stimulus and relatively stable consumer prices, economic activity in China was constrained by strict pandemic containment measures in 2022. These measures contributed to weak industrial production and falling retail sales compared to 2021. Overall, real GDP grew by 3.0 per cent annually, the slowest rate since the 1970s (aside from 2020 at the onset of the pandemic). Although the removal of COVID-19 containment measures in late 2022 is expected to boost activity in 2023, the new year began with significant hardship as the virus spread rapidly. Other headwinds facing the country include a deep downturn in the property sector, challenging demographics with an aging population amid falling birthrates, and high youth unemployment.
Japan’s economy alternated between rising and falling output each quarter for two years leading to the latest data from the third (July to September) quarter of 2022, which showed an annualized quarterly decline of 0.8 per cent. Until recently, this fluctuating pattern was largely attributed to waves of the pandemic and related restrictions. The latest decline, however, reflected the effects of high global commodity prices and a weak yen weighing on consumer and industrial activity in the import-dependent economy. Overall, real GDP in Japan grew by 1.2 per cent year-to-date to the third quarter compared to same period in 2021, down from the annual growth rate of 2.1 per cent in 2021. At its meeting on January 18, 2023, the Bank of Japan maintained its highly accommodative monetary policy to support economic growth despite rising consumer price inflation (albeit still muted compared to the U.S., Canada, and Europe, at 4.0 per cent in December). The Bank also flagged risks related to financial markets, commodity prices, and COVID-19.
| 100 | | Budget and Fiscal Plan - 2023/24 to 2025/26
|
British Columbia Economic Review And Outlook
Outlook
The January 2023 Consensus forecasted China’s real GDP to grow by 4.6 per cent in 2023 and 5.3 per cent in 2024. Ongoing pandemic challenges and slowing global growth could create larger than expected headwinds for China’s economy. The Ministry’s prudent assumption is that China’s real GDP will grow by 4.4 per cent in 2023, 4.9 per cent in 2024, and then 4.4 per cent annually from 2025 to 2027.
The January 2023 Consensus forecasted Japan’s economy to expand by 1.2 per cent in 2023 (the fastest among G7 nations) and 1.1 per cent in 2024. In recognition of the downside risks associated with global commodity, financial, and export markets, the Ministry assumes that Japan’s real GDP will grow more slowly. The Ministry forecasts economic activity to rise by 1.0 per cent in 2023, and then soften to 0.8 per cent growth in 2024 and an average of 0.5 per cent annual growth over the medium-term.
Europe
The euro zone economy benefitted from improving public health conditions and tourism in 2022 and grew by 3.5 per cent annually, but was weakened by high prices and geopolitical conflict. The pace of consumer price inflation more than doubled from an already elevated year-over-year growth rate of 5.1 per cent in January 2022 to 10.6 per cent in October. Energy prices were a main contributor to inflation, which jumped after Russia invaded Ukraine and worsened as Russia drastically reduced its gas supply to European states. Gas prices eased towards the end of the year amid seasonally mild weather and heating demand, and inflation fell to 8.5 per cent in January 2023.
With price growth persistently above its 2 per cent target, the European Central Bank raised its main refinancing rate for the first time since 2011, from 0.0 per cent in July 2022 to 3.00 per cent in February 2023. High inflation and tightening financial conditions — together with energy concerns and slowing global growth — led to weakened quarterly real GDP growth of 1.2 per cent and 0.5 per cent annualized in the third and fourth quarters, respectively. Looking ahead, the European Central Bank expects continued short-term weakness amid rising interest rates, with some offset from fiscal supports and efforts to diversify away from Russian energy.
Outlook
The January 2023 Consensus forecasted no growth in the euro zone economy in 2023 (0.0 per cent) and then resumed growth of 1.2 per cent in 2024. Given uncertainty associated with the war in Ukraine, regional energy supply, and the extent of future interest rate increases by the European Central Bank, the Ministry’s forecast for euro zone real GDP is prudent. The Ministry forecasts a contraction of 0.3 per cent in 2023, followed by growth of 0.9 per cent in 2024 and around 1.2 per cent annually on average over the medium-term.
Financial Markets
Interest Rates
Like the European Central Bank, U.S. and Canadian central banks increased interest rates aggressively in 2022 to tame inflation, ending years of highly accommodative monetary policy in these major economies.
| Budget and Fiscal Plan - 2023/24 to 2025/26
| | 101 |
British Columbia Economic Review And Outlook
The target range for the U.S. federal funds rate started 2022 at 0.00 to 0.25 per cent, where it had remained since March 2020. Facing mounting inflation pressures and a tight labour market, the Federal Open Market Committee (FOMC or the Fed) started raising rates in March 2022 and then proceeded with rapid and often large increases through the remainder of the year. The target was raised by 0.25 percentage points (pp) in March, 0.50 pp in May, and then 0.75 pp at each of the following four FOMC meetings from June to November. In December, the Fed lowered the size of its rate hike to 0.50 pp, such that the range ended the year at 4.25 to 4.50 per cent. Most recently on February 1, 2023, the Fed raised its target range by an even lower increment of 0.25 pp but signaled that ongoing rate increases are expected.
Chart 3.14 Interest Rate Forecasts
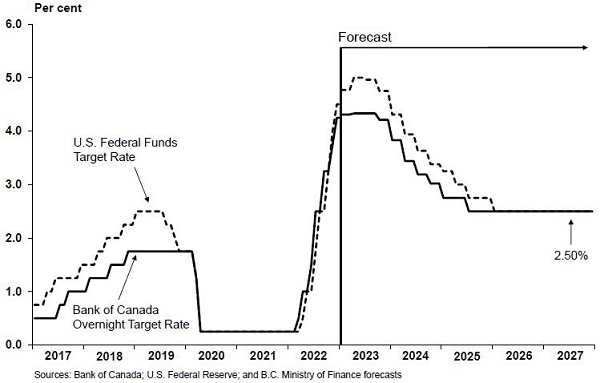
The Bank of Canada (BoC) raised the target for the overnight interest rate by a total of 4.00 pp from March to December 2022, ending the year at 4.25 per cent. The target was generally raised in increments of 0.50 pp, although larger hikes of 1.00 pp and 0.75 pp were made in July and September, respectively. The BoC’s commentary through the year chronicled evolving price pressures (e.g., from supply-chain disruptions, war in Europe, and strong consumer demand), the cooling effects from tightening financial conditions (particularly on Canadian housing markets), and enduring strength in the Canadian labour market. At its meeting on January 25, 2023, the BoC increased its policy rate by a further 0.25 pp and stated that it intends to hold the policy rate at that level as it assesses the cumulative impacts of the interest rate increases.
Outlook
The future paths of interest rates in Canada and the U.S. are uncertain, particularly regarding how high rates will climb and how long they will stay at peak levels. Based on the average of six private sector forecasts as of January 5, 2023, the Ministry assumes the U.S. federal funds rate will average 4.87 per cent in 2023 and 3.81 per cent in 2024. By comparison, the Bank of Canada’s overnight target rate is expected to average 4.30 per cent in 2023 and 3.37 per cent in 2024.
| 102 | | Budget and Fiscal Plan - 2023/24 to 2025/26
|
British Columbia Economic Review And Outlook
The Canadian three-month treasury bill interest rate is expected to average 4.16 per cent in 2023 and 3.16 per cent in 2024, according to the same six private sector forecasters. Meanwhile, the 10-year Government of Canada bond rate is assumed to be 3.01 per cent in 2023 and 2.90 per cent in 2024.
Table 3.4 Private Sector Canadian Interest Rate Forecasts
| 3-month Treasury Bill | 10-year Government Bond | |||||||||||||||
| Average annual interest rate (per cent) | 2023 | 2024 | 2023 | 2024 | ||||||||||||
| BMO | 4.44 | 3.69 | 3.18 | 3.09 | ||||||||||||
| CIBC | 4.04 | 3.22 | 3.32 | 2.80 | ||||||||||||
| National Bank | 3.99 | 3.01 | 2.77 | 2.78 | ||||||||||||
| RBC | 4.14 | 3.28 | 2.85 | 2.63 | ||||||||||||
| Scotiabank | 4.09 | 3.07 | 3.12 | 3.49 | ||||||||||||
| TD | 4.26 | 2.71 | 2.85 | 2.63 | ||||||||||||
| Average (as of January 5, 2023) | 4.16 | 3.16 | 3.01 | 2.90 | ||||||||||||
Exchange Rate
Despite rising domestic interest rates and high energy prices, the Canadian dollar fell in value through most of 2022 compared to the US dollar, starting the year at 78.7 US cents and reaching a low of 72.2 US cents in October. The loonie’s depreciation against the greenback was partly due to a flight to safety by investors amid geopolitical conflict and recession risks. The Canadian dollar strengthened somewhat towards the end of the year but, on an annual basis, fell from an average of 79.8 US cents in 2021 to 76.8 US cents in 2022.
Chart 3.15 Private Sector Expectations for the Canadian Dollar
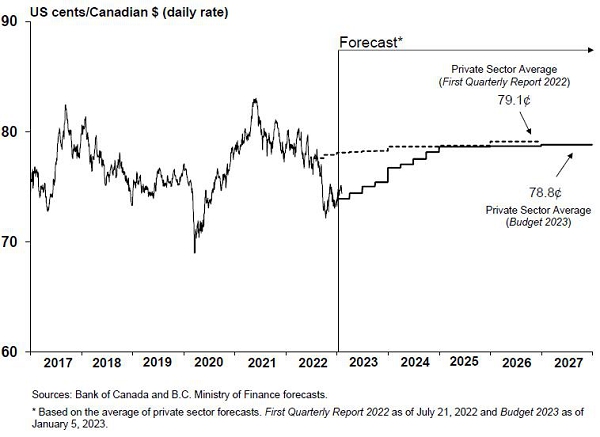
| Budget and Fiscal Plan - 2023/24 to 2025/26
| | 103 |
British Columbia Economic Review And Outlook
Outlook
Based on the average of six private sector forecasts as of January 5, 2023, the Ministry assumes the Canadian dollar will average 74.7 US cents in 2023 and 77.4 US cents in 2024.
Table 3.5 Private Sector Exchange Rate Forecasts
| Average annual exchange rate (US cents/Canadian $) | 2023 | 2024 | ||||||
| BMO | 75.3 | 77.1 | ||||||
| CIBC | 74.4 | 76.3 | ||||||
| National Bank | 77.1 | 79.6 | ||||||
| RBC | 72.9 | na | ||||||
| Scotiabank | 75.8 | 79.0 | ||||||
| TD | 72.6 | 74.8 | ||||||
| Average (as of January 5, 2023) | 74.7 | 77.4 | ||||||
| 104 | | Budget and Fiscal Plan - 2023/24 to 2025/26
|
British Columbia Economic Review And Outlook
Table 3.6.1 Gross Domestic Product (GDP): British Columbia
| Forecast | ||||||||||||||||||||||||||||
| 2021 | 2022 e | 2023 | 2024 | 2025 | 2026 | 2027 | ||||||||||||||||||||||
| Gross Domestic Product at Market Prices: | ||||||||||||||||||||||||||||
| – Real (chained 2012 $ billions) | 282.1 | 290.0 | 291.2 | 295.7 | 302.8 | 309.8 | 316.5 | |||||||||||||||||||||
| (% change) | 6.1 | 2.8 | 0.4 | 1.5 | 2.4 | 2.3 | 2.2 | |||||||||||||||||||||
| – Nominal (current prices, $ billions) | 350.6 | 389.1 | 400.1 | 414.9 | 432.4 | 450.4 | 469.5 | |||||||||||||||||||||
| (% change) | 14.2 | 11.0 | 2.8 | 3.7 | 4.2 | 4.2 | 4.2 | |||||||||||||||||||||
| – GDP price deflator (2012 = 100) | 124.3 | 134.2 | 137.4 | 140.3 | 142.8 | 145.4 | 148.3 | |||||||||||||||||||||
| (% change) | 7.6 | 8.0 | 2.4 | 2.1 | 1.8 | 1.8 | 2.0 | |||||||||||||||||||||
| Real GDP per person (chained 2012 $) | 54,227 | 54,510 | 53,441 | 53,252 | 53,616 | 53,979 | 54,289 | |||||||||||||||||||||
| (% change) | 5.2 | 0.5 | -2.0 | -0.4 | 0.7 | 0.7 | 0.6 | |||||||||||||||||||||
| Real GDP per employed person | 0.0 | -0.4 | 0.1 | 0.5 | 1.2 | 1.2 | 1.0 | |||||||||||||||||||||
| (% change) | ||||||||||||||||||||||||||||
| Unit labour cost1 (% change) | 6.0 | 8.3 | 5.8 | 3.6 | 1.9 | 1.5 | 1.5 | |||||||||||||||||||||
| Components of Real GDP at Market Prices (chained 2012 $ billions) | ||||||||||||||||||||||||||||
| Household expenditure on goods and services | 182.5 | 187.5 | 192.7 | 197.1 | 201.1 | 205.6 | 210.8 | |||||||||||||||||||||
| (% change) | 7.3 | 2.7 | 2.8 | 2.3 | 2.0 | 2.2 | 2.5 | |||||||||||||||||||||
| – Goods | 78.3 | 75.0 | 74.4 | 74.6 | 75.4 | 76.4 | 77.5 | |||||||||||||||||||||
| (% change) | 7.9 | -4.2 | -0.8 | 0.4 | 1.0 | 1.4 | 1.4 | |||||||||||||||||||||
| – Services | 104.4 | 112.6 | 118.5 | 122.6 | 125.9 | 129.3 | 133.5 | |||||||||||||||||||||
| (% change) | 6.8 | 7.9 | 5.2 | 3.5 | 2.7 | 2.7 | 3.2 | |||||||||||||||||||||
| NPISH2 expenditure on goods and services | 4.5 | 4.7 | 4.9 | 5.0 | 5.1 | 5.2 | 5.3 | |||||||||||||||||||||
| (% change) | 2.9 | 5.1 | 3.1 | 2.6 | 2.3 | 2.0 | 1.9 | |||||||||||||||||||||
| Government expenditure on goods and services | 53.6 | 53.8 | 53.1 | 53.0 | 53.2 | 53.9 | 54.5 | |||||||||||||||||||||
| (% change) | 7.9 | 0.4 | -1.4 | -0.2 | 0.5 | 1.2 | 1.2 | |||||||||||||||||||||
| Investment in fixed capital | 77.0 | 81.0 | 79.6 | 80.0 | 82.3 | 83.9 | 85.7 | |||||||||||||||||||||
| (% change) | 10.5 | 5.2 | -1.7 | 0.4 | 2.9 | 2.0 | 2.1 | |||||||||||||||||||||
| Final domestic demand | 318.3 | 327.9 | 330.7 | 335.3 | 341.9 | 348.8 | 356.5 | |||||||||||||||||||||
| (% change) | 8.1 | 3.0 | 0.9 | 1.4 | 2.0 | 2.0 | 2.2 | |||||||||||||||||||||
| Exports of goods and services | 99.0 | 105.3 | 108.2 | 111.5 | 117.3 | 122.3 | 125.5 | |||||||||||||||||||||
| (% change) | 3.2 | 6.3 | 2.8 | 3.0 | 5.2 | 4.3 | 2.6 | |||||||||||||||||||||
| Imports of goods and services | 136.1 | 144.0 | 147.6 | 151.0 | 156.3 | 161.3 | 165.7 | |||||||||||||||||||||
| (% change) | 10.3 | 5.8 | 2.5 | 2.3 | 3.5 | 3.2 | 2.7 | |||||||||||||||||||||
| Inventory change | 1.7 | 1.7 | 0.4 | 0.2 | 0.1 | 0.3 | 0.5 | |||||||||||||||||||||
| Statistical discrepancy | 0.0 | 0.0 | 0.0 | 0.0 | 0.0 | 0.0 | 0.0 | |||||||||||||||||||||
| Real GDP at market prices | 282.1 | 290.0 | 291.2 | 295.7 | 302.8 | 309.8 | 316.5 | |||||||||||||||||||||
| (% change) | 6.1 | 2.8 | 0.4 | 1.5 | 2.4 | 2.3 | 2.2 | |||||||||||||||||||||
1 Unit labour cost is the nominal cost of labour incurred to produce one unit of real output.
2 Non-profit institutions serving households.
e B.C. Ministry of Finance estimate.
| Budget and Fiscal Plan - 2023/24 to 2025/26 | | 105 | |
British Columbia Economic Review And Outlook
Table 3.6.2 Selected Nominal Income and Other Indicators: British Columbia
| Forecast | ||||||||||||||||||||||||||||
| 2021 | 2022 | 2023 | 2024 | 2025 | 2026 | 2027 | ||||||||||||||||||||||
| Compensation of employees1 ($ millions) | 171,837 | 191,314 | e | 203,353 | 213,992 | 223,394 | 231,875 | 240,478 | ||||||||||||||||||||
| (% change) | 12.5 | 11.3 | 6.3 | 5.2 | 4.4 | 3.8 | 3.7 | |||||||||||||||||||||
| Household income ($ millions) | 306,148 | 327,940 | e | 347,966 | 362,804 | 377,585 | 392,191 | 407,573 | ||||||||||||||||||||
| (% change) | 5.5 | 7.1 | 6.1 | 4.3 | 4.1 | 3.9 | 3.9 | |||||||||||||||||||||
| Net operating surplus ($ millions) | 44,601 | 50,639 | e | 43,287 | 40,256 | 41,194 | 43,103 | 45,410 | ||||||||||||||||||||
| (% change) | 26.3 | 13.5 | -14.5 | -7.0 | 2.3 | 4.6 | 5.4 | |||||||||||||||||||||
| Retail sales ($ millions) | 98,567 | 101,570 | e | 103,362 | 106,320 | 109,909 | 113,789 | 117,810 | ||||||||||||||||||||
| (% change) | 12.6 | 3.0 | 1.8 | 2.9 | 3.4 | 3.5 | 3.5 | |||||||||||||||||||||
| Housing starts (units) | 47,607 | 46,721 | 39,033 | 37,037 | 38,033 | 38,034 | 38,048 | |||||||||||||||||||||
| (% change) | 26.2 | -1.9 | -16.5 | -5.1 | 2.7 | 0.0 | 0.0 | |||||||||||||||||||||
| Residential sales ($ millions) | 115,741 | 80,631 | 64,702 | 77,968 | 84,378 | 87,057 | 88,864 | |||||||||||||||||||||
| (% change) | 57.7 | -30.3 | -19.8 | 20.5 | 8.2 | 3.2 | 2.1 | |||||||||||||||||||||
| Residential sales (units) | 124,785 | 80,898 | 70,100 | 82,021 | 87,011 | 88,006 | 88,041 | |||||||||||||||||||||
| (% change) | 32.9 | -35.2 | -13.3 | 17.0 | 6.1 | 1.1 | 0.0 | |||||||||||||||||||||
| Residential average sale price ($) | 927,526 | 996,694 | 923,003 | 950,581 | 969,735 | 989,214 | 1,009,346 | |||||||||||||||||||||
| (% change) | 18.7 | 7.5 | -7.4 | 3.0 | 2.0 | 2.0 | 2.0 | |||||||||||||||||||||
| Consumer price index (2002 = 100) | 136.1 | 145.5 | 151.1 | 154.9 | 158.3 | 161.5 | 164.7 | |||||||||||||||||||||
| (% change) | 2.8 | 6.9 | 3.9 | 2.5 | 2.2 | 2.0 | 2.0 | |||||||||||||||||||||
1 Domestic basis; wages, salaries and employers’ social contributions.
e B.C. Ministry of Finance estimate.
Table 3.6.3 Labour Market Indicators: British Columbia
| Forecast | ||||||||||||||||||||||||||||
| 2021 | 2022 | 2023 | 2024 | 2025 | 2026 | 2027 | ||||||||||||||||||||||
| Population (thousands at July 1) | 5,202 | 5,319 | 5,449 | 5,552 | 5,647 | 5,739 | 5,830 | |||||||||||||||||||||
| (% change) | 0.9 | 2.2 | 2.4 | 1.9 | 1.7 | 1.6 | 1.6 | |||||||||||||||||||||
| Net migration (thousands) | ||||||||||||||||||||||||||||
| – International1,4 | 67.6 | 149.5 | e | 103.1 | 82.0 | 78.4 | 76.3 | 76.1 | ||||||||||||||||||||
| – Interprovincial4 | 27.2 | 0.5 | e | 6.3 | 8.7 | 11.6 | 12.0 | 12.0 | ||||||||||||||||||||
| – Total | 94.8 | 150.0 | e | 109.4 | 90.7 | 89.9 | 88.3 | 88.1 | ||||||||||||||||||||
| Labour force population2 (thousands) | 4,350 | 4,426 | 4,535 | 4,629 | 4,718 | 4,803 | 4,888 | |||||||||||||||||||||
| (% change) | 1.2 | 1.7 | 2.5 | 2.1 | 1.9 | 1.8 | 1.8 | |||||||||||||||||||||
| Labour force (thousands) | 2,852 | 2,881 | 2,923 | 2,950 | 2,979 | 3,008 | 3,039 | |||||||||||||||||||||
| (% change) | 3.3 | 1.0 | 1.5 | 0.9 | 1.0 | 1.0 | 1.0 | |||||||||||||||||||||
| Participation rate3 (%) | 65.6 | 65.1 | 64.5 | 63.7 | 63.1 | 62.6 | 62.2 | |||||||||||||||||||||
| Employment (thousands) | 2,664 | 2,748 | 2,758 | 2,785 | 2,820 | 2,852 | 2,884 | |||||||||||||||||||||
| (% change) | 6.2 | 3.2 | 0.4 | 1.0 | 1.2 | 1.1 | 1.1 | |||||||||||||||||||||
| Unemployment rate (%) | 6.6 | 4.6 | 5.7 | 5.6 | 5.4 | 5.2 | 5.1 | |||||||||||||||||||||
1 International migration includes net non-permanent residents and returning emigrants less net temporary residents abroad.
2 The civilian, non-institutionalized population 15 years of age and over.
3 Percentage of the labour force population in the labour force.
4 Components may not sum to total due to rounding.
e BC Stats estimate.
| 106 | | Budget and Fiscal Plan - 2023/24 to 2025/26 | |
British Columbia Economic Review And Outlook
Table 3.6.4 Major Economic Assumptions
| Forecast | ||||||||||||||||||||||||||||
| 2021 | 2022 | 2023 | 2024 | 2025 | 2026 | 2027 | ||||||||||||||||||||||
| Real GDP | ||||||||||||||||||||||||||||
| Canada (chained 2012 $ billions) | 2,103 | 2,177 | e | 2,181 | 2,212 | 2,252 | 2,288 | 2,324 | ||||||||||||||||||||
| (% change) | 5.0 | 3.5 | 0.2 | 1.4 | 1.8 | 1.6 | 1.6 | |||||||||||||||||||||
| U.S. (chained 2012 US$ billions) | 19,610 | 20,018 | 20,038 | 20,238 | 20,603 | 20,953 | 21,309 | |||||||||||||||||||||
| (% change) | 5.9 | 2.1 | 0.1 | 1.0 | 1.8 | 1.7 | 1.7 | |||||||||||||||||||||
| Japan (chained 2015 Yen trillions) | 540 | 547 | e | 553 | 557 | 560 | 563 | 566 | ||||||||||||||||||||
| (% change) | 2.1 | 1.3 | 1.0 | 0.8 | 0.6 | 0.5 | 0.5 | |||||||||||||||||||||
| China (constant 2010 US$ billions) | 12,775 | 13,157 | 13,736 | 14,409 | 15,043 | 15,705 | 16,396 | |||||||||||||||||||||
| (% change) | 8.4 | 3.0 | 4.4 | 4.9 | 4.4 | 4.4 | 4.4 | |||||||||||||||||||||
| Euro zone1 (chained 2015 Euro billions) | 11,229 | 11,622 | 11,587 | 11,691 | 11,843 | 11,986 | 12,129 | |||||||||||||||||||||
| (% change) | 5.3 | 3.5 | -0.3 | 0.9 | 1.3 | 1.2 | 1.2 | |||||||||||||||||||||
| Industrial production index (% change) | ||||||||||||||||||||||||||||
| U.S. | 4.9 | 3.9 | -1.2 | 0.3 | 1.8 | 1.7 | 1.7 | |||||||||||||||||||||
| Japan | 5.4 | 0.1 | 1.6 | 1.4 | 0.9 | 0.7 | 0.7 | |||||||||||||||||||||
| China | 10.9 | 3.8 | 4.4 | 4.6 | 4.1 | 4.1 | 4.1 | |||||||||||||||||||||
| Euro zone1 | 8.0 | 0.4 | e | -0.6 | 1.8 | 1.6 | 1.2 | 1.2 | ||||||||||||||||||||
| Housing starts (thousands) | ||||||||||||||||||||||||||||
| Canada | 271 | 262 | 210 | 200 | 200 | 200 | 200 | |||||||||||||||||||||
| (% change) | 24.5 | -3.4 | -19.8 | -4.8 | 0.0 | 0.0 | 0.0 | |||||||||||||||||||||
| U.S. | 1,601 | 1,553 | 1,295 | 1,345 | 1,350 | 1,350 | 1,350 | |||||||||||||||||||||
| (% change) | 16.0 | -3.0 | -16.6 | 3.9 | 0.4 | 0.0 | 0.0 | |||||||||||||||||||||
| Japan | 856 | 860 | 860 | 865 | 880 | 880 | 880 | |||||||||||||||||||||
| (% change) | 5.0 | 0.4 | 0.1 | 0.6 | 1.7 | 0.0 | 0.0 | |||||||||||||||||||||
| Consumer price index | ||||||||||||||||||||||||||||
| Canada (2002 = 100) | 141.6 | 151.2 | 157.1 | 160.9 | 164.4 | 167.7 | 171.0 | |||||||||||||||||||||
| (% change) | 3.4 | 6.8 | 3.9 | 2.4 | 2.2 | 2.0 | 2.0 | |||||||||||||||||||||
| Canadian interest rates (%) | ||||||||||||||||||||||||||||
| 3-month treasury bills | 0.12 | 2.30 | 4.16 | 3.16 | 2.63 | 2.50 | 2.50 | |||||||||||||||||||||
| 10-year government bonds | 1.36 | 2.77 | 3.01 | 2.90 | 2.75 | 2.75 | 2.75 | |||||||||||||||||||||
| United States interest rates (%) | ||||||||||||||||||||||||||||
| 3-month treasury bills | 0.04 | 2.08 | 4.68 | 3.57 | 2.69 | 2.50 | 2.50 | |||||||||||||||||||||
| 10-year government bonds | 1.44 | 2.95 | 3.58 | 3.28 | 2.81 | 2.75 | 2.75 | |||||||||||||||||||||
| Exchange rate (US cents / Canadian $) | 79.8 | 76.8 | 74.7 | 77.4 | 78.6 | 78.7 | 78.8 | |||||||||||||||||||||
| British Columbia goods and services | ||||||||||||||||||||||||||||
| Export price deflator (% change) | 15.8 | 12.2 | e | -0.2 | 0.5 | 0.5 | 0.8 | 1.3 | ||||||||||||||||||||
1 Euro zone (19) is Austria, Belgium, Cyprus, Estonia, Finland, France, Germany, Greece, Ireland, Italy, Latvia, Lithuania, Luxembourg, Malta, Netherlands, Portugal, Slovakia, Slovenia and Spain.
e B.C. Ministry of Finance estimate.
| Budget and Fiscal Plan - 2023/24 to 2025/26 | | 107 | |
British Columbia Economic Review And Outlook
The Economic Forecast Council, Budget 2023
Introduction
In accordance with the Budget Transparency and Accountability Act, the Minister of Finance, in preparing the provincial budget, consults the Economic Forecast Council (the Council or EFC) on British Columbia's economic outlook. The 13-member Council is comprised of leading economists from several of Canada's major financial and private research institutions.
The most recent meeting between the Minister and the EFC was on December 5, 2022, with Council members presenting their estimates for economic performance in 2022 and their forecasts for 2023 through 2027 and over the long-term. Key topics of discussion included: impacts of the Bank of Canada's monetary policy tightening and inflation expectations; B.C.'s risk of recession; opportunities and challenges with climate change and energy transition; B.C.'s labour market; housing supply and affordability; and immigration.
EFC members were welcome to revise their forecasts following the meeting until January 6, 2023 (6 of the 13 members chose to resubmit). Forecast details from the Council's surveys are summarized in the table at the end of this topic box.
British Columbia Outlook
On average, the Council estimates that B.C.'s economy grew by 3.0 per cent in 2022, down 1.2 percentage points from the Council's previous projection in January 2022. Members' latest forecasts call for B.C. economic growth of 0.5 per cent in 2023 and 1.6 per cent in 2024, down 2.2 percentage points in 2023 and 0.7 percentage points in 2024 compared to their January 2022 outlook. Over the medium-term, the Council forecasts B.C.'s economy to grow by 2.3 per cent annually in 2025 and 2026 and 2.1 per cent in 2027. Over the long-term, members forecast average growth of 1.9 per cent (see Chart 1).
Chart 1 – EFC Outlook for B.C.
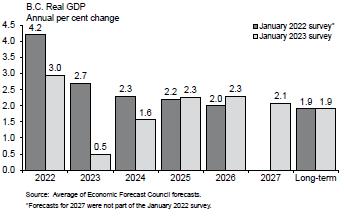
The Council estimates that B.C.'s economy grew at a slower rate than Canada's in 2022, and forecasts similar growth in the two jurisdictions in 2023 and 2024. B.C.'s economy is expected to grow faster than the national average throughout the rest of forecast horizon (see Chart 2).
Chart 2 – EFC Outlook for B.C. and Canada

Collectively, the Council anticipates slowing economic growth resulting from monetary policy successfully driving down demand. Members discussed the uncertainty about a coming recession highlighting that the exposure risks are higher for provinces with elevated levels of household debt. Many members also highlighted the risk of inflation remaining "sticky" and taking longer to return to the Bank of Canada's target range of 1-3 per cent.
Housing supply and affordability issues were another key topic of discussion. Most Council members noted housing as one of the most pressing issues. While several highlighted that the issue of housing affordability in B.C. pre-dated COVID-19, tight supply paired with extremely low mortgage rates and the shift towards remote work exacerbated the housing affordability challenge further. In order to tackle this issue, most members indicated the need to continue to work towards expanding the housing supply. Continuing to expand purpose-built rentals and remove barriers to home building (such as local zoning rules and slow approval processes) were some of the possible measures suggested to help address housing affordability.
| 108 | | Budget and Fiscal Plan - 2023/24 to 2025/26
|
British Columbia Economic Review And Outlook
The Council also discussed B.C.'s labour market dynamics and outlook. An aging population, diminishing labour force participation among older workers, and longstanding skills shortages were highlighted as significant factors driving tightness in the labour market and relatively high job vacancy rates. However, many members noted disruptions from the pandemic as the primary source of current labour supply and demand imbalances. Looking ahead, the Council expects job creation to slow and job vacancy rates to normalize as the economy slows in 2023, resulting in upward pressure on the unemployment rate. Members also highlighted increased immigration and investment in training as possible ways to help fill gaps in the job matching process and ease labour market pressures.
The opportunities and challenges associated with climate change, the clean energy transition, as well as striking a balance between resource development and climate related risks was another key topic of discussion. Members highlighted B.C.'s strong regulatory framework, Indigenous partnerships and relatively clean resource development as opportunities to aid in the energy transition. They also noted opportunities for B.C. to be a reliable global supplier of natural resources amid growing geopolitical tensions, specifically highlighting the potential to capitalize on B.C.'s mining and LNG sectors.
Other topics discussed by the Council included the need for continued climate mitigation and adaption, targeted fiscal programs and investment in childcare.
British Columbia Economic Forecast Council:
Summary of B.C. real GDP forecasts, annual per cent change
| Participant | Organization | 2022 | 2023 | 2024 | 2025 | 2026 | 2027 | Long-term | ||||||||||||||||||||||
| Douglas Porter | Bank of Montreal1 | 3.0 | -0.3 | 1.6 | 2.0 | 2.0 | 2.0 | 2.0 | ||||||||||||||||||||||
| Brendon Ogmundson | BC Real Estate Association | 3.5 | 0.8 | 2.0 | 2.5 | 2.7 | 2.7 | 2.7 | ||||||||||||||||||||||
| Ken Peacock | Business Council of BC | 2.9 | 0.9 | 1.5 | 1.9 | 2.7 | 2.5 | 1.8 | ||||||||||||||||||||||
| Bryan Yu | Central 1 Credit Union1 | 3.2 | 1.3 | 2.0 | 3.0 | 2.7 | 2.0 | 2.1 | ||||||||||||||||||||||
| Avery Shenfeld | CIBC1 | 3.0 | 0.3 | 0.7 | na | na | na | na | ||||||||||||||||||||||
| Pedro Antunes | Conference Board of Canada1 | 2.6 | 1.0 | 2.9 | 2.0 | 2.0 | 1.9 | 1.7 | ||||||||||||||||||||||
| Jimmy Jean | Desjardins Group | 3.0 | -0.1 | na | na | na | na | na | ||||||||||||||||||||||
| Sébastien Lavoie | Laurentian Bank Securities | 3.0 | -0.2 | 1.3 | 1.7 | 1.5 | 1.5 | 1.5 | ||||||||||||||||||||||
| Stéfane Marion | National Bank | 2.7 | 0.7 | 1.6 | 1.5 | 1.4 | 1.4 | 1.4 | ||||||||||||||||||||||
| Craig Wright | RBC1 | 3.1 | 0.3 | 1.1 | 2.9 | 2.5 | 2.2 | 2.2 | ||||||||||||||||||||||
| Jean-François Perrault | Scotiabank | 2.0 | 0.5 | 1.5 | na | na | na | na | ||||||||||||||||||||||
| Aaron Stokes | Stokes Economics | 3.3 | 0.8 | 2.2 | 3.2 | 3.5 | 2.6 | na | ||||||||||||||||||||||
| Derek Burleton | TD1 | 3.1 | 0.5 | 0.3 | 1.8 | 1.9 | 1.9 | 1.9 | ||||||||||||||||||||||
| Average | 3.0 | 0.5 | 1.6 | 2.3 | 2.3 | 2.1 | 1.9 | |||||||||||||||||||||||
| Standard Deviation | 0.4 | 0.5 | 0.7 | 0.6 | 0.6 | 0.4 | 0.4 | |||||||||||||||||||||||
1 Updated survey submitted subsequent to the December 5, 2022 meeting.
| Budget and Fiscal Plan - 2023/24 to 2025/26
| | 109 |
British Columbia Economic Review And Outlook
Canadian Outlook
After an estimated gain of 3.4 per cent in 2022, the EFC expects Canadian real GDP growth to slow significantly, increasing by 0.5 per cent in 2023. Similar to B.C., economic growth is forecast to strengthen thereafter, with the economy expected to expand by 1.5 per cent, 2.1 per cent, 1.9 per cent and 1.8 per cent each year from 2024 to 2027, respectively. The Council anticipates long-term economic growth in Canada to average 1.7 per cent.
Consumer price inflation (CPI) in Canada (and abroad) was a key topic of discussion. While some members expect inflation to reach a more normal pace in 2023, several noted the risk of persistently high inflation in 2023 before converging towards the Bank of Canada's target range of 1 to 3 per cent. Most members anticipate inflation to remain above the 3 per cent upper bound in 2023, averaging 3.5 per cent. From there, the Council anticipates Canadian CPI to reach 2.2 per cent in 2024 before stabilizing at the 2 per cent target over the medium to long-term forecast horizon.
Members also discussed the risks and opportunities associated with the increased levels of international immigration. Many highlighted the importance of planning and using a targeted approach to fill the most needed gaps across the country, while some noted that increasing immigration could help provide balance to the labour market.
International Outlook
The Council forecasts U.S. real GDP growth of 0.3 per cent in 2023, following growth of 1.8 per cent the previous year. The EFC is calling for 1.5 per cent growth in 2024, 2.2 per cent in 2025, 2.0 per cent in 2026, then 1.9 per cent annually in 2027 and over the long-term.
Some members discussed the importance of reliable export partners and secure supply chains amid growing geopolitical risks. B.C.'s high trade exposure to China was also highlighted, as slowing growth and ongoing pandemic disruptions could pose additional challenges.
Canadian Dollar
Council members' projections for the Canadian dollar ranged from 72.0 US cents to 77.8 US cents in 2023 and from 75.0 US cents to 79.4 US cents in 2024. Over the medium-term, EFC forecasts ranged from lows of 74 to 75 US cents to a range of highs of 80 to 81 US cents, while long-term forecasts ranged from 75.0 US cents to 80.0 US cents (see Chart 3).
Chart 3 – EFC Outlook for the Dollar
| 110 | | Budget and Fiscal Plan - 2023/24 to 2025/26
|
British Columbia Economic Review And Outlook
Forecast Survey – Participants’ Opinions
| 2022 | 2023 | 2024 | 2025 | 2026 | 2027 | Long-term | ||||||||||||||||||||||||||||||||||||
| All figures are based on annual averages | Range | Average1 | Range | Average1 | Range | Average1 | Range | Average1 | Range | Average1 | Range | Average1 | Range | Average1 | ||||||||||||||||||||||||||||
| British Columbia | ||||||||||||||||||||||||||||||||||||||||||
| Real GDP (% change) | 2.0 – 3.5 | 3.0 | (13) | -0.3 – 1.3 | 0.5 | (13) | 0.3 – 2.9 | 1.6 | (12) | 1.5 – 3.2 | 2.3 | (10) | 1.4 – 3.5 | 2.3 | (10) | 1.4 – 2.7 | 2.1 | (10) | 1.4 – 2.7 | 1.9 | (9) | |||||||||||||||||||||
| Nominal GDP (% change) | 5.3 – 11.0 | 8.7 | (12) | 0.3 – 4.8 | 2.8 | (12) | 2.5 – 4.5 | 3.6 | (12) | 3.3 – 6.0 | 4.3 | (10) | 3.2 – 5.4 | 4.2 | (9) | 3.2 – 4.7 | 4.0 | (9) | 3.2 – 4.7 | 4.0 | (9) | |||||||||||||||||||||
| GDP Deflator (% change) | 2.6 – 8.1 | 5.8 | (11) | -0.4 – 4.0 | 2.2 | (11) | 0.9 – 2.5 | 2.1 | (11) | 1.3 – 3.0 | 2.0 | (10) | 1.7 – 2.3 | 2.0 | (9) | 1.8 – 2.5 | 2.0 | (9) | 1.8 – 2.4 | 2.0 | (9) | |||||||||||||||||||||
| Real business non-residential investment (% change) | 2.4–7.6 | 4.8 | (5) | -1.1 – 4.0 | 1.0 | (5) | -12.5 – 3.0 | -5.1 | (5) | -3.5 – 3.0 | 0.1 | (5) | -0.7 – 3.1 | 2.0 | (4) | 0.6 – 5.2 | 2.8 | (4) | 1.3 – 3.0 | 2.1 | (3) | |||||||||||||||||||||
| Real business machinery and equipment investment (% change) | 2.3 – 12.3 | 6.6 | (6) | -1.0 – 2.1 | 0.9 | (6) | -2.0 – 4.5 | 2.4 | (6) | 0.5 – 5.5 | 3.2 | (6) | 0.2 – 4.8 | 2.7 | (5) | 0.5 – 5.5 | 2.8 | (5) | 1.4 – 3.5 | 2.5 | (4) | |||||||||||||||||||||
| Household Income (% change) | 5.8 – 12.0 | 7.8 | (8) | 2.5 – 5.0 | 3.8 | (8) | 3.5 – 6.1 | 4.5 | (8) | 3.5 – 6.4 | 4.4 | (8) | 3.3 – 6.1 | 4.1 | (7) | 3.1 – 5.3 | 4.0 | (7) | 3.3 – 4.2 | 3.8 | (6) | |||||||||||||||||||||
| Net Migration (thousand persons) | 98.0 –133.1 | 116.3 | (9) | 82.0 – 120.0 | 101.6 | (9) | 79.1 – 120.0 | 98.0 | (9) | 67.7 – 115.0 | 96.0 | (9) | 65.0 – 110.0 | 89.9 | (8) | 65.0 – 100.0 | 83.0 | (8) | 55.0 – 98.0 | 75.5 | (6) | |||||||||||||||||||||
| Employment (% change) | 2.9 – 3.2 | 3.1 | (12) | 0.1 – 1.0 | 0.6 | (12) | -0.3 – 1.9 | 1.0 | (11) | 0.8 – 2.4 | 1.4 | (10) | 0.8 – 1.8 | 1.3 | (9) | 0.7 – 1.8 | 1.2 | (9) | 0.7 – 1.8 | 1.2 | (7) | |||||||||||||||||||||
| Unemployment rate (%) | 4.3 – 5.3 | 4.8 | (13) | 5.0 – 6.1 | 5.6 | (13) | 4.7 – 6.3 | 5.8 | (12) | 4.6 – 6.1 | 5.5 | (10) | 4.5 – 5.8 | 5.1 | (9) | 4.3 – 5.6 | 5.0 | (9) | 4.1 – 5.5 | 4.8 | (8) | |||||||||||||||||||||
| Net operating surplus of corporations (% change) | 7.3 – 17.9 | 12.1 | (6) | -14.5 – 3.0 | -5.2 | (6) | -10.0 – 10.0 | 2.6 | (6) | -1.3 – 8.0 | 3.9 | (6) | 3.0 – 5.5 | 4.3 | (5) | 1.4 – 4.6 | 3.0 | (5) | 4.0 – 5.0 | 4.5 | (3) | |||||||||||||||||||||
| Housing starts (thousand units) | 40.5 – 48.0 | 44.7 | (13) | 29.0 – 49.8 | 37.8 | (13) | 31.9 – 52.5 | 38.5 | (12) | 33.0 – 56.0 | 40.6 | (10) | 35.0 – 58.0 | 41.6 | (9) | 35.0 – 60.0 | 41.6 | (9) | 35.0 – 55.0 | 39.6 | (7) | |||||||||||||||||||||
| MLS residential unit sales (thousand units) | 79.7 – 83.0 | 81.4 | (7) | 56.2 – 83.0 | 70.2 | (7) | 77.8 – 90.0 | 83.3 | (6) | 85.0 – 100.0 | 92.2 | (6) | 85.0 – 101.0 | 91.8 | (6) | 85.0 – 105.0 | 93.5 | (6) | 85.0 – 110.0 | 93.0 | (5) | |||||||||||||||||||||
| MLS residential average sale price ($ thousand) | 978 – 995 | 985 | (7) | 881 – 969 | 917 | (7) | 901 – 980 | 936 | (6) | 924 – 1,000 | 961 | (6) | 947 – 1,080 | 998 | (6) | 969 – 1,150 | 1,034 | (6) | 1,010 – 1,200 | 1,105 | (2) | |||||||||||||||||||||
| Retail sales (% change) | 2.4 – 4.2 | 3.3 | (9) | 0.0 – 2.9 | 1.9 | (9) | 2.4 – 4.3 | 3.4 | (8) | 3.0 – 5.6 | 4.1 | (8) | 3.0 – 6.1 | 4.3 | (7) | 3.0 – 5.1 | 4.0 | (7) | 2.9 – 5.0 | 3.7 | (6) | |||||||||||||||||||||
| Consumer price index (% change) | 6.7 – 7.1 | 6.9 | (12) | 2.6 – 4.4 | 3.6 | (12) | 1.8 – 2.6 | 2.2 | (11) | 1.9 – 2.2 | 2.1 | (9) | 2.0 – 2.2 | 2.0 | (8) | 2.0 – 2.2 | 2.0 | (8) | 2.0 – 2.0 | 2.0 | (7) | |||||||||||||||||||||
| United States | ||||||||||||||||||||||||||||||||||||||||||
| Real GDP (% change) | 1.5 – 2.1 | 1.8 | (13) | 0.0 – 0.9 | 0.3 | (13) | 0.7 – 2.5 | 1.5 | (13) | 1.5 – 2.9 | 2.2 | (10) | 1.5 – 2.4 | 2.0 | (9) | 1.5 – 2.1 | 1.9 | (8) | 1.5 – 2.1 | 1.9 | (8) | |||||||||||||||||||||
| Intended Federal Funds rate (%) | 1.45 – 4.50 | 2.45 | (12) | 3.93 – 5.00 | 4.69 | (12) | 3.00 – 4.40 | 3.55 | (12) | 2.25 – 3.40 | 2.65 | (8) | 2.25 – 2.75 | 2.47 | (8) | 2.25 – 2.75 | 2.46 | (7) | 2.25 – 2.75 | 2.46 | (7) | |||||||||||||||||||||
| Housing starts (million units) | 1.45 – 1.59 | 1.55 | (12) | 0.90 – 1.46 | 1.33 | (12) | 1.10 – 1.52 | 1.42 | (11) | 1.40 – 1.60 | 1.50 | (7) | 1.45 – 1.80 | 1.55 | (7) | 1.40 – 2.00 | 1.56 | (7) | 1.50 – 2.00 | 1.59 | (6) | |||||||||||||||||||||
| Canada | ||||||||||||||||||||||||||||||||||||||||||
| Real GDP (% change) | 3.2 – 3.6 | 3.4 | (13) | 0.0 – 0.9 | 0.5 | (13) | 0.4 – 2.3 | 1.5 | (13) | 1.3 – 2.7 | 2.1 | (11) | 1.5 – 2.5 | 1.9 | (10) | 1.5 – 2.3 | 1.8 | (9) | 1.5 – 1.9 | 1.7 | (9) | |||||||||||||||||||||
| Bank of Canada overnight target rate (%) | 1.88 – 4.25 | 2.45 | (12) | 3.82 – 4.50 | 4.21 | (12) | 2.55 – 3.90 | 3.16 | (12) | 2.00 – 3.25 | 2.52 | (10) | 2.00 – 2.50 | 2.31 | (9) | 2.00 – 2.50 | 2.34 | (8) | 2.00 – 2.50 | 2.34 | (8) | |||||||||||||||||||||
| Exchange rate (US cents/C$) | 72.5 – 77.0 | 75.9 | (13) | 72.0 – 77.8 | 74.4 | (13) | 75.0 – 79.4 | 77.2 | (13) | 75.0 – 80.0 | 77.8 | (10) | 74.5 – 81.0 | 78.1 | (9) | 74.3 – 81.0 | 78.2 | (8) | 75.0 – 80.0 | 78.3 | (7) | |||||||||||||||||||||
| Housing starts (thousand units) | 250 – 267 | 260 | (13) | 168 – 271 | 221 | (13) | 174 – 283 | 217 | (13) | 207 – 302 | 228 | (11) | 210 – 296 | 230 | (10) | 210 – 294 | 230 | (9) | 210 – 275 | 225 | (8) | |||||||||||||||||||||
| Consumer price index (% change) | 6.7 – 6.9 | 6.8 | (13) | 2.7 – 4.2 | 3.5 | (13) | 1.7 – 2.6 | 2.2 | (13) | 1.7 – 2.2 | 2.0 | (11) | 2.0 – 2.1 | 2.0 | (10) | 1.9 – 2.0 | 2.0 | (9) | 2.0 – 2.0 | 2.0 | (8) | |||||||||||||||||||||
1 Based on responses from participants providing forecasts. Number of respondents shown in parentheses.
| Budget and Fiscal Plan - 2023/24 to 2025/26
| | 111 |
This page
intentionally left blank.
PART 4 | 2022/23 UPDATED FINANCIAL FORECAST (THIRD QUARTERLY REPORT)
Table 4.1 2022/23 Forecast Update
| ($ millions) | Budget 2022 | First Quarterly Report | Second Quarterly Report | Third Quarterly Report | ||||||||||||
| Revenue | 68,552 | 77,854 | 81,097 | 82,700 | ||||||||||||
| Expense | (71,013 | ) | (74,148 | ) | (73,065 | ) | (77,108 | ) | ||||||||
| Pandemic and Recovery Contingencies | (2,000 | ) | (2,000 | ) | (2,000 | ) | (2,000 | ) | ||||||||
| Forecast allowance | (1,000 | ) | (1,000 | ) | (300 | ) | - | |||||||||
| Surplus (Deficit) | (5,461 | ) | 706 | 5,732 | 3,592 | |||||||||||
| Capital Spending: | ||||||||||||||||
| Taxpayer-supported capital spending | 9,279 | 9,423 | 9,091 | 8,117 | ||||||||||||
| Self-supported capital spending | 4,374 | 4,362 | 4,343 | 4,055 | ||||||||||||
| 13,653 | 13,785 | 13,434 | 12,172 | |||||||||||||
| Provincial Debt: | ||||||||||||||||
| Taxpayer-supported debt | 73,475 | 66,742 | 61,908 | 63,701 | ||||||||||||
| Self-supported debt | 30,956 | 29,784 | 29,784 | 29,788 | ||||||||||||
| Total debt (including forecast allowance) | 105,431 | 97,526 | 91,992 | 93,489 | ||||||||||||
| Taxpayer-supported debt to GDP ratio | 20.0 | % | 17.0 | % | 15.8 | % | 16.4 | % | ||||||||
| Taxpayer-supported debt to revenue ratio | 110.9 | % | 88.4 | % | 78.0 | % | 78.7 | % | ||||||||
Introduction
The third-quarter fiscal outlook for 2022/23 forecasts a surplus of $3.6 billion, which is $2.1 billion lower than the second-quarter outlook from November 2022. The revenue forecast is $1.6 billion higher and expenses are up by $4.0 billion, including $2.7 billion of additional spending authority requested through Supplementary Estimates.
Operating forecast changes are illustrated in Chart 4.1, and additional detail is provided in Table 4.2, including changes in each quarter since Budget 2022.
The Province's operating results have improved significantly from the Budget 2022 projection of a $5.5 billion deficit. While some uncertainty remains in the last quarter of the fiscal year, the forecast allowance is removed given the expected year-end operating results.
Capital spending for the year is lower by $1.3 billion due to scheduling changes in taxpayer-supported and self-supported projects.
The taxpayer-supported debt forecast is higher by $1.8 billion from the Second Quarterly Report due to the lower operating surplus, partly offset by lower capital spending (see Table 4.5 on page 121 for details on the debt forecast).
| Budget and Fiscal Plan - 2023/24 to 2025/26
| | 113 |
2022/23 Updated Financial Forecast (Third Quarterly Report)
Table 4.2 2022/23 Financial Forecast Changes
| ($ millions) | ||||||||||||||||
| 2022/23 deficit at Budget 2022 (February 22, 2022) | (5,461 | ) | (5,461 | ) | ||||||||||||
| 2022/23 surplus at the First Quarterly Report (September 12, 2022) | 706 | |||||||||||||||
| 2022/23 surplus at the Second Quarterly Report (November 25, 2022) | 5,732 | |||||||||||||||
| Q1 Update | Q2 Update | Q3 Update | Total Changes | |||||||||||||
| Revenue changes: | ||||||||||||||||
| Personal income tax – stronger preliminary 2021 tax assessment reflecting increases in incomes from middle to higher income-earning individuals resulting in an unusual high prior year adjustment, as well as an improvement in 2022 household income | 2,924 | 1,269 | 671 | 4,864 | ||||||||||||
| Corporate income tax – increase in instalments reflecting an improved federal government outlook of 2022 national corporate taxable income, and a higher prior year settlement payment, reflecting stronger 2021 tax assessments | 1,813 | 2,808 | 397 | 5,018 | ||||||||||||
| Provincial sales tax – higher 2021/22 carry forward impacts and higher nominal expenditures in most components | 374 | 114 | 196 | 684 | ||||||||||||
| Property transfer tax – due to slower housing market and higher mortgage rates | (300 | ) | 50 | (250 | ) | |||||||||||
| Employer health tax – mainly expected higher wages and re-assessment related to prior years | 243 | 100 | 75 | 418 | ||||||||||||
| Other taxation sources – mainly reflecting year-to-date results and the impacts of the 2021/22 year-end results | 32 | (120 | ) | (2 | ) | (90 | ) | |||||||||
| Natural gas royalties – changes in natural gas prices and natural gas liquids royalties, as well as impacts of the new royalty system partly offset by changes in utilization of royalty and infrastructure programs/credits | 1,688 | (176 | ) | (217 | ) | 1,295 | ||||||||||
| Mining – changes in coal and copper prices, partly offset by changes in mining costs | 443 | (43 | ) | 400 | ||||||||||||
| Electricity sales under the Columbia River Treaty – changes in Mid-C electricity prices and stronger US dollar | 137 | 9 | 75 | 221 | ||||||||||||
| Forests – higher stumpage rates and logging tax, reflecting changes in lumber prices | 394 | 218 | 122 | 734 | ||||||||||||
| Other natural resources – mainly changes in petroleum prices and water rental revenues | 36 | (9 | ) | 27 | ||||||||||||
| Other revenue - post-secondary institutions fees and other revenue sources | (115 | ) | (46 | ) | (30 | ) | (191 | ) | ||||||||
| Other sources – mainly changes in investment earnings, other fees, penalties, miscellaneous | (17 | ) | 43 | 298 | 324 | |||||||||||
| Canada health and social transfers – mainly additional one-time funding to reduce or eliminate backlogs of medical and surgical procedures and changes in B.C. share of national population | 257 | (7 | ) | 250 | ||||||||||||
| Other federal government transfers – mainly change to Disaster Financial Assistance Arrangements recognition of eligible claims, COVID-19 relief, & higher transfers to taxpayer-supported entities | 1,001 | (41 | ) | (65 | ) | 895 | ||||||||||
| Commercial Crown corporation net income – mainly changes at ICBC and BCLC | 92 | (576 | ) | 33 | (451 | ) | ||||||||||
| Total revenue changes | 9,302 | 3,243 | 1,603 | 14,148 | ||||||||||||
| Less: expense increases (decreases): | ||||||||||||||||
| Consolidated Revenue Fund changes: | ||||||||||||||||
| Supplementary Estimates - see Table 4.3 for details | - | - | 2,715 | 2,715 | ||||||||||||
| Statutory spending: | ||||||||||||||||
| Fire management costs | 229 | (6 | ) | - | 223 | |||||||||||
| Rental Protection Fund | - | - | 500 | 500 | ||||||||||||
| Updated cost of the updated Shared Recovery Mandate for labour negotiations | 1,900 | (1,100 | ) | (300 | ) | 500 | ||||||||||
| Affordability measures | 1,000 | 100 | 500 | 1,600 | ||||||||||||
| Other statutory spending | 14 | 89 | 44 | 147 | ||||||||||||
| Refundable tax credits – mainly reflects preliminary 2021 tax assessment information | 77 | 92 | 253 | 422 | ||||||||||||
| Other expense changes | (122 | ) | (85 | ) | 124 | (83 | ) | |||||||||
| Spending funded by third party recoveries | 75 | 10 | - | 85 | ||||||||||||
| Changes in spending profile of service delivery agencies: | ||||||||||||||||
| School districts | 60 | 11 | 176 | 247 | ||||||||||||
| Universities | (97 | ) | 35 | (16 | ) | (78 | ) | |||||||||
| Colleges | 43 | (19 | ) | 20 | 44 | |||||||||||
| Health authorities and hospital societies | 1,580 | 15 | 838 | 2,433 | ||||||||||||
| Other service delivery agencies 1 | 149 | (112 | ) | (100 | ) | (63 | ) | |||||||||
| (Increase) decrease in transfers to service delivery agencies - accounting elimination | (1,773 | ) | (113 | ) | (711 | ) | (2,597 | ) | ||||||||
| Total expense changes | 3,135 | (1,083 | ) | 4,043 | 6,095 | |||||||||||
| Subtotal | 6,167 | 4,326 | (2,440 | ) | 8,053 | |||||||||||
| Forecast allowance - decrease (increase) | - | 700 | 300 | 1,000 | ||||||||||||
| Total changes | 6,167 | 5,026 | (2,140 | ) | 9,053 | |||||||||||
| 2022/23 surplus at the First Quarterly Report | 706 | |||||||||||||||
| 2022/23 surplus at the Second Quarterly Report | 5,732 | |||||||||||||||
| 2022/23 surplus at the Third Quarterly Report | 3,592 | 3,592 | ||||||||||||||
1 Includes BC Transportation Financing Authority, BC Transit, BC Housing Management Commission, Community Living BC, and other entities.
| 114 | | Budget and Fiscal Plan - 2023/24 to 2025/26
|
2022/23 Updated Financial Forecast (Third Quarterly Report)
Chart 4.1 2022/23 Surplus – Major Changes from the Second Quarterly Report
Surplus decreased by $2.1 billion
$ millions
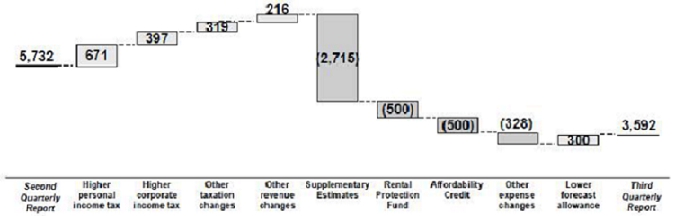
Revenue
Total government revenue is now forecast to be $1.6 billion higher than the Second Quarterly Report. Major changes include:
| · | $671 million increase in personal income tax revenue, mainly reflecting stronger 2021 preliminary personal tax assessments results and an improvement in household income; |
| · | $397 million higher corporate income tax revenues mainly due to stronger 2021 preliminary corporate tax assessments results and higher corporate income tax advance payments from the federal government; |
| · | $319 million higher other taxation revenue sources mainly reflecting year-to-date information; |
| · | $20 million decrease in natural resource revenue mainly due to the effects of lower natural gas and coal prices partly offset by higher stumpage rates and Mid-Columbia electricity price; |
| · | $268 million increase in revenue from fees, licences, investment earnings and miscellaneous sources mainly due to improvements in taxpayer-supported entities projections; |
| · | $65 million decrease in federal government contributions mainly due to reduced transfers under the Disaster Financial Assistance Arrangements and to taxpayer supported Crown entities; and |
| · | $33 million increase in commercial Crown corporations' net income due to higher projections from the BC Lottery Corporation and the Liquor Distribution Branch. |
| Budget and Fiscal Plan - 2023/24 to 2025/26
| | 115 |
2022/23 Updated Financial Forecast (Third Quarterly Report)
Expense
Total government spending is now forecast to be $4.0 billion higher than the Second Quarterly Report. Major changes include:
| · | $2.7 billion in Supplementary Estimates (see Table 4.3); |
| · | $500 million increase for the Rental Protection Fund, through the Housing Priority Initiatives Special Account, to support non-profit housing organizations purchase affordable residential rental buildings and ownership co-operatives to preserve lower-cost rental units at risk of redevelopment; |
| · | $500 million increase to fund the BC Affordability Credit — a one-time enhancement of the April payments through the Climate Action Tax Credit. This is in addition to the $1.1 billion in cost of living measures provided earlier in this fiscal year; |
| · | $253 million increase for refundable tax transfers mainly reflecting 2021 tax assessments and stronger year-to-date activity in the film and television industry; |
| · | $207 million in higher net spending by various service delivery agencies; and, |
| · | $168 million increase in interest and other expenses. |
| · | The above increases were partly offset by $300 million in labour negotiation costs shifted to 2023/24 to reflect the change in timing in the signing of agreements. The total cost of the mandate in this fiscal year is now forecast to be $1.2 billion, including initial allocations in Budget 2022 contingencies. The overall cost of the Shared Recovery Mandate is $10.8 billion for the 2022/23 to 2024/25 period. |
Table 4.2 provides a detailed breakdown of changes in the operating results by quarter from Budget 2022.
2022/23 Supplementary Estimates
Government intends to introduce Supplementary Estimates to obtain the necessary legislative appropriation to fund the following initiatives:
| Table 4.3 - 2022/23 Supplementary Estimates | ||||
| ($ millions) | 2022/23 | |||
| Growing Communities Fund | 1,000 | |||
| BC Ferries Fare Affordability | 500 | |||
| Critical Community Infrastructure | 450 | |||
| Food Security Initiatives | 160 | |||
| BC Cancer Foundation | 150 | |||
| Local Government Next Gen 911 Readiness Fund | 150 | |||
| Watershed Security Fund | 100 | |||
| Highway and Community Cellular Connectivity | 85 | |||
| Accelerating Funding for First Nations Agreements | 75 | |||
| Public Libraries | 45 | |||
| Total | 2,715 | |||
| 116 | | Budget and Fiscal Plan - 2023/24 to 2025/26
|
2022/23 Updated Financial Forecast (Third Quarterly Report)
Growing Communities Fund
The fund will provide immediate support to local governments with the costs of upgrading, adding capacity, and extending core infrastructure and community amenities and support additional housing supply. The fund will provide all local governments, municipalities and regional districts, with base funding and additional formula-based funding based on current population and population growth rate. Upgraded infrastructure or amenities sets the foundation for communities to support residents, housing and attract economic development.
BC Ferries Fare Affordability
BC Ferries Fare Affordability funding supports ferry fare affordability for coastal ferry users during the next performance term, which covers 2024 through 2028, and includes climate initiatives to meet GHG reductions by 2030.
Critical Community Infrastructure
Funding for Critical Community Infrastructure will support targeted projects located in each economic development region in B.C. Projects will support certain local communities in meeting public and environmental health regulations in a time sensitive manner. This includes supplying reliable, clean drinking water, effectively managing wastewater and solid waste, and reducing greenhouse gas emissions. As the Investing in Canada Infrastructure Program is fully allocated, this funding will help to address key projects to ensure continuation of infrastructure improvements in communities across B.C., including Indigenous communities.
Food Security Initiatives
Funding for food security initiatives will support British Columbians access an affordable supply of nutritious food. Through a series of targeted initiatives, the Province will strengthen the food supply chain across B.C., including local and regional food systems. This includes direct food support to underserved people and communities through trusted community partners such as Food Banks BC and the United Way. Dedicated funding will increase the availability of fresh food in Indigenous communities, increase food processing capacity in BC, and support the development of new and expanded local food production businesses. Funding will also improve the resilience of B.C. food supply by identifying and mitigating the effects of climate change and the increasing intensity of climate events.
BC Cancer Foundation
The BC Cancer Foundation supports world-leading scientists and clinicians across the province — as they advance global innovation and accelerate access for all British Columbians to cutting edge cancer care, close to home. Funding for the BC Cancer Foundation will support cancer research by expanding genomics and precision health; expanding access to new medicines; enhancing capacity to participate in research studies, including clinical trials; and establishing innovative cancer treatment programs, bringing new technologies and treatments to B.C. Funding will also support attracting high caliber talent and expertise into the province.
Budget and Fiscal Plan - 2023/24 to 2025/26
| | 117 |
2022/23 Updated Financial Forecast (Third Quarterly Report)
Local Government Next Gen 911 Readiness Fund
The Canadian Radio-television and Telecommunications Commission has directed that all telecommunications providers migrate to Next Generation 911 services to provide improved emergency services using world-class telecommunications networks. This funding will support local, remote and Indigenous communities with planning, preparation, and implementation of technology and infrastructure upgrades for the transition to Next Gen 911. The funding also provides support to address training, education, program delivery, supporting technology, public outreach, audit, and other requirements for the technological upgrades. This will lead to safer, faster and more informed emergency response services for all British Columbians.
Watershed Security Fund
Healthy watersheds are vital to ensuring British Columbia has good quality water for healthy ecosystems and communities. This funding will enable projects that benefit a range of provincial priorities, including wild salmon health, clean drinking water, biodiversity, flood resilience, economic opportunities, and reconciliation with First Nations.
Highway and Community Cellular Connectivity
Government will provide $75 million more for new highway cellular coverage across the province, building on the 532 kilometres of cellular coverage and 33 rest areas completed or in progress since 2020. In addition, the Province will provide an additional $10 million to support connectivity in the southeast region of B.C. that is expected to benefit more than 78 communities, including 6,600 homes upon project completion in 2027. This brings the Province’s total investments since 2017 to $584 million to support connecting rural, remote and Indigenous communities and expand highway cellular along B.C. highways.
Accelerating Funding for First Nations Agreements
This funding will advance Government commitments under existing agreements with First Nations in 2022/23. Nearly $75 million will be accelerated to support existing reconciliation initiatives with First Nations across B.C., including in natural resource and economic development, clean energy development, land purchases, community health and wellness programs, and emergency management.
Public Libraries
Public libraries are a core service to communities all over the province. This funding will support public libraries and service partners to address local priorities and support accessibility, inclusion, and reconciliation. The funding will assist public libraries to address the rising costs and growing demand for services. This includes opportunities for libraries to extend and improve access to books, digital collections, programs, spaces, literacy, technology and operating hours.
| 118 | | Budget and Fiscal Plan - 2023/24 to 2025/26
|
2022/23 Updated Financial Forecast (Third Quarterly Report)
Contingencies
Budget 2022 includes a Contingencies vote of $4.8 billion in 2022/23, with $2.0 billion in the Pandemic and Recovery sub-vote, and $2.8 billion allocated to General Programs and CleanBC sub-votes. Contingencies help fund unexpected costs such as flood recovery, increased costs for government services, and emerging priorities. The Contingencies vote also includes funding for the Shared Recovery Mandate. The Contingencies allocations, including the forecast for the pandemic and recovery initiatives, remain unchanged from the Second Quarterly Report.
Government will report the final spending details of the Contingencies vote, including pandemic recovery contingencies allocations, in the 2022/23 Public Accounts which are released in the summer of 2023.
Government Employment (FTEs)
Full-time equivalent (FTE) staff utilization in core government ministries for 2022/23 is forecast to be 33,800, a reduction of 200 FTEs compared to the forecast in the Second Quarterly Report. This is primarily due to hiring lag and vacancies in the BC Public Service, consistent with labour trends in other sectors across B.C. Further details on FTEs are provided in Table A13 in the appendix.
Budget and Fiscal Plan - 2023/24 to 2025/26
| | 119 |
2022/23 Updated Financial Forecast (Third Quarterly Report)
Provincial Capital Spending
Capital spending is projected to total $12.2 billion in 2022/23 — $1.3 billion lower than the Second Quarterly Report forecast (see Table 4.4).
The forecast for taxpayer-supported capital spending is $974 million lower than in the Second Quarterly Report, due to changes in the timing of capital project spending.
Self-supported capital spending is expected to be $288 million lower than the forecast in the Second Quarterly Report, primarily due to updates to BC Hydro’s capital plan to reflect timing of Site C cash flows. Project completion is forecast to meet the project in-service date in 2025 and is within the approved budget of $16 billion.
| Table 4.4 2022/23 Capital Spending Update | ||||||||||||||||
| ($ millions) | ||||||||||||||||
| Q1 | Q2 | Q3 | Total | |||||||||||||
| Update | Update | Update | Changes | |||||||||||||
| Taxpayer-supported capital spending at Budget 2022 | 9,279 | 9,279 | ||||||||||||||
| Taxpayer-supported capital spending at the First Quarterly Report | 9,423 | |||||||||||||||
| Taxpayer-supported capital spending at the Second Quarterly Report | 9,091 | |||||||||||||||
| Taxpayer-supported changes | ||||||||||||||||
| School districts | (122 | ) | (10 | ) | (73 | ) | (205 | ) | ||||||||
| Post-secondary institutions | - | (6 | ) | (238 | ) | (244 | ) | |||||||||
| Health sector | 283 | (52 | ) | (33 | ) | 198 | ||||||||||
| Transportation sector | (48 | ) | (268 | ) | (312 | ) | (628 | ) | ||||||||
| Social housing | 51 | 6 | (199 | ) | (142 | ) | ||||||||||
| Other net adjustments | (20 | ) | (2 | ) | (119 | ) | (141 | ) | ||||||||
| Total taxpayer-supported changes | 144 | (332 | ) | (974 | ) | (1,162 | ) | |||||||||
| Taxpayer-supported capital spending - updated forecast | 9,423 | 9,091 | 8,117 | 8,117 | ||||||||||||
| Self-supported capital spending at Budget 2022 | 4,374 | 4.374 | ||||||||||||||
| Self-supported capital spending at the First Quarterly Report | 4,362 | |||||||||||||||
| Self-supported capital spending at the Second Quarterly Report | 4,343 | |||||||||||||||
| BC Hydro | - | - | (253 | ) | (253 | ) | ||||||||||
| ICBC | - | - | (17 | ) | (17 | ) | ||||||||||
| BC Lottery Corporation | (10 | ) | (15 | ) | (5 | ) | (30 | ) | ||||||||
| Other net adjustments | (2 | ) | (4 | ) | (13 | ) | (19 | ) | ||||||||
| Total self-supported changes | (12 | ) | (19 | ) | (288 | ) | (319 | ) | ||||||||
| Self-supported capital spending - updated forecast | 4,362 | 4,343 | 4,055 | 4,055 | ||||||||||||
| 2022/23 provincial capital spending at the First Quarterly Report | 13,785 | |||||||||||||||
| 2022/23 provincial capital spending at the Second Quarterly Report | 13,434 | |||||||||||||||
| 2022/23 provincial capital spending at the Third Quarterly Report | 12,172 | 12,172 | ||||||||||||||
| 120 | | Budget and Fiscal Plan - 2023/24 to 2025/26
|
2022/23 Updated Financial Forecast (Third Quarterly Report)
Provincial Debt
The provincial debt is projected to total $93.5 billion by the end of the fiscal year — $11.9 billion lower than the projection at Budget 2022, and $1.5 billion higher than the forecast in the Second Quarterly Report.
Taxpayer-supported debt is projected to be $63.7 billion — $9.8 billion lower than the projection in Budget 2022 mainly due to improved operating results. The forecast is $1.8 billion higher than the Second Quarterly Report due to the reduced forecasted surplus and cash balances, partially offset by lower capital spending and improved working capital balances.
Consistent with the Second Quarterly Report, self-supported debt is projected to be $29.8 billion — $1.2 billion lower than the projection in Budget 2022 mainly due to lower capital spending.
Details on changes in provincial debt by quarter are shown in Table 4.5.
| Table 4.5 2022/23 Provincial Debt Update1 | ||||||||||||||||
| ($ millions) | ||||||||||||||||
| Q1 | Q2 | Q3 | Total | |||||||||||||
| Update | Update | Update | Changes | |||||||||||||
| Taxpayer-supported debt forecast at Budget 2022 | 73,475 | 73,475 | ||||||||||||||
| Taxpayer-supported debt at the First Quarterly Report | 66,742 | |||||||||||||||
| Taxpayer-supported debt at the Second Quarterly Report | 61,908 | |||||||||||||||
| Changes: | ||||||||||||||||
| Higher debt level from 2021/22 | 610 | - | - | 610 | ||||||||||||
| Changes in operating results (before forecast allowance) | (6,167 | ) | (4,326 | ) | 2,440 | (8,053 | ) | |||||||||
| Non-cash items | 123 | 141 | 108 | 372 | ||||||||||||
| Changes in cash balances | (2,749 | ) | 275 | 577 | (1,897 | ) | ||||||||||
| Changes in other working capital balances 2 | 1,306 | (592 | ) | (358 | ) | 356 | ||||||||||
| Taxpayer-supported capital spending | 144 | (332 | ) | (974 | ) | (1,162 | ) | |||||||||
| Total taxpayer-supported changes | (6,733 | ) | (4,834 | ) | 1,793 | (9,774 | ) | |||||||||
| Taxpayer-supported debt - updated forecast | 66,742 | 61,908 | 63,701 | 63,701 | ||||||||||||
| Self-supported debt forecast at Budget 2022 | 30,956 | 30,956 | ||||||||||||||
| Self-supported debt at the First Quarterly Report | 29,784 | |||||||||||||||
| Self-supported debt at the Second Quarterly Report | 29,784 | |||||||||||||||
| Changes: | ||||||||||||||||
| Lower debt level from 2021/22 | (489 | ) | - | - | (489 | ) | ||||||||||
| Lower capital spending | (12 | ) | (19 | ) | (288 | ) | (319 | ) | ||||||||
| Changes in internal financing | (671 | ) | 19 | 292 | (360 | ) | ||||||||||
| Total self-supported changes | (1,172 | ) | - | 4 | (1,168 | ) | ||||||||||
| Self-supported debt - updated forecast | 29,784 | 29,784 | 29,788 | 29,788 | ||||||||||||
| Forecast allowance | 1,000 | 300 | - | - | ||||||||||||
| 2022/23 provincial debt forecast at the First Quarterly Report | 97,526 | |||||||||||||||
| 2022/23 provincial debt forecast at the Second Quarterly Report | 91,992 | |||||||||||||||
| 2022/23 provincial debt forecast at the Third Quarterly Report | 93,489 | 93,489 | ||||||||||||||
1 Provincial debt is prepared in accordance with Generally Accepted Accounting Principles and presented consistent with the Debt Summary Report included in the Public Accounts. Debt is shown net of sinking funds and unamortized discounts, excludes accrued interest, and includes non-guaranteed debt directly incurred by commercial Crown corporations and debt guaranteed by the Province.
2 Changes in other working capital balances include changes in accounts receivables, accounts payable, accrued liabilities, deferred revenue, investments, restricted assets and other assets.
Budget and Fiscal Plan - 2023/24 to 2025/26
| | 121 |
2022/23 Updated Financial Forecast (Third Quarterly Report)
Risks to the Fiscal Forecast
The forecasts of revenues, expenditures, capital spending and debt are estimates based on multiple economic, financial and external factors. In addition, capital spending and debt figures may be influenced by several factors including design development, procurement activity, weather, geotechnical conditions and interest rates. As a result, the actual operating results, capital expenditure and debt figures may differ from the current forecast.
Revenues can be volatile due in part to the influence of the cyclical nature of the natural resource sector in the economy. Changes in energy or commodity prices, such as natural gas and lumber, may have a significant effect on revenue and the fiscal forecast.
The spending forecast in the fiscal plan is based on ministry and service delivery agency plans and strategies. The main risks are changes to planning assumptions, such as utilization or demand rates for government services in the health care, education, or community social services sectors, and costs associated with natural disaster responses.
| 122 | | Budget and Fiscal Plan - 2023/24 to 2025/26
|
2022/23 Updated Financial Forecast (Third Quarterly Report)
Supplementary Schedules
The following tables provide the financial results for the nine months ended December 31, 2022, and the 2022/23 full-year forecast.
Table 4.6 2022/23 Operating Statement
| Year-to-Date to December 31 | Full Year | |||||||||||||||||||||||||||||||
| 2022/23 | Actual | 2022/23 | Actual | |||||||||||||||||||||||||||||
| ($ millions) | Budget | Actual | Variance | 2021/22 | Budget | Forecast | Variance | 2021/22 | ||||||||||||||||||||||||
| Revenue | 50,056 | 59,766 | 9,710 | 52,716 | 68,552 | 82,700 | 14,148 | 72,392 | ||||||||||||||||||||||||
| Expense | (49,316 | ) | (50,328 | ) | (1,012 | ) | (48,265 | ) | (73,013 | ) | (79,108 | ) | (6,095 | ) | (71,086 | ) | ||||||||||||||||
| Surplus (deficit) before forecast allowance | 740 | 9,438 | 8,698 | 4,451 | (4,461 | ) | 3,592 | 8,053 | 1,306 | |||||||||||||||||||||||
| Forecast allowance | - | - | - | - | (1,000 | ) | - | 1,000 | - | |||||||||||||||||||||||
| Surplus (deficit) | 740 | 9,438 | 8,698 | 4,451 | (5,461 | ) | 3,592 | 9,053 | 1,306 | |||||||||||||||||||||||
| Accumulated surplus (deficit) beginning of the year excluding other comprehensive income | 1,975 | 3,693 | 1,718 | 2,525 | 1,975 | 3,693 | 1,718 | 2,387 | ||||||||||||||||||||||||
| Adjustments to accumulated surplus (deficit) | - | (1,711 | ) | (1,711 | ) | - | - | - | - | - | ||||||||||||||||||||||
| Accumulated surplus (deficit) before comprehensive income | 2,715 | 11,420 | 8,705 | 6,976 | (3,486 | ) | 7,285 | 10,771 | 3,693 | |||||||||||||||||||||||
| Accumulated other comprehensive income from self-supported Crown agencies | 1,069 | (144 | ) | (1,213 | ) | 475 | 1,072 | 234 | (838 | ) | 462 | |||||||||||||||||||||
| Accumulated surplus (deficit) end of period | 3,784 | 11,276 | 7,492 | 7,451 | (2,414 | ) | 7,519 | 9,933 | 4,155 | |||||||||||||||||||||||
| Budget and Fiscal Plan - 2023/24 to 2025/26 | | 123 |
2022/23 Updated Financial Forecast (Third Quarterly Report)
Table 4.7 2022/23 Expense by Ministry, Program and Agency
| Year-to-Date to December 31 | Full Year | |||||||||||||||||||||||||||||||
| 2022/23 | Actual | 2022/23 | Actual | |||||||||||||||||||||||||||||
| ($ millions) | Budget | Actual | Variance | 2021/22 1 | Budget | Forecast | Variance | 2021/22 1 | ||||||||||||||||||||||||
| Office of the Premier | 12 | 11 | (1 | ) | 10 | 15 | 15 | - | 13 | |||||||||||||||||||||||
| Agriculture and Food | 84 | 135 | 51 | 101 | 107 | 107 | - | 114 | ||||||||||||||||||||||||
| Attorney General | 531 | 591 | 60 | 456 | 706 | 706 | - | 710 | ||||||||||||||||||||||||
| Children and Family Development | 1,294 | 1,271 | (23 | ) | 994 | 1,742 | 1,742 | - | 1,680 | |||||||||||||||||||||||
| Citizens’ Services | 460 | 474 | 14 | 475 | 657 | 657 | - | 610 | ||||||||||||||||||||||||
| Education and Child Care | 6,139 | 6,166 | 27 | 5,875 | 8,217 | 8,217 | - | 7,853 | ||||||||||||||||||||||||
| Emergency Management and Climate Readiness | 140 | 212 | 72 | 78 | 479 | 479 | - | 65 | ||||||||||||||||||||||||
| Energy, Mines and Low Carbon Innovation | 60 | 78 | 18 | 110 | 112 | 152 | 40 | 322 | ||||||||||||||||||||||||
| Environment and Climate Change Strategy | 269 | 359 | 90 | 205 | 368 | 379 | 11 | 565 | ||||||||||||||||||||||||
| Finance | 896 | 390 | (506 | ) | 601 | 1,221 | 2,305 | 1,084 | 1,963 | |||||||||||||||||||||||
| Forests | 563 | 844 | 281 | 1,076 | 833 | 1,057 | 224 | 1,529 | ||||||||||||||||||||||||
| Health | 18,852 | 18,872 | 20 | 17,378 | 25,456 | 25,456 | - | 25,723 | ||||||||||||||||||||||||
| Housing | 501 | 581 | 80 | 521 | 669 | 669 | - | 593 | ||||||||||||||||||||||||
| Indigenous Relations and Reconciliation | 147 | 165 | 18 | 169 | 178 | 178 | - | 548 | ||||||||||||||||||||||||
| Jobs, Economic Development and Innovation | 64 | 70 | 6 | 62 | 111 | 111 | - | 592 | ||||||||||||||||||||||||
| Labour | 13 | 18 | 5 | 14 | 17 | 17 | - | 37 | ||||||||||||||||||||||||
| Mental Health and Addictions | 19 | 16 | (3 | ) | 13 | 25 | 25 | - | 19 | |||||||||||||||||||||||
| Municipal Affairs | 296 | 282 | (14 | ) | 302 | 256 | 256 | - | 401 | |||||||||||||||||||||||
| Post-Secondary Education and Future Skills | 1,932 | 1,945 | 13 | 1,903 | 2,615 | 2,615 | - | 2,629 | ||||||||||||||||||||||||
| Public Safety and Solicitor General | 677 | 701 | 24 | 703 | 915 | 915 | - | 1,457 | ||||||||||||||||||||||||
| Social Development and Poverty Reduction | 3,320 | 3,321 | 1 | 3,195 | 4,456 | 4,456 | - | 4,354 | ||||||||||||||||||||||||
| Tourism, Arts, Culture and Sport | 130 | 153 | 23 | 125 | 173 | 173 | - | 405 | ||||||||||||||||||||||||
| Transportation and Infrastructure | 707 | 711 | 4 | 704 | 956 | 956 | - | 974 | ||||||||||||||||||||||||
| Water, Land and Resource Stewardship | 65 | 92 | 27 | 80 | 92 | 92 | - | 82 | ||||||||||||||||||||||||
| Total ministries and Office of the Premier | 37,171 | 37,458 | 287 | 35,150 | 50,376 | 51,735 | 1,359 | 53,238 | ||||||||||||||||||||||||
| Management of public funds and debt | 1,010 | 988 | (22 | ) | 970 | 1,378 | 1,268 | (110 | ) | 1,280 | ||||||||||||||||||||||
| Contingencies - General programs and CleanBC | - | - | - | - | 2,848 | 2,848 | - | - | ||||||||||||||||||||||||
| Pandemic and Recovery Contingencies | - | 378 | 378 | 1,787 | 2,000 | 2,000 | - | - | ||||||||||||||||||||||||
| Affordability measures | - | 413 | 413 | - | 1,600 | 1,600 | - | |||||||||||||||||||||||||
| Funding for capital expenditures | 2,024 | 1,220 | (804 | ) | 1,306 | 3,734 | 3,225 | (509 | ) | 2,202 | ||||||||||||||||||||||
| Refundable tax credit transfers | 1,515 | 1,647 | 132 | 1,447 | 2,044 | 2,466 | 422 | 1,837 | ||||||||||||||||||||||||
| Legislative Assembly and other appropriations | 130 | 123 | (7 | ) | 115 | 185 | 196 | 11 | 208 | |||||||||||||||||||||||
| Subtotal | 41,850 | 42,227 | 377 | 40,775 | 62,565 | 65,338 | 2,773 | 58,765 | ||||||||||||||||||||||||
| Supplementary Estimates | - | - | - | - | - | 2,715 | 2,715 | - | ||||||||||||||||||||||||
| Total appropriations | 41,850 | 42,227 | 377 | 40,775 | 62,565 | 68,053 | 5,488 | 58,765 | ||||||||||||||||||||||||
| Elimination of transactions between appropriations 2 | - | (16 | ) | (16 | ) | (10 | ) | (17 | ) | (25 | ) | (8 | ) | (13 | ) | |||||||||||||||||
| Prior year liability adjustments | - | - | - | - | - | (21 | ) | (21 | ) | (39 | ) | |||||||||||||||||||||
| Consolidated revenue fund expense | 41,850 | 42,211 | 361 | 40,765 | 62,548 | 68,007 | 5,459 | 58,713 | ||||||||||||||||||||||||
| Expenses recovered from external entities | 2,378 | 2,478 | 100 | 2,614 | 4,011 | 4,152 | 141 | 4,054 | ||||||||||||||||||||||||
| Elimination of funding provided to service delivery agencies | (26,355 | ) | (25,527 | ) | 828 | (25,128 | ) | (35,863 | ) | (37,951 | ) | (2,088 | ) | (35,558 | ) | |||||||||||||||||
| Total direct program spending | 17,873 | 19,162 | 1,289 | 18,251 | 30,696 | 34,208 | 3,512 | 27,209 | ||||||||||||||||||||||||
| Service delivery agency expense | ||||||||||||||||||||||||||||||||
| School districts | 5,492 | 5,484 | (8 | ) | 5,272 | 7,733 | 7,980 | 247 | 7,429 | |||||||||||||||||||||||
| Universities | 4,401 | 4,340 | (61 | ) | 3,988 | 6,154 | 6,076 | (78 | ) | 5,621 | ||||||||||||||||||||||
| Colleges and institutes | 1,119 | 1,128 | 9 | 1,088 | 1,528 | 1,572 | 44 | 1,508 | ||||||||||||||||||||||||
| Health authorities and hospital societies | 15,409 | 15,488 | 79 | 15,008 | 19,644 | 22,077 | 2,433 | 20,783 | ||||||||||||||||||||||||
| Other service delivery agencies | 5,022 | 4,726 | (296 | ) | 4,658 | 7,258 | 7,195 | (63 | ) | 8,536 | ||||||||||||||||||||||
| Total service delivery agency expense | 31,443 | 31,166 | (277 | ) | 30,014 | 42,317 | 44,900 | 2,583 | 43,877 | |||||||||||||||||||||||
| Total expense | 49,316 | 50,328 | 1,012 | 48,265 | 73,013 | 79,108 | 6,095 | 71,086 | ||||||||||||||||||||||||
| 1 | Restated to reflect government’s current organization and accounting policies. Effective December 7, 2022, the Ministry of Housing and the Ministry of Emergency Management and Climate Readiness were established with programs transferred from other ministries. A number of other programs were also transferred between ministries as a part of this reorganization. |
| 2 | Reflects payments made under an agreement where an expense from a voted appropriation is recorded as revenue by a special account. |
| 124 | | Budget and Fiscal Plan - 2023/24 to 2025/26 |
2022/23 Updated Financial Forecast (Third Quarterly Report)
Table 4.8 2022/23 Revenue by Source
| Year-to-Date to December 31 | Full Year | |||||||||||||||||||||||||||||||
| 2022/23 | Actual | 2022/23 | Actual | |||||||||||||||||||||||||||||
| ($ millions) | Budget | Actual | Variance | 2021/22 | Budget | Forecast | Variance | 2021/22 | ||||||||||||||||||||||||
| Taxation | ||||||||||||||||||||||||||||||||
| Personal income | 9,544 | 12,750 | 3,206 | 10,671 | 12,848 | 17,712 | 4,864 | 13,704 | ||||||||||||||||||||||||
| Corporate income | 3,595 | 6,372 | 2,777 | 3,482 | 5,501 | 10,519 | 5,018 | 5,053 | ||||||||||||||||||||||||
| Employer health | 1,695 | 2,045 | 350 | 1,575 | 2,257 | 2,675 | 418 | 2,443 | ||||||||||||||||||||||||
| Sales | 7,052 | 7,586 | 534 | 6,621 | 9,009 | 9,693 | 684 | 8,731 | ||||||||||||||||||||||||
| Fuel | 781 | 798 | 17 | 798 | 1,051 | 1,061 | 10 | 1,022 | ||||||||||||||||||||||||
| Carbon | 1,634 | 1,542 | (92 | ) | 1,441 | 2,311 | 2,211 | (100 | ) | 2,011 | ||||||||||||||||||||||
| Tobacco | 609 | 444 | (165 | ) | 588 | 760 | 565 | (195 | ) | 708 | ||||||||||||||||||||||
| Property | 2,350 | 2,336 | (14 | ) | 2,245 | 3,173 | 3,253 | 80 | 3,012 | |||||||||||||||||||||||
| Property transfer | 1,994 | 1,950 | (44 | ) | 2,573 | 2,500 | 2,250 | (250 | ) | 3,327 | ||||||||||||||||||||||
| Insurance premium | 497 | 592 | 95 | 482 | 660 | 775 | 115 | 706 | ||||||||||||||||||||||||
| 29,751 | 36,415 | 6,664 | 30,476 | 40,070 | 50,714 | 10,644 | 40,717 | |||||||||||||||||||||||||
| Natural resource | ||||||||||||||||||||||||||||||||
| Natural gas royalties | 673 | 1,662 | 989 | 484 | 911 | 2,206 | 1,295 | 920 | ||||||||||||||||||||||||
| Forests | 833 | 1,445 | 612 | 1,474 | 1,121 | 1,855 | 734 | 1,893 | ||||||||||||||||||||||||
| Other natural resource revenues 1 | 1,007 | 1,519 | 512 | 1,169 | 1,355 | 2,003 | 648 | 1,658 | ||||||||||||||||||||||||
| 2,513 | 4,626 | 2,113 | 3,127 | 3,387 | 6,064 | 2,677 | 4,471 | |||||||||||||||||||||||||
| Other revenue | ||||||||||||||||||||||||||||||||
| Post-secondary education fees | 1,849 | 1,834 | (15 | ) | 1,750 | 2,679 | 2,641 | (38 | ) | 2,536 | ||||||||||||||||||||||
| Fees and licenses 2 | 1,562 | 1,590 | 28 | 1,480 | 2,207 | 2,358 | 151 | 2,048 | ||||||||||||||||||||||||
| Investment earnings | 941 | 1,041 | 100 | 920 | 1,298 | 1,290 | (8 | ) | 1,306 | |||||||||||||||||||||||
| Miscellaneous 3 | 2,551 | 3,185 | 634 | 2,628 | 3,807 | 3,835 | 28 | 3,910 | ||||||||||||||||||||||||
| 6,903 | 7,650 | 747 | 6,778 | 9,991 | 10,124 | 133 | 9,800 | |||||||||||||||||||||||||
| Contributions from the federal government | ||||||||||||||||||||||||||||||||
| Health and social transfers | 6,272 | 6,525 | 253 | 6,529 | 8,363 | 8,613 | 250 | 8,541 | ||||||||||||||||||||||||
| COVID-19 related funding | 19 | 148 | 129 | 213 | 40 | 176 | 136 | 301 | ||||||||||||||||||||||||
| Other federal government contributions 4 | 1,818 | 1,565 | (253 | ) | 1,631 | 2,937 | 3,696 | 759 | 3,138 | |||||||||||||||||||||||
| 8,109 | 8,238 | 129 | 8,373 | 11,340 | 12,485 | 1,145 | 11,980 | |||||||||||||||||||||||||
| Commercial Crown corporation net income BC Hydro | 350 | 342 | (8 | ) | 306 | 712 | 712 | - | 668 | |||||||||||||||||||||||
| Liquor Distribution Branch | 939 | 960 | 21 | 960 | 1,166 | 1,179 | 13 | 1,189 | ||||||||||||||||||||||||
| BC Lottery Corporation 5 | 1,043 | 1,207 | 164 | 900 | 1,415 | 1,574 | 159 | 1,211 | ||||||||||||||||||||||||
| ICBC | 334 | 186 | (148 | ) | 1,692 | 327 | (298 | ) | (625 | ) | 2,216 | |||||||||||||||||||||
| Other 6 | 114 | 142 | 28 | 104 | 144 | 146 | 2 | 140 | ||||||||||||||||||||||||
| 2,780 | 2,837 | 57 | 3,962 | 3,764 | 3,313 | (451 | ) | 5,424 | ||||||||||||||||||||||||
| Total revenue | 50,056 | 59,766 | 9,710 | 52,716 | 68,552 | 82,700 | 14,148 | 72,392 | ||||||||||||||||||||||||
1 Columbia River Treaty, other energy and minerals, water rental and other resources.
2 Healthcare-related, motor vehicle, and other fees.
3 Includes reimbursements for health care and other services provided to external agencies, and other recoveries.
4 Includes contributions for health, education, community development, housing and social service programs, and transportation projects.
5 Net of payments to the federal government and payments to the BC First Nations Gaming Revenue Sharing Limited Partnership in accordance with section 14.3 of the Gaming Control Act (B.C.) .
6 Includes Columbia Power Corporation, BC Railway Company, Columbia Basin power projects, and post-secondary institutions’ self-supported subsidiaries.
| Budget and Fiscal Plan - 2023/24 to 2025/26 | | 125 |
2022/23 Updated Financial Forecast (Third Quarterly Report)
Table 4.9 2022/23 Expense by Function
| Year-to-Date to December 31 | Full Year | |||||||||||||||||||||||||||||||
| 2022/23 | Actual | 2022/23 | Actual | |||||||||||||||||||||||||||||
| ($ millions) | Budget | Actual | Variance | 2021/22 | Budget | Forecast | Variance | 2021/22 | ||||||||||||||||||||||||
| Health 1 | 20,523 | 20,447 | (76 | ) | 19,264 | 27,685 | 27,818 | 133 | 27,584 | |||||||||||||||||||||||
| Education 2 | 11,980 | 11,710 | (270 | ) | 11,060 | 16,673 | 16,615 | (58 | ) | 15,795 | ||||||||||||||||||||||
| Social services | 5,676 | 5,545 | (131 | ) | 5,112 | 7,916 | 7,862 | (54 | ) | 7,268 | ||||||||||||||||||||||
| Protection of persons and property | 1,609 | 1,824 | 215 | 1,625 | 2,479 | 2,486 | 7 | 2,937 | ||||||||||||||||||||||||
| Transportation | 1,689 | 1,586 | (103 | ) | 1,658 | 2,454 | 2,367 | (87 | ) | 4,453 | ||||||||||||||||||||||
| Natural resources and economic development | 2,410 | 2,851 | 441 | 2,739 | 3,748 | 4,238 | 490 | 5,213 | ||||||||||||||||||||||||
| Other | 2,125 | 1,940 | (185 | ) | 1,655 | 2,636 | 3,693 | 1,057 | 3,058 | |||||||||||||||||||||||
| Contingencies - General programs and CleanBC 3 | - | - | - | - | 2,848 | 2,848 | - | - | ||||||||||||||||||||||||
| Pandemic and Recovery Contingencies 3 | - | 378 | 378 | 1,787 | 2,000 | 2,000 | - | - | ||||||||||||||||||||||||
| Affordability measures | - | 413 | 413 | - | - | 1,600 | 1,600 | - | ||||||||||||||||||||||||
| Supplementary spending | - | - | - | - | - | 2,715 | 2,715 | - | ||||||||||||||||||||||||
| General government | 1,159 | 1,434 | 275 | 1,326 | 1,648 | 2,007 | 359 | 2,036 | ||||||||||||||||||||||||
| Debt servicing | 2,144 | 2,200 | 56 | 2,039 | 2,926 | 2,859 | (67 | ) | 2,742 | |||||||||||||||||||||||
| Total expense | 49,316 | 50,328 | 1,012 | 48,265 | 73,013 | 79,108 | 6,095 | 71,086 | ||||||||||||||||||||||||
1 Payments for healthcare services by the Ministry of Social Development and Poverty Reduction and the Ministry of Children and Family Development made on behalf of their clients are reported in the Health function.
2 Payments for training costs by the Ministry of Social Development and Poverty Reduction made on behalf of its clients are reported in the Education function.
3 Contingencies for the prior fiscal year are reported in the relevant functions; the current year forecast is not yet allocated to functions.
| 126 | | Budget and Fiscal Plan - 2023/24 to 2025/26 |
2022/23 Updated Financial Forecast (Third Quarterly Report)
Table 4.10 2022/23 Capital Spending
| Year-to-Date to December 31 | Full Year | |||||||||||||||||||||||||||||||
| 2022/23 | Actual | 2022/23 | Actual | |||||||||||||||||||||||||||||
| ($ millions) | Budget | Actual | Variance | 2021/22 | Budget | Forecast | Variance | 2021/22 | ||||||||||||||||||||||||
| Taxpayer-supported | ||||||||||||||||||||||||||||||||
| Education | ||||||||||||||||||||||||||||||||
| School districts | 780 | 650 | (130 | ) | 722 | 1,082 | 877 | (205 | ) | 1,001 | ||||||||||||||||||||||
| Post-secondary institutions | 820 | 676 | (144 | ) | 596 | 1,237 | 993 | (244 | ) | 899 | ||||||||||||||||||||||
| Health | 1,162 | 882 | (280 | ) | 699 | 2,584 | 2,782 | 198 | 1,555 | |||||||||||||||||||||||
| BC Transportation Financing Authority | 2,214 | 1,453 | (761 | ) | 1,142 | 2,644 | 2,083 | (561 | ) | 1,364 | ||||||||||||||||||||||
| BC Transit | 128 | 77 | (51 | ) | 48 | 178 | 111 | (67 | ) | 67 | ||||||||||||||||||||||
| Government ministries | 503 | 271 | (232 | ) | 257 | 755 | 638 | (117 | ) | 386 | ||||||||||||||||||||||
| Social housing 1 | 434 | 299 | (135 | ) | 487 | 572 | 430 | (142 | ) | 642 | ||||||||||||||||||||||
| Other | 108 | 43 | (65 | ) | 42 | 227 | 203 | (24 | ) | 88 | ||||||||||||||||||||||
| Total taxpayer-supported | 6,149 | 4,351 | (1,798 | ) | 3,993 | 9,279 | 8,117 | (1,162 | ) | 6,002 | ||||||||||||||||||||||
| Self-supported | ||||||||||||||||||||||||||||||||
| BC Hydro | 3,138 | 2,872 | (266 | ) | 2,587 | 4,131 | 3,878 | (253 | ) | 3,475 | ||||||||||||||||||||||
| Columbia Basin power projects 2 | 8 | 5 | (3 | ) | 5 | 11 | 11 | - | 9 | |||||||||||||||||||||||
| BC Railway Company | 6 | 4 | (2 | ) | 2 | 12 | 8 | (4 | ) | 2 | ||||||||||||||||||||||
| ICBC | 25 | 27 | 2 | 41 | 60 | 43 | (17 | ) | 54 | |||||||||||||||||||||||
| BC Lottery Corporation 3 | 85 | 44 | (41 | ) | 31 | 120 | 90 | (30 | ) | 90 | ||||||||||||||||||||||
| Liquor Distribution Branch | 31 | 7 | (24 | ) | 16 | 40 | 25 | (15 | ) | 22 | ||||||||||||||||||||||
| Other 4 | - | - | - | - | - | - | - | 78 | ||||||||||||||||||||||||
| Total self-supported | 3,293 | 2,959 | (334 | ) | 2,682 | 4,374 | 4,055 | (319 | ) | 3,730 | ||||||||||||||||||||||
| Total capital spending | 9,442 | 7,310 | (2,132 | ) | 6,675 | 13,653 | 12,172 | (1,481 | ) | 9,732 | ||||||||||||||||||||||
1 Includes BC Housing Management Commission and Provincial Rental Housing Corporation.
2 Joint ventures of the Columbia Power Corporation and Columbia Basin Trust.
3 Excludes right-of-use assets except for 2021/22 full year actual.
4 Includes post-secondary institutions’ self-supported subsidiaries.
| Budget and Fiscal Plan - 2023/24 to 2025/26 | | 127 |
2022/23 Updated Financial Forecast (Third Quarterly Report)
Table 4.11 2022/23 Provincial Debt 1
| Year-to-Date to December 31 | Full Year | |||||||||||||||||||||||||||||||
| 2022/23 | Actual | 2022/23 | Actual | |||||||||||||||||||||||||||||
| ($ millions) | Budget | Actual | Variance | 2021/22 | Budget | Forecast | Variance | 2021/22 | ||||||||||||||||||||||||
| Taxpayer-supported debt | ||||||||||||||||||||||||||||||||
| Provincial government | ||||||||||||||||||||||||||||||||
| Operating | 9,238 | - | (9,238 | ) | 6,063 | 10,411 | - | (10,411 | ) | 7,233 | ||||||||||||||||||||||
| Capital 2 | 39,856 | 35,973 | (3,883 | ) | 35,716 | 40,573 | 39,908 | (665 | ) | 36,487 | ||||||||||||||||||||||
| Total provincial government | 49,094 | 35,973 | (13,121 | ) | 41,779 | 50,984 | 39,908 | (11,076 | ) | 43,720 | ||||||||||||||||||||||
| Taxpayer-supported entities | ||||||||||||||||||||||||||||||||
| BC Transportation Financing Authority | 16,873 | 18,676 | 1,803 | 14,410 | 17,512 | 19,505 | 1,993 | 14,615 | ||||||||||||||||||||||||
| Health authorities and hospital societies | 1,840 | 1,944 | 104 | 1,846 | 1,831 | 2,019 | 188 | 1,839 | ||||||||||||||||||||||||
| Post-secondary institutions | 891 | 908 | 17 | 930 | 888 | 874 | (14 | ) | 922 | |||||||||||||||||||||||
| Social housing 3 | 1,465 | 1,195 | (270 | ) | 1,026 | 1,932 | 1,125 | (807 | ) | 974 | ||||||||||||||||||||||
| Other | 315 | 256 | (59 | ) | 257 | 328 | 270 | (58 | ) | 271 | ||||||||||||||||||||||
| Total taxpayer-supported entities | 21,384 | 22,979 | 1,595 | 18,469 | 22,491 | 23,793 | 1,302 | 18,621 | ||||||||||||||||||||||||
| Total taxpayer-supported debt | 70,478 | 58,952 | (11,526 | ) | 60,248 | 73,475 | 63,701 | (9,774 | ) | 62,341 | ||||||||||||||||||||||
| Self-supported debt | 30,430 | 29,193 | (1,237 | ) | 28,725 | 30,956 | 29,788 | (1,168 | ) | 28,325 | ||||||||||||||||||||||
| Total debt before forecast allowance | 100,908 | 88,145 | (12,763 | ) | 88,973 | 104,431 | 93,489 | (10,942 | ) | 90,666 | ||||||||||||||||||||||
| Forecast allowance | - | - | - | - | 1,000 | - | (1,000 | ) | - | |||||||||||||||||||||||
| Total provincial debt | 100,908 | 88,145 | (12,763 | ) | 88,973 | 105,431 | 93,489 | (11,942 | ) | 90,666 | ||||||||||||||||||||||
1 Provincial debt is prepared in accordance with Generally Accepted Accounting Principles and presented consistent with the Debt Summary Report included in the Public Accounts. Debt is shown net of sinking funds and unamortized discounts, excludes accrued interest, and includes non-guaranteed debt directly incurred by commercial Crown corporations and debt guaranteed by the Province.
2 Includes debt incurred by the government to fund the building of capital assets in the education, health, social housing and other sectors.
3 Includes debt incurred by BC Housing Management Commission and the Provincial Rental Housing Corporation to fund investments in affordable housing through HousingHub. The debt forecast reflects projects that have been approved as of December 2022.
| 128 | | Budget and Fiscal Plan - 2023/24 to 2025/26 |
2022/23 Updated Financial Forecast (Third Quarterly Report)
Table 4.12 2022/23 Statement of Financial Position
| ($ millions) | Actual March 31, 2022 | Year-to-Date December 31, 2022 | Forecast March 31, 2023 | |||||||||
| Financial assets: | ||||||||||||
| Cash and temporary investments | 7,142 | 5,708 | 4,646 | |||||||||
| Other financial assets | 17,105 | 19,047 | 17,112 | |||||||||
| Sinking funds | 510 | 534 | 537 | |||||||||
| Investments in commercial Crown corporations: | ||||||||||||
| Retained earnings | 12,223 | 12,267 | 12,530 | |||||||||
| Recoverable capital loans | 27,218 | 27,957 | 28,344 | |||||||||
| Total investments in commercial Crown corporations | 39,441 | 40,224 | 40,874 | |||||||||
| Total financial assets | 64,198 | 65,513 | 63,169 | |||||||||
| Liabilities: | ||||||||||||
| Accounts payable and accrued liabilities | 16,829 | 13,401 | 14,592 | |||||||||
| Deferred revenue | 13,379 | 15,443 | 14,058 | |||||||||
| Debt: | ||||||||||||
| Taxpayer-supported debt | 62,341 | 58,952 | 63,701 | |||||||||
| Self-supported debt | 28,325 | 29,193 | 29,788 | |||||||||
| Forecast allowance | - | - | - | |||||||||
| Total provincial debt | 90,666 | 88,145 | 93,489 | |||||||||
| Add: debt offset by sinking funds | 510 | 534 | 537 | |||||||||
| Less: guarantees and non-guaranteed debt | (1,402 | ) | (982 | ) | (1,444 | ) | ||||||
| Financial statement debt | 89,774 | 87,697 | 92,582 | |||||||||
| Total liabilities | 119,982 | 116,541 | 121,232 | |||||||||
| Net assets (liabilities) | (55,784 | ) | (51,028 | ) | (58,063 | ) | ||||||
| Capital and other non-financial assets: | ||||||||||||
| Tangible capital assets | 56,001 | 58,308 | 61,677 | |||||||||
| Other non-financial assets | 3,938 | 3,996 | 3,905 | |||||||||
| Total capital and other non-financial assets | 59,939 | 62,304 | 65,582 | |||||||||
| Accumulated surplus | 4,155 | 11,276 | 7,519 | |||||||||
Changes in Financial Position
| Year-to-Date | Forecast | |||||||
| December 31, | March 31, | |||||||
| ($ millions) | 2022 | 2023 | ||||||
| Surplus for the period | (9,438 | ) | (3,592 | ) | ||||
| Comprehensive income decrease and other adjustments | 2,317 | 228 | ||||||
| Decrease/(Increase) in accumulated surplus | (7,121 | ) | (3,364 | ) | ||||
| Capital and other non-financial asset changes: | ||||||||
| Taxpayer-supported capital investments | 4,351 | 8,117 | ||||||
| Less: amortization and other accounting changes | (2,044 | ) | (2,441 | ) | ||||
| Increase in net capital assets | 2,307 | 5,676 | ||||||
| Increase (decrease) in other non-financial assets | 58 | (33 | ) | |||||
| Increase in capital and other non-financial assets | 2,365 | 5,643 | ||||||
| Increase (decrease) in net liabilities | (4,756 | ) | 2,279 | |||||
| Investment and working capital changes: | ||||||||
| Investment in commercial Crown corporations: | ||||||||
| Decrease in retained earnings | 44 | 307 | ||||||
| Self-supported capital investments | 2,959 | 4,055 | ||||||
| Less: loan repayments and other accounting changes | (2,220 | ) | (2,929 | ) | ||||
| Increase/(decrease) in investment in commercial Crown corporations | 783 | 1,433 | ||||||
| Decrease in cash and temporary investments | (1,434 | ) | (2,496 | ) | ||||
| Increase in other working capital | 3,330 | 1,592 | ||||||
| Increase in Investment and working capital | 2,679 | 529 | ||||||
| Increase (decrease) in financial statement debt | (2,077 | ) | 2,808 | |||||
| (Increase) decrease in sinking fund debt | (24 | ) | (27 | ) | ||||
| Increase (decrease) in guarantees and non-guaranteed debt | (420 | ) | 42 | |||||
| Increase (decrease) in total provincial debt | (2,521 | ) | 2,823 | |||||
| Budget and Fiscal Plan - 2023/24 to 2025/26 | | 129 |
This page
intentionally left blank.
APPENDIX
| A1 | Tax Expenditures | 133 |
| A1.1.1 | Personal Income Tax — Tax Expenditures (Refundable Tax Credits) | 135 |
| A1.1.2 | Corporate Income Tax — Tax Expenditures (Refundable Tax Credits) | 136 |
| A1.2.1 | Personal Income Tax — Tax Expenditures (Deductions and Non-Refundable Tax Credits) | 137 |
| A1.2.2 | Corporate Income Tax — Tax Expenditures (Deductions and Non-Refundable Tax Credits) | 139 |
| A1.3 | Property Taxes — Tax Expenditures | 139 |
| A1.4 | Consumption Taxes — Tax Expenditures | 141 |
| A1.5 | Employer Health Tax — Tax Expenditures | 142 |
| A1.6 | Insurance Premium Tax — Tax Expenditures | 142 |
| A2 | Interprovincial Comparisons of Tax Rates — 2023 | 143 |
| A3 | Comparison of Provincial and Federal Taxes by Province — 2023 | 144 |
| A4 | Interprovincial Comparisons of Provincial Personal Income Taxes Payable — 2023 | 146 |
| A4.1 | Net Provincial Taxes Since Budget 2016 | 147 |
| A5 | Material Assumptions — Revenue | 148 |
| A6 | Natural Gas Price Forecasts — 2023/24 to 2025/26 | 154 |
| A7 | Material Assumptions — Expense | 156 |
| A8 | Operating Statement — 2016/17 to 2025/26 | 159 |
| A9 | Revenue by Source — 2016/17 to 2025/26 | 160 |
| A10 | Revenue by Source Supplementary Information — 2016/17 to 2025/26 | 161 |
| A11 | Expense by Function — 2016/17 to 2025/26 | 162 |
| A12 | Expense by Function Supplementary Information — 2016/17 to 2025/26 | 163 |
| A13 | Full-Time Equivalents (FTEs) 2016/17 to 2025/26 | 164 |
| A14 | Capital Spending — 2016/17 to 2025/26 | 165 |
| A15 | Statement of Financial Position — 2016/17 to 2025/26 | 166 |
| A16 | Changes in Financial Position — 2016/17 to 2025/26 | 167 |
| A17 | Provincial Debt — 2016/17 to 2025/26 | 168 |
| A18 | Provincial Debt Supplementary Information — 2016/17 to 2025/26 | 169 |
| A19 | Key Provincial Debt Indicators — 2016/17 to 2025/26 | 170 |
Budget and Fiscal Plan - 2023/24 to 2025/26
| | 131 |
This page
intentionally left blank.
Appendix
A1: Tax Expenditures
Introduction
Tax expenditures reduce the amount of tax a taxpayer pays and are used to deliver government programs or benefits through the tax system. Tax expenditures are usually made by offering special tax rates, exemptions or credits. Governments introduce tax expenditures primarily to achieve social policy objectives such as transfers to lower-income families or to promote economic development and job creation.
Reporting tax expenditures improves government accountability by providing a more complete picture of government activities. Beginning with Budget 2012, refundable tax transfers are accounted for in a voted appropriation. For transparency and consistency with previous tax expenditure reports, Tables A1.1.1 and A1.1.2 also report on these tax transfers.
The Role of Tax Expenditure Programs
Using the tax system to deliver programs can reduce administration costs and compliance costs for recipients. In certain situations, the tax system allows intended beneficiaries to be readily identified from information that is already collected. In these cases, setting up a separate expenditure program would result in costly overlap and duplication of effort. An example is the climate action tax credit, which is delivered through the income tax system by the Canada Revenue Agency. If this were a direct provincial expenditure program, a provincial agency or office would have to be established to duplicate much of the work already done by the Canada Revenue Agency. In addition, it would require individuals to undertake a separate, time-consuming application process to qualify for the benefit.
There are several potential drawbacks to tax expenditure programs. First, their overall cost often receives less public scrutiny than is the case for spending programs because annual budget appropriations by the legislature are not typically required. Second, tax expenditure programs do not always effectively target those who are intended to benefit from them. Some tax expenditure programs that are intended to provide tax relief for lower-income earners may, in reality, provide the greatest benefit to higher-income earners who pay the most taxes. Finally, costs are often more difficult to control under a tax expenditure program because the benefits tend to be more open-ended and enforcement is often more difficult than for spending programs.
Tax Expenditure Reporting
Not all tax reductions, credits, exemptions and refunds are classed as tax expenditures.
The emphasis is on tax reductions, credits, exemptions and refunds that are close equivalents to spending programs. By implication, the list does not include tax measures designed to meet broad tax policy objectives such as improving fairness in the tax system or measures designed to simplify the administration of a tax. The list also does not include anything that is not intended to be part of a tax base.
Tax expenditures that cost less than $2 million annually are generally not included. Where practical, smaller items have been presented together as an aggregate figure or have been excluded to ensure taxpayer confidentiality is maintained.
| Budget and Fiscal Plan - 2023/24 to 2025/26
| | 133 |
Appendix
British Columbia Tax Expenditures
Tables A1.1.1 to A1.6 report tax expenditure estimates.
The cost of individual tax expenditures cannot be added together to reach a total tax expenditure figure for two reasons: in some cases, the programs interact with one another so that eliminating one program could increase or decrease the cost of another; and eliminating certain tax expenditure programs could change the choices taxpayers make, which in turn would affect the cost estimates.
The estimates for each tax expenditure are based on a static analysis of the costs and do not consider any behavioural changes, which could change the costs over time. In addition, estimates are generally recalculated each year using current data sources and using refinements to the methods of estimation, which can result in significant changes to the value of a given tax expenditure from prior years' reports.
Tables A1.1.1 and A1.1.2 list tax programs delivered through refundable personal and corporate income tax credits, respectively. Refundable tax credits can be used to reduce income tax liabilities with any remainder refunded to the taxpayer. These tax credits are reported in a voted appropriation.
Tables A1.2.1 and A1.2.2 list tax expenditures that are deductions, exemptions or non-refundable tax credits for personal and corporate income tax, respectively. Deductions reduce taxable income, whereas non-refundable tax credits can only be used to reduce income taxes payable. The tables include both provincial measures and federal measures. Federal measures are deductions and exemptions that reduce British Columbia income tax. Under the tax collection agreement between British Columbia and the federal government, the federal government has sole responsibility for determining income subject to tax, including British Columbia tax.
Table A1.3 lists property tax exemptions and grants. Property tax exemptions can reduce the tax owing or remove a property from tax. Grants reduce the final tax owing and may be refunded after full payment has been received. Exemptions are used to define the tax base; estimates for property tax expenditures for government entities, municipalities, colleges, schools, hospitals and similar public facilities are not shown.
Table A1.4 lists consumption tax exemptions. Fuel tax estimates include point-of-sale exemptions for certain individuals and businesses, and refunds if fuel is purchased then subsequently used for an exempt purpose. Provincial sales tax exemptions are typically point-of-sale exemptions and either apply to everyone at the point of sale or apply in certain circumstances with appropriate documentation.
Table A1.5 reports employer health tax expenditures.
Table A1.6 reports an insurance premium tax exemption for marine insurance.
More information on British Columbia tax expenditures in Tables A1.1.1 to A1.6 can be found at https://www2.gov.bc.ca/gov/content/taxes. Information on federal tax expenditures in Tables A1.2.1 and A1.2.2 can be found at https://www.canada.ca/en/ services/taxes/income-tax.html.
| 134 | | Budget and Fiscal Plan - 2023/24 to 2025/26
|
Appendix
| Table A1.1.1 Personal Income Tax – Tax Expenditures (Refundable Tax Credits) | ||||||||
| 2021/22 | 2022/23 | 2023/24 | ||||||
| Actual Cost1 | Estimated Cost2 | Planned Cost | ||||||
| ($ millions) | ($ millions) | ($ millions) | ||||||
| BC Family Benefit | 420 | 505 | 463 | |||||
| ● | Tax-free monthly payment made to eligible families to help with the cost of raising children under age 18. | |||||||
| ● | The maximum benefit is increased as of July 2023 to $1,750 for a family's first child, $1,100 for a second child, and $900 for each subsequent child. | |||||||
| ● | Started October 1, 2020 as the BC Child Opportunity Benefit. The benefit was temporarily enhanced for the period January 2023 to March 2023. | |||||||
| BC Recovery Benefit | 52 | - | - | |||||
| ● | Provided a one-time tax-free payment to British Columbians of $500 per individual or $1,000 per family. | |||||||
| ● | The benefit was reduced between $62,500 and $87,500 of net income for individuals and $125,000 and $175,000 of family net income for families. | |||||||
| Climate action tax credit | 325 | 1,840 | 757 | |||||
| ● | Helps offset the impact of the carbon taxes paid by low- to moderate-income individuals and families. | |||||||
| ● | The benefit varies based on the composition of the family and their family net income. | |||||||
| ● | Includes the temporary enhanced payments for the July 2022 to June 2023 benefit year. | |||||||
| ● | Introduced in 2008 with the carbon tax. | |||||||
| Home renovation tax credit for seniors and persons with disabilities | 2 | 3 | 3 | |||||
| ● | Assists eligible individuals 65 and over and persons with disabilities with the cost of certain permanent home renovations to improve accessibility or be more functional or mobile at home. | |||||||
| ● | Recipients may receive up to 10 per cent of qualifying renovation expenses, up to a maximum of $10,000 of qualifying renovation expenses or $1,000. | |||||||
| ● | Introduced in 2012. | |||||||
| Sales tax credit | 9 | 33 | 50 | |||||
| ● | Helps offset the cost of provincial sales tax for low-income individuals and families. | |||||||
| ● | The maximum benefit is $75 for individuals and $150 for couples. | |||||||
| ● | Reintroduced in 2013 in conjunction with reimplementation of the provincial sales tax. | |||||||
| Small business venture capital tax credit | 33 | 44 | 40 | |||||
| ● | Encourages investors to make early-stage equity investments that help B.C. small businesses develop and grow. | |||||||
| ● | Individuals receive a credit of up to 30 per cent of their investment and may claim a benefit of up to $120,000 per tax year. | |||||||
| ● | A temporary tax credit budget increase of $2.5 million for the 2022 to 2024 years supports additional investments in clean technology. | |||||||
| ● | Introduced in 1979. | |||||||
| Training tax credits 3 | 8 | 8 | 12 | |||||
| ● | Provides refundable income tax credits for apprentices based on the apprenticeship level completed. | |||||||
| ● | Provides refundable income tax credits for employers of up to 15 per cent of apprentices' salaries. | |||||||
| ● | Introduced in 2007. | |||||||
| ● | Sunset date of December 31, 2024. | |||||||
| 1 | Figures include prior year adjustments of -$1 million for the home renovation tax credit for seniors and persons with disabilities, -$41 million for the sales tax credit, -$1 million for the small business venture capital tax credit, and -$4 million for the training tax credits. |
| 2 | Figures include prior year adjustments of -$17 million for the sales tax credit, $4 million for the small business venture capital tax credit, and -$4 million for the training tax credit. |
| 3 | Training tax credits for corporations are listed in Table A1.1.2. The training tax credit for individuals includes tax credits for apprentices and unincorporated employers. |
| Budget and Fiscal Plan - 2023/24 to 2025/26
| | 135 |
Appendix
Table A1.1.2 Corporate Income Tax – Tax Expenditures (Refundable Tax Credits)
| 2021/22 | 2022/23 | 2023/24 | ||||||
| Actual Cost1 | Estimated Cost2 | Planned Cost | ||||||
| ($ millions) | ($ millions) | ($ millions) | ||||||
| Book publishing tax credit | 3 | 3 | 3 | |||||
| · | Supports book publishers that carry out business primarily in B.C. | |||||||
| · | Introduced in 2003. | |||||||
| · | Sunset date of March 31, 2026. | |||||||
| Clean buildings tax credit | - | - | 20 | |||||
| · | Provides a temporary 5 per cent refundable income tax credit on eligible expenditures paid towards improving the energy efficiency of eligible buildings. | |||||||
| · | Introduced in 2022 for eligible expenditures made before April 1, 2025. | |||||||
| Film Incentive BC tax credit | 73 | 166 | 153 | |||||
| · | Supports the production of film or television productions in B.C. The Film Incentive BC tax credit is for domestic productions meeting Canadian content requirements. | |||||||
| · | Basic, regional location and film training tax credits were introduced in 1998. | |||||||
| · | Digital animation and visual effects (DAVE) tax credit was introduced in 2008, and expanded to post-production activities in 2015. | |||||||
| · | Distant location tax credit was introduced in 2009. | |||||||
| · | B.C.-based scriptwriters tax credit was introduced in 2018. | |||||||
| · | Tax credit does not have a sunset date. | |||||||
| Production services tax credit | 582 | 775 | 890 | |||||
| · | Supports the production of film or video productions in B.C. The production services tax credit is available to both domestic and foreign producers. | |||||||
| · | Introduced in 1998. | |||||||
| · | Regional location tax credit and digital animation and visual effects (DAVE) tax credit introduced in 2008. Post-production activities became eligible for the DAVE credit in 2015. | |||||||
| · | Distant location tax credit was introduced in 2009. | |||||||
| · | Tax credit does not have a sunset date. | |||||||
| Interactive digital media tax credit | 86 | 136 | 110 | |||||
| · | Supports the development of interactive digital media products in B.C. | |||||||
| · | In 2017, eligibility was expanded to small business venture capital corporations, and principal business requirements were relaxed for corporations with annual qualifying B.C. labour expenditures greater than $2 million. | |||||||
| · | Introduced in September 2010. | |||||||
| · | Budget 2023 extends this tax credit for five years to August 31, 2028. | |||||||
| International business activity program tax refunds | 10 | 3 | - | |||||
| · | Provided eligible corporations, certain foreign banks authorized to carry on business in Canada, and specialists employed by these entities a refund of B.C. income tax paid on income related to the corporation's international business carried on in B.C. | |||||||
| · | Program eliminated effective September 12, 2017. The 2021/22 cost represents refunds paid in respect of eligible income earned before September 12, 2017. | |||||||
| Mining exploration tax credit | 28 | 35 | 30 | |||||
| · | Supports eligible corporations conducting grassroots mineral exploration in B.C. | |||||||
| · | Introduced for expenditures incurred after July 31, 1998; expanded to active partners in partnerships effective after March 31, 2003 and enhanced tax credit for prescribed areas introduced effective after February 20, 2007. | |||||||
| · | Tax credit does not have a sunset date. | |||||||
| Scientific research and experimental development tax credit 4 | 81 | 84 | 96 | |||||
| · | Supports research and development carried on in B.C. | |||||||
| · | Capital expenditures removed from qualifying expenditures effective after 2013 and taxable income removed from calculation of refundable tax credit expenditure limit for taxation years ending after March 18, 2019. | |||||||
| · | Introduced effective September 1, 1999. | |||||||
| · | Sunset date of August 31, 2027. | |||||||
| 1 | Figures include prior year adjustments of -$39 million for the Film Incentive BC tax credit, -$88 million for the production services tax credit, $6 million for the interactive digital media tax credit, $3 million for the mining exploration tax credit,-$11 million for the scientific research and experimental development tax credit, and $2 million for the training tax credit. |
| 2 | Figures include prior year adjustments of $24 million from the Film Incentive BC tax credit, -$27 million for the production services tax credit, $25 million for the interactive digital media tax credit, $5 million for the mining exploration tax credit, -$7 million for the scientific research and experimental development tax credit, and -$2 million for the training tax credit. |
| 3 | The scientific research and experimental development tax credit has a non-refundable component, which is reported in Table A1.2.2. |
| 136 | | Budget and Fiscal Plan - 2023/24 to 2025/26
|
Appendix
| Table A1.1.2 Corporate Income Tax – Tax Expenditures (Refundable Tax Credits) (continued) | ||||||||
| 2021/22 | 2022/23 | 2023/24 | ||||||
| Actual Cost | Estimated Cost | Planned Cost | ||||||
| ($ millions) | ($ millions) | ($ millions) | ||||||
| Training tax credits 1 | 13 | 10 | 12 | |||||
| · | Provides refundable income tax credits for employers of up to 15 per cent of apprentices' salaries. | |||||||
| · | Includes tax credit for shipbuilders and ship repair industry. | |||||||
| · | Introduced in 2007. | |||||||
| · | Sunset date of December 31, 2024. | |||||||
| 1 | Training tax credits for individuals are reported in Table A1.1.1. |
Table A1.2.1 Personal Income Tax – Tax Expenditures (Deductions and Non-Refundable Tax Credits)
| 2021/22 Actual Cost | 2022/23 Estimated Cost | 2023/24 Planned Cost | ||||||
| ($ millions) | ($ millions) | ($ millions) | ||||||
| Provincial Measures | 109 | 113 | 117 | |||||
| Age tax credit | ||||||||
| · | Provides an income-tested tax credit to elderly British Columbians. | |||||||
| · | Introduced in 2000. | |||||||
| BC caregiver tax credit | 6 | 6 | 6 | |||||
| · | Provides a tax credit to individuals who care for family members with a disability. | |||||||
| · | Introduced in 2018 in response to changes to the federal caregiver tax credit. | |||||||
| Canada Pension Plan tax credit | 221 | 236 | 256 | |||||
| · | Provides a tax credit to individuals who make Canada Pension Plan contributions. | |||||||
| · | Introduced in 2000. | |||||||
| Charitable donations tax credit | 388 | 396 | 402 | |||||
| · | Provides a tax credit to individuals who make charitable donations to registered charities and eligible donees. | |||||||
| · | Introduced in 2000. | |||||||
| Disability tax credit | 43 | 44 | 46 | |||||
| · | Provides a tax credit to persons with a disability. | |||||||
| · | Introduced in 2000. | |||||||
| Employment Insurance tax credit | 64 | 68 | 74 | |||||
| · | Provides a tax credit to individuals who pay Employment Insurance premiums. | |||||||
| · | Introduced in 2000. | |||||||
| Medical expense tax credit | 84 | 85 | 87 | |||||
| · | Provides a tax credit to individuals who make sufficient qualifying medical expenditures. | |||||||
| · | Introduced in 2000. | |||||||
| Mining flow-through share tax credit | 25 | 40 | 40 | |||||
| · | Provides a tax credit to individuals who invest in flow-through shares on renounced mining expenditures. | |||||||
| · | Introduced in 2001. | |||||||
| Pension tax credit | 31 | 32 | 32 | |||||
| · | Provides a tax credit to individuals who receive amounts from private pension plans. | |||||||
| · | Introduced in 2000. | |||||||
| Political contribution tax credit | 4 | 4 | 4 | |||||
| · | Provides a tax credit to individuals who donate to provincial political parties, constituency associations, or candidates. | |||||||
| · | Introduced in 2000. Prior to 2000, B.C. had a similar deduction, rather than a credit. | |||||||

| Budget and Fiscal Plan - 2023/24 to 2025/26
| | 137 |
Appendix
Table A1.2.1 Personal Income Tax – Tax Expenditures (Deductions and Non-Refundable Tax Credits) (continued)
| 2021/22 | 2022/23 | 2023/24 | ||||||
| Actual Cost | Estimated Cost | Planned Cost | ||||||
| ($ millions) | ($ millions) | ($ millions) | ||||||
| Provincial Measures (continued) | ||||||||
| Spousal and eligible dependant tax credits | 89 | 90 | 92 | |||||
| · | Provides a tax credit to individuals who have a low-income spouse, or to single parents who support a minor child. | |||||||
| · | Introduced in 2000. | |||||||
| Tuition tax credit | 72 | 74 | 75 | |||||
| · | Provides a tax credit for tuition paid to a post-secondary institution. | |||||||
| · | Costs also include education tax credit amounts in respect of studies prior to the elimination of that tax credit in 2019, which have been carried forward. | |||||||
| · | Unused tax credits may be carried forward to future years. | |||||||
| · | Introduced in 2000. | |||||||
| Federal Measures1 | ||||||||
| Child care expense deduction | 55 | 53 | 51 | |||||
| · | Allows families to deduct child care costs from taxable income. | |||||||
| · | Introduced in 1972. | |||||||
| Non-taxation of business-paid health and dental benefits | 184 | 203 | 213 | |||||
| · | Allows for private health and dental benefits to not be taxed. | |||||||
| · | Introduced in 1948. | |||||||
| Northern residents deduction | 19 | 19 | 19 | |||||
| · | Provides a deduction to individuals living in northern communities. | |||||||
| · | Introduced in 1987. | |||||||
| Pension income splitting | 111 | 119 | 129 | |||||
| · | Allows for spouses to split pension income, other than income from the Canada Pension Plan and Old Age Security. | |||||||
| · | Introduced in 2007. | |||||||
| Registered pension plans | 1,420 | 1,559 | 1,758 | |||||
| · | Allows amounts contributed to a pension plan to be deducted from taxable income. | |||||||
| · | Introduced in 1919. | |||||||
| Registered retirement savings plans (RRSPs) | 873 | 897 | 979 | |||||
| · | Allows amounts contributed to an RRSP to be deducted from taxable income. | |||||||
| · | Introduced in 1957. | |||||||
| Tax-free savings accounts (TFSAs) | 132 | 147 | 160 | |||||
| · | Allows for investment income to be earned tax-free within a TFSA. | |||||||
| · | Introduced in 2009. | |||||||
1 These measures show the foregone provincial revenue resulting from federal measures. Each measure is calculated from the 2022 federal cost projections as reported in the Government of Canada's Report on Federal Tax Expenditures 2022 by applying British Columbia residents' share of the measure and the relevant tax rates. Certain tax expenditure items have been excluded where no data is available or the amounts are immaterial.
| 138 | | Budget and Fiscal Plan - 2023/24 to 2025/26
|
Appendix
Table A1.2.2 Corporate Income Tax – Tax Expenditures (Deductions and Non-Refundable Tax Credits)
| 2021/22 | 2022/23 | 2023/24 | ||||||
| Actual Cost | Estimated Cost | Planned Cost | ||||||
| ($ millions) | ($ millions) | ($ millions) | ||||||
| Provincial Measures | ||||||||
| Small business venture capital tax credit | 3 | 6 | 5 | |||||
| · | See description under Table A1.1.1. | |||||||
| · | Corporations receive a credit of up to 30 per cent of their investment. There is no annual limit on the benefit that can be claimed. | |||||||
| Scientific research and experimental development tax credit 1 | 110 | 108 | 112 | |||||
| · | See description under Table A1.1.2. | |||||||
| Small business corporate income tax rate | 1,560 | 2,175 | 1,750 | |||||
| · | Provides a reduced income tax rate for Canadian-controlled private corporations on active business income up to $500,000. | |||||||
| · | The small business corporate income tax rate was reduced to 2 per cent from 2.5 per cent effective April 1, 2017. | |||||||
| · | Includes savings for credit unions, which are also reported below. | |||||||
| · | Introduced in 1975. | |||||||
| Small business corporate income tax rate for credit unions | 31 | 44 | 35 | |||||
| · | Provides a reduced income tax rate for credit unions on a portion of taxable income. | |||||||
| · | Introduced in 1977. | |||||||
| · | This tax credit expenditure reflects the savings provided to credit unions from the small business rate. | |||||||
| · | In 2017, expanded access for credit unions to the provincial small business rate continued despite the phase-out of the corresponding federal measure. | |||||||
| Federal Measure 2 | ||||||||
| Charitable donations deduction | 87 | 90 | 95 | |||||
| · | Generally permits corporations to deduct charitable donations made to registered charities up to a maximum of 75 per cent of the corporation's taxable income. The limit may be exceeded for donations of certain items. | |||||||
| · | Encourages corporations to make donations to charities. | |||||||
| · | Introduced in 1929 for certain charities, and expanded to all charities by 1933. | |||||||
| 1 | The scientific research and experimental development tax credit has a refundable component, which is reported in Table A1.1.2. | |
| 2 | The deduction for corporate charitable donations is a federal measure but the estimate shows only the foregone provincial revenue. This is calculated from the 2022 federal cost projection as reported in the Government of Canada's Report on Federal Tax Expenditures 2022 by applying British Columbia's share of corporate taxable income and the relevant tax rates to the federal estimate. |
| Table A1.3 Property Taxes – Tax Expenditures | ||||||||
| 2021/22 | 2022/23 | 2023/24 | ||||||
| Actual Cost | Estimated Cost | Planned Cost | ||||||
| ($ millions) | ($ millions) | ($ millions) | ||||||
| School and Rural Area Property Tax | ||||||||
| Assessment exemption of $10,000 for business properties 1 | 5 | 5 | 5 | |||||
| · | Assessed improvement values for property tax are reduced by $10,000 for each industrial and business property. | |||||||
| · | Introduced in 1984. | |||||||
| Overnight tourist accommodation assessment relief 1 | 2 | 2 | 2 | |||||
| · | Reduces the taxable assessed value of smaller tourist accommodation properties. | |||||||
| · | Introduced in 1988. | |||||||
| · | Assessment reductions for properties in rural areas were increased in 2016. | |||||||
| Home owner grant | 878 | 892 | 910 | |||||
| · | Reduces property taxes for Canadians and permanent residents of Canada who use the property as their principal residence. The benefit relative to tax paid is greater for lower-valued homes. | |||||||
| · | The grant is phased out on properties with an assessed value above a threshold value. Low-income seniors and some other low-income individuals may be eligible for a low-income grant supplement if some or all of the grant is reduced because of the phase out. | |||||||
| · | The grant is up to $275 higher for seniors, eligible veterans, and people with disabilities. | |||||||
| · | The northern and rural area home owner benefit was introduced in 2011, which provides a $200 higher grant outside the Metro Vancouver, Capital, and Fraser Valley regional districts. | |||||||
| · | Introduced in 1957. | |||||||
| 1 | Estimates are for the most recent calendar year of the fiscal year and include only school and rural area property taxes levied by the Province. |

Budget and Fiscal Plan - 2023/24 to 2025/26
| | 139 |
Appendix
Table A1.3 Property Taxes – Tax Expenditures (continued)
| 2021/22 | 2022/23 | |||||
| Actual Cost | Estimated Cost1 | |||||
| ($ millions) | ($ millions) | |||||
| Property Transfer Tax | ||||||
| Exemptions for the following: | ||||||
| First time home buyers | 65 | 41 | ||||
| · | Exempts Canadian citizens and permanent residents of Canada who purchase their first home. | |||||
| · | The homeowner must live in the home as their principal residence for at least one year after purchase and the property must have a fair market value of $500,000 or less. A phase out applies for homes up to $525,000. | |||||
| · | Introduced in 1994. | |||||
| Newly built home | 84 | 51 | ||||
| · | Exempts Canadian citizens and permanent residents of Canada from property transfer tax for a newly built home with a fair market value of up to $750,000. A partial exemption applies up to $800,000. | |||||
| · | The homeowner must live in the home for at least one year after purchase. There is no requirement to live in B.C. before the purchase. | |||||
| · | Introduced in 2016. | |||||
| Property transfers between related individuals | 212 | 223 | ||||
| · | Longstanding exemption for spousal and intergenerational transfers for principal residences, recreational properties, family farms, and in the event of a division of property due to divorce or marital breakdown. Available to Canadian citizens and permanent residents of Canada. | |||||
| Property transfers to municipalities, regional districts, hospital districts, library boards, school boards, water districts | 21 | 22 | ||||
| · | Longstanding exemption for transfers to specified public bodies. | |||||
| Property transfers to charities registered under the Income Tax Act (Canada) | 15 | 18 | ||||
| · | Longstanding exemption for transfers of properties to a registered charity or a specified individual where the land will be used for a charitable purpose. | |||||
| Speculation and Vacancy Tax 2 | ||||||
| $2,000 tax credit for B.C. residents | 4 | |||||
| · | Provides a tax credit of up to $2,000 for owners who are B.C. residents on the first $400,000 of their property value subject to the tax. | |||||
| Income tax credit for non-B.C. residents who pay B.C. income tax | 2 | |||||
| · | Provides a tax credit to reduce a non-B.C. resident's tax payable based on their B.C. income. | |||||
| Exemptions for the following: 3 | ||||||
| Recently acquired or inherited property | 122 | |||||
| · | Provides an exemption from tax for a property that is purchased or acquired in the calendar year. | |||||
| Temporary extended absence | 3 | |||||
| · | Provides an exemption from tax when an owner is absent from their principal residence. | |||||
| Separation or divorce | 4 | |||||
| · | Provides an exemption from tax for owners who are going through a separation or divorce. | |||||
| Death of an owner | 22 | |||||
| · | Provides an exemption from tax for owners in the calendar year of an owner's death and the following year. | |||||
| Rental restricted property | 27 | |||||
| · | Provides a temporary exemption from tax for property with a rental restriction bylaw or covenant until 2022. | |||||
| Hazardous or damaged residential property | 13 | |||||
| · | Provides an exemption from tax for property that is damaged by natural disaster or is uninhabitable. | |||||
| Strata accommodation property | 3 | |||||
| · | Provides an exemption from tax for property that is a strata hotel. | |||||
| Daycares | 2 | |||||
| · | Provides an exemption from tax for property that is used as a licenced daycare. | |||||
| 1 | Future costs for first time home buyers' program and newly built home exemption will vary depending on completion and sale of new homes below the threshold value and by activity of first time buyers in the market. Other property transfer tax exemptions will be more stable over time. |
| 2 | Certain exemptions such as the principal residence exemption, occupied by a tenant exemption and land under development exemption, are intended to exclude principal residences, rental properties and properties under development from the tax base. |
| 3 | This is the value of the exemptions without applying any credits. Ownership percentage is assumed to be split into equal parts based on the number of owners on title (e.g., if a property has 3 owners, each owner is assumed to have 1/3 ownership). The tax rate of either 0.5 per cent or 2 per cent based on their ownership type is then applied to their ownership percentage. |
| 140 | | Budget and Fiscal Plan - 2023/24 to 2025/26
|
Appendix
Table A1.4 Consumption Taxes – Tax Expenditures
| 2021/22 | 2022/23 | 2023/24 | ||||||
| Estimated Cost1 | Estimated Cost | Planned Cost | ||||||
| ($ millions) | ($ millions) | ($ millions) | ||||||
| Fuel Taxes 2 | 4 | 5 | 5 | |||||
| Exemption for alternative fuels 3 | ||||||||
| · | Exempts hydrogen, natural gas, and gasoline and diesel that contains at least 85 per cent methanol from motor fuel tax. | |||||||
| · | Introduced in 1982. | |||||||
| Exemption for international flights (jet fuel) | 9 | 13 | 13 | |||||
| · | Exempts fuel purchased by interjurisdictional airlines from motor fuel tax. | |||||||
| · | Introduced in 2012. | |||||||
| Exemptions for farmers 2 | 10 | 12 | 15 | |||||
| · | Exempts coloured gasoline and coloured diesel purchased by qualifying farmers from motor fuel and carbon tax. | |||||||
| · | Introduced in 2008 for motor fuel tax and 2014 for carbon tax. | |||||||
| Provincial Sales Tax 4 | ||||||||
| Rebate for select machinery and equipment | 124 | 142 | - | |||||
| · | Provided, as part of B.C.'s Economic Recovery Plan, a temporary rebate to encourage business investment. | |||||||
| Exemptions for the following: | ||||||||
| Food for human consumption 5 | 1,608 | 1,716 | 1,831 | |||||
| · | Provides an exemption to reduce the cost of basic necessities. | |||||||
| Production machinery and equipment | 186 | 186 | 200 | |||||
| · | Provides an exemption to help reduce the cost of certain machinery and equipment for businesses in the manufacturing, oil and gas, mining, and logging industries. | |||||||
| Residential energy (e.g., electricity, natural gas, fuel oil) | 285 | 308 | 337 | |||||
| · | Provides an exemption to reduce the cost of residential energy. | |||||||
| Non-residential electricity | 198 | 197 | 199 | |||||
| · | Provides an exemption to help businesses become more competitive and support increased investment, growth and job creation. Phased in starting January 1, 2018 and fully implemented on April 1, 2019. | |||||||
| Prescription and non-prescription drugs, vitamins, and certain other health care products | 295 | 300 | 313 | |||||
| · | Provides exemptions to reduce the cost of certain drugs, vitamins and health care products. | |||||||
| Children's clothing and footwear | 41 | 40 | 39 | |||||
| · | Provides an exemption to reduce the cost of clothing and footwear for children under 15. | |||||||
| Clothing patterns and fabrics | 8 | 8 | 8 | |||||
| · | Provides an exemption to reduce the cost of patterns, yarns, natural fibres, threads and fabric that are commonly used in making or repairing clothing. | |||||||
| Specified school supplies | 41 | 41 | 42 | |||||
| · | Provides an exemption to reduce the cost of school supplies. | |||||||
| Books, magazines, and newspapers | 45 | 45 | 47 | |||||
| · | Provides an exemption to reduce the cost of reading material. | |||||||
| Basic land-line telephone and cable service | 54 | 54 | 54 | |||||
| · | Provides exemptions to reduce the cost of basic land-line telephone and basic cable television service. | |||||||
| "1-800" and equivalent telephone services | 5 | 5 | 5 | |||||
| · | Provides an exemption to reduce the cost of offering toll-free telephone services. | |||||||
| Specified safety equipment | 43 | 43 | 43 | |||||
| · | Provides exemptions to reduce the cost of specified protective gear and safety equipment. | |||||||
| 1 | Exemptions are largely point-of-sale exemptions and can only be estimated unlike expenditures provided through the income or property tax systems. |
| 2 | Estimate is for both motor fuel tax and carbon tax. |
| 3 | Exemption for natural gas began in 1982. The exemption was expanded to include gasoline and diesel with at least 85 per cent methanol in 1992, hydrogen used in a fuel cell vehicle in 2009, and hydrogen used in an internal combustion engine vehicle in 2022. |
| 4 | Estimates are based on internal data, publicly available industry data and Statistics Canada data. All exemptions for provincial sales tax existed prior to the implementation of the Provincial Sales Tax Act in 2013 except for the exemption for non-residential electricity, which was introduced in 2018, and the expansion of the exemption for bicycles and tricycles in 2021 to include electric bicycles and tricycles. |
| 5 | Effective April 1, 2021, carbonated sodas and certain other beverages became subject to provincial sales tax. |
Budget and Fiscal Plan - 2023/24 to 2025/26
| | 141 |
Appendix
| Table A1.4 Consumption Taxes – Tax Expenditures (continued) | ||||||||
| 2021/22 | 2022/23 | 2023/24 | ||||||
| Estimated Cost1 | Estimated Cost | Planned Cost | ||||||
| ($ millions) | ($ millions) | ($ millions) | ||||||
| Provincial Sales Tax 2 | ||||||||
| Exemptions for the following: | ||||||||
| Labour to repair major household appliances, clothing, and footwear | 16 | 17 | 18 | |||||
| · | Provides exemptions to reduce the cost of repairing certain essentials. | |||||||
| Livestock for human consumption and feed, seed, and fertilizer | 81 | 87 | 91 | |||||
| · | Provides exemptions to reduce the cost of animals that are part of the food system. | |||||||
| Specified energy conservation equipment | 23 | 23 | 23 | |||||
| · | Provides exemptions to reduce the cost of certain energy conservation equipment. | |||||||
| Bicycles and adult-sized tricycles | 22 | 24 | 24 | |||||
| · | Provides exemptions to reduce the cost of non-motorized bicycles, adult-sized tricycles, and parts and services. Expanded on April 21, 2021 to include electric bicycles, electric adult-sized tricycles, conversion kits, and parts and services. | |||||||
| Used zero-emission vehicles | 2 | 21 | 29 | |||||
| · | Provides an exemption to reduce the cost of used zero-emission vehicles. | |||||||
| · | Introduced on February 23, 2022. Sunset date of February 22, 2027. | |||||||
| · | Sunset date of February 22, 2027. | |||||||
| Heat pumps | - | 8 | 8 | |||||
| · | Provides an exemption to reduce the cost of heat pumps. Introduced on April 1, 2022. | |||||||
| 1 | Exemptions are largely point-of-sale exemptions and can only be estimated unlike expenditures provided through the income or property tax systems. | |
| 2 | Estimates are based on internal data, publicly available industry data and Statistics Canada data. All exemptions for provincial sales tax existed prior to the implementation of the Provincial Sales Tax Act in 2013 unless otherwise noted. |
| Table A1.5 Employer Health Tax – Tax Expenditures (Refundable Tax Credit) |
| 2021/22 | 2022/23 | 2023/24 | ||||||
| Actual Cost | Estimated Cost | Planned Cost | ||||||
| ($ millions) | ($ millions) | ($ millions) | ||||||
| Increased Employment Incentive | 28 | 2 | - | |||||
| · | Provides a refundable tax credit to employers who increased their payroll for low- to middle-income workers between the third and fourth quarters of 2020. | |||||||
| · | Introduced for the quarter ended December 31, 2020 as part of B.C.'s Economic Recovery Plan. | |||||||
| Relief for small businesses, charities, and non-profits | 488 | 535 | 546 | |||||
| · | Provides a tax exemption for employers with B.C. remuneration of $500,000 or less, and a lower effective tax rate for employers with B.C. remuneration up to $1.5 million. | |||||||
| · | Charities and not-for-profit employers are exempt on their first $1.5 million of B.C. remuneration at a qualifying location, and receive a lower effective tax rate on B.C. remuneration of up to $4.5 million at a qualifying location. | |||||||
| · | Introduced in 2019 with the employer health tax. | |||||||
Table A1.6 Insurance Premium Tax – Tax Expenditures
| 2021/22 | 2022/23 | 2023/24 | ||||||
| Actual Cost | Estimated Cost | Planned Cost | ||||||
| ($ millions) | ($ millions) | ($ millions) | ||||||
| Marine Insurance Exemption | 3 | 3 | 3 | |||||
| · | Provides an exemption for marine insurance other than pleasure craft insurance. | |||||||
| · | Introduced in 1957. | |||||||
| 142 | | Budget and Fiscal Plan - 2023/24 to 2025/26
|
Appendix
Table A2 Interprovincial Comparisons of Tax Rates – 2023 (Rates known and in effect as of February 1, 2023)
| Tax | British Columbia | Alberta | Saskat- chewan | Manitoba | Ontario | Quebec | New Brunswick | Nova Scotia | Prince Edward Island | Newfound- land and Labrador | ||||||||||||||||||||
| Corporate income tax (per cent of taxable income) | ||||||||||||||||||||||||||||||
| General rate | 12 | 8 | 12 | 12 | 11.5 | 11.5 | 14 | 14 | 16 | 15 | ||||||||||||||||||||
| Manufacturing rate 1 | 12 | 8 | 10 | 12 | 10 | 11.5 | 14 | 14 | 16 | 15 | ||||||||||||||||||||
| Small business rate | 2 | 2 | 0 | 0 | 3.2 | 3.2 | 2.5 | 2.5 | 1 | 3 | ||||||||||||||||||||
| Small business threshold ($000s) | 500 | 500 | 600 | 500 | 500 | 500 | 500 | 500 | 500 | 500 | ||||||||||||||||||||
| Corporation capital tax (per cent) Financial 2 | Nil | Nil | 0.7/4 | 6 | Nil | 1.25 | 4/5 | 4 | 5 | 6 | ||||||||||||||||||||
| Payroll tax (per cent) 3 | 1.95 | Nil | Nil | 2.15 | 1.95 | 4.26 | Nil | Nil | Nil | 2 | ||||||||||||||||||||
| Insurance premium tax (per cent) 4 | 2/7 | 3/4 | 3/4 | 2/4 | 2/3.5 | 3.3 | 2/3 | 3/4 | 3.75/4 | 5 | ||||||||||||||||||||
| Fuel tax (cents per litre) 5 | ||||||||||||||||||||||||||||||
| Gasoline | 25.55 | 11.05 | 26.05 | 25.05 | 29.86 | 32.43 | 34.75 | 27.85 | 32.44 | 39.00 | ||||||||||||||||||||
| Diesel | 28.01 | 13.41 | 28.41 | 27.41 | 37.38 | 40.04 | 50.29 | 34.37 | 48.83 | 50.34 | ||||||||||||||||||||
| Sales tax (per cent) 6 General rate | 7 | Nil | 6 | 7 | 8 | 9.975 | 10 | 10 | 10 | 10 | ||||||||||||||||||||
| Tobacco tax ($per carton of 200 cigarettes) 7 | 75.95 | 55 | 66.97 | 70.60 | 47.22 | 29.80 | 65.29 | 74.09 | 74.09 | 80.64 |
| 1 | In British Columbia (and some other provinces), the general rate applies to income from manufacturing and processing. |
| 2 | Saskatchewan provides a lower rate for small financial corporations, while Manitoba exempts small financial corporations from taxation. Quebec's tax only applies to life insurance companies. New Brunswick generally applies a 4 per cent tax on financial institutions with a 5 per cent tax on banks specifically. Saskatchewan, New Brunswick, Nova Scotia, Prince Edward Island, and Newfoundland and Labrador each provide capital tax deductions. |
| 3 | Provinces with payroll taxes provide payroll tax relief for small businesses. Quebec levies a compensation tax of up to 2.8 per cent on salaries and wages paid by financial institutions other than insurance corporations which are taxed at a rate of 0.3 per cent. |
| 4 | Lower rates apply to premiums for life, sickness, and accident insurance; higher rates apply to premiums for property insurance including automobile insurance. In British Columbia, the highest rate applies to unlicensed insurance. Quebec's rate includes the 0.3 per cent rate of compensation tax levied on insurance corporations. In Saskatchewan, Manitoba, Ontario, Quebec, and Newfoundland and Labrador, sales taxes also apply to certain insurance premiums except, generally, those related to individual life and health. |
| 5 | Tax rates are for regular fuel used on highways and include all provincial taxes payable by consumers at the pump. The British Columbia rates include 6.75 cents per litre dedicated to the BC Transportation Financing Authority and the carbon tax rates of 11.05 cents per litre for gasoline and 13.01 cents per litre for diesel. The British Columbia rates do not include regional taxes that increase the gasoline and diesel rates by 18.5 cents per litre in the South Coast British Columbia Transportation Authority service region and by 5.5 cents per litre in the Capital Regional District. The rates for Ontario, Quebec, New Brunswick, Nova Scotia, Prince Edward Island, and Newfoundland and Labrador include provincial sales tax based on average pump prices as of December 2022. The rates for Alberta, Saskatchewan, Manitoba, and Ontario include federal carbon pricing backstop rates of 11.05 cents per litre for gasoline and 13.41 cents per litre for diesel. Federal carbon pricing backstop rates will apply in Newfoundland and Labrador, Nova Scotia, and Prince Edward Island beginning July 1, 2023. The rates for New Brunswick, Prince Edward Island and Newfoundland and Labrador include provincial carbon tax rates of 11.05 cents per litre for gasoline and 13.41 cents per litre for diesel. In Alberta, fuel tax rates, including gas and diesel, are adjusted quarterly based on an average West Texas Intermediate price within a given period, and fuel tax rates are currently at zero as a temporary measure until June 30, 2023. The temporary fuel tax reduction in Newfoundland and Labrador has not been included as it will expire on March 31, 2023. The temporary fuel tax reduction in Ontario has been included as it is in effect until December 31, 2023. Quebec's rates do not include increased or reduced regional tax rates, such as an additional 3 cents per litre on gasoline in the Montreal area. |
| 6 | Tax rates shown are statutory rates. Ontario, Quebec, New Brunswick, Nova Scotia, Prince Edward Island, and Newfoundland and Labrador have harmonized their sales taxes with the federal GST. Alberta imposes a 4 per cent tax on short-term rental accommodation. |
| 7 | Includes estimated provincial sales tax / provincial portion of the harmonized sales tax in all provinces except Alberta and Quebec. |
Budget and Fiscal Plan - 2023/24 to 2025/26
| | 143 |
Appendix
Table A3 Comparison of Provincial and Federal Taxes by Province – 2023
| Tax | British Columbia | Alberta | Saskat- chewan | Manitoba | Ontario | Quebec | New Brunswick | Nova Scotia | Prince Edward Island | New- foundland and Labrador | ||||||||||||||||||||
| Two Income Family of Four - $120,000 | ( $ ) | |||||||||||||||||||||||||||||
| 1. Provincial Income Tax | 4,902 | 6,381 | 6,500 | 9,225 | 6,337 | 10,480 | 8,859 | 11,250 | 10,372 | 9,344 | ||||||||||||||||||||
| Net Child Benefits | (319 | ) | 0 | 0 | -- | 0 | (2,867 | ) | 0 | 0 | -- | 0 | ||||||||||||||||||
| 2. Property Tax - Gross | 5,608 | 4,629 | 3,044 | 5,377 | 8,998 | 4,331 | 5,120 | 5,902 | 6,132 | 2,717 | ||||||||||||||||||||
| - Net | 5,038 | 4,629 | 3,044 | 5,377 | 8,998 | 4,331 | 5,120 | 5,902 | 6,132 | 2,717 | ||||||||||||||||||||
| 3. Sales Tax | 1,942 | 0 | 1,712 | 1,843 | 2,764 | 3,384 | 3,409 | 3,198 | 3,232 | 3,392 | ||||||||||||||||||||
| 4. Fuel Tax | 218 | 98 | 225 | 210 | 135 | 288 | 163 | 233 | 127 | 191 | ||||||||||||||||||||
| 5. Net Carbon Tax | 482 | (1,055 | ) | (942 | ) | (593 | ) | (751 | ) | -- | 202 | -- | 202 | 202 | ||||||||||||||||
| 6. Total Provincial Tax | 12,263 | 10,053 | 10,539 | 16,062 | 17,483 | 15,617 | 17,752 | 20,583 | 20,066 | 15,845 | ||||||||||||||||||||
| 7. Federal Income Tax | 12,595 | 12,595 | 12,595 | 12,595 | 12,595 | 12,561 | 12,595 | 12,595 | 12,595 | 12,595 | ||||||||||||||||||||
| 8. Net Federal GST | 1,805 | 1,767 | 1,765 | 1,709 | 1,768 | 1,793 | 1,716 | 1,667 | 1,685 | 1,706 | ||||||||||||||||||||
| 9. Total Tax | 26,663 | 24,416 | 24,898 | 30,365 | 31,846 | 29,971 | 32,063 | 34,844 | 34,346 | 30,146 | ||||||||||||||||||||
| Two Income Family of Four - $90,000 | ||||||||||||||||||||||||||||||
1. Provincial Income Tax | 2,783 | 3,664 | 3,142 | 5,467 | 2,643 | 5,898 | 5,050 | 6,690 | 6,247 | 5,345 | ||||||||||||||||||||
| Net Child Benefits | (1,403 | ) | 0 | 0 | -- | 0 | (4,001 | ) | 0 | 0 | -- | 0 | ||||||||||||||||||
| 2. Property Tax - Gross | 3,074 | 2,600 | 2,627 | 4,277 | 5,663 | 4,126 | 4,485 | 5,240 | 3,166 | 2,296 | ||||||||||||||||||||
| - Net | 2,504 | 2,600 | 2,627 | 4,277 | 5,663 | 4,126 | 4,485 | 5,240 | 3,166 | 2,296 | ||||||||||||||||||||
| 3. Sales Tax | 1,620 | 0 | 1,425 | 1,532 | 2,312 | 2,881 | 2,839 | 2,678 | 2,695 | 2,829 | ||||||||||||||||||||
| 4. Fuel Tax | 218 | 98 | 225 | 210 | 135 | 288 | 163 | 233 | 127 | 191 | ||||||||||||||||||||
| 5. Net Carbon Tax | 326 | (1,133 | ) | (1,023 | ) | (673 | ) | (839 | ) | -- | 202 | -- | 202 | 202 | ||||||||||||||||
| 6. Total Provincial Tax | 6,047 | 5,229 | 6,395 | 10,813 | 9,914 | 9,193 | 12,740 | 14,841 | 12,437 | 10,864 | ||||||||||||||||||||
| 7. Federal Income Tax | 7,330 | 7,330 | 7,330 | 7,330 | 7,330 | 7,312 | 7,330 | 7,330 | 7,330 | 7,330 | ||||||||||||||||||||
| 8. Net Federal GST | 1,505 | 1,458 | 1,469 | 1,421 | 1,479 | 1,527 | 1,429 | 1,395 | 1,405 | 1,423 | ||||||||||||||||||||
| 9. Total Tax | 14,882 | 14,017 | 15,194 | 19,563 | 18,723 | 18,032 | 21,500 | 23,566 | 21,171 | 19,617 | ||||||||||||||||||||
| Single Parent with One Child - $60,000 | ||||||||||||||||||||||||||||||
1. Provincial Income Tax | 1,852 | 1,101 | 1,088 | 3,240 | 1,888 | 2,435 | 3,004 | 4,799 | 4,069 | 3,861 | ||||||||||||||||||||
| Net Child Benefits | (875 | ) | (62 | ) | 0 | -- | 0 | (2,445 | ) | 0 | 0 | -- | 0 | |||||||||||||||||
| 2. Property Tax | - | - | - | - | - | - | - | - | - | - | ||||||||||||||||||||
| 3. Sales Tax | 1,196 | 0 | 1,076 | 1,149 | 1,708 | 2,171 | 1,883 | 1,982 | 1,941 | 2,092 | ||||||||||||||||||||
| 4. Fuel Tax | 218 | 98 | 225 | 210 | 135 | 288 | 163 | 233 | 127 | 191 | ||||||||||||||||||||
| 5. Net Carbon Tax | 26 | (921 | ) | (822 | ) | (522 | ) | (654 | ) | -- | 202 | -- | 202 | 202 | ||||||||||||||||
| 6. Total Provincial Tax | 2,417 | 216 | 1,568 | 4,077 | 3,078 | 2,450 | 5,253 | 7,014 | 6,339 | 6,347 | ||||||||||||||||||||
| 7. Federal Income Tax | 3,881 | 3,881 | 3,881 | 3,881 | 3,881 | 3,868 | 3,881 | 3,881 | 3,881 | 3,881 | ||||||||||||||||||||
| 8. Net Federal GST | 1,077 | 1,076 | 1,075 | 1,030 | 1,058 | 1,115 | 1,040 | 998 | 1,015 | 1,017 | ||||||||||||||||||||
| 9. Total Tax | 7,375 | 5,172 | 6,523 | 8,988 | 8,016 | 7,434 | 10,174 | 11,892 | 11,234 | 11,245 | ||||||||||||||||||||
| Unattached Individual - $30,000 | ||||||||||||||||||||||||||||||
1. Provincial Income Tax | 445 | 606 | 629 | 1,226 | -723 | -97 | 927 | 1,158 | 1,502 | 1,451 | ||||||||||||||||||||
| 2. Property Tax | - | - | - | - | - | - | - | - | - | - | ||||||||||||||||||||
| 3. Sales Tax | 478 | 0 | 431 | 469 | 573 | 872 | 573 | 826 | 707 | 389 | ||||||||||||||||||||
| 4. Fuel Tax | 218 | 98 | 225 | 210 | 135 | 288 | 163 | 233 | 127 | 191 | ||||||||||||||||||||
| 5. Net Carbon Tax | (118 | ) | (646 | ) | (601 | ) | (446 | ) | (537 | ) | -- | 202 | -- | 202 | 202 | |||||||||||||||
| 6. Total Provincial Tax | 1,023 | 58 | 684 | 1,459 | -551 | 1,063 | 1,866 | 2,217 | 2,539 | 2,234 | ||||||||||||||||||||
| 7. Federal Income Tax | 1,826 | 1,826 | 1,826 | 1,826 | 1,826 | 1,820 | 1,826 | 1,826 | 1,826 | 1,826 | ||||||||||||||||||||
| 8. Net Federal GST | (39 | ) | (42 | ) | (42 | ) | (53 | ) | (16 | ) | (22 | ) | (42 | ) | (52 | ) | (56 | ) | (48 | ) | ||||||||||
| 9. Total Tax | 2,810 | 1,842 | 2,468 | 3,233 | 1,259 | 2,861 | 3,650 | 3,992 | 4,310 | 4,012 | ||||||||||||||||||||

| 144 | | Budget and Fiscal Plan - 2023/24 to 2025/26
|
Appendix
Table A3 Comparison of Provincial and Federal Taxes by Province – 2023 (continued)
| Tax | British Columbia | Alberta | Saskat- chewan | Manitoba | Ontario | Quebec | New Brunswick | Nova Scotia | Prince Edward Island | New- foundland and Labrador | ||||||||||||||||||||
| Unattached Individual - $80,000 | ($) | |||||||||||||||||||||||||||||
| 1. Provincial Income Tax | 3,912 | 5,192 | 6,349 | 6,962 | 4,974 | 8,470 | 7,033 | 8,951 | 8,214 | 7,505 | ||||||||||||||||||||
| 2. Property Tax - Gross | 2,116 | 1,983 | 2,681 | 3,508 | 4,894 | 2,750 | 3,634 | 5,091 | 4,455 | 1,789 | ||||||||||||||||||||
| - Net | 1,546 | 1,983 | 2,681 | 3,508 | 4,894 | 2,750 | 3,634 | 5,091 | 4,455 | 1,789 | ||||||||||||||||||||
| 3. Sales Tax | 1,041 | 0 | 904 | 996 | 1,479 | 1,741 | 1,807 | 1,682 | 1,705 | 1,791 | ||||||||||||||||||||
| 4. Fuel Tax | 218 | 98 | 225 | 210 | 135 | 288 | 163 | 233 | 127 | 191 | ||||||||||||||||||||
| 5. Net Carbon Tax | 379 | (343 | ) | (280 | ) | (130 | ) | (168 | ) | -- | 202 | -- | 202 | 202 | ||||||||||||||||
| 6. Total Provincial Tax | 7,097 | 6,929 | 9,878 | 11,546 | 11,314 | 13,249 | 12,839 | 15,956 | 14,703 | 11,478 | ||||||||||||||||||||
| 7. Federal Income Tax | 10,008 | 10,008 | 10,008 | 10,008 | 10,008 | 9,982 | 10,008 | 10,008 | 10,008 | 10,008 | ||||||||||||||||||||
| 8. Net Federal GST | 963 | 941 | 921 | 910 | 945 | 917 | 909 | 875 | 888 | 900 | ||||||||||||||||||||
| 9. Total Tax | 18,069 | 17,878 | 20,807 | 22,464 | 22,267 | 24,147 | 23,756 | 26,839 | 25,599 | 22,387 | ||||||||||||||||||||
| Senior Couple with Equal Pension Incomes - $40,000 | ||||||||||||||||||||||||||||||
| 1. Provincial Income Tax | 0 | 0 | (462 | ) | (39 | ) | (1,689 | ) | (1,073 | ) | 0 | 462 | 808 | 0 | ||||||||||||||||
| 2. Property Tax - Gross | 3,074 | 2,600 | 2,627 | 4,277 | 5,663 | 4,126 | 4,485 | 5,240 | 3,166 | 2,296 | ||||||||||||||||||||
| - Net | 2,229 | 2,600 | 2,627 | 4,277 | 5,663 | 4,126 | 4,485 | 5,240 | 3,166 | 2,296 | ||||||||||||||||||||
| 3. Sales Tax | 905 | 0 | 821 | 867 | 1,095 | 1,556 | 1,160 | 1,485 | 1,338 | 1,413 | ||||||||||||||||||||
| 4. Fuel Tax | 218 | 98 | 225 | 210 | 135 | 288 | 163 | 233 | 127 | 191 | ||||||||||||||||||||
| 5. Net Carbon Tax | (46 | ) | (631 | ) | (540 | ) | (291 | ) | (382 | ) | -- | 202 | -- | 202 | 202 | |||||||||||||||
| 6. Total Provincial Tax | 3,305 | 2,067 | 2,670 | 5,023 | 4,822 | 4,897 | 6,011 | 7,420 | 5,642 | 4,103 | ||||||||||||||||||||
| 7. Federal Income Tax | 0 | 0 | 0 | 0 | 0 | 0 | 0 | 0 | 0 | 0 | ||||||||||||||||||||
| 8. Net Federal GST | 304 | 297 | 306 | 264 | 272 | 288 | 267 | 234 | 273 | 308 | ||||||||||||||||||||
| 9. Total Tax | 3,609 | 2,364 | 2,976 | 5,286 | 5,094 | 5,184 | 6,278 | 7,653 | 5,915 | 4,411 | ||||||||||||||||||||
Personal Income Tax
| · | Income tax is based on basic personal credits, applicable credits and typical major deductions at each income level. Quebec residents pay federal income tax less an abatement of 16.5 per cent of basic federal tax. This abatement has been used to reduce Quebec provincial tax rather than federal tax, for comparative purposes. |
| · | The amounts noted for each family is their family total income. Total income is used for these tables as it provides a more accurate view of the taxes paid by a family at a particular level of earnings. The two income family of four with $120,000 income is assumed to have one spouse earning $80,000 and the other $40,000, the family with $90,000 income is assumed to have one spouse earning $50,000 and the other $40,000 and each spouse in the senior couple is assumed to receive $20,000. The senior couple is assumed to have pension income and the remaining representative families are assumed to have employment income. |
Net Child Benefits
| · | Net child benefits are provincial measures affecting payments to families with children. Provincial child benefit measures are available in British Columbia (BC Family Benefit), Alberta (Alberta Child and Family Benefit), Ontario (Child Benefit), Quebec (Child Assistance Payments), New Brunswick (Child Tax Benefit), Nova Scotia (Child Benefit), and Newfoundland and Labrador (Child Benefit). |
| · | The single parent is assumed to have one child aged 5. The family earning $90,000 income is assumed to have two children aged 5 and 7. The family earning $120,000 income is assumed to have two children aged 15 and 17. |
Property Tax
| · | Property taxes are based on a representative two storey home, townhouse or condominium in a major city in each respective province. |
| · | It is assumed that the single parent and the individual at $30,000 income rent accommodation, the family at $90,000 income and senior couple own townhouses, the family at $120,000 income owns a single family detached home, and the individual at $80,000 income owns a condominium in a major city for each province. Net local and provincial property taxes are estimated as taxes owing after credits provided through the property tax system are subtracted. |
Sales Tax
| · | Estimates are based on expenditure patterns from the Survey of Household Spending. In estimating individual and family taxable consumption, disposable income is reduced by estimated federal income taxes and provincial income taxes. In addition, the single individual with $80,000 income, family with $90,000 income and family with $120,000 income are assumed to have savings equal to 5 per cent of their income. For each family, disposable income is distributed among expenditures using the consumption pattern of a typical family with the relevant characteristics as estimated using family expenditure data, and the relevant sales tax component is extracted. Sales tax includes: provincial retail sales taxes in British Columbia, Saskatchewan, and Manitoba; Quebec's value added tax; the provincial component of the HST in Ontario, New Brunswick, Nova Scotia, Prince Edward Island and Newfoundland and Labrador; and Alberta's Tourism Levy. Sales tax estimates have been reduced by sales tax credits where applicable. |
Fuel and Carbon Taxes
| · | Fuel tax is based on annual consumption: all families are assumed to consume 1,500 litres of gasoline. |
| · | Net carbon tax is estimated as carbon tax liabilities minus rebates such as B.C.'s climate action tax credit, where applicable. Carbon tax liabilities are based on direct fuel charges on gasoline, natural gas and home heating fuel where such charges apply (fuel charges do not apply to home heating fuel in New Brunswick, Prince Edward Island and Newfoundland and Labrador). Estimated carbon tax liabilities are based on natural gas and home heating fuel consumption amounts from household energy consumption data produced by Statistics Canada and Natural Resources Canada. Carbon tax liabilities do not include the effect of cap-and-trade or output-based pricing systems. |
| · | The federal government requires provinces to implement a price on carbon of at least $65/tonne starting April 2023. Provinces that do not have a carbon pricing program will have the federal carbon pricing backstop rates applied to the price of the fuel. As of December 31, 2022, Ontario, Manitoba, Saskatchewan, and Alberta are subject to the federal carbon pricing on fuel purchases. Families in these provinces receive the federal climate action incentive to offset the cost of the carbon pricing. |
Effective Tax Rates
| · | British Columbia taxes have been calculated using rates in effect for 2023. Taxes for other provinces were calculated using rates that were announced prior to February 1, 2023, and that come into effect during 2023. |
Budget and Fiscal Plan - 2023/24 to 2025/26
| | 145 |
Appendix
Table A4 Interprovincial Comparisons of Provincial Personal Income Taxes Payable 1 – 2023 (Rates known as of February 1, 2023)
| Taxable income | British Columbia | Alberta | Saskat- chewan | Manitoba | Ontario | Quebec 2 | New Brunswick | Nova Scotia | Prince Edward Island | New- foundland and Labrador | ||||||||||||||||||||||||||||||||
| Annual provincial taxes payable3 ($) | ||||||||||||||||||||||||||||||||||||||||||
| $ | 10,000 | 0 | 0 | 0 | 0 | 0 | 0 | 0 | 0 | 0 | 0 | |||||||||||||||||||||||||||||||
| $ | 20,000 | 0 | 0 | 108 | 816 | 0 | 0 | 0 | 590 | 322 | 0 | |||||||||||||||||||||||||||||||
| $ | 30,000 | 520 | 693 | 1,079 | 1,845 | 300 | 1,097 | 1,035 | 1,503 | 1,588 | 1,527 | |||||||||||||||||||||||||||||||
| $ | 40,000 | 1,275 | 1,617 | 2,049 | 2,897 | 1,210 | 2,404 | 2,201 | 2,987 | 2,809 | 2,331 | |||||||||||||||||||||||||||||||
| $ | 50,000 | 1,845 | 2,542 | 3,020 | 4,088 | 2,334 | 3,887 | 3,276 | 4,470 | 4,121 | 3,604 | |||||||||||||||||||||||||||||||
| $ | 60,000 | 2,574 | 3,466 | 4,184 | 5,280 | 3,230 | 5,535 | 4,600 | 5,957 | 5,432 | 4,982 | |||||||||||||||||||||||||||||||
| $ | 70,000 | 3,321 | 4,424 | 5,389 | 6,508 | 4,121 | 7,194 | 5,958 | 7,641 | 6,932 | 6,392 | |||||||||||||||||||||||||||||||
| $ | 80,000 | 4,091 | 5,424 | 6,639 | 7,783 | 5,186 | 8,856 | 7,358 | 9,337 | 8,602 | 7,842 | |||||||||||||||||||||||||||||||
| $ | 100,000 | 5,857 | 7,424 | 9,139 | 11,251 | 7,228 | 12,179 | 10,237 | 12,724 | 11,942 | 10,956 | |||||||||||||||||||||||||||||||
| $ | 125,000 | 8,831 | 9,924 | 12,264 | 15,601 | 11,394 | 17,214 | 14,237 | 17,099 | 16,478 | 14,906 | |||||||||||||||||||||||||||||||
| $ | 150,000 | 12,436 | 12,566 | 15,535 | 19,951 | 15,747 | 22,579 | 18,237 | 21,474 | 21,071 | 18,883 | |||||||||||||||||||||||||||||||
| Provincial personal income taxes as a per cent of taxable income (%) | ||||||||||||||||||||||||||||||||||||||||||
| $ | 10,000 | 0.0 | 0.0 | 0.0 | 0.0 | 0.0 | 0.0 | 0.0 | 0.0 | 0.0 | 0.0 | |||||||||||||||||||||||||||||||
| $ | 20,000 | 0.0 | 0.0 | 0.5 | 4.1 | 0.0 | 0.0 | 0.0 | 3.0 | 1.6 | 0.0 | |||||||||||||||||||||||||||||||
| $ | 30,000 | 1.7 | 2.3 | 3.6 | 6.1 | 1.0 | 3.7 | 3.4 | 5.0 | 5.3 | 5.1 | |||||||||||||||||||||||||||||||
| $ | 40,000 | 3.2 | 4.0 | 5.1 | 7.2 | 3.0 | 6.0 | 5.5 | 7.5 | 7.0 | 5.8 | |||||||||||||||||||||||||||||||
| $ | 50,000 | 3.7 | 5.1 | 6.0 | 8.2 | 4.7 | 7.8 | 6.6 | 8.9 | 8.2 | 7.2 | |||||||||||||||||||||||||||||||
| $ | 60,000 | 4.3 | 5.8 | 7.0 | 8.8 | 5.4 | 9.2 | 7.7 | 9.9 | 9.1 | 8.3 | |||||||||||||||||||||||||||||||
| $ | 70,000 | 4.7 | 6.3 | 7.7 | 9.3 | 5.9 | 10.3 | 8.5 | 10.9 | 9.9 | 9.1 | |||||||||||||||||||||||||||||||
| $ | 80,000 | 5.1 | 6.8 | 8.3 | 9.7 | 6.5 | 11.1 | 9.2 | 11.7 | 10.8 | 9.8 | |||||||||||||||||||||||||||||||
| $ | 100,000 | 5.9 | 7.4 | 9.1 | 11.3 | 7.2 | 12.2 | 10.2 | 12.7 | 11.9 | 11.0 | |||||||||||||||||||||||||||||||
| $ | 125,000 | 7.1 | 7.9 | 9.8 | 12.5 | 9.1 | 13.8 | 11.4 | 13.7 | 13.2 | 11.9 | |||||||||||||||||||||||||||||||
| $ | 150,000 | 8.3 | 8.4 | 10.4 | 13.3 | 10.5 | 15.1 | 12.2 | 14.3 | 14.0 | 12.6 | |||||||||||||||||||||||||||||||
1
| Calculated for a single individual with wage income and claiming credits for Canada Pension Plan and Quebec Pension Plan contributions, Employment Insurance premiums, Quebec Parental Insurance Plan premiums, and the basic personal amount. | |
| 2 | Quebec residents pay federal tax less an abatement of 16.5 per cent of federal tax. In the table, the Quebec abatement has been used to reduce Quebec provincial personal income tax for comparative purposes. | |
| 3 | Includes provincial low income reductions, surtaxes payable in Ontario and Prince Edward Island, and the Ontario Health Premium tax. Excludes credits for sales and property tax credits. |
| 146 | | Budget and Fiscal Plan - 2023/24 to 2025/26
|
Appendix
Table A4.1 Net Provincial Taxes Since Budget 2016
| Tax | 2016 | 2017 | 2018 | 2019 | 2020 | 2021 | 2022 | 2023 | ||||||||||||||||||||||||
| $30,000 of Family Net Income | ($) | |||||||||||||||||||||||||||||||
| 1. MSP Premiums | 0 | 0 | 0 | 0 | -- | -- | -- | -- | ||||||||||||||||||||||||
| 2. Provincial Income Tax | 0 | 0 | 0 | 0 | (1,000 | ) | 0 | 0 | 0 | |||||||||||||||||||||||
| 3. Early Childhood Tax Benefit | (660 | ) | (660 | ) | (660 | ) | (660 | ) | (495 | ) | -- | -- | -- | |||||||||||||||||||
| 4. BC Family Benefit | -- | -- | -- | -- | (600 | ) | (2,406 | ) | (2,422 | ) | (2,763 | ) | ||||||||||||||||||||
| 5. Carbon Tax | (126 | ) | (126 | ) | (129 | ) | (150 | ) | (645 | ) | (193 | ) | (159 | ) | (955 | ) | ||||||||||||||||
| 6. Sales Tax | 818 | 830 | 839 | 845 | 940 | 1,022 | 1,022 | 1,008 | ||||||||||||||||||||||||
| 7. Fuel Tax | 145 | 145 | 145 | 145 | 145 | 145 | 145 | 145 | ||||||||||||||||||||||||
| 8. Net Provincial Tax | 177 | 189 | 195 | 180 | (1,655 | ) | (1,432 | ) | (1,414 | ) | (2,565 | ) | ||||||||||||||||||||
| $60,000 of Family Net Income | ||||||||||||||||||||||||||||||||
| 1. MSP Premiums | 1,800 | 1,800 | 900 | 900 | -- | -- | -- | -- | ||||||||||||||||||||||||
| 2. Provincial Income Tax | 1,714 | 1,663 | 1,595 | 1,505 | 416 | 1,361 | 1,274 | 1,039 | ||||||||||||||||||||||||
| 3. Early Childhood Tax Benefit | (660 | ) | (660 | ) | (660 | ) | (660 | ) | (495 | ) | -- | -- | -- | |||||||||||||||||||
| 4. BC Family Benefit | -- | -- | -- | -- | (345 | ) | (1,380 | ) | (1,380 | ) | (1,665 | ) | ||||||||||||||||||||
| 5. Carbon Tax | 208 | 208 | 233 | 261 | (224 | ) | 217 | 188 | (620 | ) | ||||||||||||||||||||||
| 6. Sales Tax | 958 | 969 | 1,003 | 1,025 | 1,164 | 1,210 | 1,363 | 1,391 | ||||||||||||||||||||||||
| 7. Fuel Tax | 218 | 218 | 218 | 218 | 218 | 218 | 218 | 218 | ||||||||||||||||||||||||
| 8. Net Provincial Tax | 4,238 | 4,198 | 3,289 | 3,249 | 734 | 1,626 | 1,663 | 363 | ||||||||||||||||||||||||
| $80,000 of Family Net Income | ||||||||||||||||||||||||||||||||
| 1. MSP Premiums | 1,800 | 1,800 | 900 | 900 | -- | -- | -- | -- | ||||||||||||||||||||||||
| 2. Provincial Income Tax | 2,869 | 2,824 | 2,761 | 2,713 | 1,682 | 2,662 | 2,630 | 2,550 | ||||||||||||||||||||||||
| 3. Early Childhood Tax Benefit | (660 | ) | (660 | ) | (660 | ) | (660 | ) | (495 | ) | -- | -- | -- | |||||||||||||||||||
| 4. BC Family Benefit | -- | -- | -- | -- | (345 | ) | (1,380 | ) | (1,380 | ) | (1,655 | ) | ||||||||||||||||||||
| 5. Carbon Tax | 236 | 236 | 265 | 305 | (59 | ) | 348 | 365 | (220 | ) | ||||||||||||||||||||||
| 6. Sales Tax | 1,174 | 1,184 | 1,215 | 1,245 | 1,357 | 1,491 | 1,552 | 1,565 | ||||||||||||||||||||||||
| 7. Fuel Tax | 218 | 218 | 218 | 218 | 218 | 218 | 218 | 218 | ||||||||||||||||||||||||
| 8. Net Provincial Tax | 5,637 | 5,602 | 4,699 | 4,721 | 2,358 | 3,339 | 3,385 | 2,458 | ||||||||||||||||||||||||
| $100,000 of Family Net Income | ||||||||||||||||||||||||||||||||
| 1. MSP Premiums | 1,800 | 1,800 | 900 | 900 | -- | -- | -- | -- | ||||||||||||||||||||||||
| 2. Provincial Income Tax | 4,340 | 4,298 | 4,234 | 4,148 | 3,062 | 4,004 | 3,916 | 3,690 | ||||||||||||||||||||||||
| 3. Early Childhood Tax Benefit | (660 | ) | (660 | ) | (660 | ) | (660 | ) | (495 | ) | -- | -- | -- | |||||||||||||||||||
| 4. BC Family Benefit | -- | -- | -- | -- | (145 | ) | (598 | ) | (649 | ) | (1,057 | ) | ||||||||||||||||||||
| 5. Carbon Tax | 269 | 269 | 303 | 348 | 86 | 397 | 407 | 196 | ||||||||||||||||||||||||
| 6. Sales Tax | 1,434 | 1,447 | 1,480 | 1,527 | 1,633 | 1,659 | 1,659 | 1,829 | ||||||||||||||||||||||||
| 7. Fuel Tax | 290 | 290 | 290 | 290 | 290 | 290 | 290 | 290 | ||||||||||||||||||||||||
| 8. Net Provincial Tax | 7,473 | 7,444 | 6,547 | 6,553 | 4,431 | 5,752 | 5,623 | 4,948 | ||||||||||||||||||||||||
Personal Income Tax
| · | For each family, the amount noted is the family net income. Net income forms the basis of many benefits provided through the tax system and, therefore, will provide a more accurate illustration of benefits received and premiums paid by a family at their respective family net income level. Income tax is calculated based on applicable tax rates and credits. All families are assumed to have each spouse earning an equal amount of employment income. |
| · | Families are assumed to have two children aged 5 and 12. |
Net Child Benefits
| · | Net child benefits are provincial measures affecting payments to families with children. The BC early childhood tax benefit was in effect until September 2020. The BC Family Benefit, formerly the BC Child Opportunity Benefit, is effective October 1, 2020. |
Sales, Fuel and Carbon Tax Estimates
| · | Disposable income is estimated based on the total amounts received in 2016 and then adjusted for inflation. In estimating taxable consumption, disposable income is reduced by 20 per cent to reflect rent. Cost of groceries and utilities are estimated based on the Survey of Household Spending and subtracted, thereafter. |
| · | For each family, income after rent, groceries and utilities is distributed among the remaining expenditures using the consumption pattern of a typical family with two children estimated based on expenditure patterns from the Survey of Household Spending. The relevant sales tax component is extracted based on the estimates. |
| · | Fuel tax is based on annual consumption: 1,000 litres of fuel for the family at $30,000; 1,500 litres of fuel for the family at $60,000 and at $80,000; and 2,000 of fuel for the family at $100,000. |
| · | Net carbon tax is estimated as carbon tax liabilities minus the BC climate action tax credit. This includes the temporary enhancements for October 2022, January 2023, and April 2023, as well as the increase for the July 2023 to June 2024 period. Carbon tax liabilities are based on direct fuel charges on gasoline, natural gas and home heating fuel. Estimated carbon tax liabilities are based on natural gas and home heating fuel consumption amounts from household energy consumption data from Natural Resources Canada. |
Health Care Premiums
| · | B.C. Medical Services Plan premiums were eliminated January 1, 2020. This table assumes that the full Medical Services Plan premium was paid by the family and not paid by the employer. |
COVID-19 Relief in 2020
| · | As part of COVID-19 relief, a one-time enhancement to the climate action tax credit was paid with the July 2020 payment. The amount of the benefit is included in net carbon taxes. |
| · | The BC Recovery Benefit provided families up to $1,000 per family reduced by family net income over $125,000. Payments for the benefit commenced in December 2020. The amount of the benefit is net against provincial income taxes for 2020. |
Budget and Fiscal Plan - 2023/24 to 2025/26
| | 147 |
Appendix
Table A5 Material Assumptions – Revenue
| Revenue Source and Assumptions ($ millions unless otherwise specified) | Updated Forecast 2022/23 | Budget Estimate 2023/24 | Plan 2024/25 | Plan 2025/26 | 2023/24 Sensitivities | |||||||||
| Personal income tax * | 17,712 | 15,953 | 16,705 | 17,519 | ||||||||||
| Current calendar year assumptions | ||||||||||||||
| Household income growth | 7.1 | % | 6.1 | % | 4.3 | % | 4.1 | % | +/- 1 percentage point change in 2023 B.C. | |||||
| Employee compensation growth | 11.3 | % | 6.3 | % | 5.2 | % | 4.4 | % | household income growth equals +/- $140 to | |||||
| Tax base growth | 6.2 | % | 6.0 | % | 4.3 | % | 4.0 | % | $160 million | |||||
| Average tax yield | 6.38 | % | 6.36 | % | 6.38 | % | 6.44 | % | ||||||
| Current-year tax | 14,713 | 15,528 | 16,252 | 17,067 | ||||||||||
| Prior year’s tax assessments | 510 | 520 | 530 | 540 | ||||||||||
| Unapplied taxes | 100 | 100 | 100 | 100 | ||||||||||
| B.C. Tax Reduction | (197 | ) | (205 | ) | (210 | ) | (215 | ) | ||||||
| Non-refundable B.C. tax credits | (176 | ) | (176 | ) | (176 | ) | (176 | ) | ||||||
| Policy neutral elasticity ** | 0.8 | 0.9 | 1.1 | 1.2 | +/- 0.5 change in 2023 B.C. policy neutral elasticity equals +/- $440 to $460 million | |||||||||
| Fiscal year assumptions | ||||||||||||||
| Prior-year adjustment | 2,554 | |||||||||||||
| 2021 Tax-year | 2021 Assumptions | |||||||||||||
| Household income growth | 5.5 | % | +/- 1 percentage point change in 2022 B.C. | |||||||||||
| Tax base growth | 9.9 | % | household or taxable income growth equals | |||||||||||
| Average 2021 tax yield | 6.42 | % | +/- $170 to $190 million one-time effect (prior- | |||||||||||
| 2021 tax | 13,940 | year adjustment) and could result in an | ||||||||||||
| 2020 & prior year’s tax assessments | 498 | additional +/- $140 to $160 million base change | ||||||||||||
| Unapplied taxes | 230 | in 2023/24 | ||||||||||||
| B.C. Tax Reduction | (184 | ) | ||||||||||||
| Non-refundable B.C. tax credits | (170 | ) | ||||||||||||
| Policy neutral elasticity ** | 3.6 | |||||||||||||
| * Reflects information as at January 23, 2023 | ||||||||||||||
| ** Per cent growth in current year tax revenue (excluding policy measures) relative to per cent growth in household income (calendar year). | ||||||||||||||
| Corporate income tax * | 10,519 | 5,938 | 6,451 | 6,503 | ||||||||||
| Components of revenue (fiscal year) | ||||||||||||||
| Installments – subject to general rate | 8,528 | 6,879 | 6,735 | 6,757 | ||||||||||
| Installments – subject to small business rate | 435 | 350 | 335 | 336 | ||||||||||
| Non-refundable B.C. tax credits | (232 | ) | (187 | ) | (172 | ) | (177 | ) | ||||||
| Advance installments | 8,731 | 7,042 | 6,898 | 6,916 | ||||||||||
| Prior-year settlement payment | 1,788 | (1,104 | ) | (447 | ) | (413 | ) | |||||||
| Current calendar year assumptions | ||||||||||||||
| National tax base ($ billions) | 620.0 | 547.0 | 565.0 | 572.0 | +/- 1% change in the 2023 national tax base | |||||||||
| B.C. installment share of national tax base | 14.0 | % | 13.6 | % | 13.0 | % | 12.7 | % | equals +/- $70 to $80 million | |||||
| Effective percentage tax rates (% general/small business) | 12.0 / 2.0 | 12.0 / 2.0 | 12.0 / 2.0 | 12.0 / 2.0 | ||||||||||
| Share of the B.C. tax base subject to the small business rate | 24.0 | % | 23.8 | % | 23.0 | % | 23.0 | % | +/- 1 percentage point change in the 2023 small | |||||
| B.C. tax base growth (post federal measures) | 7.5 | % | -7.1 | % | 0.9 | % | 2.6 | % | business share equals -/+ $70 to $80 million | |||||
| B.C. net operating surplus growth | 13.5 | % | -14.5 | % | -7.0 | % | 2.3 | % | ||||||
| 2021 Tax-year | 2021 Assumptions | |||||||||||||
| B.C. tax base growth (post federal measures) | 35.7 | % | ||||||||||||
| Share of the B.C. tax base subject to small business rate | 24.2 | % | +/- 1% change in the 2022 B.C. tax base equals | |||||||||||
| B.C. net operating surplus growth | 26.3 | % | +/- $60 to $80 million one-time effect (prior-year | |||||||||||
| Gross 2021 tax | 6,901 | adjustment) and could result in an additional | ||||||||||||
| Prior-year settlement payment | 1,788 | installments payments of +/- $80 to $100 million | ||||||||||||
| Prior years losses/gains (included in above) | 119 | in 2023/24 | ||||||||||||
| Non-refundable B.C. tax credits | (212 | ) | ||||||||||||
* Reflects information as at January 23, 2023
Cash received from the federal government is used as the basis for estimating revenue. Due to lags in the federal collection and installment systems, changes to the B.C. net operating surplus and tax base forecasts affect revenue in the succeeding year. The 2023/24 installments from the federal government reflects two-third of payments related to the 2023 tax year (paid during Apr-July 2023 and adjusted in Sept and Dec) and one-third of 2024 payments. Installments for the 2023 (2024) tax year are based on B.C.'s share of the national tax base for the 2022 (2023) tax year and a forecast of the 2023 (2024) national tax base. B.C.'s share of the 2021 national tax base was 13.8%, based on tax assessments as of December 31, 2022. Cash adjustments for any under/over payments from the federal government in respect of 2022 will be received/paid on March 31, 2024.
| 148 | | Budget and Fiscal Plan - 2023/24 to 2025/26
|
Appendix
Table A5 Material Assumptions – Revenue (continued)
| Revenue Source and Assumptions ($ millions unless otherwise specified) | Updated Forecast 2022/23 | Budget Estimate 2023/24 | Plan 2024/25 | Plan 2025/26 | 2023/24 Sensitivities | |||||||||
| Employer health tax | 2,675 | 2,731 | 2,874 | 3,000 | ||||||||||
| Employee compensation growth | 11.3 | % | 6.3 | % | 5.2 | % | 4.4 | % | +/- 1 percentage point change in the 2023 employee compensation growth equals up to +/- $25 million | |||||
| Provincial sales tax | 9,693 | 10,187 | 10,584 | 11,038 | ||||||||||
| Provincial sales tax base growth (fiscal year) | 7.5 | % | 3.2 | % | 3.9 | % | 4.3 | % | +/- 1 percentage point change in the | |||||
| Calendar Year nominal expenditure | 2023 consumer expenditure growth | |||||||||||||
| Consumer expenditures on durable goods | -4.3 | % | -3.6 | % | 0.1 | % | 2.6 | % | equals up to +/- $20 to $30 million | |||||
| Consumer expenditures on goods and services | 9.6 | % | 6.9 | % | 4.9 | % | 4.2 | % | ||||||
| Business investment | 11.5 | % | 1.4 | % | 5.5 | % | 7.0 | % | ||||||
| Other | 18.3 | % | 3.4 | % | 2.7 | % | 4.9 | % | ||||||
| Components of Provincial sales tax revenue | +/- 1 percentage point change in the | |||||||||||||
| Consolidated Revenue Fund | 9,686 | 10,178 | 10,575 | 11,029 | 2023 business investment growth | |||||||||
| BC Transportation Financing Authority | 7 | 9 | 9 | 9 | equals up to +/- $10 to $20 million | |||||||||
| Fuel and carbon taxes | 3,272 | 3,883 | 4,107 | 4,446 | ||||||||||
| Calendar Year | ||||||||||||||
| Real GDP | 2.8 | % | 0.4 | % | 1.5 | % | 2.4 | % | ||||||
| Gasoline volumes | 1.8 | % | 0.0 | % | -1.0 | % | -3.0 | % | ||||||
| Diesel volumes | 8.0 | % | 3.0 | % | 2.0 | % | 2.0 | % | ||||||
| Natural gas volumes | 0.5 | % | 1.0 | % | 1.0 | % | 0.0 | % | ||||||
| Carbon tax rates (April 1) | ||||||||||||||
| Carbon dioxide equivalent emissions ($/tonne) | 50 | 65 | 80 | 95 | ||||||||||
| Natural gas (cents/gigajoule) | 248.30 | ¢ | 322.79 | ¢ | 397.28 | ¢ | 471.77 | ¢ | ||||||
| Gasoline (cents/litre) | 11.05 | ¢ | 14.31 | ¢ | 17.61 | ¢ | 20.91 | ¢ | ||||||
| Light fuel oil (cents/litre) | 13.01 | ¢ | 16.85 | ¢ | 20.74 | ¢ | 24.62 | ¢ | ||||||
| Components of revenue * | ||||||||||||||
| Consolidated Revenue Fund | 576 | 582 | 583 | 579 | ||||||||||
| BC Transit | 18 | 18 | 18 | 18 | ||||||||||
| BC Transportation Financing Authority | 467 | 472 | 472 | 466 | ||||||||||
| Fuel tax revenue | 1,061 | 1,072 | 1,073 | 1,063 | ||||||||||
| Carbon tax revenue | 2,211 | 2,811 | 3,034 | 3,383 | ||||||||||
| Property taxes | 3,253 | 3,488 | 3,644 | 3,827 | ||||||||||
| Calendar Year | ||||||||||||||
| Consumer Price Index | 6.9 | % | 3.9 | % | 2.5 | % | 2.2 | % | +/- 1 percentage point change in 2023 new | |||||
| Housing starts (units) | 46,721 | 39,033 | 37,037 | 38,033 | construction & inflation growth equals up to +/- | |||||||||
| Home owner grants (fiscal year) | 892 | 910 | 928 | 947 | $30 million in residential property taxation | |||||||||
| revenue | ||||||||||||||
| Components of revenue | ||||||||||||||
| Residential (net of home owner grants) | 1,330 | 1,434 | 1,536 | 1,611 | ||||||||||
| Speculation and vacancy | 90 | 90 | 90 | 90 | ||||||||||
| Non-residential | 1,457 | 1,566 | 1,590 | 1,679 | +/- 1% change in 2023 total | |||||||||
| Rural area | 139 | 147 | 154 | 157 | business property assessment | |||||||||
| Police | 30 | 37 | 40 | 42 | value equals up to +/- $20 million | |||||||||
| BC Assessment Authority | 105 | 107 | 109 | 108 | in non-residential property | |||||||||
| BC Transit | 102 | 107 | 125 | 140 | taxation revenue | |||||||||
| Other taxes | 3,590 | 3,144 | 3,456 | 3,619 | ||||||||||
| Calendar Year | ||||||||||||||
| Population | 2.2 | % | 2.4 | % | 1.9 | % | 1.7 | % | ||||||
| Residential sales value | -30.3 | % | -19.8 | % | 20.5 | % | 8.2 | % | ||||||
| Real GDP | 2.8 | % | 0.4 | % | 1.5 | % | 2.4 | % | ||||||
| Nominal GDP | 11.0 | % | 2.8 | % | 3.7 | % | 4.2 | % | ||||||
| Components of revenue | +/- 1% change to 2023 residential | |||||||||||||
| Property transfer | 2,250 | 1,799 | 2,101 | 2,254 | sales value equals +/- $20 million | |||||||||
| Additional Property Transfer Tax (included in above) | 82 | 30 | 35 | 60 | in property transfer revenue, | |||||||||
| Tobacco | 565 | 565 | 565 | 565 | depending on property values | |||||||||
| Insurance premium | 775 | 780 | 790 | 800 |
Budget and Fiscal Plan - 2023/24 to 2025/26
| | 149 |
Appendix
Table A5 Material Assumptions – Revenue (continued)
| Revenue Source and Assumptions ($ millions unless otherwise specified) | Updated Forecast 2022/23 | Budget Estimate 2023/24 | Plan 2024/25 | Plan 2025/26 | 2023/24 Sensitivities | |||||||||
| Energy, sales of Crown land tenures, metals, minerals and other * | 3,690 | 3,367 | 2,767 | 2,510 | ||||||||||
| Natural gas price | +/- $0.25 change in the natural gas | |||||||||||||
| Plant inlet, $C/gigajoule | 3.81 | 3.04 | 2.69 | 2.55 | price equals +/- $130 to $150 million, | |||||||||
| Sumas, $US/MMBtu | 4.62 | 3.99 | 3.84 | 3.77 | including impacts on production | |||||||||
| Natural gas production volumes | volumes and royalty program | |||||||||||||
| Billions of cubic metres | 66.3 | 72.2 | 74.0 | 73.8 | credits, but excluding any | |||||||||
| Petajoules | 2,751 | 2,995 | 3,071 | 3,062 | changes from natural gas liquids | |||||||||
| Annual per cent change | 9.8 | % | 8.9 | % | 2.5 | % | -0.3 | % | revenue (e.g. butane, pentanes) | |||||
| Oil price ($US/bbl at Cushing, OK) | 92.07 | 80.79 | 77.47 | 76.22 | Sensitivities can also vary significantly at different price levels | |||||||||
| Auctioned land base (000 hectares) | 11 | 11 | 20 | 20 | +/- 1% change in natural gas volumes equals +/- $20 million | |||||||||
| Average bid price/hectare ($) | 200 | 275 | 300 | 200 | in natural gas royalties | |||||||||
| Cash sales of Crown land tenures | 2 | 3 | 6 | 4 | +/- 1 cent change in the exchange rate | |||||||||
| Metallurgical coal price ($US/tonne, fob Australia) | 318 | 252 | 223 | 204 | equals +/-$1 million in natural gas royalties | |||||||||
| Copper price ($US/lb) | 3.74 | 3.56 | 3.73 | 3.85 | ||||||||||
| Annual electricity volumes set by treaty (million mega-watt hours) | 3.8 | 3.9 | 3.8 | 3.8 | +/- $10/bbl change in petroleum price equals +/- $5 million in petroleum royalties | |||||||||
| Mid-Columbia electricity price | 92.85 | 107.84 | 99.14 | 94.52 | +/- 12% change in natural gas liquids | |||||||||
| ($US/mega-watt hour) | (equivalent to +/- $10/bbl oil price) prices | |||||||||||||
| Exchange rate (US¢/C$, calendar year) | 76.8 | 74.7 | 77.4 | 78.6 | equals +/- $80 to $100 million in natural gas | |||||||||
| liquids royalties | ||||||||||||||
| Components of revenue | ||||||||||||||
| Bonus bid auctions: | +/- US$20 change in the average | |||||||||||||
| Deferred revenue | 81 | 61 | 28 | 28 | metallurgical coal price | |||||||||
| Current-year cash (one-tenth) | - | - | 1 | - | equals +/- $50 to $80 million | |||||||||
| Fees and rentals | 50 | 50 | 49 | 49 | +/- 10% change in the average Mid-Columbia | |||||||||
| Total bonus bids, fees and rentals | 131 | 111 | 78 | 77 | electricity price equals +/- $50 million | |||||||||
| Natural gas royalties after deductions and allowances | 2,206 | 2,016 | 1,648 | 1,518 | ||||||||||
| Petroleum royalties | 48 | 37 | 32 | 29 | ||||||||||
| Columbia River Treaty electricity sales | 478 | 522 | 468 | 463 | ||||||||||
| Oil and Gas Commission fees and levies | 68 | 66 | 67 | 68 | Based on a recommendation from the Auditor | |||||||||
| Coal, metals and other minerals revenue: | General to be consistent with generally | |||||||||||||
| Coal tenures | 8 | 8 | 8 | 8 | accepted accounting principles, bonus bid | |||||||||
| Net coal mineral tax | 608 | 372 | 284 | 180 | revenue recognition reflects ten-year deferral of | |||||||||
| Net metals and other minerals tax | 34 | 47 | 49 | 55 | cash receipts from the sale of Crown land | |||||||||
| Recoveries relating to revenue sharing payments to First Nations | 90 | 170 | 115 | 94 | tenures | |||||||||
| Miscellaneous mining revenue | 19 | 18 | 18 | 18 | ||||||||||
| Total coal, metals and other minerals revenue | 759 | 615 | 474 | 355 | ||||||||||
| Gross royalties prior to deductions and allowances | ||||||||||||||
| Gross natural gas revenue | 2,752 | 1,993 | 1,524 | 1,186 | ||||||||||
| Gross natural gas liquids royalties revenue | 1,030 | 783 | 843 | 1,003 | ||||||||||
| Royalty programs and infrastructure credits | ||||||||||||||
| Deep drilling | (1,147 | ) | (400 | ) | (156 | ) | (85 | ) | ||||||
| Road, pipeline, Clean Growth Infrastructure Royalty and other infrastructure programs | (139 | ) | (95 | ) | (134 | ) | (166 | ) | ||||||
| Total | (1,286 | ) | (495 | ) | (290 | ) | (251 | ) | ||||||
| Implicit average natural gas royalty rate | 21.0 | % | 22.2 | % | 16.8 | % | 14.5 | % |
Royalty program (marginal, low productivity and ultra marginal drilling) adjustments reflect reduced royalty rates.
Natural gas royalties incorporate royalty programs and Treasury Board approved infrastructure credits.
* Reflects information as at January 13, 2023.
| 150 | | Budget and Fiscal Plan - 2023/24 to 2025/26
|
Appendix
Table A5 Material Assumptions – Revenue (continued)
| Revenue Source and Assumptions | Updated Forecast | Budget Estimate | Plan | Plan | ||||||||||
| ($ millions unless otherwise specified) | 2022/23 | 2023/24 | 2024/25 | 2025/26 | 2023/24 Sensitivities | |||||||||
| Forests * | 1,855 | 846 | 830 | 939 | ||||||||||
| Prices (calendar year average) | +/- US$50 change in SPF price equals +/- $100 | |||||||||||||
| SPF 2x4 ($US/thousand board feet) | 814 | 400 | 450 | 500 | to $150 million | |||||||||
| Crown harvest volumes (million cubic metres) | ||||||||||||||
| Interior | 30.0 | 30.0 | 29.9 | 29.7 | +/- 10% change in Interior harvest volumes | |||||||||
| Coast | 9.0 | 8.0 | 8.1 | 8.3 | equals | |||||||||
| Total | 39.0 | 38.0 | 38.0 | 38.0 | +/- $50 to $60 million | |||||||||
| B.C. Timber Sales (included in above) | 6.5 | 6.3 | 6.4 | 7.4 | +/- 10% change in Coastal harvest volumes equals +/- $15 to $25 million | |||||||||
| Stumpage rates ($Cdn/cubic metre) | ||||||||||||||
| Total stumpage rates | 36.20 | 18.07 | 18.96 | 21.82 | +/- 1 cent change in exchange rate equals +/- $25 to $35 million in stumpage revenue | |||||||||
| Components of revenue | ||||||||||||||
| Timber tenures (net of revenue sharing recoveries) | 1,012 | 293 | 333 | 427 | ||||||||||
| Recoveries relating to revenue sharing payments to First Nations | 102 | 138 | 138 | 105 | ||||||||||
| B.C. Timber Sales | 320 | 274 | 268 | 316 | The above sensitivities relate | |||||||||
| Logging tax | 375 | 100 | 50 | 50 | to stumpage revenue only. | |||||||||
| Other CRF revenue | 36 | 30 | 30 | 30 | ||||||||||
| Recoveries | 10 | 11 | 11 | 11 | ||||||||||
| * Reflects information as at January 10, 2023 | ||||||||||||||
| Other natural resource | 519 | 551 | 554 | 556 | ||||||||||
| Components of revenue | ||||||||||||||
| Water rental and licences* | 446 | 478 | 481 | 483 | +/- 5% change in water power production | |||||||||
| Recoveries | 50 | 50 | 50 | 50 | equals +/- $20 to $25 million | |||||||||
| Angling and hunting permits and licences | 10 | 10 | 10 | 10 | ||||||||||
| Recoveries | 13 | 13 | 13 | 13 | ||||||||||
| * Water rentals for power purposes are indexed to Consumer Price Index. | ||||||||||||||
| Total natural resource recoveries relating to revenue sharing payments to First Nations | 204 | 327 | 253 | 199 | Revenue sharing from natural gas royalties, mineral tax and forest stumpage revenues. | |||||||||
| Other revenue | 10,124 | 10,520 | 10,583 | 10,766 | ||||||||||
| Components of revenue | ||||||||||||||
| Fees and licences | ||||||||||||||
| Motor vehicle licences and permits | 614 | 618 | 627 | 636 | ||||||||||
| International student health fees | 80 | 70 | 70 | 70 | ||||||||||
| Other Consolidated Revenue Fund | 509 | 495 | 472 | 491 | ||||||||||
| Summary consolidation eliminations | (15 | ) | (14 | ) | (14 | ) | (14 | ) | ||||||
| Ministry vote recoveries | 190 | 270 | 105 | 105 | ||||||||||
| Taxpayer-supported Crown corporations | 215 | 202 | 201 | 200 | ||||||||||
| Post-secondary education fees | 2,641 | 2,770 | 2,899 | 2,984 | ||||||||||
| Other healthcare-related fees | 494 | 496 | 501 | 502 | ||||||||||
| School Districts | 271 | 275 | 279 | 282 | ||||||||||
| Investment earnings | ||||||||||||||
| Consolidated Revenue Fund | 140 | 130 | 110 | 105 | ||||||||||
| Fiscal agency loans & sinking funds earnings | 928 | 1,088 | 1,108 | 1,126 | ||||||||||
| Summary consolidation eliminations | (135 | ) | (198 | ) | (184 | ) | (189 | ) | ||||||
| Taxpayer-supported Crown corporations | 41 | 36 | 34 | 35 | ||||||||||
| SUCH sector agencies | 316 | 293 | 301 | 312 | ||||||||||
| Sales of goods and services | ||||||||||||||
| SUCH sector agencies | 925 | 986 | 1,048 | 1,100 | ||||||||||
| BC Infrastructure Benefits Inc | 159 | 246 | 270 | 257 | ||||||||||
| Other taxpayer-supported Crown corporations | 247 | 254 | 262 | 265 | ||||||||||
| Miscellaneous | 2,504 | 2,503 | 2,494 | 2,499 | ||||||||||
Budget and Fiscal Plan - 2023/24 to 2025/26
| | 151 |
Appendix
Table A5 Material Assumptions – Revenue (continued)
| Revenue Source and Assumptions ($ millions unless otherwise specified) | Updated Forecast 2022/23 | Budget Estimate 2023/24 | Plan 2024/25 | Plan 2025/26 | 2023/24 Sensitivities | |||||||||
| Health and social transfers | 8,613 | 8,970 | 9,422 | 9,745 | ||||||||||
| National Cash Transfers | ||||||||||||||
| Canada Health Transfer (CHT) | 45,208 | 49,421 | 52,398 | 54,243 | ||||||||||
| Annual growth | 4.8 | % | 9.3 | % | 6.0 | % | 3.5 | % | ||||||
| Canada Social Transfer (CST) | 15,938 | 16,416 | 16,909 | 17,416 | ||||||||||
| B.C.'s share of national population (June 1) | 13.66 | % | 13.62 | % | 13.60 | % | 13.60 | % | +/- 0.1 percentage point change in B.C.'s population share equals +/- $65 million | |||||
| B.C. health and social transfers revenue | ||||||||||||||
| CHT | 6,176 | 6,733 | 7,123 | 7,377 | ||||||||||
| CST | 2,178 | 2,237 | 2,299 | 2,368 | ||||||||||
| Prior-year adjustments: | ||||||||||||||
| CHT | (10 | ) | ||||||||||||
| CST | (3 | ) | ||||||||||||
| CHT top up - reduce or eliminate back-logs of medical and surgical procedures | 272 | |||||||||||||
| Other federal contributions | 3,872 | 4,623 | 3,762 | 3,736 | ||||||||||
| Components of revenue | ||||||||||||||
| COVID-19 related funding: | ||||||||||||||
| Safe Restart Agreement - funding to transit and municipalities | 102 | |||||||||||||
| Safe Return to Class Fund - top up for safe indoor air | 12 | |||||||||||||
| Financial Assistance Agreement to Support Closure and Restoration of Oil and Gas Sites in British Columbia | 62 | - | - | - | ||||||||||
| Total | 176 | - | - | - | ||||||||||
| Disaster Financial Assistance Arrangements | 745 | 1,268 | 643 | 592 | ||||||||||
| B.C.'s share of the federal cannabis excise tax | 70 | 70 | 70 | 70 | ||||||||||
| Other Consolidated Revenue Fund | 222 | 104 | 104 | 103 | ||||||||||
| Vote Recoveries: | ||||||||||||||
| Labour Market Development Agreement | 345 | 296 | 296 | 296 | ||||||||||
| Labour Market and Skills Training Program | 124 | 98 | 98 | 98 | ||||||||||
| Home Care | 82 | 82 | 81 | 81 | ||||||||||
| Mental Health | 82 | 82 | 82 | 82 | ||||||||||
| Child Care | 464 | 822 | 822 | 822 | ||||||||||
| Child Safety, Family Support, Children in Care and with special needs | 83 | 83 | 83 | 83 | ||||||||||
| Public Transit | 82 | 297 | 92 | 135 | ||||||||||
| Local government services and transfers | 195 | 188 | 181 | 120 | ||||||||||
| Other recoveries | 155 | 154 | 155 | 155 | ||||||||||
| Taxpayer-supported Crown corporations | 286 | 324 | 292 | 331 | ||||||||||
| Post-secondary institutions | 636 | 634 | 640 | 644 | ||||||||||
| Other SUCH sector agencies | 125 | 121 | 123 | 124 | ||||||||||
| Service delivery agency direct revenue | 8,654 | 8,981 | 9,210 | 9,421 | ||||||||||
| School districts | 697 | 681 | 683 | 688 | ||||||||||
| Post-secondary institutions | 4,775 | 4,962 | 5,179 | 5,344 | ||||||||||
| Health authorities and hospital societies | 1,188 | 1,165 | 1,173 | 1,179 | ||||||||||
| BC Transportation Financing Authority | 554 | 579 | 583 | 591 | ||||||||||
| Other service delivery agencies | 1,440 | 1,594 | 1,592 | 1,619 |
| 152 | | Budget and Fiscal Plan - 2023/24 to 2025/26
|
Appendix
Table A5 Material Assumptions – Revenue (continued)
| Revenue Source and Assumptions ($ millions unless otherwise specified) | Updated Forecast 2022/23 | Budget Estimate 2023/24 | Plan 2024/25 | Plan 2025/26 | 2023/24 Sensitivities | |||||||||
| Commercial Crown corporation net income | 3,313 | 3,489 | 3,985 | 4,019 | ||||||||||
| BC Hydro | 712 | 712 | 712 | 712 | Sensitivities impacts shown below are before regulatory account transfers | |||||||||
| Reservoir water inflows | 97 | % | 100 | % | 100 | % | 100 | % | +/-1% in hydro generation equals +/- $40 million | |||||
| Mean gas price | 7.21 | 5.08 | 4.51 | 4.43 | +/-1% equals +/-$0.1 million | |||||||||
| (Sumas, $US/MMbtu – BC Hydro forecast based on NYMEX forward selling prices) | ||||||||||||||
| Electricity prices (Mid-C, $US/MWh) | 79.27 | 83.41 | 71.38 | 64.87 | +/-1% change in electricity/gas trade income equals | |||||||||
| ICBC | (298 | ) | - | 450 | 450 | |||||||||
| Vehicle growth | 0.8 | % | 1.9 | % | 1.9 | % | 1.9 | % | +/-1% equals +/-$56 million | |||||
| Current claims cost percentage change | 23.9 | % | 11.8 | % | 9.9 | % | 6.7 | % | +/-1% equals +/-$41 million | |||||
| Unpaid claims balance ($ billions) | 12.5 | 10.4 | 9.0 | 8.3 | +/-1% equals +/-$104 to $125 million | |||||||||
| Investment return | (0.1 | )% | 0.7 | % | 3.6 | % | 3.7 | % | +/-1% return equals +/-$180 to $192 million | |||||
| Loss ratio | 87.0 | % | 84.3 | % | 85.0 | % | 84.7 | % | ||||||
Budget and Fiscal Plan - 2023/24 to 2025/26
| | 153 |
Appendix
Table A6 Natural Gas Price Forecasts – 2023/24 to 2025/26
| Private sector forecasts (calendar year) | 2023 | 2024 | 2025 | 2023/24 | 2024/25 | 2025/26 | ||||||||||||||||||
| GLJ Henry Hub US$/MMBtu (Jan 1, 2023) | 4.71 | 4.50 | 4.27 | 3.40 | 2.85 | 2.62 | ||||||||||||||||||
| Sproule Henry Hub US$/MMBtu (Dec 30, 2022) | 5.00 | 4.50 | 4.25 | 3.77 | 2.84 | 2.60 | ||||||||||||||||||
| McDaniel Henry Hub US$/MMBtu (Jan 1, 2023) | 4.50 | 4.50 | 4.42 | 3.29 | 2.90 | 2.81 | ||||||||||||||||||
| Deloitte Henry Hub US$/Mcf (Dec 30, 2022) | 5.50 | 5.15 | 4.75 | 4.22 | 3.36 | 2.99 | ||||||||||||||||||
| GLJ Alberta AECO-C Spot CDN$/MMBtu (Jan 1, 2023) | 4.36 | 4.77 | 4.47 | 3.18 | 3.30 | 3.10 | ||||||||||||||||||
| Sproule Alberta AECO-C Spot CDN$/MMBtu (Dec 30, 2022) | 4.33 | 4.34 | 4.00 | 3.10 | 2.88 | 2.67 | ||||||||||||||||||
| McDaniel AECO-C Spot C$/MMBtu (Jan 1, 2023) | 4.00 | 4.08 | 4.16 | 2.80 | 2.75 | 2.83 | ||||||||||||||||||
| Deloitte AECO-C Spot C$/Mcf (Dec 30, 2022) | 5.05 | 4.95 | 4.85 | 3.61 | 3.36 | 3.32 | ||||||||||||||||||
| GLJ Sumas Spot US$/MMBtu (Jan 1, 2023) | 5.33 | 4.40 | 4.17 | 3.95 | 3.29 | 3.07 | ||||||||||||||||||
| Sproule Sumas Spot CDN$/MMBtu (Dec 30, 2022) | 6.18 | 6.29 | 6.00 | 4.10 | 3.90 | 3.73 | ||||||||||||||||||
| GLJ BC Spot Plant Gate CDN$/MMBtu (Jan 1, 2023) | 3.83 | 4.29 | 4.03 | 2.96 | 3.15 | 2.98 | ||||||||||||||||||
| Sproule BC Station 2 CDN$/MMBtu (Dec 30, 2022) | 4.18 | 4.23 | 3.89 | 2.99 | 2.80 | 2.59 | ||||||||||||||||||
| McDaniel BC Avg Plant Gate C$MMBtu (Jan 1, 2023) | 3.60 | 3.67 | 3.75 | 2.69 | 2.65 | 2.72 | ||||||||||||||||||
| Deloitte BC Station 2 C$MMBtu (Dec 30, 2022) | 4.65 | 4.50 | 4.50 | 3.61 | 3.36 | 3.29 | ||||||||||||||||||
| GLJ Midwest Chicago US$/MMBtu (Jan 1, 2023) | 4.35 | 4.12 | 4.20 | 3.40 | 2.86 | 2.64 | ||||||||||||||||||
| Sproule Alliance Plant Gate CDN$/MMBtu (Dec 30, 2022) | 6.52 | 5.47 | 5.15 | 4.96 | 3.96 | 3.77 | ||||||||||||||||||
| EIA Henry Hub US$/MMBtu (Dec 2022) | 5.43 | |||||||||||||||||||||||
| TD Economics Henry Hub FuturesUS$/MMBtu (Dec 2022) | 5.80 | 6.04 | 4.64 | |||||||||||||||||||||
| Scotiabank Group Henry Hub US$/MMBtu (Dec 2022) | 4.32 | |||||||||||||||||||||||
| BMO Henry Hub US$/MMBtu (Dec 2022) | 5.50 | |||||||||||||||||||||||
| InSite Petroleum Consultants Ltd BC Spot C$/Mcf (Dec 2022) | 4.75 | 4.50 | 4.35 | 3.30 | 3.09 | 3.00 | ||||||||||||||||||
| NYMEX Forward Market converted to Plant Inlet CDN$/GJ (Jan 4, 2023) | 2.59 | 2.53 | 2.68 | |||||||||||||||||||||
| Average all minus high/low | 3.52 | 3.11 | 2.96 | |||||||||||||||||||||
| Average one forecast per consultant minus high/low | 3.21 | 3.01 | 2.90 | |||||||||||||||||||||
| Natural gas royalty price forecast | 3.04 | 2.69 | 2.55 | |||||||||||||||||||||
GLJ: Gilbert Laustsen Jung Petroleum Consultants Ltd US EIA: US Energy Information Administration AECO: Alberta Energy Company
Deloitte/AJM: Deloitte L.L.P acquired Ashton Jenkins Mann Petroleum Consultants McDaniel: McDaniel & Associates Consultants Ltd
| 154 | | Budget and Fiscal Plan - 2023/24 to 2025/26
|
Appendix
Budget and Fiscal Plan - 2023/24 to 2025/26
| | 155 |
Appendix
Table A7 Material Assumptions – Expense
| Ministry Programs and Assumptions ($ millions unless otherwise specified) | Updated Forecast 2022/23 | Budget Estimate 2023/24 | Plan 2024/25 | Plan 2025/26 | 2023/24 Sensitivities | |||||||||||||
| Attorney General | 708 | 773 | 781 | 778 | ||||||||||||||
| New cases filed/processed | 242,000 | 242,000 | 242,000 | 242,000 | The number of criminal cases proceeded on by the | |||||||||||||
| (# for all courts) | provincial and federal Crown (including appeals to | |||||||||||||||||
| higher courts in BC), the number of civil and family | ||||||||||||||||||
| litigation cases, the number of violation tickets | ||||||||||||||||||
| disputed, and the number of municipal bylaw tickets | ||||||||||||||||||
| disputed which would go to court for resolution. | ||||||||||||||||||
| Crown Proceeding Act (CPA) | 25 | 25 | 25 | 25 | The number of new cases and the difference | |||||||||||||
| between estimated settlements and actual | ||||||||||||||||||
| settlements and in some cases, the impact of | ||||||||||||||||||
| potential legislative changes. | ||||||||||||||||||
| Children and Family Development | 1,741 | 1,912 | 1,930 | 1,926 | ||||||||||||||
| Average children-in-care | 4,952 | 4,852 | 4,817 | 4,738 | The average number of children-in-care is | |||||||||||||
| caseload (#) | decreasing as a result of ministry efforts to keep | |||||||||||||||||
| Average annual residential | 109,248 | 105,337 | 121,815 | 135,233 | children in family settings where safe and feasible. | |||||||||||||
| cost per child in care ($) | The average cost per child in care is projected to | |||||||||||||||||
| increase based on the higher cost of contracted | ||||||||||||||||||
| residential services and an increasing acuity of need | ||||||||||||||||||
| for children in care. A 1% increase in the cost per | ||||||||||||||||||
| case or a 1% increase in the average caseload will | ||||||||||||||||||
| affect expenditures by $2.5 million (excluding | ||||||||||||||||||
| Indigenous CFS Agencies). | ||||||||||||||||||
| Education and Child Care | 8,217 | 8,874 | 9,133 | 9,172 | ||||||||||||||
| Public School Enrolment (# of FTEs) | 583,189 | 591,272 | 600,178 | 607,449 | Updated forecast enrolment figures are based on | |||||||||||||
| School age (K–12) | 560,347 | 568,521 | 577,311 | 584,487 | submissions from school districts of their actual | |||||||||||||
| Continuing Education | 776 | 905 | 905 | 905 | enrolment as at September 30, 2022 for the | |||||||||||||
| Distributed Learning (online) | 13,704 | 13,229 | 13,346 | 13,441 | 2022/23 school year, including February and May | |||||||||||||
| Summer | 6,288 | 6,288 | 6,288 | 6,288 | enrolment counts. Projections are based on the | |||||||||||||
| Adults | 2,073 | 2,328 | 2,328 | 2,328 | Ministry of Education and Child Care's enrolment | |||||||||||||
| forecasting model. | ||||||||||||||||||
| Emergency Management and Climate Readiness | 479 | 101 | 111 | 120 | ||||||||||||||
| Emergency Program Act (EPA) | 436 | 36 | 36 | 36 | Emergency disaster relief is unpredictable by | |||||||||||||
| nature.There are a number of factors that could | ||||||||||||||||||
| impact the timing of delivering recovery projects | ||||||||||||||||||
| resulting from the Major Events. | ||||||||||||||||||
| Forests | 1,048 | 925 | 905 | 913 | ||||||||||||||
| BC Timber Sales | 207 | 237 | 235 | 243 | Targets can be impacted by changes to actual inventory | |||||||||||||
| costs incurred. There is a lag of approximately 1.5 years | ||||||||||||||||||
| between when inventory costs are incurred and when | ||||||||||||||||||
| they are expensed. Volume harvested can also impact | ||||||||||||||||||
| targets. For example, if volume harvested is less than | ||||||||||||||||||
| projected in any year, then capitalized expenses will also | ||||||||||||||||||
| be reduced in that year. | ||||||||||||||||||
| Fire Management | 418 | 204 | 205 | 205 | Costs are driven by length of season and severity of | |||||||||||||
| weather conditions, severity of fires, proportion of | ||||||||||||||||||
| interface fires and size of fires. Costs have ranged | ||||||||||||||||||
| from a low of $47 million in 2006 to a high of | ||||||||||||||||||
| $809 million in 2021. | ||||||||||||||||||
| Health | 25,460 | 28,674 | 29,887 | 30,669 | ||||||||||||||
| Pharmacare | 1,514 | 1,578 | 1,610 | 1,597 | A 1% change in PharmaCare utilization or prices | |||||||||||||
| affects costs by approximately $12 million. | ||||||||||||||||||
| Medical Services Plan (MSP) | 6,069 | 7,039 | 7,340 | 7,281 | A 1% increase in volume of services provided by | |||||||||||||
| fee-for-service physicians expenditures is | ||||||||||||||||||
| approximately $35 million. | ||||||||||||||||||
| Regional Services | 17,544 | 19,671 | 20,534 | 21,403 | A 1% increase in volume of services provided by | |||||||||||||
| Health Authorities is estimated to be $186 million. | ||||||||||||||||||

| 156 | | Budget and Fiscal Plan - 2023/24 to 2025/26
|
Appendix
Table A7 Material Assumptions – Expense (continued)
| Ministry Programs and Assumptions | Updated | Budget | ||||||||||||||||
| ($ millions unless otherwise specified) | Forecast 2022/23 | Estimate 2023/24 | Plan 2024/25 | Plan 2025/26 | 2023/24 Sensitivities | |||||||||||||
| Post-Secondary Education and Future Skills | 2,616 | 2,770 | 2,815 | 2,837 | ||||||||||||||
| Student spaces in public institutions | 195,117 | 206,085 | 205,886 | 206,048 | Student enrolments may fluctuate due to a number | |||||||||||||
| of factors including economic changes and labour | ||||||||||||||||||
| market needs. | ||||||||||||||||||
| Public Safety and Solicitor General | 913 | 1,028 | 1,034 | 1,033 | ||||||||||||||
| Policing, Victim Services and | 806 | 909 | 913 | 913 | Policing, Victim Services and Corrections costs are | |||||||||||||
| Corrections | sensitive to the volume and severity of criminal | |||||||||||||||||
| activity, the number of inmate beds occupied and | ||||||||||||||||||
| the number of offenders under community supervision. | ||||||||||||||||||
| Social Development and Poverty Reduction | 4,451 | 4,745 | 4,861 | 4,927 | ||||||||||||||
| Temporary Assistance | 51,705 | 47,500 | 45,200 | 44,400 | The expected to work caseload is sensitive to | |||||||||||||
| annual average caseload (#) | fluctuations in economic and employment trends. | |||||||||||||||||
| Costs are driven by changes to cost per case and | ||||||||||||||||||
| caseload. Cost per case fluctuations result from | ||||||||||||||||||
| changes in the needed supports required by clients, | ||||||||||||||||||
| as well as caseload composition. | ||||||||||||||||||
| Disability Assistance | 118,831 | 121,600 | 125,000 | 126,700 | The caseload for persons with disabilities is | |||||||||||||
| annual average caseload (#) | sensitive to the aging of the population and longer | |||||||||||||||||
| life expectancy for individuals with disabilities. Cost | ||||||||||||||||||
| per case fluctuations are driven primarily by | ||||||||||||||||||
| earnings exemptions which is dependent on the | ||||||||||||||||||
| level of income earned by clients. | ||||||||||||||||||
| Adult Community Living: | ||||||||||||||||||
| Developmental Disabilities Programs | The adult community living caseload is sensitive to | |||||||||||||||||
| Average caseload (#) | 23,380 | 24,330 | 25,320 | 26,350 | an aging population and to the level of service | |||||||||||||
| Average cost per client ($) | 53,300 | 53,600 | 52,400 | 51,800 | required. Cost per case fluctuations are driven by | |||||||||||||
| Personal Supports Initiative (PSI) | the proportion of clients receiving certain types of | |||||||||||||||||
| Average caseload (#) | 2,940 | 3,240 | 3,550 | 3,860 | services at differing costs. For example, residential | |||||||||||||
| Average cost per client ($) | 16,000 | 15,200 | 14,300 | 13,700 | care services are significantly more costly than day programs. | |||||||||||||
Budget and Fiscal Plan - 2023/24 to 2025/26
| | 157 |
Appendix
Table A7 Material Assumptions – Expense (continued)
| Ministry Programs and Assumptions ($ millions unless otherwise specified) | Updated Forecast 2022/23 | Budget Estimate 2023/24 | Plan 2024/25 | Plan 2025/26 | 2023/24 Sensitivities | |||||||||||||
| Tax Transfers | 4,066 | 3,159 | 3,561 | 3,964 | ||||||||||||||
| Individuals | 2,793.0 | 1,815.0 | 2,113.0 | 2,413.0 | ||||||||||||||
| Climate Action Tax Credit | 340.0 | 757.0 | 1,032.0 | 1,323.0 | These tax transfers are now expensed as required | |||||||||||||
| BC Family Benefit | 405.0 | 463.0 | 482.0 | 485.0 | under generally accepted accounting principles. | |||||||||||||
| Affordability measures* | 1,600.0 | - | - | - | ||||||||||||||
| Renter's Tax Credit | 77.0 | 309.0 | 313.0 | 319.0 | ||||||||||||||
| Sales Tax | 32.6 | 50.0 | 50.0 | 50.0 | ||||||||||||||
| Small Business Venture Capital | 44.4 | 40.0 | 40.0 | 40.0 | ||||||||||||||
| BC Senior's Home Renovation | 2.7 | 3.0 | 3.0 | 3.0 | Changes in 2022 tax transfers will result in one-time | |||||||||||||
| Other tax transfers to individuals | 291.3 | 193.0 | 193.0 | 193.0 | effect (prior-year adjustment) and could result in an | |||||||||||||
| additional base change in 2023/24. Production | ||||||||||||||||||
| Corporations | 1,273.0 | 1,344.0 | 1,448.0 | 1,551.0 | services tax credit is the most volatile of all tax | |||||||||||||
| Film and Television | 166.1 | 152.5 | 162.5 | 170.0 | transfers and is influenced by several factors | |||||||||||||
| Production Services | 774.8 | 890.3 | 979.5 | 1,070.0 | including delay in filing returns and assessment of | |||||||||||||
| Scientific Research & Experimental Development | 84.2 | 96.2 | 101.0 | 106.0 | claims, length of projects and changes in the exchange rates. | |||||||||||||
| Interactive Digital Media | 135.7 | 110.0 | 110.0 | 110.0 | ||||||||||||||
| Mining Exploration | 35.1 | 30.0 | 30.0 | 30.0 | ||||||||||||||
| Other tax transfers to corporations | 77.1 | 65.0 | 65.0 | 65.0 | ||||||||||||||
| Prior-year adjustment (included above)** | ||||||||||||||||||
| Individuals | 84.8 | |||||||||||||||||
| Corporations | 51.9 | |||||||||||||||||
| 2021 Tax-year | 2021 Assumptions | |||||||||||||||||
| Tax Transfers | 2,027.2 | |||||||||||||||||
| Individuals | 1,033.1 | |||||||||||||||||
| Corporations | 994.1 | |||||||||||||||||
| Film and Television | 128.6 | |||||||||||||||||
| Production Services | 612.5 | |||||||||||||||||
| Scientific Research & Experimental Development | 85.5 | |||||||||||||||||
| Interactive Digital Media | 98.2 | |||||||||||||||||
| Other tax transfers to corporations | 69.3 | |||||||||||||||||
*Affordability measures include one time payments for Climate Action tax credit ($1.5 billion) and BC Family Benefit ($100 million).
**2022/23 tax transfer forecast incorporates adjustments relating to prior years.
| Management of Public Funds and Debt | 1,268 | 1,309 | 1,593 | 1,866 | ||||||||||||||
| Interest rates for new provincial borrowing: | Full year impact on MoPD on interest costs of a 1% | |||||||||||||||||
| Short-term | 3.31 | % | 4.04 | % | 3.01 | % | 2.61 | % | change in interest rates equals $61 million; | |||||||||
| Long-term | 4.14 | % | 4.10 | % | 4.05 | % | 3.97 | % | $100 million increase in debt level equals | |||||||||
| CDN/US exchange rate (cents) | 132.2 | 132.6 | 128.5 | 127.1 | $4.1 million. | |||||||||||||
| Service delivery agency net spending | 8,881 | 9,176 | 9,675 | 10,070 | ||||||||||||||
| School districts | 565 | 557 | 549 | 540 | ||||||||||||||
| Post-secondary institutions | 4,597 | 4,795 | 4,933 | 5,146 | ||||||||||||||
| Health authorities and hospital societies | 1,224 | 1,103 | 1,110 | 1,113 | Agency expenses, net of Provincial funding. These | |||||||||||||
| BC Transportation Financing Authority | 1,594 | 1,887 | 2,267 | 2,391 | are mainly funded through revenue from other sources. | |||||||||||||
| BC Infrastructure Benefits Inc | 159 | 246 | 270 | 256 | ||||||||||||||
| Other service delivery agencies | 742 | 588 | 546 | 624 |
| 158 | | Budget and Fiscal Plan - 2023/24 to 2025/26
|
Appendix
Table A8 Operating Statement – 2016/17 to 2025/26
| ($ millions) | Actual 2016/17 | Actual 2017/18 | Actual 2018/19 | Actual 2019/20 | Actual 2020/21 | Actual 2021/22 | Updated Forecast 2022/23 | Budget Estimate 2023/24 | Plan 2024/25 | Plan 2025/26 | Average annual change | |||||||||||||||||||||||||||||||||
| �� | (per cent) | |||||||||||||||||||||||||||||||||||||||||||
| Revenue | 51,449 | 52,020 | 57,128 | 58,660 | 62,156 | 72,392 | 82,700 | 77,690 | 79,724 | 82,223 | 5.3 | |||||||||||||||||||||||||||||||||
| Expense | (48,684 | ) | (51,707 | ) | (55,597 | ) | (58,982 | ) | (67,624 | ) | (71,086 | ) | (79,108 | ) | (81,206 | ) | (82,978 | ) | (84,766 | ) | 6.4 | |||||||||||||||||||||||
| Surplus (deficit) before forecast allowance | 2,765 | 313 | 1,531 | (322 | ) | (5,468 | ) | 1,306 | 3,592 | (3,516 | ) | (3,254 | ) | (2,543 | ) | |||||||||||||||||||||||||||||
| Forecast allowance | - | - | - | - | - | - | (700 | ) | (500 | ) | (500 | ) | ||||||||||||||||||||||||||||||||
| Surplus (deficit) | 2,765 | 313 | 1,531 | (322 | ) | (5,468 | ) | 1,306 | 3,592 | (4,216 | ) | (3,754 | ) | (3,043 | ) | |||||||||||||||||||||||||||||
| Per cent of nominal GDP: 1 | ||||||||||||||||||||||||||||||||||||||||||||
| Surplus (deficit) | 1.0 | 0.1 | 0.5 | -0.1 | -1.8 | 0.4 | 0.9 | -1.1 | -0.9 | -0.7 | ||||||||||||||||||||||||||||||||||
| Per cent of revenue: | ||||||||||||||||||||||||||||||||||||||||||||
| Surplus (deficit) | 5.4 | 0.6 | 2.7 | -0.5 | -8.8 | 1.8 | 4.3 | -5.4 | -4.7 | -3.7 | ||||||||||||||||||||||||||||||||||
| Per capita ($): 2 | ||||||||||||||||||||||||||||||||||||||||||||
| Surplus (deficit) | 569 | 63 | 306 | (63 | ) | (1,061 | ) | 251 | 675 | (774 | ) | (676 | ) | (539 | ) | |||||||||||||||||||||||||||||
| 1 | Surplus (deficit) as a per cent of nominal GDP is calculated using nominal GDP for the calendar year ending in the fiscal year (e.g. 2023/24 amounts divided by nominal GDP for the 2023 calendar year). | |
| 2 | Per capita revenue and expense is calculated using July 1 population (e.g. 2023/24 amounts divided by population on July 1, 2023). |
Budget and Fiscal Plan - 2023/24 to 2025/26
| | 159 |
Appendix
Table A9 Revenue by Source – 2016/17 to 2025/26
| ($ millions) | Actual 2016/17 | Actual 2017/18 | Actual 2018/19 | Actual 2019/20 | Actual 2020/21 | Actual 2021/22 | Updated Forecast 2022/23 | Budget Estimate 2023/24 | Plan 2024/25 | Plan 2025/26 | Average annual change | |||||||||||||||||||||||||||||||||
| (per cent) | ||||||||||||||||||||||||||||||||||||||||||||
| Taxation revenue: | ||||||||||||||||||||||||||||||||||||||||||||
| Personal income | 9,704 | 8,923 | 11,364 | 10,657 | 11,118 | 13,704 | 17,712 | 15,953 | 16,705 | 17,519 | 6.8 | |||||||||||||||||||||||||||||||||
| Corporate income | 3,003 | 4,165 | 5,180 | 5,011 | 4,805 | 5,053 | 10,519 | 5,938 | 6,451 | 6,503 | 9.0 | |||||||||||||||||||||||||||||||||
| Employer health | - | - | 464 | 1,897 | 2,156 | 2,443 | 2,675 | 2,731 | 2,874 | 3,000 | n/a | |||||||||||||||||||||||||||||||||
| Sales | 6,606 | 7,131 | 7,369 | 7,374 | 7,694 | 8,731 | 9,693 | 10,187 | 10,584 | 11,038 | 5.9 | |||||||||||||||||||||||||||||||||
| Fuel | 969 | 1,010 | 1,015 | 1,008 | 936 | 1,022 | 1,061 | 1,072 | 1,073 | 1,063 | 1.0 | |||||||||||||||||||||||||||||||||
| Carbon | 1,220 | 1,255 | 1,465 | 1,682 | 1,683 | 2,011 | 2,211 | 2,811 | 3,034 | 3,383 | 12.0 | |||||||||||||||||||||||||||||||||
| Tobacco | 737 | 727 | 781 | 729 | 711 | 708 | 565 | 565 | 565 | 565 | -2.9 | |||||||||||||||||||||||||||||||||
| Property | 2,279 | 2,367 | 2,617 | 2,608 | 2,313 | 3,012 | 3,253 | 3,488 | 3,644 | 3,827 | 5.9 | |||||||||||||||||||||||||||||||||
| Property transfer | 2,026 | 2,141 | 1,826 | 1,609 | 2,098 | 3,327 | 2,250 | 1,799 | 2,101 | 2,254 | -1.2 | |||||||||||||||||||||||||||||||||
| Insurance premium | 549 | 602 | 633 | 691 | 652 | 706 | 775 | 780 | 790 | 800 | 4.3 | |||||||||||||||||||||||||||||||||
| 27,093 | 28,321 | 32,714 | 33,266 | 34,166 | 40,717 | 50,714 | 45,324 | 47,821 | 49,952 | 7.0 | ||||||||||||||||||||||||||||||||||
| Natural resource revenue: | ||||||||||||||||||||||||||||||||||||||||||||
| Natural gas royalties | 152 | 161 | 199 | 118 | 196 | 920 | 2,206 | 2,016 | 1,648 | 1,518 | 29.1 | |||||||||||||||||||||||||||||||||
| Bonus bids, rents on drilling rights and leases | 633 | 276 | 279 | 225 | 162 | 133 | 131 | 111 | 78 | 77 | -20.9 | |||||||||||||||||||||||||||||||||
| Columbia River Treaty | 111 | 111 | 202 | 119 | 117 | 231 | 478 | 522 | 468 | 463 | 17.2 | |||||||||||||||||||||||||||||||||
| Other energy and minerals | 403 | 619 | 557 | 386 | 191 | 795 | 875 | 718 | 573 | 452 | 1.3 | |||||||||||||||||||||||||||||||||
| Forests | 913 | 1,065 | 1,406 | 988 | 1,304 | 1,893 | 1,855 | 846 | 830 | 939 | 0.3 | |||||||||||||||||||||||||||||||||
| Other resources | 499 | 463 | 465 | 432 | 433 | 499 | 519 | 551 | 554 | 556 | 1.2 | |||||||||||||||||||||||||||||||||
| 2,711 | 2,695 | 3,108 | 2,268 | 2,403 | 4,471 | 6,064 | 4,764 | 4,151 | 4,005 | 4.4 | ||||||||||||||||||||||||||||||||||
| Other revenue: | ||||||||||||||||||||||||||||||||||||||||||||
| Medical Services Plan premiums | 2,558 | 2,266 | 1,360 | 1,063 | (4 | ) | 1 | - | - | - | - | n/a | ||||||||||||||||||||||||||||||||
| Post-secondary education fees | 1,828 | 2,034 | 2,275 | 2,451 | 2,418 | 2,536 | 2,641 | 2,770 | 2,899 | 2,984 | 5.6 | |||||||||||||||||||||||||||||||||
| Other health-care related fees | 404 | 429 | 441 | 475 | 372 | 417 | 494 | 496 | 501 | 502 | 2.4 | |||||||||||||||||||||||||||||||||
| Motor vehicle licences and permits | 529 | 557 | 568 | 579 | 571 | 610 | 614 | 618 | 627 | 636 | 2.1 | |||||||||||||||||||||||||||||||||
| Other fees and licences | 894 | 963 | 949 | 1,004 | 972 | 1,020 | 1,250 | 1,298 | 1,113 | 1,134 | 2.7 | |||||||||||||||||||||||||||||||||
| Investment earnings | 1,232 | 1,101 | 1,243 | 1,263 | 1,264 | 1,306 | 1,290 | 1,349 | 1,369 | 1,389 | 1.3 | |||||||||||||||||||||||||||||||||
| Sales of goods and services | 1,131 | 1,133 | 1,164 | 1,162 | 741 | 1,059 | 1,331 | 1,486 | 1,580 | 1,622 | 4.1 | |||||||||||||||||||||||||||||||||
| Miscellaneous | 2,377 | 2,410 | 2,249 | 2,676 | 2,395 | 2,851 | 2,504 | 2,503 | 2,494 | 2,499 | 0.6 | |||||||||||||||||||||||||||||||||
| 10,953 | 10,893 | 10,249 | 10,673 | 8,729 | 9,800 | 10,124 | 10,520 | 10,583 | 10,766 | -0.2 | ||||||||||||||||||||||||||||||||||
| Contributions from the federal government: | ||||||||||||||||||||||||||||||||||||||||||||
| Canada Health Transfer | 4,744 | 4,994 | 5,182 | 5,523 | 5,701 | 6,431 | 6,439 | 6,733 | 7,123 | 7,377 | 5.0 | |||||||||||||||||||||||||||||||||
| Canada Social Transfer | 1,751 | 1,854 | 1,908 | 1,971 | 2,042 | 2,110 | 2,174 | 2,237 | 2,299 | 2,368 | 3.4 | |||||||||||||||||||||||||||||||||
| Other cost shared agreements | 1,672 | 2,207 | 1,962 | 2,041 | 5,151 | 3,439 | 3,872 | 4,623 | 3,762 | 3,736 | 9.3 | |||||||||||||||||||||||||||||||||
| 8,167 | 9,055 | 9,052 | 9,535 | 12,894 | 11,980 | 12,485 | 13,593 | 13,184 | 13,481 | 5.7 | ||||||||||||||||||||||||||||||||||
| Commercial Crown corporation net income: | ||||||||||||||||||||||||||||||||||||||||||||
| BC Hydro1 | 684 | 683 | (428 | ) | 705 | 688 | 668 | 712 | 712 | 712 | 712 | 0.4 | ||||||||||||||||||||||||||||||||
| Liquor Distribution Branch | 1,083 | 1,119 | 1,104 | 1,107 | 1,161 | 1,189 | 1,179 | 1,150 | 1,170 | 1,194 | 1.1 | |||||||||||||||||||||||||||||||||
| BC Lottery Corporation 2 | 1,329 | 1,391 | 1,405 | 1,336 | 420 | 1,211 | 1,574 | 1,456 | 1,478 | 1,484 | 1.2 | |||||||||||||||||||||||||||||||||
| ICBC | (612 | ) | (1,327 | ) | (1,153 | ) | (376 | ) | 1,528 | 2,216 | (298 | ) | - | 450 | 450 | -196.6 | ||||||||||||||||||||||||||||
| Transportation Investment Corporation | (81 | ) | (29 | ) | - | - | - | - | - | - | - | - | n/a | |||||||||||||||||||||||||||||||
| Other | 122 | 169 | 127 | 146 | 167 | 140 | 146 | 171 | 175 | 179 | 4.4 | |||||||||||||||||||||||||||||||||
| Accounting adjustment 1 | - | (950 | ) | 950 | - | - | - | - | - | - | n/a | |||||||||||||||||||||||||||||||||
| 2,525 | 1,056 | 2,005 | 2,918 | 3,964 | 5,424 | 3,313 | 3,489 | 3,985 | 4,019 | 5.3 | ||||||||||||||||||||||||||||||||||
| Total revenue | 51,449 | 52,020 | 57,128 | 58,660 | 62,156 | 72,392 | 82,700 | 77,690 | 79,724 | 82,223 | 5.3 | |||||||||||||||||||||||||||||||||
| 1 | BC Hydro's loss for 2018/19 includes a write-off of a regulatory account. At the summary level, the Province recognized a $950 million adjustment in fiscal 2017/18 with respect to BC Hydro's deferred regulatory accounts. | |
| 2 | Net of payments to the federal government and beginning in 2021/22 , is also net of payments to the BC First Nations Gaming Revenue Sharing Limited Partnership in accordance with section 14.3 of the Gaming Control Act (B.C.) |
| 160 | | Budget and Fiscal Plan - 2023/24 to 2025/26
|
Appendix
Table A10 Revenue by Source Supplementary Information – 2016/17 to 2025/26 1
| Actual 2016/17 | Actual 2017/18 | Actual 2018/19 | Actual 2019/20 | Actual 2020/21 | Actual 2021/22 | Updated Forecast 2022/23 | Budget Estimate 2023/24 | Plan 2024/25 | Plan 2025/26 | Average annual change | ||||||||||||||||||||||||||||||||||
| (per cent) | ||||||||||||||||||||||||||||||||||||||||||||
| Per cent of nominal GDP: 2 | ||||||||||||||||||||||||||||||||||||||||||||
| Taxation and Medical Services Plan premiums | 11.2 | 10.8 | 11.5 | 11.1 | 11.1 | 11.6 | 13.0 | 11.3 | 11.5 | 11.6 | 0.3 | |||||||||||||||||||||||||||||||||
| Natural resources | 1.0 | 1.0 | 1.0 | 0.7 | 0.8 | 1.3 | 1.6 | 1.2 | 1.0 | 0.9 | -1.1 | |||||||||||||||||||||||||||||||||
| Other | 4.2 | 3.9 | 3.4 | 3.5 | 2.8 | 2.8 | 2.6 | 2.6 | 2.6 | 2.5 | -5.5 | |||||||||||||||||||||||||||||||||
| Other excluding Medical Services Plan premiums | 3.2 | 3.1 | 3.0 | 3.1 | 2.8 | 2.8 | 2.6 | 2.6 | 2.6 | 2.5 | -2.7 | |||||||||||||||||||||||||||||||||
| Contributions from the federal government | 3.1 | 3.2 | 3.0 | 3.1 | 4.2 | 3.4 | 3.2 | 3.4 | 3.2 | 3.1 | 0.1 | |||||||||||||||||||||||||||||||||
| Commercial Crown corporation net income | 1.0 | 0.4 | 0.7 | 0.9 | 1.3 | 1.5 | 0.9 | 0.9 | 1.0 | 0.9 | -0.3 | |||||||||||||||||||||||||||||||||
| Total revenue | 19.5 | 18.4 | 19.2 | 19.0 | 20.3 | 20.6 | 21.3 | 19.4 | 19.2 | 19.0 | -0.3 | |||||||||||||||||||||||||||||||||
| Growth rates (per cent): | ||||||||||||||||||||||||||||||||||||||||||||
| Taxation and Medical Services Plan premiums | 10.8 | 3.2 | 11.4 | 0.7 | -0.5 | 19.2 | 24.5 | -10.6 | 5.5 | 4.5 | n/a | |||||||||||||||||||||||||||||||||
| Natural resources | 5.4 | -0.6 | 15.3 | -27.0 | 6.0 | 86.1 | 35.6 | -21.4 | -12.9 | -3.5 | n/a | |||||||||||||||||||||||||||||||||
| Other | 5.9 | -0.5 | -5.9 | 4.1 | -18.2 | 12.3 | 3.3 | 3.9 | 0.6 | 1.7 | n/a | |||||||||||||||||||||||||||||||||
| Other excluding Medical Services Plan premiums | 6.1 | 2.8 | 3.0 | 8.1 | -9.1 | 12.2 | 3.3 | 3.9 | 0.6 | 1.7 | n/a | |||||||||||||||||||||||||||||||||
| Contributions from the federal government | 6.8 | 10.9 | 0.0 | 5.3 | 35.2 | -7.1 | 4.2 | 8.9 | -3.0 | 2.3 | n/a | |||||||||||||||||||||||||||||||||
| Commercial Crown corporation net income | -6.8 | -58.2 | 89.9 | 45.5 | 35.8 | 36.8 | -38.9 | 5.3 | 14.2 | 0.9 | n/a | |||||||||||||||||||||||||||||||||
| Total revenue | 8.1 | 1.1 | 9.8 | 2.7 | 6.0 | 16.5 | 14.2 | -6.1 | 2.6 | 3.1 | n/a | |||||||||||||||||||||||||||||||||
| Per capita ($): 3 | ||||||||||||||||||||||||||||||||||||||||||||
| Taxation and Medical Services Plan premiums | 6,102 | 6,205 | 6,801 | 6,738 | 6,626 | 7,827 | 9,534 | 8,318 | 8,613 | 8,845 | 4.2 | |||||||||||||||||||||||||||||||||
| Natural resources | 558 | 547 | 620 | 445 | 466 | 859 | 1,140 | 874 | 748 | 709 | 2.7 | |||||||||||||||||||||||||||||||||
| Other | 2,254 | 2,210 | 2,046 | 2,095 | 1,693 | 1,884 | 1,903 | 1,931 | 1,906 | 1,906 | -1.8 | |||||||||||||||||||||||||||||||||
| Other excluding Medical Services Plan premiums | 1,728 | 1,750 | 1,774 | 1,886 | 1,694 | 1,884 | 1,903 | 1,931 | 1,906 | 1,906 | 1.1 | |||||||||||||||||||||||||||||||||
| Contributions from the federal government | 1,681 | 1,837 | 1,807 | 1,872 | 2,501 | 2,303 | 2,347 | 2,495 | 2,375 | 2,387 | 4.0 | |||||||||||||||||||||||||||||||||
| Commercial Crown corporation net income | 520 | 214 | 400 | 573 | 769 | 1,043 | 623 | 640 | 718 | 712 | 3.6 | |||||||||||||||||||||||||||||||||
| Total revenue | 10,588 | 10,553 | 11,402 | 11,514 | 12,056 | 13,915 | 15,547 | 14,258 | 14,360 | 14,560 | 3.6 | |||||||||||||||||||||||||||||||||
| Real Per Capita Revenue (2022 $) 4 | 12,586 | 12,284 | 12,920 | 12,749 | 13,249 | 14,876 | 15,547 | 13,729 | 13,488 | 13,384 | 0.7 | |||||||||||||||||||||||||||||||||
| Growth rate (per cent) | 4.3 | -2.4 | 5.2 | -1.3 | 3.9 | 12.3 | 4.5 | -11.7 | -1.8 | -0.8 | 1.2 | |||||||||||||||||||||||||||||||||
| 1 | Numbers may not add due to rounding. |
| 2 | Revenue as a per cent of GDP is calculated using nominal GDP for the calendar year ending in the fiscal year (e.g. 2023/24 revenue divided by nominal GDP for the 2023 calendar year). |
| 3 | Per capita revenue is calculated using July 1 population (e.g. 2023/24 revenue divided by population on July 1, 2023). |
| 4 | Revenue is converted to real (inflation-adjusted) terms using the consumer price index (CPI) for the corresponding calendar year (e.g. 2023 CPI for 2023/24 revenue). |
Budget and Fiscal Plan - 2023/24 to 2025/26
| | 161 |
Appendix
Table A11 Expense by Function – 2016/17 to 2025/261,2
| ($ millions) | Actual 2016/17 | Actual 2017/18 | Actual 2018/19 | Actual 2019/20 | Actual 2020/21 | Actual 2021/22 | Updated Forecast 2022/23 | Budget Estimate 2023/24 | Plan 2024/25 | Plan 2025/26 | Average annual change | |||||||||||||||||||||||||||||||||
| (per cent) | ||||||||||||||||||||||||||||||||||||||||||||
| Function:: | ||||||||||||||||||||||||||||||||||||||||||||
| Health: | ||||||||||||||||||||||||||||||||||||||||||||
| Medical Services Plan | 4,573 | 4,623 | 4,861 | 5,013 | 5,145 | 5,776 | 6,111 | 7,081 | 7,382 | 7,323 | 5.4 | |||||||||||||||||||||||||||||||||
| Pharmacare | 1,284 | 1,400 | 1,494 | 1,517 | 1,501 | 1,579 | 1,664 | 1,728 | 1,760 | 1,747 | 3.5 | |||||||||||||||||||||||||||||||||
| Regional services | 13,079 | 14,094 | 14,996 | 16,047 | 18,282 | 19,567 | 19,339 | 21,177 | 22,007 | 22,935 | 6.4 | |||||||||||||||||||||||||||||||||
| Other healthcare expenses | 753 | 810 | 800 | 872 | 677 | 662 | 858 | 941 | 970 | 954 | 2.7 | |||||||||||||||||||||||||||||||||
| Total health | 19,689 | 20,927 | 22,151 | 23,449 | 25,605 | 27,584 | 27,972 | 30,927 | 32,119 | 32,959 | 5.9 | |||||||||||||||||||||||||||||||||
| Education: | ||||||||||||||||||||||||||||||||||||||||||||
| Elementary and secondary | 6,422 | 6,918 | 7,253 | 7,583 | 7,443 | 8,084 | 8,340 | 8,970 | 9,194 | 9,230 | 4.1 | |||||||||||||||||||||||||||||||||
| Post-secondary | 5,673 | 5,998 | 6,394 | 6,842 | 6,868 | 7,352 | 7,835 | 8,227 | 8,513 | 8,751 | 4.9 | |||||||||||||||||||||||||||||||||
| Other education expenses | 374 | 176 | 442 | 310 | 632 | 359 | 440 | 403 | 401 | 402 | 0.8 | |||||||||||||||||||||||||||||||||
| Total education | 12,469 | 13,092 | 14,089 | 14,735 | 14,943 | 15,795 | 16,615 | 17,600 | 18,108 | 18,383 | 4.4 | |||||||||||||||||||||||||||||||||
| Social services: | ||||||||||||||||||||||||||||||||||||||||||||
| Social assistance | 1,692 | 1,988 | 2,202 | 2,342 | 3,141 | 2,910 | 2,866 | 3,010 | 3,090 | 3,114 | 7.0 | |||||||||||||||||||||||||||||||||
| Child welfare | 1,358 | 1,507 | 1,652 | 1,940 | 2,226 | 2,254 | 3,213 | 3,784 | 3,856 | 3,854 | 12.3 | |||||||||||||||||||||||||||||||||
| Low income tax credit transfers | 244 | 239 | 414 | 435 | 1,131 | 754 | 1,969 | 807 | 1,082 | 1,373 | 21.2 | |||||||||||||||||||||||||||||||||
| Community living and other services | 949 | 1,003 | 1,075 | 1,170 | 1,291 | 1,350 | 1,460 | 1,557 | 1,579 | 1,622 | 6.1 | |||||||||||||||||||||||||||||||||
| Total social services | 4,243 | 4,737 | 5,343 | 5,887 | 7,789 | 7,268 | 9,508 | 9,158 | 9,607 | 9,963 | 9.9 | |||||||||||||||||||||||||||||||||
| Protection of persons and property | 1,655 | 1,930 | 2,004 | 2,126 | 2,258 | 2,937 | 2,711 | 2,324 | 2,340 | 2,351 | 4.0 | |||||||||||||||||||||||||||||||||
| Transportation | 1,784 | 1,931 | 2,021 | 2,126 | 3,360 | 4,453 | 2,867 | 2,616 | 2,550 | 2,608 | 4.3 | |||||||||||||||||||||||||||||||||
| Natural resources & economic development | 2,465 | 3,374 | 3,825 | 3,778 | 4,191 | 5,213 | 4,476 | 4,432 | 4,282 | 4,335 | 6.5 | |||||||||||||||||||||||||||||||||
| Other | 2,260 | 1,553 | 1,810 | 2,501 | 2,841 | 3,058 | 5,160 | 3,485 | 3,536 | 3,383 | 4.6 | |||||||||||||||||||||||||||||||||
| Contingencies | - | - | - | - | - | - | 4,848 | 5,500 | 4,800 | 3,900 | n/a | |||||||||||||||||||||||||||||||||
| Priority spending initiatives and caseload pressures | - | - | - | - | - | - | - | - | - | 800 | n/a | |||||||||||||||||||||||||||||||||
| General government | 1,532 | 1,540 | 1,670 | 1,653 | 3,915 | 2,036 | 2,092 | 1,929 | 1,922 | 1,935 | 2.6 | |||||||||||||||||||||||||||||||||
| Debt servicing | 2,587 | 2,623 | 2,684 | 2,727 | 2,722 | 2,742 | 2,859 | 3,235 | 3,714 | 4,149 | 5.4 | |||||||||||||||||||||||||||||||||
| Total expense | 48,684 | 51,707 | 55,597 | 58,982 | 67,624 | 71,086 | 79,108 | 81,206 | 82,978 | 84,766 | ||||||||||||||||||||||||||||||||||
| Per cent of operating expense: | ||||||||||||||||||||||||||||||||||||||||||||
| Health | 40.4 | 40.5 | 39.8 | 39.8 | 37.9 | 38.8 | 35.4 | 38.1 | 38.7 | 38.9 | -0.4 | |||||||||||||||||||||||||||||||||
| Education | 25.6 | 25.3 | 25.3 | 25.0 | 22.1 | 22.2 | 21.0 | 21.7 | 21.8 | 21.7 | -1.8 | |||||||||||||||||||||||||||||||||
| Social services | 8.7 | 9.2 | 9.6 | 10.0 | 11.5 | 10.2 | 12.0 | 11.3 | 11.6 | 11.8 | 3.4 | |||||||||||||||||||||||||||||||||
| Protection of persons and property | 3.4 | 3.7 | 3.6 | 3.6 | 3.3 | 4.1 | 3.4 | 2.9 | 2.8 | 2.8 | -2.2 | |||||||||||||||||||||||||||||||||
| Transportation | 3.7 | 3.7 | 3.6 | 3.6 | 5.0 | 6.3 | 3.6 | 3.2 | 3.1 | 3.1 | -1.9 | |||||||||||||||||||||||||||||||||
| Natural resources & economic development | 5.1 | 6.5 | 6.9 | 6.4 | 6.2 | 7.3 | 5.7 | 5.5 | 5.2 | 5.1 | 0.1 | |||||||||||||||||||||||||||||||||
| Other | 4.6 | 3.0 | 3.3 | 4.2 | 4.2 | 4.3 | 6.5 | 4.3 | 4.3 | 4.0 | -1.7 | |||||||||||||||||||||||||||||||||
| Contingencies | - | - | - | - | - | - | 6.1 | 6.8 | 5.8 | 4.6 | n/a | |||||||||||||||||||||||||||||||||
| Priority spending initiatives and caseload pressures | - | - | - | - | - | - | - | - | - | 0.9 | n/a | |||||||||||||||||||||||||||||||||
| General government | 3.1 | 3.0 | 3.0 | 2.8 | 5.8 | 2.9 | 2.6 | 2.4 | 2.3 | 2.3 | -3.5 | |||||||||||||||||||||||||||||||||
| Debt servicing | 5.3 | 5.1 | 4.8 | 4.6 | 4.0 | 3.9 | 3.6 | 4.0 | 4.5 | 4.9 | -0.9 | |||||||||||||||||||||||||||||||||
| Operating expense | 100.0 | 100.0 | 100.0 | 100.0 | 100.0 | 100.0 | 100.0 | 100.0 | 100.0 | 100.0 | ||||||||||||||||||||||||||||||||||
1 Figures reflect government accounting policies used in the 2021/22 Public Accounts audited financial statements.
2 Numbers may not add due to rounding.
| 162 | | Budget and Fiscal Plan - 2023/24 to 2025/26
|
Appendix
Table A12 Expense by Function Supplementary Information - 2016/17 to 2025/261
| Actual 2016/17 | Actual 2017/18 | Actual 2018/19 | Actual 2019/20 | Actual 2020/21 | Actual 2021/22 | Updated Forecast 2022/23 | Budget Estimate 2023/24 | Plan 2024/25 | Plan 2025/26 | Average annual change | ||||||||||||||||||||||||||||||||||
| (per cent) | ||||||||||||||||||||||||||||||||||||||||||||
| Per cent of nominal GDP: 2 | ||||||||||||||||||||||||||||||||||||||||||||
| Health | 7.5 | 7.4 | 7.4 | 7.6 | 8.3 | 7.9 | 7.2 | 7.7 | 7.7 | 7.6 | 0.2 | |||||||||||||||||||||||||||||||||
| Education | 4.7 | 4.6 | 4.7 | 4.8 | 4.9 | 4.5 | 4.3 | 4.4 | 4.4 | 4.3 | -1.2 | |||||||||||||||||||||||||||||||||
| Social services | 1.6 | 1.7 | 1.8 | 1.9 | 2.5 | 2.1 | 2.4 | 2.3 | 2.3 | 2.3 | 4.1 | |||||||||||||||||||||||||||||||||
| Protection of persons and property | 0.6 | 0.7 | 0.7 | 0.7 | 0.7 | 0.8 | 0.7 | 0.6 | 0.6 | 0.5 | -1.6 | |||||||||||||||||||||||||||||||||
| Transportation | 0.7 | 0.7 | 0.7 | 0.7 | 1.1 | 1.3 | 0.7 | 0.7 | 0.6 | 0.6 | -1.3 | |||||||||||||||||||||||||||||||||
| Natural resources & economic development | 0.9 | 1.2 | 1.3 | 1.2 | 1.4 | 1.5 | 1.2 | 1.1 | 1.0 | 1.0 | 0.8 | |||||||||||||||||||||||||||||||||
| Other | 0.9 | 0.6 | 0.6 | 0.8 | 0.9 | 0.9 | 1.3 | 0.9 | 0.9 | 0.8 | -1.0 | |||||||||||||||||||||||||||||||||
| Contingencies | - | - | - | - | - | - | 1.2 | 1.4 | 1.2 | 0.9 | n/a | |||||||||||||||||||||||||||||||||
| Priority spending initiatives and caseload pressures | - | - | - | - | - | - | - | - | - | 0.2 | n/a | |||||||||||||||||||||||||||||||||
| General government | 0.6 | 0.5 | 0.6 | 0.5 | 1.3 | 0.6 | 0.5 | 0.5 | 0.5 | 0.4 | -2.9 | |||||||||||||||||||||||||||||||||
| Debt servicing | 1.0 | 0.9 | 0.9 | 0.9 | 0.9 | 0.8 | 0.7 | 0.8 | 0.9 | 1.0 | -0.2 | |||||||||||||||||||||||||||||||||
| Operating expense | 18.4 | 18.3 | 18.7 | 19.1 | 22.0 | 20.3 | 20.3 | 20.3 | 20.0 | 19.6 | 0.7 | |||||||||||||||||||||||||||||||||
| Growth rates (per cent): | ||||||||||||||||||||||||||||||||||||||||||||
| Health | 2.5 | 6.3 | 5.8 | 5.9 | 9.2 | 7.7 | 1.4 | 10.6 | 3.9 | 2.6 | n/a | |||||||||||||||||||||||||||||||||
| Education | 2.1 | 5.0 | 7.6 | 4.6 | 1.4 | 5.7 | 5.2 | 5.9 | 2.9 | 1.5 | n/a | |||||||||||||||||||||||||||||||||
| Social services | 3.3 | 11.6 | 12.8 | 10.2 | 32.3 | -6.7 | 30.8 | -3.7 | 4.9 | 3.7 | n/a | |||||||||||||||||||||||||||||||||
| Protection of persons and property | 5.3 | 16.6 | 3.8 | 6.1 | 6.2 | 30.1 | -7.7 | -14.3 | 0.7 | 0.5 | n/a | |||||||||||||||||||||||||||||||||
| Transportation | 6.8 | 8.2 | 4.7 | 5.2 | 58.0 | 32.5 | -35.6 | -8.8 | -2.5 | 2.3 | n/a | |||||||||||||||||||||||||||||||||
| Natural resources & economic development | -0.5 | 36.9 | 13.4 | -1.2 | 10.9 | 24.4 | -14.1 | -1.0 | -3.4 | 1.2 | n/a | |||||||||||||||||||||||||||||||||
| Other | 78.8 | -31.3 | 16.5 | 38.2 | 13.6 | 7.6 | 68.7 | -32.5 | 1.5 | -4.3 | n/a | |||||||||||||||||||||||||||||||||
| Contingencies | - | - | - | - | - | 13.4 | -12.7 | -18.8 | n/a | |||||||||||||||||||||||||||||||||||
| General government | 2.1 | 0.5 | 8.4 | -1.0 | 136.8 | -48.0 | 2.8 | -7.8 | -0.4 | 0.7 | n/a | |||||||||||||||||||||||||||||||||
| Debt servicing | -8.5 | 1.4 | 2.3 | 1.6 | -0.2 | 0.7 | 4.3 | 13.2 | 14.8 | 11.7 | n/a | |||||||||||||||||||||||||||||||||
| Operating expense | 4.0 | 6.2 | 7.5 | 6.1 | 14.7 | 5.1 | 11.3 | 2.7 | 2.2 | 2.2 | n/a | |||||||||||||||||||||||||||||||||
| Per capita ($): 3 | ||||||||||||||||||||||||||||||||||||||||||||
| Health | 4,052 | 4,245 | 4,421 | 4,603 | 4,967 | 5,302 | 5,259 | 5,676 | 5,785 | 5,836 | 4.1 | |||||||||||||||||||||||||||||||||
| Education | 2,566 | 2,656 | 2,812 | 2,892 | 2,898 | 3,036 | 3,124 | 3,230 | 3,262 | 3,255 | 2.7 | |||||||||||||||||||||||||||||||||
| Social services | 873 | 961 | 1,066 | 1,155 | 1,511 | 1,397 | 1,787 | 1,681 | 1,730 | 1,764 | 8.1 | |||||||||||||||||||||||||||||||||
| Protection of persons and property | 341 | 392 | 400 | 417 | 438 | 565 | 510 | 427 | 421 | 416 | 2.2 | |||||||||||||||||||||||||||||||||
| Transportation | 367 | 392 | 403 | 417 | 652 | 856 | 539 | 480 | 459 | 462 | 2.6 | |||||||||||||||||||||||||||||||||
| Natural resources & economic development | 507 | 684 | 763 | 742 | 813 | 1,002 | 841 | 813 | 771 | 768 | 4.7 | |||||||||||||||||||||||||||||||||
| Other | 465 | 315 | 361 | 491 | 551 | 588 | 970 | 640 | 637 | 599 | 2.9 | |||||||||||||||||||||||||||||||||
| Contingencies | - | - | - | - | - | - | 911 | 1,009 | 865 | 691 | n/a | |||||||||||||||||||||||||||||||||
| Priority spending initiatives and caseload pressures | - | - | - | - | - | - | - | - | - | 142 | n/a | |||||||||||||||||||||||||||||||||
| General government | 315 | 312 | 333 | 324 | 759 | 391 | 393 | 354 | 346 | 343 | 1.0 | |||||||||||||||||||||||||||||||||
| Debt servicing | 532 | 532 | 536 | 535 | 528 | 527 | 538 | 594 | 669 | 735 | 3.7 | |||||||||||||||||||||||||||||||||
| Operating expense | 10,018 | 10,489 | 11,095 | 11,576 | 13,117 | 13,664 | 14,872 | 14,904 | 14,945 | 15,011 | 4.6 | |||||||||||||||||||||||||||||||||
| Real Per Capita Operating Expense (2022 $) 4 | 11,910 | 12,210 | 12,574 | 12,819 | 14,415 | 14,608 | 14,872 | 14,351 | 14,039 | 13,798 | 1.6 | |||||||||||||||||||||||||||||||||
| Growth rate (per cent) | 0.3 | 2.5 | 3.0 | 2.0 | 12.4 | 1.3 | 1.8 | -3.5 | -2.2 | -1.7 | 1.7 | |||||||||||||||||||||||||||||||||
| 1 | Numbers may not add due to rounding. | |
| 2 | Expense as a per cent of GDP is calculated using nominal GDP for the calendar year ending in the fiscal year (e.g. 2023/24 expense divided by nominal GDP for the 2023 calendar year). | |
| 3 | Per capita expense is calculated using July 1 population (e.g. 2023/24 expense divided by population on July 1, 2023). | |
| 4 | Expense is converted to real (inflation-adjusted) terms using the consumer price index (CPI) for the corresponding calendar year (e.g. 2023 CPI for 2023/24 expense). |
Budget and Fiscal Plan - 2023/24 to 2025/26
| | 163 |
Appendix
Table A13 Full-Time Equivalents (FTEs) – 2016/17 to 2025/26 1
| Actual 2016/17 | Actual 2017/18 | Actual 2018/19 | Actual 2019/20 | Actual 2020/21 | Actual 2021/22 | Updated Forecast 2022/23 | Budget Estimate 2023/24 | Plan 2024/25 | Plan 2025/26 | Average annual change | ||||||||||||||||||||||||||||||||||
| (per cent) | ||||||||||||||||||||||||||||||||||||||||||||
| Taxpayer-supported programs and agencies: | ||||||||||||||||||||||||||||||||||||||||||||
| Ministries and special offices (CRF) | 27,940 | 29,291 | 30,891 | 31,774 | 32,444 | 33,400 | 33,800 | 34,400 | 35,000 | 35,000 | 2.5 | |||||||||||||||||||||||||||||||||
| Service delivery agencies 2 | 4,850 | 5,076 | 5,258 | 5,985 | 6,042 | 6,698 | 7,909 | 8,693 | 8,797 | 8,724 | 6.7 | |||||||||||||||||||||||||||||||||
| Total FTEs | 32,790 | 34,367 | 36,149 | 37,759 | 38,486 | 40,098 | 41,709 | 43,093 | 43,797 | 43,724 | 3.2 | |||||||||||||||||||||||||||||||||
| Growth rates (per cent): | ||||||||||||||||||||||||||||||||||||||||||||
| Ministries and special offices (CRF) | 2.8 | 4.8 | 5.5 | 2.9 | 2.1 | 2.9 | 1.2 | 1.8 | 1.7 | 0.0 | 2.6 | |||||||||||||||||||||||||||||||||
| Service delivery agencies | 1.0 | 4.7 | 3.6 | 13.8 | 1.0 | 10.9 | 18.1 | 9.9 | 1.2 | -0.8 | 6.3 | |||||||||||||||||||||||||||||||||
| Population per FTE: 3 | ||||||||||||||||||||||||||||||||||||||||||||
| Total FTEs | 148.2 | 143.4 | 138.6 | 134.9 | 134.0 | 129.7 | 127.5 | 126.4 | 126.8 | 129.2 | -1.5 | |||||||||||||||||||||||||||||||||
| 1 | Full-time equivalents (FTEs) are a measure of staff employment. FTEs are calculated by dividing the total hours of employment paid for in a given period by the number of hours an individual, full-time person would normally work in that period. This does not equate to the physical number of employees. For example, two half-time employees would equal one FTE, or alternatively, three FTEs may represent two full-time employees who have worked sufficient overtime hours to equal an additional FTE. | |
| 2 | Service delivery agency FTE amounts do not include SUCH sector staff employment. | |
| 3 | Population per FTE is calculated using July 1 population (e.g. population on July 1, 2023 divided by 2023/24 FTEs). |
| 164 | | Budget and Fiscal Plan - 2023/24 to 2025/26
|
Appendix
Table A14 Capital Spending – 2016/17 to 2025/26
| ($ millions) | Actual 2016/17 | Actual 2017/18 | Actual 2018/19 | Actual 2019/20 | Actual 2020/21 | Actual 2021/22 | Updated Forecast 2022/23 | Budget Estimate 2023/24 | Plan 2024/25 | Plan 2025/26 | Average annual change | |||||||||||||||||||||||||||||||||
| (per cent) | ||||||||||||||||||||||||||||||||||||||||||||
| Taxpayer-supported: | ||||||||||||||||||||||||||||||||||||||||||||
| Education | ||||||||||||||||||||||||||||||||||||||||||||
| Schools districts | 474 | 578 | 626 | 877 | 944 | 1,001 | 877 | 1,019 | 1,134 | 1,238 | 11.3 | |||||||||||||||||||||||||||||||||
| Post-secondary institutions | 792 | 968 | 1,024 | 936 | 904 | 899 | 993 | 1,716 | 1,921 | 1,905 | 10.2 | |||||||||||||||||||||||||||||||||
| Health | 1,004 | 890 | 904 | 1,009 | 1,162 | 1,555 | 2,782 | 3,243 | 3,637 | 4,291 | 17.5 | |||||||||||||||||||||||||||||||||
| BC Transportation Financing Authority1 | 823 | 717 | 853 | 955 | 1,285 | 1,364 | 2,083 | 3,947 | 4,160 | 3,977 | 19.1 | |||||||||||||||||||||||||||||||||
| BC Transit | 41 | 115 | 85 | 73 | 107 | 67 | 111 | 232 | 485 | 495 | 31.9 | |||||||||||||||||||||||||||||||||
| Government direct (ministries) | 301 | 430 | 421 | 520 | 389 | 386 | 638 | 701 | 500 | 459 | 4.8 | |||||||||||||||||||||||||||||||||
| Social Housing | 184 | 169 | 483 | 355 | 572 | 642 | 430 | 808 | 665 | 686 | 15.7 | |||||||||||||||||||||||||||||||||
| Other | 40 | 41 | 56 | 47 | 65 | 88 | 203 | 147 | 132 | 47 | 1.8 | |||||||||||||||||||||||||||||||||
| Total taxpayer-supported | 3,659 | 3,908 | 4,452 | 4,772 | 5,428 | 6,002 | 8,117 | 11,813 | 12,634 | 13,098 | 15.2 | |||||||||||||||||||||||||||||||||
| Self-supported: | ||||||||||||||||||||||||||||||||||||||||||||
| BC Hydro | 2,444 | 2,473 | 3,826 | 3,082 | 3,207 | 3,475 | 3,878 | 3,815 | 3,924 | 2,653 | 0.9 | |||||||||||||||||||||||||||||||||
| Columbia Basin power projects | 2 | 1 | 2 | 994 | 7 | 9 | 11 | 9 | 11 | 21 | 29.9 | |||||||||||||||||||||||||||||||||
| Transportation Investment Corporation 1 | 38 | 4 | - | - | - | - | - | - | - | - | n/a | |||||||||||||||||||||||||||||||||
| ICBC | 62 | 54 | 66 | 62 | 100 | 54 | 43 | 65 | 42 | 49 | -2.6 | |||||||||||||||||||||||||||||||||
| BC Lottery Corporation 2 | 86 | 82 | 75 | 102 | 73 | 90 | 90 | 103 | 100 | 100 | 1.7 | |||||||||||||||||||||||||||||||||
| Liquor Distribution Branch | 27 | 48 | 60 | 36 | 22 | 22 | 25 | 28 | 34 | 27 | 0.0 | |||||||||||||||||||||||||||||||||
| Other 3 | 66 | 67 | 77 | 110 | 66 | 80 | 8 | 7 | 5 | 3 | -29.1 | |||||||||||||||||||||||||||||||||
| Total self-supported | 2,725 | 2,729 | 4,106 | 4,386 | 3,475 | 3,730 | 4,055 | 4,027 | 4,116 | 2,853 | 0.5 | |||||||||||||||||||||||||||||||||
| Total capital spending | 6,384 | 6,637 | 8,558 | 9,158 | 8,903 | 9,732 | 12,172 | 15,840 | 16,750 | 15,951 | 10.7 | |||||||||||||||||||||||||||||||||
| Per cent of nominal GDP: 4 | ||||||||||||||||||||||||||||||||||||||||||||
| Taxpayer-supported | 1.4 | 1.4 | 1.5 | 1.5 | 1.8 | 1.7 | 2.1 | 3.0 | 3.0 | 3.0 | 9.1 | |||||||||||||||||||||||||||||||||
| Self-supported | 1.0 | 1.0 | 1.4 | 1.4 | 1.1 | 1.1 | 1.0 | 1.0 | 1.0 | 0.7 | -4.9 | |||||||||||||||||||||||||||||||||
| Total | 2.4 | 2.4 | 2.9 | 3.0 | 2.9 | 2.8 | 3.1 | 4.0 | 4.0 | 3.7 | 4.8 | |||||||||||||||||||||||||||||||||
| Growth rates: | ||||||||||||||||||||||||||||||||||||||||||||
| Taxpayer-supported | 5.8 | 6.8 | 13.9 | 7.2 | 13.7 | 10.6 | 35.2 | 45.5 | 6.9 | 3.7 | -4.9 | |||||||||||||||||||||||||||||||||
| Self-supported | 5.9 | 0.1 | 50.5 | 6.8 | -20.8 | 7.3 | 8.7 | -0.7 | 2.2 | -30.7 | 2.9 | |||||||||||||||||||||||||||||||||
| Total capital spending | 5.8 | 4.0 | 28.9 | 7.0 | -2.8 | 9.3 | 25.1 | 30.1 | 5.7 | -4.8 | 10.8 | |||||||||||||||||||||||||||||||||
| Per capita: 5 | ||||||||||||||||||||||||||||||||||||||||||||
| Taxpayer-supported | 753 | 793 | 889 | 937 | 1,053 | 1,154 | 1,526 | 2,168 | 2,276 | 2,319 | 13.3 | |||||||||||||||||||||||||||||||||
| Self-supported | 561 | 554 | 819 | 861 | 674 | 717 | 762 | 739 | 741 | 505 | -1.2 | |||||||||||||||||||||||||||||||||
| Total capital spending | 1,314 | 1,346 | 1,708 | 1,798 | 1,727 | 1,871 | 2,288 | 2,907 | 3,017 | 2,825 | 8.9 | |||||||||||||||||||||||||||||||||
| Real Per Capita Capital Spending (2022 $)6 | 1,562 | 1,567 | 1,935 | 1,990 | 1,898 | 2,000 | 2,288 | 2,799 | 2,834 | 2,596 | 5.8 | |||||||||||||||||||||||||||||||||
| Growth rate (per cent) | 2.2 | 0.4 | 23.5 | 2.8 | -4.7 | 5.4 | 14.4 | 22.3 | 1.2 | -8.4 | 5.9 | |||||||||||||||||||||||||||||||||
| 1 | Includes Transportation Investment Plan capital spending and, beginning in 2017/18, Transportation Investment Corporation rehabilitation costs for the Port Mann Bridge due to reclassification from self-supported commercial Crown corporation to a taxpayer-supported agency in response to the cancellation of tolls. Effective April 1, 2018, Transportation Investment Corporation became a subsidiary of | |
| 2 | Forecasted amounts exclude right-of-use assets. | |
| 3 | Includes post-secondary institutions' self-supported subsidiaries. | |
| 4 | Capital spending as a per cent of GDP is calculated using nominal GDP for the calendar year ending in the fiscal year (e.g. 2023/24 amounts divided by nominal GDP for the 2023 calendar year). | |
| 5 | Per capita capital spending is calculated using July 1 population (e.g. 2023/24 amounts divided by population on July 1, 2023). | |
| 6 | Capital spending is converted to real (inflation-adjusted) terms using the consumer price index (CPI) for the corresponding calendar year (e.g. 2023 CPI for 2023/24 capital spending). |
| Budget and Fiscal Plan - 2023/24 to 2025/26 | | 165 | |
Appendix
Table A15 Statement of Financial Position – 2016/17 to 2025/26
| Actual | Actual | Actual | Actual | Actual | Actual | Updated Forecast | Budget Estimate | Plan | Plan | Average annual | ||||||||||||||||||||||||||||||||||
| ($ millions) | 2016/17 | 2017/18 | 2018/19 | 2019/20 | 2020/21 | 2021/22 | 2022/23 | 2023/24 | 2024/25 | 2025/26 | change | |||||||||||||||||||||||||||||||||
| (per cent) | ||||||||||||||||||||||||||||||||||||||||||||
| Financial assets: | ||||||||||||||||||||||||||||||||||||||||||||
| Cash and temporary investments | 4,232 | 3,440 | 3,029 | 3,985 | 6,560 | 7,142 | 4,646 | 3,120 | 2,627 | 1,635 | -10.0 | |||||||||||||||||||||||||||||||||
| Other financial assets | 10,209 | 11,740 | 12,636 | 12,405 | 15,410 | 17,105 | 17,112 | 18,450 | 19,229 | 18,923 | 7.1 | |||||||||||||||||||||||||||||||||
| Sinking funds | 1,087 | 1,348 | 752 | 692 | 492 | 510 | 537 | 529 | 576 | 397 | -10.6 | |||||||||||||||||||||||||||||||||
| Investments in commercial Crown corporations: | ||||||||||||||||||||||||||||||||||||||||||||
| Retained earnings | 7,517 | 6,134 | 5,740 | 6,523 | 9,632 | 12,223 | 12,530 | 13,274 | 14,476 | 15,672 | 8.5 | |||||||||||||||||||||||||||||||||
| Recoverable capital loans | 23,809 | 20,534 | 22,547 | 24,768 | 26,301 | 27,218 | 28,344 | 30,174 | 32,265 | 33,024 | 3.7 | |||||||||||||||||||||||||||||||||
| Total investments in commercial Crown corporations | 31,326 | 26,668 | 28,287 | 31,291 | 35,933 | 39,441 | 40,874 | 43,448 | 46,741 | 48,696 | 5.0 | |||||||||||||||||||||||||||||||||
| Total financial assets | 46,854 | 43,196 | 44,704 | 48,373 | 58,395 | 64,198 | 63,169 | 65,547 | 69,173 | 69,652 | 4.5 | |||||||||||||||||||||||||||||||||
| Liabilities: | ||||||||||||||||||||||||||||||||||||||||||||
| Accounts payable & accrued liabilities | 9,031 | 9,751 | 10,573 | 11,497 | 13,092 | 16,829 | 14,592 | 14,741 | 16,085 | 17,080 | 7.3 | |||||||||||||||||||||||||||||||||
| Deferred revenue | 9,665 | 10,068 | 10,543 | 10,652 | 12,211 | 13,379 | 14,058 | 14,933 | 15,719 | 16,453 | 6.1 | |||||||||||||||||||||||||||||||||
| Debt: | ||||||||||||||||||||||||||||||||||||||||||||
| Taxpayer-supported debt | 41,499 | 43,607 | 42,681 | 46,229 | 59,750 | 62,341 | 63,701 | 75,617 | 88,436 | 99,395 | 10.2 | |||||||||||||||||||||||||||||||||
| Self-supported debt | 24,338 | 21,312 | 23,281 | 25,932 | 27,350 | 28,325 | 29,788 | 31,607 | 33,671 | 34,405 | 3.9 | |||||||||||||||||||||||||||||||||
| Forecast allowance | - | - | - | - | - | - | - | 700 | 500 | 500 | ||||||||||||||||||||||||||||||||||
| Total provincial debt | 65,837 | 64,919 | 65,962 | 72,161 | 87,100 | 90,666 | 93,489 | 107,924 | 122,607 | 134,300 | 8.2 | |||||||||||||||||||||||||||||||||
| Add: debt offset by sinking funds | 1,087 | 1,348 | 752 | 692 | 492 | 510 | 537 | 529 | 576 | 397 | -10.6 | |||||||||||||||||||||||||||||||||
| Less: guarantees and non-guaranteed debt | (835 | ) | (896 | ) | (850 | ) | (1,337 | ) | (1,335 | ) | (1,402 | ) | (1,444 | ) | (1,434 | ) | (1,406 | ) | (1,381 | ) | 5.7 | |||||||||||||||||||||||
| Financial statement debt | 66,089 | 65,371 | 65,864 | 71,516 | 86,257 | 89,774 | 92,582 | 107,019 | 121,777 | 133,316 | 8.1 | |||||||||||||||||||||||||||||||||
| Total liabilities | 84,785 | 85,190 | 86,980 | 93,665 | 111,560 | 119,982 | 121,232 | 136,693 | 153,581 | 166,849 | 7.8 | |||||||||||||||||||||||||||||||||
| Net liabilities | (37,931 | ) | (41,994 | ) | (42,276 | ) | (45,292 | ) | (53,165 | ) | (55,784 | ) | (58,063 | ) | (71,146 | ) | (84,408 | ) | (97,197 | ) | 11.0 | |||||||||||||||||||||||
| Capital and other assets: | ||||||||||||||||||||||||||||||||||||||||||||
| Tangible capital assets | 41,238 | 45,771 | 47,764 | 49,958 | 52,716 | 56,001 | 61,677 | 70,474 | 79,913 | 89,637 | 9.0 | |||||||||||||||||||||||||||||||||
| Restricted assets | 1,695 | 1,768 | 1,834 | 1,931 | 2,003 | 2,147 | 2,224 | 2,292 | 2,361 | 2,430 | 4.1 | |||||||||||||||||||||||||||||||||
| Other assets | 1,126 | 932 | 952 | 1,100 | 1,582 | 1,791 | 1,681 | 1,683 | 1,683 | 1,636 | 4.2 | |||||||||||||||||||||||||||||||||
| Total capital and other non-financial assets | 44,059 | 48,471 | 50,550 | 52,989 | 56,301 | 59,939 | 65,582 | 74,449 | 83,957 | 93,703 | 8.7 | |||||||||||||||||||||||||||||||||
| Accumulated surplus (deficit) | 6,128 | 6,477 | 8,274 | 7,697 | 3,136 | 4,155 | 7,519 | 3,303 | (451 | ) | (3,494 | ) | -193.9 | |||||||||||||||||||||||||||||||
| Per cent of nominal GDP:1 | ||||||||||||||||||||||||||||||||||||||||||||
| Net liabilities | 14.4 | 14.9 | 14.2 | 14.7 | 17.3 | 15.9 | 14.9 | 17.8 | 20.3 | 22.5 | 5.1 | |||||||||||||||||||||||||||||||||
| Capital and other assets | 16.7 | 17.2 | 17.0 | 17.1 | 18.3 | 17.1 | 16.9 | 18.6 | 20.2 | 21.7 | 2.9 | |||||||||||||||||||||||||||||||||
| Growth rates (per cent): | ||||||||||||||||||||||||||||||||||||||||||||
| Net liabilities | -4.6 | 10.7 | 0.7 | 7.1 | 17.4 | 4.9 | 4.1 | 22.5 | 18.6 | 15.2 | -214.2 | |||||||||||||||||||||||||||||||||
| Capital and other assets | 2.7 | 10.0 | 4.3 | 4.8 | 6.3 | 6.5 | 9.4 | 13.5 | 12.8 | 11.6 | 17.4 | |||||||||||||||||||||||||||||||||
| Per capita: 2 | ||||||||||||||||||||||||||||||||||||||||||||
| Net liabilities | 7,806 | 8,519 | 8,438 | 8,890 | 10,312 | 10,723 | 10,915 | 13,057 | 15,203 | 17,211 | 9.2 | |||||||||||||||||||||||||||||||||
| Capital and other assets | 9,067 | 9,833 | 10,089 | 10,401 | 10,921 | 11,521 | 12,329 | 13,663 | 15,122 | 16,593 | 6.9 | |||||||||||||||||||||||||||||||||
| 1 | Net liabilities as a per cent of nominal GDP is calculated using nominal GDP for the calendar year ending in the fiscal year (e.g. 2023/24 amount divided by nominal GDP for the 2023 calendar year). | |
| 2 | Per capita net liabilities is calculated using July 1 population (e.g. 2023/24 amount divided by population on July 1, 2023). |
| 166 | | Budget and Fiscal Plan - 2023/24 to 2025/26 | |
Appendix
Table A16 Changes in Financial Position – 2016/17 to 2025/26
| ($ millions) | Actual 2016/17 | Actual 2017/18 | Actual 2018/19 | Actual 2019/20 | Actual 2020/21 | Actual 2021/22 | Updated Forecast 2022/23 | Budget Estimate 2023/24 | Plan 2024/25 | Plan 2025/26 | 10-Year Total | |||||||||||||||||||||||||||||||||
| (Surplus) deficit for the year | (2,765 | ) | (313 | ) | (1,531 | ) | 322 | 5,468 | (1,306 | ) | (3,592 | ) | 4,216 | 3,754 | 3,043 | 7,296 | ||||||||||||||||||||||||||||
| Comprehensive income (increase) decrease | (236 | ) | (36 | ) | (266 | ) | 255 | (907 | ) | 287 | 228 | - | - | - | (675 | ) | ||||||||||||||||||||||||||||
| Change in accumulated (surplus) deficit | (3,001 | ) | (349 | ) | (1,797 | ) | 577 | 4,561 | (1,019 | ) | (3,364 | ) | 4,216 | 3,754 | 3,043 | 6,621 | ||||||||||||||||||||||||||||
| Capital and other asset changes: | ||||||||||||||||||||||||||||||||||||||||||||
| Taxpayer-supported capital investments | 3,659 | 3,908 | 4,452 | 4,772 | 5,428 | 6,002 | 8,117 | 11,813 | 12,634 | 13,098 | 73,883 | |||||||||||||||||||||||||||||||||
| Less: amortization and other accounting changes | (2,638 | ) | 625 | (2,459 | ) | (2,578 | ) | (2,670 | ) | (2,717 | ) | (2,441 | ) | (3,016 | ) | (3,195 | ) | (3,374 | ) | (24,463 | ) | |||||||||||||||||||||||
| Increase in net capital assets | 1,021 | 4,533 | 1,993 | 2,194 | 2,758 | 3,285 | 5,676 | 8,797 | 9,439 | 9,724 | 49,420 | |||||||||||||||||||||||||||||||||
| Increase (decrease) in restricted assets | 64 | 73 | 66 | 97 | 72 | 144 | 77 | 68 | 69 | 69 | 799 | |||||||||||||||||||||||||||||||||
| Increase (decrease) in other assets | 87 | (194 | ) | 20 | 148 | 482 | 209 | (110 | ) | 2 | (47 | ) | 597 | |||||||||||||||||||||||||||||||
| Change in capital and other assets | 1,172 | 4,412 | 2,079 | 2,439 | 3,312 | 3,638 | 5,643 | 8,867 | 9,508 | 9,746 | 50,816 | |||||||||||||||||||||||||||||||||
| Increase (decrease) in net liabilities | (1,829 | ) | 4,063 | 282 | 3,016 | 7,873 | 2,619 | 2,279 | 13,083 | 13,262 | 12,789 | 57,437 | ||||||||||||||||||||||||||||||||
| Investment and working capital changes: | ||||||||||||||||||||||||||||||||||||||||||||
| Investment in commercial Crown corporations: | ||||||||||||||||||||||||||||||||||||||||||||
| Increase (decrease) in retained earnings | (20 | ) | (1,383 | ) | (394 | ) | 783 | 3,109 | 2,591 | 307 | 744 | 1,202 | 1,196 | 8,135 | ||||||||||||||||||||||||||||||
| Self-supported capital investments | 2,725 | 2,729 | 4,106 | 4,386 | 3,475 | 3,730 | 4,055 | 4,027 | 4,116 | 2,853 | 36,202 | |||||||||||||||||||||||||||||||||
| Less: loan repayments and other accounting changes | (957 | ) | (6,004 | ) | (2,093 | ) | (2,165 | ) | (1,942 | ) | (2,813 | ) | (2,929 | ) | (2,197 | ) | (2,025 | ) | (2,094 | ) | (25,219 | ) | ||||||||||||||||||||||
| Change in investment | 1,748 | (4,658 | ) | 1,619 | 3,004 | 4,642 | 3,508 | 1,433 | 2,574 | 3,293 | 1,955 | 19,118 | ||||||||||||||||||||||||||||||||
| Increase (decrease) in cash and temporary investments | 340 | (792 | ) | (411 | ) | 956 | 2,575 | 582 | (2,496 | ) | (1,526 | ) | (493 | ) | (992 | ) | (2,257 | ) | ||||||||||||||||||||||||||
| Other working capital changes | (181 | ) | 669 | (997 | ) | (1,324 | ) | (349 | ) | (3,192 | ) | 1,592 | 306 | (1,304 | ) | (2,214 | ) | (6,994 | ) | |||||||||||||||||||||||||
| Changes in investment and working capital | 1,907 | (4,781 | ) | 211 | 2,636 | 6,868 | 898 | 529 | 1,354 | 1,496 | (1,250 | ) | 9,868 | |||||||||||||||||||||||||||||||
| Increase (decrease) in financial statement debt | 78 | (718 | ) | 493 | 5,652 | 14,741 | 3,517 | 2,808 | 14,437 | 14,758 | 11,539 | 67,305 | ||||||||||||||||||||||||||||||||
| (Increase) decrease in sinking fund debt | 493 | (261 | ) | 596 | 60 | 200 | (18 | ) | (27 | ) | 8 | (47 | ) | 179 | 1,183 | |||||||||||||||||||||||||||||
| Increase (decrease) in guarantees | (23 | ) | (188 | ) | (2 | ) | 57 | 113 | 9 | (295 | ) | 1 | (1 | ) | 1 | (328 | ) | |||||||||||||||||||||||||||
| Increase (decrease) in non-guaranteed debt | 38 | 249 | (44 | ) | 430 | (115 | ) | 58 | 337 | (11 | ) | (27 | ) | (26 | ) | 889 | ||||||||||||||||||||||||||||
| Increase (decrease) in total provincial debt | 586 | (918 | ) | 1,043 | 6,199 | 14,939 | 3,566 | 2,823 | 14,435 | 14,683 | 11,693 | 69,049 | ||||||||||||||||||||||||||||||||
| Represented by increase (decrease) in: | ||||||||||||||||||||||||||||||||||||||||||||
| Taxpayer-supported debt | (1,220 | ) | 2,108 | (926 | ) | 3,548 | 13,521 | 2,591 | 1,360 | 11,916 | 12,819 | 10,959 | 56,676 | |||||||||||||||||||||||||||||||
| Self-supported debt | 1,806 | (3,026 | ) | 1,969 | 2,651 | 1,418 | 975 | 1,463 | 1,819 | 2,064 | 734 | 11,873 | ||||||||||||||||||||||||||||||||
| Forecast allowance | - | - | - | - | - | - | - | 700 | (200 | ) | - | 500 | ||||||||||||||||||||||||||||||||
| Total provincial debt | 586 | (918 | ) | 1,043 | 6,199 | 14,939 | 3,566 | 2,823 | 14,435 | 14,683 | 11,693 | 69,049 | ||||||||||||||||||||||||||||||||
| Budget and Fiscal Plan - 2023/24 to 2025/26 | | 167 | |
Appendix
Table A17 Provincial Debt – 2016/17 to 2025/26
| ($ millions) | Actual 2016/17 | Actual 2017/18 | Actual 2018/19 | Actual 2019/20 | Actual 2020/21 | Actual 2021/22 | Updated Forecast 2022/23 | Budget Estimate 2023/24 | Plan 2024/25 | Plan 2025/26 | Average annual change | |||||||||||||||||||||||||||||||||
| (per cent) | ||||||||||||||||||||||||||||||||||||||||||||
| Taxpayer-supported debt: | ||||||||||||||||||||||||||||||||||||||||||||
| Provincial government | ||||||||||||||||||||||||||||||||||||||||||||
| Operating | 4,644 | 1,156 | - | - | 8,746 | 7,233 | - | 2,440 | 4,128 | 4,710 | 0.2 | |||||||||||||||||||||||||||||||||
| Capital 2 | ||||||||||||||||||||||||||||||||||||||||||||
| K-12 education | 8,454 | 8,891 | 8,885 | 9,757 | 10,529 | 11,342 | 11,982 | 12,699 | 13,621 | 14,616 | 6.3 | |||||||||||||||||||||||||||||||||
| Post-secondary institutions | 4,285 | 4,584 | 4,607 | 4,917 | 5,426 | 5,732 | 6,049 | 6,725 | 7,609 | 8,383 | 7.7 | |||||||||||||||||||||||||||||||||
| Health facilities | 5,835 | 6,141 | 6,173 | 6,705 | 7,484 | 8,223 | 9,680 | 11,384 | 14,174 | 17,386 | 12.9 | |||||||||||||||||||||||||||||||||
| Government ministries | 2,288 | 2,718 | 2,363 | 3,133 | 3,702 | 4,087 | 4,718 | 5,279 | 5,729 | 6,142 | 11.6 | |||||||||||||||||||||||||||||||||
| Transportation | 2,174 | 5,682 | 5,401 | 5,401 | 5,401 | 5,401 | 5,401 | 5,403 | 5,405 | 5,406 | 10.7 | |||||||||||||||||||||||||||||||||
| Social housing | 449 | 619 | 619 | 805 | 1,062 | 1,424 | 1,747 | 2,196 | 2,703 | 3,266 | 24.7 | |||||||||||||||||||||||||||||||||
| Other | 242 | 242 | 242 | 252 | 268 | 278 | 331 | 403 | 486 | 497 | 8.3 | |||||||||||||||||||||||||||||||||
| Total capital | 23,727 | 28,877 | 28,290 | 30,970 | 33,872 | 36,487 | 39,908 | 44,089 | 49,727 | 55,696 | 9.9 | |||||||||||||||||||||||||||||||||
| Total provincial government | 28,371 | 30,033 | 28,290 | 30,970 | 42,618 | 43,720 | 39,908 | 46,529 | 53,855 | 60,406 | 8.8 | |||||||||||||||||||||||||||||||||
| Taxpayer-supported entities: | ||||||||||||||||||||||||||||||||||||||||||||
| BC Pavilion Corporation | 143 | 141 | 138 | 135 | 132 | 129 | 126 | 123 | 120 | 116 | -2.3 | |||||||||||||||||||||||||||||||||
| BC Transit | 94 | 84 | 73 | 65 | 60 | 56 | 62 | 120 | 206 | 342 | 15.4 | |||||||||||||||||||||||||||||||||
| BC Transportation Financing Authority | 9,974 | 10,388 | 11,293 | 12,193 | 13,321 | 14,615 | 19,505 | 23,171 | 27,764 | 32,305 | 13.9 | |||||||||||||||||||||||||||||||||
| Health Authorities and Hospital Societies | 1,717 | 1,762 | 1,795 | 1,802 | 1,875 | 1,839 | 2,019 | 2,381 | 2,334 | 2,279 | 3.2 | |||||||||||||||||||||||||||||||||
| InBC Investment Corp | 217 | 161 | 70 | 45 | 37 | 19 | 18 | 53 | 135 | 247 | 1.4 | |||||||||||||||||||||||||||||||||
| Post-secondary institutions | 699 | 744 | 763 | 753 | 882 | 922 | 874 | 952 | 1,002 | 989 | 3.9 | |||||||||||||||||||||||||||||||||
| School districts | 19 | 17 | 19 | 18 | 24 | 25 | 28 | 32 | 37 | 41 | 8.9 | |||||||||||||||||||||||||||||||||
| Social housing | 246 | 259 | 225 | 222 | 770 | 974 | 1,125 | 2,227 | 2,957 | 2,644 | 30.2 | |||||||||||||||||||||||||||||||||
| Other | 19 | 18 | 15 | 26 | 31 | 42 | 36 | 29 | 26 | 26 | 3.5 | |||||||||||||||||||||||||||||||||
| Total taxpayer-supported entities | 13,128 | 13,574 | 14,391 | 15,259 | 17,132 | 18,621 | 23,793 | 29,088 | 34,581 | 38,989 | 12.9 | |||||||||||||||||||||||||||||||||
| Total taxpayer-supported debt | 41,499 | 43,607 | 42,681 | 46,229 | 59,750 | 62,341 | 63,701 | 75,617 | 88,436 | 99,395 | 10.2 | |||||||||||||||||||||||||||||||||
| Self-supported debt: | ||||||||||||||||||||||||||||||||||||||||||||
| Commercial Crown corporations and agencies | ||||||||||||||||||||||||||||||||||||||||||||
| BC Hydro | 19,685 | 19,990 | 22,064 | 23,238 | 24,650 | 25,611 | 27,054 | 28,946 | 31,041 | 31,794 | 5.5 | |||||||||||||||||||||||||||||||||
| BC Liquor Distribution Branch | - | - | - | 210 | 233 | 230 | 234 | 254 | 263 | 269 | n/a | |||||||||||||||||||||||||||||||||
| BC Lottery Corporation | 145 | 155 | 100 | 233 | 228 | 195 | 174 | 104 | 92 | 91 | -5.0 | |||||||||||||||||||||||||||||||||
| Columbia Basin power projects | 448 | 433 | 418 | 1,387 | 1,349 | 1,319 | 1,293 | 1,266 | 1,238 | 1,207 | 11.6 | |||||||||||||||||||||||||||||||||
| Columbia Power Corporation | 291 | 286 | 282 | 276 | 271 | 266 | 261 | 255 | 249 | 243 | -2.0 | |||||||||||||||||||||||||||||||||
| Post-secondary institution subsidiaries | 340 | 418 | 387 | 504 | 520 | 615 | 656 | 656 | 656 | 656 | 7.6 | |||||||||||||||||||||||||||||||||
| Transportation Investment Corporation 1 | 3,398 | - | - | - | - | - | - | - | - | - | n/a | |||||||||||||||||||||||||||||||||
| Other | 31 | 30 | 30 | 84 | 99 | 89 | 116 | 126 | 132 | 144 | 18.6 | |||||||||||||||||||||||||||||||||
| Total self-supported debt | 24,338 | 21,312 | 23,281 | 25,932 | 27,350 | 28,325 | 29,788 | 31,607 | 33,671 | 34,405 | 3.9 | |||||||||||||||||||||||||||||||||
| Forecast allowance | - | - | - | - | - | - | - | 700 | 500 | 500 | n/a | |||||||||||||||||||||||||||||||||
| Total provincial debt | 65,837 | 64,919 | 65,962 | 72,161 | 87,100 | 90,666 | 93,489 | 107,924 | 122,607 | 134,300 | 8.2 | |||||||||||||||||||||||||||||||||
| 1 | Beginning in 2017/18, debt related to the Port Mann Bridge was reclassified as taxpayer-supported due to the elimination of tolls effective September 1, 2017. | |
| 2 | Includes debt incurred by the government to fund the building and construction of capital assets in the education, health, social housing and other sectors. |
| 168 | | Budget and Fiscal Plan - 2023/24 to 2025/26 | |
Appendix
Table A18 Provincial Debt Supplementary Information – 2016/17 to 2025/261
| ($ millions) | Actual 2016/17 | Actual 2017/18 | Actual 2018/19 | Actual 2019/20 | Actual 2020/21 | Actual 2021/22 | Updated Forecast 2022/23 | Budget Estimate 2023/24 | Plan 2024/25 | Plan 2025/26 | Average annual change | |||||||||||||||||||||||||||||||||
| (per cent) | ||||||||||||||||||||||||||||||||||||||||||||
| Per cent of nominal GDP: 2 | ||||||||||||||||||||||||||||||||||||||||||||
| Taxpayer-supported debt: | ||||||||||||||||||||||||||||||||||||||||||||
| Provincial government direct operating | 1.8 | 0.4 | - | - | 2.8 | 2.1 | - | 0.6 | 1.0 | 1.1 | -5.2 | |||||||||||||||||||||||||||||||||
| Provincial government capital | 9.0 | 10.2 | 9.5 | 10.0 | 11.0 | 10.4 | 10.3 | 11.0 | 12.0 | 12.9 | 4.1 | |||||||||||||||||||||||||||||||||
| Total provincial government | 10.8 | 10.6 | 9.5 | 10.0 | 13.9 | 12.5 | 10.3 | 11.6 | 13.0 | 14.0 | 3.0 | |||||||||||||||||||||||||||||||||
| Taxpayer-supported entities | 5.0 | 4.8 | 4.8 | 4.9 | 5.6 | 5.3 | 6.1 | 7.3 | 8.3 | 9.0 | 6.8 | |||||||||||||||||||||||||||||||||
| Total taxpayer-supported debt | 15.7 | 15.4 | 14.4 | 15.0 | 19.5 | 17.8 | 16.4 | 18.9 | 21.3 | 23.0 | 4.3 | |||||||||||||||||||||||||||||||||
| Self-supported debt: | ||||||||||||||||||||||||||||||||||||||||||||
| Commercial Crown corporations & agencies. | 9.2 | 7.6 | 7.8 | 8.4 | 8.9 | 8.1 | 7.7 | 7.9 | 8.1 | 8.0 | -1.6 | |||||||||||||||||||||||||||||||||
| Total provincial debt | 24.9 | 23.0 | 22.2 | 23.4 | 28.4 | 25.9 | 24.0 | 27.0 | 29.6 | 31.1 | 2.5 | |||||||||||||||||||||||||||||||||
| Growth rates (per cent): | ||||||||||||||||||||||||||||||||||||||||||||
| Taxpayer-supported debt: | ||||||||||||||||||||||||||||||||||||||||||||
| Provincial government direct operating | -42.2 | -75.1 | -100.0 | - | - | -17.3 | - | - | 69.2 | 14.1 | -15.1 | |||||||||||||||||||||||||||||||||
| Provincial government capital | 6.3 | 21.7 | -2.0 | 9.5 | 9.4 | 7.7 | 9.4 | 10.5 | 12.8 | 12.0 | 9.7 | |||||||||||||||||||||||||||||||||
| Taxpayer-supported entities | 6.2 | 3.4 | 6.0 | 6.0 | 12.3 | 8.7 | 27.8 | 22.3 | 18.9 | 12.7 | 12.4 | |||||||||||||||||||||||||||||||||
| Total taxpayer-supported debt | -2.9 | 5.1 | -2.1 | 8.3 | 29.2 | 4.3 | 2.2 | 18.7 | 17.0 | 12.4 | 9.2 | |||||||||||||||||||||||||||||||||
| Self-supported debt: | ||||||||||||||||||||||||||||||||||||||||||||
| Commercial Crown corporations & agencies. | 8.0 | -12.4 | 9.2 | 11.4 | 5.5 | 3.6 | 5.2 | 6.1 | 6.5 | 2.2 | 4.5 | |||||||||||||||||||||||||||||||||
| Total provincial debt | 0.9 | -1.4 | 1.6 | 9.4 | 20.7 | 4.1 | 3.1 | 15.4 | 13.6 | 9.5 | 7.7 | |||||||||||||||||||||||||||||||||
Per capita: 3 | ||||||||||||||||||||||||||||||||||||||||||||
| Taxpayer-supported debt: | ||||||||||||||||||||||||||||||||||||||||||||
| Provincial government direct operating | 956 | 235 | - | - | 1,696 | 1,390 | - | 448 | 744 | 834 | -1.5 | |||||||||||||||||||||||||||||||||
| Provincial government capital | 4,883 | 5,858 | 5,646 | 6,079 | 6,570 | 7,014 | 7,502 | 8,092 | 8,957 | 9,862 | 8.1 | |||||||||||||||||||||||||||||||||
| Taxpayer-supported entities | 2,702 | 2,754 | 2,872 | 2,995 | 3,323 | 3,579 | 4,473 | 5,338 | 6,229 | 6,904 | 11.0 | |||||||||||||||||||||||||||||||||
| Total taxpayer-supported debt | 8,540 | 8,846 | 8,518 | 9,074 | 11,590 | 11,983 | 11,975 | 13,878 | 15,929 | 17,600 | 8.4 | |||||||||||||||||||||||||||||||||
| Self-supported debt: | ||||||||||||||||||||||||||||||||||||||||||||
| Commercial Crown corporations & agencies. | 5,009 | 4,323 | 4,646 | 5,090 | 5,305 | 5,445 | 5,600 | 5,801 | 6,065 | 6,092 | 2.2 | |||||||||||||||||||||||||||||||||
| Total provincial debt | 13,549 | 13,170 | 13,165 | 14,164 | 16,895 | 17,428 | 17,575 | 19,807 | 22,083 | 23,781 | 6.5 | |||||||||||||||||||||||||||||||||
| Real Per Capita Provincial Debt (2022 $) 4 | 16,106 | 15,330 | 14,918 | 15,684 | 18,566 | 18,631 | 17,575 | 19,072 | 20,744 | 21,860 | 3.5 | |||||||||||||||||||||||||||||||||
| Growth rate (per cent) | -2.6 | -4.8 | -2.7 | 5.1 | 18.4 | 0.4 | -5.7 | 8.5 | 8.8 | 5.4 | 3.1 | |||||||||||||||||||||||||||||||||
| 1 | Numbers may not add due to rounding. | |
| 2 | Debt as a per cent of GDP is calculated using nominal GDP for the calendar year ending in the fiscal year (e.g. 2023/24 debt divided by nominal GDP for the 2023 calendar year). | |
| 3 | Per capita debt is calculated using July 1 population (e.g. 2023/24 debt divided by population on July 1, 2023). | |
| 4 | Debt is converted to real (inflation-adjusted) terms using the consumer price index (CPI) for the corresponding calendar year (e.g. 2023 CPI for 2023/24 debt). |
| Budget and Fiscal Plan - 2023/24 to 2025/26 | | 169 | |
Appendix
Table A19 Key Provincial Debt Indicators – 2016/17 to 2025/26
| Actual 2016/17 | Actual 2017/18 | Actual 2018/19 | Actual 2019/20 | Actual 2020/21 | Actual 2021/22 | Updated Forecast 2022/23 | Budget Estimate 2023/24 | Plan 2024/25 | Plan 2025/26 | Average annual change | ||||||||||||||||||||||||||||||||||
| (per cent) | ||||||||||||||||||||||||||||||||||||||||||||
| Debt to revenue (per cent) | ||||||||||||||||||||||||||||||||||||||||||||
| Total provincial | 99.3 | 94.7 | 89.5 | 95.9 | 115.1 | 104.3 | 93.5 | 113.7 | 125.5 | 132.6 | 3.3 | |||||||||||||||||||||||||||||||||
| Taxpayer-supported | 81.8 | 82.5 | 75.0 | 80.6 | 101.2 | 90.8 | 78.7 | 100.1 | 114.8 | 124.9 | 4.8 | |||||||||||||||||||||||||||||||||
| Debt per capita ($)1 | ||||||||||||||||||||||||||||||||||||||||||||
| Total provincial | 13,549 | 13,170 | 13,165 | 14,164 | 16,895 | 17,428 | 17,575 | 19,807 | 22,083 | 23,781 | 6.5 | |||||||||||||||||||||||||||||||||
| Taxpayer-supported | 8,540 | 8,846 | 8,518 | 9,074 | 11,590 | 11,983 | 11,975 | 13,878 | 15,929 | 17,600 | 8.4 | |||||||||||||||||||||||||||||||||
| Debt to nominal GDP (per cent) 2 | ||||||||||||||||||||||||||||||||||||||||||||
| Total provincial | 24.9 | 23.0 | 22.2 | 23.4 | 28.4 | 25.9 | 24.0 | 27.0 | 29.6 | 31.1 | 2.5 | |||||||||||||||||||||||||||||||||
| Taxpayer-supported | 15.7 | 15.4 | 14.4 | 15.0 | 19.5 | 17.8 | 16.4 | 18.9 | 21.3 | 23.0 | 4.3 | |||||||||||||||||||||||||||||||||
| Interest bite (cents per dollar of revenue) 3 | ||||||||||||||||||||||||||||||||||||||||||||
| Total provincial | 3.8 | 4.0 | 3.8 | 3.8 | 3.7 | 3.3 | 2.8 | 3.5 | 3.9 | 4.3 | 1.4 | |||||||||||||||||||||||||||||||||
| Taxpayer-supported | 3.2 | 3.3 | 3.2 | 3.1 | 3.1 | 2.8 | 2.4 | 2.9 | 3.5 | 3.9 | 2.2 | |||||||||||||||||||||||||||||||||
| Interest costs ($ millions) | ||||||||||||||||||||||||||||||||||||||||||||
| Total provincial | 2,521 | 2,759 | 2,786 | 2,893 | 2,817 | 2,848 | 2,836 | 3,333 | 3,842 | 4,352 | 6.3 | |||||||||||||||||||||||||||||||||
| Taxpayer-supported | 1,644 | 1,725 | 1,793 | 1,807 | 1,832 | 1,896 | 1,962 | 2,206 | 2,672 | 3,135 | 7.4 | |||||||||||||||||||||||||||||||||
Interest rate (per cent) 4 Taxpayer-supported | 3.9 | 4.1 | 4.2 | 4.1 | 3.5 | 3.1 | 3.1 | 3.2 | 3.3 | 3.3 | -1.7 | |||||||||||||||||||||||||||||||||
| Background Information: | ||||||||||||||||||||||||||||||||||||||||||||
| Revenue ($ millions) | ||||||||||||||||||||||||||||||||||||||||||||
| Total provincial 5 | 66,334 | 68,551 | 73,734 | 75,283 | 75,691 | 86,903 | 99,997 | 94,901 | 97,663 | 101,262 | 4.8 | |||||||||||||||||||||||||||||||||
| Taxpayer-supported 6 | 50,726 | 52,866 | 56,881 | 57,386 | 59,033 | 68,658 | 80,985 | 75,511 | 77,065 | 79,554 | 5.1 | |||||||||||||||||||||||||||||||||
| Debt ($ millions) | ||||||||||||||||||||||||||||||||||||||||||||
| Total provincial | 65,837 | 64,919 | 65,962 | 72,161 | 87,100 | 90,666 | 93,489 | 107,924 | 122,607 | 134,300 | 8.2 | |||||||||||||||||||||||||||||||||
| Taxpayer-supported 7 | 41,499 | 43,607 | 42,681 | 46,229 | 59,750 | 62,341 | 63,701 | 75,617 | 88,436 | 99,395 | 10.2 | |||||||||||||||||||||||||||||||||
| Provincial nominal GDP ($ millions) 8 | 263,912 | 282,283 | 297,392 | 308,993 | 306,947 | 350,598 | 389,129 | 400,093 | 414,866 | 432,405 | 5.6 | |||||||||||||||||||||||||||||||||
| Population (thousands at July 1) 9 | 4,859 | 4,929 | 5,010 | 5,095 | 5,155 | 5,202 | 5,319 | 5,449 | 5,552 | 5,647 | 1.7 | |||||||||||||||||||||||||||||||||
| 1 | The ratio of debt to population (e.g. 2023/24 debt divided by population at July 1, 2023). | |
| 2 | The ratio of debt outstanding at fiscal year end to provincial nominal gross domestic product (GDP) for the calendar year ending in the fiscal year (e.g. 2023/24 debt divided by 2023 nominal GDP). | |
| 3 | The ratio of interest costs (less sinking fund interest) to revenue. Figures include capitalized interest expense in order to provide a more comparable measure to outstanding debt. | |
| 4 | Weighted average of all outstanding debt issues. | |
| 5 | Includes revenue of the consolidated revenue fund (excluding dividends from enterprises) plus revenue of all government organizations and enterprises. | |
| 6 | Excludes revenue of government enterprises, but includes dividends from enterprises paid to the consolidated revenue fund. | |
| 7 | Excludes debt of commercial Crown corporations and agencies and funds held under the province's warehouse borrowing program. | |
| 8 | Nominal GDP for the calendar year ending in the fiscal year (e.g. nominal GDP for 2023 is used for the fiscal year ended March 31, 2024). | |
| 9 | Population at July 1st within the fiscal year (e.g. population at July 1, 2023 is used for the fiscal year ended March 31, 2024). |
| 170 | | Budget and Fiscal Plan - 2023/24 to 2025/26 | |
This page
intentionally left blank.