Exhibit 99.12
First quarterly report september 2023

This page intentionally left blank
First quarterly report fiscal plan update 2023/24 – 2025/26 2023/24 economic outlook and financial forecast & three month results april - june 2023
British Columbia Cataloguing in Publication Data
British Columbia. Ministry of Finance.
Quarterly report on the economy, fiscal situation and Crown corporations. — ongoing–
Quarterly.
Title on cover: Quarterly report.
Continues: British Columbia. Ministry of Finance.
Quarterly financial report. ISSN 0833-1375.
ISSN 1192-2176 — Quarterly Report on the economy, fiscal situation and Crown corporations.
1. Finance, Public — British Columbia — Accounting — Periodicals. 2. British Columbia — Economic conditions — 1945– — Periodicals.*
3. Corporations, Government — British Columbia — Accounting — Periodicals. I. Title.
HJ13.B77 354.711’007231’05
| 2023/24 First Quarterly Report September 15, 2023 | | TABLE OF CONTENTS |
| Updated Fiscal Plan 2023/24 to 2025/26 | ||
| Tables: | ||
| Updated Fiscal Plan 2023/24 to 2025/26 | 1 | |
| Part One — Updated 2023/24 Financial Forecast | ||
| Introduction | 5 | |
| Revenue | 7 | |
| Expense | 10 | |
| Consolidated Revenue Fund (CRF) Spending | 10 | |
| Service Delivery Agency Spending | 11 | |
| Full-Time Equivalents for the BC Public Service | 12 | |
| Provincial Capital Spending | 12 | |
| Projects Over $50 Million | 13 | |
| Provincial Debt | 16 | |
| Risks to the Fiscal Forecast | 17 | |
| Supplementary Schedules | 19 | |
Tables: | ||
| 1.1 | Forecast Update | 5 |
| 1.2 | Financial Forecast Changes | 6 |
| 1.3 | Comparison of Major Factors Underlying Revenue | 8 |
| 1.4 | Pandemic Recovery Contingencies | 11 |
| 1.5 | Capital Spending Update | 12 |
| 1.6 | Provincial Debt Update | 16 |
| 1.7 | Operating Statement | 19 |
| 1.8 | Revenue by Source | 20 |
| 1.9 | Expense by Ministry, Program and Agency | 21 |
| 1.10 | Expense by Function | 22 |
| 1.11 | Capital Spending | 23 |
| 1.12 | Capital Expenditure Projects Greater Than $50 million | 24 |
| 1.13 | Provincial Debt | 28 |
| 1.14 | Statement of Financial Position | 29 |
| First Quarterly Report 2023/24 | | i |
Table of Contents
Part Two — Economic Review and Outlook
| Summary | 31 | |
| British Columbia Economic Activity and Outlook | 32 | |
| Labour Market | 33 | |
| Consumer Spending and Inflation | 34 | |
| Housing | 36 | |
| Business and Government | 38 | |
| External Trade and Commodity Markets | 39 | |
| Demographics | 41 | |
| Risks to the Economic Outlook | 41 | |
| External Outlook | 42 | |
| United States | 42 | |
| Canada | 45 | |
| Asia | 47 | |
| Europe | 48 | |
| Financial Markets | 48 | |
| Interest Rates | 48 | |
| Exchange Rates | 50 | |
| Tables: | ||
| 2.1 | British Columbia Economic Indicators | 32 |
| 2.2 | U.S. Real GDP Forecast: Consensus vs B.C. Ministry of Finance | 44 |
| 2.3 | Canadian Real GDP Forecast: Consensus vs B.C. Ministry of Finance | 46 |
| 2.4 | Private Sector Canadian Interest Rate Forecasts | 50 |
| 2.5 | Private Sector Exchange Rate Forecasts | 51 |
| 2.6.1 | Gross Domestic Product (GDP): British Columbia | 52 |
| 2.6.2 | Selected Nominal Income and Other Indicators: British Columbia | 53 |
| 2.6.3 | Labour Market Indicators: British Columbia | 53 |
| 2.6.4 | Major Economic Assumptions | 54 |
| ii | | First Quarterly Report 2023/24 |
Table of Contents
Appendix — Fiscal Plan Update
Tables:
| A1 | Material Assumptions – Revenue | 55 |
| A2 | Natural Gas Price Forecasts – 2023/24 to 2025/26 | 60 |
| A3 | Material Assumptions – Expense | 62 |
| A4 | Operating Statement – 2016/17 to 2025/26 | 65 |
| A5 | Revenue by Source – 2016/17 to 2025/26 | 66 |
| A6 | Revenue by Source Supplementary Information – 2016/17 to 2025/26 | 67 |
| A7 | Expense by Function – 2016/17 to 2025/26 | 68 |
| A8 | Expense by Function Supplementary Information – 2016/17 to 2025/26 | 69 |
| A9 | Full-Time Equivalents (FTEs) – 2016/17 to 2025/26 | 70 |
| A10 | Capital Spending – 2016/17 to 2025/26 | 71 |
| A11 | Statement of Financial Position – 2016/17 to 2025/26 | 72 |
| A12 | Changes in Financial Position – 2016/17 to 2025/26 | 73 |
| A13 | Provincial Debt – 2016/17 to 2025/26 | 74 |
| A14 | Provincial Debt Supplementary Information – 2016/17 to 2025/26 | 75 |
| A15 | Key Provincial Debt Indicators – 2016/17 to 2025/26 | 76 |
| First Quarterly Report 2023/24 | | iii |

This page intentionally left blank
| UPDATED FISCAL PLAN – 2023/24 to 2025/26 |
| ($ millions) | 2023/24 | 2024/25 | 2025/26 | |||||||||
| Deficit - Budget 2023 | (4,216 | ) | (3,754 | ) | (3,043 | ) | ||||||
| Fiscal Plan Updates: | ||||||||||||
| Personal income tax | (522 | ) | (556 | ) | (579 | ) | ||||||
| Corporate income tax | 99 | 1,165 | (561 | ) | ||||||||
| Sales tax | 175 | 195 | 191 | |||||||||
| Carbon tax | (111 | ) | (113 | ) | (114 | ) | ||||||
| Property transfer tax | 151 | 104 | 94 | |||||||||
| Other taxation revenue | 77 | 57 | 78 | |||||||||
| Natural gas royalties | (1,179 | ) | (469 | ) | (336 | ) | ||||||
| Other natural resources revenue | (201 | ) | (89 | ) | 25 | |||||||
| Contributions from the federal government - DFAA | (420 | ) | 459 | 181 | ||||||||
| Contributions from the federal government - other | 319 | 13 | 45 | |||||||||
| Other revenue | 150 | 246 | 287 | |||||||||
| Wildfires | (762 | ) | - | - | ||||||||
| Other spending changes | (234 | ) | (405 | ) | (405 | ) | ||||||
| Deficit - First Quarterly Report | (6,674 | ) | (3,147 | ) | (4,137 | ) | ||||||
| Prudence included in fiscal plan: | ||||||||||||
| Contingencies - General, CleanBC and Climate & Emergency Response | (4,500 | ) | (4,800 | ) | (4,700 | ) | ||||||
| Pandemic Recovery Contingencies | (1,000 | ) | - | - | ||||||||
| Forecast allowance | (700 | ) | (500 | ) | (500 | ) | ||||||
| Capital Spending: | ||||||||||||
| Taxpayer-supported capital spending | 12,180 | 12,639 | 13,076 | |||||||||
| Self-supported capital spending | 4,073 | 4,117 | 2,853 | |||||||||
| 16,253 | 16,756 | 15,929 | ||||||||||
| Provincial Debt: | ||||||||||||
| Taxpayer-supported debt | 70,772 | 84,737 | 98,130 | |||||||||
| Self-supported debt | 31,562 | 34,092 | 34,713 | |||||||||
| Total debt (including forecast allowance) | 103,034 | 119,329 | 133,343 | |||||||||
| Taxpayer-supported debt-to-GDP ratio | 17.6 | % | 20.3 | % | 22.6 | % | ||||||
| Taxpayer-supported debt-to-revenue ratio | 95.5 | % | 108.7 | % | 124.6 | % |
Financial Outlook
The First Quarterly Report shows an increased deficit forecast for 2023/24 mainly due to lower natural gas royalties, lower personal income tax, and higher spending for wildfire response. The deficit projection is lower in 2024/25 but higher in 2025/26 reflecting updated revenue forecasts for corporate income tax and other streams, as outlined in this report.
Compared to Budget 2023, revenue forecasts are lower by $1.5 billion in 2023/24, higher by $1.0 billion in 2024/25 and lower by $689 million in 2025/26. Expense projections are higher by $996 million in 2023/24 and by $405 million in 2024/25 and 2025/26. These changes result in a forecast deficit of $6.7 billion in 2023/24, $3.1 billion in 2024/25, and $4.1 billion in 2025/26, as shown in the table above.
Personal income taxation revenue is lower by $1.7 billion over the fiscal plan mainly reflecting preliminary 2022 income tax returns. Corporate income tax projections have shifted based on the federal government’s updated forecast of national corporate taxable income, with an increase in 2024/25 and reduction in 2025/26. This is in contrast to last year’s first quarterly update, when the income tax data showed significant improvements.
| First Quarterly Report 2023/24 | | 1 |
Updated Fiscal Plan – 2023/24 to 2025/26
Over the three years, natural resource revenue is forecast to be $2.2 billion lower than at Budget 2023, mostly from natural gas royalties as a result of lower prices. The updated natural gas price forecast for 2023/24 is $1.29 ($Cdn/gigajoule, plant inlet), down from the budget outlook ($3.04), a 58 per cent reduction. The Ministry of Finance incorporates a prudent forecast for natural gas revenue, using a price forecast that is within the 20th percentile of the private sector forecasts.
Contributions from the federal government are higher mainly as a result of a one-time top-up payment of $273 million under the Canada Health Transfer. Also, funding under the Disaster Financial Assistance Arrangements is re-profiled to reflect updated spending timelines.
Compared to budget, expenses in 2023/24 are expected to be higher mainly as a result of wildfire response costs, as the province faces record-breaking wildfires in many areas. The updated expense outlook also includes higher spending by government organizations, higher interest expense and lower uptake of refundable tax credits.
Economic Outlook
B.C.’s economy continues to be resilient, despite the higher-than-expected interest rate environment. Employment has posted modest gains, and consumer spending has been supported by strong population growth. Total inflation has eased from 8.1 per cent in May 2022 to 3.0 per cent in July 2023. Housing markets are adjusting to higher interest rates, with increased home sales activity in recent months, and robust new home construction. However, merchandise exports have declined in the first half of 2023, reflecting weaker demand from B.C.’s trading partners and lower prices for key commodities compared to the first half of 2022.
The First Quarterly Report forecast for B.C. real GDP growth in 2023 has been revised up to 1.2 per cent from the Budget 2023 forecast of 0.4 per cent, and the forecast for 2024 has been revised down to 0.8 per cent from 1.5 per cent. This revision largely reflects weaker exports and the impact of higher interest rates over a longer than expected period, with increased borrowing costs weighing on consumer spending and business investment.
British Columbia’s Real GDP Outlook
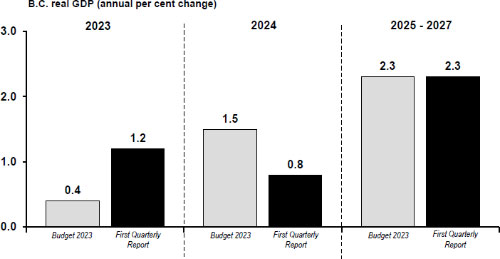
The economic outlook over the 2025 to 2027 period is relatively unchanged from the Budget 2023 forecast. Over this period, inflation is expected to normalize and interest rates are expected to stabilize.
Capital Investments
Taxpayer-supported capital spending on hospitals, education facilities, transportation infrastructure, housing and other projects is financed through a combination of provincial borrowing, funding provided by third parties, and from internal cash flows. Taxpayer-supported capital spending is forecast to total $37.9 billion over the fiscal plan period, which is $350 million higher than the Budget 2023 forecast mainly due to changes in the timing of capital projects and increased spending in health and social housing sectors.
Over the three years, self-supported infrastructure spending by commercial Crown corporations totals $11.0 billion.
Debt Affordability
Government’s key debt affordability metric, the taxpayer-supported debt-to-GDP ratio, is forecast to improve from Budget 2023 due to lower debt balances from fiscal 2022/23 (see chart below). Taxpayer-supported debt is projected at $98.1 billion at the end of the fiscal plan period, which is $1.3 billion lower than the budget forecast.
B.C. continues to have low debt-affordability metrics relative to other Canadian provinces.
| 2 | | First Quarterly Report 2023/24 |
Updated Fiscal Plan – 2023/24 to 2025/26
Taxpayer-Supported Debt-to-GDP
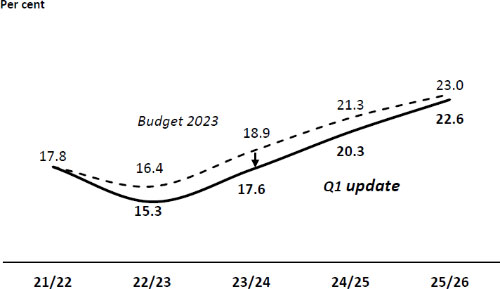
Including the self-supported debt of commercial Crown corporations and a $500 million forecast allowance, the total provincial debt is projected at $133.3 billion by the end of 2025/26.
Risks to the Fiscal Plan
The main risks to the government’s fiscal plan include:
| · | risks to the B.C. economic outlook, largely due to uncertainty surrounding global economic activity, as persistent price pressures may lead to higher than anticipated interest rates for longer; |
| · | assumptions underlying revenue and Crown corporation forecasts such as economic factors and commodity prices; |
| · | increased spending which may include wildfire and floods response and increased demand and costs for government services such as health care and social services; and |
| · | potential changes to federal government transfer allocations, cost-sharing agreements with the federal government, and impacts on the provincial income tax bases arising from federal tax policy and budget changes. |
Government incorporates several levels of prudence in its projections to help mitigate the risks to the fiscal plan, including the following:
| · | economic forecast prudence, as shown by a lower outlook for B.C.’s major trading partners, resulting in a projection for B.C.’s real GDP growth that is within the range of private sector forecasters in 2023 and 2024; |
| · | contingencies vote allocations of $5.5 billion in 2023/24, $4.8 billion in 2024/25 and $4.7 billion in 2025/26 to help manage unexpected pressures including pandemic and climate change and emergency response-related costs, as well as the cost of unsigned labour agreements; |
| · | a forecast allowance of $700 million in 2023/24 and $500 million in 2024/25 and 2025/26 to guard against volatility, including revenue changes; and |
| · | the natural gas revenue forecast continues to incorporate a prudent price forecast that is within the 20th percentile of the private sector forecasts. |
Conclusion
B.C.’s fiscal forecast for 2023/24 shows a higher deficit from budget, mainly as a result of lower natural gas royalties and higher spending for wildfire response. The province’s economy continues to be resilient, and debt projections have improved, maintaining the Province’s fiscal sustainability.
Government continues to invest in the priorities outlined in Budget 2023, including housing, health care and mental health, affordability, and climate change.
| First Quarterly Report 2023/24 | | 3 |

This page intentionally left blank
PART 1 | UPDATED 2023/24 FINANCIAL FORECAST
Introduction
| Table 1.1 2023/24 Forecast Update | ||||||||||||
| ($ millions) | Budget 2023 | First Quarterly Report | Change | |||||||||
| Revenue | 77,690 | 76,228 | (1,462 | ) | ||||||||
| Expense | (80,206 | ) | (81,202 | ) | (996 | ) | ||||||
| Pandemic Recovery Contingencies | (1,000 | ) | (1,000 | ) | - | |||||||
| Forecast allowance | (700 | ) | (700 | ) | - | |||||||
| Surplus (Deficit) | (4,216 | ) | (6,674 | ) | (2,458 | ) | ||||||
| Capital Spending: | ||||||||||||
| Taxpayer-supported capital spending | 11,813 | 12,180 | 367 | |||||||||
| Self-supported capital spending | 4,027 | 4,073 | 46 | |||||||||
| 15,840 | 16,253 | 413 | ||||||||||
| Provincial Debt: | ||||||||||||
| Taxpayer-supported debt | 75,617 | 70,772 | (4,845 | ) | ||||||||
| Self-supported debt | 31,607 | 31,562 | (45 | ) | ||||||||
| Total debt (including forecast allowance) | 107,924 | 103,034 | (4,890 | ) | ||||||||
| Taxpayer-supported debt-to-GDP ratio | 18.9 | % | 17.6 | % | -1.3 | % | ||||||
| Taxpayer-supported debt-to-revenue ratio | 100.1 | % | 95.5 | % | -4.6 | % | ||||||
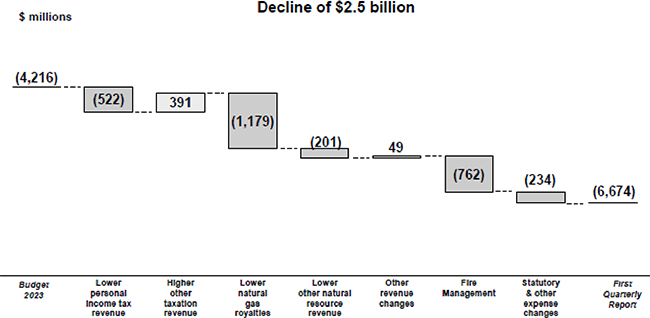
The first quarter update for 2023/24 shows a decline in revenue and an increase in spending resulting in a deficit of $6.7 billion — up $2.5 billion from the budget deficit forecast of $4.2 billion. The forecast for revenue is lower for personal income tax, carbon tax, natural gas royalties, and other natural resources, with increases in sales tax and property transfer tax. The expense forecast is higher mainly due to the wildfire response.
Details of the revenue and expense forecast changes from Budget 2023 are shown in Chart 1.1 and Table 1.2.
Chart 1.1 2023/24 Deficit – Major Changes from Budget 2023
| First Quarterly Report 2023/24 | | 5 |
Updated 2023/24 Financial Forecast
Table 1.2 2023/24 Financial Forecast Changes
| ($ millions) | ||||
| 2023/24 deficit at Budget 2023 (February 28, 2023) | (4,216 | ) | ||
| Revenue1 changes: | ||||
| Personal income tax – weaker preliminary 2022 tax assessment partly offset by improvement in 2023 household income | (522 | ) | ||
| Corporate income tax – gain in prior-year settlement payment, offset by decrease in instalments reflecting revised outlook of 2023 national corporate taxable income | 99 | |||
| Provincial sales tax – higher 2022/23 carry forward and year-to-date sales activity | 175 | |||
| Property transfer tax – due to higher than expected sales results | 151 | |||
| Carbon tax – lower sales volume in most fuel types reflecting prior year and year-to-date results | (111 | ) | ||
| Tobacco tax – reflecting lower prior year and year-to-date sales results | (45 | ) | ||
| Other taxation sources – mainly reflecting the impacts of the 2022/23 year-end and year-to-date results | 122 | |||
| Natural gas royalties – lower prices, volumes and natural gas liquids royalties, partly offset by decreased utilization of royalty and infrastructure programs/credit | (1,179 | ) | ||
| Mining – lower coal prices and production, partly offset by higher copper prices | (174 | ) | ||
| Electricity sales under the Columbia River Treaty – lower Mid-C electricity prices | (44 | ) | ||
| Forests – mainly higher stumpage rates | 40 | |||
| Other natural resources – mainly lower water rental revenues, other fees and rental tenure revenue | (23 | ) | ||
| Fees, licences, investment earnings and miscellaneous revenue: | ||||
| Post-secondary institutions | 36 | |||
| Other sources – mainly higher revenue from fees and investment earnings | 111 | |||
| Canada health and social transfers – mainly one-time funding to strengthen public health care | 282 | |||
| Other federal government transfers – mainly lower claims under the Disaster Financial Assistance Arrangements relating to 2021 rainstorm | (383 | ) | ||
| Commercial Crown corporation net income | 3 | |||
| Total revenue changes | (1,462 | ) | ||
| Less : expense1 increases (decreases): | ||||
| Consolidated Revenue Fund changes: | ||||
| Statutory spending: | ||||
| Fire management costs | 762 | |||
| Housing Priority Initiatives Special Account | 104 | |||
| Other statutory spending | 17 | |||
| Refundable tax credits – mainly reflects lower film tax credits | (81 | ) | ||
| Other expense changes – mainly higher interest costs | 91 | |||
| Spending funded by third party recoveries | (73 | ) | ||
| Changes in spending profile of service delivery agencies: | ||||
| School districts | 177 | |||
| Universities | 165 | |||
| Colleges and institutes | 152 | |||
| Health authorities and hospital societies | 1,170 | |||
| Other service delivery agencies2 | 455 | |||
| (Increase) decrease in transfers to service delivery agencies - accounting elimination | (1,943 | ) | ||
| Total expense changes | 996 | |||
| Total changes | (2,458 | ) | ||
| 2023/24 deficit at the First Quarterly Report | (6,674 | ) | ||
1 Detailed descriptions of changes are provided in the revenue and expense sections of this report.
2 Includes BC Transportation Financing Authority, BC Transit, BC Housing Management Commission, Community Living BC, and other entities.
| 6 | | First Quarterly Report 2023/24 |
Updated 2023/24 Financial Forecast
Projected taxpayer-supported capital spending in 2023/24 is $12.2 billion, which is $367 million higher than forecast in Budget 2023, with increased spending in the health sector and social housing, partly offset by lower spending in the education sector. The self-supported capital spending forecast is $4.1 billion, with minor changes from budget.
The taxpayer-supported debt at the end of 2023/24 is forecast at $70.8 billion, which is lower by $4.8 billion compared to the Budget 2023 forecast as a result of lower debt balances at the end of fiscal 2022/23 in addition to higher cash balances. Self-supported debt is forecast to be $31.6 billion with minor changes from budget.
Revenue
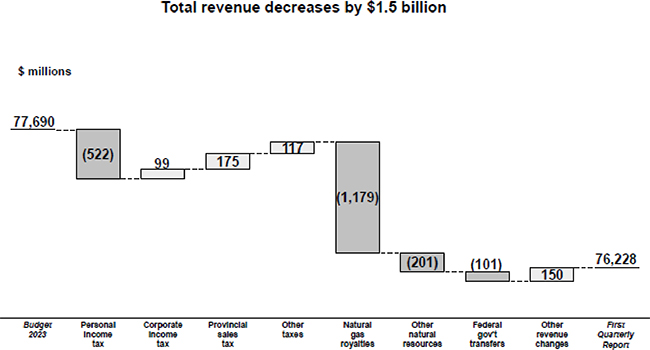
Revenue for 2023/24 is forecast to be $76.2 billion — $1.5 billion lower than the projection in Budget 2023. The natural resource revenue forecast is lower by $1.4 billion mainly reflecting lower natural gas royalties. The remaining $138 million decrease to the revenue forecast reflects lower taxation revenue, mainly due to lower than expected preliminary 2022 income tax returns, effects of the economic update, the impacts of final 2022/23 revenue that carry forward, year-to-date results, and weaker federal government outlook of national corporate taxable income.
Chart 1.2 Revenue Changes from Budget 2023
Detailed revenue projections are disclosed in Table 1.8, and key assumptions and sensitivities relating to revenue are provided in Table A1. An analysis on historical volatility of major economic drivers can be found in the 2023 B.C. Financial and Economic Review (pages 17-18). For 2023/24, the major changes from the Budget 2023 forecast include the following:
| First Quarterly Report 2023/24 | | 7 |
Updated 2023/24 Financial Forecast
Table 1.3 Comparison of Major Factors Underlying Revenue
| Calendar Year | First Quarterly Report | Budget 2023 | ||||||||||||||||||||||||||||||
| Per cent growth unless otherwise indicated | 2022 | 2023 | 2024 | 2025 | 2022 | 2023 | 2024 | 2025 | ||||||||||||||||||||||||
| Real GDP | 3.3 | 1.2 | 0.8 | 2.4 | 2.8 | 0.4 | 1.5 | 2.4 | ||||||||||||||||||||||||
| Nominal GDP | 11.7 | 2.9 | 3.3 | 4.3 | 11.0 | 2.8 | 3.7 | 4.2 | ||||||||||||||||||||||||
| Household income | 6.7 | 6.3 | 4.2 | 4.1 | 7.1 | 6.1 | 4.3 | 4.1 | ||||||||||||||||||||||||
| Wages and salaries | 10.7 | 5.9 | 5.1 | 4.6 | 11.3 | 6.3 | 5.2 | 4.4 | ||||||||||||||||||||||||
| Corporations net operating surplus | 20.8 | -11.8 | -9.1 | 1.5 | 13.5 | -14.5 | -7.0 | 2.3 | ||||||||||||||||||||||||
| Employment | 3.2 | 1.1 | 0.8 | 1.3 | 3.2 | 0.4 | 1.0 | 1.2 | ||||||||||||||||||||||||
| Consumer expenditures on durable goods | -2.6 | 2.0 | 0.8 | 2.2 | -4.3 | -3.6 | 0.1 | 2.6 | ||||||||||||||||||||||||
| Consumer expenditures on goods and services | 10.4 | 6.4 | 4.7 | 4.4 | 9.6 | 6.9 | 4.9 | 4.2 | ||||||||||||||||||||||||
| Business investment | 12.7 | 4.0 | 4.8 | 5.5 | 11.5 | 1.4 | 5.5 | 7.0 | ||||||||||||||||||||||||
| Residential investment | 8.6 | 3.3 | 3.5 | 2.9 | 8.2 | -1.5 | 4.7 | 5.3 | ||||||||||||||||||||||||
| Retail sales | 3.1 | 2.4 | 2.5 | 3.4 | 3.0 | 1.8 | 2.9 | 3.4 | ||||||||||||||||||||||||
| Consumer Price Index | 6.9 | 3.9 | 2.5 | 2.2 | 6.9 | 3.9 | 2.5 | 2.2 | ||||||||||||||||||||||||
| Residential sales value | -30.4 | -11.6 | 16.9 | 7.4 | -30.3 | -19.8 | 20.5 | 8.2 | ||||||||||||||||||||||||
| B.C. Housing starts | -1.9 | 0.0 | -9.8 | -5.0 | -1.9 | -16.5 | -5.1 | 2.7 | ||||||||||||||||||||||||
| U.S. Housing starts | -3.0 | -11.1 | -2.5 | 0.4 | -3.0 | -16.6 | 3.9 | 0.4 | ||||||||||||||||||||||||
| SPF 2x4 price ($US/thousand board feet) | $ | 814 | $ | 400 | $ | 450 | $ | 500 | $ | 814 | $ | 400 | $ | 450 | $ | 500 | ||||||||||||||||
| Exchange rate (US cents/Canadian dollar) | 76.8 | 74.7 | 75.8 | 77.6 | 76.8 | 74.7 | 77.4 | 78.6 | ||||||||||||||||||||||||
| Fiscal Year | 2022/23 | 2023/24 | 2024/25 | 2025/26 | 2022/23 | 2023/24 | 2024/25 | 2025/26 | ||||||||||||||||||||||||
| Natural gas price ($Cdn/GJ at plant inlet) | $ | 4.09 | $ | 1.29 | $ | 2.03 | $ | 2.33 | $ | 3.81 | $ | 3.04 | $ | 2.69 | $ | 2.55 | ||||||||||||||||
| Bonus bid average bid price per hectare ($) | $ | 0 | $ | 200 | $ | 200 | $ | 300 | $ | 200 | $ | 275 | $ | 300 | $ | 200 | ||||||||||||||||
| Electricity price ($US/mega-watt hour, Mid-C) | $ | 85 | $ | 93 | $ | 90 | $ | 92 | $ | 93 | $ | 108 | $ | 99 | $ | 95 | ||||||||||||||||
| Metallurgical coal price ($US/tonne, fob Australia) | $ | 322 | $ | 248 | $ | 222 | $ | 210 | $ | 318 | $ | 252 | $ | 223 | $ | 204 | ||||||||||||||||
| Copper price ($US/lb) | $ | 3.87 | $ | 3.82 | $ | 3.96 | $ | 4.09 | $ | 3.74 | $ | 3.56 | $ | 3.73 | $ | 3.85 | ||||||||||||||||
| Average stumpage rates ($Cdn/cubic metre) | $ | 38.05 | $ | 19.04 | $ | 19.42 | $ | 22.14 | $ | 36.20 | $ | 18.07 | $ | 18.96 | $ | 21.82 | ||||||||||||||||
| Crown harvest volumes (million cubic metres) | 37.2 | 38.0 | 38.0 | 38.0 | 39.0 | 38.0 | 38.0 | 38.0 | ||||||||||||||||||||||||
Income Tax Revenue
Personal income tax revenue is down $522 million reflecting weaker 2022 preliminary tax assessment information, partly offset by slightly improved 2023 household income.
Corporate income tax revenue is up $99 million as a result of improvement from prior-year settlement payments, partially offset by lower advance instalments from the federal government. The budget forecast included a $1.1 billion prior-year settlement payment due to the federal government but instead this adjustment was recognized in the fiscal year 2022/23, reflecting the preliminary 2022 tax assessment information.
This improvement is offset by lower advance instalments from the federal government. The lower forecast for advance instalments is due to a significant change in the federal government forecast for 2023 national corporate taxable income, which is expected to decline by 16.5 per cent compared to a decline of 3.1 per cent assumed at budget.
Other Tax Revenue
Provincial sales tax revenue is up $175 million mainly due to improvements reflected in the 2022/23 Public Accounts that will carry forward, as well as increases in various components of taxable expenditures in 2023.
Property transfer tax revenue is up $151 million mainly due to higher-than-expected activity in the housing market reflecting demand, consistent with higher than assumed residential sales values.
Tobacco tax revenues are down $45 million due to lower year-to-date sales.
| 8 | | First Quarterly Report 2023/24 |
Updated 2023/24 Financial Forecast
Fuel tax revenues are down $30 million due to the impacts of lower 2022/23 and year-to-date sales volumes.
Carbon tax revenues are down $111 million due to the impacts of lower 2022/23 year-end results as well as year-to-date sales volumes on major fuel types. Carbon tax projection includes a tax rate increase to $65/tonne of carbon dioxide equivalent emissions, effective April 1, 2023, which was included in the Budget 2023 forecast.
Other taxation revenues are up $152 million due to higher property, insurance premium and employer health taxes reflecting the impacts of the 2022/23 results.
Natural Resources Revenue
Revenue from natural gas royalties is down $1.2 billion mainly due to lower prices for natural gas and natural gas liquids as well as slightly lower natural gas volumes, partially offset by decreased utilization of royalty and infrastructure program credits.
The updated natural gas price forecast is $1.29 ($Cdn/gigajoule, plant inlet), down from the Budget 2023 outlook ($3.04). The price assumption is within the 20th percentile of the private sector forecasters, continuing the prudence incorporated since 2013/14. Natural gas royalty rates are sensitive to prices in the $1.22 to $2.42 range. Hence, the effective royalty rate is generally expected to fall as prices decrease, depending on the take up of royalty program credits. Since the prices for natural gas liquids (e.g. pentane and condensate) are more closely aligned to oil rather than natural gas, the lower byproduct royalties from these commodities reflect the expected decrease in oil prices, now forecast to be $74.56 US/barrel in 2023/24, down 8 per cent from the budget outlook.
Revenue from coal, metals, minerals and other mining-related sources is down $174 million mainly due to lower coal prices and production reflecting global excess coal supply. This decrease is partially offset by higher copper prices.
Revenue from electricity sales under the Columbia River Treaty is down $44 million mainly reflecting lower Mid-C electricity prices which are closely aligned with natural gas prices. The price forecast reflects increased hydro capacity and availability of solar power in western electricity markets. Mid-C electricity prices, now forecast to be $92.90 US/mega-watt hour, are down 14 per cent from the budget outlook.
Forest revenue is up $40 million mainly due to higher stumpage revenue reflecting regular updates to the market pricing system. Total stumpage rates, now forecast to be $19.04 Cdn/cubic metre, are up 5 per cent from the budget outlook.
Revenue from other natural resources is down $23 million mainly due to decreased water rentals collected under the Water Sustainability Act and lower revenue related to annual natural gas and petroleum tenure payments.
Other Taxpayer-Supported Revenue
Other taxpayer-supported revenue consists of revenue from fees, licences, investment earnings and miscellaneous sources. These revenue sources are now expected to total $10.7 billion, up $147 million from budget.
The updated forecast for fee revenues totals $5.3 billion, up $81 million from budget mainly due to higher projections from post-secondary institutions and health authorities. The revised forecast for investment earnings is $1.4 billion, up $60 million from budget mainly due to higher interest rates. The miscellaneous revenue outlook of $4 billion is up $6 million from budget mainly due to increased projections from taxpayer-supported Crown entities.
| First Quarterly Report 2023/24 | | 9 |
Updated 2023/24 Financial Forecast
Federal Government Transfers
Federal government contributions are expected to be $13.5 billion, down $101 million from budget.
Canada health and social transfers have improved by $282 million, mainly reflecting one-time funding to strengthen the public health care system.
Other federal government contributions are down $383 million mainly due to lower claims under the Disaster Financial Assistance Arrangements, reflecting changes in cost and timing related to the 2021 November rainstorm event.
Expense
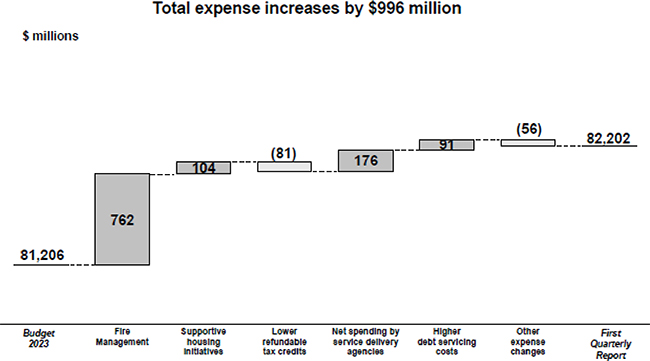
The First Quarterly Report expense forecast for 2023/24 is $996 million higher than Budget 2023 mainly due to higher spending for wildfire response and supportive housing initiatives.
Chart 1.3 Expense Changes from Budget 2023
Consolidated Revenue Fund (CRF) Spending
Statutory spending is projected at $802 million in 2023/24 and includes the following:
| · | $762 million for fire management costs — this is in addition to the $204 million in the fire management voted appropriation, for a total spending forecast of $966 million; |
| · | $104 million increase to support decampment in Vancouver and to provide permanent housing for individuals residing in temporary housing through the Housing Priority Initiatives Special Account; |
| · | $17 million in other statutory spending; offset by, |
| · | $81 million lower refundable tax transfers mainly reflecting lower film tax credits. |
| 10 | | First Quarterly Report 2023/24 |
Updated 2023/24 Financial Forecast
Other changes in CRF spending include $91 million increase in debt servicing costs due to higher interest rates.
Contingencies
Budget 2023 includes a Contingencies vote of $5.5 billion in 2023/24, with $1.0 billion in the Pandemic Recovery sub-vote, $2.2 billion allocated to Shared Recovery Mandate, and $2.3 billion allocated to General Programs, CleanBC and Climate & Emergency Response. Contingencies help fund unexpected costs such as flood recovery, wage mandate, increased costs for government services, and emerging priorities. These allocations remain unchanged in the First Quarterly Report.
Pandemic Recovery Contingencies
Budget 2023 allocated $1.0 billion for continued measures related to the pandemic and economic recovery. Table 1.4 provides an update on the notional allocations of the Province’s pandemic measures as of June 30, 2023.
Table 1.4 2023/24 Pandemic Recovery Contingencies
| $ millions | Updated Forecast | |||||||
Initiative | Budget 2023 | Q1 | ||||||
| Health COVID-19 Management | 875 | 875 | ||||||
| Supports for Vulnerable Populations | 20 | 20 | ||||||
| Tourism Initiative Envelope | 20 | 20 | ||||||
| Unallocated: available for additional health or recovery measures | 85 | 85 | ||||||
| Total | 1,000 | 1,000 | ||||||
Spending Recovered from Third Parties
Expenses funded by third parties are forecast to decrease by $73 million mainly due to lower recoveries from commercial Crown corporations through the fiscal agency loan program.
Operating Transfers to Service Delivery Agencies
Operating transfers to service delivery agencies are forecast to be $1.9 billion higher than Budget 2023 mainly due to higher grants to health organizations ($973 million) and education sector ($412 million) for wage mandate, a $311 million increase to BC Housing Management Commission, and an additional $247 million to other service delivery agencies. These funding increases are related to spending forecast changes noted below.
Service Delivery Agency Spending
Service delivery agency expenses are forecast to increase by $2.1 billion in 2023/24 compared to Budget 2023.
| · | School district expense forecasts are higher by $177 million mainly to reflect salary increases under the Shared Recovery Mandate and higher inflationary pressures affecting operating costs. |
| First Quarterly Report 2023/24 | | 11 |
Updated 2023/24 Financial Forecast
| · | Post-secondary sector expenses are forecast to increase by $317 million mainly due to salary increases under the Shared Recovery Mandate, which are funded by increased provincial grants to the institutions. |
| · | The health authority and hospital society expense forecast is $1.2 billion higher than Budget 2023, mainly due to salary increases under the Shared Recovery Mandate and higher operating costs. |
| · | Other service delivery agency spending is forecast to be $455 million higher than budget mainly due to increased spending by the BC Housing Management Commission to fund additional supportive housing and various updates across a number of other agencies. |
Detailed expense projections are disclosed in Table 1.9. Key spending assumptions and sensitivities are provided in the appendix Table A3.
Full-Time Equivalents for the BC Public Service
The projection of full-time equivalent (FTE) staff utilization for 2023/24 is 35,500 FTEs, an increase of 1,100 since budget, to support the continued response to a significant wildfire season and to implement key government priorities such as child care and education.
Provincial Capital Spending
Capital spending is projected to total $16.3 billion in 2023/24 — $413 million higher than the forecast in Budget 2023 (see Tables 1.5 and 1.11).
| Table 1.5 2023/24 Capital Spending Update | ||||
| ($ millions) | ||||
| Taxpayer-supported capital spending at Budget 2023 | 11,813 | |||
| Changes: | ||||
| Timing of school district spending | (29 | ) | ||
| Timing of post-secondary institution spending | (33 | ) | ||
| Higher health authority spending | 288 | |||
| Timing of transportation sector spending | (3 | ) | ||
| Higher social housing spending | 133 | |||
| Other net adjustments to capital schedules | 11 | |||
| Total taxpayer-supported changes | 367 | |||
| Taxpayer-supported capital spending - updated forecast | 12,180 | |||
| Self-supported capital spending at Budget 2023 | 4,027 | |||
| Higher BC Hydro spending | 46 | |||
| Self-supported capital spending - updated forecast | 4,073 | |||
| 2023/24 provincial capital spending at the First Quarterly Report | 16,253 | |||
Taxpayer-supported capital spending is projected at $12.2 billion. The $367 million increase since Budget 2023 is primarily due to higher planned spending on health routine capital programs by health authorities and social housing projects. This is partially offset by timing changes in capital spending on K-12 and post-secondary projects.
| 12 | | First Quarterly Report 2023/24 |
Updated 2023/24 Financial Forecast
At $4.1 billion, self-supported capital spending is $46 million higher than Budget 2023 primarily due to changes in the timing of BC Hydro expenditures.
Projects Over $50 million
Capital spending on projects greater than $50 million is presented in Table 1.12. Since Budget 2023 thirty projects have been added to the table:
| · | Carson Elementary School ($61 million); |
| · | Guildford Park Secondary School ($65 million); |
| · | La Vallée (Pemberton) Elementary School ($66 million); |
| · | New Cloverley Elementary School ($64 million); |
| · | New East Side Elementary School ($59 million); |
| · | North East Latimer Elementary School ($52 million); |
| · | Prince Rupert Middle School ($127 million); |
| · | Tamanawis Secondary School ($57 million); |
| · | Capilano University – New Squamish Campus ($63 million); |
| · | Vancouver Community College – Centre for Clean Energy and Automotive Innovation ($291 million); |
| · | Abbotsford Long-Term Care ($211 million); |
| · | Campbell River Long-Term Care ($134 million); |
| · | Delta Long-Term Care ($180 million); |
| · | FW Green Long-Term Care ($156 million); |
| · | Richmond Long-Term Care ($178 million); |
| · | Burnaby Hospital Redevelopment Phase 2 and BC Cancer Centre ($1.731 billion); |
| · | Belleville Terminal Replacement ($304 million); |
| · | Blackwater North Fraser Slide ($203 million); |
| · | Cottonwood Hill at Highway 97 Slide ($335 million); |
| · | Highway 1 Corridor – Falls Creek ($143 million); |
| · | Highway 1 Goldstream Safety Improvements ($162 million); |
| · | Highway 1 Jumping Creek to MacDonald ($245 million); |
| · | Highway 1 Selkirk ($129 million); |
| · | 1015 Hastings St. Development ($151 million); |
| · | 128 to 134 East Cordova St. ($166 million); |
| · | 320 Hastings St E. Redevelopment ($86 million); |
| · | BC Hydro – Kootenay Canal modernize controls project ($61 million); |
| · | BC Hydro – Peace to Kelly Lake stations sustainment project ($344 million); |
| First Quarterly Report 2023/24 | | 13 |
Updated 2023/24 Financial Forecast
| · | BC Hydro – John Hart dam seismic upgrade project ($913 million); and |
| · | BC Hydro – Bridge River 1 replace units 1-4 generators/governors project ($313 million). |
The following projects have been removed since Budget 2023 and are no longer listed in the table:
| · | British Columbia Institute of Technology – Health Sciences Centre for Advanced Simulation; and |
| · | Highway 1 Lower Lynn Corridor improvements. |
Changes since Budget 2023 for existing projects include:
| · | Burnaby North Secondary project’s year of completion was amended from 2023 to 2024 to align with revised project schedule; |
| · | Simon Fraser University – Student Housing project’s anticipated total cost decreased from $112 million to $108 million to reflect final project cost. Other contributions decreased from $39 million to $35 million; |
| · | University of Victoria – Student Housing project’s anticipated total cost increased from $231 million to $236 million to reflect revised project cost. Contributions from other sources increased from $103 million to $108 million; |
| · | Royal Roads University – West Shore Learning Centre project’s anticipated total cost increased from $100 million to $106 million to reflect revised project cost. Contributions from other sources increased from $20 million to $26 million; |
| · | University of Victoria - Engineering and Computer Science Building Expansion project’s anticipated total cost increased from $90 million to $133 million to reflect revised project cost. Internal borrowing increased from $65 million to $97 million and other contributions increased from $25 million to $36 million. Project’s anticipated year of completion was amended to align with revised project schedule; |
| · | British Columbia Institute of Technology – Student Housing project’s year of completion was amended from 2024 to 2025 to align with revised project schedule; |
| · | North Island College – Student Housing project’s year of completion was amended from 2024 to 2025 to align with revised project schedule; |
| · | Vancouver Island University – Student Housing project’s year of completion was amended from 2025 to 2026 to align with revised project schedule; |
| · | Peace Arch Hospital Renewal project’s anticipated total cost decreased from $91 million to $87 million to reflect revised project cost. Other contributions decreased from $83 million to $79 million; |
| · | The Clinical and Systems Transformation project’s anticipated total cost increased from $754 million to $799 million to reflect revised project cost. Other contributions increased from $52 million to $97 million; |
| · | Burnaby Hospital Redevelopment – Phase 1 project’s anticipated total cost increased from $612 million to $683 million to reflect the revised project scope. Internal borrowing increased from $578 million to $633 million and other contributions increased from $34 million to $50 million; |
| 14 | | First Quarterly Report 2023/24 |
Updated 2023/24 Financial Forecast
| · | Dawson Creek and District Hospital Replacement project’s anticipated total cost increased from $378 million to $590 million to reflect the updated post-tender budget. Internal borrowing increased from $247 million to $413 million and other contributions increased from $131 million to $177 million; |
| · | Royal Inland Hospital Phil and Jennie Gaglardi Tower project’s year of completion was amended from 2026 to 2027 to align with revised project schedule; |
| · | Cariboo Memorial Hospital Redevelopment project’s year of completion was amended from 2028 to 2029 to align with revised project schedule; |
| · | Vancouver General Hospital – Operating Rooms Renewal Phase 2 project’s year of completion was amended from 2028 to 2029 to align with revised project schedule; |
| · | Royal BC Museum – Collections and Research Building project’s anticipated total cost increased from $224 million to $270 million to reflect revised project budget. Internal borrowing increased from $224 million to $270 million; |
| · | Highway 1 Chase Four-Laning project’s anticipated total cost decreased from $220 million to $196 million to reflect revised project cost. Internal borrowing decreased from $208 million to $184 million; |
| · | Highway 1 Salmon Arm West project’s anticipated total cost decreased from $155 million to $140 million to reflect revised project cost. Internal borrowing decreased from $124 million to $109 million; |
| · | Highway 1 Quartz Creek Bridge Replacement project’s anticipated total cost decreased from $121 million to $119 million to reflect revised project cost. Internal borrowing decreased from $71 million to $69 million; |
| · | BC Transit Victoria HandyDART Facility project’s anticipated total cost increased from $60 million to $84 million to reflect revised project cost. Internal borrowing increased from $26 million to $41 million and other contributions increased from $13 million to $22 million; |
| · | Highway 1 R.W. Bruhn Bridge project’s year of completion was amended from 2025 to 2027 to align with revised project schedule. The project’s anticipated total cost increased from $225 million to $255 million to reflect revised project cost. Internal borrowing increased from $134 million to $164 million; |
| · | UBC load increase stage 2 project’s anticipated total cost decreased from $56 million to $53 million as final costs were lower than estimated for underground works; |
| · | Bridge River 2 upgrade units 7 and 8 project’s anticipated total cost decreased from $78 million to $75 million due to lower contractor cost; |
| · | Mica units 1 to 4 generator transformers replacement project’s anticipated total cost increased from $80 million to $89 million due to purchasing additional spare transformer and constructing infrastructure to store this equipment; |
| · | Mount Lehman substation upgrade project’s anticipated total cost decreased from $58 million to $55 million due to construction efficiencies and an earlier in service date; and |
| · | Wahleach refurbish generator project’s anticipated total cost increased from $51 million to $64 million to reflect changes to project scope, severe weather in 2021 and supply chain disruptions. |
| First Quarterly Report 2023/24 | | 15 |
Updated 2023/24 Financial Forecast
Provincial Debt
The provincial debt is projected to total $103.0 billion by the end of the fiscal year — $4.9 billion lower than the forecast in Budget 2023. This improvement is primarily due to lower debt balance from fiscal 2022/23 and changes in cash balances.
Table 1.6 2023/24 Provincial Debt Update 1
| ($ millions) | ||||
| Taxpayer-supported debt forecast at Budget 2023 | 75,617 | |||
| Changes: | ||||
| Lower debt level from 2022/23 | (3,767 | ) | ||
| Changes in operating results (before forecast allowance) | 2,458 | |||
| Non-cash items | 57 | |||
| Changes in cash balances 2 | (3,760 | ) | ||
| Changes in other working capital balances 3 | (200 | ) | ||
| Taxpayer-supported capital spending | 367 | |||
| Total taxpayer-supported changes | (4,845 | ) | ||
| Taxpayer-supported debt - updated forecast | 70,772 | |||
| Self-supported debt forecast at Budget 2023 | 31,607 | |||
| Changes: | ||||
| Lower debt level from 2022/23 | (296 | ) | ||
| Higher capital spending | 46 | |||
| Changes in internal financing | 205 | |||
| Total self-supported changes | (45 | ) | ||
| Self-supported debt - updated forecast | 31,562 | |||
| Forecast allowance | 700 | |||
| 2023/24 provincial debt forecast at the First Quarterly Report | 103,034 | |||
| 1 | Provincial debt is prepared in accordance with Generally Accepted Accounting Principles and presented consistent with the Debt Summary Report included in the Public Accounts. Debt is shown net of sinking funds and unamortized discounts, excludes accrued interest, and includes non-guaranteed debt directly incurred by commercial Crown corporations and debt guaranteed by the Province. |
| 2 | Reflects changes in cash balances at April 1, 2023 and includes all cash balances from the Consolidated Revenue Fund, School Districts, Universities, Colleges, Health Authorities, Hospital Societies and other taxpayer-supported agencies. |
| 3 | Changes in other working capital balances include changes in accounts receivables, accounts payable, accrued liabilities, deferred revenue, investments, restricted assets and other assets. |
Taxpayer-supported debt is forecast to be $70.8 billion at the end of 2023/24 — $4.8 billion lower than forecast in Budget 2023. This decrease reflects a lower opening balance of $3.8 billion, and changes in cash and other working capital balances of $4.0 billion, offset by higher operating deficit of $2.5 billion and higher capital spending of $367 million.
The taxpayer-supported debt-to-GDP ratio is projected to end 2023/24 at 17.6 per cent — 1.3 percentage points lower than forecast in Budget 2023. The taxpayer-supported debt-to-revenue ratio is forecast to end the fiscal year at 95.5 per cent — 4.6 percentage points lower than forecast at budget.
| 16 | | First Quarterly Report 2023/24 |
Updated 2023/24 Financial Forecast
Chart 1.4 Debt Affordability
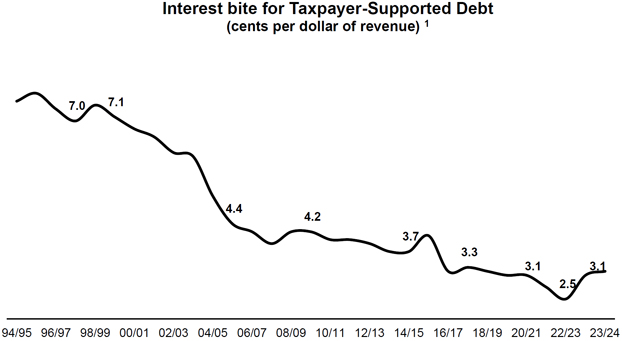
1 The ratio of interest costs (less sinking fund interest) to revenue. Figures include capitalized interest expense in order to provide a more comparable measure to outstanding debt.
Self-supported debt is forecast to be $31.6 billion at the end of 2023/24 — consistent with the forecast in Budget 2023. The forecast allowance remains at $700 million.
While the Province’s debt level is expected to increase by $13.6 billion over the year, the B.C. government is able to borrow at relatively low interest rates, with debt affordability remaining at levels that are lower than they have been historically. The Province’s taxpayer-supported interest bite is 3.1 cents per dollar of revenue.
Details on provincial debt are shown in Table 1.13.
Total provincial debt is presented consistent with the Debt Summary Report included in the Public Accounts. Debt is shown net of sinking fund investments and unamortized discounts, excludes accrued interest, and includes non-guaranteed debt directly incurred by commercial Crown corporations and debt guaranteed by the Province. The reconciliation between provincial debt and the financial statement debt is shown in Table 1.14.
Risks to the Fiscal Forecast
The major risks to the updated economic and fiscal forecasts include persistent price pressures leading to higher than anticipated interest rates for longer and weaker global demand. Other risks include climate change impacts, housing affordability, and volatility in commodity markets.
Personal and corporate income tax revenues take over a year to finalize. For example, tax assessments for the 2022 tax year will not be finalized until March 2024 (and assessments for the 2023 tax year will not be finalized until March 2025, and so on). Property transfer tax and provincial sales tax revenues are impacted by the number of residential transactions, average home sale prices and the amount of taxable purchases of goods and services. Natural resource revenues are affected by international commodity prices, and the health of B.C.’s major trading partners.
| First Quarterly Report 2023/24 | | 17 |
Updated 2023/24 Financial Forecast
The spending forecast contained in the fiscal plan is based on ministry and service delivery agency plans. Risks include changes in planning assumptions such as demand for government services in the health care, education, and community social services sectors, as well as costs associated with fighting forests fires and responding to other natural disasters.
Capital spending may be influenced by several factors including design development, procurement activity, labour shortages, ongoing supply chain issues, inflation, weather, geotechnical conditions and interest rates.
As a result of these uncertainties, the actual operating result, capital spending, and debt levels may differ from the current forecast. Government will continue to update the fiscal outlook throughout the year in the second and third quarterly reports.
The potential fiscal impacts from these risks may be partly offset by the prudence incorporated in the updated forecast, including an economic outlook within the range of the private sector forecasters, the $5.5 billion contingencies vote allocation, and the $700 million forecast allowance.
| 18 | | First Quarterly Report 2023/24 |
Updated 2023/24 Financial Forecast
Supplementary Schedules
The following tables provide the financial results for the three months ended June 30, 2023 and the 2023/24 full-year forecast.
Table 1.7 2023/24 Operating Statement
| Year-to-Date to June 30 | Full Year | |||||||||||||||||||||||||||||||
| 2023/24 | Actual | 2023/24 | Actual | |||||||||||||||||||||||||||||
| ($ millions) | Budget | Actual | Variance | 2022/23 1 | Budget | Forecast | Variance | 2022/23 | ||||||||||||||||||||||||
| Revenue | 20,106 | 20,729 | 623 | 17,751 | 77,690 | 76,228 | (1,462 | ) | 81,536 | |||||||||||||||||||||||
| Expense | (17,834 | ) | (18,405 | ) | (571 | ) | (16,619 | ) | (81,206 | ) | (82,202 | ) | (996 | ) | (80,832 | ) | ||||||||||||||||
| Surplus (deficit) before forecast allowance | 2,272 | 2,324 | 52 | 1,132 | (3,516 | ) | (5,974 | ) | (2,458 | ) | 704 | |||||||||||||||||||||
| Forecast allowance | - | - | - | - | (700 | ) | (700 | ) | - | - | ||||||||||||||||||||||
| Surplus (deficit) | 2,272 | 2,324 | 52 | 1,132 | (4,216 | ) | (6,674 | ) | (2,458 | ) | 704 | |||||||||||||||||||||
| Accumulated surplus (deficit) beginning of the year before remeasurement gains and losses | 8,355 | 2,905 | (5,450 | ) | 2,211 | 8,355 | 2,905 | (5,450 | ) | 2,201 | ||||||||||||||||||||||
| Adjustments to accumulated surplus (deficit) 1 | - | 942 | 942 | 674 | - | - | - | - | ||||||||||||||||||||||||
| Accumulated surplus (deficit) before remeasurement gains and losses | 10,627 | 6,171 | (4,456 | ) | 4,017 | 4,139 | (3,769 | ) | (7,908 | ) | 2,905 | |||||||||||||||||||||
| Effect of remeasurement gains and (losses) | (836 | ) | (282 | ) | 554 | 170 | (836 | ) | (202 | ) | 634 | (202 | ) | |||||||||||||||||||
| Accumulated surplus (deficit) end of period | 9,791 | 5,889 | (3,902 | ) | 4,187 | 3,303 | (3,971 | ) | (7,274 | ) | 2,703 | |||||||||||||||||||||
| 1 | Restated to reflect government’s current accounting policies. |
| First Quarterly Report 2023/24 | | 19 |
Updated 2023/24 Financial Forecast
Table 1.8 2023/24 Revenue by Source
| Year-to-Date to June 30 | Full Year | |||||||||||||||||||||||||||||||
| 2023/24 | Actual | 2023/24 | Actual | |||||||||||||||||||||||||||||
| ($ millions) | Budget | Actual | Variance | 2022/23 1 | Budget | Forecast | Variance | 2022/23 | ||||||||||||||||||||||||
| Taxation | ||||||||||||||||||||||||||||||||
| Personal income | 3,942 | 3,942 | - | 3,181 | 15,953 | 15,431 | (522 | ) | 17,268 | |||||||||||||||||||||||
| Corporate income | 3,533 | 3,533 | - | 2,612 | 5,938 | 6,037 | 99 | 9,156 | ||||||||||||||||||||||||
| Employer health | 683 | 679 | (4 | ) | 599 | 2,731 | 2,750 | 19 | 2,720 | |||||||||||||||||||||||
| Sales 2 | 2,460 | 2,709 | 249 | 2,319 | 10,187 | 10,362 | 175 | 9,818 | ||||||||||||||||||||||||
| Fuel | 239 | 239 | - | 250 | 1,072 | 1,042 | (30 | ) | 1,021 | |||||||||||||||||||||||
| Carbon | 680 | 708 | 28 | 566 | 2,811 | 2,700 | (111 | ) | 2,161 | |||||||||||||||||||||||
| Tobacco | 126 | 123 | (3 | ) | 157 | 565 | 520 | (45 | ) | 531 | ||||||||||||||||||||||
| Property | 864 | 861 | (3 | ) | 773 | 3,488 | 3,591 | 103 | 3,253 | |||||||||||||||||||||||
| Property transfer | 507 | 555 | 48 | 863 | 1,799 | 1,950 | 151 | 2,293 | ||||||||||||||||||||||||
| Insurance premium | 194 | 194 | - | 165 | 780 | 810 | 30 | 804 | ||||||||||||||||||||||||
| 13,228 | 13,543 | 315 | 11,485 | 45,324 | 45,193 | (131 | ) | 49,025 | ||||||||||||||||||||||||
| Natural resource | ||||||||||||||||||||||||||||||||
| Natural gas royalties | 505 | 193 | (312 | ) | 552 | 2,016 | 837 | (1,179 | ) | 2,255 | ||||||||||||||||||||||
| Forests | 148 | 149 | 1 | 277 | 846 | 886 | 40 | 1,887 | ||||||||||||||||||||||||
| Other natural resource revenues 3 | 415 | 481 | 66 | 587 | 1,902 | 1,661 | (241 | ) | 2,056 | |||||||||||||||||||||||
| 1,068 | 823 | (245 | ) | 1,416 | 4,764 | 3,384 | (1,380 | ) | 6,198 | |||||||||||||||||||||||
| Other revenue | ||||||||||||||||||||||||||||||||
| Post-secondary education fees | 484 | 483 | (1 | ) | 463 | 2,770 | 2,829 | 59 | 2,651 | |||||||||||||||||||||||
| Fees and licenses 4 | 554 | 590 | 36 | 555 | 2,412 | 2,434 | 22 | 2,277 | ||||||||||||||||||||||||
| Investment earnings | 350 | 418 | 68 | 291 | 1,349 | 1,409 | 60 | 1,316 | ||||||||||||||||||||||||
| Miscellaneous 5 | 874 | 1,089 | 215 | 976 | 3,989 | 3,995 | 6 | 4,445 | ||||||||||||||||||||||||
| 2,262 | 2,580 | 318 | 2,285 | 10,520 | 10,667 | 147 | 10,689 | |||||||||||||||||||||||||
| Contributions from the federal government | ||||||||||||||||||||||||||||||||
| Health and social transfers | 2,243 | 2,516 | 273 | 2,098 | 8,970 | 9,252 | 282 | 8,769 | ||||||||||||||||||||||||
| Other federal government contributions 6 | 694 | 531 | (163 | ) | 522 | 4,623 | 4,240 | (383 | ) | 3,757 | ||||||||||||||||||||||
| 2,937 | 3,047 | 110 | 2,620 | 13,593 | 13,492 | (101 | ) | 12,526 | ||||||||||||||||||||||||
| Commercial Crown corporation net income | ||||||||||||||||||||||||||||||||
| BC Hydro | 21 | (4 | ) | (25 | ) | (12 | ) | 712 | 712 | - | 360 | |||||||||||||||||||||
| Liquor Distribution Branch | 303 | 304 | 1 | 324 | 1,150 | 1,150 | - | 1,199 | ||||||||||||||||||||||||
| BC Lottery Corporation 7 | 286 | 292 | 6 | 405 | 1,456 | 1,456 | - | 1,584 | ||||||||||||||||||||||||
| ICBC 8 | (39 | ) | 95 | 134 | (817 | ) | - | - | - | (197 | ) | |||||||||||||||||||||
| Other 9 | 40 | 49 | 9 | 45 | 171 | 174 | 3 | 152 | ||||||||||||||||||||||||
| 611 | 736 | 125 | (55 | ) | 3,489 | 3,492 | 3 | 3,098 | ||||||||||||||||||||||||
| Total revenue | 20,106 | 20,729 | 623 | 17,751 | 77,690 | 76,228 | (1,462 | ) | 81,536 | |||||||||||||||||||||||
| 1 | Restated to reflect government’s current accounting policies. |
| 2 | Includes provincial sales tax and HST/PST housing transition tax related to prior years. |
| 3 | Columbia River Treaty, other energy and minerals, water rental and other resources. |
| 4 | Healthcare-related, motor vehicle, and other fees. |
| 5 | Includes reimbursements for health care and other services provided to external agencies, and other recoveries. |
| 6 | Includes contributions for health, education, community development, housing and social service programs, and transportation projects. |
| 7 | Net of payments to the federal government and payments to the BC First Nations Gaming Revenue Sharing Limited Partnership in accordance with section 14.3 of the Gaming Control Act (B.C.). |
| 8 | 2022/23 full year actual does not include non-controlling interest and will be restated in future quarterly reports to reflect the adoption of IFRS 9 and IFRS 17. |
| 9 | Includes Columbia Power Corporation, BC Railway Company, Columbia Basin power projects, and post-secondary institutions’ self-supported subsidiaries. |
| 20 | | First Quarterly Report 2023/24 |
Updated 2023/24 Financial Forecast
Table 1.9 2023/24 Expense by Ministry, Program and Agency
| Year-to-Date to June 30 | Full Year | |||||||||||||||||||||||||||||||
| 2023/24 | Actual | 2023/24 | Actual | |||||||||||||||||||||||||||||
| ($ millions) | Budget | Actual | Variance | 2022/23 1 | Budget | Forecast | Variance | 2022/23 | ||||||||||||||||||||||||
| Office of the Premier | 4 | 4 | - | 4 | 16 | 16 | - | 14 | ||||||||||||||||||||||||
| Agriculture and Food | 24 | 25 | 1 | 38 | 112 | 112 | - | 292 | ||||||||||||||||||||||||
| Attorney General | 202 | 219 | 17 | 202 | 773 | 776 | 3 | 807 | ||||||||||||||||||||||||
| Children and Family Development | 474 | 451 | (23 | ) | 401 | 1,912 | 1,912 | - | 1,743 | |||||||||||||||||||||||
| Citizens’ Services | 155 | 191 | 36 | 172 | 683 | 683 | - | 768 | ||||||||||||||||||||||||
| Education and Child Care | 2,470 | 2,587 | 117 | 2,330 | 8,874 | 8,874 | - | 8,233 | ||||||||||||||||||||||||
| Emergency Management and Climate Readiness | 28 | 27 | (1 | ) | 27 | 101 | 101 | - | 821 | |||||||||||||||||||||||
| Energy, Mines and Low Carbon Innovation | 21 | 18 | (3 | ) | 17 | 129 | 134 | 5 | 399 | |||||||||||||||||||||||
| Environment and Climate Change Strategy | 48 | 66 | 18 | 78 | 255 | 263 | 8 | 574 | ||||||||||||||||||||||||
| Finance | 412 | 472 | 60 | 197 | 1,578 | 1,682 | 104 | 4,059 | ||||||||||||||||||||||||
| Forests | 218 | 283 | 65 | 206 | 925 | 1,687 | 762 | 1,190 | ||||||||||||||||||||||||
| Health | 6,373 | 6,464 | 91 | 6,030 | 28,674 | 28,674 | - | 26,385 | ||||||||||||||||||||||||
| Housing | 213 | 214 | 1 | 163 | 897 | 897 | - | 897 | ||||||||||||||||||||||||
| Indigenous Relations and Reconciliation | 47 | 39 | (8 | ) | 84 | 188 | 188 | - | 777 | |||||||||||||||||||||||
| Jobs, Economic Development and Innovation | 28 | 34 | 6 | 26 | 113 | 113 | - | 225 | ||||||||||||||||||||||||
| Labour | 5 | 9 | 4 | 7 | 21 | 21 | - | 34 | ||||||||||||||||||||||||
| Mental Health and Addictions | 4 | 4 | - | 3 | 27 | 27 | - | 198 | ||||||||||||||||||||||||
| Municipal Affairs | 228 | 175 | (53 | ) | 230 | 269 | 269 | - | 1,923 | |||||||||||||||||||||||
| Post-Secondary Education and Future Skills | 718 | 755 | 37 | 656 | 2,770 | 2,770 | - | 2,691 | ||||||||||||||||||||||||
| Public Safety and Solicitor General | 260 | 243 | (17 | ) | 248 | 1,028 | 1,028 | - | 1,126 | |||||||||||||||||||||||
| Social Development and Poverty Reduction | 1,136 | 1,162 | 26 | 1,111 | 4,745 | 4,745 | - | 4,689 | ||||||||||||||||||||||||
| Tourism, Arts, Culture and Sport | 60 | 55 | (5 | ) | 39 | 182 | 182 | - | 427 | |||||||||||||||||||||||
| Transportation and Infrastructure | 246 | 240 | (6 | ) | 237 | 1,021 | 1,021 | - | 2,044 | |||||||||||||||||||||||
| Water, Land and Resource Stewardship | 27 | 43 | 16 | 34 | 124 | 124 | - | 464 | ||||||||||||||||||||||||
| Total ministries and Office of the Premier | 13,401 | 13,780 | 379 | 12,540 | 55,417 | 56,299 | 882 | 60,780 | ||||||||||||||||||||||||
| Management of public funds and debt | 294 | 346 | 52 | 332 | 1,309 | 1,400 | 91 | 1,314 | ||||||||||||||||||||||||
| Contingencies - Shared Recovery Mandate | - | - | - | - | 2,200 | 2,200 | - | - | ||||||||||||||||||||||||
| Contingencies - General programs, CleanBC and Climate & Emergency Response | - | - | - | - | 2,300 | 2,300 | - | 1 | ||||||||||||||||||||||||
| Pandemic Recovery Contingencies | - | - | - | 151 | 1,000 | 1,000 | - | - | ||||||||||||||||||||||||
| Funding for capital expenditures | 464 | 382 | (82 | ) | 238 | 4,540 | 4,429 | (111 | ) | 2,248 | ||||||||||||||||||||||
| Refundable tax credit transfers | 676 | 664 | (12 | ) | 497 | 3,159 | 3,078 | (81 | ) | 3,920 | ||||||||||||||||||||||
| Legislative Assembly and other appropriations | 50 | 46 | (4 | ) | 38 | 214 | 216 | 2 | 181 | |||||||||||||||||||||||
| Total appropriations | 14,885 | 15,218 | 333 | 13,796 | 70,139 | 70,922 | 783 | 68,444 | ||||||||||||||||||||||||
| Elimination of transactions between appropriations 2 | - | (8 | ) | (8 | ) | (4 | ) | (32 | ) | (33 | ) | (1 | ) | (24 | ) | |||||||||||||||||
| Prior year liability adjustments | - | - | - | - | - | - | - | (98 | ) | |||||||||||||||||||||||
| Consolidated revenue fund expense | 14,885 | 15,210 | 325 | 13,792 | 70,107 | 70,889 | 782 | 68,322 | ||||||||||||||||||||||||
| Expenses recovered from external entities | 867 | 879 | 12 | 693 | 4,909 | 4,836 | (73 | ) | 4,919 | |||||||||||||||||||||||
| Elimination of funding provided to service delivery agencies | (9,666 | ) | (9,133 | ) | 533 | (8,495 | ) | (41,212 | ) | (43,044 | ) | (1,832 | ) | (38,236 | ) | |||||||||||||||||
| Total direct program spending | 6,086 | 6,956 | 870 | 5,990 | 33,804 | 32,681 | (1,123 | ) | 35,005 | |||||||||||||||||||||||
| Service delivery agency expense | ||||||||||||||||||||||||||||||||
| School districts | 2,428 | 2,460 | 32 | 2,253 | 8,356 | 8,533 | 177 | 7,933 | ||||||||||||||||||||||||
| Universities | 1,451 | 1,493 | 42 | 1,385 | 6,369 | 6,534 | 165 | 6,053 | ||||||||||||||||||||||||
| Colleges and institutes | 379 | 385 | 6 | 379 | 1,574 | 1,726 | 152 | 1,591 | ||||||||||||||||||||||||
| Health authorities and hospital societies | 5,601 | 5,379 | (222 | ) | 5,043 | 22,645 | 23,815 | 1,170 | 22,814 | |||||||||||||||||||||||
| Other service delivery agencies | 1,889 | 1,732 | (157 | ) | 1,569 | 8,458 | 8,913 | 455 | 7,436 | |||||||||||||||||||||||
| Total service delivery agency expense | 11,748 | 11,449 | (299 | ) | 10,629 | 47,402 | 49,521 | 2,119 | 45,827 | |||||||||||||||||||||||
| Total expense | 17,834 | 18,405 | 571 | 16,619 | 81,206 | 82,202 | 996 | 80,832 | ||||||||||||||||||||||||
| 1 | Restated to reflect government’s current organization and accounting policies. |
| 2 | Reflects payments made under an agreement where an expense from a voted appropriation is recorded as revenue by a special account. |
| First Quarterly Report 2023/24 | | 21 |
Updated 2023/24 Financial Forecast
Table 1.10 2023/24 Expense by Function
| Year-to-Date to June 30 | Full Year | |||||||||||||||||||||||||||||||
| 2023/24 | Actual | 2023/24 | Actual | |||||||||||||||||||||||||||||
| ($ millions) | Budget | Actual | Variance | 2022/23 1 | Budget | Forecast | Variance | 2022/23 | ||||||||||||||||||||||||
| Health 2 | 7,035 | 7,217 | 182 | 6,614 | 30,927 | 30,956 | 29 | 30,322 | ||||||||||||||||||||||||
| Education 3 | 4,521 | 4,686 | 165 | 4,277 | 17,600 | 17,862 | 262 | 16,991 | ||||||||||||||||||||||||
| Social services | 2,087 | 2,061 | (26 | ) | 1,783 | 9,158 | 9,148 | (10 | ) | 9,652 | ||||||||||||||||||||||
| Protection of persons and property | 567 | 558 | (9 | ) | 567 | 2,324 | 2,319 | (5 | ) | 3,483 | ||||||||||||||||||||||
| Transportation | 569 | 618 | 49 | 507 | 2,616 | 2,634 | 18 | 3,319 | ||||||||||||||||||||||||
| Natural resources and economic development | 817 | 950 | 133 | 773 | 4,432 | 5,161 | 729 | 6,284 | ||||||||||||||||||||||||
| Other | 1,039 | 1,009 | (30 | ) | 762 | 3,485 | 3,437 | (48 | ) | 5,736 | ||||||||||||||||||||||
| Contingencies - Shared Recovery Mandate | - | - | - | - | 2,200 | 2,200 | - | - | ||||||||||||||||||||||||
| Contingencies - General programs, CleanBC and Climate & Emergency Response 4 | - | - | - | - | 2,300 | 2,300 | - | - | ||||||||||||||||||||||||
| Pandemic Recovery Contingencies 4 | - | - | - | 151 | 1,000 | 1,000 | - | - | ||||||||||||||||||||||||
| General government | 456 | 527 | 71 | 480 | 1,929 | 1,931 | 2 | 2,326 | ||||||||||||||||||||||||
| Debt servicing | 743 | 779 | 36 | 705 | 3,235 | 3,254 | 19 | 2,719 | ||||||||||||||||||||||||
| Total expense | 17,834 | 18,405 | 571 | 16,619 | 81,206 | 82,202 | 996 | 80,832 | ||||||||||||||||||||||||
| 1 | Figures have been restated to reflect government’s current accounting policies. |
| 2 | Payments for healthcare services by the Ministry of Social Development and Poverty Reduction and the Ministry of Children and Family Development made on behalf of their clients are reported in the Health function. |
| 3 | Payments for training costs by the Ministry of Social Development and Poverty Reduction made on behalf of its clients are reported in the Education function. |
| 4 | Contingencies for the prior fiscal year are reported in the relevant functions; the current year forecast is not yet allocated to functions. |
| 22 | | First Quarterly Report 2023/24 |
Updated 2023/24 Financial Forecast
Table 1.11 2023/24 Capital Spending
| Year-to-Date to June 30 | Full Year | |||||||||||||||||||||||||||||||
| 2023/24 | Actual | 2023/24 | Actual | |||||||||||||||||||||||||||||
| ($ millions) | Budget | Actual | Variance | 2022/23 | Budget | Forecast | Variance | 2022/23 | ||||||||||||||||||||||||
| Taxpayer-supported | ||||||||||||||||||||||||||||||||
| Education | ||||||||||||||||||||||||||||||||
| School districts | 233 | 184 | (49 | ) | 214 | 1,019 | 990 | (29 | ) | 934 | ||||||||||||||||||||||
| Post-secondary institutions | 258 | 219 | (39 | ) | 161 | 1,716 | 1,683 | (33 | ) | 1,071 | ||||||||||||||||||||||
| Health | 218 | 195 | (23 | ) | 129 | 3,243 | 3,531 | 288 | 1,915 | |||||||||||||||||||||||
| BC Transportation Financing Authority | 851 | 392 | (459 | ) | 393 | 3,947 | 3,968 | 21 | 1,823 | |||||||||||||||||||||||
| BC Transit | 60 | 22 | (38 | ) | 26 | 232 | 208 | (24 | ) | 100 | ||||||||||||||||||||||
| Government ministries | 116 | 97 | (19 | ) | 78 | 701 | 699 | (2 | ) | 470 | ||||||||||||||||||||||
| Social housing 1 | 140 | 232 | 92 | 62 | 808 | 941 | 133 | 357 | ||||||||||||||||||||||||
| Other | 21 | 19 | (2 | ) | 12 | 147 | 160 | 13 | 85 | |||||||||||||||||||||||
| Total taxpayer-supported | 1,897 | 1,360 | (537 | ) | 1,075 | 11,813 | 12,180 | 367 | 6,755 | |||||||||||||||||||||||
| Self-supported | ||||||||||||||||||||||||||||||||
| BC Hydro | 1,145 | 1,099 | (46 | ) | 894 | 3,815 | 3,861 | 46 | 3,919 | |||||||||||||||||||||||
| Columbia Basin power projects 2 | 2 | 5 | 3 | 2 | 9 | 9 | - | 10 | ||||||||||||||||||||||||
| BC Railway Company | 1 | 1 | 0 | - | 7 | 7 | - | 6 | ||||||||||||||||||||||||
| ICBC | 13 | 8 | (5 | ) | 18 | 65 | 65 | - | 41 | |||||||||||||||||||||||
| BC Lottery Corporation 3 | 18 | 6 | (12 | ) | 4 | 103 | 103 | - | 95 | |||||||||||||||||||||||
| Liquor Distribution Branch | 6 | 2 | (4 | ) | 3 | 28 | 28 | - | 16 | |||||||||||||||||||||||
| Other 4 | - | - | - | - | - | - | - | 78 | ||||||||||||||||||||||||
| Total self-supported | 1,185 | 1,121 | (64 | ) | 921 | 4,027 | 4,073 | 46 | 4,165 | |||||||||||||||||||||||
| Total capital spending | 3,082 | 2,481 | (601 | ) | 1,996 | 15,840 | 16,253 | 413 | 10,920 | |||||||||||||||||||||||
| 1 | Includes BC Housing Management Commission and Provincial Rental Housing Corporation. |
| 2 | Joint ventures of the Columbia Power Corporation and Columbia Basin Trust. |
| 3 | Excludes right-of-use assets except for 2022/23 full year actual. |
| 4 | Includes post-secondary institutions’ self-supported subsidiaries. |
| First Quarterly Report 2023/24 | | 23 |
Updated 2023/24 Financial Forecast
Table 1.12 Capital Expenditure Projects Greater Than $50 million 1
Note: Information in bold type denotes changes from Budget 2023 released on February 28, 2023.
| ($ millions) | Year of Completion | Project Cost to Jun. 30, 2023 | Estimated Cost to Complete | Anticipated Total Cost | Internal/ Borrowing | P3 Liability | Federal Gov’t | Other Contrib’ns | |||||||||||||||||||||||
| Schools | |||||||||||||||||||||||||||||||
| Centennial Secondary 2 | 2017 | 59 | 2 | 61 | 61 | - | - | - | |||||||||||||||||||||||
| Grandview Heights Secondary 2 | 2021 | 78 | 5 | 83 | 63 | - | - | 20 | |||||||||||||||||||||||
| New Westminster Secondary 2 | 2021 | 93 | 14 | 107 | 107 | - | - | - | |||||||||||||||||||||||
| Handsworth Secondary 2 | 2022 | 66 | 3 | 69 | 69 | - | - | - | |||||||||||||||||||||||
| Pexsisen Elementary and Centre Mountain Lellum Middle 2 | 2022 | 88 | 1 | 89 | 89 | - | - | - | |||||||||||||||||||||||
| Quesnel Junior School 2 | 2022 | 46 | 6 | 52 | 52 | - | - | - | |||||||||||||||||||||||
| Stitó:s Lá:lém totí:lt Elementary Middle School 2 | 2022 | 52 | 2 | 54 | 49 | - | - | 5 | |||||||||||||||||||||||
| Coast Salish Elementary 3 | 2023 | 22 | 21 | 43 | 38 | - | - | 5 | |||||||||||||||||||||||
| Burnaby North Secondary | 2024 | 94 | 14 | 108 | 99 | 9 | |||||||||||||||||||||||||
| Cowichan Secondary | 2024 | 38 | 48 | 86 | 84 | - | - | 2 | |||||||||||||||||||||||
| Eric Hamber Secondary | 2024 | 66 | 40 | 106 | 94 | - | - | 12 | |||||||||||||||||||||||
| Victoria High School | 2024 | 80 | 20 | 100 | 97 | - | - | 3 | |||||||||||||||||||||||
| North East Latimer Elementary | 2025 | - | 52 | 52 | 52 | - | - | - | |||||||||||||||||||||||
| Burke Mountain Secondary | 2026 | 4 | 156 | 160 | 135 | - | - | 25 | |||||||||||||||||||||||
| Carson Elementary | 2026 | - | 61 | 61 | 61 | - | - | - | |||||||||||||||||||||||
| New East Side Elementary | 2026 | - | 59 | 59 | 59 | - | - | - | |||||||||||||||||||||||
| New Cloverley Elementary | 2026 | - | 64 | 64 | 61 | - | - | 3 | |||||||||||||||||||||||
| Pineview Valley Elementary | 2026 | - | 65 | 65 | 65 | - | - | - | |||||||||||||||||||||||
| George Pringle Secondary (formerly Westside Secondary) | 2027 | 7 | 99 | 106 | 103 | - | - | 3 | |||||||||||||||||||||||
| La Vallée (Pemberton) Elementary | 2027 | - | 66 | 66 | 66 | - | - | - | |||||||||||||||||||||||
| Prince Rupert Middle | 2027 | - | 127 | 127 | 127 | - | - | - | |||||||||||||||||||||||
| Guildford Park Secondary | 2028 | - | 65 | 65 | 60 | - | - | 5 | |||||||||||||||||||||||
| Tamanawis Secondary | 2028 | - | 57 | 57 | 52 | - | - | 5 | |||||||||||||||||||||||
| Seismic mitigation program 4 | 2030 | 1,390 | 636 | 2,026 | 2,026 | - | - | - | |||||||||||||||||||||||
| Total schools | 2,183 | 1,683 | 3,866 | 3,769 | - | - | 97 | ||||||||||||||||||||||||
| Post-secondary institutions | |||||||||||||||||||||||||||||||
| Simon Fraser University - Student Housing 2 | 2023 | 108 | - | 108 | 73 | - | - | 35 | |||||||||||||||||||||||
| University of Victoria – Student Housing | 2023 | 200 | 36 | 236 | 128 | - | - | 108 | |||||||||||||||||||||||
| Capilano University | |||||||||||||||||||||||||||||||
| – New Squamish Campus | 2023 | 63 | - | 63 | 48 | - | - | 15 | |||||||||||||||||||||||
| Okanagan College – Student Housing | 2024 | 16 | 59 | 75 | 74 | - | - | 1 | |||||||||||||||||||||||
| Capilano University – Student Housing | 2024 | 6 | 52 | 58 | 41 | - | - | 17 | |||||||||||||||||||||||
| Royal Roads University - West Shore Learning Centre | 2024 | 33 | 73 | 106 | 80 | - | - | 26 | |||||||||||||||||||||||
| British Columbia Institute of Technology – Student Housing | 2025 | 27 | 93 | 120 | 108 | - | - | 12 | |||||||||||||||||||||||
| North Island College – Student Housing | 2025 | 5 | 73 | 78 | 76 | - | - | 2 | |||||||||||||||||||||||
| The University of British Columbia | |||||||||||||||||||||||||||||||
| – School of Biomedical Engineering | 2025 | 35 | 104 | 139 | 25 | - | - | 114 | |||||||||||||||||||||||
| University of the Fraser Valley – Student Housing | 2025 | - | 75 | 75 | 63 | - | - | 12 | |||||||||||||||||||||||
| University of Victoria | |||||||||||||||||||||||||||||||
| – Engineering and Computer Science Building Expansion | 2026 | 5 | 128 | 133 | 97 | - | - | 36 | |||||||||||||||||||||||
| Vancouver Island University – Student Housing and Dining | 2026 | - | 88 | 88 | 87 | - | - | 1 | |||||||||||||||||||||||
| British Columbia Institute of Technology | |||||||||||||||||||||||||||||||
| – Trades and Technology Complex | 2027 | 1 | 177 | 178 | 152 | - | - | 26 | |||||||||||||||||||||||
| Douglas College – Academic and Student Housing | 2027 | 4 | 289 | 293 | 203 | - | - | 90 | |||||||||||||||||||||||
| Vancouver Community College | |||||||||||||||||||||||||||||||
| – Centre for Clean Energy & Automotive Innovation | 2027 | - | 291 | 291 | 271 | - | - | 20 | |||||||||||||||||||||||
| Total post-secondary institutions | 503 | 1,538 | 2,041 | 1,526 | - | - | 515 | ||||||||||||||||||||||||

| 24 | | First Quarterly Report 2023/24 |
Updated 2023/24 Financial Forecast
Table 1.12 Capital Expenditure Projects Greater Than $50 million 1
Note: Information in bold type denotes changes from Budget 2023 released on February 28, 2023.
| ($ millions) | Year of Completion | Project Cost to Jun. 30, 2023 | Estimated Cost to Complete | Anticipated Total Cost | Internal/ Borrowing | P3 Liability | Federal Gov’t | Other Contrib’ns | |||||||||||||||||||||||
| Health facilities | |||||||||||||||||||||||||||||||
| Royal Columbian Hospital Redevelopment – Phase 1 2 | 2020 | 247 | 4 | 251 | 242 | - | - | 9 | |||||||||||||||||||||||
| Red Fish Healing Centre for Mental Health and Addiction - θəqiʔ ɫəwʔənəq leləm 2 | 2021 | 129 | 2 | 131 | 131 | - | - | - | |||||||||||||||||||||||
| Vancouver General Hospital – Operating Rooms | |||||||||||||||||||||||||||||||
| Renewal – Phase 1 2 | 2021 | 101 | 1 | 102 | 35 | - | - | 67 | |||||||||||||||||||||||
| Peace Arch Hospital Renewal 2 | 2022 | 86 | 1 | 87 | 8 | - | - | 79 | |||||||||||||||||||||||
| Penticton Regional Hospital Patient Care Tower 2 | |||||||||||||||||||||||||||||||
| – Direct procurement | 2022 | 65 | 11 | 76 | 18 | - | - | 58 | |||||||||||||||||||||||
| – P3 contract | 2019 | 232 | - | 232 | - | 139 | - | 93 | |||||||||||||||||||||||
| Dogwood Lodge Long-Term Care Home Replacement | 2023 | 56 | 9 | 65 | - | - | - | 65 | |||||||||||||||||||||||
| Lions Gate Hospital – New Acute Care Facility | 2024 | 146 | 164 | 310 | 144 | - | - | 166 | |||||||||||||||||||||||
| Nanaimo Regional General Hospital – ICU/HAU Redevelopment | 2024 | 31 | 29 | 60 | 22 | - | - | 38 | |||||||||||||||||||||||
| Stuart Lake Hospital Replacement | 2024 | 61 | 97 | 158 | 140 | - | - | 18 | |||||||||||||||||||||||
| Clinical and Systems Transformation | 2025 | 726 | 73 | 799 | 702 | - | - | 97 | |||||||||||||||||||||||
| iHealth Project – Vancouver Island Health Authority | 2025 | 133 | 22 | 155 | 55 | - | - | 100 | |||||||||||||||||||||||
| Mills Memorial Hospital Replacement | 2026 | 421 | 212 | 633 | 513 | - | - | 120 | |||||||||||||||||||||||
| Royal Columbian Hospital Redevelopment Phases 2 & 3 5 | 2026 | 487 | 757 | 1,244 | 1,182 | - | - | 62 | |||||||||||||||||||||||
| Abbotsford Long-Term Care | 2027 | - | 211 | 211 | 157 | - | - | 54 | |||||||||||||||||||||||
| Burnaby Hospital Redevelopment - Phase 1 | 2027 | 68 | 615 | 683 | 633 | - | - | 50 | |||||||||||||||||||||||
| Campbell River Long-Term Care | 2027 | - | 134 | 134 | 80 | - | - | 54 | |||||||||||||||||||||||
| Cowichan District Hospital Replacement | 2027 | 92 | 1,354 | 1,446 | 1,148 | - | - | 298 | |||||||||||||||||||||||
| Dawson Creek and District Hospital Replacement | 2027 | 23 | 567 | 590 | 413 | - | - | 177 | |||||||||||||||||||||||
| Delta Long-Term Care | 2027 | - | 180 | 180 | 162 | - | - | 18 | |||||||||||||||||||||||
| New St Paul’s Hospital | 2027 | 606 | 1,574 | 2,180 | 1,327 | - | - | 853 | |||||||||||||||||||||||
| New Surrey Hospital and BC Cancer Centre | 2027 | 9 | 1,715 | 1,724 | 1,664 | - | - | 60 | |||||||||||||||||||||||
| Richmond Long-Term Care | 2027 | - | 178 | 178 | 178 | - | - | - | |||||||||||||||||||||||
| Royal Inland Hospital Phil and Jennie Gaglardi Tower | |||||||||||||||||||||||||||||||
| – Direct procurement | 2027 | 62 | 67 | 129 | 39 | - | - | 90 | |||||||||||||||||||||||
| – P3 contract | 2022 | 288 | - | 288 | - | 164 | - | 124 | |||||||||||||||||||||||
| Western Communities Long-Term Care | 2027 | - | 224 | 224 | 157 | - | - | 67 | |||||||||||||||||||||||
| Centre for Children and Youth Living with Health Complexity | 2028 | 3 | 219 | 222 | 193 | - | - | 29 | |||||||||||||||||||||||
| St. Vincent’s Heather Long-Term Care | 2028 | 1 | 206 | 207 | 207 | - | - | - | |||||||||||||||||||||||
| Cariboo Memorial Hospital Redevelopment | 2029 | 25 | 342 | 367 | 257 | - | - | 110 | |||||||||||||||||||||||
| FW Green Long-Term Care | 2029 | - | 156 | 156 | 94 | - | - | 62 | |||||||||||||||||||||||
| Vancouver General Hospital – | |||||||||||||||||||||||||||||||
| Operating Rooms Renewal – Phase 2 | 2029 | 10 | 322 | 332 | 312 | - | - | 20 | |||||||||||||||||||||||
| Burnaby Hospital Redevelopment Phase 2 and BC Cancer Centre | 2030 | - | 1,731 | 1,731 | 1,703 | - | - | 28 | |||||||||||||||||||||||
| Richmond Hospital Redevelopment 6 | 2031 | 5 | 856 | 861 | 791 | - | - | 70 | |||||||||||||||||||||||
| Total health facilities | 4,113 | 12,033 | 16,146 | 12,707 | 303 | - | 3,136 | ||||||||||||||||||||||||
| First Quarterly Report 2023/24 | | 25 |
Updated 2023/24 Financial Forecast
Table 1.12 Capital Expenditure Projects Greater Than $50 million 1
Note: Information in bold type denotes changes from Budget 2023 released on February 28, 2023.
| ($ millions) | Year of Completion | Project Cost to Jun. 30, 2023 | Estimated Cost to Complete | Anticipated Total Cost | Internal/ Borrowing | P3 Liability | Federal Gov’t | Other Contrib’ns | |||||||||||||||||||||||
| Transportation | |||||||||||||||||||||||||||||||
| Highway 91 Alex Fraser Bridge Capacity Improvements 2 | 2019 | 67 | 3 | 70 | 37 | - | 33 | - | |||||||||||||||||||||||
| Highway 1 Illecillewaet Four-Laning and Brake Check improvements 2 | 2021 | 74 | 1 | 75 | 59 | - | 16 | - | |||||||||||||||||||||||
| Highway 99 10-Mile Slide 2 | 2021 | 75 | 9 | 84 | 84 | - | - | - | |||||||||||||||||||||||
| Highway 4 Kennedy Hill Safety Improvements2 | 2022 | 54 | - | 54 | 40 | - | 14 | - | |||||||||||||||||||||||
| Highway 14 Corridor improvements | 2023 | 66 | 11 | 77 | 48 | - | 29 | - | |||||||||||||||||||||||
| Highway 1 Chase Four-Laning | 2023 | 99 | 97 | 196 | 184 | - | 12 | - | |||||||||||||||||||||||
| Highway 1 Salmon Arm West | 2023 | 88 | 52 | 140 | 109 | - | 31 | - | |||||||||||||||||||||||
| Highway 91 to Highway 17 and Deltaport Way Corridor improvements | 2023 | 241 | 19 | 260 | 87 | - | 82 | 91 | |||||||||||||||||||||||
| Kootenay Lake ferry service upgrade | 2023 | 51 | 34 | 85 | 68 | - | 17 | - | |||||||||||||||||||||||
| West Fraser Road Realignment | 2023 | 62 | 41 | 103 | 103 | - | - | - | |||||||||||||||||||||||
| Highway 1 Quartz Creek Bridge Replacement | 2024 | 61 | 58 | 119 | 69 | - | 50 | - | |||||||||||||||||||||||
| Highway 1 Ford Road to Tappen Valley Road Four-Laning | 2024 | 43 | 200 | 243 | 161 | - | 82 | - | |||||||||||||||||||||||
| Highway 1 Kicking Horse Canyon Phase 4 7 | 2024 | 495 | 106 | 601 | 386 | - | 215 | - | |||||||||||||||||||||||
| Pattullo Bridge Replacement 8 | 2024 | 722 | 655 | 1,377 | 1,076 | 301 | - | - | |||||||||||||||||||||||
| Highway 5 Corridor | 2024 | 141 | 209 | 350 | 350 | - | - | - | |||||||||||||||||||||||
| Highway 1 Corridor - Falls Creek | 2024 | 3 | 140 | 143 | 143 | - | - | - | |||||||||||||||||||||||
| BC Transit Victoria HandyDART Facility | 2025 | 24 | 60 | 84 | 41 | - | 21 | 22 | |||||||||||||||||||||||
| Highway 1 216th - 264th Street widening | 2025 | 59 | 286 | 345 | 226 | - | 96 | 23 | |||||||||||||||||||||||
| Highway 7 Widening - 266th St to 287th St. | 2025 | 34 | 72 | 106 | 77 | - | 29 | - | |||||||||||||||||||||||
| Highway 99 / Steveston Interchange, Transit & Cycling Improvements 9 | 2025 | 39 | 98 | 137 | 137 | - | - | - | |||||||||||||||||||||||
| Highway 17 Keating Cross Overpass | 2025 | 12 | 65 | 77 | 58 | - | 17 | 2 | |||||||||||||||||||||||
| Broadway Subway 10 | 2026 | 1,185 | 1,642 | 2,827 | 1,380 | 450 | 897 | 100 | |||||||||||||||||||||||
| Blackwater North Fraser Slide | 2026 | - | 203 | 203 | 203 | - | - | - | |||||||||||||||||||||||
| Cottonwood Hill at Highway 97 Slide | 2026 | - | 335 | 335 | 335 | - | - | - | |||||||||||||||||||||||
| Highway 1 Selkirk | 2026 | 5 | 124 | 129 | 97 | - | 32 | - | |||||||||||||||||||||||
| Highway 1 Jumping Creek to MacDonald | 2027 | 10 | 235 | 245 | 199 | - | 46 | - | |||||||||||||||||||||||
| Highway 1 Goldstream Safety Improvements | 2027 | 12 | 150 | 162 | 162 | - | - | ||||||||||||||||||||||||
| Belleville Terminal Replacement | 2027 | 3 | 301 | 304 | 262 | - | 42 | - | |||||||||||||||||||||||
| Highway 1 R.W. Bruhn Bridge | 2027 | 36 | 219 | 255 | 164 | - | 91 | - | |||||||||||||||||||||||
| Surrey Langley SkyTrain Project 11 | 2028 | 98 | 3,912 | 4,010 | 2,476 | - | 1,306 | 228 | |||||||||||||||||||||||
| Fraser River Tunnel Project 9, 12 | 2030 | 58 | 4,090 | 4,148 | 4,148 | - | - | - | |||||||||||||||||||||||
| Total transportation | 3,917 | 13,427 | 17,344 | 12,969 | 751 | 3,158 | 466 | ||||||||||||||||||||||||
| Housing | |||||||||||||||||||||||||||||||
| Stanley New Fountain 2 | 2023 | 77 | 1 | 78 | 9 | - | - | 69 | |||||||||||||||||||||||
| 13583 81st Ave | 2023 | 46 | 4 | 50 | 37 | - | - | 13 | |||||||||||||||||||||||
| Crosstown | 2024 | 41 | 31 | 72 | 61 | - | - | 11 | |||||||||||||||||||||||
| 58 W Hastings | 2024 | 39 | 119 | 158 | 67 | - | 19 | 72 | |||||||||||||||||||||||
| 1015 Hastings St. Development | 2025 | 14 | 137 | 151 | 110 | - | 22 | 19 | |||||||||||||||||||||||
| 128 to 134 East Cordova St. | 2025 | 10 | 156 | 166 | 36 | - | 27 | 103 | |||||||||||||||||||||||
| 320 Hastings St. E. Redevelopment | 2025 | - | 86 | 86 | 49 | - | 5 | 32 | |||||||||||||||||||||||
| Clark & 1st Ave | 2026 | 7 | 102 | 109 | 75 | - | - | 34 | |||||||||||||||||||||||
| Total housing | 234 | 636 | 870 | 444 | - | 73 | 353 | ||||||||||||||||||||||||
| Other taxpayer-supported | |||||||||||||||||||||||||||||||
| Nanaimo Correctional Centre Replacement | 2024 | 124 | 57 | 181 | 181 | - | - | - | |||||||||||||||||||||||
| Royal BC Museum – | |||||||||||||||||||||||||||||||
| Collections and Research Building | 2025 | 31 | 239 | 270 | 270 | - | - | - | |||||||||||||||||||||||
| Total other taxpayer-supported | 155 | 296 | 451 | 451 | - | - | - | ||||||||||||||||||||||||
| Total taxpayer-supported | 11,105 | 29,613 | 40,718 | 31,866 | 1,054 | 3,231 | 4,567 | ||||||||||||||||||||||||
| 26 | | First Quarterly Report 2023/24 |
Updated 2023/24 Financial Forecast
Table 1.12 Capital Expenditure Projects Greater Than $50 million 1
Note: Information in bold type denotes changes from Budget 2023 released on February 28, 2023.
| ($ millions) | Year of Completion | Project Cost to Jun. 30, 2023 | Estimated Cost to Complete | Anticipated Total Cost | Internal/ Borrowing | P3 Liability | Federal Gov’t | Other Contrib’ns | |||||||||||||||||||||||
| Power generation and transmission | |||||||||||||||||||||||||||||||
| BC Hydro | |||||||||||||||||||||||||||||||
| –UBC load increase stage 2 project 2 | 2020 | 53 | - | 53 | 53 | - | - | - | |||||||||||||||||||||||
| –Bridge River 2 upgrade units 7 and 8 project 2 | 2021 | 74 | 1 | 75 | 75 | - | - | - | |||||||||||||||||||||||
| –LNG Canada load interconnection project 2 | 2021 | 81 | 1 | 82 | 58 | - | - | 24 | |||||||||||||||||||||||
| –Peace Region Electricity Supply (PRES) project 2, 13 | 2021 | 218 | 1 | 219 | 219 | - | TBD | - | |||||||||||||||||||||||
| –Mica replace units 1 to 4 generator transformers project 2 | 2022 | 76 | 13 | 89 | 89 | - | - | - | |||||||||||||||||||||||
| –Mount Lehman substation upgrade project 2 | 2023 | 55 | - | 55 | 55 | - | - | - | |||||||||||||||||||||||
| – G.M. Shrum G1 to 10 control system upgrade | 2023 | 69 | 6 | 75 | 75 | - | - | - | |||||||||||||||||||||||
| – 5L063 Telkwa relocation project | 2023 | 47 | 19 | 66 | 66 | - | - | - | |||||||||||||||||||||||
| – Lake Buntzen 1 Coquitlam Tunnel Gates Refurbishment project | 2023 | 46 | 21 | 67 | 67 | - | - | - | |||||||||||||||||||||||
| – Street light replacement program | 2023 | 56 | 19 | 75 | 75 | - | - | - | |||||||||||||||||||||||
| – Various Sites - NERC Critical Infrastructure Protection implementation project for cyber assets | 2023 | 44 | 16 | 60 | 60 | - | - | - | |||||||||||||||||||||||
| – Wahleach refurbish generator project | 2023 | 52 | 12 | 64 | 64 | - | - | - | |||||||||||||||||||||||
| – Capilano substation upgrade project | 2024 | 61 | 26 | 87 | 87 | - | - | - | |||||||||||||||||||||||
| – Mica modernize controls project | 2024 | 48 | 8 | 56 | 56 | - | - | - | |||||||||||||||||||||||
| – Vancouver Island radio system project | 2024 | 42 | 11 | 53 | 53 | - | - | - | |||||||||||||||||||||||
| – Natal - 60-138 kV switchyard upgrade project | 2025 | 29 | 55 | 84 | 84 | - | - | - | |||||||||||||||||||||||
| –Site C project 14 | 2025 | 11,669 | 4,331 | 16,000 | 16,000 | - | - | - | |||||||||||||||||||||||
| – Sperling substation metalclad switchgear replacement project | 2026 | 37 | 39 | 76 | 76 | - | - | - | |||||||||||||||||||||||
| – Treaty Creek Terminal - Transmission Load Interconnection (KSM) project | 2026 | 29 | 80 | 109 | 72 | - | - | 37 | |||||||||||||||||||||||
| – Mainwaring station upgrade project | 2026 | 14 | 140 | 154 | 154 | - | - | - | |||||||||||||||||||||||
| –Kootenay Canal modernize controls project | 2028 | 4 | 57 | 61 | 61 | - | - | - | |||||||||||||||||||||||
| –Peace to Kelly Lake stations sustainment project | 2028 | 25 | 319 | 344 | 344 | - | - | - | |||||||||||||||||||||||
| –John Hart dam seismic upgrade project | 2029 | 89 | 824 | 913 | 913 | - | - | - | |||||||||||||||||||||||
| –Bridge River 1 replace units 1-4 generators / governors project | 2030 | 14 | 299 | 313 | 313 | - | - | - | |||||||||||||||||||||||
| Total power generation and transmission | 12,932 | 6,298 | 19,230 | 19,169 | - | - | 61 | ||||||||||||||||||||||||
| Total self-supported | 12,932 | 6,298 | 19,230 | 19,169 | - | - | 61 | ||||||||||||||||||||||||
| Total $50 million projects | 24,037 | 35,911 | 59,948 | 51,035 | 1,054 | 3,231 | 4,628 | ||||||||||||||||||||||||
| 1 | Only projects that receive provincial funding and have been approved by Treasury Board and/or Crown corporation boards are included in this table. Ministry service plans may highlight projects that still require final approval. Capital costs reflect current government accounting policy. |
| 2 | Assets have been put into service and only trailing costs remain. |
| 3 | The anticipated total cost was previously reported as $52 million and has been reduced to $43 million to reflect current estimates. |
| 4 | The Seismic Mitigation Program consists of all spending to date on Phase 2 of the program and may include spending on projects greater than $50 million included in the table above. |
| 5 | The Royal Columbian Hospital new acute care tower is expected to be available to patients in 2025. |
| 6 | The Richmond Hospital new acute care tower is expected to be available to patients in 2028. |
| 7 | Kicking Horse Canyon Project costs exclude $11 million of past planning costs which are expensed. |
| 8 | Pattullo Bridge forecasted to open to the public in 2024 with old bridge decommissioning to follow. Forecasted amount reflects total expenditures including capitalized and expensed items. |
| 9 | Project is part of the Highway 99 Tunnel Program. |
| 10 | The Broadway Subway Project forecast and value of costs incurred to date include the City of Vancouver in-kind contribution of land rights, in keeping with the approved project budget. Under current government accounting, purchased intangible assets are given accounting recognition, and contributed intangible assets, such as land use rights or licenses are not. |
| 11 | Total project cost includes $3.939 billion capital costs and $0.071 billion operating costs. |
| 12 | The Fraser River Tunnel is forecasted to open to the public in 2030 with the removal of the existing tunnel to follow. |
| 13 | The total cost represents the gross cost of the project and has not been netted for Federal Government contributions. The Federal Government’s contribution amount is dependent on the final actual project costs and what costs are eligible under the agreement. |
| 14 | The approved updated project cost estimate is $16 billion, with a project in-service date of 2025 (first and last generating unit in-service in December 2024 and 2025, respectively). The anticipated project cost and cost to date include capital costs, charges subject to regulatory deferral and certain operating expenditures. |
| First Quarterly Report 2023/24 | | 27 |
Updated 2023/24 Financial Forecast
Table 1.13 2023/24 Provincial Debt 1
| Year-to-Date to June 30 | Full Year | |||||||||||||||||||||||
| 2023/24 | Actual | 2023/24 | Actual | |||||||||||||||||||||
| ($ millions) | Budget | Actual | Variance | 2022/23 | Budget | Forecast | Variance | 2022/23 | ||||||||||||||||
| Taxpayer-supported debt | ||||||||||||||||||||||||
| Provincial government | ||||||||||||||||||||||||
| Operating | - | - | - | 4,710 | 2,440 | 1,871 | (569 | ) | - | |||||||||||||||
| Capital 2 | 37,817 | 37,366 | (451 | ) | 36,801 | 44,089 | 40,739 | (3,350 | ) | 36,538 | ||||||||||||||
| Total provincial government | 37,817 | 37,366 | (451 | ) | 41,511 | 46,529 | 42,610 | (3,919 | ) | 36,538 | ||||||||||||||
| Taxpayer-supported entities | ||||||||||||||||||||||||
| BC Transportation Financing Authority | 19,570 | 19,570 | - | 17,623 | 23,171 | 22,930 | (241 | ) | 18,992 | |||||||||||||||
| Health authorities and hospital societies | 2,147 | 2,047 | (100 | ) | 1,833 | 2,381 | 2,380 | (1 | ) | 1,983 | ||||||||||||||
| Post-secondary institutions | 909 | 909 | - | 924 | 952 | 944 | (8 | ) | 910 | |||||||||||||||
| Social housing 3 | 1,244 | 1,044 | (200 | ) | 1,190 | 2,227 | 1,566 | (661 | ) | 1,241 | ||||||||||||||
| Other | 294 | 297 | 3 | 171 | 357 | 342 | (15 | ) | 270 | |||||||||||||||
| Total taxpayer-supported entities | 24,164 | 23,867 | (297 | ) | 21,741 | 29,088 | 28,162 | (926 | ) | 23,396 | ||||||||||||||
| Total taxpayer-supported debt | 61,981 | 61,233 | (748 | ) | 63,252 | 75,617 | 70,772 | (4,845 | ) | 59,934 | ||||||||||||||
| Self-supported debt | 30,339 | 30,347 | 8 | 28,795 | 31,607 | 31,562 | (45 | ) | 29,492 | |||||||||||||||
| Total debt before forecast allowance | 92,320 | 91,580 | (740 | ) | 92,047 | 107,224 | 102,334 | (4,890 | ) | 89,426 | ||||||||||||||
| Forecast allowance | - | - | - | - | 700 | 700 | - | - | ||||||||||||||||
| Total provincial debt | 92,320 | 91,580 | (740 | ) | 92,047 | 107,924 | 103,034 | (4,890 | ) | 89,426 | ||||||||||||||
| 1 | Provincial debt is prepared in accordance with Generally Accepted Accounting Principles and presented consistent with the Debt Summary Report included in the Public Accounts . Debt is shown net of sinking funds and unamortized discounts, excludes accrued interest, and includes non-guaranteed debt directly incurred by commercial Crown corporations and debt guaranteed by the Province. |
| 2 | Includes debt incurred by the government to fund the building of capital assets in the education, health, social housing and other sectors. |
| 3 | Includes debt incurred by BC Housing Management Commission and the Provincial Rental Housing Corporation to fund investments in affordable housing through HousingHub. The debt forecast reflects projects that have been approved as of June 2023. |
| 28 | | First Quarterly Report 2023/24 |
Updated 2023/24 Financial Forecast
Table 1.14 2023/24 Statement of Financial Position
| ($ millions) | Actual March 31, 2023 | Year-to-Date June 30, 2023 | Forecast March 31, 2024 | |||||||||
| Financial assets: | ||||||||||||
| Cash and temporary investments | 8,247 | 6,310 | 2,961 | |||||||||
| Other financial assets | 19,077 | 19,398 | 16,492 | |||||||||
| Sinking funds | 521 | 531 | 485 | |||||||||
| Investments in commercial Crown corporations: | ||||||||||||
| Retained earnings | 12,634 | 13,086 | 13,349 | |||||||||
| Recoverable capital loans | 28,145 | 29,001 | 30,147 | |||||||||
| Total investments in commercial Crown corporations | 40,779 | 42,087 | 43,496 | |||||||||
| Total financial assets | 68,624 | 68,326 | 63,434 | |||||||||
| Liabilities: | ||||||||||||
| Accounts payable, accrued liabilities and others | 25,402 | 21,045 | 22,305 | |||||||||
| Deferred revenue | 15,005 | 15,081 | 16,068 | |||||||||
| Debt: | ||||||||||||
| Taxpayer-supported debt | 59,934 | 61,233 | 70,772 | |||||||||
| Self-supported debt | 29,492 | 30,347 | 31,562 | |||||||||
| Forecast allowance | - | - | 700 | |||||||||
| Total provincial debt | 89,426 | 91,580 | 103,034 | |||||||||
| Add: debt offset by sinking funds | 521 | 531 | 485 | |||||||||
| Add: foreign exchange adjustments | 472 | 326 | - | |||||||||
| Less : guarantees and non-guaranteed debt | (1,523 | ) | (1,897 | ) | (1,415 | ) | ||||||
| Financial statement debt | 88,896 | 90,540 | 102,104 | |||||||||
| Total liabilities | 129,303 | 126,666 | 140,477 | |||||||||
| Net liabilities | (60,679 | ) | (58,340 | ) | (77,043 | ) | ||||||
| Capital and other non-financial assets: | ||||||||||||
| Tangible capital assets | 59,811 | 60,503 | 69,032 | |||||||||
| Other non-financial assets | 3,571 | 3,726 | 4,040 | |||||||||
| Total capital and other non-financial assets | 63,382 | 64,229 | 73,072 | |||||||||
| Accumulated surplus (deficit) | 2,703 | 5,889 | (3,971 | ) | ||||||||
Changes in Financial Position
| ($ millions) | Year-to-Date June 30, 2023 | Forecast March 31, 2024 | ||||||
| Deficit (Surplus) for the period | (2,324 | ) | 6,674 | |||||
| Change in remeasurement (gains) losses and other adjustments | (862 | ) | - | |||||
| Decrease/(Increase) in accumulated surplus/deficit | (3,186 | ) | 6,674 | |||||
| Capital and other non-financial asset changes: | ||||||||
| Taxpayer-supported capital investments | 1,360 | 12,180 | ||||||
| Less: amortization and other accounting changes | (668 | ) | (2,959 | ) | ||||
| Increase in net capital assets | 692 | 9,221 | ||||||
| Increase (decrease) in other non-financial assets | 155 | 469 | ||||||
| Increase in capital and other non-financial assets | 847 | 9,690 | ||||||
| Increase (decrease) in net liabilities | (2,339 | ) | 16,364 | |||||
| Investment and working capital changes: | ||||||||
| Investment in commercial Crown corporations: | ||||||||
| Decrease in retained earnings | 452 | 715 | ||||||
| Self-supported capital investments | 1,121 | 4,073 | ||||||
| Less: loan repayments and other accounting changes | (265 | ) | (2,071 | ) | ||||
| Increase/(decrease) in investment in commercial Crown corporations | 1,308 | 2,717 | ||||||
| Decrease in cash and temporary investments | (1,937 | ) | (5,286 | ) | ||||
| Increase in other working capital | 4,612 | (587 | ) | |||||
| Increase in Investment and working capital | 3,983 | (3,156 | ) | |||||
| Increase in financial statement debt | 1,644 | 13,208 | ||||||
| Changes in sinking fund debt and foreign exchange adjustments | 136 | 508 | ||||||
| Decrease in guarantees and non-guaranteed debt | 374 | (108 | ) | |||||
| Increase in total provincial debt | 2,154 | 13,608 | ||||||
| First Quarterly Report 2023/24 | | 29 |

PART 2 | ECONOMIC REVIEW AND OUTLOOK 1
Summary
B.C.’s economy continues to be resilient, despite the higher-than-expected interest rate environment. Employment has posted modest gains, while strong population growth has helped to reduce job vacancies and support consumer spending. Housing markets are adjusting to higher interest rates, with increased home sales activity in recent months and robust new home construction. However, merchandise exports declined in the first half of 2023 reflecting weaker demand from B.C.’s trading partners and lower prices for key commodities compared to the first half of 2022.
Inflation has fallen from the high rates seen last year but prices remain elevated, particularly for food and shelter. Persistent price pressures and economic strength have led to interest rates rising higher than anticipated around the world, which are expected to weigh on domestic and external demand. While the significant uncertainty around COVID-19 disruptions has subsided compared to recent years, B.C.’s economy faces headwinds including the potential impacts of commodity price volatility, extreme weather events, and lingering supply-chain and labour disruptions amid a weaker global outlook.
The Ministry of Finance (Ministry) estimates that B.C.’s economy grew by 3.3 per cent in 2022. The Ministry forecasts economic growth to be 1.2 per cent in 2023 and then slow to 0.8 per cent growth in 2024 as the cumulative effect of higher interest rates works its way through the broader economy. As Chart 2.1 shows, the Ministry’s outlook for B.C. real GDP is within the range of private sector forecasters in 2023 and 2024. Ministry of Finance analysis suggests that the province’s economic growth will be stronger than the current average private sector outlook in both years. The Ministry will continue to monitor trends to assess and update the economic outlook. Over the medium-term (2025 to 2027), the Ministry expects B.C.’s economic growth to range between 2.2 per cent and 2.4 per cent annually.
Chart 2.1 Ministry’s Outlook for B.C. Compared to Private Sector
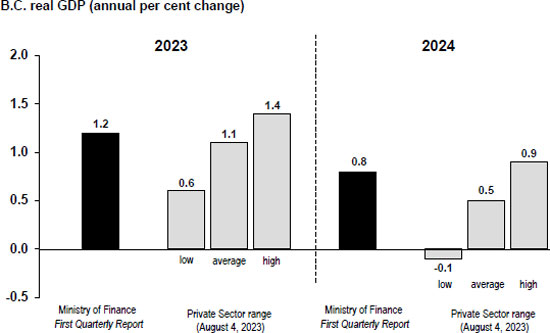
Sources: B.C. Ministry of Finance; Private Sector range (low/average/high of Economic Forecast Council subset consisting of BMO, CIBC, National Bank, RBC, Scotiabank and TD).
1 Reflects data available as of August 23, 2023, unless otherwise indicated.
| First Quarterly Report 2023/24 | | 31 |
Economic Review and Outlook
The main downside risks to B.C.’s outlook include persistent price pressures leading to higher than anticipated interest rates for longer and weaker global demand. Other risks include climate change impacts, housing affordability, and volatility in commodity and financial markets.
British Columbia Economic Activity and Outlook
B.C.’s economy has been more resilient to the impact of higher interest rates than expected. However, rates have risen further than anticipated, which is weighing on the outlook for next year. Steady economic activity is expected to support modest real GDP growth in B.C. this year as the cumulative effects of higher interest rates and elevated inflation soften domestic and global demand. The Ministry’s forecast for B.C. real GDP growth in 2023 has been revised up to 1.2 per cent from the Budget 2023 forecast of 0.4 per cent. The forecast for 2024 has been lowered to 0.8 per cent from 1.5 per cent. This revision largely reflects weaker exports and the impact of higher interest rates over a longer than expected period. Nominal GDP growth for 2023 has been revised up slightly to 2.9 per cent from 2.8 per cent, and in 2024 down to 3.3 per cent from 3.7 per cent.
Table 2.1 British Columbia Economic Indicators
| First Quarter | Second Quarter | Year-to-date | |||||
| All data seasonally adjusted, per cent change | Jan. to Mar. 2023 change from Oct. to Dec. 2022 | Apr. to Jun. 2023 change from Jan. to Mar. 2023 | Jan. to Jun. 2023 change from Jan. to Jun. 2022 | ||||
| Employment | +0.6 | +0.2 | +1.4 | ||||
| Manufacturing shipments | -3.7 | -0.9 | -7.7 | ||||
| Exports | +2.0 | -5.7 | -14.2 | ||||
| Retail sales | -1.0 | +2.5 | +1.0 | ||||
| Consumer price index 1 | +5.7 | +3.7 | +4.7 | ||||
| Housing starts | +1.2 | +3.2 | +19.7 | ||||
| Residential sales units | +0.8 | +33.7 | -25.0 | ||||
| Residential average sale price | -1.8 | +9.3 | -7.5 | ||||
| Non-residential building permits | +18.1 | -15.2 | -10.5 |
1 Quarterly calculations for CPI are year-over-year, e.g. First Quarter is Jan. to Mar. 2023 change from Jan. to Mar. 2022
In the near-term, B.C.’s labour market is expected to see modest employment gains, supported by strong population growth. An up-tick in the unemployment rate from the historically low levels seen in 2022 is expected before trending down over the forecast horizon. Construction activity is expected to continue at high levels, supported by public sector investment. Consumer spending is forecast to ease as higher interest rates and elevated prices limit consumers’ purchasing power. Inflation is forecast to average 3.9 per cent in 2023 and 2.5 per cent in 2024. On the trade front, weaker global demand and lower prices for key commodities are expected to weigh on exports.
Real GDP growth over the 2025 to 2027 period is relatively unchanged from the Budget 2023 forecast. Over this period, inflation is expected to normalize and interest rates are expected to stabilize.
| 32 | | First Quarterly Report 2023/24 |
Economic Review and Outlook
Labour Market
B.C.’s labour market growth has eased in 2023 from the rapid pace associated with the pandemic recovery. Overall, employment grew by 1.3 per cent year-to-date to July 2023 compared to the same period last year. Full-time employment increased by nearly 47,000 jobs and part-time employment decreased by about 11,000 jobs on a year-to-date basis. During this period, the number of jobs created was balanced between the public sector (+21,314 jobs) and self-employment (+19,443 jobs), while private sector jobs declined (-4,757 jobs).
On an industry basis, year-to-date employment gains were concentrated in the services sector (+37,643 jobs), led by educational services (+17,743 jobs); accommodation and food services (+14,943 jobs); and finance, insurance, real estate, and leasing (+10,729 jobs). Meanwhile, the largest service-sector declines were in transportation and warehousing (-7,514 jobs) and health care and social assistance (-4,557 jobs) compared to the first seven months of 2022. During this period, employment in the goods sector edged down (-1,643 jobs), where growth in construction (+11,886 jobs), agriculture (+2,829 jobs) and utilities (+1,014 jobs) was offset by declines in manufacturing (-16,571 jobs) and forestry, fishing, mining, oil, and gas (-757 jobs).
Employment among women accounted for the majority of growth in the labour market so far this year. Women represented 48.4 per cent of B.C.’s labour force and filled 80.8 per cent of the 46,986 new full-time jobs created in the first seven months of 2023. While total employment increased by 1.3 per cent during this period, employment among women grew by 2.1 per cent, outpacing employment growth among men at 0.6 per cent.
Chart 2.2 B.C. Employment
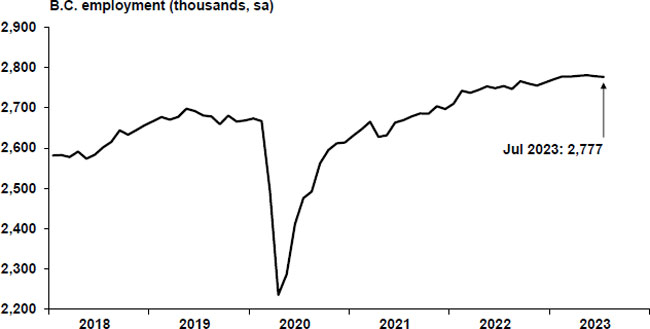
Sources: Statistics Canada (Labour Force Survey); Haver Analytics
The provincial unemployment rate has increased from the historical lows seen in 2022 as labour force growth has outpaced job gains. B.C.’s unemployment rate reached 5.4 per cent in July 2023 and averaged 5.0 per cent year-to-date, 0.2 percentage points below the national average. Meanwhile, job vacancies in the province have steadily declined since peaking in mid-2022 but remain elevated relative to pre-pandemic levels.
| First Quarterly Report 2023/24 | | 33 |
Economic Review and Outlook
The size of B.C.’s labour force increased by 1.6 per cent year-to-date to July 2023, supported by strong population growth. Meanwhile, the province’s labour force participation rate averaged 65.1 per cent, 0.1 percentage points lower than the first seven months of 2022. While the prime-age (25-54 years) labour force participation rate has surpassed its pre-pandemic five-year average, the participation rate among the 55+ years age group has fallen. An aging population poses a challenge for labour markets across the country.
Employee compensation (aggregate wages, salaries, and employers’ social contributions) in B.C. increased by 5.8 per cent year-to-date to March 2023 compared to the same period of 2022. So far this year, the average hourly wage rate rose by 6.0 per cent compared to the first seven months of 2022. On average, wages grew faster than the consumer price index for B.C., which increased by 4.4 per cent over the same period.
Outlook
The outlook for B.C.’s labour market remains stable but faces headwinds next year amid slower domestic and global economic activity. The Ministry forecasts employment in B.C. to increase by 1.1 per cent in 2023 (approximately +30,200 jobs), followed by annual growth of 0.8 per cent in 2024 (approximately +22,000 jobs). Over the medium-term, employment growth is forecast to average 1.3 per cent annually.
In the near-term, the province’s unemployment rate is expected to average 5.4 per cent in 2023 and 5.9 per cent in 2024 reflecting solid labour force growth and a broader slowdown in economic activity. Then B.C.’s unemployment rate is forecast to trend down over the medium-term to 5.1 per cent in 2027.
Consumer Spending and Inflation
Consumer spending has moderated from the strong growth observed in the past two years as the pandemic rebound has faded. Year-to-date to June, B.C. nominal retail sales rose by 1.0 per cent, tempered by higher interest rates and elevated inflation. Meanwhile, consumer prices rose by 4.4 per cent over a similar period, indicating a lower volume of sales. Year-to-date sales gains were led by increased spending at food and beverage stores (+5.8 per cent); clothing, accessories and related retailers (+15.7 per cent); and general merchandise stores (+6.4 per cent). Declines in spending were led by lower sales at building material and garden equipment and supplies dealers (-15.7 per cent) and gasoline stations (-8.7 per cent) compared to the first six months of 2022.
Sales at food services and drinking places in B.C., a component of the service sector, rose by 15.4 per cent year-to-date to May 2023 compared to the same period last year, partly due to higher prices.
Consumer sentiment has weakened amid higher interest rates and elevated inflation. The Conference Board of Canada’s consumer confidence index for B.C. averaged 79.0 points in the first eight months of 2023, 28.6 points lower than the same period of 2022. Similarly, the Bank of Canada’s latest Canadian Survey of Consumer Expectations (conducted in May 2023 before the Bank resumed hiking interest rates in June) cited high interest rates and increased living expenses across a broad range of goods and services as key concerns for Canadian consumers.
| 34 | | First Quarterly Report 2023/24 |
Economic Review and Outlook
Chart 2.3 B.C. Retail Sales

Sources: Statistics Canada; Haver Analytics
Inflation has eased since peaking at 8.1 per cent in May 2022 to reach 3.0 per cent in July 2023. The slower pace partly reflects lower energy prices compared to the high prices for commodities seen in 2022 amid global supply uncertainty following Russia’s invasion of Ukraine. Despite slowing, inflation in the province and globally has not returned to the target levels observed prior to the sharp rise in 2021 and 2022. B.C.’s consumer price index averaged 4.4 per cent in the first seven months of 2023. During this period, price growth was led by shelter (+5.4 per cent) and food (+8.2 per cent). This reflects higher owned and rented accommodation costs, as well as higher prices for food purchased at both stores and restaurants. In the Bank of Canada’s (BoC) Monetary Policy Statement on July 12, 2023, the BoC forecast Canadian inflation to hover around 3 per cent before gradually slowing toward the 2 per cent target by mid-2025.
Chart 2.4 B.C. Inflation
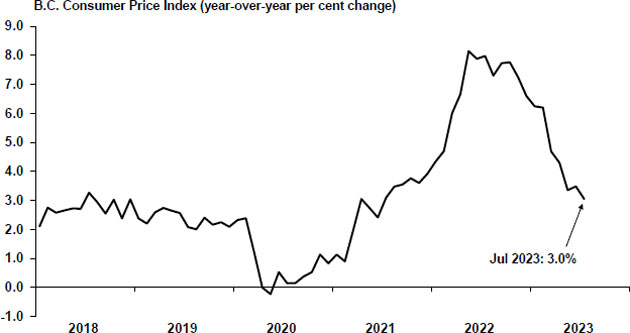
Sources: Statistics Canada; Haver Analytics
| First Quarterly Report 2023/24 | | 35 |
Economic Review and Outlook
Outlook
Household consumption is expected to continue to ease in the near-term as the cumulative effects of interest rate hikes and elevated prices reduce consumers’ purchasing power. The Ministry forecasts real household consumption of goods and services to increase by 2.4 per cent in 2023, followed by 2.2 per cent growth in 2024. Then growth is expected to range between 2.3 per cent and 2.6 per cent annually in the 2025 to 2027 period.
The Ministry expects nominal retail sales to grow by 2.4 per cent in 2023 and by 2.5 per cent in 2024, as support from strong population growth is somewhat offset by the cooling effects of higher interest rates and slower income growth. Then over the medium-term, retail sales are expected to average 3.5 per cent growth annually.
While inflation has fallen from the high rates seen last year, price pressures, particularly for food and shelter, are anticipated to persist in the near-term. However, inflation is expected to gradually ease toward the BoC’s target rate of 2 per cent in the medium-term. Overall, consumer price inflation in B.C. is forecast to be 3.9 per cent in 2023, 2.5 per cent in 2024 and 2.2 per cent in 2025. Then inflation is expected to normalize, averaging 2.0 per cent in 2026 and 2027. Annual inflation rates for Canada are expected to be relatively similar to B.C. over the forecast period.
Housing
B.C. housing market activity has picked up in recent months following a decline last year in response to the sharp increase in interest rates. Still, year-to-date to July, MLS home sales decreased by 19.5 per cent compared to the first seven months of 2022. Further, the additional interest rate increases in June and July of 2023 are expected to dampen activity. On a year-to-date basis, sales decreased in every region in B.C., including Greater Vancouver (-21.8 per cent), Fraser Valley (-15.3 per cent), Okanagan-Mainline (-22.6 per cent) and Victoria (-16.8 per cent).
Chart 2.5 Home Sales and Price
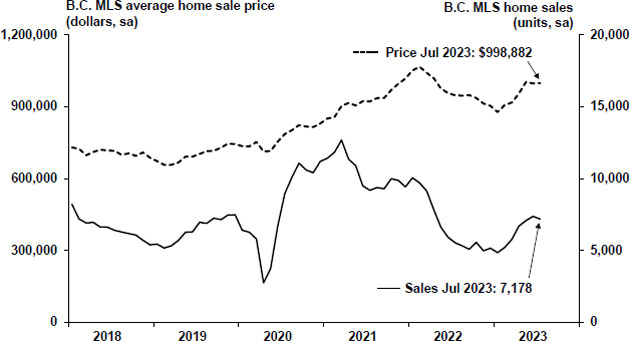
Sources: Canadian Real Estate Association; Haver Analytics
| 36 | | First Quarterly Report 2023/24 |
Economic Review and Outlook
Year-to-date to July, the MLS average home sale price was 5.7 per cent below the high levels seen in the same period of 2022. However, the MLS average home sale price has edged up in recent months, partly due to low inventories of homes for sale.
Despite recent gains, MLS composite benchmark house prices (which incorporates benchmark attributes by dwelling type in each region) decreased across many markets in B.C. on a year-to-date basis. Declines were seen in the Fraser Valley (-13.4 per cent), Vancouver Island (-9.7 per cent), Victoria (-8.7 per cent), the Okanagan Valley (-6.7 per cent) and Greater Vancouver (-5.5 per cent) compared to the first seven months of 2022.
Chart 2.6 Greater Vancouver HPI Benchmark Price
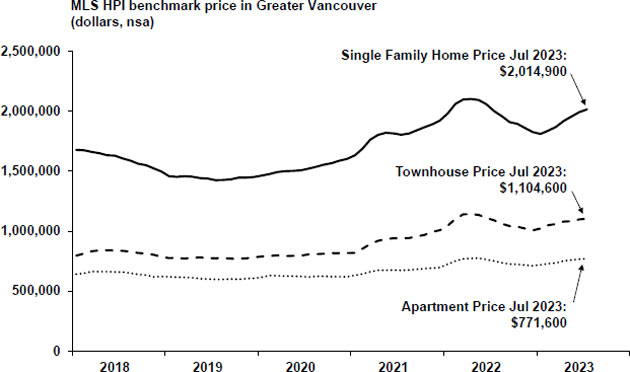
Sources: Canadian Real Estate Association; Haver Analytics
The impact of rising interest rates on home construction has been muted compared to home sales. Robust homebuilding activity has continued so far this year, up 17.4 per cent year-to-date to July 2023. Averaging 51,312 annualized units in the first seven months of 2023, housing starts remain well above the ten-year historical average of 39,073 units. However, a decline in both the value and number of residential building permits, a leading indicator of home construction, points to the potential for some moderation in homebuilding activity moving forward. Year-to-date to June, the value of single-dwelling permits fell by 20.7 per cent and the value of multiple-dwelling permits fell by 8.3 per cent.
| First Quarterly Report 2023/24 | | 37 |
Economic Review and Outlook
Chart 2.7 B.C. Housing Starts
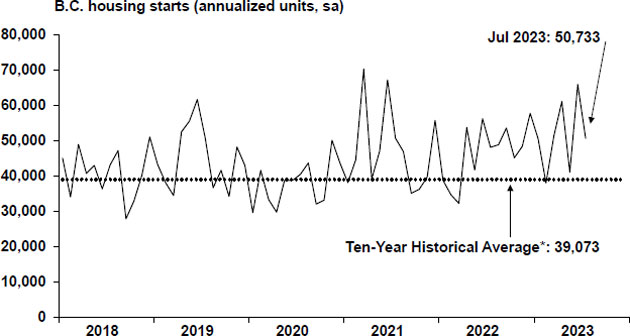
Sources: Canada Mortgage and Housing Corporation; Haver Analytics
* Historical average from Jan. 2013 to Dec. 2022
Outlook
The Ministry expects the impact of high interest rates to continue to weigh on housing market activity this year. The Ministry forecasts unit home sales to decrease by 8.5 per cent in 2023 and then increase by 13.5 per cent in 2024. Average home sale prices are expected to decrease by 3.5 per cent in 2023 and then grow by 3.0 per cent in 2024. Over the medium-term, average sales prices are forecast to increase by 2.6 per cent annually on average. Putting unit sales and prices together, the total value of home sales is forecast to decrease by 11.6 per cent in 2023, increase by 16.9 per cent in 2024, and then average 4.2 per cent growth over the 2025 to 2027 period.
The Ministry prudently expects B.C. housing starts to total approximately 46,700 units in 2023, 42,100 units in 2024 and then average around 40,000 units per year over the medium-term, supported by population growth and public sector investment.
Business and Government
Non-residential construction permitting has slowed from the high levels seen in 2022. The total value of non-residential building permits declined by 10.5 per cent year-to-date to June compared to the same period last year. Underlying the decline was lower permit issuance for institutional and governmental buildings (-30.8 per cent) and industrial structures (-22.5 per cent), while permit issuance increased for commercial buildings (+8.8 per cent).
Businesses in B.C. and at the national level have faced challenges with labour shortages and higher wage costs amid tight labour market conditions and high inflation. Year-to-date to July, the Canadian Federation of Independent Business’ 12-month small business confidence index for B.C. was 6.6 points below the same period of 2022. However, in July 2023, the index stood at 54.7 points, above the 50-point threshold, indicating that more small business owners expect stronger performance over the next year.
| 38 | | First Quarterly Report 2023/24 |
Economic Review and Outlook
B.C.’s tourism sector has moderated, following a rebound in activity throughout 2022. International travelers entering B.C. rose by 107.6 per cent year-to-date to June 2023 compared to the low levels seen in early 2022. However, the number of U.S. and non-U.S. visitors have levelled off in recent months and the 646,050 international travelers entering B.C. in June 2023 remained below the roughly 700,000 visitors seen in an average month prior to the pandemic.
Outlook
The Ministry forecasts total real investment in B.C. to rise by 3.7 per cent in 2023, supported by increases in residential construction and government capital investment. Then total real investment is projected to grow by 2.8 per cent in 2024, and range between 1.9 per cent and 2.2 per cent growth annually over the medium-term.
In the near-term, real business investment is projected to decrease by 1.3 per cent in 2023 and then increase by 1.0 per cent in 2024, reflecting the dampening effects of higher interest rates. Over the 2025 to 2027 period, real business investment growth is expected to range between 2.4 per cent and 2.9 per cent annually.
Real expenditure on goods and services by all levels of government is forecast to rise by 1.1 per cent in 2023 and then decline by 2.8 per cent in 2024 due to the timing and one-time nature of some government expenditures, such as the 2022/23 Supplementary Estimates. In real terms, government expenditures are forecast to be relatively stable over the medium-term.
The Ministry expects nominal net operating surplus of corporations (an approximation of corporate profits) to decrease by 11.8 per cent in 2023 and by 9.1 per cent in 2024 amid slower global economic activity. Then, net operating surplus of corporations is forecast to increase between 1.5 per cent and 4.7 per cent in the 2025 to 2027 period.
External Trade and Commodity Markets
So far this year, weaker global demand and lower prices for key commodities have lowered B.C. merchandise exports. During the first six months of 2023, the value of B.C. goods exports decreased by 14.2 per cent compared to the same period of 2022. Year-to-date declines were broad-based, led by decreases in exports of forestry products and building and packaging materials (-30.2 per cent) and energy products (-17.0 per cent). Meanwhile, exports of electronic and electrical equipment and parts (+17.1 per cent) and industrial machinery, equipment and parts (+16.2 per cent) increased on a year-to-date basis.
Merchandise exports to the U.S. accounted for 54.6 per cent of B.C.’s total goods exports in the first six months of 2023. During this period, goods exports to the U.S. fell by 15.9 per cent, largely due to a decline in forestry products and building and packaging materials (-36.0 per cent). Meanwhile, total goods exports to non-U.S. destinations decreased by 12.1 per cent, led by a drop in energy exports (-17.9 per cent).
| First Quarterly Report 2023/24 | | 39 |
Economic Review and Outlook
Chart 2.8 B.C. Exports
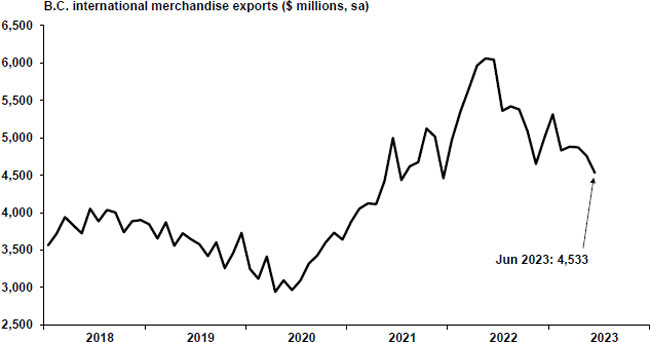
Source: BC Stats
B.C.’s manufacturing shipments decreased by 7.7 per cent year-to-date to June 2023 compared to the same period of 2022, mainly due to reduced shipments of wood products (-36.8 per cent).
In 2022, the war in Ukraine, persistent supply-chain disruptions and strong demand led to rapid growth in commodity prices. However, prices for some commodities have declined this year reflecting reduced demand in the manufacturing sector amid high interest rates and slower global economic activity. The price of Western spruce-pine-fir (SPF) 2x4 lumber averaged $393 US/000 board feet during the January to July period of 2023, down 61.6 per cent compared to the same period of 2022.
Energy prices have softened amid concerns over a broader global economic slowdown. In the first seven months of 2023, the West Texas Intermediate (WTI) oil price averaged $75.08 per barrel, down 26.1 per cent from the same period of 2022. Similarly, the plant inlet price of natural gas fell 53.2 per cent year-to-date, averaging $1.94 C/GJ in the first seven months of 2023.
Meanwhile, the average metallurgical coal price fell by 34.1 per cent year-to-date to July 2023 compared to the same period of 2022 amid weaker market conditions. Zinc and copper declined by 25.5 per cent and 8.2 per cent, respectively. The price for molybdenum rose 44.6 per cent, while price gains for gold and silver were modest compared to the first seven months of 2022.
Outlook
Real exports of goods and services are forecast to grow by 0.7 per cent in 2023 and decrease by 0.2 per cent in 2024 reflecting lower commodity prices and weaker global demand. Then, real exports of goods and services are expected to grow between 2.8 per cent and 5.6 per cent annually in the 2025 to 2027 period.
| 40 | | First Quarterly Report 2023/24 |
Economic Review and Outlook
The price of lumber is forecast to average $400 US/000 board feet in 2023 and $450 US/000 board feet in 2024, before levelling off at $500 US/000 board feet over the medium-term. The plant inlet price for natural gas is expected to average $1.29 C/GJ in 2023/24, $2.03 C/GJ in 2024/25, and $2.33 C/GJ in 2025/26.
Demographics
On April 1, 2023, B.C.’s population was 5.44 million people, up 3.1 per cent from the same date in 2022. During the January to March period of 2023, the province welcomed 40,128 net migrants, up 66.6 per cent compared to the same period of 2022 and continuing the strong growth seen in recent quarters. The increase in immigration in the first three months of 2023 reflects higher net international migration (from +21,266 persons to +40,840 persons), which offset a decline in net interprovincial migration (from +2,816 persons to -712 persons) compared to the same period last year.
Outlook
B.C.’s July 1 population is projected to increase by 3.2 per cent in 2023, 2.9 per cent in 2024, and then average 1.7 per cent annual growth over the medium-term.
Total net migration is expected to be about 173,500 persons in 2023 and 118,100 persons in 2024. Looking beyond, total net migration is projected to taper down to around 98,800 persons in 2027. Over the forecast horizon, international migrants are expected to average around 95 per cent of total migrants, which is higher than recent historical levels, reflecting higher federal immigration targets and the entry of more non-permanent residents.
Risks to the Economic Outlook
There are some upside risks to B.C.’s economy, such as inflationary pressures easing sooner than expected and a less pronounced slowing of the global economy. However, risks are weighted to the downside. Downside risks to B.C.’s economic outlook include the following:
| · | persistent high inflation reducing affordability, and leading to higher interest rates over a longer period; |
| · | uncertainty around the extent of the impact of higher interest rates on consumer and business borrowing, as well as housing markets; |
| · | aging demographics and housing affordability weighing on the supply of labour; |
| · | weaker than expected global economic activity, geopolitical conflict weighing on trade and commodity markets, and broader economic challenges in Europe and Asia; |
| · | severe climate-related events disrupting the lives and livelihoods of British Columbians, destroying productive capital, and impacting economic activity; |
| · | lower prices for B.C.’s major commodity exports, such as lumber, pulp, natural gas, and coal; |
| · | higher volatility in international foreign exchange, stock, and bond markets; and |
| · | timing of investment and hiring related to the LNG Canada project, similar to the risks that exist for other major capital projects. |
| First Quarterly Report 2023/24 | | 41 |
Economic Review and Outlook
External Outlook
The economic outlook for most of B.C.’s major trading partners has improved for 2023 and worsened for 2024 compared to Budget 2023, reflecting the delayed impact of interest rate increases on global economies. Although global inflation has been easing since the start of 2023, core inflation and specific components, including food prices, have remained elevated. In addition, labour market conditions across numerous countries continue to be tight. While many of B.C.’s major trading partners saw stronger economic activity this year than originally anticipated, the effects of rising interest rates on consumption, investment, and exports, coupled with geopolitical uncertainties, may present economic challenges both later this year and into 2024. As inflation returns to target levels, global economic activity is expected to pick up once again over the medium-term.
United States
The U.S. economy showed resilience in the first half of 2023, despite a restrictive monetary policy environment. U.S. real GDP grew by an annualized rate of 2.4 per cent in the second (April to June) quarter of 2023, following annualized growth of 2.0 per cent in the first (January to March) quarter. The second quarter growth reflected an increase in consumer spending, primarily on services, and gains in non-residential investment. The increases were partially offset by declines in exports and residential investment compared to the first quarter.
Chart 2.9 U.S. Real GDP
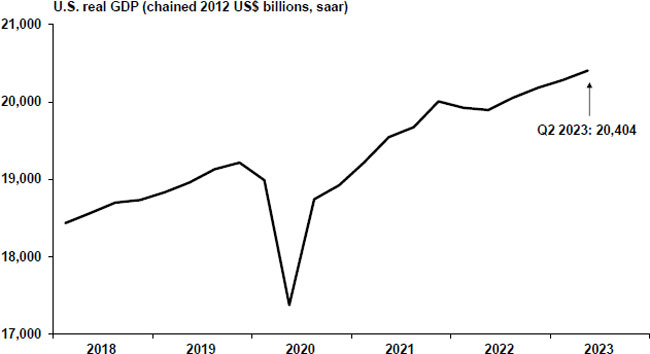
Sources: U.S. Bureau of Economic Analysis; Haver Analytics
As of July 2023, the U.S. labour market had recorded net payroll job gains for 31 consecutive months. On a year-to-date basis, employment was 4.0 million jobs (+2.7 per cent) above the first seven months of last year. The unemployment rate was 3.5 per cent in July 2023, and was 0.1 percentage points lower on average in the first seven months of 2023 compared to the same period in 2022. Year-to-date to July 2023, the average duration of unemployment was down 14.4 per cent compared to the same period last year and 6.4 per cent lower when compared to the same period in 2019, before the pandemic. However, the U.S. labour force participation rate was 62.6 per cent in July 2023, 0.7 percentage points lower than February 2020, contributing to an already tight labour market.
| 42 | | First Quarterly Report 2023/24 |
Economic Review and Outlook
U.S. home sales activity rebounded in the first half of 2023 but generally remains below the levels reached in the past several years. Year-to-date to July 2023, existing home sales were 23.5 per cent lower while new single-family home sales were 1.1 per cent higher compared to the same period last year. The median sales price was down on a year-to-date basis for both existing (-0.6 per cent) and new single-family homes (-3.8 per cent). Similarly, U.S. housing starts declined 13.1 per cent in the first seven months of 2023 compared to the same period of 2022, reflecting fewer single-family starts (-18.6 per cent) and multi-family starts (-1.6 per cent). Furthermore, U.S. residential building permits, an indicator of future building activity, declined by 19.1 per cent in the first seven months of 2023 compared to the same period last year.
Chart 2.10 U.S. Housing Starts
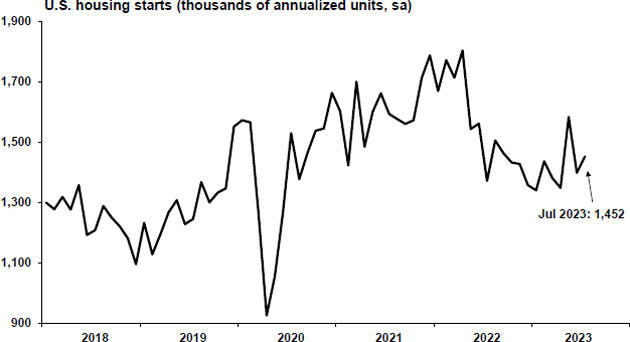
Sources: U.S. Census Bureau; Haver Analytics
Year-to-date to July 2023, U.S. nominal retail sales were up by 3.3 per cent compared to the first seven months of 2022. However, growth in U.S. retail sales has slowed and was flat in the second quarter of 2023. Furthermore, retail sales (measured in nominal dollars) has been boosted by lingering inflation and estimates of real retail sales growth are negative in the first seven months of 2023 compared to the same period last year.
Following its peak of 9.1 per cent (year-over-year) in June 2022, consumer price inflation in the U.S. declined in 12 of the last 13 months and was 3.2 per cent in July 2023. The downward trend in consumer price inflation in 2023 partly reflects easing demand and lower commodity prices.
The US Conference Board Consumer Confidence Index has improved in recent months, including substantial gains in June and July. Year-to-date to July 2023, U.S. consumer confidence averaged 106.7 points, which was 2.4 points above the same period last year.
| First Quarterly Report 2023/24 | | 43 |
Economic Review and Outlook
Year-to-date to June 2023, the value of U.S. merchandise exports decreased slightly (-0.1 per cent). The decline was led by lower exports of petroleum and natural gas products, which were partly offset by higher pharmaceutical exports.
Outlook
In July 2023, Consensus Economics (Consensus) projected U.S. economic growth of 1.6 per cent in 2023 compared to 0.3 per cent in the January 2023 Consensus survey. Meanwhile for 2024, Consensus forecasts growth of 0.5 per cent.
Table 2.2 U.S. Real GDP Forecast: Consensus versus B.C. Ministry of Finance
| 2023 | 2024 | |||||||
| Per cent change in real GDP | ||||||||
| B.C. Ministry of Finance | 1.8 | 0.4 | ||||||
| Consensus Economics (July 2023*) | 1.6 | 0.5 | ||||||
* Comparable month to B.C. Ministry of Finance forecast.
The potential for further interest rate increases by the Federal Reserve in the latter half of 2023 is expected to exert pressure on the U.S. economy in the near-term. In addition, geopolitical tensions worldwide and the slowdown of the global economy increases risk for trade and economic growth. Based on these uncertainties, the Ministry assumes that U.S. real GDP will grow by 1.8 per cent in 2023 and by 0.4 per cent in 2024, while averaging 1.8 per cent annually over the 2025 to 2027 period.
Chart 2.11 Consensus Outlook for the U.S. in 2023
Forecast annual per cent change in U.S. real GDP, 2023
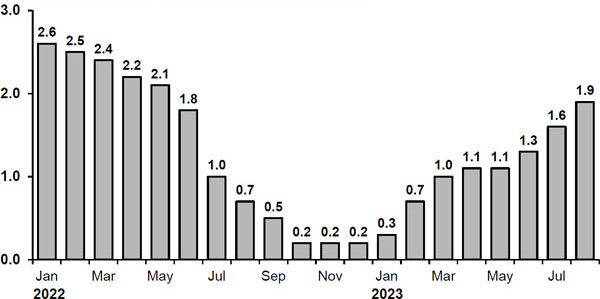
Source: Consensus Economics
The chart above represents forecasts for U.S. real GDP growth in 2023 as polled on specific dates. For example, forecasters surveyed on January 10, 2022 had an average 2023 U.S. real GDP growth forecast of 2.6 per cent, while on August 7, 2023 they forecast 2023 U.S. real GDP to grow by 1.9 per cent.
| 44 | | First Quarterly Report 2023/24 |
Economic Review and Outlook
Canada
The Canadian economy grew 3.1 per cent (annualized) in the first quarter of 2023, following a decline of 0.1 per cent (annualized) in the fourth (October to December) quarter of 2022. Real GDP growth in the first quarter was driven by gains in consumer spending and net exports. Consumer spending grew by 5.7 per cent compared to the fourth quarter of 2022, driven by increases in durable goods expenditure, particularly for motor vehicles. Exports grew by 10.1 per cent supported by shipments of motor vehicles, precious metals and agricultural goods. However, increases were partially offset by a slowdown in inventory accumulations and lower residential investment, which fell 14.6 per cent (annualized) in the first quarter of 2023.
Chart 2.12 Canadian Real GDP
Canadian real GDP (chained 2012 $ billions, saar)
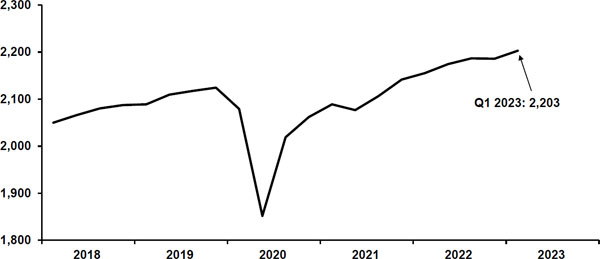
Sources: Statistics Canada; Haver Analytics
After rising by 4.0 per cent in 2022, Canadian employment continued to grow in 2023 but at a slower pace. Year-to-date to July 2023, employment was up by 2.4 per cent compared to the same period last year. The unemployment rate, which had held steady at 5.0 per cent since December 2022, rose from 5.2 per cent in May 2023 to 5.5 per cent in July, partly reflecting labour force increases. Year-to-date to July, the unemployment rate was 0.2 percentage points lower compared to the first seven months of 2022 and averaged 5.2 per cent.
Job vacancies have fallen 11.9 per cent between the first quarter of 2022 and the first quarter of 2023 but remain elevated compared to pre-2020 levels. Year-to-date to July 2023, Canada’s labour force participation rate has remained consistent at 65.6 per cent, slightly above the rate from the same period in 2022. While the participation rate for the prime- age cohort (25-54 years) has been near record highs in 2023 so far, the participation rate among the 55+ years age group is below its pre-pandemic five-year average. The Bank of Canada’s latest Business Outlook Survey released in June 2023 reports that although labour shortages remain a concern for firms, most notably in sectors such as manufacturing, construction, and retail trade, there are signs of improving conditions due to increased labour supply.
| First Quarterly Report 2023/24 | | 45 |
Economic Review and Outlook
Partly due to higher interest rates, Canadian housing market activity continued to weaken in the first quarter of 2023 before posting a modest rebound in the second quarter. Despite the rebound, housing starts were down 8.1 per cent year-to-date to July compared to the same period last year. The decline so far in 2023 was primarily driven by slower construction in urban centers of Montreal and Edmonton but was partially offset by growth in Toronto and Vancouver. Canadian MLS home sales increased by 17.0 per cent in the second quarter of 2023; however, due to declines earlier in the year, they were down by 20.0 per cent year-to-date to July. The national average home sale price declined by 6.5 per cent year-to-date to July 2023.
Canadian nominal retail sales were up 2.2 per cent year-to-date to June compared to the same period last year, partly driven by stronger sales at motor vehicle and parts dealers. On a volume basis, Canadian retail sales were up 1.4 per cent year-to-date to June.
Driven in part by rising interest rates and falling energy prices, consumer price inflation in Canada has decelerated in 2023. Year-over-year, national inflation declined to 3.3 per cent in July 2023 (compared to the 8.1 per cent peak in June 2022), which is still above the Bank of Canada’s target range. In July, food (+7.8 per cent, year-over-year) and shelter (+5.1 per cent, year-over-year) prices added the most upward pressure on national inflation.
After rising 24.9 per cent in 2022, Canadian merchandise exports declined in the first half of 2023 as commodity prices decreased. Year-to-date to June, the value of Canadian merchandise exports declined by 1.0 per cent compared to the same period in 2022, led by lower exports of energy products (-18.0 per cent), and forestry products and building and packaging materials (-20.1 per cent). Services exports were up 12.9 per cent on a year-to-date basis led by the continued recovery of travel services.
Outlook
The July 2023 Consensus forecasts Canadian real GDP to rise by 1.4 per cent in 2023 (1.0 percentage points higher than the January 2023 survey) and by 0.9 per cent in 2024.
Table 2.3 Canadian Real GDP Forecast: Consensus versus B.C. Ministry of Finance
| 2023 | 2024 | |||||||
| Per cent change in real GDP | ||||||||
| B.C. Ministry of Finance | 1.4 | 0.8 | ||||||
| Consensus Economics (July 2023*) | 1.4 | 0.9 | ||||||
* Comparable month to B.C. Ministry of Finance forecast.
The impact of higher interest rates on household spending and business investment, along with weaker exports attributed to global economic activity, could create headwinds for the Canadian economy. The Ministry assumes that the Canadian economy will grow by 1.4 per cent in 2023, 0.8 per cent in 2024 and then average 1.9 per cent annual growth over the 2025 to 2027 period.
| 46 | | First Quarterly Report 2023/24 |
Economic Review and Outlook
Chart 2.13 Consensus Outlook for Canada in 2023
Forecast annual per cent change in Canadian real GDP, 2023
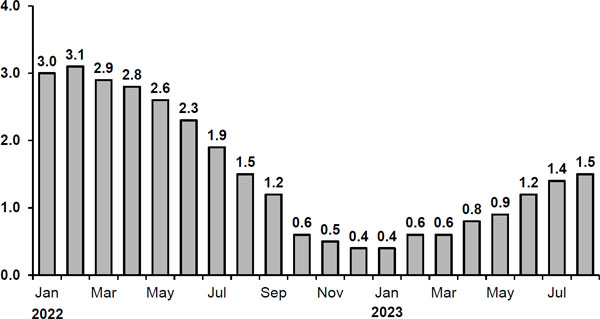
Source: Consensus Economics
The chart above represents forecasts for Canadian real GDP growth in 2023 as polled on specific dates. For example, forecasters surveyed on January 10, 2022 had an average 2023 Canadian real GDP growth forecast of 3.0 per cent, while on August 7, 2023 they forecast 2023 Canadian real GDP to grow by 1.5 per cent.
Asia
China’s economy witnessed a robust recovery in the first quarter of 2023, marked by the lifting of pandemic restrictions, leading to real GDP growing at an annualized rate of 12.0 per cent. However, real GDP in the second quarter declined by an annualized rate of 1.7 per cent. The underperformance of China’s economy in the second quarter reflected several factors, including a rising youth unemployment rate, a weak housing market, and weaker exports due to waning global demand. China’s consumer price inflation rate has been below 2 per cent since February 2023 and turned negative in July. The People’s Bank of China reduced its main benchmark lending rates in both June and August to stimulate demand.
Japan’s economy grew at an annualized rate of 6.0 per cent in the second quarter of 2023, following an increase of 3.7 per cent in the first quarter. Growth in the second quarter was supported by exports, particularly for vehicles and tourism, as well as residential construction. Meanwhile, consumption declined as the fall in the value of the Yen increased import prices. In July, the Bank of Japan adjusted its yield curve control policy, allowing long-term interest rates to rise.
Outlook
The July 2023 Consensus forecasted that China’s real GDP will grow by 5.5 per cent in 2023 and 4.8 per cent in 2024. However, worsening geopolitical tensions, continued weakness in the property market and a slowdown in external demand could present headwinds for China’s economic growth. The Ministry prudently forecasts that China’s economy will expand by 5.3 per cent in 2023, 4.6 per cent in 2024, and average 4.4 per cent annual growth over the 2025 to 2027 period.
| First Quarterly Report 2023/24 | | 47 |
Economic Review and Outlook
The July 2023 Consensus expected Japan real GDP growth of 1.2 per cent in 2023 and 1.0 per cent in 2024. In recognition of downside risks, the Ministry assumes a more moderate pace of growth in Japan’s real GDP. The Ministry forecasts economic activity to rise by 1.0 per cent in 2023 and 0.8 per cent in 2024, and average 0.5 per cent annual growth over the 2025 to 2027 period.
Europe
Economic activity in the euro zone in 2023 has been dampened by elevated inflation and rising interest rates. However, growth improved in the second quarter as annualized real GDP in the euro zone increased by 1.0 per cent, following a 0.1 per cent increase in the first quarter. On a year-to-date basis through the second quarter of 2023 compared to the same period last year, Spain, France, and Italy contributed to euro zone economic growth while Germany’s economy contracted.
Despite headline inflation easing to 5.3 per cent year-over-year in July, it remained well above the European Central Bank’s (ECB) 2 per cent target with some components remaining persistently high (such as food prices). On July 27, 2023 (effective August 2, 2023), the ECB announced its ninth straight interest rate increase, bringing the deposit rate to 3.75 per cent, its highest level since 2000, and kept options open for further rate increases in the future if appropriate.
Outlook
The July 2023 Consensus forecasted that the euro zone economy would grow by 0.5 per cent in 2023 and 0.9 per cent in 2024. Tighter monetary conditions, a global demand slowdown and ongoing geopolitical tensions are expected to create headwinds for the euro zone economy throughout the rest of 2023 and into 2024. As such, the Ministry forecasts real GDP to grow by 0.4 per cent in 2023, 0.7 per cent in 2024, and average 1.2 per cent over the 2025 to 2027 period.
Financial Markets
Interest Rates
The U.S. Federal Reserve (Fed) continued its interest rate hikes in the first half of 2023 to reduce inflation. The Fed has increased rates four times in 2023, each time by 0.25 percentage points (pp), with the last increase in July bringing the target range for the federal funds rate to 5.25 to 5.50 per cent, the highest level since January 2001. Throughout 2023, the Federal Reserve also continued to reduce its holdings of Treasury securities, agency debt and mortgage-backed securities. Comparing their June 2023 projections to those released prior to Budget 2023 (December 2022), the Fed is anticipating stronger economic growth and lower unemployment in 2023, weaker economic growth in 2024, and higher core inflation over the 2023 to 2025 period. The Fed also left the door open for additional policy tightening in future meetings if deemed appropriate.
Following a pause in interest rate increases through the spring, the Bank of Canada (BoC) surprised markets by increasing interest rates twice in the summer. In both June and July, the BoC increased its target for the overnight interest rate by 0.25 pp, bringing the target for the overnight rate to 5.00 per cent, the highest rate since March 2001.
48 | | First Quarterly Report 2023/24 |
Economic Review and Outlook
The BoC’s increases to the policy interest rate reflected its view that monetary policy was not tight enough to return supply and demand back to balance and bring inflation sustainably back to target. In their July interest rate announcement, the BoC noted that global consumer price inflation was on a downward trend, largely due to lower energy prices, but underlying price pressures remained and core inflation was persistent. Looking ahead, the BoC projects inflation to remain close to 3 per cent until the middle of 2024, before reaching the 2 per cent target in the middle of 2025.
Chart 2.14 Interest Rate Forecasts
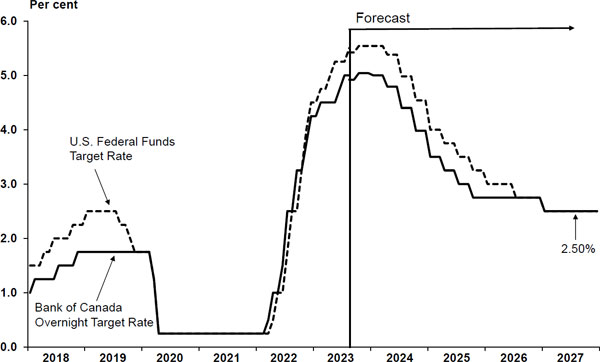
Sources: Bank of Canada; U.S. Federal Reserve; and B.C. Ministry of Finance forecasts.
Outlook
Both the U.S. Federal Reserve and the Bank of Canada expect that additional interest rate increases could be necessary if inflationary pressures persist, but emphasized that any rate changes will be dependent on economic data. Based on the average of six private sector forecasts as of July 21, 2023, the Ministry assumes that the U.S. federal funds rate will average 5.20 per cent in 2023 and 5.11 per cent in 2024. By comparison, the Bank of Canada’s target for the overnight rate is expected to average 4.74 per cent in 2023 and 4.54 per cent in 2024.
The Canadian three-month treasury bill interest rate is expected to average 4.79 per cent in 2023 and 4.42 per cent in 2024, according to the same six private sector forecasters. Meanwhile, the 10-year Government of Canada bond rate is assumed to average 3.19 per cent in 2023 and 3.10 per cent in 2024.
| First Quarterly Report 2023/24 | | 49 |
Economic Review and Outlook
Table 2.4 Private Sector Canadian Interest Rate Forecasts
| 3-month Treasury Bill | 10-year Government Bond | ||||||||
| Average annual interest rate (per cent) | 2023 | 2024 | 2023 | 2024 | |||||
| BMO | 4.82 | 4.50 | 3.22 | 3.11 | |||||
| CIBC | 4.85 | 4.36 | 3.25 | 3.06 | |||||
| National Bank | 4.74 | 4.29 | 3.19 | 3.13 | |||||
| RBC | 4.78 | 4.63 | 3.10 | 2.86 | |||||
| Scotiabank | 4.80 | 4.50 | 3.15 | 3.43 | |||||
| TD | 4.76 | 4.22 | 3.21 | 3.04 | |||||
| Average (as of July 21, 2023) | 4.79 | 4.42 | 3.19 | 3.10 | |||||
Exchange Rates
Since the fourth quarter of 2022, reduced global economic uncertainty, along with slower inflation decreased the demand for safe-haven assets such as the U.S. dollar and contributed to a modest appreciation of the Canadian dollar. During the first seven months of 2023, the Canadian dollar averaged 74.4 US cents.
Chart 2.15 Private Sector Expectations for the Canadian Dollar
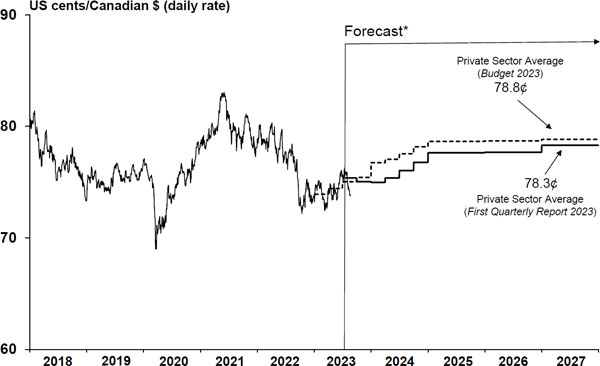
Sources: Bank of Canada and B.C. Ministry of Finance forecasts.
* Based on the average of private sector forecasts. First Quarterly Report 2023 as of July 21, 2023 and Budget 2023 as of January 5, 2023.
| 50 | | First Quarterly Report 2023/24 |
Economic Review and Outlook
Outlook
Based on the average of six private sector forecasts as of July 21, 2023, the Ministry assumes the Canadian dollar will average 74.7 US cents in 2023 and edge up to 75.8 US cents in 2024.
Table 2.5 Private Sector Exchange Rate Forecasts
| Average annual exchange rate (US cents/Canadian $) | 2023 | 2024 | ||
| BMO | 75.2 | 77.7 | ||
| CIBC | 74.9 | 77.0 | ||
| National Bank | 74.0 | 73.1 | ||
| RBC | 74.1 | 74.2 | ||
| Scotiabank | 75.4 | 79.0 | ||
| TD | 74.6 | 73.7 | ||
| Average (as of July 21, 2023) | 74.7 | 75.8 |
| First Quarterly Report 2023/24 | | 51 |
Economic Review and Outlook
Table 2.6.1 Gross Domestic Product (GDP): British Columbia
| Forecast | ||||||||||||||||||||||||||||
| 2021 | 2022 e | 2023 | 2024 | 2025 | 2026 | 2027 | ||||||||||||||||||||||
| Gross Domestic Product at Market Prices: | ||||||||||||||||||||||||||||
| – Real (chained 2012 $ billions) | 282.1 | 291.3 | 294.7 | 297.0 | 304.1 | 311.0 | 317.7 | |||||||||||||||||||||
| (% change) | 6.1 | 3.3 | 1.2 | 0.8 | 2.4 | 2.3 | 2.2 | |||||||||||||||||||||
| – Nominal (current prices, $ billions) | 350.6 | 391.7 | 403.2 | 416.4 | 434.2 | 452.2 | 471.4 | |||||||||||||||||||||
| (% change) | 14.2 | 11.7 | 2.9 | 3.3 | 4.3 | 4.2 | 4.2 | |||||||||||||||||||||
| – GDP price deflator (2012 = 100) | 124.3 | 134.4 | 136.8 | 140.2 | 142.7 | 145.4 | 148.4 | |||||||||||||||||||||
| (% change) | 7.6 | 8.2 | 1.8 | 2.5 | 1.8 | 1.9 | 2.0 | |||||||||||||||||||||
| Real GDP per person (chained 2012 $) | 54,227 | 54,772 | 53,680 | 52,586 | 52,941 | 53,251 | 53,480 | |||||||||||||||||||||
| (% change) | 5.2 | 1.0 | -2.0 | -2.0 | 0.7 | 0.6 | 0.4 | |||||||||||||||||||||
| Real GDP per employed person | ||||||||||||||||||||||||||||
| (% change) | 0.0 | 0.1 | 0.1 | 0.0 | 1.1 | 1.0 | 0.9 | |||||||||||||||||||||
| Unit labour cost1 (% change) | 6.0 | 7.2 | 4.7 | 4.3 | 2.2 | 1.6 | 1.6 | |||||||||||||||||||||
| Components of Real GDP at Market Prices (chained 2012 $ billions) | ||||||||||||||||||||||||||||
| Household expenditure on goods and services | 182.5 | 188.9 | 193.4 | 197.7 | 202.1 | 206.9 | 212.3 | |||||||||||||||||||||
| (% change) | 7.3 | 3.5 | 2.4 | 2.2 | 2.3 | 2.4 | 2.6 | |||||||||||||||||||||
| – Goods | 78.3 | 75.8 | 75.1 | 75.2 | 76.0 | 77.1 | 78.2 | |||||||||||||||||||||
| (% change) | 7.9 | -3.2 | -0.9 | 0.1 | 1.1 | 1.4 | 1.5 | |||||||||||||||||||||
| – Services | 104.4 | 113.2 | 118.4 | 122.6 | 126.3 | 130.0 | 134.2 | |||||||||||||||||||||
| (% change) | 6.8 | 8.5 | 4.5 | 3.6 | 3.0 | 2.9 | 3.3 | |||||||||||||||||||||
| NPISH2 expenditure on goods and services | 4.5 | 4.7 | 4.8 | 5.0 | 5.1 | 5.2 | 5.3 | |||||||||||||||||||||
| (% change) | 2.9 | 4.9 | 2.9 | 2.5 | 2.2 | 1.9 | 1.9 | |||||||||||||||||||||
| Government expenditure on goods and services | 53.6 | 55.5 | 56.1 | 54.5 | 54.6 | 54.7 | 54.7 | |||||||||||||||||||||
| (% change) | 7.9 | 3.5 | 1.1 | -2.8 | 0.1 | 0.1 | 0.1 | |||||||||||||||||||||
| Investment in fixed capital | 77.0 | 79.0 | 81.9 | 84.2 | 86.0 | 87.6 | 89.4 | |||||||||||||||||||||
| (% change) | 10.5 | 2.6 | 3.7 | 2.8 | 2.2 | 1.9 | 2.0 | |||||||||||||||||||||
| Final domestic demand | 318.3 | 328.7 | 336.9 | 342.0 | 348.4 | 354.9 | 362.1 | |||||||||||||||||||||
| (% change) | 8.1 | 3.3 | 2.5 | 1.5 | 1.9 | 1.9 | 2.0 | |||||||||||||||||||||
| Exports of goods and services | 99.0 | 105.8 | 106.6 | 106.4 | 112.4 | 117.3 | 120.6 | |||||||||||||||||||||
| (% change) | 3.2 | 6.9 | 0.7 | -0.2 | 5.6 | 4.4 | 2.8 | |||||||||||||||||||||
| Imports of goods and services | 136.1 | 144.2 | 148.3 | 150.8 | 156.1 | 160.8 | 164.9 | |||||||||||||||||||||
| (% change) | 10.3 | 5.9 | 2.8 | 1.7 | 3.5 | 3.0 | 2.5 | |||||||||||||||||||||
| Inventory change | 1.7 | 1.7 | 0.3 | 0.1 | 0.1 | 0.2 | 0.4 | |||||||||||||||||||||
| Statistical discrepancy | 0.0 | 0.0 | 0.0 | 0.0 | 0.0 | 0.0 | 0.0 | |||||||||||||||||||||
| Real GDP at market prices | 282.1 | 291.3 | 294.7 | 297.0 | 304.1 | 311.0 | 317.7 | |||||||||||||||||||||
| (% change) | 6.1 | 3.3 | 1.2 | 0.8 | 2.4 | 2.3 | 2.2 | |||||||||||||||||||||
| 1 | Unit labour cost is the nominal cost of labour incurred to produce one unit of real output. |
| 2 | Non-profit institutions serving households. |
| e | B.C. Ministry of Finance estimate. |
| 52 | | First Quarterly Report 2023/24 |
Economic Review and Outlook
Table 2.6.2 Selected Nominal Income and Other Indicators: British Columbia
| Forecast | ||||||||||||||||||||||||||||
| 2021 | 2022 | 2023 | 2024 | 2025 | 2026 | 2027 | ||||||||||||||||||||||
| Compensation of employees1 ($ millions) | 171,837 | 190,233 | 201,523 | 211,895 | 221,663 | 230,229 | 238,904 | |||||||||||||||||||||
| (% change) | 12.5 | 10.7 | 5.9 | 5.1 | 4.6 | 3.9 | 3.8 | |||||||||||||||||||||
| Household income ($ millions) | 306,148 | 326,780 | e | 347,506 | 362,161 | 377,041 | 391,619 | 406,986 | ||||||||||||||||||||
| (% change) | 5.5 | 6.7 | 6.3 | 4.2 | 4.1 | 3.9 | 3.9 | |||||||||||||||||||||
| Net operating surplus ($ millions) | 44,601 | 53,878 | e | 47,511 | 43,173 | 43,829 | 45,476 | 47,615 | ||||||||||||||||||||
| (% change) | 26.3 | 20.8 | -11.8 | -9.1 | 1.5 | 3.8 | 4.7 | |||||||||||||||||||||
| Retail sales ($ millions) | 104,653 | 107,889 | 110,481 | 113,252 | 117,110 | 121,203 | 125,506 | |||||||||||||||||||||
| (% change) | 12.6 | 3.1 | 2.4 | 2.5 | 3.4 | 3.5 | 3.5 | |||||||||||||||||||||
| Housing starts (units) | 47,607 | 46,721 | 46,727 | 42,140 | 40,024 | 40,044 | 40,063 | |||||||||||||||||||||
| (% change) | 26.2 | -1.9 | 0.0 | -9.8 | -5.0 | 0.0 | 0.0 | |||||||||||||||||||||
| Residential sales ($ millions) | 115,729 | 80,559 | 71,182 | 83,181 | 89,336 | 91,746 | 94,109 | |||||||||||||||||||||
| (% change) | 57.7 | -30.4 | -11.6 | 16.9 | 7.4 | 2.7 | 2.6 | |||||||||||||||||||||
| Residential sales (units) | 124,769 | 80,848 | 73,996 | 83,980 | 88,032 | 88,090 | 88,110 | |||||||||||||||||||||
| (% change) | 32.9 | -35.2 | -8.5 | 13.5 | 4.8 | 0.1 | 0.0 | |||||||||||||||||||||
| Residential average sale price ($) | 927,549 | 996,428 | 961,969 | 990,489 | 1,014,818 | 1,041,503 | 1,068,077 | |||||||||||||||||||||
| (% change) | 18.7 | 7.4 | -3.5 | 3.0 | 2.5 | 2.6 | 2.6 | |||||||||||||||||||||
| Consumer price index (2002 = 100) | 136.1 | 145.5 | 151.2 | 155.0 | 158.4 | 161.5 | 164.8 | |||||||||||||||||||||
| (% change) | 2.8 | 6.9 | 3.9 | 2.5 | 2.2 | 2.0 | 2.0 | |||||||||||||||||||||
| 1 | Domestic basis; wages, salaries and employers’ social contributions. |
| e | B.C. Ministry of Finance estimate. |
Table 2.6.3 Labour Market Indicators: British Columbia
| Forecast | ||||||||||||||||||||||||||||
| 2021 | 2022 | 2023 | 2024 | 2025 | 2026 | 2027 | ||||||||||||||||||||||
| Population (thousands at July 1) | 5,202 | 5,319 | 5,490 | 5,648 | 5,745 | 5,840 | 5,941 | |||||||||||||||||||||
| (% change) | 0.9 | 2.2 | 3.2 | 2.9 | 1.7 | 1.7 | 1.7 | |||||||||||||||||||||
| Net migration (thousands) | ||||||||||||||||||||||||||||
| – International1,4 | 67.6 | 150.8 | 173.6 | 117.6 | 94.3 | 86.7 | 86.8 | |||||||||||||||||||||
| – Interprovincial4 | 27.2 | 0.5 | -0.1 | 0.5 | 2.3 | 10.8 | 12.0 | |||||||||||||||||||||
| – Total | 94.8 | 151.3 | 173.5 | 118.1 | 96.6 | 97.5 | 98.8 | |||||||||||||||||||||
| Labour force population2 (thousands) | 4,350 | 4,426 | 4,510 | 4,643 | 4,741 | 4,834 | 4,927 | |||||||||||||||||||||
| (% change) | 1.2 | 1.7 | 1.9 | 3.0 | 2.1 | 2.0 | 1.9 | |||||||||||||||||||||
| Labour force (thousands) | 2,852 | 2,881 | 2,936 | 2,974 | 3,006 | 3,035 | 3,066 | |||||||||||||||||||||
| (% change) | 3.3 | 1.0 | 1.9 | 1.3 | 1.1 | 1.0 | 1.0 | |||||||||||||||||||||
| Participation rate3 (%) | 65.6 | 65.1 | 65.1 | 64.1 | 63.4 | 62.8 | 62.2 | |||||||||||||||||||||
| Employment (thousands) | 2,664 | 2,748 | 2,778 | 2,800 | 2,837 | 2,873 | 2,909 | |||||||||||||||||||||
| (% change) | 6.2 | 3.2 | 1.1 | 0.8 | 1.3 | 1.2 | 1.2 | |||||||||||||||||||||
| Unemployment rate (%) | 6.6 | 4.6 | 5.4 | 5.9 | 5.6 | 5.3 | 5.1 | |||||||||||||||||||||
| 1 | International migration includes net non-permanent residents and returning emigrants less net temporary residents abroad. |
| 2 | The civilian, non-institutionalized population 15 years of age and over. |
| 3 | Percentage of the labour force population in the labour force. |
| 4 | Components may not sum to total due to rounding. |
| First Quarterly Report 2023/24 | | 53 |
Economic Review and Outlook
Table 2.6.4 Major Economic Assumptions
| Forecast | ||||||||||||||||||||||||||||
| 2021 | 2022 | 2023 | 2024 | 2025 | 2026 | 2027 | ||||||||||||||||||||||
| Real GDP | ||||||||||||||||||||||||||||
| Canada (chained 2012 $ billions) | 2,103 | 2,176 | 2,206 | 2,224 | 2,268 | 2,309 | 2,351 | |||||||||||||||||||||
| (% change) | 5.0 | 3.4 | 1.4 | 0.8 | 2.0 | 1.8 | 1.8 | |||||||||||||||||||||
| U.S. (chained 2012 US$ billions) | 19,610 | 20,014 | 20,374 | 20,456 | 20,865 | 21,241 | 21,602 | |||||||||||||||||||||
| (% change) | 5.9 | 2.1 | 1.8 | 0.4 | 2.0 | 1.8 | 1.7 | |||||||||||||||||||||
| Japan (chained 2015 Yen trillions) | 540 | 546 | 551 | 556 | 559 | 562 | 565 | |||||||||||||||||||||
| (% change) | 2.2 | 1.0 | 1.0 | 0.8 | 0.6 | 0.5 | 0.5 | |||||||||||||||||||||
| China (constant 2010 US$ billions) | 12,775 | 13,157 | 13,855 | 14,492 | 15,130 | 15,795 | 16,490 | |||||||||||||||||||||
| (% change) | 8.4 | 3.0 | 5.3 | 4.6 | 4.4 | 4.4 | 4.4 | |||||||||||||||||||||
| Euro zone1 (chained 2015 Euro billions) | 11,301 | 11,687 | 11,733 | 11,815 | 11,969 | 12,113 | 12,258 | |||||||||||||||||||||
| (% change) | 5.4 | 3.4 | 0.4 | 0.7 | 1.3 | 1.2 | 1.2 | |||||||||||||||||||||
| Industrial production index (% change) | ||||||||||||||||||||||||||||
| U.S. | 4.4 | 3.4 | -0.3 | -0.8 | 2.0 | 1.7 | 1.7 | |||||||||||||||||||||
| Japan | 5.6 | 0.1 | -0.8 | 1.4 | 0.9 | 0.7 | 0.7 | |||||||||||||||||||||
| China | 10.9 | 3.8 | 4.2 | 4.3 | 4.1 | 4.1 | 4.1 | |||||||||||||||||||||
| Euro zone1 | 8.9 | 2.3 | -0.7 | 1.1 | 1.6 | 1.2 | 1.2 | |||||||||||||||||||||
| Housing starts (thousands) | ||||||||||||||||||||||||||||
| Canada | 271 | 262 | 225 | 205 | 200 | 200 | 200 | |||||||||||||||||||||
| (% change) | 24.5 | -3.4 | -14.1 | -8.9 | -2.4 | 0.0 | 0.0 | |||||||||||||||||||||
| U.S. | 1,601 | 1,553 | 1,380 | 1,345 | 1,350 | 1,350 | 1,350 | |||||||||||||||||||||
| (% change) | 16.0 | -3.0 | -11.1 | -2.5 | 0.4 | 0.0 | 0.0 | |||||||||||||||||||||
| Japan | 856 | 860 | 855 | 855 | 880 | 880 | 880 | |||||||||||||||||||||
| (% change) | 5.0 | 0.4 | -0.5 | 0.0 | 2.9 | 0.0 | 0.0 | |||||||||||||||||||||
| Consumer price index | ||||||||||||||||||||||||||||
| Canada (2002 = 100) | 141.6 | 151.2 | 156.8 | 160.7 | 164.2 | 167.5 | 170.9 | |||||||||||||||||||||
| (% change) | 3.4 | 6.8 | 3.7 | 2.5 | 2.2 | 2.0 | 2.0 | |||||||||||||||||||||
| Canadian interest rates (%) | ||||||||||||||||||||||||||||
| 3-month treasury bills | 0.12 | 2.30 | 4.79 | 4.42 | 3.13 | 2.75 | 2.50 | |||||||||||||||||||||
| 10-year government bonds | 1.36 | 2.77 | 3.19 | 3.10 | 3.00 | 2.85 | 2.85 | |||||||||||||||||||||
| United States interest rates (%) | ||||||||||||||||||||||||||||
| 3-month treasury bills | 0.04 | 2.08 | 5.25 | 4.84 | 3.63 | 2.88 | 2.50 | |||||||||||||||||||||
| 10-year government bonds | 1.44 | 2.95 | 3.72 | 3.51 | 3.25 | 3.13 | 3.00 | |||||||||||||||||||||
| Exchange rate (US cents / Canadian $) | 79.8 | 76.8 | 74.7 | 75.8 | 77.6 | 77.7 | 78.3 | |||||||||||||||||||||
| British Columbia goods and services | ||||||||||||||||||||||||||||
| Export price deflator (% change) | 15.8 | 12.6 | e | -2.4 | 1.8 | 1.2 | 1.2 | 1.2 | ||||||||||||||||||||
| 1 | Euro zone (20) is Austria, Belgium, Croatia, Cyprus, Estonia, Finland, France, Germany, Greece, Ireland, Italy, Latvia, Lithuania, Luxembourg, Malta, Netherlands, Portugal, Slovakia, Slovenia, and Spain. |
| e | B.C. Ministry of Finance estimate. |
| 54 | | First Quarterly Report 2023/24 |
| APPENDIX | FISCAL PLAN UPDATE |
Table A1 Material Assumptions – Revenue
Revenue Source and Assumptions ($ millions unless otherwise specified) | Budget Estimate 2023/24 | Updated Forecast 2023/24 | Plan 2024/25 | Plan 2025/26 | 2023/24 Sensitivities | |||||||||||||
| Personal income tax * | 15,953 | 15,431 | 16,149 | 16,940 | ||||||||||||||
| Current calendar year assumptions | ||||||||||||||||||
| Household income growth | 6.1 | % | 6.3 | % | 4.2 | % | 4.1 | % | +/- 1 percentage point change in 2023 B.C. | |||||||||
| Employee compensation growth | 6.3 | % | 5.9 | % | 5.1 | % | 4.6 | % | household income growth equals +/- $140 to $160 | |||||||||
| Tax base growth | 6.0 | % | 6.2 | % | 4.3 | % | 4.0 | % | million | |||||||||
| Average tax yield | 6.36 | % | 6.32 | % | 6.34 | % | 6.40 | % | ||||||||||
| Current-year tax | 15,528 | 14,924 | 15,621 | 16,415 | ||||||||||||||
| Prior year’s tax assessments | 520 | 550 | 560 | 570 | ||||||||||||||
| Unapplied taxes | 100 | 150 | 150 | 150 | ||||||||||||||
| B.C. Tax Reduction | (205 | ) | (205 | ) | (210 | ) | (215 | ) | ||||||||||
| Non-refundable B.C. tax credits | (176 | ) | (176 | ) | (176 | ) | (176 | ) | ||||||||||
| Policy neutral elasticity ** | 0.9 | 0.9 | 1.1 | 1.2 | +/- 0.5 change in 2023 B.C. policy neutral elasticity | |||||||||||||
| Fiscal year assumptions | equals +/- $440 to $460 million | |||||||||||||||||
| Prior-year adjustment | - | 9 | ||||||||||||||||
| 2022 Tax-year | 2022 Assumptions | |||||||||||||||||
| Household income growth | 7.1 | % | 6.7 | % | +/- 1 percentage point change in 2022 B.C. | |||||||||||||
| Tax base growth | 6.2 | % | 2.5 | % | household or taxable income growth equals | |||||||||||||
| Average 2022 tax yield | 6.38 | % | 6.34 | % | +/- $170 to $190 million one-time effect (prior-year | |||||||||||||
| 2022 tax | 14,713 | 14,113 | adjustment) and could result in an additional +/- | |||||||||||||||
| 2021 & prior year’s tax assessments | 510 | 700 | $140 to $160 million base change in 2023/24 | |||||||||||||||
| Unapplied taxes | 100 | 150 | ||||||||||||||||
| B.C. Tax Reduction | (197 | ) | (197 | ) | ||||||||||||||
| Non-refundable B.C. tax credits | (176 | ) | (176 | ) | ||||||||||||||
| Policy neutral elasticity ** | 0.8 | 0.2 | ||||||||||||||||
| * Reflects information as at August 18, 2023 | ||||||||||||||||||
| ** Per cent growth in current year tax revenue (excluding policy measures) relative to per cent growth in household income (calendar year). | ||||||||||||||||||
| Corporate income tax * | 5,938 | 6,037 | 7,616 | 5,942 | ||||||||||||||
| Components of revenue (fiscal year) | ||||||||||||||||||
| Installments – subject to general rate | 6,879 | 5,929 | 7,229 | 6,672 | ||||||||||||||
| Installments – subject to small business rate | 350 | 295 | 360 | 332 | ||||||||||||||
| Non-refundable B.C. tax credits | (187 | ) | (187 | ) | (172 | ) | (177 | ) | ||||||||||
| Advance installments | 7,042 | 6,037 | 7,417 | 6,827 | ||||||||||||||
| Prior-year settlement payment | (1,104 | ) | - | 199 | (885 | ) | ||||||||||||
| Current calendar year assumptions | ||||||||||||||||||
| National tax base ($ billions) | 547.0 | 488.6 | 532.5 | 565.6 | +/- 1% change in the 2023 national tax base | |||||||||||||
| B.C. installment share of national tax base | 13.6 | % | 13.4 | % | 14.2 | % | 12.9 | % | equals +/- $70 to $80 million | |||||||||
| Effective percentage tax rates | ||||||||||||||||||
| (% general/small business) | 12.0 / 2.0 | 12.0 / 2.0 | 12.0 / 2.0 | 12.0 / 2.0 | ||||||||||||||
| Share of the B.C. tax base subject to the small business rate | 23.8 | % | 23.4 | % | 23.0 | % | 23.0 | % | +/- 1 percentage point change in the 2023 small | |||||||||
| B.C. tax base growth (post federal measures) | -7.1 | % | -5.0 | % | -0.5 | % | 1.7 | % | business share equals -/+ $70 to $80 million | |||||||||
| B.C. net operating surplus growth | -14.5 | % | -11.8 | % | -9.1 | % | 1.5 | % | ||||||||||
| 2022 Tax-year | 2022 Assumptions | |||||||||||||||||
| B.C. tax base growth (post federal measures) | 7.5 | % | 1.9 | % | ||||||||||||||
| Share of the B.C. tax base subject to small business rate | 24.0 | % | 23.6 | % | +/- 1% change in the 2022 B.C. tax base equals +/ | |||||||||||||
| B.C. net operating surplus growth | 13.5 | % | 20.8 | % | $60 to $80 million one-time effect (prior-year | |||||||||||||
| Gross 2022 tax | 7,424 | 7,068 | adjustment) and could result in an additional | |||||||||||||||
| Prior-year settlement payment | (1,104 | ) | - | installments payments of +/- $80 to $100 million in | ||||||||||||||
| Prior years losses/gains (included in above) | (200 | ) | (100 | ) | 2023/24 | |||||||||||||
| Non-refundable B.C. tax credits | (210 | ) | (210 | ) | ||||||||||||||
* Reflects information as at August 18, 2023
Cash received from the federal government is used as the basis for estimating revenue. Due to lags in the federal collection and installment systems, changes to the B.C. net operating surplus and tax base forecasts affect revenue in the succeeding year. The 2023/24 installments from the federal government reflects two-third of payments related to the 2023 tax year (paid during Apr-July 2023 and adjusted in Sept and Dec) and one-third of 2024 payments. Installments for the 2023 (2024) tax year are based on B.C.’s share of the national tax base for the 2022 (2023) tax year and a forecast of the 2023 (2024) national tax base. B.C.’s share of the 2021 national tax base was 13.8%, based on tax assessments as of December 31, 2022. Cash adjustments for any under/over payments from the federal government in respect of 2022 will be received/paid on March 31, 2024.
| First Quarterly Report 2023/24 | | 55 |
Appendix – Fiscal Plan Update
Table A1 Material Assumptions – Revenue (continued)
Revenue Source and Assumptions ($ millions unless otherwise specified) | Budget Estimate 2023/24 | Updated Forecast 2023/24 | Plan 2024/25 | Plan 2025/26 | 2023/24 Sensitivities | |||||||||||||
| Employer health tax | 2,731 | 2,750 | 2,892 | 3,025 | ||||||||||||||
| Employee compensation growth | 6.3 | % | 5.9 | % | 5.1 | % | 4.6 | % | +/- 1 percentage point change in the 2023 | |||||||||
| employee compensation growth equals up to +/- | ||||||||||||||||||
| $25 million | ||||||||||||||||||
| Provincial sales tax | 10,187 | 10,362 | 10,779 | 11,229 | ||||||||||||||
| Provincial sales tax base growth (fiscal year) | 3.2 | % | 5.0 | % | 4.0 | % | 4.1 | % | +/- 1 percentage point change in the 2023 | |||||||||
| Calendar Year nominal expenditure | consumer expenditure growth equals up to +/- $20 | |||||||||||||||||
| Consumer expenditures on durable goods | -3.6 | % | 2.0 | % | 0.8 | % | 2.2 | % | to $30 million | |||||||||
| Consumer expenditures on goods and services | 6.9 | % | 6.4 | % | 4.7 | % | 4.4 | % | ||||||||||
| Business investment | 1.4 | % | 4.0 | % | 4.8 | % | 5.5 | % | +/- 1 percentage point change in the 2023 | |||||||||
| Other | 3.4 | % | 2.6 | % | 2.6 | % | 5.7 | % | business investment growth equals up to +/- $10 | |||||||||
| to $20 million | ||||||||||||||||||
| Components of Provincial sales tax revenue | ||||||||||||||||||
| Consolidated Revenue Fund | 10,178 | 10,353 | 10,770 | 11,220 | ||||||||||||||
| BC Transportation Financing Authority | 9 | 9 | 9 | 9 | ||||||||||||||
| Fuel and carbon taxes | 3,883 | 3,742 | 3,953 | 4,287 | ||||||||||||||
| Calendar Year | ||||||||||||||||||
| Real GDP | 0.4 | % | 1.2 | % | 0.8 | % | 2.4 | % | ||||||||||
| Gasoline volumes | 0.0 | % | -1.0 | % | -1.0 | % | -3.0 | % | ||||||||||
| Diesel volumes | 3.0 | % | -2.0 | % | 2.0 | % | 2.0 | % | ||||||||||
| Natural gas volumes | 1.0 | % | -1.0 | % | 1.0 | % | 0.0 | % | ||||||||||
| Carbon tax rates (April 1) | ||||||||||||||||||
| Carbon dioxide equivalent emissions ($/tonne) | 65 | 65 | 80 | 95 | ||||||||||||||
| Natural gas (cents/gigajoule) | 322.79 | ¢ | 322.79 | ¢ | 397.28 | ¢ | 471.77 | ¢ | ||||||||||
| Gasoline (cents/litre) | 14.31 | ¢ | 14.31 | ¢ | 17.61 | ¢ | 20.91 | ¢ | ||||||||||
| Light fuel oil (cents/litre) | 16.85 | ¢ | 16.85 | ¢ | 20.74 | ¢ | 24.62 | ¢ | ||||||||||
| Components of revenue * | ||||||||||||||||||
| Consolidated Revenue Fund | 582 | 562 | 553 | 547 | ||||||||||||||
| BC Transit | 18 | 18 | 18 | 17 | ||||||||||||||
| BC Transportation Financing Authority | 472 | 462 | 461 | 454 | ||||||||||||||
| Fuel tax revenue | 1,072 | 1,042 | 1,032 | 1,018 | ||||||||||||||
| Carbon tax revenue | 2,811 | 2,700 | 2,921 | 3,269 | ||||||||||||||
| Property taxes | 3,488 | 3,591 | 3,739 | 3,940 | ||||||||||||||
| Calendar Year | ||||||||||||||||||
| Consumer Price Index | 3.9 | % | 3.9 | % | 2.5 | % | 2.2 | % | +/- 1 percentage point change in 2023 new | |||||||||
| Housing starts (units) | 39,033 | 46,727 | 42,140 | 40,024 | construction & inflation growth equals up to +/- | |||||||||||||
| Home owner grants (fiscal year) | 910 | 907 | 926 | 944 | $30 million in residential property taxation revenue | |||||||||||||
| Components of revenue | ||||||||||||||||||
| Residential (net of home owner grants) | 1,434 | 1,510 | 1,596 | 1,674 | ||||||||||||||
| Speculation and vacancy | 90 | 90 | 90 | 90 | ||||||||||||||
| Non-residential | 1,566 | 1,572 | 1,630 | 1,717 | +/- 1% change in 2023 total | |||||||||||||
| Rural area | 147 | 149 | 153 | 157 | business property assessment | |||||||||||||
| Police | 37 | 39 | 40 | 41 | value equals up to +/- $20 million | |||||||||||||
| BC Assessment Authority | 107 | 114 | 115 | 117 | in non-residential property | |||||||||||||
| BC Transit | 107 | 117 | 115 | 144 | taxation revenue | |||||||||||||
| Other taxes | 3,144 | 3,280 | 3,545 | 3,698 | ||||||||||||||
| Calendar Year | ||||||||||||||||||
| Population | 2.4 | % | 3.2 | % | 2.9 | % | 1.7 | % | ||||||||||
| Residential sales value | -19.8 | % | -11.6 | % | 16.9 | % | 7.4 | % | ||||||||||
| Real GDP | 0.4 | % | 1.2 | % | 0.8 | % | 2.4 | % | ||||||||||
| Nominal GDP | 2.8 | % | 2.9 | % | 3.3 | % | 4.3 | % | ||||||||||
| Components of revenue | +/- 1% change to 2023 residential | |||||||||||||||||
| Property transfer | 1,799 | 1,950 | 2,205 | 2,348 | sales value equals +/- $20 million | |||||||||||||
| Additional Property Transfer Tax (included in above) | 30 | 40 | 45 | 60 | in property transfer revenue, depending on property values | |||||||||||||
| Tobacco | 565 | 520 | 520 | 520 | ||||||||||||||
| Insurance premium | 780 | 810 | 820 | 830 | ||||||||||||||
| 56 | | First Quarterly Report 2023/24 |
Appendix – Fiscal Plan Update
Table A1 Material Assumptions – Revenue (continued)
Revenue Source and Assumptions ($ millions unless otherwise specified) | Budget Estimate 2023/24 | Updated Forecast 2023/24 | Plan 2024/25 | Plan 2025/26 | 2023/24 Sensitivities | |||||||||||||
| Energy, sales of Crown land tenures, metals, minerals and other * | 3,367 | 1,962 | 2,237 | 2,193 | ||||||||||||||
| Natural gas price | +/- $0.25 change in the natural gas | |||||||||||||||||
| Plant inlet, $C/gigajoule | 3.04 | 1.29 | 2.03 | 2.33 | price equals +/- $130 to $150 million, | |||||||||||||
| Sumas, $US/MMBtu | 3.99 | 2.42 | 3.06 | 3.36 | including impacts on production | |||||||||||||
| Natural gas production volumes | volumes and royalty program | |||||||||||||||||
| Billions of cubic metres | 72.2 | 70.2 | 73.2 | 73.4 | credits, but excluding any | |||||||||||||
| Petajoules | 2,995 | 2,927 | 3,051 | 3,059 | changes from natural gas liquids | |||||||||||||
| Annual per cent change | 8.9 | % | 7.2 | % | 4.2 | % | 0.3 | % | revenue (e.g. butane, pentanes) | |||||||||
| Sensitivities can also vary | ||||||||||||||||||
| Oil price ($US/bbl at Cushing, OK) | 80.79 | 74.56 | 73.17 | 74.72 | significantly at different price levels | |||||||||||||
| +/- 1% change in natural gas | ||||||||||||||||||
| Auctioned land base (000 hectares) | 11 | 11 | 20 | 20 | volumes equals +/- $20 million | |||||||||||||
| Average bid price/hectare ($) | 275 | 200 | 200 | 300 | in natural gas royalties | |||||||||||||
| Cash sales of Crown land tenures | 3 | 2 | 4 | 6 | +/- 1 cent change in the exchange rate | |||||||||||||
| Metallurgical coal price ($US/tonne, fob Australia) | 252 | 248 | 222 | 210 | equals +/-$1 million in natural gas royalties | |||||||||||||
| Copper price ($US/lb) | 3.56 | 3.82 | 3.96 | 4.09 | ||||||||||||||
| Annual electricity volumes set by treaty | 3.9 | 3.9 | 3.8 | 3.8 | +/- $10/bbl change in petroleum price | |||||||||||||
| (million mega-watt hours) | equals +/- $5 million in petroleum royalties | |||||||||||||||||
| Mid-Columbia electricity price | 107.84 | 92.90 | 90.06 | 92.10 | +/- 12% change in natural gas liquids | |||||||||||||
| ($US/mega-watt hour) | (equivalent to +/- $10/bbl oil price) prices | |||||||||||||||||
| equals +/- $80 to $100 million in natural gas | ||||||||||||||||||
| Exchange rate (US¢/C$, calendar year) | 74.7 | 74.7 | 75.8 | 77.6 | liquids royalties | |||||||||||||
| Components of revenue | ||||||||||||||||||
| Bonus bid auctions: | +/- US$20 change in the average | |||||||||||||||||
| Deferred revenue | 61 | 60 | 29 | 28 | metallurgical coal price | |||||||||||||
| Current-year cash (one-tenth) | - | 1 | - | - | equals +/- $50 to $80 million | |||||||||||||
| Fees and rentals | 50 | 38 | 36 | 36 | +/- 10% change in the average Mid-Columbia | |||||||||||||
| Total bonus bids, fees and rentals | 111 | 99 | 65 | 64 | electricity price equals +/- $50 million | |||||||||||||
| Natural gas royalties after deductions and allowances | 2,016 | 837 | 1,179 | 1,182 | ||||||||||||||
| Petroleum royalties | 37 | 34 | 31 | 29 | ||||||||||||||
| Columbia River Treaty electricity sales | 522 | 478 | 452 | 456 | ||||||||||||||
| BC Energy Regulator fees and levies | 66 | 73 | 75 | 74 | Based on a recommendation from the Auditor | |||||||||||||
| Coal, metals and other minerals revenue: | General to be consistent with generally accepted | |||||||||||||||||
| Coal tenures | 8 | 8 | 8 | 8 | accounting principles, bonus bid revenue | |||||||||||||
| Net coal mineral tax | 372 | 194 | 240 | 210 | recognition reflects ten-year deferral of cash | |||||||||||||
| Net metals and other minerals tax | 47 | 51 | 54 | 58 | receipts from the sale of Crown land tenures | |||||||||||||
| Recoveries relating to revenue sharing payments to First Nations | 170 | 170 | 115 | 94 | ||||||||||||||
| Miscellaneous mining revenue | 18 | 18 | 18 | 18 | ||||||||||||||
| Total coal, metals and other minerals revenue | 615 | 441 | 435 | 388 | ||||||||||||||
| Gross royalties prior to deductions and allowances | ||||||||||||||||||
| Gross natural gas revenue | 1,993 | 531 | 953 | 1,077 | ||||||||||||||
| Gross natural gas liquids royalties revenue | 783 | 685 | 609 | 727 | ||||||||||||||
| Royalty programs and infrastructure credits | ||||||||||||||||||
| Deep drilling | (400 | ) | (200 | ) | (141 | ) | (99 | ) | ||||||||||
| Road, pipeline, Clean Growth Infrastructure Royalty and other infrastructure programs | (95 | ) | (65 | ) | (118 | ) | (171 | ) | ||||||||||
| Total | (495 | ) | (265 | ) | (259 | ) | (270 | ) | ||||||||||
| Implicit average natural gas royalty rate | 22.2 | % | 22.5 | % | 14.8 | % | 11.8 | % | ||||||||||
Royalty program (marginal, low productivity and ultra marginal drilling) adjustments reflect reduced royalty rates. Natural gas royalties incorporate royalty programs and Treasury Board approved infrastructure credits.
* Reflects information as at August 4, 2023.
| First Quarterly Report 2023/24 | | 57 |
Appendix – Fiscal Plan Update
Table A1 Material Assumptions – Revenue (continued)
Revenue Source and Assumptions ($ millions unless otherwise specified) | Budget Estimate 2023/24 | Updated Forecast 2023/24 | Plan 2024/25 | Plan 2025/26 | 2023/24 Sensitivities | |||||||||||||
| Forests * | 846 | 886 | 847 | 952 | ||||||||||||||
| Prices (calendar year average) | +/- US$50 change in SPF price equals | |||||||||||||||||
| SPF 2x4 ($US/thousand board feet) | 400 | 400 | 450 | 500 | +/- $100 to $150 million | |||||||||||||
| Crown harvest volumes (million cubic metres) | ||||||||||||||||||
| Interior | 30.0 | 30.0 | 29.9 | 29.7 | +/- 10% change in Interior harvest volumes equals | |||||||||||||
| Coast | 8.0 | 8.0 | 8.1 | 8.3 | +/- $50 to $60 million | |||||||||||||
| Total | 38.0 | 38.0 | 38.0 | 38.0 | +/- 10% change in Coastal harvest volumes | |||||||||||||
| B.C. Timber Sales (included in above) | 6.3 | 6.3 | 6.4 | 7.4 | equals +/- $15 to $25 million | |||||||||||||
| Stumpage rates ($Cdn/cubic metre) | ||||||||||||||||||
| Total stumpage rates | 18.07 | 19.04 | 19.42 | 22.14 | +/- 1 cent change in exchange rate | |||||||||||||
| equals +/- $25 to $35 million in stumpage revenue | ||||||||||||||||||
| Components of revenue | ||||||||||||||||||
| Timber tenures (net of revenue sharing recoveries) | 293 | 330 | 350 | 440 | ||||||||||||||
| Recoveries relating to revenue sharing payments to First Nations | 138 | 138 | 138 | 105 | ||||||||||||||
| B.C. Timber Sales | 274 | 274 | 268 | 316 | The above sensitivities relate | |||||||||||||
| Logging tax | 100 | 100 | 50 | 50 | to stumpage revenue only. | |||||||||||||
| Other CRF revenue | 30 | 33 | 30 | 30 | ||||||||||||||
| Recoveries | 11 | 11 | 11 | 11 | ||||||||||||||
| * Reflects information as at August 3, 2023 | ||||||||||||||||||
| Other natural resource | 551 | 536 | 509 | 549 | ||||||||||||||
| Components of revenue | ||||||||||||||||||
| Water rental and licences* | 478 | 463 | 436 | 476 | +/- 5% change in water power production | |||||||||||||
| Recoveries | 50 | 50 | 50 | 50 | equals +/- $20 to $25 million | |||||||||||||
| Angling and hunting permits and licences | 10 | 10 | 10 | 10 | ||||||||||||||
| Recoveries | 13 | 13 | 13 | 13 | ||||||||||||||
| * Water rentals for power purposes are indexed to Consumer Price Index. | ||||||||||||||||||
| Total natural resource recoveries relating to revenue sharing payments to First Nations | 327 | 327 | 253 | 199 | Revenue sharing from natural gas royalties, mineral tax and forest stumpage revenues. | |||||||||||||
| Other revenue | 10,520 | 10,667 | 10,829 | 11,052 | ||||||||||||||
| Components of revenue | ||||||||||||||||||
| Fees and licences | ||||||||||||||||||
| Motor vehicle licences and permits | 618 | 614 | 621 | 630 | ||||||||||||||
| International student health fees | 70 | 90 | 90 | 90 | ||||||||||||||
| Other Consolidated Revenue Fund | 495 | 509 | 476 | 494 | ||||||||||||||
| Summary consolidation eliminations | (14 | ) | (15 | ) | (15 | ) | (14 | ) | ||||||||||
| Ministry vote recoveries | 270 | 270 | 105 | 105 | ||||||||||||||
| Taxpayer-supported Crown corporations | 202 | 208 | 209 | 211 | ||||||||||||||
| Post-secondary education fees | 2,770 | 2,829 | 2,956 | 3,061 | ||||||||||||||
| Other healthcare-related fees | 496 | 510 | 510 | 516 | ||||||||||||||
| School Districts | 275 | 248 | 266 | 281 | ||||||||||||||
| Investment earnings | ||||||||||||||||||
| Consolidated Revenue Fund | 130 | 235 | 130 | 130 | ||||||||||||||
| Fiscal agency loans & sinking funds earnings | 1,088 | 1,014 | 1,223 | 1,202 | ||||||||||||||
| Summary consolidation eliminations | (198 | ) | (204 | ) | (198 | ) | (204 | ) | ||||||||||
| Taxpayer-supported Crown corporations | 36 | 46 | 41 | 41 | ||||||||||||||
| SUCH sector agencies | 293 | 318 | 326 | 342 | ||||||||||||||
| Sales of goods and services | ||||||||||||||||||
| SUCH sector agencies | 986 | 988 | 1,039 | 1,092 | ||||||||||||||
| BC Infrastructure Benefits Inc. | 246 | 279 | 311 | 346 | ||||||||||||||
| Other taxpayer-supported Crown corporations | 254 | 99 | 107 | 112 | ||||||||||||||
| Miscellaneous | 2,503 | 2,629 | 2,632 | 2,617 | ||||||||||||||
| 58 | | First Quarterly Report 2023/24 |
Appendix – Fiscal Plan Update
Table A1 Material Assumptions – Revenue (continued)
Revenue Source and Assumptions ($ millions unless otherwise specified) | Budget Estimate 2023/24 | Updated Forecast 2023/24 | Plan 2024/25 | Plan 2025/26 | 2023/24 Sensitivities | |||||||||||||
| Health and social transfers | 8,970 | 9,252 | 9,385 | 9,770 | ||||||||||||||
| National Cash Transfers | ||||||||||||||||||
| Canada Health Transfer (CHT) | 49,421 | 49,421 | 52,083 | 54,687 | ||||||||||||||
| Annual growth | 9.3 | % | 9.3 | % | 5.4 | % | 5.0 | % | ||||||||||
| Canada Social Transfer (CST) | 16,416 | 16,416 | 16,909 | 17,416 | ||||||||||||||
| B.C.’s share of national population (June 1) | 13.62 | % | 13.64 | % | 13.60 | % | 13.55 | % | +/- 0.1 percentage point change in B.C.’s | |||||||||
| population share equals +/- $65 million | ||||||||||||||||||
| B.C. health and social transfers revenue | ||||||||||||||||||
| CHT | 6,733 | 6,740 | 7,085 | 7,410 | ||||||||||||||
| CST | 2,237 | 2,239 | 2,300 | 2,360 | ||||||||||||||
| CHT top up - strengthen public health care | - | 273 | - | - | ||||||||||||||
| Other federal contributions | 4,623 | 4,240 | 4,271 | 3,937 | ||||||||||||||
| Components of revenue | ||||||||||||||||||
| Disaster Financial Assistance Arrangements | 1,268 | 848 | 1,102 | 773 | ||||||||||||||
| B.C.’s share of the federal cannabis excise tax | 70 | 85 | 85 | 85 | ||||||||||||||
| Other Consolidated Revenue Fund | 104 | 105 | 105 | 105 | ||||||||||||||
| Vote Recoveries: | ||||||||||||||||||
| Labour Market Development Agreement | 296 | 296 | 296 | 296 | ||||||||||||||
| Labour Market and Skills Training Program | 98 | 98 | 98 | 98 | ||||||||||||||
| Home Care | 82 | 82 | 81 | 81 | ||||||||||||||
| Mental Health | 82 | 82 | 82 | 82 | ||||||||||||||
| Child Care | 822 | 822 | 822 | 822 | ||||||||||||||
| Child Safety, Family Support, Children in Care and with special needs | 83 | 83 | 83 | 83 | ||||||||||||||
| Public Transit | 297 | 297 | 92 | 135 | ||||||||||||||
| Local government services and transfers | 188 | 188 | 181 | 120 | ||||||||||||||
| Other recoveries | 154 | 154 | 155 | 155 | ||||||||||||||
| Taxpayer-supported Crown corporations | 324 | 347 | 322 | 329 | ||||||||||||||
| Post-secondary institutions | 634 | 623 | 636 | 641 | ||||||||||||||
| Other SUCH sector agencies | 121 | 130 | 131 | 132 | ||||||||||||||
| Service delivery agency direct revenue | 8,981 | 9,118 | 9,345 | 9,614 | ||||||||||||||
| School districts | 681 | 661 | 677 | 693 | ||||||||||||||
| Post-secondary institutions | 4,962 | 4,992 | 5,196 | 5,385 | ||||||||||||||
| Health authorities and hospital societies | 1,165 | 1,216 | 1,199 | 1,208 | ||||||||||||||
| BC Transportation Financing Authority | 579 | 567 | 571 | 578 | ||||||||||||||
| Other service delivery agencies | 1,594 | 1,682 | 1,702 | 1,750 | ||||||||||||||
| Commercial Crown corporation net income | 3,489 | 3,492 | 3,985 | 4,020 | ||||||||||||||
| BC Hydro | 712 | 712 | 712 | 712 | Sensitivities impacts shown below are before regulatory account transfers | |||||||||||||
| Reservoir water inflows | 100 | % | 85 | % | 100 | % | 100 | % | +/-1% in hydro generation equals +/- $60 million | |||||||||
| Mean gas price | 5.08 | 4.46 | 4.21 | 4.35 | +/-1% equals +/- $0 million | |||||||||||||
| (Sumas, $US/MMbtu – BC Hydro forecast based on NYMEX forward selling prices) | ||||||||||||||||||
| Electricity prices | 83.41 | 89.56 | 86.47 | 85.99 | +/-1% change in electricity/gas trade income | |||||||||||||
| (Mid-C, $US/MWh) | equals +/- $3.5 million | |||||||||||||||||
| ICBC | - | - | 450 | 450 | ||||||||||||||
| Vehicle growth | 1.9 | % | 1.9 | % | 1.9 | % | 1.9 | % | +/-1% equals +/-$56 million | |||||||||
| Current claims cost percentage change | 11.8 | % | 11.8 | % | 9.9 | % | 6.7 | % | +/-1% equals +/-$41 million | |||||||||
| Unpaid claims balance ($ billions) | 10.4 | 10.4 | 9.0 | 8.3 | +/-1% equals +/-$104 to $125 million | |||||||||||||
| Investment return | 0.7 | % | 0.7 | % | 3.6 | % | 3.7 | % | +/-1% return equals +/-$180 to $192 million | |||||||||
| Loss ratio | 84.3 | % | 84.3 | % | 85.0 | % | 84.7 | % | ||||||||||
| First Quarterly Report 2023/24 | | 59 |
Appendix – Fiscal Plan Update
Table A2 Natural Gas Price Forecasts – 2023/24 to 2025/26
| Private sector forecasts (calendar year) | Adjusted to fiscal years and $C/gigajoule at plant inlet | |||||||||||||||||||||||
| 2023 | 2024 | 2025 | 2023/24 | 2024/25 | 2025/26 | |||||||||||||||||||
| GLJ Henry Hub US$/MMBtu (Jul 1, 2023) | 2.70 | 3.80 | 4.16 | 1.54 | 2.34 | 2.61 | ||||||||||||||||||
| Sproule Henry Hub US$/MMBtu (Jun 30, 2023) | 2.84 | 4.00 | 4.25 | 1.79 | 2.55 | 2.72 | ||||||||||||||||||
| McDaniel Henry Hub US$/MMBtu (Jul 1, 2023) | 2.58 | 3.32 | 3.90 | 1.29 | 1.81 | 2.29 | ||||||||||||||||||
| Deloitte Henry Hub US$/Mcf (Jun 30, 2023) | 2.55 | 3.60 | 4.20 | 1.29 | 2.01 | 2.48 | ||||||||||||||||||
| GLJ Alberta AECO-C Spot CDN$/MMBtu (Jul 1, 2023) | 2.64 | 3.60 | 4.35 | 1.59 | 2.42 | 2.94 | ||||||||||||||||||
| Sproule Alberta AECO-C Spot CDN$/MMBtu (Jun 30, 2023) | 2.85 | 3.83 | 4.13 | 1.73 | 2.52 | 2.74 | ||||||||||||||||||
| McDaniel AECO-C Spot C$/MMBtu (Jul 1, 2023) | 3.05 | 3.32 | 3.90 | 1.54 | 2.10 | 2.52 | ||||||||||||||||||
| Deloitte AECO-C Spot C$/Mcf (Jun 30, 2023) | 2.60 | 3.30 | 3.95 | 1.28 | 1.99 | 2.43 | ||||||||||||||||||
| GLJ Sumas Spot US$/MMBtu (Jul 1, 2023) | 3.80 | 3.70 | 4.06 | 1.64 | 2.94 | 3.22 | ||||||||||||||||||
| Sproule Sumas Spot CDN$/MMBtu (Jun 30, 2023) | 5.85 | 5.79 | 6.12 | 2.70 | 3.81 | 4.07 | ||||||||||||||||||
| GLJ BC Spot Plant Gate CDN$/MMBtu (Jul 1, 2023) | 2.11 | 3.18 | 3.98 | 1.47 | 2.41 | 2.96 | ||||||||||||||||||
| Sproule BC Station 2 CDN$/MMBtu (Jun 30, 2023) | 2.53 | 3.73 | 4.02 | 1.73 | 2.55 | 2.77 | ||||||||||||||||||
| McDaniel BC Avg Plant Gate C$MMBtu (Jul 1, 2023) | 2.35 | 2.60 | 3.17 | 1.30 | 1.80 | 2.21 | ||||||||||||||||||
| Deloitte BC Station 2 C$MMBtu (Jun 30, 2023) | 3.10 | 3.75 | 3.75 | 1.42 | 2.19 | 2.62 | ||||||||||||||||||
| GLJ Midwest Chicago US$/MMBtu (Jul 1, 2023) | 3.65 | 4.01 | 4.10 | 1.96 | 2.94 | 3.22 | ||||||||||||||||||
| Sproule Alliance Plant Gate CDN$/MMBtu (Jun 30, 2023) | 3.59 | 5.01 | 5.33 | 2.61 | 3.64 | 3.88 | ||||||||||||||||||
| EIA Henry Hub US$/MMBtu (Jul 2023) | 2.62 | 3.29 | 1.22 | |||||||||||||||||||||
| TD Economics Henry Hub FuturesUS$/MMBtu (Jun 2023) | 2.66 | 3.38 | 1.21 | |||||||||||||||||||||
| Scotiabank Group Henry Hub US$/MMBtu (Jun 2023) | 2.79 | 3.75 | 1.43 | |||||||||||||||||||||
| BMO Henry Hub US$/MMBtu (Jun 2023) | 2.75 | 3.75 | 1.40 | |||||||||||||||||||||
| InSite Petroleum Consultants Ltd BC Spot C$/Mcf (Jun 2023) | 2.67 | 3.60 | 4.15 | 1.64 | 2.36 | 2.76 | ||||||||||||||||||
| NYMEX Forward Market converted to Plant Inlet CDN$/GJ (Jul 11, 2023) | 1.49 | 2.04 | 2.37 | |||||||||||||||||||||
| Average all minus high/low | 1.57 | 2.45 | 2.81 | |||||||||||||||||||||
| Average one forecast per consultant minus high/low | 1.41 | 2.32 | 2.72 | |||||||||||||||||||||
| Natural gas royalty price forecast | 1.29 | 2.03 | 2.33 | |||||||||||||||||||||
GLJ: Gilbert Laustsen Jung Petroleum Consultants Ltd US EIA: US Energy Information Administration AECO: Alberta Energy Company
Deloitte/AJM: Deloitte L.L.P acquired Ashton Jenkins Mann Petroleum Consultants McDaniel: McDaniel & Associates Consultants Ltd
| 60 | | First Quarterly Report 2023/24 |
Appendix – Fiscal Plan Update
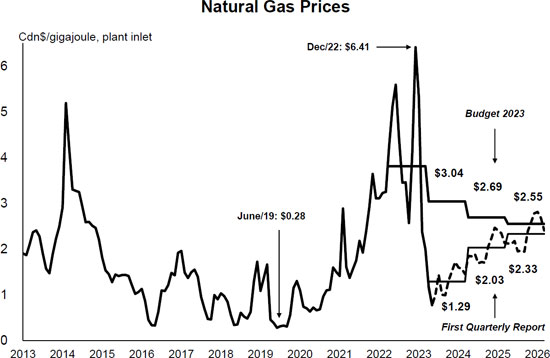
| First Quarterly Report 2023/24 | | 61 |
Appendix – Fiscal Plan Update
Table A3 Material Assumptions – Expense
| Ministry Programs and Assumptions ($ millions unless otherwise specified) | Budget Estimate 2023/24 | Updated Forecast 2023/24 | Plan 2024/25 | Plan 2025/26 | 2023/24 Sensitivities | |||||||||||||
| Attorney General | 773 | 776 | 781 | 778 | ||||||||||||||
| New cases filed/processed | 242,000 | 235,000 | 242,000 | 242,000 | The number of criminal cases proceeded on by the | |||||||||||||
| (# for all courts) | provincial and federal Crown (including appeals to | |||||||||||||||||
| higher courts in BC), the number of civil and family | ||||||||||||||||||
| litigation cases, the number of violation tickets | ||||||||||||||||||
| disputed, and the number of municipal bylaw tickets | ||||||||||||||||||
| disputed which would go to court for resolution. | ||||||||||||||||||
| Crown Proceeding Act (CPA) | 25 | 28 | 25 | 25 | Number of litigation cases resolved by court decisions | |||||||||||||
| or negotiated settlement. | ||||||||||||||||||
| Children and Family Development | 1,912 | 1,912 | 1,930 | 1,926 | ||||||||||||||
| Average children-in-care | 4,852 | 4,822 | 4,727 | 4,663 | The average number of children-in-care is decreasing | |||||||||||||
| caseload (#) | as a result of ministry efforts to keep children in family | |||||||||||||||||
| Average annual residential | 105,337 | 135,718 | 151,984 | 169,492 | settings where safe and feasible. The average cost | |||||||||||||
| cost per child in care ($) | per child in care is projected to increase based on the | |||||||||||||||||
| higher cost of contracted residential services and an | ||||||||||||||||||
| increasing acuity of need for children in care. A 1% | ||||||||||||||||||
| increase in the cost per case or a 1% increase in the | ||||||||||||||||||
| average caseload will affect expenditures by $3.3 | ||||||||||||||||||
| million (excluding Indigenous CFS Agencies). | ||||||||||||||||||
| Education and Child Care | 8,874 | 8,874 | 9,133 | 9,172 | ||||||||||||||
| Public School Enrolment (# of FTEs) | 591,272 | 591,272 | 600,178 | 607,449 | Updated forecast enrolment figures are based on | |||||||||||||
| School age (K–12) | 568,521 | 568,521 | 577,311 | 584,487 | submissions from school districts of their actual | |||||||||||||
| Continuing Education | 905 | 905 | 905 | 905 | enrolment as at September 30, 2022 for the 2022/23 | |||||||||||||
| Distributed Learning (online) | 13,229 | 13,229 | 13,346 | 13,441 | school year, including February and May enrolment | |||||||||||||
| Summer | 6,288 | 6,288 | 6,288 | 6,288 | counts. Projections are based on the Ministry of | |||||||||||||
| Adults | 2,328 | 2,328 | 2,328 | 2,328 | Education and Child Care’s enrolment forecasting model. | |||||||||||||
| Emergency Management and Climate Readiness | 101 | 101 | 111 | 120 | ||||||||||||||
| Emergency Program Act (EPA) | 36 | 36 | 250 | 91 | Emergency disaster relief is unpredictable by | |||||||||||||
| nature. There are a number of factors that could impact | ||||||||||||||||||
| the timing of delivering recovery projects resulting | ||||||||||||||||||
| from the Major Events. | ||||||||||||||||||
| Forests | 925 | 1,687 | 905 | 913 | ||||||||||||||
| BC Timber Sales | 237 | 237 | 235 | 243 | Targets can be impacted by changes to actual | |||||||||||||
| inventory costs incurred. There is a lag of | ||||||||||||||||||
| approximately 1.5 years between when inventory costs | ||||||||||||||||||
| are incurred and when they are expensed. Volume | ||||||||||||||||||
| harvested can also impact targets. For example, if | ||||||||||||||||||
| volume harvested is less than projected in any year, | ||||||||||||||||||
| then capitalized expenses will also be reduced in that year. | ||||||||||||||||||
| Fire Management | 204 | 966 | 205 | 205 | Costs are driven by length of season and severity of | |||||||||||||
| weather conditions, severity of fires, proportion of | ||||||||||||||||||
| interface fires, size of fires and damages caused. | ||||||||||||||||||
| Costs have ranged from a low of $47 million in 2006 to | ||||||||||||||||||
| a high of $809 million in 2021/22 (Fire season 2021). | ||||||||||||||||||
| 62 | | First Quarterly Report 2023/24 |
Appendix – Fiscal Plan Update
Table A3 Material Assumptions – Expense (continued)
Ministry Programs and Assumptions ($ millions unless otherwise specified) | Budget Estimate 2023/24 | Updated Forecast 2023/24 | Plan 2024/25 | Plan 2025/26 | 2023/24 Sensitivities | |||||||||||||
| Health | 28,674 | 28,674 | 29,887 | 30,669 | ||||||||||||||
| Pharmacare | 1,578 | 1,578 | 1,610 | 1,597 | A 1% change in PharmaCare utilization or prices | |||||||||||||
| affects costs by approximately $12 million. | ||||||||||||||||||
| Medical Services Plan (MSP) | 7,039 | 7,039 | 7,340 | 7,281 | A 1% increase in volume of services provided by fee- | |||||||||||||
| for-service physicians affects costs by approximately | ||||||||||||||||||
| $35 million. | ||||||||||||||||||
| Regional Services | 19,671 | 19,671 | 20,534 | 21,403 | A 1% increase in volume of services provided by | |||||||||||||
| Health Authorities is estimated to be $186 million. | ||||||||||||||||||
| Post-Secondary Education and Future Skills | 2,770 | 2,770 | 2,815 | 2,837 | ||||||||||||||
| Student spaces in public institutions | 206,085 | 206,085 | 205,886 | 206,048 | Student enrolments may fluctuate due to a number of | |||||||||||||
| factors including economic changes and labour market | ||||||||||||||||||
| needs. Current year forecast to be updated at Q3 to | ||||||||||||||||||
| align with PSI reporting, consistent with past practice. | ||||||||||||||||||
| Public Safety and Solicitor General | 1,028 | 1,028 | 1,034 | 1,033 | ||||||||||||||
| Policing, Victim Services and Corrections | 909 | 909 | 913 | 913 | Policing, Victim Services and Corrections costs are | |||||||||||||
| sensitive to the volume and severity of criminal | ||||||||||||||||||
| activity, the number of inmate beds occupied and the | ||||||||||||||||||
| number of offenders under community supervision. | ||||||||||||||||||
| Social Development and Poverty Reduction | 4,745 | 4,745 | 4,861 | 4,927 | ||||||||||||||
| Temporary Assistance | 47,500 | 55,822 | 45,200 | 44,400 | The expected to work caseload is sensitive to | |||||||||||||
| annual average caseload (#) | fluctuations in economic and employment trends. | |||||||||||||||||
| Costs are driven by changes to cost per case and | ||||||||||||||||||
| caseload. Cost per case fluctuations result from | ||||||||||||||||||
| changes in the needed supports required by clients, as | ||||||||||||||||||
| well as caseload composition. | ||||||||||||||||||
| Disability Assistance | 121,600 | 122,359 | 125,000 | 126,700 | The caseload for persons with disabilities is sensitive | |||||||||||||
| annual average caseload (#) | to the aging of the population and longer life | |||||||||||||||||
| expectancy for individuals with disabilities. Cost per | ||||||||||||||||||
| case fluctuations are driven primarily by earnings | ||||||||||||||||||
| exemptions which is dependent on the level of income | ||||||||||||||||||
| earned by clients. | ||||||||||||||||||
| Adult Community Living: | ||||||||||||||||||
| Developmental Disabilities Programs | ||||||||||||||||||
| Average caseload (#) | 24,330 | 24,190 | 25,070 | 25,520 | The adult community living caseload is sensitive to an | |||||||||||||
| Average cost per client ($) | 53,600 | 58,700 | 57,900 | 58,400 | aging population and to the level of service required. | |||||||||||||
| Personal Supports Initiative (PSI) | Cost per case fluctuations are driven by the proportion | |||||||||||||||||
| Average caseload (#) | 3,240 | 3,210 | 3,510 | 3,650 | of clients receiving certain types of services at | |||||||||||||
| Average cost per client ($) | 15,200 | 16,600 | 15,800 | 15,800 | differing costs. For example, residential care services | |||||||||||||
| are significantly more costly than day programs. | ||||||||||||||||||
| First Quarterly Report 2023/24 | | 63 |
Appendix – Fiscal Plan Update
Table A3 Material Assumptions – Expense (continued)
Ministry Programs and Assumptions ($ millions unless otherwise specified) | Budget Estimate 2023/24 | Updated Forecast 2023/24 | Plan 2024/25 | Plan 2025/26 | 2023/24 Sensitivities | |||||||||||||
| Tax Transfers | 3,159 | 3,078 | 3,424 | 3,826 | ||||||||||||||
| Individuals | 1,815.0 | 1,805.0 | 2,133.0 | 2,449.0 | ||||||||||||||
| Climate Action Tax Credit | 757.0 | 747.0 | 1,051.0 | 1,359.0 | These tax transfers are now expensed as | |||||||||||||
| BC Family Benefit | 463.0 | 463.0 | 482.8 | 485.0 | required under generally accepted accounting | |||||||||||||
| Renter’s Tax Credit | 309.0 | 309.0 | 313.0 | 319.0 | principles. | |||||||||||||
| Sales Tax | 50.0 | 50.0 | 50.0 | 50.0 | ||||||||||||||
| Small Business Venture Capital | 40.0 | 40.0 | 40.0 | 40.0 | ||||||||||||||
| BC Senior’s Home Renovation | 3.0 | 3.0 | 3.0 | 3.0 | ||||||||||||||
| Other tax transfers to individuals | 193.0 | 193.0 | 193.2 | 193.0 | ||||||||||||||
| Changes in 2022 tax transfers will result in one-time | ||||||||||||||||||
| effect (prior-year adjustment) and could result in an | ||||||||||||||||||
| Corporations | 1,344.0 | 1,273.0 | 1,291.0 | 1,377.0 | additional base change in 2023/24. Production | |||||||||||||
| Film and Television | 152.5 | 136.3 | 138.8 | 152.5 | services tax credit is the most volatile of all tax | |||||||||||||
| Production Services | 890.3 | 835.5 | 845.8 | 912.8 | transfers and is influenced by several factors including | |||||||||||||
| Scientific Research & Experimental Development | 96.2 | 96.3 | 101.3 | 106.3 | delay in filing returns and assessment of claims, | |||||||||||||
| Interactive Digital Media | 110.0 | 110.0 | 110.0 | 110.0 | length of projects and changes in the exchange rates. | |||||||||||||
| Mining Exploration | 30.0 | 30.0 | 30.0 | 30.0 | ||||||||||||||
| Other tax transfers to corporations | 65.0 | 64.9 | 65.1 | 65.4 | ||||||||||||||
| Prior-year adjustment (included above)* | ||||||||||||||||||
| Individuals | - | |||||||||||||||||
| Corporations | (8.3 | ) | ||||||||||||||||
| 2022 Tax-year | 2022 Assumptions | |||||||||||||||||
| Tax Transfers | 2,206.0 | 2,196.0 | ||||||||||||||||
| Individuals | 1,011.0 | 1,001.0 | ||||||||||||||||
| Corporations | 1,195.0 | 1,195.0 | ||||||||||||||||
| Film and Television | 140.0 | 140.0 | ||||||||||||||||
| Production Services | 780.0 | 780.0 | ||||||||||||||||
| Scientific Research & Experimental Development | 90.0 | 90.0 | ||||||||||||||||
| Interactive Digital Media | 110.0 | 110.0 | ||||||||||||||||
| Other tax transfers to corporations | 75.0 | 75.0 | ||||||||||||||||
| *2023/24 tax transfer forecast incorporates adjustments relating to prior years. | ||||||||||||||||||
| Management of Public Funds and Debt | 1,309 | 1,400 | 1,679 | 2,008 | ||||||||||||||
| Interest rates for new provincial borrowing: | Full year impact on MoPD on interest costs of a 1% | |||||||||||||||||
| Short-term | 4.04 | % | 4.97 | % | 4.11 | % | 2.99 | % | change in interest rates equals $7 million; | |||||||||
| Long-term | 4.10 | % | 4.18 | % | 4.12 | % | 4.12 | % | $100 million increase in debt level equals $4.4 million. | |||||||||
| CDN/US exchange rate (cents) | 132.6 | 133.4 | 130.8 | 128.8 | ||||||||||||||
| Service delivery agency net spending | 9,176 | 9,322 | 9,961 | 10,365 | ||||||||||||||
| School districts | 557 | 651 | 662 | 672 | ||||||||||||||
| Post-secondary institutions | 4,795 | 4,809 | 5,009 | 5,176 | ||||||||||||||
| Health authorities and hospital societies | 1,103 | 1,245 | 1,134 | 1,144 | Agency expenses, net of Provincial funding. These are | |||||||||||||
| BC Transportation Financing Authority | 1,887 | 1,894 | 2,311 | 2,402 | mainly funded through revenue from other sources. | |||||||||||||
| BC Infrastructure Benefits Inc. | 246 | 279 | 311 | 346 | ||||||||||||||
| Other service delivery agencies | 588 | 444 | 534 | 625 | ||||||||||||||
| 64 | | First Quarterly Report 2023/24 |
Appendix – Fiscal Plan Update
Table A4 Operating Statement – 2016/17 to 2025/26 1
| ($ millions) | Actual 2016/17 | Actual 2017/18 | Actual 2018/19 | Actual 2019/20 | Actual 2020/21 | Actual 2021/22 | Actual 2022/23 | Updated Forecast 2023/24 | Plan 2024/25 | Plan 2025/26 | Average annual change | |||||||||||||||||||||||
| (per cent) | ||||||||||||||||||||||||||||||||||
| Revenue | 51,449 | 52,020 | 57,128 | 58,660 | 62,156 | 72,392 | 81,536 | 76,228 | 80,736 | 81,534 | 5.2 | |||||||||||||||||||||||
| Expense | (48,721 | ) | (51,744 | ) | (55,634 | ) | (59,022 | ) | (67,663 | ) | (71,127 | ) | (80,832 | ) | (82,202 | ) | (83,383 | ) | (85,171 | ) | 6.4 | |||||||||||||
| Surplus (deficit) before forecast allowance | 2,728 | 276 | 1,494 | (362 | ) | (5,507 | ) | 1,265 | 704 | (5,974 | ) | (2,647 | ) | (3,637 | ) | |||||||||||||||||||
| Forecast allowance | - | - | - | - | - | - | - | (700 | ) | (500 | ) | (500 | ) | |||||||||||||||||||||
| Surplus (deficit) | 2,728 | 276 | 1,494 | (362 | ) | (5,507 | ) | 1,265 | 704 | (6,674 | ) | (3,147 | ) | (4,137 | ) | |||||||||||||||||||
| Per cent of nominal GDP: 2 | ||||||||||||||||||||||||||||||||||
| Surplus (deficit) | 1.0 | 0.1 | 0.5 | -0.1 | -1.8 | 0.4 | 0.2 | -1.7 | -0.8 | -1.0 | ||||||||||||||||||||||||
| Per cent of revenue: | ||||||||||||||||||||||||||||||||||
| Surplus (deficit) | 5.3 | 0.5 | 2.6 | -0.6 | -8.9 | 1.7 | 0.9 | -8.8 | -3.9 | -5.1 | ||||||||||||||||||||||||
| Per capita ($): 3 | ||||||||||||||||||||||||||||||||||
| Surplus (deficit) | 561 | 56 | 298 | (71 | ) | (1,068 | ) | 243 | 132 | (1,216 | ) | (557 | ) | (720 | ) | |||||||||||||||||||
| 1 | Figures have been restated to reflect government current accounting policies. |
| 2 | Surplus (deficit) as a per cent of nominal GDP is calculated using nominal GDP for the calendar year ending in the fiscal year (e.g. 2023/24 amounts divided by nominal GDP for the 2023 calendar year). |
| 3 | Per capita revenue and expense is calculated using July 1 population (e.g. 2023/24 amounts divided by population on July 1, 2023). |
| First Quarterly Report 2023/24 | | 65 |
Appendix – Fiscal Plan Update
Table A5 Revenue by Source – 2016/17 to 2025/26
| ($ millions) | Actual 2016/17 | Actual 2017/18 | Actual 2018/19 | Actual 2019/20 | Actual 2020/21 | Actual 2021/22 | Actual 2022/23 | Updated Forecast 2023/24 | Plan 2024/25 | Plan 2025/26 | Average annual change | |||||||||||||||||||||||
| (per cent) | ||||||||||||||||||||||||||||||||||
| Taxation revenue: | ||||||||||||||||||||||||||||||||||
| Personal income | 9,704 | 8,923 | 11,364 | 10,657 | 11,118 | 13,704 | 17,268 | 15,431 | 16,149 | 16,940 | 6.4 | |||||||||||||||||||||||
| Corporate income | 3,003 | 4,165 | 5,180 | 5,011 | 4,805 | 5,053 | 9,156 | 6,037 | 7,616 | 5,942 | 7.9 | |||||||||||||||||||||||
| Employer health | - | - | 464 | 1,897 | 2,156 | 2,443 | 2,720 | 2,750 | 2,892 | 3,025 | n/a | |||||||||||||||||||||||
| Sales | 6,606 | 7,131 | 7,369 | 7,374 | 7,694 | 8,731 | 9,818 | 10,362 | 10,779 | 11,229 | 6.1 | |||||||||||||||||||||||
| Fuel | 969 | 1,010 | 1,015 | 1,008 | 936 | 1,022 | 1,021 | 1,042 | 1,032 | 1,018 | 0.5 | |||||||||||||||||||||||
| Carbon | 1,220 | 1,255 | 1,465 | 1,682 | 1,683 | 2,011 | 2,161 | 2,700 | 2,921 | 3,269 | 11.6 | |||||||||||||||||||||||
| Tobacco | 737 | 727 | 781 | 729 | 711 | 708 | 531 | 520 | 520 | 520 | -3.8 | |||||||||||||||||||||||
| Property | 2,279 | 2,367 | 2,617 | 2,608 | 2,313 | 3,012 | 3,253 | 3,591 | 3,739 | 3,940 | 6.3 | |||||||||||||||||||||||
| Property transfer | 2,026 | 2,141 | 1,826 | 1,609 | 2,098 | 3,327 | 2,293 | 1,950 | 2,205 | 2,348 | 1.7 | |||||||||||||||||||||||
| Insurance premium | 549 | 602 | 633 | 691 | 652 | 706 | 804 | 810 | 820 | 830 | 4.7 | |||||||||||||||||||||||
| 27,093 | 28,321 | 32,714 | 33,266 | 34,166 | 40,717 | 49,025 | 45,193 | 48,673 | 49,061 | 6.8 | ||||||||||||||||||||||||
| Natural resource revenue: | ||||||||||||||||||||||||||||||||||
| Natural gas royalties | 152 | 161 | 199 | 118 | 196 | 920 | 2,255 | 837 | 1,179 | 1,182 | 25.6 | |||||||||||||||||||||||
| Bonus bids, rents on drilling rights and leases | 633 | 276 | 279 | 225 | 162 | 133 | 122 | 99 | 65 | 64 | -22.5 | |||||||||||||||||||||||
| Columbia River Treaty | 111 | 111 | 202 | 119 | 117 | 231 | 437 | 478 | 452 | 456 | 17.0 | |||||||||||||||||||||||
| Other energy and minerals | 403 | 619 | 557 | 386 | 191 | 795 | 979 | 548 | 541 | 491 | 2.2 | |||||||||||||||||||||||
| Forests | 913 | 1,065 | 1,406 | 988 | 1,304 | 1,893 | 1,887 | 886 | 847 | 952 | 0.5 | |||||||||||||||||||||||
| Other resources | 499 | 463 | 465 | 432 | 433 | 499 | 518 | 536 | 509 | 549 | 1.1 | |||||||||||||||||||||||
| 2,711 | 2,695 | 3,108 | 2,268 | 2,403 | 4,471 | 6,198 | 3,384 | 3,593 | 3,694 | 3.5 | ||||||||||||||||||||||||
| Other revenue: | ||||||||||||||||||||||||||||||||||
| Medical Services Plan premiums | 2,558 | 2,266 | 1,360 | 1,063 | (4 | ) | 1 | (1 | ) | - | - | - | n/a | |||||||||||||||||||||
| Post-secondary education fees | 1,828 | 2,034 | 2,275 | 2,451 | 2,418 | 2,536 | 2,651 | 2,829 | 2,956 | 3,061 | 5.9 | |||||||||||||||||||||||
| Other health-care related fees | 404 | 429 | 441 | 475 | 372 | 417 | 519 | 510 | 510 | 516 | 2.8 | |||||||||||||||||||||||
| Motor vehicle licences and permits | 529 | 557 | 568 | 579 | 571 | 610 | 613 | 614 | 621 | 630 | 2.0 | |||||||||||||||||||||||
| Other fees and licences | 894 | 963 | 949 | 1,004 | 972 | 1,020 | 1,146 | 1,310 | 1,131 | 1,167 | 3.0 | |||||||||||||||||||||||
| Investment earnings | 1,232 | 1,101 | 1,243 | 1,263 | 1,264 | 1,306 | 1,316 | 1,409 | 1,522 | 1,511 | 2.3 | |||||||||||||||||||||||
| Sales of goods and services | 1,131 | 1,133 | 1,164 | 1,162 | 741 | 1,059 | 1,396 | 1,366 | 1,457 | 1,550 | 3.6 | |||||||||||||||||||||||
| Miscellaneous | 2,377 | 2,410 | 2,249 | 2,676 | 2,395 | 2,851 | 3,049 | 2,629 | 2,632 | 2,617 | 1.1 | |||||||||||||||||||||||
| 10,953 | 10,893 | 10,249 | 10,673 | 8,729 | 9,800 | 10,689 | 10,667 | 10,829 | 11,052 | 0.1 | ||||||||||||||||||||||||
| Contributions from the federal government: | ||||||||||||||||||||||||||||||||||
| Canada Health Transfer | 4,744 | 4,994 | 5,182 | 5,523 | 5,701 | 6,431 | 6,432 | 7,013 | 7,085 | 7,410 | 5.1 | |||||||||||||||||||||||
| Canada Social Transfer | 1,751 | 1,854 | 1,908 | 1,971 | 2,042 | 2,110 | 2,174 | 2,239 | 2,300 | 2,360 | 3.4 | |||||||||||||||||||||||
| Other cost shared agreements | 1,672 | 2,207 | 1,962 | 2,041 | 5,151 | 3,439 | 3,920 | 4,240 | 4,271 | 3,937 | 10.0 | |||||||||||||||||||||||
| 8,167 | 9,055 | 9,052 | 9,535 | 12,894 | 11,980 | 12,526 | 13,492 | 13,656 | 13,707 | 5.9 | ||||||||||||||||||||||||
| Commercial Crown corporation net income: | ||||||||||||||||||||||||||||||||||
| BC Hydro 1 | 684 | 683 | (428 | ) | 705 | 688 | 668 | 360 | 712 | 712 | 712 | 0.4 | ||||||||||||||||||||||
| Liquor Distribution Branch | 1,083 | 1,119 | 1,104 | 1,107 | 1,161 | 1,189 | 1,199 | 1,150 | 1,170 | 1,194 | 1.1 | |||||||||||||||||||||||
| BC Lottery Corporation 2 | 1,329 | 1,391 | 1,405 | 1,336 | 420 | 1,211 | 1,584 | 1,456 | 1,478 | 1,484 | 1.2 | |||||||||||||||||||||||
| ICBC | (612 | ) | (1,327 | ) | (1,153 | ) | (376 | ) | 1,528 | 2,216 | (197 | ) | - | 450 | 450 | -196.6 | ||||||||||||||||||
| Other | 41 | 140 | 127 | 146 | 167 | 140 | 152 | 174 | 175 | 180 | 17.9 | |||||||||||||||||||||||
| Accounting adjustment 1 | - | (950 | ) | 950 | - | - | - | - | - | - | - | n/a | ||||||||||||||||||||||
| 2,525 | 1,056 | 2,005 | 2,918 | 3,964 | 5,424 | 3,098 | 3,492 | 3,985 | 4,020 | 5.3 | ||||||||||||||||||||||||
| Total revenue | 51,449 | 52,020 | 57,128 | 58,660 | 62,156 | 72,392 | 81,536 | 76,228 | 80,736 | 81,534 | 5.2 | |||||||||||||||||||||||
| 1 | BC Hydro’s loss for 2018/19 includes a write-off of a regulatory account. At the summary level, the Province recognized a $950 million adjustment in fiscal 2017/18 with respect to BC Hydro’s deferred regulatory accounts. |
| 2 | Net of federal government payments and beginning in 2021/22, is also net of payments to the BC First Nations Gaming Revenue Sharing Limited Partnership in accordance with section 14.3 of the Gaming Control Act (B.C.). |
| 66 | | First Quarterly Report 2023/24 |
Appendix – Fiscal Plan Update
Table A6 Revenue by Source Supplementary Information – 2016/17 to 2025/26 1
| Actual 2016/17 | Actual 2017/18 | Actual 2018/19 | Actual 2019/20 | Actual 2020/21 | Actual 2021/22 | Actual 2022/23 | Updated Forecast 2023/24 | Plan 2024/25 | Plan 2025/26 | Average annual change | ||||||||||||||||||||||||
| (per cent) | ||||||||||||||||||||||||||||||||||
| Per cent of nominal GDP: 2 | ||||||||||||||||||||||||||||||||||
| Taxation and Medical Services Plan premiums | 11.2 | 10.8 | 11.5 | 11.1 | 11.1 | 11.6 | 12.5 | 11.2 | 11.7 | 11.3 | 0.1 | |||||||||||||||||||||||
| Taxation | 10.3 | 10.0 | 11.0 | 10.8 | 11.1 | 11.6 | 12.5 | 11.2 | 11.7 | 11.3 | 1.1 | |||||||||||||||||||||||
| Medical Services Plan premiums | 1.0 | 0.8 | 0.5 | 0.3 | - | - | - | - | - | - | n/a | |||||||||||||||||||||||
| Natural resources | 1.0 | 1.0 | 1.0 | 0.7 | 0.8 | 1.3 | 1.6 | 0.8 | 0.9 | 0.9 | -2.1 | |||||||||||||||||||||||
| Other | 4.2 | 3.9 | 3.4 | 3.5 | 2.8 | 2.8 | 2.7 | 2.6 | 2.6 | 2.5 | -5.3 | |||||||||||||||||||||||
| Other excluding | ||||||||||||||||||||||||||||||||||
| Medical Services Plan premiums | 3.2 | 3.1 | 3.0 | 3.1 | 2.8 | 2.8 | 2.7 | 2.6 | 2.6 | 2.5 | -2.4 | |||||||||||||||||||||||
| Contributions from the federal government | 3.1 | 3.2 | 3.0 | 3.1 | 4.2 | 3.4 | 3.2 | 3.3 | 3.3 | 3.2 | 0.2 | |||||||||||||||||||||||
| Commercial Crown corporation net income | 1.0 | 0.4 | 0.7 | 0.9 | 1.3 | 1.5 | 0.8 | 0.9 | 1.0 | 0.9 | -0.4 | |||||||||||||||||||||||
| Total revenue | 19.5 | 18.4 | 19.2 | 19.0 | 20.3 | 20.6 | 20.8 | 18.9 | 19.4 | 18.8 | -0.4 | |||||||||||||||||||||||
| Growth rates (per cent): | ||||||||||||||||||||||||||||||||||
| Taxation | 11.4 | 4.5 | 15.5 | 1.7 | 2.7 | 19.2 | 20.4 | -7.8 | 7.7 | 0.8 | n/a | |||||||||||||||||||||||
| Natural resources | 5.4 | -0.6 | 15.3 | -27.0 | 6.0 | 86.1 | 38.6 | -45.4 | 6.2 | 2.8 | n/a | |||||||||||||||||||||||
| Other | 5.9 | -0.5 | -5.9 | 4.1 | -18.2 | 12.3 | 9.1 | -0.2 | 1.5 | 2.1 | n/a | |||||||||||||||||||||||
| Other excluding | ||||||||||||||||||||||||||||||||||
| Medical Services Plan premiums | 6.1 | 2.8 | 3.0 | 8.1 | -9.1 | 12.2 | 9.1 | -0.2 | 1.5 | 2.1 | n/a | |||||||||||||||||||||||
| Contributions from the federal government | 6.8 | 10.9 | 0.0 | 5.3 | 35.2 | -7.1 | 4.6 | 7.7 | 1.2 | 0.4 | n/a | |||||||||||||||||||||||
| Commercial Crown corporation net income | -6.8 | -58.2 | 89.9 | 45.5 | 35.8 | 36.8 | -42.9 | 12.7 | 14.1 | 0.9 | n/a | |||||||||||||||||||||||
| Total revenue | 8.1 | 1.1 | 9.8 | 2.7 | 6.0 | 16.5 | 12.6 | -6.5 | 5.9 | 1.0 | n/a | |||||||||||||||||||||||
| Per capita ($): 3 | ||||||||||||||||||||||||||||||||||
| Taxation | 5,576 | 5,745 | 6,529 | 6,529 | 6,627 | 7,827 | 9,216 | 8,231 | 8,618 | 8,540 | 4.9 | |||||||||||||||||||||||
| Natural resources | 558 | 547 | 620 | 445 | 466 | 859 | 1,165 | 616 | 636 | 643 | 1.6 | |||||||||||||||||||||||
| Other | 2,254 | 2,210 | 2,046 | 2,095 | 1,693 | 1,884 | 2,009 | 1,943 | 1,917 | 1,924 | -1.7 | |||||||||||||||||||||||
| Other excluding | ||||||||||||||||||||||||||||||||||
| Medical Services Plan premiums | 1,728 | 1,750 | 1,774 | 1,886 | 1,694 | 1,884 | 2,010 | 1,943 | 1,917 | 1,924 | 1.2 | |||||||||||||||||||||||
| Contributions from the federal government | 1,681 | 1,837 | 1,807 | 1,872 | 2,501 | 2,303 | 2,355 | 2,457 | 2,418 | 2,386 | 4.0 | |||||||||||||||||||||||
| Commercial Crown corporation net income | 520 | 214 | 400 | 573 | 769 | 1,043 | 582 | 636 | 706 | 700 | 3.4 | |||||||||||||||||||||||
| Total revenue | 10,588 | 10,553 | 11,402 | 11,514 | 12,056 | 13,915 | 15,328 | 13,884 | 14,295 | 14,192 | 3.3 | |||||||||||||||||||||||
| Real Per Capita Revenue (2022 $) 4 | 11,773 | 12,284 | 12,920 | 12,749 | 13,249 | 14,876 | 15,328 | 13,361 | 13,420 | 13,040 | 1.1 | |||||||||||||||||||||||
| Growth rate (per cent) | 4.3 | 4.3 | 5.2 | -1.3 | 3.9 | 12.3 | 3.0 | -12.8 | 0.4 | -2.8 | 1.7 | |||||||||||||||||||||||
| 1 | Numbers may not add due to rounding. |
| 2 | Revenue as a per cent of GDP is calculated using nominal GDP for the calendar year ending in the fiscal year (e.g. 2023/24 revenue divided by nominal GDP for the 2023 calendar year). |
| 3 | Per capita revenue is calculated using July 1 population (e.g. 2023/24 revenue divided by population on July 1, 2023). |
| 4 | Revenue is converted to real (inflation-adjusted) terms using the consumer price index (CPI) for the corresponding calendar year (e.g. 2023 CPI for 2023/24 revenue). |
| First Quarterly Report 2023/24 | | 67 |
Appendix – Fiscal Plan Update
Table A7 Expense by Function – 2016/17 to 2025/26 1,2
| ($ millions) | Actual 2016/17 | Actual 2017/18 | Actual 2018/19 | Actual 2019/20 | Actual 2020/21 | Actual 2021/22 | Actual 2022/23 | Updated Forecast 2023/24 | Plan 2024/25 | Plan 2025/26 | Average annual change | |||||||||||||||||||||||
| (per cent) | ||||||||||||||||||||||||||||||||||
| Function: | ||||||||||||||||||||||||||||||||||
| Health: | ||||||||||||||||||||||||||||||||||
| Medical Services Plan | 4,573 | 4,623 | 4,861 | 5,013 | 5,145 | 5,776 | 6,006 | 7,081 | 7,382 | 7,323 | 5.4 | |||||||||||||||||||||||
| Pharmacare | 1,284 | 1,400 | 1,494 | 1,517 | 1,501 | 1,579 | 1,711 | 1,728 | 1,760 | 1,747 | 3.5 | |||||||||||||||||||||||
| Regional services | 13,086 | 14,101 | 15,004 | 16,054 | 18,290 | 19,574 | 21,715 | 21,040 | 21,768 | 22,668 | 6.3 | |||||||||||||||||||||||
| Other healthcare expenses | 753 | 810 | 800 | 872 | 677 | 662 | 890 | 1,107 | 1,136 | 1,121 | 4.5 | |||||||||||||||||||||||
| Total health | 19,696 | 20,934 | 22,159 | 23,456 | 25,613 | 27,591 | 30,322 | 30,956 | 32,046 | 32,859 | 5.9 | |||||||||||||||||||||||
| Education: | ||||||||||||||||||||||||||||||||||
| Elementary and secondary | 6,423 | 6,919 | 7,254 | 7,584 | 7,444 | 8,085 | 8,585 | 9,037 | 9,348 | 9,247 | 4.1 | |||||||||||||||||||||||
| Post-secondary | 5,677 | 6,002 | 6,398 | 6,846 | 6,872 | 7,357 | 7,517 | 8,361 | 8,627 | 8,999 | 5.3 | |||||||||||||||||||||||
| Other education expenses | 374 | 176 | 442 | 310 | 632 | 359 | 889 | 464 | 459 | 462 | 2.4 | |||||||||||||||||||||||
| Total education | 12,474 | 13,097 | 14,094 | 14,740 | 14,948 | 15,801 | 16,991 | 17,862 | 18,435 | 18,709 | 4.6 | |||||||||||||||||||||||
| Social services: | ||||||||||||||||||||||||||||||||||
| Social assistance | 1,692 | 1,988 | 2,202 | 2,342 | 3,141 | 2,910 | 3,157 | 3,160 | 3,234 | 3,261 | 7.6 | |||||||||||||||||||||||
| Child welfare | 1,358 | 1,507 | 1,652 | 1,940 | 2,226 | 2,254 | 3,168 | 3,638 | 3,709 | 3,707 | 11.8 | |||||||||||||||||||||||
| Low income tax credit transfers | 244 | 239 | 414 | 435 | 1,131 | 754 | 1,746 | 807 | 1,082 | 1,373 | 21.2 | |||||||||||||||||||||||
| Community living and other services | 949 | 1,003 | 1,075 | 1,170 | 1,291 | 1,350 | 1,581 | 1,543 | 1,601 | 1,661 | 6.4 | |||||||||||||||||||||||
| Total social services | 4,243 | 4,737 | 5,343 | 5,887 | 7,789 | 7,268 | 9,652 | 9,148 | 9,626 | 10,002 | 10.0 | |||||||||||||||||||||||
| Protection of persons and property | 1,655 | 1,930 | 2,004 | 2,126 | 2,258 | 2,937 | 3,483 | 2,319 | 2,352 | 2,364 | 4.0 | |||||||||||||||||||||||
| Transportation | 1,784 | 1,931 | 2,021 | 2,126 | 3,362 | 4,453 | 3,319 | 2,634 | 2,551 | 2,592 | 4.2 | |||||||||||||||||||||||
| Natural resources & economic development | 2,465 | 3,374 | 3,825 | 3,778 | 4,191 | 5,213 | 6,284 | 5,161 | 4,187 | 4,244 | 6.2 | |||||||||||||||||||||||
| Other | 2,281 | 1,574 | 1,831 | 2,525 | 2,861 | 3,082 | 5,736 | 3,437 | 3,530 | 3,394 | 4.5 | |||||||||||||||||||||||
| Contingencies - general programs and CleanBC | - | - | - | - | - | - | - | 2,300 | 2,200 | 2,000 | n/a | |||||||||||||||||||||||
| Contingencies - Shared Recovery Mandate | - | - | - | - | - | - | - | 2,200 | 2,600 | 2,700 | n/a | |||||||||||||||||||||||
| Pandemic Recovery Contingencies | - | - | - | - | - | - | - | 1,000 | - | - | n/a | |||||||||||||||||||||||
| General government | 1,536 | 1,544 | 1,673 | 1,657 | 3,919 | 2,040 | 2,326 | 1,931 | 1,923 | 1,936 | 2.6 | |||||||||||||||||||||||
| Debt servicing | 2,587 | 2,623 | 2,684 | 2,727 | 2,722 | 2,742 | 2,719 | 3,254 | 3,933 | 4,371 | 6.0 | |||||||||||||||||||||||
| Total expense | 48,721 | 51,744 | 55,634 | 59,022 | 67,663 | 71,127 | 80,832 | 82,202 | 83,383 | 85,171 | ||||||||||||||||||||||||
| Per cent of operating expense: | ||||||||||||||||||||||||||||||||||
| Health | 40.4 | 40.5 | 39.8 | 39.7 | 37.9 | 38.8 | 37.5 | 37.7 | 38.4 | 38.6 | -0.5 | |||||||||||||||||||||||
| Education | 25.6 | 25.3 | 25.3 | 25.0 | 22.1 | 22.2 | 21.0 | 21.7 | 22.1 | 22.0 | -1.7 | |||||||||||||||||||||||
| Social services | 8.7 | 9.2 | 9.6 | 10.0 | 11.5 | 10.2 | 11.9 | 11.1 | 11.5 | 11.7 | 3.4 | |||||||||||||||||||||||
| Protection of persons and property | 3.4 | 3.7 | 3.6 | 3.6 | 3.3 | 4.1 | 4.3 | 2.8 | 2.8 | 2.8 | -2.2 | |||||||||||||||||||||||
| Transportation | 3.7 | 3.7 | 3.6 | 3.6 | 5.0 | 6.3 | 4.1 | 3.2 | 3.1 | 3.0 | -2.0 | |||||||||||||||||||||||
| Natural resources & economic development | 5.1 | 6.5 | 6.9 | 6.4 | 6.2 | 7.3 | 7.8 | 6.3 | 5.0 | 5.0 | -0.2 | |||||||||||||||||||||||
| Other | 4.7 | 3.0 | 3.3 | 4.3 | 4.2 | 4.3 | 7.1 | 4.2 | 4.2 | 4.0 | -1.8 | |||||||||||||||||||||||
| Contingencies - general programs and CleanBC | - | - | - | - | - | - | - | 2.8 | 2.6 | 2.3 | n/a | |||||||||||||||||||||||
| Contingencies - Shared Recovery Mandate | - | - | - | - | - | - | - | 2.7 | 3.1 | 3.2 | n/a | |||||||||||||||||||||||
| Pandemic Recovery Contingencies | - | - | - | - | - | - | - | 1.2 | - | - | n/a | |||||||||||||||||||||||
| General government | 3.2 | 3.0 | 3.0 | 2.8 | 5.8 | 2.9 | 2.9 | 2.3 | 2.3 | 2.3 | -3.6 | |||||||||||||||||||||||
| Debt servicing | 5.3 | 5.1 | 4.8 | 4.6 | 4.0 | 3.9 | 3.4 | 4.0 | 4.7 | 5.1 | -0.4 | |||||||||||||||||||||||
| Operating expense | 100.0 | 100.0 | 100.0 | 100.0 | 100.0 | 100.0 | 100.0 | 100.0 | 100.0 | 100.0 | ||||||||||||||||||||||||
| 1 | Figures reflect government accounting policies used in the 2022/23 Public Accounts audited financial statements. |
| 2 | Numbers may not add due to rounding. |
| 68 | | First Quarterly Report 2023/24 |
Appendix – Fiscal Plan Update
Table A8 Expense by Function Supplementary Information – 2016/17 to 2025/26 1
| Actual 2016/17 | Actual 2017/18 | Actual 2018/19 | Actual 2019/20 | Actual 2020/21 | Actual 2021/22 | Actual 2022/23 | Updated Forecast 2023/24 | Plan 2024/25 | Plan 2025/26 | Average annual change | ||||||||||||||||||||||||
| (per cent) | ||||||||||||||||||||||||||||||||||
| Per cent of nominal GDP: 2 | ||||||||||||||||||||||||||||||||||
| Health | 7.5 | 7.4 | 7.5 | 7.6 | 8.3 | 7.9 | 7.7 | 7.7 | 7.7 | 7.6 | 0.2 | |||||||||||||||||||||||
| Education | 4.7 | 4.6 | 4.7 | 4.8 | 4.9 | 4.5 | 4.3 | 4.4 | 4.4 | 4.3 | -1.0 | |||||||||||||||||||||||
| Social services | 1.6 | 1.7 | 1.8 | 1.9 | 2.5 | 2.1 | 2.5 | 2.3 | 2.3 | 2.3 | 4.1 | |||||||||||||||||||||||
| Protection of persons and property | 0.6 | 0.7 | 0.7 | 0.7 | 0.7 | 0.8 | 0.9 | 0.6 | 0.6 | 0.5 | -1.5 | |||||||||||||||||||||||
| Transportation | 0.7 | 0.7 | 0.7 | 0.7 | 1.1 | 1.3 | 0.8 | 0.7 | 0.6 | 0.6 | -1.4 | |||||||||||||||||||||||
| Natural resources & economic development | 0.9 | 1.2 | 1.3 | 1.2 | 1.4 | 1.5 | 1.6 | 1.3 | 1.0 | 1.0 | 0.5 | |||||||||||||||||||||||
| Other | 0.9 | 0.6 | 0.6 | 0.8 | 0.9 | 0.9 | 1.5 | 0.9 | 0.8 | 0.8 | -1.1 | |||||||||||||||||||||||
| Contingencies - general programs and CleanBC | - | - | - | - | - | - | - | 0.6 | 0.5 | 0.5 | n/a | |||||||||||||||||||||||
| Contingencies - Shared Recovery Mandate | - | - | - | - | - | - | - | 0.6 | 0.7 | 0.8 | n/a | |||||||||||||||||||||||
| Pandemic Recovery Contingencies | - | - | - | - | - | - | - | 0.3 | - | - | n/a | |||||||||||||||||||||||
| General government | 0.6 | 0.5 | 0.6 | 0.5 | 1.3 | 0.6 | 0.6 | 0.5 | 0.5 | 0.4 | -2.9 | |||||||||||||||||||||||
| Debt servicing | 1.0 | 0.9 | 0.9 | 0.9 | 0.9 | 0.8 | 0.7 | 0.8 | 0.9 | 1.0 | 0.3 | |||||||||||||||||||||||
| Operating expense | 18.5 | 18.3 | 18.7 | 19.1 | 22.0 | 20.3 | 20.6 | 20.5 | 20.1 | 19.8 | 0.8 | |||||||||||||||||||||||
| Growth rates (per cent): | ||||||||||||||||||||||||||||||||||
| Health | 2.6 | 6.3 | 5.9 | 5.9 | 9.2 | 7.7 | 9.9 | 2.1 | 3.5 | 2.5 | n/a | |||||||||||||||||||||||
| Education | 2.1 | 5.0 | 7.6 | 4.6 | 1.4 | 5.7 | 7.5 | 5.1 | 3.2 | 1.5 | n/a | |||||||||||||||||||||||
| Social services | 3.3 | 11.6 | 12.8 | 10.2 | 32.3 | -6.7 | 32.8 | -5.2 | 5.2 | 3.9 | n/a | |||||||||||||||||||||||
| Protection of persons and property | 5.3 | 16.6 | 3.8 | 6.1 | 6.2 | 30.1 | 18.6 | -33.4 | 1.4 | 0.5 | n/a | |||||||||||||||||||||||
| Transportation | 6.8 | 8.2 | 4.7 | 5.2 | 58.1 | 32.5 | -25.5 | -20.6 | -3.2 | 1.6 | n/a | |||||||||||||||||||||||
| Natural resources & economic development | -0.5 | 36.9 | 13.4 | -1.2 | 10.9 | 24.4 | 20.5 | -17.9 | -18.9 | 1.4 | n/a | |||||||||||||||||||||||
| Other | 80.5 | -31.0 | 16.3 | 37.9 | 13.3 | 7.7 | 86.1 | -40.1 | 2.7 | -3.9 | n/a | |||||||||||||||||||||||
| Contingencies - general programs and CleanBC | - | - | - | - | - | - | - | - | -4.3 | -9.1 | n/a | |||||||||||||||||||||||
| Contingencies - Shared Recovery Mandate | - | - | - | - | - | - | - | - | 18.2 | 3.8 | n/a | |||||||||||||||||||||||
| Pandemic Recovery Contingencies | - | - | - | - | - | - | - | - | -100.0 | - | n/a | |||||||||||||||||||||||
| General government | 2.3 | 0.5 | 8.4 | -1.0 | 136.5 | -47.9 | 14.0 | -17.0 | -0.4 | 0.7 | n/a | |||||||||||||||||||||||
| Debt servicing | -8.5 | 1.4 | 2.3 | 1.6 | -0.2 | 0.7 | -0.8 | 19.7 | 20.9 | 11.1 | n/a | |||||||||||||||||||||||
| Operating expense | 4.0 | 6.2 | 7.5 | 6.1 | 14.6 | 5.1 | 13.6 | 1.7 | 1.4 | 2.1 | n/a | |||||||||||||||||||||||
| Per capita ($): 3 | ||||||||||||||||||||||||||||||||||
| Health | 4,053 | 4,247 | 4,423 | 4,604 | 4,968 | 5,304 | 5,700 | 5,638 | 5,674 | 5,720 | 3.9 | |||||||||||||||||||||||
| Education | 2,567 | 2,657 | 2,813 | 2,893 | 2,899 | 3,037 | 3,194 | 3,253 | 3,264 | 3,257 | 2.7 | |||||||||||||||||||||||
| Social services | 873 | 961 | 1,066 | 1,155 | 1,511 | 1,397 | 1,815 | 1,666 | 1,704 | 1,741 | 8.0 | |||||||||||||||||||||||
| Protection of persons and property | 341 | 392 | 400 | 417 | 438 | 565 | 655 | 422 | 416 | 411 | 2.1 | |||||||||||||||||||||||
| Transportation | 367 | 392 | 403 | 417 | 652 | 856 | 624 | 480 | 452 | 451 | 2.3 | |||||||||||||||||||||||
| Natural resources & economic development | 507 | 684 | 763 | 742 | 813 | 1,002 | 1,181 | 940 | 741 | 739 | 4.3 | |||||||||||||||||||||||
| Other | 469 | 319 | 365 | 496 | 555 | 592 | 1,078 | 626 | 625 | 591 | 2.6 | |||||||||||||||||||||||
| Contingencies - general programs and CleanBC | - | - | - | - | - | - | - | 419 | 390 | 348 | n/a | |||||||||||||||||||||||
| Contingencies - Shared Recovery Mandate | - | - | - | - | - | - | - | 401 | 460 | 470 | n/a | |||||||||||||||||||||||
| Pandemic Recovery Contingencies | - | - | - | - | - | - | - | 182 | - | - | n/a | |||||||||||||||||||||||
| General government | 316 | 313 | 334 | 325 | 760 | 392 | 437 | 352 | 340 | 337 | 0.7 | |||||||||||||||||||||||
| Debt servicing | 532 | 532 | 536 | 535 | 528 | 527 | 511 | 593 | 696 | 761 | 4.1 | |||||||||||||||||||||||
| Operating expense | 10,025 | 10,497 | 11,103 | 11,584 | 13,124 | 13,672 | 15,195 | 14,972 | 14,762 | 14,826 | 4.4 | |||||||||||||||||||||||
| Real Per Capita Operating Expense (2022 $) 4 | 11,919 | 12,219 | 12,582 | 12,828 | 14,424 | 14,616 | 15,195 | 14,408 | 13,860 | 13,621 | 1.5 | |||||||||||||||||||||||
| Growth rate (per cent) | 0.4 | 2.5 | 3.0 | 2.0 | 12.4 | 1.3 | 4.0 | -5.2 | -3.8 | -1.7 | 1.5 | |||||||||||||||||||||||
| 1 | Numbers may not add due to rounding. |
| 2 | Expense as a per cent of GDP is calculated using nominal GDP for the calendar year ending in the fiscal year (e.g. 2023/24 expense divided by nominal GDP for the 2023 calendar year). |
| 3 | Per capita expense is calculated using July 1 population (e.g. 2023/24 expense divided by population on July 1, 2023). |
| 4 | Expense is converted to real (inflation-adjusted) terms using the consumer price index (CPI) for the corresponding calendar year (e.g. 2023 CPI for 2023/24 expense). |
| First Quarterly Report 2023/24 | | 69 |
Appendix – Fiscal Plan Update
Table A9 Full-Time Equivalents (FTEs) – 2016/17 to 2025/2026 1
| Actual 2016/17 | Actual 2017/18 | Actual 2018/19 | Actual 2019/20 | Actual 2020/21 | Actual 2021/22 | Actual 2022/23 | Updated Forecast 2023/24 | Plan 2024/25 | Plan 2025/26 | Average annual change | ||||||||||||||||||||||||
| (per cent) | ||||||||||||||||||||||||||||||||||
| Taxpayer-supported programs and agencies: | ||||||||||||||||||||||||||||||||||
| Ministries and special offices (CRF) | 27,940 | 29,291 | 30,891 | 31,774 | 32,672 | 33,400 | 33,696 | 35,500 | 36,000 | 36,000 | 2.9 | |||||||||||||||||||||||
| Service delivery agencies 2 | 4,850 | 5,076 | 5,258 | 5,985 | 6,042 | 6,767 | 7,746 | 9,023 | 9,217 | 9,396 | 7.6 | |||||||||||||||||||||||
| Total FTEs | 32,790 | 34,367 | 36,149 | 37,759 | 38,714 | 40,167 | 41,442 | 44,523 | 45,217 | 45,396 | 3.7 | |||||||||||||||||||||||
| Growth rates (per cent): | ||||||||||||||||||||||||||||||||||
| Ministries and special offices (CRF) | 2.8 | 4.8 | 5.5 | 2.9 | 2.8 | 2.2 | 0.9 | 6.3 | 1.4 | 0.0 | 3.0 | |||||||||||||||||||||||
| Service delivery agencies | 1.0 | 4.7 | 3.6 | 13.8 | 1.0 | 12.0 | 14.5 | 33.3 | 2.2 | 1.9 | 8.8 | |||||||||||||||||||||||
| Population per FTE: 3 | ||||||||||||||||||||||||||||||||||
| Total FTEs | 148.2 | 143.4 | 138.6 | 134.9 | 133.2 | 129.5 | 128.4 | 123.3 | 124.9 | 126.6 | -1.7 | |||||||||||||||||||||||
| 1 | Full-time equivalents (FTEs) are a measure of staff employment. FTEs are calculated by dividing the total hours of employment paid for in a given period by the number of hours an individual, full-time person would normally work in that period. This does not equate to the physical number of employees. For example, two half-time employees would equal one FTE, or alternatively, three FTEs may represent two full-time employees who have worked sufficient overtime hours to equal an additional FTE. |
| 2 | Service delivery agency FTE amounts do not include SUCH sector staff employment. |
| 3 | Population per FTE is calculated using July 1 population (e.g. population on July 1, 2023 divided by 2023/24 FTEs). |
| 70 | | First Quarterly Report 2023/24 |
Appendix – Fiscal Plan Update
Table A10 Capital Spending – 2016/17 to 2025/26
| ($ millions) | Actual 2016/17 | Actual 2017/18 | Actual 2018/19 | Actual 2019/20 | Actual 2020/21 | Actual 2021/22 | Actual 2022/23 | Updated Forecast 2023/24 | Plan 2024/25 | Plan 2025/26 | Average annual change | ||||||||||||||||||||||
| (per cent) | |||||||||||||||||||||||||||||||||
| Taxpayer-supported: | |||||||||||||||||||||||||||||||||
| Education | |||||||||||||||||||||||||||||||||
| Schools districts | 474 | 578 | 626 | 877 | 944 | 1,001 | 934 | 990 | 1,038 | 1,312 | 12.0 | ||||||||||||||||||||||
| Post-secondary institutions | 792 | 968 | 1,024 | 936 | 904 | 899 | 1,071 | 1,683 | 1,697 | 1,436 | 6.8 | ||||||||||||||||||||||
| Health | 1,004 | 890 | 904 | 1,009 | 1,162 | 1,555 | 1,915 | 3,531 | 3,802 | 4,434 | 17.9 | ||||||||||||||||||||||
| BC Transportation Financing Authority 1 | 823 | 717 | 853 | 955 | 1,285 | 1,364 | 1,823 | 3,968 | 4,188 | 4,140 | 19.7 | ||||||||||||||||||||||
| BC Transit | 41 | 115 | 85 | 73 | 107 | 67 | 100 | 208 | 507 | 519 | 32.6 | ||||||||||||||||||||||
| Government direct (ministries) | 301 | 430 | 421 | 520 | 389 | 386 | 470 | 699 | 526 | 459 | 4.8 | ||||||||||||||||||||||
| Social Housing | 184 | 169 | 483 | 355 | 572 | 642 | 357 | 941 | 703 | 698 | 16.0 | ||||||||||||||||||||||
| Other | 40 | 41 | 56 | 47 | 65 | 88 | 85 | 160 | 178 | 78 | 7.7 | ||||||||||||||||||||||
| Total taxpayer-supported | 3,659 | 3,908 | 4,452 | 4,772 | 5,428 | 6,002 | 6,755 | 12,180 | 12,639 | 13,076 | 15.2 | ||||||||||||||||||||||
| Self-supported: | |||||||||||||||||||||||||||||||||
| BC Hydro | 2,444 | 2,473 | 3,826 | 3,082 | 3,207 | 3,475 | 3,919 | 3,861 | 3,924 | 2,653 | 0.9 | ||||||||||||||||||||||
| Columbia Basin power projects | 2 | 1 | 2 | 994 | 7 | 9 | 10 | 9 | 10 | 21 | 29.9 | ||||||||||||||||||||||
| Transportation Investment Corporation 1 | 38 | 4 | - | - | - | - | - | - | - | - | n/a | ||||||||||||||||||||||
| BC Railway Company | 4 | 11 | 33 | 6 | 1 | 2 | 6 | 7 | 7 | 3 | -3.1 | ||||||||||||||||||||||
| ICBC | 62 | 54 | 66 | 62 | 100 | 54 | 41 | 65 | 42 | 49 | -2.6 | ||||||||||||||||||||||
| BC Lottery Corporation 2 | 86 | 82 | 75 | 102 | 73 | 90 | 95 | 103 | 100 | 100 | 1.7 | ||||||||||||||||||||||
| Liquor Distribution Branch | 27 | 48 | 60 | 36 | 22 | 22 | 16 | 28 | 34 | 27 | 0.0 | ||||||||||||||||||||||
| Other 3 | 62 | 56 | 44 | 104 | 65 | 78 | 78 | - | - | - | n/a | ||||||||||||||||||||||
| Total self-supported | 2,725 | 2,729 | 4,106 | 4,386 | 3,475 | 3,730 | 4,165 | 4,073 | 4,117 | 2,853 | 0.5 | ||||||||||||||||||||||
| Total capital spending | 6,384 | 6,637 | 8,558 | 9,158 | 8,903 | 9,732 | 10,920 | 16,253 | 16,756 | 15,929 | 10.7 | ||||||||||||||||||||||
| Per cent of nominal GDP: 4 | |||||||||||||||||||||||||||||||||
| Taxpayer-supported | 1.4 | 1.4 | 1.5 | 1.5 | 1.8 | 1.7 | 1.7 | 3.0 | 3.0 | 3.0 | 9.0 | ||||||||||||||||||||||
| Self-supported | 1.0 | 1.0 | 1.4 | 1.4 | 1.1 | 1.1 | 1.1 | 1.0 | 1.0 | 0.7 | -4.9 | ||||||||||||||||||||||
| Total | 2.4 | 2.4 | 2.9 | 3.0 | 2.9 | 2.8 | 2.8 | 4.0 | 4.0 | 3.7 | 4.7 | ||||||||||||||||||||||
| Growth rates: | |||||||||||||||||||||||||||||||||
| Taxpayer-supported | 5.8 | 6.8 | 13.9 | 7.2 | 13.7 | 10.6 | 12.5 | 80.3 | 3.8 | 3.5 | 15.8 | ||||||||||||||||||||||
| Self-supported | 5.9 | 0.1 | 50.5 | 6.8 | -20.8 | 7.3 | 11.7 | -2.2 | 1.1 | -30.7 | 3.0 | ||||||||||||||||||||||
| Total | 5.8 | 4.0 | 28.9 | 7.0 | -2.8 | 9.3 | 12.2 | 48.8 | 3.1 | -4.9 | 11.1 | ||||||||||||||||||||||
| Per capita: 5 | |||||||||||||||||||||||||||||||||
| Taxpayer-supported | 753 | 793 | 889 | 937 | 1,053 | 1,154 | 1,270 | 2,218 | 2,238 | 2,276 | 13.1 | ||||||||||||||||||||||
| Self-supported | 561 | 554 | 819 | 861 | 674 | 717 | 783 | 742 | 729 | 497 | -1.3 | ||||||||||||||||||||||
| Total | 1,314 | 1,346 | 1,708 | 1,798 | 1,727 | 1,871 | 2,053 | 2,960 | 2,967 | 2,773 | 8.7 | ||||||||||||||||||||||
| Real Per Capita Capital Spending (2022 $) 6 | 1,562 | 1,567 | 1,935 | 1,990 | 1,898 | 2,000 | 2,053 | 2,849 | 2,785 | 2,547 | 5.6 | ||||||||||||||||||||||
| Growth rate (per cent) | 2.2 | 0.4 | 23.5 | 2.8 | -4.7 | 5.4 | 2.7 | 38.8 | -2.2 | -8.5 | 6.0 |
| 1 | Includes Transportation Investment Plan capital spending and, beginning in 2017/18, Transportation Investment Corporation rehabilitation costs for the Port Mann Bridge due to reclassification from self-supported commercial Crown corporation to a taxpayer-supported agency in response to the cancellation of tolls. Effective April 1, 2018, Transportation Investment Corporation became a subsidiary of BCTFA. |
| 2 | Forecasted amounts exclude right-of-use assets. |
| 3 | Includes post-secondary institutions’ self-supported subsidiaries. |
| 4 | Capital spending as a per cent of GDP is calculated using nominal GDP for the calendar year ending in the fiscal year (e.g. 2023/24 amounts divided by nominal GDP for the 2023 calendar year). |
| 5 | Per capita capital spending is calculated using July 1 population (e.g. 2023/24 amounts divided by population on July 1, 2023). |
| 6 | Capital spending is converted to real (inflation-adjusted) terms using the consumer price index (CPI) for the corresponding calendar year (e.g. 2023 CPI for 2023/24 capital spending). |
| First Quarterly Report 2023/24 | | 71 |
Appendix – Fiscal Plan Update
Table A11 Statement of Financial Position – 2016/17 to 2025/26 1
| ($ millions) | Actual 2016/17 | Actual 2017/18 | Actual 2018/19 | Actual 2019/20 | Actual 2020/21 | Actual 2021/22 | Actual 2022/23 | Updated Forecast 2023/24 | Plan 2024/25 | Plan 2025/26 | Average annual change | |||||||||||||||||||||||
| (per cent) | ||||||||||||||||||||||||||||||||||
| Financial assets: | ||||||||||||||||||||||||||||||||||
| Cash and temporary investments | 4,232 | 3,440 | 3,029 | 3,985 | 6,560 | 7,142 | 8,247 | 2,961 | 4,103 | 3,215 | -2.5 | |||||||||||||||||||||||
| Other financial assets 2 | 10,209 | 11,740 | 12,637 | 12,404 | 15,410 | 17,105 | 19,077 | 16,492 | 18,158 | 19,466 | 6.0 | |||||||||||||||||||||||
| Sinking funds | 1,087 | 1,348 | 752 | 692 | 492 | 510 | 521 | 485 | 532 | 352 | -9.7 | |||||||||||||||||||||||
| Investments in commercial Crown corporations: | 7,517 | 6,134 | 5,738 | 6,523 | 9,632 | 12,223 | 12,634 | 13,349 | 14,528 | 15,707 | 6.9 | |||||||||||||||||||||||
| Retained earnings | ||||||||||||||||||||||||||||||||||
| Recoverable capital loans | 23,809 | 20,534 | 22,547 | 24,768 | 26,301 | 27,218 | 28,145 | 30,147 | 32,172 | 33,359 | 3.1 | |||||||||||||||||||||||
| 31,326 | 26,668 | 28,285 | 31,291 | 35,933 | 39,441 | 40,779 | 43,496 | 46,700 | 49,066 | 4.2 | ||||||||||||||||||||||||
| Total financial assets | 46,854 | 43,196 | 44,703 | 48,372 | 58,395 | 64,198 | 68,624 | 63,434 | 69,493 | 72,099 | 4.0 | |||||||||||||||||||||||
| Liabilities: | ||||||||||||||||||||||||||||||||||
| Accounts payable, accrued liabilities & others 2 | 10,521 | 11,278 | 12,137 | 13,101 | 14,733 | 18,509 | 25,402 | 22,305 | 23,976 | 24,900 | 8.1 | |||||||||||||||||||||||
| Deferred revenue | 9,665 | 10,068 | 10,543 | 10,651 | 12,211 | 13,379 | 15,005 | 16,068 | 17,143 | 18,194 | 5.9 | |||||||||||||||||||||||
| Debt: | 41,499 | 43,607 | 42,681 | 46,229 | 59,750 | 62,341 | 59,934 | 70,772 | 84,737 | 98,130 | 8.1 | |||||||||||||||||||||||
| Taxpayer-supported debt | ||||||||||||||||||||||||||||||||||
| Self-supported debt | 24,338 | 21,312 | 23,281 | 25,932 | 27,350 | 28,325 | 29,492 | 31,562 | 34,092 | 34,713 | 3.3 | |||||||||||||||||||||||
| Forecast allowance | - | - | - | - | - | - | - | 700 | 500 | 500 | ||||||||||||||||||||||||
| Total provincial debt | 65,837 | 64,919 | 65,962 | 72,161 | 87,100 | 90,666 | 89,426 | 103,034 | 119,329 | 133,343 | 6.6 | |||||||||||||||||||||||
| Add: debt offset by sinking funds | 1,087 | 1,348 | 752 | 692 | 492 | 510 | 521 | 485 | 532 | 352 | -9.7 | |||||||||||||||||||||||
| Add: foreign exchange adjustments | - | - | - | - | - | - | 472 | - | - | n/a | ||||||||||||||||||||||||
| Less: guarantees & non-guaranteed debt | (835 | ) | (896 | ) | (850 | ) | (1,337 | ) | (1,335 | ) | (1,402 | ) | (1,523 | ) | (1,415 | ) | (1,380 | ) | (1,355 | ) | 4.5 | |||||||||||||
| Financial statement debt | 66,089 | 65,371 | 65,864 | 71,516 | 86,257 | 89,774 | 88,896 | 102,104 | 118,481 | 132,340 | 6.5 | |||||||||||||||||||||||
| Total liabilities | 86,275 | 86,717 | 88,544 | 95,268 | 113,201 | 121,662 | 129,303 | 140,477 | 159,600 | 175,434 | 6.7 | |||||||||||||||||||||||
| Net liabilities | (39,421 | ) | (43,521 | ) | (43,841 | ) | (46,896 | ) | (54,806 | ) | (57,464 | ) | (60,679 | ) | (77,043 | ) | (90,107 | ) | (103,335 | ) | 9.2 | |||||||||||||
| Capital and other assets: | ||||||||||||||||||||||||||||||||||
| Tangible capital assets | 41,375 | 45,908 | 47,902 | 50,095 | 52,851 | 56,133 | 59,811 | 69,032 | 78,450 | 88,037 | 7.1 | |||||||||||||||||||||||
| Restricted assets | 1,695 | 1,768 | 1,834 | 1,931 | 2,003 | 2,147 | 2,224 | 2,313 | 2,382 | 2,452 | 3.4 | |||||||||||||||||||||||
| Other assets | 1,126 | 932 | 952 | 1,100 | 1,582 | 1,791 | 1,347 | 1,727 | 2,157 | 1,591 | 3.2 | |||||||||||||||||||||||
| Total capital and other assets | 44,196 | 48,608 | 50,688 | 53,126 | 56,436 | 60,071 | 63,382 | 73,072 | 82,989 | 92,080 | 6.9 | |||||||||||||||||||||||
| Accumulated surplus (deficit) | 4,775 | 5,087 | 6,847 | 6,230 | 1,630 | 2,607 | 2,703 | (3,971 | ) | (7,118 | ) | (11,255 | ) | |||||||||||||||||||||
| Per cent of Nominal GDP: 3 | ||||||||||||||||||||||||||||||||||
| Net liabilities | 14.9 | 15.4 | 14.7 | 15.2 | 17.9 | 16.4 | 15.5 | 19.1 | 21.6 | 23.8 | 4.3 | |||||||||||||||||||||||
| Capital and other assets | 16.7 | 17.2 | 17.0 | 17.2 | 18.4 | 17.1 | 16.2 | 18.1 | 19.9 | 21.2 | 2.2 | |||||||||||||||||||||||
| Growth rates: | ||||||||||||||||||||||||||||||||||
| Net liabilities | -4.3 | 10.4 | 0.7 | 7.0 | 16.9 | 4.8 | 5.6 | 27.0 | 17.0 | 14.7 | n/a | |||||||||||||||||||||||
| Capital and other assets | 2.7 | 10.0 | 4.3 | 4.8 | 6.2 | 6.4 | 5.5 | 15.3 | 13.6 | 11.0 | n/a | |||||||||||||||||||||||
| Per capita: 4 | ||||||||||||||||||||||||||||||||||
| Net liabilities | 8,113 | 8,829 | 8,750 | 9,205 | 10,631 | 11,046 | 11,407 | 14,032 | 15,954 | 17,987 | 7.5 | |||||||||||||||||||||||
| Capital and other assets | 9,095 | 9,861 | 10,116 | 10,428 | 10,947 | 11,547 | 11,915 | 13,309 | 14,694 | 16,028 | 5.3 | |||||||||||||||||||||||
| 1 | Figures have been restated to reflect government’s current accounting policies. |
| 2 | Forecast includes $663 million derivative assets in other financial assets and $1,031 million derivative liabilities in other liabilities. |
| 3 | Net liabilities as a per cent of GDP is calculated using nominal GDP for the calendar year ending in the fiscal year (e.g. 2023/24 amount divided by GDP for the 2023 calendar year). |
| 4 | Per capita net liabilities is calculated using July 1 population (e.g. 2023/24 amount divided by population on July 1, 2023). |
| 72 | | First Quarterly Report 2023/24 |
Appendix – Fiscal Plan Update
Table A12 Changes in Financial Position – 2016/17 to 2025/26
| ($ millions) | Actual 2016/17 | Actual 2017/18 | Actual 2018/19 | Actual 2019/20 | Actual 2021/22 | Actual 2021/22 | Actual 2022/23 | Updated Forecast 2023/24 | Plan 2024/25 | Plan 2025/26 | 10-Year Total | ||||||||||||||||||||||
| (Surplus) deficit for the year | (2,728 | ) | (276 | ) | (1,494 | ) | 362 | 5,507 | (1,265 | ) | (704 | ) | 6,674 | 3,147 | 4,137 | 13,360 | |||||||||||||||||
| Change in remeasurement (gains) losses | (236 | ) | (36 | ) | (266 | ) | 255 | (907 | ) | 288 | 608 | - | - | - | (294 | ) | |||||||||||||||||
| Change in accumulated (surplus) deficit | (2,964 | ) | (312 | ) | (1,760 | ) | 617 | 4,600 | (977 | ) | (96 | ) | 6,674 | 3,147 | 4,137 | 13,066 | |||||||||||||||||
| Capital and other asset changes: | |||||||||||||||||||||||||||||||||
| Taxpayer-supported capital investments | 3,659 | 3,908 | 4,452 | 4,772 | 5,428 | 6,002 | 6,755 | 12,180 | 12,639 | 13,076 | 72,871 | ||||||||||||||||||||||
| Less: amortization and other accounting changes | (2,638 | ) | 625 | (2,458 | ) | (2,579 | ) | (2,672 | ) | (2,720 | ) | (3,077 | ) | (2,959 | ) | (3,221 | ) | (3,489 | ) | (25,188 | ) | ||||||||||||
| Increase in net capital assets | 1,021 | 4,533 | 1,994 | 2,193 | 2,756 | 3,282 | 3,678 | 9,221 | 9,418 | 9,587 | 47,683 | ||||||||||||||||||||||
| Increase (decrease) in restricted assets | 64 | 73 | 66 | 97 | 72 | 144 | 77 | 89 | 69 | 70 | 821 | ||||||||||||||||||||||
| Increase (decrease) in other assets | 87 | (194 | ) | 20 | 148 | 482 | 209 | (444 | ) | 380 | 430 | (566 | ) | 552 | |||||||||||||||||||
| Change in capital and other assets | 1,172 | 4,412 | 2,080 | 2,438 | 3,310 | 3,635 | 3,311 | 9,690 | 9,917 | 9,091 | 49,056 | ||||||||||||||||||||||
| Increase (decrease) in net liabilities | (1,792 | ) | 4,100 | 320 | 3,055 | 7,910 | 2,658 | 3,215 | 16,364 | 13,064 | 13,228 | 62,122 | |||||||||||||||||||||
| Investment and working capital changes: | |||||||||||||||||||||||||||||||||
| Investment in commercial Crown corporations: | |||||||||||||||||||||||||||||||||
| Increase (decrease) in retained earnings | (20 | ) | (1,383 | ) | (396 | ) | 785 | 3,109 | 2,591 | 411 | 715 | 1,179 | 1,179 | 8,170 | |||||||||||||||||||
| Self-supported capital investments | 2,725 | 2,729 | 4,106 | 4,386 | 3,475 | 3,730 | 4,165 | 4,073 | 4,117 | 2,853 | 36,359 | ||||||||||||||||||||||
| Less: loan repayments and other accounting changes | (957 | ) | (6,004 | ) | (2,093 | ) | (2,165 | ) | (1,942 | ) | (2,813 | ) | (3,238 | ) | (2,071 | ) | (2,092 | ) | (1,666 | ) | (25,041 | ) | |||||||||||
| Change in investment | 1,748 | (4,658 | ) | 1,617 | 3,006 | 4,642 | 3,508 | 1,338 | 2,717 | 3,204 | 2,366 | 19,488 | |||||||||||||||||||||
| Increase (decrease) in cash and temporary investments | 340 | (792 | ) | (411 | ) | 956 | 2,575 | 582 | 1,105 | (5,286 | ) | 1,142 | (888 | ) | (677 | ) | |||||||||||||||||
| Other working capital changes 1 | (218 | ) | 632 | (1,033 | ) | (1,365 | ) | (386 | ) | (3,231 | ) | (6,536 | ) | (587 | ) | (1,033 | ) | (847 | ) | (14,604 | ) | ||||||||||||
| Change in investment and working capital | 1,870 | (4,818 | ) | 173 | 2,597 | 6,831 | 859 | (4,093 | ) | (3,156 | ) | 3,313 | 631 | 4,207 | |||||||||||||||||||
| Increase (decrease) in financial statement debt | 78 | (718 | ) | 493 | 5,652 | 14,741 | 3,517 | (878 | ) | 13,208 | 16,377 | 13,859 | 66,329 | ||||||||||||||||||||
| (Increase) decrease in sinking fund debt | 493 | (261 | ) | 596 | 60 | 200 | (18 | ) | (11 | ) | 36 | (47 | ) | 180 | 1,228 | ||||||||||||||||||
| (Increase) decrease in foreign exchange | - | - | - | - | - | (472 | ) | 472 | - | - | - | ||||||||||||||||||||||
| Increase (decrease) in guarantees | (23 | ) | (188 | ) | (2 | ) | 57 | 113 | 9 | (119 | ) | (176 | ) | (540 | ) | 541 | (328 | ) | |||||||||||||||
| Increase (decrease) in non-guaranteed debt | 38 | 249 | (44 | ) | 430 | (115 | ) | 58 | 240 | 68 | 505 | (566 | ) | 863 | |||||||||||||||||||
| Increase (decrease) in total provincial debt | 586 | (918 | ) | 1,043 | 6,199 | 14,939 | 3,566 | (1,240 | ) | 13,608 | 16,295 | 14,014 | 68,092 | ||||||||||||||||||||
| Represented by increase (decrease) in: | |||||||||||||||||||||||||||||||||
| Taxpayer-supported debt | (1,220 | ) | 2,108 | (926 | ) | 3,548 | 13,521 | 2,591 | (2,407 | ) | 10,838 | 13,965 | 13,393 | 55,411 | |||||||||||||||||||
| Self-supported debt | 1,806 | (3,026 | ) | 1,969 | 2,651 | 1,418 | 975 | 1,167 | 2,070 | 2,530 | 621 | 12,181 | |||||||||||||||||||||
| Forecast allowance | - | - | - | - | - | - | - | 700 | (200 | ) | - | 500 | |||||||||||||||||||||
| Total provincial debt | 586 | (918 | ) | 1,043 | 6,199 | 14,939 | 3,566 | (1,240 | ) | 13,608 | 16,295 | 14,014 | 68,092 |
| 1 | Includes changes in other financial assets, sinking funds, accounts payable, deferred revenue and other accrued liabilities. |
| First Quarterly Report 2023/24 | | 73 |
Appendix – Fiscal Plan Update
Table A13 Provincial Debt – 2016/17 to 2025/26
| ($ millions) | Actual 2016/17 | Actual 2017/18 | Actual 2018/19 | Actual 2019/20 | Actual 2020/21 | Actual 2021/22 | Actual 2022/23 | Updated Forecast 2023/24 | Plan 2024/25 | Plan 2025/26 | Average annual change | |||||||||||||||||||||||
| (per cent) | ||||||||||||||||||||||||||||||||||
| Taxpayer-supported debt: | ||||||||||||||||||||||||||||||||||
| Provincial government | ||||||||||||||||||||||||||||||||||
| Operating | 4,644 | 1,156 | - | - | 8,746 | 7,233 | - | 1,871 | 4,131 | 5,860 | 2.6 | |||||||||||||||||||||||
| Capital 2 | ||||||||||||||||||||||||||||||||||
| K-12 education | 8,454 | 8,891 | 8,885 | 9,757 | 10,529 | 11,342 | 10,893 | 11,614 | 12,465 | 13,479 | 5.3 | |||||||||||||||||||||||
| Post-secondary institutions | 4,285 | 4,584 | 4,607 | 4,917 | 5,426 | 5,732 | 5,502 | 6,156 | 7,073 | 7,822 | 6.9 | |||||||||||||||||||||||
| Health facilities | 5,835 | 6,141 | 6,173 | 6,705 | 7,484 | 8,223 | 8,286 | 9,988 | 12,773 | 15,991 | 11.9 | |||||||||||||||||||||||
| Ministries general capital | 2,288 | 2,718 | 2,363 | 3,133 | 3,702 | 4,087 | 4,549 | 5,109 | 5,559 | 5,972 | 11.2 | |||||||||||||||||||||||
| Transportation | 2,174 | 5,682 | 5,401 | 5,401 | 5,401 | 5,401 | 5,391 | 5,392 | 5,393 | 5,395 | 10.6 | |||||||||||||||||||||||
| Social housing | 449 | 619 | 619 | 805 | 1,062 | 1,424 | 1,648 | 2,110 | 2,624 | 3,165 | 24.2 | |||||||||||||||||||||||
| Other | 242 | 242 | 242 | 252 | 268 | 278 | 269 | 370 | 493 | 528 | 9.1 | |||||||||||||||||||||||
| Total capital | 23,727 | 28,877 | 28,290 | 30,970 | 33,872 | 36,487 | 36,538 | 40,739 | 46,380 | 52,352 | 9.2 | |||||||||||||||||||||||
| Total provincial government | 28,371 | 30,033 | 28,290 | 30,970 | 42,618 | 43,720 | 36,538 | 42,610 | 50,511 | 58,212 | 8.3 | |||||||||||||||||||||||
| Taxpayer-supported entities: | ||||||||||||||||||||||||||||||||||
| BC Pavilion Corporation | 143 | 141 | 138 | 135 | 132 | 129 | 126 | 123 | 120 | 116 | -2.3 | |||||||||||||||||||||||
| BC Transit | 94 | 84 | 73 | 65 | 60 | 56 | 53 | 97 | 215 | 349 | 15.7 | |||||||||||||||||||||||
| BC Transportation Financing Authority | 9,974 | 10,388 | 11,293 | 12,193 | 13,321 | 14,615 | 18,992 | 22,930 | 27,620 | 32,330 | 14.0 | |||||||||||||||||||||||
| Health Authorities and Hospital Societies | 1,717 | 1,762 | 1,795 | 1,802 | 1,875 | 1,839 | 1,983 | 2,380 | 2,332 | 2,281 | 3.2 | |||||||||||||||||||||||
| InBC Investment Corp. | 217 | 161 | 70 | 45 | 37 | 19 | 21 | 84 | 188 | 304 | 3.8 | |||||||||||||||||||||||
| Post-secondary institutions | 699 | 744 | 763 | 753 | 882 | 922 | 910 | 944 | 1,025 | 1,029 | 4.4 | |||||||||||||||||||||||
| School districts | 19 | 17 | 19 | 18 | 24 | 25 | 21 | 17 | 13 | 8 | -9.2 | |||||||||||||||||||||||
| Social housing | 246 | 259 | 225 | 222 | 770 | 974 | 1,241 | 1,566 | 2,694 | 3,484 | 34.2 | |||||||||||||||||||||||
| Other | 19 | 18 | 15 | 26 | 31 | 42 | 49 | 21 | 19 | 17 | -1.4 | |||||||||||||||||||||||
| Total taxpayer-supported entities | 13,128 | 13,574 | 14,391 | 15,259 | 17,132 | 18,621 | 23,396 | 28,162 | 34,226 | 39,918 | 13.2 | |||||||||||||||||||||||
| Total taxpayer-supported debt | 41,499 | 43,607 | 42,681 | 46,229 | 59,750 | 62,341 | 59,934 | 70,772 | 84,737 | 98,130 | 10.0 | |||||||||||||||||||||||
| Self-supported debt: | ||||||||||||||||||||||||||||||||||
| Commercial Crown corporations and agencies | ||||||||||||||||||||||||||||||||||
| BC Hydro | 19,685 | 19,990 | 22,064 | 23,238 | 24,650 | 25,611 | 26,707 | 28,889 | 31,458 | 32,098 | 5.6 | |||||||||||||||||||||||
| BC Liquor Distribution Branch | - | - | - | 210 | 233 | 230 | 242 | 243 | 245 | 250 | 3.0 | |||||||||||||||||||||||
| BC Lottery Corporation | 145 | 155 | 100 | 233 | 228 | 195 | 201 | 121 | 109 | 110 | -3.0 | |||||||||||||||||||||||
| Columbia Basin power projects | 448 | 433 | 418 | 1,387 | 1,349 | 1,319 | 1,298 | 1,271 | 1,242 | 1,210 | 11.7 | |||||||||||||||||||||||
| Columbia Power Corporation | 291 | 286 | 282 | 276 | 271 | 266 | 270 | 264 | 259 | 253 | -1.6 | |||||||||||||||||||||||
| Post-secondary institution subsidiaries | 340 | 418 | 387 | 504 | 520 | 615 | 685 | 677 | 677 | 677 | 8.0 | |||||||||||||||||||||||
| Transportation Investment Corporation 1 | 3,398 | - | - | - | - | - | - | - | - | - | n/a | |||||||||||||||||||||||
| Other | 31 | 30 | 30 | 84 | 99 | 89 | 89 | 97 | 103 | 115 | 15.7 | |||||||||||||||||||||||
| Total self-supported debt | 24,338 | 21,312 | 23,281 | 25,932 | 27,350 | 28,325 | 29,492 | 31,562 | 34,092 | 34,713 | 4.0 | |||||||||||||||||||||||
| Forecast allowance | - | - | - | - | - | - | - | 700 | 500 | 500 | n/a | |||||||||||||||||||||||
| Total provincial debt | 65,837 | 64,919 | 65,962 | 72,161 | 87,100 | 90,666 | 89,426 | 103,034 | 119,329 | 133,343 | 8.2 | |||||||||||||||||||||||
| 1 | Beginning in 2017/18, debt related to the Port Mann Bridge was reclassified as taxpayer-supported due to the elimination of tolls effective September 1, 2017. |
| 2 | Includes debt incurred by the government to fund the building and construction of capital assets in the education, health, social housing and other sectors. |
| 74 | | First Quarterly Report 2023/24 |
Appendix – Fiscal Plan Update
Table A14 Provincial Debt Supplementary Information – 2016/17 to 2025/26 1
| ($ millions) | Actual 2016/17 | Actual 2017/18 | Actual 2018/19 | Actual 2019/20 | Actual 2020/21 | Actual 2021/22 | Actual 2022/23 | Updated Forecast 2023/24 | Plan 2024/25 | Plan 2025/26 | Average annual change | ||||||||||||||||||||||
| (per cent) | |||||||||||||||||||||||||||||||||
| Per cent of nominal GDP: 2 | |||||||||||||||||||||||||||||||||
| Taxpayer-supported debt: | |||||||||||||||||||||||||||||||||
| Provincial government direct operating | 1.8 | 0.4 | - | - | 2.8 | 2.1 | - | 0.5 | 1.0 | 1.4 | -2.9 | ||||||||||||||||||||||
| Provincial government capital | 9.0 | 10.2 | 9.5 | 10.0 | 11.0 | 10.4 | 9.3 | 10.1 | 11.1 | 12.1 | 3.3 | ||||||||||||||||||||||
| Total provincial government | 10.8 | 10.6 | 9.5 | 10.0 | 13.9 | 12.5 | 9.3 | 10.6 | 12.1 | 13.4 | 2.5 | ||||||||||||||||||||||
| Taxpayer-supported entities | 5.0 | 4.8 | 4.8 | 4.9 | 5.6 | 5.3 | 6.0 | 7.0 | 8.2 | 9.2 | 7.1 | ||||||||||||||||||||||
| Total taxpayer-supported debt | 15.7 | 15.4 | 14.4 | 15.0 | 19.5 | 17.8 | 15.3 | 17.6 | 20.3 | 22.6 | 4.1 | ||||||||||||||||||||||
| Self-supported debt: | |||||||||||||||||||||||||||||||||
| Commercial Crown corporations & agencies | 9.2 | 7.6 | 7.8 | 8.4 | 8.9 | 8.1 | 7.5 | 7.8 | 8.2 | 8.0 | -1.6 | ||||||||||||||||||||||
| Total provincial debt | 24.9 | 23.0 | 22.2 | 23.4 | 28.4 | 25.9 | 22.8 | 25.6 | 28.7 | 30.7 | 2.3 | ||||||||||||||||||||||
| Growth rates (per cent): | |||||||||||||||||||||||||||||||||
| Taxpayer-supported debt: | |||||||||||||||||||||||||||||||||
| Provincial government direct operating | -42.2 | -75.1 | -100.0 | - | - | -17.3 | -100.0 | - | 120.8 | 41.9 | -16.9 | ||||||||||||||||||||||
| Provincial government capital | 6.3 | 21.7 | -2.0 | 9.5 | 9.4 | 7.7 | 0.1 | 11.5 | 13.8 | 12.9 | 8.8 | ||||||||||||||||||||||
| Taxpayer-supported entities | 6.2 | 3.4 | 6.0 | 6.0 | 12.3 | 8.7 | 25.6 | 20.4 | 21.5 | 16.6 | 12.2 | ||||||||||||||||||||||
| Total taxpayer-supported debt | -2.9 | 5.1 | -2.1 | 8.3 | 29.2 | 4.3 | -3.9 | 18.1 | 19.7 | 15.8 | 8.5 | ||||||||||||||||||||||
| Self-supported debt: | |||||||||||||||||||||||||||||||||
| Commercial Crown corporations & agencies | 8.0 | -12.4 | 9.2 | 11.4 | 5.5 | 3.6 | 4.1 | 7.0 | 8.0 | 1.8 | 4.8 | ||||||||||||||||||||||
| Total provincial debt | 0.9 | -1.4 | 1.6 | 9.4 | 20.7 | 4.1 | -1.4 | 15.2 | 15.8 | 11.7 | 7.3 | ||||||||||||||||||||||
| Per capita: 3 | |||||||||||||||||||||||||||||||||
| Taxpayer-supported debt: | |||||||||||||||||||||||||||||||||
| Provincial government direct operating | 956 | 235 | - | - | 1,696 | 1,390 | - | 341 | 731 | 1,020 | 0.7 | ||||||||||||||||||||||
| Provincial government capital | 4,883 | 5,858 | 5,646 | 6,079 | 6,570 | 7,014 | 6,869 | 7,420 | 8,212 | 9,113 | 7.2 | ||||||||||||||||||||||
| Taxpayer-supported entities | 2,702 | 2,754 | 2,872 | 2,995 | 3,323 | 3,579 | 4,398 | 5,129 | 6,060 | 6,948 | 11.1 | ||||||||||||||||||||||
| Total taxpayer-supported debt | 8,540 | 8,846 | 8,518 | 9,074 | 11,590 | 11,983 | 11,267 | 12,890 | 15,003 | 17,081 | 8.0 | ||||||||||||||||||||||
| Self-supported debt: | |||||||||||||||||||||||||||||||||
| Commercial Crown corporations & agencies | 5,009 | 4,323 | 4,646 | 5,090 | 5,305 | 5,445 | 5,544 | 5,749 | 6,036 | 6,042 | 2.1 | ||||||||||||||||||||||
| Total provincial debt | 13,549 | 13,170 | 13,165 | 14,164 | 16,895 | 17,428 | 16,812 | 18,766 | 21,128 | 23,211 | 6.2 | ||||||||||||||||||||||
| Real Per Capita Provincial Debt (2022 $) 4 | 16,106 | 15,330 | 14,918 | 15,684 | 18,566 | 18,631 | 16,812 | 18,059 | 19,834 | 21,325 | 3.2 | ||||||||||||||||||||||
| Growth rate (per cent) | 4.1 | -4.8 | -2.7 | 5.1 | 18.4 | 0.4 | -9.8 | 7.4 | 9.8 | 7.5 | 3.3 |
| 1 | Numbers may not add due to rounding. |
| 2 | Debt as a per cent of GDP is calculated using nominal GDP for the calendar year ending in the fiscal year (e.g. 2023/24 debt divided by nominal GDP for the 2023 calendar year). |
| 3 | Per capita debt is calculated using July 1 population (e.g. 2023/24 debt divided by population on July 1, 2023). |
| 4 | Debt is converted to real (inflation-adjusted) terms using the consumer price index (CPI) for the corresponding calendar year (e.g. 2023 CPI for 2023/24 debt). |
| First Quarterly Report 2023/24 | | 75 |
Appendix – Fiscal Plan Update
Table A15 Key Provincial Debt Indicators – 2016/17 to 2025/26
| Actual 2016/17 | Actual 2017/18 | Actual 2018/19 | Actual 2019/20 | Actual 2020/21 | Actual 2021/22 | Actual 2022/23 | Updated Forecast 2023/24 | Plan 2024/25 | Plan 2025/26 | Average annual change | |||||||||||||||||||||||
| Debt to revenue (per cent) | (per cent) | ||||||||||||||||||||||||||||||||
| Total provincial | 99.3 | 94.7 | 89.5 | 95.9 | 115.1 | 104.3 | 90.6 | 111.8 | 122.9 | 133.6 | 3.4 | ||||||||||||||||||||||
| Taxpayer-supported | 81.8 | 82.5 | 75.0 | 80.6 | 101.2 | 90.8 | 74.3 | 95.5 | 108.7 | 124.6 | 4.8 | ||||||||||||||||||||||
| Debt per capita ($) 1 | |||||||||||||||||||||||||||||||||
| Total provincial | 13,549 | 13,170 | 13,165 | 14,164 | 16,895 | 17,428 | 16,813 | 18,766 | 21,128 | 23,211 | 6.2 | ||||||||||||||||||||||
| Taxpayer-supported | 8,540 | 8,846 | 8,518 | 9,074 | 11,590 | 11,983 | 11,268 | 12,890 | 15,004 | 17,081 | 8.0 | ||||||||||||||||||||||
| Debt to nominal GDP (per cent) 2 | |||||||||||||||||||||||||||||||||
| Total provincial | 24.9 | 23.0 | 22.2 | 23.4 | 28.4 | 25.9 | 22.8 | 25.6 | 28.7 | 30.7 | 2.3 | ||||||||||||||||||||||
| Taxpayer-supported | 15.7 | 15.4 | 14.4 | 15.0 | 19.5 | 17.8 | 15.3 | 17.6 | 20.3 | 22.6 | 4.1 | ||||||||||||||||||||||
| Interest bite (cents per dollar of revenue) 3 | |||||||||||||||||||||||||||||||||
| Total provincial | 3.8 | 4.0 | 3.8 | 3.8 | 3.7 | 3.3 | 3.2 | 3.7 | 4.1 | 4.6 | 2.1 | ||||||||||||||||||||||
| Taxpayer-supported | 3.2 | 3.3 | 3.2 | 3.1 | 3.1 | 2.8 | 2.5 | 3.1 | 3.6 | 4.2 | 2.9 | ||||||||||||||||||||||
| Interest costs ($ millions) | |||||||||||||||||||||||||||||||||
| Total provincial | 2,521 | 2,759 | 2,786 | 2,893 | 2,817 | 2,848 | 3,114 | 3,415 | 4,002 | 4,553 | 6.8 | ||||||||||||||||||||||
| Taxpayer-supported | 1,644 | 1,725 | 1,793 | 1,807 | 1,832 | 1,896 | 2,030 | 2,302 | 2,823 | 3,313 | 8.1 | ||||||||||||||||||||||
| Interest rate (per cent) 4 | |||||||||||||||||||||||||||||||||
| Taxpayer-supported | 3.9 | 4.1 | 4.2 | 4.1 | 3.5 | 3.1 | 3.3 | 3.5 | 3.6 | 3.6 | -0.8 | ||||||||||||||||||||||
| Background Information: | |||||||||||||||||||||||||||||||||
| Revenue ($ millions) | |||||||||||||||||||||||||||||||||
| Total provincial 5 | 66,334 | 68,551 | 73,734 | 75,283 | 75,691 | 86,903 | 98,655 | 92,119 | 97,120 | 99,798 | 4.6 | ||||||||||||||||||||||
| Taxpayer-supported 6 | 50,726 | 52,866 | 56,881 | 57,386 | 59,033 | 68,658 | 80,647 | 74,128 | 77,961 | 78,787 | 5.0 | ||||||||||||||||||||||
| Debt ($ millions) | |||||||||||||||||||||||||||||||||
| Total provincial | 65,837 | 64,919 | 65,962 | 72,161 | 87,100 | 90,666 | 89,426 | 103,034 | 119,329 | 133,343 | 8.2 | ||||||||||||||||||||||
| Taxpayer-supported 7 | 41,499 | 43,607 | 42,681 | 46,229 | 59,750 | 62,341 | 59,934 | 70,772 | 84,737 | 98,130 | 10.0 | ||||||||||||||||||||||
| Provincial nominal GDP ($ millions) 8 | 263,912 | 282,283 | 297,392 | 308,993 | 306,947 | 350,598 | 391,669 | 403,219 | 416,423 | 434,159 | 5.7 | ||||||||||||||||||||||
| Population (thousands at July 1) 9 | 4,859 | 4,929 | 5,010 | 5,095 | 5,155 | 5,202 | 5,319 | 5,490 | 5,648 | 5,745 | 1.9 |
| 1 | The ratio of debt to population (e.g. 2023/24 debt divided by population at July 1, 2023). |
| 2 | The ratio of debt outstanding at fiscal year end to provincial nominal gross domestic product (GDP) for the calendar year ending in the fiscal year (e.g. 2023/24 debt divided by 2023 nominal GDP). |
| 3 | The ratio of interest costs (less sinking fund interest) to revenue. Figures include capitalized interest expense in order to provide a more comparable measure to outstanding debt. |
| 4 | Weighted average of all outstanding debt issues. |
| 5 | Includes revenue of the consolidated revenue fund (excluding dividends from enterprises) plus revenue of all government organizations and enterprises. |
| 6 | Excludes revenue of government enterprises, but includes dividends from enterprises paid to the consolidated revenue fund. |
| 7 | Excludes debt of commercial Crown corporations and agencies and funds held under the province’s warehouse borrowing program. |
| 8 | Nominal GDP for the calendar year ending in the fiscal year (e.g. nominal GDP for 2023 is used for the fiscal year ended March 31, 2024). |
| 9 | Population at July 1st within the fiscal year (e.g. population at July 1, 2023 is used for the fiscal year ended March 31, 2024). |
| 76 | | First Quarterly Report 2023/24 |