|
Exhibit 99.1 
|
Exhibit 99.1
Annual Shareholders’ Meeting
May 14, 2014
Annual Meeting Agenda
Introductions
Annual Meeting-Shareholder Proposals Business Overview Questions, Comments, and Discussion Voting Results Adjournment
Board of Directors
Thomas G. Caldwell James R. Heslop, II Eric W. Hummel Kenneth E. Jones Darryl E. Mast
James J. McCaskey William J. Skidmore Joseph J. Thomas Robert W. Toth Carolyn J. Turk
The Middlefield Banking Company welcomes: Clayton W. Rose, III
Appointed in February of 2014
CPA – Principal at Rea & Associates, Inc.
BS in Accounting from The Ohio State University
Resident of Dublin, Ohio
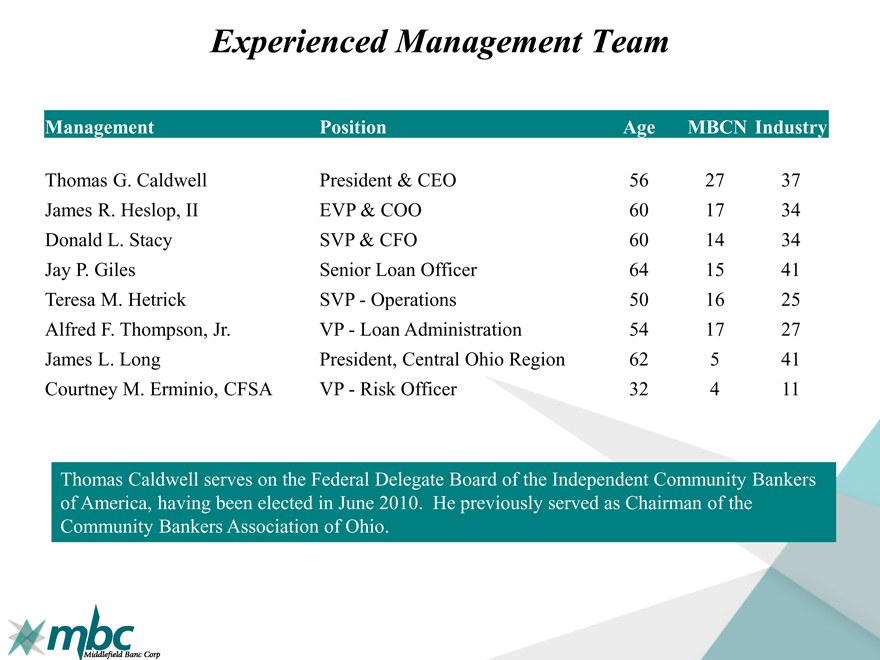
Experienced Management Team
Management Position Age MBCN Industry
Thomas G. Caldwell President & CEO 56 27 37
James R. Heslop, II EVP & COO 60 17 34
Donald L. Stacy SVP & CFO 60 14 34
Jay P. Giles Senior Loan Officer 64 15 41
Teresa M. Hetrick SVP—Operations 50 16 25
Alfred F. Thompson, Jr. VP—Loan Administration 54 17 27
James L. Long President, Central Ohio Region 62 5 41
Courtney M. Erminio, CFSA VP—Risk Officer 32 4 11
Thomas Caldwell serves on the Federal Delegate Board of the Independent Community Bankers of America, having been elected in June 2010. He previously served as Chairman of the Community Bankers Association of Ohio.
Shareholder Proposals
Proposal 1 – Election of three directors to serve until the 2017
Annual Meeting of Shareholders or until their
successors are elected and qualified.
Proposal 2 – A non-binding proposal to approve the compensation of
Middlefield Banc Corp.’s named executive officers.
Proposal 3 – Ratification of the appointment of S.R. Snodgrass, P.C.
as independent auditor for the fiscal year ending
December 31, 2014.
Annual Shareholder Presentation
Thomas G. Caldwell
President & Chief Executive Officer
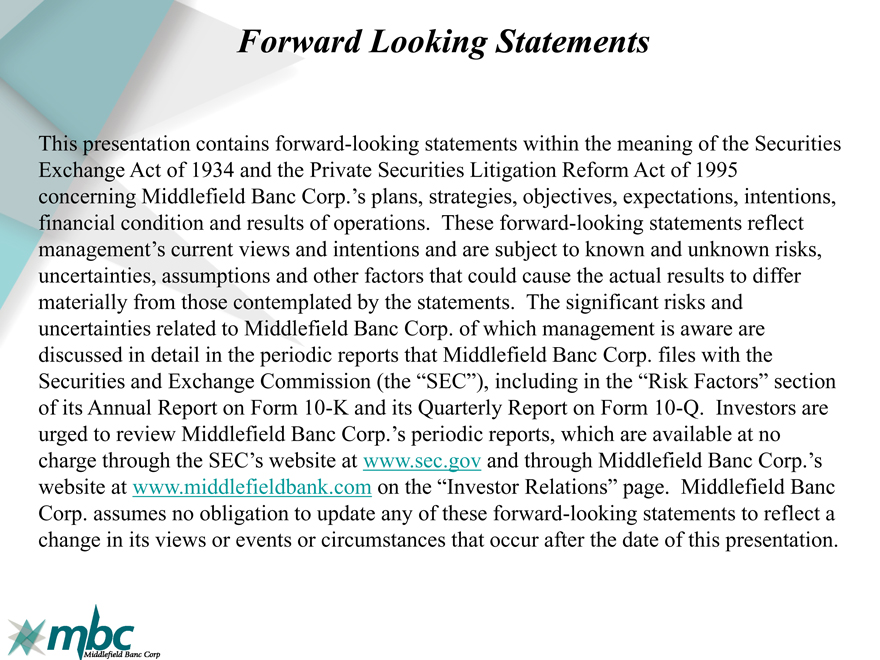
Forward Looking Statements
This presentation contains forward-looking statements within the meaning of the Securities Exchange Act of 1934 and the Private Securities Litigation Reform Act of 1995 concerning Middlefield Banc Corp.’s plans, strategies, objectives, expectations, intentions, financial condition and results of operations. These forward-looking statements reflect management’s current views and intentions and are subject to known and unknown risks, uncertainties, assumptions and other factors that could cause the actual results to differ materially from those contemplated by the statements. The significant risks and uncertainties related to Middlefield Banc Corp. of which management is aware are discussed in detail in the periodic reports that Middlefield Banc Corp. files with the Securities and Exchange Commission (the “SEC”), including in the “Risk Factors” section of its Annual Report on Form 10-K and its Quarterly Report on Form 10-Q. Investors are urged to review Middlefield Banc Corp.’s periodic reports, which are available at no charge through the SEC’s website at www.sec.gov and through Middlefield Banc Corp.’s website at www.middlefieldbank.com on the “Investor Relations” page. Middlefield Banc Corp. assumes no obligation to update any of these forward-looking statements to reflect a change in its views or events or circumstances that occur after the date of this presentation.
|
|
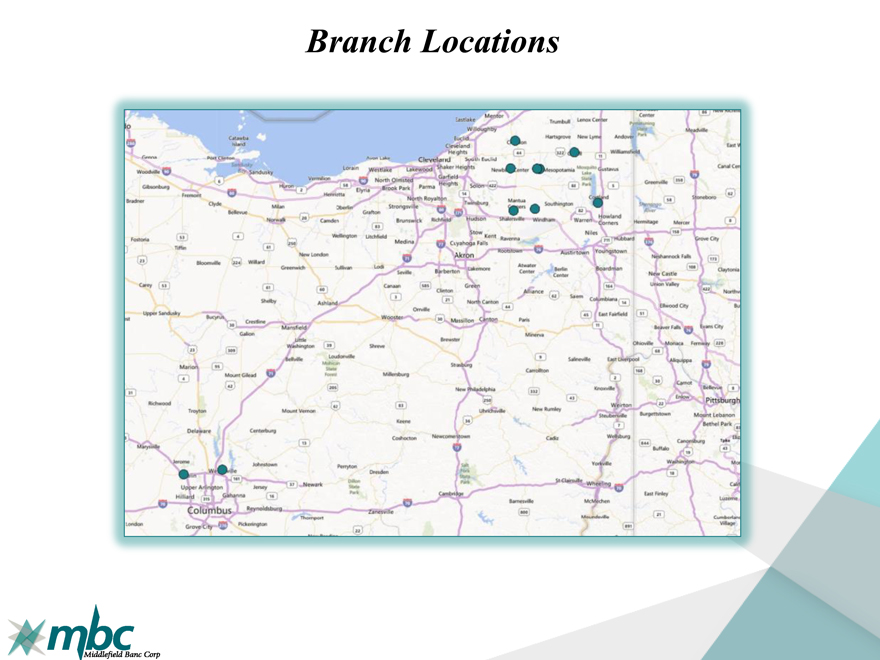
Branch Locations
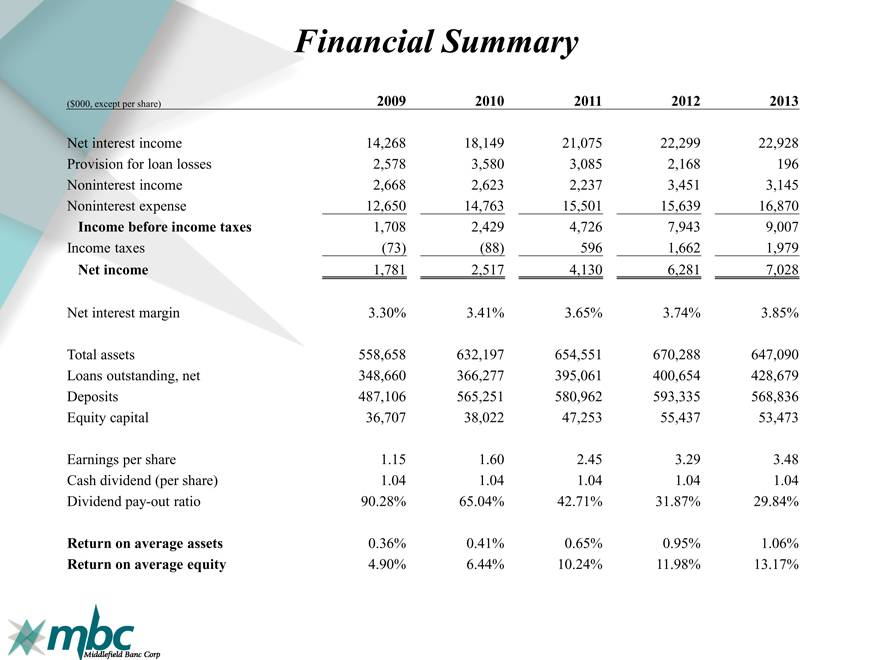
Financial Summary
($000, except per share) 2009 2010 2011 2012 2013
Net interest income 14,268 18,149 21,075 22,299 22,928
Provision for loan losses 2,578 3,580 3,085 2,168 196
Noninterest income 2,668 2,623 2,237 3,451 3,145
Noninterest expense 12,650 14,763 15,501 15,639 16,870
Income before income taxes 1,708 2,429 4,726 7,943 9,007
Income taxes (73) (88) 596 1,662 1,979
Net income 1,781 2,517 4,130 6,281 7,028
Net interest margin 3.30% 3.41% 3.65% 3.74% 3.85%
Total assets 558,658 632,197 654,551 670,288 647,090
Loans outstanding, net 348,660 366,277 395,061 400,654 428,679
Deposits 487,106 565,251 580,962 593,335 568,836
Equity capital 36,707 38,022 47,253 55,437 53,473
Earnings per share 1.15 1.60 2.45 3.29 3.48
Cash dividend (per share) 1.04 1.04 1.04 1.04 1.04
Dividend pay-out ratio 90.28% 65.04% 42.71% 31.87% 29.84%
Return on average assets 0.36% 0.41% 0.65% 0.95% 1.06%
Return on average equity 4.90% 6.44% 10.24% 11.98% 13.17%
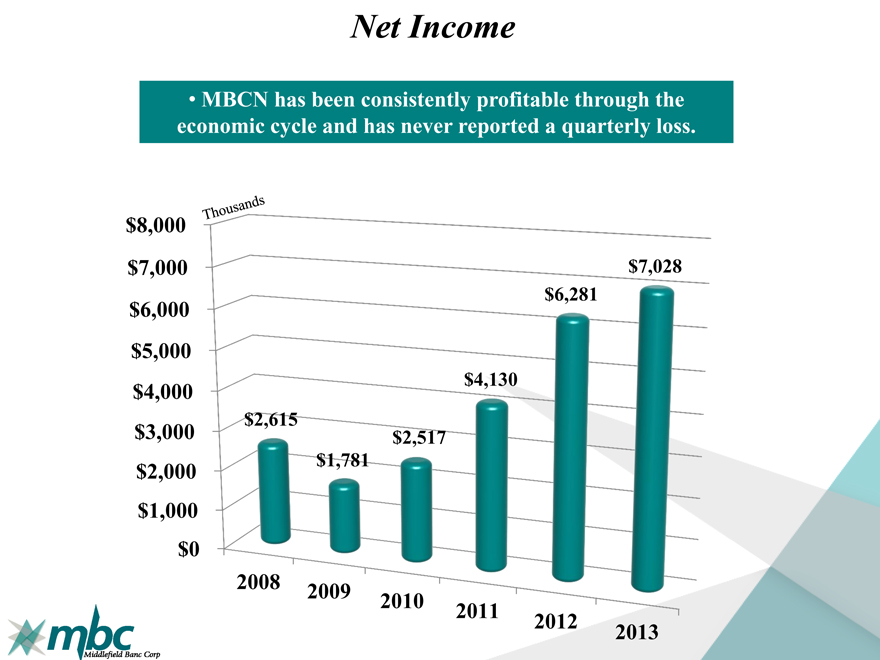
Net Income
MBCN has been consistently profitable through the economic cycle and has never reported a quarterly loss.
thousands
$8,000
$7,000 $7,028
$6,281
$6,000
$5,000
$4,000 $4,130
$2,615
$3,000 $2,517
$2,000 $1,781
$1,000
$0
2008 2009
2010 2011
2012 2013
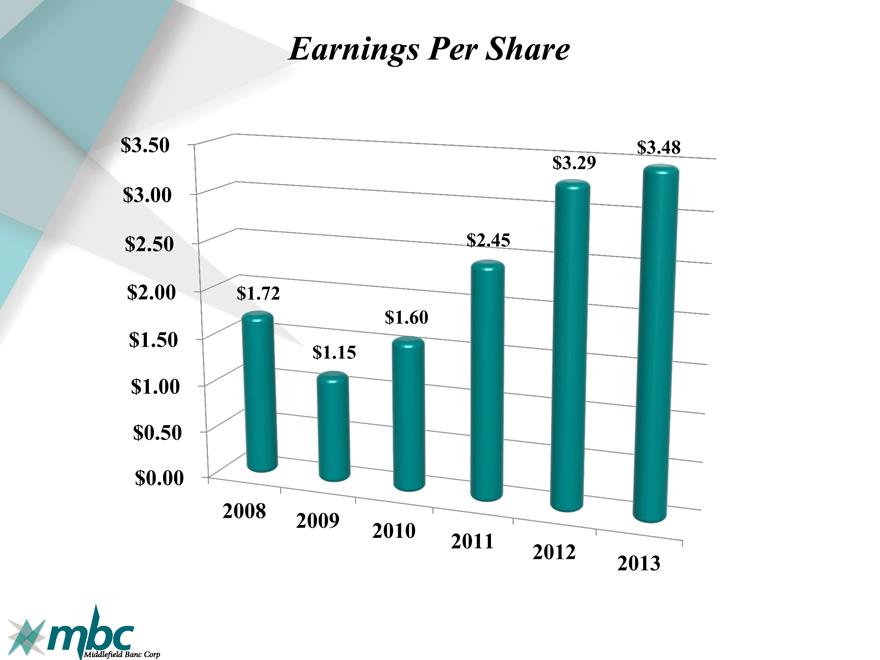
Earnings Per Share
$3.50 $3.48
$3.29
$3.00
$2.50 $2.45
$2.00 $1.72
$1.60
$1.50 $1.15
$1.00
$0.50
$0.00
2008 2009
2010 2011
2012 2013
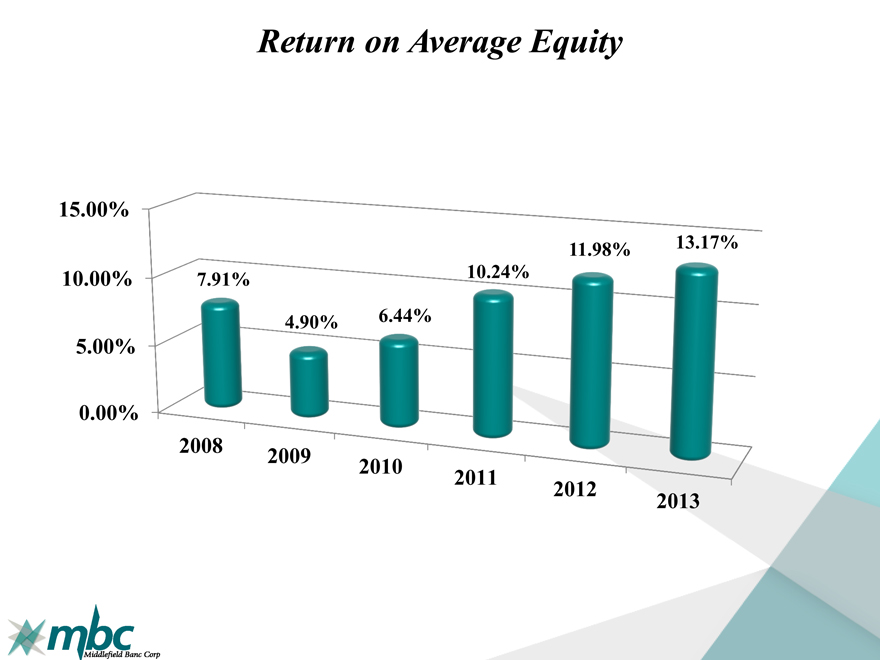
Return on Average Equity
14.00% 12.00%
11.98% 13.17%
10.00% 7.91% 10.24%
4.90% 6.44%
8.00% 6.00% 4.00% 2.00%
0.00%
2008 2009
2010 2011
2012 2013
Return on Average Assets
1.20%
1.00% 1.06%
0.95%
0.80%
0.58% 0.65%
0.60%
0.40% 0.36% 0.41%
0.20%
0.00%
2008 2009
2010 2011
2012
2013
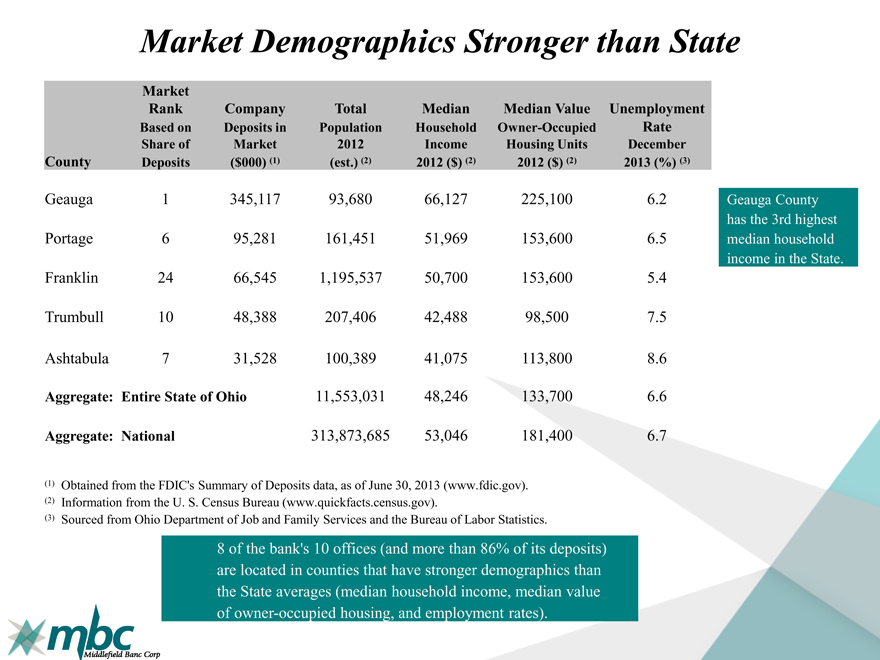
Market Demographics Stronger than State
Market
Rank Company Total Median Median Value Unemployment
Based on Deposits in Population Household Owner-Occupied Rate
Share of Market 2012 Income Housing Units December
County Deposits ($000) (1) (est.) (2) 2012 ($) (2) 2012 ($) (2) 2013 (%) (3)
Geauga 1 345,117 93,680 66,127 225,100 6.2
Portage 6 95,281 161,451 51,969 153,600 6.5
Franklin 24 66,545 1,195,537 50,700 153,600 5.4
Trumbull 10 48,388 207,406 42,488 98,500 7.5
Ashtabula 7 31,528 100,389 41,075 113,800 8.6
Aggregate: Entire State of Ohio 11,553,031 48,246 133,700 6.6
Aggregate: National 313,873,685 53,046 181,400 6.7
Geauga County has the 3rd highest median household income in the State.
(1) Obtained from the FDIC’s Summary of Deposits data, as of June 30, 2013 (www.fdic.gov).
(2) Information from the U. S. Census Bureau (www.quickfacts.census.gov).
(3) Sourced from Ohio Department of Job and Family Services and the Bureau of Labor Statistics.
8 of the bank’s 10 offices (and more than 86% of its deposits) are located in counties that have stronger demographics than the State averages (median household income, median value of owner-occupied housing, and employment rates).
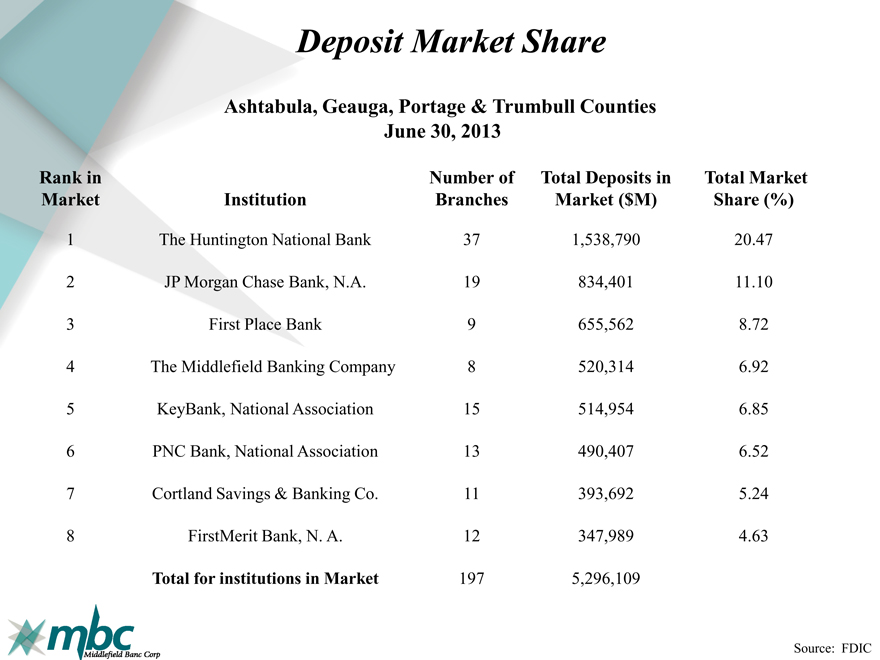
Deposit Market Share
Ashtabula, Geauga, Portage & Trumbull Counties June 30, 2013
Rank in Number of Total Deposits in Total Market
Market Institution Branches Market ($M) Share (%)
1 | | The Huntington National Bank 37 1,538,790 20.47 |
2 | | JP Morgan Chase Bank, N.A. 19 834,401 11.10 |
3 | | First Place Bank 9 655,562 8.72 |
4 | | The Middlefield Banking Company 8 520,314 6.92 |
5 | | KeyBank, National Association 15 514,954 6.85 |
6 | | PNC Bank, National Association 13 490,407 6.52 |
7 | | Cortland Savings & Banking Co. 11 393,692 5.24 |
8 | | FirstMerit Bank, N. A. 12 347,989 4.63 |
Total for institutions in Market 197 5,296,109
Source: FDIC
Total Assets
Asset growth of 43% since 2008.
$800 Millions
$558.6 $632.1 $654.5 $670.2
$600 $647.1
$467.8
$400
$200
$0
2008 2009
2010 2011
2012
2013
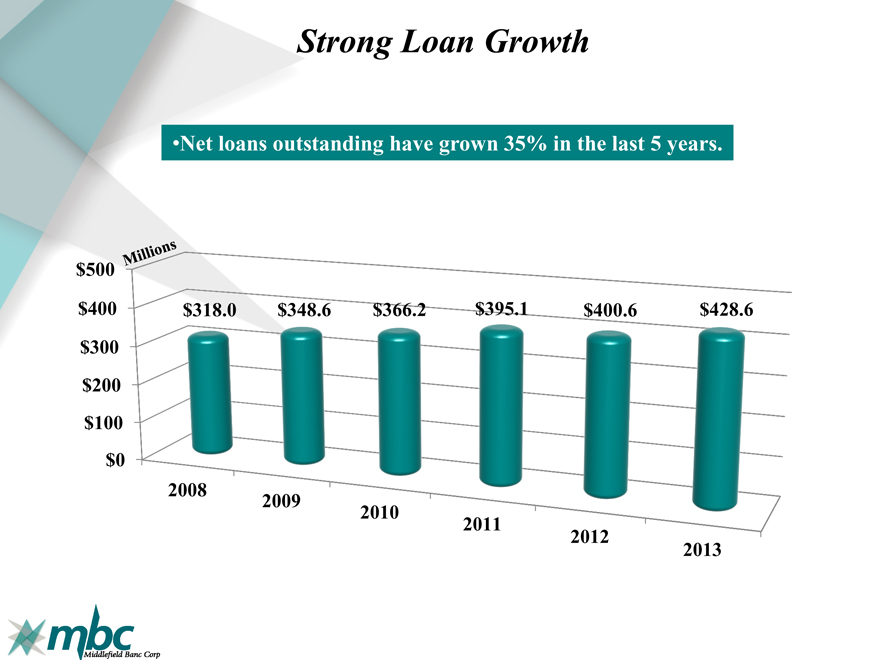
Strong Loan Growth
• | | Net loans outstanding have grown 35% in the last 5 years. |
$500 Millions
$400 $318.0 $348.6 $366.2 $395.1 $400.6 $428.6
$300
$200
$100
$0
2008 2009
2010 2011
2012
2013
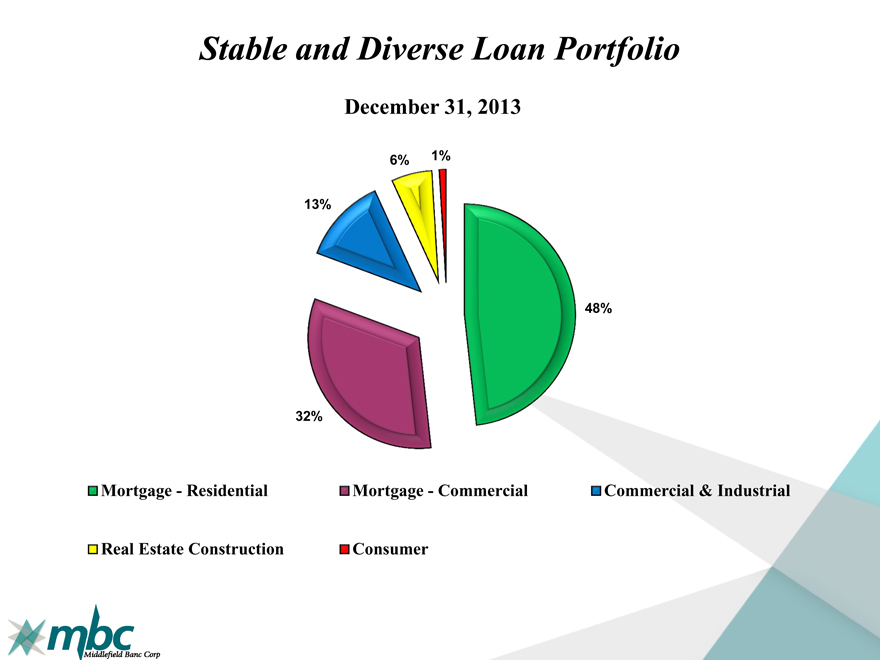
Stable and Diverse Loan Portfolio
December 31, 2013
6% 1%
13%
48%
32%
Mortgage—Residential Mortgage—Commercial Commercial & Industrial
Real Estate Construction Consumer
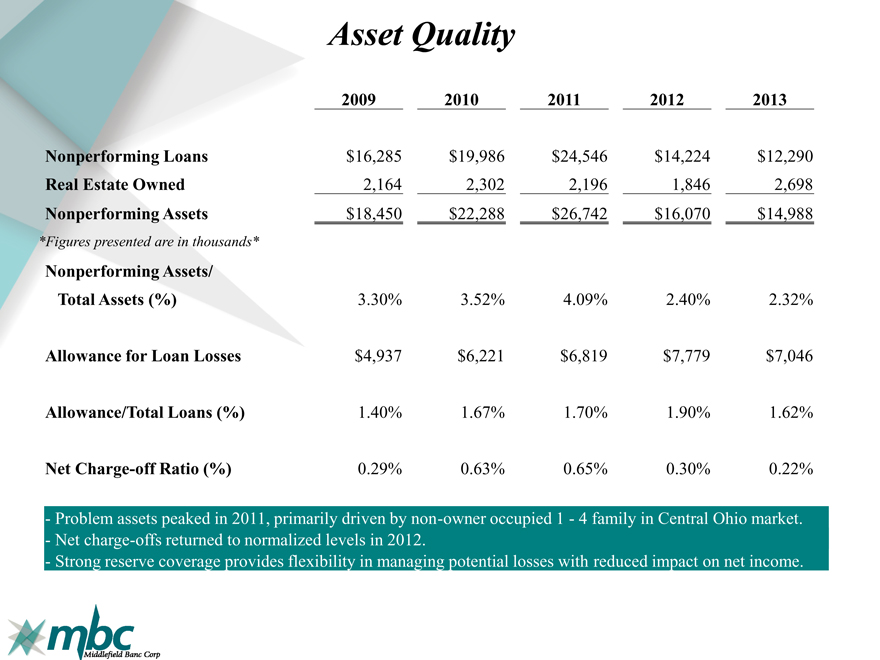
Asset Quality
2009 2010 2011 2012 2013
Nonperforming Loans $16,285 $19,986 $24,546 $14,224 $12,290
Real Estate Owned 2,164 2,302 2,196 1,846 2,698
Nonperforming Assets $18,450 $22,288 $26,742 $16,070 $14,988
*Figures presented are in thousands*
Nonperforming Assets/
Total Assets (%) 3.30% 3.52% 4.09% 2.40% 2.32%
Allowance for Loan Losses $4,937 $6,221 $6,819 $7,779 $7,046
Allowance/Total Loans (%) 1.40% 1.67% 1.70% 1.90% 1.62%
Net Charge-off Ratio (%) 0.29% 0.63% 0.65% 0.30% 0.22%
- Problem assets peaked in 2011, primarily driven by non-owner occupied 1 - 4 family in Central Ohio market. - Net charge-offs returned to normalized levels in 2012.
-Strong reserve coverage provides flexibility in managing potential losses with reduced impact on net income.
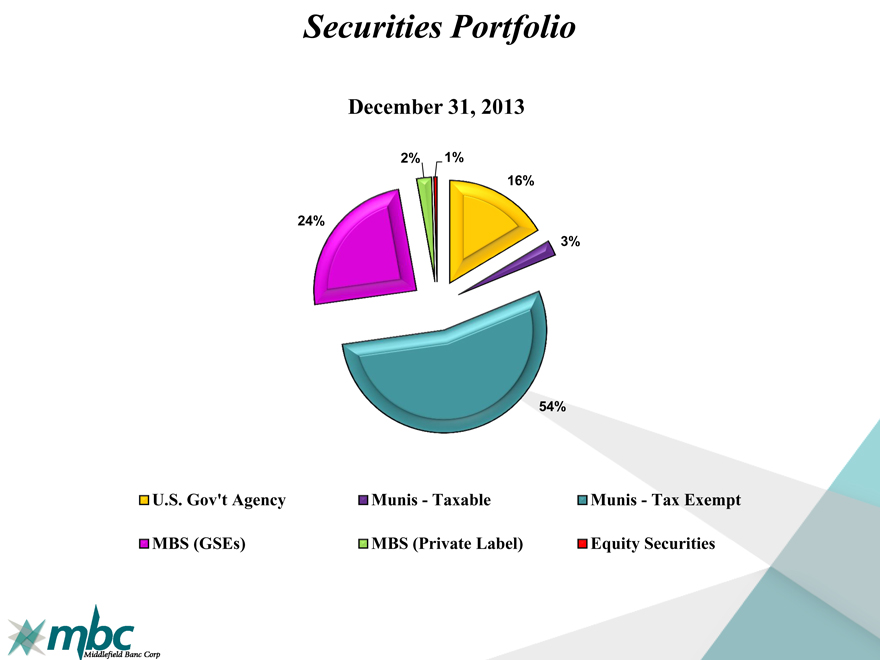
Securities Portfolio
December 31, 2013
2% 1%
16%
24%
3%
54%
U.S. Gov’t Agency Munis—Taxable Munis—Tax Exempt
MBS (GSEs) MBS (Private Label) Equity Securities
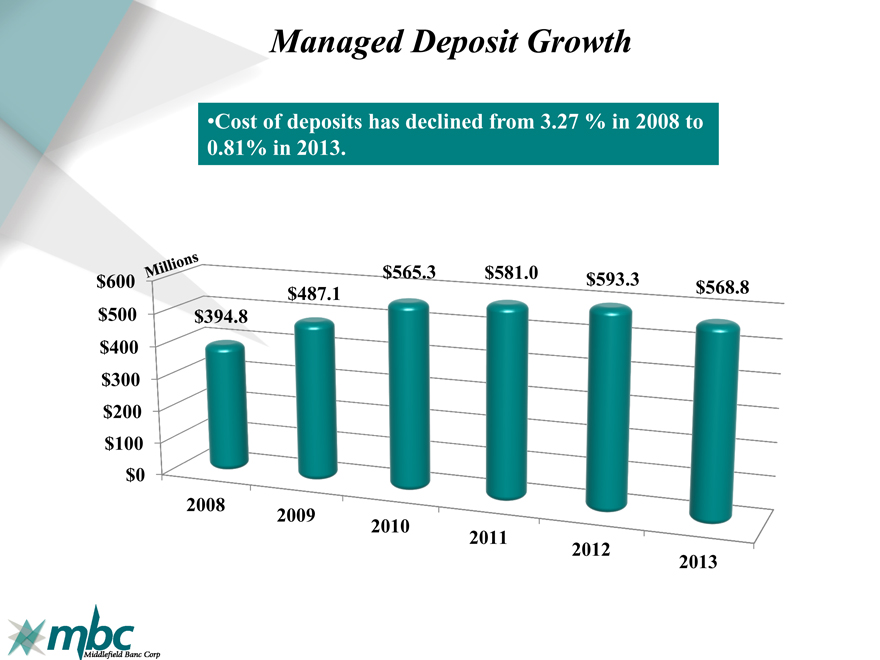
Managed Deposit Growth
• | | Cost of deposits has declined from 3.27 % in 2008 to 0.81% in 2013. |
$600 Millions $565.3 $581.0 $593.3 $568.8
$487.1
$500 $394.8
$400
$300
$200
$100
$0
2008 2009
2010 2011
2012 2013
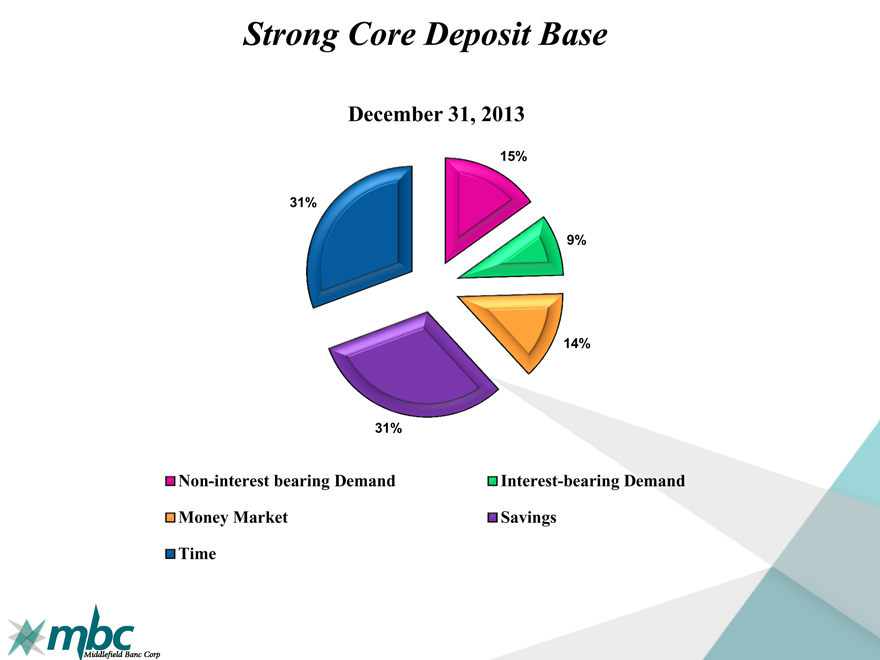
Strong Core Deposit Base
December 31, 2013
15%
31%
9%
14%
31%
Non-interest bearing Demand Interest-bearing Demand
Money Market Savings
Time
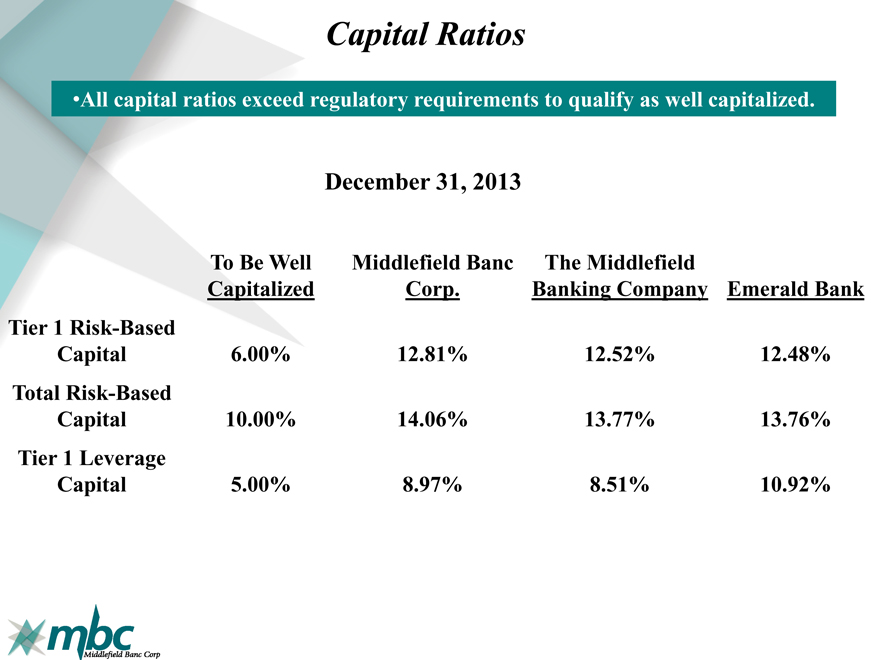
Capital Ratios
• | | All capital ratios exceed regulatory requirements to qualify as well capitalized. |
December 31, 2013
To Be Well Middlefield Banc The Middlefield
Capitalized Corp. Banking Company Emerald Bank
Tier 1 Risk-Based
Capital 6.00% 12.81% 12.52% 12.48%
Total Risk-Based
Capital 10.00% 14.06% 13.77% 13.76%
Tier 1 Leverage
Capital 5.00% 8.97% 8.51% 10.92%
2013 Initiatives
Quality loan growth Leverage technology
Expand non-interest income
Retain, attract, and develop high quality associates Continue building branch recognition
Today’s Banking Landscape
High level of competition for share of wallet
Increasing regulatory concerns with added costs for smaller banks
Economic challenges with a continued low rate environment and slow growth
Uncertain loan demand
2014 and Forward
Personnel/Talent
—Strong management to drive performance growth
—Sales-orientation and cultural fit
Operations/Risk Management
—Expanded technology
—Scaled to support growth initiatives
—Diligent risk management incorporating regulatory environment
Expand Share of Market/Share of Customer
—Identify target markets and customer segments
—Commercial relationship opportunities
—De novo expansion and strategic acquisitions
Questions, Comments, and Discussion
Voting Results
• | | Election of three Directors |
• | | Non-binding proposal on compensation |
• | | Ratification of appointment of S.R. Snodgrass, P.C. |
Thank you for your
support!
May 14, 2014