 Exhibit 99 Thomas G. Caldwell President and CEO Donald L. Stacy Treasurer and CFO |
 Forward Looking Statements This presentation contains forward-looking statements within the meaning of the Securities Exchange Act of 1934 and the Private Securities Litigation Reform Act of 1995 concerning Middlefield Banc Corp.’s plans, strategies, objectives, expectations, intentions, financial condition and results of operations. These forward-looking statements reflect management’s current views and intentions and are subject to known and unknown risks, uncertainties, assumptions and other factors that could cause the actual results to differ materially from those contemplated by the statements. The significant risks and uncertainties related to Middlefield Banc Corp. of which management is aware are discussed in detail in the periodic reports that Middlefield Banc Corp. files with the Securities and Exchange Commission (the “SEC”), including in the “Risk Factors” section of its Annual Report on Form 10-K and its Quarterly Report on Form 10-Q. Investors are urged to review Middlefield Banc Corp.’s periodic reports, which are available at no charge through the SEC’s website at www.sec.gov and through Middlefield Banc Corp.’s website at www.middlefieldbank.bank on the “Investor Relations” page. Middlefield Banc Corp. assumes no obligation to update any of these forward-looking statements to reflect a change in its views or events or circumstances that occur after the date of this presentation. 2 www.middlefieldbank.bank |
 Middlefield: A community bank that is safe, strong and committed 3 www.middlefieldbank.bank Bank established 1901/HC established 1988 Strong brand recognition in core markets – #3 overall within its core NE Ohio market Cleveland MSA and Columbus MSA have a combined population of more than 4.0 million Strong leadership team - Average tenure of nine executive officers: – At MBCN is over 14 years – Within industry is over 28 years *Stock Data at July 14, 2017 and Financial Data at June 30, 2017 Overview Rankings and Awards KBW (2) Named one of 25 U.S. banking institutions to KBW’s coveted “Bank Honor Roll” of superior performers. American Banker (1) Ranked 85 th in American Banker’s Annual List of the Top 200 Publicly Traded Community Banks. Of the top 200, 16 Ohio financial institutions made the list and Middlefield ranked 6th in Ohio-based institutions. Sources: (1) American Banker April 28, 2017; (2) KBW April 13, 2015 $158 Mil. Market Cap $1.08 (2.2%) Div. & Yield $1,070 Mil. Assets $847 Mil. Deposits $2.91 TTM EPS 16.9x P/TTM EPS |
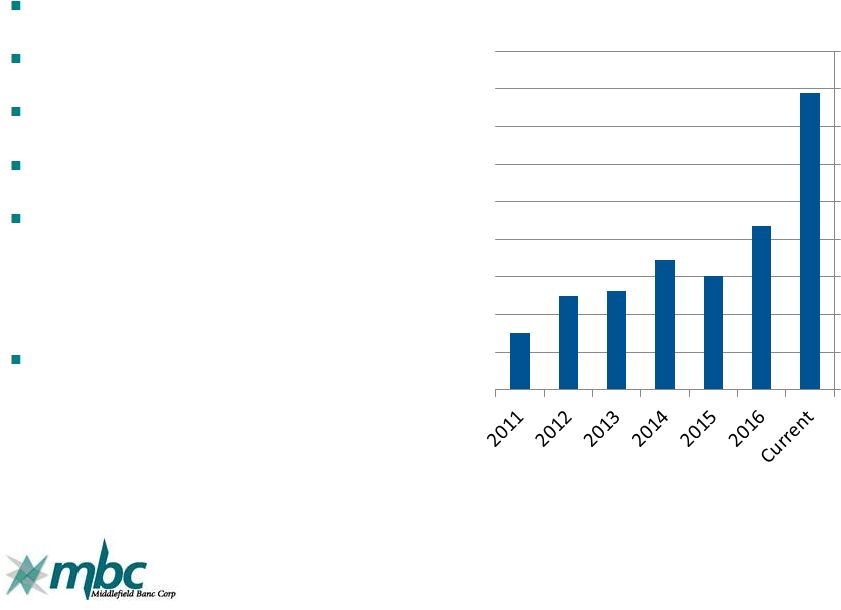 Investment Highlights 4 www.middlefieldbank.bank The largest independent community bank in its core northeast Ohio markets. The franchise serves two of Ohio's most attractive banking markets. Recently granted the Bank Preferred Lender status under the SBA's Preferred Lender Program. Well diversified loan portfolio across geography and collateral type, with no specific concentrations. M&A activity in the Cleveland and Columbus markets in recent years has limited the field of community bank competitors and created opportunities for the Company to take share from regional institutions and pick up free- agent talent. Cleveland and Columbus have seen virtually all similarly sized peers consolidated away. Going forward, the Company believes that it is optimally positioned between rural and metropolitan, and has the team and infrastructure in place to support profitable growth, organically or by acquisition, in the coming years. (1) Market cap data according to Bloomberg, current price at July 14, 2017 $- $20 $40 $60 $80 $100 $120 $140 $160 $180 Market Cap (1) (in millions) |
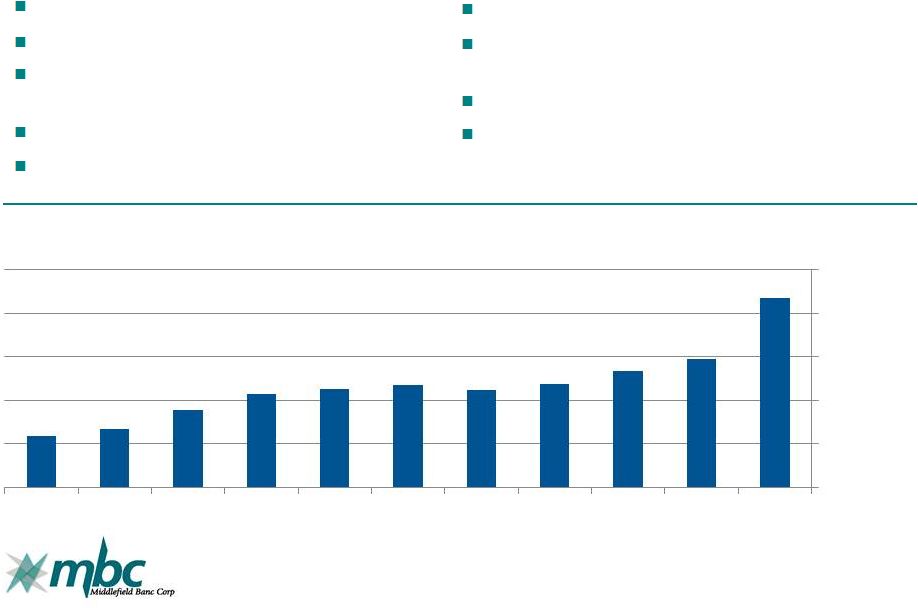 Growing Banking Franchise 5 www.middlefieldbank.bank Strong asset and loan growth Two compelling Ohio banking markets Profitable throughout the economic cycle and never reported a quarterly loss Executing growth strategies History of quarterly cash dividend payments Maintained dividend amount during recession Excellent asset quality, strong liquidity profile, and robust core deposit base Strong returns and efficiency ratios Successfully raised $16.0 million in May 2017 and $11.9 million in June 2016 $200 $400 $600 $800 $1,000 $1,200 Q2 2017 2016 2015 2014 2013 2012 2011 2010 2009 2008 2007 Total Assets (in millions) |
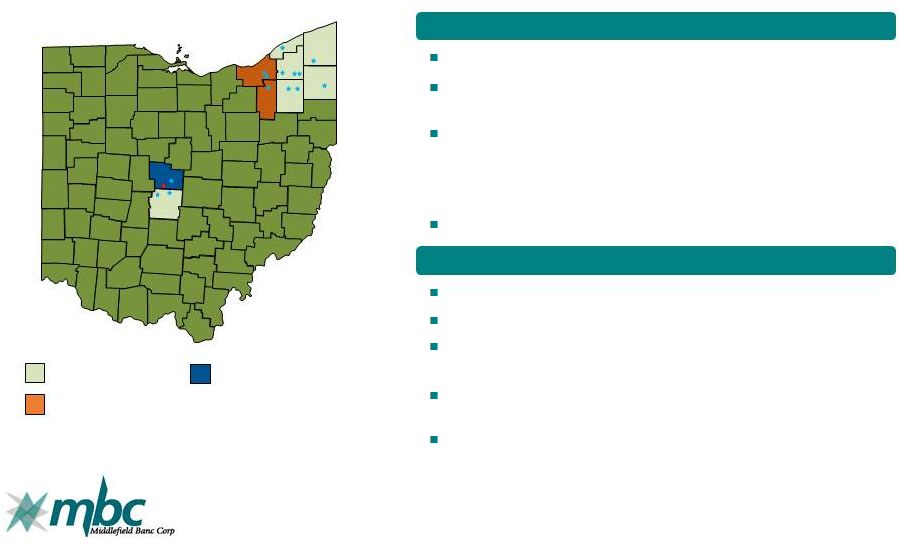 Serving Two Distinct Ohio Markets 6 www.middlefieldbank.bank Three banking locations Columbus is the state capital and largest city in Ohio Franklin County has the largest population of any county in Ohio with an unemployment rate of 3.4% in April of 2017 Delaware County, immediately north of Franklin, has the highest median household income in Ohio At June 30, 2016, five of the 30 banks in Franklin and Delaware Counties controlled nearly 88% of total deposits. 11 banking locations and one LPO Geauga County is 3 in median household income out of 88 Ohio counties Geauga County is the center of the 4 largest Amish population in the world – This demographic provides a strong borrowing and stable deposit base Stable manufacturing economy Current markets New market growth New markets through Liberty Acquisition Source: SNL Financial Ten of the Bank's 14 branches (and nearly 75% of deposits) are located in counties that have stronger demographics than the state’s average median household income, median value of owner-occupied housing, and employment rates. Additionally, the Bank’s two Cuyahoga County/Greater Cleveland branches (representing another 16% of deposits) are located in cities with median household incomes 81% (Solon) and 70% (Beachwood) higher than the state median. Northeast Ohio Central Ohio rd th |
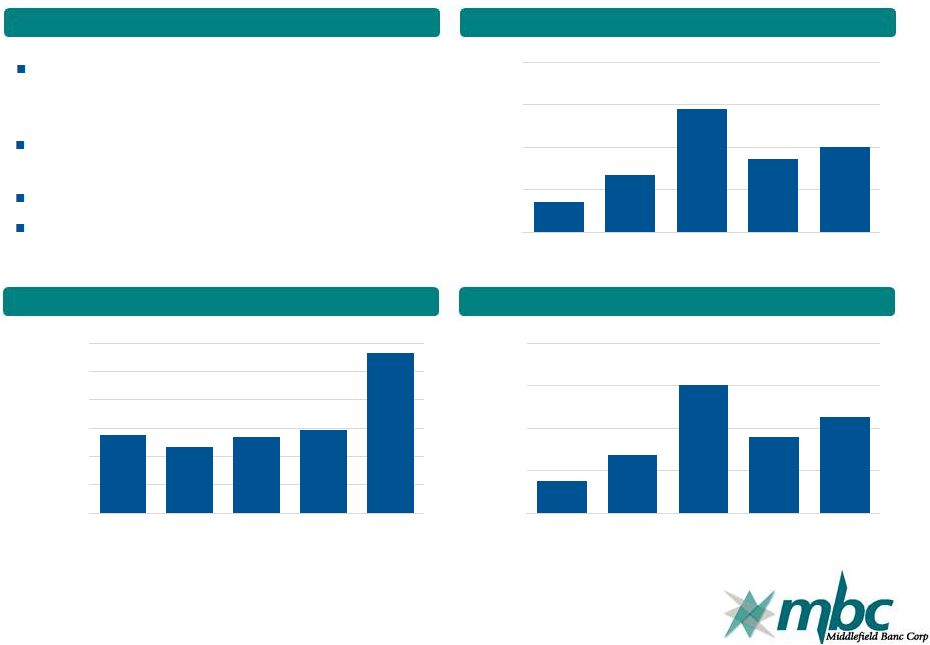
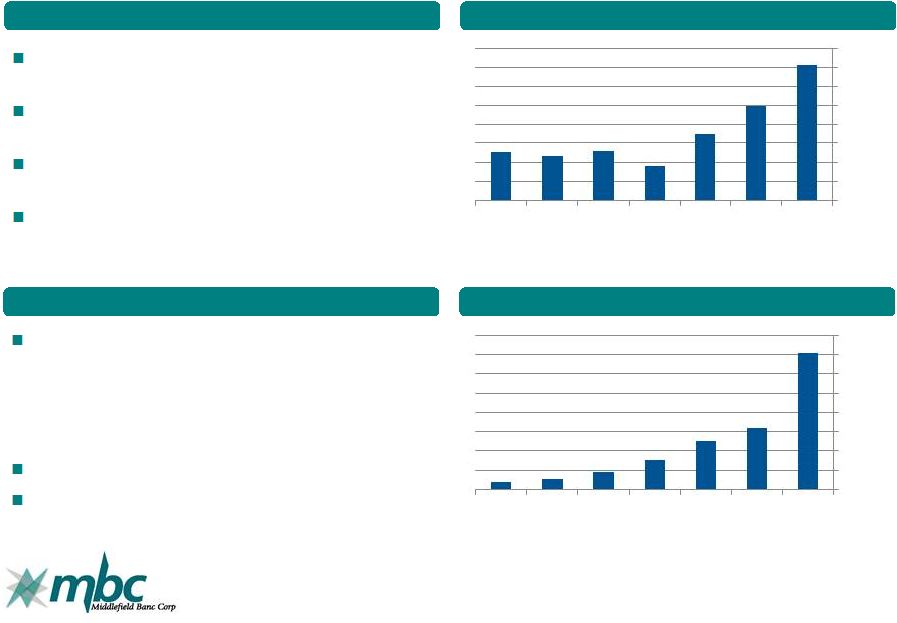 Community Oriented Banking Services 7 www.middlefieldbank.bank Personal Banking Annual Personal Loan Growth (1) Commercial Banking Annual Commercial Loan Growth (2) Franchise value driven by dedication to making a difference in markets served Clients benefit from local decision making and individual service Customer-centric approach builds long term relationships with desirable customers Respected position in communities served encourages retention of talented and experienced management team The Bank’s markets have seen significant industry consolidation in the past ten years – In most cases, the large regional banks are not in a position to deliver the same level of community service that MBCN can $503.8 million in commercial loans at June 30, 2017 Expertise in niche commercial loan products (2) In millions, commercial loans are C&I plus commercial real estate loans (1) In millions, personal loans are consumer installment plus residential real estate loans $150 $175 $200 $225 $250 $275 $300 $325 $350 2017 YTD 2016 2015 2014 2013 2012 2011 $150 $200 $250 $300 $350 $400 $450 $500 $550 2017 YTD 2016 2015 2014 2013 2012 2011 |
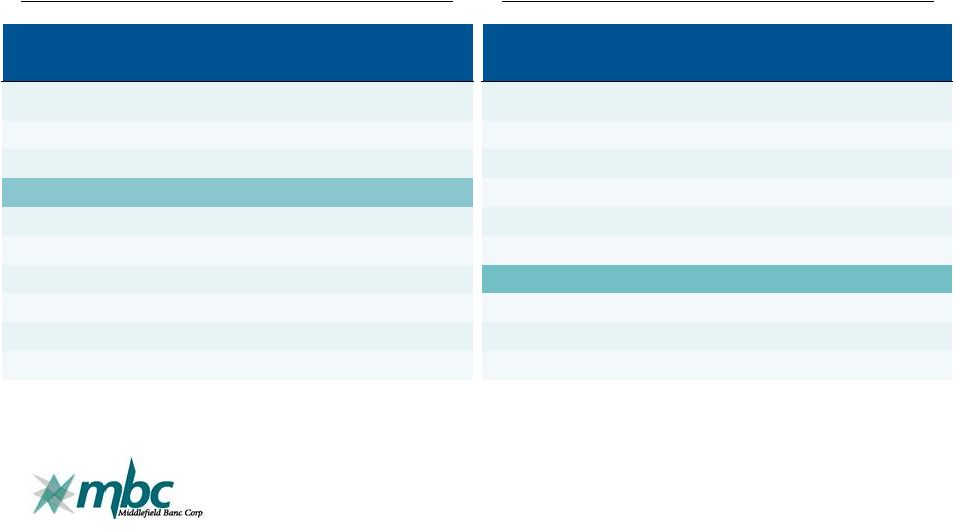 Middlefield’s Market Share (not including Liberty Acquisition) 8 www.middlefieldbank.bank Source: FDIC Ashtabula, Geauga, Portage & Trumbull Counties June 30, 2016 Rank Institution Branches Deposits in Market ($000) Market Share 1 Huntington National Bank 44 1,880,282 23.68 2 JP Morgan Chase 17 1,015,937 12.80 3 The Middlefield Banking Co. 8 575,118 7.24 4 PNC Bank 12 553,340 6.97 5 Key Bank 15 547,328 6.89 6 Chemical Financial Corp. 10 538,876 6.79 7 Cortland Savings & Banking 10 420,008 5.29 8 Citizens Financial Group 5 291,383 3.67 Total for institutions in market 182 7,939,259 Franklin & Delaware Counties June 30, 2016 Rank Institution Branches Deposits in Market ($000) Market Share 1 Huntington National Bank 78 19,723,000 38.27 2 JP Morgan Chase 61 13,439,489 26.08 3 PNC Financial Services 49 5,648,522 10.96 4 Fifth Third Bank 46 5,145,833 9.98 5 U.S. Bancorp 37 1,337,509 2.60 22 The Middlefield Banking Co. 3 57,071 0.11 23 First City Bank 1 41,637 0.08 24 Richwood Bancshares 1 40,109 0.08 Total for institutions in market 390 51,540,715 Strong Market Share in Northeastern Ohio Market Opportunities To Increase Market Share in Central Ohio |
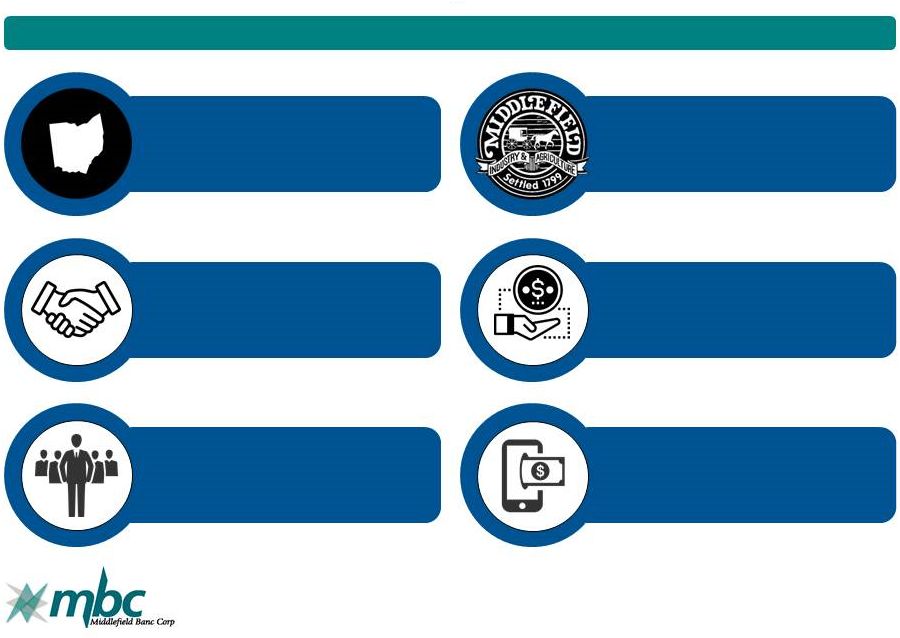 www.middlefieldbank.bank Recent Events and Growth Strategies 9 Expand Ohio De Novo Growth • Focus on high growth markets, with favorable demographics Grow Market Share • Increased advertising budget • Exploit changing market dynamics Generate Fee Income • Secondary mortgages • Financial services Enhance Team • New Central Ohio President • Invest in new lending officers Invest in Technology • Enhance online banking • Grow mobile Seek Attractive Acquisitions • Accelerate growth in similar markets • Generate strong payback Executing Growth Oriented Strategic Plan |
 Organic Growth 10 www.middlefieldbank.bank Third full-service banking location in Central Ohio. – Immediately north of Middlefield's existing Central Ohio branches Delaware County is the fastest growing suburban county in the State of Ohio – 20 miles north of Columbus – Highest median household income in Ohio Opened in October 2016 Opened in October 2015 Focused on commercial banking in Lake and Geauga Counties Mentor is home to approximately 5,000 businesses – Major manufacturers include ABB Inc., Avery Dennison Corp., Lincoln Electric Holding Inc., and STERIS Corp. Lake county has over 94,000 household with a median household income of $56,018 Source: Ohio County Profiles Lake County Source: Delaware County Sunbury, Ohio Mentor, Ohio LPO |
 Liberty Bank N.A. 0.36% 0.67% 1.46% 0.86% 1.01% 0.0% 0.5% 1.0% 1.5% 2.0% 2012 2013 2014 2015 2016 $0.8 $1.4 $3.0 $1.8 $2.3 $- $1.0 $2.0 $3.0 $4.0 2012 2013 2014 2015 2016 $208.2 $205.0 $207.7 $209.6 $230.1 $187.5 $195.0 $202.5 $210.0 $217.5 $225.0 $232.5 2012 2013 2014 2015 2016 Founded in 1990 by a group of local business owners to more effectively serve the needs of business and personal clients Three Ohio branches located in Beachwood, Twinsburg, and Solon 5-star "Superior" rating from Bauer Financial, Inc. Preferred Lender for the Small Business Administration 11 Overview ROAA (%) Net Income (in millions) Average Total Assets (in millions) |
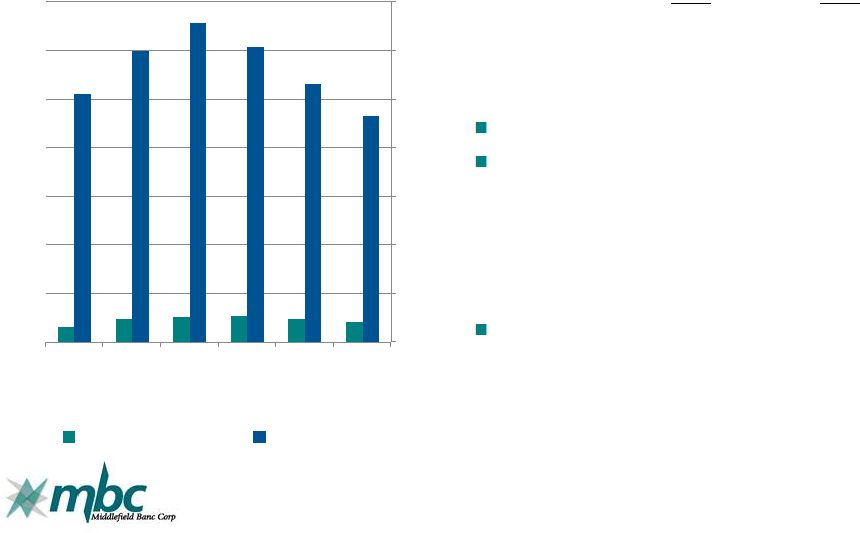 History of Strong Financial Results 12 www.middlefieldbank.bank 0.65% 0.95% 1.06% 1.07% 0.97% 0.85% 10.24% 11.98% 13.17% 12.17% 10.62% 9.33% Return on Average Assets Return on Average Equity Focused on managing cost of funding Anticipate continued pressure on profitability levels due to: – Higher regulatory costs – Continued low rate environment – Investments to support growth Opportunities to offset margin pressures and increase profitability by improvements in fee- based income Six Months Ended June 30, 2017 2016 ROAA 0.89% 0.92% ROAE 9.05% 10.62% Annual Return on Average Assets and Equity 0.00% 2.00% 4.00% 6.00% 8.00% 10.00% 12.00% 14.00% 2016 2015 2014 2013 2012 2011 ROAA: ROAE: |
 Strong 2017 First Half Growth in Profitability 13 www.middlefieldbank.bank Liberty acquisition helped drive significant growth in profitability 44.6% more average diluted shares outstanding as a result of May 2017 stock offering and Liberty merger. Middlefield’s larger scale and improved scope will allow the company to improve profitability, while offering customers a broader range of community- oriented financial products. Overview Net interest income (in millions) Net Income (in millions) EPS, Diluted Up 42.4% Up 35.0% $3.4 $4.6 $- $1.0 $2.0 $3.0 $4.0 $5.0 2016 YTD 2017 YTD $12.7 $18.0 $- $5.0 $10.0 $15.0 $20.0 2016 YTD 2017 YTD $1.73 $1.61 $1.55 $1.60 $1.65 $1.70 $1.75 2016 YTD 2017 YTD |
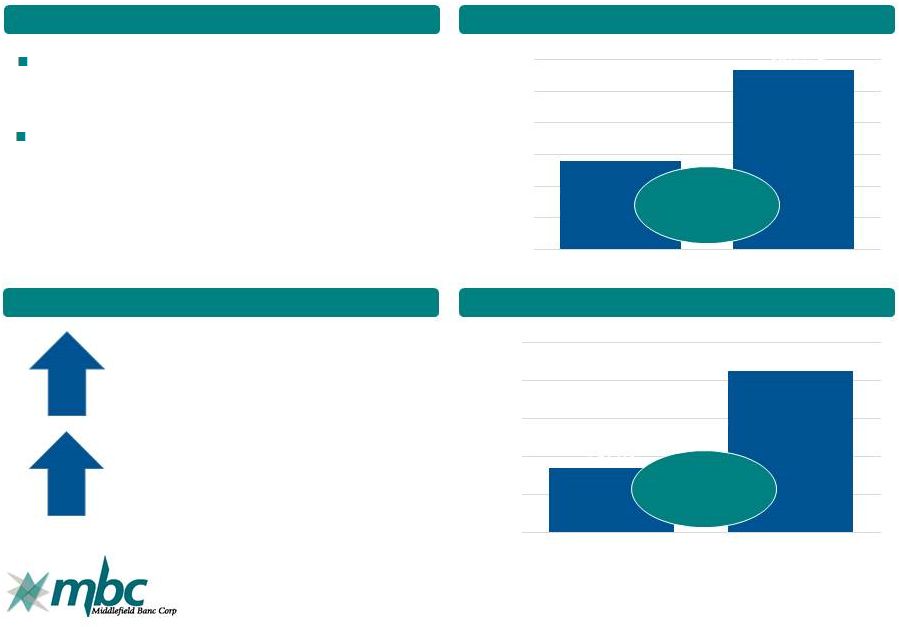 Strong Loan Growth (at June 30, 2017) 14 www.middlefieldbank.bank Stable local economies, additional loan officers, and contribution from Liberty acquisition and new Mentor LPO drove loan growth. Year-over-year loan growth: – $159.5 million increase in commercial mortgages – $57.0 million increase in residential mortgages – $36.7 million increase in commercial and industrial – $19.5 million increase in real estate construction loans – $15.4 million increase in consumer installment loans Up 14.8% year-over-year Up 3.7% from the 2017 first quarter Overview Total Loans (in millions) Organic Loan Growth Loans / Assets Up 50.2% Up 510 bps $579.7 $867.9 $300.0 $400.0 $500.0 $600.0 $700.0 $800.0 $900.0 6/30/16 6/30/17 75.4% 80.5% 72.0% 74.0% 76.0% 78.0% 80.0% 82.0% 6/30/16 6/30/17 |
 Stable Asset Quality 15 www.middlefieldbank.bank Nonperforming loans increased 32.6%, primarily due to a 50.2% increase in loan portfolio No national or sub-prime lending Lending within market area Participation loans with banks that have similar credit quality standards and cultures Overview Year-To-Date Annualized Net Charge Off Nonperforming Loans / Total Loans Nonperforming Assets / Total Assets 1.64% 1.45% 0.0% 0.3% 0.6% 0.9% 1.2% 1.5% 1.8% 6/30/16 6/30/17 0.08% 0.08% 0.0% 0.0% 0.0% 0.0% 0.0% 0.1% 0.1% 0.1% 0.1% 0.1% 6/30/16 6/30/17 1.40% 1.24% 0.0% 0.3% 0.6% 0.9% 1.2% 1.5% 6/30/16 6/30/17 |
 16 www.middlefieldbank.bank Annual Supplemental Data |
 Annual Financial Summary 17 www.middlefieldbank.bank Dollars in thousands 2011 2012 2013 2014 2015 2016 Net interest income 21,075 22,299 22,928 23,804 24,775 25,804 Provision for loan losses 3,085 2,168 196 370 315 570 Noninterest income 2,237 3,451 3,145 3,588 4,044 3,959 Noninterest expense 15,501 15,639 16,870 17,850 20,077 20,872 Income before income taxes 4,726 7,943 9,007 9,172 8,427 8,321 Income taxes 596 1,662 1,979 1,992 1,562 1,905 Net income 4,130 6,281 7,028 7,180 6,865 6,416 Net interest margin 3.65% 3.74% 3.85% 3.93% 3.94% 3.79% Total assets 654,551 670,288 647,090 677,531 735,139 787,821 Loans outstanding, net 395,061 400,654 428,679 463,738 527,325 602,542 Deposits 580,962 593,335 568,836 586,112 624,447 629,934 Equity capital 47,253 55,437 53,473 63,867 62,304 76,960 Earnings per share 2.45 3.29 3.48 3.52 3.41 3.04 Cash dividend (per share) 1.04 1.04 1.04 1.04 1.07 1.08 Dividend pay-out ratio 42.71% 31.87% 29.84% 29.54% 30.90% 36.13% Return on average assets 0.65% 0.95% 1.06% 1.07% 0.97% 0.85% Return on average equity 10.24% 11.98% 13.17% 12.17% 10.62% 9.33% |
 Excellent Asset Quality and Capital Levels 18 www.middlefieldbank.bank Strong reserve coverage provides flexibility in managing potential losses with reduced impact on net income 2012 2013 2014 2015 2016 Nonperforming Loans $14,224 $12,290 $9,048 $10,263 $7,075 Real Estate Owned 1,846 2,698 2,590 1,412 934 Nonperforming Assets $16,070 $14,988 $11,638 $11,675 $8,009 Nonperforming Assets/ Total Assets (%) 2.40% 2.32% 1.72% 1.59% 1.02% Allowance for Loan Losses $7,779 $7,046 $6,846 $6,385 $6,598 Allowance/Total Loans (%) 1.90% 1.62% 1.45% 1.20% 1.08% Net Charge-off Ratio (%) 0.30% 0.22% 0.13% 0.16% 0.06% |