Exhibit 99.1 Middlefield Banc Corp. 2022 First Quarter Investor Presentation (Nasdaq: MBCN)
Forward Looking Statements This presentation contains forward-looking statements within the meaning of the Securities Exchange Act of 1934 and the Private Securities Litigation Reform Act of 1995 concerning Middlefield Banc Corp.’s plans, strategies, objectives, expectations, intentions, financial condition and results of operations. These forward-looking statements reflect management’s current views and intentions and are subject to known and unknown risks, uncertainties, assumptions and other factors that could cause the actual results to differ materially from those contemplated by the statements. The significant risks and uncertainties related to Middlefield Banc Corp. of which management is aware are discussed in detail in the periodic reports that Middlefield Banc Corp. files with the Securities and Exchange Commission (the“SEC”), including in the“RiskFactors” section of its Annual Report on Form 10-K and its Quarterly Report on Form 10-Q. Investors are urged to review Middlefield Banc Corp.’s periodic reports, which are available at no charge through theSEC’s website at www.sec.gov and through Middlefield Banc Corp.’s website at www.middlefieldbank.bank on the“InvestorRelations” page. Middlefield Banc Corp. assumes no obligation to update any of these forward-looking statements to reflect a change in its views or events or circumstances that occur after the date of this presentation. www.middlefieldbank.bank 2
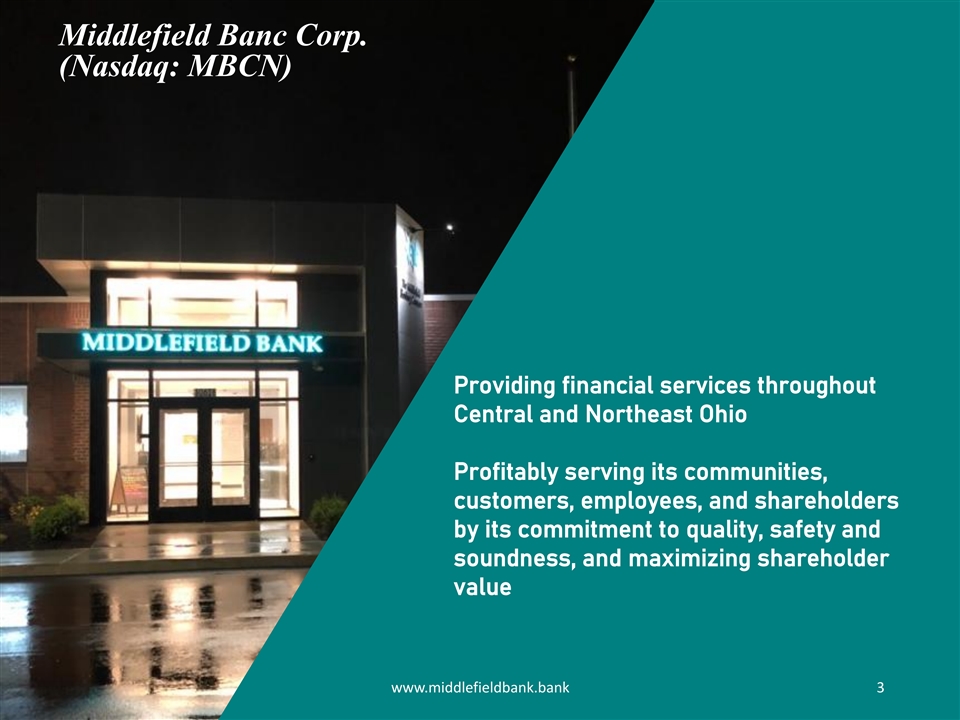
Middlefield Banc Corp. Middlefield Banc Corp. (Nasdaq: MBCN) Providing financial services throughout Central and Northeast Ohio Profitably serving its communities, customers, employees, and shareholders by its commitment to quality, safety and soundness, and maximizing shareholder value www.middlefieldbank.bank 3
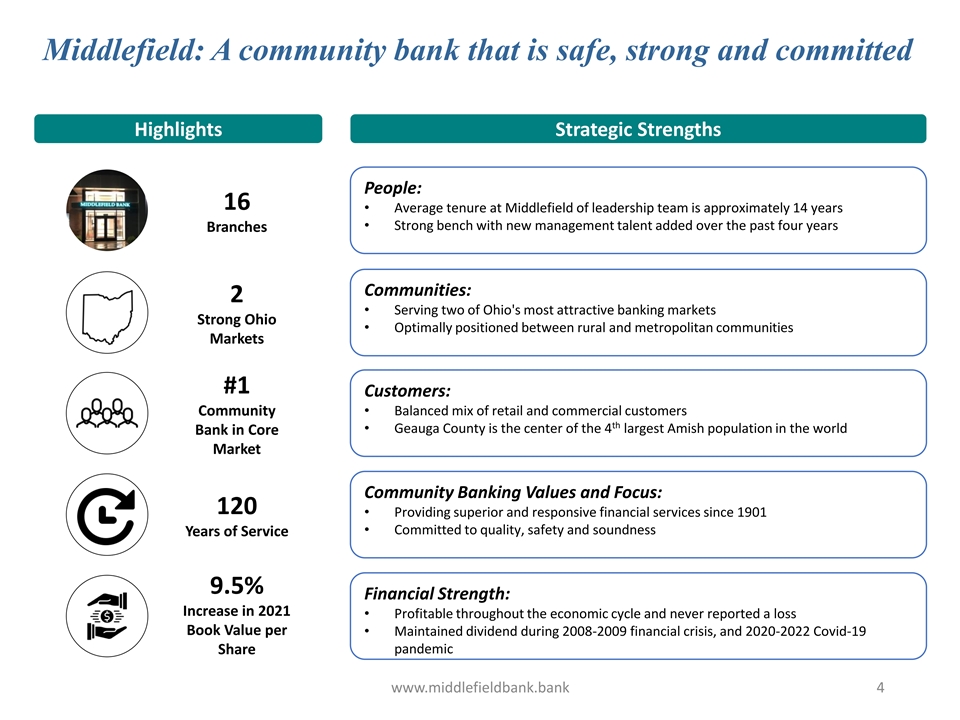
Middlefield: A community bank that is safe, strong and committed Highlights Strategic Strengths People: 16 • Average tenure at Middlefield of leadership team is approximately 14 years • Strong bench with new management talent added over the past four years Branches Communities: 2 • Serving two of Ohio's most attractive banking markets Strong Ohio • Optimally positioned between rural and metropolitan communities Markets #1 Customers: Community • Balanced mix of retail and commercial customers th • Geauga County is the center of the 4 largest Amish population in the world Bank in Core Market Community Banking Values and Focus: 120 • Providing superior and responsive financial services since 1901 • Committed to quality, safety and soundness Years of Service 9.5% Financial Strength: Increase in 2021 • Profitable throughout the economic cycle and never reported a loss Book Value per • Maintained dividend during 2008-2009 financial crisis, and 2020-2022 Covid-19 pandemic Share www.middlefieldbank.bank 4
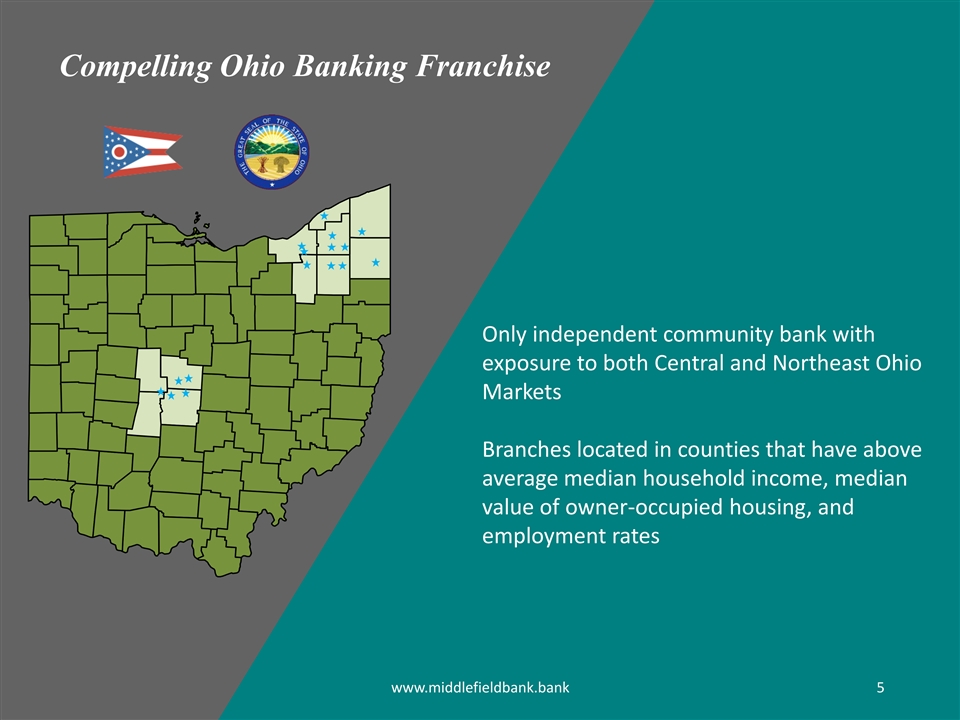
Compelling Ohio Banking Franchise Only independent community bank with exposure to both Central and Northeast Ohio Markets Branches located in counties that have above average median household income, median value of owner-occupied housing, and employment rates www.middlefieldbank.bank 5
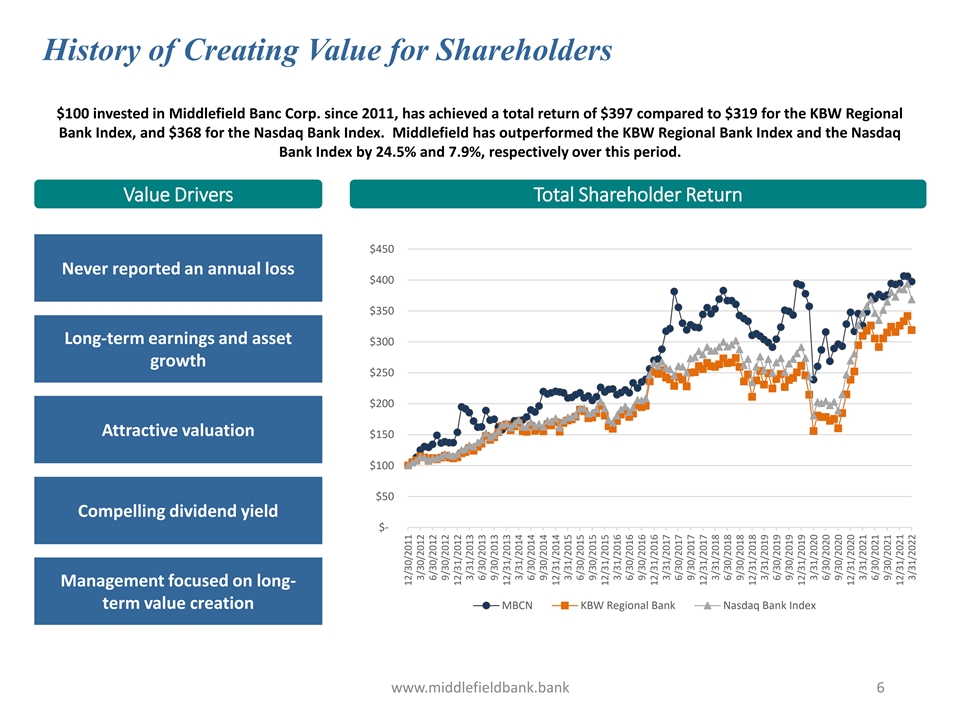
History of Creating Value for Shareholders $100 invested in Middlefield Banc Corp. since 2011, has achieved a total return of $397 compared to $319 for the KBW Regional Bank Index, and $368 for the Nasdaq Bank Index. Middlefield has outperformed the KBW Regional Bank Index and the Nasdaq Bank Index by 24.5% and 7.9%, respectively over this period. Value Drivers Total Shareholder Return $450 Never reported an annual loss $400 $350 Long-term earnings and asset $300 growth $250 $200 Attractive valuation $150 $100 $50 Compelling dividend yield $- Management focused on long- term value creation MBCN KBW Regional Bank Nasdaq Bank Index www.middlefieldbank.bank 6 12/30/2011 3/30/2012 6/30/2012 9/30/2012 12/31/2012 3/31/2013 6/30/2013 9/30/2013 12/31/2013 3/31/2014 6/30/2014 9/30/2014 12/31/2014 3/31/2015 6/30/2015 9/30/2015 12/31/2015 3/31/2016 6/30/2016 9/30/2016 12/31/2016 3/31/2017 6/30/2017 9/30/2017 12/31/2017 3/31/2018 6/30/2018 9/30/2018 12/31/2018 3/31/2019 6/30/2019 9/30/2019 12/31/2019 3/31/2020 6/30/2020 9/30/2020 12/31/2020 3/31/2021 6/30/2021 9/30/2021 12/31/2021 3/31/2022
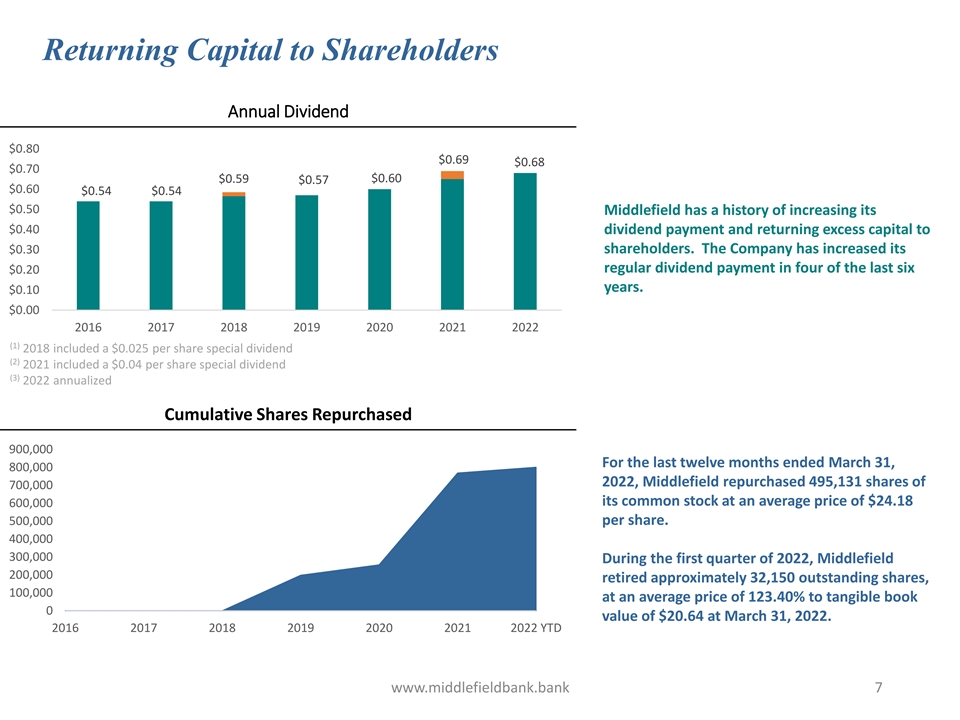
Returning Capital to Shareholders Annual Dividend $0.80 $0.69 $0.68 $0.70 $0.59 $0.60 $0.57 $0.60 $0.54 $0.54 $0.50 Middlefield has a history of increasing its $0.40 dividend payment and returning excess capital to $0.30 shareholders. The Company has increased its $0.20 regular dividend payment in four of the last six years. $0.10 $0.00 2016 2017 2018 2019 2020 2021 2022 (1) 2018 included a $0.025 per share special dividend (2) 2021 included a $0.04 per share special dividend (3) 2022 annualized Cumulative Shares Repurchased 900,000 For the last twelve months ended March 31, 800,000 2022, Middlefield repurchased 495,131 shares of 700,000 its common stock at an average price of $24.18 600,000 500,000 per share. 400,000 300,000 During the first quarter of 2022, Middlefield 200,000 retired approximately 32,150 outstanding shares, 100,000 at an average price of 123.40% to tangible book 0 value of $20.64 at March 31, 2022. 2016 2017 2018 2019 2020 2021 2022 YTD www.middlefieldbank.bank 7
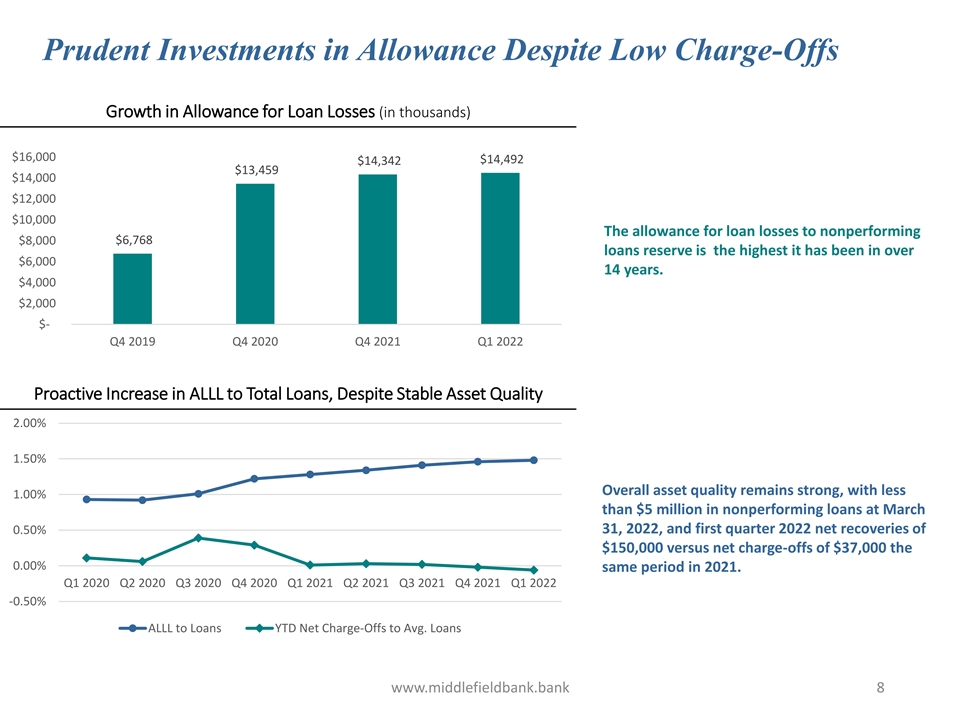
Prudent Investments in Allowance Despite Low Charge-Offs Growth in Allowance for Loan Losses (in thousands) $16,000 $14,492 $14,342 $13,459 $14,000 $12,000 $10,000 The allowance for loan losses to nonperforming $6,768 $8,000 loans reserve is the highest it has been in over $6,000 14 years. $4,000 $2,000 $- Q4 2019 Q4 2020 Q4 2021 Q1 2022 Proactive Increase in ALLL to Total Loans, Despite Stable Asset Quality 2.00% 1.50% Overall asset quality remains strong, with less 1.00% than $5 million in nonperforming loans at March 31, 2022, and first quarter 2022 net recoveries of 0.50% $150,000 versus net charge-offs of $37,000 the 0.00% same period in 2021. Q1 2020 Q2 2020 Q3 2020 Q4 2020 Q1 2021 Q2 2021 Q3 2021 Q4 2021 Q1 2022 -0.50% ALLL to Loans YTD Net Charge-Offs to Avg. Loans www.middlefieldbank.bank 8

Strong Core Earnings Growth Annual Pre-Tax, Pre-Provision Income (in thousands) $25,000 $20,000 $15,000 From 2016 to 2021 core earnings have grown at a 21.4% CAGR as a result of higher total revenue and controlled $10,000 expenses. $5,000 $- 2016 2017 2018 2019 2020 2021 LTM 2016 2017 2018 2019 2020 2021 LTM Net Income $ 6,416 $ 9,455 $12,431 $12,711 $ 8,349 $18,633 $18,299 (+) Provision 570 1,045 840 890 9,840 700 0 (+) Taxes 1,905 4,222 2,162 2,592 1,401 4,065 3,941 PTPP $ 8,891 $14,722 $15,433 $16,193 $19,590 $23,398 $22,240 www.middlefieldbank.bank 9

History of Financial Success From 2016 to 2021... Total Assets (in millions) Since 2016, total assets have $1,600 grown at a CAGR of 11.1% driven $1,400 by higher loans, new locations $1,200 and an accretive acquisition $1,000 $800 Expanded footprint by 60% $600 2016 2017 2018 2019 2020 2021 Q1 2022 Book Value per Share Enhanced infrastructure to support growth $27 $25 Highly profitable financial model $22 continues to produce strong earnings per share $20 $17 $15 Listed on American Bankers Top $12 200 Publicly Traded Community 2016 2017 2018 2019 2020 2021 Q1 2022 Banks for 8 Consecutive Years www.middlefieldbank.bank 10

Growth Oriented Platform Supports Long-Term Strategic Plan Platform and Growth Strategies Attract, Develop and Retain Talent • Strengthen and empower associates • Added important members to leadership team Enhance Products and Services • Expanding product and service offerings • Strategic focus on products and services that grow noninterest income Middlefield is focused on expanding in high growth markets with favorable demographics and Advance Customer Interactions • Enhancing online and digital banking exploiting changing market dynamics. Middlefield • New modern bank layout and engagement has invested in creating an infrastructure to support a bank of approximately $2 billion in assets. Expand Geographies and Market Share • Focus on growth in compelling Central Ohio Market • Increase share in core Northeast Ohio Markets Invest in Systems and Security • Continual investments in security, privacy, and compliance www.middlefieldbank.bank 11
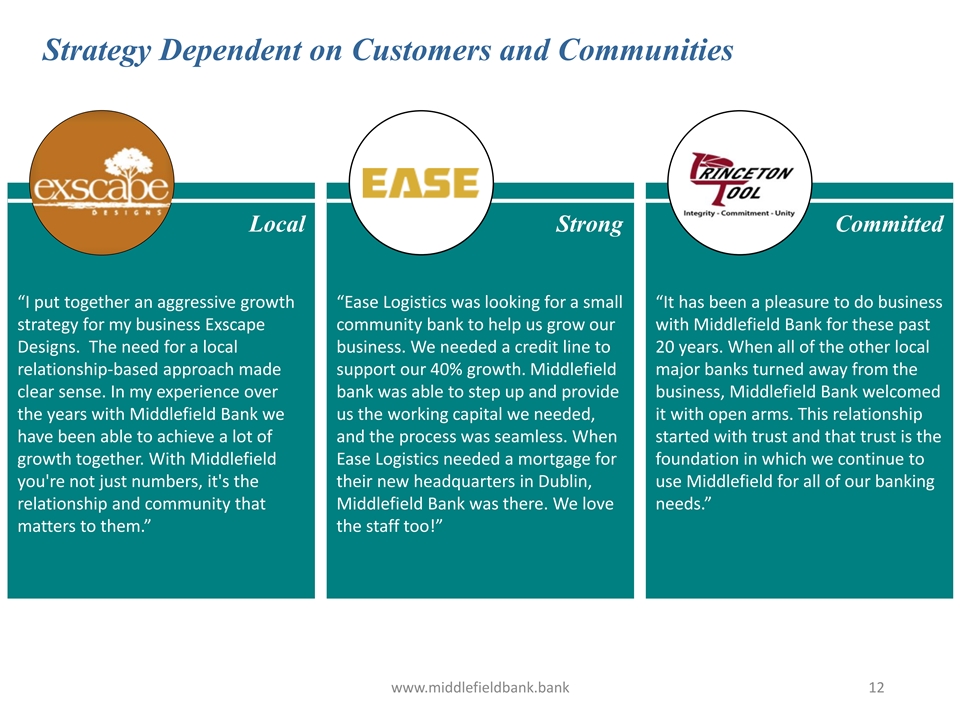
Strategy Dependent on Customers and Communities Local Strong Committed “I put together an aggressive growth “Ease Logistics was looking for a small “It has been a pleasure to do business strategy for my business Exscape community bank to help us grow our with Middlefield Bank for these past Designs. The need for a local business. We needed a credit line to 20 years. When all of the other local relationship-based approach made support our 40% growth. Middlefield major banks turned away from the clear sense. In my experience over bank was able to step up and provide business, Middlefield Bank welcomed the years with Middlefield Bank we us the working capital we needed, it with open arms. This relationship have been able to achieve a lot of and the process was seamless. When started with trust and that trust is the growth together. With Middlefield Ease Logistics needed a mortgage for foundation in which we continue to you're not just numbers, it's the their new headquarters in Dublin, use Middlefield for all of our banking relationship and community that Middlefield Bank was there. We love needs.” matters to them.” the staff too!” www.middlefieldbank.bank 12

Adding Digital Tools and Services to Improve Our Customer Experience and Enhance Our Relationships Digital Digital Digital Account Insurance Fraud Opening Agency Prevention • Fully automated Digital • New digital insurance agency • New fraud prevention Account Opening (DAO) platform. platform for checks and ACH solution provides our • Offers a full-service insurance transactions. customers a modern, flexible agency solution to our retail • Platform empowers approach to opening and commercial customers. customers with the ability to accounts. • Provides simple, seamless customize actionable alerts access to competitive and accept or reject options. suspicious ACH and checks in real-time. www.middlefieldbank.bank 13
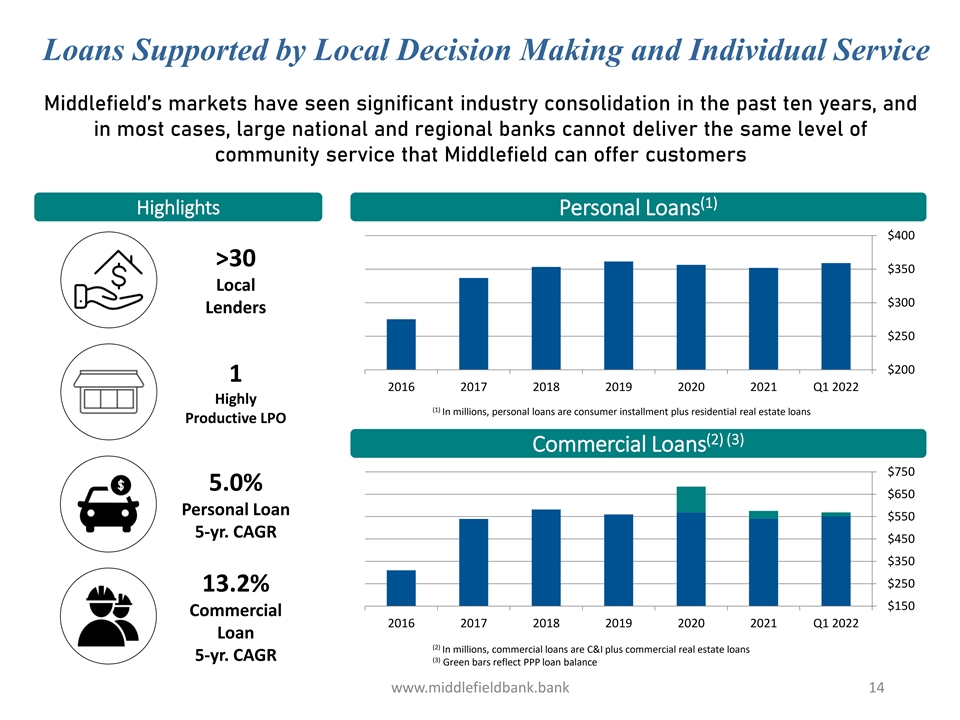
Loans Supported by Local Decision Making and Individual Service Middlefield’s markets have seen significant industry consolidation in the past ten years, and in most cases, large national and regional banks cannot deliver the same level of community service that Middlefield can offer customers (1) Highlights Personal Loans $400 >30 $350 Local $300 Lenders $250 $200 1 2016 2017 2018 2019 2020 2021 Q1 2022 Highly (1) In millions, personal loans are consumer installment plus residential real estate loans Productive LPO (2) (3) Commercial Loans $750 5.0% $650 Personal Loan $550 5-yr. CAGR $450 $350 $250 13.2% $150 Commercial 2016 2017 2018 2019 2020 2021 Q1 2022 Loan (2) In millions, commercial loans are C&I plus commercial real estate loans 5-yr. CAGR (3) Green bars reflect PPP loan balance www.middlefieldbank.bank 14
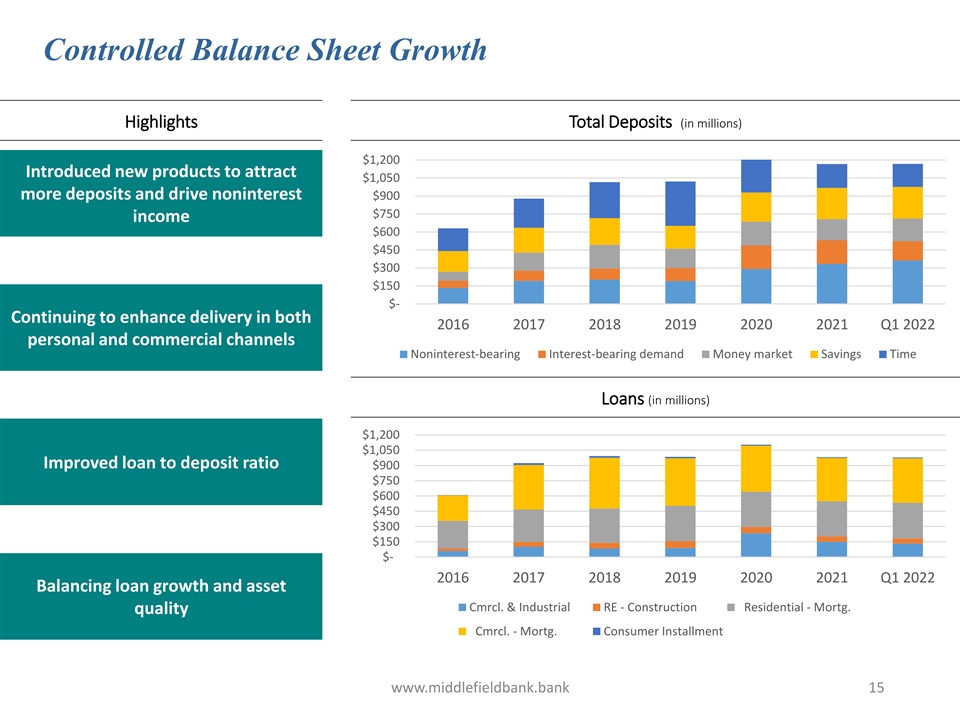
Controlled Balance Sheet Growth Highlights Total Deposits (in millions) $1,200 Introduced new products to attract $1,050 more deposits and drive noninterest $900 $750 income $600 $450 $300 $150 $- Continuing to enhance delivery in both 2016 2017 2018 2019 2020 2021 Q1 2022 personal and commercial channels Noninterest-bearing Interest-bearing demand Money market Savings Time Loans (in millions) $1,200 $1,050 Improved loan to deposit ratio $900 $750 $600 $450 $300 $150 $- 2016 2017 2018 2019 2020 2021 Q1 2022 Balancing loan growth and asset Cmrcl. & Industrial RE - Construction Residential - Mortg. quality Cmrcl. - Mortg. Consumer Installment www.middlefieldbank.bank 15
Supplemental Financial Data (Nasdaq: MBCN)
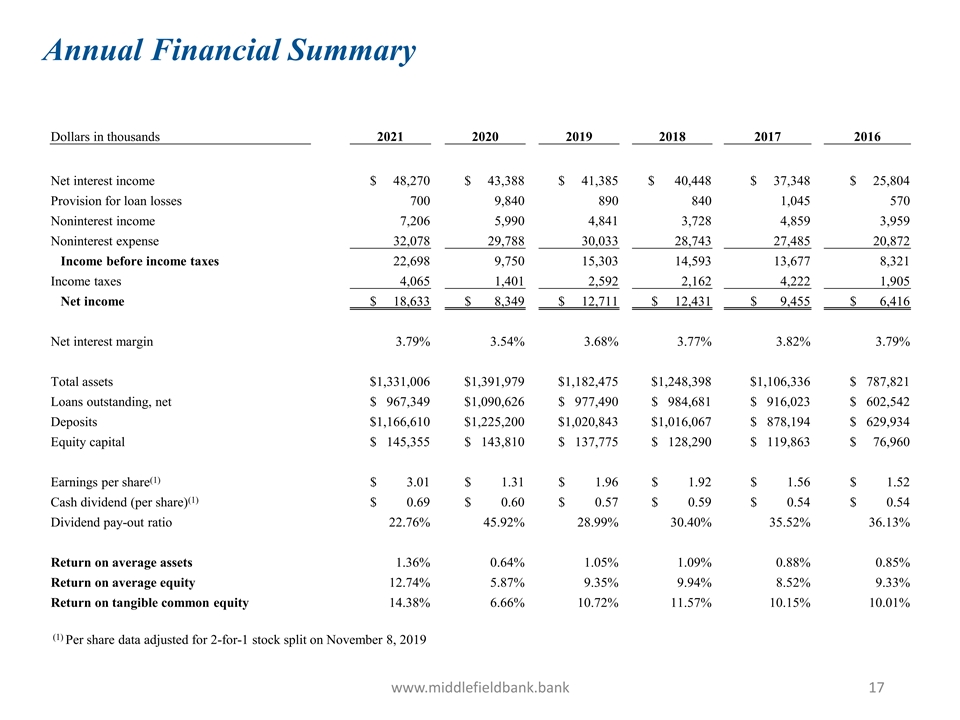
Annual Financial Summary Dollars in thousands 2021 2020 2019 2018 2017 2016 Net interest income $ 48,270 $ 43,388 $ 41,385 $ 40,448 $ 37,348 $ 25,804 Provision for loan losses 700 9,840 890 840 1,045 570 Noninterest income 7,206 5,990 4,841 3,728 4,859 3,959 Noninterest expense 32,078 29,788 30,033 28,743 27,485 20,872 Income before income taxes 22,698 9,750 15,303 14,593 13,677 8,321 Income taxes 4,065 1,401 2,592 2,162 4,222 1,905 Net income $ 18,633 $ 8,349 $ 12,711 $ 12,431 $ 9,455 $ 6,416 Net interest margin 3.79% 3.54% 3.68% 3.77% 3.82% 3.79% Total assets $1,331,006 $1,391,979 $1,182,475 $1,248,398 $1,106,336 $ 787,821 Loans outstanding, net $ 967,349 $1,090,626 $ 977,490 $ 984,681 $ 916,023 $ 602,542 Deposits $1,166,610 $1,225,200 $1,020,843 $1,016,067 $ 878,194 $ 629,934 Equity capital $ 145,355 $ 143,810 $ 137,775 $ 128,290 $ 119,863 $ 76,960 (1) Earnings per share $ 3.01 $ 1.31 $ 1.96 $ 1.92 $ 1.56 $ 1.52 (1) Cash dividend (per share) $ 0.69 $ 0.60 $ 0.57 $ 0.59 $ 0.54 $ 0.54 Dividend pay-out ratio 22.76% 45.92% 28.99% 30.40% 35.52% 36.13% Return on average assets 1.36% 0.64% 1.05% 1.09% 0.88% 0.85% Return on average equity 12.74% 5.87% 9.35% 9.94% 8.52% 9.33% Return on tangible common equity 14.38% 6.66% 10.72% 11.57% 10.15% 10.01% (1) Per share data adjusted for 2-for-1 stock split on November 8, 2019 www.middlefieldbank.bank 17
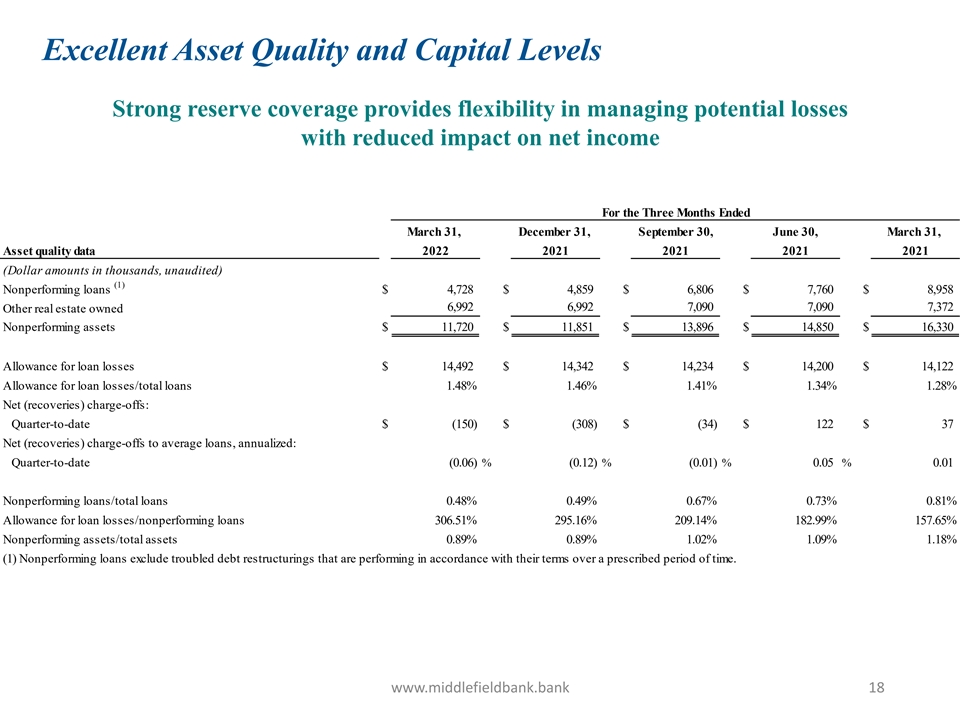
Excellent Asset Quality and Capital Levels Strong reserve coverage provides flexibility in managing potential losses with reduced impact on net income For the Three Months Ended March 31, December 31, September 30, June 30, March 31, Asset quality data 2022 2021 2021 2021 2021 (Dollar amounts in thousands, unaudited) (1) Nonperforming loans $ 4,728 $ 4,859 $ 6,806 $ 7,760 $ 8,958 6,992 6,992 7,090 7,090 7,372 Other real estate owned Nonperforming assets $ 11,720 $ 11,851 $ 13,896 $ 14,850 $ 16,330 Allowance for loan losses $ 14,492 $ 14,342 $ 14,234 $ 14,200 $ 14,122 Allowance for loan losses/total loans 1.48% 1.46% 1.41% 1.34% 1.28% Net (recoveries) charge-offs: Quarter-to-date $ (150) $ (308) $ (34) $ 122 $ 37 Net (recoveries) charge-offs to average loans, annualized: Quarter-to-date (0.06) % (0.12) % (0.01) % 0.05 % 0.01 Nonperforming loans/total loans 0.48% 0.49% 0.67% 0.73% 0.81% Allowance for loan losses/nonperforming loans 306.51% 295.16% 209.14% 182.99% 157.65% Nonperforming assets/total assets 0.89% 0.89% 1.02% 1.09% 1.18% (1) Nonperforming loans exclude troubled debt restructurings that are performing in accordance with their terms over a prescribed period of time. www.middlefieldbank.bank 18

Reconciliation of Non-GAAP Measures Reconciliation of Common Stockholders' Equity to Tangible Common Equity For the Three Months Ended (Dollar amounts in thousands, unaudited) March 31, December 31, September 30, June 30, March 31, 2022 2021 2021 2021 2021 Stockholders' Equity $ 137,644 $ 145,335 $ 146,055 $ 146,044 $ 144,670 Less Goodwill and other intangibles 16,397 16,474 16,555 16,635 16,715 Tangible Common Equity $ 121,247 $ 128,861 $ 129,500 $ 129,409 $ 127,955 Shares outstanding 5,873,565 5,888,737 6,054,083 6,215,511 6,344,657 Tangible book value per share $ 20.64 $ 21.88 $ 21.39 $ 20.82 $ 20.17 Reconciliation of Average Equity to Return on Average Tangible Common Equity For the Three Months Ended March 31, December 31, September 30, June 30, March 31, 2022 2021 2021 2021 2021 Average Stockholders' Equity $ 144,630 $ 145,716 $ 148,048 $ 146,719 $ 145,208 Less Average Goodwill and other intangibles 16,435 16,513 16,594 16,674 16,754 Average Tangible Common Equity $ 128,195 $ 129,203 $ 131,454 $ 130,045 $ 128,454 Net income $ 3,833 $ 4,837 $ 5,204 $ 4,425 $ 4,167 Return on average tangible common equity (annualized) 12.13% 14.85% 15.71% 13.65% 13.16% This presentation includes disclosure of Middlefield Banc Corp.’s tangible book value per share and return on average tangible equity, which are financial measures not prepared in accordance with generally accepted accounting principles in the United States (GAAP). A non-GAAP financial measure is a numerical measure of historical or future financial performance, financial position or cash flows that excludes or includes amounts that are required to be disclosed by GAAP. Middlefield Banc Corp. believes that these non-GAAP financial measures provide both management and investors a more complete understanding of the underlying operational results and trends and Middlefield Banc Corp.’s marketplace performance. The presentation of this additional information is not meant to be considered in isolation or as a substitute for the numbers prepared in accordance with GAAP. www.middlefieldbank.bank 19