United States SECURITIES AND EXCHANGE COMMISSION
Washington, D.C. 20549
FORM 10-K
Annual Report Pursuant to Section 13 or 15(d) of the Securities Exchange Act of 1934
for the fiscal year ended: December 31, 2008
Commission File Number: 000-32561
Middlefield Banc Corp.
(Exact name of registrant as specified in its charter)
| | | |
| Ohio | | 34-1585111 |
| | | |
(State or other jurisdiction
of incorporation or organization) | | (IRS Employer
Identification No.) |
15985 East High Street, Middlefield, Ohio 44062-0035
(440) 632-1666
(Address, including zip code, and telephone number,
including area code, of registrant’s principal executive offices)
Securities registered pursuant to section 12(b) of the Act:none
Securities registered pursuant to section 12(g) of the Act: common stock, without par value
Indicate by check mark if the registrant is a well-known seasoned issuer, as defined in Rule 405 of the Securities Act. Yeso Noþ
Indicate by check mark if the registrant is not required to file reports pursuant to Section 13 or Section 15(d) of the Act. Yeso Noþ
Indicate by check mark whether the registrant (1) has filed all reports required to be filed by sections 13 or 15(d) of the Securities Exchange Act of 1934 during the preceding 12 months (or for such shorter period that the registrant was required to file such reports), and (2) has been subject to such filing requirements for the past 90 days. Yesþ Noo
Indicate by check mark if disclosure of delinquent filers pursuant to Item 405 of Regulation S-K is not contained herein, and will not be contained, to the best of registrant’s knowledge, in definitive proxy or information statements incorporated by reference in Part III of this Form 10-K or any amendment to this Form 10-K.o
Indicate by check mark whether the registrant is large accelerated filer, an accelerated filer, an non-accelerated filer, or a smaller reporting company. See definition of “accelerated filer,” “large accelerated filer,” and “smaller reporting company” in Rule 12b-2 of the Exchange Act. (Check one):
| | | | | | | |
| Large accelerated filero | | Accelerated filero | | Non-accelerated filero | | Smaller reporting companyþ |
Indicate by check mark whether the registrant is a shell company (as defined in Rule 12b-2 of the Exchange Act). Yeso Noþ
The aggregate market value on June 30, 2008 of common stock held by non-affiliates of the registrant was approximately $45.7 million. As of March 20, 2009, there were 1,541,247 shares of common stock issued and outstanding.
Documents Incorporated by Reference
Portions of the registrant’s definitive proxy statements for the 2009 Annual Meeting of Shareholders are incorporated by reference in Part III of this report. Portions of the Annual Report to Shareholders for the year ended December 31, 2008 are incorporated by reference into Part I and Part II of this report.
TABLE OF CONTENTS
Item 1 — Business
Middlefield Banc Corp.Incorporated in 1988 under the Ohio General Corporation Law, Middlefield Banc Corp. (“Company”) is a two-bank holding company registered under the Bank Holding Company Act of 1956. The Company’s two subsidiaries are:
| | 1. | | The Middlefield Banking Company (“MBC”), an Ohio-chartered commercial bank that began operations in 1901. MBC engages in a general commercial banking business in northeastern Ohio. The principal executive office is located at 15985 East High Street, Middlefield, Ohio 44062-0035, and its telephone number is (440) 632-1666. |
| | 2. | | Emerald Bank (“EB”), an Ohio-chartered commercial bank headquartered in Dublin, Ohio. EB engages in a general commercial banking business in central Ohio. The principal executive office is located at 6215 Perimeter Drive, Dublin Ohio 43017, and its telephone number is (614) 793-4631. |
The Middlefield Banking Company.MBC was chartered under Ohio law in 1901. The Company became the holding company for MBC in 1988. MBC offers its customers a broad range of banking services, including checking, savings, and negotiable order of withdrawal (NOW) accounts; money market accounts; time certificates of deposit, commercial loans, real estate loans, and various types of consumer loans; safe deposit facilities, and travelers’ checks. MBC offers online banking and bill payment services to individuals and online cash management services to business customers through its website at www.middlefieldbank.com.
Engaged in a general commercial banking business in northeastern Ohio, MBC offers commercial banking services principally to small and medium-sized businesses, professionals and small business owners, and retail customers. MBC has developed and continues to monitor and update a marketing program to attract and retain consumer accounts, and to offer banking services and facilities compatible with the needs of its customers.
MBC’s loan products include operational and working capital loans; loans to finance capital purchases; term business loans; residential construction loans; selected guaranteed or subsidized loan programs for small businesses; professional loans; residential mortgage and commercial mortgage loans, and consumer installment loans to purchase automobiles, boats, and for home improvement and other personal expenditures. Although the bank makes agricultural loans, it currently has no significant agricultural loans.
Emerald Bank. The Company acquired Emerald Bank on April 19, 2007 for a combination of cash and stock. Emerald Bank operates as a separate commercial bank subsidiary of Middlefield, offering essentially the same range of products and services in central Ohio as MBC does in northeastern Ohio.
Market Area. MBC’s market area consists principally of Geauga, Portage, Trumbull, and Ashtabula Counties. Benefiting from the area’s proximity both to Cleveland and Warren, population and income levels have maintained steady growth over the years. EB’s two offices are located in Franklin County, serving the central Ohio market.
Competition.The banking industry has been changing for many reasons, including continued consolidation within the banking industry, legislative and regulatory changes, and advances in technology. To deliver banking products and services more effectively and efficiently, banking institutions are opening in-store branches, installing more automated teller machines (ATMs) and investing in technology to permit telephone, personal computer, and internet banking. While all banks are experiencing the effects of the changing competitive and technological environment, the manner in which banks choose to compete is increasing the gap between large national and super-regional banks, on one hand, and community banks on the other. Large institutions are committed to becoming national or regional “brand names,” providing a broad selection of products at low cost and with advanced technology, while community banks provide most of the same products but with a commitment to personal service and with local ties to the customers and communities they serve. The Company seeks to take competitive advantage of its local orientation and community banking profile. It competes for loans principally through responsiveness to customers and its ability to communicate effectively with them and understand and address their needs. The Company competes for deposits principally by offering customers personal attention, a variety of banking services, attractive rates, and strategically located banking facilities. The Company seeks to provide high quality banking service to professionals and small and mid-sized businesses, as well as individuals, emphasizing quick and flexible responses to customer demands.
Forward-looking Statements. This document contains forward-looking statements (as defined in the Private Securities Litigation Reform Act of 1995) about The Company and subsidiaries. Information incorporated in this document by reference, future filings by the Company on Form 10-Q and Form 8-K, and future oral and written statements by the Company and its management may also contain forward-looking statements. Forward-looking statements include statements about anticipated operating and financial performance, such as loan originations, operating efficiencies, loan sales, charge-offs and loan loss provisions, growth opportunities, interest rates, and deposit growth. Words such as “may,” “could,” “should,” “would,” “believe,” “anticipate,” “estimate,” “expect,” “intend,” “project,” “plan,” and similar expressions are intended to identify these forward-looking statements.
1
Forward-looking statements are necessarily subject to many risks and uncertainties. A number of things could cause actual results to differ materially from those indicated by the forward-looking statements. These include the factors we discuss immediately below, those addressed under the caption “Management’s Discussion and Analysis of Financial Condition and Results of Operations,” other factors discussed elsewhere in this document or identified in our filings with the Securities and Exchange Commission, and those presented elsewhere by our management from time to time. Many of the risks and uncertainties are beyond our control. The following factors could cause our operating and financial performance to differ materially from the plans, objectives, assumptions, expectations, estimates, and intentions expressed in forward-looking statements:
| • | | the strength of the United States economy in general and the strength of the local economies in which we conduct our operations; general economic conditions, either nationally or regionally, may be less favorable than we expect, resulting in a deterioration in the credit quality of our loan assets, among other things |
| |
| • | | the effects of, and changes in, trade, monetary and fiscal policies and laws, including interest-rate policies of the Federal Reserve Board |
| |
| • | | inflation, interest rate, market, and monetary fluctuations |
| |
| • | | the development and acceptance of new products and services of the Company and subsidiaries and the perceived overall value of these products and services by users, including the features, pricing, and quality compared to competitors’ products and services |
| |
| • | | the willingness of users to substitute our products and services for those of competitors |
| |
| • | | the impact of changes in financial services laws and regulations (including laws concerning taxes, banking, securities, and insurance) |
| |
| • | | changes in consumer spending and saving habits |
Forward-looking statements are based on our beliefs, plans, objectives, goals, assumptions, expectations, estimates, and intentions as of the date the statements are made. Investors should exercise caution because the Company cannot give any assurance that its beliefs, plans, objectives, goals, assumptions, expectations, estimates, and intentions will be realized. The Company disclaims any obligation to update or revise any forward-looking statements based on the occurrence of future events, the receipt of new information, or otherwise.
Lending—Loan Portfolio Composition and Activity. The Company makes residential mortgage and commercial mortgage loans, home equity loans, secured and unsecured consumer installment loans, commercial and industrial loans, and real estate construction loans for owner-occupied and rental properties. The Company’s loan policy aspires to a loan composition mix consisting of approximately 60% to 70% residential real estate loans, 35% to 40% commercial loans, consumer loans of 5% to 15%, and credit card accounts of up to 5%.
Although Ohio bank law imposes no material restrictions on the kinds of loans the Company may make, real estate-based lending has historically been the bank’s primary focus. For prudential reasons, the bank avoids lending on the security of real estate located in regions with which the bank is not familiar, and as a consequence almost all of the bank’s real-estate secured loans are secured by real property in northeastern Ohio. Ohio bank law does restrict the amount of loans an Ohio-chartered bank such as the banks may make, however, providing generally that loans and extensions of credit to any one borrower may not exceed 15% of capital. An additional margin of 10% of capital is allowed for loans fully secured by readily marketable collateral. This 15% legal lending limit has not been a material restriction on the banks lending. The banks can accommodate loan volumes exceeding the legal lending limit by selling loan participations to other banks. The subsidiaries’ internal policy are to maintain its credit exposure to any one borrower at less than $3.0 million, which is comfortably within the range of the bank’s legal lending limit. As of December 31, 2008, the Company’s 15%-of-capital limit on loans to a single borrower was approximately $5.3 million.
The Company offers specialized loans for business and commercial customers, including equipment and inventory financing, real estate construction loans and Small Business Administration loans for qualified businesses. A substantial portion of the bank’s commercial loans are designated as real estate loans for regulatory reporting purposes because they are secured by mortgages on real property. Loans of that type may be made for purpose of financing commercial activities, such as accounts receivable, equipment purchases and leasing, but they are secured by real estate to provide the bank with an extra measure of security. Although these loans might be secured in whole or in part by real estate, they are treated in the discussions to follow as commercial and industrial loans. The Company’s consumer installment loans include secured and unsecured loans to individual borrowers for a variety of purposes, including personal, home improvements, revolving credit lines, autos, boats, and recreational vehicles.
2
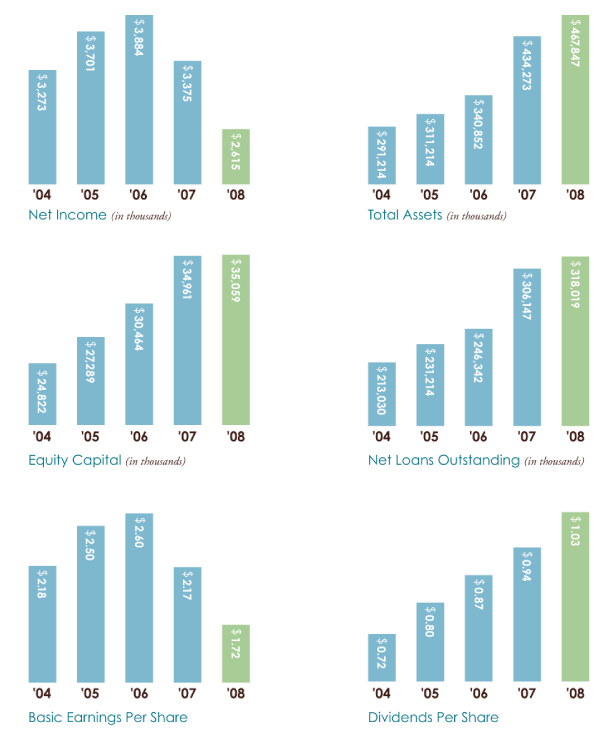
The following table shows the composition of the loan portfolio in dollar amounts and in percentages at December 31, 2008, 2007, 2006, 2005 and 2004, along with a reconciliation to loans receivable, net.
| | | | | | | | | | | | | | | | | | | | | | | | | | | | | | | | | | | | | | | | | |
| | | Loan Portfolio Composition at December 31, | |
| | | 2008 | | | 2007 | | | 2006 | | | 2005 | | | 2004 | |
| (Dollars in thousands) | | Amount | | | Percent | | | Amount | | | Percent | | | Amount | | | Percent | | | Amount | | | Percent | | | Amount | | | Percent | |
| | | | | | | | | | | | | | | | | | | | | | | | | | | | | | | | | | | | | | | | | |
Type of loan: | | | | | | | | | | | | | | | | | | | | | | | | | | | | | | | | | | | | | | | | |
Commercial and industrial | | $ | 66,524 | | | | 20.69 | | | $ | 67,010 | | | | 21.65 | | | $ | 68,496 | | | | 27.49 | % | | $ | 65,252 | | | | 27.88 | % | | $ | 52,148 | | | | 24.18 | % |
Real estate construction | | | 7,965 | | | | 2.48 | | | | 6,704 | | | | 2.17 | | | | 2,458 | | | | 0.99 | | | | 2,725 | | | | 1.16 | | | | 3,144 | | | | 1.46 | |
Mortgage: | | | | | | | | | | | | | | | | | | | | | | | | | | | | | | | | | | | | | | | | |
Residential | | | 199,354 | | | | 61.99 | | | | 193,514 | | | | 62.53 | | | | 162,917 | | | | 65.38 | | | | 151,866 | | | | 64.88 | | | | 147,425 | | | | 68.36 | |
Commercial | | | 42,789 | | | | 13.31 | | | | 36,818 | | | | 11.90 | | | | 9,949 | | | | 3.99 | | | | 8,208 | | | | 3.51 | | | | 7,027 | | | | 3.26 | |
Consumer installment | | | 4,943 | | | | 1.53 | | | | 5,400 | | | | 1.75 | | | | 5,371 | | | | 2.16 | | | | 6,004 | | | | 2.57 | | | | 5,909 | | | | 2.74 | |
| | | | | | | | | | | | | | | | | | | | | | | | | | | | | | | |
| | | | | | | | | | | | | | | | | | | | | | | | | | | | | | | | | | | | | | | | | |
Total loans | | | 321,575 | | | | 100.00 | | | | 309,446 | | | | 99.99 | | | | 249,191 | | | | 100.00 | % | | | 234,055 | | | | 100.00 | % | | | 215,653 | | | | 100.00 | % |
| | | | | | | | | | | | | | | | | | | | | | | | | | | | | | | | | | | |
Less: | | | | | | | | | | | | | | | | | | | | | | | | | | | | | | | | | | | | | | | | |
Allowance for loan losses | | | 3,557 | | | | | | | | 3,299 | | | | | | | | 2,849 | | | | | | | | 2,841 | | | | | | | | 2,623 | | | | | |
| | | | | | | | | | | | | | | | | | | | | | | | | | | | | | | | | | | | |
| | | | | | | | | | | | | | | | | | | | | | | | | | | | | | | | | | | | | | | | | |
Net loans | | $ | 318,019 | | | | | | | $ | 306,147 | | | | | | | $ | 246,342 | | | | | | | $ | 231,214 | | | | | | | $ | 213,030 | | | | | |
| | | | | | | | | | | | | | | | | | | | | | | | | | | | | | | | | | | | |
The following table presents maturity information for the loan portfolio at December 31, 2008. The table does not include prepayments or scheduled principal repayments. All loans are shown as maturing based on contractual maturities.
| | | | | | | | | | | | | | | | | | | | | | | | | |
| | | Loan Portfolio Maturity at December 31,2008 | |
| | | Commercial | | | | | | | | | | | | | | | | | |
| | | and | | | Real Estate | | | Mortgage | | | Consumer | | | | |
| (Dollars in thousands) | | Industrial | | | Construction | | | Residential | | | Commercial | | | Installment | | | Total | |
| Amount due: | | | | | | | | | | | | | | | | | | | | | | | | |
| In one year or less | | $ | 15,435 | | | $ | 2,978 | | | $ | 1,588 | | | $ | 868 | | | $ | 1,274 | | | $ | 22,143 | |
| After one year through five years | | | 15,306 | | | | 1,443 | | | | 9,599 | | | | 6,132 | | | | 3,447 | | | | 35,927 | |
| After five years | | | 35,783 | | | | 3,544 | | | | 188,167 | | | | 35,789 | | | | 222 | | | | 263,505 | |
| | | | | | | | | | | | | | | | | | | |
| | | | | | | | | | | | | | | | | | | | | | | | | |
| Total amount due | | $ | 66,524 | | | $ | 7,965 | | | $ | 199,354 | | | $ | 42,789 | | | $ | 4,943 | | | $ | 321,575 | |
| | | | | | | | | | | | | | | | | | | |
Loans due on demand and overdrafts are included in the amount due in one year or less. The Company has no loans without a stated schedule of repayment or a stated maturity.
The following table shows the dollar amount of all loans due after December 31, 2008 that have pre-determined interest rates and the dollar amount of all loans due after December 31, 2008 that have floating or adjustable rates.
| | | | | | | | | | | | | |
| | | Fixed | | | Adjustable | | | | |
| (Dollars in thousands) | | Rate | | | Rate | | | Total | |
| Commercial and industrial | | $ | 27,231 | | | $ | 39,293 | | | $ | 66,524 | |
| Real estate construction | | | 1,905 | | | | 6,060 | | | | 7,965 | |
| Mortgage: | | | | | | | | | | | | |
| Residential | | | 27,680 | | | | 171,674 | | | | 199,354 | |
| Commercial | | | 7,567 | | | | 35,222 | | | | 42,789 | |
| Consumer installment | | | 4,938 | | | | 5 | | | | 4,943 | |
| | | | | | | | | | |
| | | | | | | | | | | | | |
| | | $ | 69,321 | | | $ | 252,254 | | | $ | 321,575 | |
| | | | | | | | | | |
3
Residential Mortgage Loans.A significant portion of the Company’s lending consists of origination of conventional loans secured by 1-4 family real estate located in Franklin, Geauga, Portage, Trumbull, and Ashtabula Counties. These loans approximated $199 million or 62.0% of the Company’s total loan portfolio at December 31, 2008.
The Company makes loans of up to 80% of the value of the real estate and improvements securing a loan (the “loan-to-value” or “LTV” ratio) on 1-4 family real estate. The Company generally does not lend in excess of 80% of the appraised value or sales price (whichever is less) of the property unless additional collateral is obtained, thereby lowering the total LTV. The Company offers residential real estate loans with terms of up to 30 years.
Before 1996, nearly all residential mortgage loans originated by the Company were written on a balloon-note basis. During 1996, the Company began to originate fixed-rate mortgage loans for maturities up to 20 years. In late 1998, the Company began originating adjustable-rate mortgage loans and de-emphasized balloon-note mortgages. Approximately 86.1% of the portfolio of conventional mortgage loans secured by 1-4 family real estate at December 31, 2008 was adjustable rate. The Company’s mortgage loans are ordinarily retained in the loan portfolio. The Company’s residential mortgage loans have not been originated with loan documentation that would permit their sale to Fannie Mae and Freddie Mac.
The Company’s home equity loan policy generally allows for a loan of up to 85% of a property’s appraised value, less the principal balance of the outstanding first mortgage loan. The Company’s home equity loans generally have terms of 10 years.
At December 31, 2008, residential mortgage loans of approximately $4.9 million were over 90 days delinquent or non-accruing on that date, representing 2.50% of the residential mortgage loan portfolio.
Commercial and Industrial Loans and Commercial Real Estate Loans.The Company’s commercial loan services include —
| • | | accounts receivable, inventory and working capital loans |
| |
| • | | renewable operating lines of credit |
| |
| • | | loans to finance capital equipment |
| |
| • | | term business loans |
| |
| • | | short-term notes |
| • | | selected guaranteed or subsidized loan programs for small businesses |
| • | | commercial real estate loans |
Commercial real estate loans include commercial properties occupied by the proprietor of the business conducted on the premises, and income-producing or farm properties. Although the Company makes agricultural loans, it currently does not have a significant amount of agricultural loans. The primary risk of commercial real estate loans is loss of income of the owner or occupier of the property and the inability of the market to sustain rent levels. Although commercial and commercial real estate loans generally bear somewhat more risk than single-family residential mortgage loans, commercial and commercial real estate loans tend to be higher yielding, tend to have shorter terms and commonly provide for interest-rate adjustments as prevailing rates change. Accordingly, commercial and commercial real estate loans enhance a lender’s interest rate risk management and, in management’s opinion, promote more rapid asset and income growth than a loan portfolio comprised strictly of residential real estate mortgage loans.
Although a risk of nonpayment exists for all loans, certain specific types of risks are associated with various kinds of loans. One of the primary risks associated with commercial loans is the possibility that the commercial borrower will not generate income sufficient to repay the loan. The Company’s loan policy provides that commercial loan applications must be supported by documentation indicating that there will be cash flow sufficient for the borrower to service the proposed loan. Financial statements or tax returns for at least three years must be submitted, and annual reviews are undertaken for loans of $150,000 or more. The fair market value of collateral for collateralized commercial loans must exceed the Company’s loan exposure. For this purpose fair market value is determined by independent appraisal or by the loan officer’s estimate employing guidelines established by the loan policy. Term loans not secured by real estate generally have terms of five years or less, unless guaranteed by the U.S. Small Business Administration or other governmental agency, and terms loans secured by collateral having a useful life exceeding five years may have longer terms. The Company’s loan policy allows for terms of up to 15 years for loans secured by commercial real estate, and one year for business lines of credit. The maximum loan-to-value ratio for commercial real estate loans is 75% of the appraised value or cost, whichever is less.
Real estate is commonly a material component of collateral for the Company’s loans, including commercial loans. Although the expected source of repayment of these loans is generally the operations of the borrower’s business or personal income, real estate collateral provides an additional measure of security. Risks associated with loans secured by real estate include fluctuating land values, changing local economic conditions, changes in tax policies, and a concentration of loans within a limited geographic area.
At December 31, 2008, commercial and commercial real estate loans totaled $109.3 million, or 34.0% of the Company’s total loan portfolio. At December 31, 2008, commercial and commercial real estate loans of approximately $3.1 million were over 90 days delinquent or non-accruing on that date, and represented 2.80% of the commercial and commercial real estate loan portfolios.
Real Estate Construction. The Company originates several different types of loans that it categorizes as construction loans, including —
| | • | | residential construction loans to borrowers who will occupy the premises upon completion of construction, |
| |
| | • | | residential construction loans to builders, |
| |
| | • | | commercial construction loans, and |
| |
| | • | | real estate acquisition and development loans. |
4
Because of the complex nature of construction lending, these loans are generally recognized as having a higher degree of risk than other forms of real estate lending. The Company’s fixed-rate and adjustable-rate construction loans do not provide for the same interest rate terms on the construction loan and on the permanent mortgage loan that follows completion of the construction phase of the loan. It is the norm for the Company to make residential construction loans without an existing written commitment for permanent financing. The Company’s loan policy provides that the Company may make construction loans with terms of up to one year, with a maximum loan-to-value ratio for residential construction of 80%.
At December 31, 2008, real estate construction loans totaled $8.0 million, or 2.5% of the Company’s total loan portfolio. At December 31, 2008, real estate-construction loans of approximately $469,000 were over 90 days delinquent or non-accruing on that date, and represented 5.9% of the real estate-construction loan portfolios.
Consumer Installment Loans.The Company’s consumer installment loans include secured and unsecured loans to individual borrowers for a variety of purposes, including personal, home improvement, revolving credit lines, autos, boats, and recreational vehicles. The Company does not currently do any indirect lending. Unsecured consumer loans carry significantly higher interest rates than secured loans. The Company maintains a higher loan loss allowance for consumer loans, while maintaining strict credit guidelines when considering consumer loan applications.
According to the Company’s loan policy, consumer loans secured by collateral other than real estate generally may have terms of up to five years, and unsecured consumer loans may have terms up to two and one-half years. Real estate security generally is required for consumer loans having terms exceeding five years.
At December 31, 2008, the Company had approximately $5.0 million in its consumer installment loan portfolio, representing 1.5% of total loans. Consumer installment loans of approximately $10,000 were over 90 days delinquent or non-accruing on that date, representing 0.2% of the installment loan portfolio.
Loan Solicitation and Processing.Loan originations are developed from a number of sources, including continuing business with depositors, other borrowers and real estate builders, solicitations by Company personnel and walk-in customers.
When a loan request is made, the Company reviews the application, credit bureau reports, property appraisals or evaluations, financial information, verifications of income, and other documentation concerning the creditworthiness of the borrower, as applicable to each loan type. The Company’s underwriting guidelines are set by senior management and approved by the board. The loan policy specifies each individual officer’s loan approval authority. Loans exceeding an individual officer’s approval authority are submitted to a committee consisting of loan officers, which has authority to approve loans up to $500,000. The full board acts as a loan committee for loans exceeding that amount.
Income from Lending Activities.The Company earns interest and fee income from its lending activities. Net of origination costs, loan origination fees are amortized over the life of a loan. The Company also receives loan fees related to existing loans, including late charges. Income from loan origination and commitment fees and discounts varies with the volume and type of loans and commitments made and with competitive and economic conditions. Note 1 to the Consolidated Financial Statements included herein contains a discussion of the manner in which loan fees and income are recognized for financial reporting purposes.
Nonperforming Loans. Late charges on residential mortgages and consumer loans are assessed if a payment is not received by the due date plus a grace period. When an advanced stage of delinquency appears on a single-family loan and if repayment cannot be expected within a reasonable time or a repayment agreement is not entered into, a required notice of foreclosure or repossession proceedings may be prepared by the Company’s attorney and delivered to the borrower so that foreclosure proceedings may be initiated promptly, if necessary. The Company also collects late charges on commercial loans.
When the Company acquires real estate through foreclosure, voluntary deed, or similar means, it is classified as other real estate owned until it is sold. When property is acquired in this manner, it is recorded at the lower of cost (the unpaid principal balance at the date of acquisition) or fair value. Any subsequent write-down is charged to expense. All costs incurred from the date of acquisition to maintain the property are expensed. “Other real estate owned” is appraised during the foreclosure process, before acquisition. Losses are recognized for the amount by which the book value of the related mortgage loan exceeds the estimated net realizable value of the property.
The Company undertakes regular review of the loan portfolio to assess its risks, particularly the risks associated with the commercial loan portfolio. This includes annual review of every commercial loan representing credit exposure of $150,000 or more. An independent firm performs semi-annual loan reviews for the Company.
Classified Assets.FDIC regulations governing classification of assets require nonmember commercial banks — including the Company — to classify their own assets and to establish appropriate general and specific allowances for losses, subject to FDIC review. The regulations are designed to encourage management to evaluate assets on a case-by-case basis, discouraging automatic classifications. Under this classification system, problem assets of insured institutions are classified as “substandard,” “doubtful,” or “loss.” An asset is considered “substandard” if it is inadequately protected by the current net worth and paying capacity of the obligor or of the collateral pledged, if any. Substandard assets include those characterized by the distinct possibility that the insured institution will sustain some loss if the deficiencies are not corrected. Assets classified as “doubtful” have all the weaknesses inherent in those classified substandard, with the added characteristic that the weaknesses make collection of principal in full — on the basis of currently existing facts, conditions, and values — highly questionable and improbable. Assets classified as “loss” are those considered uncollectible and of such little value that their continuance as assets without the establishment of a specific loss reserve is not warranted. Assets that do not expose the Company to risk sufficient to warrant classification in one of the above categories, but that possess some weakness, are required to be designated “special mention” by management.
5
When an insured institution classifies assets as either “substandard” or “doubtful,” it may establish allowances for loan losses in an amount deemed prudent by management. When an insured institution classifies assets as “loss,” it is required either to establish an allowance for losses equal to 100% of that portion of the assets so classified or to charge off that amount. An FDIC-insured institution’s determination about classification of its assets and the amount of its allowances is subject to review by the FDIC, which may order the establishment of additional loss allowances. Management also employs an independent third party to semi-annually review and validate the internal loan review process and loan classifications. As of December 31, 2008, 2007, 2006, 2005, and 2004 classified assets were as follows:
| | | | | | | | | | | | | | | | | | | | | | | | | | | | | | | | | | | | | | | | | |
| | | Classified Assets at December 31, | |
| | | 2008 | | | 2007 | | | 2006 | | | 2005 | | | 2004 | |
| | | | | | | Percent of | | | | | | | Percent of | | | | | | | Percent of | | | | | | | Percent of | | | | | | | Percent of | |
| (Dollars in thousands) | | Amount | | | total loans | | | Amount | | | total loans | | | Amount | | | total loans | | | Amount | | | total loans | | | Amount | | | total loans | |
| | | | | | | | | | | | | | | | | | | | | | | | | | | | | | | | | | | | | | | | | |
| Classified loans: | | | | | | | | | | | | | | | | | | | | | | | | | | | | | | | | | | | | | | | | |
| Special mention | | $ | 5,134 | | | | 1.60 | % | | $ | 5,302 | | | | 1.71 | % | | $ | 7,394 | | | | 2.97 | % | | $ | 6,567 | | | | 2.81 | % | | $ | 4,094 | | | | 1.90 | % |
| Substandard | | | 5,350 | | | | 1.66 | % | | | 1,029 | | | | 0.33 | % | | | 1,515 | | | | 0.61 | % | | | 2,020 | | | | 0.86 | % | | | 3,097 | | | | 1.44 | % |
| Doubtful | | | 420 | | | | 0.13 | % | | | 835 | | | | 0.27 | % | | | — | | | | — | | | | — | | | | 0.00 | % | | | 163 | | | | 0.08 | % |
| Loss | | | — | | | | — | | | | — | | | | — | | | | — | | | | — | | | | — | | | | — | | | | — | | | | — | |
| | | | | | | | | | | | | | | | | | | | | | | | | | | | | | | |
| | | | | | | | | | | | | | | | | | | | | | | | | | | | | | | | | | | | | | | | | |
| Total amount due | | $ | 10,904 | | | | 3.39 | % | | $ | 7,166 | | | | 2.31 | % | | $ | 8,909 | | | | 3.58 | % | | $ | 8,587 | | | | 3.67 | % | | $ | 7,354 | | | | 3.42 | % |
| | | | | | | | | | | | | | | | | | | | | | | | | | | | | | | |
Other than those disclosed above, the Company does not believe there are any loans classified for regulatory purposes as loss, doubtful, substandard, special mention or otherwise, which will result in losses or have a material impact on future operations, liquidity or capital reserves are not aware of any other information that causes us to have serious doubts as to the ability of borrowers in general to comply with repayment terms.
Investments.Investment securities provide a return on residual funds after lending activities. Investments may be in federal funds sold, corporate securities, U.S. Government and agency obligations, state and local government obligations and government-guaranteed, mortgage-backed securities. The Company generally does not invest in securities that are rated less than investment grade by a nationally recognized statistical rating organization. Ohio bank law prescribes the kinds of investments an Ohio-chartered bank may make. Permitted investments include local, state, and federal government securities, mortgage-backed securities, and securities of federal government agencies. An Ohio-chartered bank also may invest up to 10% of its assets in corporate debt and equity securities, or a higher percentage in certain circumstances. Similar to the legal lending limit on loans to any one borrower, Ohio bank law also limits to 15% of capital the amount an Ohio-chartered bank may invest in the securities of any one issuer, other than local, state, and federal government and federal government agency issuers and mortgage-backed securities issuers. These Ohio bank law provisions have not been a material constraint upon the Company’s investment activities.
All securities-related activity is reported to the Company’s board of directors. General changes in investment strategy are required to be reviewed and approved by the board. Senior management can purchase and sell securities in accordance with the Company’s stated investment policy.
Management determines the appropriate classification of securities at the time of purchase. If management has the intent and the Company has the ability at the time of purchase to hold a security until maturity or on a long-term basis, the security is classified as held-to-maturity and is reflected on the Consolidated Balance Sheet at historical cost. Securities to be held for indefinite periods and not intended to be held to maturity or on a long-term basis are classified as available-for-sale. Available-for-sale securities are reflected on the balance sheet at their fair value.
6
The following table sets forth the amortized cost and fair value of the Company’s investment portfolio at the dates indicated.
| | | | | | | | | | | | | | | | | | | | | | | | | |
| | | Investment Portfolio Amortized Cost and Fair Value at December 31, | |
| | | 2008 | | | 2007 | | | 2006 | |
| | | Amortized | | | | | | | Amortized | | | | | | | Amortized | | | | |
| (Dollars in thousands) | | cost | | | Fair value | | | cost | | | Fair value | | | cost | | | Fair value | |
| | | | | | | | | | | | | | | | | | | | | | | | | |
Available for Sale: | | | | | | | | | | | | | | | | | | | | | | | | |
| U.S. Government agency securities | | $ | 4,377 | | | $ | 4,504 | | | $ | 7,873 | | | $ | 7,927 | | | $ | 7,253 | | | $ | 7,145 | |
| | | | | | | | | | | | | | | | | | | | | | | | | |
| Obligations of states and political subdivisions: | | | | | | | | | | | | | | | | | | | | | | | | |
| Taxable | | | 500 | | | | 496 | | | | 749 | | | | 742 | | | | 748 | | | | 727 | |
| Tax-exempt | | | 44,328 | | | | 43,684 | | | | 47,263 | | | | 46,929 | | | | 38,182 | | | | 37,968 | |
| Corporate securities | | | — | | | | — | | | | — | | | | — | | | | — | | | | — | |
| Mortgage-backed securities | | | 54,568 | | | | 54,564 | | | | 29,219 | | | | 29,046 | | | | 16,959 | | | | 16,469 | |
| Equity securities | | | 944 | | | | 1,022 | | | | 944 | | | | 1,324 | | | | 694 | | | | 739 | |
| | | | | | | | | | | | | | | | | | | |
| | | | | | | | | | | | | | | | | | | | | | | | | |
| Total | | $ | 104,717 | | | $ | 104,270 | | | $ | 86,048 | | | $ | 85,968 | | | $ | 63,836 | | | $ | 63,048 | |
| | | | | | | | | | | | | | | | | | | |
| | | | | | | | | | | | | | | | | | | | | | | | | |
Held to Maturity: | | | | | | | | | | | | | | | | | | | | | | | | |
| Obligations of states and political subdivisions: | | $ | — | | | $ | — | | | $ | — | | | $ | — | | | $ | 126 | | | $ | 134 | |
| | | | | | | | | | | | | | | | | | | | | | | | | |
| Total | | $ | — | | | $ | — | | | $ | — | | | $ | — | | | $ | 126 | | | $ | 134 | |
| | | | | | | | | | | | | | | | | | | |
| | | | | | | | | | | | | | | | | | | | | | | | | |
Total Investment Securities | | $ | 104,717 | | | $ | 104,270 | | | $ | 86,048 | | | $ | 85,968 | | | $ | 63,962 | | | $ | 63,182 | |
| | | | | | | | | | | | | | | | | | | |
The contractual maturity of investment securities at December 31, 2008 is shown below.
| | | | | | | | | | | | | | | | | | | | | | | | | | | | | | | | | | | | | | | | | | | | | |
| | | 31-Dec-08 | |
| | | | | | | | | | | More than one to | | | More than five to | | | | | | | | | | | Total investment securities and | |
| | | One year or less | | | five years | | | ten years | | | More than ten years | | | mortgage-backed securities | |
| | | Amortized | | | Average | | | Amortized | | | Average | | | Amortized | | | Average | | | Amortized | | | Average | | | Amortized | | | Average | | | Market | |
| | | cost | | | yield | | | cost | | | yield | | | cost | | | yield | | | cost | | | yield | | | cost | | | yield | | | value | |
| U.S. Government agency securities | | $ | 602 | | | | 4.65 | | | $ | — | | | | — | | | $ | 500 | | | | 5.00 | | | $ | 3,274 | | | | 5.56 | | | $ | 4,377 | | | | 5.37 | | | $ | 4,504 | |
| | | | | | | | | | | | | | | | | | | | | | | | | | | | | | | | | | | | | | | | | | | | | |
| Obligations of states and political subdivisions: | | | | | | | | | | | | | | | | | | | | | | | | | | | | | | | | | | | | | | | | | | | | |
| Taxable | | | — | | | | — | | | | 500 | | | | 4.20 | | | | — | | | | — | | | | — | | | | — | | | | 500 | | | | 3.83 | | | | 496 | |
| Tax-exempt | | | 558 | | | | 5.46 | | | | 4,543 | | | | 5.49 | | | | 10,069 | | | | 5.84 | | | | 29,158 | | | | 6.23 | | | | 44,328 | | | | 6.05 | | | | 43,684 | |
| Mortgage-backed securities | | | 84 | | | | 3.83 | | | | 596 | | | | 4.12 | | | | 2,195 | | | | 5.59 | | | | 51,694 | | | | 5.79 | | | | 54,568 | | | | 5.76 | | | | 54,564 | |
| Equity Securities | | | 944 | | | | — | | | | — | | | | — | | | | — | | | | — | | | | — | | | | — | | | | 944 | | | | — | | | | 1,022 | |
| | | | | | | | | | | | | | | | | | | | | | | | | | | | | | | | | | |
| | | | | | | | | | | | | | | | | | | | | | | | | | | | | | | | | | | | | | | | | | | | | |
| Total | | $ | 2,188 | | | | 2.82 | % | | $ | 5,639 | | | | 5.23 | % | | $ | 12,764 | | | | 5.76 | % | | $ | 84,126 | | | | 5.93 | % | | $ | 104,717 | | | | 5.81 | % | | $ | 104,270 | |
| | | | | | | | | | | | | | | | | | | | | | | | | | | | | | | | | | |
7
Expected maturities of investment securities could differ from contractual maturities because the borrower, or issuer, could have the right to call or prepay obligations with or without call or prepayment penalties. The average yields in the above table are not calculated on a tax equivalent basis.
As of December 31, 2008, the Company also held 18,730 shares of $100 par value Federal Home Loan Bank of Cincinnati stock, which is a restricted security. FHLB stock represents an equity interest in the FHLB, but it does not have a readily determinable market value. The stock can be sold at its par value only, and only to the FHLB or to another member institution. Member institutions are required to maintain a minimum stock investment in the FHLB, based on total assets, total mortgages, and total mortgage-backed securities. The Company’s minimum investment in FHLB stock at December 31, 2008 was approximately $1,873,000.
Sources of Funds—Deposit Accounts. Deposit accounts are a major source of funds for the Company. The Company offers a number of deposit products to attract both commercial and regular consumer checking and savings customers, including regular and money market savings accounts, NOW accounts, and a variety of fixed-maturity, fixed-rate certificates with maturities ranging from seven days to 60 months. These accounts earn interest at rates established by management based on competitive market factors and management’s desire to increase certain types or maturities of deposit liabilities. The Company also provides travelers’ checks, official checks, money orders, ATM services, and IRA accounts.
The following table shows the amount of time deposits of $100,000 or more as of December 31, 2008, including certificates of deposit, by time remaining until maturity.
| | | | | | | | | |
| | | Maturity of Time Deposits of | |
| | | $100,000 or more at | |
| | | December 31, 2008 | |
| | | Amount | | | Percent of Total | |
| |
| Within three months | | $ | 11,084,068 | | | | 15.91 | % |
| Beyond three but within six months | | | 15,137,052 | | | | 21.73 | |
| Beyond six but within twelve months | | | 18,782,587 | | | | 26.96 | |
| Beyond one year | | | 24,659,571 | | | | 35.40 | |
| | | | | | | |
| | | | | | | | | |
| Total | | $ | 69,663,278 | | | | 100.00 | |
| | | | | | | |
Borrowings. Deposits and repayment of loan principal are the Company’s primary sources of funds for lending activities and other general business purposes. However, when the supply of lendable funds or funds available for general business purposes cannot satisfy the demand for loans or general business purposes, the Company can obtain funds from the FHLB of Cincinnati. Interest and principal are payable monthly, and the line of credit is secured by a blanket pledge collateral agreement. At December 31, 2008, the Company had $25.7 million of FHLB borrowings outstanding. The Company also has access to credit through the Federal Reserve Bank of Cleveland and other funding sources.
The outstanding balances and related information about short-term borrowings, which includes securities sold under agreements to repurchase and Federal Funds Sold are summarized as follows:
| | | | | | | | | | | | | |
| | | 2008 | | | 2007 | | | 2006 | |
| | | | | | | | | | | | | |
| Balance at year-end | | $ | 1,886,253 | | | $ | 1,510,607 | | | | 1,609,738 | |
| Average balance outstanding | | | 2,967,069 | | | | 2,383,902 | | | | 3,281,340 | |
| Maximum month-end balance | | | 6,057,893 | | | | 5,768,057 | | | | 8,245,406 | |
| Weighted-average rate at year-end | | | 1.10 | % | | | 2.96 | % | | | 4.35 | % |
| Weighted-average rate during the year | | | 1.55 | % | | | 3.89 | % | | | 5.10 | % |
Personnel
As of December 31, 2008 the Company had 101 full-time equivalent employees. None of the employees is represented by a collective bargaining group. Management considers its relations with employees to be excellent.
Supervision and Regulation
The following discussion of bank supervision and regulation is qualified in its entirety by reference to the statutory and regulatory provisions discussed. Changes in applicable law or in the policies of various regulatory authorities could affect materially the business and prospects of the Company.
The Company is a bank holding company within the meaning of the Bank Holding Company Act of 1956. As such, the Company is subject to regulation, supervision, and examination by the Board of Governors of the Federal Reserve System, acting primarily through the Federal Reserve Bank of Cleveland. The Company is required to file annual reports and other information with the Federal Reserve. Both subsidiaries are Ohio-chartered commercial banks. As a state-chartered, nonmember banks, the banks are primarily regulated by the FDIC and by the Ohio Division of Financial Institutions.
8
The Company and the banks are subject to federal banking laws, and the Company is also subject also to Ohio bank law. These federal and state laws are intended to protect depositors, not stockholders. Federal and state laws applicable to holding companies and their financial institution subsidiaries regulate the range of permissible business activities, investments, reserves against deposits, capital levels, lending activities and practices, the nature and amount of collateral for loans, establishment of branches, mergers, dividends, and a variety of other important matters. The Company is subject to detailed, complex, and sometimes overlapping federal and state statutes and regulations affecting routine banking operations. These statutes and regulations include but are not limited to state usury and consumer credit laws, the Truth-in-Lending Act and Regulation Z, the Equal Credit Opportunity Act and Regulation B, the Fair Credit Reporting Act, the Truth in Savings Act, and the Community Reinvestment Act. The Company must comply with Federal Reserve Board regulations requiring depository institutions to maintain reserves against their transaction accounts (principally NOW and regular checking accounts). Because required reserves are commonly maintained in the form of vault cash or in a noninterest-bearing account (or pass-through account) at a Federal Reserve Bank, the effect of the reserve requirement is to reduce an institution’s earning assets.
The Federal Deposit Insurance Corporation Improvement Act of 1991 expanded significantly the authority of federal agencies to regulate the activities of federally chartered and state-chartered financial institutions and their holding companies. The Federal Reserve Board and the FDIC have extensive authority to prevent and to remedy unsafe and unsound practices and violations of applicable laws and regulations by institutions and holding companies. The agencies may assess civil money penalties, issue cease-and-desist or removal orders, seek injunctions, and publicly disclose those actions. In addition, the Ohio Division of Financial Institutions possesses enforcement powers to address violations of Ohio banking law by Ohio-chartered banks.
Regulation of Bank Holding Companies—Bank and Bank Holding Company Acquisitions. The Bank Holding Company Act requires every bank holding company to obtain approval of the Federal Reserve before —
| | • | | directly or indirectly acquiring ownership or control of any voting shares of another bank or bank holding company, if after the acquisition the acquiring company would own or control more than 5% of the shares of the other bank or bank holding company (unless the acquiring company already owns or controls a majority of the shares), |
| |
| | • | | acquiring all or substantially all of the assets of another bank, or |
| |
| | • | | merging or consolidating with another bank holding company. |
The Federal Reserve will not approve an acquisition, merger, or consolidation that would have a substantially anticompetitive result, unless the anticompetitive effects of the proposed transaction are clearly outweighed by a greater public interest in satisfying the convenience and needs of the community to be served. The Federal Reserve also considers capital adequacy and other financial and managerial factors in its review of acquisitions and mergers.
Additionally, the Bank Holding Company Act, the Change in Bank Control Act and the Federal Reserve Board’s Regulation Y require advance approval of the Federal Reserve to acquire “control” of a bank holding company. Control is conclusively presumed to exist if an individual or company acquires 25% or more of a class of voting securities of the bank holding company. If the holding company has securities registered under Section 12 of the Securities Exchange Act of 1934, as the Company does, or if no other person owns a greater percentage of the class of voting securities, control is presumed to exist if a person acquires 10% or more, but less than 25%, of any class of voting securities. Approval of the Ohio Division of Financial Institutions is also necessary to acquire control of an Ohio-chartered bank.
Nonbanking Activities. With some exceptions, the Bank Holding Company Act has for many years also prohibited a bank holding company from acquiring or retaining direct or indirect ownership or control of more than 5% of the voting shares of any company that is not a bank or bank holding company, or from engaging directly or indirectly in activities other than those of banking, managing or controlling banks, or providing services for its subsidiaries. The principal exceptions to these prohibitions involve non-bank activities that, by statute or by Federal Reserve Board regulation or order, are held to be closely related to the business of banking or of managing or controlling banks. In making its determination that a particular activity is closely related to the business of banking, the Federal Reserve considers whether the performance of the activities by a bank holding company can be expected to produce benefits to the public — such as greater convenience, increased competition, or gains in efficiency in resources — that will outweigh the risks of possible adverse effects such as decreased or unfair competition, conflicts of interest, or unsound banking practices. Some of the activities determined by Federal Reserve Board regulation to be closely related to the business of banking are: making or servicing loans or leases; engaging in insurance and discount brokerage activities; owning thrift institutions; performing data processing services; acting as a fiduciary or investment or financial advisor; and making investments in corporations or projects designed primarily to promote community welfare.
Financial Holding Companies. On November 12, 1999 the Gramm-Leach-Bliley Act became law, repealing much of the 1933 Glass-Steagall Act’s separation of the commercial and investment banking industries. The Gramm-Leach-Bliley Act expands the range of nonbanking activities a bank holding company may engage in, while preserving existing authority for bank holding companies to engage in activities that are closely related to banking. The new legislation creates a new category of holding company called a “financial holding company.” Financial holding companies may engage in any activity that is —
| | • | | financial in nature or incidental to that financial activity, or |
| |
| | • | | complementary to a financial activity and that does not pose a substantial risk to the safety and soundness of depository institutions or the financial system generally. |
9
Activities that are financial in nature include —
| | • | | acting as principal, agent, or broker for insurance, |
| |
| | • | | underwriting, dealing in, or making a market in securities, and |
| |
| | • | | providing financial and investment advice. |
The Federal Reserve Board and the Secretary of the Treasury have authority to decide that other activities are also financial in nature or incidental to financial activity, taking into account changes in technology, changes in the banking marketplace, competition for banking services, and so on. The Company is engaged solely in activities that were permissible for a bank holding company before enactment of the Gramm-Leach-Bliley Act. Although the Company has become a financial holding company, the Company has no immediate plans to use the expanded authority to engage in activities other than those in which it is currently engaged. Federal Reserve Board rules require that all of the depository institution subsidiaries of a financial holding company be and remain well capitalized and well managed. If all depository institution subsidiaries of a financial holding company do not remain well capitalized and well managed, the financial holding company must enter into an agreement acceptable to the Federal Reserve Board, undertaking to comply with all capital and management requirements within 180 days. In the meantime the financial holding company may not use its expanded authority to engage in nonbanking activities without Federal Reserve Board approval and the Federal Reserve may impose other limitations on the holding company’s or affiliates’ activities. If a financial holding company fails to restore the well-capitalized and well-managed status of a depository institution subsidiary, the Federal Reserve may order divestiture of the subsidiary.
Holding Company Capital and Source of Strength. The Federal Reserve considers the adequacy of a bank holding company’s capital on essentially the same risk-adjusted basis as capital adequacy is determined by the FDIC at the bank subsidiary level. In general, bank holding companies are required to maintain a minimum ratio of total capital to risk-weighted assets of 8% and Tier 1 capital — consisting principally of stockholders’ equity — of at least 4%. Bank holding companies are also subject to a leverage ratio requirement. The minimum required leverage ratio for the very highest rated companies is 3%, but as a practical matter the minimum required leverage ratio for most bank holding companies is 4% or higher. It is also Federal Reserve Board policy that bank holding companies serve as a source of strength for their subsidiary banking institutions.
Under Bank Holding Company Act section 5(e), the Federal Reserve Board may require a bank holding company to terminate any activity or relinquish control of a nonbank subsidiary if the Federal Reserve Board determines that the activity or control constitutes a serious risk to the financial safety, soundness or stability of a subsidiary bank. And with the Federal Deposit Insurance Corporation Improvement Act of 1991’s addition of the prompt corrective action provisions to the Federal Deposit Insurance Act, section 38(f)(2)(I) of the Federal Deposit Insurance Act now provides that a federal bank regulatory authority may require a bank holding company to divest itself of an undercapitalized bank subsidiary if the agency determines that divestiture will improve the bank’s financial condition and prospects.
Liability of Commonly Controlled Institutions.Adding subsection (e) to section 5 of the Federal Deposit Insurance Act, the Financial Institutions Reform, Recovery, and Enforcement Act of 1989 allows the FDIC to demand from one institution payment for losses incurred or to be incurred by the FDIC because of the default of another institution or because of assistance provided by the FDIC to the other institution in danger of default, if the institutions are commonly controlled.
Federal Deposit Insurance. The FDIC insures deposits of banks, savings banks, and savings associations, and it safeguards the safety and soundness of the banking industry. Two separate insurance funds are maintained and administered by the FDIC. In general, bank deposits are insured through the Bank Insurance Fund. Deposits in savings associations are insured through the Savings Association Insurance Fund.
As an FDIC member institution, deposits in the bank are insured to a maximum of $250,000 per depositor. The banks are required to pay semiannual deposit insurance premium assessments to the FDIC. In general terms, each institution is assessed insurance premiums according to how much risk to the insurance fund the institution represents. Well-capitalized institutions with few supervisory concerns are assessed lower premiums than other institutions. The premium range is currently from $0.00 for the highest-rated institutions to $0.27 per $100 of domestic deposits.
The FDIC may terminate the deposit insurance of any insured depository institution if the FDIC determines that the institution has engaged or is engaging in unsafe or unsound practices, is in an unsafe or unsound condition to continue operations, or has violated any applicable law, regulation, order, or any condition imposed in writing by, or written agreement with, the FDIC. The FDIC also may suspend deposit insurance temporarily during the hearing process for a permanent termination of insurance if the institution has no tangible capital.
Interstate Banking and Branching. In 1994 the Riegle-Neal Interstate Banking and Branching Efficiency Act eased restrictions on interstate banking. The Riegle-Neal Act allows the Federal Reserve to approve an application by an adequately capitalized and adequately managed bank holding company to acquire a bank located in a state other than the acquiring company’s home state, without regard to whether the transaction is prohibited by the laws of any state. The Federal Reserve may not approve acquisition of a bank that has not been in existence for the minimum time period (up to five years) specified by the statutory law of the acquired, or “target,” bank’s state. The Riegle-Neal Act also prohibits the Federal Reserve from approving an application if the applicant (and its depository institution affiliates) controls or would control more than 10% of the insured deposits in the United States or 30% or more of the deposits in the target bank’s home state or in any state in which the target bank maintains a branch. The Riegle-Neal Act does not affect the authority of states to limit the percentage of total insured deposits in the state that may be held or controlled by a bank or bank holding company if the limitation does not discriminate against out-of-state banks or bank holding companies. Individual states may also waive the 30% statewide concentration limit contained in the Riegle-Neal Act.
10
Branching between states may be accomplished by merging commonly controlled banks located in different states into one legal entity. Branching may also be accomplished by establishingde novobranches or acquiring branches in another state. Under section 24(j) of the Federal Deposit Insurance Act, a branch of a bank operating out-of-state — in a “host state” — is subject to the law of the host state regarding community reinvestment, fair lending, consumer protection, and establishment of branches. The Riegle-Neal Act authorizes the FDIC to approve interstate branchingde novoby state-chartered banks solely in states that specifically allow it. Ohio bank law allowsde novobranching in Ohio by an out-of-state bank. The FDIC has adopted regulations under the Riegle-Neal Act to prohibit an out-of-state bank from using the new interstate branching authority primarily for the purpose of deposit production. These regulations include guidelines to ensure that interstate branches operated by an out-of-state bank in a host state are reasonably helping to satisfy the credit needs of the communities served by the out-of-state bank.
Capital—Risk-Based Capital Requirements. The Federal Reserve Board and the FDIC employ similar risk-based capital guidelines in their examination and regulation of bank holding companies and financial institutions. If capital falls below the minimum levels established by the guidelines, the bank holding company or bank may be denied approval to acquire or establish additional banks or non-bank businesses or to open new facilities. Failure to satisfy capital guidelines could subject a banking institution to a variety of enforcement actions by federal bank regulatory authorities, including the termination of deposit insurance by the FDIC and a prohibition on the acceptance of “brokered deposits.”
In the calculation of risk-based capital, assets and off-balance sheet items are assigned to broad risk categories, each with an assigned weighting (0%, 20%, 50% and 100%). Most loans are assigned to the 100% risk category, except for first mortgage loans fully secured by residential property, which carry a 50% rating. Most investment securities are assigned to the 20% category, except for municipal or state revenue bonds, which have a 50% risk-weight, and direct obligations of or obligations guaranteed by the United States Treasury or United States Government agencies, which have a 0% risk-weight. Off-balance sheet items are also taken into account in the calculation of risk-based capital, with each class of off-balance sheet item being converted to a balance sheet equivalent according to established “conversion factors.” From these computations, the total of risk-weighted assets is derived. Risk-based capital ratios therefore state capital as a percentage of total risk-weighted assets and off-balance sheet items. The ratios established by guideline are minimums only.
Current risk-based capital guidelines require bank holding companies and banks to maintain a minimum risk-based total capital ratio equal to 8% and a Tier 1 capital ratio of 4%. Intangibles other than readily marketable mortgage servicing rights are generally deducted from capital. Tier 1 capital includes stockholders’ equity, qualifying perpetual preferred stock (within limits and subject to conditions, particularly if the preferred stock is cumulative preferred stock), and minority interests in equity accounts of consolidated subsidiaries, less intangibles, identified losses, investments in securities subsidiaries, and certain other assets. Tier 2 capital includes —
| | • | | the allowance for loan losses, up to a maximum of 1.25% of risk-weighted assets, |
| |
| | • | | any qualifying perpetual preferred stock exceeding the amount includable in Tier 1 capital, |
| |
| | • | | mandatory convertible securities, and |
| |
| | • | | subordinated debt and intermediate term preferred stock, up to 50% of Tier 1 capital. |
The FDIC also employs a market risk component in its calculation of capital requirements for nonmember banks. The market risk component could require additional capital for general or specific market risk of trading portfolios of debt and equity securities and other investments or assets. The FDIC’s evaluation of an institution’s capital adequacy takes account of a variety of other factors as well, including interest rate risks to which the institution is subject, the level and quality of an institution’s earnings, loan and investment portfolio characteristics and risks, risks arising from the conduct of nontraditional activities, and a variety of other factors.
Accordingly, the FDIC’s final supervisory judgment concerning an institution’s capital adequacy could differ significantly from the conclusions that might be derived from the absolute level of an institution’s risk-based capital ratios. Therefore, institutions generally are expected to maintain risk-based capital ratios that exceed the minimum ratios discussed above. This is particularly true for institutions contemplating significant expansion plans and institutions that are subject to high or inordinate levels of risk. Moreover, although the FDIC does not impose explicit capital requirements on holding companies of institutions regulated by the FDIC, the FDIC can take account of the degree of leverage and risks at the holding company level. If the FDIC determines that the holding company (or another affiliate of the institution regulated by the FDIC) has an excessive degree of leverage or is subject to inordinate risks, the FDIC may require the subsidiary institution(s) to maintain additional capital or the FDIC may impose limitations on the subsidiary institution’s ability to support its weaker affiliates or holding company.
The banking agencies have also established a minimum leverage ratio of 3%, which represents Tier 1 capital as a percentage of total assets, less intangibles. However, for bank holding companies and financial institutions seeking to expand and for all but the most highly rated banks and bank holding companies, the banking agencies expect an additional cushion of at least 100 to 200 basis points. At December 31, 2007, the Company was in compliance with all regulatory capital requirements.
11
Prompt Corrective Action. To resolve the problems of undercapitalized institutions and to prevent a recurrence of the banking crisis of the 1980s and early 1990s, the Federal Deposit Insurance Corporation Improvement Act of 1991 established a system known as “prompt corrective action.” Under the prompt corrective action provisions and implementing regulations, every institution is classified into one of five categories, depending on its total risk-based capital ratio, its Tier 1 risk-based capital ratio, its leverage ratio, and subjective factors. The categories are “well capitalized,” “adequately capitalized,” “undercapitalized,” “significantly undercapitalized” and “critically undercapitalized.” A financial institution’s operations can be significantly affected by its capital classification. For example, an institution that is not “well capitalized” generally is prohibited from accepting brokered deposits and offering interest rates on deposits higher than the prevailing rate in its market, and the holding company of any undercapitalized institution must guarantee, in part, aspects of the institution’s capital plan. Financial institution regulatory agencies generally are required to appoint a receiver or conservator shortly after an institution enters the category of weakest capitalization. The Federal Deposit Insurance Corporation Improvement Act of 1991 also authorizes the regulatory agencies to reclassify an institution from one category into a lower category if the institution is in an unsafe or unsound condition or engaging in an unsafe or unsound practice. Undercapitalized institutions are required to take specified actions to increase their capital or otherwise decrease the risks to the federal deposit insurance funds.
The following table illustrates the capital and prompt corrective action guidelines applicable to the Company and its subsidiaries, as well as its total risk-based capital ratio, Tier 1 capital ratio and leverage ratio as of December 31, 2008.
| | | | | | | | | | | | | | | | | |
| | | 2008 | | | 2007 | |
| | | Amount | | | Ratio | | | Amount | | | Ratio | |
| |
| Total Capital | | | | | | | | | | | | | | | | |
| (to Risk-weighted Assets) | | | | | | | | | | | | | | | | |
| | | | | | | | | | | | | | | | | |
| Actual | | $ | 42,281,067 | | | | 13.57 | | | $ | 42,664,943 | | | | 14.56 | |
| For Capital Adequacy Purposes | | | 24,931,715 | | | | 8.00 | | | | 23,441,926 | | | | 8.00 | |
| To Be Well Capitalized | | | 31,164,644 | | | | 10.00 | | | | 29,303,408 | | | | 10.00 | |
| | | | | | | | | | | | | | | | | |
| Tier I Capital | | | | | | | | | | | | | | | | |
| (to Risk-weighted Assets) | | | | | | | | | | | | | | | | |
| | | | | | | | | | | | | | | | | |
| Actual | | $ | 38,689,258 | | | | 12.41 | | | $ | 39,194,767 | | | | 13.38 | |
| For Capital Adequacy Purposes | | | 12,465,858 | | | | 4.00 | | | | 11,720,963 | | | | 4.00 | |
| To Be Well Capitalized | | | 18,698,787 | | | | 6.00 | | | | 17,581,445 | | | | 6.00 | |
| | | | | | | | | | | | | | | | | |
| Tier I Capital | | | | | | | | | | | | | | | | |
| (to Average Assets) | | | | | | | | | | | | | | | | |
| | | | | | | | | | | | | | | | | |
| Actual | | $ | 38,689,258 | | | | 8.66 | | | $ | 39,194,767 | | | | 9.23 | |
| For Capital Adequacy Purposes | | | 17,860,169 | | | | 4.00 | | | | 16,990,099 | | | | 4.00 | |
| To Be Well Capitalized | | | 22,325,211 | | | | 5.00 | | | | 21,237,623 | | | | 5.00 | |
Limits on Dividends and Other Payments. The Company’s ability to obtain funds for the payment of dividends and for other cash requirements depends on the amount of dividends that may be paid to it by the banks. Under Ohio bank law, an Ohio-chartered bank may not pay a cash dividend if the amount of the dividend exceeds “undivided profits,” which is defined in Ohio bank law to mean the cumulative undistributed amount of the bank’s net income. But with the approval of two thirds of the outstanding shares and approval of the superintendent of the Division of Financial Institutions, an Ohio-chartered bank may pay cash dividends from surplus. Lastly, approval of the superintendent is also required if the total of all dividends and distributions declared on the bank’s shares in any year exceeds the total of the bank’s net income for the year plus retained net income for the two preceding years.
State-chartered banks’ ability to pay dividends may be affected by capital maintenance requirements of their primary federal bank regulatory agency as well. Moreover, regulatory authorities may prohibit banks and bank holding companies from paying dividends if payment of dividends would constitute an unsafe and unsound banking practice.
A 1985 policy statement of the Federal Reserve Board declares that a bank holding company should not pay cash dividends on common stock unless the organization’s net income for the past year is sufficient to fully fund the dividends and the prospective rate of earnings retention appears consistent with the organization’s capital needs, asset quality, and overall financial condition.
Recent Legislation. On July 30, 2002 the Sarbanes-Oxley Act of 2002 became law. The goals of the Sarbanes-Oxley Act are to increase corporate responsibility, to provide for enhanced penalties for accounting and auditing improprieties at publicly traded companies, and to protect investors by improving the accuracy and reliability of corporate disclosures made under the securities laws. The proposed changes are intended to allow shareholders to monitor the performance of companies and directors more easily and efficiently.
12
The Sarbanes-Oxley Act generally applies to all companies that file or are required to file periodic reports with the SEC under the Securities Exchange Act of 1934. The Act includes very specific additional disclosure requirements and new corporate governance rules, requires the SEC, securities exchanges, and Nasdaq to adopt extensive additional disclosure, corporate governance, and other related rules. The final scope of all of these new requirements is not yet clear. Some of the changes are effective already, but others will become effective in the future.
The Sarbanes-Oxley Act has an impact on a wide variety of corporate governance and disclosure issues, including the composition of audit committees, certification of financial statements by the chief executive officer and the chief financial officer, forfeiture of bonuses and profits made by directors and senior officers in the 12-month period covered by restated financial statements, a prohibition on insider trading during pension plan black-out periods, disclosure of off-balance sheet transactions, a prohibition on personal loans to directors and officers (excluding Federally insured financial institutions), expedited filing requirements for stock transaction reports by officers and directors, the formation of a public accounting oversight board, auditor independence, and various increased criminal penalties for violations of securities laws.
Transactions with Affiliates. Although the banks are not member banks of the Federal Reserve System, they are required by the Federal Deposit Insurance Act to comply with section 23A and section 23B of the Federal Reserve Act — pertaining to transactions with affiliates — as if they were member banks. These statutes are intended to protect banks from abuse in financial transactions with affiliates, preventing federally insured deposits from being diverted to support the activities of unregulated entities engaged in nonbanking businesses. An affiliate of a bank includes any company or entity that controls or is under common control with the bank. Generally, section 23A and section 23B of the Federal Reserve Act —
| | • | | limit the extent to which a bank or its subsidiaries may lend to or engage in various other kinds of transactions with any one affiliate to an amount equal to 10% of the institution’s capital and surplus, limiting the aggregate of covered transactions with all affiliates to 20% of capital and surplus, |
| |
| | • | | impose restrictions on investments by a subsidiary bank in the stock or securities of its holding company, |
| |
| | • | | impose restrictions on the use of a holding company’s stock as collateral for loans by the subsidiary bank, and |
| |
| | • | | require that affiliate transactions be on terms substantially the same, or at least as favorable to the institution or subsidiary, as those provided to a non-affiliate. |
The Company’s authority to extend credit to insiders — meaning executive officers, directors and greater than 10% stockholders — or to entities those persons control, is subject to section 22(g) and section 22(h) of the Federal Reserve Act and Regulation O of the Federal Reserve Board. Among other things, these laws require insider loans to be made on terms substantially similar to those offered to unaffiliated individuals, place limits on the amount of loans a bank may make to insiders based in part on the Company’s capital position, and require that specified approval procedures be followed. Loans to an individual insider may not exceed the legal limit on loans to any one borrower, which in general terms is 15% of capital but can be higher in some circumstances. And the aggregate of all loans to all insiders may not exceed the Company’s unimpaired capital and surplus. Insider loans exceeding the greater of 5% of capital or $25,000 must be approved in advance by a majority of the board, with any “interested” director not participating in the voting. Lastly, loans to executive officers are subject to special limitations. Executive officers may borrow in unlimited amounts to finance their children’s education or to finance the purchase or improvement of their residence, and they may borrow no more than $100,000 for most other purposes. Loans to executive officers exceeding $100,000 may be allowed if the loan is fully secured by government securities or a segregated deposit account. A violation of these restrictions could result in the assessment of substantial civil monetary penalties, the imposition of a cease-and-desist order or other regulatory sanctions.
Community Reinvestment Act. Under the Community Reinvestment Act of 1977 and implementing regulations of the banking agencies, a financial institution has a continuing and affirmative obligation — consistent with safe and sound operation — to address the credit needs of its entire community, including low- and moderate-income neighborhoods. The CRA does not establish specific lending requirements or programs for financial institutions, nor does it limit an institution’s discretion to develop the types of products and services it believes are best suited to its particular community. The CRA requires that bank regulatory agencies conduct regular CRA examinations and provide written evaluations of institutions’ CRA performance. The CRA also requires that an institution’s CRA performance rating be made public. CRA performance evaluations are based on a four-tiered rating system: Outstanding, Satisfactory, Needs to Improve and Substantial Noncompliance.
Although CRA examinations occur on a regular basis, CRA performance evaluations have been used principally in the evaluation of regulatory applications submitted by an institution. CRA performance evaluations are considered in evaluating applications for such things as mergers, acquisitions, and applications to open branches. Over the 25 years that the CRA has existed, and particularly in the last decade, institutions have faced increasingly difficult regulatory obstacles and public interest group objections in connection with their regulatory applications, including institutions that have received the highest possible CRA ratings.
13
A bank holding company cannot elect to be a “financial holding company” — with the expanded securities, insurance and other powers that designation entails — unless all of the depository institutions owned by the holding company have a CRA rating of satisfactory or better. The Gramm-Leach-Bliley Act also provides that a financial institution with total assets of $250 million or greater will be subject to CRA examinations no more frequently than every 2 years.” Following a CRA examination as of July 24, 2008, the MBC received a rating of “Outstanding.” Lastly, the Gramm-Leach-Bliley Act requires public disclosure of private CRA agreements entered into between banking organizations and other parties, and annual reporting by banking organizations of actions taken under the private CRA agreements. This last provision of the Gramm-Leach-Bliley Act addresses the increasingly common practice whereby a bank or holding company undertaking acquisition of another bank or holding company enters into an agreement with parties who might otherwise file with bank regulators a CRA protest of the acquisition. The details of these agreements have not been universally disclosed by acquiring institutions in the past.
Federal Home Loan Bank. The Federal Home Loan Bank serves as a credit source for their members. As a member of the FHLB of Cincinnati, the Company is required to maintain an investment in the capital stock of the FHLB of Cincinnati in an amount calculated by reference to its amount of loans, and or “advances,” from the FHLB. The Company is in compliance with this requirement, with an investment in FHLB stock of $1,873,000 at December 31, 2008.
Each FHLB is required to establish standards of community investment or service that its members must maintain for continued access to long-term advances from the FHLB. The standards take into account a member’s performance under the Community Reinvestment Act and its record of lending to first-time home buyers.
State Banking Regulation. As Ohio-chartered banks, the banks are subject to regular examination by the Ohio Division of Financial Institutions. State banking regulation affects the internal organization of the banks as well as their savings, lending, investment, and other activities. State banking regulation may contain limitations on an institution’s activities that are in addition to limitations imposed under federal banking law. The Ohio Division of Financial Institutions may initiate supervisory measures or formal enforcement actions, and if the grounds provided by law exist it may take possession and control of an Ohio-chartered bank.
Monetary Policy. The earnings of financial institutions are affected by the policies of regulatory authorities, including monetary policy of the Federal Reserve Board. An important function of the Federal Reserve System is regulation of aggregate national credit and money supply. The Federal Reserve Board accomplishes these goals with measures such as open market transactions in securities, establishment of the discount rate on bank borrowings, and changes in reserve requirements against bank deposits. These methods are used in varying combinations to influence overall growth and distribution of financial institutions’ loans, investments and deposits, and they also affect interest rates charged on loans or paid on deposits. Monetary policy is influenced by many factors, including inflation, unemployment, short-term and long-term changes in the international trade balance, and fiscal policies of the United States government. Federal Reserve Board monetary policy has had a significant effect on the operating results of financial institutions in the past, and it can be expected to influence operating results in the future.
Item 1.A — Risk Factors
Risks Related to the Company’s Business
Recent negative developments in the financial industry and the domestic credit market may adversely affect the Company’s operations and results.Negative developments in the latter half of 2007 and during 2008 in the credit and securitization markets have resulted in uncertainty in financial markets with the expectation of the general economic downturn continuing in 2009. Business activity across a wide range of industries and regions is declining. Unemployment has increased significantly. During the second half of 2008, the financial services industry was materially and adversely affected by significant declines in the values of nearly all asset classes and by a serious lack of liquidity. These negative developments were initially triggered by declines in home prices and the values of subprime residential mortgage loans, but quickly spread to other asset classes. Market conditions have also led to the failure or merger of a number of formerly prominent and large financial institutions. Furthermore, declining asset values on financial instruments, defaults on residential mortgages and consumer loans, and the lack of market and investor confidence, as well as other factors, have all combined to decrease liquidity, despite very significant declines in Federal Reserve borrowing rates and other government actions. Some banks and other lenders have suffered significant losses and have become reluctant to lend, even on a secured basis, due to the increased risk of default and the impact of declining asset values on the value of collateral. If current levels of market disruption and volatility continue or worsen, there can be no assurance that the Company will not experience an adverse effect, which may be material, on our ability to access capital and on our business, financial condition, and results of operations.
There can be no assurance that recent legislative and regulatory initiatives to address difficult market and economic conditions will stabilize the U.S. banking system. In response to the difficult market and economic conditions affecting the banking system and financial markets, former President Bush signed the Emergency Economic Stabilization Act of 2008 (“EESA”) into law on October 3, 2008. The EESA authorizes the Treasury Department to purchase from financial institutions and their holding companies up to $700 billion in mortgage loans, mortgage-related securities, and certain other financial instruments, including debt and equity securities issued by financial institutions and their holding companies, under a Troubled Asset Relief Program, or “TARP.” TARP was enacted to restore confidence and stability to the U.S. banking system and to encourage financial institutions to increase their lending to customers and to each other. The Treasury Department established a voluntary Capital Purchase Program (“CPP”) under TARP to encourage eligible U.S. financial institutions to build capital to increase the flow of financing to U.S. businesses and consumers. Under the CPP, the Treasury Department purchases senior preferred stock and warrants from participating financial institutions. We have elected not to participate in the CPP because the Company believes the CPP’s restrictions on possible future dividend increases, the dilution to earnings, and the uncertainty surrounding future requirements of the CPP outweighed the benefits of participation. Finally, the EESA also increased federal deposit insurance on most deposit accounts from $100,000 to $250,000. This increase is in place until the end of 2009 and is not covered by deposit insurance premiums paid by the banking industry.
14
On October 14, 2008, the FDIC announced the Temporary Liquidity Guarantee Program (“TLG Program”) to strengthen confidence and encourage liquidity in the banking system. The TLG Program consists of two components — (i) a temporary guarantee of newly issued senior unsecured debt (the “Debt Guarantee Program”) and (ii) a temporary unlimited guarantee of funds in noninterest-bearing transaction accounts at FDIC-insured institutions (the “Transaction Account Guarantee Program”). The Company has elected not to participate in the Debt Guarantee Program, but will participate in the Transaction Account Guarantee Program. Under the Transaction Account Guarantee Program, the FDIC has provided a temporary full guarantee for funds held in “noninterest-bearing transaction accounts” above the existing $250,000 deposit insurance limit. A ''noninterest-bearing transaction account’’ is defined under the FDIC’s rules as a transaction account with respect to which interest is neither accrued nor paid and on which the insured depository institution does not reserve the right to require advance notice of an intended withdrawal. A ''noninterest-bearing transaction account’’ also includes IOLTA accounts and NOW accounts with interest rates below .50%. The FDIC applies a 10 basis point annual rate surcharge to deposit amounts that exceed $250,000 for non-interest bearing transaction deposit accounts maintained by Transaction Account Guarantee Program participants.
The EESA and TLG Program have been followed by numerous actions by the Federal Reserve, the U.S. Congress, the Treasury Department, the FDIC, and the SEC to address the current liquidity and credit crisis that has followed the sub-prime mortgage meltdown that began in 2007. These measures include homeowner relief that encourage loan restructuring and modification; the establishment of significant liquidity and credit facilities for financial institutions and investment banks; the lowering of the federal funds rate; emergency action against short selling practices; a temporary guaranty program for money market funds; the establishment of a commercial paper funding facility to provide back-stop liquidity to commercial paper issuers; and coordinated international efforts to address illiquidity and other weaknesses in the banking sector.
On February 17, 2009, President Obama signed the American Recovery and Reinvestment Act of 2009 (the “Recovery Act”) into law. The Recovery Act was implemented to provide $787 billion in funds to create and preserve jobs, promote economic recovery, spur technological advances in science and health, invest in transportation, environmental protection, and other infrastructure that will provide long-term economic benefits, and stabilize state and local government budgets. The Recovery Act also contains provisions limiting, but not capping, executive compensation for all current and future TARP recipients until the institution has repaid the government.
The purpose of these legislative and regulatory actions is to stabilize U.S. financial markets. The U.S. Congress or federal bank regulatory agencies could adopt additional regulatory requirements or restrictions in response to the threats to the financial system and such changes may adversely affect the Company’s operations. In addition, the EESA and the Recovery Act may not have the intended beneficial impact on the financial markets or the banking industry. To the extent the market does not respond favorably to the legislative and regulatory initiatives described above, the Company prospects and results of operations would be adversely affected.
The Company operates in a highly competitive industry and market area. The U.S. financial system has become highly concentrated and has moved into a barbell-type structure. This structure is characterized at one end by a handful of large financial conglomerates and at the other end by thousands of community financial institutions spread across the U.S. According to the FDIC, the four largest banking companies control more than 40% of the nation’s deposits and more than 50% of the industry’s assets. While the nation’s largest banks have not been permitted to fail, community banks do fail with regularity. This policy disparity has entrenched an ongoing competitive inequity against community banks. In effect, government ownership of banks considered “too big to fail” may adversely impact the market for various bank products and services, many of which are considered the financial system’s most profitable.
The Company faces significant competition both in making loans and in attracting deposits. Competition is based on interest rates and other credit and service charges, the quality of services rendered, the convenience of banking facilities, the range and type of products offered and, in the case of loans to larger commercial borrowers, lending limits, among other factors. Competition for loans comes principally from commercial banks, savings banks, savings and loan associations, credit unions, mortgage banking companies, insurance companies, and other financial service companies. The Companies most direct competition for deposits has historically come from commercial banks, savings banks, and savings and loan associations. Technology has also lowered barriers to entry and made it possible for non-banks to offer products and services traditionally provided by banks, such as automatic transfer and automatic payment systems. Larger competitors may be able to achieve economies of scale and, as a result, offer a broader range of products and services. The Company’s ability to compete successfully depends on a number of factors, including, among other things:
| | • | | the ability to develop, maintain, and build long-term customer relationships based on top quality service, high ethical standards, and safe, sound assets; |
| |
| | • | | the ability to expand the Company’s market position; |
| |
| | • | | the scope, relevance, and pricing of products and services offered to meet customer needs and demands; |
| |
| | • | | the rate at which the Company introduces new products and services relative to its competitors; |
| |
| | • | | customer satisfaction with the Company’s level of service; and |
| |
| | • | | industry and general economic trends. |
15
Failure to perform in any of these areas could significantly weaken the Company’s competitive position, which could adversely affect growth and profitability.
The Company may not be able to attract and retain skilled people.The Company’s success depends, in large part, on its ability to attract and retain key people. Competition for the best people can be intense and the Company may not be able to hire people or to retain them. The unexpected loss of the services of key personnel of the Company could have a material adverse impact on the Company’s business because of their skills, knowledge of the Company’s market, years of industry experience, and the difficulty of promptly finding qualified replacement personnel. The Company does not currently have employment agreements or non-competition agreements with any of its senior officers.
The Company does not have the financial and other resources that larger competitors have; this could affect its ability to compete for large commercial loan originations and its ability to offer products and services competitors provide to customers.The northeastern Ohio and central Ohio markets in which the Company operates have high concentrations of financial institutions. Many of the financial institutions operating in our markets are branches of significantly larger institutions headquartered in Cleveland or in other major metropolitan areas, with significantly greater financial resources and higher lending limits. In addition, many of these institutions offer services that the Company do not or cannot provide. For example, the larger competitors’ greater resources offer advantages such as the ability to price services at lower, more attractive levels, and the ability to provide larger credit facilities. Because the Company is currently smaller than many commercial lenders in its market, it is on occasion prevented from making commercial loans in amounts competitors can offer. The Company accommodates loan volumes in excess of its lending limits from time to time through the sale of loan participations to other banks.
The business of banking is changing rapidly with changes in technology, which poses financial and technological challenges to small and mid-sized institutions. With frequent introductions of new technology-driven products and services, the banking industry is undergoing rapid technological changes. In addition to enhancing customer service, the effective use of technology increases efficiency and enables financial institutions to reduce costs. Financial institutions’ success is increasingly dependent upon use of technology to provide products and services that satisfy customer demands and to create additional operating efficiencies. Many of the Company’s competitors have substantially greater resources to invest in technological improvements, which could enable them to perform various banking functions at lower costs than the Company, or to provide products and services that the Company is not able to economically provide. The Company cannot assure you that we will be able to develop and implement new technology-driven products or services or that the Company will be successful in marketing these products or services to customers. Because of the demand for technology-driven products, banks increasingly rely on unaffiliated vendors to provide data processing services and other core banking functions. The use of technology-related products, services, delivery channels, and processes exposes banks to various risks, particularly transaction, strategic, reputation, and compliance risk. The Company cannot assure you that we will be able to successfully manage the risks associated with our dependence on technology.
The banking industry is heavily regulated; the compliance burden to the industry is considerable; the principal beneficiary of federal and state regulation is the public at large and depositors, not stockholders. The Company and its subsidiaries are and will remain subject to extensive state and federal government supervision and regulation. This supervision and regulation affect many aspects of the banking business, including permissible activities, lending, investments, payment of dividends, the geographic locations in which our services can be offered, and numerous other matters. State and federal supervision and regulation are intended principally to protect depositors, the public, and the deposit insurance fund administered by the FDIC. Protection of stockholders is not a goal of banking regulation.
The burdens of federal and state banking regulation place banks in general at a competitive disadvantage compared to less regulated competitors. Applicable statutes, regulations, agency and court interpretations, and agency enforcement policies have undergone significant changes, and could change significantly again. Federal and state banking agencies also require banks and bank holding companies to maintain adequate capital. Failure to maintain adequate capital or to comply with applicable laws, regulations, and supervisory agreements could subject a bank or bank holding company to federal or state enforcement actions, including termination of deposit insurance, imposition of fines and civil penalties, and, in the most severe cases, appointment of a conservator or receiver for a depositary institution. Changes in applicable laws and regulatory policies could adversely affect the banking industry generally or the Company in particular. The Company gives you no assurance that we will be able to adapt successfully to industry changes caused by governmental actions.
Success in the banking industry requires disciplined management of lending risks.There are many risks in the business of lending, including risks associated with the duration over which loans may be repaid, risks resulting from changes in economic conditions, risks inherent in dealing with individual borrowers, and risks resulting from changes in the value of loan collateral. We attempt to mitigate this risk by a thorough review of the creditworthiness of loan customers. Nevertheless, there is risk that our credit evaluations will prove to be inaccurate due to changed circumstances or otherwise.
A critical resource for maintaining the safety and soundness of banks so that they can fulfill their basic function of financial intermediation, the allowance for possible loan losses is a reserve established through a provision for possible loan losses charged to expense that represents management’s best estimate of probable losses that have been incurred within the existing portfolio of loans. Current accounting standards for loan loss provisioning are based on the so-called “incurred loss” model. Under this model, a bank can reserve against a loan loss through a provision to the loan loss reserve only if that loss has been “incurred,” which means a loss that is probable and can be reasonably estimated. To meet that standard, banks have to document why a loss is probable and reasonably estimable, and the easiest way to do that is to refer to historical loss rates and the bank’s own prior loss experience with the type of asset in question. Banks are not limited to using historical experience in deciding the appropriate level of the loan loss reserve. In making these determinations, management can use judgment that takes into account other, forward-leaning factors, such as changes in underwriting standards and changes in the economic environment that would have an impact on loan losses. It is changes in the current economic environment that have led us, and may continue to lead management, to take provisions that are higher than our historical experience.
16
The level of the allowance reflects management’s continuing evaluation of industry concentrations; specific credit risks; loan loss experience; current loan portfolio quality; present economic, political, and regulatory conditions; and unidentified losses inherent in the current loan portfolio. The determination of the appropriate level of the allowance for possible loan losses inherently involves a high degree of subjectivity and requires management to make significant estimates of current credit risks and future trends, all of which may undergo material changes. Continuing deterioration in economic conditions affecting borrowers, new information regarding existing loans, identification of additional problem loans and other factors, both within and outside of the Company’s control, may require an increase in the allowance for possible loan losses. In addition, bank regulatory agencies periodically review the allowance for loan losses and may require an increase in the provision for possible loan losses or the recognition of further loan charge-offs, based on judgments different than those of management. In addition, if charge-offs in future periods exceed the allowance for possible loan losses, the Company will need additional provisions to increase the allowance for possible loan losses. Any increases in the allowance for possible loan losses will result in a decrease in net income and, possibly, capital, and may have a material adverse effect on the Company’s financial condition and results of operations.
Changing interest rates have a direct and immediate impact on financial institutions. The risk of nonpayment of loans — or credit risk — is not the only lending risk. Lenders are subject also to interest rate risk. Fluctuating rates of interest prevailing in the market affect a bank’s net interest income, which is the difference between interest earned from loans and investments, on one hand, and interest paid on deposits and borrowings, on the other. Changes in the general level of interest rates can affect our net interest income by affecting the difference between the weighted average yield earned on our interest-earning assets and the weighted average rate paid on our interest-bearing liabilities, or interest rate spread, and the average life of our interest-earning assets and interest-bearing liabilities. Changes in interest rates also can affect (i) our ability to originate loans, (ii) the value of our interest-earning assets, and our ability to realize gains from the sale of such assets, (iii) our ability to obtain and retain deposits in competition with other available investment alternatives, and (iv) the ability of our borrowers to repay adjustable or variable rate loans. Interest rates are highly sensitive to many factors, including governmental monetary policies, domestic and international economic and political conditions, and other factors beyond our control. Although the Company believes that the estimated maturities of our interest-earning assets currently are well balanced in relation to the estimated maturities of our interest-bearing liabilities (which involves various estimates as to how changes in the general level of interest rates will impact these assets and liabilities), there can be no assurance that our profitability would not be adversely affected during any period of changes in interest rates.
A prolonged economic downturn in our market area would adversely affect our loan portfolio and our growth prospects. Our lending market area is concentrated in northeastern and central Ohio, particularly Franklin, Geauga, Portage, Trumbull, and Ashtabula Counties. A high percentage of our loan portfolio is secured by real estate collateral, primarily residential mortgage loans. Commercial and industrial loans to small and medium-sized businesses also represent a significant percentage of our loan portfolio. The asset quality of our loan portfolio is largely dependent upon the area’s economy and real estate markets. A prolonged economic downturn would likely contribute to the deterioration of the credit quality of our loan portfolio and reduce our level of customer deposits, which in turn would hurt our business. If the current economic downturn in the economy as a whole, or in the northeastern and central Ohio markets continues for a prolonged period, borrowers may be less likely to repay their loans as scheduled or at all. Moreover, the value of real estate or other collateral that may secure our loans could be adversely affected. Unlike many larger institutions, we are not able to spread the risks of unfavorable local economic conditions across a large number of diversified economies and geographic locations. A prolonged economic downturn could, therefore, result in losses that could materially and adversely affect our business.
The Company could incur liabilities under federal and state environmental laws if we foreclose on commercial properties. A high percentage of the Company’s loans are secured by real estate. Although the vast majority of these loans are residential mortgage loans with little associated environmental risk, some are commercial loans secured by property on which manufacturing and other commercial enterprises are carried on. The Company has in the past and could again acquire property by foreclosing on loans in default. Under federal and state environmental laws, a bank could face liability for some or all of the costs of removing hazardous substances, contaminants, or pollutants from properties acquired in this fashion. Although other persons might be primarily responsible for these costs, these persons might not be financially solvent or they might be unable to bear the full cost of clean-up. It is also possible that a lender exercising unusual influence over a borrower’s commercial activities could be required to bear a portion of the clean-up costs under federal or state environmental laws.
Changes in accounting standards could materially impact our consolidated financial statements. Our accounting policies and methods are fundamental to how the Company records and reports its financial condition and results of operations. The accounting standard setters, including the Financial Accounting Standards Board, the SEC, and other regulatory bodies, from time to time may change the financial accounting and reporting standards that govern the preparation of our consolidated financial statements. These changes can be hard to predict and can materially impact how we record and report our financial condition and results of operations. In some cases, the Company could be required to apply a new or revised standard retroactively, resulting in changes to previously reported financial results, or a cumulative charge to retained earnings. Management may be required to make difficult, subjective, or complex judgments about matters that are uncertain. Materially different amounts could be reported under different conditions or using different assumptions.
17
There are risks with respect to future expansion and acquisitions or mergers. The Company may seek in the future to acquire other financial institutions or parts of those institutions. The Company may also expand into new markets or lines of business or offer new products or services. These activities would involve a number of risks, including —
| | • | | the time and expense associated with identifying and evaluating potential acquisitions and merger partners; |
| |
| | • | | using inaccurate estimates and judgments to evaluate credit, operations, management, and market risks with respect to the target institution or assets; |
| |
| | • | | diluting our existing shareholders in an acquisition; |
| |
| | • | | the time and expense associated with evaluating new markets for expansion, hiring experienced local management, and opening new offices; |
| |
| | • | | taking a significant amount of time negotiating a transaction or working on expansion plans, resulting in management’s attention being diverted from the operation of our existing business; and |
| |
| | • | | the time and expense associated with integrating the operations and personnel of the combined businesses, creating an adverse short-term effect on our results of operations. |
There is also a risk that any expansion effort will not be successful.
Compliance with Sarbanes-Oxley Act will involve significant expenditures, and non-compliance may adversely affect us. The Sarbanes-Oxley Act of 2002 (“SOX”), and the related rules and regulations promulgated by the SEC that are now applicable to us, have increased the scope, complexity, and cost of corporate governance, reporting, and disclosure practices. The Company has experienced, and expect to continue to experience, greater compliance costs, including costs related to internal controls, as a result of SOX. For example, for the year ended December 31, 2007, the Company was required to comply with Section 404 of SOX and management has issued a report on our internal controls over financial reporting. Our independent registered public accounting firm will be required to provide an attestation with respect to management’s report on our internal controls over financial reporting as of December 31, 2009. We expect the applicability of these rules and regulations to us will continue to increase our accounting, legal, and other costs, and to make some activities more difficult, time consuming, and costly. In the event that the Company is unable to maintain or achieve compliance with SOX and any related rules, it may be adversely affected.
The Company utilizes the Federal Home Loan Bank as an additional source of liquidity. The Middlefield Banking Company and Emerald Bank are members of the Federal Home Loan Bank (“FHLB”) of Cincinnati, which is one of the twelve regional banks comprising the FHLB System. The FHLB provides credit for member financial institutions. As a member of the FHLB, the Company is required to own stock in the FHLB in proportion to our borrowings. As of December 31, 2008, our investment in FHLB stock totaled $1.9 million. The Company is authorized to apply for advances from the FHLB, which are collateralized in the aggregate by loans, securities, FHLB stock, and by deposits with the FHLB. At December 31, 2008, the Company had approximately $19.4 million in FHLB advances. FHLB advances are only available to borrowers that meet certain conditions. If the Company were to cease meeting these conditions, our access to FHLB advances could be significantly reduced or eliminated.
The 12 FHLBs obtain their funding primarily through issuance of consolidated obligations of the FHLB System. The U.S. government does not guarantee these obligations, and each of the 12 FHLBs are jointly and severally liable for repayment of each other’s debt. Therefore, the Company’s investment in the equity stock of the FHLB of Cincinnati could be adversely impacted by the operations of the other FHLBs. Certain FHLBs, including Cincinnati, have experienced lower earnings from time to time and paid out lower dividends to their members. If a FHLB’s capital drops below 4% of its assets, restrictions on the redemption or repurchase of member banks’ FHLB stock are imposed by law. Should the FHLBs be restricted from redeeming or repurchasing member banks’ FHLB stock due to adverse financial conditions affecting either individual FHLBs or the FHLB System as a whole, member banks may be required to recognize an impairment charge on their FHLB equity stock investments. Future problems at the FHLBs may impact the collateral necessary to secure borrowings and limit the borrowings extended to member banks, as well as require additional capital contributions by member banks. Should this occur, the Company’s short term liquidity needs could be negatively impacted. Should the Company be restricted from using FHLB advances due to weakness in the FHLB System or with the FHLB of Cincinnati, the Company may be forced to find alternative funding sources. These alternative funding sources may include seeking lines of credit with third party banks or the Federal Reserve Bank, borrowing under repurchase agreement lines, increasing deposit rates to attract additional funds, accessing brokered deposits, or selling certain investment securities categorized as available-for-sale in order to maintain adequate levels of liquidity.
18
Our deposit insurance premium could be substantially higher in the future which would have an adverse effect on future earnings. As a result of EESA, the basic limit on federal deposit insurance coverage was temporarily raised from $100,000 to $250,000 per depositor until January 1, 2010. The Middlefield Banking Company and Emerald Bank also participate in the FDIC’s Transaction Account Guarantee Program. As a condition of participating in the Transaction Account Guarantee Program, the Company is assessed on a quarterly basis an annualized 10 basis point assessment on balances in noninterest-bearing transaction accounts that exceed the existing deposit insurance limit of $250,000. The Transaction Account Guarantee Program ends on January 1, 2010.
During the year ended December 31, 2008, the Company paid $155,000 in deposit insurance. Under the Federal Deposit Insurance Act, the FDIC, absent extraordinary circumstances, must establish and implement a plan to restore the deposit insurance reserve ratio to 1.15% of insured deposits, over a five-year period, at any time that the reserve ratio falls below 1.15%. The escalating pace of bank failures that began in 2008 has significantly increased the Deposit Insurance Fund’s loss provisions, resulting in a decline in the reserve ratio to .40% as of December 31, 2008. The FDIC expects continued insured institution failures in the next few years, which likely will result in a continued decline in the reserve ratio.
On October 7, 2008, the FDIC released a five-year recapitalization plan and a proposal to raise premiums to recapitalize the fund. In order to implement the restoration plan, the FDIC proposed to change both its risk-based assessment system and its base assessment rates. Changes to the risk-based assessment system would include increasing premiums for institutions that rely on excessive amounts of brokered deposits, increasing premiums for excessive use of secured liabilities, and lowering premiums for smaller institutions with very high capital levels. On February 27, 2009, the FDIC adopted a final rule (i) modifying the risk-based assessment system and setting initial base assessment rates beginning April 1, 2009, at 12 to 45 basis points, (ii) extending the period of the restoration plan to seven years, and (iii) adopting an interim rule imposing an emergency 20 basis point special assessment on June 30, 2009, which will be collected on September 30, 2009, and allowing the FDIC to impose possible additional special assessments of up to 10 basis points thereafter to maintain public confidence in the Deposit Insurance Fund. Accordingly, increases in the deposit insurance premium assessment rate applicable to us will adversely impact our earnings.
In February 2009, the FDIC adopted an interim final rule imposing a special assessment on all insured institutions due to recent bank and savings association failures. The emergency assessment amounts to 20 basis points of insured deposits as of June 30, 2009. The assessment will be collected on September 30, 2009. The special assessment will negatively impact the Company’s earnings by approximately $800,000.
Government regulation could restrict our ability to pay cash dividends. Dividends from the banks are the only significant source of cash for the Company. Statutory and regulatory limits could prevent the banks from paying dividends or transferring funds to the Company. As of December 31, 2008, the banks could have declared dividends of approximately $5.5 million in the aggregate to Company without having to obtain advance regulatory approval. The Company cannot assure you that the Companies’ profitability will continue to allow dividends to the Company, and the Company therefore cannot assure you that the Company will be able to continue paying regular, quarterly cash dividends.
Risks Associated with the Company’s Common Stock
An investment in the Company’s common stock is not an insured deposit. The Corporation’s common stock is not a bank deposit and, therefore, is not insured against loss by the Federal Deposit Insurance Corporation (FDIC), any other deposit insurance fund or by any other public or private entity. As a result, if you acquire the Corporation’s common stock, you could lose some or all of your investment.
The Company’s common stock is very thinly traded, and it is therefore susceptible to wide price swings. The Company’s common stock is not traded or authorized for quotation on any exchanges, including Nasdaq. However, bid prices for Company common stock appear from time to time in the pink sheets under the symbol “MBCN.” The “pink sheets” is a quotation service for over-the-counter securities that is maintained by Pink OTC Markets Inc., a privately owned company. Thinly traded, illiquid stocks are more susceptible to significant and sudden price changes than stocks that are widely followed by the investment community and actively traded on an exchange. The liquidity of the Company’s common stock depends upon the presence in the marketplace of willing buyers and sellers. The Company cannot assure you that you will be able to find a buyer for your shares. Two regional broker/dealers facilitate trades of the company common stock, matching interested buyers and sellers. The Company currently does not intend to seek listing of the Company’s common stock on Nasdaq or on another securities exchange. Even if we successfully list the Company’s common stock on a securities exchange or obtain Nasdaq trading authorization, the Company nevertheless could not assure you that an organized public market for the securities will develop or that there will be any private demand for the Company’ common stock. The Company could also fail subsequently to satisfy the standards for continued exchange listing, such as standards having to do with the minimum number of public shareholders or the aggregate market value of publicly held shares. A stock that is not listed on a securities exchange might not be accepted as collateral for loans. If accepted as collateral, the stock’s value could nevertheless be substantially discounted. Consequently, investors should regard the Company’s common stock as a long-term investment and should be prepared to bear the economic risk for an indefinite period. Investors who need or desire to dispose of all or a part of their investments in the Company’s common stock might not be able to do so except by private, direct negotiations with third parties.
19
Item 2 — Properties
The Company’s offices are:
| | | | | | | |
| Location | | County | | Owned/Leased | | Other Information |
Main Office: | | | | | | |
| 15985 East High Street | | Geauga | | Owned | | |
| Middlefield, Ohio | | | | | | |
| | | | | | | |
Branches: | | | | | | |
| West Branch | | Geauga | | Owned | | |
| 15545 West High Street | | | | | | |
| Middlefield, Ohio | | | | | | |
| | | | | | | |
| Garrettsville Branch | | Portage | | Owned | | |
| 8058 State Street | | | | | | |
| Garrettsville, Ohio | | | | | | |
| | | | | | | |
Mantua Branch
10519 South Main Street
Mantua, Ohio | | Portage | | Leased | | three-year lease renewed in November 2007, with option to renew for six additional consecutive three-year terms |
| | | | | | | |
| Chardon Branch | | Geauga | | Owned | | opened in September, 2001 |
| 348 Center Street | | | | | | |
| Chardon, Ohio | | | | | | |
| | | | | | | |
| Orwell Branch | | Ashtabula | | Owned | | opened in April, 2003 |
| 30 South Maple Avenue | | | | | | |
| Orwell, Ohio | | | | | | |
| | | | | | | |
Newbury Branch
11110 Kinsman Road
Newbury, Ohio | | Geauga | | Leased | | ten-year lease dated December 2006, with option to renew for four additional consecutive five-year terms |
| | | | | | | |
| Cortland Branch | | Trumbull | | Owned | | opened in June, 2008 |
| 3450 Niles Cortland Road | | | | | | |
| Cortland, Ohio | | | | | | |
| | | | | | | |
Emerald Bank
6215 Perimeter Drive
Dublin, OH | | Franklin | | Leased | | twenty-year lease dated Febuary 2004, with the option to purchase after the tenth year |
| |
| Westerville Branch (Emerald Bank) | | Franklin | | Owned | | opened in November, 2008 |
| 17 North State Street | | | | | | |
| Westerville, OH | | | | | | |
At December 31, 2008 the net book value of the Company’s investment in premises and equipment totaled $8.5 million.
The Company’s electronic data processing functions are performed under contract with an electronic data processing services firm that performs services for financial institutions throughout the Midwest.
20
Item 3 — Legal Proceedings
From time to time the Company and the banks are involved in various legal proceedings that are incidental to its business. In the opinion of management, no current legal proceedings are material to the financial condition of Company or the banks, either individually or in the aggregate.
Item 4 — Submission of Matters to a Vote of Security Holders
No matters were submitted to a vote of The Company’s security holders during the fourth quarter of 2008.
Part II
Item 5 — Market for Registrant’s Common Equity, Related Stockholder Matters and Issuer Purchases of Equity Securities
Information relating to the market for Middlefield’s common equity and related shareholder matters appears under “Market for the Companies’ Common Equity and Related Stockholder Matters” in the Companies’ 2008 Annual Report to Shareholders and is incorporated herein by reference. Information relating to dividend restrictions for Registrant’s common stock appears under” Supervision and Regulation.”
Equity Compensation Plan information
The following table provides information as of December 31, 2008 with respect to shares of common stock that may be issued under the Company’s existing equity plan which has been previously approved by the stockholders.
| | | | | | | | | | | | | |
| | | | | | | | | | | Number of Securities | |
| | | Number of | | | | | | | Remaining Available | |
| | | Securities | | | | | | | for Future Issuance | |
| | | to be Issued Upon | | | Weighted-Average | | | Under Equity | |
| | | Exercise of | | | Exercise Price of | | | Compensation Plans | |
| | | Outstanding | | | Outstanding | | | (Excluding Securities | |
| Plan Category | | Options or Rights | | | Options or Rights | | | Reflected in Column A) | |
| |
| Equity compensation plans approved by security holders: | | | | | | | | | | | | |
| |
| 1999 Stock Option Plan | | | 110,465 | | | | 27.21 | | | | 89,535 | |
Unregistered Sales of Equity Securities and Use of Proceeds
On May 12, 2008, the Company announced the adoption of a stock repurchase program that authorizes the repurchase of up to 4.99% or approximately 76,936 shares of its outstanding common stock in the open market or in privately negotiated transactions. This program expires in May 2009.
Item 6 — Selected Financial Data
The above-captioned information appears under “Selected Financial Data” in the Companies’ 2008 Annual Report to Shareholders and is incorporated herein by reference.
Item 7 — Management’s Discussion and Analysis of Financial Condition and Results of Operations
The above-captioned information appears under the heading “Management’s Discussion and Analysis of Financial Condition and Results of Operations” in the Companies’ 2008 Annual Report to Shareholders and is incorporated herein by reference.
Item 7A — Quantitative and Qualitative Disclosures About Market Risk
The above-captioned information appears under the heading “Management’s Discussion and Analysis of Financial Condition and Results of Operations” under the section “Interest Rate Sensitivity Simulation Analysisin the Companies’ 2008 Annual Report to Shareholders and is incorporated herein by reference.
Item 8 — Financial Statements and Supplementary Data
The Consolidated Financial Statements of the Company and its’ subsidiaries, together with the report thereon by S.R. Snodgrass, A.C. appears in the Companies’ 2008 Annual Report to Shareholders and are incorporated herein by reference.
21
Item 9 — Changes in and Disagreements with Accountants on Accounting and Financial Disclosure
None
Item 9a(T) — Controls and Procedures
| | (a) | | Disclosure Controls and Procedures |
| |
| | | | The Company’s management, including the Company’s principal executive officer and principal financial officer, have evaluated the effectiveness of the Company’s “disclosure controls and procedures,” as such term is defined in Rule 13a-15(e) promulgated under the Securities Exchange Act of 1934, as amended, (the “Exchange Act”). Based upon their evaluation, the principal executive officer and principal financial officer concluded that, as of the end of the period covered by this report, the Company’s disclosure controls and procedures were effective for the purpose of ensuring that the information required to be disclosed in the reports that the Company files or submits under the Exchange Act with the Securities and Exchange Commission (the “SEC”) (1) is recorded, processed, summarized and reported within the time periods specified in the SEC’s rules and forms, and (2) is accumulated and communicated to the Company’s management, including its principal executive and principal financial officers, as appropriate to allow timely decisions regarding required disclosure.
|
| |
| | (b) | | Internal Controls Over Financial Reporting |
| |
| | | | Management’s annual report on internal control over financial reporting is incorporated herein by reference to Item 8 — the Company’s audited Consolidated Financial Statements in this Annual Report on Form 10-K. |
| |
| | (c) | | Changes to Internal Control Over Financial Reporting |
| |
| | | | There were no changes in the Company’s internal control over financial reporting during the three months ended December 31, 2008 that have materially affected, or are reasonable likely to materially affect, the Company’s internal control over financial reporting. |
Item 9b — Other Information
None
Part III
Item 10 — Directors and Executive Officers of the Registrant
Incorporated by reference to the definitive proxy statement for the 2008 annual meeting of shareholders, which will be filed with the Securities and Exchange Commission not later than 120 days after December 31, 2008.
Item 11 — Executive Compensation
Incorporated by reference to the definitive proxy statement for the 2008 annual meeting of shareholders, which will be filed with the Securities and Exchange Commission not later than 120 days after December 31, 2008.
Item 12 — Security Ownership of Certain Beneficial Owners and Management and Related Stockholder Matters
Incorporated by reference to the definitive proxy statement for the 2008 annual meeting of shareholders, which will be filed with the Securities and Exchange Commission not later than 120 days after December 31, 2008. The information required by this item concerning Equity Compensation Plan information is presented under the caption “EQUITY COMPENSATION PLAN INFORMATION” contained in Part II, Item 5. “Market for Registrant’s Common Equity, Related Stockholder Matters and Issuer Purchases of Equity Securities”.
Item 13 — Certain Relationships and Related Transactions
Incorporated by reference to the definitive proxy statement for the 2008 annual meeting of shareholders, which will be filed with the Securities and Exchange Commission not later than 120 days after December 31, 2008.
Item 14 — Principal Accountant Fees and Services
Incorporated by reference to the definitive proxy statement for the 2008 annual meeting of shareholders, which will be filed with the Securities and Exchange Commission not later than 120 days after December 31, 2008.
22
Part IV
Item 15 — Exhibits, Financial Statement Schedules
(a)(1)Financial Statements
Index to Consolidated Financial Statements:
Consolidated Financial Statements as of December 31, 2008 and 2007 and for each of the three years in the period ended December 31, 2008:
Report of Independent Registered Public Accounting firm
Consolidated Balance Sheets
Consolidated Statements of Income
Consolidated Statements of Changes in Stockholders’ Equity
Consolidated Statements of Cash Flows
Notes to Consolidated Financial Statements
(a)(2)Financial Statement Schedules
Financial Statement Schedules have been omitted because they are not applicable or the required information is shown elsewhere in the document in the Financial Statements or Notes thereto, or in “Management’s Discussion and Analysis of Financial Condition and Results of Operations.”
(a)(3)Exhibits
See the list of exhibits below
(b)Exhibits Required by Item 601 of Regulation S-K
| | | | | | | |
| exhibit | | | | |
| number | | description | | location |
| | | | | | | |
| | 3.1 | | | Second Amended and Restated Articles of Incorporation of Middlefield Banc Corp., as amended | | Incorporated by reference to Exhibit 3.1 of Middlefield Banc Corp.’s Annual Report on Form 10-K for the Fiscal Year Ended December 31, 2005, filed on March 29, 2006 |
| | | | | | | |
| | 3.2 | | | Regulations of Middlefield Banc Corp. | | Incorporated by reference to Exhibit 3.2 of Middlefield Banc Corp.’s registration statement on Form 10 filed on April 17, 2001 |
| | | | | | | |
| | 4.0 | | | Specimen stock certificate | | Incorporated by reference to Exhibit 4 of Middlefield Banc Corp.’s registration statement on Form 10 filed on April 17, 2001 |
| | | | | | | |
| | 4.1 | | | Amended and Restated Trust Agreement, dated as of December 21, 2006, between Middlefield Banc Corp., as Depositor, Wilmington Trust Company, as Property trustee, Wilmington Trust Company, as Delaware Trustee, and Administrative Trustees | | Incorporated by reference to Exhibit 4.1 of Middlefield Banc Corp.’s Form 8-K Current Report filed on December 27, 2006 |
| | | | | | | |
| | 4.2 | | | Junior Subordinated Indenture, dated as of December 21, 2006, between Middlefield Banc Corp. and Wilmington Trust Company | | Incorporated by reference to Exhibit 4.2 of Middlefield Banc Corp.’s Form 8-K Current Report filed on December 27, 2006 |
| | | | | | | |
| | 4.3 | | | Guarantee Agreement, dated as of December 21, 2006, between Middlefield Banc Corp. and Wilmington Trust Company | | Incorporated by reference to Exhibit 4.3 of Middlefield Banc Corp.’s Form 8-K Current Report filed on December 27, 2006 |
| | | | | | | |
| | 10.1.0 | * | | 1999 Stock Option Plan of Middlefield Banc Corp. | | Incorporated by reference to Exhibit 10.1 of Middlefield Banc Corp.’s registration statement on Form 10 filed on April 17, 2001 |
23
| | | | | | | |
| exhibit | | | | |
| number | | description | | location |
| | | | | | | |
| | 10.1.1 | * | | 2007 Omnibus Equity Plan | | Incorporated by reference to Middlefield Banc Corp.’s definitive proxy statement for the 2008 Annual Meeting of Shareholders, Appendix A, filed on April 7, 2008 |
| | | | | | | |
| | 10.2 | * | | Severance Agreement between Middlefield Banc Corp. and Thomas G. Caldwell, dated January 7, 2008 | | Incorporated by reference to Exhibit 10.2 of Middlefield Banc Corp.’s Form 8-K Current Report filed on January 9, 2008 |
| | | | | | | |
| | 10.3 | * | | Severance Agreement between Middlefield Banc Corp. and James R. Heslop, II, dated January 7, 2008 | | Incorporated by reference to Exhibit 10.3 of Middlefield Banc Corp.’s Form 8-K Current Report filed on January 9, 2008 |
| | | | | | | |
| | 10.4.0 | * | | Severance Agreement between Middlefield Banc Corp. and Jay P. Giles, dated January 7, 2008 | | Incorporated by reference to Exhibit 10.4 of Middlefield Banc Corp.’s Form 8-K Current Report filed on January 9, 2008 |
| | | | | | | |
| | 10.4.1 | * | | Severance Agreement between Middlefield Banc Corp. and Teresa M. Hetrick, dated January 7, 2008 | | Incorporated by reference to Exhibit 10.4.1 of Middlefield Banc Corp.’s Form 8-K Current Report filed on January 9, 2008 |
| | | | | | | |
| | 10.4.2 | * | | Severance Agreement between Middlefield Banc Corp. and Jack L. Lester, dated January 7, 2008 | | Incorporated by reference to Exhibit 10.4.2 of Middlefield Banc Corp.’s Form 8-K Current Report filed on January 9, 2008 |
| | | | | | | |
| | 10.4.3 | * | | Severance Agreement between Middlefield Banc Corp. and Donald L. Stacy, dated January 7, 2008 | | Incorporated by reference to Exhibit 10.4.3 of Middlefield Banc Corp.’s Form 8-K Current Report filed on January 9, 2008 |
| | | | | | | |
| | 10.4.4 | * | | Severance Agreement between Middlefield Banc Corp. and Alfred F. Thompson Jr., dated January 7, 2008 | | Incorporated by reference to Exhibit 10.4.4 of Middlefield Banc Corp.’s Form 8-K Current Report filed on January 9, 2008 |
| | | | | | | |
| | 10.5 | | | Federal Home Loan Bank of Cincinnati Agreement for Advances and Security Agreement dated September 14, 2000 | | Incorporated by reference to Exhibit 10.4 of Middlefield Banc Corp.’s registration statement on Form 10 filed on April 17, 2001 |
| | | | | | | |
| | 10.6 | * | | Amended Director Retirement Agreement with Richard T. Coyne | | Incorporated by reference to Exhibit 10.6 of Middlefield Banc Corp.’s Form 8-K Current Report filed on January 9, 2008 |
| | | | | | | |
| | 10.7 | * | | Amended Director Retirement Agreement with Frances H. Frank | | Incorporated by reference to Exhibit 10.7 of Middlefield Banc Corp.’s Form 8-K Current Report filed on January 9, 2008 |
| | | | | | | |
| | 10.8 | * | | Amended Director Retirement Agreement with Thomas C. Halstead | | Incorporated by reference to Exhibit 10.8 of Middlefield Banc Corp.’s Form 8-K Current Report filed on January 9, 2008 |
| | | | | | | |
| | 10.9 | * | | Director Retirement Agreement with George F. Hasman | | Incorporated by reference to Exhibit 10.9 of Middlefield Banc Corp.’s Annual Report on Form 10-K for the Year Ended December 31, 2001, filed on March 28, 2002 |
| | | | | | | |
| | 10.10 | * | | Director Retirement Agreement with Donald D. Hunter | | Incorporated by reference to Exhibit 10.10 of Middlefield Banc Corp.’s Annual Report on Form 10-K for the Year Ended December 31, 2001, filed on March 28, 2002 |
| | | | | | | |
| | 10.11 | * | | Director Retirement Agreement with Martin S. Paul | | Incorporated by reference to Exhibit 10.11 of Middlefield Banc Corp.’s Annual Report on Form 10-K for the Year Ended December 31, 2001, filed on March 28, 2002 |
24
| | | | | | | |
| exhibit | | | | |
| number | | description | | location |
| | | | | | | |
| | 10.12 | * | | Amended Director Retirement Agreement with Donald E. Villers | | Incorporated by reference to Exhibit 10.12 of Middlefield Banc Corp.’s Form 8-K Current Report filed on January 9, 2008 |
| | | | | | | |
| | 10.13 | * | | Executive Survivor Income Agreement (aka DBO agreement [death benefit only]) with Donald L. Stacy | | Incorporated by reference to Exhibit 10.14 of Middlefield Banc Corp.’s Annual Report on Form 10-K for the Year Ended December 31, 2003, filed on March 30, 2004 |
| | | | | | | |
| | 10.14 | * | | DBO Agreement with Jay P. Giles | | Incorporated by reference to Exhibit 10.15 of Middlefield Banc Corp.’s Annual Report on Form 10-K for the Year Ended December 31, 2003, filed on March 30, 2004 |
| | | | | | | |
| | 10.15 | * | | DBO Agreement with Alfred F. Thompson Jr. | | Incorporated by reference to Exhibit 10.16 of Middlefield Banc Corp.’s Annual Report on Form 10-K for the Year Ended December 31, 2003, filed on March 30, 2004 |
| | | | | | | |
| | 10.16 | * | | DBO Agreement with Nancy C. Snow | | Incorporated by reference to Exhibit 10.17 of Middlefield Banc Corp.’s Annual Report on Form 10-K for the Year Ended December 31, 2003, filed on March 30, 2004 |
| | | | | | | |
| | 10.17 | * | | DBO Agreement with Theresa M. Hetrick | | Incorporated by reference to Exhibit 10.18 of Middlefield Banc Corp.’s Annual Report on Form 10-K for the Year Ended December 31, 2003, filed on March 30, 2004 |
| | | | | | | |
| | 10.18 | * | | DBO Agreement with Jack L. Lester | | Incorporated by reference to Exhibit 10.19 of Middlefield Banc Corp.’s Annual Report on Form 10-K for the Year Ended December 31, 2003, filed on March 30, 2004 |
| | | | | | | |
| | 10.19 | * | | DBO Agreement with James R. Heslop, II | | Incorporated by reference to Exhibit 10.20 of Middlefield Banc Corp.’s Annual Report on Form 10-K for the Year Ended December 31, 2003, filed on March 30, 2004 |
| | | | | | | |
| | 10.20 | * | | DBO Agreement with Thomas G. Caldwell | | Incorporated by reference to Exhibit 10.21 of Middlefield Banc Corp.’s Annual Report on Form 10-K for the Year Ended December 31, 2003, filed on March 30, 2004 |
| | | | | | | |
| | 10.21 | * | | Form of Indemnification Agreement with directors of Middlefield Banc Corp. and with executive officers of Middlefield Banc Corp. and The Middlefield Banking Company | | Incorporated by reference to Exhibit 99.1 of Middlefield Banc Corp.’s registration statement on Form 10, Amendment No. 1, filed on June 14, 2001 |
| | | | | | | |
| | 10.22 | * | | Annual Incentive Plan Summary | | Incorporated by reference to the summary description of the annual incentive plan included as Exhibit 10.22 of Middlefield Banc Corp.’s Form 8-K Current Report filed on December 16, 2005 |
| | | | | | | |
| | 10.23 | * | | Amended Executive Deferred Compensation Agreement with Thomas G. Caldwell | | Incorporated by reference to Exhibit 10.23 of Middlefield Banc Corp.’s Form 8-K Current Report filed on May 9, 2008 |
| | | | | | | |
| | 10.24 | * | | Amended Executive Deferred Compensation Agreement with James R. Heslop, II | | Incorporated by reference to Exhibit 10.24 of Middlefield Banc Corp.’s Form 8-K Current Report filed on May 9, 2008 |
25
| | | | | | | |
| exhibit | | | | |
| number | | description | | location |
| | | | | | | |
| | 10.25 | * | | Amended Executive Deferred Compensation Agreement with Donald L. Stacy | | Incorporated by reference to Exhibit 10.25 of Middlefield Banc Corp.’s Form 8-K Current Report filed on May 9, 2008 |
| | | | | | | |
| | 13 | | | Portions of the Annual Report for the year ended December 31, 2008 | | Incorporated by reference into this Form 10-K |
| | | | | | | |
| | 20 | | | Management’s Annual Report on Internal Control Over Financial Reporting | | filed herewith |
| | | | | | | |
| | 21 | | | Subsidiaries of Middlefield Banc Corp. | | filed herewith |
| | | | | | | |
| | 23 | | | Consent of S.R. Snodgrass, A.C., independent auditors of Middlefield Banc Corp. | | filed herewith |
| | | | | | | |
| | 31.1 | | | Rule 13a-14(a) certification of Chief Executive Officer | | filed herewith |
| | | | | | | |
| | 31.2 | | | Rule 13a-14(a) certification of Chief Financial Officer | | filed herewith |
| | | | | | | |
| | 32 | | | Rule 13a-14(b) certification | | filed herewith |
| | | |
| * | | management contract or compensatory plan or arrangement |
26
Signatures
Pursuant to the requirements of Section 13 or 15(d) of the Securities Exchange Act of 1934, the registrant has duly caused this report to be signed on its behalf by the undersigned, thereunto duly authorized.
| | | | | |
| | Middlefield Banc Corp.
| |
| | By: | /s/ Thomas G. Caldwell | |
| | | Thomas G. Caldwell | |
| | | President and Chief Executive Officer | |
| | | March 20, 2009 | |
Pursuant to the requirements of the Securities Exchange Act of 1934, this report has been signed below by the following persons on behalf of the registrant and in the capacities and on the dates indicated.
| | | | | |
/s/ Thomas G. Caldwell Thomas G. Caldwell | | | | March 20, 2009 |
| President, Chief Executive Officer, and Director | | | | |
| | | | | |
| | | | March 20, 2009 |
| Donald L. Stacy, Treasurer and Chief Financial Officer | | | | |
| (Principal accounting and financial officer) | | | | |
| | | | | |
/s/ Richard T. Coyne Richard T. Coyne, Chairman of the Board | | | | March 20, 2009 |
| | | | | |
/s/ Frances H. Frank Frances H. Frank, Director | | | | March 20, 2009 |
| | | | | |
/s/ James R. Heslop, II James R. Heslop, II, Executive Vice President, | | | | March 20, 2009 |
| Chief Operating Officer, and Director | | | | |
| | | | | |
/s/ Kenneth E. Jones Kenneth E. Jones, Director | | | | March 20, 2009 |
| | | | | |
/s/ James McCaskey James McCaskey, Director | | | | March 20, 2009 |
| | | | | |
/s/ Carolyn Turk Carolyn Turk, Director | | | | March 20, 2009 |
| | | | | |
/s/ William J. Skidmore William J. Skidmore, Director | | | | March 20, 2009 |
| | | | | |
/s/ Donald E. Villers Donald E. Villers, Director | | | | March 20, 2009 |
27
| | | | | |
| Statistical Summary | | | 2 | |
| | | | | |
| Decade of Progress | | | 4 | |
| | | | | |
| Letter to Our Shareholders | | | 8 | |
| | | | | |
| Letter from the Chairman | | | 10 | |
| | | | | |
| Middlefield Banc Corp. Board of Directors | | | 11 | |
| | | | | |
| Emerald Bank Directors, Officers & Staff | | | 14 | |
| | | | | |
| Emerald Bank Branch Locations | | | 15 | |
| | | | | |
| The Middlefield Banking Company Staff | | | 16 | |
| | | | | |
| The Middlefield Banking Company Officers | | | 17 | |
| | | | | |
| The Middlefield Banking Company Branch Locations | | | 18 | |
| | | | | |
| Financials | | | 21 | |
| | | | | |
2008 Annual Report

| | | | | | | | | | | | | |
| | | 1999 | | | 2000 | | | 2001 | |
| | | | | | | | | | | | | |
| Interest Income | | $ | 11,448,619 | | | $ | 12,770,170 | | | $ | 13,706,569 | |
| Interest Expense | | | 5,048,276 | | | | 5,909,884 | | | | 6,747,922 | |
| | | | | | | | | | |
| Net Interest Income | | | 6,400,343 | | | | 6,860,286 | | | | 6,958,647 | |
| Provision for Loan Loss | | | 296,000 | | | | 275,000 | | | | 170,000 | |
| | | | | | | | | | |
| Net Interest Income After Provision for Loan Losses | | | 6,104,343 | | | | 6,585,286 | | | | 6,788,647 | |
| Noninterest Income, Including Security Gains/Losses | | | 804,358 | | | | 982,663 | | | | 1,194,193 | |
| Nonintest Expense | | | 4,254,374 | | | | 4,408,617 | | | | 4,741,374 | |
| | | | | | | | | | |
| Income Before Income Taxes | | | 2,654,327 | | | | 3,159,332 | | | | 3,241,466 | |
| Income Taxes | | | 735,318 | | | | 992,661 | | | | 970,859 | |
| | | | | | | | | | |
| Net Income | | $ | 1,919,009 | | | $ | 2,166,671 | | | $ | 2,270,607 | |
| | | | | | | | | | |
| | | | | | | | | | | | | |
| Total Assets | | $ | 165,512,453 | | | $ | 176,488,813 | | | $ | 197,857,964 | |
| Deposits | | | 135,094,459 | | | | 147,166,046 | | | | 167,382,728 | |
| Equity Capital | | | 17,689,055 | | | | 18,243,362 | | | | 19,786,807 | |
| Loans Outstanding, Net | | | 119,471,741 | | | | 133,266,893 | | | | 150,766,103 | |
| Allowance For Loan Losses | | | 1,756,137 | | | | 2,037,322 | | | | 2,062,252 | |
| Net Charge Offs (Recoveries) | | | 78,589 | | | | (6,185 | ) | | | 145,070 | |
| Full Time Employees (Average Equivalents) | | | 61 | | | | 57 | | | | 64 | |
| Number of Offices | | | 4 | | | | 4 | | | | 5 | |
| | | | | | | | | | |
| | | | | | | | | | | | | |
| Earnings Per Share | | $ | 1.25 | | | $ | 1.50 | | | $ | 1.54 | |
| Dividends Per Share | | | 0.38 | | | | 0.40 | | | | 0.52 | |
| Book Value Per Share | | | 12.13 | | | | 12.96 | | | | 13.93 | |
| Dividends Pay-out Ratio | | | 29.82 | % | | | 27.47 | % | | | 34.00 | % |
| | | | | | | | | | |
| | | | | | | | | | | | | |
| Cash Dividends Paid | | $ | 572,343 | | | $ | 595,255 | | | $ | 772,068 | |
| Return on Average Assets | | | 1.21 | % | | | 1.31 | % | | | 1.22 | % |
| Return on Average Equity | | | 11.17 | % | | | 12.83 | % | | | 11.89 | % |
Middlefield Banc Corp. 4

| | | | | | | | | | | | | | | | | | | | | | | | | | | | | |
| 2002 | | | | | 2003 | | | 2004 | | | 2005 | | | 2006 | | | 2007 | | | 2008 | |
| | | | | | | | | | | | | | | | | | | | | | | | | | | | | |
| $ | 14,119,963 | | | | | $ | 14,647,163 | | | $ | 15,732,536 | | | $ | 17,378,504 | | | $ | 19,494,550 | | | $ | 24,871,934 | | | $ | 26,037,813 | |
| | 6,148,086 | | | | | | 5,724,907 | | | | 5,768,898 | | | | 6,654,614 | | | | 8,567,442 | | | | 13,530,919 | | | | 14,058,084 | |
| | | | | | | | | | | | | | | | | | | | | | |
| | 7,971,877 | | | | | | 8,922,256 | | | | 9,963,638 | | | | 10,723,890 | | | | 10,927,108 | | | | 11,341,015 | | | | 11,979,729 | |
| | 300,000 | | | | | | 315,000 | | | | 174,000 | | | | 302,000 | | | | 60,000 | | | | 429,391 | | | | 608,000 | |
| | | | | | | | | | | | | | | | | | | | | | |
| | 7,671,877 | | | | | | 8,607,256 | | | | 9,789,638 | | | | 10,421,890 | | | | 10,867,108 | | | | 10,911,624 | | | | 11,371,729 | |
| | 1,143,217 | | | | | | 1,428,144 | | | | 1,779,231 | | | | 2,119,237 | | | | 2,427,455 | | | | 2,632,592 | | | | 2,226,506 | |
| | 5,206,339 | | | | | | 6,105,450 | | | | 6,965,706 | | | | 7,424,640 | | | | 7,938,373 | | | | 9,372,650 | | | | 10,596,353 | |
| | | | | | | | | | | | | | | | | | | | | | |
| | 3,608,755 | | | | | | 3,929,950 | | | | 4,603,163 | | | | 5,116,487 | | | | 5,356,190 | | | | 4,171,566 | | | | 3,001,882 | |
| | 1,107,806 | | | | | | 1,131,330 | | | | 1,330,000 | | | | 1,415,156 | | | | 1,471,943 | | | | 796,223 | | | | 387,003 | |
| | | | | | | | | | | | | | | | | | | | | | |
| $ | 2,500,949 | | | | | $ | 2,798,620 | | | $ | 3,273,163 | | | $ | 3,701,331 | | | $ | 3,884,247 | | | $ | 3,375,343 | | | $ | 2,614,879 | |
| | | | | | | | | | | | | | | | | | | | | | |
| | | | | | | | | | | | | | | | | | | | | | | | | | | | | |
| $ | 226,245,533 | | | | | $ | 262,369,448 | | | $ | 291,213,986 | | | $ | 311,214,191 | | | $ | 340,603,704 | | | $ | 434,273,056 | | | $ | 467,846,935 | |
| | 187,384,494 | | | | | | 219,839,910 | | | | 239,885,451 | | | | 249,449,640 | | | | 271,050,193 | | | | 362,918,000 | | | | 394,819,602 | |
| | 21,746,408 | | | | | | 23,504,314 | | | | 24,822,024 | | | | 27,289,365 | | | | 30,463,934 | | | | 34,961,384 | | | | 35,059,248 | |
| | 172,642,646 | | | | | | 190,358,883 | | | | 213,029,852 | | | | 231,213,699 | | | | 246,341,647 | | | | 306,146,646 | | | | 318,018,530 | |
| | 2,300,485 | | | | | | 2,521,270 | | | | 2,623,431 | | | | 2,841,098 | | | | 2,848,887 | | | | 3,299,276 | | | | 3,556,763 | |
| | 61,767 | | | | | | 94,215 | | | | 71,839 | | | | 84,333 | | | | 52,211 | | | | 415,065 | | | | 350,513 | |
| | 66 | | | | | | 72 | | | | 73 | | | | 75 | | | | 80 | | | | 91 | | | | 101 | |
| | 5 | | | | | | 6 | | | | 6 | | | | 6 | | | | 8 | | | | 9 | | | | 10 | |
| | | | | | | | | | | | | | | | | | | | | | |
| | | | | | | | | | | | | | | | | | | | | | | | | | | | | |
| $ | 1.68 | | | | | $ | 1.89 | | | $ | 2.18 | | | $ | 2.50 | | | $ | 2.60 | | | $ | 2.17 | | | $ | 1.72 | |
| | 0.58 | | | | | | 0.65 | | | | 0.72 | | | | 0.80 | | | | 0.87 | | | | 0.94 | | | | 1.03 | |
| | 15.35 | | | | | | 16.49 | | | | 17.67 | | | | 19.25 | | | | 20.30 | | | | 22.56 | | | | 22.83 | |
| | 34.30 | % | | | | | 34.37 | % | | | 32.72 | % | | | 31.69 | % | | | 33.43 | % | | | 43.07 | % | | | 60.25 | % |
| | | | | | | | | | | | | | | | | | | | | | |
| | | | | | | | | | | | | | | | | | | | | | | | | | | | | |
| $ | 857,751 | | | | | $ | 961,901 | | | $ | 1,070,833 | | | $ | 1,173,044 | | | $ | 1,298,567 | | | $ | 1,453,707 | | | $ | 1,575,482 | |
| | 1.17 | % | | | | | 1.13 | % | | | 1.17 | % | | | 1.23 | % | | | 1.22 | % | | | 0.85 | % | | | 0.58 | % |
| | 12.08 | % | | | | | 12.39 | % | | | 13.36 | % | | | 14.43 | % | | | 13.59 | % | | | 10.06 | % | | | 7.91 | % |
NOTES: (1) The above per share amounts have been restated to reflect a two for one stock split effected in 2000 and 5% stock dividends paid in 2002, 2003, 2004, 2005, 2006 and 2007.
2008 Annual Report 5
Thomas G. Caldwell —President and Chief Executive Officer
To our Shareholders and Friends
Safe. Solid. Sound.
Perhaps in our lifetime, those three words have never carried such significant meaning. They do, however, fully convey the status of our company and its two affiliate banks. With a global economic crisis serving as a backdrop, I am pleased to report that during 2008 we achieved strong profitability and consistent asset growth, while maintaining a solid capital base.
Net income for the year 2008 was $2.6 million. While representing a decline from the prior year’s earnings, it also reflects on the ability of your company to navigate through turbulent economic times that have found many larger financial service companies reporting record losses. Our diluted earnings per share were $1.69. This provided us the ability to add to our capital, while paying an increased cash dividend of $1.03 per share.
In our letter to you last year, we discussed the broader economic turmoil that was experienced in 2007. The year 2008, as we all now know, proved to be even a far more challenging year for the directors and management teams of Middlefield Banc Corp., The Middlefield Banking Company (Middlefield) and Emerald Bank (Emerald). We have taken, and will continue to take, strategic actions that will continue to position our company as a bastion of strength and stability in a battered industry.
Beginning in 2008, the U.S. Treasury’s Troubled Asset Relief Program/Capital Purchase Program facilitated the flow of taxpayer dollars from Washington to many of the large financial institutions in the form of capital injections. The stated goal of these programs is to provide financial strength to the industry and to encourage lending.
While this goal may be noble in nature, we have determined to not be participants in these programs. Your company and its banks maintain capital positions in excess of regulatory well-capitalized standards. Furthermore, we are open for lending and have never hesitated in working to provide necessary funding to those within our communities. It is the basis of what we do day-in and day-out. The same may be said for the great majority of our peers within the industry.
We are pleased to report that total assets at the end of 2008 stood at $467.9 million, representing growth of 7.7% from the total reported at the end of 2007. While this level of growth is slightly below what we have experienced in recent years, it is reflective of market conditions during the past year. Pricing on both deposits and loans became somewhat irrational as several of our large competitors struggled to maintain liquidity and to achieve positive earnings. While there remains some questionable pricing within the industry, we have seen the same diminish as some of the large institutions have been forced into consolidation and others have fallen under more strict regulatory oversight.
Middlefield Banc Corp. 8
Also during 2008, our service base expanded with the opening of the Cortland office of Middlefield in June and the purchase of an existing branch by Emerald in November, located in Westerville. Both of these offices will have a short-term negative impact on earnings. However, we do view both markets as presenting strong growth opportunities and fitting for our focus on community-based one-on-one banking.
Deposit levels ended 2008 at $394.8 million, an increase of $31.9 million over the prior year-end. While the greater portion of that growth came within higher costing certificates of deposit, lower rate products also saw moderate levels of increase. Our net loans outstanding finished 2008 at $318.0 million. Although not reaching the levels that we desired, this balance does represent an increase during the year of $11.9 million. We continue to seek good lending opportunities within our communities and are appreciative of your willingness to direct the same to us.
Earnings were impacted by higher costs in both salaries and occupancy associated with expansion of our branch networks. Similarly, our data processing costs increased, indicative of the larger customer base being served and the broader array of products and services offered. Our provision for loan losses for the year was $608,000. This figure is driven by increased loan delinquency, a direct result of the economic climate within which we operate. Finally, the uncertainty in the economy is exhibited in wide swings in pricing for investment securities. This led to our recording an other-than-temporary impairment charge on two mortgage backed securities held at Middlefield in the amount of $376,000. We do expect that the final loss, if any, will be considerably less than that amount.
As we have continued our transition of Emerald Bank to a full service commercial bank, it was our pleasure to welcome James L. Long as President and Chief Executive Officer of that affiliate. Jim brings more than thirty years of sound financial services experience, having spent the majority of his career in the central Ohio markets. Glenn E. Aidt, Emerald’s founding President, continues to provide valuable insights, serving as Vice Chairman of Emerald’s board of directors.
Middlefield Banc Corp. board member Donald E. Villers will be retiring at the 2009 Annual Meeting of Shareholders. Don first joined Middlefield in 1987 and has contributed to our growth by shaping our focus on those most key to our success – our local communities. We wish to thank Mr. Villers for his dedicated service and leadership. We wish him well in his future endeavors.
As we look toward 2009 and the potential of an economic recovery in 2010, please be comfortable in the knowledge that we are managing the company for long-term success. Our company and our banks are well-capitalized and our balance sheet remains strong. We will continue to face the challenges based in economic activity, credit quality, and real estate values, but our efforts remain focused, being guided by active management with a disciplined, sound approach.
We are appreciative of the confidence that you continue to have in our ability to provide a safe investment and a sound return. Our optimism for the future is grounded in our belief in private ownership of financial service companies and our commitment to provide only the finest in community-based financial services. It is these guiding principles that keep Middlefield Banc Corp. safe, solid, and sound.
Sincerely,
Thomas G. Caldwell
President and Chief Executive Officer
2008 Annual Report 9
Richard T. Coyne — Chairman, Board of Directors
Chairman’s Report to the Shareholders
In two thousand and eight our traditional banking policies successfully helped us through a turbulent year. Middlefield Banc Corp. was able to grow its assets, deposits and net loans.
The communities of Cortland and Westerville have enthusiastically welcomed our new branches. We expect these new branches to grow and prosper.
We are proud of our officers and employees who continue the work of making our community bank a positive experience for all our customers.
Our focus will remain on improving our products and services and in providing a good return to our shareholders.
Thank you for your support of Middlefield Banc Corp.
Very truly yours,
Richard T. Coyne
Chairman, Board of Directors
Middlefield Banc Corp. 10
Board of Directors
| | | | | | | |
| | Richard T. Coyne — 1997
Chairman, Board of Directors,
Middlefield Banc Corp.
The Middlefield Banking Company
Retired: Jaco Products and Capital Plastics | |  | | James J. McCaskey — 2004
President
McCaskey Landscape and Design, LLC |
| | | | | | | |
| | Donald E. Villers — 1987
Retired: Copperweld Steel | |  | | Carolyn J. Turk, C.P.A. — 2004
Chief Financial Officer/Treasurer
Molded Fiber Glass Companies |
| | | | | | | |
| | Frances H. Frank — 1995
Secretary/Treasurer
The Frank Agency, Inc. | |  | | William J. Skidmore — 2007
Northeast Ohio Senior District Manager
Waste Management of Ohio, Inc. |
| | | | | | | |
| | Thomas G. Caldwell — 1997
President and Chief Executive Officer
Middlefield Banc Corp.
The Middlefield Banking Company | |  | | Kenneth E. Jones — 2008
President
Chesapeake Financial Advisors |
| | | | | | | |
| | James R. Heslop, II — 2001
Executive Vice President/
Chief Operating Officer
Middlefield Banc Corp.
The Middlefield Banking Company | |  | | Robert W. Toth* — 2008
Retired: Gold Key Processing, Ltd |
| | | |
| * | | denotes The Middlefield Banking Company Director only |
2008 Annual Report 11
Middlefield Banc Corp. 12
Board of Directors
Kenneth E. Jones — 2004
Chairman, Board of Directors, Emerald Bank
President
Chesapeake Financial Advisors
Glenn E. Aidt — 2004
Vice Chairman, Board of Directors, Emerald Bank
George J. Kontogiannis, AIA — 2004
Chief Executive Officer
The Kontogiannis Companies
Joseph C. Zanetos — 2004
President
Anthony-Thomas Candy Co.
Clayton W. Rose, III, C.P.A. — 2006
Shareholder
Rea & Associates, Inc.
Thomas G. Caldwell — 2007
President and Chief Executive Officer
Middlefield Banc Corp.
The Middlefield Banking Company
Richard T. Coyne — 2007
Chairman, Board of Directors, Middlefield Banc Corp.
The Middlefield Banking Company
Retired: Jaco Products and Capital Plastics
James L. Long — 2008
President and Chief Executive Officer
Emerald Bank
Officers
James L. Long — 2008
President and Chief Executive Officer
Glenn E. Aidt — 2004
Vice Chairman
Donald L. Stacy — 2007
Chief Financial Officer and Treasurer
Eric A. Forrest — 2008
Assistant Vice President
Commercial Banking
Charles T. Woodson — 2008
Banking Officer
Westerville Branch Manager
Staff
Dublin Office:
Barbara Howard — 2004 —Accounting Clerk
Valorie Thorpe — 2004 —Branch Supervisor
Georgia Wilkerson — 2004 —Loan Processor
Elaine Gaub — 2005 —Customer Services
Lisa Stokes — 2006 —Customer Services
Westerville Branch:
Rebekah Bolton — 2008 —Customer Services
Tracy Needham — 2008 — Customer Services
Nathan Reynolds — 2008 —Customer Services
Middlefield Banc Corp. 14
 Dublin BranchDrive up ATM
6215 Perimeter Drive,
Dublin, OH 43017
614.793.4631
• fax: 614.793.8922
 Westerville BranchDrive up ATM
17 North State Street,
Westerville, OH 43081
614.890.7832
• fax: 614.890.4633
2008 Annual Report 15

Staff
Main Office:
Kevin Mitchell — 2007 —Branch Manager
Louise Fenselon — 1984 —Head Teller
Bonnie Steele — 1985 —Customer Services
Diana Koller — 1998 —Teller
Amanda Cummings — 2006 —Teller
Jenna Janssen — 2006 —Teller*
Jeanette Meardith — 2006 —Receptionist
Kristina Stephens — 2006 —Customer Services
Darlene Beaver — 2007 —Teller
Linda Chandler — 2007 —Teller
Katie Wolfert — 2007 —Teller*
Brenda Bowden — 2008 —Teller
West Branch:
Patti Haendel — 1982 —Customer Services
Rachel Lilly — 1985 —Head Teller
Rachel Reese — 2005 —Teller*
Amy Kothera — 2006 —Teller
Jodi Fisher — 2008 —Teller
Linda Hammel — 2008 —Teller
Brandon Mihalisin — 2008 —Teller*
Bethany Pentek — 2008 —Teller
Becky Starcher — 2008 —Teller*
Garrettsville Branch:
Gretchen Cram — 2008 —Branch Manager
Vickie Moss — 1998 —Teller
Colleen Steele — 1998 —Teller
Nicole Meszaros — 2005 —Teller
Dawn Semich — 2005 —Customer Services
LynnRae Derthick — 2006 —Teller
Leah McPhail — 2006 —Teller*
Mantua Branch:
Joan Sweet — 2002 —Branch Manager
Rebecca Reinard — 2002 —Head Teller
Jodie Lawless — 2004 —Teller
Jamie Alexander — 2007—Teller*
Chardon Branch:
Amanda DiMeolo — 2001 —Customer Services
Gretchen Mihalic — 2001 —Teller*
Kim Koynock — 2005 —Teller*
Beverly Palinsky — 2005 —Teller*
Dorothy Brown — 2006 —Head Teller
Orwell Branch:
Jennifer Gabrielson — 1997 —Branch Manager
Jessica Slusher — 2006 —Teller*
Lisa Swango — 2006 —Customer Services
Michelle Scott — 2007 —Teller
Melissa Gay — 2008 —Teller*
Heather Rokosky — 2008 —Teller*
Newbury Branch:
Kathryn Shanholtzer — 2007 —Branch Manager
Diane Thomas — 2006 —Teller*
Susan Grosik — 2008 —Teller
Helen Milburn — 2008 —Customer Services
Cortland Branch:
Tiffany Stewart — 2005 —Teller
Onita Kocka — 2008 —Teller*
Sherry Krok — 2008 —Customer Services
Donna Marcello — 2008 —Teller*
Loan Department:
Helen Stowe — 1985 —Loan Administrative Assistant
Jane Armstrong — 1998 —Lender
Vivian Helmick — 1998 —Loan Administrative Assistant
Carolyn Fackler — 2001 —Loan Administrative Assistant
Sarah Brook — 2004 — Loan Administrative Assistant
Jamie Peck — 2003 —Loan Collection Manager
Sue Trumbull — 2005 —Loan Receptionist
Joan Limpert — 2006 —Loan Administrative Assistant
Brian Martinko — 2006 —Lender
Operations:
Karen Westover — 1983 —Bookkeeper
Pamela Malcuit — 1989 —Bookkeeper
Donna Williams — 1990 —Bookkeeper
Lauren Harth — 1995 —Audit Assistant*
Tara Morgan — 1997 —Proof Operator
Bonnie Hofstetter — 1998 —Courier*
Lisa Sanborn — 2000 —Bookkeeper
Melody Askey — 2005 —Compliance Assistant
Marcia Dziczkowski — 2008 —Float Teller
David Harth — 2008 —Facility Maintenance
Linda Moore — 2008 —Float Teller
Carrie Reiter — 2008 —Courier*
Financial Services:
Thomas Hart — 2004 —Financial Consultant
Middlefield Banc Corp. 16
Officers
Thomas G. Caldwell — 1986
President and Chief Executive Officer
James R. Heslop, II — 1996
Executive Vice President
Chief Operating Officer
Teresa M. Hetrick — 1996
Senior Vice President
Operations/Administration
Jay P. Giles — 1998
Senior Vice President
Senior Lender
Donald L. Stacy — 1999
Senior Vice President
Chief Financial Officer
Dennis E. Linville — 2006
Senior Vice President
Area Executive
Kathleen M. Johnson — 1971
Vice President
Chief Accounting Officer
Joann Vance — 1986
Vice President
Human Resource Administrator
Christine A. Polzer — 1989
Vice President
Network Administrator
Jack L. Lester — 1990
Vice President
Compliance and Security Officer
Alfred F. Thompson, Jr. — 1996
Vice President
Loan Administration
Sharon R. Jarold — 2001
Vice President/Lending
Thomas Munson — 2003
Vice President/Lending
Karen Branham — 1983
Assistant Vice President
Bookkeeping Manager
Gail Neikirk — 1983
Assistant Vice President
Executive Secretary
Thomas R. Neikirk — 1994
Assistant Vice President
West Branch Manager
Marlin J. Moschell — 2000
Assistant Vice President
Orwell Lending Officer
Timothy McCreary — 2004
Assistant Vice President
Chardon Branch Manager
Matthew Bellin — 2006
Assistant Vice President
Commercial Lender
Kathy Vanek — 1998
Banking Officer
Cortland Branch Manager
2008 Annual Report 17
| | | |
| |  |
| |
Main OfficeWalk up ATM
15985 East High Street, P.O. Box 35
Middlefield, Ohio 44062
888.801.1666• 440.632.1666• fax: 440.632.1700 | | Chardon BranchDrive up ATM
348 Center Street, P.O. Box 1078
Chardon, Ohio 44024
888.801.1666• 440.286.1222• fax: 440.286.1111 |
| | | |
| | |
| |
Garrettsville BranchDrive up ATM
8058 State Street
Garrettsville, Ohio 44231
888.801.2121• 330.527.2121• fax: 330.527.4210 | | Newbury BranchDrive up ATM
11110 Kinsman Road, Suite 1, P.O. Box 208
Newbury, Ohio 44065
888.801.1666• 440.564.7000• fax: 440.564.7004 |
Middlefield Banc Corp. 18
| | | |
| |  |
| |
Middlefield West BranchDrive up ATM
15545 West High Street, P.O. Box 35
Middlefield, Ohio 44062
888.801.1666• 440.632.1666• fax: 440.632.9781 | | Orwell BranchDrive up ATM
30 South Maple Street, P.O. Box 66
Orwell, Ohio 44076
888.801.1666• 440.437.7200• fax: 440.437.1111 |
| | | |
| |  |
| |
Mantua BranchWalk up ATM
10519 Main Street, P.O. Box 648
Mantua, Ohio 44255
877.274.0881• 330.274.0881• fax: 330.274.0883 | | Cortland BranchDrive up ATM
3450 Niles-Cortland Road, P.O. Box 636
Cortland, Ohio 44410
888.801.1666• 330.637.3208• fax: 330.637.3207 |
2008 Annual Report 19
Middlefield Banc Corp. 20
| | | | | |
| Consolidated Financial Statements | | | 22 | |
| | | | | |
| Notes to Consolidated Financial Statements | | | 26 | |
| | | | | |
| Management’s Discussion and Analysis | | | 54 | |
| | | | | |
| Shareholder Information | | | 70 | |
2008 Annual Report 21

| | | | | | | | | |
| | | December 31, | |
| Consolidated Balance Sheet | | 2008 | | | 2007 | |
| |
ASSETS | | | | | | | | |
| Cash and due from banks | | $ | 9,795,248 | | | $ | 9,072,972 | |
| Federal funds sold | | | 7,548,000 | | | | 8,631,963 | |
| Interest-bearing deposits in other institutions | | | 112,215 | | | | 110,387 | |
| | | | | | | |
| Cash and cash equivalents | | | 17,455,463 | | | | 17,815,322 | |
| Investment securities available for sale | | | 104,270,366 | | | | 85,967,764 | |
| Loans | | | 321,575,293 | | | | 309,445,922 | |
| Less allowance for loan losses | | | 3,556,763 | | | | 3,299,276 | |
| | | | | | | |
| Net loans | | | 318,018,530 | | | | 306,146,646 | |
| Premises and equipment | | | 8,448,915 | | | | 7,044,685 | |
| Goodwill | | | 4,558,687 | | | | 4,371,206 | |
| Bank-owned life insurance | | | 7,440,687 | | | | 7,153,381 | |
| Accrued interest and other assets | | | 7,654,287 | | | | 5,774,052 | |
| | | | | | | |
| | | | | | | | | |
TOTAL ASSETS | | $ | 467,846,935 | | | $ | 434,273,056 | |
| | | | | | | |
| | | | | | | | | |
LIABILITIES | | | | | | | | |
| Deposits: | | | | | | | | |
| Noninterest-bearing demand | | $ | 42,357,154 | | | $ | 41,348,219 | |
| Interest-bearing demand | | | 26,404,660 | | | | 19,566,035 | |
| Money market | | | 27,845,438 | | | | 22,684,041 | |
| Savings | | | 68,968,844 | | | | 76,895,857 | |
| Time | | | 229,243,506 | | | | 202,423,848 | |
| | | | | | | |
| Total deposits | | | 394,819,602 | | | | 362,918,000 | |
| Short-term borrowings | | | 1,886,253 | | | | 1,510,607 | |
| Other borrowings | | | 33,903,019 | | | | 32,395,319 | |
| Accrued interest and other liabilities | | | 2,178,813 | | | | 2,487,746 | |
| | | | | | | |
| | | | | | | | | |
TOTAL LIABILITIES | | $ | 432,787,687 | | | $ | 399,311,672 | |
| | | | | | | |
| | | | | | | | | |
STOCKHOLDERS’ EQUITY | | | | | | | | |
| Common stock, no par value; 10,000,000 shares authorized, 1,725,381 and 1,701,546 shares issued | | | 27,301,403 | | | | 26,650,123 | |
| Retained earnings | | | 14,786,353 | | | | 13,746,956 | |
| Accumulated other comprehensive loss | | | (294,901 | ) | | | (52,969 | ) |
| Treasury stock, at cost; 189,530 shares in 2008 and 151,745 shares in 2007 | | | (6,733,607 | ) | | | (5,382,726 | ) |
| | | | | | | |
| | | | | | | | | |
TOTAL STOCKHOLDERS’ EQUITY | | | 35,059,248 | | | | 34,961,384 | |
| | | | | | | |
| | | | | | | | | |
TOTAL LIABILITIES AND STOCKHOLDERS’ EQUITY | | $ | 467,846,935 | | | $ | 434,273,056 | |
| | | | | | | |
See accompanying notes to consolidated financial statements.
Middlefield Banc Corp. 22

| | | | | | | | | | | | | |
| | | Year Ended December 31, | |
| Consolidated Statement of Income | | 2008 | | | 2007 | | | 2006 | |
| | | | | | | | | | | | | |
INTEREST AND DIVIDEND INCOME | | | | | | | | | | | | |
| Interest and fees on loans | | $ | 21,426,372 | | | $ | 21,063,258 | | | $ | 17,092,516 | |
| Interest-bearing deposits in other institutions | | | 12,468 | | | | 155,550 | | | | 20,175 | |
| Federal funds sold | | | 135,104 | | | | 498,040 | | | | 117,115 | |
| Investment securities: | | | | | | | | | | | | |
| Taxable | | | 2,538,237 | | | | 1,265,673 | | | | 1,143,375 | |
| Tax-exempt | | | 1,810,319 | | | | 1,773,292 | | | | 1,038,318 | |
| Other dividend income | | | 115,313 | | | | 116,121 | | | | 83,051 | |
| | | | | | | | | | |
TOTAL INTEREST AND DIVIDEND INCOME | | | 26,037,813 | | | | 24,871,934 | | | | 19,494,550 | |
| | | | | | | | | | |
| | | | | | | | | | | | | |
INTEREST EXPENSE | | | | | | | | | | | | |
| Deposits | | | 12,352,211 | | | | 11,633,010 | | | | 7,157,226 | |
| Short-term borrowings | | | 46,084 | | | | 92,720 | | | | 167,475 | |
| Other borrowings | | | 1,120,491 | | | | 1,269,910 | | | | 1,226,877 | |
| Junior subordinated debt | | | 539,298 | | | | 535,279 | | | | 15,864 | |
| | | | | | | | | | |
TOTAL INTEREST EXPENSE | | | 14,058,084 | | | | 13,530,919 | | | | 8,567,442 | |
| | | | | | | | | | |
| | | | | | | | | | | | | |
NET INTEREST INCOME | | | 11,979,729 | | | | 11,341,015 | | | | 10,927,108 | |
| | | | | | | | | | | | | |
| Provision for loan losses | | | 608,000 | | | | 429,391 | | | | 60,000 | |
| | | | | | | | | | |
| | | | | | | | | | | | | |
NET INTEREST INCOME AFTER PROVISION FOR LOAN LOSSES | | | 11,371,729 | | | | 10,911,624 | | | | 10,867,108 | |
| | | | | | | | | | |
| | | | | | | | | | | | | |
NONINTEREST INCOME | | | | | | | | | | | | |
| Service charges on deposit accounts | | | 1,888,059 | | | | 1,954,992 | | | | 1,800,173 | |
| Investment securities gains (losses), net | | | (344,049 | ) | | | 7,942 | | | | (5,868 | ) |
| Earnings on bank-owned life insurance | | | 287,305 | | | | 280,638 | | | | 239,761 | |
| Other income | | | 395,191 | | | | 389,020 | | | | 393,389 | |
| | | | | | | | | | |
TOTAL NONINTEREST INCOME | | | 2,226,506 | | | | 2,632,592 | | | | 2,427,455 | |
| | | | | | | | | | |
| | | | | | | | | | | | | |
NONINTEREST EXPENSE | | | | | | | | | | | | |
| Salaries and employee benefits | | | 4,911,671 | | | | 4,458,075 | | | | 3,675,120 | |
| Occupancy | | | 885,904 | | | | 745,935 | | | | 507,250 | |
| Equipment | | | 539,040 | | | | 525,250 | | | | 440,878 | |
| Data processing costs | | | 803,230 | | | | 699,185 | | | | 634,707 | |
| Professional fees | | | 586,873 | | | | 422,991 | | | | 333,932 | |
| Ohio state franchise tax | | | 468,000 | | | | 424,873 | | | | 360,000 | |
| Advertising | | | 372,988 | | | | 316,112 | | | | 331,644 | |
| Postage and freight | | | 243,765 | | | | 208,554 | | | | 189,629 | |
| Other expense | | | 1,784,882 | | | | 1,571,675 | | | | 1,465,213 | |
| | | | | | | | | | |
TOTAL NONINTEREST EXPENSE | | | 10,596,353 | | | | 9,372,650 | | | | 7,938,373 | |
| | | | | | | | | | |
| Income before income taxes | | | 3,001,882 | | | | 4,171,566 | | | | 5,356,190 | |
| Income taxes | | | 387,003 | | | | 796,223 | | | | 1,471,943 | |
| | | | | | | | | | |
NET INCOME | | $ | 2,614,879 | | | $ | 3,375,343 | | | $ | 3,884,247 | |
| | | | | | | | | | |
| | | | | | | | | | | | | |
EARNINGS PER SHARE | | | | | | | | | | | | |
| Basic | | $ | 1.72 | | | $ | 2.17 | | | $ | 2.61 | |
| Diluted | | | 1.69 | | | | 2.14 | | | | 2.57 | |
See accompanying notes to consolidated financial statements.
2008 Annual Report 23

| | | | | | | | | | | | | | | | | | | | | | | | | | | | | |
| | | | | | | | | | | | | | | Accumulated | | | | | | | | | | | |
| | | | | | | | | | | | | | | Other | | | | | | | Total | | | | |
| Consolidated Statement of | | Common Stock | | | Retained | | | Comprehensive | | | Treasury | | | Stockholders’ | | | Comprehensive | |
| Changes in Stockholders’ Equity | | Shares | | | Amount | | | Earnings | | | Income (Loss) | | | Stock | | | Equity | | | Income (Loss) | |
Balance, December 31, 2005 | | $ | 1,434,987 | | | $ | 15,976,335 | | | $ | 14,959,891 | | | $ | (677,088 | ) | | $ | (2,969,773 | ) | | $ | 27,289,365 | | | | | |
| | | | | | | | | | | | | | | | | | | | | | | | | | | | | |
| Net income | | | | | | | | | | | 3,884,247 | | | | | | | | | | | | 3,884,247 | | | $ | 3,884,247 | |
| Other comprehensive income: | | | | | | | | | | | | | | | | | | | | | | | | | | | | |
| Unrealized gain on available-for-sale securities, net of reclassification adjustment, net of taxes of $80,416 | | | | | | | | | | | | | | | 156,101 | | | | | | | | 156,101 | | | | 156,101 | |
| | | | | | | | | | | | | | | | | | | | | | | | | | | | |
| Comprehensive income | | | | | | | | | | | | | | | | | | | | | | | | | | $ | 4,040,348 | |
| | | | | | | | | | | | | | | | | | | | | | | | | | | | |
| Exercise of stock options | | | 2,439 | | | | 62,115 | | | | | | | | | | | | | | | | 62,115 | | | | | |
| Purchase of treasury stock | | | | | | | | | | | | | | | | | | | (238,534 | ) | | | (238,534 | ) | | | | |
| Common stock issued | | | 7,420 | | | | 305,711 | | | | | | | | | | | | | | | | 305,711 | | | | | |
| Five percent stock dividend (including cash paid for fractional shares) | | | 67,284 | | | | 2,842,749 | | | | (2,859,600 | ) | | | | | | | | | | | (16,851 | ) | | | | |
| Dividend reinvestment plan | | | 7,757 | | | | 320,347 | | | | | | | | | | | | | | | | 320,347 | | | | | |
| Cash dividends ($.87 per share) | | | | | | | | | | | (1,298,567 | ) | | | | | | | | | | | (1,298,567 | ) | | | | |
| | | | | | | | | | | | | | | | | | | | | | | |
| |
Balance, December 31, 2006 | | | 1,519,887 | | | | 19,507,257 | | | | 14,685,971 | | | | (520,987 | ) | | | (3,208,307 | ) | | | 30,463,934 | | | | | |
| | | | | | | | | | | | | | | | | | | | | | | |
| | | | | | | | | | | | | | | | | | | | | | | | | | | | | |
| Net income | | | | | | | | | | | 3,375,343 | | | | | | | | | | | | 3,375,343 | | | $ | 3,375,343 | |
| Other comprehensive income: | | | | | | | | | | | | | | | | | | | | | | | | | | | | |
| Unrealized gain on available-for-sale securities, net of reclassification adjustment, net of taxes of $241,100 | | | | | | | | | | | | | | | 468,018 | | | | | | | | 468,018 | | | | 468,018 | |
| | | | | | | | | | | | | | | | | | | | | | | | | | | | |
| Comprehensive income | | | | | | | | | | | | | | | | | | | | | | | | | | $ | 3,843,361 | |
| | | | | | | | | | | | | | | | | | | | | | | | | | | | |
| Exercise of stock options | | | 538 | | | | 14,182 | | | | | | | | | | | | | | | | 14,182 | | | | | |
| Expense related to stock options | | | | | | | 26,435 | | | | 12,695 | | | | | | | | | | | | 39,130 | | | | | |
| Purchase of treasury stock (56,665 shares) | | | | | | | | | | | | | | | | | | | (2,174,419 | ) | | | (2,174,419 | ) | | | | |
| Common stock issued as a result of the acquisition of Emerald Bank | | | 92,447 | | | | 3,662,750 | | | | | | | | | | | | | | | | 3,662,750 | | | | | |
| Common stock issued | | | 5,735 | | | | 221,360 | | | | | | | | | | | | | | | | 221,360 | | | | | |
| Five percent stock dividend (including cash paid for fractional shares) | | | 73,547 | | | | 2,857,301 | | | | (2,873,346 | ) | | | | | | | | | | | (16,045 | ) | | | | |
| Dividend reinvestment plan | | | 9,392 | | | | 360,838 | | | | | | | | | | | | | | | | 360,838 | | | | | |
| Cash dividends ($.94 per share) | | | | | | | | | | | (1,453,707 | ) | | | | | | | | | | | (1,453,707 | ) | | | | |
| | | | | | | | | | | | | | | | | | | | | | | |
| |
Balance, December 31, 2007 | | | 1,701,546 | | | | 26,650,123 | | | | 13,746,956 | | | | (52,969 | ) | | | (5,382,726 | ) | | | 34,961,384 | | | | | |
| | | | | | | | | | | | | | | | | | | | | | | |
| | | | | | | | | | | | | | | | | | | | | | | | | | | | | |
| Net income | | | | | | | | | | | 2,614,879 | | | | | | | | | | | | 2,614,879 | | | $ | 2,614,879 | |
| Other comprehensive income: | | | | | | | | | | | | | | | | | | | | | | | | | | | | |
| Unrealized loss on available-for-sale securities, net of reclassification adjustment, net of tax benefit of $124,632 | | | | | | | | | | | | | | | (241,932 | ) | | | | | | | (241,932 | ) | | | (241,932 | ) |
| | | | | | | | | | | | | | | | | | | | | | | | | | | | |
| Comprehensive income | | | | | | | | | | | | | | | | | | | | | | | | | | $ | 2,372,947 | |
| | | | | | | | | | | | | | | | | | | | | | | | | | | | |
| Exercise of stock options | | | 992 | | | | 19,642 | | | | | | | | | | | | | | | | 19,642 | | | | | |
| Expense related to stock options | | | | | | | 15,048 | | | | | | | | | | | | | | | | 15,048 | | | | | |
| Purchase of treasury stock (37,785 shares) | | | | | | | | | | | | | | | | | | | (1,350,881 | ) | | | (1,350,881 | ) | | | | |
| Common stock issued | | | 6,888 | | | | 194,514 | | | | | | | | | | | | | | | | 194,514 | | | | | |
| Dividend reinvestment plan | | | 15,955 | | | | 422,076 | | | | | | | | | | | | | | | | 422,076 | | | | | |
| Cash dividends ($1.03 per share) | | | | | | | | | | | (1,575,482 | ) | | | | | | | | | | | (1,575,482 | ) | | | | |
| | | | | | | | | | | | | | | | | | | | | | | |
| | | | | | | | | | | | | | | | | | | | | | | | | | | | | |
Balance, December 31, 2008 | | $ | 1,725,381 | | | $ | 27,301,403 | | | $ | 14,786,353 | | | $ | (294,901 | ) | | $ | (6,733,607 | ) | | $ | 35,059,248 | | | | | |
| | | | | | | | | | | | | | | | | | | | | | | |
| | | | | | | | | | | | | |
| | | 2008 | | | 2007 | | | 2006 | |
| Components of comprehensive income (loss): | | | | | | | | | | | | |
| Change in net unrealized gain (loss) on investments available for sale | | $ | (469,004 | ) | | $ | 472,771 | | | $ | 152,228 | |
| Realized losses (gains) included in net income, net of taxes of $116,977, $2,448, and $1,995 | | | 227,072 | | | | (4,753 | ) | | | 3,873 | |
| | | | | | | | | | |
| | | | | | | | | | | | | |
TOTAL | | $ | (241,932 | ) | | $ | 468,018 | | | $ | 156,101 | |
| | | | | | | | | | |
See accompanying notes to consolidated financial statements.
Middlefield Banc Corp. 24
| | | | | | | | | | | | | |
| | | Year Ended December 31, | |
| Consolidated Statement of Cash Flows | | 2008 | | | 2007 | | | 2006 | |
| |
OPERATING ACTIVITIES | | | | | | | | | | | | |
| Net income | | $ | 2,614,879 | | | $ | 3,375,343 | | | $ | 3,884,247 | |
| Adjustments to reconcile net income to net cash provided by operating activities: | | | | | | | | | | | | |
| Provision for loan losses | | | 608,000 | | | | 429,391 | | | | 60,000 | |
| Depreciation and amortization | | | 645,186 | | | | 597,741 | | | | 578,592 | |
| Amortization of premium and discount on investment securities | | | 182,656 | | | | 226,766 | | | | 233,044 | |
| Amortization of net deferred loan fees | | | (143,673 | ) | | | (65,763 | ) | | | (78,577 | ) |
| Investment securities (gains) losses, net | | | 344,049 | | | | (7,942 | ) | | | 5,868 | |
| Earnings on bank-owned life insurance | | | (287,305 | ) | | | (280,638 | ) | | | (239,761 | ) |
| Deferred income taxes | | | (269,947 | ) | | | 97,308 | | | | (58,058 | ) |
| Compensation expense on stock options | | | 15,048 | | | | 26,435 | | | | — | |
| Increase in accrued interest receivable | | | 94,061 | | | | (292,056 | ) | | | (87,907 | ) |
| Decrease (increase) in accrued interest payable | | | (210,461 | ) | | | 540,144 | | | | 350,939 | |
| Other, net | | | (395,623 | ) | | | (352,696 | ) | | | (142,067 | ) |
| | | | | | | | | | |
| Net cash provided by operating activities | | | 3,196,870 | | | | 4,294,033 | | | | 4,506,320 | |
| | | | | | | | | | |
| | | | | | | | | | | | | |
INVESTING ACTIVITIES | | | | | | | | | | | | |
| Investment securities available for sale: | | | | | | | | | | | | |
| Proceeds from repayments and maturities | | | 16,912,691 | | | | 10,583,584 | | | | 11,109,971 | |
| Purchases | | | (39,061,652 | ) | | | (32,990,009 | ) | | | (16,932,389 | ) |
| Proceeds from sales | | | 2,953,089 | | | | — | | | | 658,976 | |
| Investment securities held to maturity: | | | | | | | | | | | | |
| Proceeds from repayments and maturities | | | — | | | | — | | | | 95,643 | |
| Proceeds from sale of securities | | | — | | | | 102,942 | | | | — | |
| Increase in loans, net | | | (13,388,057 | ) | | | (20,959,699 | ) | | | (15,109,371 | ) |
| Acquisition of subsidiary bank | | | — | | | | (1,828,301 | ) | | | — | |
| Purchase of Federal Home Loan Bank stock | | | (142,100 | ) | | | (91,100 | ) | | | (93,000 | ) |
| Purchase of bank-owned life insurance | | | — | | | | — | | | | (1,000,000 | ) |
| Purchase of premises and equipment | | | (1,407,631 | ) | | | (570,065 | ) | | | (585,837 | ) |
| Proceeds from the sale of other real estate owned | | | — | | | | 61,229 | | | | — | |
| Deposit acquisition premium | | | — | | | | (2,124,212 | ) | | | — | |
| | | | | | | | | | |
| Net cash used for investing activities | | $ | (34,133,660 | ) | | $ | (47,815,631 | ) | | $ | (21,856,007 | ) |
| | | | | | | | | | |
| | | | | | | | | | | | | |
FINANCING ACTIVITIES | | | | | | | | | | | | |
| Net increase in deposits | | $ | 25,804,674 | | | $ | 38,528,910 | | | $ | 21,600,553 | |
| Increase (decrease) in short-term borrowings, net | | | 375,645 | | | | (99,131 | ) | | | (5,101,176 | ) |
| Proceeds from other borrowings | | | 13,500,000 | | | | 2,000,000 | | | | 16,248,000 | |
| Repayment of other borrowings | | | (11,992,300 | ) | | | (8,967,419 | ) | | | (6,713,473 | ) |
| Purchase of treasury stock | | | (1,350,881 | ) | | | (2,174,419 | ) | | | (238,534 | ) |
| Exercise of stock options | | | 19,642 | | | | 14,182 | | | | 62,115 | |
| Common stock issued | | | — | | | | 221,360 | | | | 305,711 | |
| Proceeds from dividend reinvestment plan | | | 616,590 | | | | 360,838 | | | | 320,347 | |
| Tax effect of stock options | | | — | | | | 12,695 | | | | — | |
| Cash dividends | | | (1,575,482 | ) | | | (1,469,752 | ) | | | (1,315,418 | ) |
| Net cash received from deposit acquisition | | | 5,179,043 | | | | 19,270,054 | | | | — | |
| | | | | | | | | | |
| Net cash provided by financing activities | | | 30,576,931 | | | | 47,697,318 | | | | 25,168,125 | |
| | | | | | | | | | |
| Increase (decrease) in cash and cash equivalents | | | (359,859 | ) | | | 4,175,720 | | | | 7,818,438 | |
| | | | | | | | | | | | | |
CASH AND CASH EQUIVALENTS AT BEGINNING OF YEAR | | | 17,815,322 | | | | 13,639,602 | | | | 5,821,164 | |
| | | | | | | | | | |
CASH AND CASH EQUIVALENTS AT END OF YEAR | | $ | 17,455,463 | | | $ | 17,815,322 | | | $ | 13,639,602 | |
| | | | | | | | | | |
SUPPLEMENTAL INFORMATION | | | | | | | | | | | | |
| Cash paid during the year for: | | | | | | | | | | | | |
| Interest on deposits and borrowings | | $ | 14,268,548 | | | $ | 12,910,196 | | | $ | 8,216,503 | |
| Income taxes | | | 600,000 | | | | 850,000 | | | | 1,498,363 | |
| | | | | | | | | | |
| |
SUMMARY OF BUSINESS ACQUISITION | | | | | | | | | | | | |
| Fair value of tangible assets acquired | | $ | — | | | $ | 42,657,925 | | | $ | — | |
| Fair value of core deposit intangible acquired | | | — | | | | 103,781 | | | | — | |
| Fair value of liabilities assumed | | | — | | | | (38,408,610 | ) | | | — | |
| Stock issued for the purchase of acquired company’s common stock | | | — | | | | (3,662,750 | ) | | | — | |
| Cash paid in the acquisition | | | — | | | | (3,887,110 | ) | | | — | |
| Deferred tax asset | | | — | | | | 889,361 | | | | — | |
| | | | | | | | | | |
| Goodwill recognized | | $ | — | | | $ | (2,307,403 | ) | | $ | — | |
| | | | | | | | | | |
See accompanying notes to consolidated financial statements.
2008 Annual Report 25
| 1. | | SUMMARY OF SIGNIFICANT ACCOUNTING POLICIES |
A summary of the significant accounting and reporting policies applied in the presentation of the accompanying financial statements follows:
Nature of Operations and Basis of Presentation
Middlefield Banc Corp. (the “Company”) is an Ohio corporation organized to become the holding company of The Middlefield Banking Company (“MBC”). MBC is a state-chartered bank located in Ohio. On April 19, 2007, Middlefield Banc Corp. acquired Emerald Bank (“EB”), an Ohio-chartered savings bank headquartered in Dublin, Ohio. The Company and its subsidiaries derive substantially all of their income from banking and bank-related services, which includes interest earnings on residential real estate, commercial mortgage, commercial and consumer financings as well as interest earnings on investment securities and deposit services to its customers through ten locations. The Company is supervised by the Board of Governors of the Federal Reserve System, while MBC and EB are subject to regulation and supervision by the Federal Deposit Insurance Corporation and the Ohio Division of Financial Institutions.
The consolidated financial statements of the Company include its wholly owned subsidiaries, MBC and EB (the “Banks”). Significant intercompany items have been eliminated in preparing the consolidated financial statements.
The financial statements have been prepared in conformity with U.S. generally accepted accounting principles. In preparing the financial statements, management is required to make estimates and assumptions that affect the reported amounts of assets and liabilities as of the balance sheet date and revenues and expenses for the period. Actual results could differ significantly from those estimates.
Investment Securities
Investment securities are classified at the time of purchase, based on management’s intention and ability, as securities held to maturity or securities available for sale. Debt securities acquired with the intent and ability to hold to maturity are stated at cost adjusted for amortization of premium and accretion of discount, which are computed using a level yield method and recognized as adjustments of interest income. Certain other debt securities have been classified as available for sale to serve principally as a source of liquidity. Unrealized holding gains and losses for available-for-sale securities are reported as a separate component of stockholders’ equity, net of tax, until realized. Realized security gains and losses are computed using the specific identification method. Interest and dividends on investment securities are recognized as income when earned.
Common stock of the Federal Home Loan Bank (“FHLB”) represents ownership in an institution that is wholly owned by other financial institutions. This equity security is accounted for at cost and classified with other assets.
Securities are periodically reviewed for other-than-temporary impairment based upon a number of factors including, but not limited to, the length of time and extent to which the market value has been less than cost, the financial condition of the underlying issuer, the ability of the issuer to meet contractual obligations, the likelihood of the security’s ability to recover any decline in its market value, and management’s intent and ability to hold the security for a period of time sufficient to allow for a recovery in market value. Among the factors that are considered in determining management’s intent and ability is a review of the Company’s capital adequacy, interest rate risk position, and liquidity. The assessment of a security’s ability to recover any decline in market value, the ability of the issuer to meet contractual obligations, and management’s intent and ability requires considerable judgment. A decline in value that is considered to be other-than-temporary is recorded as a loss within noninterest income in the Consolidated Statement of Income.
Middlefield Banc Corp. 26
Loans
Loans are reported at their principal amount net of the allowance for loan losses. Interest income is recognized as income when earned on the accrual method. The accrual of interest is discontinued on a loan when management believes, after considering economic and business conditions, the borrower’s financial condition is such that collection of interest is doubtful. Interest received on non-accrual loans is recorded as income or applied against principal according to management’s judgment as to the collectibility of such principal.
Loan origination fees and certain direct loan origination costs are being deferred and the net amount amortized as an adjustment of the related loan’s yield. Management is amortizing these amounts over the contractual life of the related loans.
Allowance for Loan Losses
The allowance for loan losses represents the amount which management estimates is adequate to provide for probable loan losses inherent in its loan portfolio. The allowance method is used in providing for loan losses. Accordingly, all loan losses are charged to the allowance, and all recoveries are credited to it. The allowance for loan losses is established through a provision for loan losses which is charged to operations. The provision is based on management’s periodic evaluation of the adequacy of the allowance for loan losses, which encompasses the overall risk characteristics of the various portfolio segments, past experience with losses, the impact of economic conditions on borrowers, and other relevant factors. The estimates used in determining the adequacy of the allowance for loan losses, including the amounts and timing of future cash flows expected on impaired loans, are particularly susceptible to significant change in the near term.
A loan is considered impaired when it is probable the borrower will not repay the loan according to the original contractual terms of the loan agreement. Management has determined that first mortgage loans on one-to-four family properties and all consumer loans represent large groups of smaller-balance homogeneous loans that are to be collectively evaluated. Loans that experience insignificant payment delays, which are defined as 90 days or less, generally are not classified as impaired. A loan is not impaired during a period of delay in payment if the Company expects to collect all amounts due, including interest accrued, at the contractual interest rate for the period of delay. All loans identified as impaired are evaluated independently by management. The Company estimates credit losses on impaired loans based on the present value of expected cash flows or the fair value of the underlying collateral if the loan repayment is expected to come from the sale or operation of such collateral. Impaired loans, or portions thereof, are charged off when it is determined a realized loss has occurred. Until such time, an allowance for loan losses is maintained for estimated losses. Cash receipts on impaired loans are applied first to accrued interest receivable unless otherwise required by the loan terms, except when an impaired loan is also a non-accrual loan, in which case the portion of the payment related to interest is recognized as income.
Mortgage loans secured by one-to-four family properties and all consumer loans are large groups of smaller-balance homogeneous loans and are measured for impairment collectively. Loans that experience insignificant payment delays, which are defined as 90 days or less, generally are not classified as impaired. Management determines the significance of payment delays on a case-by-case basis, taking into consideration all circumstances concerning the loan, the creditworthiness and payment history of the borrower, the length of the payment delay, and the amount of shortfall in relation to the principal and interest owed.
Premises and Equipment
Premises and equipment are stated at cost net of accumulated depreciation. Depreciation is computed on the straight-line method over the estimated useful lives of the assets, which range from 3 to 20 years for furniture, fixtures, and equipment and 3 to 40 years for buildings and leasehold improvements. Expenditures for maintenance and repairs are charged against income as incurred. Costs of major additions and improvements are capitalized.
2008 Annual Report 27
Goodwill
Goodwill represents the excess of the cost of businesses acquired over the fair value of the net assets acquired. The Company accounts for goodwill in accordance with Statement of Financial Accounting Standards (“FAS”) No. 142, “Goodwill and Other Intangible Assets.” This statement, among other things, requires a two-step process for testing the impairment of goodwill on at least an annual basis. This approach could cause more volatility in the Company’s reported net income because impairment losses, if any, could occur irregularly and in varying amounts. The Company performs an annual impairment analysis of goodwill based on the fair value of the reporting unit determined by estimating the expected present value of future cash flows.
Intangible Assets
Intangible assets include core deposit intangibles, which are a measure of the value of consumer demand and savings deposits acquired in business combinations accounted for as purchases. The core deposit intangibles are being amortized to expense over a 10 year life on a straight-line basis. The recoverability of the carrying value of intangible assets is evaluated on an ongoing basis, and permanent declines in value, if any, are charged to expense.
Bank-Owned Life Insurance (BOLI)
The Company owns insurance on the lives of a certain group of key employees. The policies were purchased to help offset the increase in the costs of various fringe benefit plans including healthcare. The cash surrender value of these policies is included as an asset on the consolidated balance sheet and any increases in the cash surrender value are recorded as noninterest income on the consolidated statements of income. In the event of the death of an insured individual under these policies, the Company would receive a death benefit, which would be recorded as noninterest income.
Income Taxes
The Company and its subsidiaries file a consolidated federal income tax return. Deferred tax assets and liabilities are reflected at currently enacted income tax rates applicable to the period in which the deferred tax assets or liabilities are expected to be realized or settled. As changes in tax laws or rates are enacted, deferred tax assets and liabilities are adjusted through the provision for income taxes.
Earnings Per Share
The Company provides dual presentation of basic and diluted earnings per share. Basic earnings per share are calculated utilizing net income as reported in the numerator and average shares outstanding in the denominator. The computation of diluted earnings per share differs in that the dilutive effects of any stock options, warrants, and convertible securities are adjusted in the denominator.
Stock-Based Compensation
The Company accounts for stock compensation based on the grant date fair value of all share-based payment awards that are expected to vest, including employee share options to be recognized as employee compensation expense over the requisite service period.
The cash flows from the tax benefits resulting from tax deductions in excess of the compensation cost recognized for stock-based awards (excess tax benefits) are classified as financing cash flows. Excess tax benefits of $12,695 have been classified as a financing cash inflow for the year ended December 31, 2007, in the Consolidated Statement of Cash Flows. There were no excess tax benefits recognized in 2008 and 2006.
Middlefield Banc Corp. 28
For purposes of computing results, the Company estimated the fair values of stock options using the Black-Scholes option-pricing model. The model requires the use of subjective assumptions that can materially affect fair value estimates. Therefore, the pro forma results are estimates of results of operations as if compensation expense had been recognized for the stock option plans. The fair value of each option is amortized into compensation expense on a straight-line basis between the grant date for the option and each vesting date. The fair value of each stock option granted was estimated using the following weighted-average assumptions:
| | | | | | | | | | | | | | | | | |
| | | Expected | | | Risk-Free | | | Expected | | | Expected Life | |
| Grant Year | | Dividend Yield | | | Interest Rate | | | Volatility | | | (in years) | |
| 2006 | | | 2.27 | | | | 4.67 | | | | 7.18 | | | | 9.94 | |
| 2007 | | | 2.53 | | | | 3.70 – 4.80 | | | | 4.09 | | | | 9.94 | |
| 2008 | | | 8.54 | | | | 3.53 – 3.73 | | | | 33.29 | | | | 9.94 | |
During the years ended December 31, 2008 and 2007, the Company recorded $15,048 and $26,435 of compensation cost related to unvested share-based compensation awards granted in 2007 and 2006, respectively. As of December 31, 2008, there was approximately $66,981 of unrecognized compensation cost related to unvested share-based compensation awards granted in 2008 that is expected to be recognized in 2009.
The weighted-average fair value of each stock option granted for 2008, 2007, and 2006, was $2.70, $3.35, and $7.19, respectively. The total intrinsic value of options exercised during the years ended December 31, 2008, 2007, and 2006, was $5,486, $2,717, and $16,219, respectively.
Cash Flow Information
The Company has defined cash and cash equivalents as those amounts included in the Consolidated Balance Sheet captions as “Cash and due from banks,” “Federal funds sold,” and “Interest-bearing deposits with other institutions” with original maturities of less than 90 days.
Advertising Costs
Advertising costs are expensed as the costs are incurred. Advertising expenses amounted to $372,988, $316,112, and $331,644, for 2008, 2007, and 2006, respectively.
Reclassification of Comparative Amounts
Certain comparative amounts for prior years have been reclassified to conform to current-year presentations. Such reclassifications did not affect net income or retained earnings.
Recent Accounting Pronouncements
In December 2007, the FASB issued FAS No. 141 (revised 2007),Business Combinations(“FAS 141(R)”), which establishes principles and requirements for how an acquirer recognizes and measures in its financial statements the identifiable assets acquired, the liabilities assumed, and any noncontrolling interest in an acquiree, including the recognition and measurement of goodwill acquired in a business combination. FAS No. 141(R) is effective for fiscal years beginning on or after December 15, 2008. Earlier adoption is prohibited. The Company is currently evaluating the impact the adoption of the standard will have on the Company’s results of operations.
2008 Annual Report 29

In December 2007, the FASB issued FAS No. 160,Noncontrolling Interests in Consolidated Financial Statements — an amendment of ARB No. 51.FAS No. 160 amends ARB No. 51 to establish accounting and reporting standards for the noncontrolling interest in a subsidiary and for the deconsolidation of a subsidiary. It clarifies that a noncontrolling interest in a subsidiary, which is sometimes referred to as minority interest, is an ownership interest in the consolidated entity that should be reported as equity in the consolidated financial statements. Among other requirements, this statement requires consolidated net income to be reported at amounts that include the amounts attributable to both the parent and the noncontrolling interest. It also requires disclosure, on the face of the consolidated income statement, of the amounts of consolidated net income attributable to the parent and to the noncontrolling interest. FAS No. 160 is effective for fiscal years beginning on or after December 15, 2008. Earlier adoption is prohibited. The Company is currently evaluating the impact the adoption of the standard will have on the Company’s results of operations.
In March 2008, the FASB issued FAS No. 161,Disclosures about Derivative Instruments and Hedging Activities, to require enhanced disclosures about derivative instruments and hedging activities. The new standard has revised financial reporting for derivative instruments and hedging activities by requiring more transparency about how and why an entity uses derivative instruments; how derivative instruments and related hedged items are accounted for under FAS No. 133,Accounting for Derivative Instruments and Hedging Activities; and how derivative instruments and related hedged items affect an entity’s financial position, financial performance, and cash flows. FAS No. 161 requires disclosure of the fair values of derivative instruments and their gains and losses in a tabular format. It also requires entities to provide more information about their liquidity by requiring disclosure of derivative features that are credit risk-related. Further, it requires cross-referencing within footnotes to enable financial statement users to locate important information about derivative instruments. FAS No. 161 is effective for financial statements issued for fiscal years and interim periods beginning after November 15, 2008, with early application encourage. The adoption of this standard is not expected to have a material effect on the Company’s results of operations or financial position.
In June 2008, the FASB ratified EITF Issue No. 08-4,Accounting for Convertible Securities with Beneficial Conversion Features or Contingently Adjusted Conversion Ratios.This issue provides transition guidance for conforming changes made to EITF Issue No. 98-5,Accounting for Convertible Securities with Beneficial Conversion Features or Contingently Adjusted Conversion Ratios,that resulted from EITF Issue No. 00-27,Application of Issue No. 98-5 to Certain Convertible Instruments,and FAS No. 150,Accounting for Certain Financial Instruments with Characteristics of both Liability and Equity.The conforming changes are effective for financial statements issued for fiscal years ending after December 15, 2008, with earlier application permitted. The adoption of this FSP is not expected to have a material effect on the Company’s results of operations or financial position.
In May 2008, the FASB issued FASB Staff Position (FSP) No. APB 14-1,Accounting for Convertible Debt Instruments That May Be Settled in Cash upon Conversion (Including Partial Cash Settlement). This FSP provides guidance on the accounting for certain types of convertible debt instruments that may be settled in cash upon conversion. Additionally, this FSP specifies that issuers of such instruments should separately account for the liability and equity components in a manner that will reflect the entity’s nonconvertible debt borrowing rate when interest cost is recognized in subsequent periods. The FSP is effective for financial statements issued for fiscal years beginning after December 15, 2008, and interim periods within those fiscal years. The adoption of this FSP is not expected to have a material effect on the Company’s results of operations or financial position.
In February 2008, the FASB Staff Position (FSP) issued FSP No. FAS 140-3,Accounting for Transfers of Financial Assets and Repurchase Financing Transactions.This FSP concludes that a transferor and transferee should not separately account for a transfer of a financial asset and a related repurchase financing unless (a) the two transactions have a valid and distinct business or economic purpose for being entered into separately, and (b) the repurchase financing does not result in the initial transferor regaining control over the financial asset. The FSP is effective for financial statements issued for fiscal years beginning on or after November 15, 2008, and interim periods within those fiscal years. The adoption of this FSP is not expected to have a material effect on the Company’s results of operations or financial position.
Middlefield Banc Corp. 30
In April 2008, the FASB issued FASB Staff Position (FSP) No. 142-3,Determination of the Useful Life of Intangible Assets(“FSP 142-3”). FSP 142-3 amends the factors that should be considered in developing assumptions about renewal or extension used in estimating the useful life of a recognized intangible asset under FAS No. 142,Goodwill and Other Intangible Assets.This standard is intended to improve the consistency between the useful life of a recognized intangible asset under FAS No. 142 and the period of expected cash flows used to measure the fair value of the asset under FAS No. 141R and other GAAP. FSP 142-3 is effective for financial statements issued for fiscal years beginning after December 15, 2008. The measurement provisions of this standard will apply only to intangible assets of the Company acquired after the effective date.
In June 2008, the FASB issued FASB Staff Position (FSP) No. EITF 03-6-1,Determining Whether Instruments Granted in Share-Based Payment Transactions Are Participating Securities,to clarify that instruments granted in share-based payment transactions can be participating securities prior to the requisite service having been rendered. A basic principle of the FSP is that unvested share-based payment awards that contain nonforfeitable rights to dividends or dividend equivalents (whether paid or unpaid) are participating securities and are to be included in the computation of EPS pursuant to the two-class method. The provisions of this FSP are effective for financial statements issued for fiscal years beginning after December 15, 2008, and interim periods within those years. All prior-period EPS data presented (including interim financial statements, summaries of earnings, and selected financial data) are required to be adjusted retrospectively to conform to the provisions of the FSP. The adoption of this FSP is not expected to have a material effect on the Company’s results of operations or financial position.
In October 2008, the FASB issued FSP No. 157-3,Determining the Fair Value of a Financial Asset When the Market for That Asset is not Active.This FSP clarifies the application of FAS Statement No. 157,Fair Value Measurements,in a market that is not active and provides an example to illustrate key considerations in determining the fair value of a financial asset when the market for that financial asset is not active. This FSP shall be effective upon issuance, including prior periods for which financial statements have not been issued. Revisions resulting from a change in the valuation technique or its application shall be accounted for as a change in accounting estimate (FAS Statement No. 154,Accounting Changes and Error Corrections). The disclosure provisions of Statement 154 for a change in accounting estimate are not required for revisions resulting from a change in valuation technique or its application. The Company is currently evaluating the impact the adoption of the FSP will have on the Company’s results of operations.
In December 2008, the FASB issued FASB Staff Position (FSP) No. FAS 132(R)-1,Employers’ Disclosures about Postretirement Benefit Plan Assets. This FSP amends FASB Statement No. 132 (revised 2003),Employers’ Disclosures about Pensions and Other Postretirement Benefits, to improve an employer’s disclosures about plan assets of a defined benefit pension or other postretirement plan. The disclosures about plan assets required by the FSP are to be provided for fiscal years ending after December 15, 2009. The Company is currently evaluating the impact the adoption of the FSP will have on the Company’s results of operations.
| 2. | | MERGERS AND ACQUISITIONS |
On November 15, 2006, Middlefield Banc Corp. entered into an Agreement and Plan of Merger for the acquisition of Emerald Bank, an Ohio-chartered savings bank headquartered in Dublin, Ohio. Middlefield Banc Corp. organized an interim bank subsidiary under Ohio commercial bank law to carry out the merger with Emerald Bank. The Agreement and Plan of Merger was amended on January 3, 2007 to make the new interim bank subsidiary, known as EB Interim Bank, a party to the agreement. At the effective time of the merger Emerald Bank merged into the new interim subsidiary, which is the surviving corporation and which operates under the name Emerald Bank as a wholly owned commercial bank subsidiary of Middlefield Banc Corp. The purchase price for Emerald Bank totaled $7,326,890 with one half of the merger consideration payable in cash and the other half in shares of Middlefield Banc Corp. common stock. The merger was approved by both bank regulators and Emerald Bank stockholders. The transaction was completed on April 19, 2007. Emerald Bank operates as a separate banking subsidiary of Middlefield Banc Corp. under the Emerald Bank name, employing a commercial bank charter.
2008 Annual Report 31
The following unaudited pro forma condensed combined financial information presents the results of operations of the Company had the merger taken place at January 1, 2007.
| | | | | | | | | |
| | | Twelve Months Ended December 31, | |
| | | 2008 | | | 2007 | |
| Interest income | | $ | 26,037,813 | | | $ | 25,712,096 | |
| Interest expense | | | 14,058,084 | | | | 14,041,702 | |
| | | | | | | |
| Net interest income | | | 11,979,729 | | | | 11,670,394 | |
| Provision for loan losses | | | 608,000 | | | | 475,493 | |
| | | | | | | |
| Net interest income after provisions for loan losses | | | 11,371,729 | | | | 11,194,901 | |
| Noninterest income | | | 2,226,506 | | | | 2,659,299 | |
| Noninterest expense | | | 10,596,353 | | | | 10,385,875 | |
| | | | | | | |
| Income before income taxes | | | 3,001,882 | | | | 3,468,325 | |
| Provisions for income taxes | | | 387,003 | | | | 639,923 | |
| | | | | | | |
| Net income including restructuring charges | | | 2,614,879 | | | | 2,828,402 | |
| | | | | | | |
| Restructuring charges of $418,848, net of tax benefit of $142,408 | | | — | | | | 276,440 | |
| Net income excluding restructuring charges | | $ | 2,614,879 | | | $ | 3,104,842 | |
| | | | | | | |
| Net loss per share including restructuring charges | | | | | | | | |
| Basic | | $ | 1.72 | | | $ | 1.82 | |
| Diluted | | $ | 1.69 | | | $ | 1.79 | |
| | | | | | | |
| Net income per share excluding restructuring charges | | | | | | | | |
| Basic | | $ | 1.72 | | | $ | 2.00 | |
| Diluted | | $ | 1.69 | | | $ | 1.97 | |
Merger and restructuring charges are recorded in unaudited pro forma condensed combined financial information, and include incremental costs to integrate Emerald Bank with the Company’s operations. These charges represent costs associated with these one-time activities and do not represent ongoing costs of the fully integrated combined organization. These one-time charges, as shown in the table above, were expensed as incurred at Emerald Bank prior to the acquisition.
| | | | | |
| | | Twelve Months Ended December 31, | |
| | | 2007 | |
| Compensation and benefits | | $ | 40,092 | |
| Professional fees | | | 221,389 | |
| Accleleration of contracts | | | 157,367 | |
| | | | |
| Total | | $ | 418,848 | |
| | | | |
On November 9, 2008, EB completed its acquisition of certain deposit liabilities attributable to a third-party financial institution’s branch office located in Westerville, Ohio. The acquisition included management personnel, certain other assets, and retail deposits of approximately $5.9 million. EB recorded goodwill and core deposit intangible of approximately $354,995.
On August 1, 2007, MBC completed its acquisition of certain deposit liabilities attributable to a third-party financial institution’s branch office located in Middlefield, Ohio. The acquisition included management personnel and retail deposits of approximately $21 million. MBC recorded goodwill and core deposit intangible of approximately $2.1 million.
Middlefield Banc Corp. 32
There are no convertible securities that would affect the numerator in calculating basic and diluted earnings per share; therefore, net income as presented on the Consolidated Statement of Income will be used as the numerator. The following table sets forth the composition of the weighted-average common shares (denominator) used in the basic and diluted earnings per share computation.
| | | | | | | | | | | | | |
| | | 2008 | | | 2007 | | | 2006 | |
| |
| Weighted-average common shares outstanding | | | 1,710,861 | | | | 1,666,265 | | | | 1,586,463 | |
| | | | | | | | | | | | | |
| Average treasury stock shares | | | (177,888 | ) | | | (110,667 | ) | | | (92,809 | ) |
| | | | | | | | | | |
| | | | | | | | | | | | | |
| Weighted-average common shares and common stock equivalents used to calculate basic earnings per share | | | 1,532,973 | | | | 1,555,598 | | | | 1,493,654 | |
| | | | | | | | | | | | | |
| Additional common stock equivalents (stock options) used to calculate diluted earnings per share | | | 13,440 | | | | 21,649 | | | | 22,999 | |
| | | | | | | | | | |
| | | | | | | | | | | | | |
| Weighted-average common shares and common stock equivalents used to calculate diluted earnings per share | | | 1,546,413 | | | | 1,577,247 | | | | 1,516,653 | |
Options to purchase 40,307 shares of common stock at prices ranging from $30.45 to $40.24 were outstanding during the year ended December 31, 2008 but were not included in the computation of diluted earnings per share as they were anti-dilutive due to the strike price being greater than the average market price as of December 31, 2008. Options to purchase 25,897 shares of common stock at prices ranging from $36.73 to $40.24 were outstanding during the year ended December 31, 2007, but were not included in the computation of diluted earnings per share as they were anti-dilutive due to the strike price being greater than the average market price as of December 31, 2007. For the year ended December 31, 2006, there were no anti-dilutive options outstanding.
The Board of Directors approved a 5 percent stock dividend to stockholders of record as of December 1, 2007, payable December 15, 2007. As a result of the dividend, 73,547 additional shares of the Company’s common stock were issued, common stock was increased by $2,857,301, and retained earnings decreased by $2,873,346.
The Board of Directors approved a 5 percent stock dividend to stockholders of record as of December 1, 2006, payable December 15, 2006. As a result of the dividend, 67,284 additional shares of the Company’s common stock were issued, common stock was increased by $2,842,749, and retained earnings decreased by $2,859,600.
Fractional shares paid were paid in cash. All average shares outstanding and all per share amounts included in the financial statements are based on the increased number of shares after giving retroactive effects to the stock dividend.
2008 Annual Report 33
| 5. | | INVESTMENT SECURITIES AVAILABLE FOR SALE |
The amortized cost and fair values of securities available for sale are as follows:
| | | | | | | | | | | | | | | | | |
| | | | | | | Gross | | | Gross | | | | |
| | | Amortized | | | Unrealized | | | Unrealized | | | Fair | |
| 2008 | | Cost | | | Gains | | | Losses | | | Value | |
| |
| U.S. government agency securities | | $ | 4,376,650 | | | $ | 126,912 | | | $ | — | | | $ | 4,503,562 | |
| Obligations of states and political subdivisions: | | | | | | | | | | | | | | | | |
| Taxable | | | 499,528 | | | | — | | | | (3,278 | ) | | | 496,250 | |
| Tax-exempt | | | 44,328,318 | | | | 405,958 | | | | (1,050,244 | ) | | | 43,684,032 | |
| Mortgage-backed securities | | | 54,568,407 | | | | 1,042,038 | | | | (1,046,085 | ) | | | 54,564,360 | |
| | | | | | | | | | | | | |
| Total debt securities | | | 103,772,903 | | | | 1,574,908 | | | | (2,099,607 | ) | | | 103,248,204 | |
| Equity securities | | | 944,283 | | | | 141,079 | | | | (63,200 | ) | | | 1,022,162 | |
| | | | | | | | | | | | | |
| Total | | $ | 104,717,186 | | | $ | 1,715,987 | | | $ | (2,162,807 | ) | | $ | 104,270,366 | |
| | | | | | | | | | | | | |
| | | | | | | | | | | | | | | | | |
| | | | | | | Gross | | | Gross | | | | |
| | | Amortized | | | Unrealized | | | Unrealized | | | Fair | |
| 2007 | | Cost | | | Gains | | | Losses | | | Value | |
| |
| U.S. government agency securities | | $ | 7,872,500 | | | $ | 55,058 | | | $ | (422 | ) | | $ | 7,927,136 | |
| Obligations of states and political subdivisions: | | | | | | | | | | | | | | | | |
| Taxable | | | 749,234 | | | | — | | | | (6,845 | ) | | | 742,389 | |
| Tax-exempt | | | 47,262,680 | | | | 188,253 | | | | (522,389 | ) | | | 46,928,544 | |
| Mortgage-backed securities | | | 29,219,323 | | | | 161,252 | | | | (334,940 | ) | | | 29,045,635 | |
| | | | | | | | | | | | | |
| Total debt securities | | | 85,103,737 | | | | 404,563 | | | | (864,596 | ) | | | 84,643,704 | |
| Equity securities | | | 944,283 | | | | 396,477 | | | | (16,700 | ) | | | 1,324,060 | |
| | | | | | | | | | | | | |
| Total | | $ | 86,048,020 | | | $ | 801,040 | | | $ | (881,296 | ) | | $ | 85,967,764 | |
| | | | | | | | | | | | | |
The amortized cost and fair value of debt securities at December 31, 2008, by contractual maturity, are shown below. Expected maturities will differ from contractual maturities because borrowers may have the right to call or prepay obligations with or without call or prepayment penalties.
| | | | | | | | | |
| | | Amortized | | | Fair | |
| | | Cost | | | Value | |
| |
| Due in one year or less | | $ | 1,243,594 | | | $ | 1,257,988 | |
| Due after one year through five years | | | 5,638,739 | | | | 5,740,175 | |
| Due after five years through ten years | | | 12,764,409 | | | | 12,884,932 | |
| Due after ten years | | | 84,126,161 | | | | 83,365,109 | |
| | | | | | | |
| | | | | | | | | |
| Total | | $ | 103,772,903 | | | $ | 103,248,204 | |
| | | | | | | |
Investment securities with approximate carrying values of $26,102,154 and $23,974,806 at December 31, 2008 and 2007, respectively, were pledged to secure deposits and other purposes as required by law.
Proceeds from sales of investment securities available for sale were $2,953,089 during 2008. Gross gains and gross losses realized were $34,509 and $2,109, respectively, during 2008. Proceeds from sales of investment securities available for sale and gross losses realized were $658,976 and $5,868, respectively, during 2006. There were no sales of investment securities available for sale during 2007.
Middlefield Banc Corp. 34
Proceeds from the sale of investment securities held to maturity and gross gains realized were $102,942 and $7,942, respectively, during 2007. The Company transferred investment securities held to maturity with a carrying amount of $19,899 and fair value of $20,641 to investment securities available for sale during 2007. The Company no longer maintains a held-to-maturity portfolio.
The Company’s investment in two private-label collateralized mortgage obligations aggregating $1.4 million were impaired as a result of the Company’s determination that declines in their fair market value were other than temporary. As a result of this determination, the Company recognized a $376,449 before tax, non-cash charge, which was recorded as a reduction to noninterest income.
The following table shows the Company’s gross unrealized losses and fair value, aggregated by investment category and length of time that the individual securities have been in a continuous unrealized loss position, at December 31, 2008 and 2007.
| | | | | | | | | | | | | | | | | | | | | | | | | |
| | | Less than Twelve Months | | | Twelve Months or Greater | | | Total | |
| | | | | | | Gross | | | | | | | Gross | | | | | | | Gross | |
| | | Fair | | | Unrealized | | | Fair | | | Unrealized | | | Fair | | | Unrealized | |
| 2008 | | Value | | | Losses | | | Value | | | Losses | | | Value | | | Losses | |
| |
| Obligations of states and political subdivisions | | $ | 17,777,295 | | | $ | (561,005 | ) | | $ | 7,820,417 | | | $ | (492,517 | ) | | $ | 25,597,712 | | | $ | (1,053,522 | ) |
| Mortgage-backed securities | | | 16,107,618 | | | | (966,793 | ) | | | 5,062,619 | | | | (79,292 | ) | | | 21,170,237 | | | | (1,046,085 | ) |
| Equity securities | | | 221,500 | | | | (28,500 | ) | | | 11,250 | | | | (34,700 | ) | | | 232,750 | | | | (63,200 | ) |
| | | | | | | | | | | | | | | | | | | |
| | | | | | | | | | | | | | | | | | | | | | | | | |
| Total | | $ | 34,106,413 | | | $ | (1,556,298 | ) | | $ | 12,894,286 | | | $ | (606,509 | ) | | $ | 47,000,699 | | | $ | (2,162,807 | ) |
| | | | | | | | | | | | | | | | | | | |
| | | | | | | | | | | | | | | | | | | | | | | | | |
| | | Less than Twelve Months | | | Twelve Months or Greater | | | Total | |
| | | | | | | Gross | | | | | | | Gross | | | | | | | Gross | |
| | | Fair | | | Unrealized | | | Fair | | | Unrealized | | | Fair | | | Unrealized | |
| 2007 | | Value | | | Losses | | | Value | | | Losses | | | Value | | | Losses | |
| |
| U.S. government agency securities | | $ | — | | | $ | — | | | $ | 498,930 | | | $ | (422 | ) | | $ | 498,930 | | | $ | (422 | ) |
| Obligations of states and political subdivisions | | | 12,102,406 | | | | (223,753 | ) | | | 19,818,047 | | | | (305,481 | ) | | | 31,920,453 | | | | (529,234 | ) |
| Mortgage-backed securities | | | 4,753,699 | | | | (42,409 | ) | | | 12,503,364 | | | | (292,331 | ) | | | 17,257,063 | | | | (334,940 | ) |
| Equity securities | | | — | | | | — | | | | 29,250 | | | | (16,700 | ) | | | 29,250 | | | | (16,700 | ) |
| | | | | | | | | | | | | | | | | | | |
| | | | | | | | | | | | | | | | | | | | | | | | | |
| Total | | $ | 16,856,105 | | | $ | (266,362 | ) | | $ | 32,849,591 | | | $ | (614,934 | ) | | $ | 49,705,696 | | | $ | (881,296 | ) |
| | | | | | | | | | | | | | | | | | | |
There are 124 securities that are considered temporarily impaired at December 31, 2008. The Company reviews its position quarterly and has asserted that at December 31, 2008, the declines outlined in the above table represent temporary declines and the Company does have the intent and ability either to hold those securities to maturity or to allow a market recovery. The Company has concluded that these unrealized losses are not other than temporary but are the result of interest rate changes that are not expected to result in the non-collection of principal and interest during the period.
2008 Annual Report 35
Major classifications of loans are summarized as follows:
| | | | | | | | | |
| | | 2008 | | | 2007 | |
| |
| Commercial and industrial | | $ | 66,523,227 | | | $ | 67,009,564 | |
| Real estate – construction | | | 7,964,892 | | | | 6,704,054 | |
| Real estate – mortgage: | | | | | | | | |
| Residential | | | 199,354,277 | | | | 193,514,047 | |
| Commercial | | | 42,789,470 | | | | 36,818,070 | |
| Consumer installment | | | 4,943,427 | | | | 5,400,187 | |
| | | | | | | |
| | | | 321,575,293 | | | | 309,445,922 | |
| Less allowance for loan losses | | | 3,556,763 | | | | 3,299,276 | |
| | | | | | | |
| | | | | | | | | |
| Net loans | | $ | 318,018,530 | | | $ | 306,146,646 | |
| | | | | | | |
The Company’s primary business activity is with customers located within its local trade area, eastern Geauga County, and contiguous counties to the north, east, and south. Commercial, residential, consumer, and agricultural loans are granted. Although the Company has a diversified loan portfolio at December 31, 2008 and 2007, loans outstanding to individuals and businesses are dependent upon the local economic conditions in its immediate trade area.
Nonperforming loans consist of commercial and consumer loans which are on a non-accrual basis and loans contractually past due 90 days or more but are not on non-accrual status because they are well secured or in the process of collection.
Information regarding nonperforming loans at December 31 is as follows:
| | | | | | | | | |
| | | 2008 | | | 2007 | |
| |
| 90 days or more past due and accruing interest | | $ | 2,226,632 | | | $ | 1,917,480 | |
| Non-accrual loans (inclusive of impaired loans) | | | 6,254,748 | | | | 3,744,451 | |
| | | | | | | |
| | | | | | | | | |
| Total nonperforming loans | | $ | 8,481,380 | | | $ | 5,661,931 | |
| | | | | | | |
Information regarding impaired loans at December 31 is as follows:
| | | | | | | | | |
| | | 2008 | | | 2007 | |
| |
| Impaired loans without a related allowance for loan loss | | $ | — | | | $ | — | |
| Impaired loans with a related allowance for loan loss | | | 2,661,300 | | | | 2,481,272 | |
| Related allowance for loan loss | | | 439,340 | | | | 348,006 | |
| Average recorded investment in impaired loans | | | 1,886,661 | | | | 1,117,297 | |
| Interest income recognized | | | 13,078 | | | | 126,305 | |
Middlefield Banc Corp. 36
| 7. | | ALLOWANCE FOR LOAN LOSSES |
Changes in the allowance for loan losses for the years ended December 31 are as follows:
| | | | | | | | | | | | | |
| | | 2008 | | | 2007 | | | 2006 | |
| |
| Balance, January 1 | | $ | 3,299,276 | | | $ | 2,848,887 | | | $ | 2,841,098 | |
| Add: | | | | | | | | | | | | |
| Additions from acquisitions | | | — | | | | 436,063 | | | | — | |
| Provisions charged to operations | | | 608,000 | | | | 429,391 | | | | 60,000 | |
| Recoveries | | | 64,353 | | | | 13,839 | | | | 28,663 | |
| Less loans charged off | | | 414,866 | | | | 428,904 | | | | 80,874 | |
| | | | | | | | | | |
| | | | | | | | | | | | | |
| Balance, December 31 | | $ | 3,556,763 | | | $ | 3,299,276 | | | $ | 2,848,887 | |
| | | | | | | | | | |
| 8. | | PREMISES AND EQUIPMENT |
Major classifications of premises and equipment are summarized as follows:
| | | | | | | | | |
| | | 2008 | | | 2007 | |
| |
| Land and land improvements | | $ | 1,896,376 | | | $ | 1,537,930 | |
| Building and leasehold improvements | | | 8,858,066 | | | | 7,620,924 | |
| Furniture, fixtures, and equipment | | | 4,111,853 | | | | 3,801,814 | |
| | | | | | | |
| | | | 14,866,295 | | | | 12,960,668 | |
| Less accumulated depreciation and amortization | | | 6,417,380 | | | | 5,915,983 | |
| | | | | | | |
| | | | | | | | | |
| Total | | $ | 8,448,915 | | | $ | 7,044,685 | |
| | | | | | | |
Depreciation charged to operations was $518,296 in 2008, $504,058 in 2007, and $468,148 in 2006.
| 9. | | GOODWILL AND INTANGIBLE ASSETS |
Goodwill totaled $4,558,687 at December 31, 2008 and $4,371,206 at December 31, 2007. During 2008, the Company recorded goodwill totaling $187,481 in connection with the acquisition of a third-party financial institution’s branch office. In 2007, the Company recorded goodwill totaling $2,339,403 in connection with the acquisition of Emerald Bank, and the Company recorded goodwill totaling $2,031,803 in connection with the acquisition of a third-party financial institution’s branch office.
The Company recorded core deposit intangibles in 2008 of $109,300 in connection with the acquisitions of a third-party financial institution’s branch office.
The Company recorded core deposit intangibles in 2007 of $103,781 and $182,100 in connection with the acquisitions of Emerald Bank and a third-party financial institution’s branch office, respectively.
2008 Annual Report 37
Core deposit intangible assets are amortized on a straight-line basis over their estimated lives of ten years. Amortization expense totaled $30,409 in 2008 and $11,913 in 2007. The estimated aggregate future amortization expense for core deposit intangible assets as of December 31, 2008 is as follows:
| | | | | |
| 2009 | | $ | 39,518 | |
| 2010 | | | 39,518 | |
| 2011 | | | 39,518 | |
| 2012 | | | 39,518 | |
| 2013 | | | 39,518 | |
| Thereafter | | | 155,269 | |
| | | | |
| | | | | |
| Balance, December 31 | | $ | 352,859 | |
| | | | |
The components of other assets are as follows:
| | | | | | | | | |
| | | 2008 | | | 2007 | |
| |
| FHLB stock | | $ | 1,873,100 | | | $ | 1,731,000 | |
| Accrued interest on investment securities | | | 528,067 | | | | 475,043 | |
| Accrued interest on loans | | | 918,306 | | | | 1,065,391 | |
| Deferred tax asset, net | | | 1,767,873 | | | | 1,398,408 | |
| Other | | | 2,566,941 | | | | 1,104,210 | |
| | | | | | | |
| | | | | | | | | |
| Total | | $ | 7,654,287 | | | $ | 5,774,052 | |
| | | | | | | |
Time deposits at December 31, 2008, mature $159,240,534, $33,596,734, $11,213,508, $6,212,959, and $18,979,771 during 2009, 2010, 2011, 2012, and 2013, respectively.
The aggregate of all time deposit accounts of $100,000 or more amounted to $69,663,278 and $51,016,057 at December 31, 2008 and 2007, respectively.
Maturities on time deposits of $100,000 or more at December 31, 2008, are as follows:
| | | | | |
| Within three months | | $ | 11,084,068 | |
| Beyond three but within six months | | | 15,137,052 | |
| Beyond six but within twelve months | | | 18,782,587 | |
| Beyond one year | | | 24,659,571 | |
| | | | |
| | | | | |
| Total | | $ | 69,663,278 | |
| | | | |
Middlefield Banc Corp. 38
| 12. | | SHORT-TERM BORROWINGS |
The outstanding balances and related information of short-term borrowings, which includes securities sold under agreements to repurchase and federal funds purchased, are summarized as follows:
| | | | | | | | | | | | | |
| | | 2008 | | | 2007 | | | 2006 | |
| |
| Balance at year-end | | $ | 1,886,253 | | | $ | 1,510,607 | | | $ | 1,609,738 | |
| Average balance outstanding | | | 2,967,069 | | | | 2,383,902 | | | | 3,281,340 | |
| Maximum month-end balance | | | 6,057,893 | | | | 5,768,057 | | | | 8,245,406 | |
| Weighted-average rate at year-end | | | 1.10 | % | | | 2.96 | % | | | 4.35 | % |
| Weighted-average rate during the year | | | 1.55 | % | | | 3.89 | % | | | 5.10 | % |
Average balances outstanding during the year represent daily average balances, and average interest rates represent interest expense divided by the related average balance.
The Company maintains a $4,000,000 line of credit at an adjustable rate, currently 3.0 percent, from Lorain National Bank. At December 31, 2008 and December 31, 2007, there were no outstanding borrowings under this line.
Other borrowings consist of advances from the FHLB as follows:
| | | | | | | | | | | | | | | | | | | | | | | | | | | | | |
| | | | | | | | | | | Weighted- | | | Stated interest | | | | | | | |
| | | Maturity range | | | average | | | rate range | | | | | | | |
| Description | | from | | | to | | | interest rate | | | from | | | to | | | 2008 | | | 2007 | |
| Fixed rate | | | 02/13/09 | | | | 12/27/10 | | | | 4.25 | % | | | 2.61 | % | | | 5.07 | % | | $ | 4,250,000 | | | $ | 5,250,000 | |
| Fixed rate amortizing | | | 05/18/09 | | | | 09/04/28 | | | | 4.00 | | | | 2.70 | | | | 5.51 | | | | 17,405,019 | | | | 8,897,319 | |
| Convertible | | | 07/28/10 | | | | 10/09/12 | | | | 5.30 | | | | 4.14 | | | | 6.45 | | | | 4,000,000 | | | | 10,000,000 | |
| Junior subordinated debt | | | 12/21/37 | | | | 12/21/37 | | | | 6.58 | | | | 6.58 | | | | 6.58 | | | | 8,248,000 | | | | 8,248,000 | |
| | | | | | | | | | | | | | | | | | | | | | | | | | | |
| | | | | | | | | | | | | | | | | | | | | | | | | | | | | |
| | | | | | | | | | | | | | | | | | | | | | | $ | 33,903,019 | | | $ | 32,395,319 | |
| | | | | | | | | | | | | | | | | | | | | | | | | | | |
The scheduled maturities of advances outstanding, as of December 31, 2008, are as follows:
| | | | | | | | | |
| | | | | | | Weighted- | |
| Year Ending December 31, | | Amount | | | Average Rate | |
| 2009 | | $ | 7,682,102 | | | | 4.13 | % |
| 2010 | | | 6,320,897 | | | | 4.85 | |
| 2011 | | | 2,378,922 | | | | 3.92 | |
| 2012 | | | 3,819,871 | | | | 4.04 | |
| 2013 | | | 1,393,211 | | | | 3.96 | |
| Beyond 2013 | | | 12,308,016 | | | | 5.73 | |
| | | | | | | |
| | | | | | | | | |
| | | $ | 33,903,019 | | | | 4.81 | % |
| | | | | | | |
2008 Annual Report 39
The Bank entered into a ten-year “Convertible Select” fixed commitment advance arrangement with the FHLB. Rates may be reset at the FHLB’s discretion on a quarterly basis based on the three-month LIBOR rate. At each rate change, the Bank may exercise a put option and satisfy the obligation without penalty.
Fixed rate amortizing advances from the FHLB require monthly principal and interest payments and an annual 20 percent paydown of outstanding principal. Monthly principal and interest payments are adjusted after each 20 percent paydown. Under terms of a blanket agreement, collateral for the FHLB borrowings are secured by certain qualifying assets of the Bank, which consist principally of first mortgage loans. Under this credit arrangement, the Bank has a remaining borrowing capacity of approximately $78 million at December 31, 2008.
In December 2006, the Company formed a special purpose entity (“Entity”) to issue $8,000,000 of floating rate, obligated mandatorily redeemable securities and $248,000 in common securities as part of a pooled offering. The rate is fixed through January 2012 at 6.58 percent and floats quarterly thereafter, equal to LIBOR plus 1.67 percent. The Entity may redeem them, in whole or in part, at face value after January 30, 2012. The Company borrowed the proceeds of the issuance from the Entity in December 2006 in the form of an $8,248,000 note payable, which is included in the liabilities section of the Company’s Consolidated Balance Sheet. Debt issue costs of $248,000 have been capitalized and are being amortized through the first call date.
The components of other liabilities are as follows:
| | | | | | | | | |
| | | 2008 | | | 2007 | |
| |
| Accrued interest payable | | $ | 1,299,114 | | | $ | 1,509,575 | |
| Other | | | 879,699 | | | | 978,171 | |
| | | | | | | |
| | | | | | | | | |
| Total | | $ | 2,178,813 | | | $ | 2,487,746 | |
| | | | | | | |
The provision for federal income taxes consists of:
| | | | | | | | | | | | | |
| | | 2008 | | | 2007 | | | 2006 | |
| |
| Current payable | | $ | 656,950 | | | $ | 698,915 | | | $ | 1,530,001 | |
| Deferred | | | (269,947 | ) | | | 97,308 | | | | (58,058 | ) |
| | | | | | | | | | |
| | | | | | | | | | | | | |
| Total provision | | $ | 387,003 | | | $ | 796,223 | | | $ | 1,471,943 | |
| | | | | | | | | | |
Middlefield Banc Corp. 40
The tax effects of deductible and taxable temporary differences that give rise to significant portions of the deferred tax assets and deferred tax liabilities are as follows:
| | | | | | | | | |
| | | 2008 | | | 2007 | |
| | | | | | | | | |
| Deferred tax assets: | | | | | | | | |
| Allowance for loan losses | | $ | 1,114,868 | | | $ | 1,008,069 | |
| Net unrealized loss on securities | | | 151,919 | | | | 27,287 | |
| Supplemental retirement plan | | | 134,121 | | | | 123,339 | |
| Origination costs | | | 7,811 | | | | 25,115 | |
| Alternative minimum tax credits | | | 65,637 | | | | — | |
| Investment security basis adjustment | | | 127,993 | | | | — | |
| Intangibles | | | 45,295 | | | | — | |
| Net operating losses | | | 502,676 | | | | 606,806 | |
| | | | | | | |
| Gross deferred tax assets | | | 2,150,320 | | | | 1,790,616 | |
| | | | | | | |
| | | | | | | | | |
| Deferred tax liabilities: | | | | | | | | |
| Deferred origination fees, net | | | 29,523 | | | | 55,637 | |
| Premises and equipment | | | 83,425 | | | | 113,170 | |
| Other | | | 269,499 | | | | 223,400 | |
| | | | | | | |
| Gross deferred tax liabilities | | | 382,447 | | | | 392,207 | |
| | | | | | | |
| | | | | | | | | |
| Net deferred tax assets | | $ | 1,767,873 | | | $ | 1,398,409 | |
| | | | | | | |
No valuation allowance was established at December 31, 2008 and 2007, in view of the Company’s ability to carryback to taxes paid in previous years and certain tax strategies, coupled with the anticipated future taxable income as evidenced by the Company’s earnings potential.
The reconciliation between the federal statutory rate and the Company’s effective consolidated income tax rate is as follows:
| | | | | | | | | | | | | | | | | | | | | | | | | |
| | | 2008 | | | 2007 | | | 2006 | |
| | | | | | | % of | | | | | | | % of | | | | | | | % of | |
| | | | | | | Pre-tax | | | | | | | Pre-tax | | | | | | | Pre-tax | |
| | | Amount | | | Income | | | Amount | | | Income | | | Amount | | | Income | |
| Provision at statutory rate | | $ | 1,020,640 | | | | 34.0 | % | | $ | 1,418,332 | | | | 34.0 | % | | $ | 1,821,105 | | | | 34.0 | % |
| Tax-free income | | | (713,193 | ) | | | (23.8 | ) | | | (702,123 | ) | | | (16.8 | ) | | | (437,874 | ) | | | (8.2 | ) |
| Nondeductible interest expense | | | 96,250 | | | | 3.2 | | | | 102,830 | | | | 2.5 | | | | 54,673 | | | | 1.0 | |
| Other | | | (16,694 | ) | | | (0.7 | ) | | | (22,816 | ) | | | (0.6 | ) | | | 34,039 | | | | 0.6 | |
| | | | | | | | | | | | | | | | | | | |
| | | | | | | | | | | | | | | | | | | | | | | | | |
| Actual tax expense and effective rate | | $ | 387,003 | | | | 12.7 | % | | $ | 796,223 | | | | 19.1 | % | | $ | 1,471,943 | | | | 27.4 | % |
| | | | | | | | | | | | | | | | | | | |
The Company adopted the provisions of FIN No. 48,“Accounting for Uncertainty in Income Taxes, an interpretation of FASB Statement 109,”effective January 1, 2007. FIN No. 48 prescribes a recognition threshold and a measurement attribute for the financial statement recognition and measurement of a tax position taken or expected to be taken in a tax return. Benefits from tax positions should be recognized in the financial statements only when it is more likely than not that the tax position will be sustained upon examination by the appropriate taxing authority that would have full knowledge of all relevant information. A tax position that meets the more-likely-than-not recognition threshold is measured at the largest amount of benefit that is greater than fifty percent likely of being realized upon ultimate settlement. Tax positions that previously failed to meet the more-likely-than-not recognition threshold should be recognized in the first subsequent financial reporting period in which that threshold is met. Previously recognized tax positions that no longer meet the more-likely-than-not recognition threshold should be derecognized in the first subsequent financial reporting period in which that threshold is no longer met. FIN No. 48 also provides guidance on the accounting for and disclosure of unrecognized tax benefits, interest, and penalties. The adoption of FIN No. 48 did not have a significant impact on the Company’s financial statements.
2008 Annual Report 41
Retirement Plan
The Banks maintain section 401(k) employee savings and investment plans for all full-time employees and officers of the Banks with more than one year of service. The Banks’ contributions to the plans are based on 50 percent matching of voluntary contributions up to 6 percent of compensation. An eligible employee can contribute up to 15 percent of salary. Employee contributions are vested at all times, and MBC contributions are fully vested after six years beginning at the second year in 20 percent increments. EB contributions are vested at 25 percent for less than a year of employment, 50 percent after one year, 75 percent after two years, and fully vested after three years. Contributions for 2008, 2007, and 2006 to these plans amounted to $95,752, $79,959, and $71,516, respectively.
Supplemental Retirement Plan
MBC maintains a Directors’ Retirement Plan to provide postretirement payments over a ten-year period to members of the Board of Directors who have completed five or more years of service. The plan requires payment of 25 percent of the final average annual board fees paid to a director in the three years preceding the director’s retirement.
The following table illustrates the components of the net periodic pension cost for the Directors’ Retirement Plan for the years ended December 31:
| | | | | | | | | | | | | |
| | | 2008 | | | 2007 | | | 2006 | |
| | | | | | | | | | | | | |
| Components of net periodic pension costs | | | | | | | | | | | | |
| Service cost | | $ | 12,656 | | | $ | 11,991 | | | $ | 9,510 | |
| Interest cost | | | 12,813 | | | | 12,189 | | | | 9,791 | |
| | | | | | | | | | |
| | | | | | | | | | | | | |
| Net periodic pension cost | | $ | 25,469 | | | $ | 24,180 | | | $ | 19,301 | |
| | | | | | | | | | |
Executive Deferred Compensation Plan
During 2006, MBC implemented an Executive Deferred Compensation Plan (the “Plan”) to provide post-retirement payments to members of senior management. The Plan agreements are noncontributory, defined contribution arrangements that provide supplemental retirement income benefits to three officers, with contributions made solely by MBC. During 2008 and 2007, MBC contributed $26,145 and $49,932 to the Plan, respectively. There were no contributions made to the Plan in 2006.
Stock Option and Restricted Stock Plan
The Company maintains a stock option and restricted stock plan (“the Plan”) for granting incentive stock options, nonqualified stock options, and restricted stock for key officers and employees and nonemployee directors of the Company. A total of 160,000 shares of authorized and unissued or issued common stock are reserved for issuance under the Plan, which expires ten years from the date of stockholder ratification. The per share exercise price of an option granted will not be less than the fair value of a share of common stock on the date the option is granted. No option shall become exercisable earlier than one year from the date the Plan was approved by the stockholders.
Middlefield Banc Corp. 42
The following table presents share data related to the outstanding options:
| | | | | | | | | | | | | | | | | |
| | | | | | | Weighted- | | | | | | | Weighted- | |
| | | | | | | Average | | | | | | | Average | |
| | | | | | | Exercise | | | | | | | Exercise | |
| | | 2008 | | | Price | | | 2007 | | | Price | |
| Outstanding, January 1 | | | 88,211 | | | $ | 28.04 | | | | 77,287 | | | $ | 26.23 | |
| Granted | | | 24,837 | | | | 23.71 | | | | 14,840 | | | | 37.27 | |
| Exercised | | | (992 | ) | | | 19.80 | | | | (565 | ) | | | 25.10 | |
| Forfeited | | | (1,591 | ) | | | 23.48 | | | | (3,351 | ) | | | 22.11 | |
| | | | | | | | | | | | | |
| | | | | | | | | | | | | | | | | |
| Outstanding, December 31 | | | 110,465 | | | $ | 27.21 | | | | 88,211 | | | $ | 28.04 | |
| | | | | | | | | | | | | |
| Exercisable at year-end | | | 85,628 | | | | 28.22 | | | | 83,724 | | | | 27.86 | |
| | | | | | | | | | | | | |
The following table summarizes the characteristics of stock options at December 31, 2008:
| | | | | | | | | | | | | | | | | | | | | | | | | |
| | | | | | | Outstanding | | | Exercisable | |
| | | | | | | | | | | Contractual | | | Average | | | | | | | Average | |
| | | Exercise | | | | | | | Average | | | Exercise | | | | | | | Exercise | |
| Grant Date | | Price | | | Shares | | | Life | | | Price | | | Shares | | | Price | |
| June 14, 1999 | | $ | 23.70 | | | | 2,074 | | | | 0.45 | | | $ | 23.70 | | | | 2,074 | | | $ | 23.70 | |
| November 23, 1999 | | | 23.13 | | | | 2,934 | | | | 0.90 | | | | 23.13 | | | | 2,934 | | | | 23.13 | |
| December 11, 2000 | | | 17.90 | | | | 10,274 | | | | 1.95 | | | | 17.90 | | | | 10,274 | | | | 17.90 | |
| December 9, 2002 | | | 22.33 | | | | 9,552 | | | | 3.94 | | | | 22.33 | | | | 9,552 | | | | 22.33 | |
| December 8, 2003 | | | 24.29 | | | | 20,917 | | | | 4.94 | | | | 24.29 | | | | 20,917 | | | | 24.29 | |
| May 12, 2004 | | | 27.35 | | | | 907 | | | | 5.33 | | | | 27.35 | | | | 907 | | | | 27.35 | |
| December 13, 2004 | | | 30.45 | | | | 13,073 | | | | 5.95 | | | | 30.45 | | | | 13,073 | | | | 30.45 | |
| December 14, 2005 | | | 36.73 | | | | 8,595 | | | | 6.95 | | | | 36.73 | | | | 8,595 | | | | 36.73 | |
| December 10, 2006 | | | 40.24 | | | | 3,675 | | | | 7.95 | | | | 40.24 | | | | 3,675 | | | | 40.24 | |
| April 19, 2007 | | | 37.33 | | | | 9,140 | | | | 8.31 | | | | 37.33 | | | | 9,140 | | | | 37.73 | |
| May 16, 2007 | | | 37.48 | | | | 1,337 | | | | 8.41 | | | | 37.48 | | | | 1,337 | | | | 37.48 | |
| December 10, 2007 | | | 37.00 | | | | 3,150 | | | | 8.95 | | | | 37.00 | | | | 3,150 | | | | 37.00 | |
| January 2, 2008 | | | 36.25 | | | | 1,337 | | | | 9.12 | | | | 36.25 | | | | — | | | | — | |
| November 10, 2008 | | | 23.00 | | | | 23,500 | | | | 9.95 | | | | 23.00 | | | | — | | | | — | |
| | | | | | | | | | | | | | | | | | | |
| | | | | | | | | | | | | | | | | | | | | | | | | |
| | | | | | | | 110,465 | | | | | | | | | | | | 85,628 | | | | | |
| | | | | | | | | | | | | | | | | | | |
For the years ended December 31, 2008, 2007, and 2006, the Company granted 150 shares, 130 shares, and 90 shares, respectively, of common stock under the restricted stock plan. The Company recognizes compensation expense in the amount of fair value of the common stock at the grant date and as an addition to stockholders’ equity.
2008 Annual Report 43
In the normal course of business, there are various outstanding commitments and certain contingent liabilities which are not reflected in the accompanying consolidated financial statements. These commitments and contingent liabilities represent financial instruments with off-balance sheet risk. The contract or notional amounts of those instruments reflect the extent of involvement in particular types of financial instruments which were composed of the following:
| | | | | | | | | |
| | | 2008 | | | 2007 | |
| | | | | | | | | |
| Commitments to extend credit | | $ | 56,648,649 | | | $ | 49,375,176 | |
| Standby letters of credit | | | 1,357,173 | | | | 466,647 | |
| | | | | | | |
| | | | | | | | | |
| Total | | $ | 58,005,822 | | | $ | 49,841,823 | |
| | | | | | | |
These instruments involve, to varying degrees, elements of credit and interest rate risk in excess of the amount recognized in the Consolidated Balance Sheet. The Company’s exposure to credit loss, in the event of nonperformance by the other parties to the financial instruments, is represented by the contractual amounts as disclosed. The Company minimizes its exposure to credit loss under these commitments by subjecting them to credit approval and review procedures and collateral requirements as deemed necessary. Commitments generally have fixed expiration dates within one year of their origination.
Standby letters of credit are conditional commitments issued by the Company to guarantee the performance of a customer to a third party. Performance letters of credit represent conditional commitments issued by the Bank to guarantee the performance of a customer to a third party. These instruments are issued primarily to support bid or performance-related contracts. The coverage period for these instruments is typically a one-year period with an annual renewal option subject to prior approval by management. Fees earned from the issuance of these letters are recognized over the coverage period. For secured letters of credit, the collateral is typically Bank deposit instruments or customer business assets.
| 18. | | REGULATORY RESTRICTIONS |
Loans
Federal law prevents the Company from borrowing from the Banks unless the loans are secured by specific obligations. Further, such secured loans are limited in amount of 10 percent of the Banks’ common stock and capital surplus.
Dividends
MBC and EB are subject to dividend restrictions that generally limit the amount of dividends that can be paid by an Ohio state-chartered bank. Under the Ohio Banking Code, cash dividends may not exceed net profits as defined for that year combined with retained net profits for the two preceding years less any required transfers to surplus. Under this formula, for MBC, the amount available for payment of dividends for 2009 approximates $2,731,000 plus 2009 profits retained up to the date of the dividend declaration. For EB, the amount available for payment of dividends for 2009 approximates $62,000 plus 2009 profits retained up to the date of the dividend declaration.
Middlefield Banc Corp. 44
Federal regulations require the Company and the Banks to maintain minimum amounts of capital. Specifically, each is required to maintain certain minimum dollar amounts and ratios of Total and Tier I capital to risk-weighted assets and of Tier I capital to average total assets.
In addition to the capital requirements, the Federal Deposit Insurance Corporation Improvement Act (“FDICIA”) established five capital categories ranging from “well capitalized” to “critically undercapitalized.” Should any institution fail to meet the requirements to be considered “adequately capitalized,” it would become subject to a series of increasingly restrictive regulatory actions.
As of December 31, 2008 and 2007, the FDIC categorized the Banks as well capitalized under the regulatory framework for prompt corrective action. To be classified as a well capitalized financial institution, Total risk-based, Tier 1 risk-based, and Tier 1 Leverage capital ratios must be at least 10 percent, 6 percent, and 5 percent, respectively.
The Company’s and its subsidiaries’ actual capital ratios are presented in the following table that shows that all regulatory capital requirements were met as of December 31, 2008.
| | | | | | | | | | | | | | | | | | | | | | | | | |
| | | Middlefield Banc Corp. | | | The Middlefield Banking Co. | | | Emerald Bank | |
| | | December 31, | | | December 31, | | | December 31, | |
| | | 2008 | | | 2008 | | | 2008 | |
| | | Amount | | | Ratio | | | Amount | | | Ratio | | | Amount | | | Ratio | |
| |
Total Capital
(to Risk-Weighted Assets) | | | | | | | | | | | | | | | | | | | | | | | | |
| | | | | | | | | | | | | | | | | | | | | | | | | |
| Actual | | $ | 42,281,067 | | | | 13.57 | % | | $ | 32,793,489 | | | | 12.30 | % | | $ | 7,472,699 | | | | 16.73 | % |
| For Capital Adequacy Purposes | | | 24,931,715 | | | | 8.00 | | | | 21,324,640 | | | | 8.00 | | | | 3,572,686 | | | | 8.00 | |
| To Be Well Capitalized | | | 31,164,644 | | | | 10.00 | | | | 26,655,800 | | | | 10.00 | | | | 4,465,857 | | | | 10.00 | |
| | | | | | | | | | | | | | | | | | | |
| | | | | | | | | | | | | | | | | | | | | | | | | |
Tier I Capital
(to Risk-Weighted Assets) | | | | | | | | | | | | | | | | | | | | | | | | |
| | | | | | | | | | | | | | | | | | | | | | | | | |
| Actual | | $ | 38,689,258 | | | | 12.41 | % | | $ | 29,956,378 | | | | 11.24 | % | | $ | 6,912,474 | | | | 15.48 | % |
| For Capital Adequacy Purposes | | | 12,465,858 | | | | 4.00 | | | | 10,662,320 | | | | 4.00 | | | | 1,786,343 | | | | 4.00 | |
| To Be Well Capitalized | | | 18,698,787 | | | | 6.00 | | | | 15,993,480 | | | | 6.00 | | | | 2,679,514 | | | | 6.00 | |
| | | | | | | | | | | | | | | | | | | |
| | | | | | | | | | | | | | | | | | | | | | | | | |
Tier I Capital
(to Average Assets) | | | | | | | | | | | | | | | | | | | | | | | | |
| | | | | | | | | | | | | | | | | | | | | | | | | |
| Actual | | $ | 38,689,258 | | | | 8.66 | % | | $ | 29,956,378 | | | | 7.69 | % | | $ | 6,912,474 | | | | 12.91 | % |
| For Capital Adequacy Purposes | | | 17,860,169 | | | | 4.00 | | | | 15,578,777 | | | | 4.00 | | | | 2,142,047 | | | | 4.00 | |
| To Be Well Capitalized | | | 22,325,211 | | | | 5.00 | | | | 19,473,471 | | | | 5.00 | | | | 2,677,558 | | | | 5.00 | |
2008 Annual Report 45
The Company’s and its subsidiaries’ actual capital ratios are presented in the following table that shows that all regulatory capital requirements were met as of December 31, 2007.
| | | | | | | | | | | | | | | | | | | | | | | | | |
| | | Middlefield Banc Corp. | | | The Middlefield Banking Co. | | | Emerald Bank | |
| | | December 31, | | | December 31, | | | December 31, | |
| | | 2007 | | | 2007 | | | 2007 | |
| | | Amount | | | Ratio | | | Amount | | | Ratio | | | Amount | | | Ratio | |
| | | | | | | | | | | | | | | | | | | | | | | | | |
Total Capital
(to Risk-Weighted Assets) | | | | | | | | | | | | | | | | | | | | | | | | |
| | | | | | | | | | | | | | | | | | | | | | | | | |
| Actual | | $ | 42,664,943 | | | | 14.56 | % | | $ | 32,028,171 | | | | 12.67 | % | | $ | 7,777,400 | | | | 19.50 | % |
| For Capital Adequacy Purposes | | | 23,441,926 | | | | 8.00 | | | | 20,230,160 | | | | 8.00 | | | | 3,190,160 | | | | 8.00 | |
| To Be Well Capitalized | | | 29,302,408 | | | | 10.00 | | | | 25,287,700 | | | | 10.00 | | | | 3,987,700 | | | | 10.00 | |
| | | | | | | | | | | | | | | | | | | |
| | | | | | | | | | | | | | | | | | | | | | | | | |
Tier I Capital
(to Risk-Weighted Assets) | | | | | | | | | | | | | | | | | | | | | | | | |
| | | | | | | | | | | | | | | | | | | | | | | | | |
| Actual | | $ | 39,194,767 | | | | 13.38 | % | | $ | 29,205,547 | | | | 11.55 | % | | $ | 7,300,748 | | | | 18.31 | % |
| For Capital Adequacy Purposes | | | 11,720,963 | | | | 4.00 | | | | 10,115,080 | | | | 4.00 | | | | 1,595,080 | | | | 4.00 | |
| To Be Well Capitalized | | | 17,581,445 | | | | 6.00 | | | | 15,172,620 | | | | 6.00 | | | | 2,392,620 | | | | 6.00 | |
| | | | | | | | | | | | | | | | | | | |
| | | | | | | | | | | | | | | | | | | | | | | | | |
Tier I Capital
(to Average Assets) | | | | | | | | | | | | | | | | | | | | | | | | |
| | | | | | | | | | | | | | | | | | | | | | | | | |
| Actual | | $ | 39,194,767 | | | | 9.23 | % | | $ | 29,205,547 | | | | 7.82 | % | | $ | 7,300,748 | | | | 14.38 | % |
| For Capital Adequacy Purposes | | | 16,990,099 | | | | 4.00 | | | | 14,946,917 | | | | 4.00 | | | | 2,030,504 | | | | 4.00 | |
| To Be Well Capitalized | | | 21,237,623 | | | | 5.00 | | | | 18,683,646 | | | | 5.00 | | | | 2,538,130 | | | | 5.00 | |
| 20. | | FAIR VALUE DISCLOSURE MEASUREMENTS |
Effective January 1, 2008, the Company adopted FAS No. 157, which, among other things, requires enhanced disclosures about assets and liabilities carried at fair value. FAS No. 157 establishes a hierarchal disclosure framework associated with the level of pricing observability utilized in measuring assets and liabilities at fair value. The three broad levels defined by FAS No. 157 hierarchy are as follows:
| | | | |
| | Level I: | | Quoted prices are available in active markets for identical assets or liabilities as of the reported date. |
| | | | |
| | Level II: | | Pricing inputs are other than the quoted prices in active markets, which are either directly or indirectly observable as of the reported date. The nature of these assets and liabilities includes items for which quoted prices are available but traded less frequently and items that are fair-valued using other financial instruments, the parameters of which can be directly observed. |
| | | | |
| | Level III: | | Assets and liabilities that have little to no pricing observability as of the reported date. These items do not have two- way markets and are measured using management’s best estimate of fair value, where the inputs into the determination of fair value require significant management judgment or estimation. |
Middlefield Banc Corp. 46
The following table presents the assets measured on a recurring basis on the consolidated statements of financial condition at their fair value as of December 31, 2008 by level within the fair value hierarchy. As required by FAS No. 157, financial assets and liabilities are classified in their entirety based on the lowest level of input that is significant to the fair value measurement.
| | | | | | | | | | | | | | | | | |
| | | | | | | December 31, 2008 | | | | |
| | | Level I | | | Level II | | | Level III | | | Total | |
| | | | | | | | | | | | | | | | | |
| Assets Measured on a Recurring Basis: | | | | | | | | | | | | | | | | |
| Investment securities available for sale | | $ | 1,022,162 | | | $ | 96,568,054 | | | $ | 6,680,150 | | | $ | 104,270,366 | |
Financial instruments are considered Level III when their values are determined using pricing models, discounted cash flow methodologies or similar techniques and at least one significant model assumption or input is unobservable. In addition to these unobservable inputs, the valuation models for Level III financial instruments typically also rely on a number of inputs that are readily observable either directly or indirectly. Level III financial instruments also include those for which the determination of fair value requires significant management judgment or estimation. The following table presents the changes in the Level III fair-value category for the year ended December 31, 2008.
The following represent fair value measurements using significant unobservable inputs (Level III):
| | | | | |
| | | Available-for-Sale | |
| | | Securities | |
| | | | | |
| Balance, January 1, 2008, | | $ | — | |
| Total gains or losses (realized/unrealized) | | | — | |
| Included in earnings | | | (376,449 | ) |
| Included in other comprehensive income | | | — | |
| Purchases, issuances, and settlements | | | — | |
| Transfers in and/or out of Level III | | | 7,056,599 | |
| | | | |
| Balance, December 31, 2008 | | $ | 6,680,150 | |
| | | | |
| | | | | |
| The amount of total gains or losses for the period included in earnings attributable to the change in unrealized gains or losses relating to assets still held at the reporting date | | $ | (376,449 | ) |
Gains and losses (realized and unrealized) included in earnings (or changes in net assets) for the year ended December 31, 2008 are reported as investment securities gains (losses), net on the Consolidated Statement of Income.
At December 31, 2008, the Company changed its valuation technique for certain private-label collateralized mortgage obligations (“CMOs”). Previously, the Company relied on prices compiled by third-party vendors using observable market data (Level II) to determine the values of these securities. However, FAS 157 assumes that fair values of financial assets are determined in an orderly transaction and not a forced liquidation or distressed sale at the measurement date. Based on financial market conditions at December 31, 2008, the Company concluded the fair values obtained from third-party vendors reflected forced liquidation or distressed sales for these CMOs. Therefore, the Company estimated fair value based on a discounted cash flow methodology using appropriately adjusted discount rates reflecting nonperformance and liquidity risks. The change in the valuation technique for these CMOs resulted in a transfer of $6,680,150 into Level III financial assets.
2008 Annual Report 47
The following table presents the assets measured on a nonrecurring basis on the consolidated statements of financial condition at their fair value as of December 31, 2008, by level within the fair value hierarchy. Impaired loans that are collateral dependent are written down to fair value through the establishment of specific reserves. Techniques used to value the collateral that secure the impaired loan include: quoted market prices for identical assets classified as Level I inputs; observable inputs, employed by certified appraisers, for similar assets classified as Level II inputs. In cases where valuation techniques included inputs that are unobservable and are based on estimates and assumptions developed by management based on the best information available under each circumstance, the asset valuation is classified as Level III inputs.
| | | | | | | | | | | | | | | | | |
| | | | | | | December 31, 2008 | | | | |
| | | Level I | | | Level II | | | Level III | | | Total | |
| | | | | | | | | | | | | | | | | |
| Assets Measured on a Nonrecurring Basis: | | | | | | | | | | | | | | | | |
| Impaired loans | | $ | — | | | $ | 1,194,594 | | | $ | 1,027,366 | | | $ | 2,221,960 | |
| 21. | | FAIR VALUE DISCLOSURE OF FINANCIAL INSTRUMENTS |
The estimated fair value of the Company’s financial instruments at December 31 is as follows:
| | | | | | | | | | | | | | | | | |
| | | 2008 | | | 2007 | |
| | | Carrying | | | Fair | | | Carrying | | | Fair | |
| | | Value | | | Value | | | Value | | | Value | |
| | | | | | | | | | | | | | | | | |
| Financial assets: | | | | | | | | | | | | | | | | |
| Cash and cash equivalents | | $ | 17,455,463 | | | $ | 17,455,463 | | | $ | 17,815,322 | | | $ | 17,815,322 | |
| Investment securities available for sale | | | 104,270,366 | | | | 104,270,366 | | | | 85,967,764 | | | | 85,967,764 | |
| Net loans | | | 318,018,530 | | | | 317,010,526 | | | | 306,146,646 | | | | 307,323,642 | |
| Bank-owned life insurance | | | 7,440,687 | | | | 7,440,687 | | | | 7,153,381 | | | | 7,153,381 | |
| Federal Home Loan Bank stock | | | 1,873,100 | | | | 1,873,100 | | | | 1,731,000 | | | | 1,731,000 | |
| Accrued interest receivable | | | 1,446,373 | | | | 1,446,373 | | | | 1,540,434 | | | | 1,540,434 | |
| | | | | | | | | | | | | | | | | |
| Financial liabilities: | | | | | | | | | | | | | | | | |
| Deposits | | $ | 394,819,602 | | | $ | 399,946,594 | | | $ | 362,918,000 | | | $ | 364,271,994 | |
| Short-term borrowings | | | 1,886,253 | | | | 1,886,253 | | | | 1,510,607 | | | | 1,510,607 | |
| Other borrowings | | | 33,903,019 | | | | 35,771,019 | | | | 32,395,319 | | | | 32,262,319 | |
| Accrued interest payable | | | 1,299,114 | | | | 1,299,114 | | | | 1,509,575 | | | | 1,509,575 | |
Financial instruments are defined as cash, evidence of ownership interest in an entity, or a contract which creates an obligation or right to receive or deliver cash or another financial instrument from/to a second entity on potentially favorable or unfavorable terms.
Fair value is defined as the amount at which a financial instrument could be exchanged in a current transaction between willing parties other than in a forced liquidation sale. If a quoted market price is available for a financial instrument, the estimated fair value would be calculated based upon the market price per trading unit of the instrument.
If no readily available market exists, the fair value estimates for financial instruments should be based upon management’s judgment regarding current economic conditions, interest rate risk, expected cash flows, future estimated losses, and other factors as determined through various option pricing formulas or simulation modeling. Since many of these assumptions result from judgments made by management based upon estimates which are inherently uncertain, the resulting estimated fair values may not be indicative of the amount realizable in the sale of a particular financial instrument. In addition, changes in assumptions on which the estimated fair values are based may have a significant impact on the resulting estimated fair values.
Middlefield Banc Corp. 48
As certain assets such as deferred tax assets and premises and equipment are not considered financial instruments, the estimated fair value of financial instruments would not represent the full value of the Company.
The Company employed simulation modeling in determining the estimated fair value of financial instruments for which quoted market prices were not available based upon the following assumptions:
Cash and Cash Equivalents, Federal Home Loan Bank Stock, Accrued Interest Receivable, Accrued Interest Payable, and Short-Term Borrowings
The fair value is equal to the current carrying value.
Bank-Owned Life Insurance
The fair value is equal to the cash surrender value of the life insurance policies.
Investment Securities Available for Sale
The fair value of investment securities is equal to the available quoted market price. If no quoted market price is available, fair value is estimated using the quoted market price for similar securities. Fair value for certain private-label collaterized mortgage obligations were determined utilizing discounted cash flow models, due to the absence of a current market to provide reliable market quotes for the instruments.
Loans
The fair value is estimated by discounting future cash flows using current market inputs at which loans with similar terms and qualities would be made to borrowers of similar credit quality. Where quoted market prices were available, primarily for certain residential mortgage loans, such market rates were utilized as estimates for fair value.
Deposits and Other Borrowed Funds
The fair values of certificates of deposit and other borrowed funds are based on the discounted value of contractual cash flows. The discount rates are estimated using rates currently offered for similar instruments with similar remaining maturities. Demand, savings, and money market deposits are valued at the amount payable on demand as of year-end.
Commitments to Extend Credit
These financial instruments are generally not subject to sale, and estimated fair values are not readily available. The carrying value, represented by the net deferred fee arising from the unrecognized commitment or letter of credit, and the fair value, determined by discounting the remaining contractual fee over the term of the commitment using fees currently charged to enter into similar agreements with similar credit risk, are not considered material for disclosure. The contractual amounts of unfunded commitments and letters of credit are presented in Note 17.
2008 Annual Report 49
Following are condensed financial statements for the Company.
| | | | | | | | | |
| | | December 31, | |
| CONDENSED BALANCE SHEET | | 2008 | | | 2007 | |
| | | | | | | | | |
| ASSETS | | | | | | | | |
| Cash and due from banks | | $ | 695,025 | | | $ | 1,199,416 | |
| Interest-bearing deposits in other institutions | | | 112,215 | | | | 110,387 | |
| Investment securities available for sale | | | 1,022,162 | | | | 1,324,060 | |
| Other assets | | | 248,000 | | | | 420,175 | |
| Investment in subsidiary bank | | | 41,435,443 | | | | 40,452,190 | |
| | | | | | | | | |
| | | | | | | |
| TOTAL ASSETS | | $ | 43,512,845 | | | $ | 43,506,228 | |
| | | | | | | |
| | | | | | | | | |
| LIABILITIES | | | | | | | | |
| Junior subordinated debt | | $ | 8,248,000 | | | $ | 8,248,000 | |
| Other liabilities | | | 205,597 | | | | 296,844 | |
| |
| STOCKHOLDERS’ EQUITY | | | 35,059,248 | | | | 34,961,384 | |
| | | | | | | | | |
| | | | | | | |
| TOTAL LIABILITIES AND STOCKHOLDERS’ EQUITY | | $ | 43,512,845 | | | $ | 43,506,228 | |
| | | | | | | |
| | | | | | | | | | | | | |
| | | Year Ended December 31, | |
| CONDENSED STATEMENT OF INCOME | | 2008 | | | 2007 | | | 2006 | |
| | | | | | | | | | | | | |
| INCOME | | | | | | | | | | | | |
| Dividends from subsidiary bank | | $ | 2,184,241 | | | $ | 2,018,050 | | | $ | 1,277,306 | |
| Interest income | | | 10,029 | | | | 154,199 | | | | 19,931 | |
| Other | | | 5,108 | | | | 6,965 | | | | — | |
| | | | | | | | | | |
| TOTAL INCOME | | | 2,199,378 | | | | 2,179,214 | | | | 1,297,237 | |
| | | | | | | | | | |
| | | | | | | | | | | | | |
| EXPENSES | | | | | | | | | | | | |
| Interest expense | | | 539,298 | | | | 535,280 | | | | 18,387 | |
| Other | | | 379,076 | | | | 269,861 | | | | 180,651 | |
| | | | | | | | | | |
| TOTAL INCOME | | | 918,374 | | | | 805,141 | | | | 199,038 | |
| | | | | | | | | | |
| | | | | | | | | | | | | |
| Income before income tax benefit | | | 1,281,004 | | | | 1,374,073 | | | | 1,098,199 | |
| Income tax benefit | | | (322,991 | ) | | | (218,952 | ) | | | (60,644 | ) |
| | | | | | | | | | |
| | | | | | | | | | | | | |
| Income before equity in undistributed net income of subsidiary | | | 1,603,995 | | | | 1,593,025 | | | | 1,158,843 | |
| Equity in undistributed net income of subsidiary | | | 1,010,884 | | | | 1,782,318 | | | | 2,725,404 | |
| | | | | | | | | | |
| NET INCOME | | $ | 2,614,879 | | | $ | 3,375,343 | | | $ | 3,884,247 | |
| | | | | | | | | | |
Middlefield Banc Corp. 50
| | | | | | | | | | | | | |
| | | Year Ended December 31, | |
| CONDENSED STATEMENT OF CASH FLOWS | | 2008 | | | 2007 | | | 2006 | |
| | | | | | | | | | | | | |
| OPERATING ACTIVITIES | | | | | | | | | | | | |
| Net income | | $ | 2,614,879 | | | $ | 3,375,343 | | | $ | 3,884,247 | |
| Adjustments to reconcile net income to net cash provided by operating activities: | | | | | | | | | | | | |
| Equity in undistributed net income of Middlefield Banking Company | | | (981,770 | ) | | | (1,749,538 | ) | | | (2,725,404 | ) |
| Equity in undistributed net income of Emerald Bank | | | (29,114 | ) | | | (32,780 | ) | | | — | |
| Compensation expense on stock options | | | 15,048 | | | | 26,435 | | | | — | |
| Other | | | 168,526 | | | | 76,419 | | | | 15,865 | |
| | | | | | | | | | |
| Net cash provided by operating activities | | | 1,787,569 | | | | 1,695,879 | | | | 1,174,708 | |
| | | | | | | | | | |
| | | | | | | | | | | | | |
| INVESTING ACTIVITIES | | | | | | | | | | | | |
| Deferred acquisition costs | | | — | | | | — | | | | (123,175 | ) |
| Investment in unconsolidated subsidiary | | | — | | | | — | | | | (248,000 | ) |
| Purchase of investment securities | | | — | | | | (250,000 | ) | | | (250,020 | ) |
| Net assets of Emerald Bank acquired | | | — | | | | (5,912,621 | ) | | | — | |
| | | | | | | | | | |
| Net cash used for investing activities | | | — | | | | (6,162,621 | ) | | | (621,195 | ) |
| | | | | | | | | | |
| |
| FINANCING ACTIVITIES | | | | | | | | | | | | |
| Issuance of trust-preferred securities | | | — | | | | — | | | | 8,248,000 | |
| Purchase of treasury stock | | | (1,350,881 | ) | | | (2,174,419 | ) | | | (238,534 | ) |
| Exercise of stock options | | | 19,642 | | | | 14,182 | | | | 62,115 | |
| Proceeds from dividend reinvestment and purchase plan | | | 616,589 | | | | 582,198 | | | | 626,058 | |
| Tax effect of stock options | | | — | | | | 12,695 | | | | — | |
| Cash dividends | | | (1,575,482 | ) | | | (1,469,752 | ) | | | (1,315,418 | ) |
| | | | | | | | | | |
| Net cash provided by (used for) financing activities | | | (2,290,132 | ) | | | (3,035,096 | ) | | | 7,382,221 | |
| | | | | | | | | | |
| Increase (decrease) in cash | | | (502,563 | ) | | | (7,501,838 | ) | | | 7,935,734 | |
| | | | | | | | | | | | | |
| CASH AT BEGINNING OF YEAR | | | 1,309,803 | | | | 8,811,641 | | | | 875,907 | |
| | | | | | | | | | | | | |
| | | | | | | | | | |
| CASH AT END OF YEAR | | $ | 807,240 | | | $ | 1,309,803 | | | $ | 8,811,641 | |
| | | | | | | | | | |
2008 Annual Report 51
| 23. | | SELECTED QUARTERLY FINANCIAL DATA (Unaudited) |
| | | | | | | | | | | | | | | | | |
| | | Three Months Ended | |
| | | March 31, | | | June 30, | | | September 30, | | | December 31, | |
| | | 2008 | | | 2008 | | | 2008 | | | 2008 | |
| | | | | | | | | | | | | | | | | |
| Total interest income | | $ | 6,588,203 | | | $ | 6,512,636 | | | $ | 6,550,445 | | | $ | 6,386,529 | |
| Total interest expense | | | 3,757,986 | | | | 3,513,850 | | | | 3,398,663 | | | | 3,387,585 | |
| | | | | | | | | | | | | |
| | | | | | | | | | | | | | | | | |
| Net interest income | | | 2,830,217 | | | | 2,998,786 | | | | 3,151,782 | | | | 2,998,944 | |
| Provision for loan losses | | | 75,000 | | | | 95,000 | | | | 187,000 | | | | 251,000 | |
| | | | | | | | | | | | | |
| | | | | | | | | | | | | | | | | |
| Net interest income after provision for loan losses | | | 2,755,217 | | | | 2,903,786 | | | | 2,964,782 | | | | 2,747,944 | |
| | | | | | | | | | | | | | | | | |
| Total noninterest income | | | 637,451 | | | | 637,217 | | | | 680,247 | | | | 271,591 | |
| Total noninterest expense | | | 2,515,672 | | | | 2,578,974 | | | | 2,729,581 | | | | 2,772,126 | |
| | | | | | | | | | | | | |
| | | | | | | | | | | | | | | | | |
| Income before income taxes | | | 876,996 | | | | 962,029 | | | | 915,448 | | | | 247,409 | |
| Income taxes | | | 140,000 | | | | 179,000 | | | | 211,000 | | | | (132,997 | ) |
| | | | | | | | | | | | | |
| Net income | | $ | 736,996 | | | $ | 783,029 | | | $ | 704,448 | | | $ | 380,406 | |
| | | | | | | | | | | | | |
| | | | | | | | | | | | | | | | | |
| Per share data: | | | | | | | | | | | | | | | | |
| Net income | | | | | | | | | | | | | | | | |
| Basic | | $ | 0.48 | | | $ | 0.51 | | | $ | 0.46 | | | $ | 0.26 | |
| Diluted | | | 0.47 | | | | 0.51 | | | | 0.46 | | | | 0.25 | |
| | | | | | | | | | | | | | | | | |
| Average shares outstanding | | | | | | | | | | | | | | | | |
| Basic | | | 1,548,043 | | | | 1,530,255 | | | | 1,523,044 | | | | 1,530,686 | |
| Diluted | | | 1,568,380 | | | | 1,548,607 | | | | 1,525,373 | | | | 1,532,597 | |
| | | | | | | | | | | | | | | | | |
| | | Three Months Ended | |
| | | March 31, | | | June 30, | | | September 30, | | | December 31, | |
| | | 2007 | | | 2007 | | | 2007 | | | 2007 | |
| | | | | | | | | | | | | | | | | |
| Total interest income | | $ | 5,391,747 | | | $ | 6,235,712 | | | $ | 6,573,178 | | | $ | 6,671,297 | |
| Total interest expense | | | 2,779,298 | | | | 3,359,372 | | | | 3,666,111 | | | | 3,726,138 | |
| | | | | | | | | | | | | |
| | | | | | | | | | | | | | | | | |
| Net interest income | | | 2,612,449 | | | | 2,876,340 | | | | 2,907,067 | | | | 2,945,159 | |
| Provision for loan losses | | | 45,000 | | | | 69,391 | | | | 60,000 | | | | 255,000 | |
| | | | | | | | | | | | | |
| | | | | | | | | | | | | | | | | |
| Net interest income after provision for loan losses | | | 2,567,449 | | | | 2,806,949 | | | | 2,847,067 | | | | 2,690,159 | |
| | | | | | | | | | | | | | | | | |
| Total noninterest income | | | 621,628 | | | | 648,243 | | | | 653,810 | | | | 708,911 | |
| Total noninterest expense | | | 2,273,702 | | | | 2,320,833 | | | | 2,416,933 | | | | 2,361,182 | |
| | | | | | | | | | | | | |
| | | | | | | | | | | | | | | | | |
| Income before income taxes | | | 915,375 | | | | 1,134,359 | | | | 1,083,944 | | | | 1,037,888 | |
| Income taxes | | | 163,000 | | | | 235,128 | | | | 223,000 | | | | 175,095 | |
| | | | | | | | | | | | | |
| Net income | | $ | 752,375 | | | $ | 899,231 | | | $ | 860,944 | | | $ | 862,793 | |
| | | | | | | | | | | | | |
| | | | | | | | | | | | | | | | | |
| Per share data: | | | | | | | | | | | | | | | | |
| Net income Basic | | $ | 0.51 | | | $ | 0.57 | | | $ | 0.54 | | | $ | 0.55 | |
| Diluted | | | 0.49 | | | | 0.56 | | | | 0.54 | | | | 0.55 | |
| | | | | | | | | | | | | | | | | |
| Average shares outstanding | | | | | | | | | | | | | | | | |
| Basic | | | 1,497,417 | | | | 1,578,583 | | | | 1,585,225 | | | | 1,561,771 | |
| Diluted | | | 1,519,911 | | | | 1,600,045 | | | | 1,604,693 | | | | 1,582,872 | |
Middlefield Banc Corp. 52
Board of Directors and Stockholders
Middlefield Banc Corp.
We have audited the accompanying consolidated balance sheet of Middlefield Banc Corp. and subsidiaries as of December 31, 2008 and 2007, and the related consolidated statements of income, changes in stockholders’ equity, and cash flows for each of the three years in the period ended December 31, 2008. These financial statements are the responsibility of the Company’s management. Our responsibility is to express an opinion on these financial statements based on our audits.
We conducted our audits in accordance with the standards of the Public Company Accounting Oversight Board (United States). Those standards require that we plan and perform the audit to obtain reasonable assurance about whether the financial statements are free of material misstatement. An audit includes examining, on a test basis, evidence supporting the amounts and disclosures in the financial statements. An audit also includes assessing the accounting principles used and significant estimates made by management as well as evaluating the overall financial statement presentation. We believe that our audits provide a reasonable basis for our opinion.
In our opinion, the consolidated financial statements referred to above present fairly, in all material respects, the financial position of Middlefield Banc Corp. and subsidiaries as of December 31, 2008 and 2007, and the results of their operations and their cash flows for each of the three years in the period ending December 31, 2008, in conformity with U.S. generally accepted accounting principles.
As discussed in Note 20 to the consolidated financial statements, effective January 1, 2008, the Company adopted Statement of Financial Accounting Standards No. 157,Fair Value Measurements.
We were not engaged to examine management’s assertion about the effectiveness of the Company’s internal control over financial reporting as of December 31, 2008, included in the accompanying Management’s Annual Report on Internal Control Over Financial Reporting and, accordingly, we do not express an opinion thereon.
S. R. Snodgrass, A.C.
Wexford, PA
March 9, 2009
2008 Annual Report 53
Overview
The consolidated review and analysis of Middlefield Banc Corp. (“Company”) is intended to assist the reader in evaluating the performance of the Company for the years ended December 31, 2008, 2007, and 2006. This information should be read in conjunction with the consolidated financial statements and accompanying notes to the financial statements.
The Company is an Ohio corporation organized to become the holding company of The Middlefield Banking Company (“MBC”). MBC is a state-chartered bank located in Ohio. On April 19, 2007, the Company acquired Emerald Bank (“EB”), an Ohio-chartered commercial bank headquartered in Dublin, Ohio. The Company and its two banking subsidiaries derive substantially all of their income from banking and bank-related services, which includes interest earnings on residential real estate, commercial mortgage, commercial and consumer financings as well as interest earnings on investment securities and deposit services to its customers through five locations. The Company is supervised by the Board of Governors of the Federal Reserve System, while the Banks are subject to regulation and supervision by the Federal Deposit Insurance Corporation and the Ohio Division of Financial Institutions. MBC and EB are members of the Federal Home Loan Bank (FHLB) of Cincinnati, which is one of the twelve regional banks comprising the FHLB System.
This Management’s Discussion and Analysis section of the Annual Report contains forward-looking statements. Forward-looking statements are based upon a variety of estimates and assumptions. The estimates and assumptions involve judgments about a number of things, including future economic, competitive, and financial market conditions and future business decisions. These matters are inherently subject to significant business, economic, and competitive uncertainties, all of which are difficult to predict and many of which are beyond the Company’s control. Although the Company believes its estimates and assumptions are reasonable, actual results could vary materially from those shown. Inclusion of forward-looking information does not constitute a representation by the Company or any other person that the indicated results will be achieved. Investors are cautioned not to place undue reliance on forward-looking information.
These forward-looking statements may involve significant risks and uncertainties. Although the Company believes that the expectations reflected in such forward-looking statements are reasonable, actual results may differ materially from the results in these forward-looking statements.
Significant Financial Events in 2008
On November 9, 2008, EB completed its acquisition of certain deposit liabilities attributable to a third-party financial institution’s branch office located in Westerville, Ohio. The acquisition included management personnel and retail deposits of approximately $5.9 million. EB recorded goodwill and core deposit intangible of approximately $355,000.
Critical Accounting Policies
Allowance for loan losses
Arriving at an appropriate level of allowance for loan losses involves a high degree of judgment. The Company’s allowance for loan losses provides for probable losses based upon evaluations of known and inherent risks in the loan portfolio.
Management uses historical information to assess the adequacy of the allowance for loan losses as well as the prevailing business environment, which is affected by changing economic conditions and various external factors and which may impact the portfolio in ways currently unforeseen. The allowance is increased by provisions for loan losses and by recoveries of loans previously charged off and reduced by loans charged off. For a full discussion of the Company’s methodology of assessing the adequacy of the reserve for loan losses, refer to Note 1 of “Notes to Consolidated Financial Statements” commencing on the previous pages of this Annual Report.
Middlefield Banc Corp. 54
The allowance for loan loss balance as of December 31, 2008 totaled $3.6 million representing a $258,000 increase from the end of 2007. For the year of 2008, the provision for credit losses was $608,000, which represented an increase from the $429,000 allocated during 2007. This level of provision during 2008 is reflective of the changing economic conditions adversely impacting the market areas served by the company’s affiliate banks, which have caused non-performing loans to increase. Asset quality is a high-priority in our overall business plan as it relates to long-term asset growth projections. During 2008, net charge offs declined by $65,000 compared to 2007. Two key ratios to monitor asset quality performance are net charge offs/average loans and the allowance for loan losses/non-performing loans. At year-end 2008, these ratios were .11% and 41.9% respectively compared to .15% and 58.3% in 2007.
Valuation of Securities
Securities are classified as held-to-maturity or available-for-sale on the date of purchase. Only those securities classified as held-to-maturity are reported at amortized cost. Available-for-sale and trading securities are reported at fair value with unrealized gains and losses included in accumulated other comprehensive income, net of related deferred income taxes, on the Consolidated Balance Sheets and noninterest income in the Consolidated Statements of Income, respectively. The fair value of a security is determined based on quoted market prices. If quoted market prices are not available, fair value is determined based on quoted prices of similar instruments. Realized securities gains or losses are reported within noninterest income in the Consolidated Statements of Income. The cost of securities sold is based on the specific identification method. Available-for-sale securities are reviewed quarterly for possible other-than-temporary impairment. The review includes an analysis of the facts and circumstances of each individual investment such as the severity of loss, the length of time the fair value has been below cost, the expectation for that security’s performance, the creditworthiness of the issuer and the Banc Corp.’s intent and ability to hold the security to recovery. A decline in value that is considered to be other-than-temporary is recorded as a loss within noninterest income in the Consolidated Statements of Income. The Company believes the price movements in these securities are dependent upon the movement in market interest rates. The Company’s management also maintains the intent and ability to hold securities in an unrealized loss position to the earlier of the recovery of losses or maturity.
Income Taxes
The Company estimates income tax expense based on amounts expected to be owed to the various tax jurisdictions in which the Company conducts business. On a quarterly basis, management assesses the reasonableness of its effective tax rate based upon its current estimate of the amount and components of net income, tax credits and the applicable statutory tax rates expected for the full year. The estimated income tax expense is recorded in the Consolidated Statements of Income.
Deferred income tax assets and liabilities are determined using the balance sheet method and are reported in accrued taxes, interest, and expenses in the Consolidated Balance Sheets. Under this method, the net deferred tax asset or liability is based on the tax effects of the differences between the book and tax basis of assets and liabilities and recognizes enacted changes in tax rates and laws. Deferred tax assets are recognized to the extent they exist and are subject to a valuation allowance based on management’s judgment that realization is more-likely-than-not.
Accrued taxes represent the net estimated amount due to taxing jurisdictions and are reported in accrued taxes, interest, and expenses in the Consolidated Balance Sheets. The Company evaluates and assesses the relative risks and appropriate tax treatment of transactions and filing positions after considering statutes, regulations, judicial precedent, and other information, and maintains tax accruals consistent with its evaluation of these relative risks and merits. Changes to the estimate of accrued taxes occur periodically due to changes in tax rates, interpretations of tax laws, the status of examinations being conducted by taxing authorities, and changes to statutory, judicial, and regulatory guidance that impact the relative risks of tax positions. These changes, when they occur, can affect deferred taxes and accrued taxes as well as the current period’s income tax expense and can be significant to the operating results of the Company.
2008 Annual Report 55
Changes in Financial Condition
General.The Company’s total assets increased $33.6 million or 7.7% to $467.9 million at December 31, 2008 from $434.3 million at December 31, 2007. This increase was composed of a net increase in investment securities of $18.3 million, net loans receivable of $11.9 million, and accrued interest and other assets of $1.9 million.
The increase in the Company’s total assets reflects a corresponding increase in total liabilities of $33.5 million or 8.4% to a total balance of $432.8 million at December 31, 2008 from $399.3 million at December 31, 2007. The Company also experienced an increase in total stockholders’ equity of $98,000 to a new balance of $35.1 million as of December 31, 2008 from $35.0 million at December 31, 2007.
The increase in total liabilities was primarily due to deposit growth for the year. Total deposits increased $31.9 million or 8.8% to $394.8 million at December 31, 2008 from $362.9 million at December 31, 2007. The net increase in total stockholders’ equity can be attributed to an increase in common stock and net income offset by an increase in treasury stock of $1.4 million.
Cash on hand, Interest-earning deposits and Federal funds sold.Cash on hand, interest-earning deposits, and federal funds sold represent cash equivalents which decreased a combined $360,000 or 2.0% to $17.5 million at December 31, 2008 from $17.8 million at December 31, 2007. Deposits from customers into savings and checking accounts, loan and security repayments, and proceeds from borrowed funds typically increase these accounts. Decreases result from customer withdrawals, new loan originations, security purchases, and repayments of borrowed funds. The net decrease in 2008 can be attributed principally to a decline in Federal funds sold balances.
Securities.Management’s goal in structuring the portfolio is to maintain a prudent level of liquidity while providing an acceptable rate of return without sacrificing asset quality. Maturing securities have historically provided sufficient liquidity. The balance of total securities increased $18.3 million or 21.3% as compared to 2007, with the ratio of securities to total assets also increasing to 22.3% at December 31, 2008, compared to 19.8% at December 31, 2007. This trend of higher security investments was driven by an increase in mortgage-backed securities of $25.5 million or 87.9% as compared to year-end 2007. The growth in this segment of investments was the result of attractive yield opportunities and a desire to increase diversification within the Company’s securities portfolio. This growth was partially offset by a decline in government agency and obligations of state and political subdivisions securities of $3.4 million and $3.5 million from year-end 2007.
The Company continues to benefit from the advantages of mortgage-backed securities, which totaled $54.6 million or 52.3% of the Company’s total investment portfolio at December 31, 2008. The primary advantage of mortgage-backed securities has been the increased cash flows due to the more rapid (monthly) repayment of principal as compared to other types of investment securities, which deliver proceeds upon maturity or call date. The weighted average federal tax equivalent (FTE) yield on securities at year-end 2008 was 5.48%, as compared to 5.28% at year-end 2007 and 4.72% at year-end 2006. While the Company’s focus is to generate interest revenue primarily through loan growth, management will continue to invest excess funds in securities when opportunities arise.
Substantially, all of our securities are valued based on quoted market prices. However, certain securities are less actively traded and do not always have quoted market prices. The determination of their fair value, therefore, requires judgment, as this determination may require benchmarking to similar instruments or analyzing default and recovery rates. Examples include certain collateralized mortgage and debt obligations and high-yield debt securities.
Middlefield Banc Corp. 56
Loans receivable.The loans receivable category consists primarily of single family mortgage loans used to purchase or refinance personal residences located within the Company’s market area and commercial real estate loans used to finance properties that are used in the borrowers’ businesses or to finance investor-owned rental properties and commercial loans to finance the business operations and, to a lesser extent, construction and consumer loans. Net loans receivable increased $11.9 million or 3.9% to $318.0 million at December 31, 2008 from $306.2 million at December 31, 2007. Included in this growth were increases in most loan types including residential, commercial, and construction real estate of $5.8, $6.0, and $1.3 million, respectively.
The product mix in the loan portfolio includes commercial loans comprising 20.7%, construction loans 2.5%, residential real estate loans 62.0%, commercial real estate loans 13.3%, and consumer loans 1.5% at December 31, 2008 compared with 21.7%, 2.2%, 62.5%, 11.9%, and 1.8%, respectively, at December 31, 2007.
Loans contributed 82.3% of total interest income in 2008 and 84.7% in 2007. The loan portfolio yield of 6.75% in 2008 was 35 basis points greater than the average yield for total interest earning assets. Management recognizes that while the loan portfolio holds some of the Company’s highest yielding assets, it is inherently the most risky portfolio. Accordingly, management attempts to balance credit risk versus return with conservative credit standards. Management has developed and maintains comprehensive underwriting guidelines and a loan review function that monitors credits during and after the approval process. To minimize risks associated with changes in the borrower’s future repayment capacity, the Company generally requires scheduled periodic principal and interest payments on all types of loans and normally requires collateral.
The Company will continue to monitor the relatively mild pace of its loan portfolio growth during 2009. The Company’s lending markets remain challenging and have impacted loan growth due to increased payoffs and a flat to declining level of loan originations during 2008. The Company anticipates total loan growth to be marginal, with volume to continue at a flat to moderate pace throughout 2009. The Company remains committed to sound underwriting practices without sacrificing asset quality and avoiding exposure to unnecessary risk that could weaken the credit quality of the portfolio.
FHLB stock.FHLB stock increased $142,000 or 8.2% to $1.9 million at December 31, 2008 from $1.7 million at December 31, 2007, primarily as a result of increased asset size of both affiliates that is used to calculate the minimum stock requirement.
Goodwill.Goodwill results from prior business acquisitions and represents the excess of the purchase price over the fair value of acquired tangible assets and liabilities and identifiable intangible assets. Goodwill is assessed annually for impairment and any such impairment is recognized in the period identified by a charge to earnings. In assessing goodwill for impairment, management estimates the fair value of the Company’s banking subsidiary to which the goodwill relates. To arrive at fair value estimates, management considers prices received upon sale of other banking institutions of similar size and with similar operating results. Purchase prices as a multiple of earnings, book value, tangible book value, and deposits are considered and applied to the Company’s banking subsidiary.
The process of evaluating goodwill for impairment requires management to make significant estimates and judgments. The use of different estimates, judgments or approaches to estimate fair value could result in a different conclusion regarding impairment of goodwill. Based on the analysis, management has determined that there is no goodwill impairment.
The Company routinely utilizes the services of an independent third party that is regarded in the banking industry as an expert in valuing core deposits and monitoring the ongoing value of core deposit intangibles and goodwill on an annual basis. Goodwill increased from $4.4 million in 2007 to $4.6 million in 2008. This increase was due to the goodwill created from the acquisition of a third party financial institution’s branch office in early November of 2008.
Bank-owned life insurance.Bank owned life insurance (BOLI) is universal life insurance, purchased by the Company, on the lives of the Company’s officers. The beneficial aspects of these universal life insurance policies are tax-free earnings and a tax-free death benefit, which are realized by the Company as the owner of the policies. BOLI increased by $287,000 to $7.4 million at December 31, 2008 from $7.2 million at the end of 2007 as a result of the earnings of the underlying insurance policies.
2008 Annual Report 57
Deposits.Interest-earning assets are funded generally by both interest-bearing and noninterest-bearing core deposits. Deposits are influenced by changes in interest rates, economic conditions, and competition from other banks. The Company considers various sources when evaluating funding needs including, but not limited to, deposits, which represented 91.7% of the Company’s total funding sources at December 31, 2008. The deposit base consists of demand deposits, savings, money market accounts, and time deposits. Total deposits increased $31.9 million or 8.8% to $394.8 million at December 31, 2008 from $362.9 million at December 31, 2007.
Time deposits, particularly certificates of deposit (“CD’s”), remain the most significant source of funding for the Company’s earning assets, making up 58.1% of total deposits. During 2008, time deposits increased $26.8 million or 13.2% from year-end 2007. This increase was primarily due to customers’ fleeing to safety from the volatility of the stock market. As market rates have declined over the past year, the Company has seen the cost of its retail CD balances re-price downward to reflect current deposit rates. Partially offsetting the increases in time deposits was the decline in the Company’s savings balances, which were down $7.9 million or 10.3% to finish at $69.0 million at year-end 2008 as compared to $76.9 million at year-end 2007. This decline was due to a $14.2 million reduction in prime savings accounts at EB. EB experienced a $16.2 million increase in CDs in 2008 to offset this decline.
Also partially offsetting savings decreases was growth in the Company’s interest-bearing demand deposits, which were up $6.9 million or 35.0% from year-end 2007. The Company will continue to experience increased competition for deposits in its market areas, which should challenge net growth in its deposit balances. The Company will continue to evaluate its deposit portfolio mix to properly utilize both retail and wholesale funds to support earning assets and minimize interest costs.
Borrowed funds.The Company utilizes short and long-term borrowings as another source of funding used for asset growth and liquidity needs. These borrowings primarily include FHLB advances, junior subordinated debt, and repurchase agreement borrowings. Borrowed funds increased $1.9 million or 5.6% to $35.8 million at December 31, 2008 from $33.9 million at December 31, 2007. FHLB advances increased $1.5 million with short-term borrowings increasing $375,000.
Stockholders’ equity.The Company maintains a capital level that exceeds regulatory requirements as a margin of safety for its depositors and shareholders. All of the capital ratios exceeded the regulatory well capitalized guidelines. Shareholders’ equity totaled $35.1 million at December 31, 2008, compared to $35.0 million at December 31, 2007, which represents growth of 0.3%. Contributing most to this increase was year-to-date net income of $2.6 million. Partially offsetting the growth in capital were cash dividends paid of $1.6 million, or $1.03 per share, year-to-date, and $1.4 million in treasury stock repurchases. Cash dividends paid for 2008 represents a 9.6% increase as compared to 2007.
The Company may repurchase additional common shares from time to time as authorized by its stock repurchase program. The Company’s Board of Directors has approved annual extensions to the plan. Most recently, the Board of Directors extended the stock repurchase program from May 12, 2008 to May 12, 2009, and authorized to repurchase up to 77,000 of its common shares through open market and privately negotiated purchases.
Furthermore, the Company maintains a dividend reinvestment and stock purchase plan. The plan allows shareholders to purchase additional shares of company stock. A benefit of the plan is to permit the shareholders to reinvest cash dividends as well as make supplemental purchases without the usual payment of brokerage commissions. During 2008, shareholders invested more than $613,000 through the dividend reinvestment and stock purchase plan. These proceeds resulted in the issuance of 22,693 new shares.
Middlefield Banc Corp. 58
Average balance sheet and yield/rate analysis.The following table sets forth, for the periods indicated, information concerning the total dollar amounts of interest income from interest-earning assets and the resultant average yields, the total dollar amounts of interest expense on interest-bearing liabilities and the resultant average costs, net interest income, interest rate spread, and the net interest margin earned on average interest-earning assets. For purposes of this table, average balances are calculated using monthly averages and the average loan balances include non-accrual loans and exclude the allowance for loan losses, and interest income includes accretion of net deferred loan fees. Yields on tax-exempt securities (tax-exempt for federal income tax purposes) are shown on a fully tax equivalent basis utilizing a federal tax rate of 34%.
| | | | | | | | | | | | | | | | | | | | | | | | | | | | | | | | | | | | | |
| | | For The Year Ended December 31, | |
| | | 2008 | | | 2007 | | | 2006 | |
| | | Average | | | | | | | Average | | | Average | | | | | | | Average | | | Average | | | | | | | Average | |
| | | Balance | | | Interest | | | Yield/Cost | | | Balance | | | Interest | | | Yield/Cost | | | Balance | | | Interest | | | Yield/Cost | |
| | | (Dollars in thousands) | | | (Dollars in thousands) | | | (Dollars in thousands) | |
| Interest-earning assets: | | | | | | | | | | | | | | | | | | | | | | | | | | | | | | | | | | | | |
| Loans receivable | | $ | 317,226 | | | $ | 21,426 | | | | 6.75 | % | | $ | 288,022 | | | $ | 21,063 | | | | 7.31 | % | | $ | 240,452 | | | $ | 17,093 | | | | 7.11 | % |
| Investments securities (3) | | | 96,277 | | | | 4,349 | | | | 5.48 | % | | | 74,820 | | | | 3,040 | | | | 5.28 | % | | | 57,520 | | | | 2,181 | | | | 4.72 | % |
| Interest-bearing deposits with other banks | | | 7,701 | | | | 263 | | | | 3.41 | % | | | 13,829 | | | | 770 | | | | 5.57 | % | | | 4,503 | | | | 221 | | | | 4.91 | % |
| | | | | | | | | | | | | | | | | | | | | | | | | | | | |
| Total interest-earning assets | | | 421,204 | | | | 26,038 | | | | 6.40 | % | | | 376,671 | | | | 24,873 | | | | 6.85 | % | | | 302,475 | | | | 19,495 | | | | 6.62 | % |
| | | | | | | | | | | | | | | | | | | | | | | | | | | | |
| Noninterest-earning assets | | | 29,407 | | | | | | | | | | | | 21,307 | | | | | | | | | | | | 16,231 | | | | | | | | | |
| | | | | | | | | | | | | | | | | | | | | | | | | | | | |
| | | | | | | | | | | | | | | | | | | | | | | | | | | | | | | | | | | | | |
| Total assets | | | 450,610 | | | | | | | | | | | | 397,979 | | | | | | | | | | | | 318,706 | | | | | | | | | |
| | | | | | | | | | | | | | | | | | | | | | | | | | | | |
| | | | | | | | | | | | | | | | | | | | | | | | | | | | | | | | | | | | | |
| Interest-bearing liabilities: | | | | | | | | | | | | | | | | | | | | | | | | | | | | | | | | | | | | |
| Interest-bearing demand deposits | | $ | 24,178 | | | | 297 | | | | 1.23 | % | | $ | 15,541 | | | | 359 | | | | 2.31 | % | | $ | 11,280 | | | | 133 | | | | 1.18 | % |
| Money market deposits | | | 25,042 | | | | 783 | | | | 3.13 | % | | | 25,057 | | | | 1,026 | | | | 4.09 | % | | | 13,675 | | | | 374 | | | | 2.73 | % |
| Savings deposits | | | 70,868 | | | | 1,363 | | | | 1.92 | % | | | 68,882 | | | | 1,695 | | | | 2.46 | % | | | 57,831 | | | | 910 | | | | 1.57 | % |
| Certificates of deposit | | | 216,732 | | | | 9,912 | | | | 4.57 | % | | | 172,552 | | | | 8,581 | | | | 4.97 | % | | | 135,763 | | | | 5,740 | | | | 4.23 | % |
| Borrowings | | | 36,229 | | | | 1,702 | | | | 4.70 | % | | | 36,639 | | | | 1,870 | | | | 5.10 | % | | | 30,767 | | | | 1,410 | | | | 4.58 | % |
| | | | | | | | | | | | | | | | | | | | | | | | | | | | |
| | | | | | | | | | | | | | | | | | | | | | | | | | | | | | | | | | | | | |
| Total interest-bearing liabilities | | | 373,049 | | | | 14,058 | | | | 3.77 | % | | | 318,671 | | | | 13,531 | | | | 4.25 | % | | | 249,316 | | | | 8,567 | | | | 3.44 | % |
| | | | | | | | | | | | | | | | | | | | | | | | | | | | |
| | | | | | | | | | | | | | | | | | | | | | | | | | | | | | | | | | | | | |
| Noninterest-bearing liabilities Other liabilities | | | 44,762 | | | | | | | | | | | | 45,769 | | | | | | | | | | | | 40,799 | | | | | | | | | |
| Stockholders’ equity | | | 33,051 | | | | | | | | | | | | 33,539 | | | | | | | | | | | | 28,591 | | | | | | | | | |
| | | | | | | | | | | | | | | | | | | | | | | | | | | | |
| | | | | | | | | | | | | | | | | | | | | | | | | | | | | | | | | | | | | |
| Total liabilities and stockholders’ equity | | $ | 450,862 | | | | | | | | | | | $ | 397,979 | | | | | | | | | | | $ | 318,706 | | | | | | | | | |
| | | | | | | | | | | | | | | | | | | | | | | | | | | | |
| Net interest income | | | | | | $ | 11,980 | | | | | | | | | | | $ | 11,342 | | | | | | | | | | | $ | 10,928 | | | | | |
| | | | | | | | | | | | | | | | | | | | | | | | | | | | |
| | | | | | | | | | | | | | | | | | | | | | | | | | | | | | | | | | | | | |
| Interest rate spread (1) | | | | | | | | | | | 2.63 | % | | | | | | | | | | | 2.60 | % | | | | | | | | | | | 3.19 | % |
| Net yield on interest-earning assets (2) | | | | | | | | | | | 3.06 | % | | | | | | | | | | | 3.25 | % | | | | | | | | | | | 3.79 | % |
| Ratio of average interest-earning assets to average interest-bearing liabilities | | | | | | | | | | | 112.91 | % | | | | | | | | | | | 118.20 | % | | | | | | | | | | | 121.32 | % |
| | | |
| (1) | | Interest rate spread represents the difference between the average yield on interest-earning assets and the average cost of interest-bearing liabilities. |
| |
| (2) | | Net yield on interest-earning assets represents net interest income as a percentage of average interest-earning assets. |
| |
| (3) | | Tax equivalent adjustments to interest income for tax-exempt securities were $932, $913, and $535 for 2008, 2007, and 2006 respectively. |
2008 Annual Report 59
| | | | | | | | | | | | | | | | | | | | | | | | | |
| | | 2008 versus 2007 | | | 2007 versus 2006 | |
| | | Increase (decrease) due to | | | Increase (decrease) due to | |
| | | Volume | | | Rate | | | Total | | | Volume | | | Rate | | | Total | |
| | | (Dollars in thousands) | | | (Dollars in thousands) | |
| Interest income | | | | | | | | | | | | | | | | | | | | | | | | |
| Loans receivable | | $ | 2,136 | | | $ | (1,773 | ) | | $ | 363 | | | $ | 3,382 | | | $ | 588 | | | $ | 3,970 | |
| Investments securities | | | 1,133 | | | | 176 | | | | 1,309 | | | | 817 | | | | 42 | | | | 859 | |
| Other interest-earning assets | | | (341 | ) | | | (166 | ) | | | (507 | ) | | | 458 | | | | 91 | | | | 549 | |
| | | | | | | | | | | | | | | | | | | |
| | | | | | | | | | | | | | | | | | | | | | | | | |
| Total interest-earning assets | | | 2,928 | | | | (1,763 | ) | | | 1,165 | | | | 4,657 | | | | 721 | | | | 5,378 | |
| | | | | | | | | | | | | | | | | | | |
| | | | | | | | | | | | | | | | | | | | | | | | | |
| Interest expense | | | | | | | | | | | | | | | | | | | | | | | | |
| Interest-bearing demand deposits | | | 200 | | | | (261 | ) | | | (62 | ) | | | 50 | | | | 176 | | | | 226 | |
| Money market deposits | | | (1 | ) | | | (242 | ) | | | (243 | ) | | | 311 | | | | 341 | | | | 652 | |
| Savings deposits | | | 49 | | | | (381 | ) | | | (332 | ) | | | 174 | | | | 611 | | | | 785 | |
| Certificates of deposit | | | 2,197 | | | | (866 | ) | | | 1,331 | | | | 1,555 | | | | 1,286 | | | | 2,841 | |
| Other interest-bearing liabilities | | | (21 | ) | | | (147 | ) | | | (168 | ) | | | 269 | | | | 191 | | | | 460 | |
| | | | | | | | | | | | | | | | | | | |
| | | | | | | | | | | | | | | | | | | | | | | | | |
| Total interest-bearing liabilities | | | 2,424 | | | | (1,897 | ) | | | 527 | | | | 2,359 | | | | 2,605 | | | | 4,964 | |
| | | | | | | | | | | | | | | | | | | |
| | | | | | | | | | | | | | | | | | | | | | | | | |
| Change in net interest income | | $ | 504 | | | $ | 134 | | | $ | 638 | | | $ | 2,298 | | | $ | (1,884 | ) | | $ | 414 | |
Changes in Results of Operations
2008 Results Compared to 2007 Results
General.The Company posted net income of $2.6 million, compared to $3.4 million for the year ended December 31, 2007. On a per share basis, 2008 earnings were $1.69 per diluted share, representing a decrease from the $2.14 per diluted share for the year ended December 31, 2007. The return on average equity for the year ended December 31, 2008 was 7.91% and its return on average assets was 0.58%. The $760,000 or 22.5% decline in net income between 2008 and 2007 can primarily be attributed to an increase in total noninterest expense of $1.2 million.
Net interest income.Net interest income, which is the Company’s largest revenue source, is the difference between interest income on earning assets and interest expense paid on liabilities. Net interest income is affected by the changes in interest rates and the composition of interest earning assets and liabilities. Net interest income increased by $638,000 in 2008 to $12.03 million compared to $11.3 million for 2007. This increase is the net result of a $1.2 million rise in interest income which was partially offset by a rise in interest expense of $527,000. Interest-earning assets averaged $421.2 million during 2008 representing a $44.5 million or 11.8% increase since year-end 2007. The Company’s average interest-bearing liabilities increased 54.4% from $318.6 million in 2007 to $373.1 million in 2008.
The Company finances its earning assets with a combination of interest-bearing and interest-free funds. The interest-bearing funds are composed of deposits, short-term borrowings, and long-term debt. Interest paid for the use of these funds is the second factor in the net interest income equation. Interest-free funds, such as demand deposits and stockholders’ equity, require no interest expense and, therefore, contribute significantly to net interest income.
The profit margin, or spread, on invested funds is a key performance measure. The Company monitors two key performance indicators — net interest spread and net interest margin. The net interest spread represents the difference between the average rate earned on interest-earning assets and the average rate paid on interest-bearing liabilities. The net interest margin represents the overall profit margin: net interest income as a percentage of total interest-earning assets. This performance indicator gives effect to interest earned for all investable funds including the substantial volume of interest-free funds. For 2008 the net interest margin, measured on a fully taxable equivalent basis, decreased to 3.06% compared to 3.25% in 2007.
Middlefield Banc Corp. 60
Interest income.Interest income increased $1.2 million or 4.7% to $26.0 million for 2008, compared to $24.9 million for 2007. The increase in interest income can be attributed to the growth of interest earned investment securities of $1.3 million or 43.1%. This change was primarily attributable to an increase in the average balance of investment securities of $21.5 million or 28.7% to $96.3 million for the year ended December 31, 2008 as compared to $74.8 million for the year ended December 31, 2007. In addition to growth, there was also an increase in the investment security yield to 5.48% for 2008, compared to 5.28% for 2007.
Interest earned on loans increased $363,000 to $21.4 million for 2008, compared to $21.1 million for 2007. This increase was primarily attributable to the growth of the average balance of loans of $29.2 million to $317.2 million for the year ended December 31, 2008 as compared to $288.0 million for the year ended December 31, 2007. In addition to growth there was also a decline in the loan yield to 6.75% for 2008, compared to 7.31% for 2007. This decline was due to the fact that a large percentage of the loan portfolio uses the prime rate as its index. The prime rate declined by 400 basis points from 7.25% to 3.25% in 2008.
Interest expense.Interest expense increased by $527,000 or 3.9% to $14.1 for 2008, compared with $13.5 million for 2007. This change in interest expense can be attributed to an increase in the average balance of interest-bearing liabilities which was partially offset by a 48 basis point decline in the rate paid on these liabilities. For the year ended December 31, 2008, the average balance of interest-bearing liabilities grew by $54.4 million to $373.1 million as compared to $318.7 million for the year ended December 31, 2007. Interest incurred on deposits grew by $719,000 for the year from $11.6 million in 2007 to $12.4 million for year-end 2008. The change in deposit expense was due to both an increase in the average balance of $54.8 million in 2008 which was partially offset by a 43 basis point decline during the year. Interest incurred on FHLB advances, repurchase agreements, junior subordinated debt, and other borrowings declined $192,000 or 10.1% to $1.7 million for 2008, compared to $1.9 million for 2007. The decline was primarily attributable to a 40 basis point decrease in the rate paid on these borrowings during the year.
Loan loss provision.The provision for loan losses is an operating expense recorded to maintain the related balance sheet allowance for loan losses at an amount considered adequate to cover probable losses incurred in the normal course of lending. The provision for loan losses was $608,000 in 2008 as compared to $429,000 in 2007. The loan loss provision is based upon management’s assessment of a variety of factors, including types and amounts of non-performing loans, historical loss experience, collectibility of collateral values and guaranties, pending legal action for collection of loans and related guaranties, and current economic conditions. The loan loss provision reflects management’s judgment of the current period cost-of-credit risk inherent in the loan portfolio. Although management believes the loan loss provision has been sufficient to maintain an adequate allowance for loan losses, actual loan losses could exceed the amounts that have been charged to operations. This level of provision during 2008 is reflective of the changing economic conditions adversely impacting the market areas served by the Company’s affiliate banks, which have caused charge offs and non-performing loans to increase. Net charge offs for 2008 was $351,000, which was below the $423,000 of net charged offs during 2007. The allowance for loan losses at December 31, 2008 stood at $3,557,000 or 1.11% of total loans.
Noninterest income.Noninterest income, exclusive of other than temporary charges of $376,000, decreased $29,000 for the twelve-month period ending December 31, 2008 over the equal reporting period of 2007. The decreases were primarily the result of a decline in deposit service charges, which corresponds to a reduction in overdraft fees and statement service charges at MBC. These reductions were driven, in part, by a wider acceptance of the free checking account product in that market. The other-than-temporary impairment charge relates to two mortgage backed securities held by one of the Company’s subsidiary banks. Management has concluded that it is probable that there has been an adverse change in estimated cash flows for those securities, which management deemed to be other-than-temporarily impaired in accordance with generally accepted accounting principles.
2008 Annual Report 61

Noninterest expense.Total noninterest expense for the full year of 2008 was 13.1% higher than the level of 2007. The factors that primarily led to the increase were costs associated with the operation of additional offices, increased staffing levels related to those offices, and associated higher levels of equipment depreciation. While The Middlefield Banking Company opened its office in Cortland, Ohio, in June of 2008, its Newbury, Ohio, office was completing its second year of operation in 2008. Emerald Bank expanded into Westerville, Ohio, with the purchase of a branch office in early November 2008. Deposit insurance premiums paid to the FDIC during the period ended December 31, 2008 increased $139,000 over the prior year, as that agency sought to maintain the legally prescribed coverage ratio. Audit and exam expense increased $101,000 during 2008 as the company continued its efforts to ensure compliance with the provisions of the Sarbanes-Oxley Act of 2002 and other regulatory mandates. Data processing costs for 2008 increased $104,000 over the prior year. This increased expense was driven by an increase in customer relationships and the expansion of product offerings.
Provision for income taxes.The provision for income taxes declined $409,000 or 51.4% to $387,000 for 2008, compared to $796,000 for 2007. This decrease was primarily the result of a decline in income before taxes of $1.2 million or 28.0% to $3.0 million for 2008, compared to $4.2 million for 2007. The Company’s federal rate in 2008 totaled 12.9% compared to 19.1% in 2007.
2007 Results Compared to 2006 Results
General.The Company posted net income of $3.4 million, compared to $3.9 million for the year ended December 31, 2006. On a per share basis, 2007 earnings were $2.14 per diluted share, representing a decrease from the $2.57 per diluted share for the year ended December 31, 2006. The return on average equity for the year ended December 31, 2007 was 10.06% and its return on average assets was 0.85%. The $509,000 or 13.1% decline in net income between 2007 and 2006 can primarily be attributed to an increase in total noninterest expense of $1.4 million resulting from a 54 basis point reduction of the net interest margin.
Net interest income, the principal source of the Company’s earnings, represents the difference between interest income on interest-earning assets and interest expense on interest-bearing liabilities. For 2007, net interest income increased $414,000 or 3.8% from 2006.
Net interest income.Net interest income, which is the Company’s largest revenue source, is the difference between interest income on earning assets and interest expense paid on liabilities. Net interest income is affected by the changes in interest rates and the composition of interest earning assets and liabilities. Net interest income increased by $415,000 in 2007 to $11.3 million compared to $10.9 million for 2006. This increase is the net result of a $5.4 million rise in interest income which was partially offset by a rise in interest expense of $5.0 million. Interest-earning assets averaged $376.7 million during 2007, representing a $74.2 million or 24.5% increase since year-end 2006. The Company’s average interest-bearing liabilities increased 27.8% from $249.3 million in 2006 to $318.7 million in 2007.
The Company finances its earning assets with a combination of interest-bearing and interest-free funds. The interest-bearing funds are composed of deposits, short-term borrowings, and long-term debt. Interest paid for the use of these funds is the second factor in the net interest income equation. Interest-free funds, such as demand deposits and stockholders’ equity, require no interest expense and, therefore, contribute significantly to net interest income.
The profit margin, or spread, on invested funds is a key performance measure. The Corporation monitors two key performance indicators — net interest spread and net interest margin. The net interest spread represents the difference between the average rate earned on interest-earning assets and the average rate paid on interest-bearing liabilities. The net interest margin represents the overall profit margin: net interest income as a percentage of total interest-earning assets. This performance indicator gives effect to interest earned for all investable funds including the substantial volume of interest-free funds. For 2007 the net interest margin, measured on a fully taxable equivalent basis, decreased to 3.25%, compared to 3.79% in 2006.
Middlefield Banc Corp. 62
Interest income.Interest income increased $5.4 million or 27.6% to $24.9 million for 2007, compared to $19.5 million for 2006. This increase in interest income can be attributed to the growth of interest earned on loans of $4.0 million. This change was primarily attributable to an increase in the average balance of loans outstanding of $47.6 million or 19.8% to $288.0 million for the year ended December 31, 2007 as compared to $240.59 million for the year ended December 31, 2006. In addition to growth, there was also an increase in the loan yield to 7.31% for 2007, compared to 7.11% for 2006.
Interest earned on securities increased $859,000 to $3.1 million for 2007, compared to $2.2 million for 2006. This increase was primarily attributable to the growth of the average balance of securities of $17.3 million to $74.8 million for the year ended December 31, 2007 as compared to $57.5 million for the year ended December 31, 2006.
Interest expense.Interest expense increased by $5.0 million or 57.9% to $13.5 million for 2007, compared with $8.6 million for 2006. This increase in interest expense can be attributed to both an increase in the average balance of interest-bearing liabilities along with an 81 basis point increase in the rate paid on these liabilities. For the year ended December 31, 2007, the average balance of interest-bearing liabilities grew by $69.4 million to $318.7 million as compared to $249.3 million for the year ended December 31, 2006. Interest incurred on deposits grew by $4.5 million for the year from $7.2 million in 2006 to $11.7 million for year-end 2007. This change was due mainly to the large deposit growth for the year along with the increase in rate. Interest incurred on FHLB advances, repurchase agreements, junior subordinated debt, and other borrowings increased $460,000 or 32.6% to $1.9 million for 2007, compared to $1.4 million for 2006. This increase was primarily attributable to an increase in the average balance of the junior subordinated debt which was borrowed late in the 4th quarter of 2006.
Loan loss provision.The provision for loan losses is an operating expense recorded to maintain the related balance sheet allowance for loan losses at an amount considered adequate to cover probable losses incurred in the normal course of lending. The provision for loan losses was $429,000 in 2007 as compared to $60,000 in 2006. The loan loss provision is based upon management’s assessment of a variety of factors, including types and amounts of non-performing loans, historical loss experience, collectibility of collateral values and guaranties, pending legal action for collection of loans and related guaranties, and current economic conditions. The loan loss provision reflects management’s judgment of the current period cost-of-credit risk inherent in the loan portfolio. Although management believes the loan loss provision has been sufficient to maintain an adequate allowance for loan losses, actual loan losses could exceed the amounts that have been charged to operations.
Noninterest income.Noninterest income increased $204,000 or 8.45% to $2.6 million for 2007, compared to $2.4 million for 2006. This increase can be attributed to increases in fees and service charges of $155,000, earnings of bank-owned life insurance of $41,000, and a gain realized on the sale of investment securities of $13,000. The improvement in fees and service charges was largely due to increased fees collected on overdraft checking accounts.
Noninterest expense.Noninterest expenses increased $1.4 million or 18.1% to $9.4 million for 2007, compared to $7.9 million for 2006. The growth can be attributed to increases in compensation and employee benefits and occupancy expense which increased $783,000 and $239,000 respectively. Factors that primarily led to the increase were costs associated with the operation of additional offices, increased staffing levels related to those offices, and associated higher levels of equipment depreciation. In addition to these items, the company recognized increased costs during the year to ensure compliance with the provisions of the Sarbanes-Oxley Act of 2002 and costs associated with the acquisition of Emerald Bank, and the assumption of the aforementioned branch deposits.
Provision for income taxes.The provision for income taxes declined $676,000 or 45.9% to $796,000 for 2007, compared to $1.5 million for 2006. This decrease was primarily the result of a decline in income before taxes of $1.2 million or 22.1% to $4.2 million for 2007, compared to $5.4 million for 2006. The Company’s federal rate in 2007 totaled 19.1% compared to 27.5% in 2006. The income tax provision was also affected by the growth of the tax free investment portfolio of $9.1 million which was a 23.8% increase over the balance at the end of 2006.
2008 Annual Report 63
Asset and Liability Management
The primary objective of the Company’s asset and liability management function is to maximize the Company’s net interest income while simultaneously maintaining an acceptable level of interest rate risk given the Company’s operating environment, capital and liquidity requirements, performance objectives, and overall business focus. The principal determinant of the exposure of the Company’s earnings to interest rate risk is the timing difference between the re-pricing or maturity of interest-earning assets and the re-pricing or maturity of its interest-bearing liabilities. The Company’s asset and liability management policies are designed to decrease interest rate sensitivity primarily by shortening the maturities of interest-earning assets while, at the same time, extending the maturities of interest-bearing liabilities. The Board of Directors of the Company continues to believe in strong asset/liability management in order to insulate the Company from material and prolonged increases in interest rates. As a result of this policy, the Company emphasizes a larger, more diversified portfolio of residential mortgage loans in the form of mortgage-backed securities. Mortgage-backed securities generally increase the quality of the Company’s assets by virtue of the insurance or guarantees that back them, are more liquid than individual mortgage loans, and may be used to collateralize borrowings or other obligations of the Company.
The Company’s Board of Directors has established an Asset and Liability Management Committee consisting of outside directors and senior management. This committee, which meets quarterly, generally monitors various asset and liability management policies and strategies which were implemented by the Company over the past few years.
Interest Rate Sensitivity Simulation Analysis
The Company utilizes income simulation modeling in measuring its interest rate risk and managing its interest rate sensitivity. The Asset and Liability Management Committee of the Company believes that simulation modeling enables the Company to more accurately evaluate and manage the possible effects on net interest income due to the exposure to changing market interest rates, the slope of the yield curve and different loan and mortgage-backed security prepayment, and deposit decay assumptions under various interest rate scenarios.
Earnings simulation modeling and assumptions about the timing and variability of cash flows are critical in net portfolio equity valuation analysis. Particularly important are the assumptions driving mortgage prepayments and the assumptions about expected attrition of the core deposit portfolios. These assumptions are based on the Company’s historical experience and industry standards and are applied consistently across the different rate risk measures.
The Company has established the following guidelines for assessing interest rate risk:
Net interest income simulation.Given a 200 basis point parallel gradual increase or decrease in market interest rates, net interest income may not change by more than 10% for a one year period.
Portfolio equity simulation.Portfolio equity is the net present value of the Company’s existing assets and liabilities. Given a 200 basis point immediate and permanent increase or decrease in market interest rates, portfolio equity may not correspondingly decrease or increase by more than 20% of stockholders’ equity.
Middlefield Banc Corp. 64
The following table presents the simulated impact of a 200 basis point upward or downward shift of market interest rates on net interest income and the change in portfolio equity. This analysis was done assuming that the interest-earning asset and interest-bearing liability levels at December 31, 2008 remained constant. The impact of the market rate movements was developed by simulating the effects of rates changing gradually over a one-year period from the December 31, 2008 levels for net interest income, and portfolio equity. The impact of market rate movements was developed by simulating the effects of an immediate and permanent change in rates at December 31, 2008 for portfolio equity:
| | | | | | | | | |
| | | Increase | | | Decrease | |
| | | +200 BP | | | -200 BP | |
| | | | | | | | | |
| Net interest income—increase (decrease) | | | (2.49 | )% | | | 6.47 | % |
| Portfolio equity—increase (decrease) | | | (8.79 | )% | | | (6.19 | )% |
Allowance for loan losses.The allowance for loan losses represents the amount management estimates is adequate to provide for probable losses inherent in the loan portfolio as of the balance sheet date. Accordingly, all loan losses are charged to the allowance, and all recoveries are credited to it. At December 31, 2008, the Company’s allowance for loan losses showed an increase of $258,000 for a balance of $3.6 million compared to $3.3 million from December 31, 2007. The allowance now represents 1.11% of the gross loan portfolio as compared to 1.07% for the previous period. The allowance for loan losses is established through a provision for loan losses which is charged to operations. The provision is based on management’s periodic evaluation of the adequacy of the allowance for loan losses, taking into account the overall risk characteristics of the various portfolio segments, the Company’s loan loss experience, the impact of economic conditions on borrowers, and other relevant factors. The estimates used to determine the adequacy of the allowance for loan losses, including the amounts and timing of future cash flows expected on impaired loans, are particularly susceptible to significant change in the near term. The total allowance for loan losses is a combination of a specific allowance for identified problem loans, a general allowance for homogeneous loan pools, and an unallocated allowance.
The specific allowance incorporates the results of measuring impaired loans as provided in Statement of Financial Accounting Standards (“FAS”) No. 114,Accounting by Creditors for Impairment of a Loan, and FAS No. 118,Accounting by Creditors for Impairment of a Loan Income Recognition and Disclosures. These accounting standards prescribe the measurement methods, income recognition, and disclosures for impaired loans. The formula allowance is calculated by applying loss factors to outstanding loans by type, excluding loans for which a specific allowance has been determined. Loss factors are based on management’s determination of the amounts necessary for concentrations and changes in mix and volume of the loan portfolio, and consideration of historical loss experience.
The unallocated allowance is determined based upon management’s evaluation of existing economic and business conditions affecting the key lending areas of the Company and other conditions, such as new loan products, credit quality trends, collateral values, specific industry conditions within portfolio segments that existed as of the balance sheet date, and the impact of those conditions on the collectibility of the loan portfolio. Management reviews these conditions quarterly. The unallocated allowance is subject to a higher degree of uncertainty because it considers risk factors that may not be reflected in the historical loss factors.
Although management believes that it uses the best information available to make such determinations and that the allowance for loan losses was adequate at December 31, 2008, future adjustments could be necessary if circumstances or economic conditions differ substantially from the assumptions used in making the initial determinations. A downturn in the local economy and employment could result in increased levels of non-performing assets and charge offs, increased loan loss provisions, and reductions in income. Additionally, as an integral part of the examination process, bank regulatory agencies periodically review a Company’s loan loss allowance. The banking agencies could require the recognition of additions to the loan loss allowance based on their judgment of information available to them at the time of their examination.
2008 Annual Report 65
The following table sets forth information concerning the Company’s allowance for loan losses at the dates and for the periods presented.
| | | | | | | | | | | | | |
| | | For the Years Ended December 31, | |
| | | 2008 | | | 2007 | | | 2006 | |
| | | (Dollars in thousands) | |
| Allowance balance at beginning of period | | $ | 3,299 | | | $ | 2,849 | | | $ | 2,841 | |
| Addition from acquisition | | | — | | | | 436 | | | | — | |
| Loans charged off: | | | | | | | | | | | | |
| Commercial and industrial | | | (278 | ) | | | (251 | ) | | | (8 | ) |
| Real estate — construction | | | — | | | | — | | | | — | |
| Real estate — mortgage: | | | — | | | | — | | | | — | |
| Residential | | | (2 | ) | | | (26 | ) | | | — | |
| Commercial | | | — | | | | — | | | | — | |
| Consumer installment | | | (135 | ) | | | (151 | ) | | | (72 | ) |
| | | | | | | | | | |
| |
| Total loans charged off | | | (415 | ) | | | (428 | ) | | | (80 | ) |
| | | | | | | | | | |
| | | | | | | | | | | | | |
| Recoveries of loans previously charged off: | | | | | | | | | | | | |
| Commercial and industrial | | | 30 | | | | — | | | | — | |
| Real estate — construction | | | — | | | | — | | | | — | |
| Real estate — mortgage: | | | — | | | | — | | | | — | |
| Residential | | | 2 | | | | — | | | | — | |
| Commercial | | | — | | | | — | | | | — | |
| Consumer installment | | | 33 | | | | 13 | | | | 28 | |
| | | | | | | | | | |
| |
| Total recoveries | | | 65 | | | | 13 | | | | 28 | |
| | | | | | | | | | |
| | | | | | | | | | | | | |
| Net loans charged off | | | (350 | ) | | | (415 | ) | | | (52 | ) |
| |
| Provision for loan losses | | | 608 | | | | 429 | | | | 60 | |
| | | | | | | | | | |
| |
| Allowance balance at end of period | | $ | 3,557 | | | $ | 3,299 | | | $ | 2,849 | |
| | | | | | | | | | |
| | | | | | | | | | | | | |
| Loans outstanding: | | | | | | | | | | | | |
| Average | | $ | 317,226 | | | $ | 288,022 | | | $ | 240,452 | |
| End of period | | | 321,575 | | | | 309,446 | | | | 249,191 | |
| |
| Ratio of allowance for loan losses to loans outstanding at end of period | | | 1.11 | % | | | 1.07 | % | | | 1.14 | % |
| |
| Net charge offs to average loans | | | (0.11 | ) | | | (0.14 | ) | | | (0.02 | ) |
The following table illustrates the allocation of the Company’s allowance for probable loan losses for each category of loan for each reported period. The allocation of the allowance to each category is not necessarily indicative of future loss in a particular category and does not restrict our use of the allowance to absorb losses in other loan categories.
| | | | | | | | | | | | | | | | | | | | | | | | | |
| | | At December 31, | |
| | | 2008 | | | 2007 | | | 2006 | |
| | | | | | | Percent of | | | | | | | Percent of | | | | | | | Percent of | |
| | | | | | | Loans in Each | | | | | | | Loans in Each | | | | | | | Loans in Each | |
| | | | | | | Category to | | | | | | | Category to | | | | | | | Category to | |
| | | Amount | | | Total Loans | | | Amount | | | Total Loans | | | Amount | | | Total Loans | |
| | | (Dollars in thousands) | | | (Dollars in thousands) | | | (Dollars in thousands) | |
| Type of Loans: | | | | | | | | | | | | | | | | | | | | | | | | |
| Commercial and industrial | | $ | 961 | | | | 20.7 | % | | $ | 1,060 | | | | 21.7 | % | | $ | 1,126 | | | | 27.5 | % |
| Real estate — construction | | | — | | | | 2.5 | | | | 99 | | | | 2.2 | | | | 25 | | | | 1.0 | |
| Real estate — mortgage: | | | | | | | | | | | | | | | | | | | | | | | | |
| Residential | | | 2,048 | | | | 62.0 | | | | 1,527 | | | | 62.5 | | | | 1,147 | | | | 65.4 | |
| Commercial | | | 521 | | | | 13.3 | | | | 512 | | | | 11.9 | | | | 158 | | | | 4.0 | |
| Consumer installment | | | 27 | | | | 1.5 | | | | 101 | | | | 1.7 | | | | 116 | | | | 2.1 | |
| Unallocated | | | — | | | | — | | | | — | | | | — | | | | 277 | | | | — | |
| | | | | | | | | | | | | | | | | | | |
| |
| Total | | $ | 3,557 | | | | 100 | % | | $ | 3,299 | | | | 100 | % | | $ | 2,849 | | | | 100 | % |
| | | | | | | | | | | | | | | | | | | |
Middlefield Banc Corp. 66
Accrual of interest is discontinued on a loan when management believes, after considering economic and business conditions, the borrower’s financial condition is such that collection of interest is doubtful. Payments received on non-accrual loans are recorded as income or applied against principal according to management’s judgment as to the collectibility of principal.
A loan is considered impaired when it is probable the borrower will not repay the loan according to the original contractual terms of the loan agreement. Management has determined that first mortgage loans on one-to-four family properties and all consumer loans represent large groups of smaller-balance homogeneous loans that are to be collectively evaluated. Loans that experience insignificant payment delays, which are defined as 90 days or less, generally are not classified as impaired. A loan is not impaired during a period of delay in payment if the Company expects to collect all amounts due, including interest accrued at the contractual interest rate for the period of delay. Management evaluates all loans identified as impaired individually. The Company estimates credit losses on impaired loans based on the present value of expected cash flows, or the fair value of the underlying collateral if loan repayment is expected to come from the sale or operation of the collateral. Impaired loans, or portions thereof, are charged off when it is determined a realized loss has occurred. Until that time, an allowance for loan losses is maintained for estimated losses.
Unless otherwise required by the loan terms, cash receipts on impaired loans are applied first to accrued interest receivable except when an impaired loan is also a non-accrual loan, in which case the portion of the payment related to interest is recognized as income.
The following table summarizes nonperforming assets by category.
| | | | | | | | | | | | | |
| | | At December 31, | |
| | | 2008 | | | 2007 | | | 2006 | |
| | | | | | | | | | | | | |
| Loans accounted for on a non-accrual basis: | | | | | | | | | | | | |
| | | | | | | | | | | | | |
| Commercial and industrial | | $ | 1,530 | | | $ | 1,231 | | | $ | 200 | |
| Real estate — construction | | | 469 | | | | 643 | | | | — | |
| Real estate — mortgage: | | | | | | | | | | | | |
| Residential | | | 3,902 | | | | 1,825 | | | | 952 | |
| Commercial | | | 351 | | | | 33 | | | | — | |
| Consumer installment | | | 2 | | | | 12 | | | | 28 | |
| | | | | | | | | | |
| | | | | | | | | | | | | |
| Total non-accrual loans | | | 6,254 | | | | 3,744 | | | | 1,180 | |
| | | | | | | | | | |
| | | | | | | | | | | | | |
| Accruing loans which are contractually past due 90 days or more: | | | | | | | | | | | | |
| Commercial and industrial | | | 558 | | | | 574 | | | | 90 | |
| Real estate — construction | | | — | | | | — | | | | — | |
| Real estate — mortgage: | | | | | | | | | | | | |
| Residential | | | 1,659 | | | | 1,333 | | | | — | |
| Commercial | | | — | | | | — | | | | 110 | |
| Consumer installment | | | 9 | | | | 11 | | | | 9 | |
| | | | | | | | | | |
| | | | | | | | | | | | | |
| Total accruing loans which are contractually past due 90 days or more | | | 2,226 | | | | 1,918 | | | | 209 | |
| | | | | | | | | | |
| | | | | | | | | | | | | |
| Total non-performing loans | | $ | 8,480 | | | $ | 5,662 | | | $ | 1,389 | |
| Real estate owned | | | 1,106 | | | | — | | | | — | |
| Other non-performing assets | | | — | | | | — | | | | — | |
| | | | | | | | | | |
| |
| Total non-performing assets | | $ | 9,586 | | | $ | 5,662 | | | $ | 1,389 | |
| | | | | | | | | | |
| Total non-performing loans to total loans | | | 2.64 | % | | | 1.83 | % | | | 0.56 | % |
| | | | | | | | | | |
| Total non-performing loans to total assets | | | 1.81 | % | | | 1.30 | % | | | 0.41 | % |
| | | | | | | | | | |
| Total non-performing assets to total assets | | | 2.05 | % | | | 1.30 | % | | | 0.41 | % |
| | | | | | | | | | |
2008 Annual Report 67
Non-performing loans as a percentage of total loans at December 31, 2008 increased to 2.67% from 1.83% for 2007. The Company had non-accrual loans of $6,255,000 and $3,744,000 at December 31, 2008 and 2007, respectively. Interest income recognized on non-accrual loans during all of the periods was insignificant. Management is not aware of any trends or uncertainties related to any loans classified as doubtful or substandard that might have a material effect on earnings, liquidity, or capital resources. Management is not aware of any information pertaining to material credits that would cause it to doubt the ability of borrowers to comply with repayment terms.
Liquidity and Capital Resources
Liquidity.Liquidity management for the Company is measured and monitored on both a short and long-term basis, allowing management to better understand and react to emerging balance sheet trends. After assessing actual and projected cash flow needs, management seeks to obtain funding at the most economical cost to the Company. Both short and long-term liquidity needs are addressed by maturities and sales of investments securities, loan repayments and maturities, and liquidating money market investments such as federal funds sold. The use of these resources, in conjunction with access to credit, provides the core ingredients for satisfying depositor, borrower, and creditor needs.
The Company’s liquid assets consist of cash and cash equivalents, which include investments in very short-term investments (i.e. federal funds sold) and investment securities classified as available for sale. The level of these assets is dependent on the Company’s operating, investing, and financing activities during any given period. At December 31, 2008 cash and cash equivalents totaled $17.5 million or 3.7% of total assets while investment securities classified as available for sale totaled $104.3 million or 22.3% of total assets. Management believes that the liquidity needs of the Company are satisfied by the current balance of cash and cash equivalents, readily available access to traditional funding sources, FHLB advances, junior subordinated debt, and the portion of the investment and loan portfolios that mature within one year. These sources of funds will enable the Company to meet cash obligations and off-balance sheet commitments as they come due.
Operating activities provided net cash of $3.2 million, $4.3 million, and $4.5 million for 2008, 2007, and 2006, respectively, generated principally from net income of $2.6 million, $3.4 million, and $3.9 million in each of these respective periods.
Investing activities consist primarily of loan originations and repayments and investment purchases and maturities. These cash usages primarily consisted of loan increases of $13.4 million as well as investment purchases of $39.1 million. Partially offsetting the usage of investment activities is $16.9 million of proceeds from investment security maturities and repayments. For the same period ended 2007, investing activities used $47.8 million in funds, principally for the net origination of loans and the purchase of investment securities of $21.0 million and $33.0 million, respectively. During the same period ended 2006, cash usages primarily consisted of loan originations of $15.1 million as well as investment purchases of $16.9 million.
Financing activities consist of the solicitation and repayment of customer deposits, borrowings and repayments, treasury stock activity, and the payment of dividends. During 2008, net cash provided by financing activities totaled $34.1 million, principally derived from an increase in deposit accounts in general, and certificates specifically. During 2007, net cash provided by financing activities totaled $47.7 million, principally derived from an increase in deposit accounts. During the same period ended 2006, net cash provided by financing activities was $25.2 million, principally derived from an increase in deposit accounts.
Liquidity may be adversely affected by unexpected deposit outflows, excessive interest rates paid by competitors, and similar matters. Management monitors projected liquidity needs and determines the level desirable, based in part on the Company’s commitment to make loans, as well as management’s assessment of the Company’s ability to generate funds. The Company anticipates that it will have sufficient liquidity to satisfy estimated short-term and long-term funding needs.
Middlefield Banc Corp. 68
Capital Resources.The Company’s primary source of capital has been retained earnings. Historically, the Company has generated net retained income to support normal growth and expansion. Management has developed a capital planning policy to not only ensure compliance with regulations, but also to ensure capital adequacy for future expansion.
The Company and its subsidiaries are subject to federal regulations imposing minimum capital requirements. Management monitors both the Company’s and banks’ Total risk-based, Tier I risk-based and Tier I leverage capital ratios to assess compliance with regulatory guidelines. At December 31, 2008, both the Company and its subsidiaries exceeded the minimum risk-based and leverage capital ratio requirements. The Company’s Total risk-based, Tier I risk-based and Tier I leverage ratios were 13.57%, 12.41%, and 8.66% at December 31, 2008. MBC’s Total risk-based, Tier I risk-based and Tier I leverage ratios were 12.30%, 11.24%, and 7.69%, and EB’s were 16.73%, 15.48%, and 12.91%, respectively, at December 31, 2008.
Market Price of and Dividends on the Registrant’s Common Equity and Related Stockholder Matters
The Company had approximately 1,041 stockholders of record as of February 6, 2009. There is no established market for the Company’s common stock. The stock is traded very infrequently. Bid prices are quoted from time to time in the “pink sheets” under the symbol “MBCN.” The “pink sheets” is a quotation service for over-the-counter securities that is maintained by Pink OTC Markets Inc., a privately owned company. The following table shows the high and low bid prices of and cash dividends paid on the Company’s common stock in 2008 and 2007, adjusted for stock splits and stock dividends. This information does not reflect retail mark-up, markdown or commissions, and does not necessarily represent actual transactions.
| | | | | | | | | | | | | |
| | | | | | | | | | | Cash | |
| | | High | | | Low | | | Dividends | |
| | | Bid | | | Bid | | | per share | |
| |
2008 | | | | | | | | | | | | |
| First Quarter | | $ | 37.25 | | | $ | 36.00 | | | $ | 0.250 | |
| Second Quarter | | $ | 37.00 | | | $ | 30.00 | | | $ | 0.260 | |
| Third Quarter | | $ | 29.25 | | | $ | 21.00 | | | $ | 0.260 | |
| Fourth Quarter | | $ | 28.00 | | | $ | 20.00 | | | $ | 0.260 | |
| | | | | | | | | | | | | |
2007 | | | | | | | | | | | | |
| First Quarter | | $ | 39.76 | | | $ | 36.43 | | | $ | 0.229 | |
| Second Quarter | | $ | 38.10 | | | $ | 36.33 | | | $ | 0.229 | |
| Third Quarter | | $ | 37.38 | | | $ | 36.19 | | | $ | 0.233 | |
| Fourth Quarter | | $ | 38.81 | | | $ | 36.00 | | | $ | 0.245 | |
2008 Annual Report 69
Corporate Headquarters
The Corporation’s headquarters is located at:
Middlefield Banc Corp.
15985 East High Street
P.O. Box 35
Middlefield, Ohio 44062
888.801.1666• 440.632.1666
fax 440.632.1700
Form 10-K and 10-Q Availability
A copy of Middlefield Banc Corp.’s Annual Report on Form 10-K and Quarterly Reports on 10-Q filed with the Securities and Exchange Commission will be furnished to any shareholder, free of charge, upon written or e-mail request to:
Donald L. Stacy
Treasurer and CFO
Middlefield Banc Corp.
P.O. Box 35
Middlefield, Ohio 44062
or dstacy@middlefieldbank.com
Market Makers
The symbol for Middlefield Banc Corp. common stock is MBCN and the CUSIP is 596304204.
Sweney Cartwright & Co.
17 South High Street
Columbus, Ohio 43215
614.228.5391• 800.334.7481
Stifel, Nicolaus & Co., Inc.
18 Columbia Turnpike
Florham, NJ 07932
800.342.2325
Howe Barnes Hoefer & Arnett, Inc.
222 South Riverside Plaza
Chicago, Illinois 60606
312.655.3000
Notice of Annual Meeting
The Annual Meeting of Shareholders of Middlefield Banc Corp. will be held at 1:00 p.m. on Wednesday, May 13, 2009, at:
Sun Valley Banquet and Party Center
10000 Edwards Lane
Aurora, Ohio 44202
Transfer Agent and Registrar
American Stock Transfer & Trust Company
59 Maiden Lane
Plaza Level
New York, NY 10038
877.366.6443
Independent Auditors
S.R. Snodgrass, A. C.
2100 Corporate Drive, Suite 400
Wexford, Pennsylvania 15090-7647
724.934.0344
Internet Information
Information on the company and its subsidiary banks is available on the Internet at www.middlefieldbank.com and www.emeraldbank.com.
Dividend Payment Dates
Subject to action by the Board of Directors, Middlefield Banc Corp. will pay dividends in March, June, September, and December.
Middlefield Banc Corp. 70
Dividend Reinvestment and Stock Purchase Plan
Shareholders may elect to reinvest their dividends in additional shares of Middlefield Banc Corp.’s common stock through the company’s Dividend Reinvestment Plan. To arrange automatic purchase of shares with quarterly dividend proceeds, please call 888.801.1666.
Direct Deposit of Dividends
The direct deposit program, which is offered at no charge, provides for automatic deposit of quarterly dividends directly to a checking or savings account with The Middlefield Banking Company or Emerald Bank. For information regarding this program, please call 888.801.1666.
Market for Middlefield’s Common Equity & Related Stockholder Matters
Middlefield had approximately 1,041 stockholders of record as of February 6, 2009. There is no established market for Middlefield common stock. The stock is traded very infrequently. Bid prices are quoted from time to time on the National Quotation Bureau’s “pink sheets” under the symbol “MBCN.” The following table shows the high and low bid prices of and cash dividends paid on Middlefield common stock in 2008 and 2007, adjusted for stock splits and stock dividends. This information does not reflect retail mark-up, markdown or commissions, and does not necessarily represent actual transactions.
| | | | | | | | | | | | | |
| | | | | | | | | | | Cash | |
| | | High | | | Low | | | Dividends | |
| | | Bid | | | Bid | | | per share | |
| |
2008 | | | | | | | | | | | | |
| First Quarter | | $ | 37.25 | | | $ | 36.00 | | | $ | 0.250 | |
| Second Quarter | | $ | 37.00 | | | $ | 30.00 | | | $ | 0.260 | |
| Third Quarter | | $ | 29.25 | | | $ | 21.00 | | | $ | 0.260 | |
| Fourth Quarter | | $ | 28.00 | | | $ | 20.00 | | | $ | 0.260 | |
| | | | | | | | | | | | | |
2007 | | | | | | | | | | | | |
| First Quarter | | $ | 39.76 | | | $ | 36.43 | | | $ | 0.229 | |
| Second Quarter | | $ | 38.10 | | | $ | 36.33 | | | $ | 0.229 | |
| Third Quarter | | $ | 37.38 | | | $ | 36.19 | | | $ | 0.233 | |
| Fourth Quarter | | $ | 38.81 | | | $ | 36.00 | | | $ | 0.245 | |
2008 Annual Report 71
| | | | | |
Main Office | | Mantua Branch | | Newbury Branch |
| |
| 15985 East High Street | | 10519 Main Street | | 11110 Kinsman Road |
| 440.632.1666 | | 330.274.0881 | | 440.564.7000 |
| | | | | |
West Branch | | Chardon Branch | | Cortland Branch |
| |
| 15545 West High Street | | 348 Center Street | | 3450 Niles-Cortland Road |
| 440.632.1666 | | 440.286.1222 | | 330.637.3208 |
| | | | | |
Garrettsville Branch | | Orwell Branch | | |
| |
| 8058 State Street | | 30 South Maple Street | | |
| 330.527.2121 | | 440.437.7200 | | |
| | | | | |
Dublin Branch | | Westerville Branch | | |
| |
| 6215 Perimeter Drive | | 17 North State Street | | |
| 614.793.4631 | | 614.890.7832 | | |
2008 Annual Report
Exhibit Index
| | | | | | | |
| exhibit | | | | |
| number | | description | | location |
| | | | | | | |
| | 20 | | | Management’s Annual Report on Internal Control Over Financial Reporting | | filed herewith |
| | | | | | | |
| | 21 | | | Subsidiaries of Middlefield Banc Corp. | | filed herewith |
| | | | | | | |
| | 23 | | | Consent of S.R. Snodgrass, A.C., independent auditors of Middlefield Banc Corp. | | filed herewith |
| | | | | | | |
| | 31.1 | | | Rule 13a-14(a) certification of Chief Executive Officer | | filed herewith |
| | | | | | | |
| | 31.2 | | | Rule 13a-14(a) certification of Chief Financial Officer | | filed herewith |
| | | | | | | |
| | 32 | | | Rule 13a-14(b) certification | | filed herewith |
| | | | | | | |