
Earnings Call Presentation 1 st Quarter Fiscal 2018 ADVANCING INNOVATION TO SOLVE GLOBAL CHALLENGES
1 st Quarter Fiscal 2018 Earnings Call Presentation 2 Safe - Harbor Statement This presentation contains forward - looking statements that are subject to risks and uncertainties and which reflect management’s current beliefs and estimates of future economic circumstances, industry conditions, Company performance, financial results and planned financing. You can find a discussion of many of these risks and uncertainties in the annual, quarterly and current reports that the Company files with the Securities and Exchange Commission. Investors should understand that a number of factors could cause future economic and industry conditions, and the Company’s actual financial condition and results of operations, to differ materially from management’s beliefs expressed in the forward - looking statements contained in this presentation. These factors include those outlined in the “Risk Factors” section of the Company’s most recent annual report on Form 10 - K filed with the Securities and Exchange Commission, and investors are urged to review these factors when considering the forward - looking statements contained in this presentation. For these statements, the Company claims the protection of the safe harbor for forward - looking statements contained in the Private Securities Litigation Reform Act of 1995 . For full financial statement information, please see the Company’s earnings release dated December 21, 2017 .
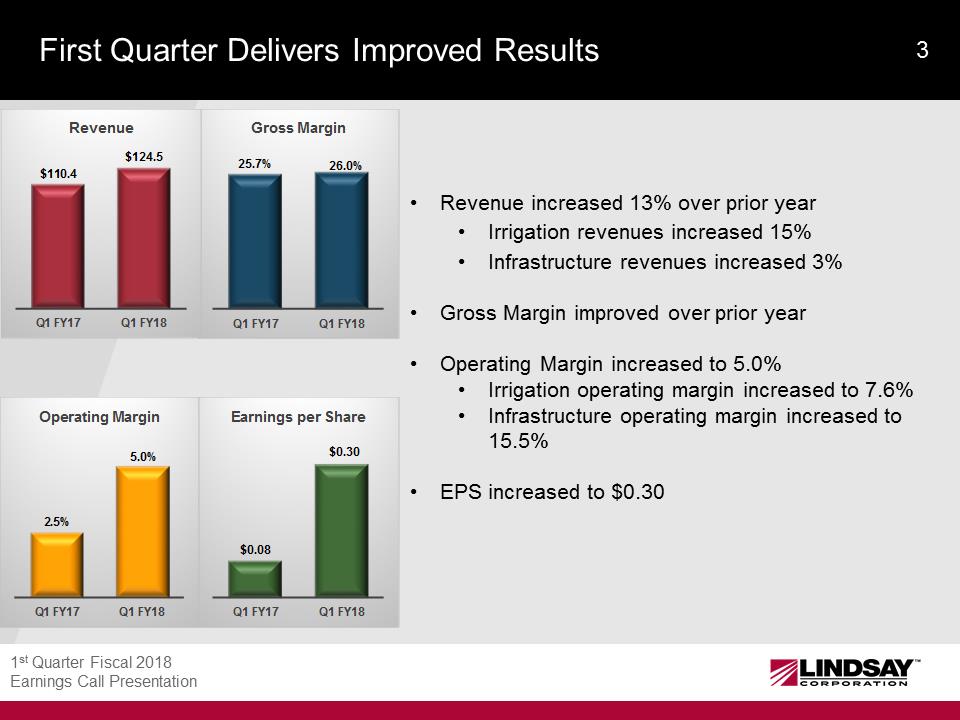
1 st Quarter Fiscal 2018 Earnings Call Presentation 3 First Quarter Delivers Improved Results 25.7%26.0% Q1 FY17Q1 FY18Gross Margin $0.08 $0.30 Q1 FY17Q1 FY18Earnings per Share• Revenue increased 13% over prior year • Irrigation revenues increased 15% • Infrastructure revenues increased 3% • Gross Margin improved over prior year • Operating Margin increased to 5.0 % • Irrigation operating margin increased to 7.6% • Infrastructure operating margin increased to 15.5% • EPS increased to $0.30 $110.4 $124.5 Q1 FY17Q1 FY18Revenue 2.5% 5.0% Q1 FY17Q1 FY18Operating Margin
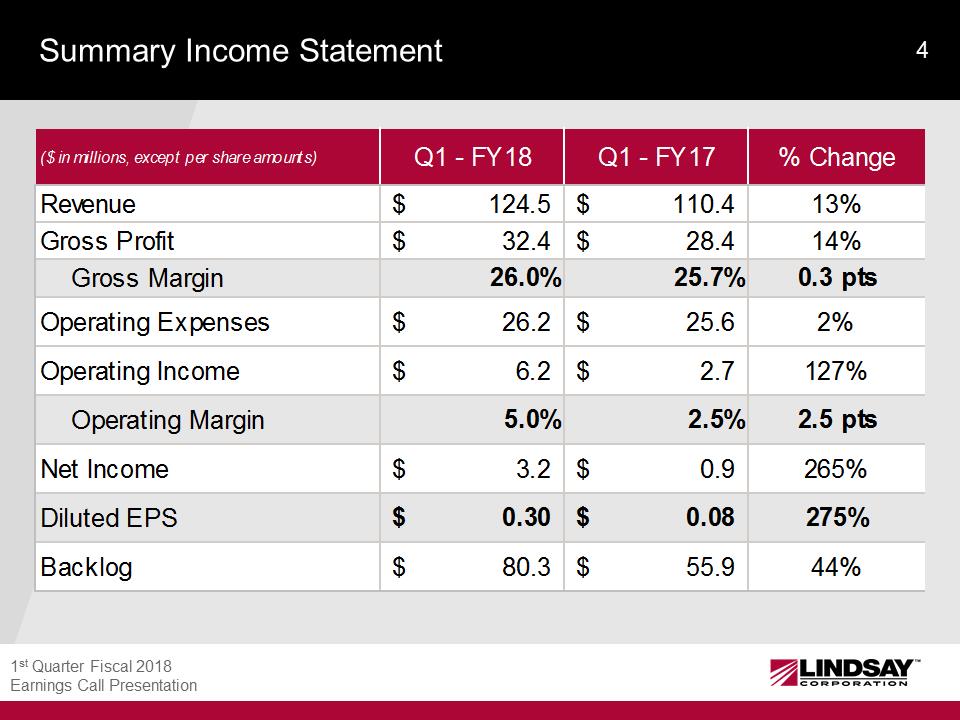
1 st Quarter Fiscal 2018 Earnings Call Presentation 4 Summary Income Statement ($ in millions, except per share amounts)Q1 - FY18Q1 - FY17% Change Revenue 124.5$ 110.4$ 13% Gross Profit 32.4$ 28.4$ 14% Gross Margin 26.0% 25.7% 0.3 pts Operating Expenses 26.2$ 25.6$ 2% Operating Income6.2$ 2.7$ 127% Operating Margin5.0%2.5%2.5 pts Net Income3.2$ 0.9$ 265% Diluted EPS0.30$ 0.08$ 275% Backlog80.3$ 55.9$ 44%
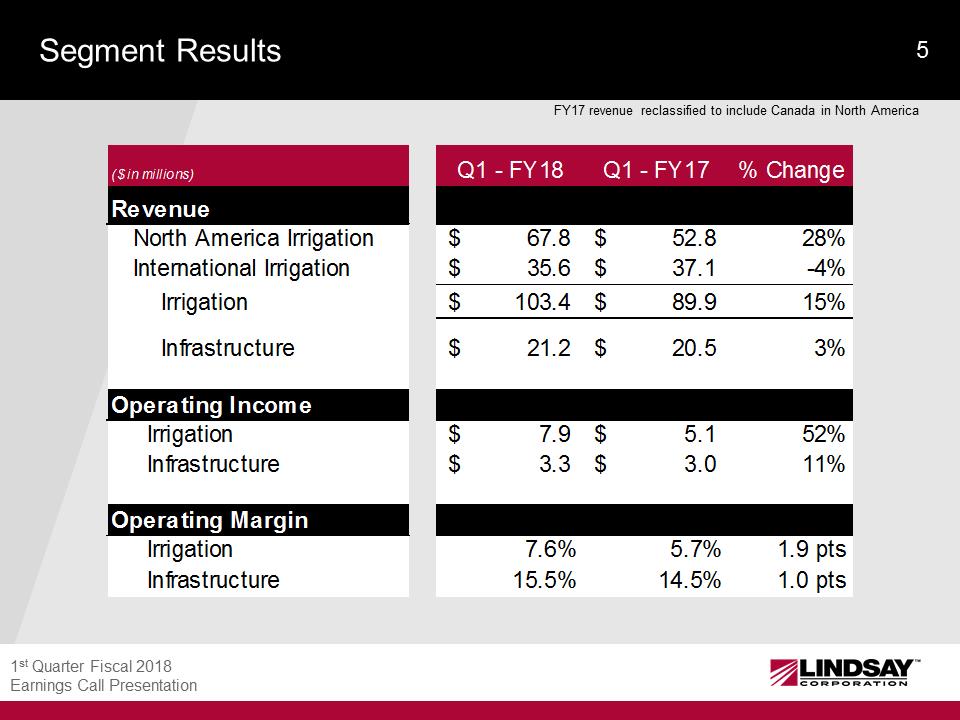
1 st Quarter Fiscal 2018 Earnings Call Presentation 5 Segment Results FY17 revenue reclassified to include Canada in North America ($ in millions)Q1 - FY18Q1 - FY17% Change Revenue North America Irrigation67.8$ 52.8$ 28% International Irrigation35.6$ 37.1$ -4% Irrigation103.4$ 89.9$ 15% Infrastructure21.2$ 20.5$ 3% Operating Income Irrigation7.9$ 5.1$ 52% Infrastructure3.3$ 3.0$ 11% Operating Margin Irrigation7.6%5.7%1.9 pts Infrastructure15.5%14.5%1.0 pts
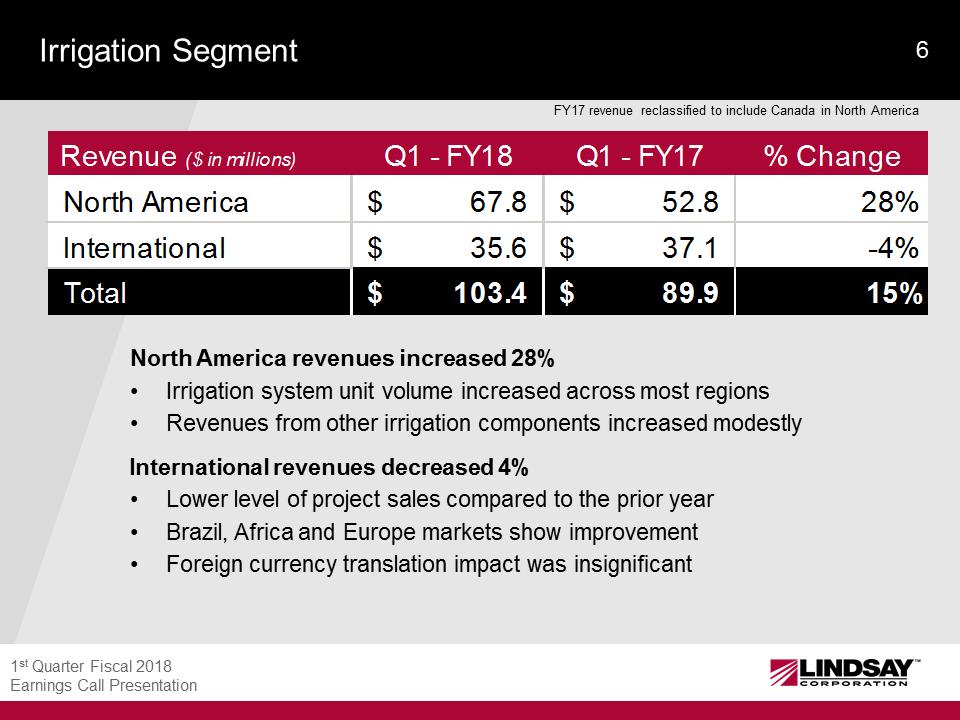
1 st Quarter Fiscal 2018 Earnings Call Presentation 6 Irrigation Segment North America revenues increased 28% • Irrigation system unit volume increased across most regions • Revenues from other irrigation components increased modestly International revenues decreased 4% • Lower level of project sales compared to the prior year • Brazil, Africa and Europe markets show improvement • Foreign currency translation impact was insignificant FY17 revenue reclassified to include Canada in North America Revenue ($ in millions)Q1 - FY18Q1 - FY17% Change North America67.8$ 52.8$ 28% International35.6$ 37.1$ -4% Total103.4$ 89.9$ 15%
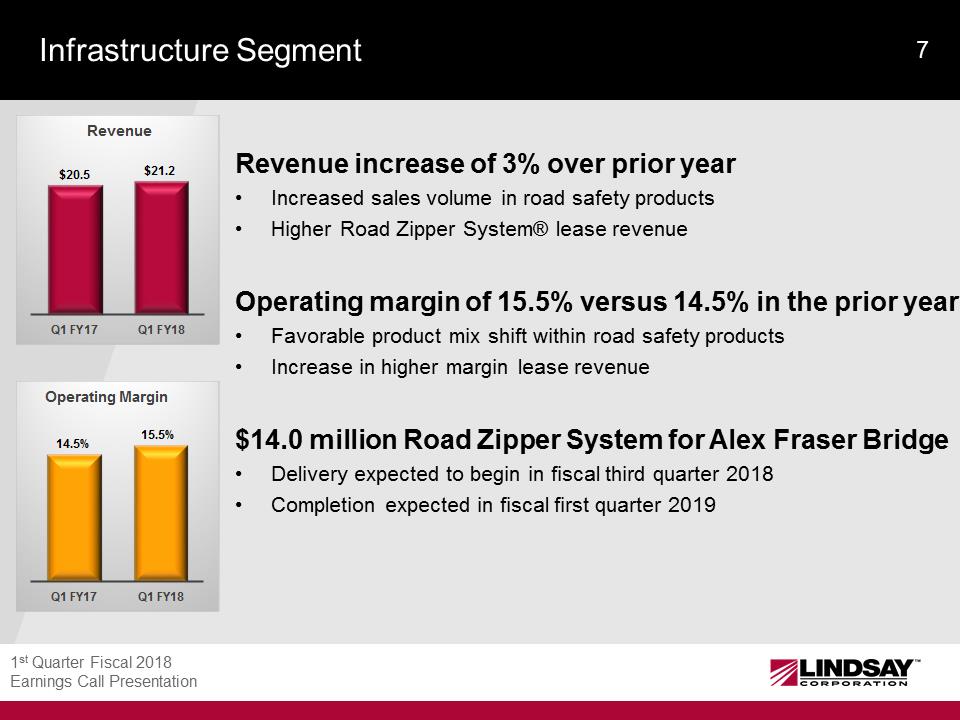
1 st Quarter Fiscal 2018 Earnings Call Presentation 7 Infrastructure Segment Revenue increase of 3% over prior year • Increased sales volume in road safety products • Higher Road Zipper System® lease revenue Operating margin of 15.5% versus 14.5% in the prior year • Favorable product mix shift within road safety products • Increase in higher margin lease revenue $14.0 million Road Zipper System for Alex Fraser Bridge • Delivery expected to begin in fiscal third quarter 2018 • Completion expected in fiscal first quarter 2019 $20.5 $21.2 Q1 FY17Q1 FY18Revenue 14.5% 15.5% Q1 FY17Q1 FY18Operating Margin
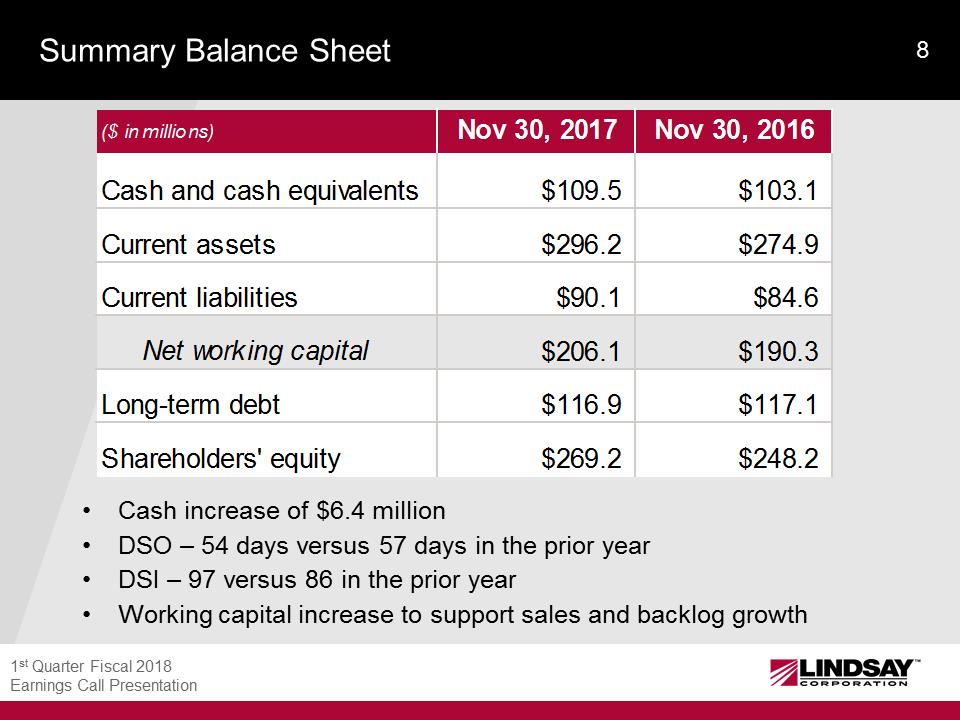
1 st Quarter Fiscal 2018 Earnings Call Presentation 8 Summary Balance Sheet • Cash increase of $6.4 million • DSO – 54 days versus 57 days in the prior year • DSI – 97 versus 8 6 in the prior year • Working capital increase to support sales and backlog growth ($ in millions)Nov 30, 2017Nov 30, 2016Cash and cash equivalents$109.5 $103.1 Current assets$296.2 $274.9 Current liabilities$90.1 $84.6 Net working capital$206.1 $190.3 Long-term debt$116.9 $117.1 Shareholders' equity$269.2 $248.2
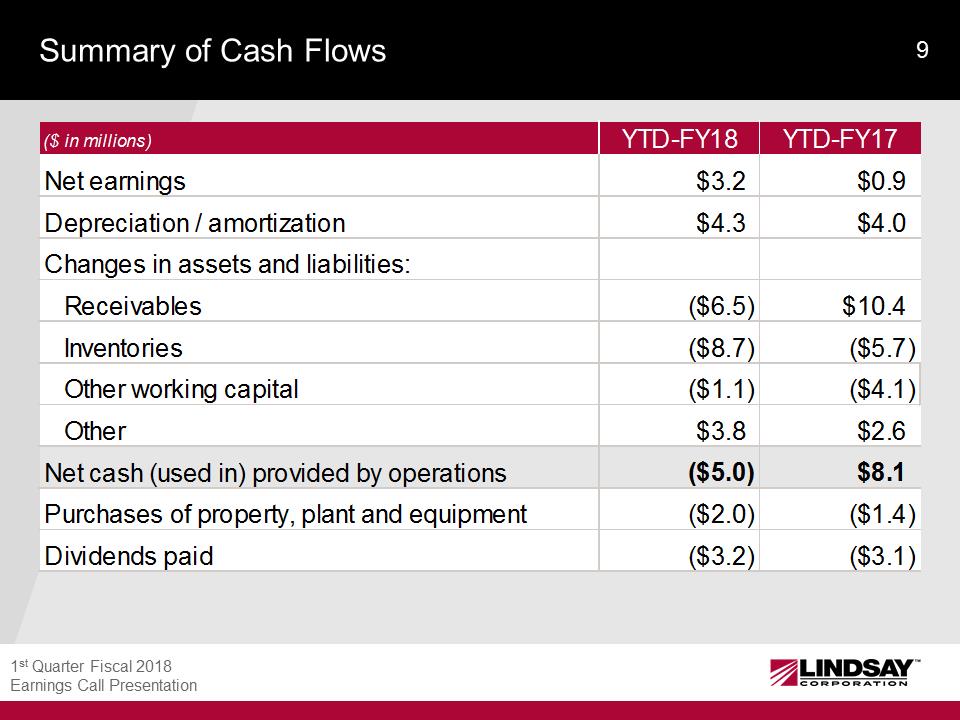
1 st Quarter Fiscal 2018 Earnings Call Presentation 9 Summary of Cash Flows ($ in millions)YTD-FY18YTD-FY17Net earnings$3.2 $0.9 Depreciation / amortization$4.3 $4.0 Changes in assets and liabilities: Receivables ($6.5) $10.4 Inventories($8.7) ($5.7) Other working capital($1.1) ($4.1) Other$3.8 $2.6 Net cash (used in) provided by operations ($5.0) $8.1 Purchases of property, plant and equipment ($2.0) ($1.4) Dividends paid($3.2) ($3.1)
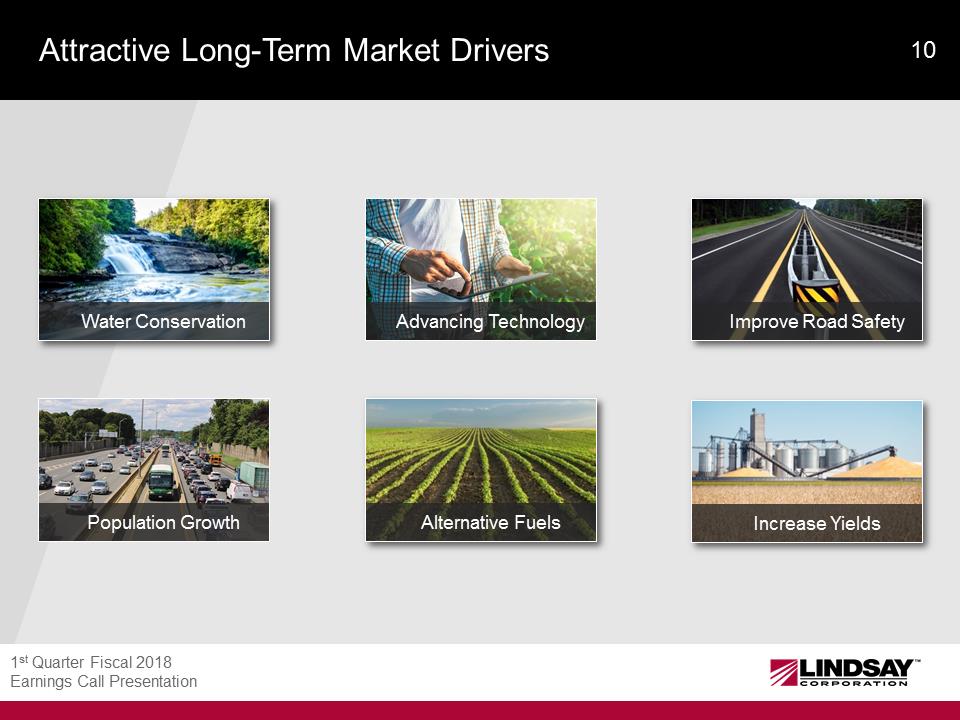
1 st Quarter Fiscal 2018 Earnings Call Presentation 10 Attractive Long - Term Market Drivers Water Conservation Alternative Fuels Increase Yields Improve Road Safety Population Growth Advancing Technology
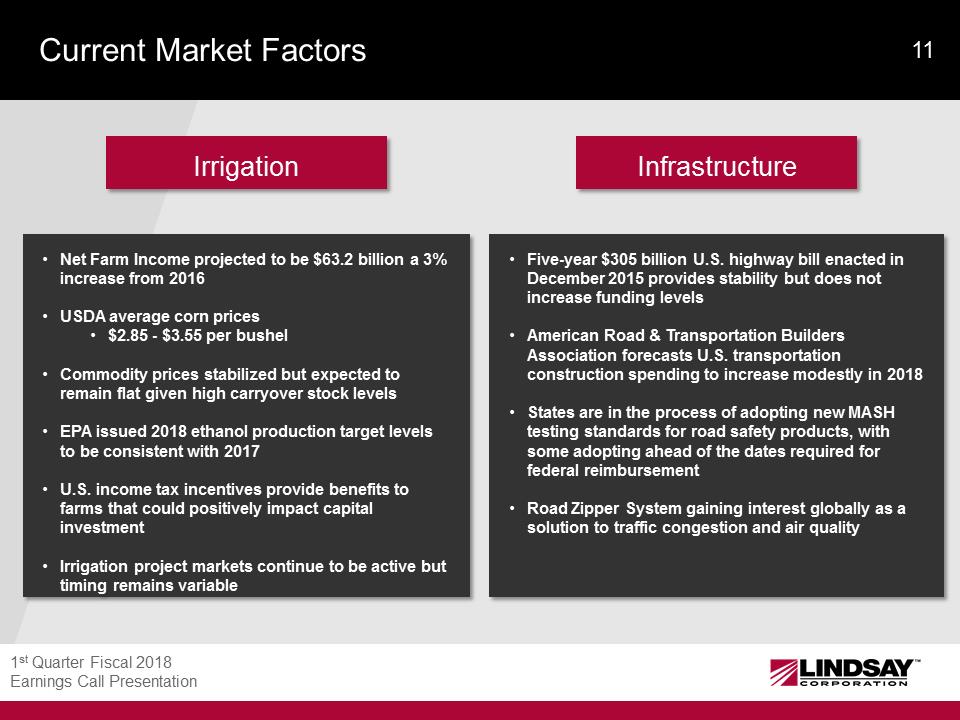
1 st Quarter Fiscal 2018 Earnings Call Presentation 11 Current Market Factors • Net Farm Income projected to be $63.2 billion a 3% increase from 2016 • USDA average corn prices • $2.85 - $3.55 per bushel • Commodity prices stabilized but expected to remain flat given high carryover stock levels • EPA issued 2018 ethanol production target levels to be consistent with 2017 • U.S. income tax incentives provide benefits to farms that could positively impact capital investment • Irrigation project markets continue to be active but timing remains variable • Five - year $305 billion U.S. highway bill enacted in December 2015 provides stability but does not increase funding levels • American Road & Transportation Builders Association forecasts U.S. transportation construction spending to increase modestly in 2018 • States are in the process of adopting new MASH testing standards for road safety products, with some adopting ahead of the dates required for federal reimbursement • Road Zipper System gaining interest globally as a solution to traffic congestion and air quality Irrigation Infrastructure
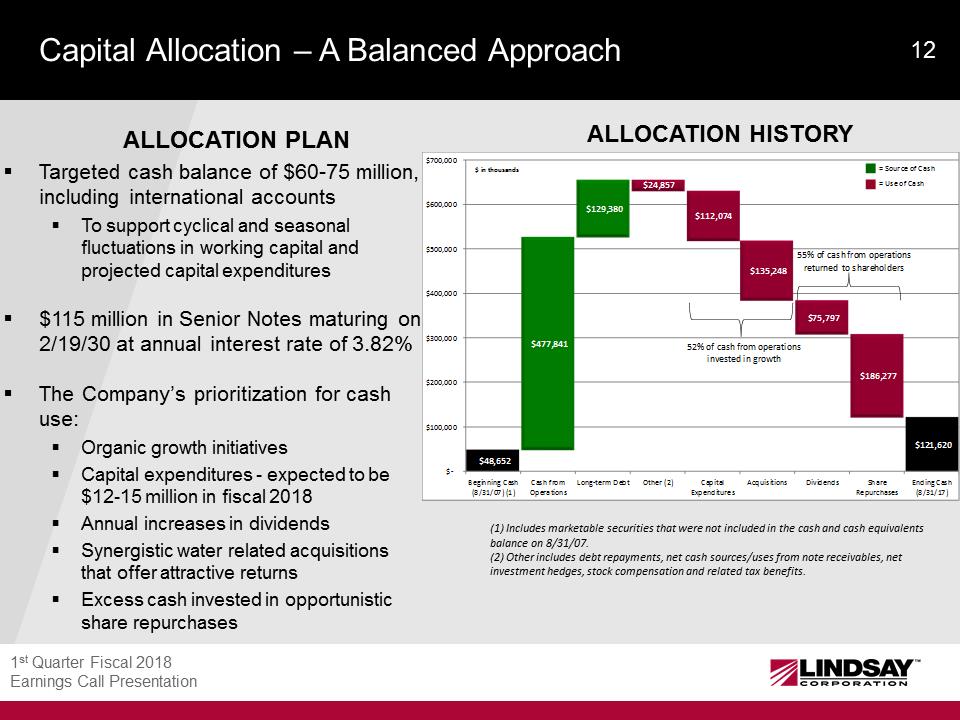
1 st Quarter Fiscal 2018 Earnings Call Presentation 12 Capital Allocation – A Balanced Approach (1) Includes marketable securities that were not included in the cash and cash equivalents balance on 8/31/07. (2) Other includes debt repayments, net cash sources/uses from note receivables, net investment hedges, stock compensation and related tax benefits. . Targeted cash balance of $ 60 - 75 million, including international accounts . To support cyclical and seasonal fluctuations in working capital and projected capital expenditures . $115 million in Senior Notes maturing on 2/19/30 at annual interest rate of 3.82% . The Company’s prioritization for cash use: . Organic growth initiatives . Capital expenditures - expected to be $12 - 15 million in fiscal 2018 . Annual increases in dividends . Synergistic water related acquisitions that offer attractive returns . Excess cash invested in opportunistic share repurchases ALLOCATION PLAN ALLOCATION HISTORY $48,652 $477,841 $129,380 $24,857 $112,074 $135,248 $75,797 $186,277 $121,620 $- $100,000 $200,000 $300,000 $400,000 $500,000 $600,000 $700,000Beginning Cash(8/31/07) (1) Cash from Operations Long-term Debt Other (2)CapitalExpendituresAcquisitionsDividendsShareRepurchasesEnding Cash(8/31/17) 52% of cash from operations invested in growth55% of cash from operations returned to shareholders= Source of Cash= Use of Cash$ in thousands