3rd Quarter Fiscal 2022 Earnings Slide Deck Exhibit 99.2
Safe-Harbor Statement This presentation contains forward-looking statements that are subject to risks and uncertainties, and which reflect management’s current beliefs and estimates of future economic circumstances, industry conditions, Company performance, financial results and planned financing. You can find a discussion of many of these risks and uncertainties in the annual, quarterly and current reports that the Company files with the Securities and Exchange Commission. Investors should understand that a number of factors (including but not limited to the lingering effects of the COVID-19 pandemic and related public health measures on plant operations, workforce availability, supply chain availability, and product demand) could cause future economic and industry conditions and the Company’s actual financial condition and results of operations to differ materially from management’s beliefs expressed in the forward-looking statements contained in this presentation. These factors include those outlined in the “Risk Factors” section of the Company’s most recent annual report on Form 10-K filed with the Securities and Exchange Commission, and investors are urged to review these factors when considering the forward-looking statements contained in this presentation. For these statements, the Company claims the protection of the safe harbor for forward-looking statements contained in the Private Securities Litigation Reform Act of 1995. For full financial statement information, please see the Company’s earnings release dated June 30, 2022.
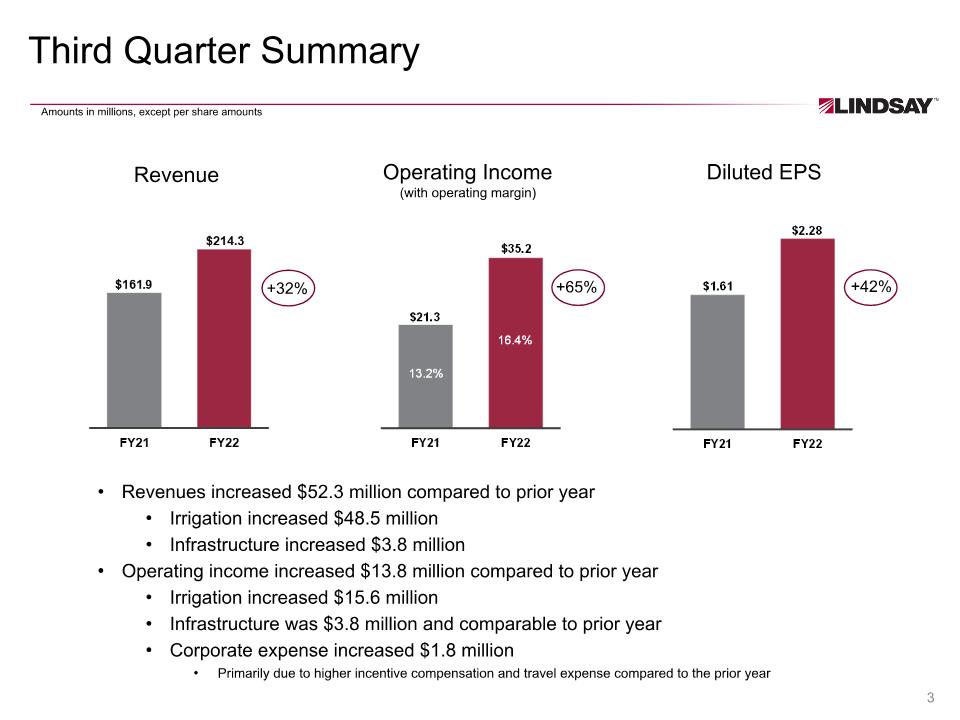
Third Quarter Summary Revenues increased $52.3 million compared to prior year Irrigation increased $48.5 million Infrastructure increased $3.8 million Operating income increased $13.8 million compared to prior year Irrigation increased $15.6 million Infrastructure was $3.8 million and comparable to prior year Corporate expense increased $1.8 million Primarily due to higher incentive compensation and travel expense compared to the prior year Amounts in millions, except per share amounts Revenue Operating Income (with operating margin) Diluted EPS +32% +42% +65%
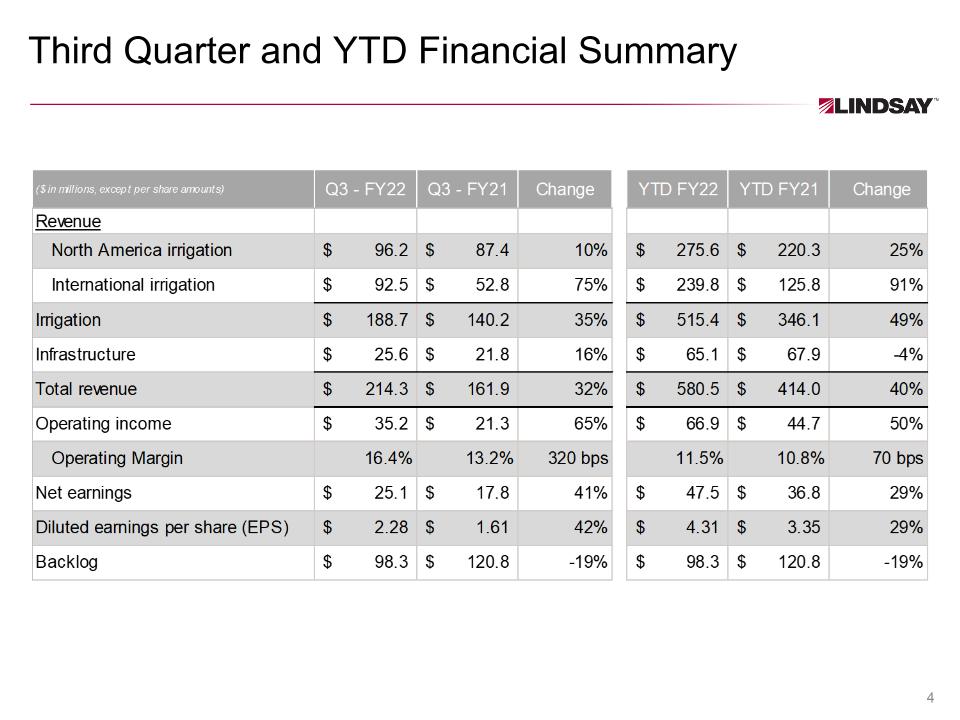
Third Quarter and YTD Financial Summary
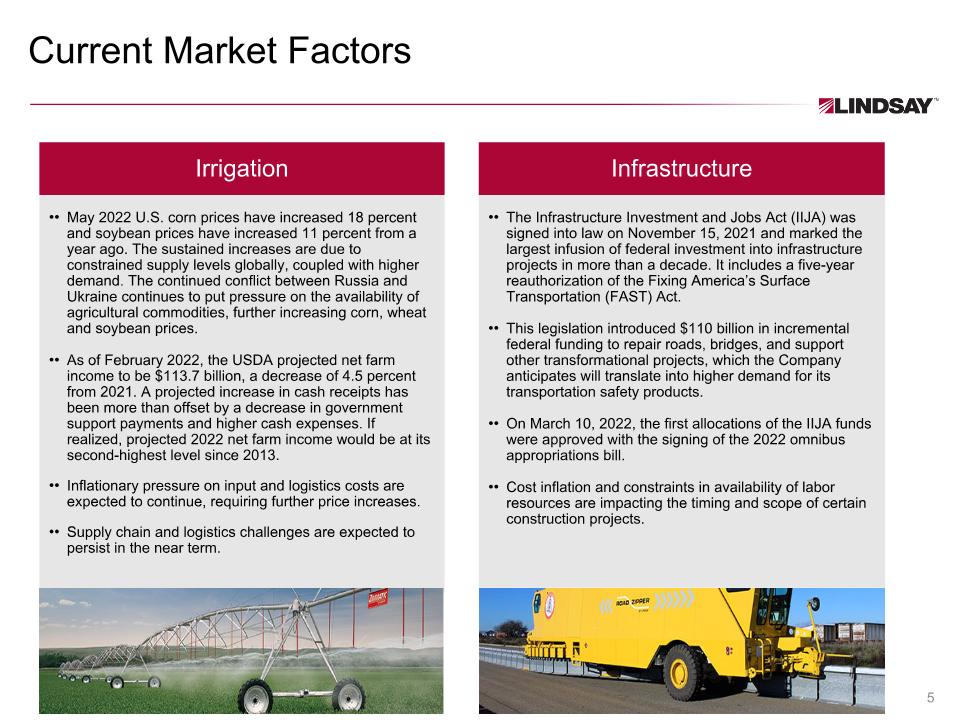
Current Market Factors May 2022 U.S. corn prices have increased 18 percent and soybean prices have increased 11 percent from a year ago. The sustained increases are due to constrained supply levels globally, coupled with higher demand. The continued conflict between Russia and Ukraine continues to put pressure on the availability of agricultural commodities, further increasing corn, wheat and soybean prices. As of February 2022, the USDA projected net farm income to be $113.7 billion, a decrease of 4.5 percent from 2021. A projected increase in cash receipts has been more than offset by a decrease in government support payments and higher cash expenses. If realized, projected 2022 net farm income would be at its second-highest level since 2013. Inflationary pressure on input and logistics costs are expected to continue, requiring further price increases. Supply chain and logistics challenges are expected to persist in the near term. Irrigation Infrastructure The Infrastructure Investment and Jobs Act (IIJA) was signed into law on November 15, 2021 and marked the largest infusion of federal investment into infrastructure projects in more than a decade. It includes a five-year reauthorization of the Fixing America’s Surface Transportation (FAST) Act. This legislation introduced $110 billion in incremental federal funding to repair roads, bridges, and support other transformational projects, which the Company anticipates will translate into higher demand for its transportation safety products. On March 10, 2022, the first allocations of the IIJA funds were approved with the signing of the 2022 omnibus appropriations bill. Cost inflation and constraints in availability of labor resources are impacting the timing and scope of certain construction projects.
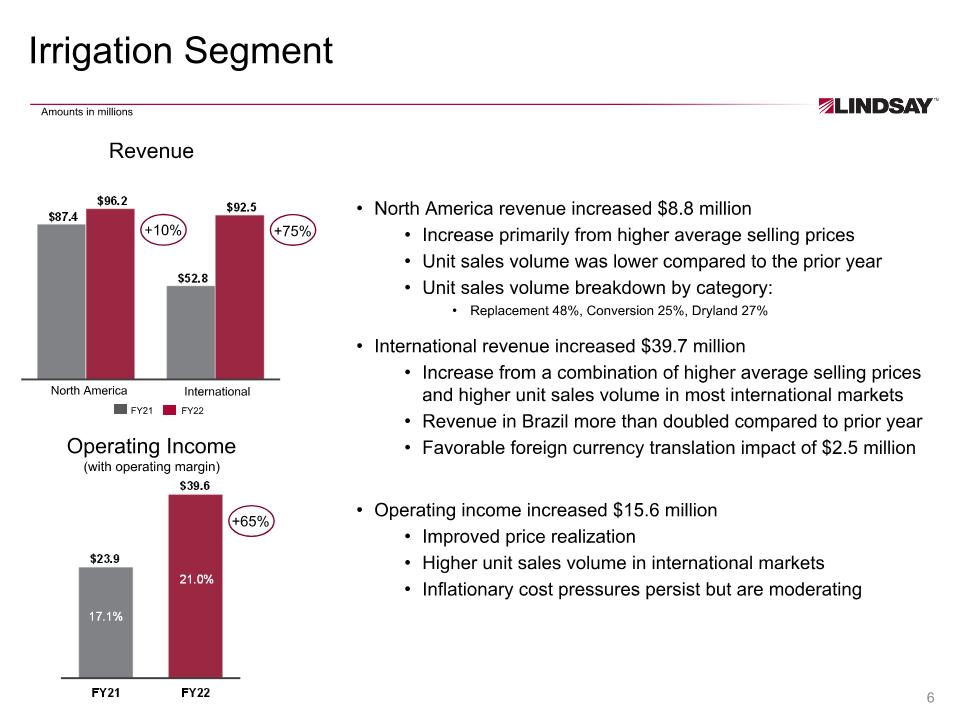
Irrigation Segment North America revenue increased $8.8 million Increase primarily from higher average selling prices Unit sales volume was lower compared to the prior year Unit sales volume breakdown by category: Replacement 48%, Conversion 25%, Dryland 27% International revenue increased $39.7 million Increase from a combination of higher average selling prices and higher unit sales volume in most international markets Revenue in Brazil more than doubled compared to prior year Favorable foreign currency translation impact of $2.5 million Operating income increased $15.6 million Improved price realization Higher unit sales volume in international markets Inflationary cost pressures persist but are moderating Revenue North America International FY21 FY22 Amounts in millions +75% +65% +10% Operating Income (with operating margin)
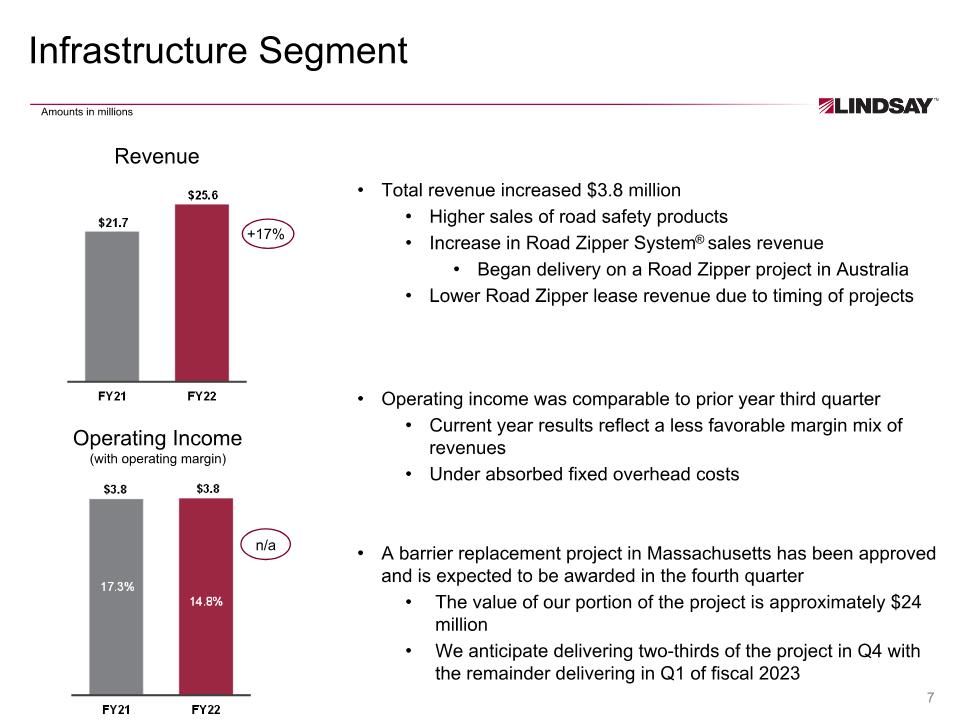
Infrastructure Segment Total revenue increased $3.8 million Higher sales of road safety products Increase in Road Zipper System® sales revenue Began delivery on a Road Zipper project in Australia Lower Road Zipper lease revenue due to timing of projects Operating income was comparable to prior year third quarter Current year results reflect a less favorable margin mix of revenues Under absorbed fixed overhead costs A barrier replacement project in Massachusetts has been approved and is expected to be awarded in the fourth quarter The value of our portion of the project is approximately $24 million We anticipate delivering two-thirds of the project in Q4 with the remainder delivering in Q1 of fiscal 2023 Revenue Amounts in millions +17% n/a Operating Income (with operating margin)
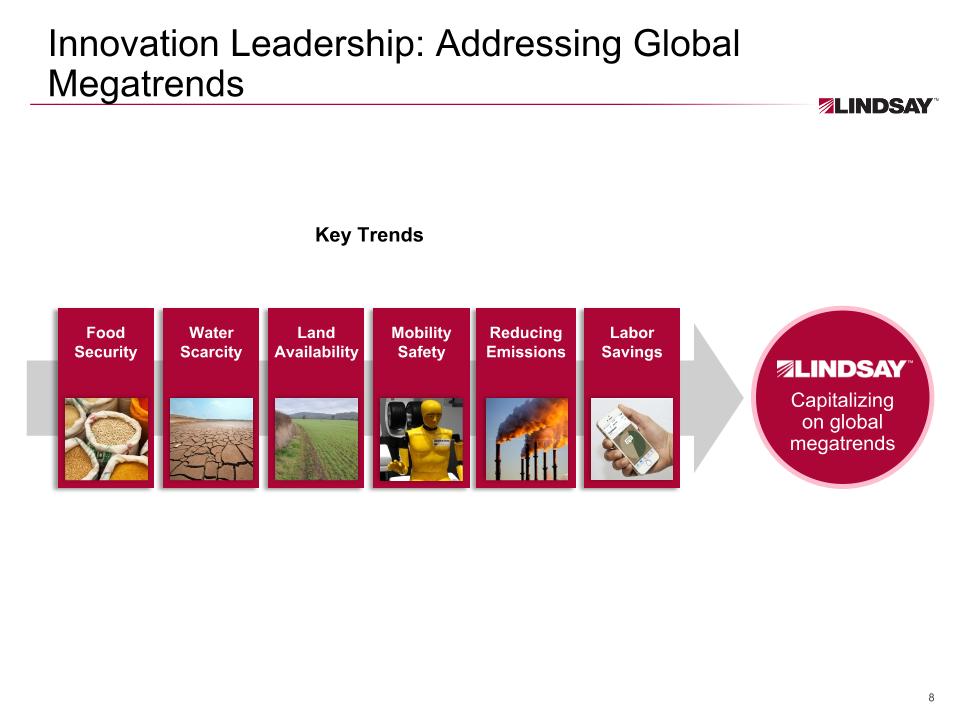
Innovation Leadership: Addressing Global Megatrends Capitalizing�on global�megatrends Key Trends Food�Security Water�Scarcity Land�Availability Mobility�Safety Reducing�Emissions Labor Savings
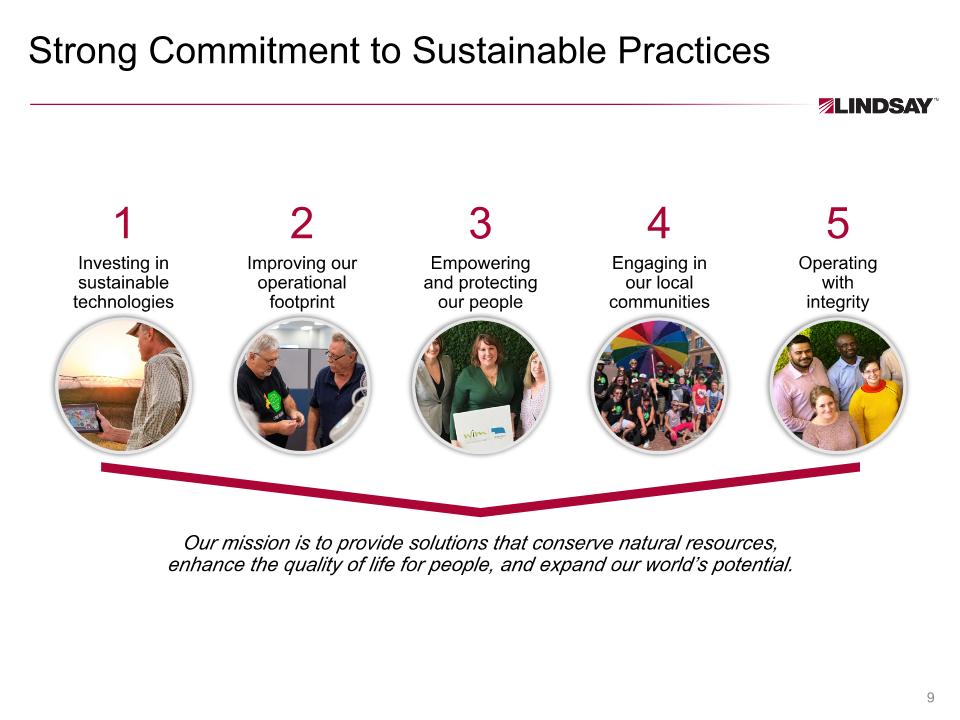
Strong Commitment to Sustainable Practices Our mission is to provide solutions that conserve natural resources, enhance the quality of life for people, and expand our world’s potential. Investing in sustainable technologies Improving our operational footprint Empowering and protecting our people Engaging in�our local communities Operating�with�integrity 1 2 3 4 5
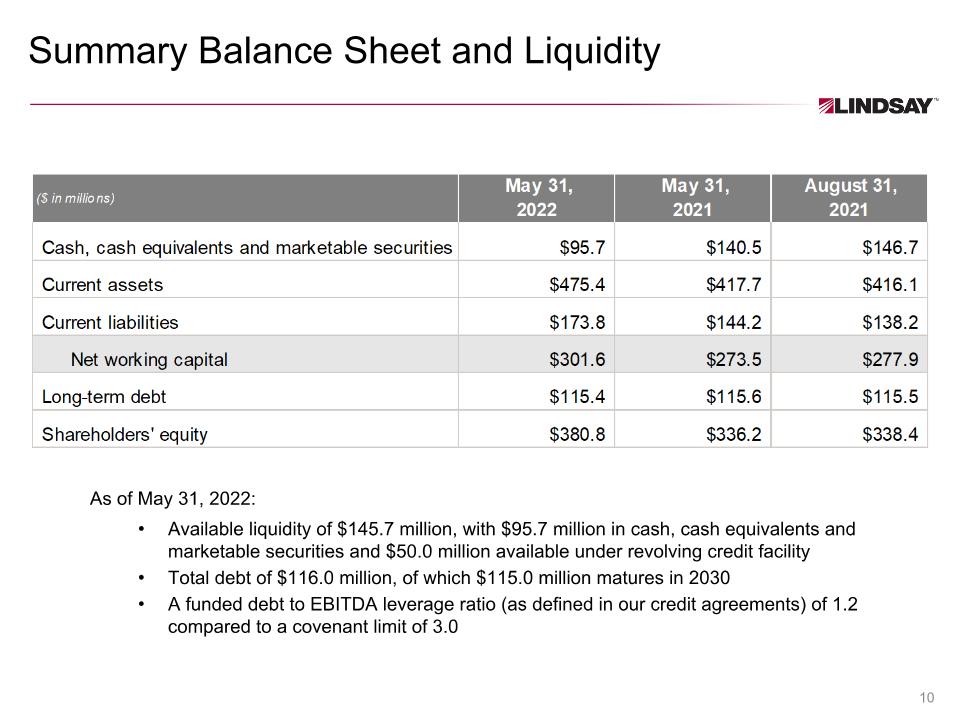
Summary Balance Sheet and Liquidity As of May 31, 2022: Available liquidity of $145.7 million, with $95.7 million in cash, cash equivalents and marketable securities and $50.0 million available under revolving credit facility Total debt of $116.0 million, of which $115.0 million matures in 2030 A funded debt to EBITDA leverage ratio (as defined in our credit agreements) of 1.2 compared to a covenant limit of 3.0
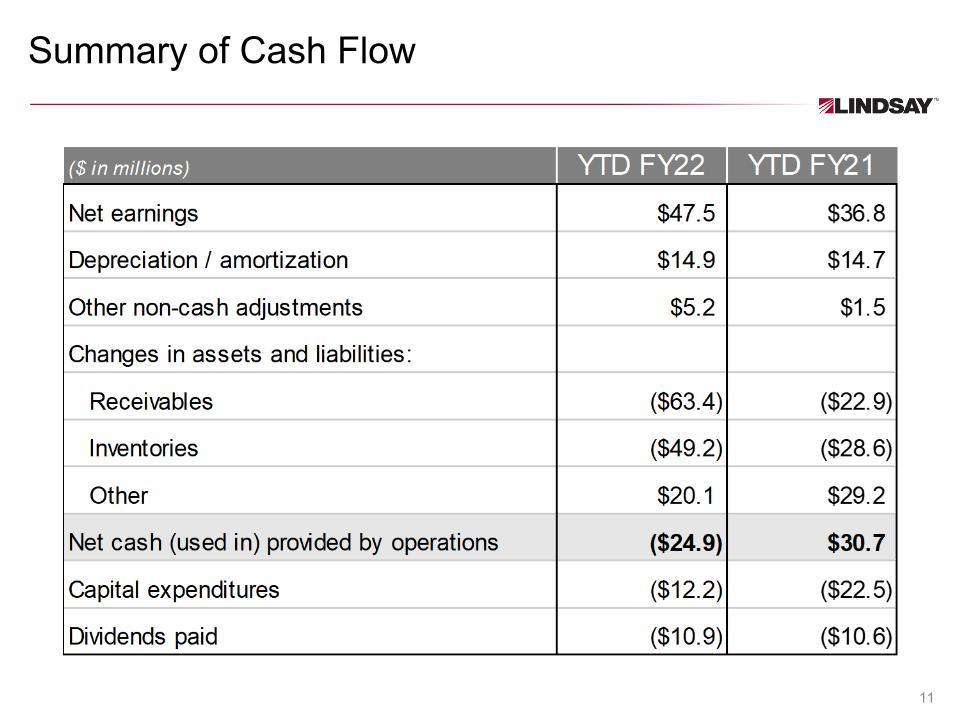
Summary of Cash Flow
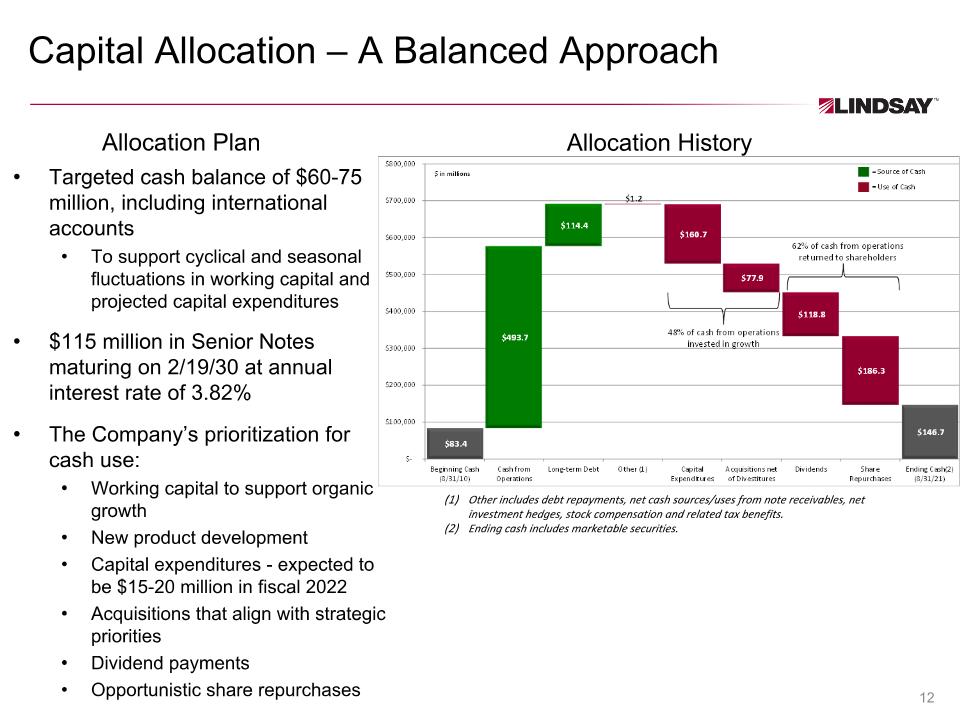
Capital Allocation – A Balanced Approach Allocation History Other includes debt repayments, net cash sources/uses from note receivables, net investment hedges, stock compensation and related tax benefits. Ending cash includes marketable securities. Targeted cash balance of $60-75 million, including international accounts To support cyclical and seasonal fluctuations in working capital and projected capital expenditures $115 million in Senior Notes maturing on 2/19/30 at annual interest rate of 3.82% The Company’s prioritization for cash use: Working capital to support organic growth New product development Capital expenditures - expected to be $15-20 million in fiscal 2022 Acquisitions that align with strategic priorities Dividend payments Opportunistic share repurchases Allocation Plan
Appendix
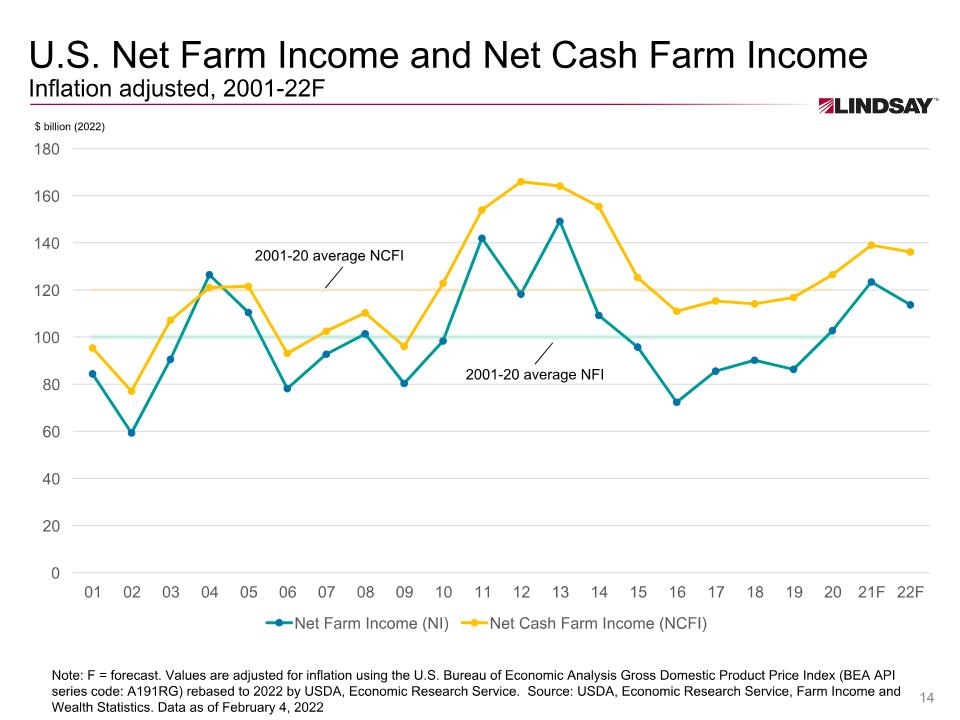
U.S. Net Farm Income and Net Cash Farm Income�Inflation adjusted, 2001-22F 2001-20 average NCFI Note: F = forecast. Values are adjusted for inflation using the U.S. Bureau of Economic Analysis Gross Domestic Product Price Index (BEA API series code: A191RG) rebased to 2022 by USDA, Economic Research Service. Source: USDA, Economic Research Service, Farm Income and Wealth Statistics. Data as of February 4, 2022 $ billion (2022) 2001-20 average NFI
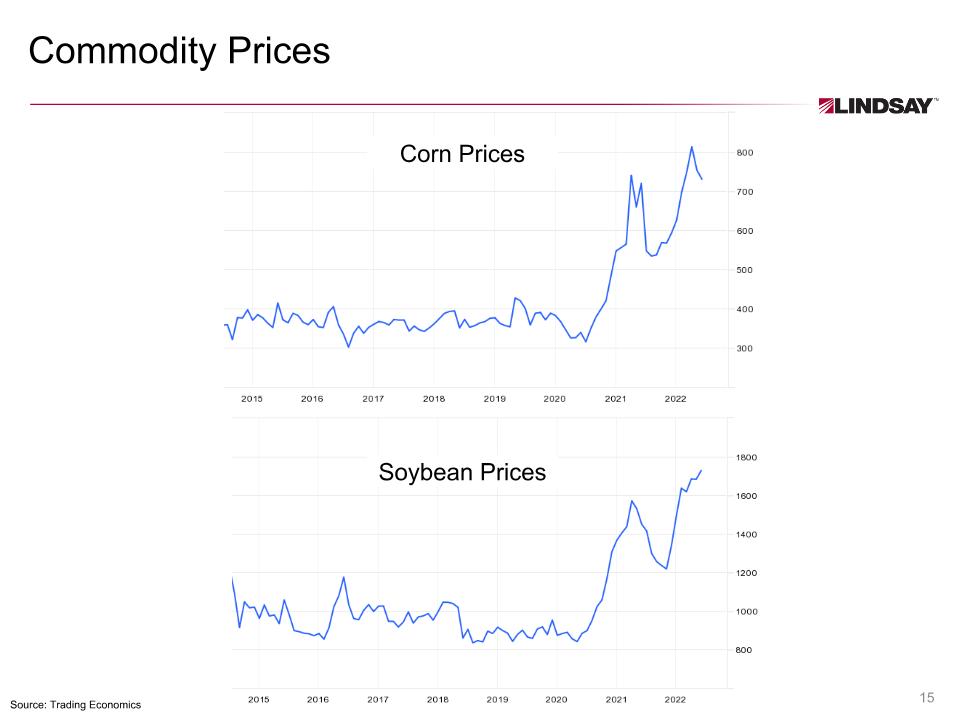
Commodity Prices Soybean Prices Source: Trading Economics Corn Prices
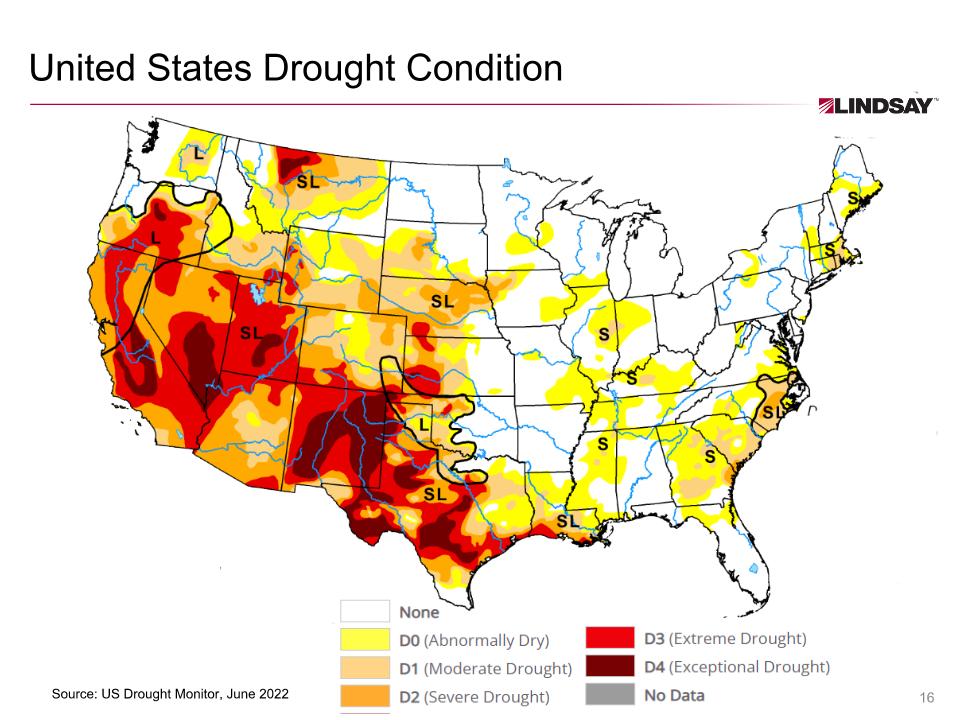
United States Drought Condition Source: US Drought Monitor, June 2022


