
Exhibit 99.1 CUSTOMER-FIRST INNOVATION REAL-WORLD SOLUTIONS Investor Presentation November 2019Exhibit 99.1 CUSTOMER-FIRST INNOVATION REAL-WORLD SOLUTIONS Investor Presentation November 2019
Safe-Harbor Statement This presentation contains forward-looking statements that are subject to risks and uncertainties and which reflect management’s current beliefs and estimates of future economic circumstances, industry conditions, Company performance, financial results and planned financing. You can find a discussion of many of these risks and uncertainties in the annual, quarterly and current reports that the Company files with the Securities and Exchange Commission. Investors should understand that a number of factors could cause future economic and industry conditions, and the Company’s actual financial condition and results of operations, to differ materially from management’s beliefs expressed in the forward-looking statements contained in this presentation. These factors include those outlined in the “Risk Factors” section of the Company’s most recent annual report on Form 10-K filed with the Securities and Exchange Commission, and investors are urged to review these factors when considering the forward-looking statements contained in this presentation. For these statements, the Company claims the protection of the safe harbor for forward- looking statements contained in the Private Securities Litigation Reform Act of 1995. 2Safe-Harbor Statement This presentation contains forward-looking statements that are subject to risks and uncertainties and which reflect management’s current beliefs and estimates of future economic circumstances, industry conditions, Company performance, financial results and planned financing. You can find a discussion of many of these risks and uncertainties in the annual, quarterly and current reports that the Company files with the Securities and Exchange Commission. Investors should understand that a number of factors could cause future economic and industry conditions, and the Company’s actual financial condition and results of operations, to differ materially from management’s beliefs expressed in the forward-looking statements contained in this presentation. These factors include those outlined in the “Risk Factors” section of the Company’s most recent annual report on Form 10-K filed with the Securities and Exchange Commission, and investors are urged to review these factors when considering the forward-looking statements contained in this presentation. For these statements, the Company claims the protection of the safe harbor for forward- looking statements contained in the Private Securities Litigation Reform Act of 1995. 2

Global Platforms Rooted in Innovation and Sustainable Solutions Lindsay Revenue Mix Key Statistics* (Fiscal 2019) Founded 1955 Infrastructure 21% Global Mfg. Locations 7 Countries 49% U.S. Irrigation Employees ~1,100 30% Market cap ~$1.0B International Irrigation Headquarters Omaha, NE * As of 11/6/19 3Global Platforms Rooted in Innovation and Sustainable Solutions Lindsay Revenue Mix Key Statistics* (Fiscal 2019) Founded 1955 Infrastructure 21% Global Mfg. Locations 7 Countries 49% U.S. Irrigation Employees ~1,100 30% Market cap ~$1.0B International Irrigation Headquarters Omaha, NE * As of 11/6/19 3

Executing Long-Term Value Creation • Deepening customer relationships through technology differentiation • Solutions and growth aligned to market megatrends…. designed to sustain and protect our evolving world • Foundation for Growth initiative driving margin expansion ONE LINDSAY • Empowered global culture through Innovative Market Leader Vision, Values and Behaviors Framework Innovative Market Leader – Sustainable Solutions – Sustainable Solutions 4Executing Long-Term Value Creation • Deepening customer relationships through technology differentiation • Solutions and growth aligned to market megatrends…. designed to sustain and protect our evolving world • Foundation for Growth initiative driving margin expansion ONE LINDSAY • Empowered global culture through Innovative Market Leader Vision, Values and Behaviors Framework Innovative Market Leader – Sustainable Solutions – Sustainable Solutions 4
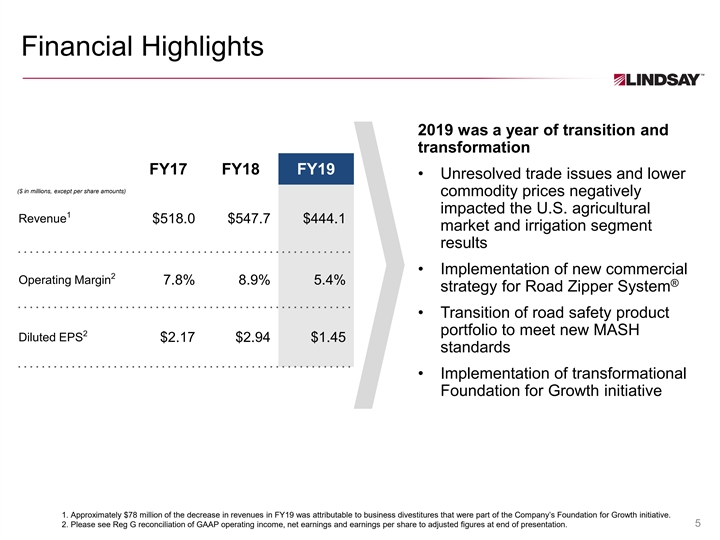
Financial Highlights 2019 was a year of transition and transformation FY17 FY18 FY19 • Unresolved trade issues and lower ($ in millions, except per share amounts) commodity prices negatively impacted the U.S. agricultural 1 Revenue $518.0 $547.7 $444.1 market and irrigation segment results • Implementation of new commercial 2 Operating Margin 7.8% 8.9% 5.4% ® strategy for Road Zipper System • Transition of road safety product portfolio to meet new MASH 2 Diluted EPS $2.17 $2.94 $1.45 standards • Implementation of transformational Foundation for Growth initiative 1. Approximately $78 million of the decrease in revenues in FY19 was attributable to business divestitures that were part of the Company’s Foundation for Growth initiative. 2. Please see Reg G reconciliation of GAAP operating income, net earnings and earnings per share to adjusted figures at end of presentation. 5Financial Highlights 2019 was a year of transition and transformation FY17 FY18 FY19 • Unresolved trade issues and lower ($ in millions, except per share amounts) commodity prices negatively impacted the U.S. agricultural 1 Revenue $518.0 $547.7 $444.1 market and irrigation segment results • Implementation of new commercial 2 Operating Margin 7.8% 8.9% 5.4% ® strategy for Road Zipper System • Transition of road safety product portfolio to meet new MASH 2 Diluted EPS $2.17 $2.94 $1.45 standards • Implementation of transformational Foundation for Growth initiative 1. Approximately $78 million of the decrease in revenues in FY19 was attributable to business divestitures that were part of the Company’s Foundation for Growth initiative. 2. Please see Reg G reconciliation of GAAP operating income, net earnings and earnings per share to adjusted figures at end of presentation. 5

Driving Margin Expansion and Sustainable Growth through Technology Differentiation 1 2 3 STRONG EXECUTING CLEAR PRIORITIES / PLATFORMS NEW STRATEGY GOALS 6Driving Margin Expansion and Sustainable Growth through Technology Differentiation 1 2 3 STRONG EXECUTING CLEAR PRIORITIES / PLATFORMS NEW STRATEGY GOALS 6
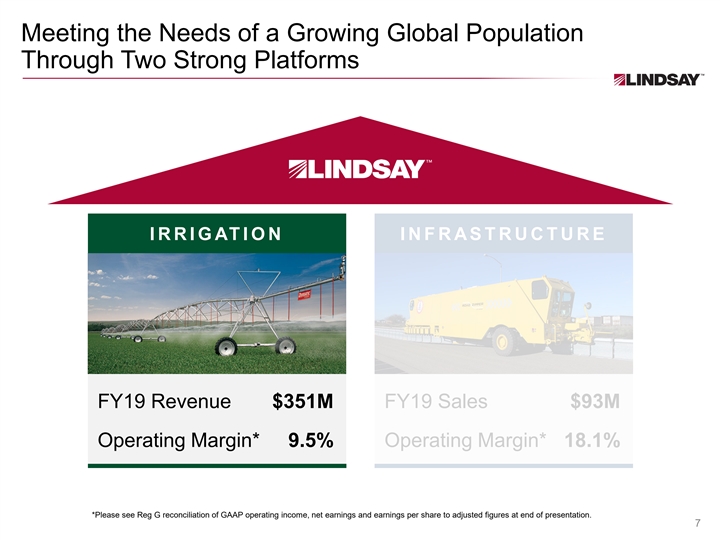
Meeting the Needs of a Growing Global Population Through Two Strong Platforms IR R IGATION I NF RAS T RUCT URE FY19 Revenue $351M FY19 Sales $93M Operating Margin* 9.5% Operating Margin* 18.1% *Please see Reg G reconciliation of GAAP operating income, net earnings and earnings per share to adjusted figures at end of presentation. 7Meeting the Needs of a Growing Global Population Through Two Strong Platforms IR R IGATION I NF RAS T RUCT URE FY19 Revenue $351M FY19 Sales $93M Operating Margin* 9.5% Operating Margin* 18.1% *Please see Reg G reconciliation of GAAP operating income, net earnings and earnings per share to adjusted figures at end of presentation. 7
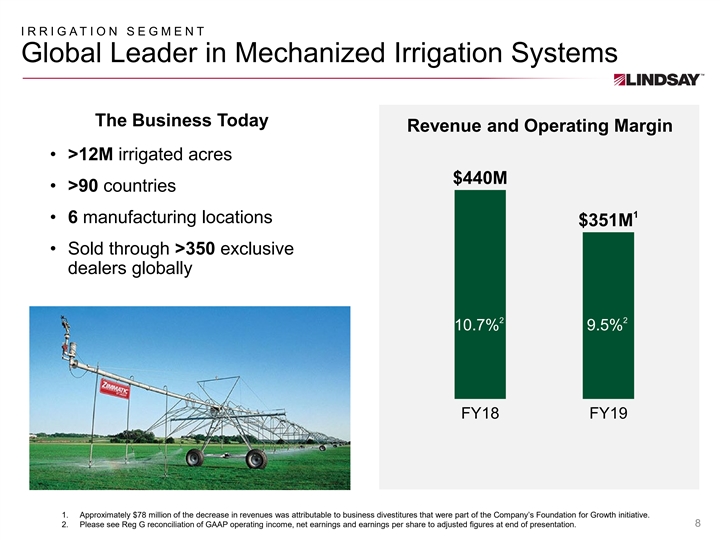
IRRIGATION SEGMENT Global Leader in Mechanized Irrigation Systems The Business Today Revenue and Operating Margin • >12M irrigated acres $440M • >90 countries 1 • 6 manufacturing locations $351M • Sold through >350 exclusive dealers globally 2 2 10.7% 9.5% FY18 FY19 1. Approximately $78 million of the decrease in revenues was attributable to business divestitures that were part of the Company’s Foundation for Growth initiative. 2. Please see Reg G reconciliation of GAAP operating income, net earnings and earnings per share to adjusted figures at end of presentation. 8IRRIGATION SEGMENT Global Leader in Mechanized Irrigation Systems The Business Today Revenue and Operating Margin • >12M irrigated acres $440M • >90 countries 1 • 6 manufacturing locations $351M • Sold through >350 exclusive dealers globally 2 2 10.7% 9.5% FY18 FY19 1. Approximately $78 million of the decrease in revenues was attributable to business divestitures that were part of the Company’s Foundation for Growth initiative. 2. Please see Reg G reconciliation of GAAP operating income, net earnings and earnings per share to adjusted figures at end of presentation. 8
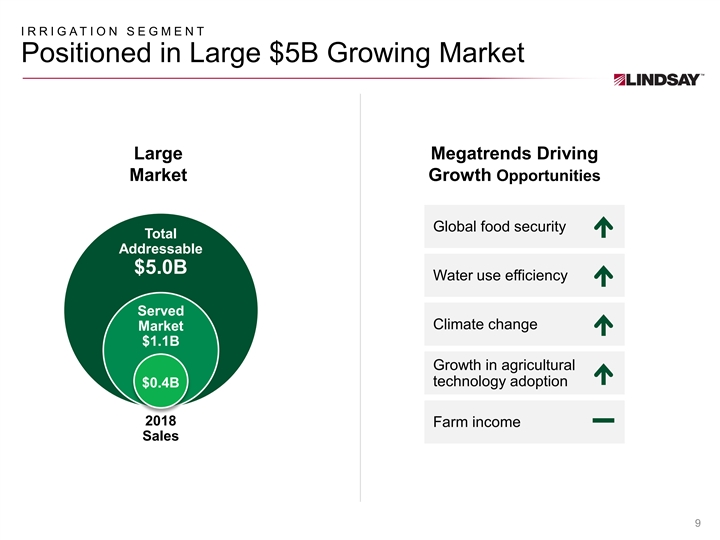
IRRIGATION SEGMENT Positioned in Large $5B Growing Market Large Megatrends Driving Market Growth Opportunities Global food security Total Addressable $5.0B Water use efficiency Served Climate change Market $1.1B Growth in agricultural technology adoption $0.4B 2018 Farm income Sales 9IRRIGATION SEGMENT Positioned in Large $5B Growing Market Large Megatrends Driving Market Growth Opportunities Global food security Total Addressable $5.0B Water use efficiency Served Climate change Market $1.1B Growth in agricultural technology adoption $0.4B 2018 Farm income Sales 9
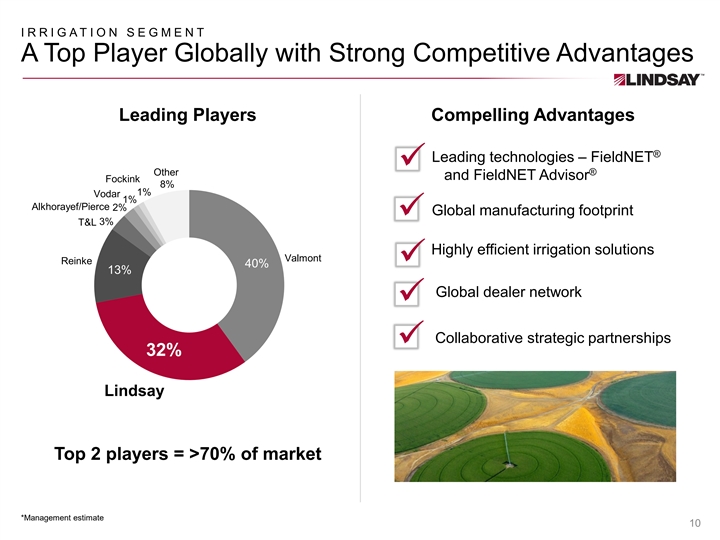
IRRIGATION SEGMENT A Top Player Globally with Strong Competitive Advantages Leading Players Compelling Advantages ® Leading technologies – FieldNET ü ® Other and FieldNET Advisor Fockink 8% 1% Vodar 1% Alkhorayef/Pierce 2% Global manufacturing footprint ü 3% T&L Highly efficient irrigation solutions Valmont Reinke ü 40% 13% Global dealer network ü Collaborative strategic partnerships ü 32% Lindsay Top 2 players = >70% of market *Management estimate 10IRRIGATION SEGMENT A Top Player Globally with Strong Competitive Advantages Leading Players Compelling Advantages ® Leading technologies – FieldNET ü ® Other and FieldNET Advisor Fockink 8% 1% Vodar 1% Alkhorayef/Pierce 2% Global manufacturing footprint ü 3% T&L Highly efficient irrigation solutions Valmont Reinke ü 40% 13% Global dealer network ü Collaborative strategic partnerships ü 32% Lindsay Top 2 players = >70% of market *Management estimate 10
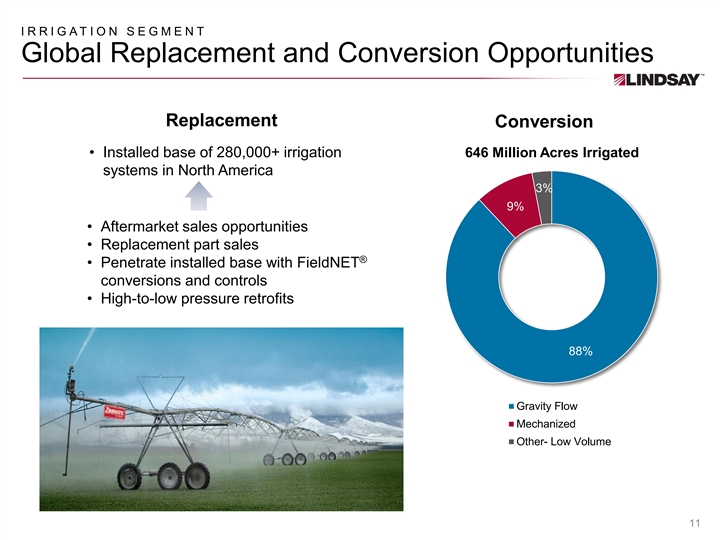
IRRIGATION SEGMENT Global Replacement and Conversion Opportunities Replacement Conversion • Installed base of 280,000+ irrigation 646 Million Acres Irrigated systems in North America 3% 9% • Aftermarket sales opportunities • Replacement part sales ® • Penetrate installed base with FieldNET conversions and controls • High-to-low pressure retrofits 88% Gravity Flow Mechanized Other- Low Volume 11IRRIGATION SEGMENT Global Replacement and Conversion Opportunities Replacement Conversion • Installed base of 280,000+ irrigation 646 Million Acres Irrigated systems in North America 3% 9% • Aftermarket sales opportunities • Replacement part sales ® • Penetrate installed base with FieldNET conversions and controls • High-to-low pressure retrofits 88% Gravity Flow Mechanized Other- Low Volume 11
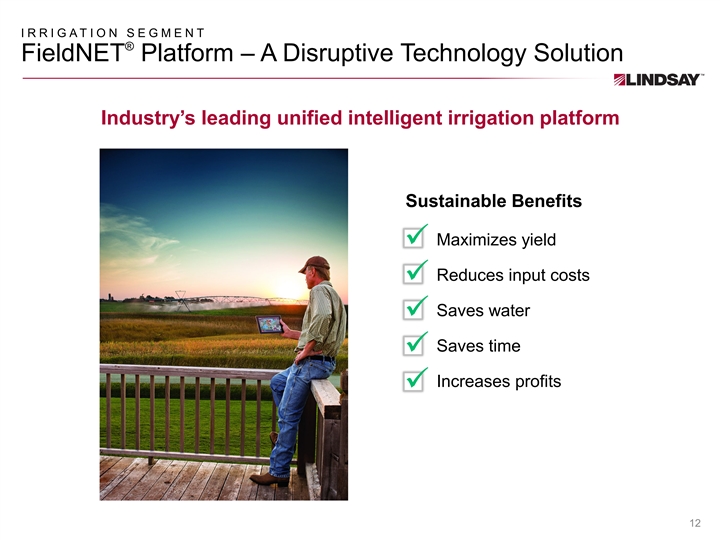
IRRIGATION SEGMENT ® FieldNET Platform – A Disruptive Technology Solution Industry’s leading unified intelligent irrigation platform Sustainable Benefits Maximizes yield ü Reduces input costs ü Saves water ü Saves time ü Increases profits ü 12IRRIGATION SEGMENT ® FieldNET Platform – A Disruptive Technology Solution Industry’s leading unified intelligent irrigation platform Sustainable Benefits Maximizes yield ü Reduces input costs ü Saves water ü Saves time ü Increases profits ü 12
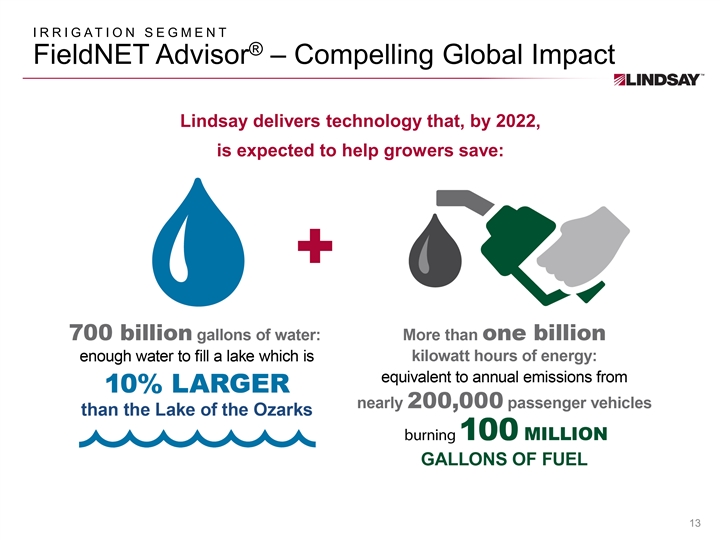
IRRIGATION SEGMENT ® FieldNET Advisor – Compelling Global Impact Lindsay delivers technology that, by 2022, is expected to help growers save: 13IRRIGATION SEGMENT ® FieldNET Advisor – Compelling Global Impact Lindsay delivers technology that, by 2022, is expected to help growers save: 13
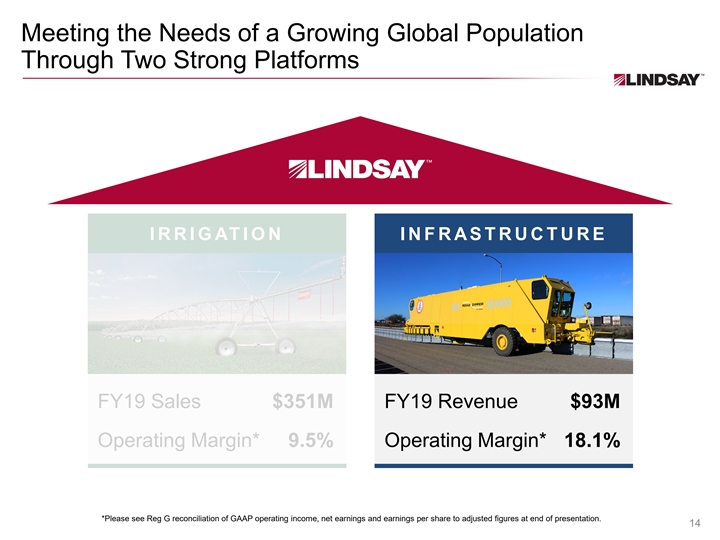
Meeting the Needs of a Growing Global Population Through Two Strong Platforms IR R IGATION I NF RAS T RUCT URE FY19 Sales $351M FY19 Revenue $93M Operating Margin* 9.5% Operating Margin* 18.1% *Please see Reg G reconciliation of GAAP operating income, net earnings and earnings per share to adjusted figures at end of presentation. 14Meeting the Needs of a Growing Global Population Through Two Strong Platforms IR R IGATION I NF RAS T RUCT URE FY19 Sales $351M FY19 Revenue $93M Operating Margin* 9.5% Operating Margin* 18.1% *Please see Reg G reconciliation of GAAP operating income, net earnings and earnings per share to adjusted figures at end of presentation. 14
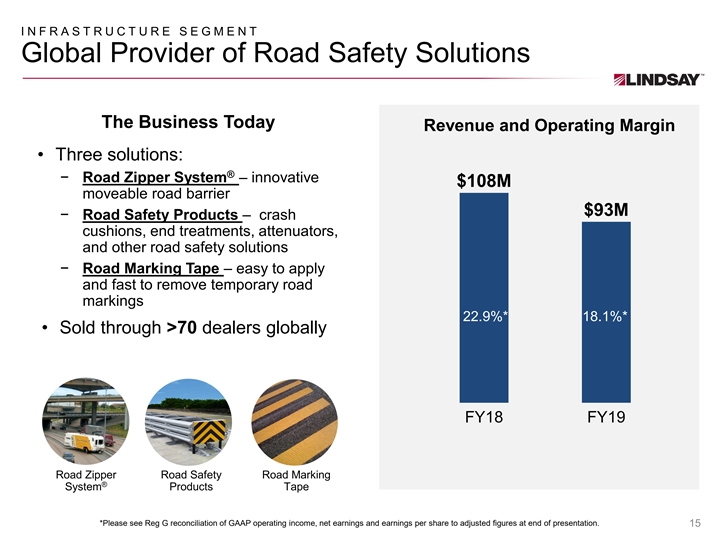
INFRAST RUCT URE SEGMENT Global Provider of Road Safety Solutions The Business Today Revenue and Operating Margin • Three solutions: ® − Road Zipper System – innovative $108M moveable road barrier $93M − Road Safety Products – crash cushions, end treatments, attenuators, and other road safety solutions − Road Marking Tape – easy to apply and fast to remove temporary road markings 22.9%* 18.1%* • Sold through >70 dealers globally FY18 FY19 Road Zipper Road Safety Road Marking ® System Products Tape *Please see Reg G reconciliation of GAAP operating income, net earnings and earnings per share to adjusted figures at end of presentation. 15INFRAST RUCT URE SEGMENT Global Provider of Road Safety Solutions The Business Today Revenue and Operating Margin • Three solutions: ® − Road Zipper System – innovative $108M moveable road barrier $93M − Road Safety Products – crash cushions, end treatments, attenuators, and other road safety solutions − Road Marking Tape – easy to apply and fast to remove temporary road markings 22.9%* 18.1%* • Sold through >70 dealers globally FY18 FY19 Road Zipper Road Safety Road Marking ® System Products Tape *Please see Reg G reconciliation of GAAP operating income, net earnings and earnings per share to adjusted figures at end of presentation. 15
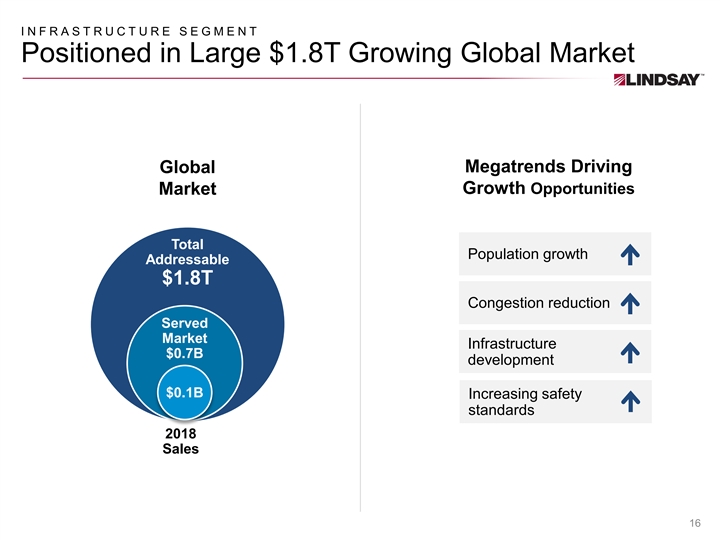
INFRAST RUCT URE SEGMENT Positioned in Large $1.8T Growing Global Market Megatrends Driving Global Growth Opportunities Market Total Population growth Addressable $1.8T Congestion reduction Served Market Infrastructure $0.7B development $0.1B Increasing safety standards 2018 $100M Sales 16INFRAST RUCT URE SEGMENT Positioned in Large $1.8T Growing Global Market Megatrends Driving Global Growth Opportunities Market Total Population growth Addressable $1.8T Congestion reduction Served Market Infrastructure $0.7B development $0.1B Increasing safety standards 2018 $100M Sales 16
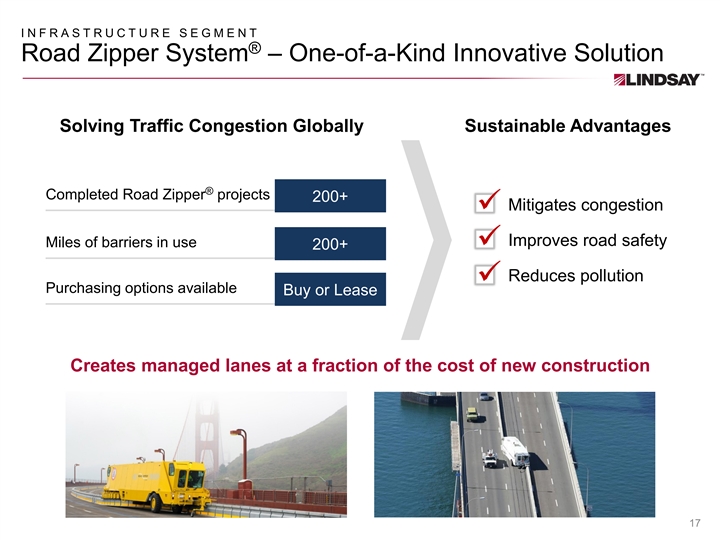
INFRAST RUCT URE SEGMENT ® Road Zipper System – One-of-a-Kind Innovative Solution Solving Traffic Congestion Globally Sustainable Advantages ® Completed Road Zipper projects 200+ Mitigates congestion ü Improves road safety Miles of barriers in use ü 200+ Reduces pollution ü Purchasing options available Buy or Lease Creates managed lanes at a fraction of the cost of new construction 17INFRAST RUCT URE SEGMENT ® Road Zipper System – One-of-a-Kind Innovative Solution Solving Traffic Congestion Globally Sustainable Advantages ® Completed Road Zipper projects 200+ Mitigates congestion ü Improves road safety Miles of barriers in use ü 200+ Reduces pollution ü Purchasing options available Buy or Lease Creates managed lanes at a fraction of the cost of new construction 17
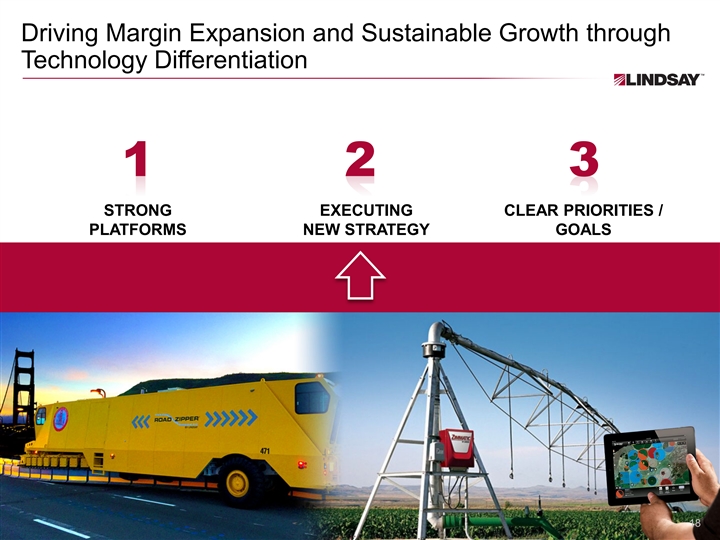
Driving Margin Expansion and Sustainable Growth through Technology Differentiation 1 2 3 STRONG EXECUTING CLEAR PRIORITIES / PLATFORMS NEW STRATEGY GOALS 18Driving Margin Expansion and Sustainable Growth through Technology Differentiation 1 2 3 STRONG EXECUTING CLEAR PRIORITIES / PLATFORMS NEW STRATEGY GOALS 18
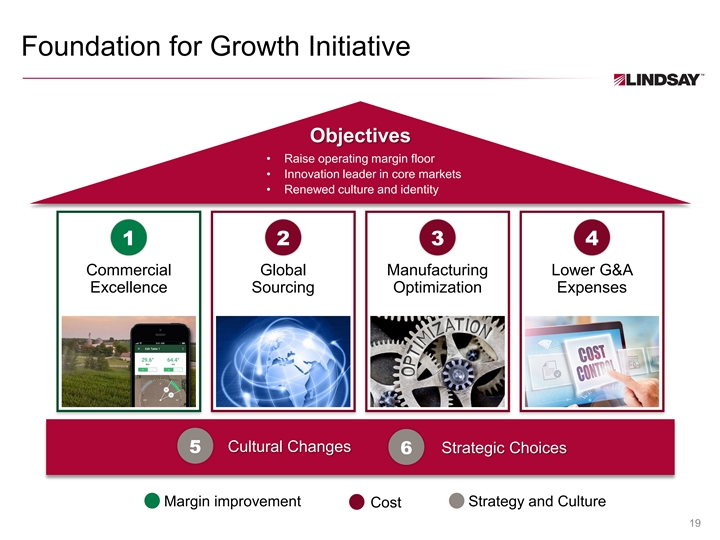
Foundation for Growth Initiative Objectives • Raise operating margin floor • Innovation leader in core markets • Renewed culture and identity 1 2 3 4 Commercial Global Manufacturing Lower G&A Excellence Sourcing Optimization Expenses Cultural Changes 5 Strategic Choices 6 Margin improvement Strategy and Culture Cost 19Foundation for Growth Initiative Objectives • Raise operating margin floor • Innovation leader in core markets • Renewed culture and identity 1 2 3 4 Commercial Global Manufacturing Lower G&A Excellence Sourcing Optimization Expenses Cultural Changes 5 Strategic Choices 6 Margin improvement Strategy and Culture Cost 19
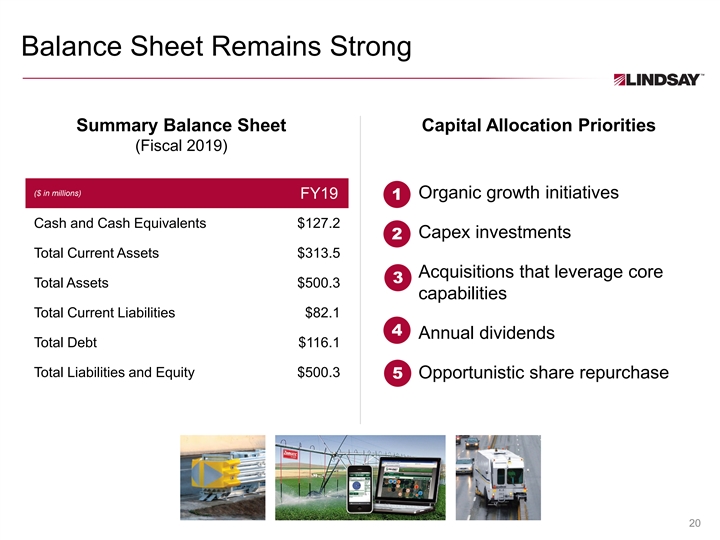
Balance Sheet Remains Strong Summary Balance Sheet Capital Allocation Priorities (Fiscal 2019) ($ in millions) FY19 Organic growth initiatives 1 Cash and Cash Equivalents $127.2 Capex investments 2 Total Current Assets $313.5 Acquisitions that leverage core 3 Total Assets $500.3 capabilities Total Current Liabilities $82.1 4 Annual dividends Total Debt $116.1 Total Liabilities and Equity $500.3 5 Opportunistic share repurchase 20Balance Sheet Remains Strong Summary Balance Sheet Capital Allocation Priorities (Fiscal 2019) ($ in millions) FY19 Organic growth initiatives 1 Cash and Cash Equivalents $127.2 Capex investments 2 Total Current Assets $313.5 Acquisitions that leverage core 3 Total Assets $500.3 capabilities Total Current Liabilities $82.1 4 Annual dividends Total Debt $116.1 Total Liabilities and Equity $500.3 5 Opportunistic share repurchase 20

Driving Margin Expansion and Sustainable Growth through Technology Differentiation 1 2 3 STRONG EXECUTING CLEAR PRIORITIES / PLATFORMS NEW STRATEGY GOALS 21Driving Margin Expansion and Sustainable Growth through Technology Differentiation 1 2 3 STRONG EXECUTING CLEAR PRIORITIES / PLATFORMS NEW STRATEGY GOALS 21

Clear Strategic Priorities Execute Foundation for Growth 1 Widen Irrigation technology leadership position 2 ® Increase Road Zipper System market penetration 3 Supported by selective acquisitions 22Clear Strategic Priorities Execute Foundation for Growth 1 Widen Irrigation technology leadership position 2 ® Increase Road Zipper System market penetration 3 Supported by selective acquisitions 22
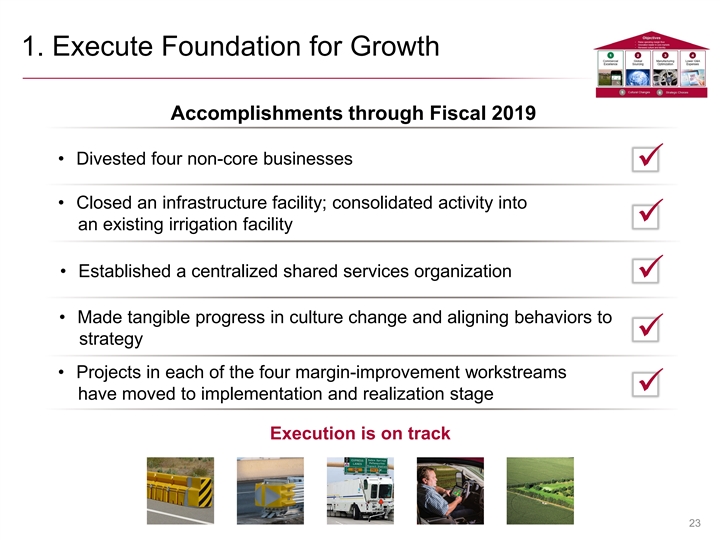
1. Execute Foundation for Growth Accomplishments through Fiscal 2019 • Divested four non-core businesses ü • Closed an infrastructure facility; consolidated activity into ü an existing irrigation facility • Established a centralized shared services organization ü • Made tangible progress in culture change and aligning behaviors to ü strategy • Projects in each of the four margin-improvement workstreams ü have moved to implementation and realization stage Execution is on track 231. Execute Foundation for Growth Accomplishments through Fiscal 2019 • Divested four non-core businesses ü • Closed an infrastructure facility; consolidated activity into ü an existing irrigation facility • Established a centralized shared services organization ü • Made tangible progress in culture change and aligning behaviors to ü strategy • Projects in each of the four margin-improvement workstreams ü have moved to implementation and realization stage Execution is on track 23
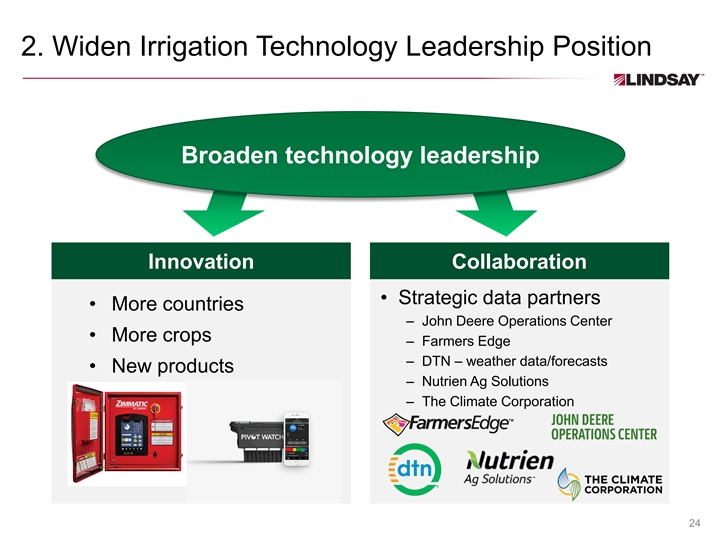
2. Widen Irrigation Technology Leadership Position Broaden technology leadership Innovation Collaboration • Strategic data partners • More countries – John Deere Operations Center • More crops – Farmers Edge – DTN – weather data/forecasts • New products – Nutrien Ag Solutions – The Climate Corporation 242. Widen Irrigation Technology Leadership Position Broaden technology leadership Innovation Collaboration • Strategic data partners • More countries – John Deere Operations Center • More crops – Farmers Edge – DTN – weather data/forecasts • New products – Nutrien Ag Solutions – The Climate Corporation 24
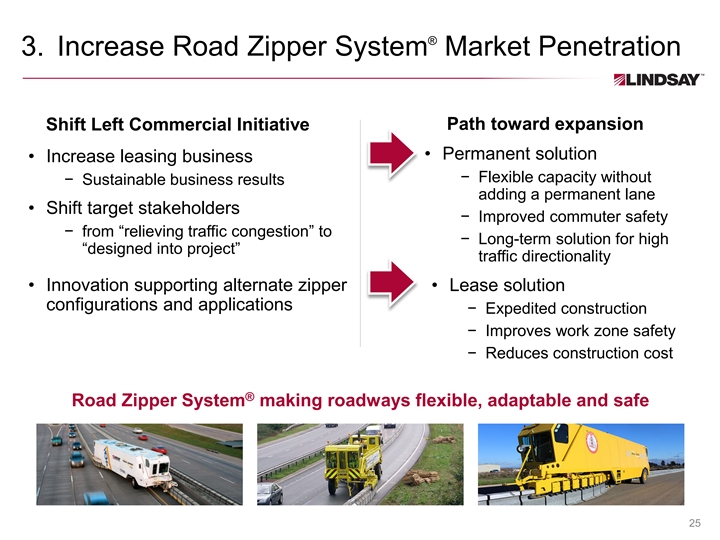
® 3. Increase Road Zipper System Market Penetration Path toward expansion Shift Left Commercial Initiative • Permanent solution • Increase leasing business − Flexible capacity without − Sustainable business results adding a permanent lane • Shift target stakeholders − Improved commuter safety − from “relieving traffic congestion” to − Long-term solution for high “designed into project” traffic directionality • Innovation supporting alternate zipper • Lease solution configurations and applications − Expedited construction − Improves work zone safety − Reduces construction cost ® Road Zipper System making roadways flexible, adaptable and safe 25® 3. Increase Road Zipper System Market Penetration Path toward expansion Shift Left Commercial Initiative • Permanent solution • Increase leasing business − Flexible capacity without − Sustainable business results adding a permanent lane • Shift target stakeholders − Improved commuter safety − from “relieving traffic congestion” to − Long-term solution for high “designed into project” traffic directionality • Innovation supporting alternate zipper • Lease solution configurations and applications − Expedited construction − Improves work zone safety − Reduces construction cost ® Road Zipper System making roadways flexible, adaptable and safe 25
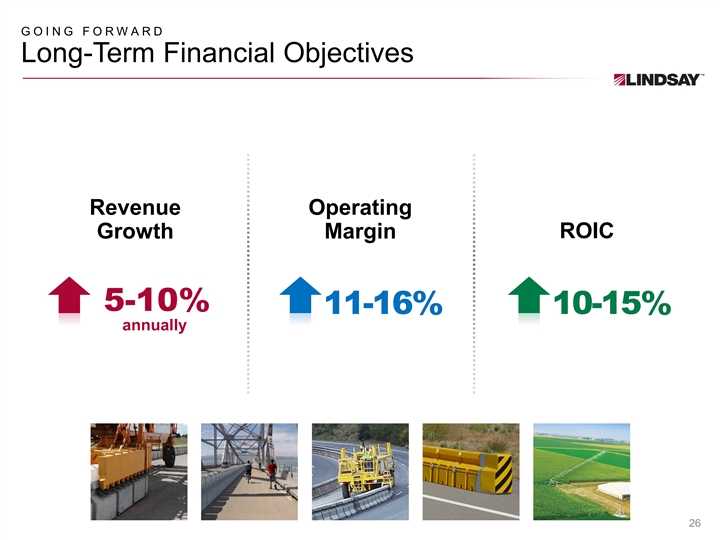
GOING FORWARD Long-Term Financial Objectives Revenue Operating ROIC Growth Margin 5-10% 11-16% 10-15% annually 26GOING FORWARD Long-Term Financial Objectives Revenue Operating ROIC Growth Margin 5-10% 11-16% 10-15% annually 26
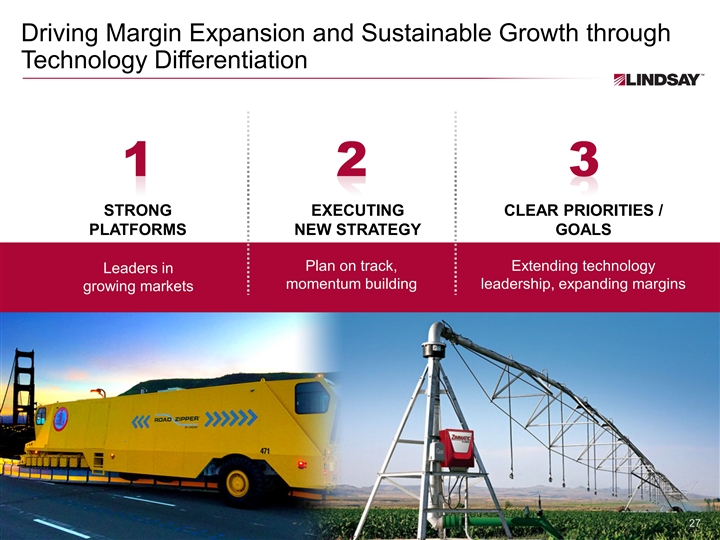
Driving Margin Expansion and Sustainable Growth through Technology Differentiation 1 2 3 STRONG EXECUTING CLEAR PRIORITIES / PLATFORMS NEW STRATEGY GOALS Plan on track, Extending technology Leaders in momentum building leadership, expanding margins growing markets 27Driving Margin Expansion and Sustainable Growth through Technology Differentiation 1 2 3 STRONG EXECUTING CLEAR PRIORITIES / PLATFORMS NEW STRATEGY GOALS Plan on track, Extending technology Leaders in momentum building leadership, expanding margins growing markets 27

Regulation G Reconciliation of GAAP to NON-GAAP Financial Measures LINDSAY CORPORATION AND SUBSIDIARIES RECONCILIATION OF GAAP TO NON-GAAP FINANCIAL MEASURES (Unaudited) The non-GAAP tables below disclose (a) the impact on diluted earnings per share of (1) consulting fees, severance costs and loss from business divestitures, associated with the Company's Foundation for Growth Initiative ( FFG costs ), and (2) a valuation adjustment for indirect tax credits in a foreign jurisdiction (“valuation adjustment”), (b) the impact on operating income of FFG costs and the valuation adjustment, and (c) the impact on segment operating income of FFG costs and the valuation adjustment. Management believes adjusted net earnings, adjusted diluted earnings per share and adjusted operating income are important indicators of the Company’s business performance because they exclude items that may not be indicative of, or may be unrelated to, the Company’s underlying operating results, and provide a useful baseline for analyzing trends in the business. Non-GAAP measures used by the Company may differ from similar measures used by other companies, even when similar terms are used to identify such measures. These adjusted financial measures should not be considered in isolation or as a substitute for reported net earnings, diluted earnings per share and operating income. These non-GAAP financial measures reflect an additional way of viewing the Company’s operations that, when viewed with the GAAP results and the following reconciliations to the corresponding GAAP financial measures, management believes provides a more complete understanding of the Company’s business. Twelve months ended August 31, Diluted earnings (in thousands, except per share amounts) 2019 per share Net earnings - reported GAAP measure $ 2,172 $ 0.20 FFG costs - pre-tax 15, 113 1.40 Valuation adjustment - pre-tax 2,795 0. 26 Total adjustments 17, 908 1. 66 Tax effect of adjustments* (4,454) ( 0.41) Net earnings - adjusted $ 15, 626 $ 1. 45 Average shares outstanding - diluted 10,810 * The tax effect of adjustments is calculated based on the income tax rate in each applicable jurisdiction. 28Regulation G Reconciliation of GAAP to NON-GAAP Financial Measures LINDSAY CORPORATION AND SUBSIDIARIES RECONCILIATION OF GAAP TO NON-GAAP FINANCIAL MEASURES (Unaudited) The non-GAAP tables below disclose (a) the impact on diluted earnings per share of (1) consulting fees, severance costs and loss from business divestitures, associated with the Company's Foundation for Growth Initiative ( FFG costs ), and (2) a valuation adjustment for indirect tax credits in a foreign jurisdiction (“valuation adjustment”), (b) the impact on operating income of FFG costs and the valuation adjustment, and (c) the impact on segment operating income of FFG costs and the valuation adjustment. Management believes adjusted net earnings, adjusted diluted earnings per share and adjusted operating income are important indicators of the Company’s business performance because they exclude items that may not be indicative of, or may be unrelated to, the Company’s underlying operating results, and provide a useful baseline for analyzing trends in the business. Non-GAAP measures used by the Company may differ from similar measures used by other companies, even when similar terms are used to identify such measures. These adjusted financial measures should not be considered in isolation or as a substitute for reported net earnings, diluted earnings per share and operating income. These non-GAAP financial measures reflect an additional way of viewing the Company’s operations that, when viewed with the GAAP results and the following reconciliations to the corresponding GAAP financial measures, management believes provides a more complete understanding of the Company’s business. Twelve months ended August 31, Diluted earnings (in thousands, except per share amounts) 2019 per share Net earnings - reported GAAP measure $ 2,172 $ 0.20 FFG costs - pre-tax 15, 113 1.40 Valuation adjustment - pre-tax 2,795 0. 26 Total adjustments 17, 908 1. 66 Tax effect of adjustments* (4,454) ( 0.41) Net earnings - adjusted $ 15, 626 $ 1. 45 Average shares outstanding - diluted 10,810 * The tax effect of adjustments is calculated based on the income tax rate in each applicable jurisdiction. 28
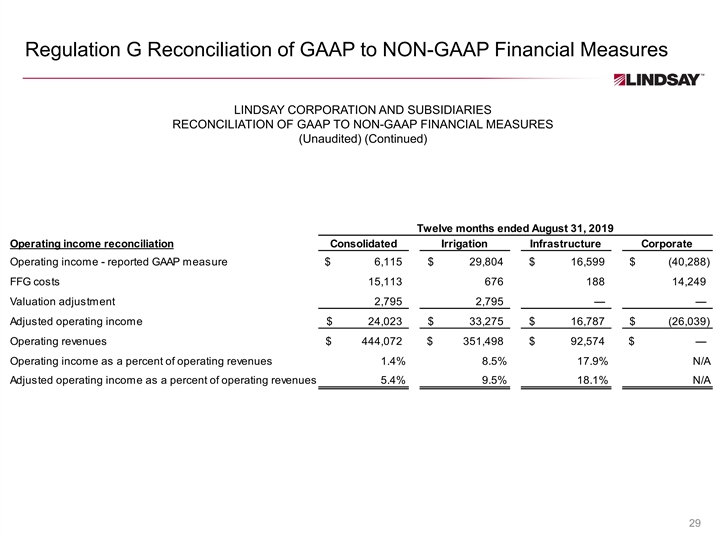
Regulation G Reconciliation of GAAP to NON-GAAP Financial Measures LINDSAY CORPORATION AND SUBSIDIARIES RECONCILIATION OF GAAP TO NON-GAAP FINANCIAL MEASURES (Unaudited) (Continued) Twelve months ended August 31, 2019 Operating income reconciliation Consolidated Irrigation Infrastructure Corporate Operating income - reported GAAP measure $ 6,115 $ 29,804 $ 16, 599 $ (40,288) FFG costs 15,113 676 188 14, 249 Valuation adjustment 2,795 2,795 — — Adjusted operating income $ 24,023 $ 33, 275 $ 16,787 $ ( 26,039) Operating revenues $ 444, 072 $ 351, 498 $ 92,574 $ — Operating income as a percent of operating revenues 1.4% 8.5% 17.9% N/A Adjusted operating income as a percent of operating revenues 5.4% 9.5% 18.1% N/A 29 Regulation G Reconciliation of GAAP to NON-GAAP Financial Measures LINDSAY CORPORATION AND SUBSIDIARIES RECONCILIATION OF GAAP TO NON-GAAP FINANCIAL MEASURES (Unaudited) (Continued) Twelve months ended August 31, 2019 Operating income reconciliation Consolidated Irrigation Infrastructure Corporate Operating income - reported GAAP measure $ 6,115 $ 29,804 $ 16, 599 $ (40,288) FFG costs 15,113 676 188 14, 249 Valuation adjustment 2,795 2,795 — — Adjusted operating income $ 24,023 $ 33, 275 $ 16,787 $ ( 26,039) Operating revenues $ 444, 072 $ 351, 498 $ 92,574 $ — Operating income as a percent of operating revenues 1.4% 8.5% 17.9% N/A Adjusted operating income as a percent of operating revenues 5.4% 9.5% 18.1% N/A 29
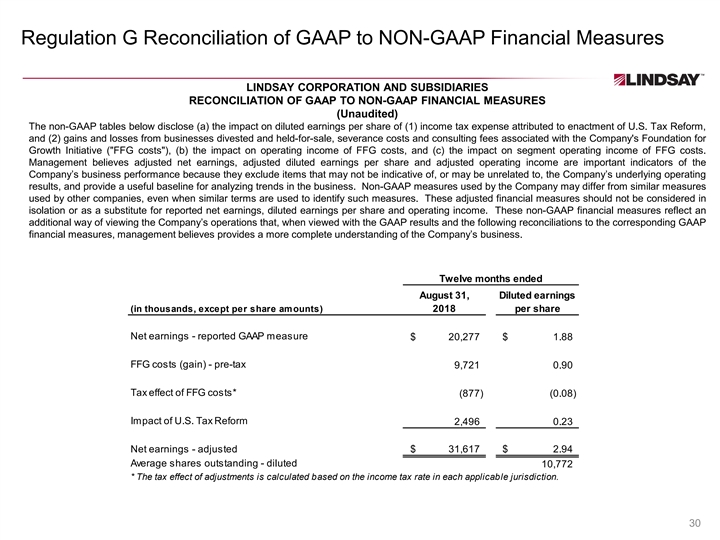
Regulation G Reconciliation of GAAP to NON-GAAP Financial Measures LINDSAY CORPORATION AND SUBSIDIARIES RECONCILIATION OF GAAP TO NON-GAAP FINANCIAL MEASURES (Unaudited) The non-GAAP tables below disclose (a) the impact on diluted earnings per share of (1) income tax expense attributed to enactment of U.S. Tax Reform, and (2) gains and losses from businesses divested and held-for-sale, severance costs and consulting fees associated with the Company's Foundation for Growth Initiative ( FFG costs ), (b) the impact on operating income of FFG costs, and (c) the impact on segment operating income of FFG costs. Management believes adjusted net earnings, adjusted diluted earnings per share and adjusted operating income are important indicators of the Company’s business performance because they exclude items that may not be indicative of, or may be unrelated to, the Company’s underlying operating results, and provide a useful baseline for analyzing trends in the business. Non-GAAP measures used by the Company may differ from similar measures used by other companies, even when similar terms are used to identify such measures. These adjusted financial measures should not be considered in isolation or as a substitute for reported net earnings, diluted earnings per share and operating income. These non-GAAP financial measures reflect an additional way of viewing the Company’s operations that, when viewed with the GAAP results and the following reconciliations to the corresponding GAAP financial measures, management believes provides a more complete understanding of the Company’s business. Twelve months ended August 31, Diluted earnings (in thousands, except per share amounts) 2018 per share Net earnings - reported GAAP measure $ 20,277 $ 1.88 FFG costs (gain) - pre-tax 9, 721 0. 90 Tax effect of FFG costs* ( 877) (0.08) Impact of U.S. Tax Reform 2,496 0.23 Net earnings - adjusted $ 31, 617 $ 2.94 Average shares outstanding - diluted 10, 772 * The tax effect of adjustments is calculated based on the income tax rate in each applicable jurisdiction. 30Regulation G Reconciliation of GAAP to NON-GAAP Financial Measures LINDSAY CORPORATION AND SUBSIDIARIES RECONCILIATION OF GAAP TO NON-GAAP FINANCIAL MEASURES (Unaudited) The non-GAAP tables below disclose (a) the impact on diluted earnings per share of (1) income tax expense attributed to enactment of U.S. Tax Reform, and (2) gains and losses from businesses divested and held-for-sale, severance costs and consulting fees associated with the Company's Foundation for Growth Initiative ( FFG costs ), (b) the impact on operating income of FFG costs, and (c) the impact on segment operating income of FFG costs. Management believes adjusted net earnings, adjusted diluted earnings per share and adjusted operating income are important indicators of the Company’s business performance because they exclude items that may not be indicative of, or may be unrelated to, the Company’s underlying operating results, and provide a useful baseline for analyzing trends in the business. Non-GAAP measures used by the Company may differ from similar measures used by other companies, even when similar terms are used to identify such measures. These adjusted financial measures should not be considered in isolation or as a substitute for reported net earnings, diluted earnings per share and operating income. These non-GAAP financial measures reflect an additional way of viewing the Company’s operations that, when viewed with the GAAP results and the following reconciliations to the corresponding GAAP financial measures, management believes provides a more complete understanding of the Company’s business. Twelve months ended August 31, Diluted earnings (in thousands, except per share amounts) 2018 per share Net earnings - reported GAAP measure $ 20,277 $ 1.88 FFG costs (gain) - pre-tax 9, 721 0. 90 Tax effect of FFG costs* ( 877) (0.08) Impact of U.S. Tax Reform 2,496 0.23 Net earnings - adjusted $ 31, 617 $ 2.94 Average shares outstanding - diluted 10, 772 * The tax effect of adjustments is calculated based on the income tax rate in each applicable jurisdiction. 30

Regulation G Reconciliation of GAAP to NON-GAAP Financial Measures LINDSAY CORPORATION AND SUBSIDIARIES RECONCILIATION OF GAAP TO NON-GAAP FINANCIAL MEASURES (Unaudited) (C ontinue d) Twelve months ended August 31, 2018 Operating income reconciliation Consolidated Irrigation Infrastructure Corporate Operating income - reported GAAP measure $ 39, 012 $ 41,933 $ 23, 857 $ (26,778) FFG costs 9,721 4,962 855 3,904 Adjusted operating income $ 48,733 $ 46,895 $ 24, 712 $ (22,874) Operating revenues $ 547, 705 $ 439, 858 $ 107, 847 $ — Operating income as a percent of operating revenues 7.1% 9.5% 22.1% N/A Adjusted operating income as a percent of operating revenues 8.9% 10.7% 22.9% N/A 31 Regulation G Reconciliation of GAAP to NON-GAAP Financial Measures LINDSAY CORPORATION AND SUBSIDIARIES RECONCILIATION OF GAAP TO NON-GAAP FINANCIAL MEASURES (Unaudited) (C ontinue d) Twelve months ended August 31, 2018 Operating income reconciliation Consolidated Irrigation Infrastructure Corporate Operating income - reported GAAP measure $ 39, 012 $ 41,933 $ 23, 857 $ (26,778) FFG costs 9,721 4,962 855 3,904 Adjusted operating income $ 48,733 $ 46,895 $ 24, 712 $ (22,874) Operating revenues $ 547, 705 $ 439, 858 $ 107, 847 $ — Operating income as a percent of operating revenues 7.1% 9.5% 22.1% N/A Adjusted operating income as a percent of operating revenues 8.9% 10.7% 22.9% N/A 31