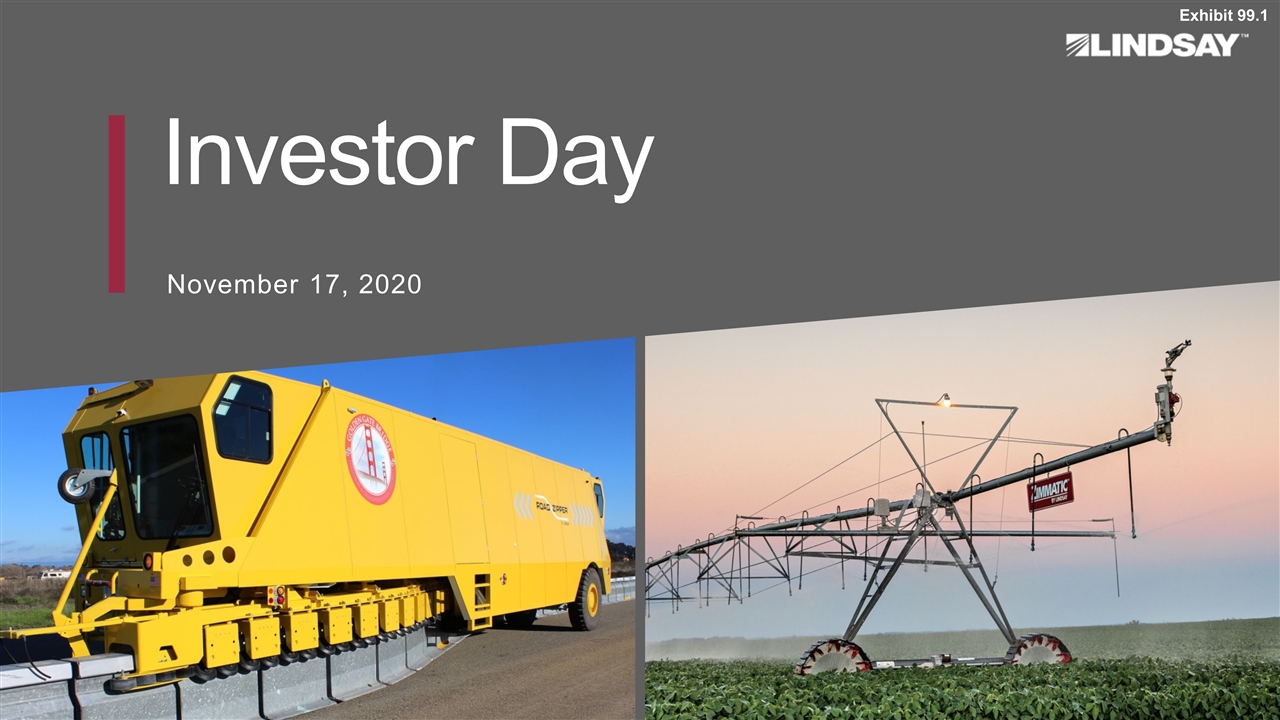
Investor Day November 17, 2020 Exhibit 99.1

Investor Event Opener
Safe-Harbor Statement This presentation contains forward-looking statements that are subject to risks and uncertainties and which reflect management’s current beliefs and estimates of future economic circumstances, industry conditions, Company performance, financial results and planned financing. You can find a discussion of many of these risks and uncertainties in the annual, quarterly and current reports that the Company files with the Securities and Exchange Commission. Investors should understand that a number of factors could cause future economic and industry conditions, and the Company’s actual financial condition and results of operations, to differ materially from management’s beliefs expressed in the forward-looking statements contained in this presentation. These factors include but are not limited to those outlined in the “Risk Factors” sections of the Company’s most recent annual report on Form 10-K filed with the Securities and Exchange Commission and investors are urged to review these factors when considering the forward-looking statements contained in this presentation. For these statements, the Company claims the protection of the safe harbor for forward-looking statements contained in the Private Securities Litigation Reform Act of 1995.
Investor Day Agenda Introduction 10:00 – 10:05 Brian Ketcham, SVP and CFO Strategic Overview 10:05 – 10:20 Tim Hassinger, President and CEO Growth Through Innovation 10:20 – 10:40 Randy Wood, COO Q&A 10:40 – 11:10 Irrigation 11:10 – 11:25 Gustavo Oberto, President – Irrigation Infrastructure 11:25 – 11:40 Scott Marion, President – Infrastructure Financial Overview 11:40 – 11:50 Brian Ketcham, SVP and CFO Q&A 11:50 – 12:20 Eastern Standard Time
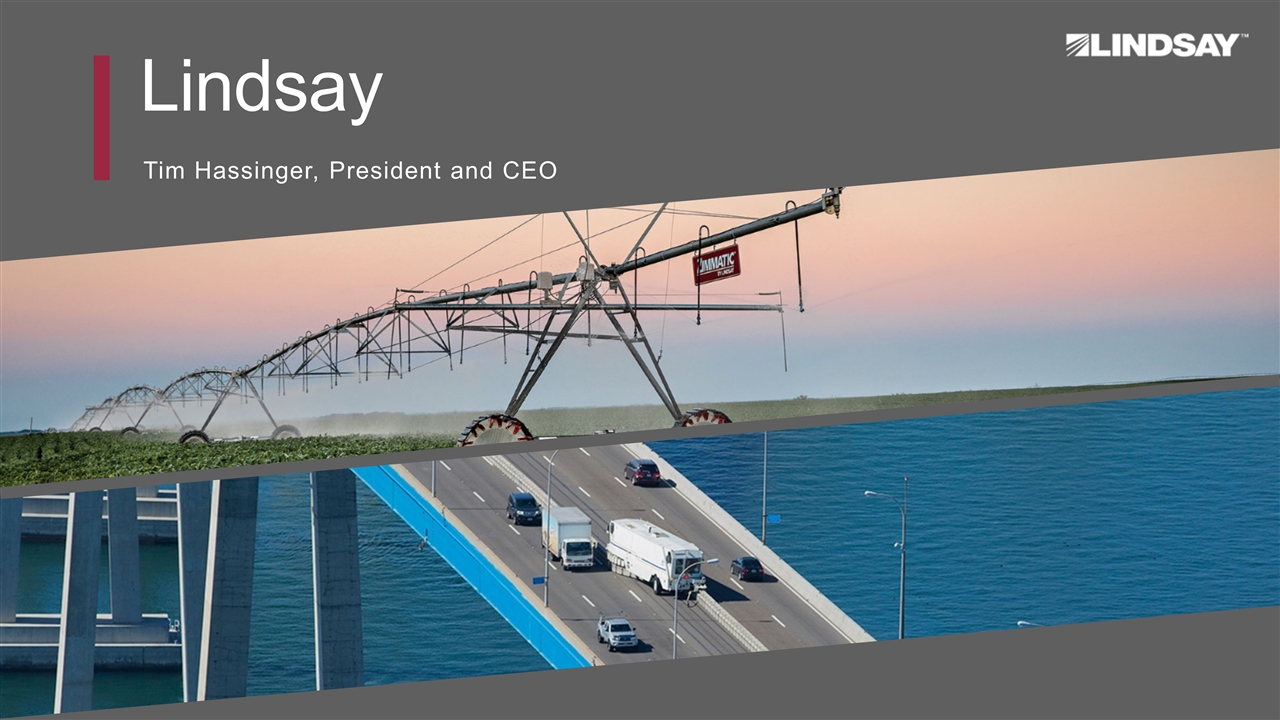
Lindsay Tim Hassinger, President and CEO
KEY MESSAGES FOR THE DAY Lindsay – Delivering Customer-First Innovation Customer-First Innovation to Drive Growth and Outperform the Cycle 3 2 1 Two market leading business platforms Successfully executed our transformation Building a powerful innovation engine
Agenda Lindsay today: Two strong platforms Our transformation: Foundation for growth Clear strategy: Innovation-driven growth
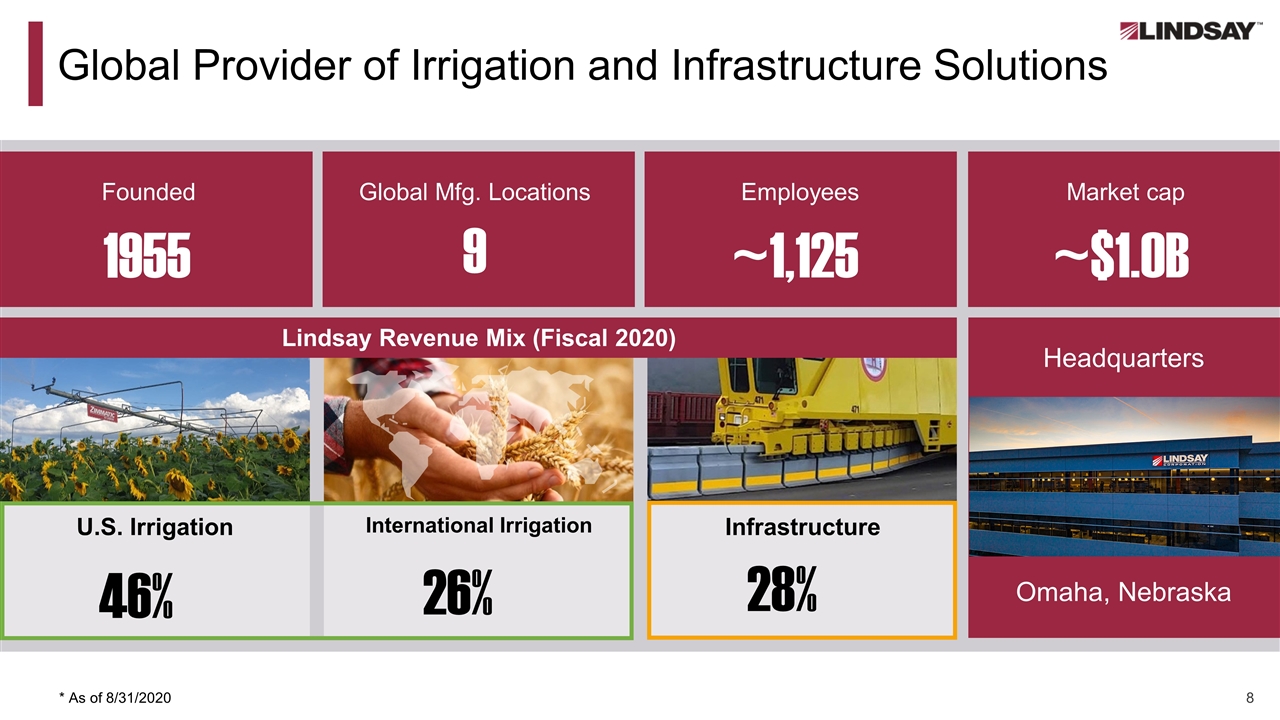
Global Provider of Irrigation and Infrastructure Solutions 1955 U.S. Irrigation International Irrigation Infrastructure Headquarters 46% 26% 28% Omaha, Nebraska Founded 9 Global Mfg. Locations ~1,125 Employees ~$1.0B Market cap * As of 8/31/2020 Lindsay Revenue Mix (Fiscal 2020)
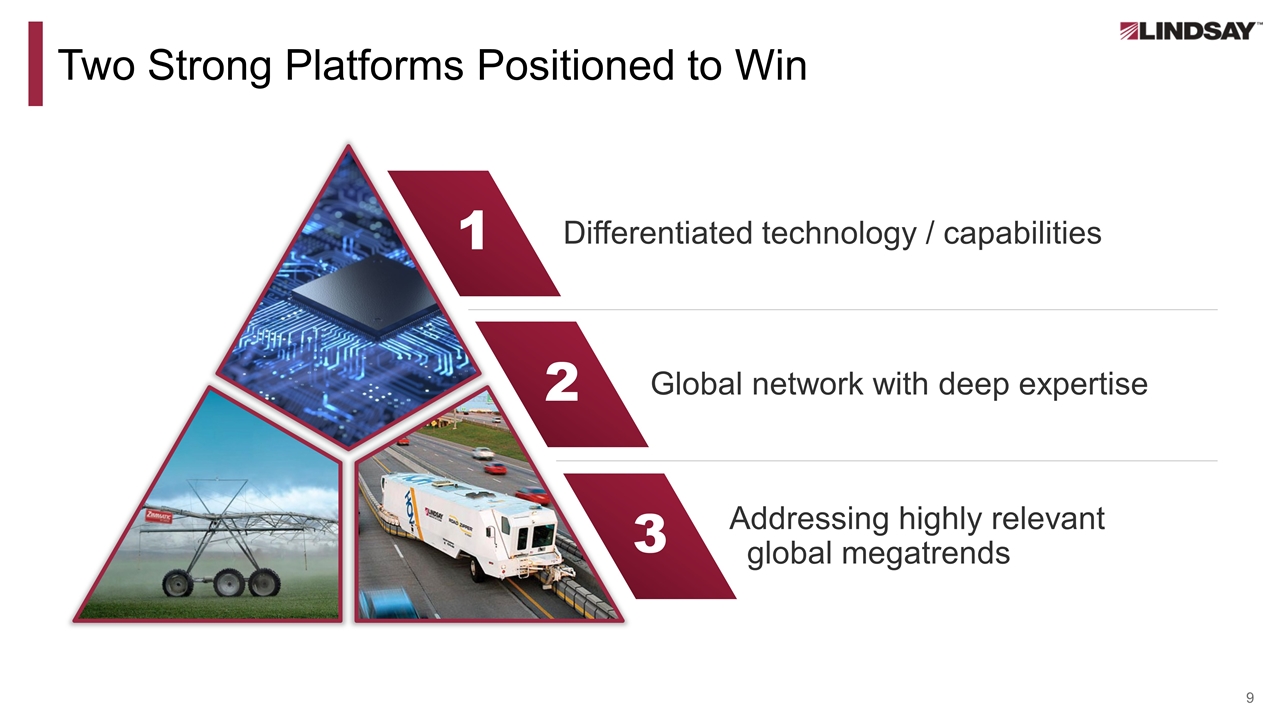
Two Strong Platforms Positioned to Win 2 1 3 Differentiated technology / capabilities Global network with deep expertise Addressing highly relevant global megatrends
Agenda Lindsay today: Two strong platforms Our transformation: Foundation for growth Clear strategy: Innovation-driven growth
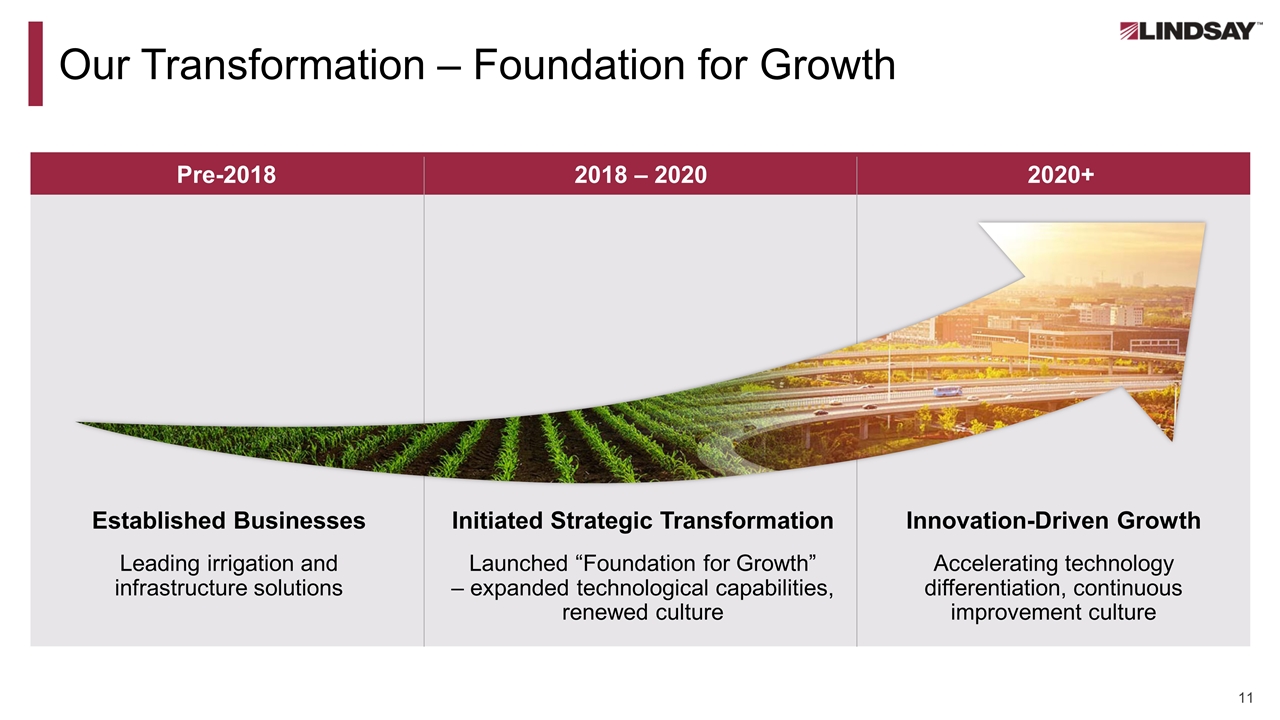
Our Transformation – Foundation for Growth Initiated Strategic Transformation Established Businesses Innovation-Driven Growth 2018 – 2020 Pre-2018 2020+ Launched “Foundation for Growth” – expanded technological capabilities, renewed culture Accelerating technology differentiation, continuous improvement culture Leading irrigation and infrastructure solutions
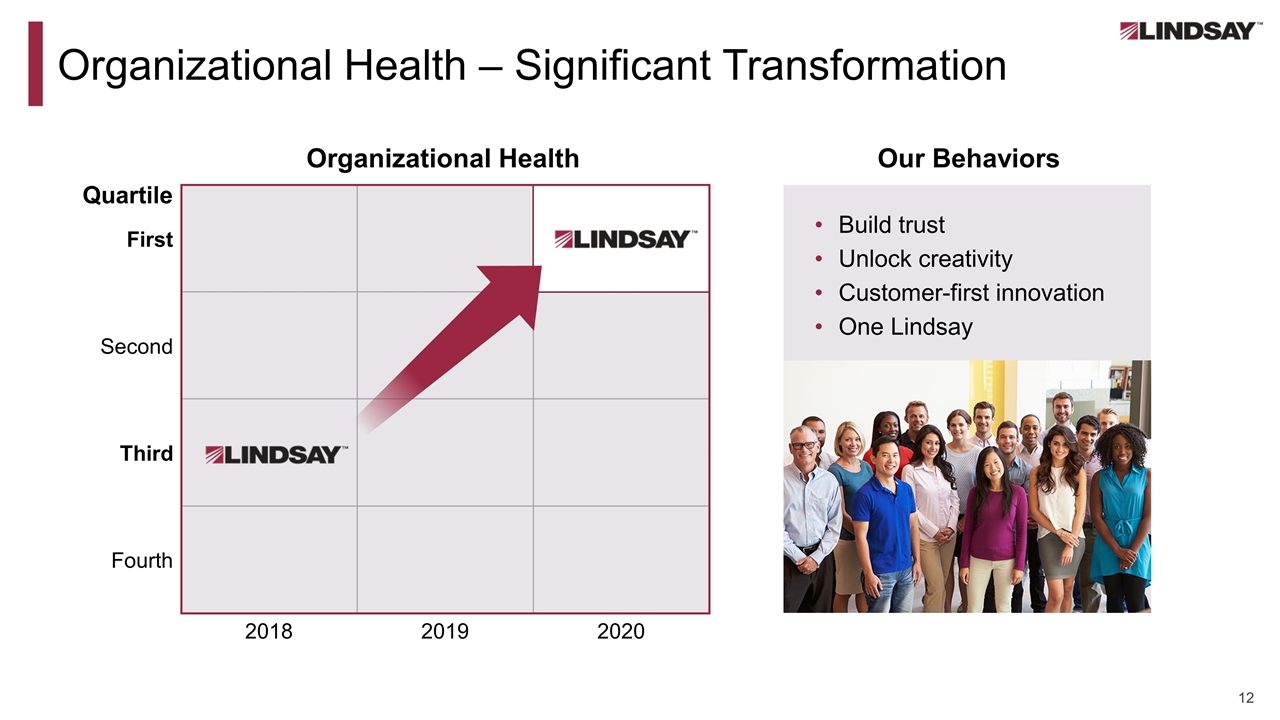
Organizational Health – Significant Transformation Our Behaviors Build trust Unlock creativity Customer-first innovation One Lindsay 2018 2019 2020 Quartile First Second Third Fourth Organizational Health
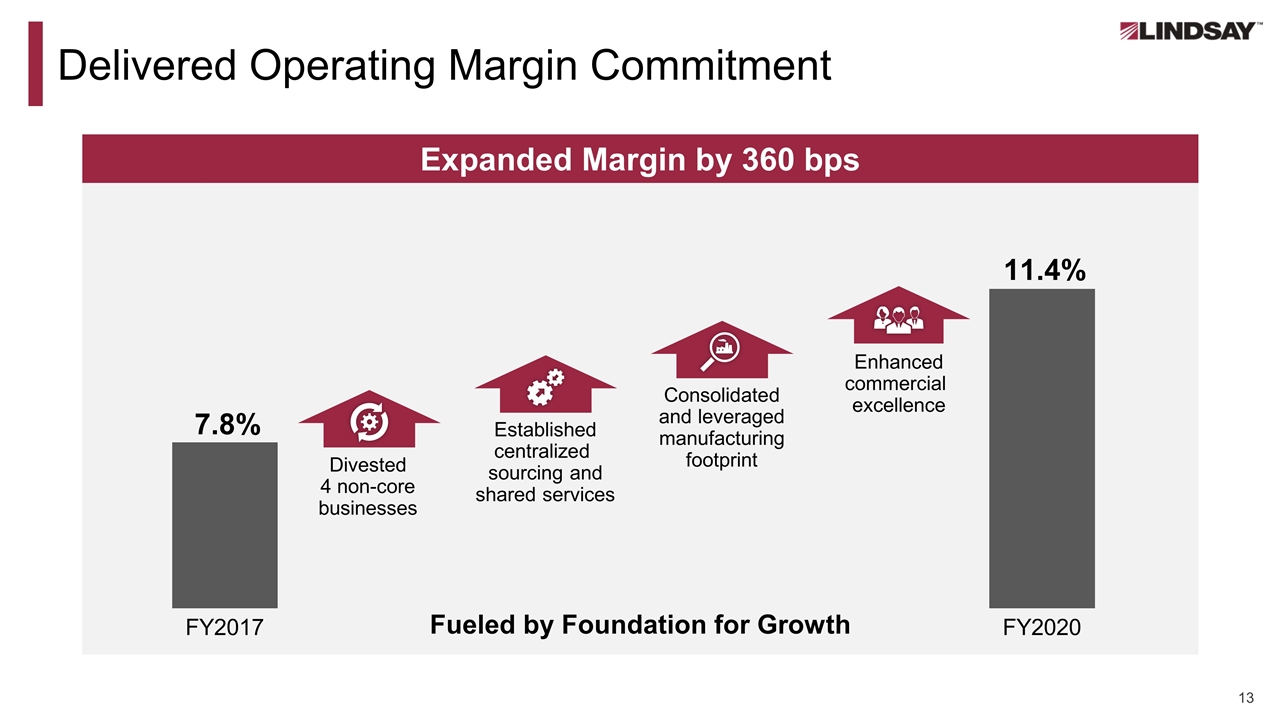
Delivered Operating Margin Commitment FY2017 FY2020 Established centralized sourcing and shared services Consolidated and leveraged manufacturing footprint Enhanced commercial excellence Divested 4 non-core businesses 11.4% 7.8% Fueled by Foundation for Growth Expanded Margin by 360 bps
Agenda Lindsay today: Two strong platforms Our transformation: Foundation for growth Clear strategy: Innovation-driven growth
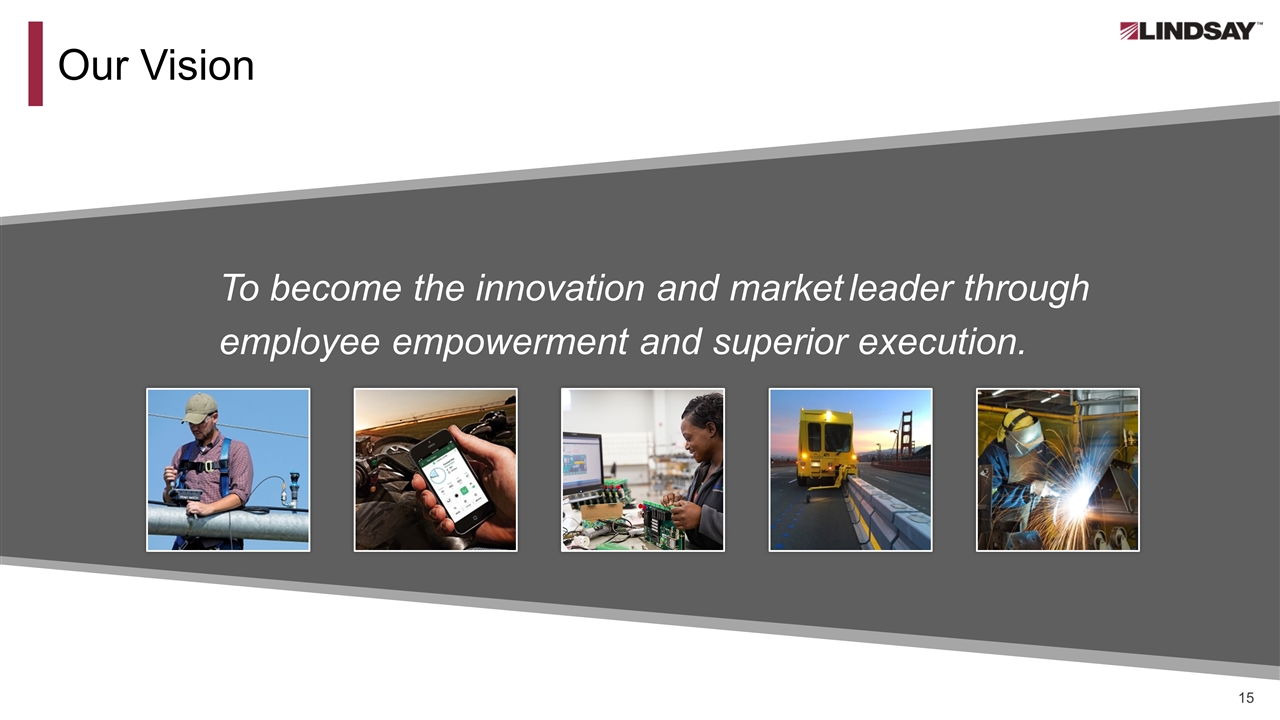
Our Vision To become the innovation and market leader through employee empowerment and superior execution.
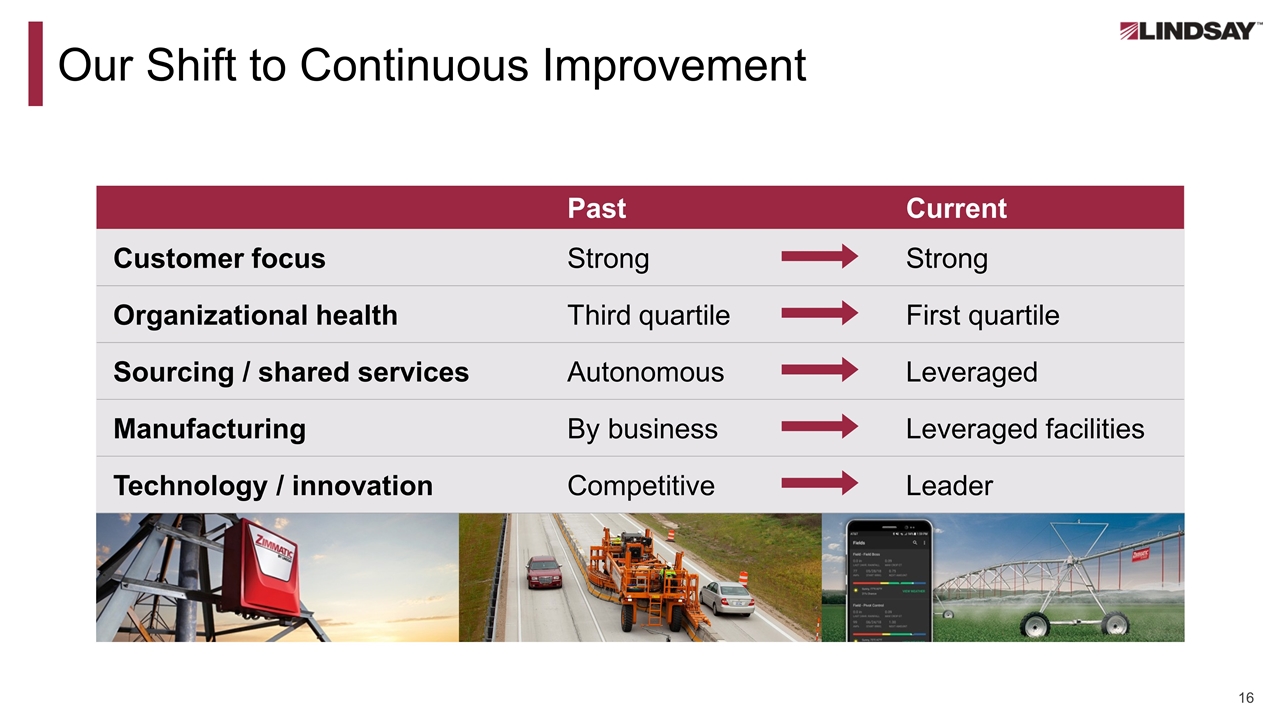
Our Shift to Continuous Improvement Past Current Customer focus Strong Strong Organizational health Third quartile First quartile Sourcing / shared services Autonomous Leveraged Manufacturing By business Leveraged facilities Technology / innovation Competitive Leader
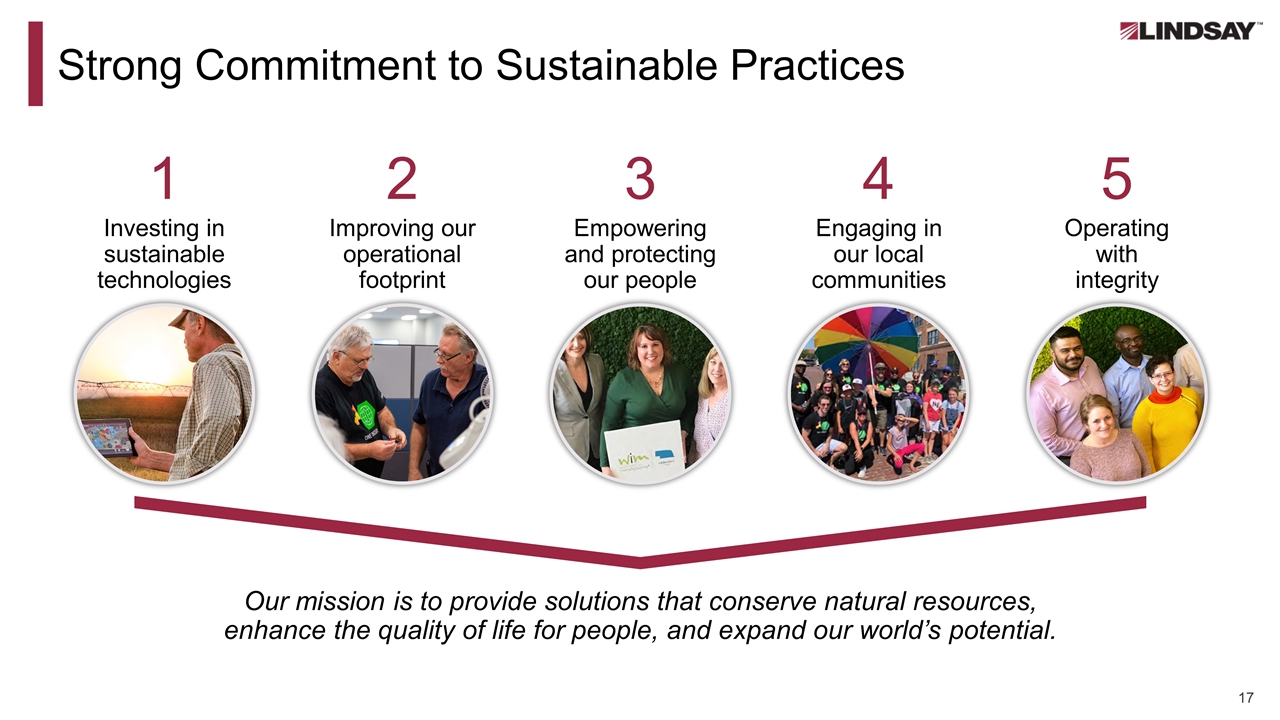
Strong Commitment to Sustainable Practices Our mission is to provide solutions that conserve natural resources, enhance the quality of life for people, and expand our world’s potential. Investing in sustainable technologies Improving our operational footprint Empowering and protecting our people Engaging in our local communities Operating with integrity 1 2 3 4 5
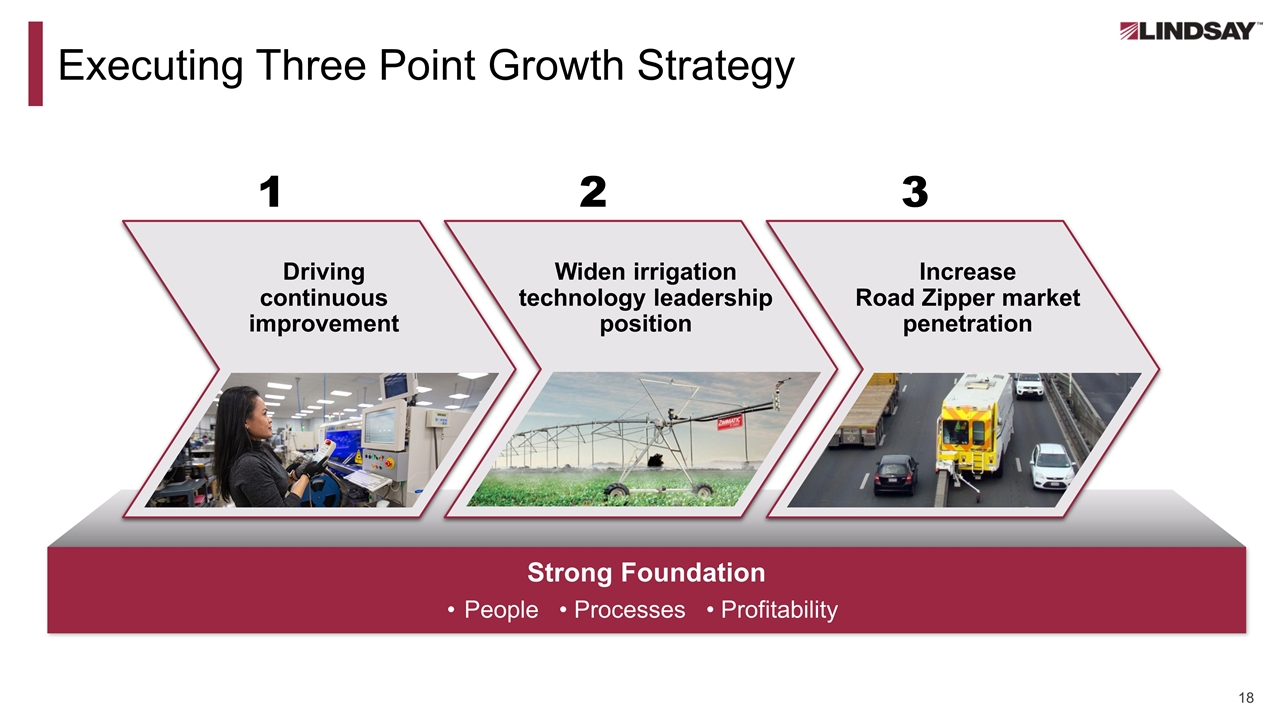
Executing Three Point Growth Strategy 1 2 3 Driving continuous improvement Widen irrigation technology leadership position Increase Road Zipper market penetration People • Processes • Profitability Strong Foundation
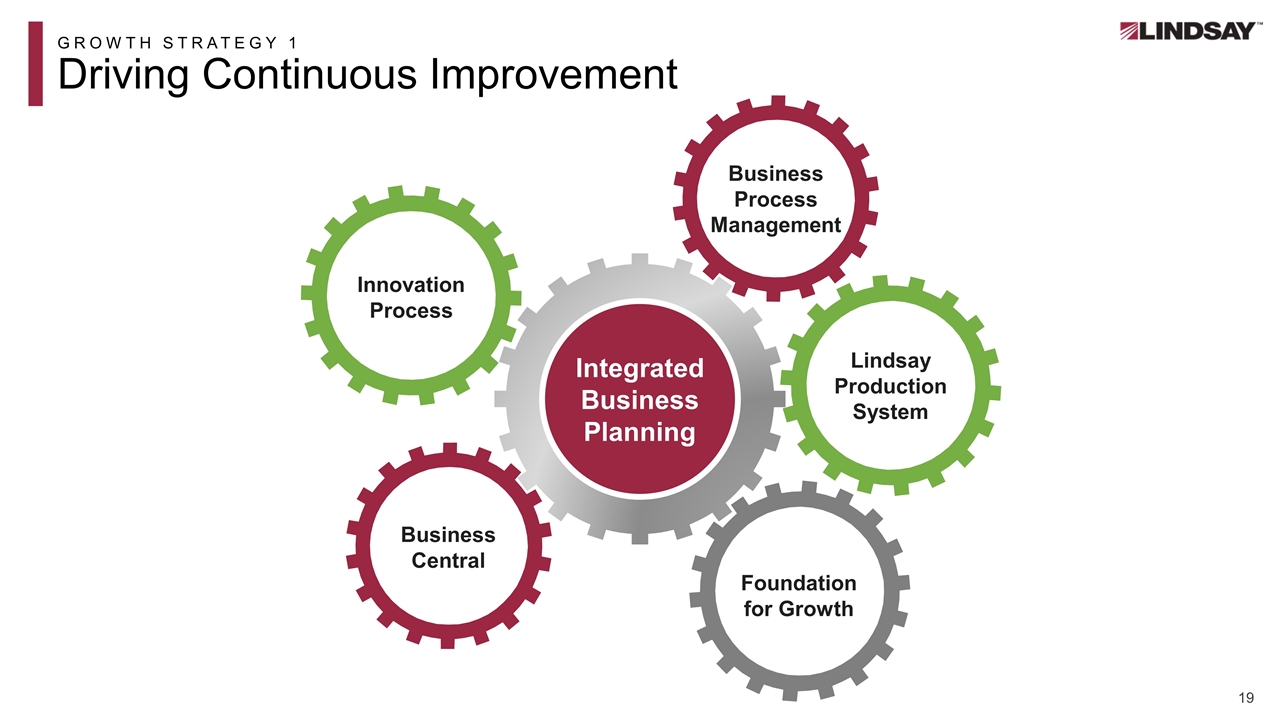
GROWTH STRATEGY 1 Driving Continuous Improvement Innovation Process Foundation for Growth Lindsay Production System Business Central Business Process Management Integrated Business Planning
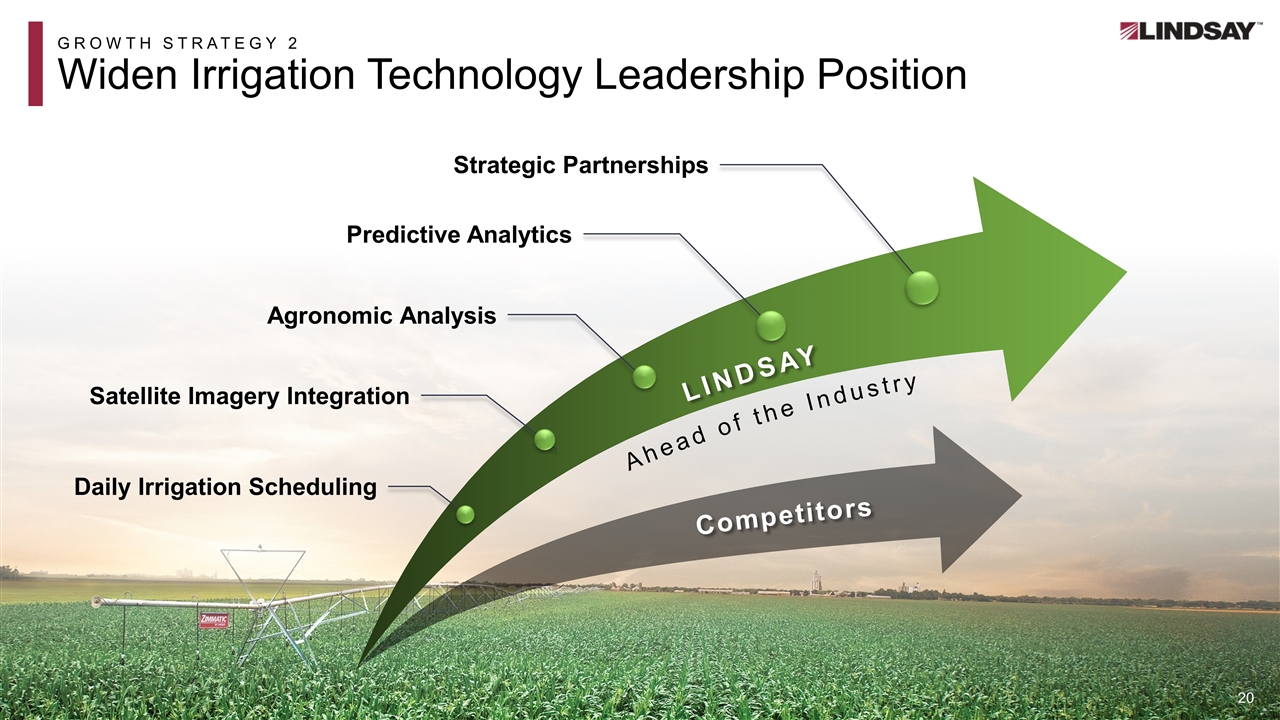
GROWTH STRATEGY 2 Widen Irrigation Technology Leadership Position LINDSAY Ahead of the Industry Satellite Imagery Integration Daily Irrigation Scheduling Strategic Partnerships Competitors Agronomic Analysis Predictive Analytics
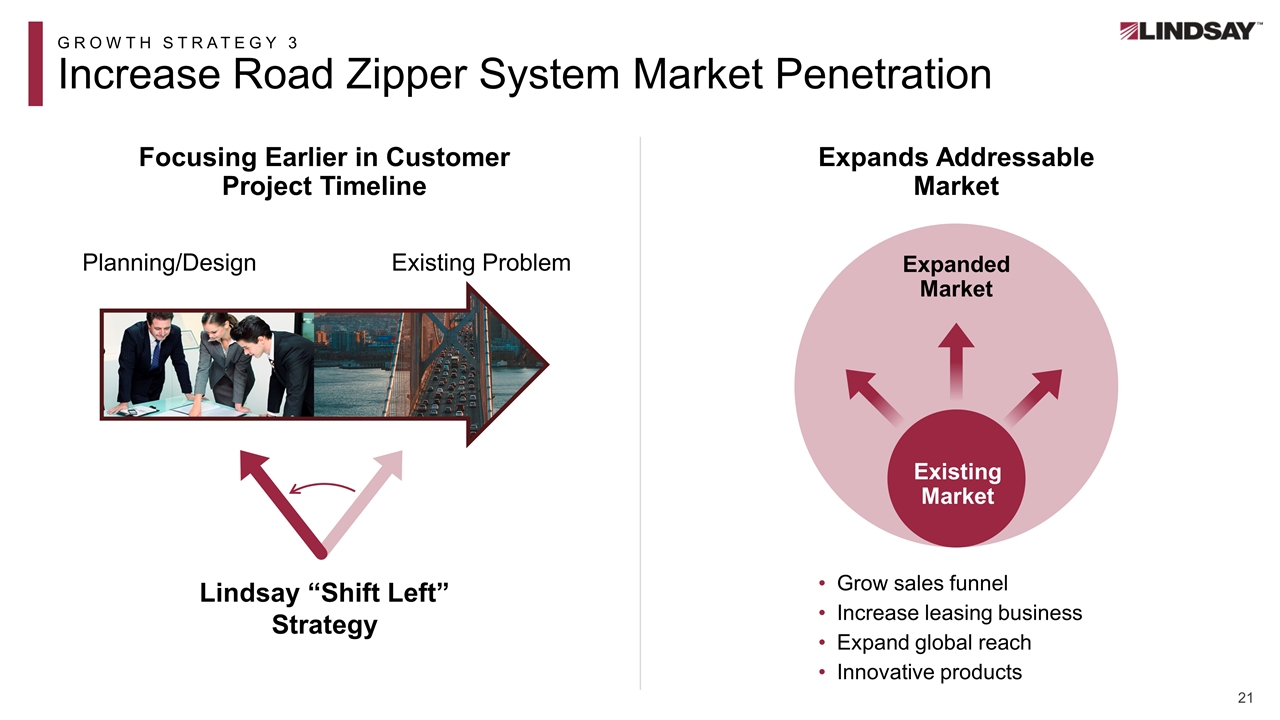
GROWTH STRATEGY 3 Increase Road Zipper System Market Penetration Expands Addressable Market Focusing Earlier in Customer Project Timeline Planning/Design Existing Problem Lindsay “Shift Left” Strategy Grow sales funnel Increase leasing business Expand global reach Innovative products Expanded Market Existing Market
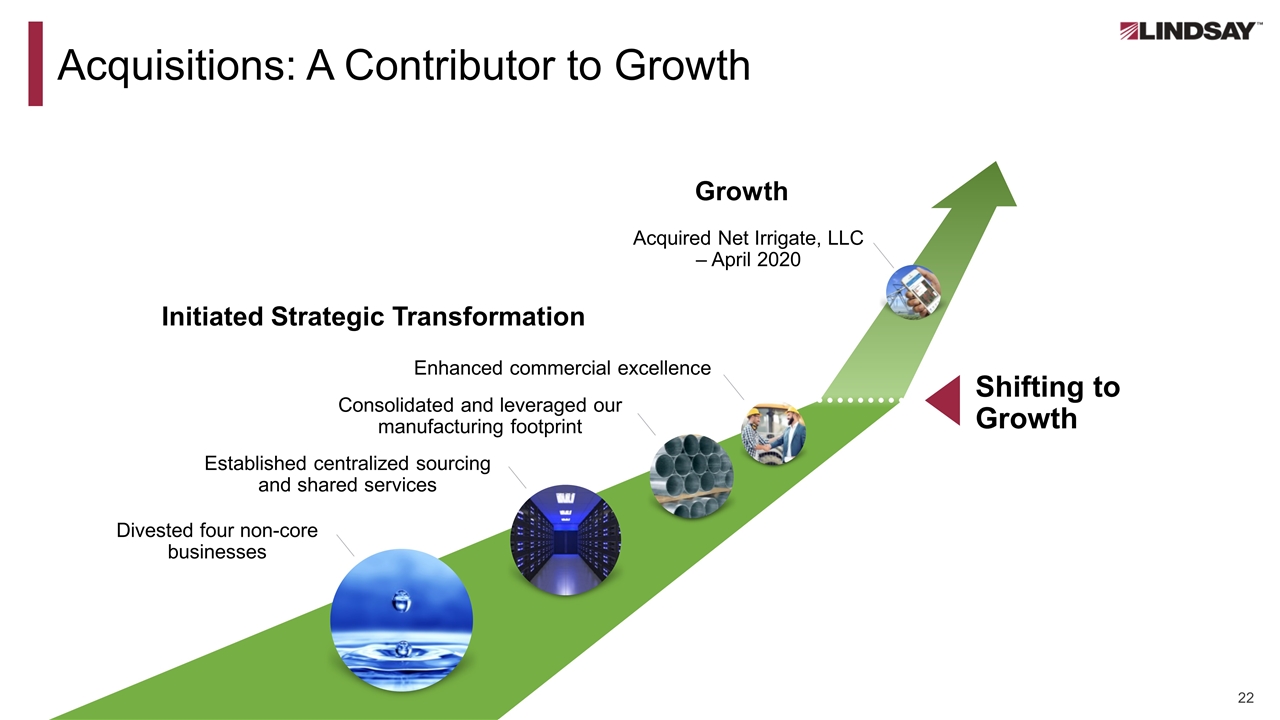
Acquisitions: A Contributor to Growth Divested four non-core businesses Consolidated and leveraged our manufacturing footprint Enhanced commercial excellence Established centralized sourcing and shared services Shifting to Growth Acquired Net Irrigate, LLC – April 2020 Initiated Strategic Transformation Growth
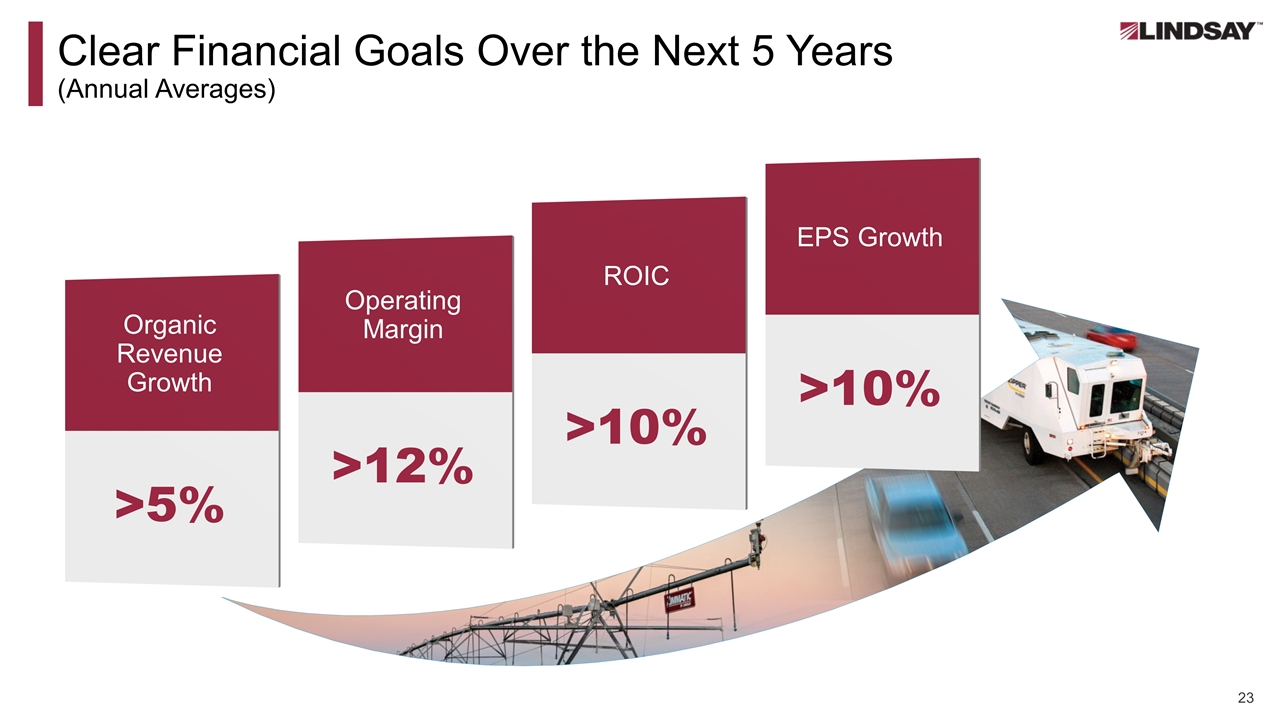
Organic Revenue Growth >5% Operating Margin >12% ROIC >10% EPS Growth >10% Clear Financial Goals Over the Next 5 Years (Annual Averages)
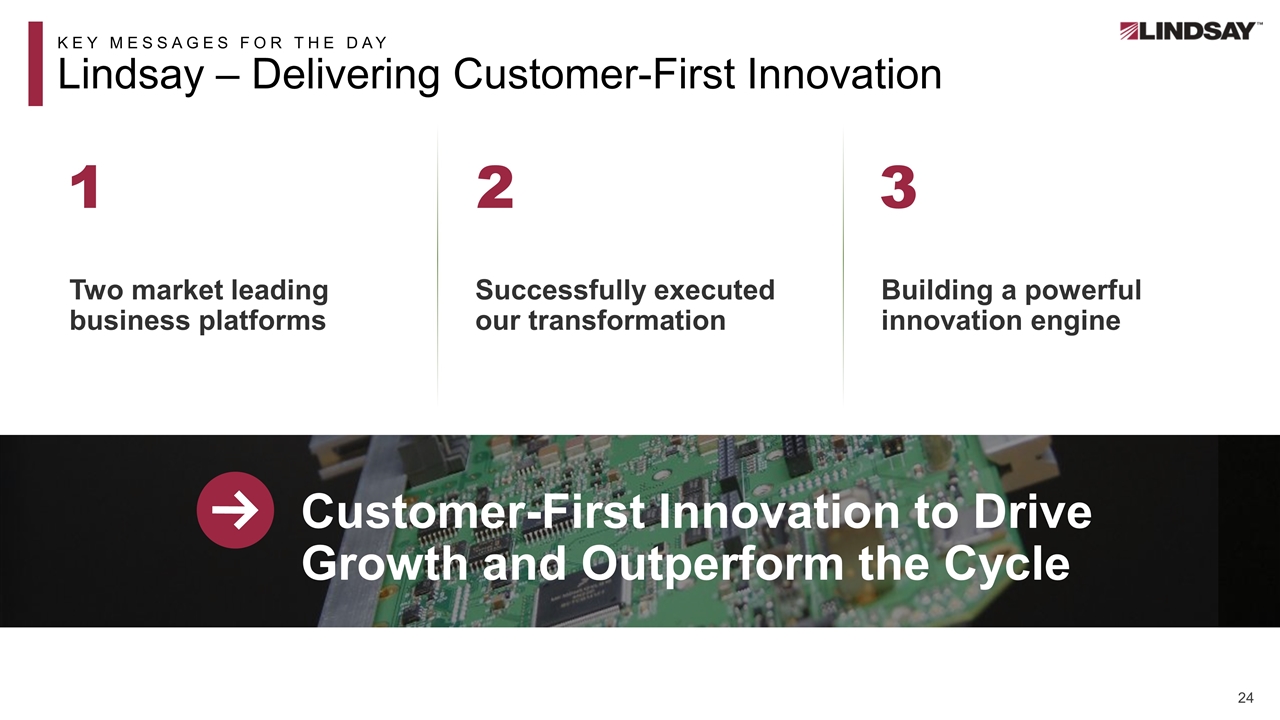
KEY MESSAGES FOR THE DAY Lindsay – Delivering Customer-First Innovation Customer-First Innovation to Drive Growth and Outperform the Cycle 3 2 1 Two market leading business platforms Successfully executed our transformation Building a powerful innovation engine
Innovation Leadership Driving Growth Randy Wood, COO
Innovation Opener
Agenda Record of innovation leadership Our innovation engine – delivering results Leveraging our technology capabilities

Innovation Leadership: Addressing Global Megatrends Capitalizing on global megatrends Key Trends Food Security Water Scarcity Land Availability Mobility Safety Reducing Emissions Labor Savings
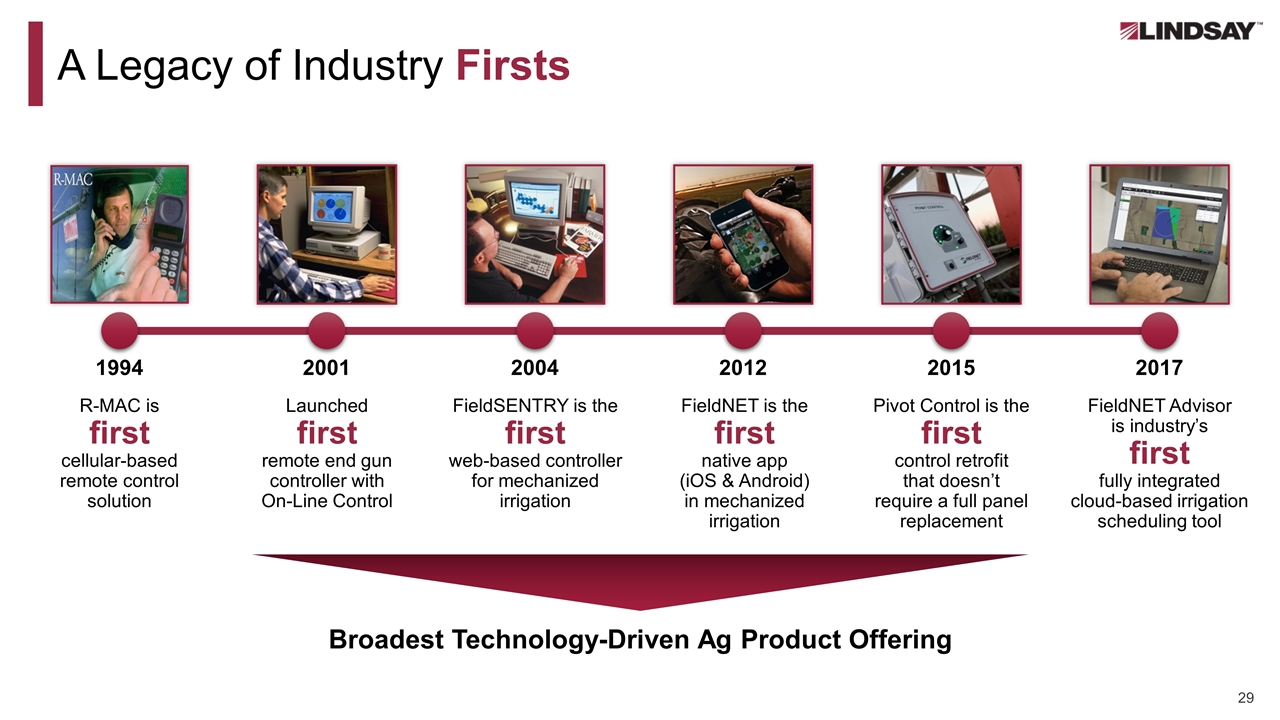
A Legacy of Industry Firsts 1994 2004 2012 2015 2017 R-MAC is first cellular-based remote control solution FieldSENTRY is the first web-based controller for mechanized irrigation FieldNET is the first native app (iOS & Android) in mechanized irrigation Pivot Control is the first control retrofit that doesn’t require a full panel replacement FieldNET Advisor is industry’s first fully integrated cloud-based irrigation scheduling tool 2001 Launched first remote end gun controller with On-Line Control Broadest Technology-Driven Ag Product Offering
Agenda Record of innovation leadership Our innovation engine – delivering results Leveraging our technology capabilities
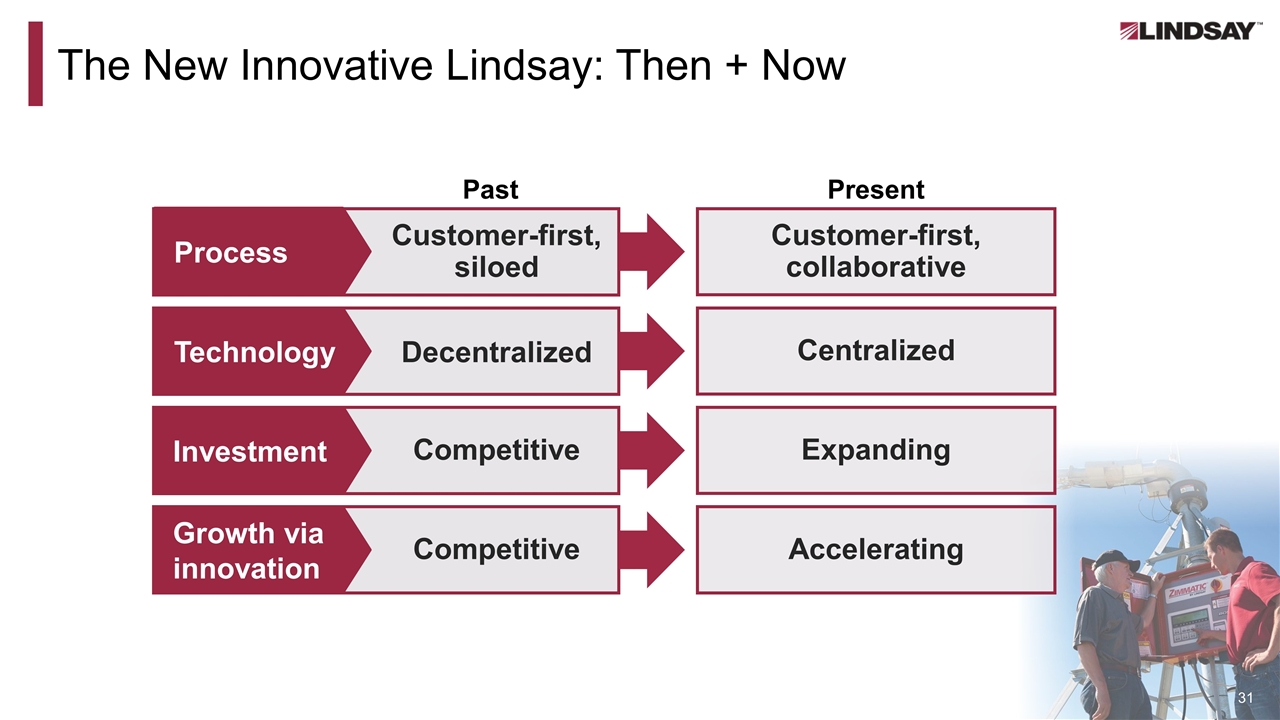
The New Innovative Lindsay: Then + Now Present Customer-first, collaborative Centralized Expanding Accelerating Past Customer-first, siloed Decentralized Competitive Competitive Growth via innovation Investment Process Technology
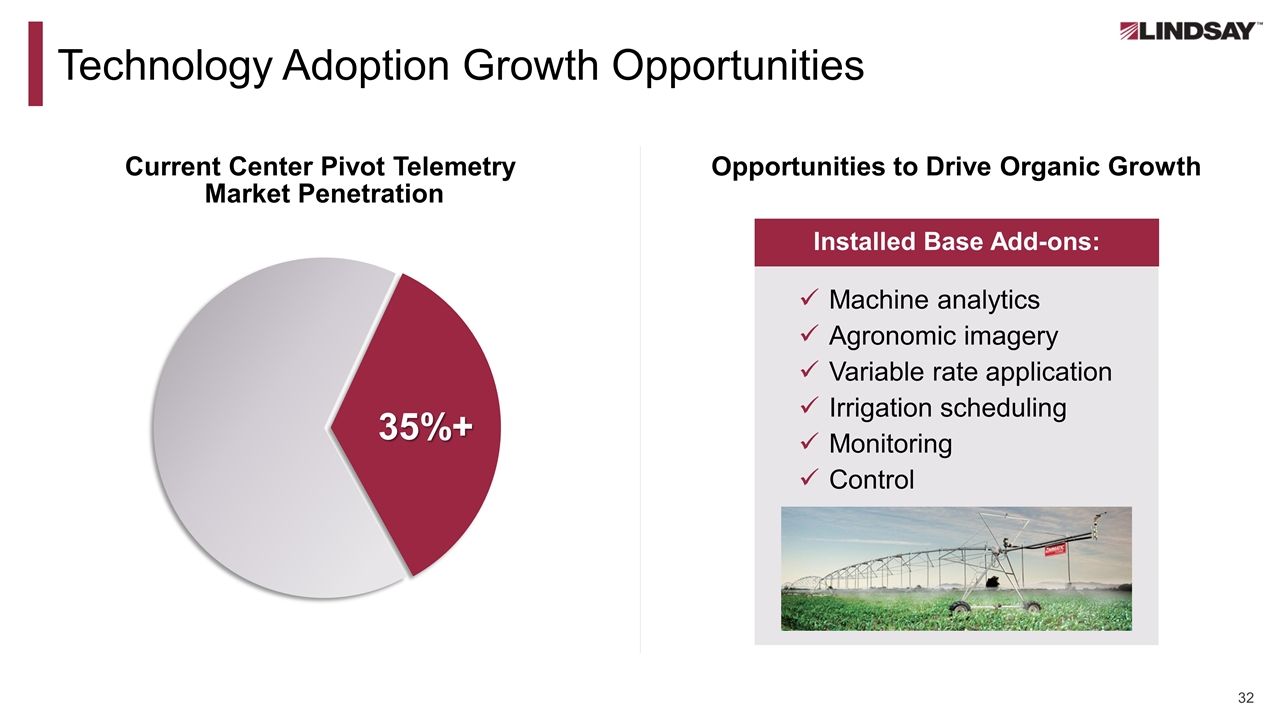
Technology Adoption Growth Opportunities Current Center Pivot Telemetry Market Penetration Opportunities to Drive Organic Growth Machine analytics Agronomic imagery Variable rate application Irrigation scheduling Monitoring Control 35%+ Installed Base Add-ons:
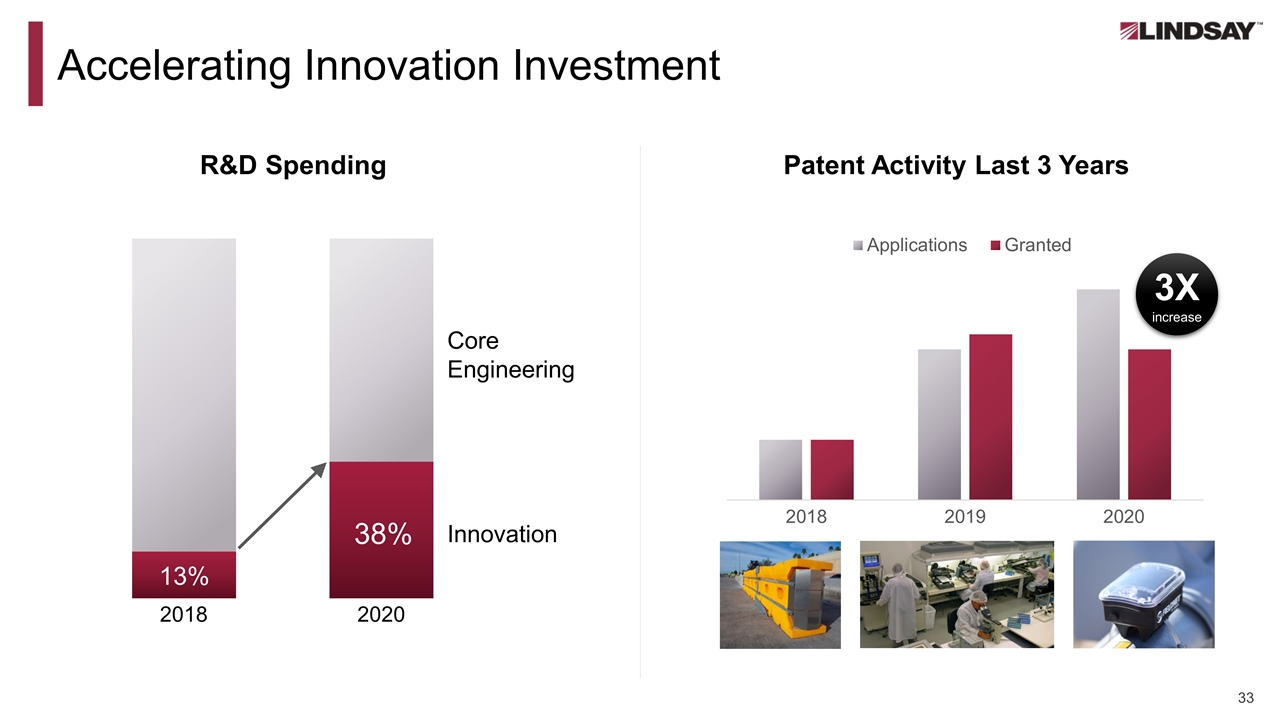
Accelerating Innovation Investment R&D Spending Patent Activity Last 3 Years 3X increase 13% 38% Core Engineering Innovation
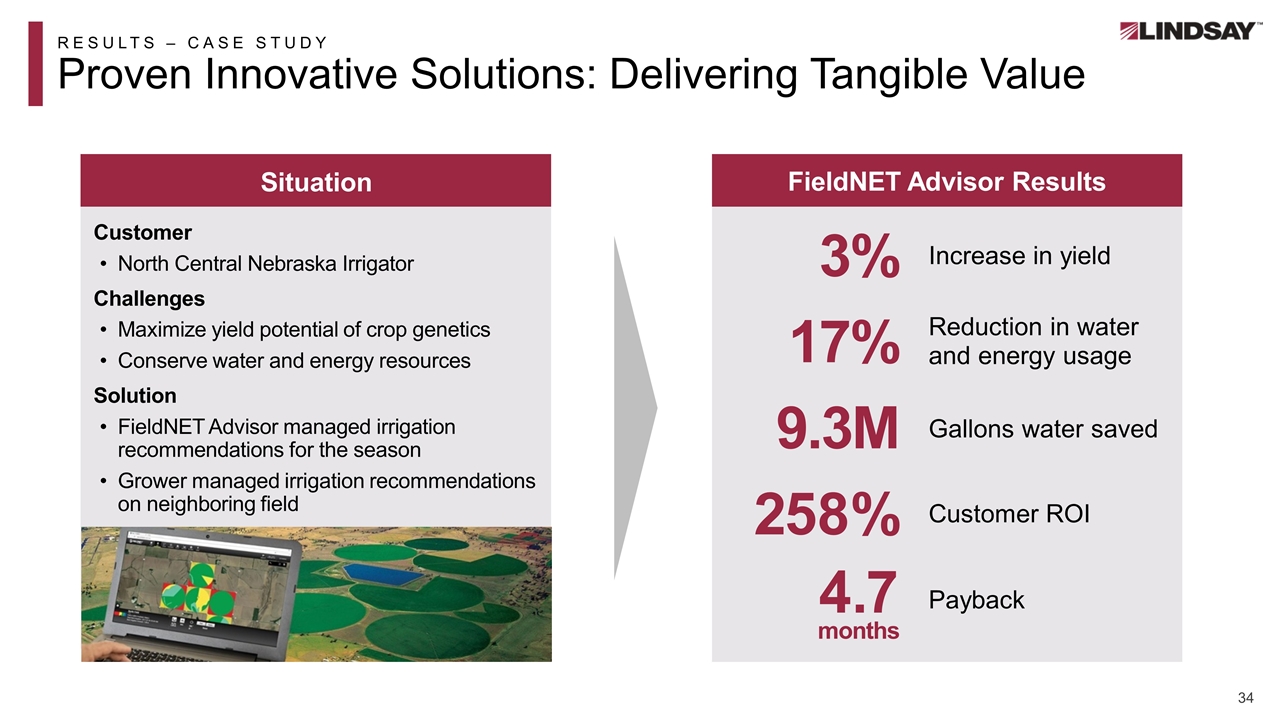
RESULTS – CASE STUDY Proven Innovative Solutions: Delivering Tangible Value FieldNET Advisor Results 3% Situation Customer North Central Nebraska Irrigator Challenges Maximize yield potential of crop genetics Conserve water and energy resources Solution FieldNET Advisor managed irrigation recommendations for the season Grower managed irrigation recommendations on neighboring field Increase in yield 258% Customer ROI 17% Reduction in water and energy usage 4.7 Payback 9.3M Gallons water saved months
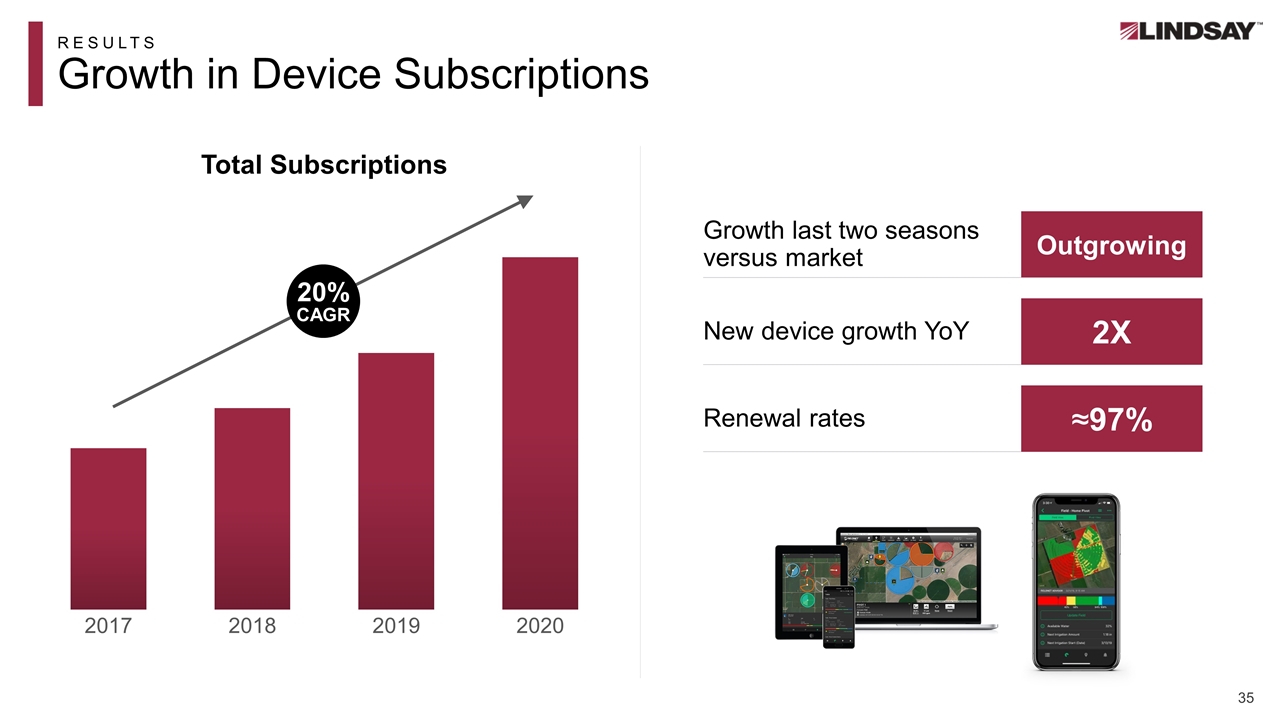
RESULTS Growth in Device Subscriptions Innovation Total Subscriptions 20% CAGR Renewal rates New device growth YoY Growth last two seasons versus market ≈97% 2X Outgrowing
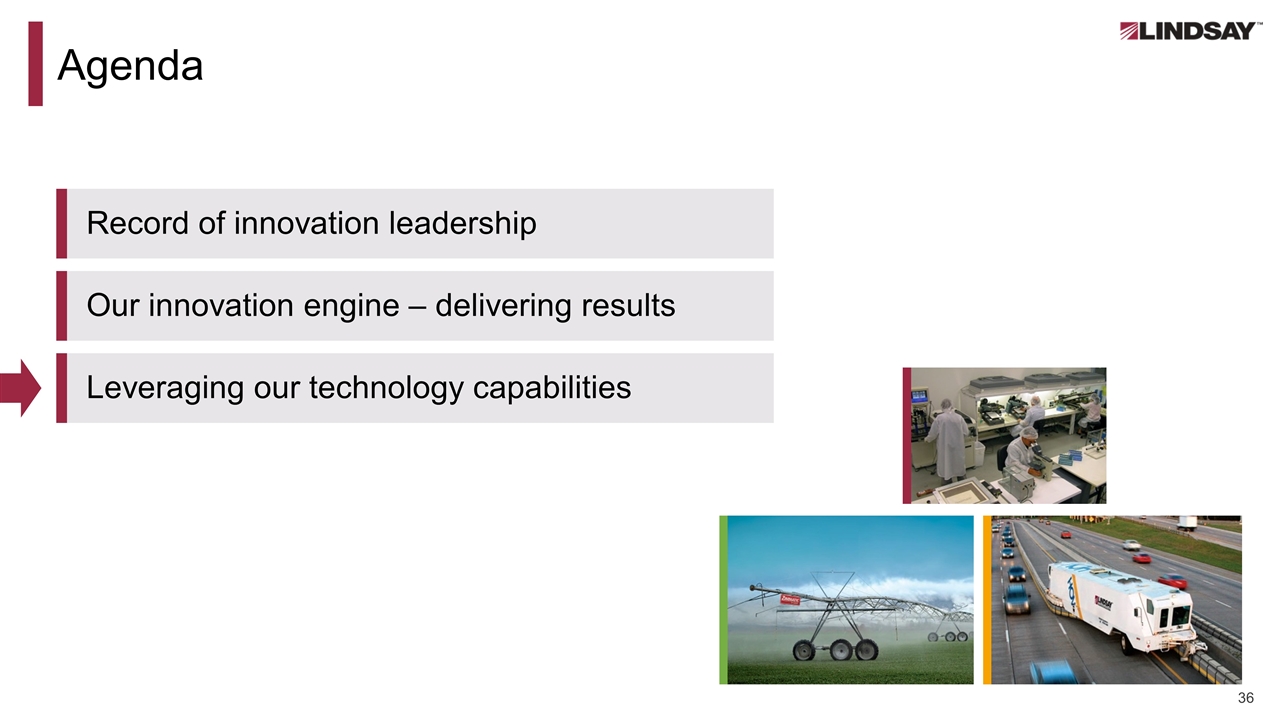
Agenda Record of innovation leadership Our innovation engine – delivering results Leveraging our technology capabilities
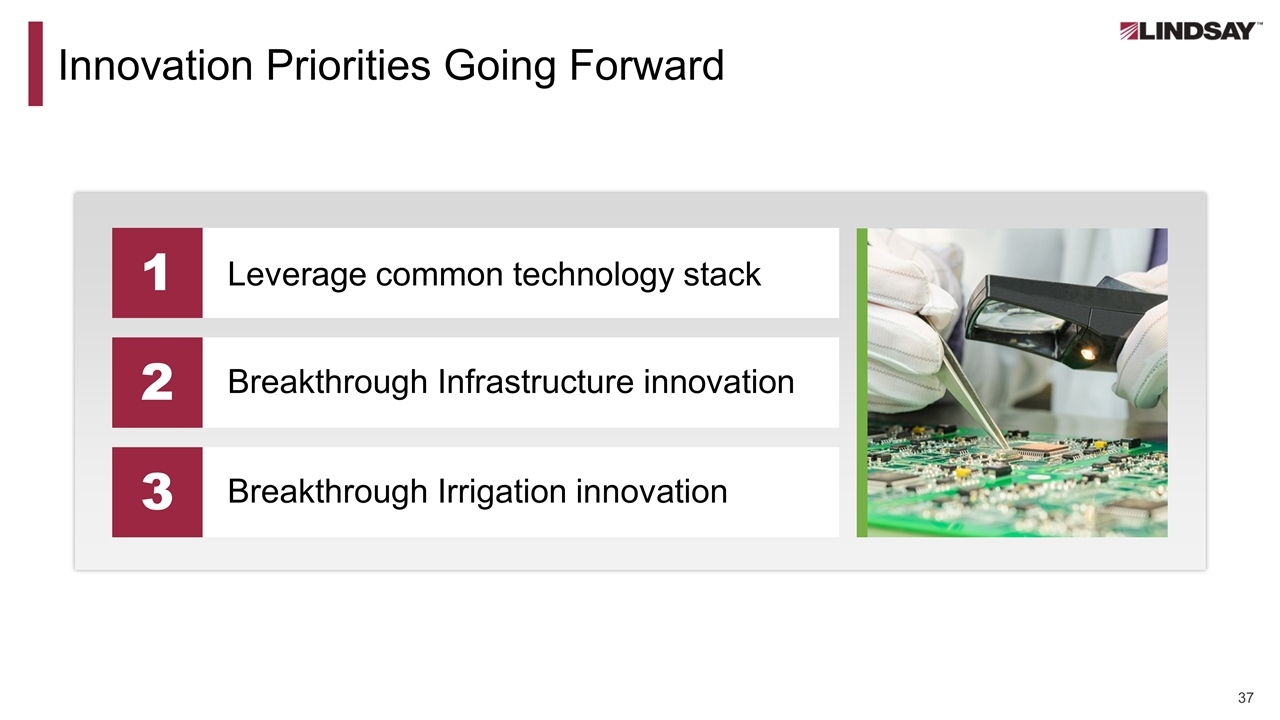
Innovation Priorities Going Forward Leverage common technology stack Breakthrough Infrastructure innovation Breakthrough Irrigation innovation 1 2 3
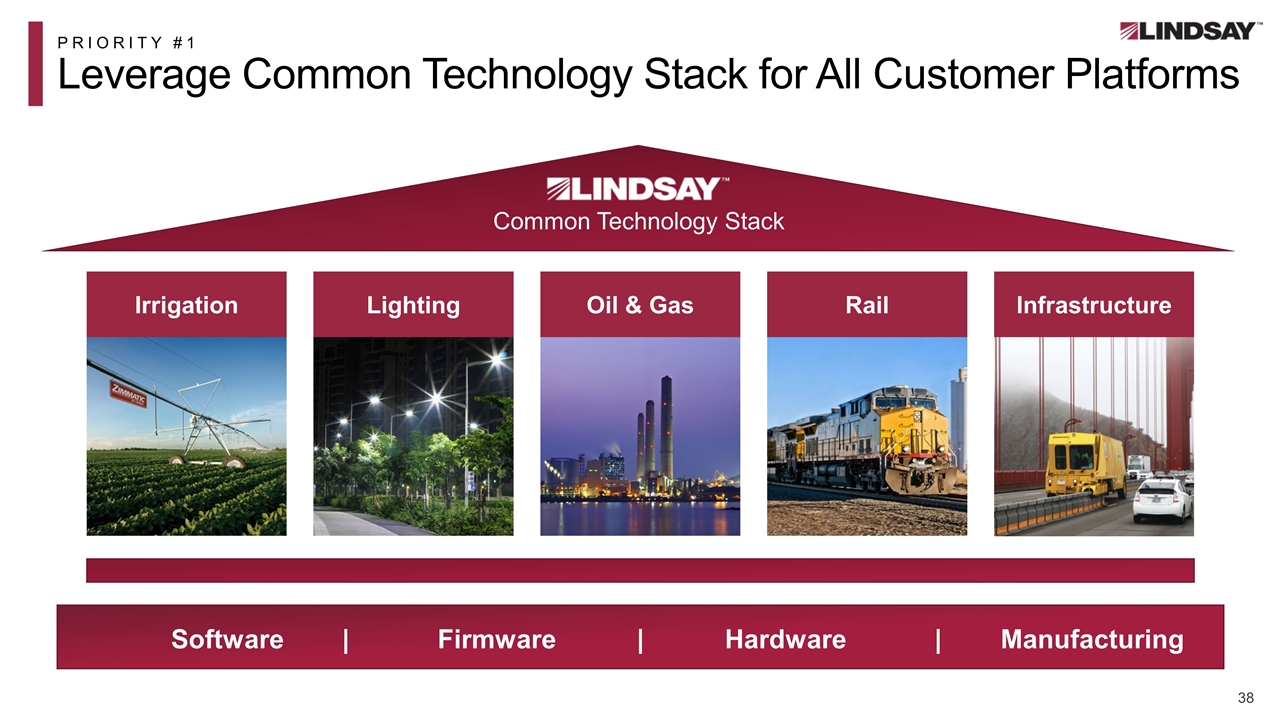
PRIORITY #1 Leverage Common Technology Stack for All Customer Platforms Irrigation Lighting Oil & Gas Rail Infrastructure Software | Firmware | Hardware | Manufacturing Common Technology Stack
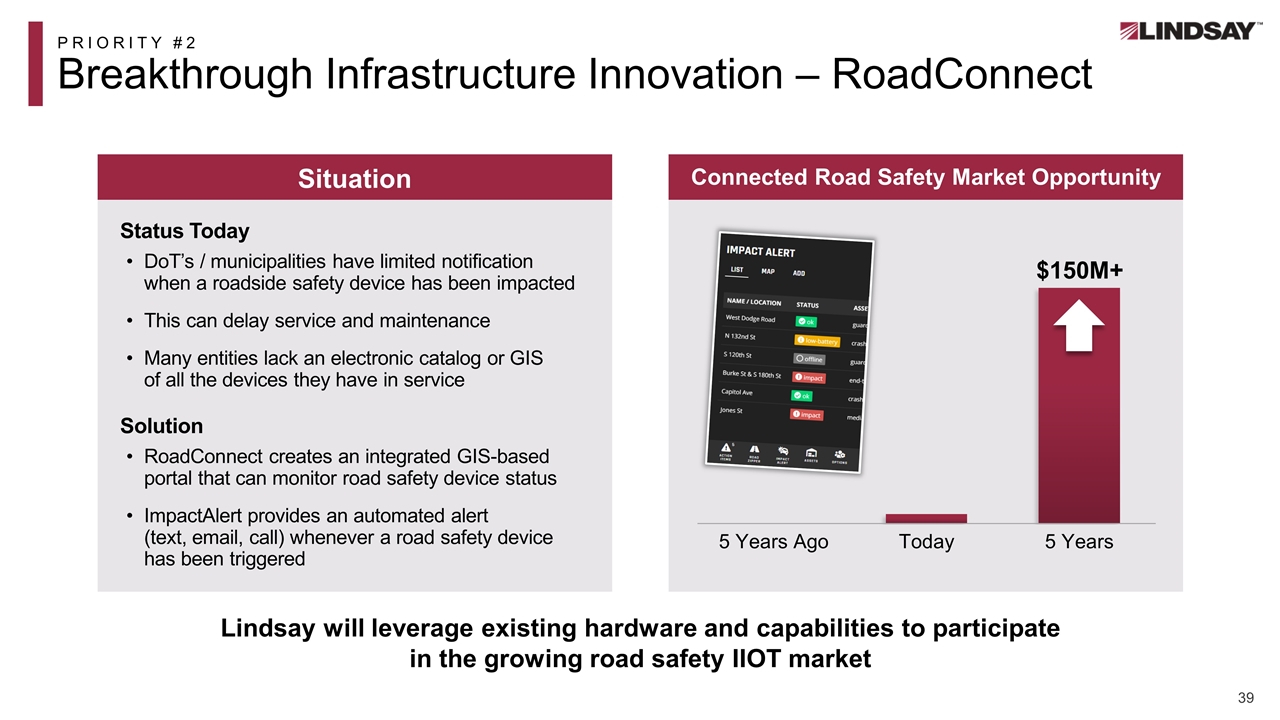
PRIORITY #2 Breakthrough Infrastructure Innovation – RoadConnect Lindsay will leverage existing hardware and capabilities to participate in the growing road safety IIOT market Situation Status Today DoT’s / municipalities have limited notification when a roadside safety device has been impacted This can delay service and maintenance Many entities lack an electronic catalog or GIS of all the devices they have in service Solution RoadConnect creates an integrated GIS-based portal that can monitor road safety device status ImpactAlert provides an automated alert (text, email, call) whenever a road safety device has been triggered Connected Road Safety Market Opportunity $150M+
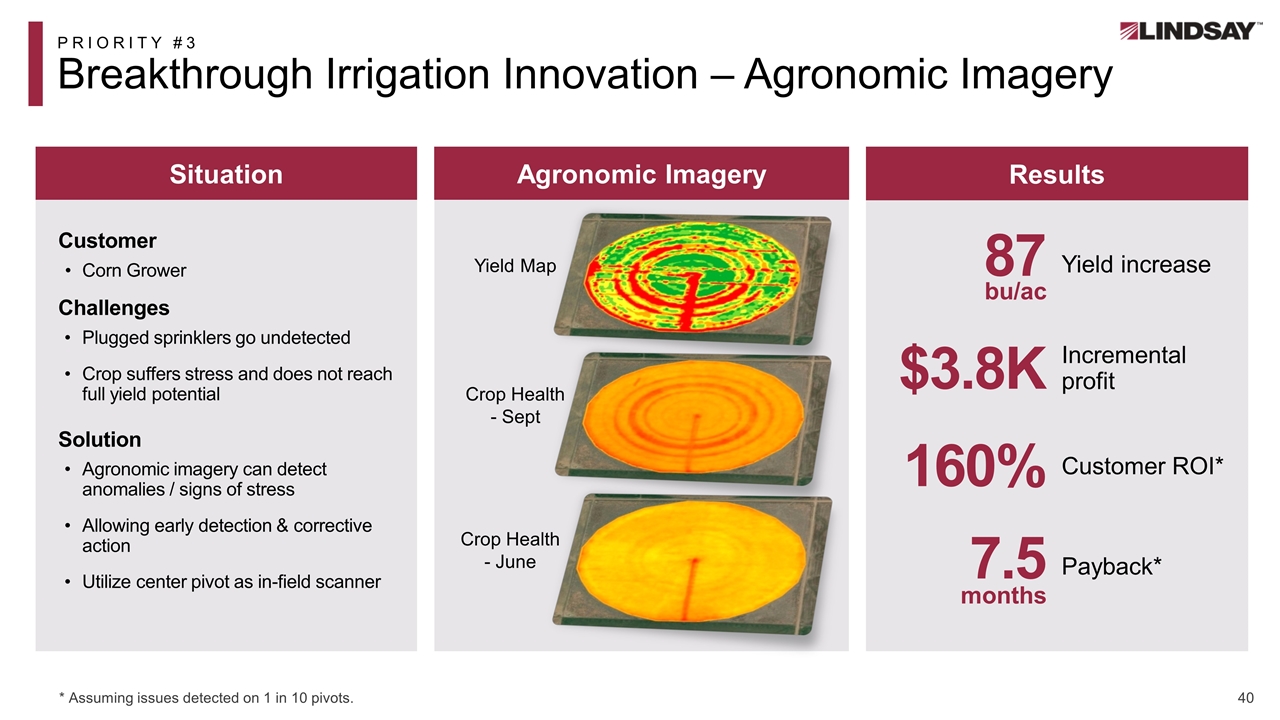
Agronomic Imagery PRIORITY #3 Breakthrough Irrigation Innovation – Agronomic Imagery * Assuming issues detected on 1 in 10 pivots. Crop Health - June Situation Customer Corn Grower Challenges Plugged sprinklers go undetected Crop suffers stress and does not reach full yield potential Solution Agronomic imagery can detect anomalies / signs of stress Allowing early detection & corrective action Utilize center pivot as in-field scanner Results 87 Yield increase 160% Customer ROI* $3.8K Incremental profit Payback* 7.5 months bu/ac Crop Health - Sept Yield Map
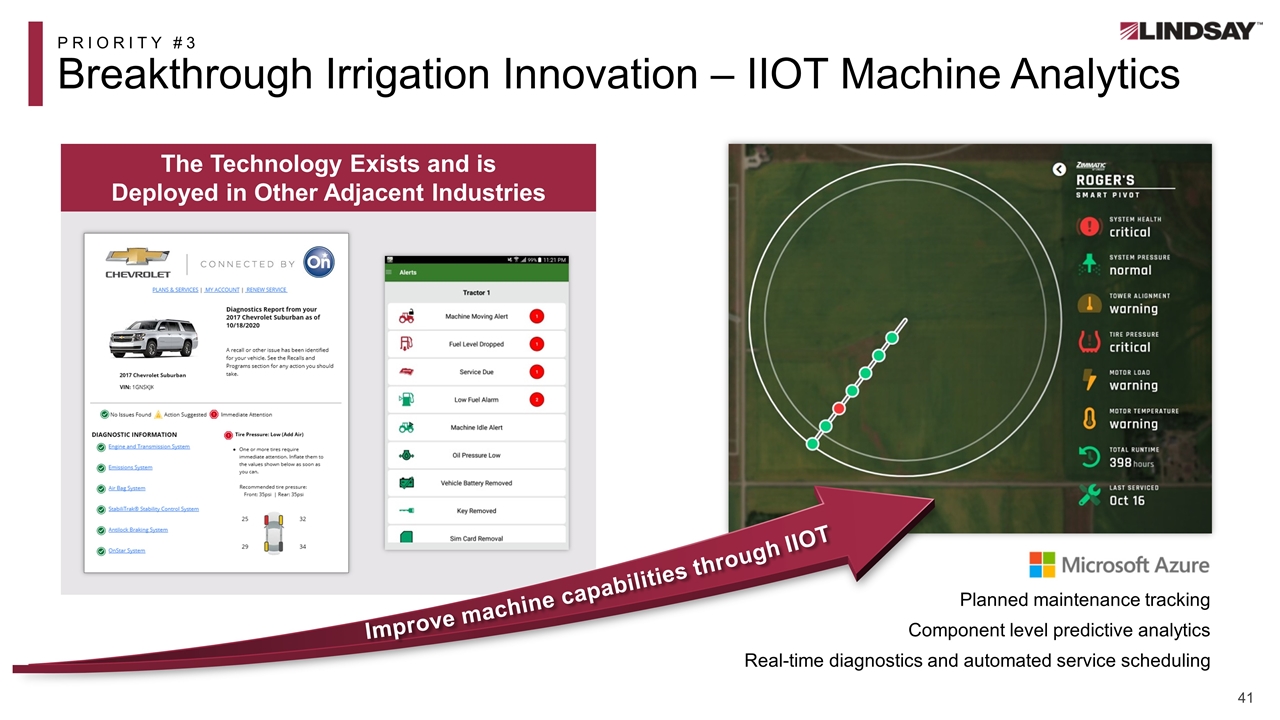
PRIORITY #3 Breakthrough Irrigation Innovation – IIOT Machine Analytics Planned maintenance tracking Component level predictive analytics Real-time diagnostics and automated service scheduling The Technology Exists and is Deployed in Other Adjacent Industries Improve machine capabilities through IIOT
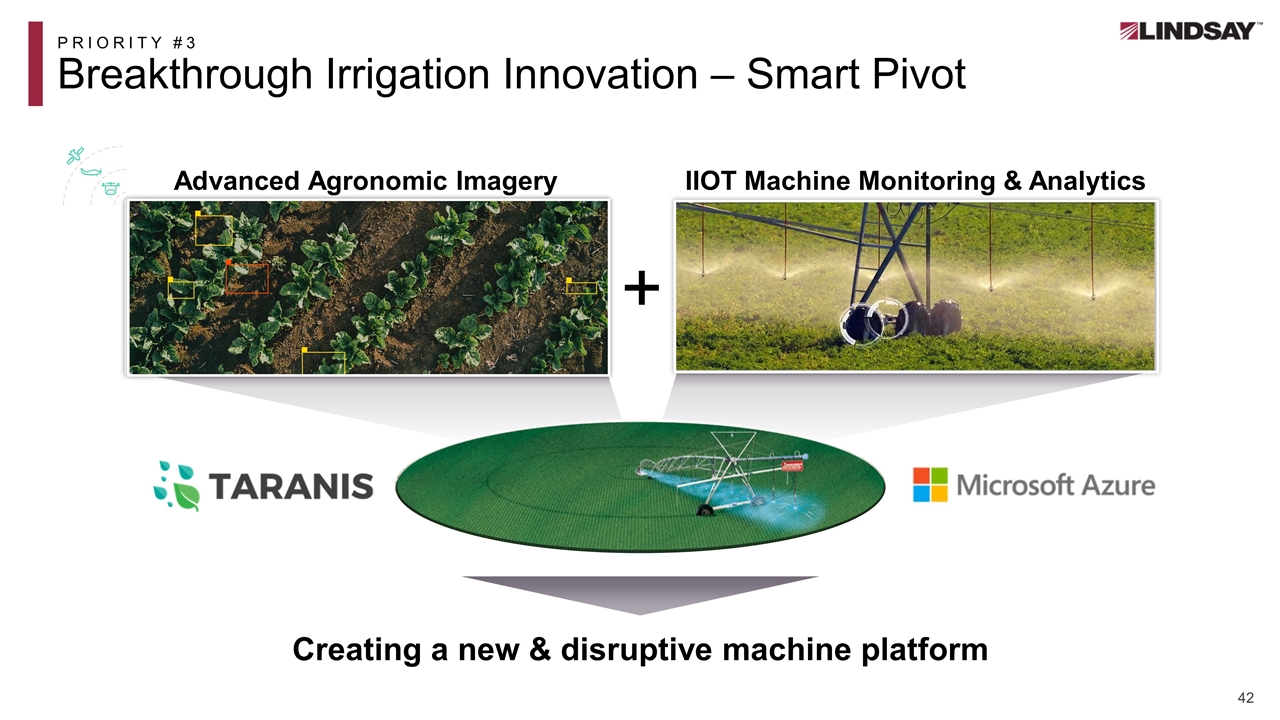
PRIORITY #3 Breakthrough Irrigation Innovation – Smart Pivot Creating a new & disruptive machine platform + IIOT Machine Monitoring & Analytics Advanced Agronomic Imagery
Smart Pivot Demo
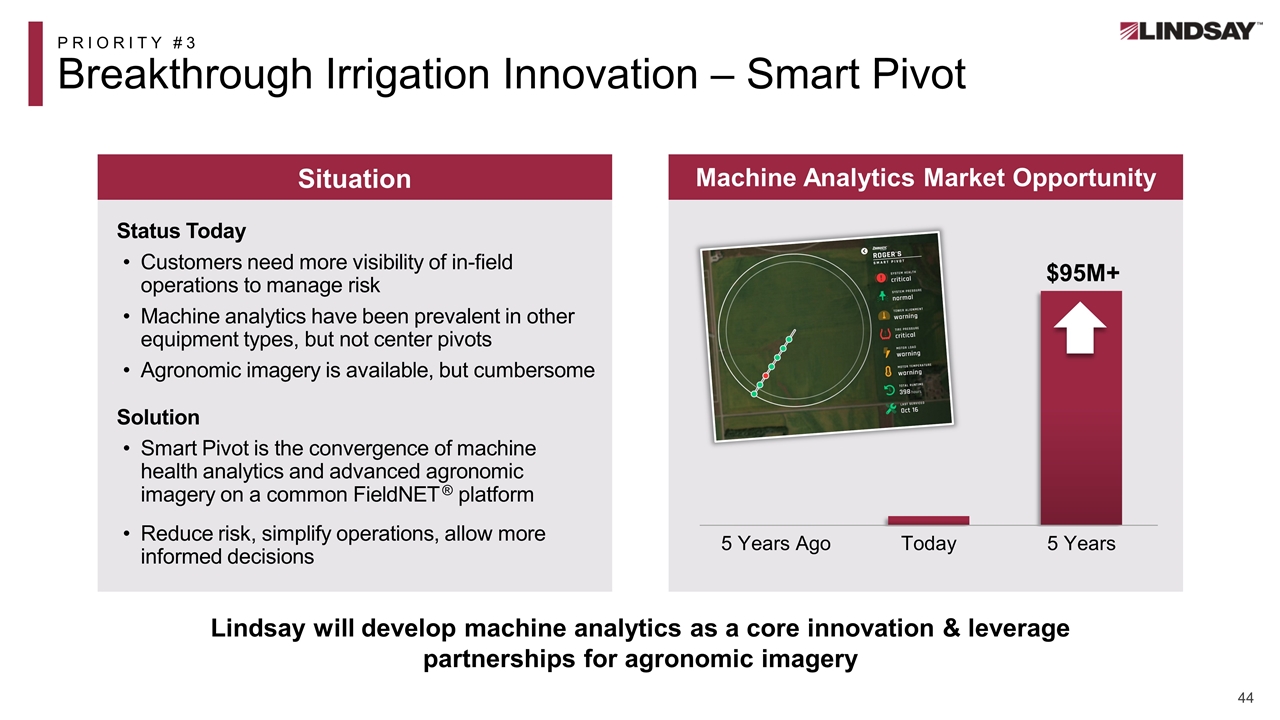
PRIORITY #3 Breakthrough Irrigation Innovation – Smart Pivot Lindsay will develop machine analytics as a core innovation & leverage partnerships for agronomic imagery Situation Status Today Customers need more visibility of in-field operations to manage risk Machine analytics have been prevalent in other equipment types, but not center pivots Agronomic imagery is available, but cumbersome Solution Smart Pivot is the convergence of machine health analytics and advanced agronomic imagery on a common FieldNET ® platform Reduce risk, simplify operations, allow more informed decisions Machine Analytics Market Opportunity $95M+
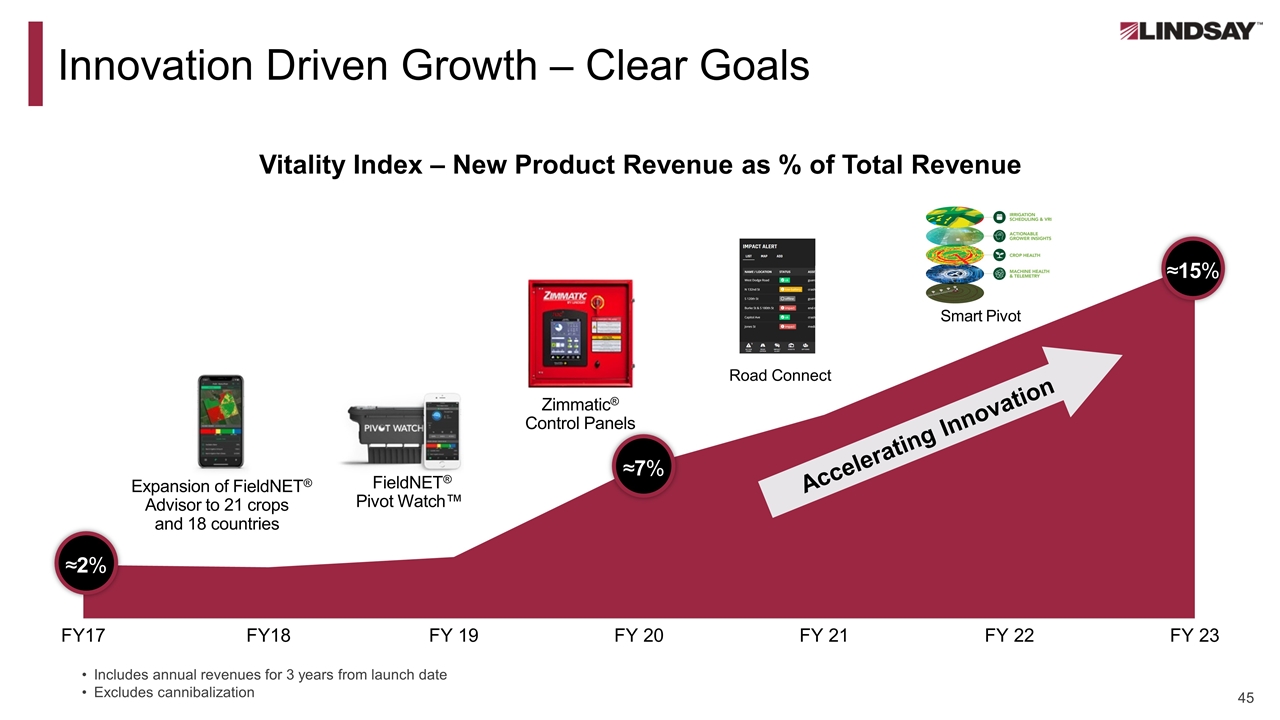
Innovation Driven Growth – Clear Goals FieldNET® Pivot Watch™ Zimmatic® Control Panels Expansion of FieldNET® Advisor to 21 crops and 18 countries Smart Pivot Road Connect Vitality Index – New Product Revenue as % of Total Revenue Includes annual revenues for 3 years from launch date Excludes cannibalization ≈2% ≈7% ≈15% Accelerating Innovation
IN SUMMARY Innovation Driving Growth 3 2 1 Long record of innovation leadership Solving global problems efficiently and sustainably for customers Accelerating investment in our innovation engine Bringing disruptive technology to the market faster New products driving growth Projects in place and advancing
Q&A Session
Irrigation - Innovating and Expanding to Drive Growth Gustavo Oberto, President
The business today – a differentiated platform Capitalizing on key megatrends Growth initiatives Agenda
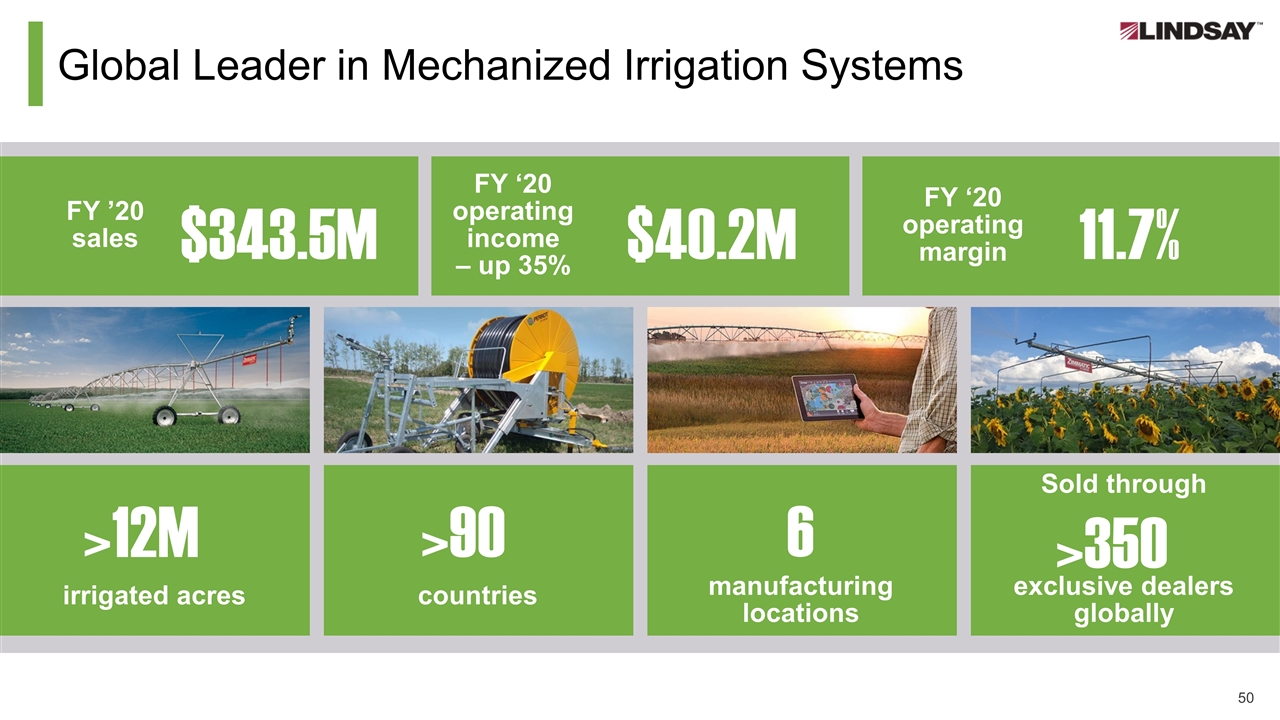
Global Leader in Mechanized Irrigation Systems $343.5M FY ’20 sales $40.2M FY ‘20 operating income – up 35% 11.7% FY ‘20 operating margin >12M irrigated acres >90 countries 6 manufacturing locations >350 exclusive dealers globally Sold through
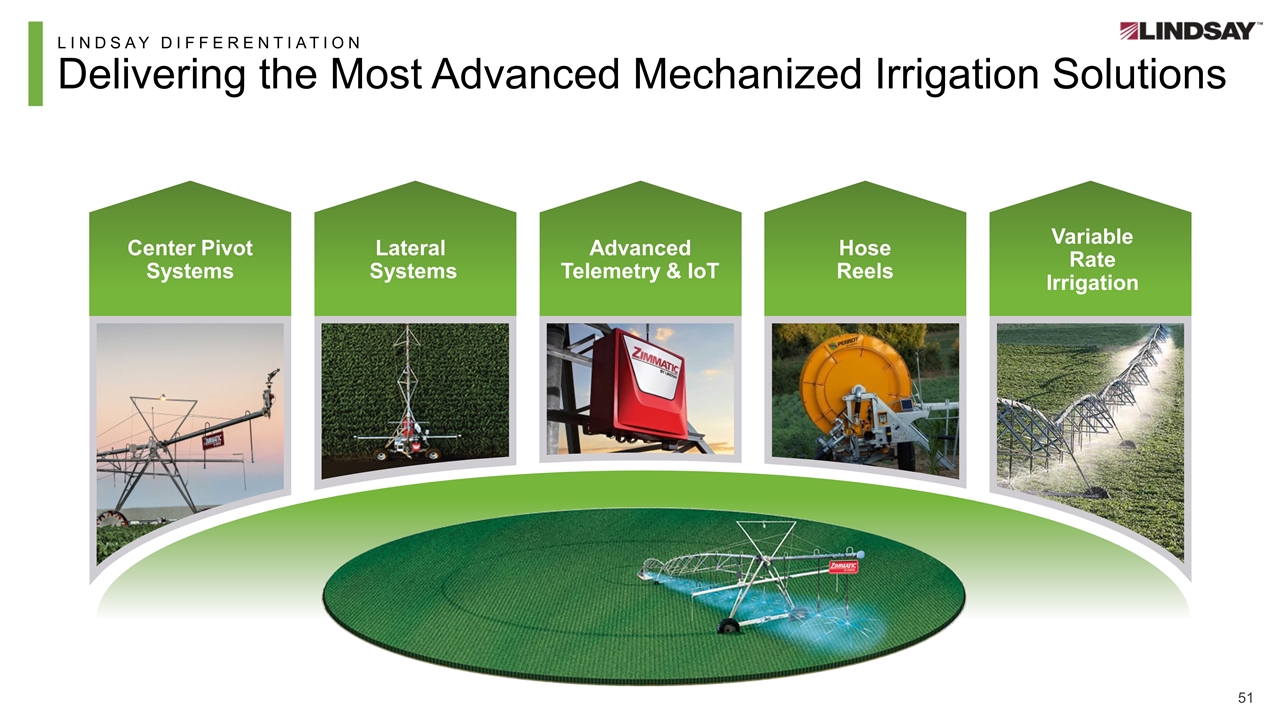
LINDSAY DIFFERENTIATION Delivering the Most Advanced Mechanized Irrigation Solutions Center Pivot Systems Lateral Systems Variable Rate Irrigation Hose Reels Advanced Telemetry & IoT
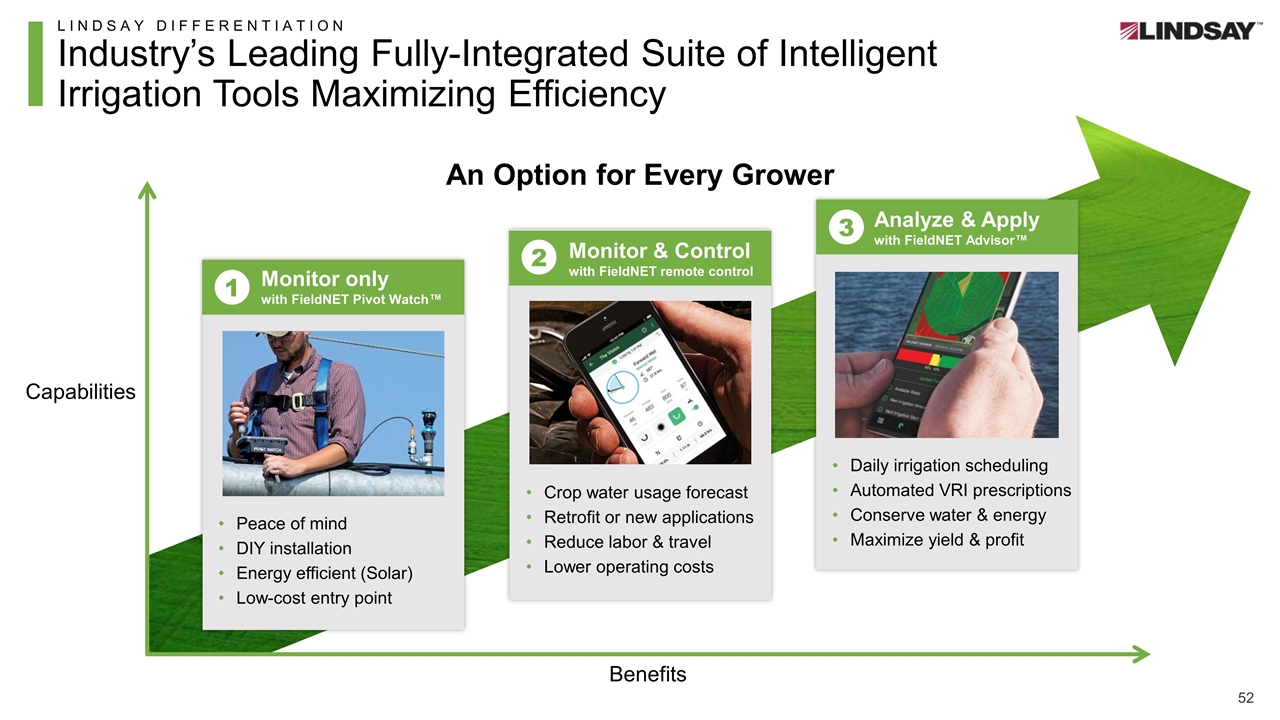
An Option for Every Grower 1 Peace of mind DIY installation Energy efficient (Solar) Low-cost entry point Monitor only with FieldNET Pivot Watch™ 2 Crop water usage forecast Retrofit or new applications Reduce labor & travel Lower operating costs Monitor & Control with FieldNET remote control 3 Daily irrigation scheduling Automated VRI prescriptions Conserve water & energy Maximize yield & profit Analyze & Apply with FieldNET Advisor™ LINDSAY DIFFERENTIATION Industry’s Leading Fully-Integrated Suite of Intelligent Irrigation Tools Maximizing Efficiency Capabilities Benefits
Agenda The business today – a differentiated platform Capitalizing on key megatrends Growth initiatives
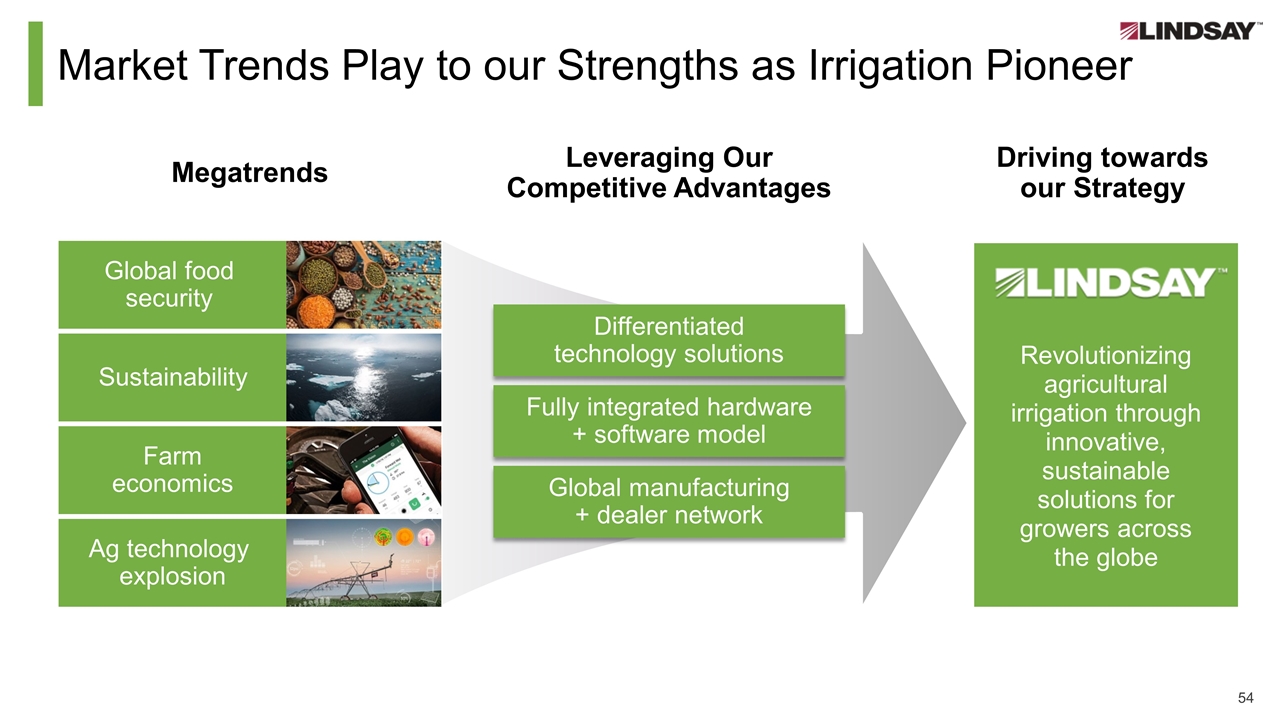
Revolutionizing agricultural irrigation through innovative, sustainable solutions for growers across the globe Market Trends Play to our Strengths as Irrigation Pioneer Megatrends Global food security Sustainability Farm economics Ag technology explosion Leveraging Our Competitive Advantages Differentiated technology solutions Fully integrated hardware + software model Global manufacturing + dealer network Driving towards our Strategy
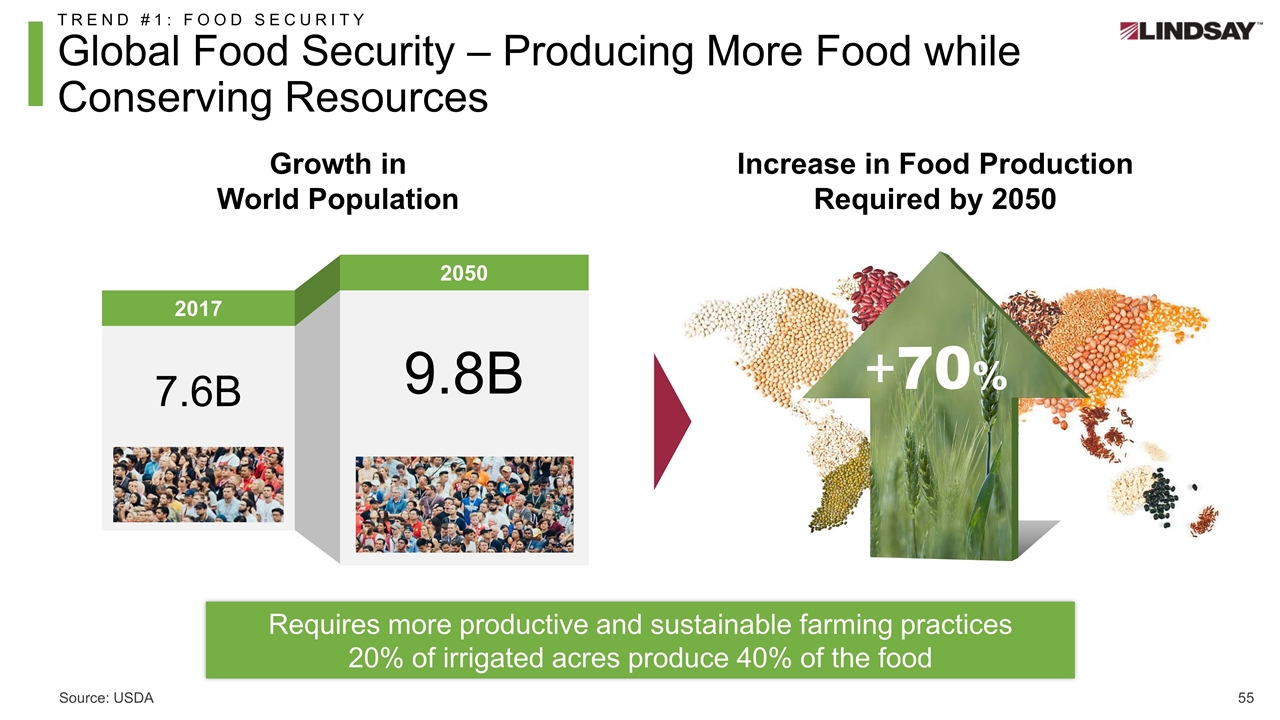
Growth in World Population 2017 7.6B 2050 9.8B TREND #1: FOOD SECURITY Global Food Security – Producing More Food while Conserving Resources Requires more productive and sustainable farming practices 20% of irrigated acres produce 40% of the food Increase in Food Production Required by 2050 +70% Source: USDA
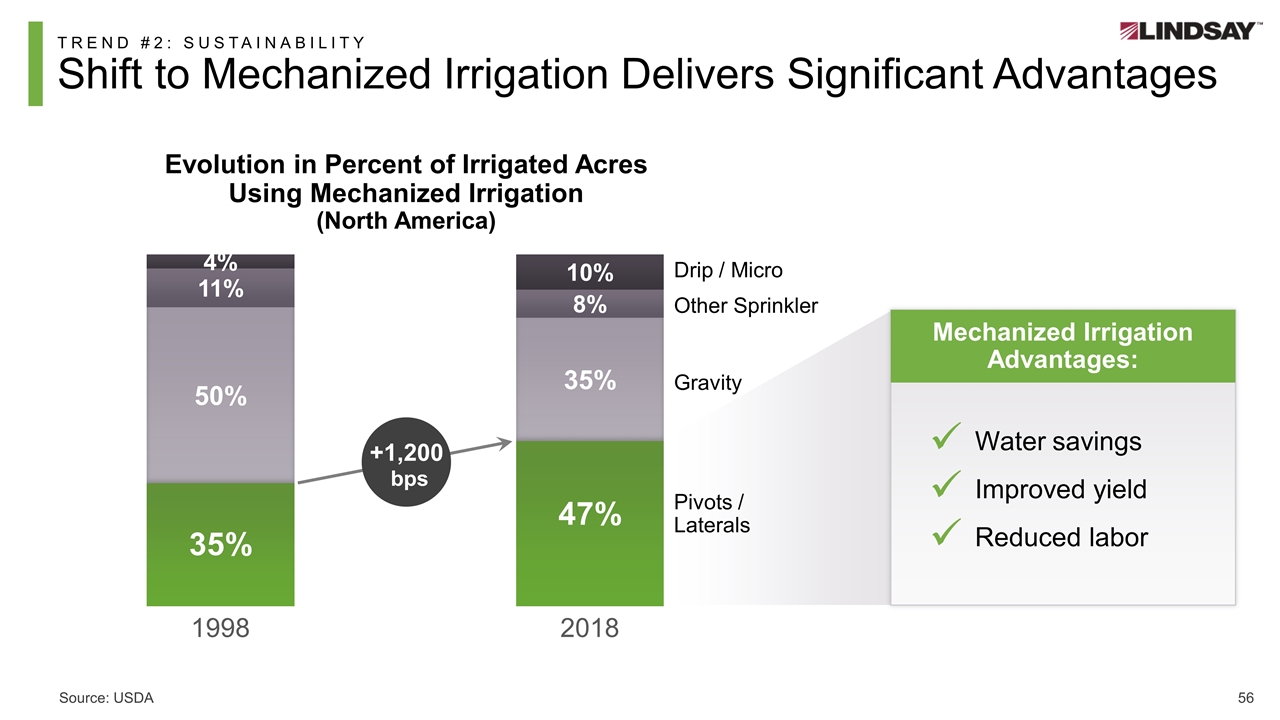
TREND #2: SUSTAINABILITY Shift to Mechanized Irrigation Delivers Significant Advantages +1,200 bps Pivots / Laterals Gravity Other Sprinkler Drip / Micro Water savings Improved yield Reduced labor ü ü ü Mechanized Irrigation Advantages: Evolution in Percent of Irrigated Acres Using Mechanized Irrigation (North America) Source: USDA
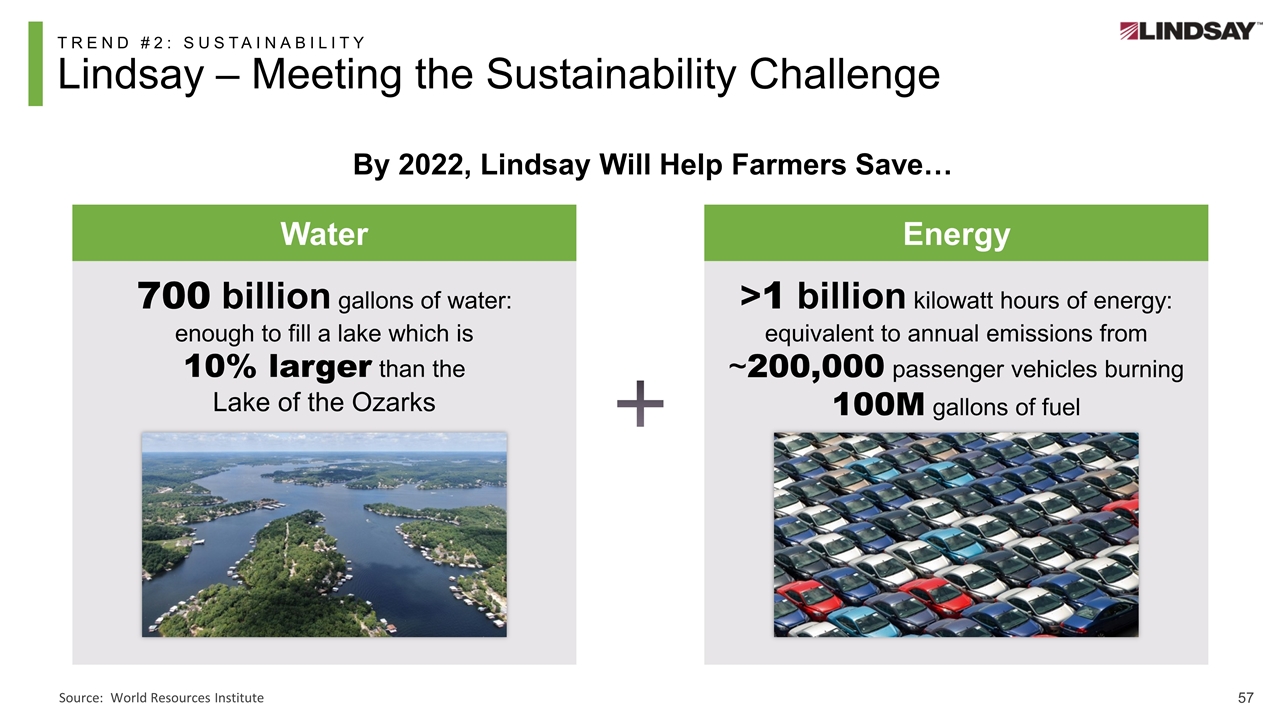
TREND #2: SUSTAINABILITY Lindsay – Meeting the Sustainability Challenge Water Energy Source: World Resources Institute By 2022, Lindsay Will Help Farmers Save… 700 billion gallons of water: enough to fill a lake which is 10% larger than the Lake of the Ozarks >1 billion kilowatt hours of energy: equivalent to annual emissions from ~200,000 passenger vehicles burning 100M gallons of fuel
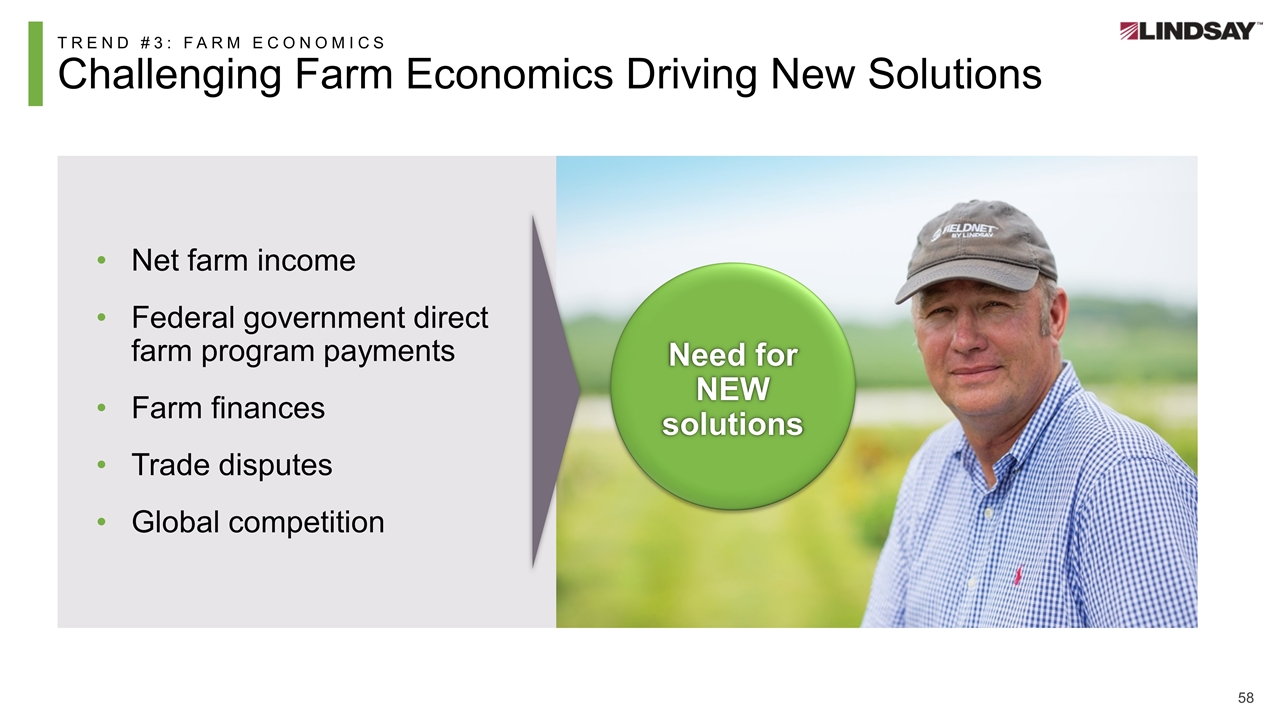
TREND #3: FARM ECONOMICS Challenging Farm Economics Driving New Solutions Net farm income Federal government direct farm program payments Farm finances Trade disputes Global competition Need for NEW solutions
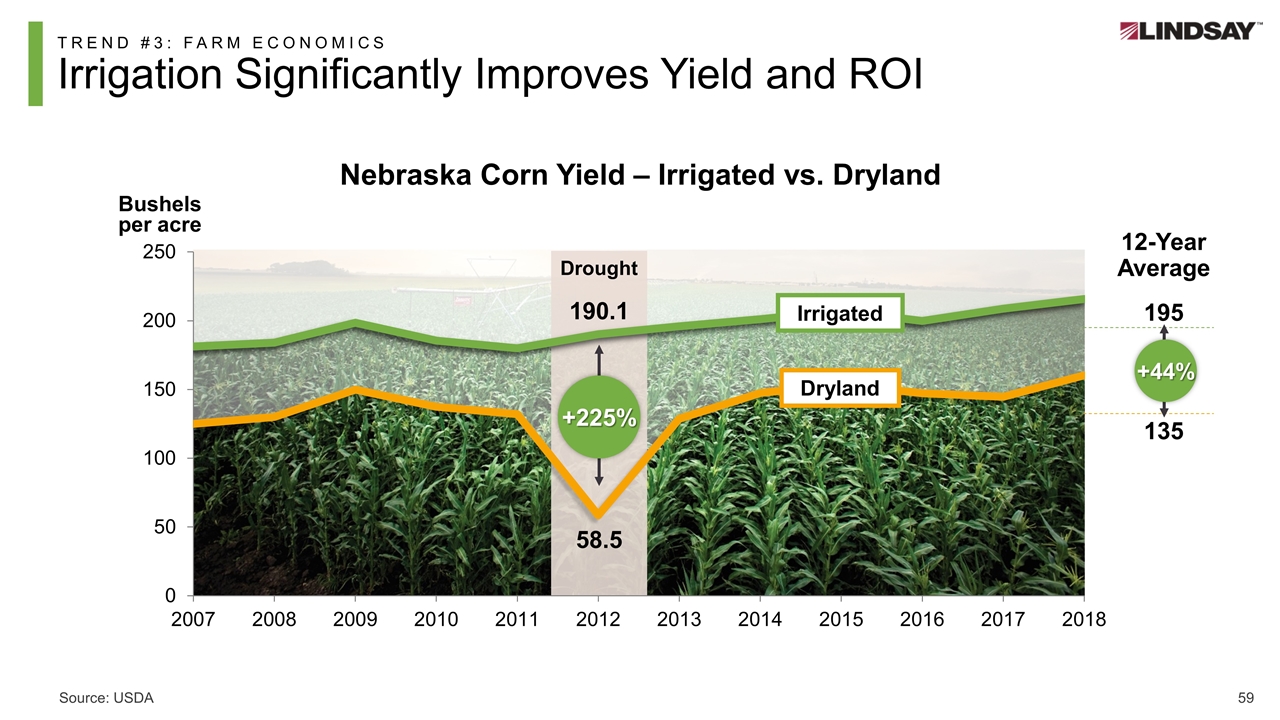
Source: USDA TREND #3: FARM ECONOMICS Irrigation Significantly Improves Yield and ROI 12-Year Average 195 135 190.1 58.5 Drought +225% +44% Irrigated Dryland Nebraska Corn Yield – Irrigated vs. Dryland Bushels per acre
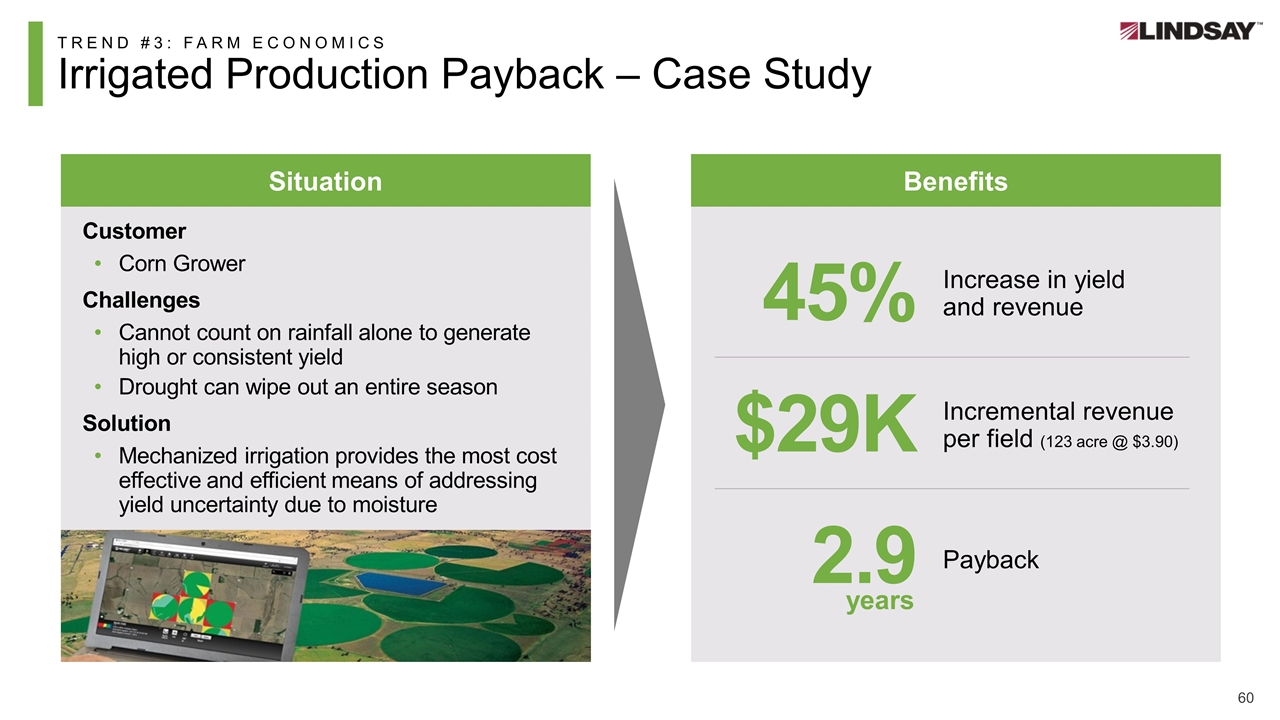
TREND #3: FARM ECONOMICS Irrigated Production Payback – Case Study Benefits 45% Situation Customer Corn Grower Challenges Cannot count on rainfall alone to generate high or consistent yield Drought can wipe out an entire season Solution Mechanized irrigation provides the most cost effective and efficient means of addressing yield uncertainty due to moisture Increase in yield and revenue $29K Incremental revenue per field (123 acre @ $3.90) 2.9 Payback years
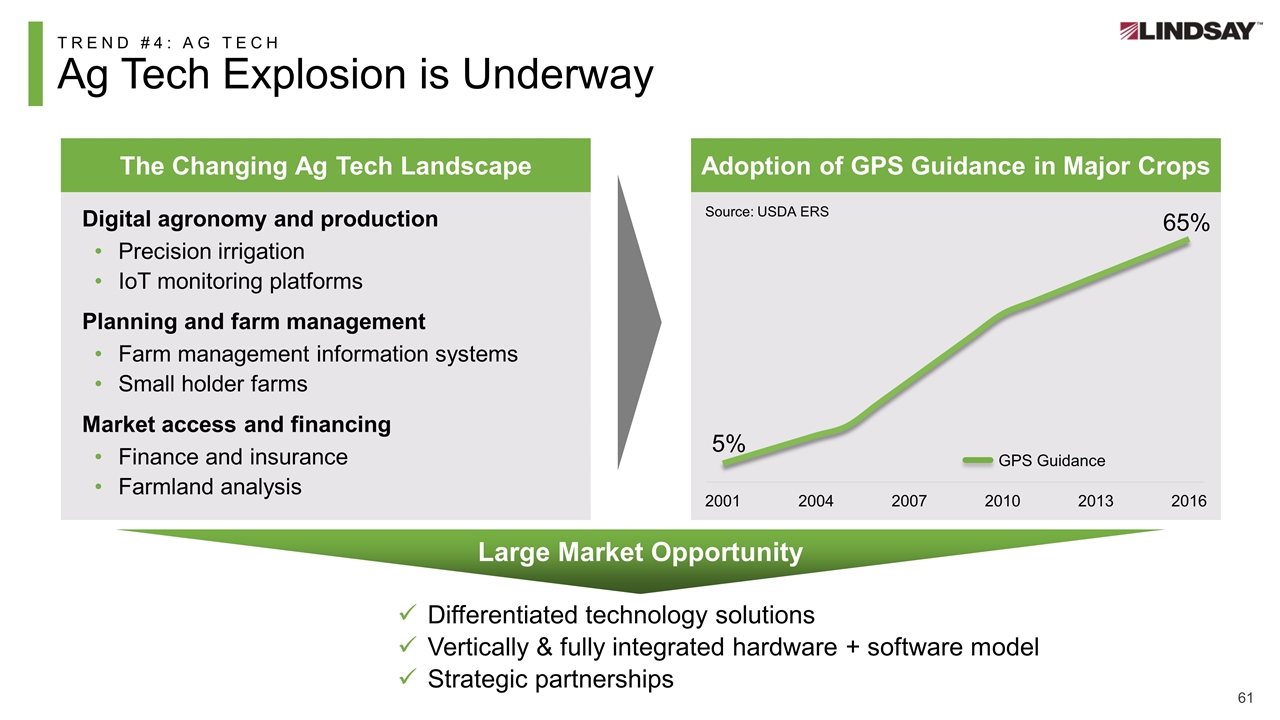
TREND #4: AG TECH Ag Tech Explosion is Underway The Changing Ag Tech Landscape Digital agronomy and production Precision irrigation IoT monitoring platforms Planning and farm management Farm management information systems Small holder farms Market access and financing Finance and insurance Farmland analysis Differentiated technology solutions Vertically & fully integrated hardware + software model Strategic partnerships Large Market Opportunity GPS Guidance 5% 65% Source: USDA ERS Adoption of GPS Guidance in Major Crops
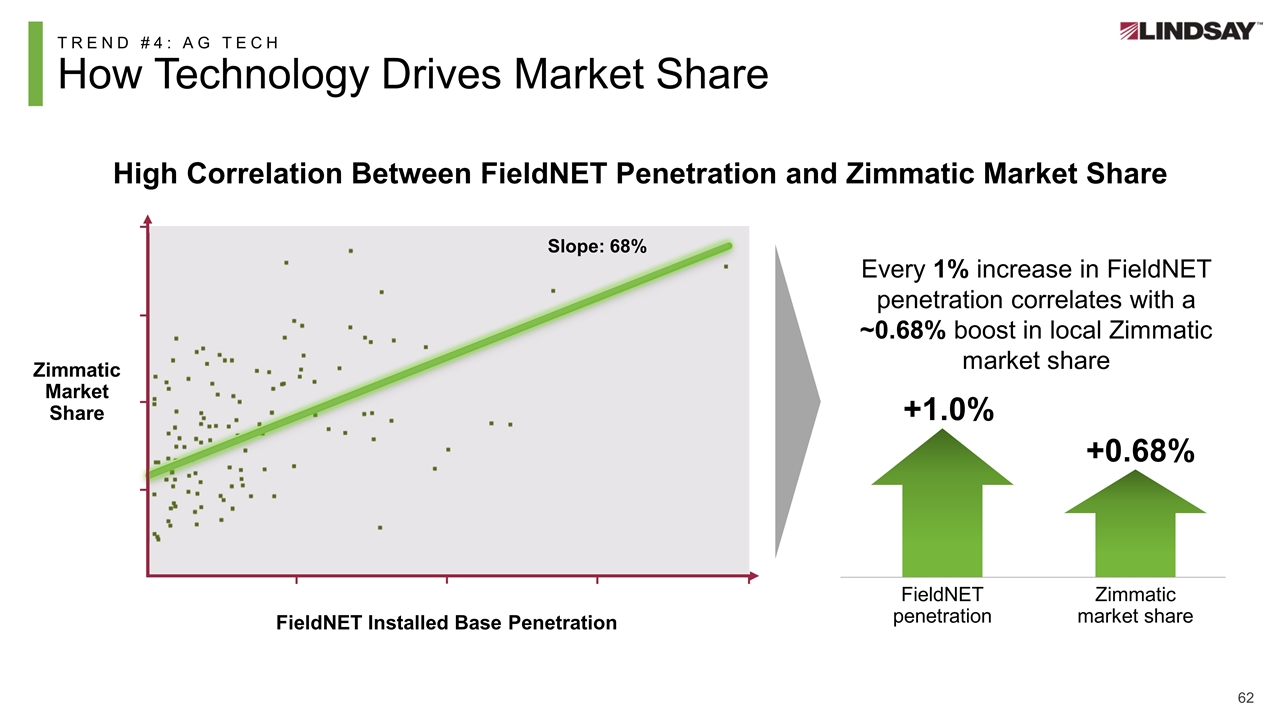
TREND #4: AG TECH How Technology Drives Market Share High Correlation Between FieldNET Penetration and Zimmatic Market Share Every 1% increase in FieldNET penetration correlates with a ~0.68% boost in local Zimmatic market share FieldNET penetration Zimmatic market share +1.0% +0.68% Zimmatic Market Share FieldNET Installed Base Penetration Slope: 68%
TREND #4: AG TECH Hear It Directly From Our Customers
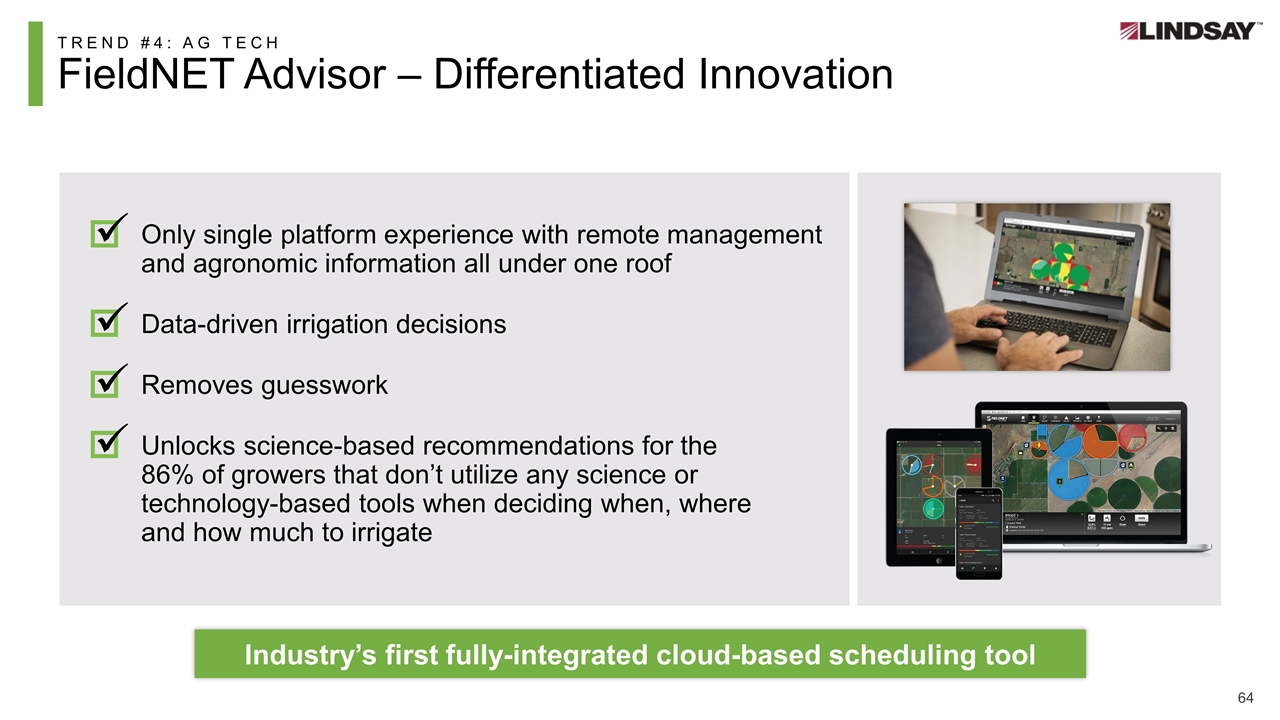
TREND #4: AG TECH FieldNET Advisor – Differentiated Innovation Only single platform experience with remote management and agronomic information all under one roof Data-driven irrigation decisions Removes guesswork Unlocks science-based recommendations for the 86% of growers that don’t utilize any science or technology-based tools when deciding when, where and how much to irrigate Industry’s first fully-integrated cloud-based scheduling tool
Agenda The business today – a differentiated platform Capitalizing on key megatrends Growth initiatives
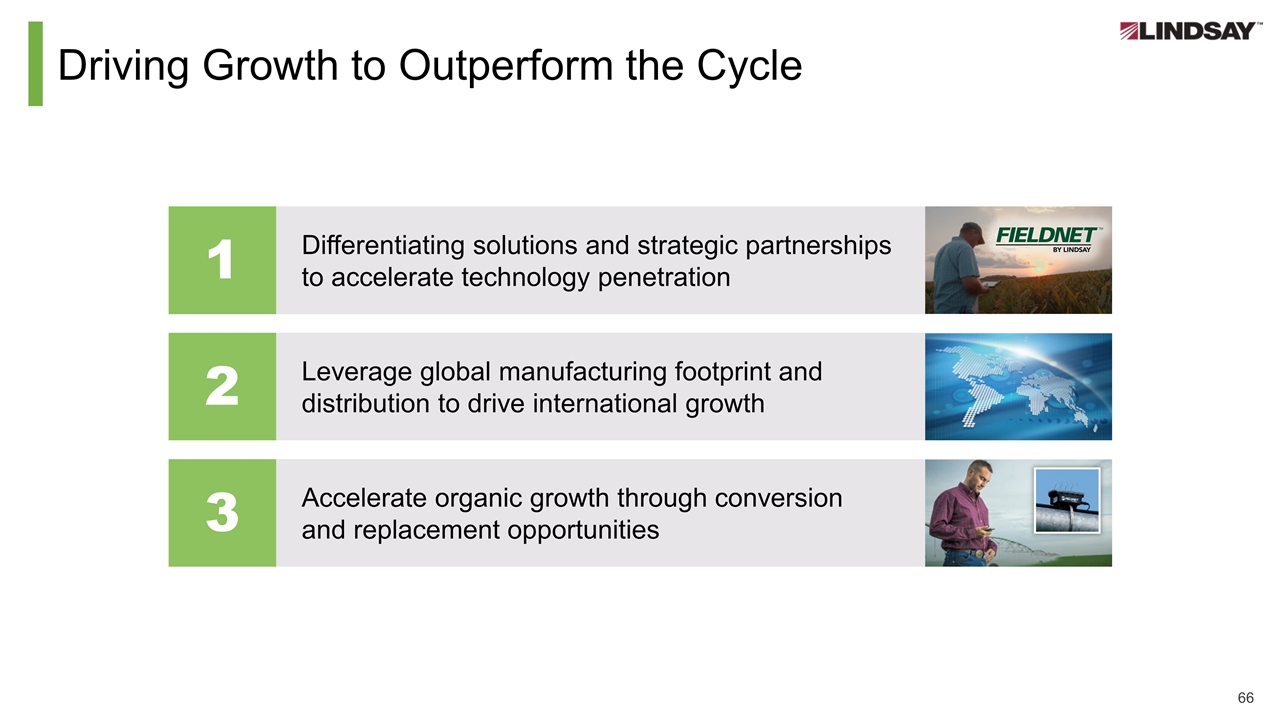
Driving Growth to Outperform the Cycle 1 Differentiating solutions and strategic partnerships to accelerate technology penetration 2 Leverage global manufacturing footprint and distribution to drive international growth 3 Accelerate organic growth through conversion and replacement opportunities
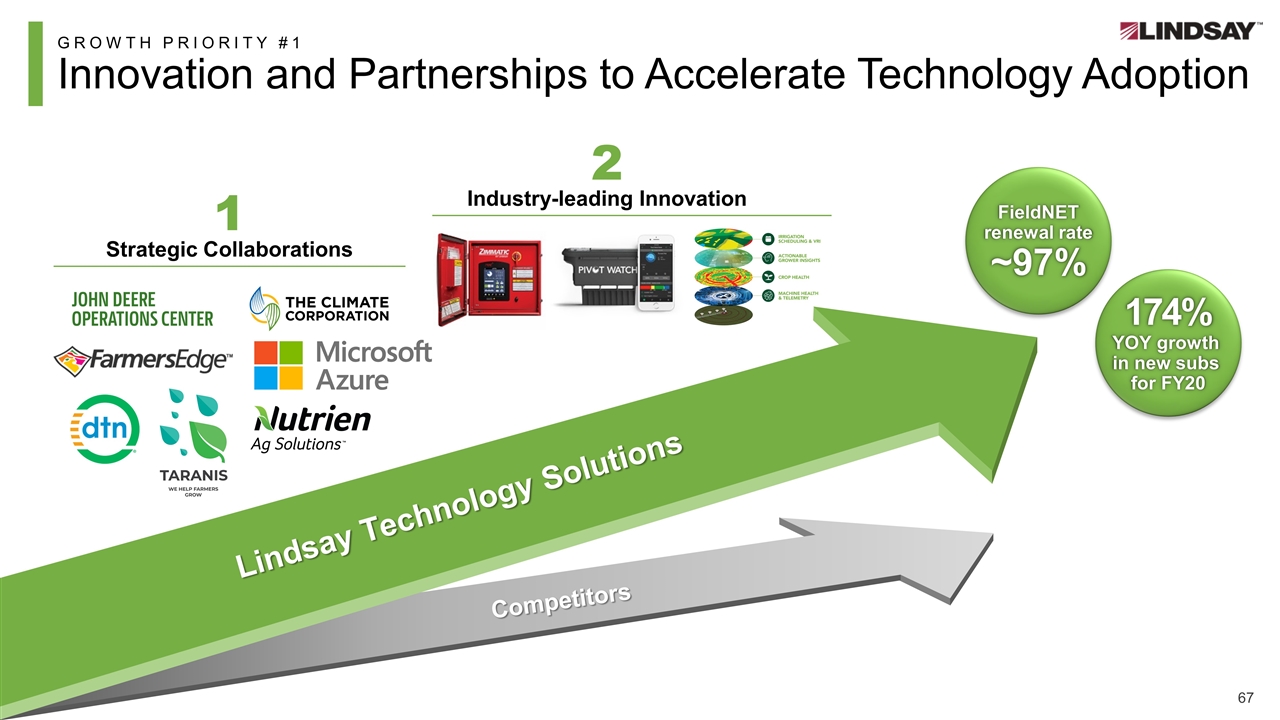
Competitors FieldNET renewal rate ~97% 1 Strategic Collaborations 2 Industry-leading Innovation GROWTH PRIORITY #1 Innovation and Partnerships to Accelerate Technology Adoption Lindsay Technology Solutions 174% YOY growth in new subs for FY20
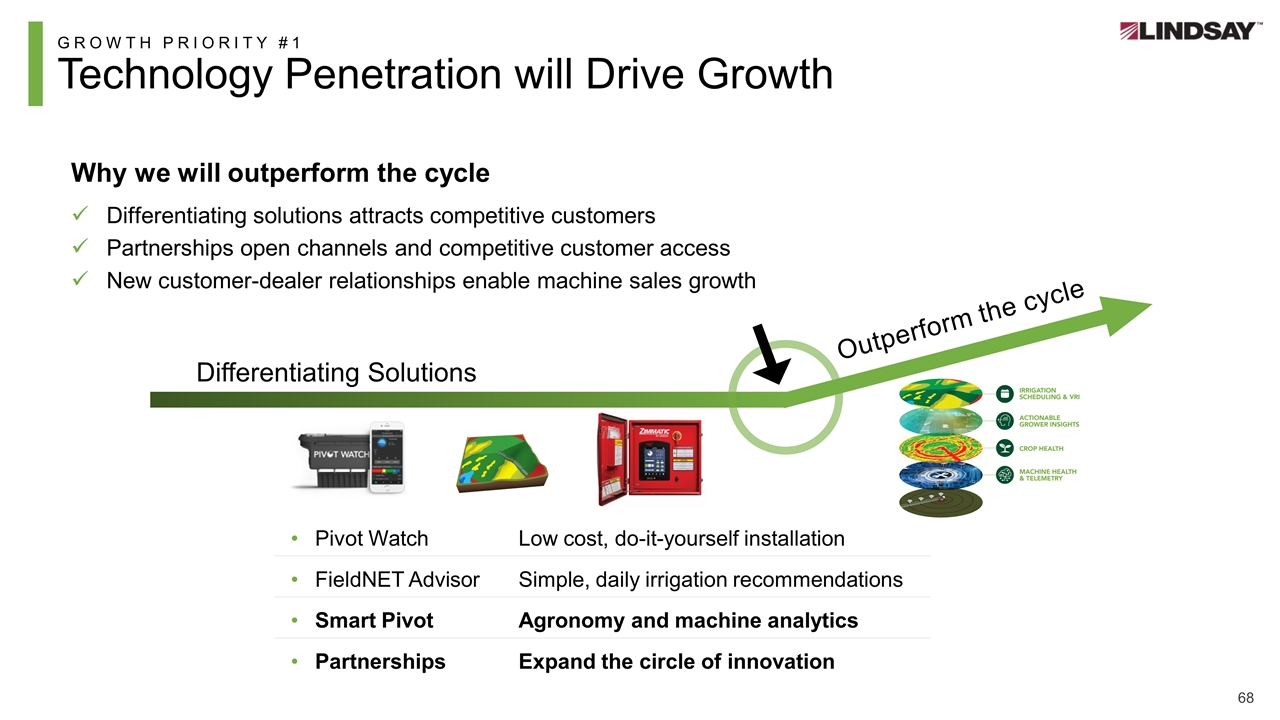
GROWTH PRIORITY #1 Technology Penetration will Drive Growth Differentiating Solutions Outperform the cycle Pivot WatchLow cost, do-it-yourself installation FieldNET AdvisorSimple, daily irrigation recommendations Smart PivotAgronomy and machine analytics PartnershipsExpand the circle of innovation Why we will outperform the cycle Differentiating solutions attracts competitive customers Partnerships open channels and competitive customer access New customer-dealer relationships enable machine sales growth

GROWTH PRIORITY #2 Leverage Global Manufacturing Footprint and Distribution: Global Mechanized Irrigation Market: $1.2B $200M S. America $320M EMEA $130M Asia Pacific $550M N. America Sales / Service Center Manufacturing Addressable Market by Region
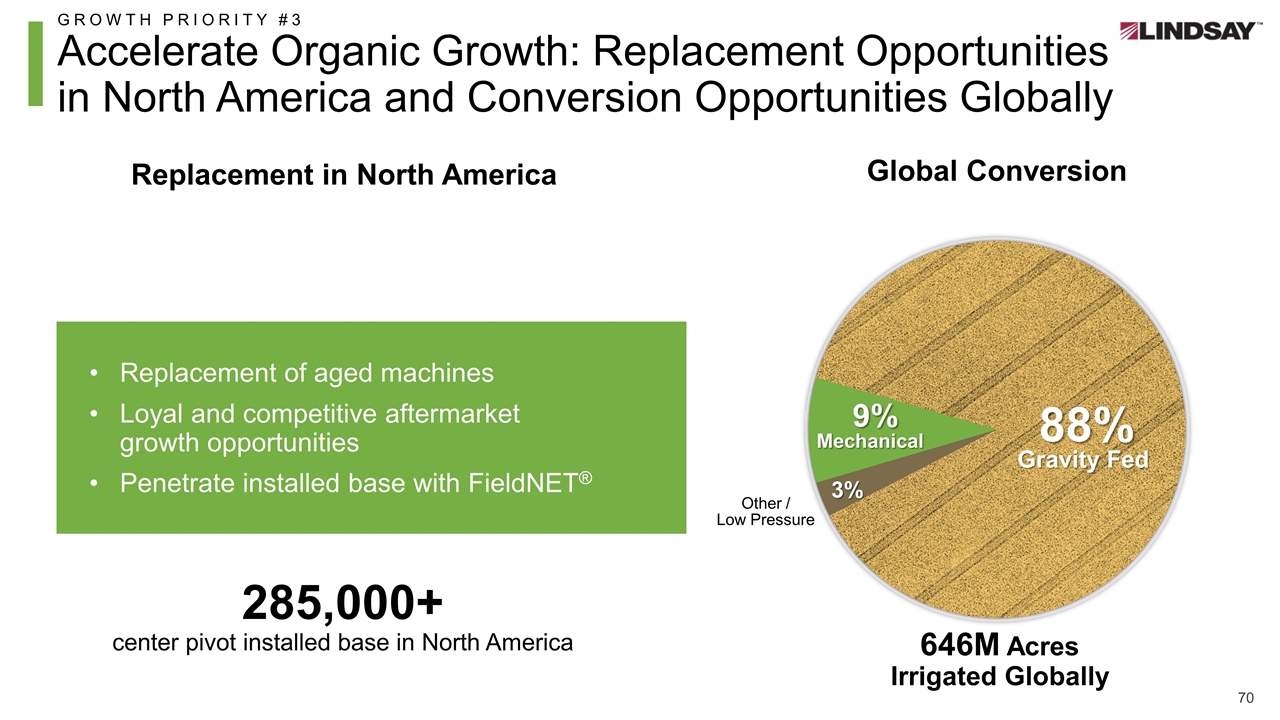
GROWTH PRIORITY #3 Accelerate Organic Growth: Replacement Opportunities in North America and Conversion Opportunities Globally Replacement in North America 3% Global Conversion 285,000+ center pivot installed base in North America 9% Mechanical Other / Low Pressure 88% Gravity Fed Replacement of aged machines Loyal and competitive aftermarket growth opportunities Penetrate installed base with FieldNET® 646M Acres Irrigated Globally
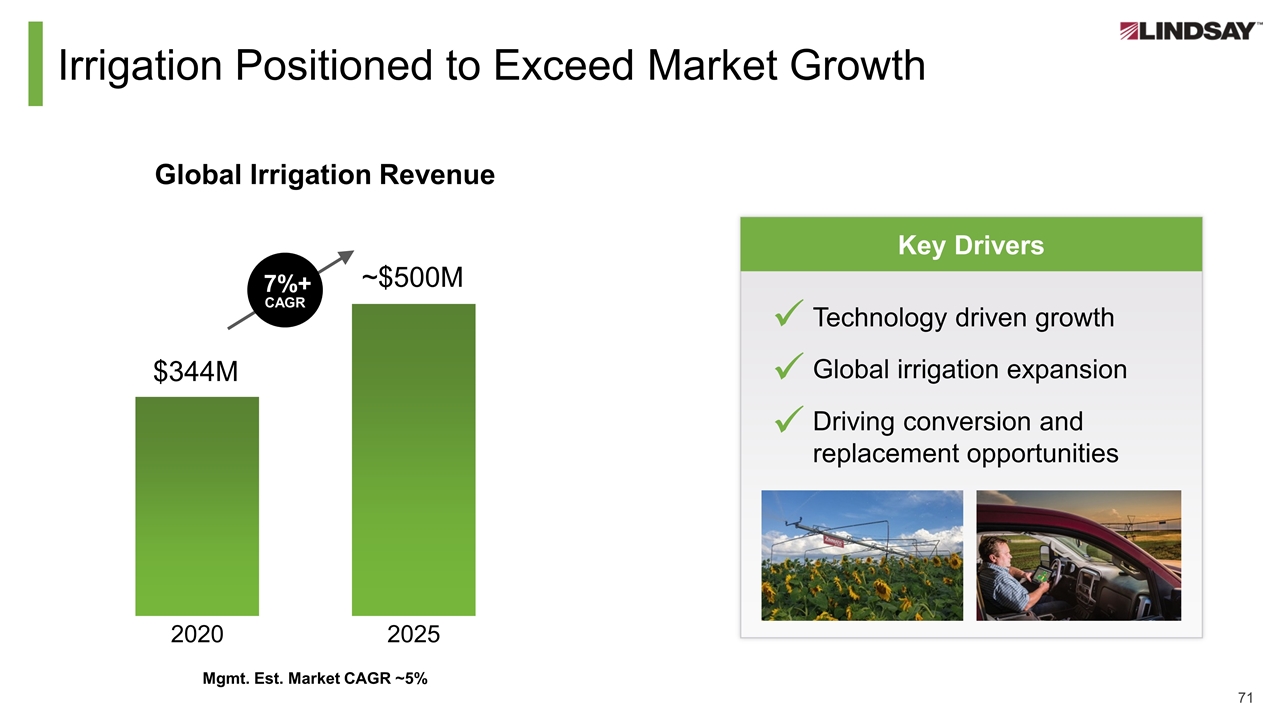
Key Drivers Irrigation Positioned to Exceed Market Growth Global Irrigation Revenue ~$500M Technology driven growth Global irrigation expansion Driving conversion and replacement opportunities $344M 7%+ CAGR ü ü ü Mgmt. Est. Market CAGR ~5%
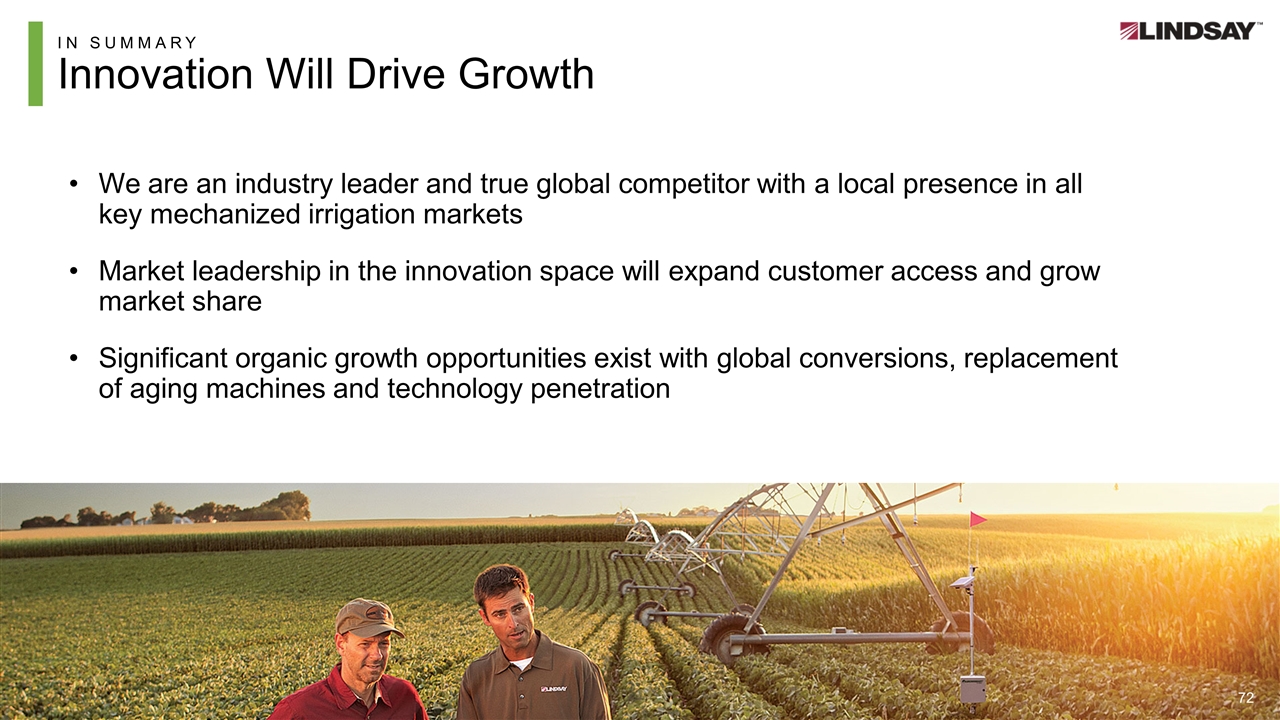
IN SUMMARY Innovation Will Drive Growth We are an industry leader and true global competitor with a local presence in all key mechanized irrigation markets Market leadership in the innovation space will expand customer access and grow market share Significant organic growth opportunities exist with global conversions, replacement of aging machines and technology penetration

Infrastructure – Leveraging Our Market Lead to Drive Growth Scott Marion, President
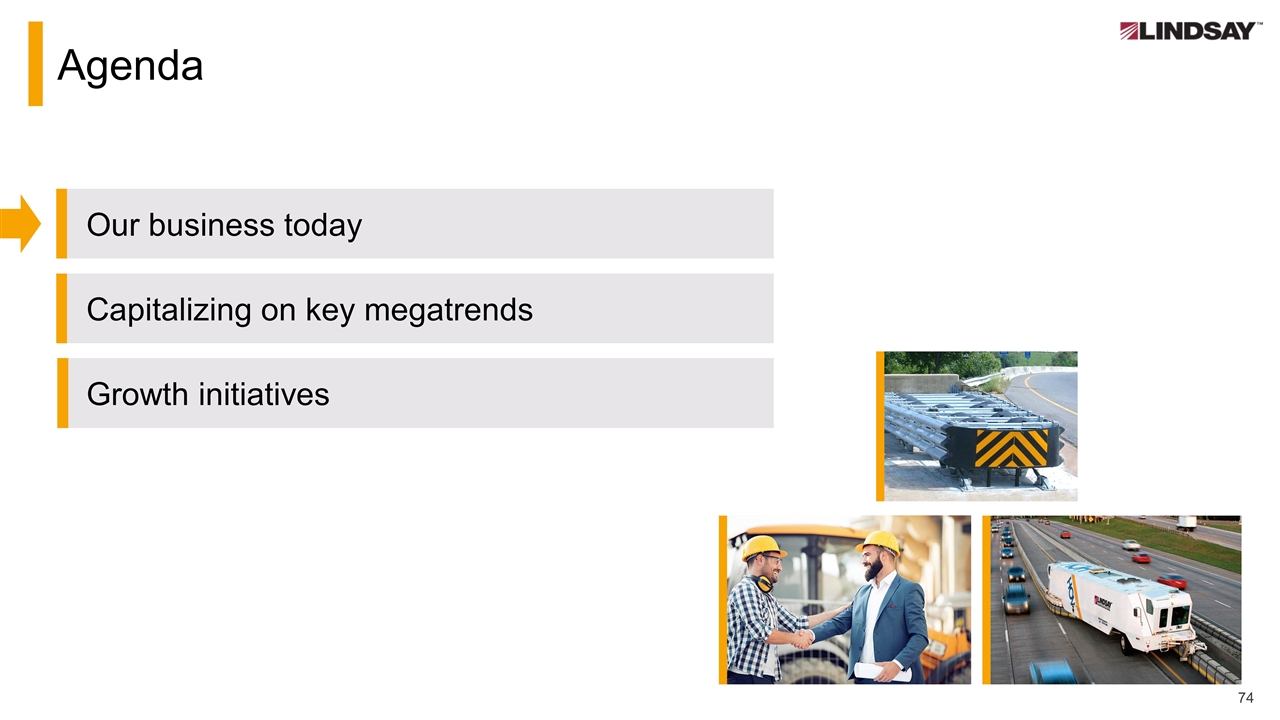
Agenda Our business today Growth initiatives Capitalizing on key megatrends
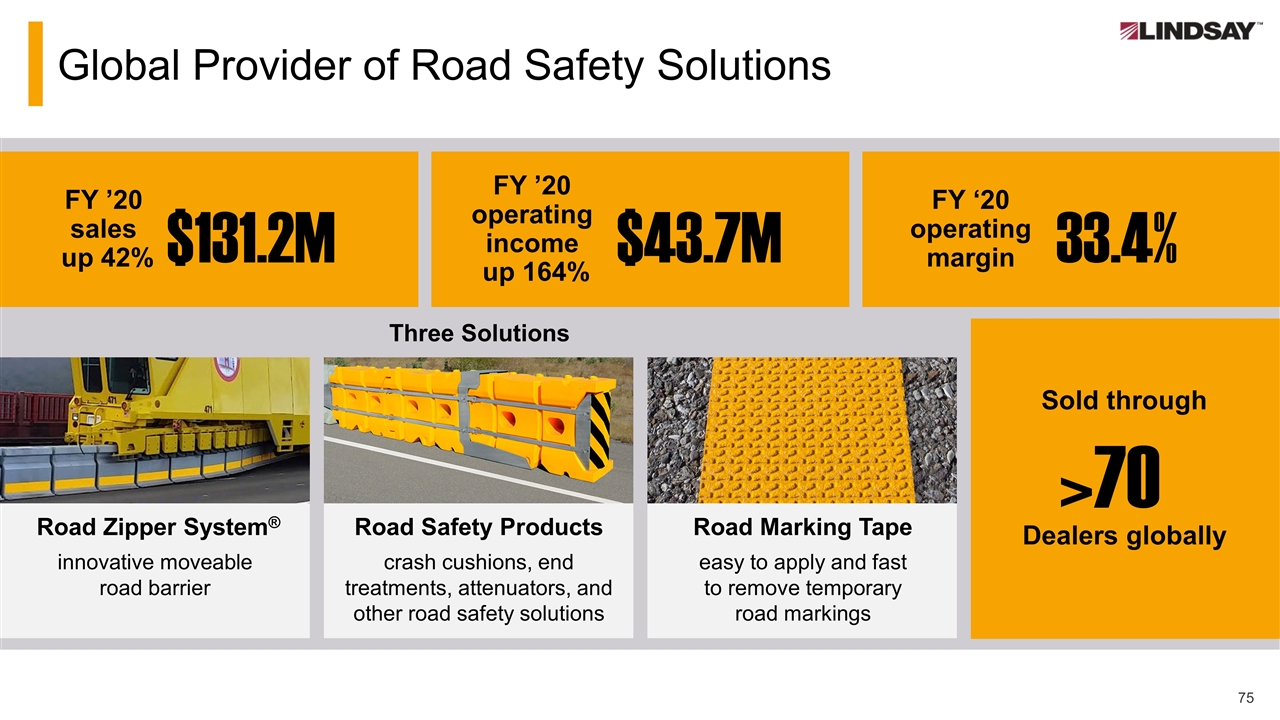
Global Provider of Road Safety Solutions Three Solutions $131.2M FY ’20 sales up 42% $43.7M FY ’20 operating income up 164% 33.4% FY ‘20 operating margin Road Zipper System® innovative moveable road barrier Road Safety Products crash cushions, end treatments, attenuators, and other road safety solutions Road Marking Tape easy to apply and fast to remove temporary road markings >70 Dealers globally Sold through
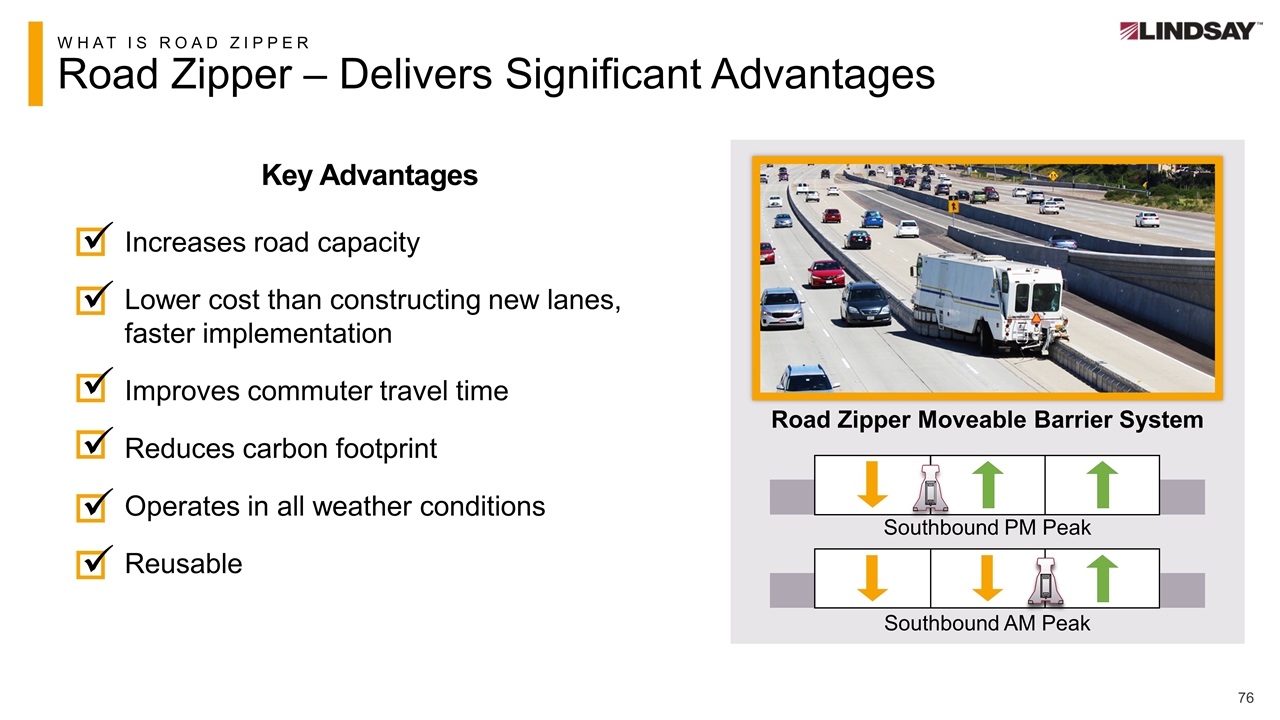
WHAT IS ROAD ZIPPER Road Zipper – Delivers Significant Advantages Increases road capacity Lower cost than constructing new lanes, faster implementation Improves commuter travel time Reduces carbon footprint Operates in all weather conditions Reusable ü ü ü ü ü ü Road Zipper Moveable Barrier System Key Advantages Southbound AM Peak Southbound PM Peak
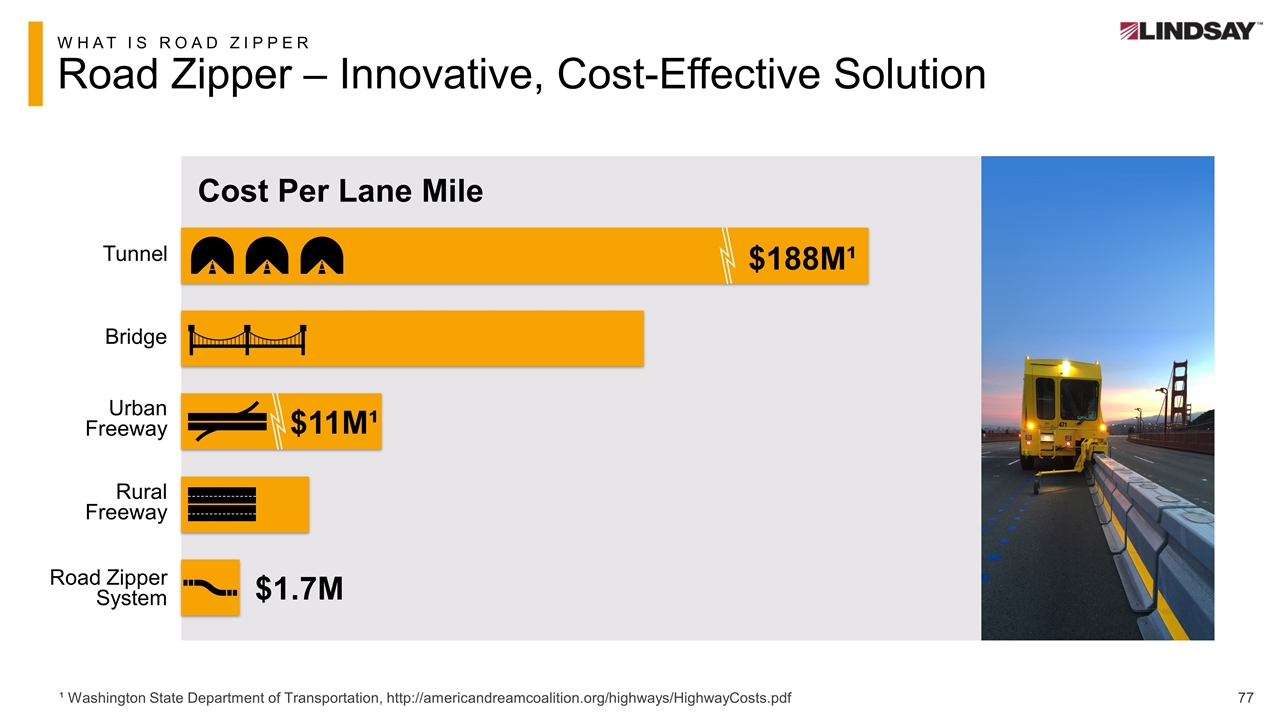
Cost Per Lane Mile WHAT IS ROAD ZIPPER Road Zipper – Innovative, Cost-Effective Solution Tunnel Bridge Urban Freeway Rural Freeway Road Zipper System ¹ Washington State Department of Transportation, http://americandreamcoalition.org/highways/HighwayCosts.pdf $188M¹ $1.7M $11M¹
Agenda Our business today Growth initiatives Capitalizing on key megatrends
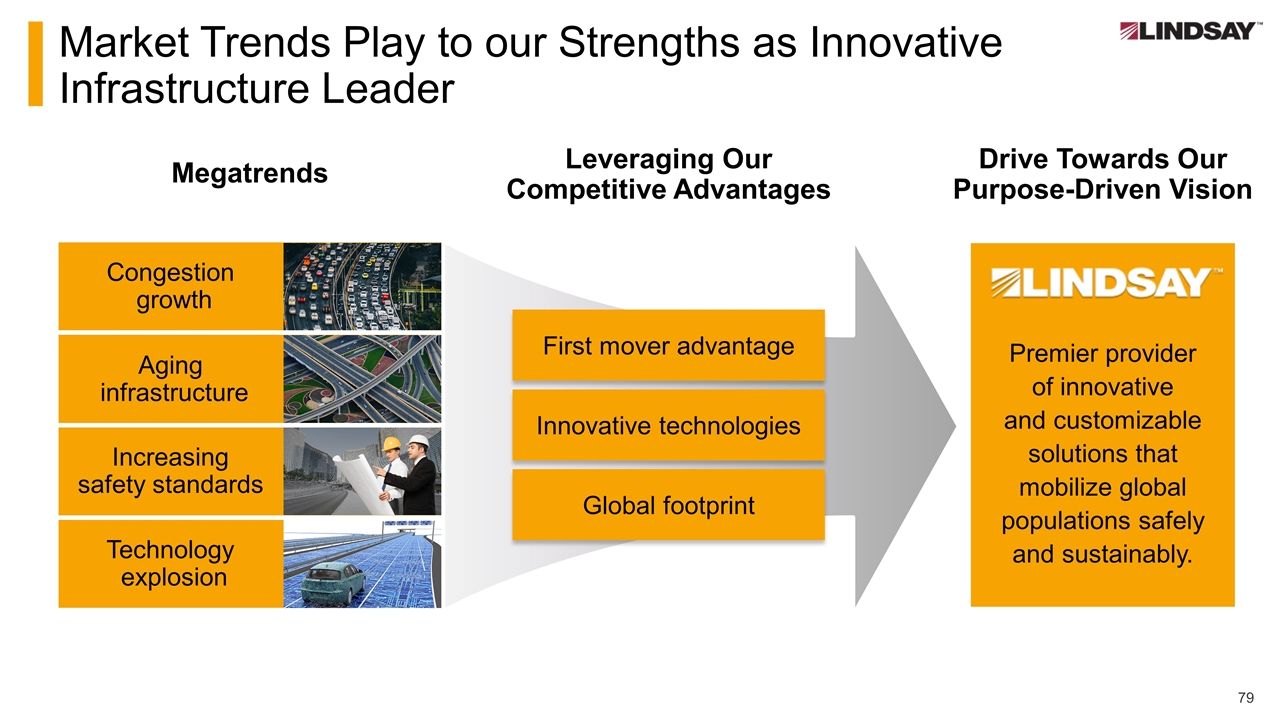
Market Trends Play to our Strengths as Innovative Infrastructure Leader Megatrends Premier provider of innovative and customizable solutions that mobilize global populations safely and sustainably. Congestion growth Aging infrastructure Increasing safety standards Technology explosion Leveraging Our Competitive Advantages First mover advantage Innovative technologies Global footprint Drive Towards Our Purpose-Driven Vision
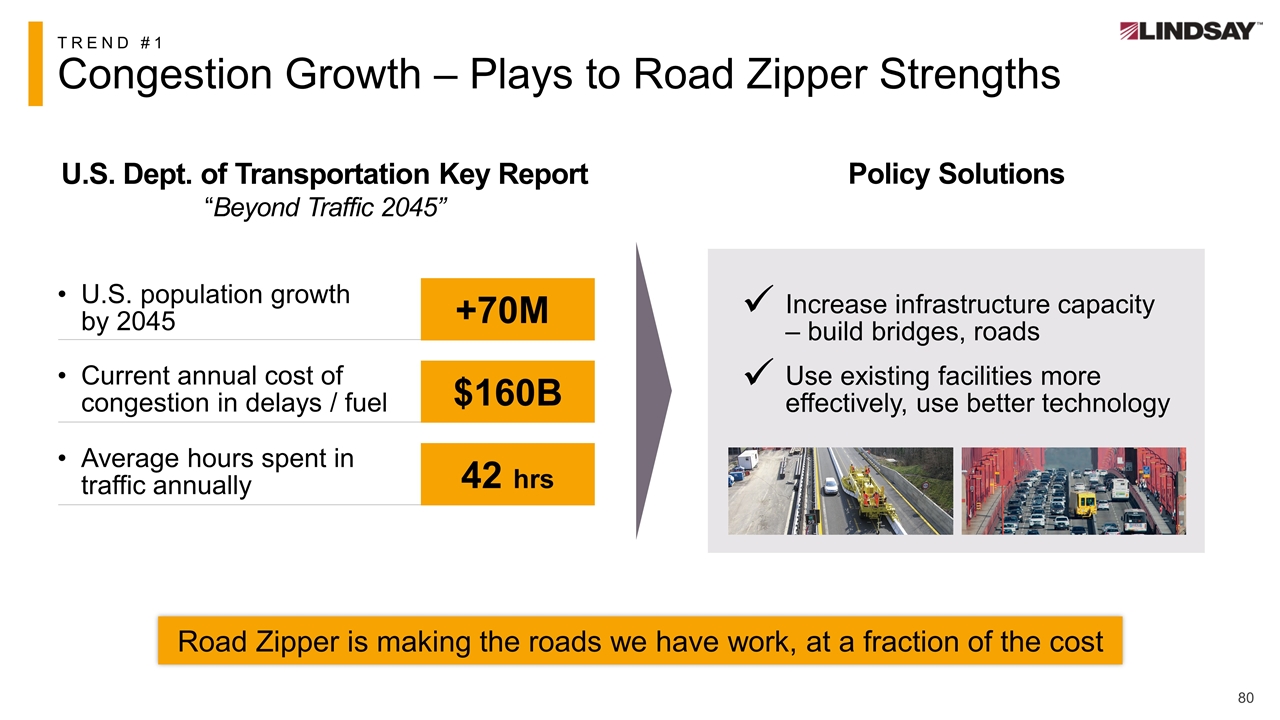
TREND #1 Congestion Growth – Plays to Road Zipper Strengths U.S. Dept. of Transportation Key Report “Beyond Traffic 2045” U.S. population growth by 2045 Current annual cost of congestion in delays / fuel Average hours spent in traffic annually Policy Solutions Increase infrastructure capacity – build bridges, roads Use existing facilities more effectively, use better technology Road Zipper is making the roads we have work, at a fraction of the cost +70M $160B 42 hrs ü ü
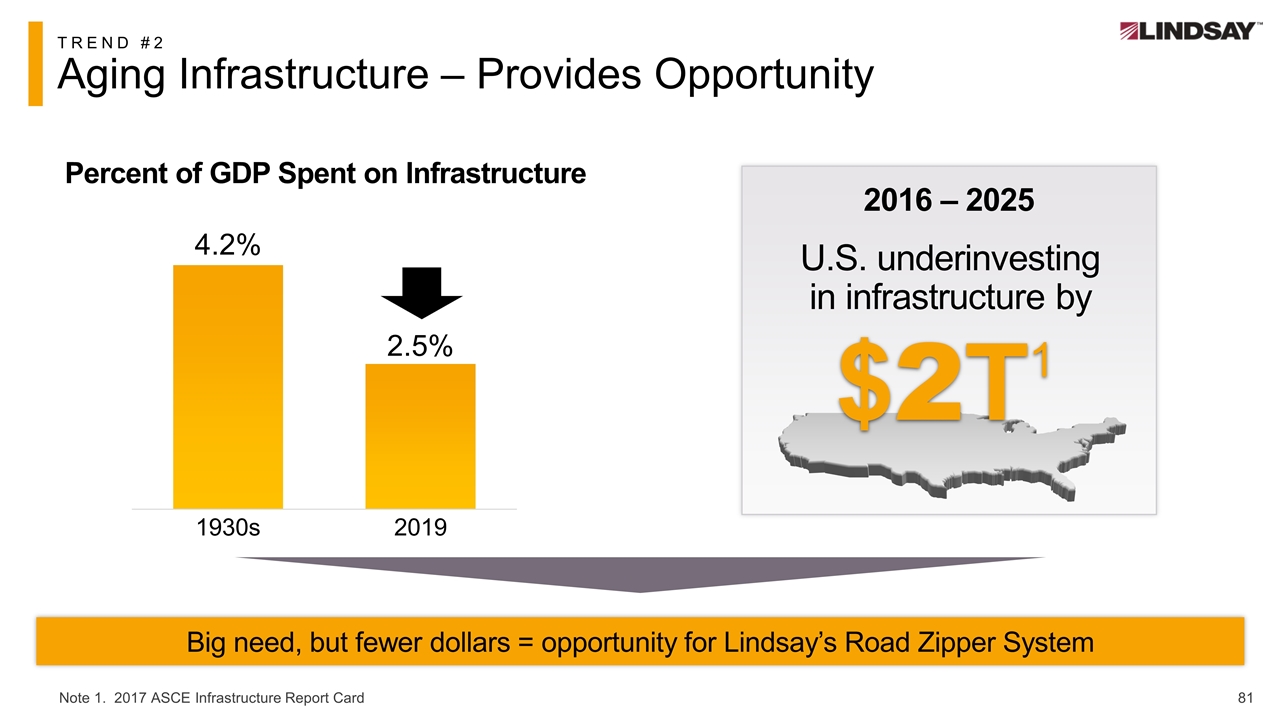
TREND #2 Aging Infrastructure – Provides Opportunity Percent of GDP Spent on Infrastructure Note 1. 2017 ASCE Infrastructure Report Card 2016 – 2025 U.S. underinvesting in infrastructure by $2T1 Big need, but fewer dollars = opportunity for Lindsay’s Road Zipper System
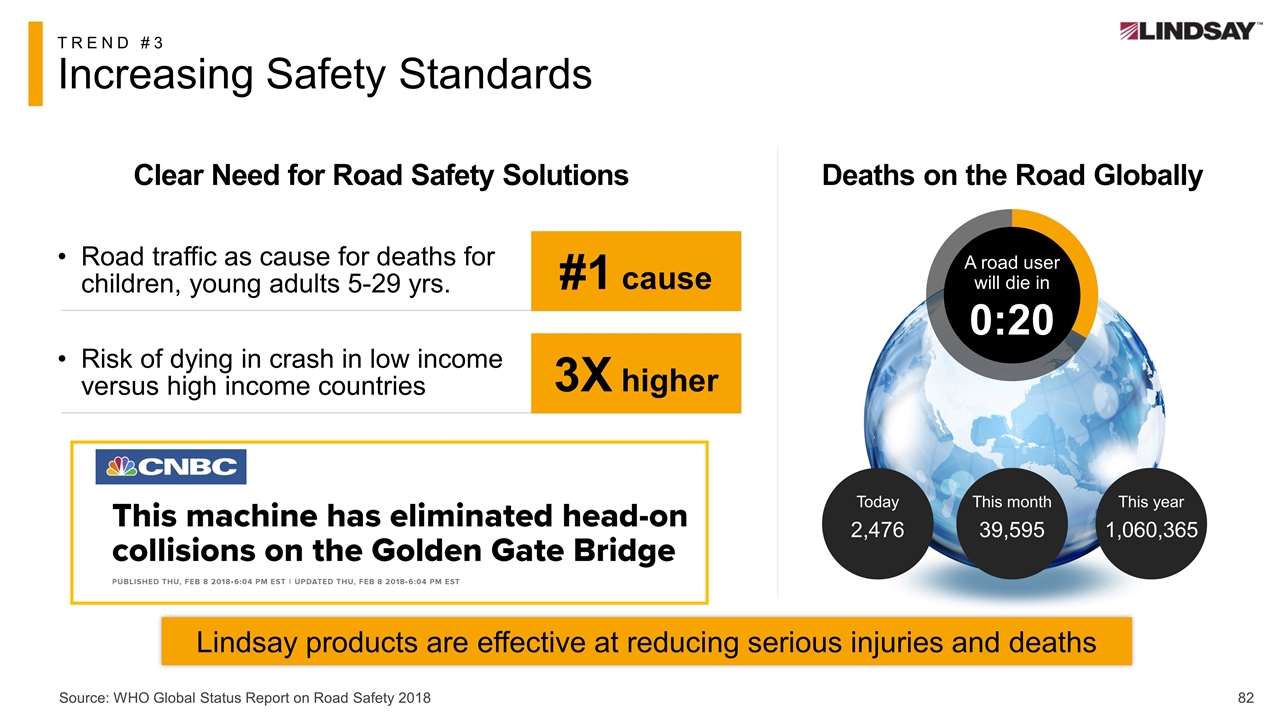
82 TREND #3 Increasing Safety Standards Deaths on the Road Globally Road traffic as cause for deaths for children, young adults 5-29 yrs. Risk of dying in crash in low income versus high income countries #1 cause 3X higher Clear Need for Road Safety Solutions A road user will die in 0:20 Today 2,476 This month 39,595 This year 1,060,365 Source: WHO Global Status Report on Road Safety 2018 Lindsay products are effective at reducing serious injuries and deaths
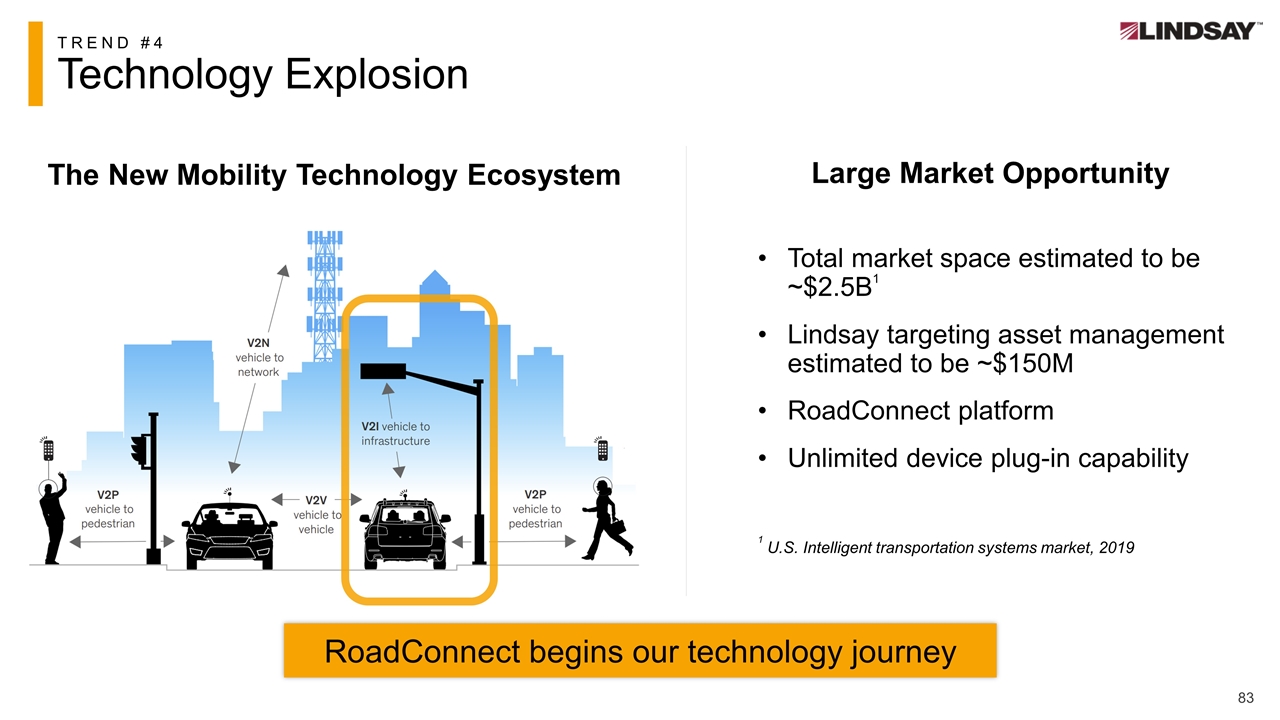
83 TREND #4 Technology Explosion Total market space estimated to be ~$2.5B1 Lindsay targeting asset management estimated to be ~$150M RoadConnect platform Unlimited device plug-in capability 1 U.S. Intelligent transportation systems market, 2019 The New Mobility Technology Ecosystem Large Market Opportunity RoadConnect begins our technology journey

Agenda Our business today Growth initiatives Capitalizing on key megatrends
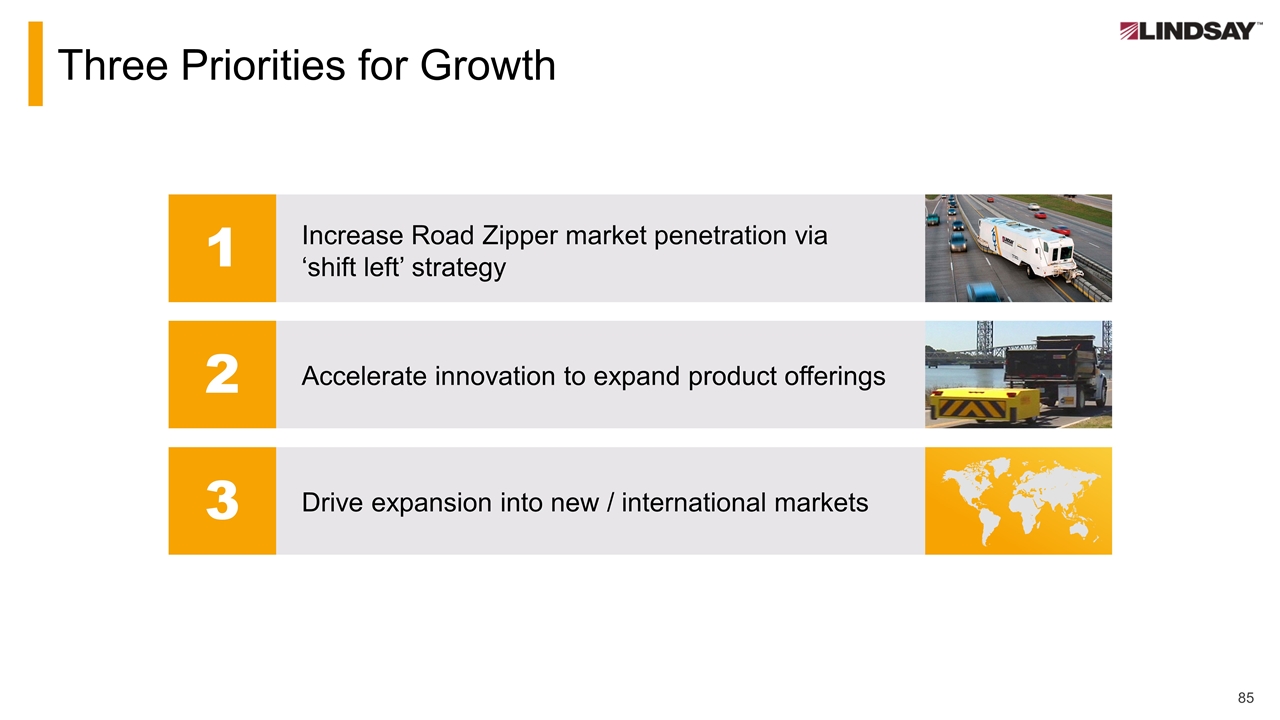
Three Priorities for Growth 1 Increase Road Zipper market penetration via ‘shift left’ strategy 2 Accelerate innovation to expand product offerings 3 Drive expansion into new / international markets
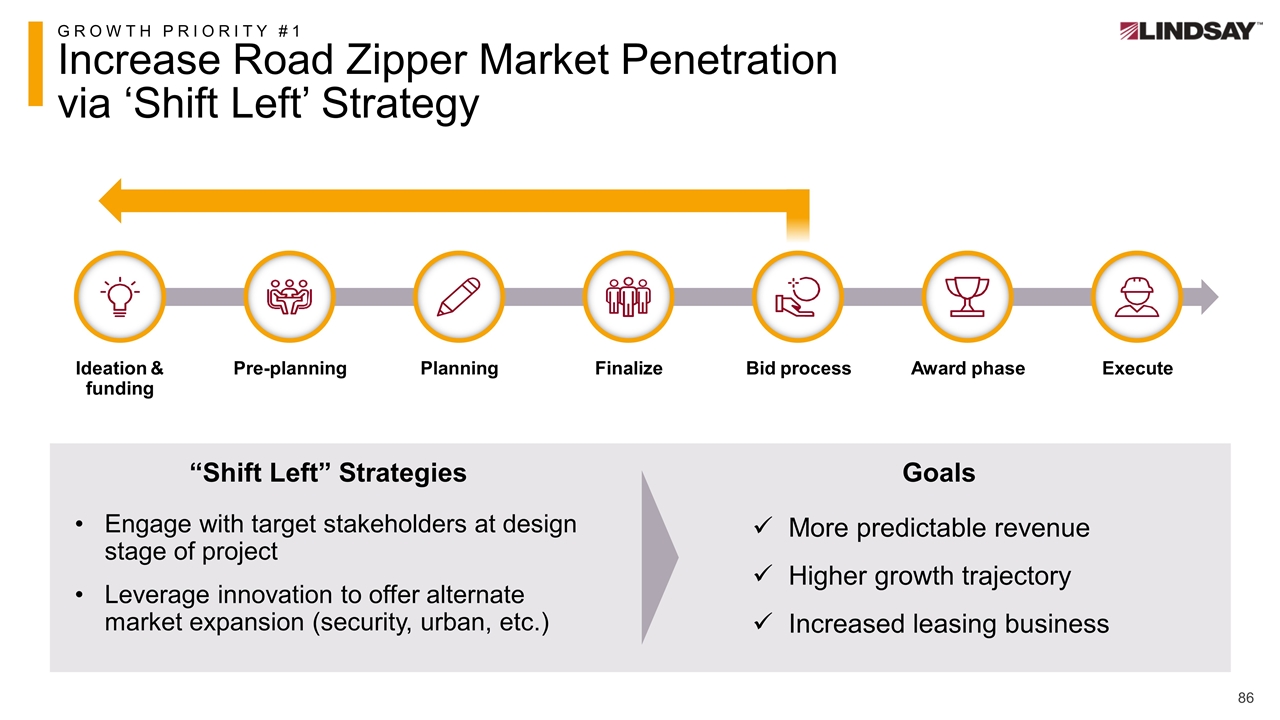
GROWTH PRIORITY #1 Increase Road Zipper Market Penetration via ‘Shift Left’ Strategy Engage with target stakeholders at design stage of project Leverage innovation to offer alternate market expansion (security, urban, etc.) “Shift Left” Strategies Goals More predictable revenue Higher growth trajectory Increased leasing business Pre-planning Planning Finalize Award phase Ideation & funding Bid process Execute
GROWTH PRIORITY #1 Customer-First Innovation – Case Study: Highways England UK is set to exit the EU on 12/31/20 Exit will impact travel to and from the EU Current motorway configuration estimated to cause hours of delays The Road Zipper System was deemed to be the best solution to minimize the disruption Preferred solution to solve a global problem
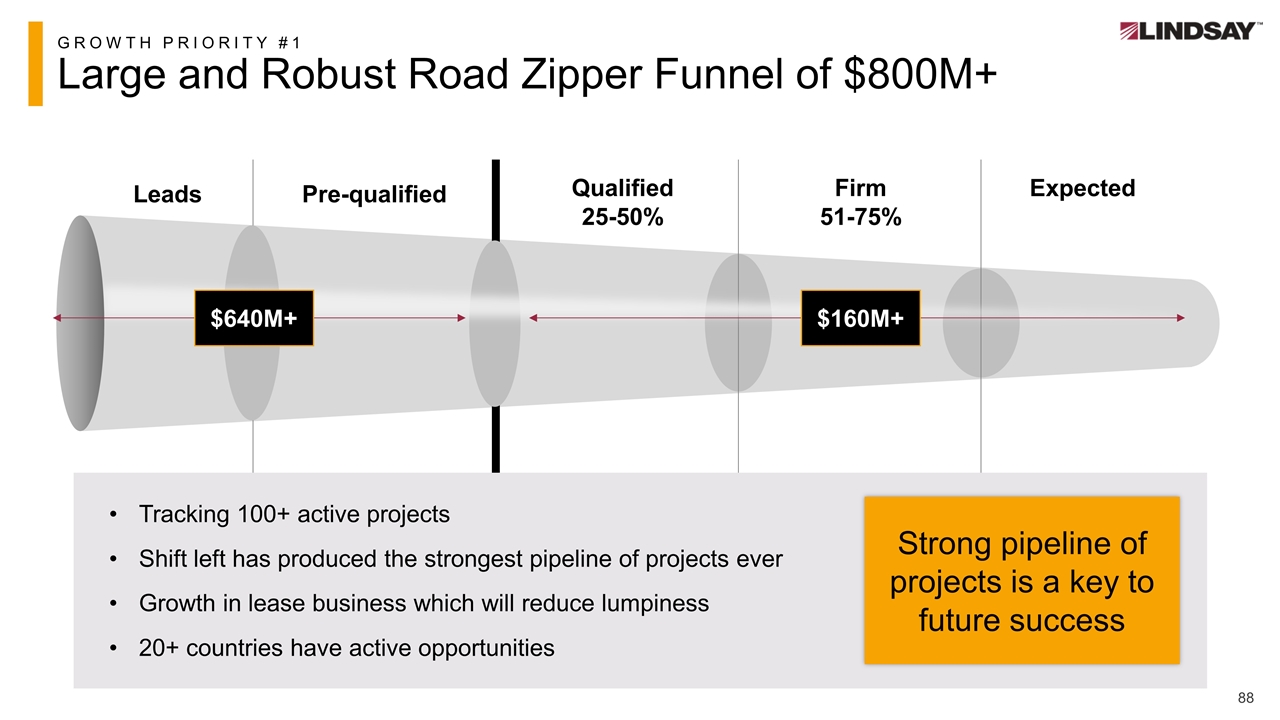
GROWTH PRIORITY #1 Large and Robust Road Zipper Funnel of $800M+ Pre-qualified Leads Expected Tracking 100+ active projects Shift left has produced the strongest pipeline of projects ever Growth in lease business which will reduce lumpiness 20+ countries have active opportunities Strong pipeline of projects is a key to future success $160M+ $640M+ Qualified 25-50% Firm 51-75%
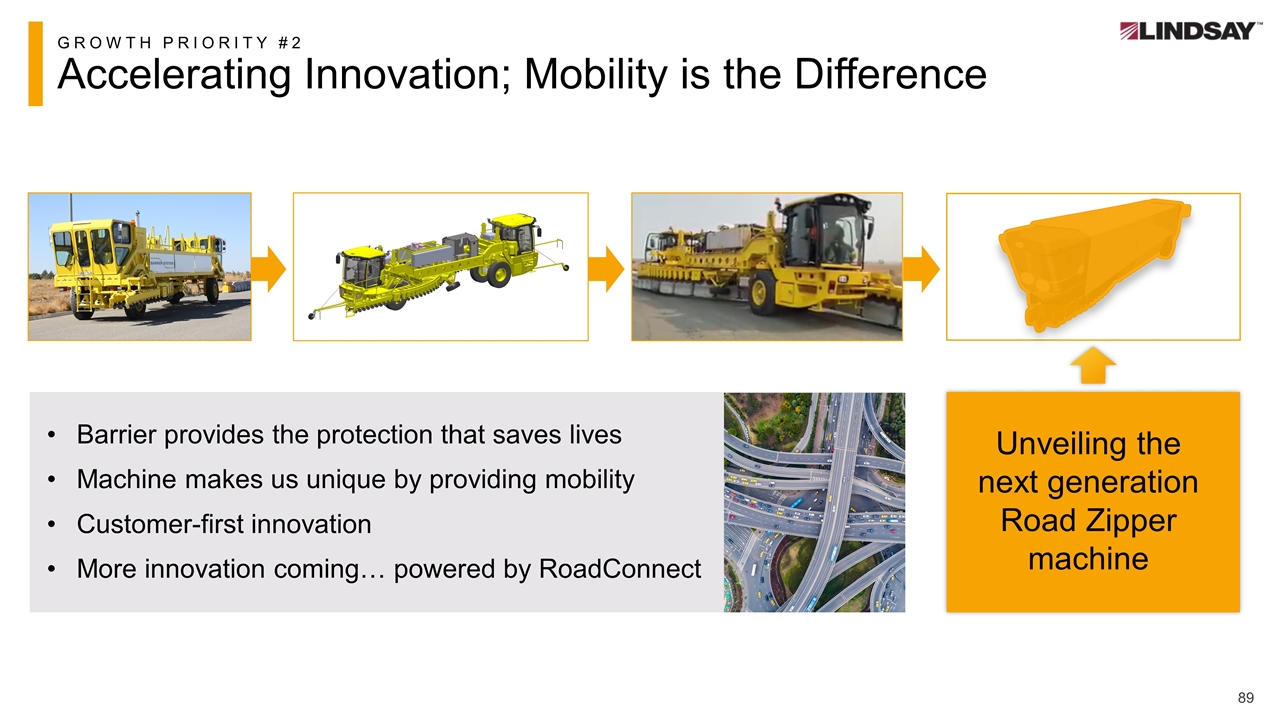
GROWTH PRIORITY #2 Accelerating Innovation; Mobility is the Difference Barrier provides the protection that saves lives Machine makes us unique by providing mobility Customer-first innovation More innovation coming… powered by RoadConnect Unveiling the next generation Road Zipper machine

GROWTH PRIORITY #2 Regulatory Change Sparks Innovation Contractor inspired innovation with new products Customer-first innovation success U.S. road safety standards updated Required updating product portfolio
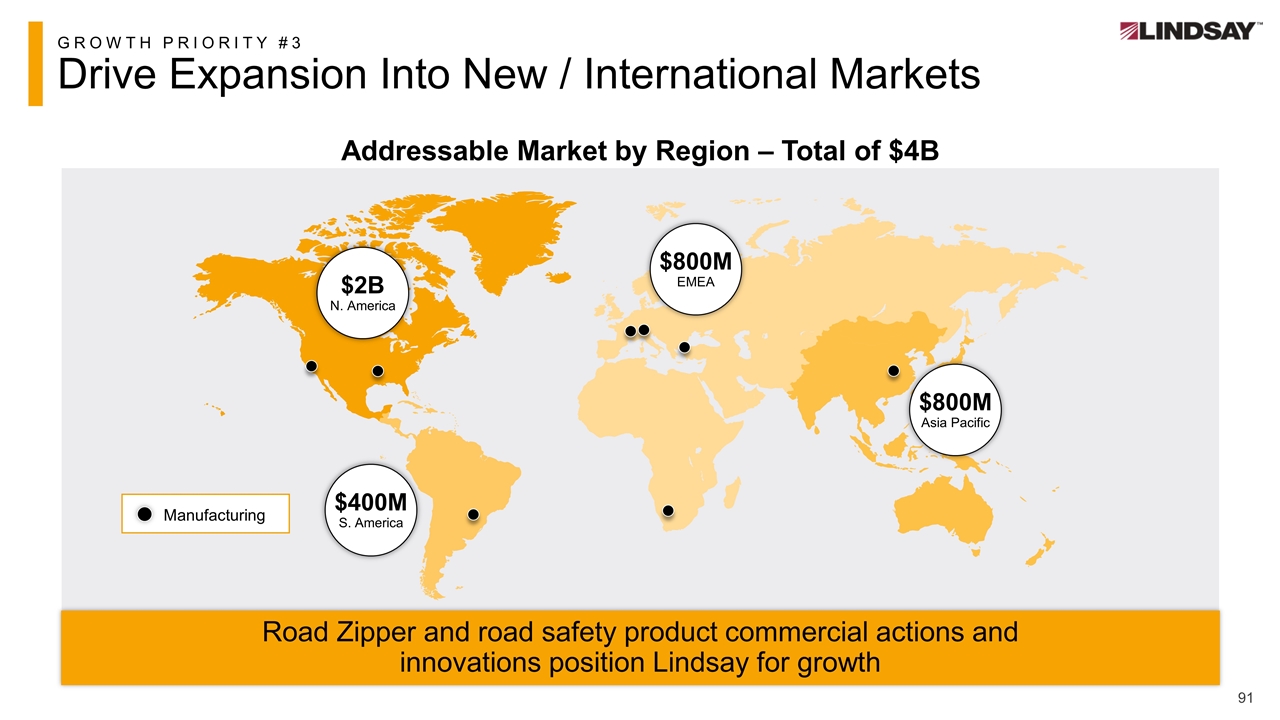
GROWTH PRIORITY #3 Drive Expansion Into New / International Markets Manufacturing $400M S. America $800M EMEA $800M Asia Pacific $2B N. America Road Zipper and road safety product commercial actions and innovations position Lindsay for growth Addressable Market by Region – Total of $4B
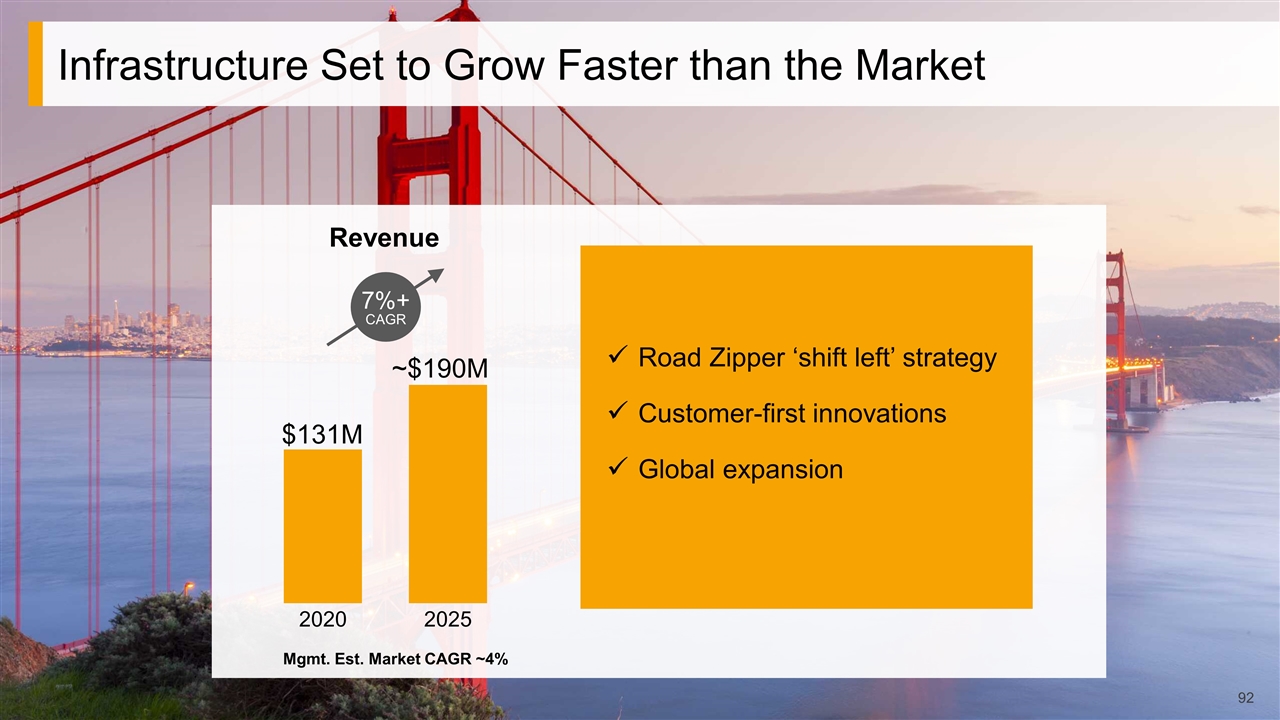
Infrastructure Set to Grow Faster than the Market $131M ~$190M Revenue Road Zipper ‘shift left’ strategy Customer-first innovations Global expansion 7%+ CAGR Mgmt. Est. Market CAGR ~4%
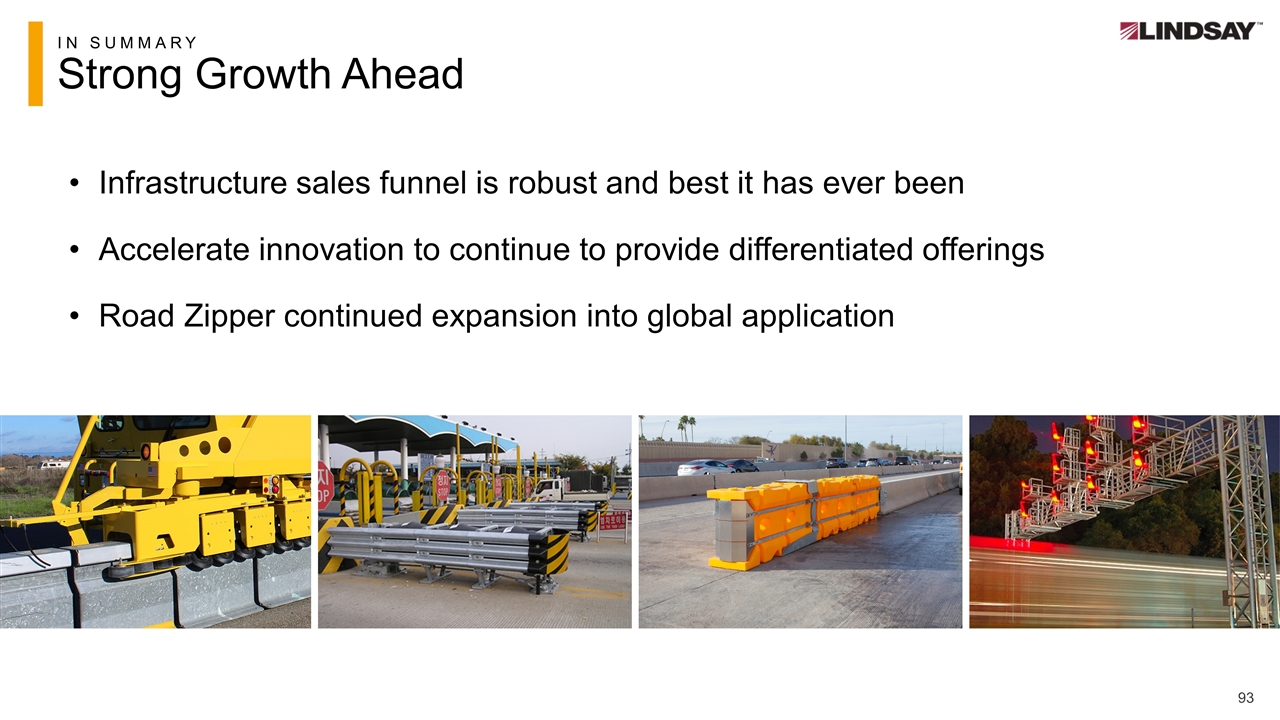
IN SUMMARY Strong Growth Ahead Infrastructure sales funnel is robust and best it has ever been Accelerate innovation to continue to provide differentiated offerings Road Zipper continued expansion into global application

Financial Overview Brian Ketcham, SVP & CFO
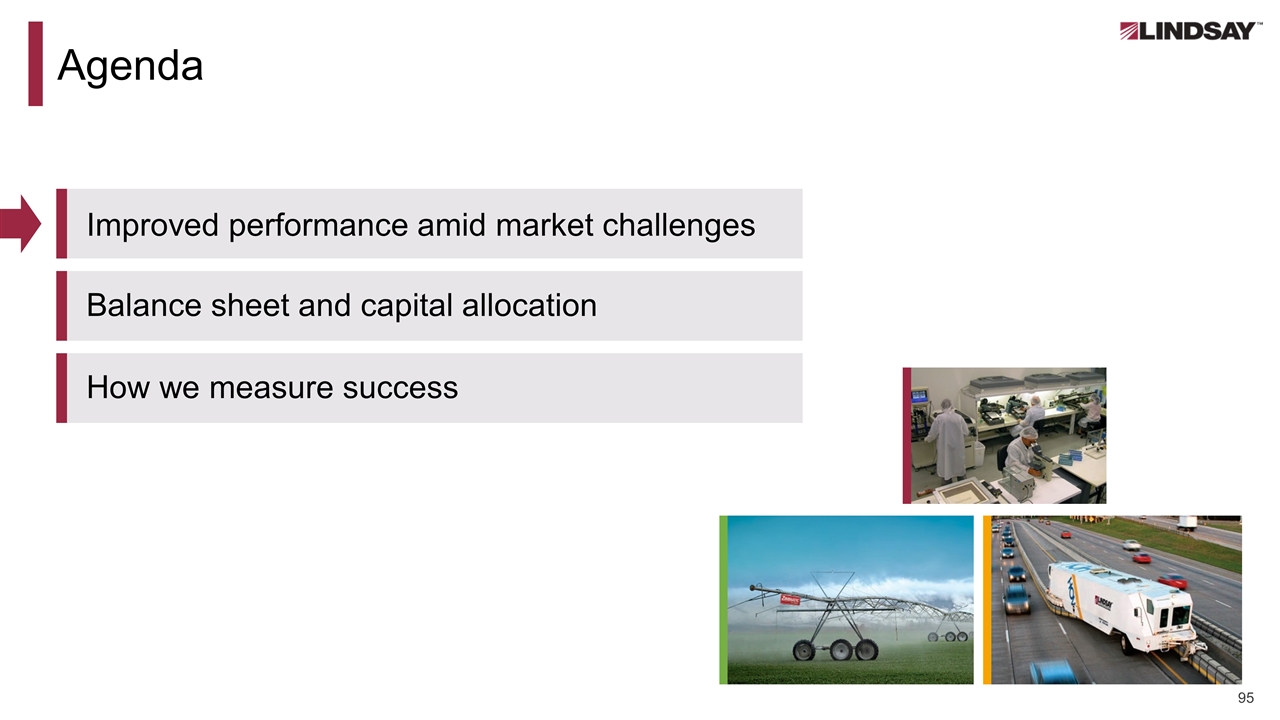
Agenda Improved performance amid market challenges Balance sheet and capital allocation How we measure success
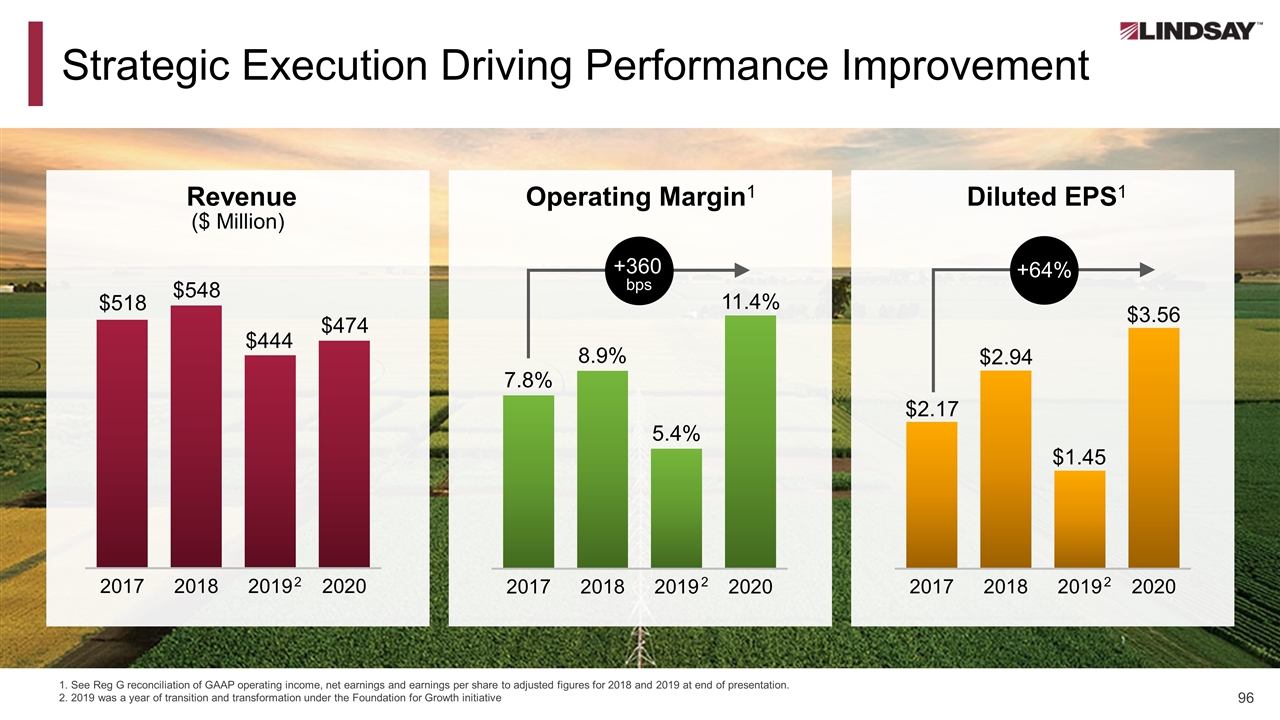
Strategic Execution Driving Performance Improvement Revenue ($ Million) Operating Margin1 Diluted EPS1 2 2 2 1. See Reg G reconciliation of GAAP operating income, net earnings and earnings per share to adjusted figures for 2018 and 2019 at end of presentation. 2. 2019 was a year of transition and transformation under the Foundation for Growth initiative +360 bps +64%
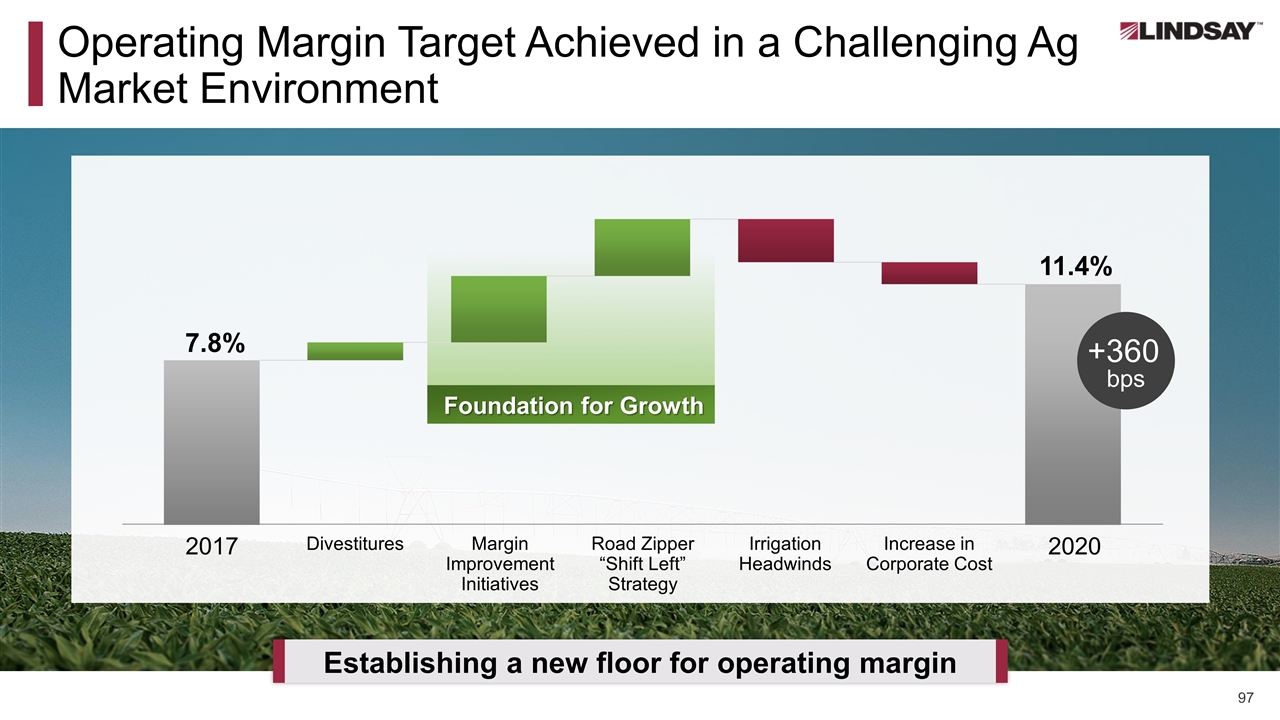
Operating Margin Target Achieved in a Challenging Ag Market Environment Establishing a new floor for operating margin Foundation for Growth 2017 2020 Divestitures Margin Improvement Initiatives Road Zipper “Shift Left” Strategy Irrigation Headwinds Increase in Corporate Cost 11.4% 7.8% +360 bps
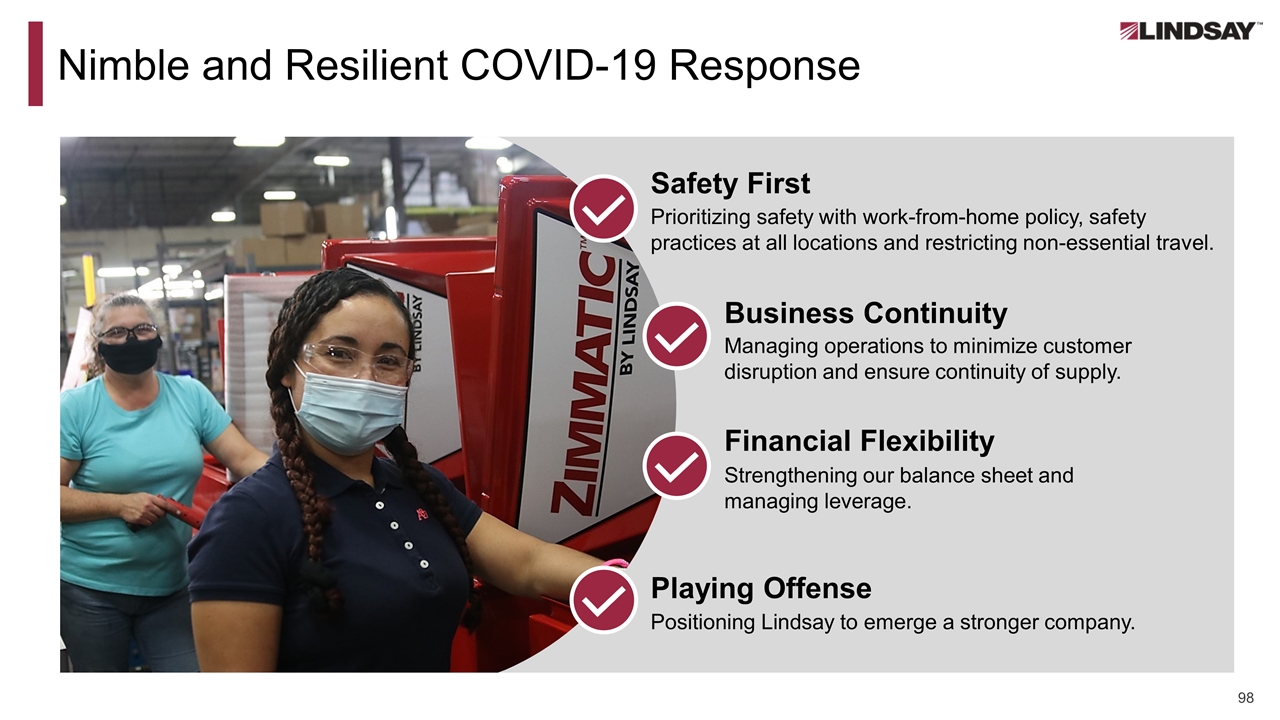
Resilient and Nimble COVID-19 Response Financial Flexibility Strengthening our balance sheet and managing leverage. Managing operations to minimize customer disruption and ensure continuity of supply. Business Continuity Safety First Prioritizing safety with work-from-home policy, safety practices at all locations and restricting non-essential travel. Playing Offense Positioning Lindsay to emerge a stronger company. Nimble and Resilient COVID-19 Response
Agenda Improved performance amid market challenges Balance sheet and capital allocation How we measure success
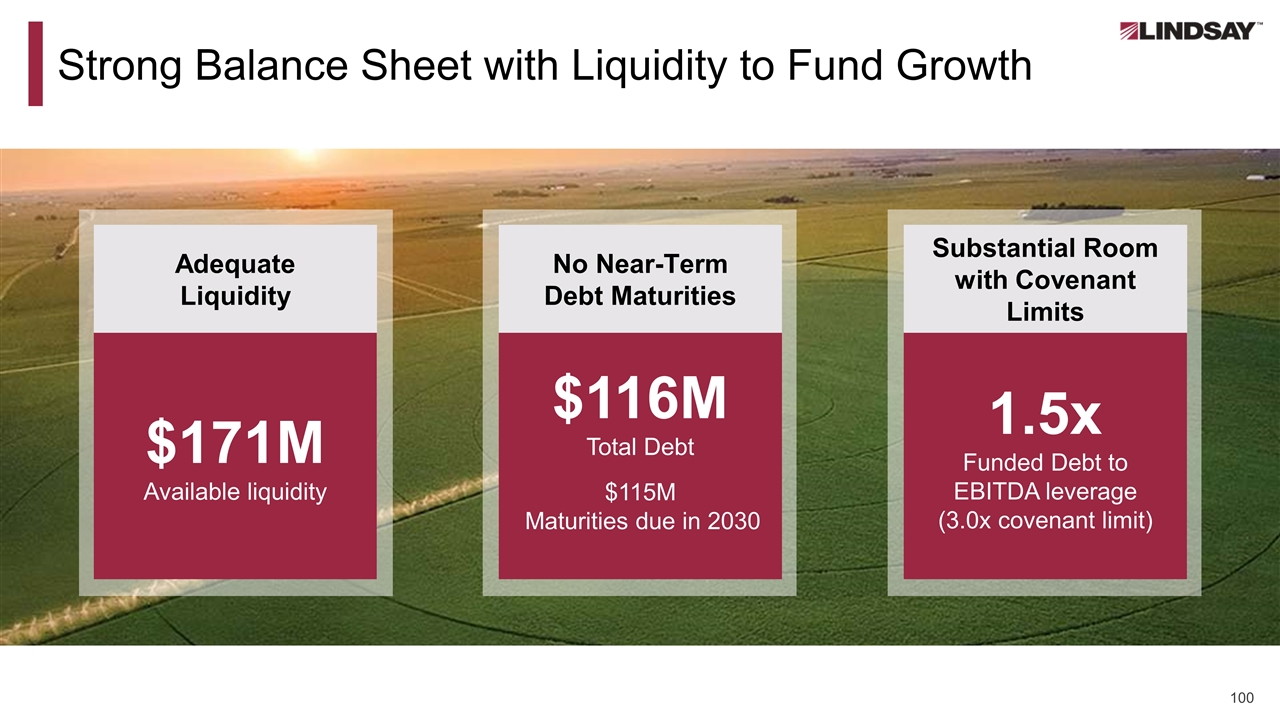
Resilient and Nimble COVID-19 Response Strong Balance Sheet with Liquidity to Fund Growth $171M Available liquidity Adequate Liquidity 1.5x Funded Debt to EBITDA leverage (3.0x covenant limit) Substantial Room with Covenant Limits No Near-Term Debt Maturities $116M Total Debt $115M Maturities due in 2030
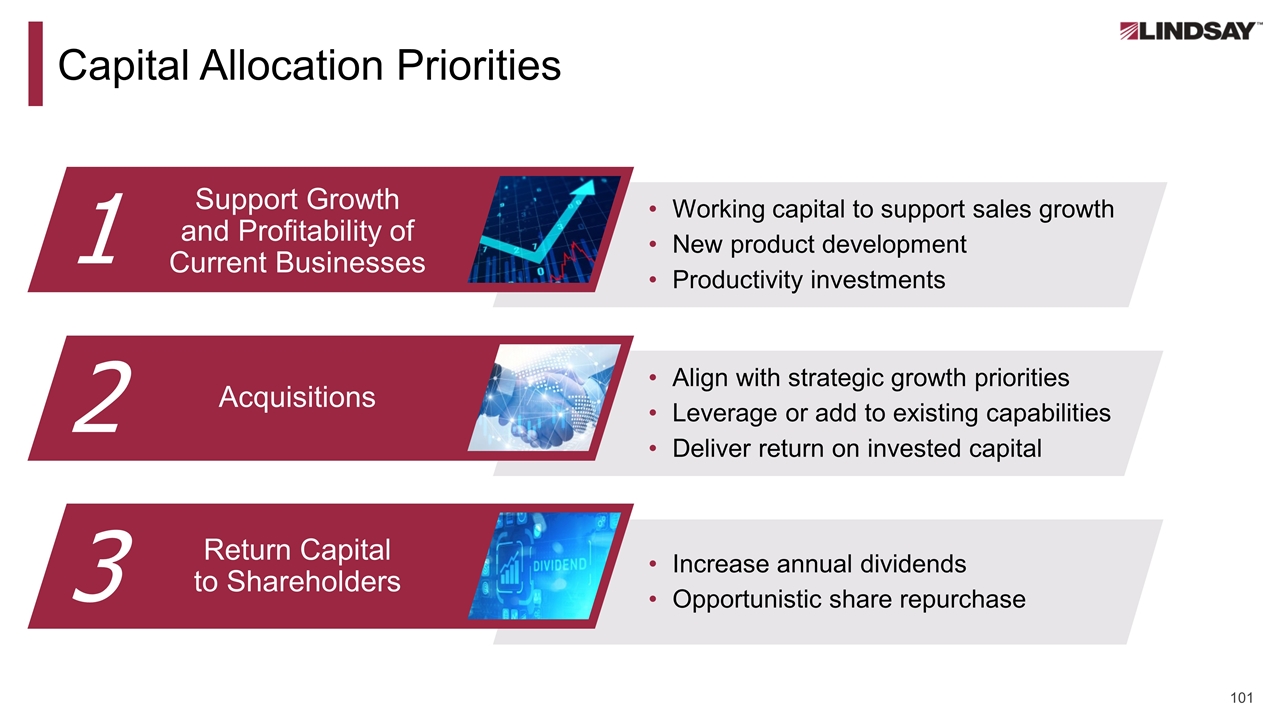
Capital Allocation Priorities Working capital to support sales growth New product development Productivity investments Align with strategic growth priorities Leverage or add to existing capabilities Deliver return on invested capital Increase annual dividends Opportunistic share repurchase 1 2 3 Support Growth and Profitability of Current Businesses Acquisitions Return Capital to Shareholders
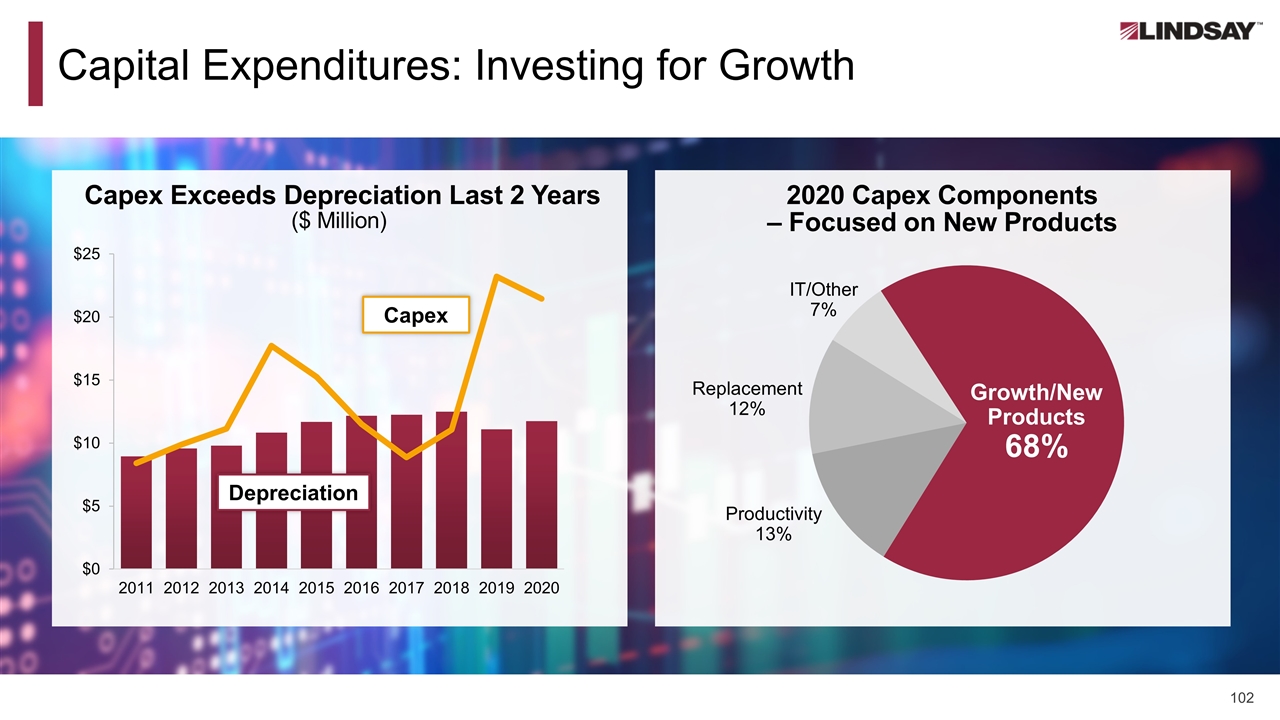
Capital Expenditures: Investing for Growth Capex Exceeds Depreciation Last 2 Years ($ Million) 2020 Capex Components – Focused on New Products Capex Depreciation Growth/New Products 68% Productivity 13% Replacement 12% IT/Other 7%
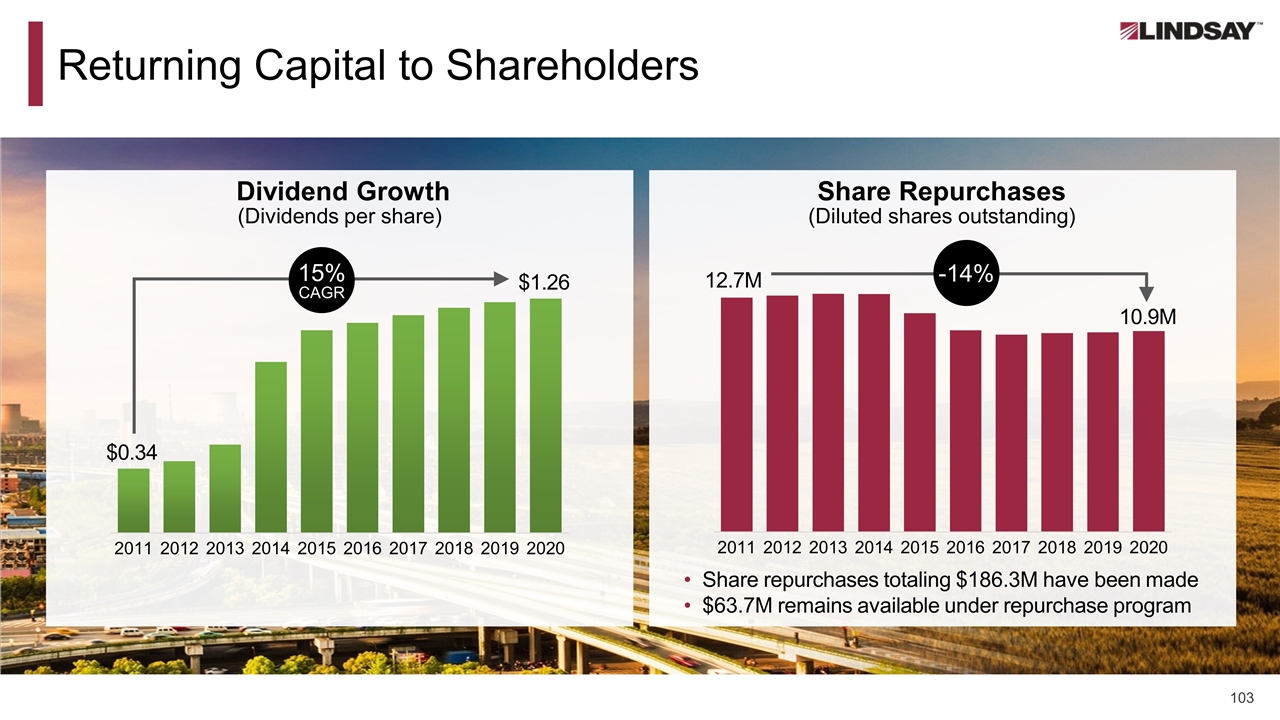
Returning Capital to Shareholders Dividend Growth (Dividends per share) Share Repurchases (Diluted shares outstanding) 15% CAGR $1.26 $0.34 12.7M 10.9M -14% Share repurchases totaling $186.3M have been made $63.7M remains available under repurchase program
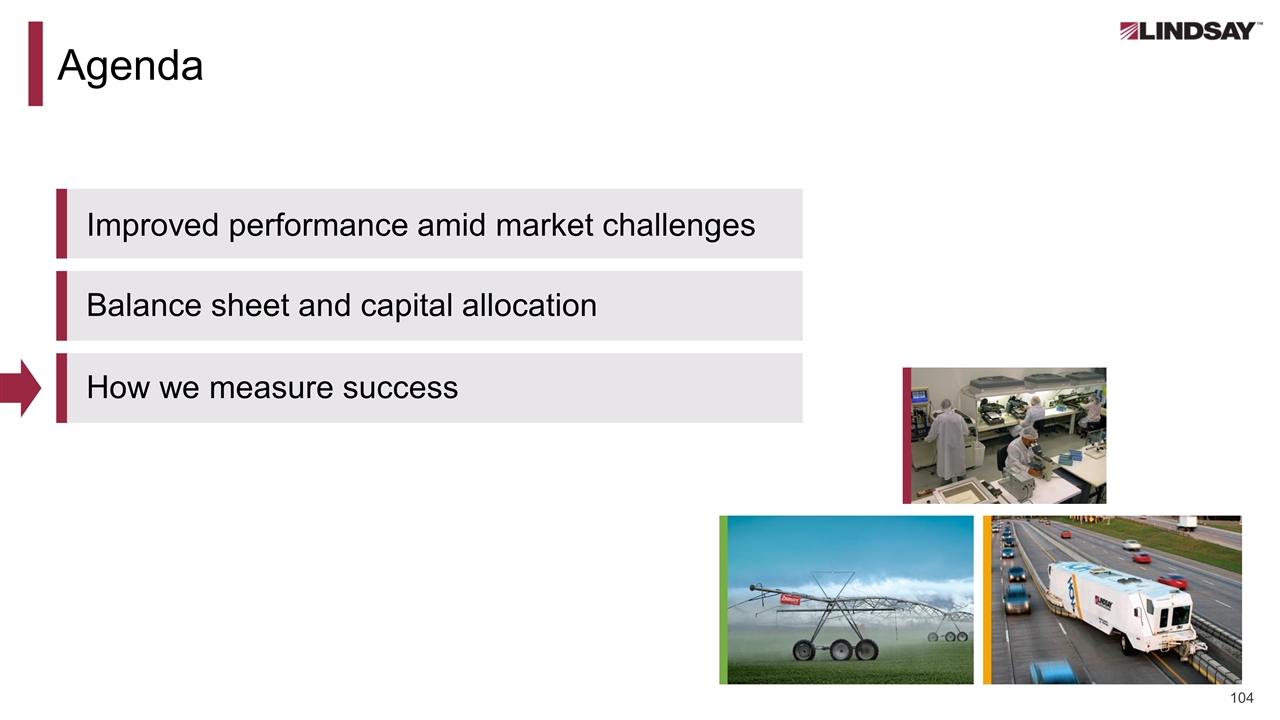
Agenda Improved performance amid market challenges Balance sheet and capital allocation How we measure success
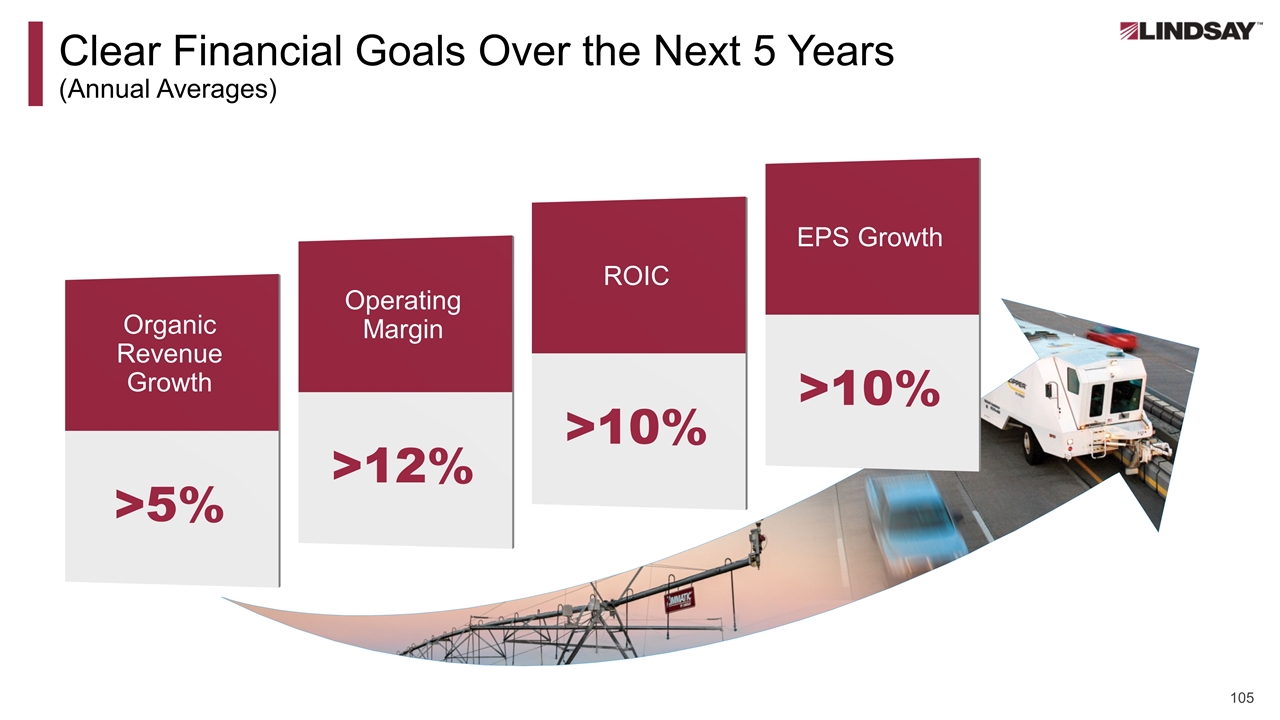
Clear Financial Goals Over the Next 5 Years (Annual Averages) Organic Revenue Growth >5% Operating Margin >12% ROIC >10% EPS Growth >10%
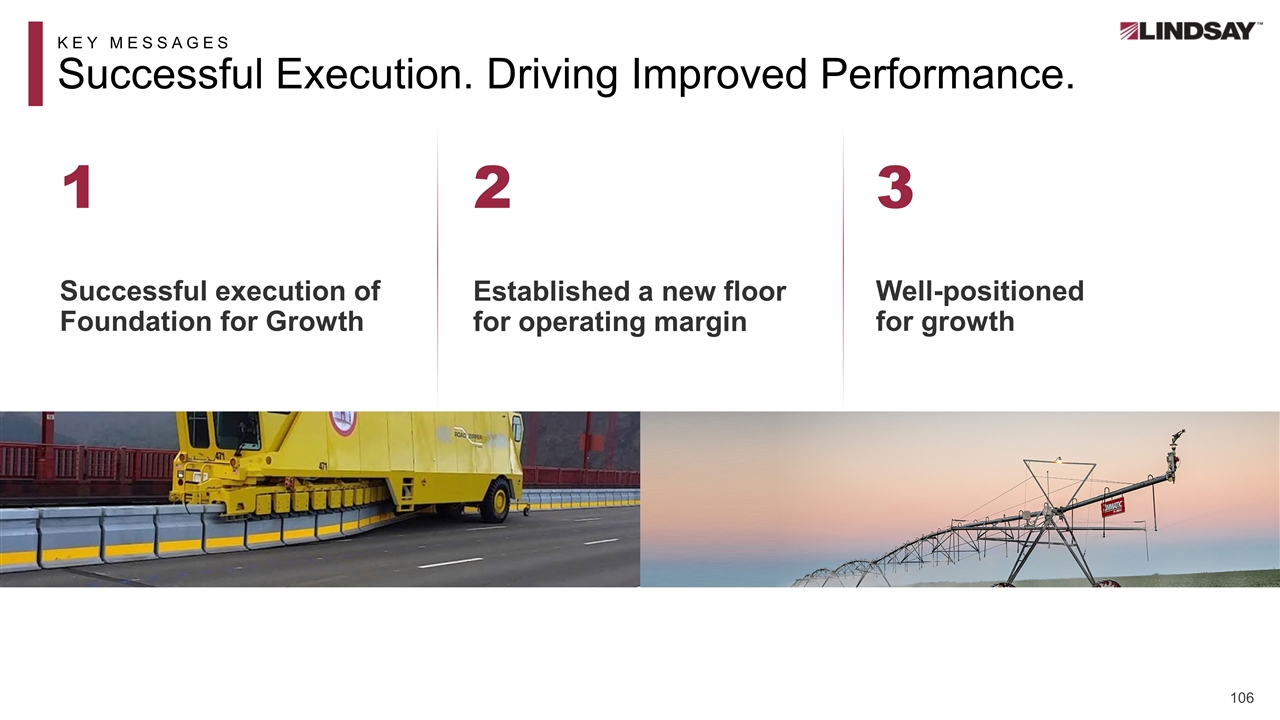
3 2 1 Successful execution of Foundation for Growth Well-positioned for growth KEY MESSAGES Successful Execution. Driving Improved Performance. Established a new floor for operating margin
Q&A Session
Feedback – Quick Survey Thank you for joining us for our 2020 Investor event. We hope you found it informative. Your feedback is important to us, so we would appreciate it if you could fill out a quick survey - it should take only 2 to 3 minutes. The answers are all anonymous. Please click on this link to access the brief questionnaire https://forms.office.com/Pages/ResponsePage.aspx?id=rWvxNGyyQ0iX-dYkZqj0wW_6ZFaq-IBAsfP9FsyV-4RUMTYyTFU5OVpHOElXWDJLMFNVQlE4OThNSC4u This survey will be online for the next 5 days so we ask you to please complete it as soon as possible
Appendix
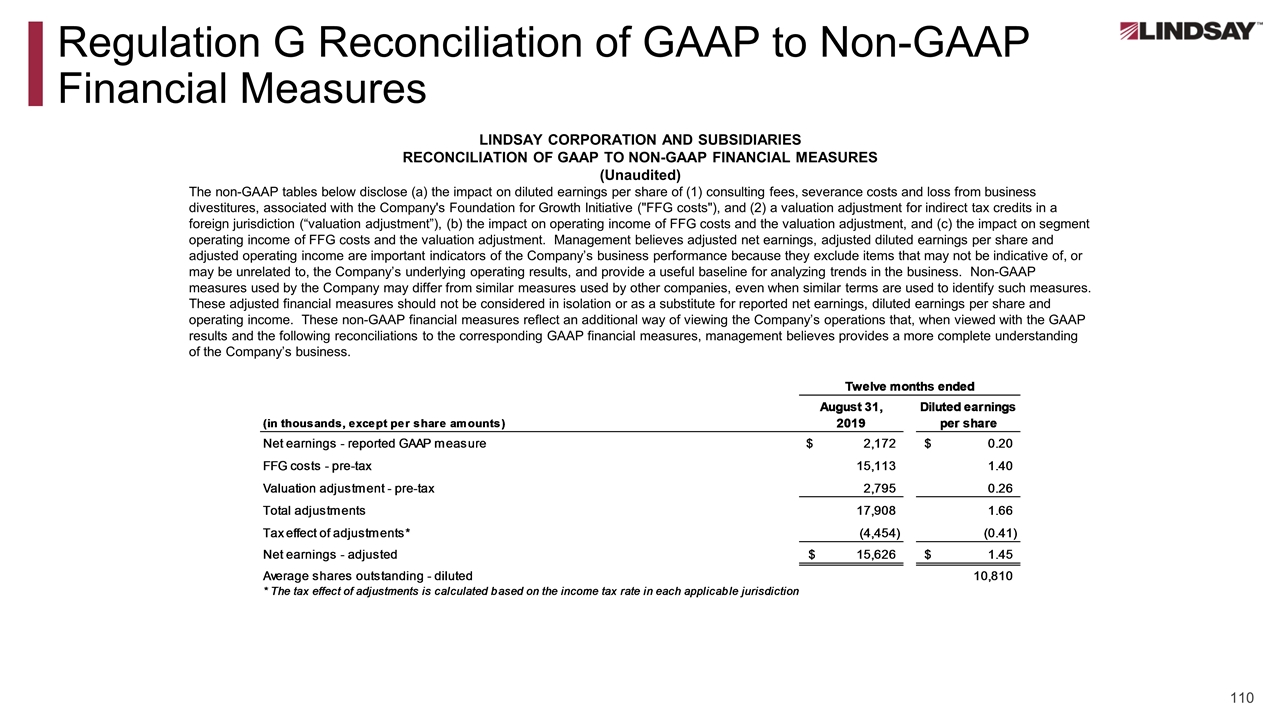
Regulation G Reconciliation of GAAP to Non-GAAP Financial Measures LINDSAY CORPORATION AND SUBSIDIARIES RECONCILIATION OF GAAP TO NON-GAAP FINANCIAL MEASURES (Unaudited) The non-GAAP tables below disclose (a) the impact on diluted earnings per share of (1) consulting fees, severance costs and loss from business divestitures, associated with the Company's Foundation for Growth Initiative ("FFG costs"), and (2) a valuation adjustment for indirect tax credits in a foreign jurisdiction (“valuation adjustment”), (b) the impact on operating income of FFG costs and the valuation adjustment, and (c) the impact on segment operating income of FFG costs and the valuation adjustment. Management believes adjusted net earnings, adjusted diluted earnings per share and adjusted operating income are important indicators of the Company’s business performance because they exclude items that may not be indicative of, or may be unrelated to, the Company’s underlying operating results, and provide a useful baseline for analyzing trends in the business. Non-GAAP measures used by the Company may differ from similar measures used by other companies, even when similar terms are used to identify such measures. These adjusted financial measures should not be considered in isolation or as a substitute for reported net earnings, diluted earnings per share and operating income. These non-GAAP financial measures reflect an additional way of viewing the Company’s operations that, when viewed with the GAAP results and the following reconciliations to the corresponding GAAP financial measures, management believes provides a more complete understanding of the Company’s business.
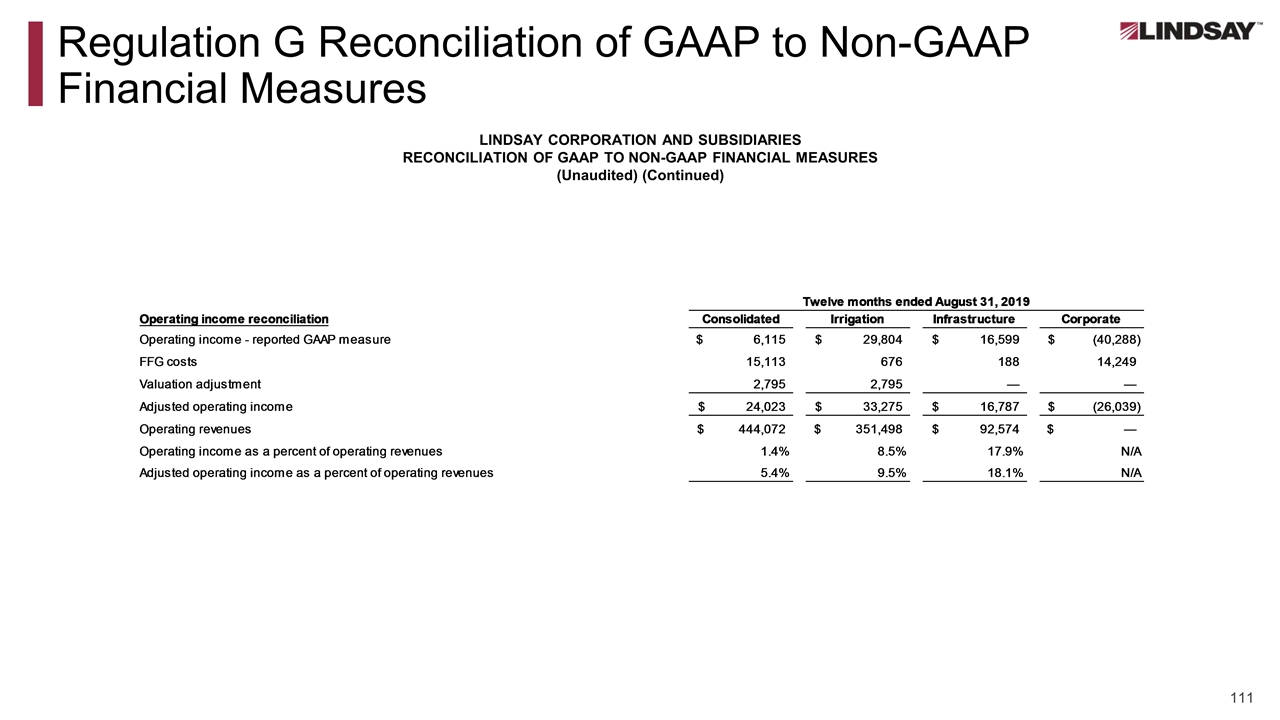
Regulation G Reconciliation of GAAP to Non-GAAP Financial Measures LINDSAY CORPORATION AND SUBSIDIARIES RECONCILIATION OF GAAP TO NON-GAAP FINANCIAL MEASURES (Unaudited) (Continued)
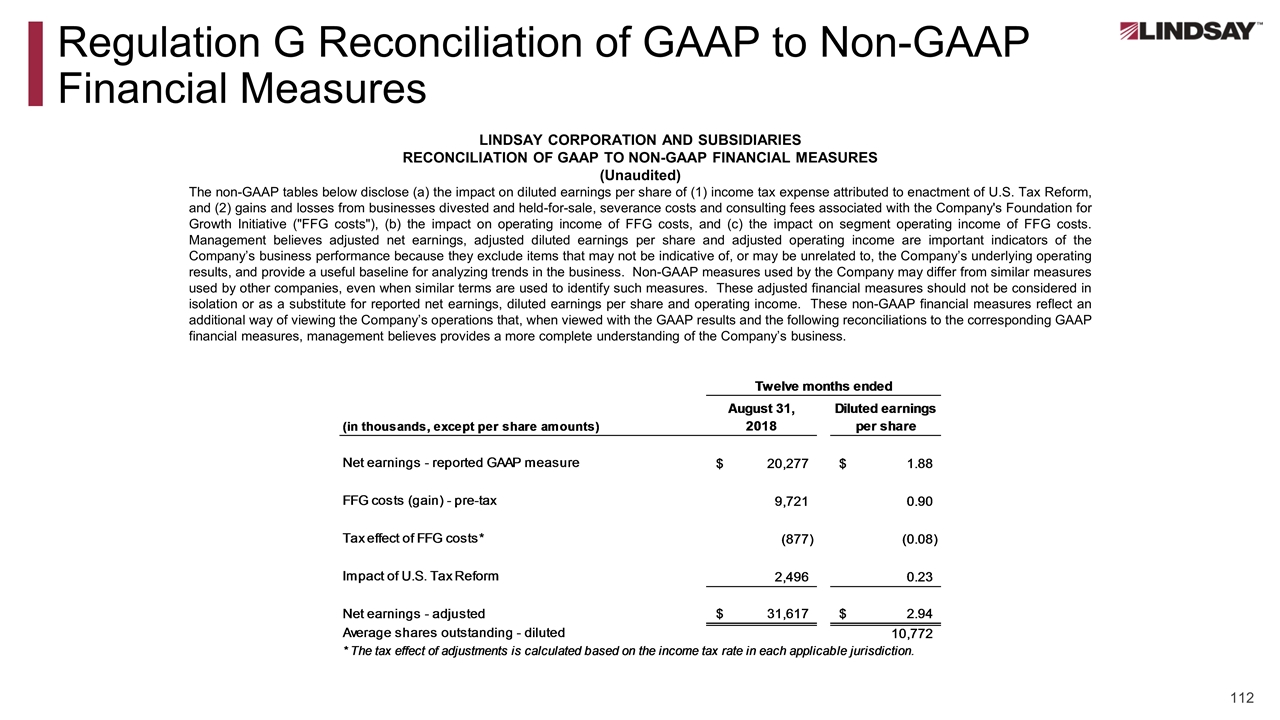
Regulation G Reconciliation of GAAP to Non-GAAP Financial Measures LINDSAY CORPORATION AND SUBSIDIARIES RECONCILIATION OF GAAP TO NON-GAAP FINANCIAL MEASURES (Unaudited) The non-GAAP tables below disclose (a) the impact on diluted earnings per share of (1) income tax expense attributed to enactment of U.S. Tax Reform, and (2) gains and losses from businesses divested and held-for-sale, severance costs and consulting fees associated with the Company's Foundation for Growth Initiative ("FFG costs"), (b) the impact on operating income of FFG costs, and (c) the impact on segment operating income of FFG costs. Management believes adjusted net earnings, adjusted diluted earnings per share and adjusted operating income are important indicators of the Company’s business performance because they exclude items that may not be indicative of, or may be unrelated to, the Company’s underlying operating results, and provide a useful baseline for analyzing trends in the business. Non-GAAP measures used by the Company may differ from similar measures used by other companies, even when similar terms are used to identify such measures. These adjusted financial measures should not be considered in isolation or as a substitute for reported net earnings, diluted earnings per share and operating income. These non-GAAP financial measures reflect an additional way of viewing the Company’s operations that, when viewed with the GAAP results and the following reconciliations to the corresponding GAAP financial measures, management believes provides a more complete understanding of the Company’s business.
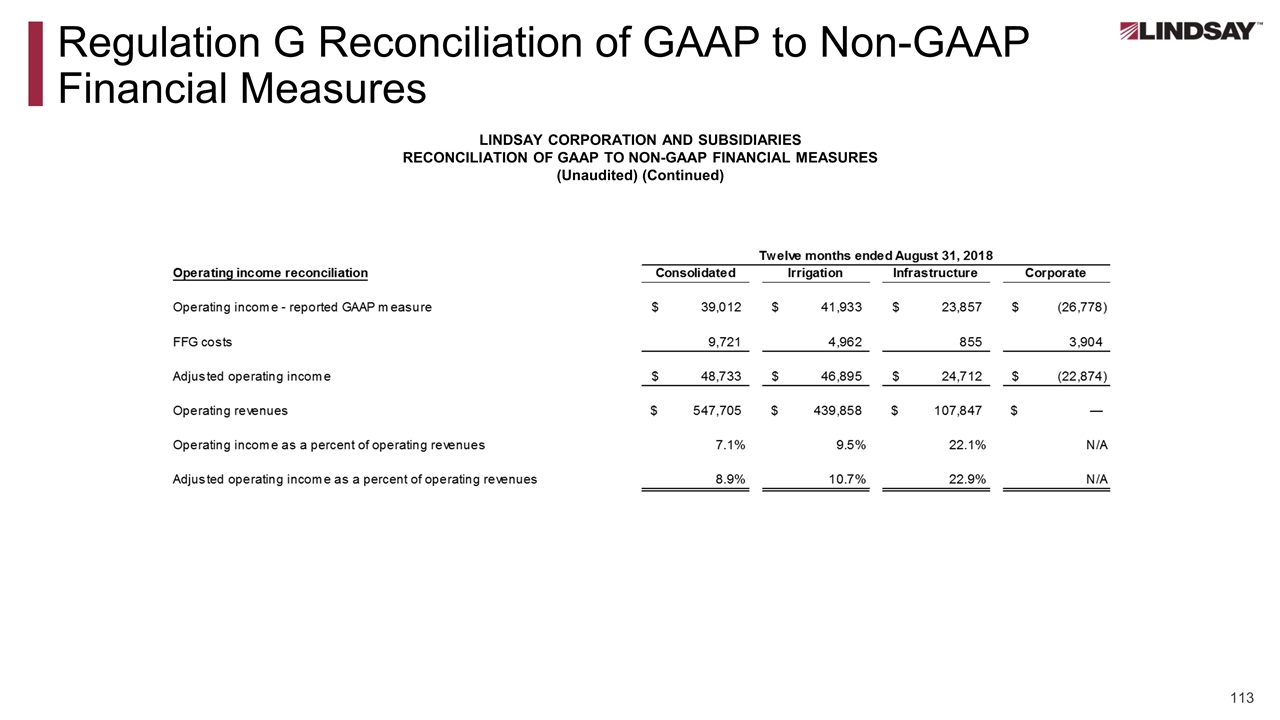
Regulation G Reconciliation of GAAP to Non-GAAP Financial Measures LINDSAY CORPORATION AND SUBSIDIARIES RECONCILIATION OF GAAP TO NON-GAAP FINANCIAL MEASURES (Unaudited) (Continued)


