Investor Presentation – April 2018 ADVANCING INNOVATION TO SOLVE GLOBAL CHALLENGES Exhibit 99.1
Safe-Harbor Statement This presentation contains forward-looking statements that are subject to risks and uncertainties and which reflect management’s current beliefs and estimates of future economic circumstances, industry conditions, Company performance, financial results and planned financing. You can find a discussion of many of these risks and uncertainties in the annual, quarterly and current reports that the Company files with the Securities and Exchange Commission. Investors should understand that a number of factors could cause future economic and industry conditions, and the Company’s actual financial condition and results of operations, to differ materially from management’s beliefs expressed in the forward-looking statements contained in this presentation. These factors include those outlined in the “Risk Factors” section of the Company’s most recent annual report on Form 10-K filed with the Securities and Exchange Commission, and investors are urged to review these factors when considering the forward-looking statements contained in this presentation. For these statements, the Company claims the protection of the safe harbor for forward-looking statements contained in the Private Securities Litigation Reform Act of 1995.
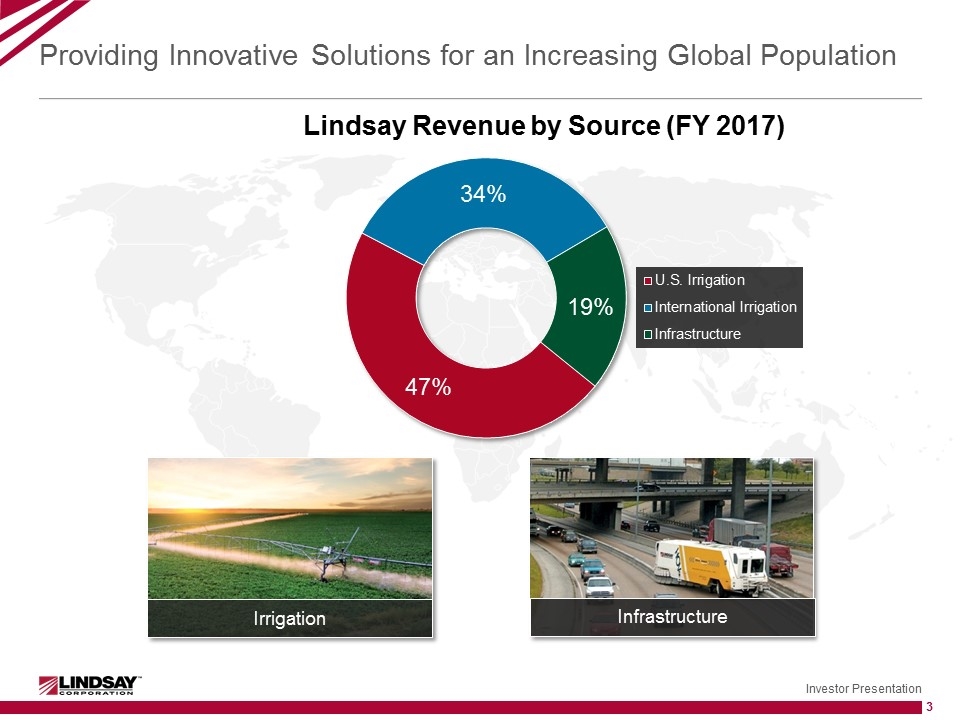
Providing Innovative Solutions for an Increasing Global Population Irrigation Infrastructure
Global Leader in Differentiated Market Solutions Custom turnkey irrigation solutions delivered to over 90 countries Global Provider of Road Safety Solutions Award-winning industry-leading technology
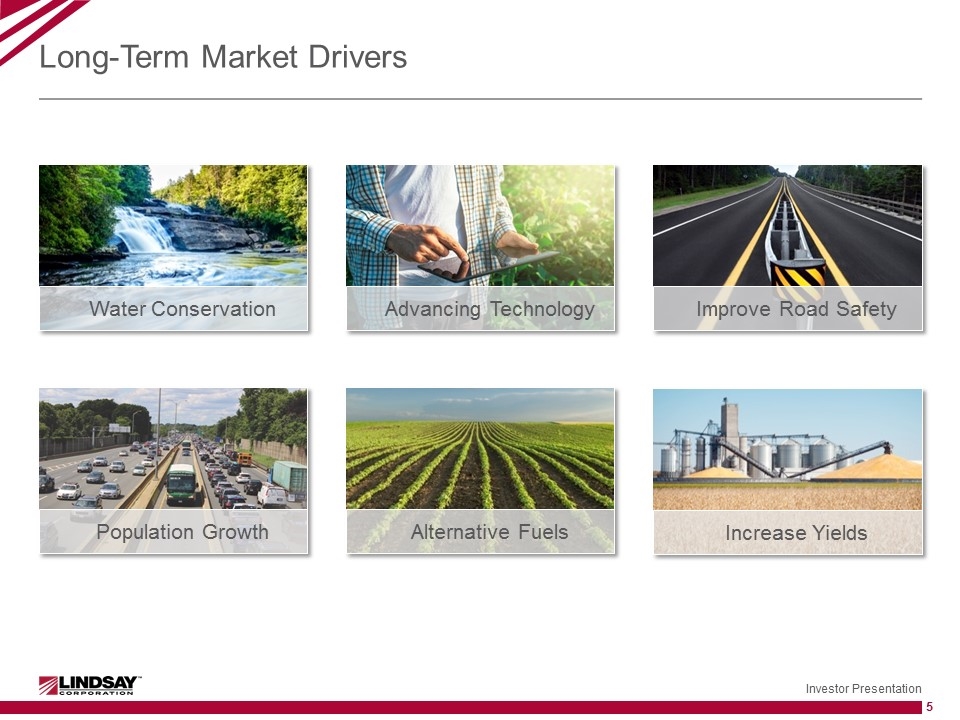
Long-Term Market Drivers Water Conservation Alternative Fuels Increase Yields Improve Road Safety Population Growth Advancing Technology
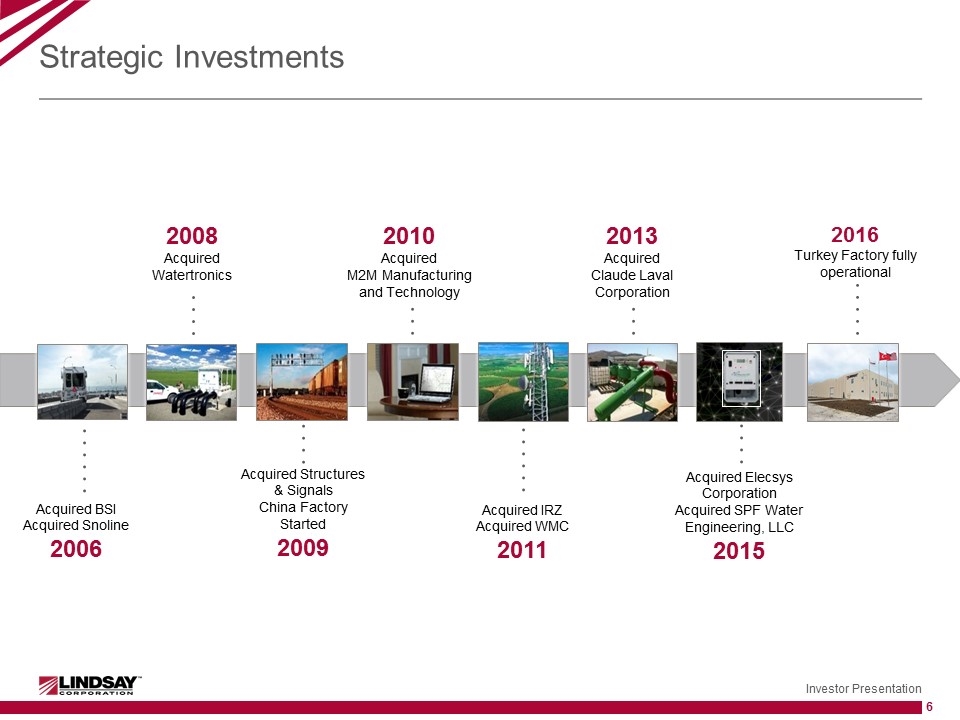
Strategic Investments 2016 Turkey Factory fully operational 2008 Acquired Watertronics Acquired Structures & Signals China Factory Started 2009 2010 Acquired M2M Manufacturing and Technology Acquired BSI Acquired Snoline 2006 Acquired IRZ Acquired WMC 2011 2013 Acquired Claude Laval Corporation Acquired Elecsys Corporation Acquired SPF Water Engineering, LLC 2015
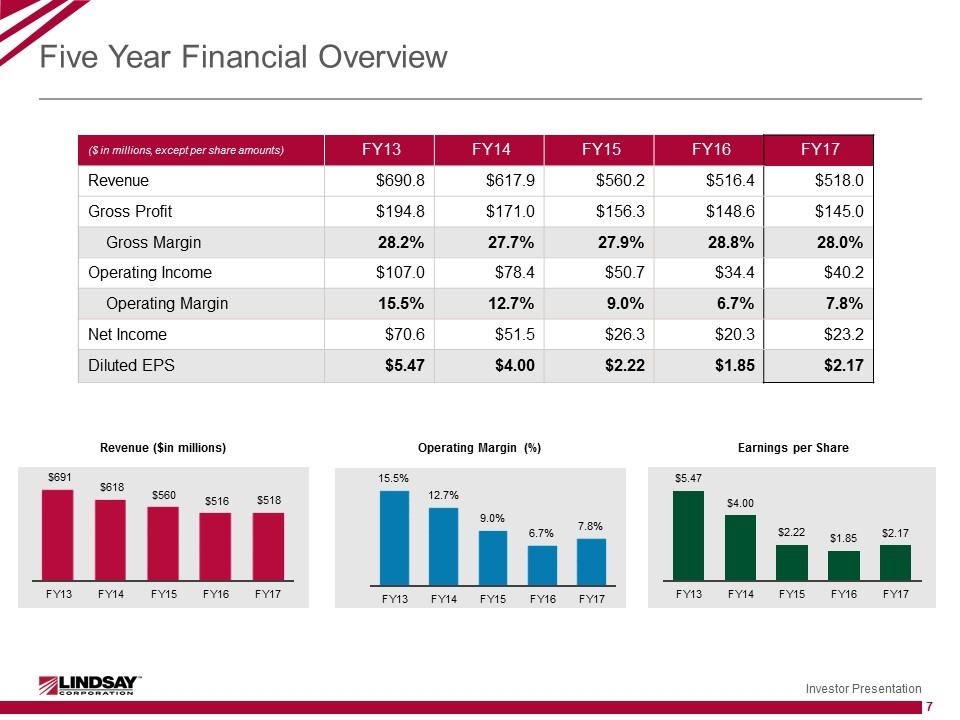
Five Year Financial Overview Revenue ($in millions) Operating Margin (%) ($ in millions, except per share amounts) FY13 FY14 FY15 FY16 FY17 Revenue $690.8 $617.9 $560.2 $516.4 $518.0 Gross Profit $194.8 $171.0 $156.3 $148.6 $145.0 Gross Margin 28.2% 27.7% 27.9% 28.8% 28.0% Operating Income $107.0 $78.4 $50.7 $34.4 $40.2 Operating Margin 15.5% 12.7% 9.0% 6.7% 7.8% Net Income $70.6 $51.5 $26.3 $20.3 $23.2 Diluted EPS $5.47 $4.00 $2.22 $1.85 $2.17 Earnings per Share
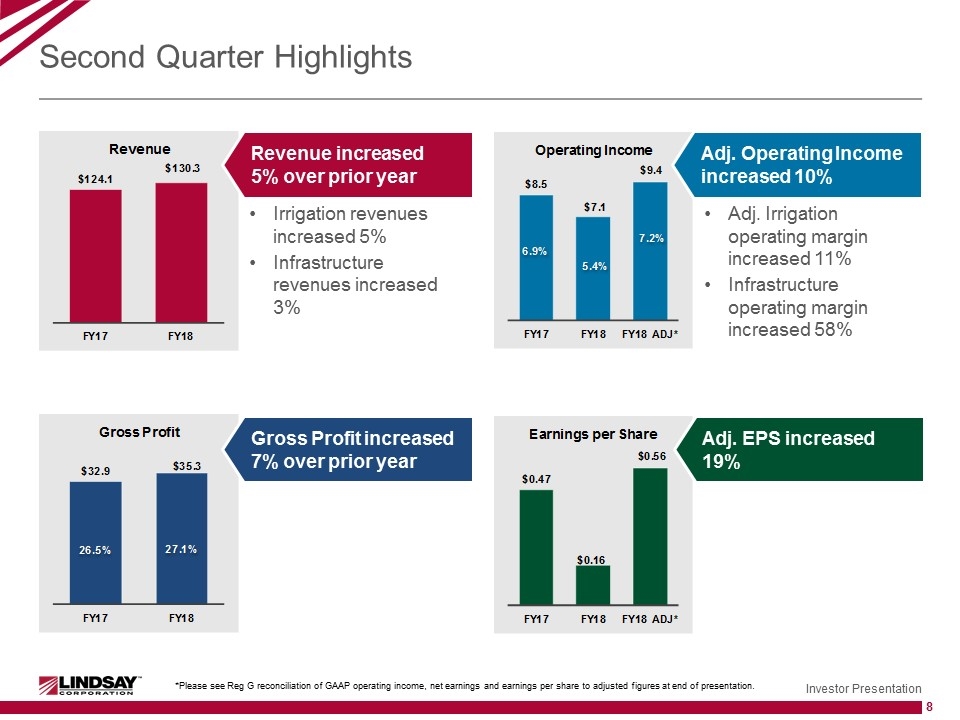
Second Quarter Highlights Irrigation revenues increased 5% Infrastructure revenues increased 3% Revenue increased 5% over prior year Gross Profit increased 7% over prior year Adj. EPS increased 19% Adj. Irrigation operating margin increased 11% Infrastructure operating margin increased 58% Adj. Operating Income increased 10% *Please see Reg G reconciliation of GAAP operating income, net earnings and earnings per share to adjusted figures at end of presentation.
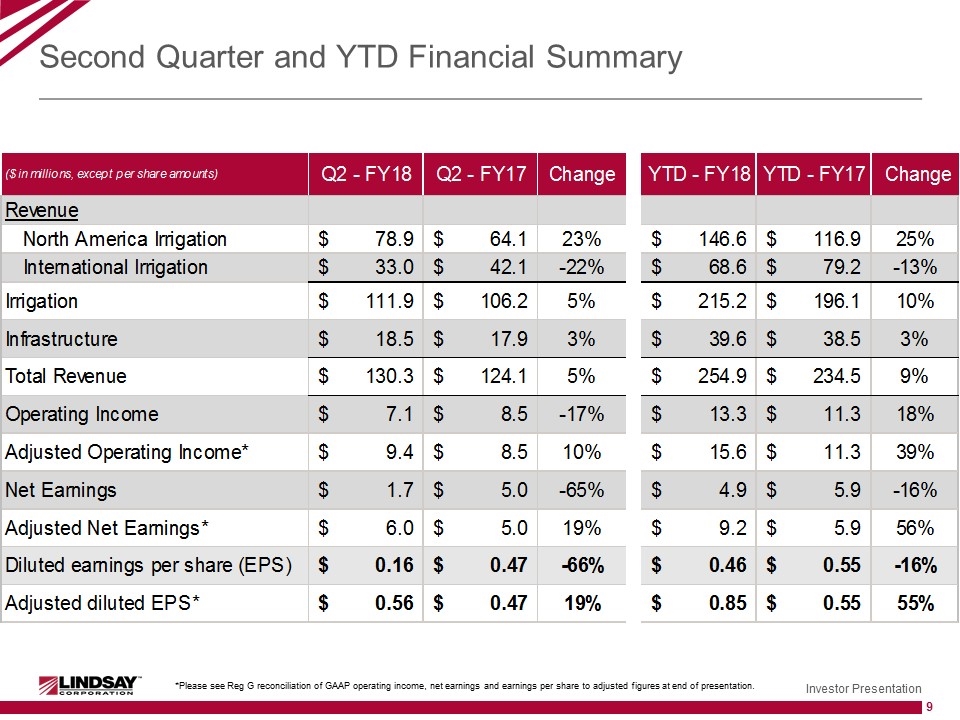
Second Quarter and YTD Financial Summary *Please see Reg G reconciliation of GAAP operating income, net earnings and earnings per share to adjusted figures at end of presentation.
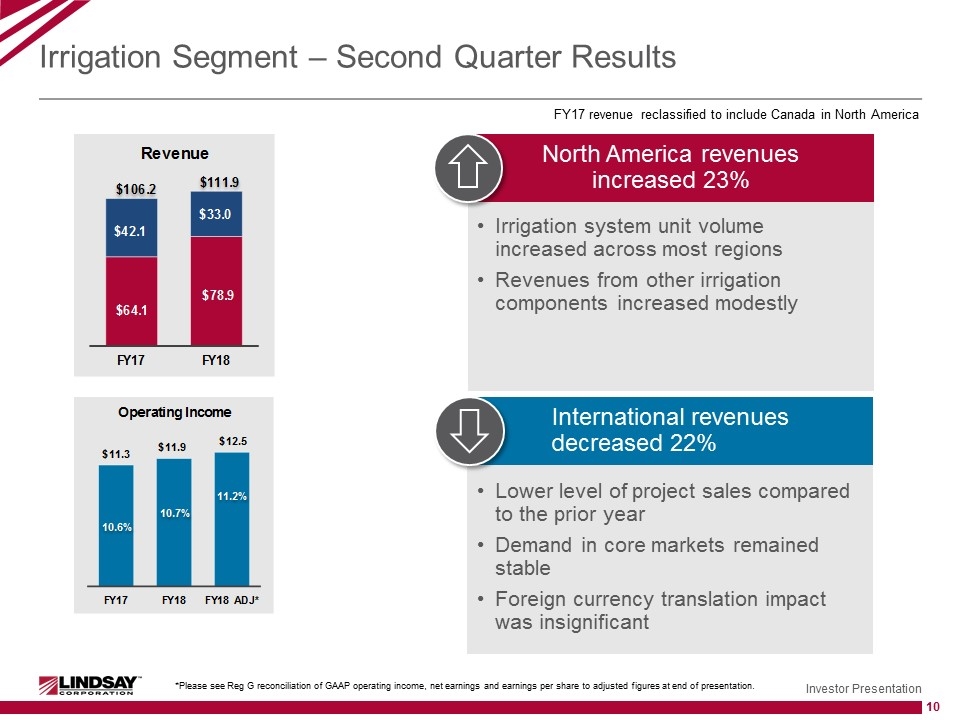
Irrigation Segment – Second Quarter Results FY17 revenue reclassified to include Canada in North America North America revenues increased 23% Irrigation system unit volume increased across most regions Revenues from other irrigation components increased modestly International revenues decreased 22% Lower level of project sales compared to the prior year Demand in core markets remained stable Foreign currency translation impact was insignificant *Please see Reg G reconciliation of GAAP operating income, net earnings and earnings per share to adjusted figures at end of presentation.
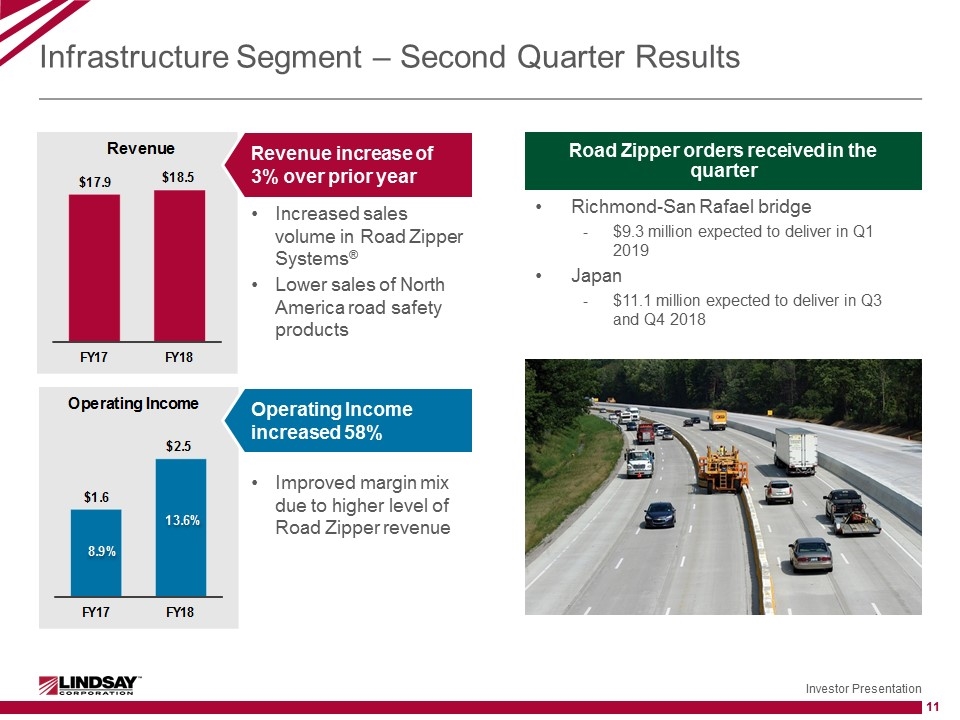
Infrastructure Segment – Second Quarter Results Richmond-San Rafael bridge $9.3 million expected to deliver in Q1 2019 Japan $11.1 million expected to deliver in Q3 and Q4 2018 Increased sales volume in Road Zipper Systems® Lower sales of North America road safety products Revenue increase of 3% over prior year Improved margin mix due to higher level of Road Zipper revenue Operating Income increased 58% Road Zipper orders received in the quarter
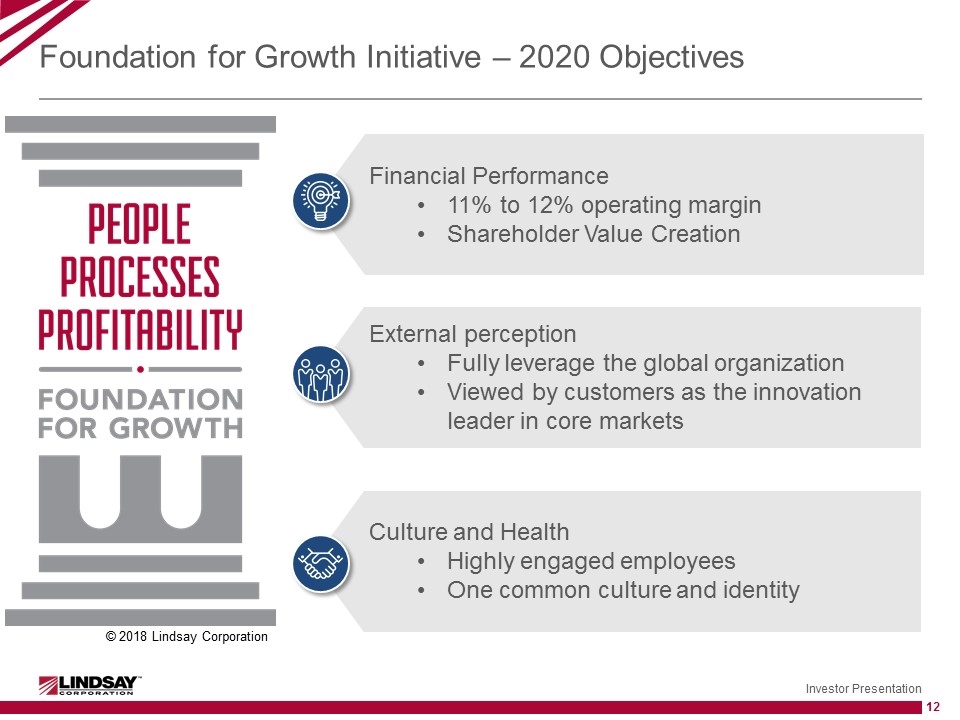
Foundation for Growth Initiative – 2020 Objectives Financial Performance 11% to 12% operating margin Shareholder Value Creation External perception Fully leverage the global organization Viewed by customers as the innovation leader in core markets Culture and Health Highly engaged employees One common culture and identity © 2018 Lindsay Corporation
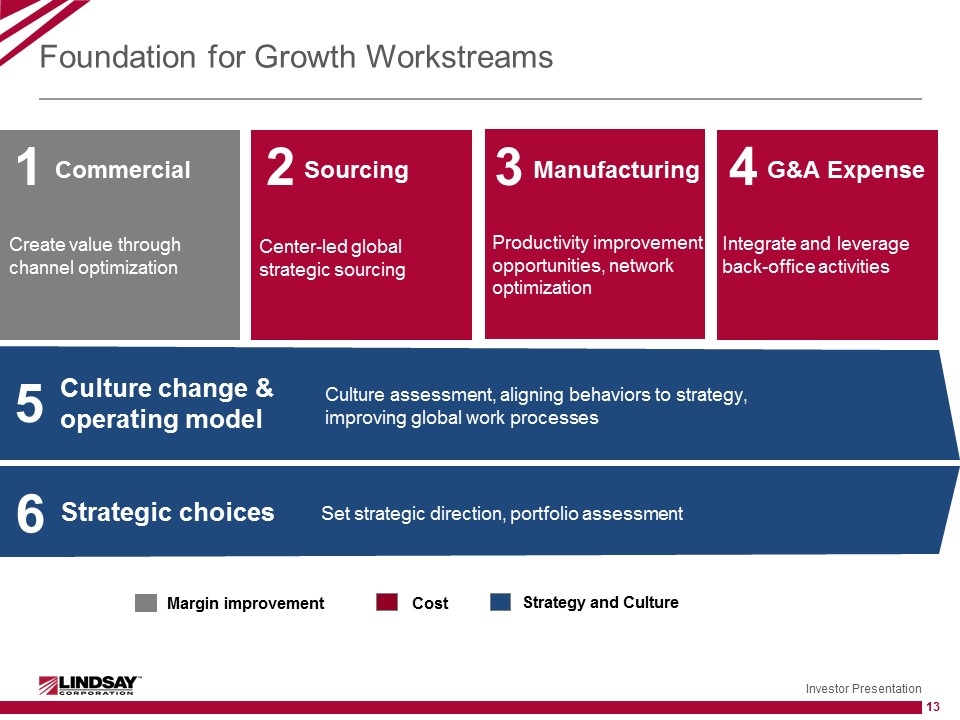
Foundation for Growth Workstreams Strategic choices 6 Culture change & operating model 5 Culture assessment, aligning behaviors to strategy, improving global work processes Set strategic direction, portfolio assessment Commercial 1 Manufacturing 3 Sourcing 2 G&A Expense 4 Create value through channel optimization Center-led global strategic sourcing Productivity improvement opportunities, network optimization Integrate and leverage back-office activities Margin improvement Cost Strategy and Culture
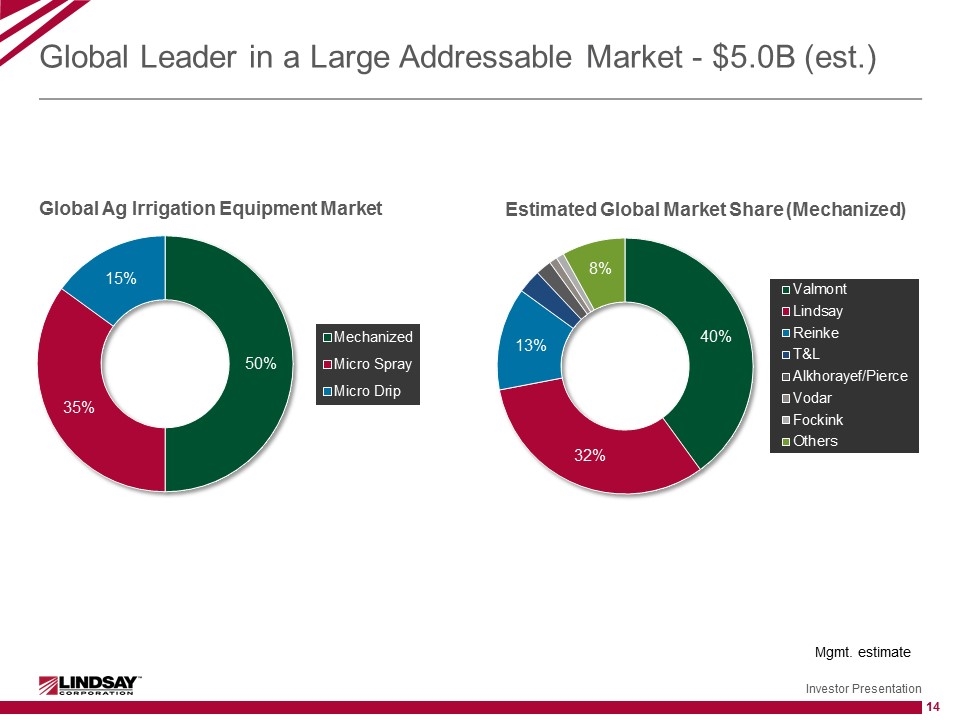
Global Leader in a Large Addressable Market - $5.0B (est.) Mgmt. estimate
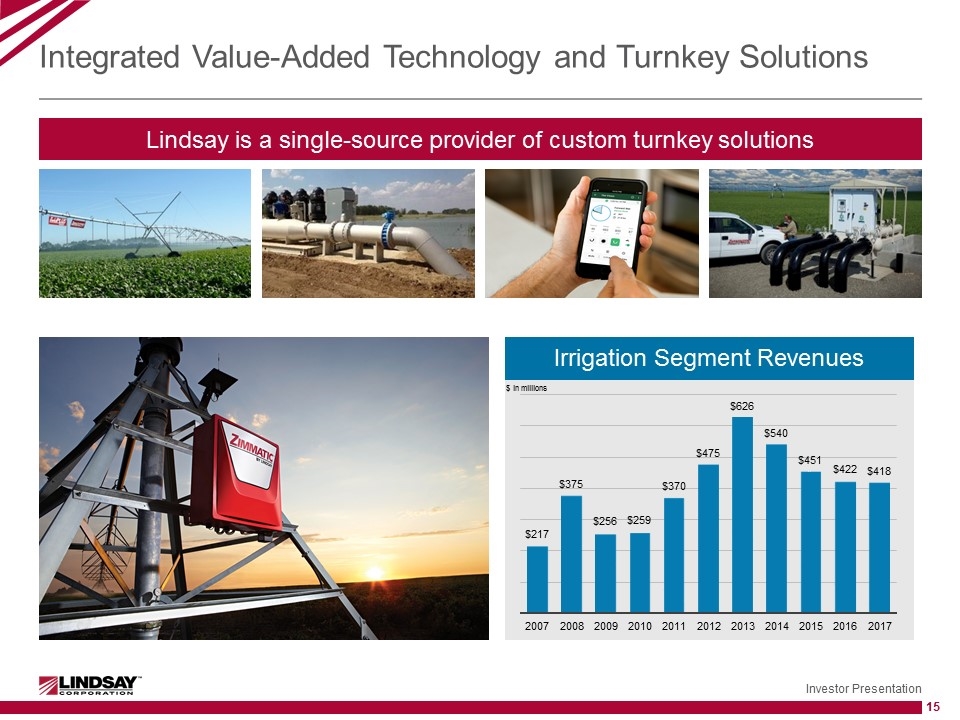
Integrated Value-Added Technology and Turnkey Solutions Lindsay is a single-source provider of custom turnkey solutions Irrigation Segment Revenues $ in millions
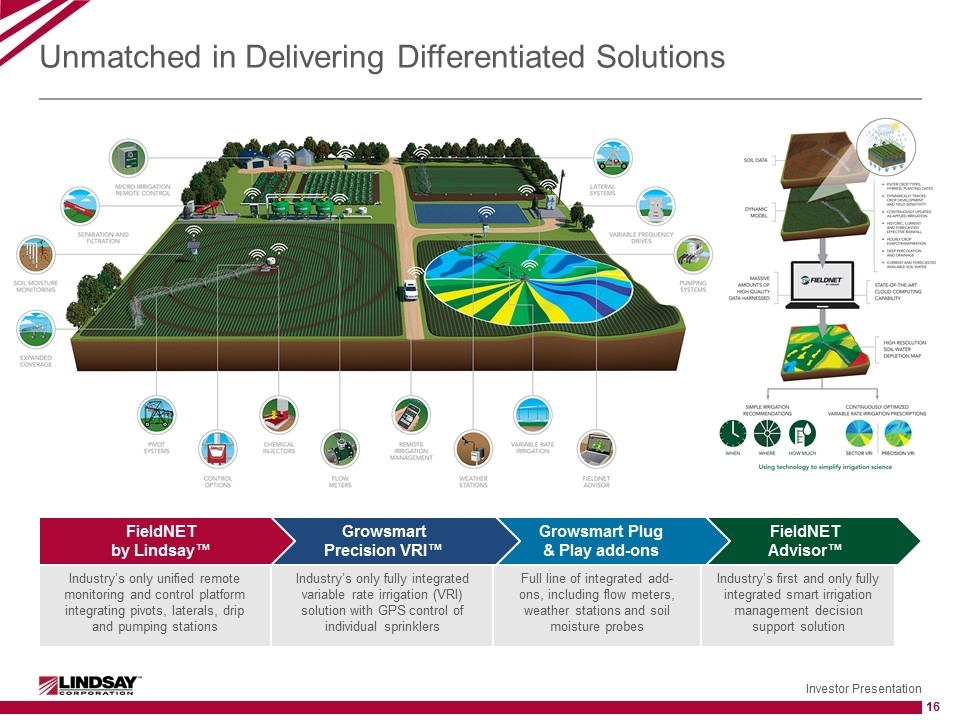
Unmatched in Delivering Differentiated Solutions Industry’s only unified remote monitoring and control platform integrating pivots, laterals, drip and pumping stations Industry’s only fully integrated variable rate irrigation (VRI) solution with GPS control of individual sprinklers Full line of integrated add-ons, including flow meters, weather stations and soil moisture probes Industry’s first and only fully integrated smart irrigation management decision support solution FieldNET Advisor™ Growsmart Plug & Play add-ons Growsmart Precision VRI™ FieldNET by Lindsay™
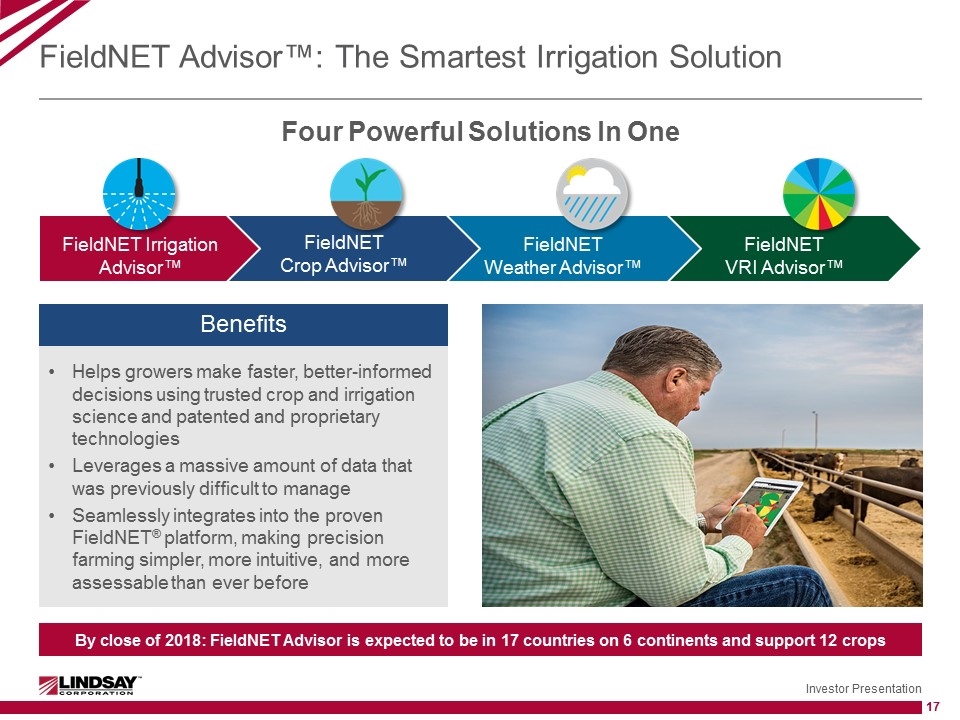
FieldNET Advisor™: The Smartest Irrigation Solution Helps growers make faster, better-informed decisions using trusted crop and irrigation science and patented and proprietary technologies Leverages a massive amount of data that was previously difficult to manage Seamlessly integrates into the proven FieldNET® platform, making precision farming simpler, more intuitive, and more assessable than ever before Four Powerful Solutions In One FieldNET VRI Advisor™ FieldNET Weather Advisor™ FieldNET Crop Advisor™ FieldNET Irrigation Advisor™ Benefits By close of 2018: FieldNET Advisor is expected to be in 17 countries on 6 continents and support 12 crops
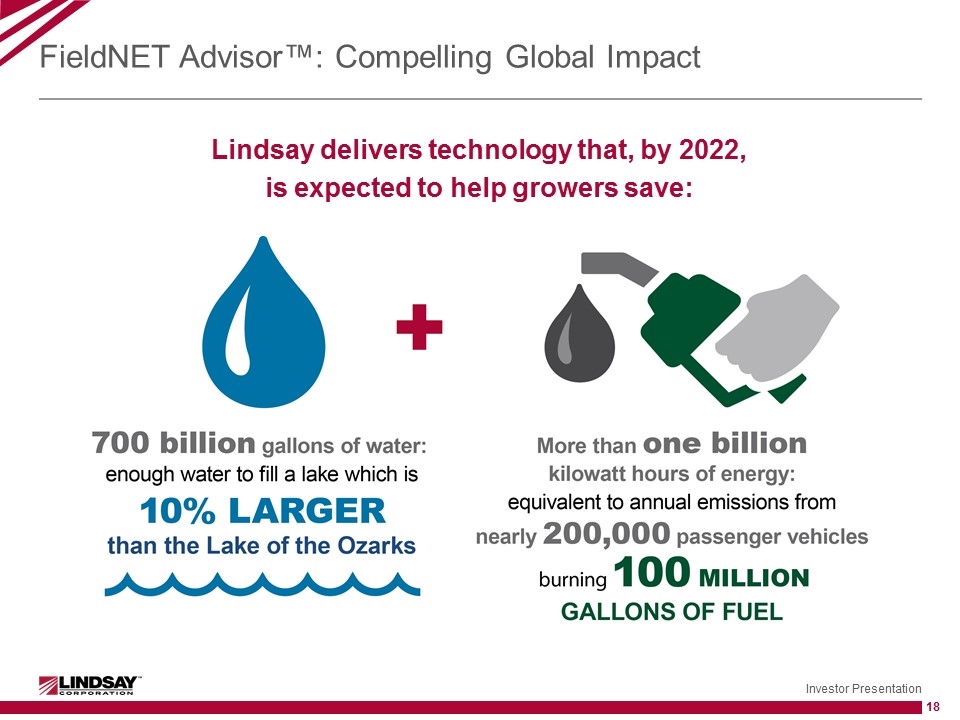
FieldNET Advisor™: Compelling Global Impact Lindsay delivers technology that, by 2022, is expected to help growers save:
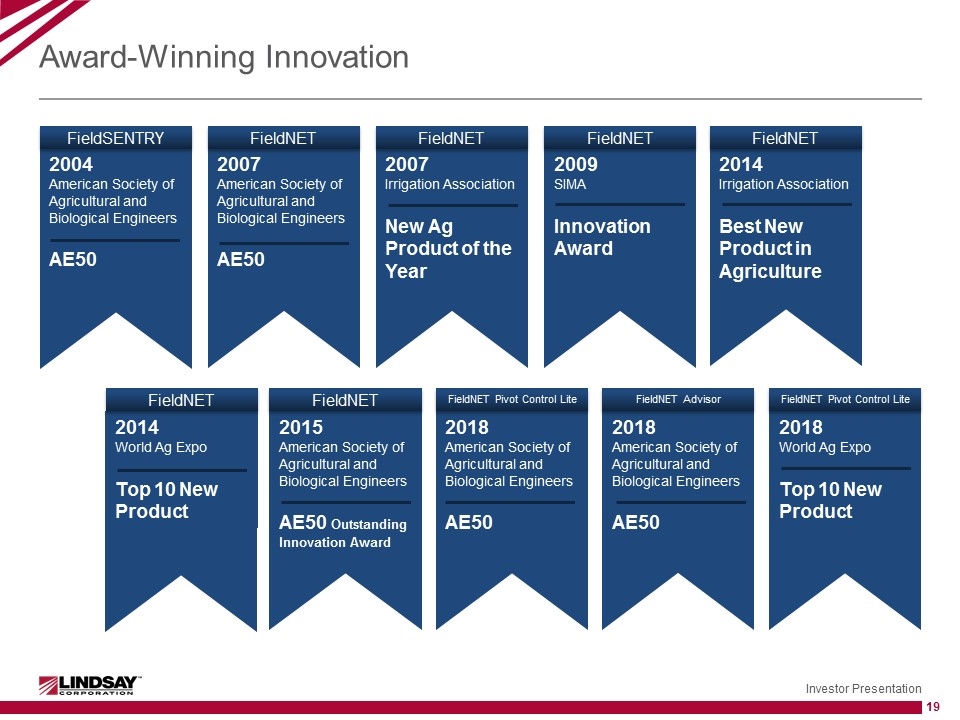
2014 Irrigation Association Best New Product in Agriculture 2014 World Ag Expo Top 10 New Product 2015 American Society of Agricultural and Biological Engineers AE50 Outstanding Innovation Award 2018 American Society of Agricultural and Biological Engineers AE50 2018 American Society of Agricultural and Biological Engineers AE50 2018 World Ag Expo Top 10 New Product 2009 SIMA Innovation Award 2007 Irrigation Association New Ag Product of the Year 2007 American Society of Agricultural and Biological Engineers AE50 2004 American Society of Agricultural and Biological Engineers AE50 Award-Winning Innovation FieldNET FieldNET FieldNET FieldNET FieldNET FieldNET FieldNET Pivot Control Lite FieldNET Pivot Control Lite FieldNET Advisor FieldSENTRY
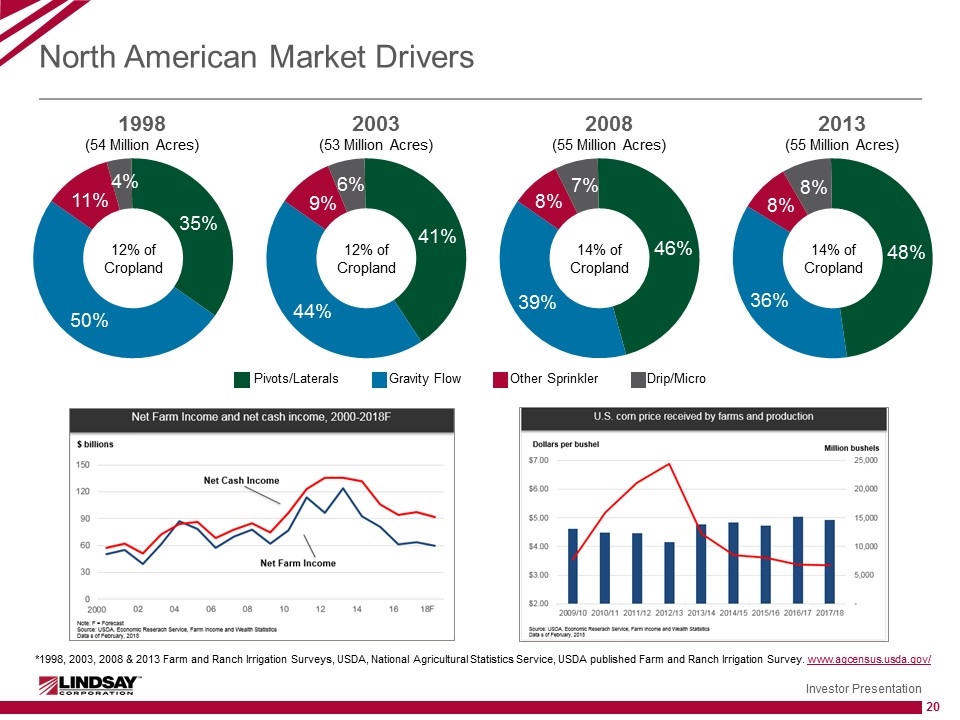
North American Market Drivers 2013 (55 Million Acres) 14% of Cropland Pivots/Laterals Gravity Flow Other Sprinkler Drip/Micro 2008 (55 Million Acres) 14% of Cropland 1998 (54 Million Acres) 12% of Cropland 2003 (53 Million Acres) 12% of Cropland *1998, 2003, 2008 & 2013 Farm and Ranch Irrigation Surveys, USDA, National Agricultural Statistics Service, USDA published Farm and Ranch Irrigation Survey. www.agcensus.usda.gov/
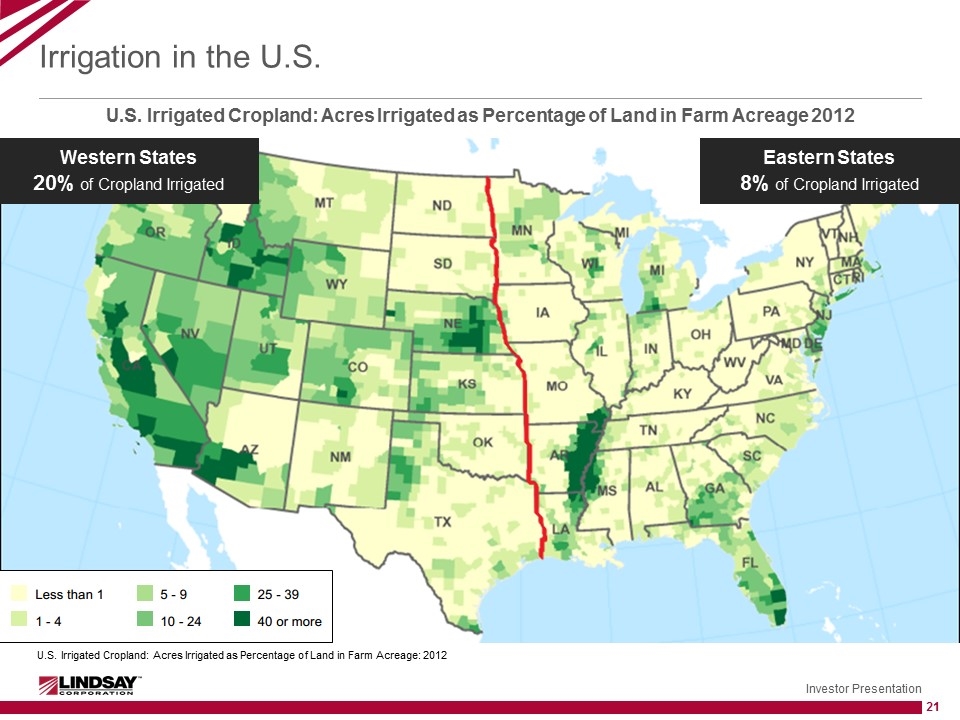
Irrigation in the U.S. U.S. Irrigated Cropland: Acres Irrigated as Percentage of Land in Farm Acreage 2012 Western States 20% of Cropland Irrigated Eastern States 8% of Cropland Irrigated U.S. Irrigated Cropland: Acres Irrigated as Percentage of Land in Farm Acreage: 2012
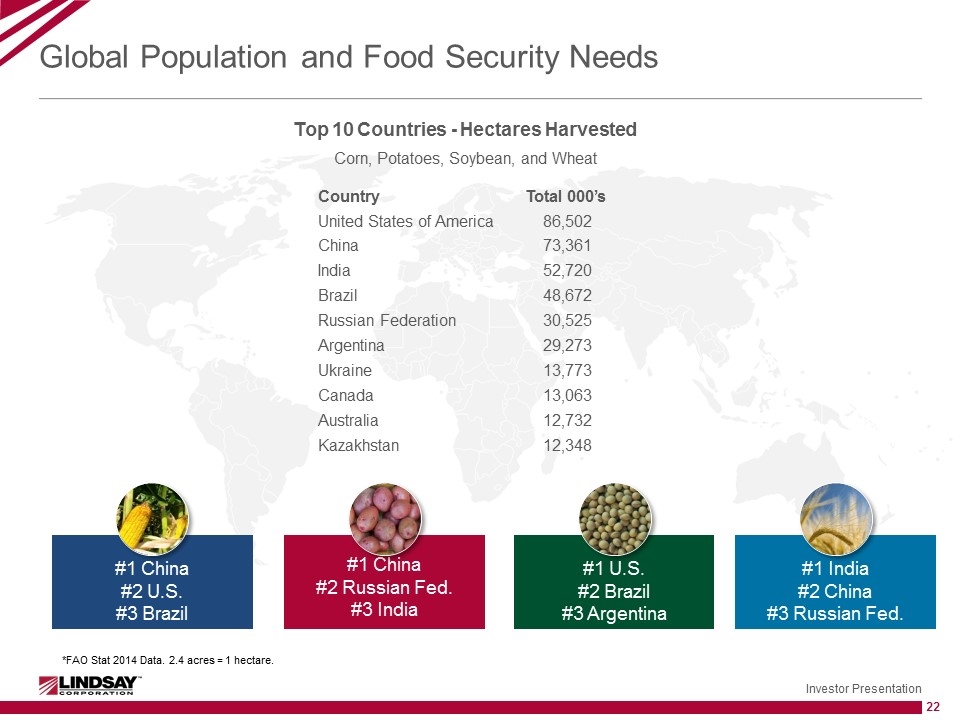
Global Population and Food Security Needs #1 China #2 U.S. #3 Brazil #1 China #2 Russian Fed. #3 India #1 U.S. #2 Brazil #3 Argentina #1 India #2 China #3 Russian Fed. Top 10 Countries - Hectares Harvested Corn, Potatoes, Soybean, and Wheat *FAO Stat 2014 Data. 2.4 acres = 1 hectare. Country Total 000’s United States of America 86,502 China 73,361 India 52,720 Brazil 48,672 Russian Federation 30,525 Argentina 29,273 Ukraine 13,773 Canada 13,063 Australia 12,732 Kazakhstan 12,348
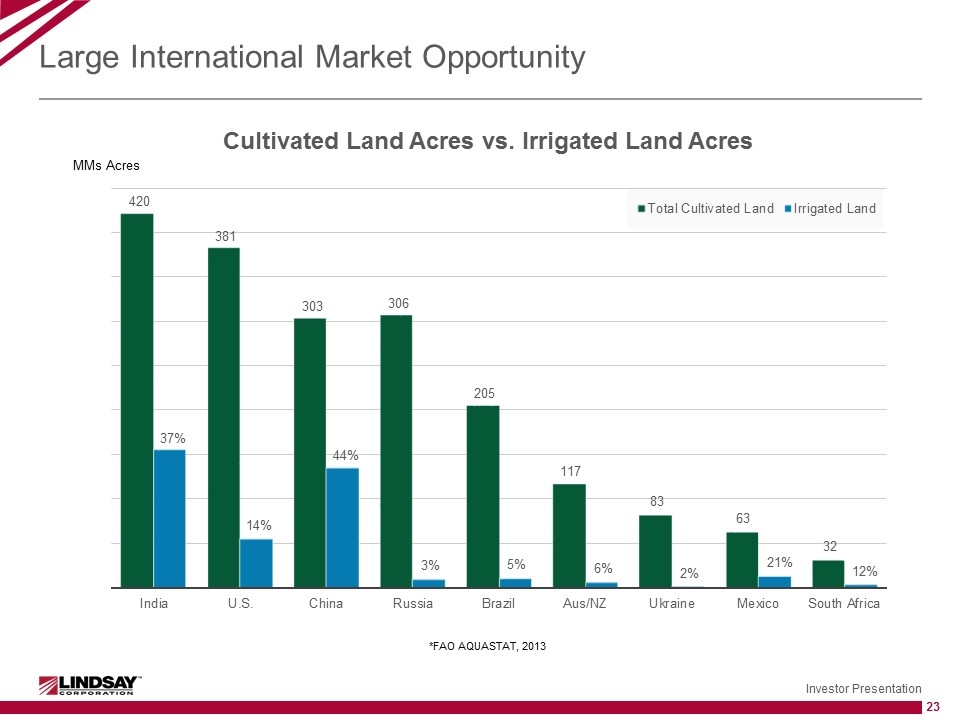
Large International Market Opportunity *FAO AQUASTAT, 2013
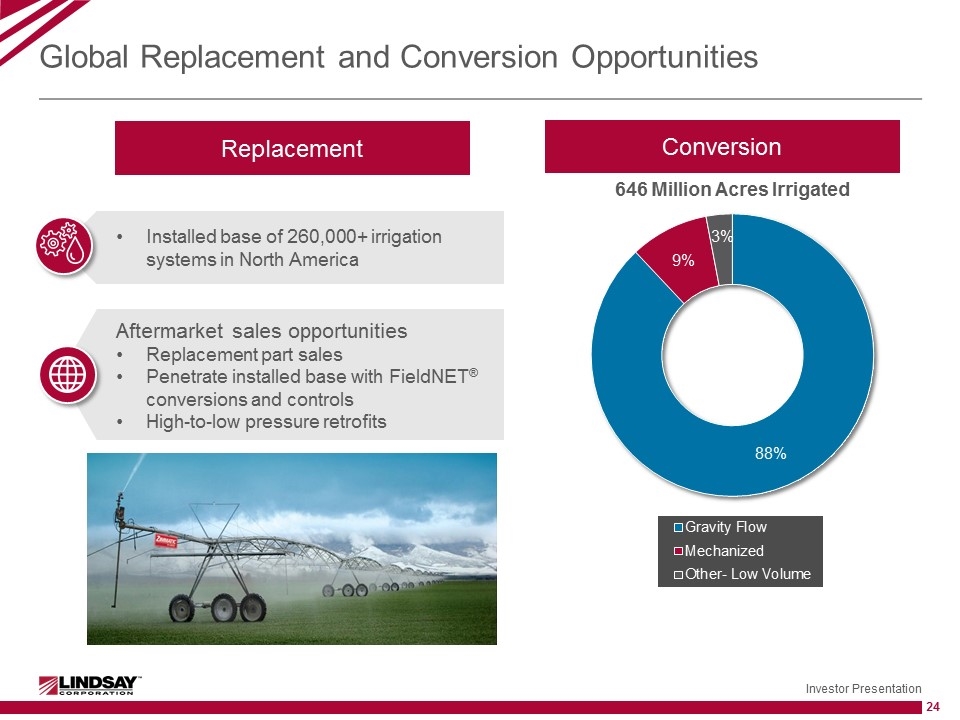
Aftermarket sales opportunities Replacement part sales Penetrate installed base with FieldNET® conversions and controls High-to-low pressure retrofits Global Replacement and Conversion Opportunities Conversion Installed base of 260,000+ irrigation systems in North America Replacement
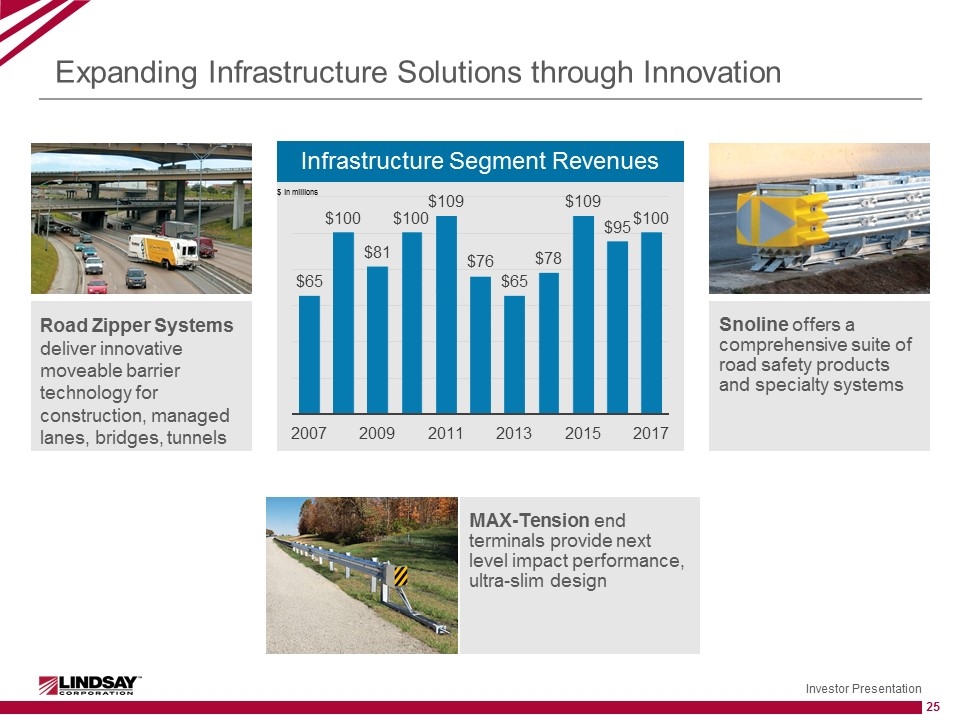
Road Zipper Systems deliver innovative moveable barrier technology for construction, managed lanes, bridges, tunnels MAX-Tension end terminals provide next level impact performance, ultra-slim design Snoline offers a comprehensive suite of road safety products and specialty systems Expanding Infrastructure Solutions through Innovation Infrastructure Segment Revenues $ in millions
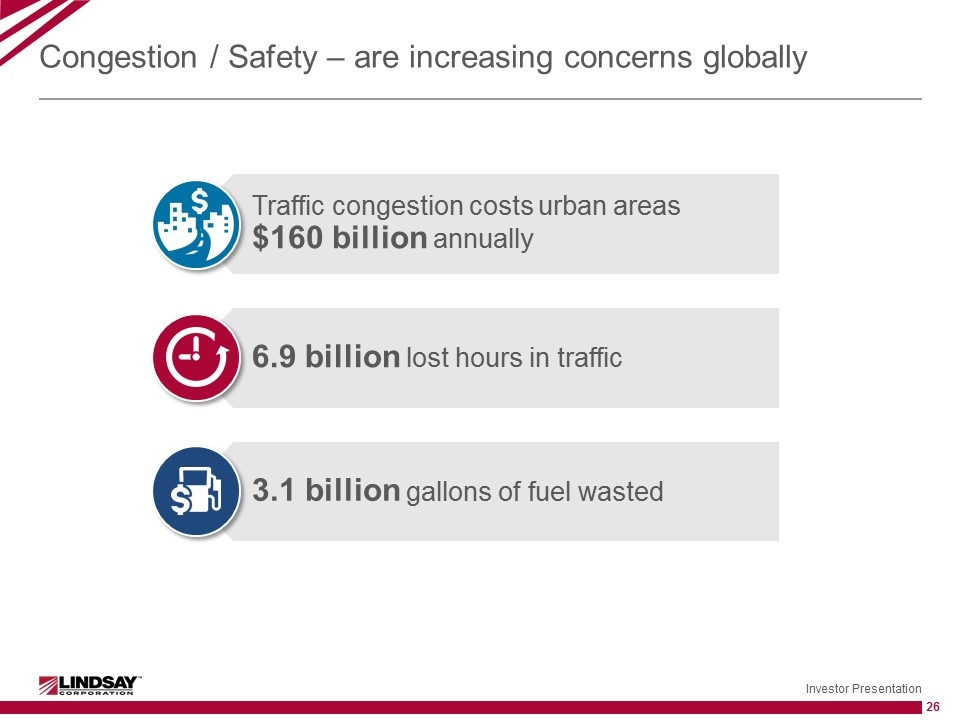
Congestion / Safety – are increasing concerns globally Traffic congestion costs urban areas $160 billion annually 6.9 billion lost hours in traffic 3.1 billion gallons of fuel wasted
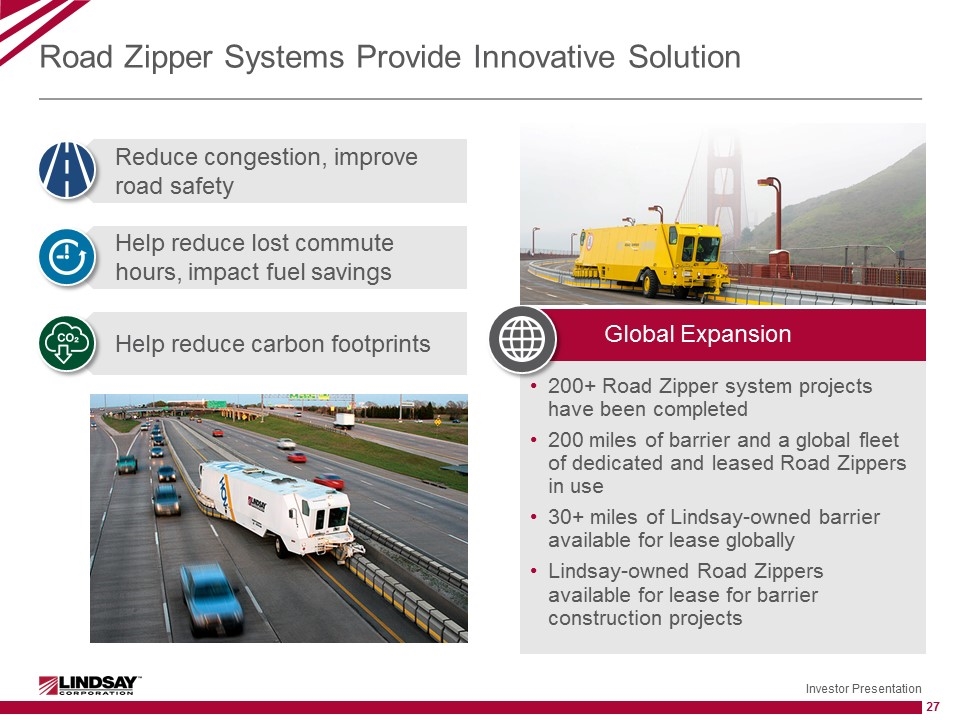
Road Zipper Systems Provide Innovative Solution Global Expansion 200+ Road Zipper system projects have been completed 200 miles of barrier and a global fleet of dedicated and leased Road Zippers in use 30+ miles of Lindsay-owned barrier available for lease globally Lindsay-owned Road Zippers available for lease for barrier construction projects Reduce congestion, improve road safety Help reduce lost commute hours, impact fuel savings Help reduce carbon footprints
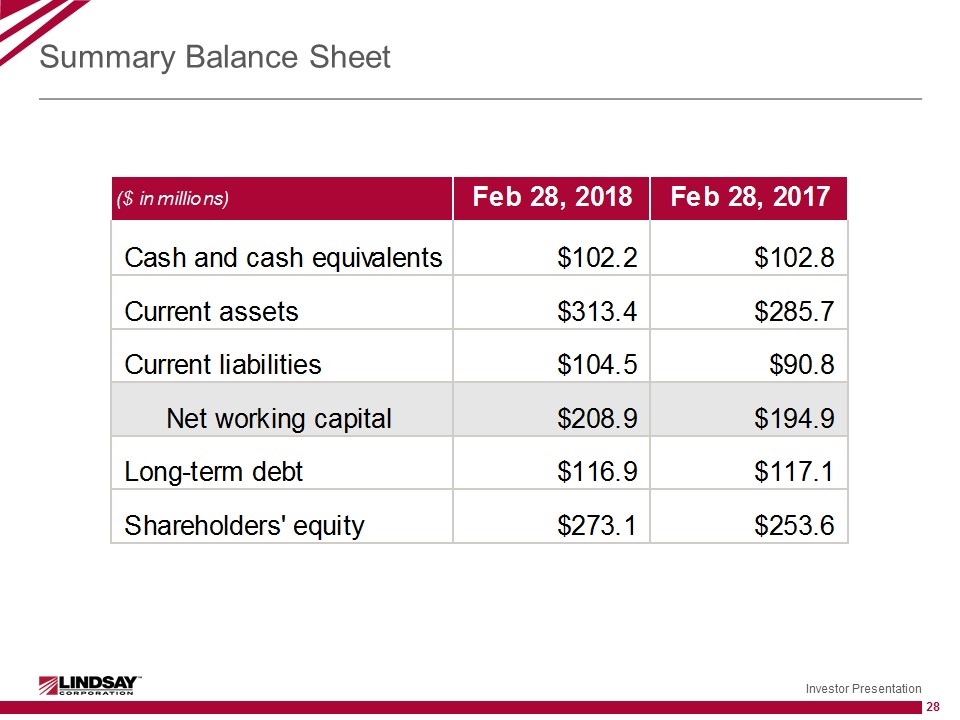
Summary Balance Sheet
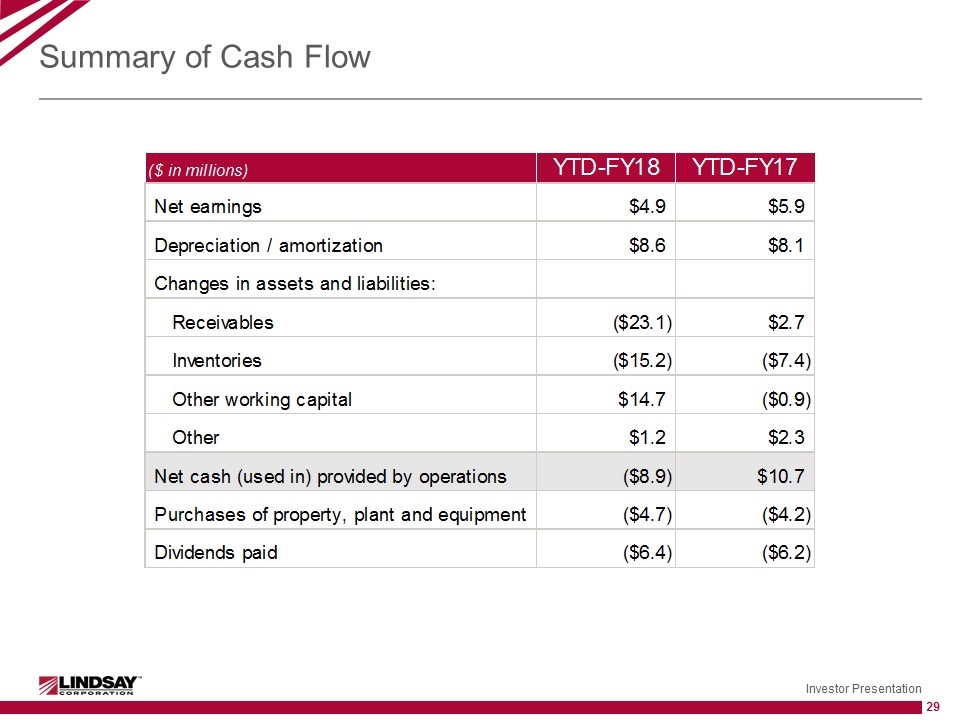
Summary of Cash Flow
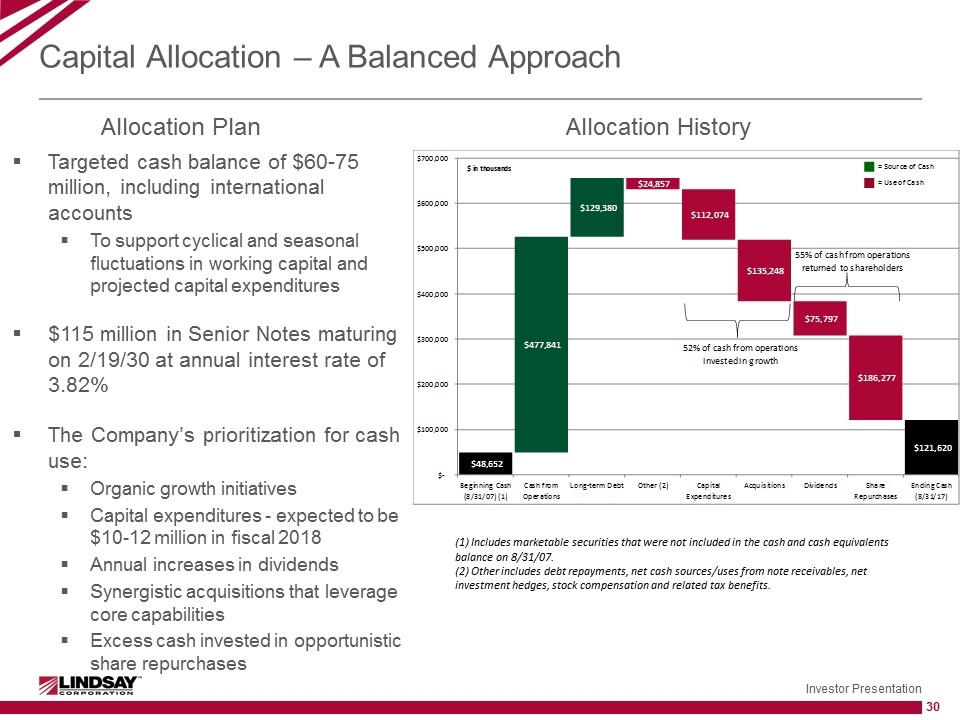
Capital Allocation – A Balanced Approach Allocation History (1) Includes marketable securities that were not included in the cash and cash equivalents balance on 8/31/07. (2) Other includes debt repayments, net cash sources/uses from note receivables, net investment hedges, stock compensation and related tax benefits. Targeted cash balance of $60-75 million, including international accounts To support cyclical and seasonal fluctuations in working capital and projected capital expenditures $115 million in Senior Notes maturing on 2/19/30 at annual interest rate of 3.82% The Company’s prioritization for cash use: Organic growth initiatives Capital expenditures - expected to be $10-12 million in fiscal 2018 Annual increases in dividends Synergistic acquisitions that leverage core capabilities Excess cash invested in opportunistic share repurchases Allocation Plan
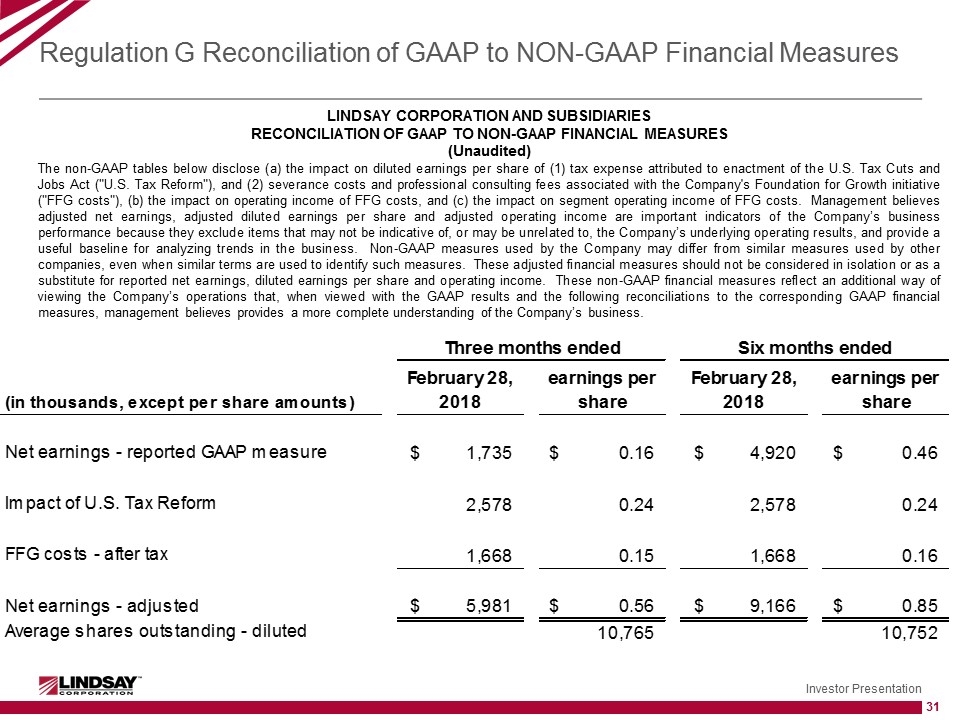
Regulation G Reconciliation of GAAP to NON-GAAP Financial Measures LINDSAY CORPORATION AND SUBSIDIARIES RECONCILIATION OF GAAP TO NON-GAAP FINANCIAL MEASURES (Unaudited) The non-GAAP tables below disclose (a) the impact on diluted earnings per share of (1) tax expense attributed to enactment of the U.S. Tax Cuts and Jobs Act ("U.S. Tax Reform"), and (2) severance costs and professional consulting fees associated with the Company's Foundation for Growth initiative ("FFG costs"), (b) the impact on operating income of FFG costs, and (c) the impact on segment operating income of FFG costs. Management believes adjusted net earnings, adjusted diluted earnings per share and adjusted operating income are important indicators of the Company’s business performance because they exclude items that may not be indicative of, or may be unrelated to, the Company’s underlying operating results, and provide a useful baseline for analyzing trends in the business. Non-GAAP measures used by the Company may differ from similar measures used by other companies, even when similar terms are used to identify such measures. These adjusted financial measures should not be considered in isolation or as a substitute for reported net earnings, diluted earnings per share and operating income. These non-GAAP financial measures reflect an additional way of viewing the Company’s operations that, when viewed with the GAAP results and the following reconciliations to the corresponding GAAP financial measures, management believes provides a more complete understanding of the Company’s business.
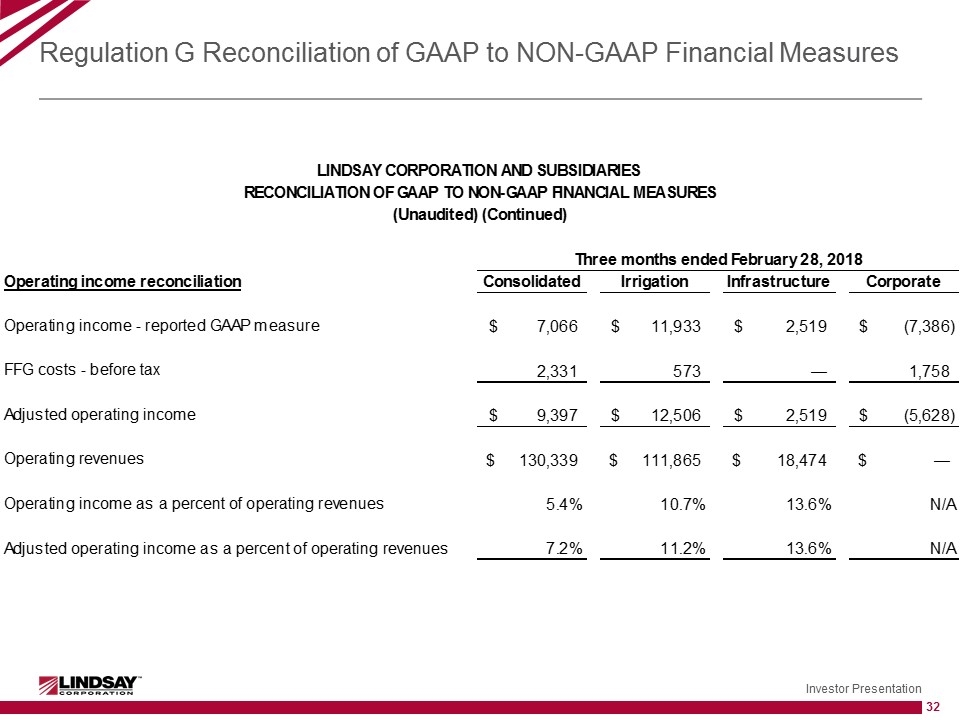
Regulation G Reconciliation of GAAP to NON-GAAP Financial Measures
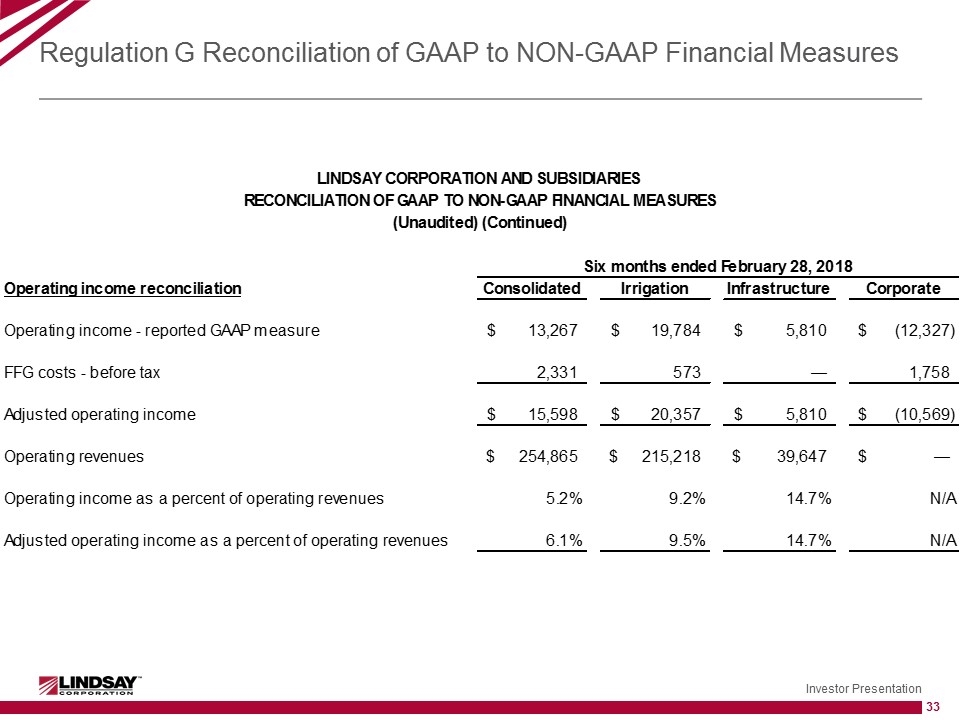
Regulation G Reconciliation of GAAP to NON-GAAP Financial Measures


