UNITED STATES
SECURITIES AND EXCHANGE COMMISSION
WASHINGTON, D.C. 20549
FORM N-CSRS
CERTIFIED SHAREHOLDER REPORT OF REGISTERED
MANAGEMENT INVESTMENT COMPANIES
Investment Company Act file number: 811-05617
SCM Trust
(Exact name of registrant as specified in charter)
1875 Lawrence Street, Suite 300
Denver, CO 80202
(Address of principal executive offices) (Zip code)
Steve Rogers
1875 Lawrence Street, Suite 300
Denver, CO 80202
(Name and address of agent for service)
Registrant’s telephone number, including area code: (800) 955-9988.
Date of fiscal year end: December 31
Date of reporting period: June 30, 2021
ITEM 1. REPORTS TO STOCKHOLDERS


SEMI-ANNUAL REPORT
June 30, 2021
Shelton BDC Income Fund
Shelton Emerging Markets Fund
Shelton International Select Equity Fund
Shelton Tactical Credit Fund
This report is intended only for the information of shareholders or those who have received the offering prospectus covering shares of beneficial interest of The SCM Trust which contains information about the management fee and other costs. Investments in shares of The SCM Trust are neither insured nor guaranteed by the U.S. Government.
Table of Contents | June 30, 2021 |
| | |
About Your Fund’s Expenses | 2 |
Top Holdings and Sector Breakdown | 3 |
Portfolio of Investments | 5 |
Statements of Assets and Liabilities | 9 |
Statements of Operations | 10 |
Statements of Changes in Net Assets | 11 |
Statement of Cash Flows | 14 |
Financial Highlights | 15 |
Notes to Financial Statements | 23 |
Additional Information | 30 |
Board of Trustees and Executive Officers | 31 |
Board Approval of the Investment Advisory Agreement | 32 |
1
About Your Fund’s Expenses (Unaudited) | June 30, 2021 |
As a shareholder of the Funds, you incur two types of costs: (1) transaction costs, including sales charges (loads) on purchase payments, reinvested dividends, or other distributions, redemption fees, and exchange fees; and (2) ongoing costs, including management fees, distribution fees and other Fund expenses. Operating expenses, which are deducted from the Funds’ gross income, directly reduce the investment return of the Funds. The Funds’ expenses are expressed as a percentage of its average net assets. This figure is known as the expense ratio. This example is intended to help you understand your ongoing cost (in dollars) of investing in the Funds and to compare these costs with the ongoing costs of investing in other mutual funds. The examples are based on an investment of $1,000 invested at the beginning of the period and held for the entire period from January 1, 2021 to June 30, 2021.
Actual Expenses
The first line of the tables below provides information about actual account values and actual expenses. You may use the information in this line, together with the amount you invested, to estimate the expenses you have paid over the period. Simply divide your account value by $1,000 (for example, an $8,600 account value divided by $1,000 = 8.6), then multiply the result by the number in the first line under the heading entitled “Expenses Paid During Period” to estimate the expenses you paid on your account during this period.
Hypothetical Example for Comparison Purposes
The second line of the table provides information about hypothetical account values and hypothetical expenses based on the Funds’ actual expense ratio and an assumed rate of return of 5% per year before expenses, which is not the Funds’ actual return. The hypothetical account values and expenses may not be used to estimate the actual ending account balance or expenses you paid for the period. You may use this information to compare the ongoing costs of investing in the Funds and other funds. To do so, compare this 5% hypothetical example with the 5% hypothetical examples that appear in the shareholder reports of the other funds. The Funds do not charge any sales charges. Please note that the expenses shown in the tables are meant to highlight your ongoing costs only and do not reflect any transactional cost, such as sales charges (loads), redemption fees, or exchange fees. Therefore, the second line of the tables are useful in comparing ongoing costs only, and will not help you determine the relative total costs of owning different funds. In addition, if these transactional costs were included, your costs would have been higher. The calculations assume no shares were bought or sold during the period.
| | Beginning
Account Value
January 1, 2021 | Ending
Account Value
June 30,
2021 | Expenses Paid
During Period* | Net Annual
Expense Ratio |
Shelton BDC Income Fund | | | | |
Institutional Shares | | | | |
Based on Actual Fund Return | $ 1,000 | $ 1,205 | $ 6.83 | 1.25% |
Based on Hypothetical 5% Return before expenses | $ 1,000 | $ 1,019 | $ 6.26 | 1.25% |
Investor Shares | | | | |
Based on Actual Fund Return | $ 1,000 | $ 1,204 | $ 8.20 | 1.50% |
Based on Hypothetical 5% Return before expenses | $ 1,000 | $ 1,018 | $ 7.51 | 1.50% |
| | | | | |
Shelton Emerging Markets Fund | | | | |
Institutional Shares | | | | |
Based on Actual Fund Return | $ 1,000 | $ 1,025 | $ 7.73 | 1.54% |
Based on Hypothetical 5% Return before expenses | $ 1,000 | $ 1,017 | $ 7.70 | 1.54% |
Investor Shares | | | | |
Based on Actual Fund Return | $ 1,000 | $ 1,024 | $ 9.03 | 1.80% |
Based on Hypothetical 5% Return before expenses | $ 1,000 | $ 1,016 | $ 9.00 | 1.80% |
| | | | | |
Shelton International Select Equity Fund | | | | |
Institutional Shares | | | | |
Based on Actual Fund Return | $ 1,000 | $ 1,058 | $ 5.10 | 1.00% |
Based on Hypothetical 5% Return before expenses | $ 1,000 | $ 1,020 | $ 5.01 | 1.00% |
Investor Shares | | | | |
Based on Actual Fund Return | $ 1,000 | $ 1,057 | $ 6.32 | 1.24% |
Based on Hypothetical 5% Return before expenses | $ 1,000 | $ 1,019 | $ 6.21 | 1.24% |
| | | | | |
Shelton Tactical Credit Fund | | | | |
Institutional Shares | | | | |
Based on Actual Fund Return | $ 1,000 | $ 1,072 | $ 11.41 | 2.22% |
Based on Hypothetical 5% Return before expenses | $ 1,000 | $ 1,014 | $ 11.09 | 2.22% |
Investor Shares | | | | |
Based on Actual Fund Return | $ 1,000 | $ 1,071 | $ 12.63 | 2.46% |
Based on Hypothetical 5% Return before expenses | $ 1,000 | $ 1,013 | $ 12.28 | 2.46% |
* | Expenses are equal to the Fund’s annualized expense ratio listed in the “Net Annual Expense Ratio” column, multiplied by the average account value over the period, multiplied by 181/365 (to reflect the one-half year period). |
2
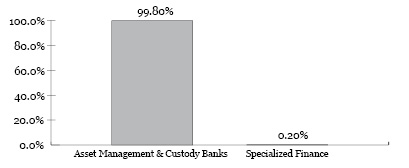
Top Holdings and Sector Breakdown (Unaudited) | June 30, 2021 |
Shelton BDC Income Fund
Security | | Market Value
(in U.S.
Dollars) | | | Percentage
of Total
Investment | | 
|
1 | Ares Capital Corp | | | $549,715 | | | | 13.4 | % |
2 | Owl Rock Capital Corp | | | 494,812 | | | | 12.1 | % |
3 | Hercules Capital Inc | | | 379,585 | | | | 9.3 | % |
4 | FS KKR Capital Corp | | | 359,571 | | | | 8.8 | % |
5 | Sixth Street Specialty Lending Inc | | | 308,441 | | | | 7.5 | % |
6 | Main Street Capital Corp | | | 279,412 | | | | 6.8 | % |
7 | Oaktree Specialty Lending Corp | | | 262,703 | | | | 6.4 | % |
8 | Barings BDC Inc | | | 228,096 | | | | 5.6 | % |
9 | Golub Capital BDC Inc | | | 212,025 | | | | 5.2 | % |
10 | SuRo Capital Corp | | | 188,860 | | | | 4.6 | % |
Shelton Emerging Markets Fund
Security | | Market Value
(in U.S.
Dollars) | | | Percentage
of Total
Investment | | 
|
1 | Samsung Electronics Co Ltd | | | $2,048,223 | | | | 7.2 | % |
2 | Taiwan Semiconductor Manufacturing Co Ltd | | | 1,966,422 | | | | 6.9 | % |
3 | eMemory Technology Inc | | | 1,280,180 | | | | 4.5 | % |
4 | Accton Technology Corp | | | 1,188,895 | | | | 4.2 | % |
5 | Infosys Ltd | | | 1,185,538 | | | | 4.2 | % |
6 | HDFC Bank Ltd | | | 1,169,554 | | | | 4.1 | % |
7 | Kimberly-Clark de Mexico | | | 1,168,846 | | | | 4.1 | % |
8 | China Meidong Auto Holdings Ltd | | | 1,154,944 | | | | 4.1 | % |
9 | MediaTek Inc | | | 1,151,840 | | | | 4.1 | % |
10 | Haier Smart Home Co Ltd | | | 1,103,472 | | | | 3.9 | % |
| | | | | | | | | | | | | | |
3
Top Holdings and Sector Breakdown (Unaudited) (Continued) | June 30, 2021 |
Shelton International Select Equity Fund
Security | | Market Value
(in U.S.
Dollars) | | | Percentage
of Total
Investment | | 
|
1 | Element Fleet Management Corp | | $ | 8,755,744 | | | | 5.5% | |
2 | CRH PLC | | | 8,421,163 | | | | 5.3% | |
3 | ASML Holding NV | | | 7,286,289 | | | | 4.6% | |
4 | DBS Group Holdings Ltd | | | 6,884,287 | | | | 4.3% | |
5 | Taiwan Semiconductor Manufacturing Co Ltd | | | 6,091,151 | | | | 3.8% | |
6 | Nestle SA | | | 6,034,672 | | | | 3.8% | |
7 | Kimberly-Clark de Mexico SAB de CV | | | 5,862,689 | | | | 3.7% | |
8 | AIA Group Ltd | | | 5,781,911 | | | | 3.6% | |
9 | KBC Group NV | | | 5,762,318 | | | | 3.6% | |
10 | Constellation Software Inc | | | 5,512,608 | | | | 3.5% | |
Shelton Tactical Credit Fund — Long Positions
Security | | Market Value
(in U.S.
Dollars) | | | Percentage
of Total
Investment | | 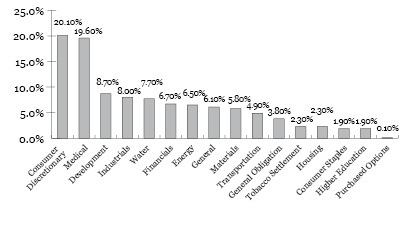
|
1 | Iron Mountain Inc, 4.875%, 9/15/2029 (144A) | | $ | 2,064,400 | | | | 4.0% | |
2 | Massachusetts Development Finance Agency, 5.000%, 7/1/2044 | | | 2,011,400 | | | | 3.9% | |
3 | Bay Area Toll Authority, 0.010%, 4/1/2053 | | | 2,000,000 | | | | 3.8% | |
4 | City of Murray UT, 0.010%, 5/15/2036 | | | 2,000,000 | | | | 3.8% | |
5 | City of New York NY, 0.010%, 10/1/2046 | | | 2,000,000 | | | | 3.8% | |
6 | Massachusetts Water Resources Authority, 0.030%, 11/1/2026 | | | 2,000,000 | | | | 3.8% | |
7 | New York City Transitional Finance Authority Future Tax Secured Revenue, 0.010%, 11/1/2042 | | | 2,000,000 | | | | 3.8% | |
8 | New York City Water & Sewer System, 0.010%, 6/15/2050 | | | 2,000,000 | | | | 3.8% | |
9 | State of Ohio, 0.020%, 1/1/2052 | | | 2,000,000 | | | | 3.8% | |
10 | Station Casinos LLC, 4.500%, 2/15/2028 (144A) | | | 1,932,386 | | | | 3.7% | |
Shelton Tactical Credit Fund — Short Positions
Security | | Market Value
(in U.S.
Dollars) | | | Percentage
of Total
Investment | | 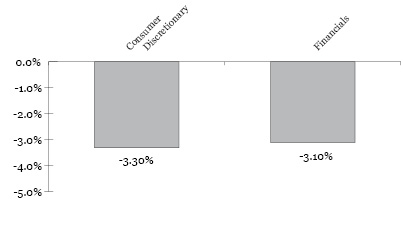
|
1 | Wynn Las Vegas LLC / Wynn Las Vegas Capital Corp, 5.500%, 03/01/2025 | | $ | (1,722,976 | ) | | | -3.3% | |
2 | Navient Corp, 5.875%, 10/25/2024 | | | (1,618,125 | ) | | | -3.1% | |
| | | | | | | | | | |
4
Shelton BDC Income Fund Portfolio of Investments (Expressed in U.S. Dollars) (Unaudited) June 30, 2021 |
Security Description | | Shares | | | Value | |
Common Stock (99.31%) | | | | | | | | |
| | | | | | | | | |
Financial (99.31%) | | | | | | | | |
Diversified Financial Services (0.47%) | | | | | | | | |
Medley Management Inc* | | | 1,863 | | | $ | 11,476 | |
Newstar Financial Inc CVR*,(a) | | | 100,410 | | | | 8,033 | |
| | | | | | | | 19,509 | |
Investment Company (98.84%) | | | | | | | | |
Apollo Investment Corp | | | 5,076 | | | | 69,287 | |
Ares Capital Corp | | | 28,061 | | | | 549,715 | |
Barings BDC Inc | | | 21,600 | | | | 228,096 | |
BlackRock TCP Capital Corp | | | 6,200 | | | | 85,684 | |
Capital Southwest Corp | | | 5,500 | | | | 127,765 | |
FS KKR Capital Corp | | | 16,716 | | | | 359,571 | |
Goldman Sachs BDC Inc | | | 2,580 | | | | 50,568 | |
Golub Capital BDC Inc | | | 13,750 | | | | 212,025 | |
Hercules Capital Inc | | | 22,250 | | | | 379,585 | |
Main Street Capital Corp | | | 6,800 | | | | 279,412 | |
New Mountain Finance Corp | | | 11,900 | | | | 156,723 | |
Oaktree Specialty Lending Corp | | | 39,268 | | | | 262,703 | |
Owl Rock Capital Corp | | | 34,675 | | | | 494,812 | |
Saratoga Investment Corp | | | 6,100 | | | | 163,907 | |
Sixth Street Specialty Lending Inc | | | 13,900 | | | | 308,441 | |
SLR Investment Corp | | | 4,429 | | | | 82,557 | |
SuRo Capital Corp | | | 14,000 | | | | 188,860 | |
TriplePoint Venture Growth BDC Corp | | | 4,728 | | | $ | 71,818 | |
| | | | | | | | 4,071,529 | |
| | | | | | | | | |
Total Common Stock (Cost $3,783,605) | | | | | | | 4,091,038 | |
| | | | | | | | | |
Total Investments (Cost $3,783,605)(b) (99.31%) | | | | | | $ | 4,091,038 | |
Other Net Assets (0.69%) | | | | | | | 28,276 | |
Net Assets (100.00%) | | | | | | $ | 4,119,314 | |
* | Non-income producing security. |
(a) | Level 3 security fair valued under procedures established by the Board of Trustees, represents 0.20% of net assets. The total value of the fair value security is $8,033. |
(b) | Aggregate cost for federal income tax purposes is $3,790,802 |
At June 30, 2021, unrealized appreciation/(depreciation) of securities for federal income tax purposes is as follows:
Unrealized appreciation | | $ | 527,362 | |
Unrealized depreciation | | | (227,126 | ) |
Net unrealized appreciation | | $ | 300,236 | |
Shelton Emerging Markets Fund Portfolio of Investments (Expressed in U.S. Dollars) (Unaudited) June 30, 2021 |
Security Description | | Shares | | | Value | |
Common Stock (93.51%) | | | | | | | | |
| | | | | | | | | |
Argentina (2.60%) | | | | | | | | |
MercadoLibre Inc* | | | 505 | | | $ | 786,684 | |
| | | | | | | | | |
Brazil (7.90%) | | | | | | | | |
Arco Platform Ltd* | | | 33,230 | | | | 1,018,832 | |
Notre Dame Intermedica Participacoes SA | | | 37,400 | | | | 639,901 | |
Sul America SA | | | 105,769 | | | | 737,053 | |
Total Brazil | | | | | | | 2,395,786 | |
| | | | | | | | | |
China (15.37%) | | | | | | | | |
Autohome Inc | | | 6,300 | | | | 402,948 | |
China Meidong Auto Holdings Ltd | | | 212,000 | | | | 1,154,944 | |
Haier Smart Home Co Ltd | | | 316,400 | | | | 1,103,472 | |
New Oriental Education & Technology Group Inc* | | | 57,660 | | | | 473,557 | |
Ping An Insurance Group Co of China Ltd | | | 66,200 | | | | 647,131 | |
Xinyi Solar Holdings Ltd | | | 407,000 | | | | 876,036 | |
Total China | | | | | | | 4,658,088 | |
| | | | | | | | | |
India (7.77%) | | | | | | | | |
HDFC Bank Ltd* | | | 15,995 | | | | 1,169,554 | |
Infosys Ltd | | | 55,948 | | | | 1,185,538 | |
Total India | | | | | | | 2,355,092 | |
| | | | | | | | | |
Indonesia (10.41%) | | | | | | | | |
Ace Hardware Indonesia Tbk PT | | | 7,477,000 | | | | 645,676 | |
Bank Rakyat Indonesia Persero Tbk PT | | | 3,856,000 | | | | 1,048,428 | |
Indofood CBP Sukses Makmur Tbk PT | | | 993,000 | | | | 558,410 | |
Sarana Menara Nusantara Tbk PT | | | 10,537,900 | | | | 901,962 | |
Total Indonesia | | | | | | | 3,154,476 | |
| | | | | | | | | |
Mexico (7.37%) | | | | | | | | |
Kimberly-Clark de Mexico SAB de CV | | | 658,000 | | | | 1,168,846 | |
Regional SAB de CV | | | 180,000 | | | | 1,066,690 | |
Total Mexico | | | | | | | 2,235,536 | |
| | | | | | | | | |
South Korea (12.35%) | | | | | | | | |
Dentium Co Ltd | | | 15,000 | | | | 864,432 | |
Samsung Electronics Co Ltd | | | 28,612 | | | | 2,048,223 | |
Samsung SDI Co Ltd | | | 1,342 | | | | 830,883 | |
Total South Korea | | | | | | | 3,743,538 | |
| | | | | | | | | |
Taiwan (25.47%) | | | | | | | | |
Accton Technology Corp | | | 100,400 | | | | 1,188,895 | |
Chailease Holding Co Ltd | | | 122,000 | | | | 886,676 | |
eMemory Technology Inc | | | 26,700 | | | | 1,280,180 | |
MediaTek Inc | | | 33,400 | | | | 1,151,840 | |
Sporton International Inc | | | 61,000 | | | | 526,095 | |
Taiwan Semiconductor Manufacturing Co Ltd | | | 91,300 | | | | 1,966,422 | |
Voltronic Power Technology Corp | | | 15,000 | | | | 723,602 | |
Total Taiwan | | | | | | | 7,723,710 | |
| | | | | | | | | |
Thailand (4.27%) | | | | | | | | |
Bangkok Bank PCL | | | 223,000 | | | | 786,948 | |
Charoen Pokphand Foods PCL | | | 614,000 | | | | 508,104 | |
Total Thailand | | | | | | | 1,295,052 | |
See accompanying notes to financial statements.
5
Shelton Emerging Markets Fund Portfolio of Investments (Expressed in U.S. Dollars) (Unaudited) (Continued) June 30, 2021 |
Security Description | | Shares | | | Value | |
Total Common Stock (Cost $20,445,726) | | | | | | $ | 28,347,962 | |
| | | | | | | | | |
Total Investments (Cost $20,445,726)(a) (93.51%) | | | | | | $ | 28,347,962 | |
Other Net Assets (6.49%) | | | | | | | 1,966,023 | |
Net Assets (100.00%) | | | | | | $ | 30,313,985 | |
* | Non-income producing security. |
(a) | Aggregate cost for federal income tax purposes is $21,004,661 |
At June 30, 2021, unrealized appreciation/(depreciation) of securities for federal income tax purposes is as follows:
Unrealized appreciation | | $ | 7,982,477 | |
Unrealized depreciation | | | (639,176 | ) |
Net unrealized appreciation | | $ | 7,343,301 | |
Shelton International Select Equity Fund Portfolio of Investments (Expressed in U.S. Dollars) (Unaudited) June 30, 2021 |
Security Description | | Shares | | | Value | |
Common Stock (91.99%) | | | | | | | | |
| | | | | | | | | |
Belgium (3.32%) | | | | | | | | |
KBC Group NV | | | 75,568 | | | $ | 5,762,318 | |
| | | | | | | | | |
Canada (12.45%) | | | | | | | | |
CAE Inc* | | | 131,311 | | | | 4,048,659 | |
Constellation Software Inc | | | 3,636 | | | | 5,512,608 | |
Element Fleet Management Corp | | | 749,809 | | | | 8,755,744 | |
Linamar Corp | | | 52,000 | | | | 3,264,960 | |
Total Canada | | | | | | | 21,581,971 | |
| | | | | | | | | |
China (5.59%) | | | | | | | | |
China Meidong Auto Holdings Ltd | | | 718,000 | | | | 3,915,515 | |
New Oriental Education & Technology Group Inc* | | | 162,400 | | | | 1,338,372 | |
Ping An Insurance Group Co of China Ltd | | | 453,900 | | | | 4,444,986 | |
Total China | | | | | | | 9,698,873 | |
| | | | | | | | | |
France (9.19%) | | | | | | | | |
BNP Paribas SA | | | 84,387 | | | | 5,290,944 | |
L’Oreal SA | | | 11,937 | | | | 5,319,861 | |
Valeo | | | 176,879 | | | | 5,321,634 | |
Total France | | | | | | | 15,932,439 | |
| | | | | | | | | |
Germany (5.00%) | | | | | | | | |
adidas AG | | | 10,962 | | | | 4,080,650 | |
MTU Aero Engines AG | | | 18,496 | | | | 4,582,100 | |
Total Germany | | | | | | | 8,662,750 | |
| | | | | | | | | |
Great Britain (5.79%) | | | | | | | | |
Intertek Group PLC | | | 68,135 | | | | 5,205,118 | |
Unilever PLC | | | 82,562 | | | | 4,829,877 | |
Total Great Britain | | | | | | | 10,034,995 | |
| | | | | | | | | |
Hong Kong (6.09%) | | | | | | | | |
AIA Group Ltd | | | 465,300 | | | | 5,781,911 | |
Techtronic Industries Co Ltd | | | 273,400 | | | | 4,773,855 | |
Total Hong Kong | | | | | | | 10,555,766 | |
| | | | | | | | | |
India (2.49%) | | | | | | | | |
HDFC Bank Ltd* | | | 59,159 | | | | 4,325,706 | |
| | | | | | | | | |
Indonesia (2.55%) | | | | | | | | |
Bank Rakyat Indonesia Persero Tbk PT | | | 16,268,450 | | | | 4,420,531 | |
| | | | | | | | | |
Ireland (7.65%) | | | | | | | | |
CRH PLC | | | 167,084 | | | | 8,421,163 | |
Smurfit Kappa Group PLC | | | 89,315 | | | | 4,845,781 | |
Total Ireland | | | | | | | 13,266,944 | |
Japan (5.03%) | | | | | | | | |
Daikin Industries Ltd | | | 11,400 | | | | 2,125,110 | |
Nomura Research Institute Ltd | | | 134,700 | | | | 4,460,064 | |
Santen Pharmaceutical Co Ltd | | | 155,500 | | | | 2,143,571 | |
Total Japan | | | | | | | 8,728,745 | |
| | | | | | | | | |
Mexico (3.38%) | | | | | | | | |
Kimberly-Clark de Mexico SAB de CV | | | 3,296,500 | | | | 5,862,689 | |
| | | | | | | | | |
Netherlands (5.54%) | | | | | | | | |
ASML Holding NV | | | 10,547 | | | | 7,286,289 | |
Topicus.com Inc* | | | 31,858 | | | | 2,316,735 | |
Total Netherlands | | | | | | | 9,603,024 | |
| | | | | | | | | |
Singapore (3.97%) | | | | | | | | |
DBS Group Holdings Ltd | | | 310,428 | | | | 6,884,287 | |
| | | | | | | | | |
Switzerland (7.98%) | | | | | | | | |
Givaudan SA | | | 1,004 | | | | 4,673,784 | |
Nestle SA | | | 48,378 | | | | 6,034,672 | |
Straumann Holding AG | | | 1,964 | | | | 3,133,986 | |
Total Switzerland | | | | | | | 13,842,442 | |
| | | | | | | | | |
Taiwan (3.51%) | | | | | | | | |
Taiwan Semiconductor Manufacturing Co Ltd | | | 50,692 | | | | 6,091,151 | |
| | | | | | | | | |
Thailand (2.46%) | | | | | | | | |
Bangkok Bank PCL | | | 1,211,100 | | | | 4,270,025 | |
| | | | | | | | | |
Total Common Stock (Cost $132,078,663) | | | | | | | 159,524,656 | |
| | | | | | | | | |
Total Investments (Cost $132,078,663)(a) (91.99%) | | | | | | $ | 159,524,656 | |
Other Net Assets (8.01%) | | | | | | | 13,897,689 | |
Net Assets (100.00%) | | | | | | $ | 173,422,345 | |
* | Non-income producing security. |
(a) | Aggregate cost for federal income tax purposes is $134,306,434 |
At June 30, 2021, unrealized appreciation/(depreciation) of securities for federal income tax purposes is as follows:
Unrealized appreciation | | $ | 28,578,015 | |
Unrealized depreciation | | | (3,359,793 | ) |
Net unrealized appreciation | | $ | 25,218,222 | |
See accompanying notes to financial statements.
6
Shelton Tactical Credit Fund Portfolio of Investments (Expressed in U.S. Dollars) (Unaudited) June 30, 2021 |
Security Description /
Long Positions | | Shares | | | Value | |
Common Stock (0.84%) | | | | | | | | |
| | | | | | | | | |
Consumer, Cyclical (0.25%) | | | | | | | | |
Copper Earnout Trust(a) | | | 891 | | | $ | 9,133 | |
Propco Earnout Trust(a) | | | 6,682 | | | | 120,276 | |
| | | | | | | | 129,409 | |
| | | | | | | | | |
Consumer, Non-cyclical (0.58%) | | | | | | | | |
Pyxus International Inc* | | | 83,441 | | | | 304,560 | |
| | | | | | | | | |
Energy (0.01%) | | | | | | | | |
CHC Group LLC*,(b) | | | 187,153 | | | | 6,363 | |
| | | | | | | | | |
Total Common Stock (Cost $2,228,812) | | | | | | | 440,332 | |
| | | | | | | | | |
| | Par Value | | | | |
Corporate Debt (46.27%) | | | | | | | | |
| | | | | | | | |
Basic Materials (5.74%) | | | | | | | | |
Cleveland-Cliffs Inc, 9.875%, 10/17/2025 (144A)(c) | | $ | 1,239,000 | | | | 1,452,120 | |
Ferroglobe PLC / Globe Specialty Metals Inc, 9.375%, 3/1/2022 (144A)(c) | | | 1,500,000 | | | | 1,567,500 | |
Total Basic Materials | | | | | | | 3,019,620 | |
| | | | | | | | | |
Consumer, Cyclical (21.53%) | | | | | | | | |
The Bon-Ton Department Stores Inc, 8.000%, 6/15/2021(d) | | | 4,958,932 | | | | 37,192 | |
Boyd Gaming Corp, 4.750%, 6/15/2031 (144A)(c) | | | 500,000 | | | | 519,515 | |
Carnival Corp, 5.750%, 3/1/2027 (144A)(c) | | | 1,750,000 | | | | 1,833,125 | |
Hawaiian Brand Intellectual Property Ltd / HawaiianMiles Loyalty Ltd, 5.750%, 1/20/2026 (144A)(c) | | | 1,750,000 | | | | 1,881,250 | |
JC Penney Corp Inc, 5.875%, 7/1/2023 (144A)(a),(d) | | | 1,400,000 | | | | 3,500 | |
The Michaels Cos Inc, 5.250%, 5/1/2028 (144A)(c) | | | 1,100,000 | | | | 1,128,523 | |
PetSmart Inc / PetSmart Finance Corp, 7.750%, 2/15/2029 (144A)(c) | | | 750,000 | | | | 824,828 | |
Six Flags Entertainment Corp, 4.875%, 7/31/2024 (144A)(c) | | | 1,500,000 | | | | 1,505,625 | |
Spirit Loyalty Cayman Ltd / Spirit IP Cayman Ltd, 8.000%, 9/20/2025 (144A) | | | 538,554 | | | | 609,105 | |
Station Casinos LLC, 4.500%, 2/15/2028 (144A)(c) | | | 1,900,000 | | | | 1,932,386 | |
Titan International Inc, 7.000%, 4/30/2028 (144A)(c) | | | 1,000,000 | | | | 1,046,250 | |
Total Consumer, Cyclical | | | | | | | 11,321,299 | |
| | | | | | | | | |
Consumer, Non-Cyclical (2.01%) | | | | | | | | |
Herc Holdings Inc, 5.500%, 7/15/2027 (144A)(c) | | | 1,000,000 | | | | 1,054,220 | |
| | | | | | | | | |
Energy (6.45%) | | | | | | | | |
Energy Ventures Gom LLC / EnVen Finance Corp, 11.750%, 4/15/2026 (144A)(c) | | | 1,000,000 | | | | 1,042,880 | |
Talos Production Inc, 12.000%, 1/15/2026(c) | | | 1,000,000 | | | | 1,060,000 | |
Transocean Inc, 7.500%, 1/15/2026 (144A)(c) | | | 1,500,000 | | | | 1,290,000 | |
Total Energy | | | | | | | 3,392,880 | |
Financial (6.63%) | | | | | | | | |
CBL & Associates LP, 4.600%, 10/15/2024(d) | | | 1,000,000 | | | | 562,500 | |
CBL & Associates LP, 5.950%, 12/15/2026(d) | | | 1,526,000 | | | | 858,375 | |
Iron Mountain Inc, 4.875%, 9/15/2029 (144A)(c) | | | 2,000,000 | | | | 2,064,400 | |
Total Financial | | | | | | | 3,485,275 | |
| | | | | | | | | |
Industrial (3.91%) | | | | | | | | |
Eletson Holdings Inc / Eletson Finance US LLC / Agathonissos Finance LLC, 9.625%, 1/15/2022 | | | 548,153 | | | | 187,057 | |
Scorpio Tankers Inc, 3.000%, 5/15/2022(c) | | | 1,875,000 | | | | 1,870,025 | |
Total Industrial | | | | | | | 2,057,082 | |
| | | | | | | | | |
Total Corporate Debt (Cost $24,572,618) | | | | | | | 24,330,376 | |
| | | | | | | | | |
Municipal Bonds (56.79%) | | | | | | | | |
| | | | | | | | | |
Development (8.67%) | | | | | | | | |
California Pollution Control Financing Authority, 7.500%, 12/1/2040 (144A)(c) | | | 1,500,000 | | | | 1,641,019 | |
California Pollution Control Financing Authority, 7.500%, 7/1/2032 (144A) | | | 250,000 | | | | 233,727 | |
California Pollution Control Financing Authority, 8.000%, 7/1/2039 (144A)(d) | | | 2,050,000 | | | | 1,332,500 | |
New York Transportation Development Corp, 4.000%, 4/30/2053(c) | | | 325,000 | | | | 378,877 | |
New York Transportation Development Corp, 5.000%, 10/1/2035(c) | | | 750,000 | | | | 972,097 | |
Total Development | | | | | | | 4,558,220 | |
| | | | | | | | | |
General Obligation (9.81%) | | | | | | | | |
City of New York NY, 0.010%, 10/1/2046(e) | | | 2,000,000 | | | | 2,000,000 | |
New York City Transitional Finance Authority Future Tax Secured Revenue, 0.010%, 11/1/2042(e) | | | 2,000,000 | | | | 2,000,000 | |
Puerto Rico Public Finance Corp, 5.500%, 8/1/2031(c),(d) | | | 400,000 | | | | 4,800 | |
Puerto Rico Sales Tax Financing Corp Sales Tax Revenue, 5.000%, 7/1/2058(c) | | | 1,000,000 | | | | 1,152,617 | |
Total General Obligation | | | | | | | 5,157,417 | |
| | | | | | | | | |
Higher Education (1.90%) | | | | | | | | |
Board of Regents of the University of Texas System, 0.010%, 8/1/2034(e) | | | 1,000,000 | | | | 1,000,000 | |
| | | | | | | | | |
Housing (2.27%) | | | | | | | | |
California Municipal Finance Authority, 5.000%, 5/15/2051(c) | | | 1,000,000 | | | | 1,194,757 | |
| | | | | | | | | |
Medical (19.38%) | | | | | | | | |
City of Murray UT, 0.010%, 5/15/2036(e) | | | 2,000,000 | | | | 2,000,000 | |
County of Cuyahoga OH, 5.500%, 2/15/2052(c) | | | 1,300,000 | | | | 1,543,924 | |
County of Cuyahoga OH, 5.500%, 2/15/2057(c) | | | 760,000 | | | | 900,823 | |
Illinois Finance Authority, 0.010%, 8/15/2049(e) | | | 500,000 | | | | 500,000 | |
Massachusetts Development Finance Agency, 5.000%, 7/1/2044(c) | | | 1,765,000 | | | | 2,011,400 | |
New York State Dormitory Authority, 5.000%, 8/1/2035(c) | | | 1,000,000 | | | | 1,231,246 | |
State of Ohio, 0.020%, 1/1/2052(e) | | | 2,000,000 | | | | 2,000,000 | |
Total Medical | | | | | | | 10,187,393 | |
See accompanying notes to financial statements.
7
Shelton Tactical Credit Fund Portfolio of Investments (Expressed in U.S. Dollars) (Unaudited) (Continued) June 30, 2021 |
Security Description /
Long Positions | | Par Value | | | Value | |
Tobacco Settlement (2.26%) | | | | | | | | |
Tobacco Settlement Financing Corp, 5.000%, 6/1/2046(c) | | $ | 1,000,000 | | | $ | 1,188,515 | |
| | | | | | | | | |
Transportation (4.89%) | | | | | | | | |
Bay Area Toll Authority, 0.010%, 4/1/2053(e) | | | 2,000,000 | | | | 2,000,000 | |
Texas Private Activity Bond Surface Transportation Corp, 7.000%, 12/31/2038(c) | | | 500,000 | | | | 569,389 | |
Total Transportation | | | | | | | 2,569,389 | |
| | | | | | | | | |
Water (7.61%) | | | | | | | | |
Massachusetts Water Resources Authority, 0.030%, 11/1/2026(e) | | | 2,000,000 | | | | 2,000,000 | |
New York City Water & Sewer System, 0.010%, 6/15/2050(e) | | | 2,000,000 | | | | 2,000,000 | |
Total Water | | | | | | | 4,000,000 | |
| | | | | | | | | |
Total Municipal Debt (Cost $23,758,297) | | | | | | | 29,855,691 | |
| | | | | | | | | |
Term Loans (1.42%) | | | | | | | | |
JC Penney, Penney Borrower LLC, 3M US LIBOR (floor 1.500%) + 9.500%, 12/07/2026(e) | | | 46,212 | | | | 44,941 | |
Pyxus International Loan, 3M US LIBOR (floor 1.500%) + 9.500%, 2/24/25(e) | | | 722,750 | | | | 704,081 | |
| | | | | | | | | |
Total Term Loans (Cost $2,372,965) | | | | | | | 749,022 | |
| | | | | | | | | |
| | Contracts | | | | |
Purchased Options - Puts (0.02%) | | | | | | | | |
| | | | | | | | | |
Reference Asset | | | | | | | | |
10-Year US Treasury Note Futures | | | | | | | | |
Notional amount $655,000, premiums paid $42,969, exercise price $131, expires 7/26/21* | | | 50 | | | | 5,469 | |
10-Year US Treasury Note Futures | | | | | | | | |
Notional amount $975,000, premiums paid $43,360, exercise price $130, expires 7/26/21* | | | 75 | | | | 2,344 | |
10-Year US Treasury Note Futures | | | | | | | | |
Notional amount $1,290,000, premiums paid $37,500, exercise price $129, expires 7/26/21* | | | 100 | | | | 1,563 | |
| | | | | | | | | |
Total Purchased Options - Puts (Cost $123,828) | | | | | | | 9,376 | |
| | | | | | | | | |
Total Long Positions (Cost $57,364,321)(f) (105.34%) | | | | | | | 55,384,797 | |
Liabilities in Excess of Other Assets (-5.34%) | | | | | | | (2,812,498 | ) |
Net Assets (100.00%) | | | | | | $ | 52,572,299 | |
Security Description /
Short Positions | | Par Value | | | Value | |
Short Corporate Debt (-6.36%) | | | | | | | | |
| | | | | | | | | |
Consumer, Cyclical (-3.28%) | | | | | | | | |
Wynn Las Vegas LLC / Wynn Las Vegas Capital Corp, 5.500%, 3/1/2025 (144A)(c) | | $ | (1,600,000 | ) | | $ | (1,722,976 | ) |
| | | | | | | | | |
Financial (-3.08%) | | | | | | | | |
Navient Corp, 5.875%, 10/25/2024(c) | | | (1,500,000 | ) | | | (1,618,125 | ) |
| | | | | | | | | |
Total Short Corporate Debt (Proceeds $3,141,425) | | | | | | | (3,341,101 | ) |
(144A) Security was purchased pursuant to Rule 144A or Section 4(a)(2) under the Securities Act of 1933 and may be resold in transactions exempt from registration only to qualified institutional buyers. As of June 30, 2021, these securities had a total aggregate market value of $21,239,497, which represented approximately 40.40% of net assets.
* | Non-income producing security. |
(a) | Level 3 security fair valued under procedures established by the Board of Trustees, represents 0.25% of net assets. The total value of the fair value security is $132,909. |
(c) | All or a portion of this security has been segregated as collateral. |
(e) | Variable rate security. |
(f) | Aggregate cost for federal income tax purposes is $54,441,455 |
At June 30, 2021, unrealized appreciation/(depreciation) of securities for federal income tax purposes is as follows:
Unrealized appreciation | | $ | 2,683,776 | |
Unrealized depreciation | | | (5,081,535 | ) |
Net unrealized depreciation | | $ | (2,397,759 | ) |
See accompanying notes to financial statements.
8
Statements of Assets and Liabilities (Unaudited) June 30, 2021 |
| | | Shelton
BDC Income
Fund | | | Shelton
Emerging
Markets Fund | | | Shelton
International
Select Equity
Fund | | | Shelton
Tactical Credit
Fund | |
Assets | | | | | | | | | | | | | | | | |
Investments in securities | | | | | | | | | | | | | | | | |
Cost of investments | | $ | 3,783,605 | | | $ | 20,445,726 | | | $ | 132,078,663 | | | $ | 57,240,493 | |
Cost of purchased options | | | — | | | | — | | | | — | | | | 123,828 | |
Market value of investments (Note 1) | | | 4,091,038 | | | | 28,347,962 | | | | 159,524,656 | | | | 55,375,421 | |
Market value of purchased options (Note 1) | | | — | | | | — | | | | — | | | | 9,376 | |
Cash | | | 92,567 | | | | 2,599,015 | | | | 13,982,961 | | | | 28,642 | |
Interest receivable | | | — | | | | — | | | | — | | | | 651,113 | |
Dividend receivable | | | 32,327 | | | | 62,320 | | | | 540,019 | | | | — | |
Receivable from investment advisor | | | 484 | | | | 5,769 | | | | 16,893 | | | | 9,402 | |
Receivable for fund shares sold | | | 55,525 | | | | 90,368 | | | | 446,727 | | | | 535,289 | |
Prepaid expenses | | | 636 | | | | 38,869 | | | | 39,942 | | | | 1,799 | |
Total assets | | $ | 4,272,577 | | | $ | 31,144,303 | | | $ | 174,551,198 | | | $ | 56,611,042 | |
| | | | | | | | | | | | | | | | | |
Liabilities | | | | | | | | | | | | | | | | |
Payables and other liabilities | | | | | | | | | | | | | | | | |
Short positions, at value (proceeds $3,141,425) | | | — | | | | — | | | | — | | | | 3,341,101 | |
Interest payable | | | — | | | | — | | | | — | | | | 45,490 | |
Payable for fund shares repurchased | | | 4,033 | | | | 4,383 | | | | 115,494 | | | | 50,450 | |
Payable to investment advisor | | | 558 | | | | 27,738 | | | | 117,679 | | | | 55,114 | |
Distributions payable | | | 116,601 | | | | 824 | | | | 1,065 | | | | 478,273 | |
Payable for securities purchased | | | — | | | | 734,883 | | | | 742,287 | | | | — | |
Accrued 12b-1 fees | | | 920 | | | | 369 | | | | 5,888 | | | | 1,060 | |
Accrued administration fees | | | 356 | | | | 2,506 | | | | 14,376 | | | | 4,258 | |
Accrued CCO fees | | | 348 | | | | 1,192 | | | | 27,388 | | | | 1,976 | |
Accrued custody fees | | | 24 | | | | 3,691 | | | | 11,312 | | | | 1,887 | |
Accrued expenses | | | 10,079 | | | | 22,844 | | | | 41,524 | | | | 31,940 | |
Accrued fund Accounting fees | | | 6,023 | | | | 11,046 | | | | 22,240 | | | | 18,744 | |
Accrued printing fees | | | 2,048 | | | | (1,156 | ) | | | (2,359 | ) | | | 1,298 | |
Accrued registration fees | | | 8,540 | | | | — | | | | — | | | | — | |
Accrued transfer agent fees | | | 2,741 | | | | 21,058 | | | | 29,974 | | | | 5,996 | |
Accrued trustee fees | | | 992 | | | | 940 | | | | 1,985 | | | | 1,156 | |
Total liabilities | | | 153,263 | | | | 830,318 | | | | 1,128,853 | | | | 4,038,743 | |
| | | | | | | | | | | | | | | | | |
Net assets | | $ | 4,119,314 | | | $ | 30,313,985 | | | $ | 173,422,345 | | | $ | 52,572,299 | |
| | | | | | | | | | | | | | | | | |
Net assets at June 30, 2021 consist of | | | | | | | | | | | | | | | | |
Paid-in capital | | | 8,478,217 | | | | 24,475,866 | | | | 189,790,873 | | | | 59,907,524 | |
Distributable earnings/(loss) | | | (4,358,903 | ) | | | 5,838,119 | | | | (16,368,528 | ) | | | (7,335,225 | ) |
Total net assets | | $ | 4,119,314 | | | $ | 30,313,985 | | | $ | 173,422,345 | | | $ | 52,572,299 | |
| | | | | | | | | | | | | | | | | |
Net assets | | | | | | | | | | | | | | | | |
Institutional Shares | | $ | 270,390 | | | $ | 28,667,069 | | | $ | 147,450,949 | | | $ | 47,886,237 | |
Investor Shares | | $ | 3,848,924 | | | $ | 1,646,916 | | | $ | 25,971,396 | | | $ | 4,686,062 | |
| | | | | | | | | | | | | | | | | |
Shares outstanding | | | | | | | | | | | | | | | | |
Institutional Shares (no par value, unlimited shares authorized) | | | 32,505 | | | | 1,391,671 | | | | 5,407,562 | | | | 4,263,677 | |
Investor Shares (no par value, unlimited shares authorized) | | | 458,447 | | | | 80,745 | | | | 959,105 | | | | 417,748 | |
| | | | | | | | | | | | | | | | | |
Net asset value per share | | | | | | | | | | | | | | | | |
Institutional Shares | | $ | 8.32 | | | $ | 20.60 | | | $ | 27.27 | | | $ | 11.23 | |
Investor Shares | | $ | 8.40 | | | $ | 20.40 | | | $ | 27.08 | | | $ | 11.22 | |
See accompanying notes to financial statements.
9
Statements of Operations (Unaudited)
June 30, 2021 |
| | | Shelton
BDC Income
Fund | | | Shelton
Emerging
Markets Fund | | | Shelton
International
Select Equity
Fund | | | Shelton
Tactical
Credit
Fund | |
| | | Period Ended
June 30,
2021 | | | Period Ended
June 30,
2021 | | | Period Ended
June 30,
2021 | | | Period Ended
June 30,
2021 | |
Investment income | | | | | | | | | | | | | | | | |
Interest income | | $ | — | | | $ | 62 | | | $ | 1,464 | | | $ | 1,232,928 | |
Dividend income (net of foreign tax withheld: $—, $35,214, $170,759 and $— respectively) | | | 239,109 | | | | 241,438 | | | | 1,556,532 | | | | 1,945 | |
Total | | $ | 239,109 | | | $ | 241,500 | | | $ | 1,557,996 | | | $ | 1,234,873 | |
| | | | | | | | | | | | | | | | | |
Expenses | | | | | | | | | | | | | | | | |
Interest on short positions | | $ | — | | | $ | — | | | $ | — | | | $ | 109,012 | |
Management fees (Note 2) | | | 19,188 | | | | 144,429 | | | | 581,314 | | | | 280,514 | |
Administration fees (Note 2) | | | 1,937 | | | | 13,145 | | | | 71,407 | | | | 21,785 | |
Transfer agent fees | | | 5,286 | | | | 17,420 | | | | 43,054 | | | | 9,536 | |
Accounting services | | | 10,421 | | | | 14,834 | | | | 28,737 | | | | 25,533 | |
Broker fees | | | — | | | | — | | | | 220 | | | | 91,292 | |
Custodian fees | | | 164 | | | | 10,148 | | | | 17,732 | | | | 3,547 | |
Legal and audit fees | | | 3,052 | | | | 5,835 | | | | 20,026 | | | | 7,537 | |
CCO fees (Note 2) | | | 181 | | | | 1,347 | | | | 8,043 | | | | 2,235 | |
Trustees fees | | | 2,017 | | | | 2,330 | | | | 2,549 | | | | 2,286 | |
Insurance | | | 71 | | | | 558 | | | | 3,295 | | | | 886 | |
Printing | | | 5,975 | | | | 6,306 | | | | 7,205 | | | | 8,674 | |
Registration and dues | | | 11,766 | | | | 15,123 | | | | 31,107 | | | | 14,276 | |
12b-1 fees Investor Shares (Note 2) | | | 4,986 | | | | 2,033 | | | | 27,224 | | | | 6,275 | |
Total expenses | | $ | 65,044 | | | $ | 233,508 | | | $ | 841,913 | | | $ | 583,388 | |
Less reimbursement from manager (Note 2) | | | (33,220 | ) | | | (5,769 | ) | | | (27,810 | ) | | | (41,100 | ) |
Net expenses | | $ | 31,824 | | | $ | 227,739 | | | $ | 814,103 | | | $ | 542,288 | |
Net investment income | | $ | 207,285 | | | $ | 13,761 | | | $ | 743,893 | | | $ | 692,585 | |
| | | | | | | | | | | | | | | | | |
Realized and unrealized gain/(loss) on investments | | | | | | | | | | | | | | | | |
Net realized gain/(loss) from security transactions and foreign currency | | $ | 9,870 | | | $ | 909,215 | | | $ | 8,238,417 | | | $ | 740,215 | |
Net realized gain/(loss) from futures contracts | | | — | | | | — | | | | — | | | | (22,869 | ) |
Net realized gain/(loss) from purchased option contracts | | | — | | | | — | | | | — | | | | (20,585 | ) |
Net realized gain/(loss) from written options contracts | | | — | | | | — | | | | — | | | | 74,599 | |
Total Net Realized gain/(loss) | | | 9,870 | | | | 909,215 | | | | 8,238,417 | | | | 771,360 | |
| | | | | | | | | | | | | | | | | |
Change in unrealized appreciation/(depreciation) of investments | | | 553,820 | | | | (189,637 | ) | | | (558,583 | ) | | | 1,837,264 | |
Change in unrealized appreciation/(depreciation) of purchased option contracts | | | — | | | | — | | | | — | | | | 95,695 | |
Change in unrealized appreciation/(depreciation) of written option contracts | | | — | | | | — | | | | — | | | | (88,726 | ) |
Net realized and unrealized gain/(loss) on investments | | $ | 563,690 | | | $ | 719,578 | | | $ | 7,679,834 | | | $ | 2,615,593 | |
Net increase/(decrease) in net assets resulting from operations | | $ | 770,975 | | | $ | 733,339 | | | $ | 8,423,727 | | | $ | 3,308,178 | |
See accompanying notes to financial statements.
10
Statements of Changes in Net Assets |
| | | Shelton BDC
Income Fund | | | Shelton Emerging Markets Fund | | | Shelton International
Select Equity Fund | |
| | | Period
Ended
June 30,
2021 | | | Year Ended
December 31,
2020 | | | Period
Ended
June 30,
2021 | | | Period
Ended
December 31,
2020 | | | Year Ended
September 30,
2020 | | | Period
Ended
June 30,
2021 | | | Year Ended
December 31,
2020 | |
Operations | | | | | | | | | | | | | | | | | | | | | | | | | | | | |
Net investment income/(loss) | | $ | 207,285 | | | $ | 417,271 | | | $ | 13,761 | | | $ | (41,404 | ) | | $ | 50,062 | | | $ | 743,893 | | | $ | 425,800 | |
Net realized gain/(loss) from security transactions and foreign currency | | | 9,870 | | | | (683,527 | ) | | | 909,215 | | | | 3,489,313 | | | | (3,886,642 | ) | | | 8,238,417 | | | | 38,555 | |
Change in unrealized appreciation/(depreciation) of investments | | | 553,820 | | | | (598,529 | ) | | | (189,637 | ) | | | 3,281,869 | | | | 4,945,157 | | | | (558,583 | ) | | | 19,176,951 | |
Net increase/(decrease) in net assets resulting from operations | | | 770,975 | | | | (864,785 | ) | | | 733,339 | | | | 6,729,778 | | | | 1,108,577 | | | | 8,423,727 | | | | 19,641,306 | |
| | | | | | | | | | | | | | | | | | | | | | | | | | | | | |
Distributions to shareholders | | | | | | | | | | | | | | | | | | | | | | | | | | | | |
Distributions | | | | | | | | | | | | | | | | | | | | | | | | | | | | |
Institutional Shares | | | (15,321 | ) | | | (21,443 | ) | | | — | | | | (47,123 | ) | | | (802,092 | ) | | | — | | | | (810,174 | ) |
Investor Shares | | | (212,829 | ) | | | (396,171 | ) | | | — | | | | (2,929 | ) | | | (49,976 | ) | | | — | | | | (75,408 | ) |
Total Distributions | | | (228,150 | ) | | | (417,614 | ) | | | — | | | | (50,052 | ) | | | (852,068 | ) | | | — | | | | (885,582 | ) |
| | | | | | | | | | | | | | | | | | | | | | | | | | | | | |
Capital share transactions | | | | | | | | | | | | | | | | | | | | | | | | | | | | |
Increase/(decrease) in net assets resulting from capital share transactions | | | (466,640 | ) | | | (1,057,698 | ) | | | 2,243,469 | | | | (2,092,602 | ) | | | (21,276,448 | ) | | | 21,242,447 | | | | 64,229,063 | |
Total increase/(decrease) | | | 76,185 | | | | (2,340,097 | ) | | | 2,976,808 | | | | 4,587,124 | | | | (21,019,939 | ) | | | 29,666,174 | | | | 82,984,787 | |
| | | | | | | | | | | | | | | | | | | | | | | | | | | | | |
Net assets | | | | | | | | | | | | | | | | | | | | | | | | | | | | |
Beginning of period | | | 4,043,129 | | | | 6,383,226 | | | | 27,337,177 | | | | 22,750,053 | | | | 43,769,992 | | | | 143,756,171 | | | | 60,771,384 | |
End of period | | $ | 4,119,314 | | | $ | 4,043,129 | | | $ | 30,313,985 | | | $ | 27,337,177 | | | $ | 22,750,053 | | | $ | 173,422,345 | | | $ | 143,756,171 | |
| | | Shelton Tactical Credit Fund | |
| | | Period Ended
June 30,
2021 | | | Year Ended
December 31,
2020 | |
Operations | | | | | | | | |
Net investment income/(loss) | | $ | 692,585 | | | $ | 2,304,569 | |
Net realized gain/(loss) from security transactions and foreign currency | | | 740,215 | | | | 786,483 | |
Net realized gain/(loss) from futures contracts | | | (22,869 | ) | | | (1,876,622 | ) |
Net realized gain/(loss) from purchased option contracts | | | (20,585 | ) | | | (1,086,795 | ) |
Net realized gain/(loss) from written options contracts | | | 74,599 | | | | 385,413 | |
Change in unrealized appreciation/(depreciation) of investments | | | 1,837,264 | | | | (1,465,185 | ) |
Change in unrealized appreciation/(depreciation) of futures | | | — | | | | (401,601 | ) |
Change in unrealized appreciation/(depreciation) of purchased option contracts | | | 95,695 | | | | (210,148 | ) |
Change in unrealized appreciation/(depreciation) of written option contracts | | | (88,726 | ) | | | 88,726 | |
Net increase/(decrease) in net assets resulting from operations | | | 3,308,178 | | | | (1,475,160 | ) |
| | | | | | | | | |
Distributions to shareholders | | | | | | | | |
Distributions | | | | | | | | |
Institutional Shares | | | (942,109 | ) | | | (1,860,085 | ) |
Investor Shares | | | (101,293 | ) | | | (443,874 | ) |
Total Distributions | | | (1,043,402 | ) | | | (2,303,959 | ) |
| | | | | | | | | |
Capital share transactions | | | | | | | | |
Increase/(Decrease) in net assets resulting from capital share transactions | | | 3,324,789 | | | | (39,592,702 | ) |
Total increase/(decrease) | | | 5,589,565 | | | | (43,371,821 | ) |
| | | | | | | | | |
Net assets | | | | | | | | |
Beginning of period | | | 46,982,734 | | | | 90,354,555 | |
End of period | | $ | 52,572,299 | | | $ | 46,982,734 | |
See accompanying notes to financial statements.
11
Statements of Changes in Net Assets (Continued) |
Shelton BDC Income Fund | | Institutional Shares | |
| | | Period Ended
June 30, 2021 | | | Year Ended
December 31, 2020 | |
| | | Shares | | | Value | | | Shares | | | Value | |
Shares sold | | | 340 | | | $ | 2,703 | | | | 36,291 | | | $ | 252,509 | |
Shares issued in reinvestment of distributions | | | 639 | | | | 5,227 | | | | 874 | | | | 5,237 | |
Shares repurchased | | | (2,529 | ) | | | (21,936 | ) | | | (37,260 | ) | | | (265,506 | ) |
Net increase/(decrease) | | | (1,550 | ) | | $ | (14,006 | ) | | | (95 | ) | | $ | (7,760 | ) |
| | | Investor Shares | |
| | | Period Ended
June 30, 2021 | | | Year Ended
December 31, 2020 | |
| | | Shares | | | Value | | | Shares | | | Value | |
Shares sold | | | 69,935 | | | $ | 591,440 | | | | 23,280 | | | $ | 160,788 | |
Shares issued in reinvestment of distributions | | | 12,674 | | | | 104,544 | | | | 33,743 | | | | 209,253 | |
Shares repurchased | | | (139,726 | ) | | | (1,148,618 | ) | | | (210,958 | ) | | | (1,419,979 | ) |
Net increase/(decrease) | | | (57,117 | ) | | $ | (452,634 | ) | | | (153,935 | ) | | $ | (1,049,938 | ) |
Shelton Emerging Market Fund | | Institutional Shares | |
| | | Period Ended
June 30, 2021 | | | Period Ended
December 31, 2020 | | | Year Ended
September 30, 2020 | |
| | | Shares | | | Value | | | Shares | | | Value | | | Shares | | | Value | |
Shares sold | | | 320,832 | | | $ | 6,530,525 | | | | 55,023 | | | $ | 972,867 | | | | 361,269 | | | $ | 5,104,041 | |
Shares issued in reinvestment of distributions | | | — | | | | — | | | | 2,309 | | | | 46,398 | | | | 47,764 | | | | 772,818 | |
Shares repurchased | | | (210,522 | ) | | | (4,303,605 | ) | | | (166,946 | ) | | | (2,859,468 | ) | | | (1,842,250 | ) | | | (26,676,989 | ) |
Net increase/(decrease) | | | 110,310 | | | $ | 2,226,920 | | | | (109,614 | ) | | $ | (1,840,203 | ) | | | (1,433,217 | ) | | $ | (20,800,130 | ) |
| | | Investor Shares | |
| | | Period Ended
June 30, 2021 | | | Period Ended
December 31, 2020 | | | Year Ended
September 30, 2020 | |
| | | Shares | | | Value | | | Shares | | | Value | | | Shares | | | Value | |
Shares sold | | | 31,247 | | | $ | 630,892 | | | | 1,032 | | | $ | 18,262 | | | | 14,115 | | | $ | 217,500 | |
Shares issued in reinvestment of distributions | | | — | | | | — | | | | 137 | | | | 2,728 | | | | 2,782 | | | | 44,734 | |
Shares repurchased | | | (30,243 | ) | | | (614,343 | ) | | | (15,622 | ) | | | (273,389 | ) | | | (53,368 | ) | | | (738,552 | ) |
Net increase/(decrease) | | | 1,004 | | | $ | 16,549 | | | | (14,453 | ) | | $ | (252,399 | ) | | | (36,471 | ) | | $ | (476,318 | ) |
Shelton International Select Equity Fund | | Institutional Shares | |
| | | Period Ended
June 30, 2021 | | | Year Ended
December 31, 2020 | |
| | | Shares | | | Value | | | Shares | | | Value | |
Shares sold | | | 1,862,335 | | | $ | 50,005,684 | | | | 2,852,650 | | | $ | 61,496,737 | |
Shares issued in reinvestment of distributions | | | — | | | | — | | | | 33,046 | | | | 794,614 | |
Shares gained with reorganization (Note 5) | | | — | | | | — | | | | 1,027,306 | | | | 21,305,921 | |
Shares repurchased | | | (1,417,464 | ) | | | (37,744,849 | ) | | | (1,475,934 | ) | | | (27,928,354 | ) |
Net increase/(decrease) | | | 444,871 | | | $ | 12,260,835 | | | | 2,437,068 | | | $ | 55,668,918 | |
| | | Investor Shares | |
| | | Period Ended
June 30, 2021 | | | Year Ended
December 31, 2020 | |
| | | Shares | | | Value | | | Shares | | | Value | |
Shares sold | | | 437,449 | | | $ | 11,581,828 | | | | 411,822 | | | $ | 9,231,323 | |
Shares issued in reinvestment of distributions | | | — | | | | — | | | | 2,976 | | | | 71,947 | |
Shares gained with reorganization (Note 5) | | | — | | | | — | | | | 94,062 | | | | 1,938,316 | |
Shares repurchased | | | (97,426 | ) | | | (2,600,216 | ) | | | (124,979 | ) | | | (2,681,441 | ) |
Net increase/(decrease) | | | 340,023 | | | $ | 8,981,612 | | | | 383,881 | | | $ | 8,560,145 | |
See accompanying notes to financial statements.
12
Statements of Changes in Net Assets (Continued) |
Shelton Tactical Credit Fund | | Institutional Shares | |
| | | Period Ended
June 30, 2021 | | | Year Ended
December 31, 2020 | |
| | | Shares | | | Value | | | Shares | | | Value | |
Shares sold | | | 684,802 | | | $ | 7,621,552 | | | | 772,060 | | | $ | 7,819,310 | |
Shares issued in reinvestment of distributions | | | 83,780 | | | | 934,065 | | | | 188,740 | | | | 1,841,491 | |
Shares repurchased | | | (287,397 | ) | | | (3,152,013 | ) | | | (3,803,066 | ) | | | (36,872,793 | ) |
Net increase/(decrease) | | | 481,185 | | | $ | 5,403,604 | | | | (2,842,266 | ) | | $ | (27,211,992 | ) |
| | | Investor Shares | |
| | | Period Ended
June 30, 2021 | | | Year Ended
December 31, 2020 | |
| | | Shares | | | Value | | | Shares | | | Value | |
Shares sold | | | 38,080 | | | $ | 421,581 | | | | 268,050 | | | $ | 2,797,120 | |
Shares issued in reinvestment of distributions | | | 8,984 | | | | 99,998 | | | | 44,314 | | | | 427,078 | |
Shares repurchased | | | (237,353 | ) | | | (2,600,394 | ) | | | (1,644,597 | ) | | | (15,604,908 | ) |
Net increase/(decrease) | | | (190,289 | ) | | $ | (2,078,815 | ) | | | (1,332,233 | ) | | $ | (12,380,710 | ) |
See accompanying notes to financial statements.
13
Shelton Tactical Credit Fund Statement of Cash Flows (Unaudited) For the Period Ended June 30, 2021 |
Increase/(Decrease) in Cash: | | | | |
Cash flows provided by/(used for) operating activities: | | | | |
Net increase in net assets resulting from operations | | $ | 3,308,178 | |
Adjustments to reconcile net decrease in net assets from operations to net cash provided by (used for) operating activities: | | | | |
Purchases of long-term portfolio investments | | | (48,499,108 | ) |
Sales of long-term portfolio investments | | | 53,430,166 | |
Proceeds from securities sold short | | | — | |
Cover short securities | | | (3,236,580 | ) |
Purchases of Options | | | (357,951 | ) |
Written Options | | | 457,037 | |
Sales/(Purchases) of short-term investments, net | | | — | |
Consent payment income received | | | — | |
Return of capital received | | | — | |
Cash used for corporate actions | | | — | |
Decrease/(Increase) in investment securities sold receivable | | | 2,093,906 | |
Increase/(Decrease) in payable for securities purchased | | | (2,730,000 | ) |
Increase/(Decrease) in payable for fund shares repurchased | | | (107,589 | ) |
Decrease/(Increase) in dividends and interest receivable | | | 162,474 | |
Increase/(Decrease) in distributions payable | | | 473,026 | |
Decrease/(Increase) in Fund Shares Sold | | | (487,693 | ) |
Decrease/(Increase) in due from advisor | | | (9,402 | ) |
Decrease/(Increase) in prepaid expenses | | | 2,184 | |
Increase/(Decrease) in advisory fees | | | 5,465 | |
Increase/(Decrease) in short dividends and interest payable | | | (59,857 | ) |
Increase/(Decrease) in accrued expenses | | | 29,456 | |
Net amortization on investments | | | (182,553 | ) |
Net realized loss/(gain) on investments | | | (771,360 | ) |
Net change in unrealized appreciation/depreciation | | | (1,844,233 | ) |
Net cash provided by operating activities | | | 1,675,566 | |
Cash flows provided by (used for) financing activities: | | | | |
Proceeds from shares sold | | | 9,077,196 | |
Cost of shares redeemed | | | (5,752,407 | ) |
Dividends paid to shareholders, net of reinvestments | | | (9,339 | ) |
Net cash provided by financing activities | | | 3,315,450 | |
| | | | | |
Net increase in cash | | | 4,991,015 | |
| | | | | |
Cash and cash equivalents: | | | | |
Beginning cash balance | | | — | |
Beginning cash held at broker | | | (4,962,373 | ) |
Total beginning cash and cash equivalents | | | (4,962,373 | ) |
| | | | | |
Ending cash balance | | | 28,642 | |
Ending cash held at/(due to) broker | | | — | |
Total ending cash and cash equivalents | | $ | 28,642 | |
See accompanying notes to financial statements.
14
Financial Highlights For a Share Outstanding Throughout Each Year or Period
|
Shelton BDC Income Fund | | Institutional Shares | | | Formerly
AR Capital
BDC Income
Fund | |
| | | Period Ended
June 30,
2021
(Unaudited) | | | Year Ended
December 31,
2020 | | | Year Ended
December 31,
2019 | | | Year Ended
December 31,
2018 | | | Year Ended
December 31,
2017 | | | Period Ended
December 31,
2016(a)(b) | | | Year Ended
March 31,
2016(c) | |
Net asset value, beginning of year | | $ | 7.30 | | | $ | 8.96 | | | $ | 7.75 | | | $ | 8.92 | | | $ | 9.11 | | | $ | 8.40 | | | $ | 9.65 | |
INCOME FROM INVESTMENT OPERATIONS | | | | | | | | | | | | | | | | | | | | | | | | | | | | |
Net investment income/(loss)(d) | | | 0.41 | | | | 0.65 | | | | 0.52 | | | | 0.71 | | | | 0.59 | | | | 0.44 | | | | 0.80 | |
Net gain/(loss) on securities (both realized and unrealized) | | | 1.05 | | | | (1.61 | ) | | | 1.41 | | | | (1.10 | ) | | | (0.22 | ) | | | 0.72 | | | | (1.36 | ) |
Total from investment operations | | | 1.46 | | | | (0.96 | ) | | | 1.93 | | | | (0.39 | ) | | | 0.37 | | | | 1.16 | | | | (0.56 | ) |
LESS DISTRIBUTIONS | | | | | | | | | | | | | | | | | | | | | | | | | | | | |
Dividends from net investment income | | | (0.44 | ) | | | (0.70 | ) | | | (0.65 | ) | | | (0.78 | ) | | | (0.56 | ) | | | (0.45 | ) | | | (0.69 | ) |
Distributions from return of capital | | | — | | | | — | | | | (0.07 | ) | | | — | | | | — | | | | — | | | | — | |
Total distributions | | | (0.44 | ) | | | (0.70 | ) | | | (0.72 | ) | | | (0.78 | ) | | | (0.56 | ) | | | (0.45 | ) | | | (0.69 | ) |
Net asset value, end of year | | $ | 8.32 | | | $ | 7.30 | | | $ | 8.96 | | | $ | 7.75 | | | $ | 8.92 | | | $ | 9.11 | | | $ | 8.40 | |
| | | | | | | | | | | | | | | | | | | | | | | | | | | | | |
Total return | | | 20.50 | %(e) | | | (9.00 | )% | | | 25.32 | % | | | (4.80 | )% | | | 3.94 | % | | | 14.07 | %(e) | | | (5.76 | )%(f) |
| | | | | | | | | | | | | | | | | | | | | | | | | | | | | |
RATIOS / SUPPLEMENTAL DATA | | | | | | | | | | | | | | | | | | | | | | | | | | | | |
Net assets, end of year or period (000s) | | $ | 270 | | | $ | 249 | | | $ | 306 | | | $ | 1,173 | | | $ | 1,610 | | | $ | 420 | | | $ | 443 | |
Ratio of expenses to average net assets:(g) | | | | | | | | | | | | | | | | | | | | | | | | | | | | |
Before expense reimbursements | | | 2.14 | %(h) | | | 2.62 | % | | | 1.95 | % | | | 1.78 | % | | | 1.78 | % | | | 2.53 | %(h) | | | 2.47 | % |
After expense reimbursements | | | 1.25 | %(h),(i) | | | 1.26 | %(i) | | | 1.27 | %(i) | | | 1.26 | %(i) | | | 1.25 | % | | | 1.24 | %(h) | | | 1.25 | % |
Ratio of net investment income/(loss) to average net assets(j) | | | | | | | | | | | | | | | | | | | | | | | | | | | 9.30 | % |
Before expense reimbursements | | | 9.16 | %(h) | | | 8.11 | % | | | 5.35 | % | | | 7.56 | % | | | 5.82 | % | | | 5.26 | %(h) | | | | |
After expense reimbursements | | | 10.06 | %(h) | | | 9.47 | % | | | 6.04 | % | | | 8.08 | % | | | 6.34 | % | | | 6.55 | %(h) | | | | |
Portfolio turnover | | | 27 | %(e) | | | 28 | % | | | 37 | % | | | 30 | % | | | 118 | % | | | 38 | %(e) | | | 166 | % |
(a) | For the nine months ended December 31, 2016. |
(b) | Following the acquisition on November 4, 2016, advisor class and class A were renamed Institutional and Investor Class. |
(c) | Audited by other independent registered public accounting firm. |
(d) | Calculated based upon average shares outstanding. |
(f) | Total returns shown exclude the effect of applicable sales loads/redemption fees. If the Adviser did not reimburse/waive a portion of the Fund’s expenses, total return would have been lower. Returns are not annualized |
(g) | Does not include expenses of investment companies in which the Fund invests. |
(i) | CCO Fees are not included in the expense limitation. |
(j) | Recognition of net investment income by the Fund is affected by the timing in which the Fund invests. The ratio does not include the net income of the investment companies in which the Fund invests. |
See accompanying notes to financial statements.
15
Financial Highlights For a Share Outstanding Throughout Each Year or Period
(Continued) |
Shelton BDC Income Fund | | Investor Shares | | | Formerly
AR Capital
BDC Income
Fund | |
| | | Period Ended
June 30,
2021
(Unaudited) | | | Year Ended
December 31,
2020 | | | Year Ended
December 31,
2019 | | | Year Ended
December 31,
2018 | | | Year Ended
December 31,
2017 | | | Period Ended
December 31,
2016(a)(b) | | | Year Ended
March 31,
2016(c) | |
Net asset value, beginning of year | | $ | 7.36 | | | $ | 9.08 | | | $ | 7.83 | | | $ | 9.01 | | | $ | 9.21 | | | $ | 8.51 | | | $ | 9.66 | |
INCOME FROM INVESTMENT OPERATIONS | | | | | | | | | | | | | | | | | | | | | | | | | | | | |
Net investment income/(loss)(d) | | | 0.39 | | | | 0.68 | | | | 0.60 | | | | 0.68 | | | | 0.54 | | | | 0.44 | | | | 0.70 | |
Net gain/(loss) on securities (both realized and unrealized) | | | 1.12 | | | | (1.68 | ) | | | 1.34 | | | | (1.11 | ) | | | (0.19 | ) | | | 0.71 | | | | (1.17 | ) |
Total from investment operations | | | 1.51 | | | | (1.00 | ) | | | 1.94 | | | | (0.43 | ) | | | 0.35 | | | | 1.15 | | | | (0.47 | ) |
LESS DISTRIBUTIONS | | | | | | | | | | | | | | | | | | | | | | | | | | | | |
Dividends from net investment income | | | (0.47 | ) | | | (0.72 | ) | | | (0.62 | ) | | | (0.75 | ) | | | (0.55 | ) | | | (0.45 | ) | | | (0.68 | ) |
Distributions from return of capital | | | — | | | | — | | | | (0.07 | ) | | | — | | | | — | | | | — | | | | — | |
Total distributions | | | (0.47 | ) | | | (0.72 | ) | | | (0.69 | ) | | | (0.75 | ) | | | (0.55 | ) | | | (0.45 | ) | | | (0.68 | ) |
Net asset value, end of year | | $ | 8.40 | | | $ | 7.36 | | | $ | 9.08 | | | $ | 7.83 | | | $ | 9.01 | | | $ | 9.21 | | | $ | 8.51 | |
| | | | | | | | | | | | | | | | | | | | | | | | | | | | | |
Total return | | | 20.43 | %(e) | | | (9.26 | )% | | | 25.31 | % | | | (5.13 | )% | | | 3.73 | % | | | 13.74 | %(e) | | | (4.83 | )%(f) |
| | | | | | | | | | | | | | | | | | | | | | | | | | | | | |
RATIOS / SUPPLEMENTAL DATA | | | | | | | | | | | | | | | | | | | | | | | | | | | | |
Net assets, end of year or period (000s) | | $ | 3,849 | | | $ | 3,795 | | | $ | 6,077 | | | $ | 8,430 | | | $ | 13,486 | | | $ | 13,614 | | | $ | 12,853 | |
Ratio of expenses to average net assets:(g) | | | | | | | | | | | | | | | | | | | | | | | | | | | | |
Before expense reimbursements | | | 2.38 | %(h) | | | 2.87 | % | | | 2.25 | % | | | 2.03 | % | | | 2.04 | % | | | 2.82 | %(h) | | | 2.66 | % |
After expense reimbursements | | | 1.50 | %(h),(i) | | | 1.51 | %(i) | | | 1.52 | %(i) | | | 1.51 | %(i) | | | 1.50 | % | | | 1.50 | %(h) | | | 1.45 | % |
Ratio of net investment income/(loss) to average net assets(j) | | | | | | | | | | | | | | | | | | | | | | | | | | | 7.89 | % |
Before expense reimbursements | | | 8.72 | %(h) | | | 8.36 | % | | | 6.10 | % | | | 7.13 | % | | | 5.21 | % | | | 5.16 | %(h) | | | | |
After expense reimbursements | | | 9.62 | %(h) | | | 9.72 | % | | | 6.83 | % | | | 7.65 | % | | | 5.73 | % | | | 6.48 | %(h) | | | | |
Portfolio turnover | | | 27 | %(e) | | | 28 | % | | | 37 | % | | | 30 | % | | | 118 | % | | | 38 | %(e) | | | 166 | % |
(a) | For the nine months ended December 31, 2016. |
(b) | Following the acquisition on November 4, 2016, advisor class and class A were renamed Institutional and Investor Class. |
(c) | Audited by other independent registered public accounting firm. |
(d) | Calculated based upon average shares outstanding. |
(f) | Total returns shown exclude the effect of applicable sales loads/redemption fees. If the Adviser did not reimburse/waive a portion of the Fund’s expenses, total return would have been lower. Returns are not annualized |
(g) | Does not include expenses of investment companies in which the Fund invests. |
(i) | CCO Fees are not included in the expense limitation. |
(j) | Recognition of net investment income by the Fund is affected by the timing in which the Fund invests. The ratio does not include the net income of the investment companies in which the Fund invests. |
See accompanying notes to financial statements.
16
Financial Highlights For a Share Outstanding Throughout Each Year or Period
(Continued) |
Shelton Emerging
Markets Fund(a)
Institutional Shares(b) | | Period Ended
June 30,
2021
(Unaudited) | | | Period Ended
December 31,
2020(c) | | | Year Ended
September 30,
2020 | | | Year Ended
September 30,
2019(d) | | | Year Ended
September 30,
2018(d) | | | Year Ended
September 30,
2017(d) | | | Year Ended
September 30,
2016(d) | |
Net asset value, beginning of year | | $ | 20.09 | | | $ | 15.33 | | | $ | 14.82 | | | $ | 16.22 | | | $ | 15.90 | | | $ | 14.28 | | | $ | 12.95 | |
INCOME FROM INVESTMENT OPERATIONS | | | | | | | | | | | | | | | | | | | | | | | | | | | | |
Net investment income/(loss)(e) | | | 0.01 | | | | (0.04 | ) | | | 0.01 | | | | 0.31 | | | | 0.31 | | | | 0.07 | | | | (0.00 | )(f) |
Net gain/(loss) on securities (both realized and unrealized) | | | 0.50 | | | | 4.84 | | | | 0.87 | | | | (1.24 | ) | | | 0.04 | | | | 1.55 | | | | 1.33 | |
Total from investment operations | | | 0.51 | | | | 4.80 | | | | 0.88 | | | | (0.93 | ) | | | 0.35 | | | | 1.62 | | | | 1.33 | |
LESS DISTRIBUTIONS | | | | | | | | | | | | | | | | | | | | | | | | | | | | |
Dividends from net investment income | | | — | | | | (0.04 | ) | | | (0.37 | ) | | | (0.31 | ) | | | (0.03 | ) | | | — | | | | — | |
Distributions from capital gains | | | — | | | | — | | | | — | | | | (0.16 | ) | | | — | | | | — | | | | — | |
Total distributions | | | — | | | | (0.04 | ) | | | (0.37 | ) | | | (0.47 | ) | | | (0.03 | ) | | | — | | | | — | |
Net asset value, end of year or period | | $ | 20.60 | | | $ | 20.09 | | | $ | 15.33 | | | $ | 14.82 | | | $ | 16.22 | | | $ | 15.90 | | | $ | 14.28 | |
| | | | | | | | | | | | | | | | | | | | | | | | | | | | | |
Total return | | | 2.54 | %(g) | | | 31.29 | %(g) | | | 5.78 | % | | | (5.60 | )% | | | 2.21 | % | | | 11.34 | % | | | 10.27 | % |
| | | | | | | | | | | | | | | | | | | | | | | | | | | | | |
RATIOS / SUPPLEMENTAL DATA | | | | | | | | | | | | | | | | | | | | | | | | | | | | |
Net assets, end of year (000s) | | $ | 28,667 | | | $ | 25,749 | | | $ | 21,354 | | | $ | 41,845 | | | $ | 50,897 | | | $ | 51,833 | | | $ | 45,786 | |
Ratio of expenses to average net assets: | | | | | | | | | | | | | | | | | | | | | | | | | | | | |
Before expense reimbursements | | | 1.58 | %(h) | | | 1.48 | %(h) | | | 1.89 | % | | | 1.78 | % | | | 1.61 | % | | | 1.72 | % | | | 1.85 | % |
After expense reimbursements(i) | | | 1.54 | %(h) | | | 1.48 | %(h) | | | 1.61 | % | | | 1.56 | % | | | 1.55 | % | | | 1.55 | % | | | 1.55 | % |
Ratio of net investment income/(loss) to average net assets | | | | | | | | | | | | | | | | | | | | | | | | | | | | |
Before expense reimbursements | | | 0.08 | %(h) | | | (0.88 | )%(h) | | | (0.20 | )% | | | 1.81 | % | | | 1.83 | % | | | 0.29 | % | | | (0.32 | )% |
After expense reimbursements | | | 0.12 | %(h) | | | (0.88 | )%(h) | | | 0.08 | % | | | 2.03 | % | | | 1.89 | % | | | 0.46 | % | | | (0.32 | )% |
Portfolio turnover | | | 12 | %(g) | | | 27 | %(g) | | | 58 | % | | | 78 | % | | | 63 | % | | | 169 | % | | | 156 | % |
(a) | Formerly named ICON Emerging Markets Fund. |
(b) | Formerly named ICON Emerging Markets Fund - Class S. |
(c) | Fund changed its fiscal year end from September 30 to December 31. |
(d) | Audited by other independent registered public accounting firm. |
(e) | Calculated based upon average shares outstanding. |
(f) | Amount less than $(0.005). |
(i) | Effective for the year ended September 30, 2020 and thereafter, CCO Fees are not included in the expense limitation. For the year ended September 30, 2020, reorganization costs not included. For all years presented, interest expense, when applicable, is not included in the expense limitation. |
See accompanying notes to financial statements.
17
Financial Highlights For a Share Outstanding Throughout Each Year or Period
(Continued) |
Shelton Emerging
Markets Fund(a)
Investor Shares(b) | | Period Ended
June 30,
2021
(Unaudited) | | | Period Ended
December 31,
2020(c) | | | Year Ended
September 30,
2020 | | | Year Ended
September 30,
2019(d) | | | Year Ended
September 30,
2018(d) | | | Year Ended
September 30,
2017(d) | | | Year Ended
September 30,
2016(d) | |
Net asset value, beginning of year | | $ | 19.92 | | | $ | 15.20 | | | $ | 14.73 | | | $ | 16.08 | | | $ | 15.77 | | | $ | 14.20 | | | $ | 12.91 | |
INCOME FROM INVESTMENT OPERATIONS | | | | | | | | | | | | | | | | | | | | | | | | | | | | |
Net investment income/(loss)(e) | | | (0.02 | ) | | | (0.05 | ) | | | (0.01 | ) | | | 0.14 | | | | 0.24 | | | | 0.06 | | | | (0.01 | ) |
Net gain/(loss) on securities (both realized and unrealized) | | | 0.50 | | | | 4.81 | | | | 0.84 | | | | (1.10 | ) | | | 0.07 | | | | 1.51 | | | | 1.30 | |
Total from investment operations | | | 0.48 | | | | 4.76 | | | | 0.83 | | | | (0.96 | ) | | | 0.31 | | | | 1.57 | | | | 1.29 | |
LESS DISTRIBUTIONS | | | | | | | | | | | | | | | | | | | | | | | | | | | | |
Dividends from net investment income | | | — | | | | (0.04 | ) | | | (0.36 | ) | | | (0.23 | ) | | | (0.00 | )(f) | | | — | | | | — | |
Distributions from capital gains | | | — | | | | — | | | | — | | | | (0.16 | ) | | | — | | | | — | | | | — | |
Total distributions | | | — | | | | (0.04 | ) | | | (0.36 | ) | | | (0.39 | ) | | | (0.00 | ) | | | — | | | | — | |
Net asset value, end of year or period | | $ | 20.40 | | | $ | 19.92 | | | $ | 15.20 | | | $ | 14.73 | | | $ | 16.08 | | | $ | 15.77 | | | $ | 14.20 | |
| | | | | | | | | | | | | | | | | | | | | | | | | | | | | |
Total return(g) | | | 2.41 | %(h) | | | 31.29 | %(h) | | | 5.48 | % | | | (5.87 | )% | | | 1.97 | % | | | 11.06 | % | | | 9.99 | % |
| | | | | | | | | | | | | | | | | | | | | | | | | | | | | |
RATIOS / SUPPLEMENTAL DATA | | | | | | | | | | | | | | | | | | | | | | | | | | | | |
Net assets, end of year (000s) | | $ | 1,647 | | | $ | 1,588 | | | $ | 1,432 | | | $ | 1,925 | | | $ | 6,436 | | | $ | 12,887 | | | $ | 9,072 | |
Ratio of expenses to average net assets: | | | | | | | | | | | | | | | | | | | | | | | | | | | | |
Before expense reimbursements | | | 1.84 | %(i) | | | 1.73 | %(i) | | | 2.54 | % | | | 2.26 | % | | | 1.96 | % | | | 2.12 | % | | | 2.16 | % |
After expense reimbursements(j) | | | 1.80 | %(i) | | | 1.73 | %(i) | | | 1.89 | % | | | 1.81 | % | | | 1.80 | % | | | 1.80 | % | | | 1.80 | % |
Ratio of net investment income/(loss) to average net assets | | | | | | | | | | | | | | | | | | | | | | | | | | | | |
Before expense reimbursements | | | (0.26 | )%(i) | | | (1.12 | )%(i) | | | (0.74 | )% | | | 0.45 | % | | | 1.32 | % | | | 0.08 | % | | | (0.43 | )% |
After expense reimbursements | | | (0.22 | )%(i) | | | (1.12 | )%(i) | | | (0.08 | )% | | | 0.90 | % | | | 1.48 | % | | | 0.40 | % | | | (0.07 | )% |
Portfolio turnover | | | 12 | %(h) | | | 27 | %(h) | | | 58 | % | | | 78 | % | | | 63 | % | | | 169 | % | | | 156 | % |
(a) | Formerly named ICON Emerging Markets Fund. |
(b) | Formerly named ICON Emerging Markets Fund - Class A. |
(c) | Fund changed its fiscal year end from September 30 to December 31. |
(d) | Audited by other independent registered public accounting firm. |
(e) | Calculated based upon average shares outstanding. |
(f) | Amount less than $(0.005). |
(g) | The total return calculation excludes any sales charges. |
(j) | Effective for the year ended September 30, 2020 and thereafter, CCO Fees are not included in the expense limitation. For the year ended September 30, 2020, reorganization costs not included. For all years presented, interest expense, when applicable, is not included in the expense limitation. |
See accompanying notes to financial statements.
18
Financial Highlights For a Share Outstanding Throughout Each Year
(Continued) |
Shelton International
Select Equity Fund
Institutional Shares(a) | | Period Ended
June 30,
2021
(Unaudited) | | | Year Ended
December 31,
2020 | | | Year Ended
December 31,
2019 | | | Year Ended
December 31,
2018 | | | Period Ended
December 31,
2017(b) | | | Year Ended
April 30,
2017 | | | Year Ended
April 30,
2016 (c) | |
Net asset value, beginning of year | | $ | 25.77 | | | $ | 22.02 | | | $ | 18.35 | | | $ | 21.34 | | | $ | 18.03 | | | $ | 15.90 | | | $ | 21.20 | |
INCOME FROM INVESTMENT OPERATIONS | | | | | | | | | | | | | | | | | | | | | | | | | | | | |
Net investment income/(loss)(d) | | | 0.13 | | | | 0.12 | | | | 0.29 | | | | 0.19 | | | | 0.10 | | | | 0.22 | | | | 0.25 | |
Net gain/(loss) on securities (both realized and unrealized) | | | 1.37 | | | | 3.84 | | | | 3.84 | | | | (2.97 | ) | | | 3.61 | | | | 2.13 | | | | (5.01 | ) |
Total from investment operations | | | 1.50 | | | | 3.96 | | | | 4.13 | | | | (2.78 | ) | | | 3.71 | | | | 2.35 | | | | (4.76 | ) |
LESS DISTRIBUTIONS | | | | | | | | | | | | | | | | | | | | | | | | | | | | |
Dividends from net investment income | | | — | | | | (0.21 | ) | | | (0.46 | ) | | | (0.21 | ) | | | (0.39 | ) | | | (0.22 | ) | | | (0.54 | ) |
Distributions from return of capital | | | — | | | | — | | | | — | | | | — | | | | (0.01 | ) | | | — | | | | — | |
Distributions from capital gains | | | — | | | | — | | | | — | | | | — | | | | — | | | | — | | | | — | |
Total distributions | | | — | | | | (0.21 | ) | | | (0.46 | ) | | | (0.21 | ) | | | (0.40 | ) | | | (0.22 | ) | | | (0.54 | ) |
Redemption Fees | | | — | | | | — | | | | — | | | | — | | | | — | | | | — | | | | — | |
Net asset value, end of year | | $ | 27.27 | | | $ | 25.77 | | | $ | 22.02 | | | $ | 18.35 | | | $ | 21.34 | | | $ | 18.03 | | | $ | 15.90 | |
| | | | | | | | | | | | | | | | | | | | | | | | | | | | | |
Total return | | | 5.82 | %(e) | | | 18.07 | % | | | 22.53 | % | | | (13.17 | )% | | | 20.74 | % | | | 14.89 | %(e) | | | (22.36 | )%(f) |
| | | | | | | | | | | | | | | | | | | | | | | | | | | | | |
RATIOS / SUPPLEMENTAL DATA | | | | | | | | | | | | | | | | | | | | | | | | | | | | |
Net assets, end of year or period (000s) | | $ | 147,451 | | | $ | 127,893 | | | $ | 55,619 | | | $ | 41,424 | | | $ | 42,824 | | | $ | 38,737 | | | $ | 44,133 | |
Ratio of expenses to average net assets: | | | | | | | | | | | | | | | | | | | | | | | | | | | | |
Before expense reimbursements | | | 1.02 | %(g) | | | 1.04 | % | | | 1.12 | % | | | 1.36 | % | | | 1.32 | % | | | 1.76 | %(h) | | | 1.28 | %(h) |
After expense reimbursements | | | 1.00 | %(g) | | | 0.99 | % | | | 1.01 | % | | | 1.17 | % | | | 0.99 | % | | | 0.99 | % | | | 1.23 | % |
Ratio of net investment income/(loss) to average net assets | | | | | | | | | | | | | | | | | | | | | | | | | | | | |
Before expense reimbursements | | | 0.92 | %(g) | | | 0.49 | % | | | 1.28 | % | | | 0.73 | % | | | 0.41 | % | | | | | | | | |
After expense reimbursements | | | 0.96 | %(g) | | | 0.54 | % | | | 1.40 | % | | | 0.92 | % | | | 0.74 | % | | | 1.32 | % | | | 1.36 | % |
Portfolio turnover | | | 34 | %(e) | | | 46 | % | | | 49 | % | | | 65 | % | | | 24 | % | | | 41 | % | | | 40 | % |
(a) | As of July 28, 2017 Class A shares and I shares were renamed to Investor shares and Institutional shares, respectively. |
(b) | For the eight month period ended December 31, 2017. |
(c) | Audited by other independent registered public accounting firm. |
(d) | Calculated based upon average shares outstanding. |
(f) | Total investment return is calculated assuming a purchase of shares on the first day and a sale of shares on the last day of each period reported and includes
reinvestment of dividends and distributions, if any. For Investor Shares (Formerly Class A Shares), total investment return does not reflect the impact of the
maximum front-end sales load of 5.75%. If reflected, the return would be lower. |
(h) | During the period, certain fees were waived and/or reimbursed; or recouped, if any. If such fee waivers and/or reimbursements or recoupments had not occurred, the ratios would have been as indicated. |
See accompanying notes to financial statements.
19
Financial Highlights For a Share Outstanding Throughout Each Year or Period
(Continued) |
Shelton International
Select Equity Fund Investor Shares(a) | | Period Ended
June 30,
2021
(Unaudited) | | | Year Ended
December 31,
2020 | | | Year Ended
December 31,
2019 | | | Year Ended
December 31,
2018 | | | Period Ended
December 31,
2017(b) | | | Year Ended
April 30,
2017 | | | Year Ended
April 30,
2016(c) | |
Net asset value, beginning of year | | $ | 25.62 | | | $ | 21.91 | | | $ | 18.29 | | | $ | 21.30 | | | $ | 18.02 | | | $ | 15.88 | | | $ | 21.16 | |
INCOME FROM INVESTMENT OPERATIONS | | | | | | | | | | | | | | | | | | | | | | | | | | | | |
Net investment income/(loss)(d) | | | 0.11 | | | | 0.05 | | | | 0.24 | | | | 0.11 | | | | 0.08 | | | | 0.17 | | | | 0.19 | |
Net gain/(loss) on securities (both realized and unrealized) | | | 1.35 | | | | 3.80 | | | | 3.83 | | | | (2.94 | ) | | | 3.60 | | | | 2.13 | | | | (4.97 | ) |
Total from investment operations | | | 1.46 | | | | 3.85 | | | | 4.07 | | | | (2.83 | ) | | | 3.68 | | | | 2.30 | | | | (4.78 | ) |
LESS DISTRIBUTIONS | | | | | | | | | | | | | | | | | | | | | | | | | | | | |
Dividends from net investment income | | | — | | | | (0.14 | ) | | | (0.45 | ) | | | (0.18 | ) | | | (0.39 | ) | | | (0.16 | ) | | | (0.50 | ) |
Distributions from return of capital | | | — | | | | — | | | | — | | | | — | | | | (0.01 | ) | | | — | | | | — | |
Distributions from capital gains | | | — | | | | — | | | | — | | | | — | | | | — | | | | — | | | | — | |
Total distributions | | | — | | | | (0.14 | ) | | | (0.45 | ) | | | (0.18 | ) | | | (0.40 | ) | | | (0.16 | ) | | | (0.50 | ) |
Redemption Fees | | | — | | | | — | | | | — | | | | — | | | | — | | | | — | | | | — | |
Net asset value, end of year | | $ | 27.08 | | | $ | 25.62 | | | $ | 21.91 | | | $ | 18.29 | | | $ | 21.30 | | | $ | 18.02 | | | $ | 15.88 | |
| | | | | | | | | | | | | | | | | | | | | | | | | | | | | |
Total return | | | 5.70 | %(e) | | | 17.64 | % | | | 22.25 | % | | | (13.41 | )% | | | 20.53 | % | | | 14.55 | %(e) | | | (22.51 | )%(f) |
| | | | | | | | | | | | | | | | | | | | | | | | | | | | | |
RATIOS / SUPPLEMENTAL DATA | | | | | | | | | | | | | | | | | | | | | | | | | | | | |
Net assets, end of year or period (000s) | | $ | 25,971 | | | $ | 15,863 | | | $ | 5,152 | | | $ | 5,904 | | | $ | 3,785 | | | $ | 4,488 | | | $ | 8,488 | |
Ratio of expenses to average net assets: | | | | | | | | | | | | | | | | | | | | | | | | | | | | |
Before expense reimbursements | | | 1.28 | %(g) | | | 1.29 | % | | | 1.38 | % | | | 1.56 | % | | | 1.59 | % | | | 2.02 | %(h) | | | 1.53 | %(h) |
After expense reimbursements | | | 1.24 | %(g) | | | 1.25 | % | | | 1.26 | % | | | 1.38 | % | | | 1.24 | % | | | 1.24 | % | | | 1.48 | % |
Ratio of net investment income/(loss) to average net assets | | | | | | | | | | | | | | | | | | | | | | | | | | | | |
Before expense reimbursements | | | 0.82 | %(g) | | | 0.19 | % | | | 1.06 | % | | | 0.33 | % | | | 0.23 | % | | | | | | | | |
After expense reimbursements | | | 0.86 | %(g) | | | 0.24 | % | | | 1.17 | % | | | 0.51 | % | | | 0.58 | % | | | 1.06 | % | | | 1.11 | % |
Portfolio turnover | | | 34 | %(e) | | | 46 | % | | | 49 | % | | | 65 | % | | | 24 | % | | | 41 | % | | | 40 | % |
(a) | As of July 28, 2017 Class A shares and I shares were renamed to Investor shares and Institutional shares, respectively. |
(b) | For the eight month period ended December 31, 2017. |
(c) | Audited by other independent registered public accounting firm. |
(d) | Calculated based upon average shares outstanding. |
(f) | Total investment return is calculated assuming a purchase of shares on the first day and a sale of shares on the last day of each period reported and includes
reinvestment of dividends and distributions, if any. For Investor Shares (Formerly Class A Shares), total investment return does not reflect the impact of the
maximum front-end sales load of 5.75%. If reflected, the return would be lower. |
(h) | During the period, certain fees were waived and/or reimbursed; or recouped, if any. If such fee waivers and/or reimbursements or recoupments had not occurred, the ratios would have been as indicated. |
See accompanying notes to financial statements.
20
Financial Highlights For a Share Outstanding Throughout Each Year or Period
(Continued) |
Shelton Tactical Credit Fund Institutional Shares | | Period
Ended
June 30,
2021
(Unaudited) | | | Year Ended
December
31,
2020 | | | For the
Period
November 1,
2019
through
December 31,
2019(a) | | | Year Ended
October 31,
2019 | | | Year Ended
October 31,
2018 | | | For the
Period
December 1,
2016
through
October 31,
2017(b) | | | Year Ended
November
30,
2016 | | | Year Ended
November
30,
2015 | |
Net asset value, beginning of year | | $ | 10.70 | | | $ | 10.55 | | | $ | 10.53 | | | $ | 10.97 | | | $ | 10.75 | | | $ | 10.68 | | | $ | 10.48 | | | $ | 10.93 | |
INCOME FROM INVESTMENT OPERATIONS | | | | | | | | | | | | | | | | | | | | | | | | | | | | | | | | |
Net investment income/(loss)(c) | | | 0.16 | | | | 0.40 | | | | 0.04 | | | | 0.12 | | | | 0.17 | | | | 0.22 | | | | 0.25 | | | | 0.26 | |
Net gain/(loss) on securities (both realized and unrealized) | | | 0.61 | | | | 0.18 | | | | 0.02 | | | | (0.09 | ) | | | 0.38 | | | | 0.27 | | | | 0.21 | | | | (0.45 | ) |
Total from investment operations | | | 0.77 | | | | 0.58 | | | | 0.06 | | | | 0.03 | | | | 0.55 | | | | 0.49 | | | | 0.46 | | | | (0.19 | ) |
LESS DISTRIBUTIONS | | | | | | | | | | | | | | | | | | | | | | | | | | | | | | | | |
Dividends from net investment income | | | (0.24 | ) | | | (0.43 | ) | | | (0.04 | ) | | | (0.36 | ) | | | (0.29 | ) | | | (0.28 | ) | | | (0.26 | ) | | | (0.26 | ) |
Distributions from capital gains | | | — | | | | — | | | | — | | | | (0.11 | ) | | | (0.04 | ) | | | (0.14 | ) | | | — | | | | — | |
Total distributions | | | (0.24 | ) | | | (0.43 | ) | | | (0.04 | ) | | | (0.47 | ) | | | (0.33 | ) | | | (0.42 | ) | | | (0.26 | ) | | | (0.26 | ) |
| | | | | | | | | | | | | | | | | | | | | | | | | | | | | | | | | |
Redemption fees(c) | | | — | | | | — | | | | — | | | | — | | | | — | (d) | | | — | (d) | | | — | (d) | | | — | (d) |
| | | | | | | | | | | | | | | | | | | | | | | | | | | | | | | | | |
Net asset value, end of year | | $ | 11.23 | | | $ | 10.70 | | | $ | 10.55 | | | $ | 10.53 | | | $ | 10.97 | | | $ | 10.75 | | | $ | 10.68 | | | $ | 10.48 | |
| | | | | | | | | | | | | | | | | | | | | | | | | | | | | | | | | |
Total return | | | 7.21 | %(e) | | | 5.89 | % | | | 0.60 | %(e) | | | 0.37 | % | | | 5.20 | % | | | 4.63 | %(e) | | | 4.41 | % | | | (1.80 | )% |
| | | | | | | | | | | | | | | | | | | | | | | | | | | | | | | | | |
RATIOS / SUPPLEMENTAL DATA | | | | | | | | | | | | | | | | | | | | | | | | | | | | | | | | |
Net assets, end of year or period (000s) | | $ | 47,886 | | | $ | 40,473 | | | $ | 69,877 | | | $ | 77,405 | | | $ | 66,195 | | | $ | 67,084 | | | $ | 57,555 | | | $ | 44,465 | |
Ratio of expenses to average net assets: | | | | | | | | | | | | | | | | | | | | | | | | | | | | | | | | |
Before expense reimbursements | | | 2.38 | %(f),(g) | | | 3.45 | %(f) | | | 2.83 | %(f),(g),(h) | | | 3.12 | %(h) | | | 5.18 | %(h) | | | 4.35 | %(g),(h) | | | 4.26 | %(h) | | | 3.83 | %(h) |
After expense reimbursements | | | 2.22 | %(f),(g) | | | 3.35 | %(f) | | | 2.72 | %(f),(g),(h) | | | 3.01 | %(h) | | | 4.95 | %(h) | | | 4.15 | %(g),(h) | | | 3.93 | %(h) | | | 3.47 | %(h) |
Ratio of net investment income/(loss) to average net assets | | | | | | | | | | | | | | | | | | | | | | | | | | | | | | | | |
Before expense reimbursements | | | 2.72 | %(g) | | | 3.83 | % | | | 2.34 | %(g) | | | 1.00 | % | | | 1.38 | % | | | 2.03 | %(g) | | | 2.02 | % | | | 2.11 | % |
After expense reimbursements | | | 2.88 | %(g) | | | 3.93 | % | | | 2.45 | %(g) | | | 1.11 | % | | | 1.61 | % | | | 2.23 | %(g) | | | 2.35 | % | | | 2.47 | % |
Portfolio turnover | | | 81 | %(e) | | | 249 | % | | | 20 | %(e) | | | 116 | % | | | 63 | % | | | 69 | %(e) | | | 70 | % | | | 64 | % |
(a) | Fiscal year end changed from October 31 to December 31. |
(b) | Fiscal year end changed from November 30 to October 31. |
(c) | Based on average shares outstanding for the period. |
(d) | Amount less than $0.01 per share. |
(f) | If interest expense and dividends on borrowings and securities sold short had been excluded, the expense ratios would have been lowered by 0.45% for the period ended June 30, 2021, and 1.13% for the year ended December 31, 2020 and 1.03% for the period ended December 31, 2019. |
(h) | If interest expense and dividends on securities sold short had been excluded, the expense ratios would have been lowered by 0.66% for the year ended October 31, 2019, 3.56% for the year ended October 31, 2018, 2.76% for the period December 1, 2016 through October 31, 2017, and by 2.54%, 2.08%, and 1.44% for the periods ended November 30, respectively. |
See accompanying notes to financial statements.
21
Financial Highlights For a Share Outstanding Throughout Each Year or Period
(Continued) |
Shelton Tactical Credit Fund Investor Shares | | Period
Ended
June 30,
2021
(Unaudited) | | | Year Ended
December
31,
2020 | | | For the
Period
November 1,
2019
through
December 31,
2019(a) | | | Year Ended
October 31,
2019 | | | Year Ended
October 31,
2018 | | | For the
Period
December 1,
2016
through
October 31,
2017(b) | | | Year Ended
November
30,
2016 | | | Year Ended
November
30,
2015 | |
Net asset value, beginning of year | | $ | 10.71 | | | $ | 10.55 | | | $ | 10.54 | | | $ | 10.96 | | | $ | 10.74 | | | $ | 10.68 | | | $ | 10.48 | | | $ | 10.93 | |
INCOME FROM INVESTMENT OPERATIONS | | | | | | | | | | | | | | | | | | | | | | | | | | | | | | | | |
Net investment income/(loss)(c) | | | 0.15 | | | | 0.36 | | | | 0.04 | | | | 0.08 | | | | 0.15 | | | | 0.20 | | | | 0.23 | | | | 0.24 | |
Net gain/(loss) on securities (both realized and unrealized) | | | 0.61 | | | | 0.21 | | | | — | | | | (0.06 | ) | | | 0.37 | | | | 0.25 | | | | 0.21 | | | | (0.46 | ) |
Total from investment operations | | | 0.76 | | | | 0.57 | | | | 0.04 | | | | 0.02 | | | | 0.52 | | | | 0.45 | | | | 0.44 | | | | (0.22 | ) |
LESS DISTRIBUTIONS | | | | | | | | | | | | | | | | | | | | | | | | | | | | | | | | |
Dividends from net investment income | | | (0.25 | ) | | | (0.41 | ) | | | (0.03 | ) | | | (0.33 | ) | | | (0.26 | ) | | | (0.25 | ) | | | (0.24 | ) | | | (0.23 | ) |
Distributions from capital gains | | | — | | | | — | | | | — | | | | (0.11 | ) | | | (0.04 | ) | | | (0.14 | ) | | | — | | | | — | |
Total distributions | | | (0.25 | ) | | | (0.41 | ) | | | (0.03 | ) | | | (0.44 | ) | | | (0.30 | ) | | | (0.39 | ) | | | (0.24 | ) | | | (0.23 | ) |
| | | | | | | | | | | | | | | | | | | | | | | | | | | | | | | | | |
Redemption fees(c) | | | — | | | | — | | | | — | | | | — | | | | — | (d) | | | — | (d) | | | — | (d) | | | — | (d) |
| | | | | | | | | | | | | | | | | | | | | | | | | | | | | | | | | |
Net asset value, end of year | | $ | 11.22 | | | $ | 10.71 | | | $ | 10.55 | | | $ | 10.54 | | | $ | 10.96 | | | $ | 10.74 | | | $ | 10.68 | | | $ | 10.48 | |
| | | | | | | | | | | | | | | | | | | | | | | | | | | | | | | | | |
Total return | | | 7.08 | %(e) | | | 5.77 | % | | | 0.43 | %(e) | | | 0.22 | % | | | 4.93 | % | | | 4.28 | %(e) | | | 4.17 | % | | | (2.04 | )% |
| | | | | | | | | | | | | | | | | | | | | | | | | | | | | | | | | |
RATIOS / SUPPLEMENTAL DATA | | | | | | | | | | | | | | | | | | | | | | | | | | | | | | | | |
Net assets, end of year or period (000s) | | $ | 4,686 | | | $ | 6,510 | | | $ | 20,478 | | | $ | 20,942 | | | $ | 12,044 | | | $ | 22,964 | | | $ | 18,206 | | | $ | 5,627 | |
Ratio of expenses to average net assets: | | | | | | | | | | | | | | | | | | | | | | | | | | | | | | | | |
Before expense reimbursements | | | 2.62 | %(f),(g) | | | 3.70 | %(f) | | | 3.08 | %(f),(g),(h) | | | 3.51 | %(h) | | | 5.43 | %(h) | | | 4.60 | %(g),(h) | | | 4.51 | %(h) | | | 4.08 | %(h) |
After expense reimbursements | | | 2.46 | %(f),(g) | | | 3.60 | %(f) | | | 2.97 | %(f),(g),(h) | | | 3.45 | %(h) | | | 5.20 | %(h) | | | 4.40 | %(g),(h) | | | 4.18 | %(h) | | | 3.72 | %(h) |
Ratio of net investment income/(loss) to average net assets | | | | | | | | | | | | | | | | | | | | | | | | | | | | | | | | |
Before expense reimbursements | | | 2.54 | %(g) | | | 3.51 | % | | | 1.99 | %(g) | | | 0.70 | % | | | 1.13 | % | | | 1.78 | %(g) | | | 1.77 | % | | | 1.86 | % |
After expense reimbursements | | | 2.70 | %(g) | | | 3.63 | % | | | 2.10 | %(g) | | | 0.76 | % | | | 1.36 | % | | | 1.98 | %(g) | | | 2.10 | % | | | 2.22 | % |
Portfolio turnover | | | 81 | %(e) | | | 249 | % | | | 20 | %(e) | | | 116 | % | | | 63 | % | | | 69 | %(e) | | | 70 | % | | | 64 | % |
(a) | Fiscal year end changed from October 31 to December 31. |
(b) | Fiscal year end changed from November 30 to October 31. |
(c) | Based on average shares outstanding for the period. |
(d) | Amount less than $0.01 per share. |
(f) | If interest expense and dividends on borrowings and securities sold short had been excluded, the expense ratios would have been lowered by 0.47% for the period ended June 30, 2021, and 1.13% for the year ended December 31, 2020 and 1.03% for the period ended December 31, 2019. |
(h) | If interest expense and dividends on securities sold short had been excluded, the expense ratios would have been lowered by 0.66% for the year ended October 31, 2019, 3.56% for the year ended October 31, 2018, 2.76% for the period December 1, 2016 through October 31, 2017, and by 2.54%, 2.08%, and 1.44% for the periods ended November 30, respectively. |
See accompanying notes to financial statements.
22
SCM Trust | Notes to Financial Statements (Unaudited) | June 30, 2021 |
NOTE 1 – SUMMARY OF SIGNIFICANT ACCOUNTING POLICIES
SCM Trust (the “Trust”), a Massachusetts business trust formed in July 1988 is registered as an investment company under the Investment Company Act of 1940, as amended. As of June 30, 2021 the Trust consists of eleven separate series, four of which are included in these financial statements.
Shelton BDC Income Fund (“BDC Income Fund”) is an open-end, non-diversified series of the Trust. The Fund’s inception date is April 22, 2014, and the commencement date of operations is May 2, 2014. The investment objective is to provide a high level of income with the potential for capital appreciation. Effective July 1, 2016, CCM Partners d/b/a Shelton Capital Management, a California limited partnership (“Shelton” or the “Advisor”) became the advisor to the Fund.
The Shelton Emerging Markets Fund (“Emerging Markets Fund”) is an open-end diversified series of the Trust. The Fund’s inception date of the Fund is June 26, 2020. The Fund’s investment objective is to seek long-term capital appreciation. The Fund is the successor fund to the ICON Emerging Markets Fund, a series of ICON Funds, pursuant to a reorganization that occurred after the close of business on June 26, 2020. All historic performance and financial information presented is that of the ICON Emerging Markets Fund, which was the accounting and performance survivor of the reorganizations. Historic information presented for the Institutional Class and Investor Classes shares is based on that of the Class S and Class A shares, respectively, of the ICON Emerging Markets Fund.
Shelton Tactical Credit Fund (“Tactical Credit Fund”) is an open-end, diversified series of the Trust. The Fund’s inception date is December 16, 2014. The Fund’s investment objective is to seek current income and capital appreciation. Effective July 1, 2016, Shelton became the advisor to the Fund. The Tactical Credit Fund is a successor to a series of the FundVantage Trust, a Delaware statutory trust, pursuant to a reorganization that took place after the close of business on March 17, 2017. Prior to March 17, 2017, the Successor Fund had no investment operations. As a result of the reorganization, holders of Class A Shares and Class C Shares of the former Tactical Credit Fund received Investor Shares of the successor Tactical Credit Fund and holders of Advisor Class Shares of the former Tactical Credit Fund received Institutional Shares of the successor Tactical Credit Fund. On June 19, 2019, the shareholders of the Cedar Ridge Unconstrained Credit Fund (the “Cedar Ridge Fund”) approved the agreement and plan of reorganization providing for the transfer of assets and assumption of liabilities into the Shelton Tactical Credit Fund. Cedar Ridge Unconstrained Credit Fund is the performance and accounting survivor of the reorganization, Shelton Tactical Credit is the legal and tax survivor. The reorganization was effective as of the close of business on June 21, 2019. See Note 7 for more information.
Shelton International Select Equity Fund (“International Select Fund”, and together with the BDC Income Fund, the Emerging Markets Fund, and the Tactical Credit Fund, each a “Fund” and collectively, the “Funds”) is an open-end, diversified series of the Trust. The Fund’s inception date is July 31, 2009. The Fund’s investment objective is to achieve long-term capital appreciation. Effective July 18, 2016, Shelton became the advisor to the Fund. The International Select Fund is a successor to a series of the FundVantage Trust, a Delaware statutory trust, pursuant to a reorganization that took place after the close of business on July 28, 2017. Prior to July 28, 2017, the Successor Fund had no investment operations. As a result of the reorganization, holders of Class A Shares of the former International Select Fund received Investor Shares of the successor International Select Equity Fund and holders of Class I Shares of the former International Select Equity Fund received Institutional Shares of the successor International Select Equity Fund.
On June 3, 2020 the shareholders of the ICON International Equity Fund, a series of ICON Funds approved the agreement and plan of reorganization providing for the transfer of assets and assumption of liabilities into the Shelton International Select Equity Fund. The International Select Fund is the performance and accounting, legal and tax survivor of the reorganization. The reorganization was effective as of the open of business on June 29, 2020. See Note 7 for more information.
The Trust follows the investment company accounting and reporting guidance of the Financial Accounting Standards Board (“FASB”) Accounting Standards Codification Topic 946, “Financial Services – Investment Companies”.
(a) Security Valuation — Inputs used to value corporate debt securities generally include relative credit information, observed market movements, sector news, U.S. Treasury yield curve or relevant benchmark curve, and other market information, which may include benchmark yields, reported trades, broker-dealer quotes, issuer spreads, benchmark securities, bids, offers, and reference data, such as market research publications, when available (“Other Market Information”). Equity securities listed on a national or international exchange are valued at the last reported sales price. Futures contracts are valued at the settle price, depending on the exchange the contract trades on, typically as of 4:15 p.m., Eastern Time. Municipal securities are valued by an independent pricing service at a price determined by a matrix pricing method. This technique generally considers such factors as yields or prices of bonds of comparable quality, type of issue, coupon, maturity, ratings and general market conditions. U.S. government securities for which market quotations are readily available are valued at the mean between the closing bid and asked prices provided by an independent pricing service. U.S. agency securities consisting of mortgage pass-through certificates are valued using dealer quotations provided by an independent pricing service. U.S. Treasury Bills are valued at amortized cost which approximates market value. Securities with remaining maturities of 60 days or less are valued on the amortized cost basis as reflecting fair value.
Securities for which market quotes are not readily available from the Trust’s third-party pricing service are valued at fair value, determined in good faith and in accordance with procedures adopted by the Board of Trustees. The Board has delegated to the Advisor’s Pricing Committee the responsibility for determining the fair value, subject to the Board oversight and the review of the pricing decisions at its quarterly meetings. For a description of the Advisor, see Note 2.
(b) Federal Income Taxes — No provision is considered necessary for federal income taxes. The Funds intend to qualify for and elect the tax treatment applicable to regulated investment companies under the Internal Revenue Code and to distribute all their taxable income to shareholders.
(c) Short Sales — Short sales are transactions under which the Tactical Credit Fund sells a security it does not own in anticipation of a decline in the value of that security. To complete such a transaction, the Fund must borrow the security to make delivery to the buyer. The Fund then is obligated to replace the security borrowed by purchasing the security at market price at the time of replacement. The price at such time may be more or less than the price at which the security was sold by the Fund. When a security is sold short a decrease in the value of the security will be recognized as a gain and an increase in the value of the security will be recognized as a loss, which is potentially limitless. Until the security is replaced, the Fund is required to pay the lender amounts equal to dividend or interest that accrue during the period of the loan which is recorded as an expense. To borrow the security, the Fund also may be required to pay a premium or an interest fee, which are recorded as interest expense. Cash or securities are segregated for the broker to meet the necessary margin requirements. The Fund is subject to the risk that it may not always be able to close out a short position at a particular time or at an acceptable price.
23
SCM Trust | Notes to Financial Statements (Unaudited) (Continued) | June 30, 2021 |
(d) Municipal Bonds — Municipal bonds are debt obligations issued by the states, possessions, or territories of the United States (including the District of Columbia) or a political subdivision, public instrumentality, agency, public authority or other governmental unit of such states, possessions, or territories (e.g., counties, cities, towns, villages, districts and authorities). Municipal bonds may be issued as taxable securities, or as federally tax-exempt securities. States, possessions, territories and municipalities may issue municipal bonds to raise funds for various public purposes such as airports, housing, hospitals, mass transportation, schools, water and sewer works, gas, and electric utilities. They may also issue municipal bonds to refund outstanding obligations and to meet general operating expenses. Municipal bonds may be general obligation bonds or revenue bonds. General obligation bonds are secured by the issuer’s pledge of its full faith, credit and taxing power for the payment of principal and interest. Revenue bonds are payable from revenues derived from particular facilities, from the proceeds of a special excise tax or from other specific revenue sources. They are not usually payable from the general taxing power of a municipality. In addition, certain types of “private activity” bonds may be issued by public authorities to obtain funding for privately operated facilities, such as housing and pollution control facilities, for industrial facilities and for water supply, gas, electricity and waste disposal facilities. Other types of private activity bonds are used to finance the construction, repair or improvement of, or to obtain equipment for, privately operated industrial or commercial facilities. Current federal tax laws place substantial limitations on the size of certain of such issues. In certain cases, the interest on a private activity bond may not be exempt from federal income tax or the alternative minimum tax.
(e) Security Transactions, Investment Income and Distributions to Shareholders — Security transactions are recorded on the trade date. Interest income is recorded on the accrual basis. Dividend income is recorded on the ex-dividend date. Withholding taxes on foreign dividends have been provided for, in accordance with the Trust’s understanding of the applicable country’s tax rules and rates. Discounts or premiums on debt securities are accreted or amortized to interest income over the lives of the respective securities using the effective interest method or, where applicable, to the first call date of the securities. Distributions to shareholders are recorded on the ex-dividend date for the Funds. Income distributions and capital gain distributions are determined in accordance with income tax regulations which may differ from accounting principles generally accepted in the United States of America. These differences are primarily due to differing treatments for PFICs, wash sales, REIT adjustments and post-October capital losses.
Distributions received from investments in securities that represent a return of capital or capital gains are recorded as a reduction of cost of investment or as a realized gain, respectively. The calendar year-end amounts of ordinary income, capital gains, and return of capital included in distributions received from a Fund’s investments in real estate investment trusts (“REITs”) are reported to the Fund after the end of the calendar year; accordingly, the Funds estimate these amounts for accounting purposes until the characterization of REIT distributions is reported to the Fund after the end of the calendar year. Estimates are based on the most recent REIT distribution information available.
These “Book/tax” differences are considered either temporary (i.e., deferred losses, capital loss carry forwards) or permanent in nature. To the extent these differences are permanent in nature, such amounts are reclassified within the composition of net assets based on their federal tax basis treatment; temporary differences do not require reclassification.
(f) Foreign Currency Translation — Investment securities and other assets and liabilities denominated in foreign currencies are translated into U.S. dollar amounts at the date of valuation. Purchases and sales of investment securities and income and expense items denominated in foreign currencies are translated into U.S. dollar amounts on the respective dates of such transactions. The Trust does not isolate that portion of the results of operations resulting from changes in foreign exchange rates on investments from the fluctuations arising from changes in market prices of securities held. Such fluctuations are included with the net realized and unrealized gain or loss from investments.
Reported net realized foreign exchange gains or losses arise from sales of foreign currencies, currency gains or losses realized between the trade and settlement dates on securities transactions, and the difference between the amounts of dividends, interest, and foreign withholding taxes recorded on the company’s books and the U.S. dollar equivalent of the amounts actually received or paid. Net unrealized foreign exchange gains and losses arise from changes in the fair values of assets and liabilities, other than investments in securities at fiscal period end, resulting from changes in exchange rates.
(g) Concentration — The BDC Income Fund invests substantially all (and under normal market conditions, at least 80%) of its net assets (plus any borrowings for investment purposes) in common stocks and other equity securities of business development companies (“BDCs”) that are traded on one or more nationally recognized securities exchanges. The equity securities in which the Fund may invest consist of common stocks, securities convertible into common stocks; and preferred stocks. In addition, although the Fund typically invests in equity securities, the Fund may invest up to 20% of its net assets in debt securities of BDCs and other issuers of any maturity, duration or credit rating.
The Tactical Credit Fund aims to use related credit asset classes on both the long and short side to generate an attractive rate of return with low volatility. Portfolio construction is implemented with a relative value framework and looks across the entire balance sheet of a corporation from senior secured down through subordinated, equity-linked bonds. This hedged approach is designed to generate performance that is less reliant on the direction of the overall market than a typical credit-based fund.
Cash & Cash Equivalents: The Funds consider their investment in a Federal Deposit Insurance Corporation (“FDIC”) insured interest bearing account to be cash and cash equivalents. Cash and cash equivalents are valued at cost plus any accrued interest. The Funds maintain cash balances, which, at times may exceed federally insured limits. The Funds maintain these balances with a high-quality financial institution.
Concentration of Credit Risk: Each Fund places its cash with a banking institution, which is insured by FDIC. The FDIC limit is $250,000. At various times throughout the year, the amount on deposit may exceed the FDIC limit and subject the Funds to a credit risk. The Funds do not believe that such deposits are subject to any unusual risk associated with investment activities.
(h) Use of Estimates in Financial Statements — In preparing financial statements in conformity with accounting principles generally accepted in the United States of America, Shelton Capital makes estimates and assumptions that affect the reported amounts of assets and liabilities at the date of the financial statements, as well as the reported amounts of income and expense during the year. Actual results may differ from these estimates.
(i) Share Valuations — The net asset value (“NAV”) per share of each Fund is calculated by dividing the sum of the value of the securities held by the Fund, plus cash or other assets, minus all liabilities (including estimated accrued expenses) by the total number of shares outstanding of the Fund, rounded to the nearest cent. A Fund’s shares will not be priced on the days on which the NYSE is closed for trading. The offering and redemption price per share of each Fund is equal to a Fund’s NAV per share.
24
SCM Trust | Notes to Financial Statements (Unaudited) (Continued) | June 30, 2021 |
(j) Accounting for Uncertainty in Income Taxes — The Funds recognize the tax benefits of uncertain tax positions only where the position is “more likely than not” to be sustained assuming examination by tax authorities. Shelton Capital has analyzed the Fund’s tax positions, and has concluded that no liability for unrecognized tax benefits should be recorded related to uncertain tax positions taken on returns filed for open tax years (2017-2019) or expected to be taken in the Fund’s 2020 tax returns. The Funds identify its major tax jurisdictions as U.S. Federal, however the Funds are not aware of any tax positions for which it is reasonably possible that the total amounts of unrecognized tax benefits will change materially in the next twelve months.
(k) Fair Value Measurements — The Funds utilize various methods to measure the fair value of most of its investments on a recurring basis. U.S. GAAP establishes a hierarchy that prioritizes inputs to valuation methods. The three levels of inputs are:
Level 1 – Unadjusted quoted prices in active markets for identical assets or liabilities that the company has the ability to access.
Level 2 – Observable inputs other than quoted prices included in Level 1 that are observable for the asset or liability, either directly or indirectly. These inputs may include quoted prices for the identical instrument on an inactive market, prices for similar instruments, interest rates, prepayment speeds, credit risk, yield curves, default rates and similar data.
Level 3 – Unobservable inputs for the asset or liability, to the extent relevant observable inputs are not available, representing the Fund’s own assumptions about the assumptions a market participant would use in valuing the asset or liability, and would be based on the best information available.
The availability of observable inputs can vary from security to security and is affected by a wide variety of factors, including, for example, the type of security, whether the security is new and not yet established in the marketplace, the liquidity of markets, and other characteristics particular to the security. To the extent that valuation is based on models or inputs that are less observable or unobservable in the market, the determination of fair value requires more judgment. Accordingly, the degree of judgment exercised in determining fair value is greatest for instruments categorized in Level 3.
The inputs used to measure fair value may fall into different levels of the fair value hierarchy. In such cases, for disclosure purposes, the level in the fair value hierarchy within which the fair value measurement falls in its entirety, is determined based on the lowest level input that is significant to the fair value measurement in its entirety.
The following table summarizes the valuation of the Trust’s securities at June 30, 2021 using fair value hierarchy:
| | | Level 1(a) | | | Level 2(a) | | | Level 3(a) | | | | | | | Level 2(a) | | | Level 2(a) | |
Fund | | Investments in
Securities(b) | | | Investments in
Securities(c) | | | Investments
in Securities | | | Total
Investments | | | Purchased
Options | | | Written
Options | |
BDC Income Fund | | $ | 4,083,005 | | | $ | — | | | $ | 8,033 | | | $ | 4,091,038 | | | $ | — | | | $ | — | |
Emerging Markets Fund | | $ | 28,347,962 | | | $ | — | | | $ | — | | | $ | 28,347,962 | | | $ | — | | | $ | — | |
International Select Fund | | $ | 159,524,656 | | | $ | — | | | $ | — | | | $ | 159,524,656 | | | $ | — | | | $ | — | |
Tactical Credit Fund - Assets | | $ | 310,923 | | | $ | 54,931,589 | | | $ | 132,909 | | | $ | 55,375,421 | | | $ | 9,376 | | | $ | — | |
Tactical Credit Fund - Liabilities | | $ | — | | | $ | 3,341,101 | | | $ | — | | | $ | 3,341,101 | | | $ | — | | | $ | — | |
(a) | It is the Funds’ policy to recognize transfers between levels on the last day of the fiscal reporting period. |
(b) | For a detailed break-out of common stocks by major industry classification, please refer to the Portfolio of Investments. |
(c) | All fixed income securities held in the Funds are Level 2 securities. For a detailed break-out of fixed income securities by type, please refer to the Portfolio of Investments. |
Level 3 Securities | | BDC Income
Fund | | | International
Select Fund | | | Tactical
Credit Fund | |
Beginning Balance | | $ | 8,033 | | | $ | 171,856 | | | $ | 5,346 | |
Net Purchases | | | — | | | | — | | | | — | |
Net Sales | | | — | | | | — | | | | — | |
Total Realized Gain/(Loss) | | | — | | | | — | | | | — | |
Change in Unrealized Appreciation/(Depreciation) | | | — | | | | — | | | | (1,097,807 | ) |
Accrued Interest | | | — | | | | — | | | | — | |
Transfers into Level 3 | | | — | | | | — | | | | 1,225,370 | |
Transfers out of Level 3 | | | — | | | | 171,856 | | | | — | |
Ending Balance | | $ | 8,033 | | | | — | | | $ | 132,909 | |
| | | Fair Value as
of 06/30/2021 | | Valuation Techniques | Unobservable Input | | Input Values | | Impact to
valuation from
an increase
to input |
BDC Income Fund | | | | | | | | | | | |
Newstar Financial Inc CVR | | $ | 8,033 | | Estimated recovery proceeds | Expected remaining distributions | | | $0.08 | | Increase |
Tactical Credit Fund | | | | | | | | | | | |
Copper Earnout Trust | | $ | 9,133 | | Offering documents, secondary offers | Market assessment | | | $10.25 | | Increase |
JC Penney Corp Inc | | $ | 3,500 | | Offering documents, secondary offers | Market assessment | | | $0.25 | | Increase |
Propco Earnout Trust | | $ | 120,276 | | Offering documents, secondary offers | Market assessment | | | $18.00 | | Increase |
25
SCM Trust | Notes to Financial Statements (Unaudited) (Continued) | June 30, 2021 |
(l) Disclosure about Derivative Instruments and Hedging Activities — The Fund has adopted enhanced disclosure regarding derivative and hedging activity intended to improve financial reporting of derivative instruments by enabling investors to understand how and why an entity uses derivatives, how derivatives are accounted for, and how derivative instruments affect an entity’s results of operations and financial position.
The effect of derivative instruments on the Statements of Assets & Liabilities for the six months ended June 30, 2021:
Derivatives Not Accounted for as Hedging Instruments | | Tactical
Credit Fund | |
Asset Derivatives | | | | |
Purchased Options | | $ | 9,376 | |
| | | | | |
Liability Derivatives | | | | |
Written Options | | $ | — | |
The effect of derivative instruments on the Statements of Operations for the year ended June 30, 2021:
Derivatives Not Accounted for as Hedging Instruments | | Tactical
Credit Fund | |
Amount of Realized Gain/(Loss) Recognized on Derivatives | | | | |
Interest Rate Futures | | $ | 142,968 | |
Purchased Interest Rate Options | | | 60,328 | |
Written Interest Rate Options | | | 10,155 | |
Purchased Equity Options | | | (163,554 | ) |
Written Equity Options | | | 64,445 | |
Total | | $ | 31,145 | |
| | | | | |
Amount of Change in Unrealized Appreciation/Depreciation Recognized on Derivatives | | | | |
Interest Rate Futures | | $ | — | |
Purchased Interest Rate Options | | | (55,859 | ) |
Written Interest Rate Options | | | (25,781 | ) |
Purchased Equity Options | | | 151,554 | |
Written Equity Options | | | (62,945 | ) |
Total | | $ | 6,969 | |
The previously disclosed derivative instruments outstanding as of June 30, 2021, and their effect on the Statement of Operations for the six month January 1, 2021 through June 30, 2021, serve as indicators of the volume of financial derivative activity for the company. The following table indicates the average volume for the six month period:
| | Average Month
End Notional
Value | |
Purchased Options | | $ | 26,191,667 | |
Written Options | | | 2,200,000 | |
(m) LIBOR Transition Risk — The United Kingdom’s Financial Conduct Authority announced a phase out of the London Interbank Offered Rate (“LIBOR”) by the end of 2021, On November 30, 2020, the administrator of LIBOR announced its intention to delay the phase out of the majority of the U.S. dollar LIBOR publications until June 30, 2023, with the remainder of LIBOR publications to still end at the end of 2021. The Funds may be exposed to financial instruments tied to LIBOR to determine payment obligations, financing terms, hedging strategies or investment value. The transition process away from LIBOR might lead to increased volatility and illiquidity in markets for, and reduce the effectiveness of new hedges placed against, instruments whose terms currently include LIBOR. The ultimate effect of the LIBOR transition process on the Funds Is uncertain.
(n) COVID-19 Risks — An outbreak of respiratory disease caused by a novel coronavirus was first detected in December 2019 and has now spread internationally. This coronavirus has resulted in closing borders, enhanced health screenings, partial population vaccination, healthcare service preparation and delivery, quarantines, cancellations, disruptions to supply chains and customer activity, government sponsored fiscal stimulus programs, various moratoria on the applicability of certain laws and regulations, as well as general concern and uncertainty. The impact of this coronavirus, (and the variants of such virus) and other epidemics and pandemics that may arise in the future, could affect the economies of many nations, individual companies, their securities (including equity and debt), and the market in general in ways that cannot necessarily be foreseen at the present time. In addition, the impact of infectious diseases in developing or emerging market countries may be greater due to less established health care systems. Health crises caused by the recent coronavirus outbreak may exacerbate other pre-existing political, social, financial, and economic risks in certain countries. The impact of the outbreak may last for an extended period of time.
26
SCM Trust | Notes to Financial Statements (Unaudited) (Continued) | June 30, 2021 |
NOTE 2 - INVESTMENT MANAGEMENT FEE AND OTHER RELATED PARTY TRANSACTIONS
Shelton provides each Fund with management and administrative services pursuant to investment management and administration servicing agreements.
In accordance with the terms of the management agreement, the Advisor receives compensation at the following annual rates:
Fund | | Net
Assets | |
BDC Income Fund | | | 0.90 | % |
Emerging Markets Fund | | | 1.00 | % |
International Select Fund | | | 0.74 | % |
Tactical Credit Fund | | | 1.17 | % |
The Advisor contractually agreed to reduce total operating expense to certain Funds of the Trust. This additional contractual reimbursement (excluding certain compliance costs, extraordinary expenses such as litigation or merger and reorganization expenses, for example and with respect to the BDC Income Fund, acquired fund fees and expenses) is effective until the dates listed below, unless renewed, and is subject to recoupment within three fiscal years following reimbursement. Recoupment is limited to the extent the reimbursement does not exceed any applicable expense limit and the effect of the reimbursement is measured after all ordinary operating expenses are calculated; any such reimbursement is subject to the Board of Trustees’ review and approval. Reimbursements from the Advisor to affected Funds, and the contractual expense limits, for the year ended June 30, 2021 are as follows:
| | | Contractual Expense Limitation | |
Fund | | Institutional
Shares | | | Investor
Shares | | | Expiration | |
BDC Income Fund | | | 1.25% | | | | 1.50% | | | | 5/1/22 | |
Emerging Markets Fund | | | 1.55% | | | | 1.80% | | | | 5/1/22 | |
International Select Fund | | | 0.99% | | | | 1.24% | | | | 5/1/22 | |
Tactical Credit Fund | | | 1.39% | | | | 1.64% | | | | 5/1/22 | |
At June 30, 2021, the remaining cumulative unreimbursed amount paid and/or waived by the Advisor on behalf of the Funds that may be reimbursed was $703,469. The Advisor may recapture a portion of the above amount no later than the dates as stated below.
Fund | | Expires
10/31/21 | | | Expires
12/31/21 | | | Expires
10/31/22 | | | Expires
12/31/22 | | | Expires
9/30/23 | | | Expires
12/31/23 | | | Total | |
BDC Income Fund | | $ | — | | | $ | 48,779 | * | | $ | — | | | $ | 58,429 | | | $ | — | | | $ | 58,825 | | | $ | 166,033 | |
Emerging Markets Fund | | | — | | | | — | | | | — | | | | — | | | | 634 | | | | — | | | | 634 | |
International Select Fund | | | — | | | | 91,289 | | | | — | | | | 66,303 | | | | — | | | | 44,901 | | | | 202,493 | |
Tactical Credit Fund | | | 168,854 | | | | — | | | | 82,500 | | | | 20,815 | | | | — | | | | 62,140 | | | | 334,309 | |
Total | | $ | 168,854 | | | $ | 140,068 | | | $ | 82,500 | | | $ | 145,547 | | | $ | 634 | | | $ | 165,866 | | | $ | 703,469 | |
* | The financial information presented reflects the expense reimbursement by Shelton Capital Management in effect from May 1, 2018 to December 31, 2018. |
A Fund must pay its current ordinary operating expenses before the Advisor is entitled to any reimbursement of fees and/or expenses. Any such reimbursement is contingent upon the Board of Trustees review and approval prior to the time the reimbursement is initiated.
As compensation for administrative duties not covered by the management agreement, Shelton receives an administration fee, which was revised on January 1, 2011. The administration fee is based on assets held, in aggregate, by the SCM Trust and other funds within the same “family” of investment companies managed and administered by Shelton. The fee rates are 0.10% on the first $500 million, 0.08% on the next $500 million, and 0.06% on combined assets over $1 billion. Administration fees are disclosed in the Statement of Operations.
Certain officers and trustees of the Trust are also partners of Shelton. Steve Rogers has served as a trustee and Chairman of the Board of Trustees of the Trust since 1998, and President of the Trust since 1999. Mr. Rogers is also Chief Executive Officer of the Adviser. Gregory T. Pusch has served as the Chief Compliance Officer (“CCO”) of the Trust since March 2017. Mr. Pusch is also employed by Shelton, the Advisor and Administrator to the Trust. The Trust is responsible for the portion of his salary allocated to his duties as the CCO of the Trust during his employment, and Shelton is reimbursed by the Trust for this portion of his salary. The level of reimbursement is reviewed and determined by the Board of Trustees at least annually.
The Trust has adopted a Distribution Plan (the “Plan”), as amended July 29, 2017, pursuant to Rule 12b-1 under the Investment Company Act of 1940, whereby the Investor Shares of each Fund pays RFS Partners, the Funds’ distributor (the “Distributor”), an affiliate of Shelton, for expenses that relate to the promotion and distribution of shares. Under the Plan, the Investor Shares of the Funds will pay the Distributor a fee at an annual rate of 0.25%, payable monthly, of the daily net assets attributable to such Fund’s Investor Shares.
For the year ended June 30, 2021 the following were paid:
Fund | | Investor Class
12b-1 Fees | |
BDC Income Fund | | $ | 4,986 | |
Emerging Markets Fund* | | | 2,033 | |
International Select Fund | | | 27,224 | |
Tactical Credit Fund | | | 6,275 | |
* | Period from January 1, 2021, through June 30, 2021. |
27
SCM Trust | Notes to Financial Statements (Unaudited) (Continued) | June 30, 2021 |
Management fees, Administration fees, Expense reimbursement from the manager, CCO fees and Trustees fees incurred during the year are included in the Statement of Operations.
NOTE 3 - PURCHASES AND SALES OF SECURITIES
Purchases and sales of securities other than short-term instruments for the year ended June 30, 2021 were as follows:
Fund | | Purchases | | | Sales | |
BDC Income Fund | | $ | 650,971 | | | $ | 1,132,735 | |
Emerging Markets Fund | | | 3,093,781 | | | | 1,782,684 | |
International Select Fund | | | 49,515,259 | | | | 30,610,131 | |
Tactical Credit Fund | | | 19,415,465 | | | | 27,135,798 | |
NOTE 4 - TAX CHARACTER
Tax Basis of Distributable Earnings: The tax character of distributable earnings at December 31, 2020 was as follows:
| | | Undistributed
Ordinary Income | | | Undistributed
Long-Term
Capital Gain | | | Capital
Loss Carry
Forwards | | | Unrealized
Appreciation/
(Depreciation) | | | Post October
and Other
Losses | | | Total
Distributable
Earnings | |
BDC Income Fund | | $ | 41,363 | | | $ | — | | | $ | (4,647,801 | ) | | $ | (295,290 | ) | | $ | — | | | $ | (4,901,728 | ) |
Emerging Markets Fund | | | 593,515 | | | | — | | | | (3,020,220 | ) | | | 7,531,566 | | | | — | | | | 5,104,861 | |
International Select Fund | | | 742,014 | | | | — | | | | (51,221,761 | ) | | | 25,687,492 | | | | — | | | | (24,792,255 | ) |
Tactical Credit Fund | | | 707,997 | | | | — | | | | (5,977,277 | ) | | | (4,330,721 | ) | | | — | | | | (9,600,001 | ) |
The difference between book basis and tax basis unrealized appreciation/(depreciation) is attributable primarily to wash sales and PFICs.
Capital Losses: Capital loss carry forwards, as of December 21, 2020, available to offset future capital gains, if any, are as follows:
Expiring | | BDC Income
Fund | | | Emerging
Markets Fund | | | International
Select Fund* | | | Tactical Credit
Fund** | |
Long Term with No Expiration | | $ | (2,038,826 | ) | | $ | (3,020,220 | ) | | $ | (46,167,307 | ) | | $ | (3,536,329 | ) |
Short Term with No Expiration | | | (2,608,975 | ) | | | — | | | | (5,054,454 | ) | | | (2,440,948 | ) |
Long Term with Expiration | | | — | | | | — | | | | — | | | | — | |
Short Term with Expiration | | | — | | | | — | | | | — | | | | — | |
Total | | $ | (4,647,801 | ) | | $ | (3,020,220 | ) | | $ | (51,221,761 | ) | | $ | (5,977,277 | ) |
* | Subject to annual limitation under §382 of The Code of $214,635 in 2021 and 2022, and $27,391 in 2023. |
** | Subject to annual limitation of $561,798 under §382 of The Code through 2023 with $527,580 available in 2024. |
Distributions to Shareholders: Income distributions and capital gain distributions are determined in accordance with income tax regulations, which may differ from U.S. generally accepted accounting principles. These differences are primarily due to differing treatments of income and gains on various investment securities held by each Fund, timing differences and differing characterization of distributions made by each Fund.
The tax character of distributions paid during the year ended December 31, 2020 are as follows:
Fund | Year or
Period Ended | | Return of
Capital | | | Ordinary
Income | | | Long-Term
Capital Gains(a) | | | Exempt-Interest
Dividends | | | Total
Distributions | |
BDC Income Fund | December 31, 2019 | | $ | 63,262 | | | $ | 545,542 | | | $ | — | | | $ | — | | | $ | 608,804 | |
| | December 31, 2020 | | | — | | | | 417,614 | | | | — | | | | — | | | | 417,614 | |
Emerging Markets Fund | September 30, 2019 | | | — | | | | 1,506,869 | | | | 75,722 | | | | — | | | | 1,582,591 | |
| | September 30, 2020 | | | — | | | | 852,068 | | | | — | | | | — | | | | 852,068 | |
| | December 31, 2020 | | | — | | | | 50,052 | | | | — | | | | — | | | | 50,052 | |
International Select Fund | December 31, 2019 | | | — | | | | 1,253,877 | | | | — | | | | — | | | | 1,253,877 | |
| | December 31, 2020 | | | — | | | | 885,582 | | | | — | | | | — | | | | 885,582 | |
Tactical Credit Fund | October 31, 2019(b) | | | — | | | | 161,752 | | | | 647,005 | | | | 2,260,001 | | | | 3,068,758 | |
| | December 31, 2019(b) | | | — | | | | 375,685 | | | | — | | | | 707,607 | | | | 1,083,292 | |
| | December 31, 2020 | | | — | | | | 2,303,959 | | | | — | | | | — | | | | 2,303,959 | |
(a) | The Funds designate Long-Term Capital Gain dividends pursuant to Section 852(b)(3) of the Internal Revenue Code for the year ended December 31, 2019. |
(b) | The tax distributions for the period ended December 31, 2019 differ from book distributions by $723,486 of which $264,188 was included in the book distribution for the year ended October 31, 2019 and $459,292 of income earned by Shelton Tactical Credit Fund prior to the merger date but not included in the book distributions as the Cedar Ridge Fund was the accounting survivor (see note 7) of the merger. |
The tax distributions for October 31, 2019 differ from the book distributions by $264,188 as that amount was included in the tax distributions post-merger for the period ending December 31, 2019.
A final tax returned for the Cedar Ridge Unconstrained Credit Fund was filed for the period ended June 21, 2019 the date of the merger (see note 7).
28
SCM Trust | Notes to Financial Statements (Unaudited) (Continued) | June 30, 2021 |
NOTE 5 - RECENT ACCOUNTING PRONOUNCEMENTS
In August 2018, FASB issued Accounting Standards Update No. 2018-13, “Fair Value Measurement (Topic 820: Disclosure Framework — Changes to the Disclosure Requirements for Fair Value Measurement” (“ASU 2018-13”). ASU 2018-13 eliminates the requirement to disclose the amount of and reasons for transfers between Level 1 and Level 2 of the fair value hierarchy, the timing of transfers between levels of the fair value hierarchy and the valuation processes for Level 3 fair value measurements. ASU 2018-13 will require the need to disclose the range and weighted average used to develop significant unobservable inputs for Level 3 fair value measurements and the changes in unrealized gains and losses for recurring Level 3 fair value measurements. ASU 2018-13 will also require that information is provided about the measurement uncertainty of Level 3 fair value measurements as of the reporting date. The guidance is effective for fiscal years, and interim periods within those fiscal years, beginning after December 15, 2019, and allows for early adoption of either the entire standard or only the provisions that eliminate or modify the requirements. Management has elected to adopt early the provisions that eliminate the disclosure requirements. Management is still currently evaluating the impact of applying the rest of the guidance.
NOTE 6 - BORROWINGS
In connection with the short sale arrangement of Shelton Tactical Credit Fund, the Fund may borrow in excess of the short sale proceeds. At June 30, 2021, the total amount outstanding in excess of the short sale proceeds was $0. Amounts borrowed under this arrangement bear interest at an interest rate based on the bank’s margin rate. For the period ended June 30, 2021, the weighted average interest rate of this arrangement was 1.82%, the average amount outstanding was $79,052 and the maximum outstanding balance was $4,982,778. The total amount of interest charged under the arrangement was $725 and is included in the balance of Interest and fees on borrowings and short sale arrangement in the Statement of Operations.
NOTE 7 - REORGANIZATION
On June 19, 2019, the shareholders of the Cedar Ridge Unconstrained Credit Fund approved the agreement and plan of reorganization providing for the transfer of assets and assumption of liabilities into the Shelton Tactical Credit Fund. Cedar Ridge Unconstrained Credit Fund is the performance and accounting survivor of the reorganization, Shelton Tactical Credit is the legal and tax survivor. The reorganization was effective as of the close of business on June 21, 2019. The following table illustrates the specifics of the Fund’s reorganization:
Shelton Tactical
Credit Fund Pre-
Reorganization
Net Assets | New Shares issued to
Shareholders of Shelton
Tactical Credit Fund | Cedar Ridge
Unconstrained Credit
Fund Net Assets | Combined Net Assets | Tax Status
of Transfer |
$23,813,547 | 2,227,883 | $76,412,507 | $100,226,054(a) | Non-taxable |
(a) | Includes undistributed net investment income, accumulated realized gains and unrealized depreciation in the amounts of $-, $- and $760,216 respectively. |
As of close of business on June 21, 2019, the classes were converted at the following rates:
Pre-Merger Class | Pre-Merger
NAV | Rate | Shares | Dollars | Post-Merger
NAV | Post Merger Class |
Shelton Tactical Credit – Institutional Class | 10.17 | 0.9514 | 1,323,638 | $14,151,144 | 10.69 | Shelton Tactical Credit –
Institutional Class |
Shelton Tactical Credit – Investor Class | 10.15 | 0.9499 | 904,245 | $9,662,403 | 10.69 | Shelton Tactical Credit –
Investor Class |
Cedar Ridge Unconstrained Credit Fund – Institutional Class | 10.69 | 1.0000 | 6,189,879 | $66,176,655 | 10.69 | Shelton Tactical Credit –
Institutional Class |
Cedar Ridge Unconstrained Credit Fund – Investor Class | 10.69 | 1.0000 | 957,909 | $10,235,852 | 10.69 | Shelton Tactical Credit –
Investor Class |
On May 23, 2020, the shareholders of the ICON International Equity Fund approved the agreement and plan of reorganization providing for the transfer of assets and assumption of liabilities into the Shelton International Select Equity Fund. Shelton International Select Equity Fund is the survivor of the reorganization. The reorganization was effective as of the close of business on June 26, 2020. The following table illustrates the specifics of the Fund’s reorganization:
ICON International
Equity Fund
Pre-Reorganization
Net Assets | New Shares issued
to Shareholders of
ICON International
Equity Fund | Shelton International
Select Equity Fund
Net Assets | Combined
Net Assets | Tax Status
of Transfer |
$23,244,237(a) | 1,121,368 | $62,750,633 | $85,994,870 | Non-taxable |
(a) | Includes undistributed net investment income, accumulated realized losses and unrealized appreciation in the amounts of $528,663, $(9,724,470) and $2,157,152, respectively, from the merged fund. |
29
SCM Trust | Notes to Financial Statements (Unaudited) (Continued) | June 30, 2021 |
As of close of business on June 26, 2020, the classes were converted at the following rates:
Pre-Merger Class | | Pre-Merger
NAV | | | Rate | | | Shares | | | Dollars | | | Post-Merger
NAV | | | Post Merger Class | |
ICON International Equity Fund – Class S | | | $9.40 | | | | 0.4532 | | | | 1,027,306 | | | | $21,305,921 | | | | $20.74 | | | | Shelton International Select Equity Fund –
Institutional Class | |
ICON International Equity Fund – Class A | | | $9.18 | | | | 0.4454 | | | | 69,706 | | | | $1,435,990 | | | | $20.61 | | | | Shelton International Select Equity Fund –
Investor Class | |
ICON International Equity Fund – Class C | | | $8.08 | | | | 0.3920 | | | | 24,356 | | | | $502,326 | | | | $20.61 | | | | Shelton International Select Equity Fund –
Investor Class | |
Fund Holdings
The Fund holdings shown in this report are as of June 30, 2021. Holdings are subject to change at any time, so holdings shown in the report may not reflect current Fund holdings. The Fund’s Form N-PORT is available on the SEC’s website at www.sec.gov. The information filed in the form N-PORT also may be obtained by calling (800) 955-9988.
Proxy Voting Policy
The Fund’s Statement of Additional Information (“SAI”) containing a description of the policies and procedures that the SCM Trust uses to determine how to vote proxies relating to portfolio securities, along with the Fund’s proxy voting record relating to portfolio securities held during the 12-month period ended June 30, 2020 is available upon request, at no charge, at the phone number above, or on the SEC’s website at www.sec.gov.
About this Report
This report is submitted for the general information of the shareholders of the SCM Trust. It is authorized for distribution only if preceded or accompanied by a current SCM Trust prospectus. Additional copies of the prospectus may be obtained by calling (800) 955-9988 or can be downloaded from the Fund’s website at www.sheltoncap.com. Please read the prospectus carefully before you invest or send money, as it explains the risks, fees and expenses of investing in the Fund.
30
| | Board of Trustees and Executive Officers | |
Overall responsibility for management of the Funds rests with the Board of Trustees. The Trustees serve during the lifetime of the Trust and until its termination, or until death, resignation, retirement or removal. The Trustees, in turn, elect the officers of the Fund to actively supervise its day-to-day operations. The officers have been elected for an annual term. The following are the Trustees and Executive Officers of the Funds:
Name | Address | Year of Birth | Position Held with the Trust | Length of
Time Served |
Stephen C. Rogers | 1875 Lawrence Street,
Suite 300
Denver, CO 80202 | 1966 | Chairman of the Board,
Trustee,
President | Since August 1999
Since August 1999
Since August 1999 |
Kevin T. Kogler | 1875 Lawrence Street,
Suite 300
Denver, CO 80202 | 1966 | Trustee | Since May 2006 |
Marco L. Quazzo | 1875 Lawrence Street,
Suite 300
Denver, CO 80202 | 1962 | Trustee | Since August 2014 |
Stephen H. Sutro | 1875 Lawrence Street,
Suite 300
Denver, CO 80202 | 1969 | Trustee | Since May 2006 |
William P. Mock | 1875 Lawrence Street,
Suite 300
Denver, CO 80202 | 1966 | Treasurer | Since February 2010 |
Gregory T. Pusch | 1875 Lawrence Street,
Suite 300
Denver, CO 80202 | 1966 | Chief Compliance Officer, Secretary | Since March 2017 |
Each Trustee oversees the Trust’s four Funds. The principal occupations of the Trustees and Executive Officers of the Funds during the past five years and public directorships held by the Trustees are set forth below:
Stephen C. Rogers* | Chief Executive Officer, Shelton Capital Management, 1999 to present. |
Kevin T. Kogler | President & Founder of MicroBiz, LLC, 2012 to present; Principal, Robertson Piper Software Group, 2006 to 2012; Senior Vice President, Investment Banking, Friedman, Billings Ramsey, 2003 to 2006. |
Marco L. Quazzo | Principal, Bartko Zankel Bunzel & Miller, March 2015-Present; Partner, Barg Coffin Lewis & Trapp LLP (law firm), 2008 to March 2015. |
Stephen H. Sutro | Managing Partner, Duane Morris, LLP (law firm) 2014 to present; Partner, Duane Morris LLP (law firm), 2003 to present. |
William P. Mock | Portfolio Manager, Shelton Capital Management, 2010 to present. |
Gregory T. Pusch | Principal Occupations Past five years: Global Head of Risk & Compliance, Matthews Asia 2015-2016; Head of Legal & Regulatory Compliance / CCO, HarbourVest Partners 2012-2015. |
Additional information about the Trustees may be found in the SAI, which is available without charge by calling (800) 955-9988.
* | Trustee deemed to be an “interested person” of the Trust, as defined in the Investment Company Act of 1940. Mr. Rogers is an interested person because he is the CEO of Shelton Capital Management, the Trust’s Advisor and Administrator. |
31
Board Approval of the Investment Advisory Agreement (Unaudited)
June 30, 2021 |
The Investment Company Act of 1940 (the “1940 Act”) requires that the full board of the SCM Trust (the “Board”) and a majority of the Independent Trustees annually approve the continuation of:
| | ● | The Investment Advisory Agreement (the “Advisory Agreement”) dated October 11, 2016 between SCM Trust, on behalf of the funds listed below, and Shelton Capital Management (“SCM”): |
| | o | Shelton International Select Equity Fund; |
| | o | Shelton BDC Income Fund; and |
| | o | Shelton Tactical Credit Fund (each, a “Fund” and collectively, the Funds”). |
At a meeting held on February 26, 2021, the Board, including a majority of the Independent Trustees, considered and approved the continuation of the Advisory Agreement for an additional one-year period:
Prior to the Meeting, the Independent Trustees requested information from SCM and third-party sources. This information, together with other information provided by SCM, and the information provided to the Independent Trustees throughout the course of the year, formed the primary (but not exclusive) basis for the Board’s determinations, as summarized below. In addition to the information identified above, other material factors and conclusions that formed the basis for the Board’s subsequent approval are described below.
Information Received
Materials Received. During the course of each year, the Independent Trustees receive a wide variety of materials relating to the services provided by SCM, including reports on each applicable Fund’s investment results; portfolio composition; third party fund rankings; investment strategy; portfolio trading practices; shareholder services; and other information relating to the nature, extent and quality of services provided by SCM to the applicable Funds. In addition, the Board requests and reviews supplementary information that includes materials regarding each Fund’s investment results, advisory fee and expense comparisons, the costs of operating the Funds and financial and profitability information regarding Shelton Capital, descriptions of various functions such as compliance monitoring and portfolio trading practices, and information about the personnel providing investment management services to each applicable Fund.
Review Process. The Board received assistance and advice regarding legal and industry standards from independent legal counsel to the Independent Trustees and fund counsel. The Board discussed the renewal of the Advisory Agreement with SCM representatives, and in a private session with independent legal counsel at which representatives of SCM were not present. In deciding to approve the renewal of the Advisory Agreement, the Independent Trustees considered the total mix of information requested by and made available to them and did not identify any single issue or particular information that, in isolation, was the controlling factor. This summary describes the most important, but not all, of the factors considered by the Board.
Nature, Extent and Quality of Services
SCM, its personnel and its resources. The Board considered the depth and quality of Shelton Capital’s investment management process; the experience, capability and integrity of its senior management and other personnel; operating performance and the overall financial strength and stability of its organization. The Board also considered that SCM made available to its investment professionals a variety of resources relating to investment management, compliance, trading, performance and portfolio accounting. The Board further considered SCM’s continuing need to attract and retain qualified personnel and, noting SCM’s additions over recent years, determined that SCM was adequately managing matters related to the Funds.
Other Services. The Board considered, in connection with the performance of its investment management services to the Funds: SCM’s policies, procedures and systems to ensure compliance with applicable laws and regulations and each of their commitment to these programs; each of their efforts to keep the Trustees informed; and each of their attention to matters that may involve conflicts of interest with the applicable Funds. As a point of comparison, the Board also considered the nature, extent, quality and cost of certain non-investment related administrative services provided by SCM to the Funds under the administration servicing agreements.
The Board concluded that SCM had the quality and depth of personnel and investment methods essential to performing its duties under the applicable Advisory Agreements, and that the nature, extent and overall quality of such services provided by SCM, respectively, are satisfactory and reliable.
Investment Performance
The Board considered each Fund’s investment results in comparison to its stated investment objectives. The Trustees reviewed the short-term and long-term performance of each Fund on both an absolute basis and against its benchmark indices. The Trustees also reviewed performance rankings for each Fund as provided by an independent third-party service provider, as applicable. Among the factors considered in this regard, were the following:
| | ● | For the Shelton International Select Equity Fund, it was noted that the performance of the Fund relative to its peer category was in the highest performing quartile over the 1-year and 3-year periods. |
| | ● | For the Shelton BDC Income Fund, it was noted that the performance of the Fund relative to its peer category was in the second lowest performing quartile over the 3-year period, and in the lowest performing quartile over the 1-year and 5-year periods. |
| | ● | For the Shelton Tactical Credit Fund, it was noted that the performance of the Fund relative to its peer category was in the second highest performing quartile over the 1-year and 3-year periods and in the second lowest performing quartile over the 5-year period. |
The Board received a satisfactory explanation of the reasons underlying the performance of the lower performing Funds and SCM articulated a strategy for improving performance of these Funds. The Board ultimately concluded that SCM’s performance records in managing the applicable Fund was satisfactory, and in some cases excellent, supporting the determination that SCM’s continued management under the Advisory Agreement would be consistent with the best interests of each applicable Fund and its shareholders.
32
Board Approval of the Investment Advisory Agreement (Unaudited) (Continued)
June 30, 2021 |
Management Fees and Total Annual Operating Expense Ratios
The Board reviewed the management fees and total operating expenses of each Fund and compared such amounts with the management fees and total operating expenses of other funds in the industry that are found within the same style category as defined by a third-party independent service provider. The Board considered the asset size, advisory fees and total fees and expenses of each Fund in comparison to the asset size, advisory fees and other fees and expenses of other funds in each Fund’s relevant category. The Trustees considered both the gross advisory fee rates, as well as the effective advisory rates charged by SCM after taking into consideration the expense limitation arrangements and voluntary fee waivers on certain Funds.
The Board noted that the maximum management fee charged to each Fund was higher than the relevant Fund’s peer category median.
The Board also observed that each Fund’s total annual operating expense ratios, after taking into account the expense limitations and waivers applicable to certain Funds (and excluding acquired fund fees and expenses for the Shelton BDC Income Fund), were higher than the relevant Fund’s peer category median, except for the net expense ratio of the Institutional Class of the Shelton BDC Income Fund, which (excluding acquired fund fees and expenses) was slightly below the Fund’s peer category median.
Comparable Accounts
The Board noted certain information provided by SCM regarding fees charged to other clients utilizing a strategy similar to that employed by an applicable Fund. The Board determined that, bearing in mind the limitations of comparing different types of managed accounts and the different levels of service typically associated with such accounts, the fee structures applicable to SCM’s other clients employing a comparable strategy to each applicable Fund was not indicative of any unreasonableness with respect to the advisory fee payable by such Fund.
Cost Structure, Level of Profits, Economies of Scale and Ancillary Benefits
The Board reviewed information regarding SCM’s costs of providing services to the applicable Funds. The Board also reviewed the resulting level of profits to SCM, including the cost allocation methodologies used to calculate such profits. The Independent Trustees received financial and other information from SCM.
The Board noted its intention to continue to monitor assets under management, and the resulting impact on SCM’s profitability, in order to ensure that each has sufficient resources to continue to provide the services that shareholders in the applicable Funds require. The Trustees also noted that currently, SCM has contractually agreed to limit its advisory fees on certain Funds so that those Funds do not exceed their respective specified operating expense limitations, and may extend those limits in the future.
The Board also considered that SCM does not receive material indirect benefits from managing the applicable Funds. For example, SCM does not currently employ a “soft dollar” program, but noted that Shelton Capital may seek to employ a soft dollar program in the near future.
Based on the foregoing, together with the other information provided to it at the Meeting and throughout the year, the Board concluded that each applicable Fund’s cost structure and level of profits for SCM, were reasonable and that economies of scale and ancillary benefits, to the extent present with respect to a Fund, were not material.
Conclusions
The Board indicated that the information presented and the discussion of the information were adequate for making a determination regarding the renewal of the Advisory Agreement. During the review process, the Board noted certain instances where clarification or follow-up was appropriate and others where the Board determined that further clarification or follow-up was not necessary. In those instances where clarification or follow-up was requested, the Board determined that in each case either information responsive to its requests had been provided, or where any request was outstanding in whole or in part, given the totality of the information provided with respect to the Advisory Agreement, the Board had received sufficient information to renew and approve the Advisory Agreement.
Based on their review, including but not limited to their consideration of each of the factors referred to above, the Board concluded that the Advisory Agreement, taking into account the separate administration fees, is and would be fair and reasonable to each Fund and its shareholders, that each Fund’s shareholders received or should receive reasonable value in return for the advisory fees and other amounts paid to SCM by the Funds, and that the renewal of the Advisory Agreement was in the best interests of each Fund and its shareholders.
33
THIS PAGE INTENTIONALLY LEFT BLANK
THIS PAGE INTENTIONALLY LEFT BLANK
THIS PAGE INTENTIONALLY LEFT BLANK
THIS PAGE INTENTIONALLY LEFT BLANK
THIS PAGE INTENTIONALLY LEFT BLANK


SEMI-ANNUAL REPORT
June 30, 2021
ICON Consumer Select Fund
ICON Equity Fund
ICON Equity Income Fund
ICON Flexible Bond Fund
ICON Health and Information Technology Fund
ICON Natural Resources and Infrastructure Fund
ICON Utilities and Income Fund
Table of Contents | June 30, 2021 |
| | |
About Your Fund’s Expenses | 2 |
Top Holdings and Sector Breakdown | 4 |
Portfolio of Investments | 6 |
Statements of Assets and Liabilities | 13 |
Statements of Operations | 15 |
Statements of Changes in Net Assets | 17 |
Financial Highlights | 25 |
Notes to Financial Statements | 32 |
Additional Information | 42 |
Board of Trustees and Executive Officers | 43 |
1
About Your Fund’s Expenses (Unaudited) | June 30, 2021 |
As a shareholder of the Funds, you incur two types of costs: (1) transaction costs, including sales charges (loads) on purchase payments, reinvested dividends, or other distributions, redemption fees, and exchange fees; and (2) ongoing costs, including management fees, distribution fees and other Fund expenses. Operating expenses, which are deducted from the Funds’ gross income, directly reduce the investment return of the Funds. The Funds’ expenses are expressed as a percentage of its average net assets. This figure is known as the expense ratio. This example is intended to help you understand your ongoing cost (in dollars) of investing in the Funds and to compare these costs with the ongoing costs of investing in other mutual funds. The examples are based on an investment of $1,000 invested at the beginning of the period and held for the entire period from January 1, 2021 to June 30, 2021.
Actual Expenses
The first line of the tables below provides information about actual account values and actual expenses. You may use the information in this line, together with the amount you invested, to estimate the expenses you have paid over the period. Simply divide your account value by $1,000 (for example, an $8,600 account value divided by $1,000 = 8.6), then multiply the result by the number in the first line under the heading entitled “Expenses Paid During Period” to estimate the expenses you paid on your account during this period.
Hypothetical Example for Comparison Purposes
The second line of the table provides information about hypothetical account values and hypothetical expenses based on the Funds’ actual expense ratio and an assumed rate of return of 5% per year before expenses, which is not the Funds’ actual return. The hypothetical account values and expenses may not be used to estimate the actual ending account balance or expenses you paid for the period. You may use this information to compare the ongoing costs of investing in the Funds and other funds. To do so, compare this 5% hypothetical example with the 5% hypothetical examples that appear in the shareholder reports of the other funds. The Funds do not charge any sales charges. Please note that the expenses shown in the tables are meant to highlight your ongoing costs only and do not reflect any transactional cost, such as sales charges (loads), redemption fees, or exchange fees. Therefore, the second line of the tables are useful in comparing ongoing costs only, and will not help you determine the relative total costs of owning different funds. In addition, if these transactional costs were included, your costs would have been higher. The calculations assume no shares were bought or sold during the period.
| | Beginning
Account Value
January 1, 2021 | Ending
Account Value
June 30, 2021 | Expenses Paid
During Period* | Net Annual
Expense Ratio |
ICON Consumer Select Fund | | | | |
Institutional Shares | | | | |
Based on Actual Fund Return | $ 1,000 | $ 1,182 | $ 7.36 | 1.36% |
Based on Hypothetical 5% Return before expenses | $ 1,000 | $ 1,018 | $ 6.80 | 1.36% |
Investor Shares | | | | |
Based on Actual Fund Return | $ 1,000 | $ 1,179 | $ 8.64 | 1.60% |
Based on Hypothetical 5% Return before expenses | $ 1,000 | $ 1,017 | $ 8.00 | 1.60% |
| | | | | |
ICON Equity Fund | | | | |
Institutional Shares | | | | |
Based on Actual Fund Return | $ 1,000 | $ 1,205 | $ 6.01 | 1.10% |
Based on Hypothetical 5% Return before expenses | $ 1,000 | $ 1,020 | $ 5.51 | 1.10% |
Investor Shares | | | | |
Based on Actual Fund Return | $ 1,000 | $ 1,203 | $ 7.32 | 1.34% |
Based on Hypothetical 5% Return before expenses | $ 1,000 | $ 1,018 | $ 6.70 | 1.34% |
| | | | | |
ICON Equity Income Fund | | | | |
Institutional Shares | | | | |
Based on Actual Fund Return | $ 1,000 | $ 1,193 | $ 5.44 | 1.00% |
Based on Hypothetical 5% Return before expenses | $ 1,000 | $ 1,020 | $ 5.01 | 1.00% |
Investor Shares | | | | |
Based on Actual Fund Return | $ 1,000 | $ 1,191 | $ 6.74 | 1.24% |
Based on Hypothetical 5% Return before expenses | $ 1,000 | $ 1,019 | $ 6.21 | 1.24% |
| | | | | |
ICON Flexible Bond Fund | | | | |
Institutional Shares | | | | |
Based on Actual Fund Return | $ 1,000 | $ 1,034 | $ 3.83 | 0.76% |
Based on Hypothetical 5% Return before expenses | $ 1,000 | $ 1,021 | $ 3.81 | 0.76% |
Investor Shares | | | | |
Based on Actual Fund Return | $ 1,000 | $ 1,033 | $ 5.04 | 1.00% |
Based on Hypothetical 5% Return before expenses | $ 1,000 | $ 1,020 | $ 5.01 | 1.00% |
| | | | | |
* | Expenses are equal to the Fund’s annualized expense ratio listed in the “Net Annual Expense Ratio” column, multiplied by the average account value over the
period, multiplied by 181/365 (to reflect the one-half year period). |
2
About Your Fund’s Expenses (Unaudited) (Continued) | June 30, 2021 |
| | Beginning
Account Value
January 1, 2021 | Ending
Account Value
June 30, 2021 | Expenses Paid
During Period* | Net Annual
Expense Ratio |
ICON Health and Information Technology Fund | | | | |
Institutional Shares | | | | |
Based on Actual Fund Return | $ 1,000 | $ 1,128 | $ 6.65 | 1.26% |
Based on Hypothetical 5% Return before expenses | $ 1,000 | $ 1,019 | $ 6.31 | 1.26% |
Investor Shares | | | | |
Based on Actual Fund Return | $ 1,000 | $ 1,127 | $ 7.91 | 1.50% |
Based on Hypothetical 5% Return before expenses | $ 1,000 | $ 1,018 | $ 7.51 | 1.50% |
| | | | | |
ICON Natural Resources and Infrastructure Fund | | | | |
Institutional Shares | | | | |
Based on Actual Fund Return | $ 1,000 | $ 1,145 | $ 6.91 | 1.30% |
Based on Hypothetical 5% Return before expenses | $ 1,000 | $ 1,019 | $ 6.51 | 1.30% |
Investor Shares | | | | |
Based on Actual Fund Return | $ 1,000 | $ 1,250 | $ 8.70 | 1.56% |
Based on Hypothetical 5% Return before expenses | $ 1,000 | $ 1,017 | $ 7.80 | 1.56% |
| | | | | |
ICON Utilities and Income Fund | | | | |
Institutional Shares | | | | |
Based on Actual Fund Return | $ 1,000 | $ 1,145 | $ 6.49 | 1.22% |
Based on Hypothetical 5% Return before expenses | $ 1,000 | $ 1,019 | $ 6.11 | 1.22% |
Investor Shares | | | | |
Based on Actual Fund Return | $ 1,000 | $ 1,145 | $ 7.76 | 1.46% |
Based on Hypothetical 5% Return before expenses | $ 1,000 | $ 1,018 | $ 7.31 | 1.46% |
* | Expenses are equal to the Fund’s annualized expense ratio listed in the “Net Annual Expense Ratio” column, multiplied by the average account value over the period, multiplied by 181/365 (to reflect the one-half year period). |
3
Top Holdings and Sector Breakdown (Unaudited) | June 30, 2021 |
ICON Consumer Select Fund
Security | | Market
Value | | | Percentage
of Total
Investment | | 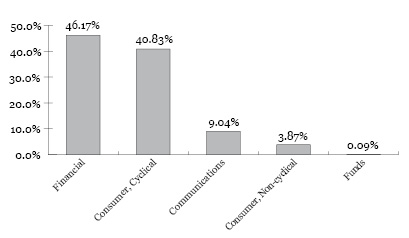
|
1 | The Goldman Sachs Group Inc | | | $3,074,193 | | | | 5.1 | % |
2 | Ally Financial Inc | | | 3,060,176 | | | | 5.1 | % |
3 | NIKE Inc | | | 2,842,616 | | | | 4.7 | % |
4 | Ulta Beauty Inc | | | 2,800,737 | | | | 4.7 | % |
5 | Monarch Casino & Resort Inc | | | 2,798,991 | | | | 4.7 | % |
6 | Mastercard Inc | | | 2,738,175 | | | | 4.6 | % |
7 | PulteGroup Inc | | | 2,559,333 | | | | 4.3 | % |
8 | Green Brick Partners Inc | | | 2,410,622 | | | | 4.0 | % |
9 | Bank of America Corp | | | 2,399,586 | | | | 4.0 | % |
10 | US Bancorp | | | 2,364,255 | | | | 3.9 | % |
ICON Equity Fund
Security | | Market
Value | | | Percentage
of Total
Investment | | 
|
1 | Skyworks Solutions Inc | | | $6,319,313 | | | | 7.8 | % |
2 | EPAM Systems Inc | | | 5,365,080 | | | | 6.7 | % |
3 | Mastercard Inc | | | 4,245,632 | | | | 5.3 | % |
4 | NIKE Inc | | | 4,155,781 | | | | 5.2 | % |
5 | Chart Industries Inc | | | 3,892,112 | | | | 4.8 | % |
6 | Global Payments Inc | | | 3,537,379 | | | | 4.4 | % |
7 | Ally Financial Inc | | | 3,264,520 | | | | 4.0 | % |
8 | Adobe Inc | | | 3,162,456 | | | | 3.9 | % |
9 | Extreme Networks Inc | | | 2,920,572 | | | | 3.6 | % |
10 | Bank of America Corp | | | 2,700,070 | | | | 3.3 | % |
ICON Equity Income Fund
Security | | Market
Value | | | Percentage
of Total
Investment | | 
|
1 | Lincoln National Corp | | | $4,449,072 | | | | 5.1 | % |
2 | Bristol-Myers Squibb Co | | | 4,109,430 | | | | 4.7 | % |
3 | JPMorgan Chase & Co | | | 3,787,866 | | | | 4.3 | % |
4 | Genuine Parts Co | | | 3,275,573 | | | | 3.7 | % |
5 | Prudential Financial Inc | | | 3,227,805 | | | | 3.7 | % |
6 | Cummins Inc | | | 3,193,911 | | | | 3.6 | % |
7 | MDC Holdings Inc | | | 3,125,866 | | | | 3.6 | % |
8 | Walgreens Boots Alliance Inc | | | 3,114,512 | | | | 3.6 | % |
9 | International Paper Co | | | 3,010,321 | | | | 3.4 | % |
10 | Whirlpool Corp | | | 2,834,260 | | | | 3.2 | % |
ICON Flexible Bond Fund
Security | | Market
Value | | | Percentage
of Total
Investment | | 
|
1 | First American Government Obligations Fund | | | $14,981,360 | | | | 10.3 | % |
2 | Argo Group US Inc, 6.500% | | | 8,451,506 | | | | 5.8 | % |
3 | Principal Financial Group Inc, 3M US LIBOR + 3.044%, 5/15/2055 | | | 7,070,895 | | | | 4.9 | % |
4 | Fifth Third Bancorp, 3M US LIBOR + 3.129% | | | 6,692,808 | | | | 4.6 | % |
5 | Dell International LLC / EMC Corp, 6.100%, 7/15/2027 | | | 5,653,251 | | | | 3.9 | % |
6 | Bank of America Corp, 7.250% | | | 5,339,736 | | | | 3.7 | % |
7 | Monmouth Real Estate Investment Corp, 6.125% | | | 5,137,012 | | | | 3.5 | % |
8 | Andeavor LLC, 5.125%, 12/15/2026 | | | 4,573,779 | | | | 3.2 | % |
9 | PacifiCorp, 8.069%, 9/9/2022 | | | 3,978,286 | | | | 2.7 | % |
10 | Foot Locker Inc, 8.500%, 1/15/2022 | | | 3,900,000 | | | | 2.7 | % |
4
Top Holdings and Sector Breakdown (Unaudited) (Continued) | June 30, 2021 |
ICON Health and Information Technology Fund
Security | | Market
Value | | | Percentage
of Total
Investment | | 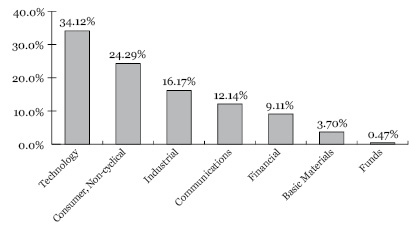
|
1 | EPAM Systems Inc | | | $7,868,784 | | | | 6.0 | % |
2 | Skyworks Solutions Inc | | | 6,329,668 | | | | 4.9 | % |
3 | UnitedHealth Group Inc | | | 6,086,688 | | | | 4.7 | % |
4 | Adobe Inc | | | 5,797,836 | | | | 4.5 | % |
5 | NXP Semiconductors NV | | | 5,695,770 | | | | 4.4 | % |
6 | Global Payments Inc | | | 5,662,395 | | | | 4.3 | % |
7 | Mastercard Inc | | | 5,439,841 | | | | 4.2 | % |
8 | II-VI Inc | | | 5,146,631 | | | | 4.0 | % |
9 | Euronet Worldwide Inc | | | 5,116,230 | | | | 3.9 | % |
10 | Autodesk Inc | | | 5,108,250 | | | | 3.9 | % |
ICON Natural Resources and Infrastructure Fund
Security | | Market
Value | | | Percentage
of Total
Investment | | 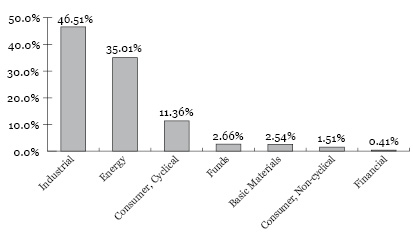
|
1 | Chart Industries Inc | | | $6,584,400 | | | | 5.0 | % |
2 | Diamondback Energy Inc | | | 6,572,300 | | | | 5.0 | % |
3 | Royal Dutch Shell PLC | | | 6,504,400 | | | | 5.0 | % |
4 | Exxon Mobil Corp | | | 6,497,240 | | | | 5.0 | % |
5 | Delek US Holdings Inc | | | 6,486,000 | | | | 4.9 | % |
6 | Herman Miller Inc | | | 6,128,200 | | | | 4.7 | % |
7 | MasTec Inc | | | 5,665,210 | | | | 4.3 | % |
8 | Atlantica Sustainable Infrastructure PLC | | | 5,359,680 | | | | 4.1 | % |
9 | Valero Energy Corp | | | 5,075,200 | | | | 3.9 | % |
10 | Old Dominion Freight Line Inc | | | 4,822,200 | | | | 3.7 | % |
ICON Utilities and Income Fund
Security | | Market
Value | | | Percentage
of Total
Investment | | 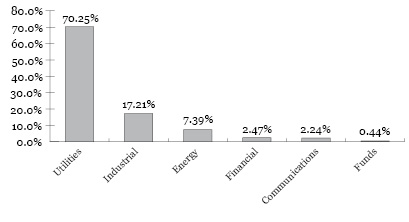
|
1 | MDU Resources Group Inc | | | $2,663,900 | | | | 6.5 | % |
2 | Xcel Energy Inc | | | 2,358,504 | | | | 5.8 | % |
3 | Duke Energy Corp | | | 2,260,688 | | | | 5.5 | % |
4 | Atlantica Sustainable Infrastructure PLC | | | 2,158,760 | | | | 5.3 | % |
5 | Sempra Energy | | | 2,119,680 | | | | 5.2 | % |
6 | Ameren Corp | | | 2,001,000 | | | | 4.9 | % |
7 | Avangrid Inc | | | 1,810,336 | | | | 4.4 | % |
8 | The AES Corp | | | 1,715,406 | | | | 4.2 | % |
9 | National Fuel Gas Co | | | 1,651,100 | | | | 4.0 | % |
10 | Evergy Inc | | | 1,631,610 | | | | 4.0 | % |
5
ICON Consumer Select Fund Portfolio of Investments (Unaudited) June 30, 2021 |
Security Description | | Shares | | | Value | |
Common Stock (99.83%) | | | | | | | | |
| | | | | | | | | |
Communications (9.03%) | | | | | | | | |
Alphabet Inc* | | | 900 | | | $ | 2,255,688 | |
Amazon.com Inc* | | | 323 | | | | 1,111,172 | |
Comcast Corp | | | 11,900 | | | | 678,538 | |
eBay Inc | | | 19,700 | | | | 1,383,137 | |
Total Communications | | | | | | | 5,428,535 | |
| | | | | | | | | |
Consumer, Cyclical (40.79%) | | | | | | | | |
Brunswick Corp | | | 22,500 | | | | 2,241,450 | |
Five Below Inc* | | | 12,200 | | | | 2,357,894 | |
Green Brick Partners Inc* | | | 106,008 | | | | 2,410,622 | |
LKQ Corp* | | | 41,400 | | | | 2,037,708 | |
Lululemon Athletica Inc* | | | 6,300 | | | | 2,299,311 | |
Monarch Casino & Resort Inc* | | | 42,300 | | | | 2,798,991 | |
NIKE Inc | | | 18,400 | | | | 2,842,616 | |
PulteGroup Inc | | | 46,900 | | | | 2,559,333 | |
Ulta Beauty Inc* | | | 8,100 | | | | 2,800,737 | |
Walgreens Boots Alliance Inc | | | 41,100 | | | | 2,162,271 | |
Total Consumer, Cyclical | | | | | | | 24,510,933 | |
| | | | | | | | | |
Consumer, Non-Cyclical (3.87%) | | | | | | | | |
Global Payments Inc | | | 12,400 | | | | 2,325,496 | |
| | | | | | | | | |
Financial (46.14%) | | | | | | | | |
Alleghany Corp* | | | 2,100 | | | | 1,400,847 | |
Ally Financial Inc | | | 61,400 | | | | 3,060,176 | |
American Express Co | | | 14,200 | | | | 2,346,266 | |
Assurant Inc | | | 8,700 | | | | 1,358,766 | |
Bank of America Corp | | | 58,200 | | | | 2,399,586 | |
Equitable Holdings Inc | | | 27,400 | | | | 834,330 | |
The Goldman Sachs Group Inc | | | 8,100 | | | | 3,074,193 | |
JPMorgan Chase & Co | | | 12,900 | | | | 2,006,466 | |
Marsh & McLennan Cos Inc | | | 4,700 | | | | 661,196 | |
Mastercard Inc | | | 7,500 | | | | 2,738,175 | |
Morgan Stanley | | | 13,500 | | | | 1,237,815 | |
US Bancorp | | | 41,500 | | | | 2,364,255 | |
Visa Inc | | | 8,500 | | | | 1,987,470 | |
Voya Financial Inc | | | 36,600 | | | | 2,250,900 | |
Total Financial | | | | | | | 27,720,441 | |
| | | | | | | | | |
Total Common Stock (Cost $39,397,927) | | | | | | | 59,985,405 | |
| | | | | | | | | |
Funds (0.09%) | | | | | | | | |
| | | | | | | | | |
Money Market Funds (0.09%) | | | | | | | | |
First American Government Obligations Fund | | | 52,632 | | | | 52,632 | |
| | | | | | | | | |
Total Funds (Cost $52,632) | | | | | | | 52,632 | |
| | | | | | | | | |
Total Investments (Cost $39,450,559)(a) (99.92%) | | | | | | | 60,038,037 | |
Other Net Assets (0.08%) | | | | | | | 50,283 | |
Net Assets (100.00%) | | | | | | $ | 60,088,320 | |
* | Non-income producing security. |
(a) | Aggregate cost for federal income tax purpose is $39,452,250. |
At June 30, 2021, unrealized appreciation/(depreciation) of securities for federal income tax purposes is as follows:
Unrealized appreciation | | $ | 20,687,417 | |
Unrealized depreciation | | | (101,630 | ) |
Net unrealized appreciation | | $ | 20,585,787 | |
ICON Equity Fund Portfolio of Investments (Unaudited) June 30, 2021 |
Security Description | | Shares | | | Value | |
Common Stock (96.13%) | | | | | | | | |
| | | | | | | | | |
Basic Materials (0.99%) | | | | | | | | |
The Chemours Co | | | 23,000 | | | $ | 800,400 | |
| | | | | | | | | |
Communications (3.62%) | | | | | | | | |
Extreme Networks Inc* | | | 261,700 | | | | 2,920,572 | |
| | | | | | | | | |
Consumer, Cyclical (21.22%) | | | | | | | | |
Brunswick Corp | | | 15,100 | | | | 1,504,262 | |
Five Below Inc* | | | 9,900 | | | | 1,913,373 | |
KB Home | | | 24,800 | | | | 1,009,856 | |
LGI Homes Inc* | | | 13,700 | | | | 2,218,578 | |
Magna International Inc | | | 28,200 | | | | 2,612,448 | |
Monarch Casino & Resort Inc* | | | 31,100 | | | | 2,057,887 | |
NIKE Inc | | | 26,900 | | | | 4,155,781 | |
Ulta Beauty Inc* | | | 4,700 | | | | 1,625,119 | |
Total Consumer, Cyclical | | | | | | | 17,097,304 | |
| | | | | | | | | |
Consumer, Non-Cyclical (6.63%) | | | | | | | | |
Euronet Worldwide Inc* | | | 13,350 | | | | 1,806,923 | |
Global Payments Inc | | | 18,862 | | | | 3,537,379 | |
Total Consumer, Non-Cyclical | | | | | | | 5,344,302 | |
Energy (5.94%) | | | | | | | | |
Baker Hughes Co | | | 92,200 | | | | 2,108,614 | |
Diamondback Energy Inc | | | 28,500 | | | | 2,675,865 | |
Total Energy | | | | | | | 4,784,479 | |
| | | | | | | | | |
Financial (20.65%) | | | | | | | | |
Ally Financial Inc | | | 65,500 | | | | 3,264,520 | |
Bank of America Corp | | | 65,488 | | | | 2,700,070 | |
JPMorgan Chase & Co | | | 15,300 | | | | 2,379,762 | |
Mastercard Inc | | | 11,629 | | | | 4,245,632 | |
Truist Financial Corp | | | 39,100 | | | | 2,170,050 | |
Voya Financial Inc | | | 30,500 | | | | 1,875,750 | |
Total Financial | | | | | | | 16,635,784 | |
| | | | | | | | | |
Industrial (14.28%) | | | | | | | | |
Advanced Drainage Systems Inc | | | 14,400 | | | | 1,678,608 | |
Alamo Group Inc | | | 10,000 | | | | 1,526,800 | |
Armstrong World Industries Inc | | | 18,000 | | | | 1,930,680 | |
Chart Industries Inc* | | | 26,600 | | | | 3,892,112 | |
CSX Corp | | | 38,100 | | | | 1,222,248 | |
L3Harris Technologies Inc | | | 5,800 | | | | 1,253,670 | |
Total Industrial | | | | | | | 11,504,118 | |
| | | | | | | | | |
See accompanying notes to financial statements.
6
ICON Equity Fund Portfolio of Investments (Unaudited) June 30, 2021 |
Security Description | | Shares | | | Value | |
Technology (22.80%) | | | | | | | | |
Adobe Inc* | | | 5,400 | | | $ | 3,162,456 | |
EPAM Systems Inc* | | | 10,500 | | | | 5,365,080 | |
NXP Semiconductors NV | | | 12,900 | | | | 2,653,788 | |
Qorvo Inc* | | | 4,400 | | | | 860,860 | |
Skyworks Solutions Inc | | | 32,956 | | | | 6,319,313 | |
Total Technology | | | | | | | 18,361,497 | |
| | | | | | | | | |
Total Common Stock (Cost $41,959,281) | | | | | | | 77,448,456 | |
| | | | | | | | | |
Funds (3.93%) | | | | | | | | |
| | | | | | | | | |
Exchange-Traded Funds (3.92%) | | | | | | | | |
Direxion Daily S&P 500 Bull 3X# | | | 18,094 | | | | 1,928,459 | |
Direxion Daily Small Cap Bull 3X Shares# | | | 12,600 | | | | 1,233,414 | |
Total Exchange-Traded Funds | | | | | | | 3,161,873 | |
| | | | | | | | | |
Money Market Funds (0.01%) | | | | | | | | |
First American Government Obligations Fund | | | 8,773 | | | | 8,773 | |
| | | | | | | | | |
Total Funds (Cost $1,192,442) | | | | | | | 3,170,646 | |
Total Investments (Cost $43,151,723)(a) (100.06%) | | | | | | $ | 80,619,102 | |
Liabilities in Excess of Other Assets (-0.06%) | | | | | | | (51,562 | ) |
Net Assets (100.00%) | | | | | | $ | 80,567,540 | |
* | Non-income producing security. |
# | Loaned security; a portion of the security is on loan at June 30, 2021. |
(a) | Aggregate cost for federal income tax purpose is $43,174,894. |
At June 30, 2021, unrealized appreciation/(depreciation) of securities for federal income tax purposes is as follows:
Unrealized appreciation | | $ | 37,554,997 | |
Unrealized depreciation | | | (110,789 | ) |
Net unrealized appreciation | | $ | 37,444,208 | |
ICON Equity Income Fund Portfolio of Investments (Unaudited) June 30, 2021 |
Security Description | | Shares | | | Value | |
Common Stock (96.79%) | | | | | | | | |
| | | | | | | | | |
Basic Materials (9.14%) | | | | | | | | |
Eastman Chemical Co | | | 21,100 | | | $ | 2,463,425 | |
International Paper Co | | | 49,100 | | | | 3,010,321 | |
Neenah Inc | | | 50,700 | | | | 2,543,619 | |
Total Basic Materials | | | | | | | 8,017,365 | |
| | | | | | | | | |
Communications (5.68%) | | | | | | | | |
Juniper Networks Inc | | | 84,700 | | | | 2,316,545 | |
Nexstar Media Group Inc | | | 18,000 | | | | 2,661,840 | |
Total Communications | | | | | | | 4,978,385 | |
| | | | | | | | | |
Consumer, Cyclical (23.21%) | | | | | | | | |
Cummins Inc | | | 13,100 | | | | 3,193,911 | |
Genuine Parts Co | | | 25,900 | | | | 3,275,573 | |
Leggett & Platt Inc | | | 45,400 | | | | 2,352,174 | |
MDC Holdings Inc | | | 61,776 | | | | 3,125,866 | |
VF Corp | | | 30,000 | | | | 2,461,200 | |
Walgreens Boots Alliance Inc | | | 59,200 | | | | 3,114,512 | |
Whirlpool Corp | | | 13,000 | | | | 2,834,260 | |
Total Consumer, Cyclical | | | | | | | 20,357,496 | |
| | | | | | | | | |
Consumer, Non-Cyclical (11.14%) | | | | | | | | |
AbbVie Inc | | | 22,561 | | | | 2,541,271 | |
Altria Group Inc | | | 7,600 | | | | 362,368 | |
Bristol-Myers Squibb Co | | | 61,500 | | | | 4,109,430 | |
Philip Morris International Inc | | | 15,000 | | | | 1,486,650 | |
Rent-A-Center Inc | | | 24,000 | | | | 1,273,680 | |
Total Consumer, Non-Cyclical | | | | | | | 9,773,399 | |
| | | | | | | | | |
Energy (1.20%) | | | | | | | | |
Baker Hughes Co | | | 46,108 | | | | 1,054,490 | |
Financial (24.84%) | | | | | | | | |
Bank of America Corp | | | 65,500 | | | | 2,700,565 | |
Fifth Third Bancorp | | | 49,500 | | | | 1,892,385 | |
JPMorgan Chase & Co | | | 24,353 | | | | 3,787,866 | |
Kearny Financial Corp | | | 149,400 | | | | 1,785,330 | |
Lincoln National Corp | | | 70,800 | | | | 4,449,072 | |
Prudential Financial Inc | | | 31,500 | | | | 3,227,805 | |
US Bancorp | | | 46,000 | | | | 2,620,620 | |
Webster Financial Corp | | | 24,900 | | | | 1,328,166 | |
Total Financial | | | | | | | 21,791,809 | |
| | | | | | | | | |
Industrial (9.98%) | | | | | | | | |
Hubbell Inc | | | 13,000 | | | | 2,428,920 | |
Lockheed Martin Corp | | | 6,800 | | | | 2,572,780 | |
Packaging Corp of America | | | 12,700 | | | | 1,719,834 | |
Union Pacific Corp | | | 9,229 | | | | 2,029,734 | |
Total Industrial | | | | | | | 8,751,268 | |
| | | | | | | | | |
Technology (7.17%) | | | | | | | | |
International Business Machines Corp | | | 5,900 | | | | 864,881 | |
QUALCOMM Inc | | | 19,800 | | | | 2,830,014 | |
Texas Instruments Inc | | | 13,500 | | | | 2,596,050 | |
Total Technology | | | | | | | 6,290,945 | |
| | | | | | | | | |
Utilities (4.43%) | | | | | | | | |
Evergy Inc | | | 29,500 | | | | 1,782,685 | |
Otter Tail Corp | | | 43,100 | | | | 2,103,711 | |
Total Utilities | | | | | | | 3,886,396 | |
| | | | | | | | | |
Total Common Stock (Cost $66,356,769) | | | | | | | 84,901,553 | |
| | | | | | | | | |
See accompanying notes to financial statements.
7
ICON Equity Income Fund Portfolio of Investments (Unaudited) June 30, 2021 |
Security Description | | Par Value | | | Value | |
Preferred Stock (0.68%) | | | | | | | | |
| | | | | | | | | |
Financial (0.68%) | | | | | | | | |
Annaly Capital Management Inc, 6.950%(a) | | $ | 4,000 | | | $ | 104,360 | |
Argo Group US Inc, 6.500% | | | 18,907 | | | | 489,502 | |
Total Financial | | | | | | | 593,862 | |
| | | | | | | | | |
Total Preferred Stock (Cost $578,026) | | | | | | | 593,862 | |
| | | | | | | | | |
Corporate Debt (1.83%) | | | | | | | | |
| | | | | | | | | |
Basic Materials (0.03%) | | | | | | | | |
CVR Partners LP / CVR Nitrogen Finance Corp, 9.250%, 6/15/2023 (144A) | | | 28,000 | | | | 28,073 | |
| | | | | | | | | |
Consumer, Cyclical (0.77%) | | | | | | | | |
Foot Locker Inc, 8.500%, 1/15/2022 | | | 650,000 | | | | 676,000 | |
| | | | | | | | | |
Consumer, Non-Cyclical (0.25%) | | | | | | | | |
Conagra Brands Inc, 7.125%, 10/1/2026 | | | 175,000 | | | | 219,234 | |
| | | | | | | | | |
Financial (0.78%) | | | | | | | | |
JPMorgan Chase & Co, LIBOR + 3.470%(a),(b) | | | 170,000 | | | | 170,425 | |
Principal Financial Group Inc, LIBOR + 3.044%, 5/15/2055(a) | | | 250,000 | | | | 248,625 | |
Prudential Financial Inc, 5.875%, 9/15/2042(a) | | | 250,000 | | | | 264,299 | |
Total Financial | | | | | | | 683,349 | |
| | | | | | | | | |
Total Corporate Debt (Cost $1,557,531) | | | | | | | 1,606,656 | |
| | | | | | | | |
| | Shares | | | | |
Funds (0.61%) | | | | | | | | |
| | | | | | | | | |
Mutual Funds (0.11%) | | | | | | | | |
Eaton Vance Short Duration Diversified Income Fund | | | 7,367 | | | | 97,760 | |
| | | | | | | | | |
Money Market Funds (0.50%) | | | | | | | | |
First American Government Obligations Fund | | | 437,882 | | | | 437,882 | |
| | | | | | | | | |
Total Funds (Cost $535,206) | | | | | | | 535,642 | |
| | | | | | | | | |
Total Investments (Cost $69,027,532)(c) (99.91%) | | | | | | | 87,637,713 | |
Other Net Assets (0.09%) | | | | | | | 76,306 | |
Net Assets (100.00%) | | | | | | $ | 87,714,019 | |
* | Non-income producing security. |
(144A) Security was purchased pursuant to Rule 144A or Section 4(a)(2) under the Securities Act of 1933 and may be resold in transactions exempt from registration only to qualified institutional buyers. As of June 30, 2021, these securities had a total aggregate market value of $28,073, which represented approximately 0.032% of net assets.
(a) | Floating or variable rate security. The reference rate is described above. The rate in effect as of June 30, 2021 is based on the reference rate plus the displayed spread as of the security’s last reset date. |
(b) | This security has no contractual maturity date, is not redeemable and contractually pays an indefinite stream of interest. |
(c) | Aggregate cost for federal income tax purpose is $69,206,877. |
At June 30, 2021, unrealized appreciation/(depreciation) of securities for federal income tax purposes is as follows:
Unrealized appreciation | | $ | 18,877,871 | |
Unrealized depreciation | | | (447,035 | ) |
Net unrealized appreciation | | $ | 18,430,836 | |
ICON Flexible Bond Fund Portfolio of Investments (Unaudited) June 30, 2021 |
Security Description | | Shares | | | Value | |
Common Stock (1.65%) | | | | | | | | |
| | | | | | | | | |
Financial (1.65%) | | | | | | | | |
Annaly Capital Management Inc, | | | 248,641 | | | $ | 2,207,932 | |
Eaton Vance Floating-Rate Income Plus Fund | | | 220,898 | | | | 181,136 | |
Total Financial | | | | | | | 2,389,068 | |
| | | | | | | | | |
Total Common Stock (Cost $2,456,809) | | | | | | | 2,389,068 | |
| | | | | | | | | |
| | | Par Value | | | | | |
Corporate Debt (63.33%) | | | | | | | | |
| | | | | | | | | |
Basic Materials (0.25%) | | | | | | | | |
CVR Partners LP / CVR Nitrogen Finance Corp, 9.250%, 6/15/2023 (144A) | | $ | 364,000 | | | | 364,946 | |
| | | | | | | | | |
Communications (3.58%) | | | | | | | | |
Cincinnati Bell Telephone Co LLC, 6.300%, 12/1/2028 | | | 1,500,000 | | | | 1,661,250 | |
The Walt Disney Co, 7.750%, 2/1/2024 | | | 3,000,000 | | | | 3,532,243 | |
Total Communications | | | | | | | 5,193,493 | |
| Consumer, Cyclical (11.27%) | | | | | | | | |
| Air Canada 2015-1 Class B Pass Through Trust, 3.875%, 3/15/2023 (144A) | | | 878,579 | | | | 889,425 | |
| Century Communities Inc, 5.875%, 7/15/2025 | | | 1,655,000 | | | | 1,711,634 | |
| Cooper-Standard Automotive Inc, 13.000%, 6/1/2024 (144A) | | | 1,000,000 | | | | 1,130,000 | |
| Foot Locker Inc, 8.500%, 1/15/2022 | | | 3,750,000 | | | | 3,900,000 | |
| G-III Apparel Group Ltd, 7.875%, 8/15/2025 (144A) | | | 1,850,000 | | | | 2,002,718 | |
| IHO Verwaltungs GmbH, 4.750%, 9/15/2026 (144A) | | | 1,000,000 | | | | 1,022,290 | |
| Navistar International Corp, 9.500%, 5/1/2025 (144A) | | | 750,000 | | | | 804,000 | |
| UAL 2007-1 Pass Through Trust, 6.636%, 7/2/2022 | | | 1,607,273 | | | | 1,659,509 | |
| United Airlines 2013-1 Class B Pass Through Trust, 5.375%, 8/15/2021 | | | 908,113 | | | | 912,672 | |
| United Airlines 2014-1 Class B Pass Through Trust, 4.750%, 4/11/2022 | | | 2,279,937 | | | | 2,317,326 | |
| Total Consumer, Cyclical | | | | | | | 16,349,574 | |
See accompanying notes to financial statements.
8
ICON Flexible Bond Fund Portfolio of Investments (Unaudited) June 30, 2021 |
| Security Description | | Par Value | | | Value | |
| Consumer, Non-Cyclical (6.73%) | | | | | | | | |
| Conagra Brands Inc, 7.125%, 10/1/2026 | | $ | 1,150,000 | | | $ | 1,440,678 | |
| Cooke Omega Investments Inc / Alpha VesselCo Holdings Inc, 8.500%, 12/15/2022 (144A) | | | 3,000,000 | | | | 3,078,750 | |
| McKesson Corp, 7.650%, 3/1/2027 | | | 2,000,000 | | | | 2,637,692 | |
| Spectrum Brands Inc, 5.750%, 7/15/2025 | | | 1,500,000 | | | | 1,537,125 | |
| Vector Group Ltd, 10.500%, 11/1/2026 (144A) | | | 1,000,000 | | | | 1,061,250 | |
| Total Consumer, Non-Cyclical | | | | | | | 9,755,495 | |
| | | | | | | | | |
| Energy (7.11%) | | | | | | | | |
| Andeavor LLC, 5.125%, 12/15/2026 | | | 4,000,000 | | | | 4,573,779 | |
Calumet Specialty Products Partners LP / Calumet Finance Corp, 7.625%, 1/15/2022# | | | 1,065,065 | | | | 1,062,402 | |
| Diamondback Energy Inc, 5.375%, 5/31/2025 | | | 1,350,000 | | | | 1,387,125 | |
| Marathon Petroleum Corp, 3.625%, 9/15/2024 | | | 2,000,000 | | | | 2,152,045 | |
| Occidental Petroleum Corp, 7.150%, 5/15/2028 | | | 1,000,000 | | | | 1,140,000 | |
| Total Energy | | | | | | | 10,315,351 | |
| | | | | | | | | |
| Financial (21.23%) | | | | | | | | |
BAC Capital Trust XIV, 4.000%, 3M US LIBOR (floor 4.000%) + 0.400%#,(a),(b) | | | 1,500,000 | | | | 1,513,125 | |
| Credit Acceptance Corp, 6.625%, 3/15/2026 | | | 2,000,000 | | | | 2,105,000 | |
| Fidelity & Guaranty Life Holdings Inc, 5.500%, 5/1/2025 (144A) | | | 1,000,000 | | | | 1,151,766 | |
Fifth Third Bancorp, 3M US LIBOR + 3.129%#,(a),(b) | | | 6,718,000 | | | | 6,692,808 | |
| GLP Capital LP / GLP Financing II Inc, 5.250%, 6/1/2025 | | | 2,000,000 | | | | 2,251,300 | |
| Icahn Enterprises LP / Icahn Enterprises Finance Corp, 6.750%, 2/1/2024 | | | 500,000 | | | | 510,715 | |
JPMorgan Chase & Co, 3M US LIBOR + 3.470%(a),(b) | | | 2,417,000 | | | | 2,423,043 | |
Principal Financial Group Inc, 3M US LIBOR + 3.044%, 5/15/2055#,(b) | | | 7,110,000 | | | | 7,070,895 | |
Prudential Financial Inc, 5.875%, 9/15/2042(b) | | | 2,800,000 | | | | 2,960,151 | |
| Tyco International Finance SA, 3.900%, 2/14/2026 | | | 1,100,000 | | | | 1,173,199 | |
USB Capital IX, 3M US LIBOR (floor 3.500%) + 1.020%(a),(b) | | | 3,000,000 | | | | 2,951,250 | |
| Total Financial | | | | | | | 30,803,252 | |
| | | | | | | | | |
| Industrial (3.58%) | | | | | | | | |
Fluor Corp, 3.500%, 12/15/2024# | | | 2,000,000 | | | | 2,115,000 | |
| Fortress Transportation and Infrastructure Investors LLC, 6.500%, 10/1/2025 (144A) | | | 1,500,000 | | | | 1,558,125 | |
| Mauser Packaging Solutions Holding Co, 5.500%, 4/15/2024 (144A) | | | 1,500,000 | | | | 1,515,000 | |
| Total Industrial | | | | | | | 5,188,125 | |
| | | | | | | | | |
| Technology (4.85%) | | | | | | | | |
| Dell International LLC / EMC Corp, 6.100%, 7/15/2027 (144A) | | | 4,612,000 | | | | 5,653,251 | |
| Dell International LLC / EMC Corp, 7.125%, 6/15/2024 (144A) | | | 1,352,000 | | | | 1,386,746 | |
| Total Technology | | | | | | | 7,039,997 | |
| | | | | | | | | |
| Utilities (4.73%) | | | | | | | | |
| PacifiCorp, 8.069%, 9/9/2022 | | | 3,685,000 | | | | 3,978,286 | |
| Vistra Operations Co LLC, 5.000%, 7/31/2027 (144A) | | | 1,460,000 | | | | 1,496,500 | |
| Vistra Operations Co LLC, 5.500%, 9/1/2026 (144A) | | | 1,350,000 | | | | 1,392,188 | |
| Total Utilities | | | | | | | 6,866,974 | |
| | | | | | | | | |
| Total Corporate Debt (Cost $89,752,916) | | | | | | | 91,877,207 | |
| | | | | | | | | |
| Asset Backed Securities (2.00%) | | | | | | | | |
| SMB Private Education Loan Trust 2014-A, 4.500%, 9/15/2045 (144A) | | | 3,000,000 | | | | 2,896,635 | |
| Total Asset Backed Securities (Cost $2,901,605) | | | | | | | 2,896,635 | |
| | | | | | | | | |
| | | | Shares | | | | | |
| Preferred Stock (15.09%) | | | | | | | | |
Annaly Capital Management Inc, 6.950%(b) | | | 824 | | | | 21,498 | |
| Argo Group US Inc, 6.500% | | | 326,439 | | | | 8,451,506 | |
| Bank of America Corp, 7.250% | | | 3,771 | | | | 5,339,736 | |
| Capital One Financial Corp, 5.000% | | | 650 | | | | 17,661 | |
| JPMorgan Chase & Co, 5.750% | | | 2,550 | | | | 72,038 | |
| Monmouth Real Estate Investment Corp, 6.125% | | | 203,285 | | | | 5,137,012 | |
The PNC Financial Services Group Inc, 6.125%(b) | | | 16,813 | | | | 443,023 | |
Public Storage, 5.150%# | | | 8,028 | | | | 215,231 | |
US Bancorp, 3.750%# | | | 81,619 | | | | 2,038,026 | |
| Wells Fargo & Co, 7.500% | | | 98 | | | | 149,569 | |
| Total Preferred Stock (Cost $21,426,412) | | | | | | | 21,885,300 | |
| | | | | | | | | |
| Funds (17.79%) | | | | | | | | |
| | | | | | | | | |
| Exchange-Traded Funds (0.38%) | | | | | | | | |
| SPDR Bloomberg Barclays Short Term High Yield Bond ETF | | | 20,000 | | | | 551,600 | |
| | | | | | | | | |
| Mutual Funds (7.08%) | | | | | | | | |
| Apollo Tactical Income Fund Inc | | | 92,483 | | | | 1,447,359 | |
| Eaton Vance Senior Floating-Rate Trust | | | 118,856 | | | | 1,681,812 | |
Eaton Vance Short Duration Diversified Income Fund# | | | 130,323 | | | | 1,729,386 | |
| Highland Income Fund | | | 45,112 | | | | 492,172 | |
| Invesco Dynamic Credit Opportunities Fund | | | 167,427 | | | | 1,985,684 | |
| RiverNorth Specialty Finance Corp | | | 85,343 | | | | 1,698,326 | |
| Vertical Capital Income Fund | | | 113,941 | | | | 1,230,563 | |
| Total Mutual Funds | | | | | | | 10,265,302 | |
| | | | | | | | | |
| Money Market Funds (10.33%) | | | | | | | | |
| First American Government Obligations Fund | | | 14,981,360 | | | | 14,981,360 | |
| | | | | | | | | |
| Total Funds (Cost $25,559,650) | | | | | | | 25,798,262 | |
| | | | | | | | | |
Total Investments (Cost $142,097,392)(c) (99.86%) | | | | | | | 144,846,472 | |
| Other Net Assets (0.14%) | | | | | | | 205,337 | |
| Net Assets (100.00%) | | | | | | $ | 145,051,809 | |
* | Non-income producing security. |
# | Loaned security; a portion of the security is on loan at June 30, 2021. |
See accompanying notes to financial statements.
9
ICON Flexible Bond Fund Portfolio of Investments (Unaudited) June 30, 2021 |
(144A) Security was purchased pursuant to Rule 144A or Section 4(a)(2) under the Securities Act of 1933 and may be resold in transactions exempt from registration only to qualified institutional buyers. As of December 31, 2020, these securities had a total aggregate market value of $27,403,590, which represented approximately 18.89% of net assets.
(a) | This security has no contractual maturity date, is not redeemable and contractually pays an indefinite stream of interest. |
(b) | Floating or variable rate security. The reference rate is described above. The rate in effect as of June 30, 2021 is based on the reference rate plus the displayed spread as of the security’s last reset date. |
(c) | Aggregate cost for federal income tax purpose is $142,122,260. |
At June 30, 2021, unrealized appreciation/(depreciation) of securities for federal income tax purposes is as follows:
Unrealized appreciation | | $ | 2,957,966 | |
Unrealized depreciation | | | (233,754 | ) |
Net unrealized appreciation | | $ | (2,724,212 | ) |
ICON Health and Information Technology Fund Portfolio of Investments (Unaudited) June 30, 2021 |
Security Description | | Shares | | | Value | |
Common Stock (99.57%) | | | | | | | | |
| | | | | | | | | |
Basic Materials (3.70%) | | | | | | | | |
Rogers Corp* | | | 24,000 | | | $ | 4,819,200 | |
| | | | | | | | | |
Communications (12.15%) | | | | | | | | |
Alphabet Inc* | | | 1,500 | | | | 3,759,480 | |
Amazon.com Inc* | | | 1,000 | | | | 3,440,160 | |
Extreme Networks Inc* | | | 375,057 | | | | 4,185,636 | |
Perficient Inc* | | | 55,100 | | | | 4,431,142 | |
Total Communications | | | | | | | 15,816,418 | |
| | | | | | | | | |
Consumer, Non-Cyclical (24.30%) | | | | | | | | |
AbbVie Inc | | | 35,965 | | | | 4,051,098 | |
Anthem Inc | | | 9,100 | | | | 3,474,380 | |
Booz Allen Hamilton Holding Corp | | | 31,000 | | | | 2,640,580 | |
Cigna Corp | | | 10,100 | | | | 2,394,407 | |
Euronet Worldwide Inc* | | | 37,800 | | | | 5,116,230 | |
Global Payments Inc | | | 30,193 | | | | 5,662,395 | |
IQVIA Holdings Inc* | | | 9,138 | | | | 2,214,320 | |
UnitedHealth Group Inc | | | 15,200 | | | | 6,086,688 | |
Total Consumer, Non-Cyclical | | | | | | | 31,640,098 | |
| | | | | | | | | |
Financial (9.11%) | | | | | | | | |
Mastercard Inc | | | 14,900 | | | | 5,439,841 | |
Visa Inc | | | 17,580 | | | | 4,110,556 | |
The Western Union Co | | | 100,900 | | | | 2,317,673 | |
Total Financial | | | | | | | 11,868,070 | |
| | | | | | | | | |
Industrial (16.18%) | | | | | | | | |
EnerSys | | | 41,100 | | | | 4,016,703 | |
II-VI Inc* | | | 70,900 | | | | 5,146,631 | |
Jabil Inc | | | 52,400 | | | | 3,045,488 | |
Sensata Technologies Holding PLC* | | | 66,600 | | | | 3,860,802 | |
TE Connectivity Ltd | | | 9,000 | | | | 1,216,890 | |
Universal Display Corp | | | 17,000 | | | | 3,779,610 | |
Total Industrial | | | | | | | 21,066,124 | |
Technology (34.13%) | | | | | | | | |
Adobe Inc* | | | 9,900 | | | | 5,797,836 | |
Autodesk Inc* | | | 17,500 | | | | 5,108,250 | |
EPAM Systems Inc* | | | 15,400 | | | | 7,868,784 | |
Genpact Ltd | | | 74,000 | | | | 3,361,820 | |
Maximus Inc | | | 28,300 | | | | 2,489,551 | |
NXP Semiconductors NV | | | 27,687 | | | | 5,695,770 | |
Qorvo Inc* | | | 21,900 | | | | 4,284,735 | |
Science Applications International Corp | | | 39,900 | | | | 3,500,427 | |
Skyworks Solutions Inc | | | 33,010 | | | | 6,329,668 | |
Total Technology | | | | | | | 44,436,841 | |
| | | | | | | | | |
Total Common Stock (Cost $81,953,487) | | | | | | | 129,646,751 | |
| | | | | | | | | |
Funds (0.47%) | | | | | | | | |
| | | | | | | | | |
Money Market Funds (0.47%) | | | | | | | | |
First American Government Obligations Fund | | | 610,004 | | | | 610,004 | |
| | | | | | | | | |
Total Funds (Cost $610,004) | | | | | | | | |
| | | | | | | | | |
Total Investments (Cost $82,563,491)(a) (100.04%) | | | | | | | 130,256,755 | |
Liabilities in Excess of Other Assets (-0.04%) | | | | | | | (52,448 | ) |
Net Assets (100.00%) | | | | | | $ | 130,204,307 | |
* | Non-income producing security. |
(a) | Aggregate cost for federal income tax purpose is $82,563,491. |
At June 30, 2021, unrealized appreciation/(depreciation) of securities for federal income tax purposes is as follows:
Unrealized appreciation | | $ | 48,094,604 | |
Unrealized depreciation | | | (401,340 | ) |
Net unrealized appreciation | | $ | 47,693,264 | |
See accompanying notes to financial statements.
10
ICON Natural Resources and Infrastructure Fund Portfolio of Investments (Unaudited) June 30, 2021 |
Security Description | | Shares | | | Value | |
Common Stock (97.40%) | | | | | | | | |
| | | | | | | | | |
Basic Materials (2.54%) | | | | | | | | |
Ashland Global Holdings Inc | | | 17,000 | | | $ | 1,487,500 | |
International Paper Co | | | 30,000 | | | | 1,839,300 | |
Total Basic Materials | | | | | | | 3,326,800 | |
| | | | | | | | | |
Consumer, Cyclical (11.36%) | | | | | | | | |
Fastenal Co | | | 47,000 | | | | 2,444,000 | |
Herman Miller Inc | | | 130,000 | | | | 6,128,200 | |
Meritor Inc* | | | 148,000 | | | | 3,466,160 | |
WW Grainger Inc | | | 6,500 | | | | 2,847,000 | |
Total Consumer, Cyclical | | | | | | | 14,885,360 | |
| | | | | | | | | |
Consumer, Non-Cyclical (1.51%) | | | | | | | | |
Darling Ingredients Inc* | | | 18,000 | | | | 1,215,000 | |
United Rentals Inc* | | | 2,400 | | | | 765,624 | |
Total Consumer, Non-Cyclical | | | | | | | 1,980,624 | |
Energy (35.03%) | | | | | | | | |
Atlantica Sustainable Infrastructure PLC | | | 144,000 | | | | 5,359,680 | |
Delek US Holdings Inc | | | 300,000 | | | | 6,486,000 | |
Diamondback Energy Inc | | | 70,000 | | | | 6,572,300 | |
EOG Resources Inc | | | 56,000 | | | | 4,672,640 | |
Exxon Mobil Corp | | | 103,000 | | | | 6,497,240 | |
Phillips 66 | | | 55,000 | | | | 4,720,100 | |
Royal Dutch Shell PLC# | | | 161,000 | | | | 6,504,400 | |
Valero Energy Corp | | | 65,000 | | | | 5,075,200 | |
Total Energy | | | | | | | 45,887,560 | |
| | | | | | | | | |
Financial (0.41%) | | | | | | | | |
Air Lease Corp | | | 12,906 | | | | 538,696 | |
| | | | | | | | | |
Industrial (46.55%) | | | | | | | | |
Armstrong World Industries Inc | | | 30,000 | | | | 3,217,800 | |
Berry Global Group Inc* | | | 57,000 | | | | 3,717,540 | |
Chart Industries Inc* | | | 45,000 | | | | 6,584,400 | |
Eagle Materials Inc | | | 26,100 | | | | 3,709,071 | |
EMCOR Group Inc | | | 18,300 | | | | 2,254,377 | |
EnerSys | | | 13,000 | | | | 1,270,490 | |
JB Hunt Transport Services Inc | | | 22,000 | | | | 3,584,900 | |
Martin Marietta Materials Inc | | | 9,000 | | | | 3,166,290 | |
Masco Corp | | | 75,000 | | | | 4,418,250 | |
MasTec Inc* | | | 53,395 | | | | 5,665,210 | |
Myers Industries Inc | | | 109,000 | | | | 2,289,000 | |
Old Dominion Freight Line Inc | | | 19,000 | | | | 4,822,200 | |
Packaging Corp of America | | | 15,000 | | | | 2,031,300 | |
Primoris Services Corp | | | 85,000 | | | | 2,501,550 | |
Saia Inc* | | | 12,000 | | | | 2,513,880 | |
Technip Energies NV* | | | 51,200 | | | | 698,368 | |
Trane Technologies PLC | | | 22,000 | | | | 4,051,080 | |
Valmont Industries Inc | | | 19,000 | | | | 4,484,950 | |
Total Industrial | | | | | | | 60,980,656 | |
| | | | | | | | | |
Total Common Stock (Cost $100,899,152) | | | | | | | 127,599,696 | |
| | | | | | | | | |
Funds (2.66%) | | | | | | | | |
| | | | | | | | | |
Money Market Funds (2.66%) | | | | | | | | |
First American Government Obligations Fund | | | 3,481,323 | | | | 3,481,323 | |
Total Funds (Cost $3,481,323) | | | | | | | | |
| | | | | | | | | |
Total Investments (Cost $104,380,475)(a) (100.06%) | | | | | | $ | 131,081,019 | |
Liabilities in Excess of Other Assets (-0.06%) | | | | | | | (79,776 | ) |
Net Assets (100.00%) | | | | | | $ | 131,001,243 | |
* | Non-income producing security. |
# | Loaned security; a portion of the security is on loan at June 30, 2021. |
(a) | Aggregate cost for federal income tax purpose is $104,429,749. |
At June 30, 2021, unrealized appreciation/(depreciation) of securities for federal income tax purposes is as follows:
Unrealized appreciation | | $ | 29,498,522 | |
Unrealized depreciation | | | (2,847,252 | ) |
Net unrealized appreciation | | $ | 26,651,270 | |
ICON Utilities and Income Fund Portfolio of Investments (Unaudited) June 30, 2021 |
Security Description | | Shares | | | Value | |
Common Stock (99.42%) | | | | | | | | |
| | | | | | | | | |
Communications (2.23%) | | | | | | | | |
Vodafone Group PLC | | | 53,500 | | | $ | 916,455 | |
| | | | | | | | | |
Energy (7.84%) | | | | | | | | |
Atlantica Sustainable Infrastructure PLC | | | 58,000 | | | | 2,158,760 | |
Baker Hughes Co | | | 38,000 | | | | 869,060 | |
Magellan Midstream Partners LP | | | 3,900 | | | | 190,749 | |
Total Energy | | | | | | | 3,218,569 | |
| | | | | | | | | |
Financial (2.46%) | | | | | | | | |
Citigroup Inc | | | 14,300 | | | | 1,011,725 | |
| | | | | | | | | |
Industrial (17.19%) | | | | | | | | |
Crane Co | | | 14,600 | | | | 1,348,602 | |
Eaton Corp PLC | | | 6,000 | | | | 889,080 | |
Hubbell Inc | | | 6,700 | | | | 1,251,828 | |
MDU Resources Group Inc | | | 85,000 | | | | 2,663,900 | |
Union Pacific Corp | | | 4,100 | | | | 901,713 | |
Total Industrial | | | | | | | 7,055,123 | |
| | | | | | | | | |
Utilities (69.70%) | | | | | | | | |
The AES Corp | | | 65,800 | | | | 1,715,406 | |
Ameren Corp | | | 25,000 | | | | 2,001,000 | |
American Electric Power Co Inc | | | 19,100 | | | | 1,615,669 | |
Avangrid Inc# | | | 35,200 | | | | 1,810,336 | |
Black Hills Corp | | | 15,600 | | | | 1,023,828 | |
Consolidated Water Co Ltd# | | | 69,300 | | | | 812,889 | |
Duke Energy Corp | | | 22,900 | | | | 2,260,688 | |
Evergy Inc | | | 27,000 | | | | 1,631,610 | |
National Fuel Gas Co | | | 31,600 | | | | 1,651,100 | |
New Jersey Resources Corp | | | 31,600 | | | | 1,250,412 | |
NextEra Energy Inc | | | 17,400 | | | | 1,275,072 | |
See accompanying notes to financial statements.
11
ICON Utilities and Income Fund Portfolio of Investments (Unaudited) June 30, 2021 |
Security Description | | Shares | | | Value | |
NiSource Inc | | | 49,800 | | | $ | 1,220,100 | |
OGE Energy Corp | | | 44,400 | | | | 1,494,060 | |
ONE Gas Inc | | | 20,900 | | | | 1,549,108 | |
Pinnacle West Capital Corp | | | 7,200 | | | | 590,184 | |
Sempra Energy | | | 16,000 | | | | 2,119,680 | |
Spire Inc | | | 12,700 | | | | 917,829 | |
UGI Corp | | | 28,295 | | | | 1,310,341 | |
Xcel Energy Inc | | | 35,800 | | | | 2,358,504 | |
Total Utilities | | | | | | | 28,607,816 | |
| | | | | | | | | |
Total Common Stock (Cost $36,942,200) | | | | | | | 40,809,688 | |
| | | | | | | | | |
Funds (0.43%) | | | | | | | | |
| | | | | | | | | |
Money Market Funds (0.43%) | | | | | | | | |
First American Government Obligations Fund | | | 178,367 | | | | 178,367 | |
| | | | | | | | | |
Total Funds (Cost $178,367) | | | | | | | | |
| | | | | | | | | |
Total Investments (Cost $37,120,567)(a) (99.85%) | | | | | | $ | 40,988,055 | |
Other Net Assets (0.15%) | | | | | | | 59,828 | |
Net Assets (100.00%) | | | | | | $ | 41,047,883 | |
* | Non-income producing security. |
# | Loaned security; a portion of the security is on loan at June 30, 2021. |
(a) | Aggregate cost for federal income tax purpose is $37,215,904. |
At June 30, 2021, unrealized appreciation/(depreciation) of securities for federal income tax purposes is as follows:
Unrealized appreciation | | $ | 4,923,932 | |
Unrealized depreciation | | | (1,151,781 | ) |
Net unrealized appreciation | | $ | 3,772,151 | |
See accompanying notes to financial statements.
12
Statements of Assets and Liabilities (Unaudited) June 30, 2021
|
| | | ICON
Consumer
Select
Fund | | | ICON
Equity
Fund | | | ICON
Equity Income
Fund | | | ICON
Flexible Bond
Fund | |
Assets | | | | | | | | | | | | | | | | |
Investments in securities | | | | | | | | | | | | | | | | |
Cost of investments | | $ | 39,450,559 | | | $ | 43,151,723 | | | $ | 69,027,532 | | | $ | 142,097,392 | |
Market value of investments (Note 1) | | | 60,038,037 | | | | 80,619,102 | (a) | | | 87,637,713 | | | | 144,846,472 | (b) |
Interest receivable | | | 2 | | | | 3 | | | | 35,129 | | | | 1,253,139 | |
Dividend receivable | | | 29,056 | | | | 17,119 | | | | 147,665 | | | | 155,118 | |
Receivable from investment advisor | | | — | | | | — | | | | 19,925 | | | | 40,686 | |
Receivable for fund shares sold | | | 145,016 | | | | 138,565 | | | | 461,744 | | | | 702,387 | |
Receivable for investment securities sold | | | — | | | | — | | | | 123,589 | | | | 1,522,920 | |
Securities Lending income receivable | | | 1 | | | | 2,054 | | | | 68 | | | | 9,252 | |
Prepaid expenses | | | 27,522 | | | | 30,044 | | | | 32,770 | | | | 21,667 | |
Total assets | | $ | 60,239,634 | | | $ | 80,806,887 | | | $ | 88,458,603 | | | $ | 148,551,641 | |
| | | | | | | | | | | | | | | | | |
Liabilities | | | | | | | | | | | | | | | | |
Payable to investment advisor | | | 54,156 | | | | 54,033 | | | | 61,259 | | | | 79,340 | |
Payable for securities purchased | | | — | | | | — | | | | — | | | | 2,481,825 | |
Payable for fund shares purchased | | | — | | | | 77,805 | | | | 130,230 | | | | 149,046 | |
Distributions payable | | | — | | | | — | | | | 410,663 | | | | 647,662 | |
Accrued 12b-1 fees | | | 597 | | | | 5,290 | | | | 9,311 | | | | 2,221 | |
Accrued administration fees | | | 4,900 | | | | 6,519 | | | | 7,381 | | | | 11,951 | |
Accrued CCO fees | | | 2,313 | | | | 3,240 | | | | 3,710 | | | | 6,545 | |
Accrued custody fees | | | — | | | | — | | | | — | | | | 612 | |
Accrued fund accounting fees | | | 11,918 | | | | 14,387 | | | | 17,098 | | | | 24,301 | |
Accrued printing fees | | | — | | | | 1,629 | | | | — | | | | — | |
Accrued registration fees | | | 24,306 | | | | 20,430 | | | | 24,795 | | | | 7,987 | |
Accrued transfer agent fees | | | 23,111 | | | | 21,777 | | | | 35,880 | | | | 29,725 | |
Accrued trustee fees | | | 1,861 | | | | 2,124 | | | | 4,019 | | | | 5,002 | |
Accrued expenses | | | 28,152 | | | | 32,113 | | | | 40,238 | | | | 53,615 | |
Total liabilities | | | 151,314 | | | | 239,347 | | | | 744,584 | | | | 3,499,832 | |
| | | | | | | | | | | | | | | | | |
Net assets | | $ | 60,088,320 | | | $ | 80,567,540 | | | $ | 87,714,019 | | | $ | 145,051,809 | |
| | | | | | | | | | | | | | | | | |
Net assets at June 30, 2021 consist of | | | | | | | | | | | | | | | | |
Paid-in capital | | | 38,823,604 | | | | 38,418,475 | | | | 63,327,633 | | | | 146,880,404 | |
Distributable earnings/(loss) | | | 21,264,716 | | | | 42,149,065 | | | | 24,386,386 | | | | (1,828,595 | ) |
Total net assets | | $ | 60,088,320 | | | $ | 80,567,540 | | | $ | 87,714,019 | | | $ | 145,051,809 | |
| | | | | | | | | | | | | | | | | |
Net assets | | | | | | | | | | | | | | | | |
Institutional Shares | | $ | 57,457,769 | | | $ | 56,980,621 | | | $ | 47,458,605 | | | $ | 135,154,421 | |
Investor Shares | | $ | 2,630,551 | | | $ | 23,586,919 | | | $ | 40,255,414 | | | $ | 9,897,388 | |
| | | | | | | | | | | | | | | | | |
Shares outstanding | | | | | | | | | | | | | | | | |
Institutional Shares (no par value, unlimited shares authorized) | | | 4,462,400 | | | | 1,408,870 | | | | 2,125,884 | | | | 14,216,567 | |
Investor Shares (no par value, unlimited shares authorized) | | | 205,217 | | | | 609,884 | | | | 1,804,922 | | | | 1,047,147 | |
| | | | | | | | | | | | | | | | | |
Net asset value per share | | | | | | | | | | | | | | | | |
Institutional Shares | | $ | 12.88 | | | $ | 40.44 | | | $ | 22.32 | | | $ | 9.51 | |
Investor Shares | | $ | 12.82 | | | $ | 38.67 | | | $ | 22.30 | | | $ | 9.45 | |
(a) | Includes securities on loan of $3,078,986. |
(b) | Includes securities on loan of $11,492,442. |
See accompanying notes to financial statements.
13
Statements of Assets and Liabilities (Unaudited) June 30, 2021
(Continued) |
| | | ICON Health
and Information
Technology
Fund | | | ICON Natural
Resources and
Infrastructure
Fund | | | ICON Utilities
and Income
Fund | |
Assets | | | | | | | | | | | | |
Investments in securities | | | | | | | | | | | | |
Cost of investments | | $ | 82,563,491 | | | $ | 104,380,475 | | | $ | 37,120,567 | |
Market value of investments (Note 1) | | | 130,256,755 | | | | 131,081,019 | (a) | | | 40,988,055 | (b) |
Interest receivable | | | 4 | | | | 117 | | | | 13 | |
Dividend receivable | | | 16,731 | | | | 158,915 | | | | 130,032 | |
Receivable from investment advisor | | | — | | | | — | | | | 15,722 | |
Receivable for fund shares sold | | | 148,451 | | | | 100,468 | | | | 235,172 | |
Receivable for investment securities sold | | | — | | | | — | | | | — | |
Securities Lending income receivable | | | — | | | | 288 | | | | — | |
Prepaid expenses | | | 23,018 | | | | 46,780 | | | | 15,113 | |
Total assets | | $ | 130,444,959 | | | $ | 131,387,587 | | | $ | 41,384,107 | |
| | | | | | | | | | | | | |
Liabilities | | | | | | | | | | | | |
Payable to investment advisor | | | 116,785 | | | | 138,397 | | | | 36,704 | |
Payable for securities purchased | | | — | | | | — | | | | — | |
Payable for fund shares purchased | | | 5,290 | | | | 54,996 | | | | 28,819 | |
Distributions payable | | | — | | | | — | | | | 199,293 | |
Accrued 12b-1 fees | | | 734 | | | | 1,779 | | | | 1,542 | |
Accrued administration fees | | | 10,558 | | | | 12,478 | | | | 3,317 | |
Accrued CCO fees | | | 4,203 | | | | 5,424 | | | | 1,561 | |
Accrued custody fees | | | — | | | | 867 | | | | — | |
Accrued fund accounting fees | | | 17,197 | | | | 18,325 | | | | 10,674 | |
Accrued printing fees | | | 2,475 | | | | — | | | | — | |
Accrued registration fees | | | 11,754 | | | | 5,923 | | | | 15,564 | |
Accrued transfer agent fees | | | 35,700 | | | | 104,474 | | | | 15,716 | |
Accrued trustee fees | | | 3,019 | | | | 3,047 | | | | 1,568 | |
Accrued expenses | | | 32,937 | | | | 40,634 | | | | 21,466 | |
Total liabilities | | | 240,652 | | | | 386,344 | | | | 336,224 | |
| | | | | | | | | | | | | |
Net assets | | $ | 130,204,307 | | | $ | 131,001,243 | | | $ | 41,047,883 | |
| | | | | | | | | | | | | |
Net assets at June 30, 2021 consist of | | | | | | | | | | | | |
Paid-in capital | | | 61,165,553 | | | | 327,263,231 | | | | 34,048,198 | |
Distributable earnings/(loss) | | | 69,038,754 | | | | (196,261,988 | ) | | | 6,999,685 | |
Total net assets | | $ | 130,204,307 | | | $ | 131,001,243 | | | $ | 41,047,883 | |
| | | | | | | | | | | | | |
Net assets | | | | | | | | | | | | |
Institutional Shares | | $ | 126,936,488 | | | $ | 123,241,568 | | | $ | 34,721,091 | |
Investor Shares | | $ | 3,267,819 | | | $ | 7,759,675 | | | $ | 6,326,792 | |
| | | | | | | | | | | | | |
Shares outstanding | | | | | | | | | | | | |
Institutional Shares (no par value, unlimited shares authorized) | | | 5,244,453 | | | | 7,161,386 | | | | 3,198,810 | |
Investor Shares (no par value, unlimited shares authorized) | | | 142,798 | | | | 457,503 | | | | 594,133 | |
| | | | | | | | | | | | | |
Net asset value per share | | | | | | | | | | | | |
Institutional Shares | | $ | 24.20 | | | $ | 17.21 | | | $ | 10.85 | |
Investor Shares | | $ | 22.88 | | | $ | 16.96 | | | $ | 10.65 | |
(a) | Includes securities on loan of $475,831. |
(b) | Includes securities on loan of $1,271,376. |
See accompanying notes to financial statements.
14
Statements of Operations (Unaudited) For the Six Months Ended June 30, 2021 |
| | | ICON
Consumer
Select
Fund | | | ICON
Equity
Fund | | | ICON
Equity Income
Fund | | | ICON
Flexible Bond
Fund | |
Investment income | | | | | | | | | | | | | | | | |
Interest income | | $ | 26 | | | $ | 32 | | | $ | 47,995 | | | $ | 2,151,097 | |
Dividend income (net of foreign tax withheld: $229, $5,815, $3,553, and $— respectively) | | | 262,806 | | | | 308,635 | | | | 1,217,370 | | | | 1,562,800 | |
Income from securities lending, net | | | 17 | | | | 10,897 | | | | 1,135 | | | | 24,386 | |
Total | | | 262,849 | | | | 319,564 | | | | 1,266,500 | | | | 3,738,283 | |
| | | | | | | | | | | | | | | | | |
Expenses | | | | | | | | | | | | | | | | |
Management fees (Note 2) | | $ | 288,186 | | | $ | 284,364 | | | $ | 328,733 | | | $ | 428,276 | |
Administration fees (Note 2) | | | 26,205 | | | | 34,497 | | | | 39,854 | | | | 64,880 | |
Transfer agent fees | | | 16,728 | | | | 26,624 | | | | 31,450 | | | | 41,975 | |
Accounting services | | | 17,156 | | | | 19,380 | | | | 23,228 | | | | 32,060 | |
Custodian fees | | | 2,136 | | | | 3,038 | | | | 4,659 | | | | 6,461 | |
Legal and audit fees | | | 9,278 | | | | 11,690 | | | | 12,573 | | | | 20,021 | |
CCO fees (Note 2) | | | 2,849 | | | | 3,956 | | | | 4,456 | | | | 7,857 | |
Trustees fees | | | 2,583 | | | | 2,638 | | | | 2,512 | | | | 2,730 | |
Insurance | | | 1,178 | | | | 1,649 | | | | 1,836 | | | | 3,236 | |
Printing | | | 6,852 | | | | 6,992 | | | | 9,750 | | | | 9,033 | |
Registration and dues | | | 22,891 | | | | 23,548 | | | | 22,002 | | | | 24,498 | |
Investor Class 12b-1 fees (Note 2) | | | 3,170 | | | | 27,646 | | | | 50,081 | | | | 12,619 | |
Total expenses | | $ | 399,212 | | | $ | 446,022 | | | $ | 531,134 | | | $ | 653,646 | |
Less reimbursement from manager (Note 2) | | | — | | | | — | | | | (42,104 | ) | | | (97,628 | ) |
Net expenses | | $ | 399,212 | | | $ | 446,022 | | | $ | 489,030 | | | $ | 556,018 | |
Net investment income | | $ | (136,363 | ) | | $ | (126,458 | ) | | $ | 777,470 | | | $ | 3,182,265 | |
| | | | | | | | | | | | | | | | | |
Realized and unrealized gain/(loss) on investments | | | | | | | | | | | | | | | | |
Net realized gain/(loss) from security transactions and foreign currency | | $ | 3,721,691 | | | $ | 4,497,950 | | | $ | 8,197,145 | | | $ | 1,368,890 | |
Change in unrealized appreciation/(depreciation) of investments | | | 5,968,189 | | | | 9,593,996 | | | | 6,220,521 | | | | 211,402 | |
Net realized and unrealized gain/(loss) on investments | | $ | 9,689,880 | | | $ | 14,091,946 | | | $ | 14,417,666 | | | $ | 1,580,290 | |
Net increase/(decrease) in net assets resulting from operations | | $ | 9,553,517 | | | $ | 13,965,488 | | | $ | 15,195,136 | | | $ | 4,762,557 | |
See accompanying notes to financial statements.
15
Statements of Operations (Unaudited)
For the Six Months Ended June 30, 2021 (Continued) |
| | | ICON Health
and Information
Technology
Fund | | | ICON Natural
Resources and
Infrastructure
Fund | | | ICON Utilities
and Income
Fund | |
Investment income | | | | | | | | | | | | |
Interest income | | $ | 88 | | | $ | 433 | | | $ | 63 | |
Dividend income (net of foreign tax withheld: $4,672, $9,579, and $669 respectively) | | | 446,163 | | | | 2,111,493 | | | | 567,411 | |
Income from securities lending, net | | | 58 | | | | 5,364 | | | | — | |
Total | | | 446,309 | | | | 2,117,290 | | | | 567,474 | |
| | | | | | | | | | | | | |
Expenses | | | | | | | | | | | | |
Management fees (Note 2) | | $ | 633,168 | | | $ | 747,532 | | | $ | 174,549 | |
Administration fees (Note 2) | | | 57,579 | | | | 68,063 | | | | 15,874 | |
Transfer agent fees | | | 37,702 | | | | 84,339 | | | | 14,448 | |
Accounting services | | | 20,859 | | | | 23,910 | | | | 14,525 | |
Custodian fees | | | 3,515 | | | | 5,255 | | | | 1,589 | |
Legal and audit fees | | | 14,929 | | | | 17,856 | | | | 6,942 | |
CCO fees (Note 2) | | | 5,781 | | | | 7,041 | | | | 1,726 | |
Trustees fees | | | 2,307 | | | | 2,427 | | | | 2,499 | |
Insurance | | | 2,361 | | | | 2,909 | | | | 720 | |
Printing | | | 6,488 | | | | 7,046 | | | | 6,639 | |
Registration and dues | | | 18,827 | | | | 19,645 | | | | 21,121 | |
Investor Class 12b-1 fees (Note 2) | | | 4,004 | | | | 8,686 | | | | 7,136 | |
Total expenses | | $ | 807,520 | | | $ | 994,709 | | | $ | 267,768 | |
Less reimbursement from manager (Note 2) | | | — | | | | — | | | | (45,302 | ) |
Net expenses | | $ | 807,520 | | | $ | 994,709 | | | $ | 222,466 | |
Net investment income | | $ | (361,211 | ) | | $ | 1,122,581 | | | $ | 345,008 | |
| | | | | | | | | | | | | |
Realized and unrealized gain/(loss) on investments | | | | | | | | | | | | |
Net realized gain/(loss) from security transactions and foreign currency | | $ | 16,277,709 | | | $ | 21,899,480 | | | $ | 3,236,778 | |
Change in unrealized appreciation/(depreciation) of investments | | | (499,756 | ) | | | 4,591,146 | | | | 623,452 | |
Net realized and unrealized gain/(loss) on investments | | $ | 15,777,953 | | | $ | 26,490,626 | | | $ | 3,860,230 | |
Net increase/(decrease) in net assets resulting from operations | | $ | 15,416,742 | | | $ | 27,613,207 | | | $ | 4,205,238 | |
See accompanying notes to financial statements.
16
Statements of Changes in Net Assets |
| | | ICON Consumer Select Fund | |
| | | Period Ended
June 30,
2021 | | | Period Ended
December 31,
2020 | | | Year Ended
September 30,
2020 | |
Operations | | | | | | | | | | | | |
Net investment income/(loss) | | $ | (136,363 | ) | | $ | (65,239 | ) | | $ | 117,902 | |
Net realized gain/(loss) from security transactions and foreign currency | | | 3,721,691 | | | | 2,597,061 | | | | (1,302,968 | ) |
Change in unrealized appreciation/(depreciation) of investments | | | 5,968,189 | | | | 5,085,250 | | | | (1,298,319 | ) |
Net increase/(decrease) in net assets resulting from operations | | | 9,553,517 | | | | 7,617,072 | | | | (2,483,385 | ) |
| | | | | | | | | | | | | |
Distributions to shareholders | | | | | | | | | | | | |
Distributions | | | | | | | | | | | | |
Institutional Shares(a) | | | — | | | | — | | | | (781,560 | ) |
Investor Shares(b) | | | — | | | | — | | | | (25,869 | ) |
| | | | | | | | | | | | | |
Capital share transactions | | | | | | | | | | | | |
Increase/(decrease) in net assets resulting from capital share transactions | | | (5,039,987 | ) | | | (3,358,027 | ) | | | 18,541,459 | |
Total increase/(decrease) | | | 4,513,530 | | | | 4,259,045 | | | | 15,250,645 | |
| | | | | | | | | | | | | |
Net assets | | | | | | | | | | | | |
Beginning of period | | | 55,574,790 | | | | 51,315,745 | | | | 36,065,100 | |
End of period | | $ | 60,088,320 | | | $ | 55,574,790 | | | $ | 51,315,745 | |
| | | ICON Equity Fund | |
| | | Period Ended
June 30,
2021 | | | Period Ended
December 31,
2020 | | | Year Ended
September 30,
2020 | |
Operations | | | | | | | | | | | | |
Net investment income/(loss) | | $ | (126,458 | ) | | $ | (58,638 | ) | | $ | (69,954 | ) |
Net realized gain/(loss) from security transactions and foreign currency | | | 4,497,950 | | | | 3,788,641 | | | | (2,102,548 | ) |
Change in unrealized appreciation/(depreciation) of investments | | | 9,593,996 | | | | 8,112,047 | | | | 7,898,128 | |
Net increase/(decrease) in net assets resulting from operations | | | 13,965,488 | | | | 11,842,050 | | | | 5,725,626 | |
| | | | | | | | | | | | | |
Distributions to shareholders | | | | | | | | | | | | |
Distributions | | | | | | | | | | | | |
Institutional Shares(a) | | | — | | | | — | | | | (458,387 | ) |
Investor Shares(b) | | | — | | | | — | | | | (180,913 | ) |
Class C Shares | | | — | | | | — | | | | (117,821 | ) |
| | | | | | | | | | | | | |
Capital share transactions | | | | | | | | | | | | |
Increase/(decrease) in net assets resulting from capital share transactions | | | (3,669,589 | ) | | | (5,826,385 | ) | | | 38,767,407 | |
Total increase/(decrease) | | | 10,295,899 | | | | 6,015,665 | | | | 43,735,912 | |
| | | | | | | | | | | | | |
Net assets | | | | | | | | | | | | |
Beginning of period | | | 70,271,641 | | | | 64,255,976 | | | | 20,520,064 | |
End of period | | $ | 80,567,540 | | | $ | 70,271,641 | | | $ | 64,255,976 | |
(a) | Formerly Class S Shares (see Note 7). |
(b) | Formerly Class A Shares (see Note 7). |
See accompanying notes to financial statements.
17
Statements of Changes in Net Assets (Continued) |
| | | ICON Equity Income Fund | |
| | | Period Ended
June 30,
2021 | | | Period Ended
December 31,
2020 | | | Year Ended
September 30,
2020 | |
Operations | | | | | | | | | | | | |
Net investment income/(loss) | | $ | 777,470 | | | $ | 531,274 | | | $ | 1,574,077 | |
Net realized gain/(loss) from security transactions and foreign currency | | | 8,197,145 | | | | 1,810,926 | | | | (2,803,532 | ) |
Change in unrealized appreciation/(depreciation) of investments | | | 6,220,521 | | | | 10,547,305 | | | | (3,055,329 | ) |
Net increase/(decrease) in net assets resulting from operations | | | 15,195,136 | | | | 12,889,505 | | | | (4,284,784 | ) |
| | | | | | | | | | | | | |
Distributions to shareholders | | | | | | | | | | | | |
Distributions | | | | | | | | | | | | |
Institutional Shares(a) | | | (450,966 | ) | | | (889,831 | ) | | | (2,270,542 | ) |
Investor Shares(b) | | | (329,015 | ) | | | (738,335 | ) | | | (549,194 | ) |
Class C Shares | | | — | | | | — | | | | (630,549 | ) |
| | | | | | | | | | | | | |
Capital share transactions | | | | | | | | | | | | |
Increase/(decrease) in net assets resulting from capital share transactions | | | (8,798,489 | ) | | | (9,350,283 | ) | | | 6,943,667 | |
Total increase/(decrease) | | | 5,616,666 | | | | 1,911,056 | | | | (791,402 | ) |
| | | | | | | | | | | | | |
Net assets | | | | | | | | | | | | |
Beginning of period | | | 82,097,353 | | | | 80,186,297 | | | | 80,977,699 | |
End of period | | $ | 87,714,019 | | | $ | 82,097,353 | | | $ | 80,186,297 | |
| | | ICON Flexible Bond Fund | |
| | | Period Ended
June 30,
2021 | | | Period Ended
December 31,
2020 | | | Year Ended
September 30,
2020 | |
Operations | | | | | | | | | | | | |
Net investment income/(loss) | | $ | 3,182,265 | | | $ | 1,651,089 | | | $ | 6,971,943 | |
Net realized gain/(loss) from security transactions and foreign currency | | | 1,368,890 | | | | (531,135 | ) | | | (2,700,973 | ) |
Change in unrealized appreciation/(depreciation) of investments | | | 211,402 | | | | 5,317,281 | | | | (3,591,635 | ) |
Net increase/(decrease) in net assets resulting from operations | | | 4,762,557 | | | | 6,437,235 | | | | 679,335 | |
| | | | | | | | | | | | | |
Distributions to shareholders | | | | | | | | | | | | |
Distributions | | | | | | | | | | | | |
Institutional Shares(a) | | | (2,750,554 | ) | | | (1,283,045 | ) | | | (6,627,115 | ) |
Investor Shares(b) | | | (195,522 | ) | | | (93,736 | ) | | | (287,378 | ) |
Class C Shares | | | — | | | | — | | | | (148,073 | ) |
| | | | | | | | | | | | | |
Capital share transactions | | | | | | | | | | | | |
Increase/(decrease) in net assets resulting from capital share transactions | | | 1,474,764 | | | | (15,118,631 | ) | | | 4,162,276 | |
Total increase/(decrease) | | | 3,291,245 | | | | (10,058,177 | ) | | | (2,220,955 | ) |
| | | | | | | | | | | | | |
Net assets | | | | | | | | | | | | |
Beginning of period | | | 141,760,564 | | | | 151,818,741 | | | | 154,039,696 | |
End of period | | $ | 145,051,809 | | | $ | 141,760,564 | | | $ | 151,818,741 | |
(a) | Formerly Class S Shares (see Note 7). |
(b) | Formerly Class A Shares (see Note 7). |
See accompanying notes to financial statements.
18
Statements of Changes in Net Assets (Continued) |
| | | ICON Health and Information Technology Fund | |
| | | Period Ended
June 30,
2021 | | | Period Ended
December 31,
2020 | | | Year Ended
September 30,
2020 | |
Operations | | | | | | | | | | | | |
Net investment income/(loss) | | $ | (361,211 | ) | | $ | (162,126 | ) | | $ | (378,092 | ) |
Net realized gain/(loss) from security transactions and foreign currency | | | 16,277,709 | | | | 7,008,704 | | | | 4,942,975 | |
Change in unrealized appreciation/(depreciation) of investments | | | (499,756 | ) | | | 13,587,755 | | | | 12,027,242 | |
Net increase/(decrease) in net assets resulting from operations | | | 15,416,742 | | | | 20,434,333 | | | | 16,592,125 | |
| | | | | | | | | | | | | |
Distributions to shareholders | | | | | | | | | | | | |
Distributions | | | | | | | | | | | | |
Institutional Shares(a) | | | — | | | | (4,213,865 | ) | | | (2,400,424 | ) |
Investor Shares(b) | | | — | | | | (115,253 | ) | | | (68,657 | ) |
| | | | | | | | | | | | | |
Capital share transactions | | | | | | | | | | | | |
Increase/(decrease) in net assets resulting from capital share transactions | | | (13,469,001 | ) | | | (415,225 | ) | | | 42,717,600 | |
Total increase/(decrease) | | | 1,947,741 | | | | 15,689,990 | | | | 56,840,644 | |
| | | | | | | | | | | | | |
Net assets | | | | | | | | | | | | |
Beginning of period | | | 128,256,566 | | | | 112,566,576 | | | | 55,725,932 | |
End of period | | $ | 130,204,307 | | | $ | 128,256,566 | | | $ | 112,566,576 | |
| | | ICON Natural Resources and
Infrastructure Fund | |
| | | Period Ended
June 30,
2021 | | | Period Ended
December 31,
2020 | | | Year Ended
September 30,
2020 | |
Operations | | | | | | | | | | | | |
Net investment income/(loss) | | $ | 1,122,581 | | | $ | 130,184 | | | $ | 402,615 | |
Net realized gain/(loss) from security transactions and foreign currency | | | 21,899,480 | | | | 3,178,678 | | | | (34,405,685 | ) |
Change in unrealized appreciation/(depreciation) of investments | | | 4,591,146 | | | | 13,794,734 | | | | 38,453,067 | |
Net increase/(decrease) in net assets resulting from operations | | | 27,613,207 | | | | 17,103,596 | | | | 4,449,997 | |
| | | | | | | | | | | | | |
Distributions to shareholders | | | | | | | | | | | | |
Distributions | | | | | | | | | | | | |
Institutional Shares(a) | | | — | | | | (331,545 | ) | | | (860,865 | ) |
Investor Shares(b) | | | — | | | | (18,251 | ) | | | (42,308 | ) |
Class C Shares | | | — | | | | — | | | | (14,111 | ) |
| | | | | | | | | | | | | |
Capital share transactions | | | | | | | | | | | | |
Increase/(decrease) in net assets resulting from capital share transactions | | | (6,510,965 | ) | | | (10,641,282 | ) | | | 41,250,272 | |
Total increase/(decrease) | | | 21,102,242 | | | | 6,112,518 | | | | 44,782,985 | |
| | | | | | | | | | | | | |
Net assets | | | | | | | | | | | | |
Beginning of period | | | 109,899,001 | | | | 103,786,483 | | | | 59,003,498 | |
End of period | | $ | 131,001,243 | | | $ | 109,899,001 | | | $ | 103,786,483 | |
(a) | Formerly Class S Shares (see Note 7). |
(b) | Formerly Class A Shares (see Note 7). |
See accompanying notes to financial statements.
19
Statements of Changes in Net Assets (Continued) |
| | | ICON Utilities and Income Fund | |
| | | Period Ended
June 30,
2021 | | | Period Ended
December 31,
2020 | | | Year Ended
September 30,
2020 | |
Operations | | | | | | | | | | | | |
Net investment income/(loss) | | $ | 345,008 | | | $ | 159,196 | | | $ | 838,890 | |
Net realized gain/(loss) from security transactions and foreign currency | | | 3,236,778 | | | | 289,880 | | | | 861,306 | |
Change in unrealized appreciation/(depreciation) of investments | | | 623,452 | | | | 2,825,367 | | | | (6,169,332 | ) |
Net increase/(decrease) in net assets resulting from operations | | | 4,205,238 | | | | 3,274,443 | | | | (4,469,136 | ) |
| | | | | | | | | | | | | |
Distributions to shareholders | | | | | | | | | | | | |
Distributions | | | | | | | | | | | | |
Institutional Shares(a) | | | (291,239 | ) | | | (1,172,561 | ) | | | (2,221,845 | ) |
Investor Shares(b) | | | (50,654 | ) | | | (231,070 | ) | | | (280,239 | ) |
| | | | | | | | | | | | | |
Capital share transactions | | | | | | | | | | | | |
Increase/(decrease) in net assets resulting from capital share transactions | | | 6,829,381 | | | | (1,350,769 | ) | | | (15,251,500 | ) |
Total increase/(decrease) | | | 10,692,726 | | | | 520,043 | | | | (22,222,720 | ) |
| | | | | | | | | | | | | |
Net assets | | | | | | | | | | | | |
Beginning of period | | | 30,355,157 | | | | 29,835,114 | | | | 52,057,834 | |
End of period | | $ | 41,047,883 | | | $ | 30,355,157 | | | $ | 29,835,114 | |
(a) | Formerly Class S Shares (see Note 7). |
(b) | Formerly Class A Shares (see Note 7). |
See accompanying notes to financial statements.
20
Statements of Changes in Net Assets (Continued) |
ICON Consumer Select Fund | | Institutional Shares | |
| | | Period Ended
June 30, 2021 | | | Period Ended
December 31, 2020 | | | Year Ended
September 30, 2020 | |
| | | Shares | | | Value | | | Shares | | | Value | | | Shares | | | Value | |
Shares sold | | | 162,097 | | | $ | 1,985,046 | | | | 108,075 | | | $ | 1,066,160 | | | | 729,367 | | | $ | 8,113,245 | |
Shares issued in reinvestment of distributions | | | — | | | | — | | | | — | | | | — | | | | 64,552 | | | | 760,428 | |
Shares issued in connection with reorganization | | | N/A | | | | N/A | | | | N/A | | | | N/A | | | | 2,619,242 | | | | 23,056,150 | |
Shares repurchased | | | (579,251 | ) | | | (6,861,396 | ) | | | (389,629 | ) | | | (3,970,275 | ) | | | (1,468,232 | ) | | | (14,471,065 | ) |
Net increase/(decrease) | | | (417,154 | ) | | $ | (4,876,350 | ) | | | (281,554 | ) | | $ | (2,904,115 | ) | | | 1,944,929 | | | $ | 17,458,758 | |
| | | Investor Shares | |
| | | Period Ended
June 30, 2021 | | | Period Ended
December 31, 2020 | | | Year Ended
September 30, 2020 | |
| | | Shares | | | Value | | | Shares | | | Value | | | Shares | | | Value | |
Shares sold | | | 442 | | | $ | 5,464 | | | | 753 | | | $ | 7,514 | | | | 17,235 | | | $ | 179,656 | |
Shares issued in reinvestment of distributions | | | — | | | | — | | | | — | | | | — | | | | 2,161 | | | | 25,451 | |
Shares issued in connection with reorganization | | | N/A | | | | N/A | | | | N/A | | | | N/A | | | | 188,420 | | | | 1,683,467 | |
Shares repurchased | | | (13,904 | ) | | | (169,101 | ) | | | (45,329 | ) | | | (461,426 | ) | | | (82,945 | ) | | | (805,903 | ) |
Net increase/(decrease) | | | (13,462 | ) | | $ | (163,637 | ) | | | (44,576 | ) | | $ | (453,912 | ) | | | 124,871 | | | $ | 1,082,671 | |
ICON Equity Fund | | Institutional Shares | |
| | | Period Ended
June 30, 2021 | | | Period Ended
December 31, 2020 | | | Year Ended
September 30, 2020 | |
| | | Shares | | | Value | | | Shares | | | Value | | | Shares | | | Value | |
Shares sold | | | 51,003 | | | $ | 1,943,208 | | | | 26,026 | | | $ | 794,360 | | | | 88,061 | | | $ | 2,281,246 | |
Shares issued in reinvestment of distributions | | | — | | | | — | | | | — | | | | — | | | | 11,579 | | | | 332,661 | |
Shares issued in connection with reorganization | | | N/A | | | | N/A | | | | N/A | | | | N/A | | | | 1,405,548 | | | | 35,818,141 | |
Shares repurchased | | | (112,408 | ) | | | (4,244,424 | ) | | | (165,388 | ) | | | (4,895,575 | ) | | | (371,304 | ) | | | (9,451,813 | ) |
Net increase/(decrease) | | | (61,405 | ) | | $ | (2,301,216 | ) | | | (139,362 | ) | | $ | (4,101,215 | ) | | | 1,133,884 | | | $ | 28,980,235 | |
| | | Investor Shares | |
| | | Period Ended
June 30, 2021 | | | Period Ended
December 31, 2020 | | | Year Ended
September 30, 2020 | |
| | | Shares | | | Value | | | Shares | | | Value | | | Shares | | | Value | |
Shares sold | | | 735 | | | $ | 82,008 | | | | 1,031 | | | $ | 30,792 | | | | 4,011 | | | $ | 100,130 | |
Shares issued in reinvestment of distributions | | | — | | | | — | | | | — | | | | — | | | | 5,916 | | | | 163,167 | |
Shares issued in connection with reorganization | | | N/A | | | | N/A | | | | N/A | | | | N/A | | | | 537,772 | | | | 13,134,931 | |
Transfers in/(out) from Class C reorganization | | | N/A | | | | N/A | | | | N/A | | | | N/A | | | | 94,965 | | | | 2,319,492 | |
Shares repurchased | | | (41,363 | ) | | | (1,450,381 | ) | | | (60,116 | ) | | | (1,755,962 | ) | | | (122,685 | ) | | | (3,236,280 | ) |
Net increase/(decrease) | | | (40,628 | ) | | $ | (1,368,373 | ) | | | (59,085 | ) | | $ | (1,725,170 | ) | | | 519,979 | | | $ | 12,481,440 | |
See accompanying notes to financial statements.
21
Statements of Changes in Net Assets (Continued) |
ICON Equity Income Fund | | Institutional Shares | |
| | | Period Ended
June 30, 2021 | | | Period Ended
December 31, 2020 | | | Year Ended
September 30, 2020 | |
| | | Shares | | | Value | | | Shares | | | Value | | | Shares | | | Value | |
Shares sold | | | 105,652 | | | $ | 2,356,698 | | | | 41,300 | | | $ | 737,880 | | | | 404,960 | | | $ | 6,749,354 | |
Shares issued in reinvestment of distributions | | | 19,820 | | | | 437,557 | | | | 45,775 | | | | 863,960 | | | | 122,717 | | | | 2,140,586 | |
Shares issued in connection with reorganization | | | — | | | | — | | | | N/A | | | | N/A | | | | 445,319 | | | | 7,274,057 | |
Shares repurchased | | | (347,225 | ) | | | (7,481,491 | ) | | | (332,548 | ) | | | (5,876,172 | ) | | | (1,260,129 | ) | | | (20,414,175 | ) |
Net increase/(decrease) | | | (221,753 | ) | | $ | (4,687,236 | ) | | | (245,473 | ) | | $ | (4,274,332 | ) | | | (287,133 | ) | | $ | (4,250,178 | ) |
| | | Investor Shares | |
| | | Period Ended
June 30, 2021 | | | Period Ended
December 31, 2020 | | | Year Ended
September 30, 2020 | |
| | | Shares | | | Value | | | Shares | | | Value | | | Shares | | | Value | |
Shares sold | | | 5,124 | | | $ | 112,768 | | | | 5,205 | | | $ | 93,505 | | | | 33,726 | | | $ | 552,171 | |
Shares issued in reinvestment of distributions | | | 13,713 | | | | 302,419 | | | | 36,055 | | | | 680,562 | | | | 29,133 | | | | 504,628 | |
Shares issued in connection with reorganization | | | — | | | | — | | | | N/A | | | | N/A | | | | 977,450 | | | | 15,916,988 | |
Transfers in/(out) from Class C reorganization | | | — | | | | — | | | | N/A | | | | N/A | | | | 905,454 | | | | 13,688,996 | |
Shares repurchased | | | (214,496 | ) | | | (4,526,440 | ) | | | (327,885 | ) | | | (5,850,018 | ) | | | (262,824 | ) | | | (4,220,319 | ) |
Net increase/(decrease) | | | (195,659 | ) | | $ | (4,111,253 | ) | | | (286,625 | ) | | $ | (5,075,951 | ) | | | 1,682,939 | | | $ | 26,442,464 | |
ICON Flexible Bond Fund | | Institutional Shares | |
| | | Period Ended
June 30, 2021 | | | Period Ended
December 31, 2020 | | | Year Ended
September 30, 2020 | |
| | | Shares | | | Value | | | Shares | | | Value | | | Shares | | | Value | |
Shares sold | | | 2,467,925 | | | $ | 23,355,412 | | | | 818,558 | | | $ | 7,556,077 | | | | 6,840,816 | | | $ | 62,398,427 | |
Shares issued in reinvestment of distributions | | | 271,634 | | | | 2,570,300 | | | | 130,346 | | | | 1,205,834 | | | | 677,781 | | | | 6,157,571 | |
Shares repurchased | | | (2,487,971 | ) | | | (23,551,968 | ) | | | (2,546,434 | ) | | | (23,521,463 | ) | | | (7,301,000 | ) | | | (65,053,730 | ) |
Net increase/(decrease) | | | 251,588 | | | $ | 2,373,744 | | | | (1,597,530 | ) | | $ | (14,759,552 | ) | | | 217,597 | | | $ | 3,502,268 | |
| | | Investor Shares | |
| | | Period Ended
June 30, 2021 | | | Period Ended
December 31, 2020 | | | Year Ended
September 30, 2020 | |
| | | Shares | | | Value | | | Shares | | | Value | | | Shares | | | Value | |
Shares sold | | | 14,514 | | | $ | 136,905 | | | | 9,959 | | | $ | 90,597 | | | | 288,798 | | | $ | 2,621,924 | |
Shares issued in reinvestment of distributions | | | 18,748 | | | | 176,306 | | | | 9,161 | | | | 84,276 | | | | 29,009 | | | | 262,179 | |
Transfers in/(out) from Class C reorganization | | | N/A | | | | N/A | | | | N/A | | | | N/A | | | | 499,394 | | | | 4,442,281 | |
Shares repurchased | | | (128,931 | ) | | | (1,212,191 | ) | | | (58,381 | ) | | | (533,952 | ) | | | (250,623 | ) | | | (2,250,280 | ) |
Net increase/(decrease) | | | (95,669 | ) | | $ | (898,980 | ) | | | (39,261 | ) | | $ | (359,079 | ) | | | 566,578 | | | $ | 5,076,104 | |
See accompanying notes to financial statements.
22
Statements of Changes in Net Assets (Continued) |
ICON Health and Information Technology Fund | | Institutional Shares | |
| | | Period Ended
June 30, 2021 | | | Period Ended
December 31, 2020 | | | Year Ended
September 30, 2020 | |
| | | Shares | | | Value | | | Shares | | | Value | | | Shares | | | Value | |
Shares sold | | | 73,505 | | | $ | 1,691,121 | | | | 42,075 | | | $ | 844,603 | | | | 240,217 | | | $ | 3,996,694 | |
Shares issued in reinvestment of distributions | | | — | | | | — | | | | 203,806 | | | | 4,114,834 | | | | 142,055 | | | | 2,326,868 | |
Shares issued in connection with reorganization | | | N/A | | | | N/A | | | | N/A | | | | N/A | | | | 3,034,144 | | | | 53,595,126 | |
Shares repurchased | | | (659,102 | ) | | | (14,843,418 | ) | | | (261,414 | ) | | | (5,225,619 | ) | | | (1,081,373 | ) | | | (18,313,702 | ) |
Net increase/(decrease) | | | (585,597 | ) | | $ | (13,152,297 | ) | | | (15,533 | ) | | $ | (266,182 | ) | | | 2,335,043 | | | $ | 41,604,986 | |
| | | Investor Shares | |
| | | Period Ended
June 30, 2021 | | | Period Ended
December 31, 2020 | | | Year Ended
September 30, 2020 | |
| | | Shares | | | Value | | | Shares | | | Value | | | Shares | | | Value | |
Shares sold | | | 592 | | | $ | 12,683 | | | | 1,882 | | | $ | 36,527 | | | | 14,429 | | | $ | 223,822 | |
Shares issued in reinvestment of distributions | | | — | | | | — | | | | 5,598 | | | | 107,042 | | | | 4,157 | | | | 64,770 | |
Shares issued in connection with reorganization | | | N/A | | | | N/A | | | | N/A | | | | N/A | | | | 93,171 | | | | 1,563,188 | |
Shares repurchased | | | (15,352 | ) | | | (329,387 | ) | | | (15,566 | ) | | | (292,612 | ) | | | (45,376 | ) | | | (739,166 | ) |
Net increase/(decrease) | | | (14,760 | ) | | $ | (316,704 | ) | | | (8,086 | ) | | $ | (149,043 | ) | | | 66,381 | | | $ | 1,112,614 | |
ICON Natural Resources and Infrastructure Fund | | Institutional Shares | |
| | | Period Ended
June 30, 2021 | | | Period Ended
December 31, 2020 | | | Year Ended
September 30, 2020 | |
| | | Shares | | | Value | | | Shares | | | Value | | | Shares | | | Value | |
Shares sold | | | 3,780,428 | | | $ | 62,348,075 | | | | 82,823 | | | $ | 1,086,966 | | | | 704,577 | | | $ | 8,087,116 | |
Shares issued in reinvestment of distributions | | | — | | | | — | | | | 23,415 | | | | 322,186 | | | | 64,260 | | | | 836,659 | |
Shares issued in connection with reorganization | | | N/A | | | | N/A | | | | N/A | | | | N/A | | | | 5,604,395 | | | | 58,579,943 | |
Shares repurchased | | | (4,196,669 | ) | | | (69,552,733 | ) | | | (912,197 | ) | | | (11,892,173 | ) | | | (2,420,027 | ) | | | (27,529,677 | ) |
Net increase/(decrease) | | | (416,241 | ) | | $ | (7,204,658 | ) | | | (805,959 | ) | | $ | (10,483,021 | ) | | | 3,953,205 | | | $ | 39,974,041 | |
| | | Investor Shares | |
| | | Period Ended
June 30, 2021 | | | Period Ended
December 31, 2020 | | | Year Ended
September 30, 2020 | |
| | | Shares | | | Value | | | Shares | | | Value | | | Shares | | | Value | |
Shares sold | | | 118,142 | | | $ | 1,947,211 | | | | 16,838 | | | $ | 226,485 | | | | 53,665 | | | $ | 142,860 | |
Shares issued in reinvestment of distributions | | | — | | | | — | | | | 1,228 | | | | 16,662 | | | | 3,101 | | | | 39,945 | |
Shares issued in connection with reorganization | | | N/A | | | | N/A | | | | N/A | | | | N/A | | | | 344,815 | | | | 3,561,866 | |
Transfers in/(out) from Class C reorganization | | | N/A | | | | N/A | | | | N/A | | | | N/A | | | | 40,930 | | | | 422,797 | |
Shares repurchased | | | (77,437 | ) | | | (1,253,518 | ) | | | (31,072 | ) | | | (401,408 | ) | | | (192,860 | ) | | | (2,140,173 | ) |
Net increase/(decrease) | | | 40,705 | | | $ | 693,693 | | | | (13,006 | ) | | $ | (158,261 | ) | | | 249,651 | | | $ | 2,027,295 | |
See accompanying notes to financial statements.
23
Statements of Changes in Net Assets (Continued) |
ICON Utilities and Income Fund | | Institutional Shares | |
| | | Period Ended
June 30, 2021 | | | Period Ended
December 31, 2020 | | | Year Ended
September 30, 2020 | |
| | | Shares | | | Value | | | Shares | | | Value | | | Shares | | | Value | |
Shares sold | | | 1,018,957 | | | $ | 11,168,922 | | | | 66,471 | | | $ | 648,534 | | | | 873,929 | | | $ | 8,530,658 | |
Shares issued in reinvestment of distributions | | | 25,962 | | | | 281,574 | | | | 118,890 | | | | 1,121,867 | | | | 223,698 | | | | 2,143,258 | |
Shares repurchased | | | (507,501 | ) | | | (5,420,029 | ) | | | (308,856 | ) | | | (2,945,579 | ) | | | (2,799,408 | ) | | | (25,388,551 | ) |
Net increase/(decrease) | | | 537,418 | | | $ | 6,030,467 | | | | (123,495 | ) | | $ | (1,175,178 | ) | | | (1,701,781 | ) | | $ | (14,714,635 | ) |
| | | Investor Shares | |
| | | Period Ended
June 30, 2021 | | | Period Ended
December 31, 2020 | | | Year Ended
September 30, 2020 | |
| | | Shares | | | Value | | | Shares | | | Value | | | Shares | | | Value | |
Shares sold | | | 260,200 | | | $ | 2,833,691 | | | | 11,724 | | | $ | 108,522 | | | | 43,120 | | | $ | 402,945 | |
Shares issued in reinvestment of distributions | | | 2,550 | | | | 27,149 | | | | 12,162 | | | | 112,536 | | | | 14,170 | | | | 133,179 | |
Shares repurchased | | | (193,667 | ) | | | (2,061,926 | ) | | | (41,842 | ) | | | (396,649 | ) | | | (115,456 | ) | | | (1,072,989 | ) |
Net increase/(decrease) | | | 69,083 | | | $ | 798,914 | | | | (17,956 | ) | | $ | (175,591 | ) | | | (58,166 | ) | | $ | (536,865 | ) |
See accompanying notes to financial statements.
24
Financial Highlights For a Share Outstanding Throughout Each Year or Period
|
Icon Consumer Select Fund(a) | | | | | | | | | | | | | | | | |
Institutional Shares(b) | | Period Ended
June 30,
2021
(Unaudited) | | | Period Ended
December 31,
2020 | | | Year Ended
September 30,
2020 | | | Year Ended
September 30,
2019 | | | Year Ended
September 30,
2018 | | | Year Ended
September 30,
2017 | | | Year Ended
September 30,
2016 | |
Net asset value, beginning of year | | $ | 10.90 | | | $ | 9.46 | | | $ | 10.75 | | | $ | 10.97 | | | $ | 9.95 | | | $ | 7.67 | | | $ | 7.74 | |
INCOME FROM INVESTMENT OPERATIONS | | | | | | | | | | | | | | | | | | | | | | | | |
Net investment income/(loss)(c) | | | (0.03 | ) | | | (0.01 | ) | | | 0.03 | | | | 0.08 | | | | 0.05 | | | | 0.03 | | | | 0.08 | |
Net gain/(loss) on securities (both realized and unrealized) | | | 2.01 | | | | 1.45 | | | | (1.09 | ) | | | (0.23 | ) | | | 0.99 | | | | 2.34 | | | | (0.15 | ) |
Total from investment operations | | | 1.98 | | | | 1.44 | | | | (1.06 | ) | | | (0.15 | ) | | | 1.04 | | | | 2.37 | | | | (0.07 | ) |
LESS DISTRIBUTIONS | | | | | | | | | | | | | | | | | | | | | | | | | | | | |
Dividends from net investment income | | | — | | | | — | | | | (0.08 | ) | | | (0.07 | ) | | | (0.02 | ) | | | (0.09 | ) | | | — | |
Distributions from capital gains | | | — | | | | — | | | | (0.15 | ) | | | — | | | | — | | | | — | | | | — | |
Total distributions | | | — | | | | — | | | | (0.23 | ) | | | (0.07 | ) | | | (0.02 | ) | | | (0.09 | ) | | | — | |
Net asset value, end of year or period | | $ | 12.88 | | | $ | 10.90 | | | $ | 9.46 | | | $ | 10.75 | | | $ | 10.97 | | | $ | 9.95 | | | $ | 7.67 | |
| | | | | | | | | | | | | | | | | | | | | | | | | | | | | |
Total return | | | 18.17 | %(d) | | | 15.22 | %(d) | | | (10.29 | )% | | | (1.26 | )% | | | 10.48 | % | | | 30.96 | % | | | (0.90 | )% |
| | | | | | | | | | | | | | | | | | | | | | | | | | | | | |
RATIOS / SUPPLEMENTAL DATA | | | | | | | | | | | | | | | | | | | | | | | | | | | | |
Net assets, end of year or period (000s) | | $ | 57,458 | | | $ | 53,198 | | | $ | 48,832 | | | $ | 34,578 | | | $ | 43,500 | | | $ | 39,072 | | | $ | 43,354 | |
Ratio of expenses to average net assets: | | | | | | | | | | | | | | | | | | | | | | | | | | | | |
Before expense reimbursements | | | 1.36 | %(e) | | | 1.32 | %(e) | | | 1.56 | % | | | 1.54 | % | | | 1.44 | % | | | 1.40 | % | | | 1.40 | % |
After expense reimbursements(f) | | | 1.36 | %(e) | | | 1.32 | %(e) | | | 1.52 | % | | | 1.50 | % | | | 1.44 | % | | | 1.40 | % | | | 1.40 | % |
Ratio of net investment income/(loss) to average net assets | | | | | | | | | | | | | | | | | | | | | | | | | | | | |
Before expense reimbursements | | | (0.46 | )%(e) | | | (0.48 | )%(e) | | | 0.28 | % | | | 0.77 | % | | | 0.41 | % | | | 0.28 | % | | | 1.00 | % |
After expense reimbursements | | | (0.46 | )%(e) | | | (0.48 | )%(e) | | | 0.33 | % | | | 0.81 | % | | | 0.41 | % | | | 0.28 | % | | | 1.00 | % |
Portfolio turnover | | | 21 | %(d) | | | 14 | %(d) | | | 82 | % | | | 28 | % | | | 44 | % | | | 68 | % | | | 49 | % |
Icon Consumer Select Fund | | | | | | | | | | | | | | | | |
Investor Shares(g) | | Period Ended
June 30,
2021
(Unaudited) | | | Period Ended
December 31,
2020 | | | Year Ended
September 30,
2020 | | | Year Ended
September 30,
2019 | | | Year Ended
September 30,
2018 | | | Year Ended
September 30,
2017 | | | Year Ended
September 30,
2016 | |
Net asset value, beginning of year | | $ | 10.87 | | | $ | 9.44 | | | $ | 10.74 | | | $ | 10.98 | | | $ | 9.99 | | | $ | 7.71 | | | $ | 7.82 | |
INCOME FROM INVESTMENT OPERATIONS | | | | | | | | | | | | | | | | | | | | | | | | |
Net investment income/(loss)(c) | | | (0.04 | ) | | | (0.02 | ) | | | — | | | | 0.06 | | | | 0.01 | | | | (0.01 | ) | | | 0.05 | |
Net gain/(loss) on securities (both realized and unrealized) | | | 1.99 | | | | 1.45 | | | | (1.08 | ) | | | (0.24 | ) | | | 0.99 | | | | 2.37 | | | | (0.16 | ) |
Total from investment operations | | | 1.95 | | | | 1.43 | | | | (1.08 | ) | | | (0.18 | ) | | | 1.00 | | | | 2.36 | | | | (0.11 | ) |
LESS DISTRIBUTIONS | | | | | | | | | | | | | | | | | | | | | | | | | | | | |
Dividends from net investment income | | | — | | | | — | | | | (0.07 | ) | | | (0.06 | ) | | | (0.01 | ) | | | (0.08 | ) | | | — | |
Distributions from capital gains | | | — | | | | — | | | | (0.15 | ) | | | — | | | | — | | | | — | | | | — | |
Total distributions | | | — | | | | — | | | | (0.22 | ) | | | (0.06 | ) | | | (0.01 | ) | | | (0.08 | ) | | | — | |
Net asset value, end of year or period | | $ | 12.82 | | | $ | 10.87 | | | $ | 9.44 | | | $ | 10.74 | | | $ | 10.98 | | | $ | 9.99 | | | $ | 7.71 | |
| | | | | | | | | | | | | | | | | | | | | | | | | | | | | |
Total return(h) | | | 17.94 | %(d) | | | 15.15 | %(d) | | | (10.46 | )% | | | (1.51 | )% | | | 10.04 | % | | | 30.68 | % | | | (1.41 | )% |
| | | | | | | | | | | | | | | | | | | | | | | | | | | | | |
RATIOS / SUPPLEMENTAL DATA | | | | | | | | | | | | | | | | | | | | | | | | | | | | |
Net assets, end of year or period (000s) | | $ | 2,631 | | | $ | 2,376 | | | $ | 2,484 | | | $ | 1,487 | | | $ | 1,512 | | | $ | 2,119 | | | $ | 2,542 | |
Ratio of expenses to average net assets: | | | | | | | | | | | | | | | | | | | | | | | | | | | | |
Before expense reimbursements | | | 1.60 | %(e) | | | 1.56 | %(e) | | | 2.17 | % | | | 2.24 | % | | | 1.98 | % | | | 2.05 | % | | | 2.12 | % |
After expense reimbursements(f) | | | 1.60 | %(e) | | | 1.56 | %(e) | | | 1.80 | % | | | 1.75 | % | | | 1.75 | % | | | 1.75 | % | | | 1.75 | % |
Ratio of net investment income/(loss) to average net assets | | | | | | | | | | | | | | | | | | | | | | | | | | | | |
Before expense reimbursements | | | (0.70 | )%(e) | | | (0.68 | )%(e) | | | (0.41 | )% | | | 0.06 | % | | | (0.13 | )% | | | (0.37 | )% | | | 0.26 | % |
After expense reimbursements | | | (0.70 | )%(e) | | | (0.68 | )%(e) | | | (0.05 | )% | | | 0.55 | % | | | 0.10 | % | | | (0.07 | )% | | | 0.63 | % |
Portfolio turnover | | | 21 | %(d) | | | 14 | %(d) | | | 82 | % | | | 28 | % | | | 44 | % | | | 68 | % | | | 49 | % |
(a) | Formerly Named ICON Financials Fund (see Note 7). |
(b) | Information prior to the reorganization date of July 10, 2020 is that of the accounting and performance survivor, ICON Financials Fund - Class S (see Note 7). |
(c) | Calculated based upon average shares outstanding. |
(f) | Effective for the year ended September 30, 2020, CCO Fees and reorganization costs are not included in the expense limitation. For all years presented, interest expense, when applicable, is not included in the expense limitation. |
(g) | Information prior to the reorganization date of July 10, 2020 is that of the accounting and performance survivor, ICON Financials Fund - Class A (see Note 7). |
(h) | The total return calculation excludes any sales charges. |
See accompanying notes to financial statements.
25
Financial Highlights For a Share Outstanding Throughout Each Year or Period
(Continued) |
Icon Equity Fund(a) | | | | | | | | | | | | | | | | |
Institutional Shares(b) | | Period Ended
June 30,
2021
(Unaudited) | | | Period Ended
December 31,
2020 | | | Year Ended
September 30,
2020 | | | Year Ended
September 30,
2019 | | | Year Ended
September 30,
2018 | | | Year Ended
September 30,
2017 | | | Year Ended
September 30,
2016 | |
Net asset value, beginning of year | | $ | 33.57 | | | $ | 28.07 | | | $ | 26.83 | | | $ | 27.11 | | | $ | 25.13 | | | $ | 18.70 | | | $ | 18.39 | |
INCOME FROM INVESTMENT OPERATIONS | | | | | | | | | | | | | | | | | | | | | | | | |
Net investment income/(loss)(c) | | | (0.05 | ) | | | (0.02 | ) | | | (0.03 | ) | | | (0.02 | ) | | | (0.06 | ) | | | (0.04 | ) | | | 0.04 | |
Net gain/(loss) on securities (both realized and unrealized) | | | 6.92 | | | | 5.52 | | | | 2.27 | | | | 0.09 | | | | 2.04 | | | | 6.47 | | | | 0.27 | |
Total from investment operations | | | 6.87 | | | | 5.50 | | | | 2.24 | | | | 0.07 | | | | 1.98 | | | | 6.43 | | | | 0.31 | |
LESS DISTRIBUTIONS | | | | | | | | | | | | | | | | | | | | | | | | | | | | |
Distributions from capital gains | | | — | | | | — | | | | (1.00 | ) | | | (0.35 | ) | | | — | | | | — | | | | — | |
Total distributions | | | — | | | | — | | | | (1.00 | ) | | | (0.35 | ) | | | — | | | | — | | | | — | |
Net asset value, end of year or period | | $ | 40.44 | | | $ | 33.57 | | | $ | 28.07 | | | $ | 26.83 | | | $ | 27.11 | | | $ | 25.13 | | | $ | 18.70 | |
| | | | | | | | | | | | | | | | | | | | | | | | | | | | | |
Total return | | | 20.46 | %(d) | | | 19.59 | %(d) | | | 8.27 | % | | | 0.56 | % | | | 7.88 | % | | | 34.39 | % | | | 1.69 | % |
| | | | | | | | | | | | | | | | | | | | | | | | | | | | | |
RATIOS / SUPPLEMENTAL DATA | | | | | | | | | | | | | | | | | | | | | | | | | | | | |
Net assets, end of year or period (000s) | | $ | 56,981 | | | $ | 49,362 | | | $ | 45,176 | | | $ | 12,764 | | | $ | 18,580 | | | $ | 11,259 | | | $ | 7,114 | |
Ratio of expenses to average net assets: | | | | | | | | | | | | | | | | | | | | | | | | | | | | |
Before expense reimbursements | | | 1.10 | %(e) | | | 1.10 | %(e) | | | 1.35 | % | | | 1.53 | % | | | 1.38 | % | | | 1.50 | % | | | 1.63 | % |
After expense reimbursements(f) | | | 1.10 | %(e) | | | 1.10 | %(e) | | | 1.22 | % | | | 1.25 | % | | | 1.25 | % | | | 1.25 | % | | | 1.28 | % |
Ratio of net investment income/(loss) to average net assets | | | | | | | | | | | | | | | | | | | | | | | | | | | | |
Before expense reimbursements | | | (0.26 | )%(e) | | | (0.28 | )%(e) | | | (0.23 | )% | | | (0.36 | )% | | | (0.33 | )% | | | (0.43 | )% | | | (0.11 | )% |
After expense reimbursements | | | (0.26 | )%(e) | | | (0.28 | )%(e) | | | (0.10 | )% | | | (0.08 | )% | | | (0.20 | )% | | | (0.18 | )% | | | 0.24 | % |
Portfolio turnover | | | 17 | %(d) | | | 14 | %(d) | | | 65 | % | | | 31 | % | | | 36 | % | | | 24 | % | | | 20 | % |
Icon Equity Fund(a) | | | | | | | | | | | | | | | | |
Investor Shares(g) | | Period Ended
June 30,
2021
(Unaudited) | | | Period Ended
December 31,
2020 | | | Year Ended
September 30,
2020 | | | Year Ended
September 30,
2019 | | | Year Ended
September 30,
2018 | | | Year Ended
September 30,
2017 | | | Year Ended
September 30,
2016 | |
Net asset value, beginning of year | | $ | 32.14 | | | $ | 26.89 | | | $ | 25.81 | | | $ | 26.16 | | | $ | 24.33 | | | $ | 18.16 | | | $ | 17.91 | |
INCOME FROM INVESTMENT OPERATIONS | | | | | | | | | | | | | | | | | | | | | | | | |
Net investment income/(loss)(c) | | | (0.09 | ) | | | (0.04 | ) | | | (0.09 | ) | | | (0.09 | ) | | | (0.14 | ) | | | (0.11 | ) | | | (0.01 | ) |
Net gain/(loss) on securities (both realized and unrealized) | | | 6.62 | | | | 5.29 | | | | 2.17 | | | | 0.09 | | | | 1.97 | | | | 6.28 | | | | 0.26 | |
Total from investment operations | | | 6.53 | | | | 5.25 | | | | 2.08 | | | | — | | | | 1.83 | | | | 6.17 | | | | 0.25 | |
LESS DISTRIBUTIONS | | | | | | | | | | | | | | | | | | | | | | | | | | | | |
Distributions from capital gains | | | — | | | | — | | | | (1.00 | ) | | | (0.35 | ) | | | — | | | | — | | | | — | |
Total distributions | | | — | | | | — | | | | (1.00 | ) | | | (0.35 | ) | | | — | | | | — | | | | — | |
Net asset value, end of year or period | | $ | 38.67 | | | $ | 32.14 | | | $ | 26.89 | | | $ | 25.81 | | | $ | 26.16 | | | $ | 24.33 | | | $ | 18.16 | |
| | | | | | | | | | | | | | | | | | | | | | | | | | | | | |
Total return(h) | | | 20.32 | %(d) | | | 19.52 | %(d) | | | 7.97 | % | | | 0.31 | % | | | 7.52 | % | | | 33.98 | % | | | 1.40 | % |
| | | | | | | | | | | | | | | | | | | | | | | | | | | | | |
RATIOS / SUPPLEMENTAL DATA | | | | | | | | | | | | | | | | | | | | | | | | | | | | |
Net assets, end of year or period (000s) | | $ | 23,587 | | | $ | 20,910 | | | $ | 19,080 | | | $ | 4,894 | | | $ | 5,351 | | | $ | 7,003 | | | $ | 5,316 | |
Ratio of expenses to average net assets: | | | | | | | | | | | | | | | | | | | | | | | | | | | | |
Before expense reimbursements | | | 1.34 | %(d) | | | 1.35 | %(d) | | | 1.67 | % | | | 2.08 | % | | | 1.83 | % | | | 1.93 | % | | | 1.95 | % |
After expense reimbursements(f) | | | 1.34 | %(d) | | | 1.35 | %(d) | | | 1.46 | % | | | 1.55 | % | | | 1.55 | % | | | 1.55 | % | | | 1.58 | % |
Ratio of net investment income/(loss) to average net assets | | | | | | | | | | | | | | | | | | | | | | | | | | | | |
Before expense reimbursements | | | (0.50 | )%(e) | | | (0.52 | )%(e) | | | (0.54 | )% | | | (0.92 | )% | | | (0.80 | )% | | | (0.87 | )% | | | (0.40 | )% |
After expense reimbursements | | | (0.50 | )%(e) | | | (0.52 | )%(e) | | | (0.34 | )% | | | (0.39 | )% | | | (0.52 | )% | | | (0.49 | )% | | | (0.03 | )% |
Portfolio turnover | | | 17 | %(d) | | | 14 | %(d) | | | 65 | % | | | 31 | % | | | 36 | % | | | 24 | % | | | 20 | % |
(a) | Formerly named ICON Long/Short Fund (see Note 7). |
(b) | Information prior to the reorganization date of July 10, 2020 is that of the accounting and performance survivor, ICON Long/Short Fund - Class S (see Note 7). |
(c) | Calculated based upon average shares outstanding. |
(f) | Effective for the year ended September 30, 2020, CCO Fees and reorganization costs are not included in the expense limitation. For all years presented, interest expense, when applicable, is not included in the expense limitation. |
(g) | Information prior to the reorganization date of July 10, 2020 is that of the accounting and performance survivor, ICON Long/Short Fund - Class A (see Note 7). |
(h) | The total return calculation excludes any sales charges. |
See accompanying notes to financial statements.
26
Financial Highlights For a Share Outstanding Throughout Each Year or Period
(Continued) |
Icon Equity Income Fund | | | | | | | | | | | | | | | | | | | | | | | | | | | | |
Institutional Shares(a) | | Period Ended
June 30,
2021
(Unaudited) | | | Period Ended
December 31,
2020 | | | Year Ended
September 30,
2020 | | | Year Ended
September 30,
2019 | | | Year Ended
September 30,
2018 | | | Year Ended
September 30,
2017 | | | Year Ended
September 30,
2016 | |
Net asset value, beginning of year | | $ | 18.89 | | | $ | 16.44 | | | $ | 18.00 | | | $ | 17.96 | | | $ | 17.61 | | | $ | 15.62 | | | $ | 14.36 | |
INCOME FROM INVESTMENT OPERATIONS | | | | | | | | | | | | | | | | | | | | | | | | |
Net investment income/(loss)(b) | | | 0.20 | | | | 0.12 | | | | 0.43 | | | | 0.50 | | | | 0.53 | | | | 0.61 | | | | 0.60 | |
Net gain/(loss) on securities (both realized and unrealized) | | | 3.44 | | | | 2.72 | | | | (1.12 | ) | | | 0.09 | | | | 0.38 | | | | 1.95 | | | | 1.27 | |
Total from investment operations | | | 3.64 | | | | 2.84 | | | | (0.69 | ) | | | 0.59 | | | | 0.91 | | | | 2.56 | | | | 1.87 | |
LESS DISTRIBUTIONS | | | | | | | | | | | | | | | | | | | | | | | | | | | | |
Dividends from net investment income | | | (0.21 | ) | | | (0.39 | ) | | | (0.58 | ) | | | (0.53 | ) | | | (0.56 | ) | | | (0.57 | ) | | | (0.61 | ) |
Distributions from capital gains | | | — | | | | — | | | | (0.29 | ) | | | (0.02 | ) | | | — | | | | — | | | | — | |
Total distributions | | | (0.21 | ) | | | (0.39 | ) | | | (0.87 | ) | | | (0.55 | ) | | | (0.56 | ) | | | (0.57 | ) | | | (0.61 | ) |
Net asset value, end of year or period | | $ | 22.32 | | | $ | 18.89 | | | $ | 16.44 | | | $ | 18.00 | | | $ | 17.96 | | | $ | 17.61 | | | $ | 15.62 | |
| | | | | | | | | | | | | | | | | | | | | | | | | | | | | |
Total return | | | 19.28 | %(c) | | | 17.25 | %(c) | | | (4.03 | )% | | | 3.45 | % | | | 5.19 | % | | | 16.53 | % | | | 13.30 | % |
| | | | | | | | | | | | | | | | | | | | | | | | | | | | | |
RATIOS / SUPPLEMENTAL DATA | | | | | | | | | | | | | | | | | | | | | | | | | | | | |
Net assets, end of year or period (000s) | | $ | 47,459 | | | $ | 44,345 | | | $ | 42,624 | | | $ | 51,853 | | | $ | 51,185 | | | $ | 57,062 | | | $ | 37,868 | |
Ratio of expenses to average net assets: | | | | | | | | | | | | | | | | | | | | | | | | | | | | |
Before expense reimbursements | | | 1.08 | %(d) | | | 1.06 | %(d) | | | 1.30 | % | | | 1.21 | % | | | 1.16 | % | | | 1.15 | % | | | 1.24 | % |
After expense reimbursements(e) | | | 1.00 | %(d) | | | 1.00 | %(d) | | | 1.05 | % | | | 0.99 | % | | | 0.99 | % | | | 1.05 | %(e) | | | 1.20 | % |
Ratio of net investment income/(loss) to average net assets | | | | | | | | | | | | | | | | | | | | | | | | | | | | |
Before expense reimbursements | | | 1.78 | %(d) | | | 2.66 | %(d) | | | 2.28 | % | | | 2.66 | % | | | 2.76 | % | | | 3.50 | % | | | 3.91 | % |
After expense reimbursements | | | 1.88 | %(d) | | | 2.72 | %(d) | | | 2.53 | % | | | 2.88 | % | | | 2.93 | % | | | 3.60 | % | | | 3.95 | % |
Portfolio turnover | | | 26 | %(c) | | | 7 | %(c) | | | 78 | % | | | 117 | % | | | 171 | % | | | 206 | % | | | 145 | % |
Icon Equity Income Fund | | | | | | | | | | | | | | | | | | | | | | | | | | | | |
Investor Shares(g) | | Period Ended
June 30,
2021
(Unaudited) | | | Period Ended
December 31,
2020 | | | Year Ended
September 30,
2020 | | | Year Ended
September 30,
2019 | | | Year Ended
September 30,
2018 | | | Year Ended
September 30,
2017 | | | Year Ended
September 30,
2016 | |
Net asset value, beginning of year | | $ | 18.87 | | | $ | 16.42 | | | $ | 17.96 | | | $ | 17.92 | | | $ | 17.56 | | | $ | 15.58 | | | $ | 14.29 | |
INCOME FROM INVESTMENT OPERATIONS | | | | | | | | | | | | | | | | | | | | | | | | |
Net investment income/(loss)(b) | | | 0.17 | | | | 0.11 | | | | 0.38 | | | | 0.46 | | | | 0.49 | | | | 0.54 | | | | 0.56 | |
Net gain/(loss) on securities (both realized and unrealized) | | | 3.44 | | | | 2.72 | | | | (1.12 | ) | | | 0.08 | | | | 0.38 | | | | 1.96 | | | | 1.26 | |
Total from investment operations | | | 3.61 | | | | 2.83 | | | | (0.74 | ) | | | 0.54 | | | | 0.87 | | | | 2.50 | | | | 1.82 | |
LESS DISTRIBUTIONS | | | | | | | | | | | | | | | | | | | | | | | | | | | | |
Dividends from net investment income | | | (0.18 | ) | | | (0.38 | ) | | | (0.51 | ) | | | (0.48 | ) | | | (0.51 | ) | | | (0.52 | ) | | | (0.53 | ) |
Distributions from capital gains | | | — | | | | — | | | | (0.29 | ) | | | (0.02 | ) | | | — | | | | — | | | | — | |
Total distributions | | | (0.18 | ) | | | (0.38 | ) | | | (0.80 | ) | | | (0.50 | ) | | | (0.51 | ) | | | (0.52 | ) | | | (0.53 | ) |
Net asset value, end of year or period | | $ | 22.30 | | | $ | 18.87 | | | $ | 16.42 | | | $ | 17.96 | | | $ | 17.92 | | | $ | 17.56 | | | $ | 15.58 | |
| | | | | | | | | | | | | | | | | | | | | | | | | | | | | |
Total return(h) | | | 19.14 | %(c) | | | 17.21 | %(c) | | | (4.33 | )% | | | 3.20 | % | | | 4.98 | % | | | 16.20 | % | | | 12.97 | % |
| | | | | | | | | | | | | | | | | | | | | | | | | | | | | |
RATIOS / SUPPLEMENTAL DATA | | | | | | | | | | | | | | | | | | | | | | | | | | | | |
Net assets, end of year or period (000s) | | $ | 40,255 | | | $ | 37,752 | | | $ | 37,563 | | | $ | 10,852 | | | $ | 10,685 | | | $ | 14,206 | | | $ | 16,775 | |
Ratio of expenses to average net assets: | | | | | | | | | | | | | | | | | | | | | | | | | | | | |
Before expense reimbursements | | | 1.34 | %(d) | | | 1.31 | %(d) | | | 1.50 | % | | | 1.50 | % | | | 1.45 | % | | | 1.45 | % | | | 1.54 | % |
After expense reimbursements(e) | | | 1.24 | %(d) | | | 1.35 | %(d) | | | 1.29 | % | | | 1.24 | % | | | 1.24 | % | | | 1.31 | %(i) | | | 1.45 | % |
Ratio of net investment income/(loss) to average net assets | | | | | | | | | | | | | | | | | | | | | | | | | | | | |
Before expense reimbursements | | | 1.52 | %(d) | | | 2.41 | %(d) | | | 2.07 | % | | | 2.38 | % | | | 2.48 | % | | | 3.06 | % | | | 3.64 | % |
After expense reimbursements | | | 1.62 | %(d) | | | 2.46 | %(d) | | | 2.29 | % | | | 2.64 | % | | | 2.69 | % | | | 3.20 | % | | | 3.73 | % |
Portfolio turnover | | | 26 | %(c) | | | 7 | %(c) | | | 78 | % | | | 117 | % | | | 171 | % | | | 206 | % | | | 145 | % |
(a) | Formerly named ICON Equity Income Fund - Class S (see Note 7). |
(b) | Calculated based upon average shares outstanding. |
(e) | Effective for the year ended September 30, 2020, CCO Fees and reorganization costs are not included in the expense limitation. For all years presented, interest expense, when applicable, is not included in the expense limitation. |
(f) | Effective January 26, 2017, the annual expense limitation rate changed from 1.20% to 0.99%. |
(g) | Formerly named ICON Equity Income Fund - Class A (see Note 7). |
(h) | The total return calculation excludes any sales charges. |
(i) | Effective January 26, 2017, the annual expense limitation rate changed from 1.45% to 1.24%. |
See accompanying notes to financial statements.
27
Financial Highlights For a Share Outstanding Throughout Each Year or Period
(Continued) |
Icon Flexible Bond Fund | | | | | | | | | | | | | | | | |
Institutional Shares(a) | | Period Ended
June 30,
2021
(Unaudited) | | | Period Ended
December 31,
2020 | | | Year Ended
September 30,
2020 | | | Year Ended
September 30,
2019 | | | Year Ended
September 30,
2018(b) | | | Year Ended
September 30,
2017 | | | Year Ended
September 30,
2016 | |
Net asset value, beginning of year | | $ | 9.39 | | | $ | 9.07 | | | $ | 9.36 | | | $ | 9.26 | | | $ | 9.43 | | | $ | 9.55 | | | $ | 9.20 | |
INCOME FROM INVESTMENT OPERATIONS | | | | | | | | | | | | | | | | | | | | | | | | |
Net investment income/(loss)(c) | | | 0.21 | | | | 0.10 | | | | 0.40 | | | | 0.36 | | | | 0.36 | | | | 0.37 | | | | 0.34 | |
Net gain/(loss) on securities (both realized and unrealized) | | | 0.10 | | | | 0.31 | | | | (0.28 | ) | | | 0.18 | | | | (0.19 | ) | | | (0.11 | ) | | | 0.34 | |
Total from investment operations | | | 0.31 | | | | 0.41 | | | | 0.12 | | | | 0.54 | | | | 0.17 | | | | 0.26 | | | | 0.68 | |
LESS DISTRIBUTIONS | | | | | | | | | | | | | | | | | | | | | | | | | | | | |
Dividends from net investment income | | | (0.19 | ) | | | (0.09 | ) | | | (0.41 | ) | | | (0.44 | ) | | | (0.34 | ) | | | (0.38 | ) | | | (0.33 | ) |
Distributions from capital gains | | | — | | | | — | | | | — | | | | — | | | | — | | | | — | | | | — | |
Total distributions | | | (0.19 | ) | | | (0.09 | ) | | | (0.41 | ) | | | (0.44 | ) | | | (0.34 | ) | | | (0.38 | ) | | | (0.33 | ) |
Net asset value, end of year or period | | $ | 9.51 | | | $ | 9.39 | | | $ | 9.07 | | | $ | 9.36 | | | $ | 9.26 | | | $ | 9.43 | | | $ | 9.55 | |
| | | | | | | | | | | | | | | | | | | | | | | | | | | | | |
Total return | | | 3.38 | %(d) | | | 4.52 | %(d) | | | 1.32 | % | | | 6.02 | % | | | 1.89 | % | | | 2.82 | % | | | 7.54 | % |
| | | | | | | | | | | | | | | | | | | | | | | | | | | | | |
RATIOS / SUPPLEMENTAL DATA | | | | | | | | | | | | | | | | | | | | | | | | | | | | |
Net assets, end of year or period (000s) | | $ | 135,154 | | | $ | 131,094 | | | $ | 141,158 | | | $ | 143,633 | | | $ | 97,303 | | | $ | 80,467 | | | $ | 76,656 | |
Ratio of expenses to average net assets: | | | | | | | | | | | | | | | | | | | | | | | | | | | | |
Before expense reimbursements | | | 0.90 | %(e) | | | 0.86 | %(e) | | | 1.01 | % | | | 0.96 | % | | | 0.92 | % | | | 0.91 | % | | | 0.93 | % |
After expense reimbursements(f) | | | 0.76 | %(e) | | | 0.76 | %(e) | | | 0.80 | % | | | 0.75 | % | | | 0.75 | % | | | 0.75 | % | | | 0.75 | % |
Ratio of net investment income/(loss) to average net assets | | | | | | | | | | | | | | | | | | | | | | | | | | | | |
Before expense reimbursements | | | 4.30 | %(e) | | | 4.38 | %(e) | | | 4.20 | % | | | 3.70 | % | | | 3.65 | % | | | 3.80 | % | | | 3.43 | % |
After expense reimbursements | | | 4.44 | %(e) | | | 4.48 | %(e) | | | 4.41 | % | | | 3.91 | % | | | 3.82 | % | | | 3.96 | % | | | 3.61 | % |
Portfolio turnover | | | 129 | %(d) | | | 29 | %(d) | | | 133 | % | | | 144 | % | | | 153 | % | | | 169 | % | | | 141 | % |
Icon Flexible Bond Fund | | | | | | | | | | | | | | | | |
Investor Shares(g) | | Period Ended
June 30,
2021
(Unaudited) | | | Period Ended
December 31,
2020 | | | Year Ended
September 30,
2020 | | | Year Ended
September 30,
2019 | | | Year Ended
September 30,
2018(b) | | | Year Ended
September 30,
2017 | | | Year Ended
September 30,
2016 | |
Net asset value, beginning of year | | $ | 9.33 | | | $ | 9.02 | | | $ | 9.31 | | | $ | 9.21 | | | $ | 9.39 | | | $ | 9.51 | | | $ | 9.17 | |
INCOME FROM INVESTMENT OPERATIONS | | | | | | | | | | | | | | | | | | | | | | | | |
Net investment income/(loss)(c) | | | 0.20 | | | | 0.10 | | | | 0.38 | | | | 0.34 | | | | 0.33 | | | | 0.33 | | | | 0.31 | |
Net gain/(loss) on securities (both realized and unrealized) | | | 0.10 | | | | 0.29 | | | | (0.28 | ) | | | 0.18 | | | | (0.19 | ) | | | (0.10 | ) | | | 0.34 | |
Total from investment operations | | | 0.30 | | | | 0.39 | | | | 0.10 | | | | 0.52 | | | | 0.14 | | | | 0.23 | | | | 0.65 | |
LESS DISTRIBUTIONS | | | | | | | | | | | | | | | | | | | | | | | | | | | | |
Dividends from net investment income | | | (0.18 | ) | | | (0.08 | ) | | | (0.39 | ) | | | (0.42 | ) | | | (0.32 | ) | | | (0.35 | ) | | | (0.31 | ) |
Distributions from capital gains | | | — | | | | — | | | | — | | | | — | | | | — | | | | — | | | | — | |
Total distributions | | | (0.18 | ) | | | (0.08 | ) | | | (0.39 | ) | | | (0.42 | ) | | | (0.32 | ) | | | (0.35 | ) | | | (0.31 | ) |
Net asset value, end of year or period | | $ | 9.45 | | | $ | 9.33 | | | $ | 9.02 | | | $ | 9.31 | | | $ | 9.21 | | | $ | 9.39 | | | $ | 9.51 | |
| | | | | | | | | | | | | | | | | | | | | | | | | | | | | |
Total return(h) | | | 3.27 | %(c) | | | 4.36 | %(c) | | | 1.12 | % | | | 5.76 | % | | | 1.55 | % | | | 2.48 | % | | | 7.25 | % |
| | | | | | | | | | | | | | | | | | | | | | | | | | | | | |
RATIOS / SUPPLEMENTAL DATA | | | | | | | | | | | | | | | | | | | | | | | | | | | | |
Net assets, end of year or period (000s) | | $ | 9,897 | | | $ | 10,667 | | | $ | 10,661 | | | $ | 5,733 | | | $ | 3,685 | | | $ | 3,859 | | | $ | 6,100 | |
Ratio of expenses to average net assets: | | | | | | | | | | | | | | | | | | | | | | | | | | | | |
Before expense reimbursements | | | 1.14 | %(e) | | | 1.11 | %(e) | | | 1.32 | % | | | 1.39 | % | | | 1.45 | % | | | 1.41 | % | | | 1.38 | % |
After expense reimbursements(f) | | | 1.00 | %(e) | | | 1.11 | %(e) | | | 1.05 | % | | | 1.00 | % | | | 1.00 | % | | | 1.00 | % | | | 1.00 | % |
Ratio of net investment income/(loss) to average net assets | | | | | | | | | | | | | | | | | | | | | | | | | | | | |
Before expense reimbursements | | | 4.04 | %(e) | | | 4.13 | %(e) | | | 3.90 | % | | | 3.29 | % | | | 3.13 | % | | | 3.13 | % | | | 2.98 | % |
After expense reimbursements | | | 4.18 | %(e) | | | 4.23 | %(e) | | | 4.17 | % | | | 3.68 | % | | | 3.58 | % | | | 3.54 | % | | | 3.36 | % |
Portfolio turnover | | | 129 | %(d) | | | 29 | %(d) | | | 133 | % | | | 144 | % | | | 153 | % | | | 169 | % | | | 141 | % |
(a) | Formerly named ICON Flexible Bond Fund - Class S (see Note 7). |
(b) | Prior to January 23, 2018, the ICON Flexible Bond Fund was known as the ICON Bond Fund. |
(c) | Calculated based upon average shares outstanding. |
(f) | Effective for the year ended September 30, 2020, CCO Fees and reorganization costs are not included in the expense limitation. For all years presented, interest expense, when applicable, is not included in the expense limitation. |
(g) | Formerly named ICON Flexible Bond Fund - Class A (see Note 7). |
(h) | The total return calculation excludes any sales charges. |
See accompanying notes to financial statements.
28
Financial Highlights For a Share Outstanding Throughout Each Year or Period
(Continued) |
Icon Health & Information Technology Fund(a) | | | | | | | | | | | | | | | | |
Institutional Shares(b) | | Period Ended
June 30,
2021
(Unaudited) | | | Period Ended
December 31,
2020 | | | Year Ended
September 30,
2020 | | | Year Ended
September 30,
2019 | | | Year Ended
September 30,
2018 | | | Year Ended
September 30,
2017 | | | Year Ended
September 30,
2016 | |
Net asset value, beginning of year | | $ | 21.45 | | | $ | 18.75 | | | $ | 15.46 | | | $ | 17.19 | | | $ | 19.14 | | | $ | 17.96 | | | $ | 14.95 | |
INCOME FROM INVESTMENT OPERATIONS | | | | | | | | | | | | | | | | | | | | | | | | |
Net investment income/(loss)(c) | | | (0.06 | ) | | | (0.03 | ) | | | (0.09 | ) | | | (0.04 | ) | | | (0.10 | ) | | | (0.10 | ) | | | (0.07 | ) |
Net gain/(loss) on securities (both realized and unrealized) | | | 2.81 | | | | 3.47 | | | | 4.10 | | | | 0.35 | | | | 2.09 | | | | 4.53 | | | | 3.08 | |
Total from investment operations | | | 2.75 | | | | 3.44 | | | | 4.01 | | | | 0.31 | | | | 1.99 | | | | 4.43 | | | | 3.01 | |
LESS DISTRIBUTIONS | | | | | | | | | | | | | | | | | | | | | | | | | | | | |
Dividends from net investment income | | | — | | | | — | | | | — | | | | — | | | | (0.08 | ) | | | — | | | | — | |
Distributions from capital gains | | | — | | | | (0.74 | ) | | | (0.72 | ) | | | (2.04 | ) | | | (3.86 | ) | | | (3.25 | ) | | | — | |
Total distributions | | | — | | | | (0.74 | ) | | | (0.72 | ) | | | (2.04 | ) | | | (3.94 | ) | | | (3.25 | ) | | | — | |
Net asset value, end of year or period | | $ | 24.20 | | | $ | 21.45 | | | $ | 18.75 | | | $ | 15.46 | | | $ | 17.19 | | | $ | 19.14 | | | $ | 17.96 | |
| | | | | | | | | | | | | | | | | | | | | | | | | | | | | |
Total return | | | 12.82 | %(d) | | | 18.59 | %(d) | | | 26.59 | % | | | 5.12 | % | | | 11.82 | % | | | 29.46 | % | | | 20.13 | % |
| | | | | | | | | | | | | | | | | | | | | | | | | | | | | |
RATIOS / SUPPLEMENTAL DATA | | | | | | | | | | | | | | | | | | | | | | | | | | | | |
Net assets, end of year or period (000s) | | $ | 126,936 | | | $ | 125,057 | | | $ | 109,619 | | | $ | 54,263 | | | $ | 61,474 | | | $ | 71,249 | | | $ | 48,953 | |
Ratio of expenses to average net assets: | | | | | | | | | | | | | | | | | | | | | | | | | | | | |
Before expense reimbursements | | | 1.26 | %(e) | | | 1.29 | %(e) | | | 1.46 | % | | | 1.49 | % | | | 1.41 | % | | | 1.42 | % | | | 1.49 | % |
After expense reimbursements(f) | | | 1.26 | %(e) | | | 1.29 | %(e) | | | 1.46 | % | | | 1.49 | % | | | 1.41 | % | | | 1.42 | % | | | 1.49 | % |
Ratio of net investment income/(loss) to average net assets | | | | | | | | | | | | | | | | | | | | | | | | | | | | |
Before expense reimbursements | | | (0.56 | )%(e) | | | (0.53 | )%(e) | | | (0.54 | )% | | | (0.25 | )% | | | (0.60 | )% | | | (0.58 | )% | | | (0.46 | )% |
After expense reimbursements | | | (0.56 | )%(e) | | | (0.53 | )%(e) | | | (0.54 | )% | | | (0.25 | )% | | | (0.60 | )% | | | (0.58 | )% | | | (0.46 | )% |
Portfolio turnover | | | 26 | %(d) | | | 13 | %(d) | | | 67 | % | | | 92 | % | | | 98 | % | | | 116 | % | | | 94 | % |
Icon Health & Information Technology Fund(a) | | | | | | | | | | | | | | | | |
Investor Shares(g) | | Period Ended
June 30,
2021
(Unaudited) | | | Period Ended
December 31,
2020 | | | Year Ended
September 30,
2020 | | | Year Ended
September 30,
2019 | | | Year Ended
September 30,
2018 | | | Year Ended
September 30,
2017 | | | Year Ended
September 30,
2016 | |
Net asset value, beginning of year | | $ | 20.31 | | | $ | 17.80 | | | $ | 14.74 | | | $ | 16.55 | | | $ | 18.55 | | | $ | 17.55 | | | $ | 14.65 | |
INCOME FROM INVESTMENT OPERATIONS | | | | | | | | | | | | | | | | | | | | | | | | |
Net investment income/(loss)(c) | | | (0.09 | ) | | | (0.04 | ) | | | (0.13 | ) | | | (0.07 | ) | | | (0.16 | ) | | | (0.15 | ) | | | (0.11 | ) |
Net gain/(loss) on securities (both realized and unrealized) | | | 2.66 | | | | 3.29 | | | | 3.91 | | | | 0.30 | | | | 2.02 | | | | 4.40 | | | | 3.01 | |
Total from investment operations | | | 2.57 | | | | 3.25 | | | | 3.78 | | | | 0.23 | | | | 1.86 | | | | 4.25 | | | | 2.90 | |
LESS DISTRIBUTIONS | | | | | | | | | | | | | | | | | | | | | | | | | | | | |
Dividends from net investment income | | | — | | | | — | | | | — | | | | — | | | | (0.00 | )(h) | | | — | | | | — | |
Distributions from capital gains | | | — | | | | (0.74 | ) | | | (0.72 | ) | | | (2.04 | ) | | | (3.86 | ) | | | (3.25 | ) | | | — | |
Total distributions | | | — | | | | (0.74 | ) | | | (0.72 | ) | | | (2.04 | ) | | | (3.86 | ) | | | (3.25 | ) | | | — | |
Net asset value, end of year or period | | $ | 22.88 | | | $ | 20.31 | | | $ | 17.80 | | | $ | 14.74 | | | $ | 16.55 | | | $ | 18.55 | | | $ | 17.55 | |
| | | | | | | | | | | | | | | | | | | | | | | | | | | | | |
Total return(i) | | | 12.65 | %(d) | | | 18.52 | %(d) | | | 26.31 | % | | | 4.79 | % | | | 11.43 | % | | | 29.08 | % | | | 19.80 | % |
| | | | | | | | | | | | | | | | | | | | | | | | | | | | | |
RATIOS / SUPPLEMENTAL DATA | | | | | | | | | | | | | | | | | | | | | | | | | | | | |
Net assets, end of year or period (000s) | | $ | 3,268 | | | $ | 3,199 | | | $ | 2,948 | | | $ | 1,463 | | | $ | 2,101 | | | $ | 2,836 | | | $ | 2,631 | |
Ratio of expenses to average net assets: | | | | | | | | | | | | | | | | | | | | | | | | | | | | |
Before expense reimbursements | | | 1.50 | %(e) | | | 1.54 | %(e) | | | 2.13 | % | | | 2.30 | % | | | 2.00 | % | | | 2.01 | % | | | 2.17 | % |
After expense reimbursements(f) | | | 1.50 | %(e) | | | 1.54 | %(e) | | | 1.76 | % | | | 1.75 | % | | | 1.75 | % | | | 1.75 | % | | | 1.75 | % |
Ratio of net investment income/(loss) to average net assets | | | | | | | | | | | | | | | | | | | | | | | | | | | | |
Before expense reimbursements | | | (0.80 | )%(e) | | | (0.76 | )%(e) | | | (1.21 | )% | | | (1.05 | )% | | | (1.20 | )% | | | (1.16 | )% | | | (1.12 | )% |
After expense reimbursements | | | (0.80 | )%(e) | | | (0.76 | )%(e) | | | (0.83 | )% | | | (0.50 | )% | | | (0.95 | )% | | | (0.90 | )% | | | (0.70 | )% |
Portfolio turnover | | | 26 | %(d) | | | 13 | %(d) | | | 67 | % | | | 92 | % | | | 98 | % | | | 116 | % | | | 94 | % |
(a) | Formerly named ICON Information Technology Fund (see Note 7). |
(b) | Information prior to the reorganization date of July 10, 2020 is that of the accounting and performance survivor, ICON Information Technology Fund - Class S (see Note 7). |
(c) | Calculated based upon average shares outstanding. |
(f) | Effective for the year ended September 30, 2020, CCO Fees and reorganization costs are not included in the expense limitation. For all years presented, interest expense, when applicable, is not included in the expense limitation. |
(g) | Information prior to the reorganization date of July 10, 2020 is that of the accounting and performance survivor, ICON Information Technology Fund - Class A (see Note 7). |
(h) | Amount less than $(0.005). |
(i) | The total return calculation excludes any sales charges. |
See accompanying notes to financial statements.
29
Financial Highlights For a Share Outstanding Throughout Each Year or Period
(Continued) |
Icon Natural Resources and Infrastructure Fund(a) | | | | | | | | | | | | | | | | |
Institutional Shares(b) | | Period Ended
June 30,
2021
(Unaudited) | | | Period Ended
December 31,
2020 | | | Year Ended
September 30,
2020 | | | Year Ended
September 30,
2019 | | | Year Ended
September 30,
2018 | | | Year Ended
September 30,
2017 | | | Year Ended
September 30,
2016(c) | |
Net asset value, beginning of year | | $ | 13.76 | | | $ | 11.78 | | | $ | 12.49 | | | $ | 16.45 | | | $ | 15.32 | | | $ | 12.82 | | | $ | 11.86 | |
INCOME FROM INVESTMENT OPERATIONS | | | | | | | | | | | | | | | | | | | | | | | | |
Net investment income/(loss)(d) | | | 0.12 | | | | 0.02 | | | | 0.08 | | | | 0.19 | | | | 0.31 | | | | 0.01 | | | | 0.10 | |
Net gain/(loss) on securities (both realized and unrealized) | | | 3.33 | | | | 2.00 | | | | (0.59 | ) | | | (1.80 | ) | | | 1.01 | | | | 2.56 | | | | 1.80 | |
Total from investment operations | | | 3.45 | | | | 2.02 | | | | (0.51 | ) | | | (1.61 | ) | | | 1.32 | | | | 2.57 | | | | 1.90 | |
LESS DISTRIBUTIONS | | | | | | | | | | | | | | | | | | | | | | | | | | | | |
Dividends from net investment income | | | — | | | | (0.04 | ) | | | (0.20 | ) | | | (0.33 | ) | | | — | | | | (0.07 | ) | | | (0.06 | ) |
Distributions from capital gains | | | — | | | | — | | | | — | | | | (2.02 | ) | | | (0.19 | ) | | | — | | | | (0.88 | ) |
Total distributions | | | — | | | | (0.04 | ) | | | (0.20 | ) | | | (2.35 | ) | | | (0.19 | ) | | | (0.07 | ) | | | (0.94 | ) |
Net asset value, end of year or period | | $ | 17.21 | | | $ | 13.76 | | | $ | 11.78 | | | $ | 12.49 | | | $ | 16.45 | | | $ | 15.32 | | | $ | 12.82 | |
| | | | | | | | | | | | | | | | | | | | | | | | | | | | | |
Total return | | | 25.07 | %(e) | | | 17.18 | %(e) | | | (4.21 | )% | | | (7.63 | )% | | | 8.68 | % | | | 20.13 | % | | | 17.24 | % |
| | | | | | | | | | | | | | | | | | | | | | | | | | | | | |
RATIOS / SUPPLEMENTAL DATA | | | | | | | | | | | | | | | | | | | | | | | | | | | | |
Net assets, end of year or period (000s) | | $ | 123,242 | | | $ | 104,241 | | | $ | 98,786 | | | $ | 55,353 | | | $ | 76,916 | | | $ | 69,444 | | | $ | 65,787 | |
Ratio of expenses to average net assets: | | | | | | | | | | | | | | | | | | | | | | | | | | | | |
Before expense reimbursements | | | 1.30 | %(f) | | | 1.35 | %(f) | | | 1.58 | % | | | 1.70 | % | | | 1.58 | % | | | 1.52 | % | | | 1.59 | % |
After expense reimbursements(g) | | | 1.30 | %(f) | | | 1.35 | %(f) | | | 1.48 | % | | | 1.50 | % | | | 1.50 | % | | | 1.50 | % | | | 1.50 | % |
Ratio of net investment income/(loss) to average net assets | | | | | | | | | | | | | | | | | | | | | | | | | | | | |
Before expense reimbursements | | | 1.48 | %(f) | | | 0.58 | %(f) | | | 0.58 | % | | | 1.33 | % | | | 1.86 | % | | | 0.06 | % | | | 0.70 | % |
After expense reimbursements | | | 1.48 | %(f) | | | (0.68 | )%(f) | | | 0.68 | % | | | 1.53 | % | | | 1.94 | % | | | 0.08 | % | | | 0.79 | % |
Portfolio turnover | | | 74 | %(e) | | | 22 | %(e) | | | 133 | % | | | 111 | % | | | 117 | % | | | 68 | % | | | 81 | % |
Icon Natural Resources and Infrastructure Fund(a) | | | | | | | | | | | | | | | | |
Investor Shares(h) | | Period Ended
June 30,
2021
(Unaudited) | | | Period Ended
December 31,
2020 | | | Year Ended
September 30,
2020 | | | Year Ended
September 30,
2019 | | | Year Ended
September 30,
2018 | | | Year Ended
September 30,
2017 | | | Year Ended
September 30,
2016(b) | |
Net asset value, beginning of year | | $ | 13.57 | | | $ | 11.64 | | | $ | 12.36 | | | $ | 16.25 | | | $ | 15.17 | | | $ | 12.73 | | | $ | 11.75 | |
INCOME FROM INVESTMENT OPERATIONS | | | | | | | | | | | | | | | | | | | | | | | | |
Net investment income/(loss)(d) | | | 0.11 | | | | 0.01 | | | | 0.05 | | | | 0.16 | | | | 0.29 | | | | (0.03 | ) | | | 0.06 | |
Net gain/(loss) on securities (both realized and unrealized) | | | 3.28 | | | | 1.96 | | | | (0.57 | ) | | | (1.78 | ) | | | 0.98 | | | | 2.54 | | | | 1.81 | |
Total from investment operations | | | 3.39 | | | | 1.97 | | | | (0.52 | ) | | | (1.62 | ) | | | 1.27 | | | | 2.51 | | | | 1.87 | |
LESS DISTRIBUTIONS | | | | | | | | | | | | | | | | | | | | | | | | | | | | |
Dividends from net investment income | | | — | | | | (0.04 | ) | | | (0.20 | ) | | | (0.25 | ) | | | — | | | | (0.07 | ) | | | (0.01 | ) |
Distributions from capital gains | | | — | | | | — | | | | — | | | | (2.02 | ) | | | (0.19 | ) | | | — | | | | (0.88 | ) |
Total distributions | | | — | | | | (0.04 | ) | | | (0.20 | ) | | | (2.27 | ) | | | (0.19 | ) | | | (0.07 | ) | | | (0.89 | ) |
Net asset value, end of year or period | | $ | 16.96 | | | $ | 13.57 | | | $ | 11.64 | | | $ | 12.36 | | | $ | 16.25 | | | $ | 15.17 | | | $ | 12.73 | |
| | | | | | | | | | | | | | | | | | | | | | | | | | | | | |
Total return(i) | | | 24.98 | %(e) | | | 16.96 | %(e) | | | (4.40 | )% | | | (7.92 | )% | | | 8.43 | % | | | 19.81 | % | | | 17.05 | % |
| | | | | | | | | | | | | | | | | | | | | | | | | | | | | |
RATIOS / SUPPLEMENTAL DATA | | | | | | | | | | | | | | | | | | | | | | | | | | | | |
Net assets, end of year or period (000s) | | $ | 7,760 | | | $ | 5,658 | | | $ | 5,001 | | | $ | 2,733 | | | $ | 4,231 | | | $ | 5,629 | | | $ | 4,451 | |
Ratio of expenses to average net assets: | | | | | | | | | | | | | | | | | | | | | | | | | | | | |
Before expense reimbursements | | | 1.56 | %(f) | | | 1.60 | %(f) | | | 2.10 | % | | | 2.19 | % | | | 1.86 | % | | | 1.91 | % | | | 2.02 | % |
After expense reimbursements(g) | | | 1.56 | %(f) | | | 1.60 | %(f) | | | 1.75 | % | | | 1.75 | % | | | 1.75 | % | | | 1.75 | % | | | 1.75 | % |
Ratio of net investment income/(loss) to average net assets | | | | | | | | | | | | | | | | | | | | | | | | | | | | |
Before expense reimbursements | | | 1.36 | %(f) | | | 0.30 | %(f) | | | 0.05 | % | | | 0.85 | % | | | 1.71 | % | | | (0.35 | )% | | | 0.24 | % |
After expense reimbursements | | | 1.36 | %(f) | | | 0.30 | %(f) | | | 0.40 | % | | | 1.29 | % | | | 1.82 | % | | | (0.19 | )% | | | 0.51 | % |
Portfolio turnover | | | 74 | %(e) | | | 22 | %(e) | | | 133 | % | | | 111 | % | | | 117 | % | | | 68 | % | | | 81 | % |
(a) | Formerly named ICON Natural Resources Fund (see Note 7). |
(b) | Information prior to the reorganization date of July 10, 2020 is that of the accounting and performance survivor, ICON Natural Resources Fund - Class S (see Note 7). |
(c) | Prior to January 22, 2016, the ICON Natural Resources Fund was known as the ICON Materials Fund. |
(d) | Calculated based upon average shares outstanding. |
(g) | Effective for the year ended September 30, 2020, CCO Fees and reorganization costs are not included in the expense limitation. For all years presented, interest expense, when applicable, is not included in the expense limitation. |
(h) | Information prior to the reorganization date of July 10, 2020 is that of the accounting and performance survivor, ICON Natural Resources Fund - Class A (see Note 7). |
(i) | The total return calculation excludes any sales charges. |
See accompanying notes to financial statements.
30
Financial Highlights For a Share Outstanding Throughout Each Year or Period
(Continued) |
Icon Utilities and Income Fund(a) | | | | | | | | | | | | | | | | | | | | | | | | | | | | |
Institutional Shares(b) | | Period Ended
June 30,
2021
(Unaudited) | | | Period Ended
December 31,
2020 | | | Year Ended
September 30,
2020 | | | Year Ended
September 30,
2019 | | | Year Ended
September 30,
2018 | | | Year Ended
September 30,
2017 | | | Year Ended
September 30,
2016 | |
Net asset value, beginning of year | | $ | 9.56 | | | $ | 8.99 | | | $ | 10.25 | | | $ | 8.85 | | | $ | 9.29 | | | $ | 9.49 | | | $ | 8.03 | |
INCOME FROM INVESTMENT OPERATIONS | | | | | | | | | | | | | | | | | | | | | | | | |
Net investment income/(loss)(c) | | | 0.11 | | | | 0.05 | | | | 0.18 | | | | 0.26 | | | | 0.28 | | | | 0.27 | | | | 0.30 | |
Net gain/(loss) on securities (both realized and unrealized) | | | 1.28 | | | | 0.97 | | | | (0.91 | ) | | | 1.45 | | | | 0.07 | | | | 0.59 | | | | 1.43 | |
Total from investment operations | | | 1.39 | | | | 1.02 | | | | (0.73 | ) | | | 1.71 | | | | 0.35 | | | | 0.86 | | | | 1.73 | |
LESS DISTRIBUTIONS | | | | | | | | | | | | | | | | | | | | | | | | | | | | |
Dividends from net investment income | | | (0.10 | ) | | | (0.05 | ) | | | (0.20 | ) | | | (0.26 | ) | | | (0.31 | ) | | | (0.27 | ) | | | (0.27 | ) |
Distributions from capital gains | | | — | | | | (0.40 | ) | | | (0.33 | ) | | | (0.05 | ) | | | (0.48 | ) | | | (0.79 | ) | | | — | |
Total distributions | | | (0.10 | ) | | | (0.45 | ) | | | (0.53 | ) | | | (0.31 | ) | | | (0.79 | ) | | | (1.06 | ) | | | (0.27 | ) |
Net asset value, end of year or period | | $ | 10.85 | | | $ | 9.56 | | | $ | 8.99 | | | $ | 10.25 | | | $ | 8.85 | | | $ | 9.29 | | | $ | 9.49 | |
| | | | | | | | | | | | | | | | | | | | | | | | | | | | | |
Total return | | | 14.52 | %(d) | | | 11.42 | %(d) | | | (7.35 | )% | | | 19.76 | % | | | 4.17 | % | | | 9.88 | % | | | 21.74 | % |
| | | | | | | | | | | | | | | | | | | | | | | | | | | | | |
RATIOS / SUPPLEMENTAL DATA | | | | | | | | | | | | | | | | | | | | | | | | | | | | |
Net assets, end of year or period (000s) | | $ | 34,721 | | | $ | 25,430 | | | $ | 25,038 | | | $ | 46,006 | | | $ | 30,883 | | | $ | 35,816 | | | $ | 43,864 | |
Ratio of expenses to average net assets: | | | | | | | | | | | | | | | | | | | | | | | | | | | | |
Before expense reimbursements | | | 1.48 | %(e) | | | 1.47 | %(e) | | | 1.63 | % | | | 1.57 | % | | | 1.60 | % | | | 1.54 | % | | | 1.59 | % |
After expense reimbursements(f) | | | 1.22 | %(e) | | | 1.23 | %(e) | | | 1.28 | % | | | 1.22 | % | | | 1.22 | % | | | 1.44 | %(f) | | | 1.50 | % |
Ratio of net investment income/(loss) to average net assets | | | | | | | | | | | | | | | | | | | | | | | | | | | | |
Before expense reimbursements | | | 1.74 | %(e) | | | 1.87 | %(e) | | | 1.62 | % | | | 2.38 | % | | | 2.82 | % | | | 2.83 | % | | | 3.15 | % |
After expense reimbursements | | | 2.00 | %(e) | | | 2.11 | %(e) | | | 1.96 | % | | | 2.73 | % | | | 3.20 | % | | | 2.93 | % | | | 3.24 | % |
Portfolio turnover | | | 40 | %(d) | | | 3 | %(d) | | | 24 | % | | | 144 | % | | | 156 | % | | | 160 | % | | | 168 | % |
Icon Utilities and Income Fund(a) | | | | | | | | | | | | | | | | |
Investor Shares(h) | | Period Ended
June 30,
2021
(Unaudited) | | | Period Ended
December 31,
2020 | | | Year Ended
September 30,
2020 | | | Year Ended
September 30,
2019 | | | Year Ended
September 30,
2018 | | | Year Ended
September 30,
2017 | | | Year Ended
September 30,
2016 | |
Net asset value, beginning of year | | $ | 9.38 | | | $ | 8.83 | | | $ | 10.07 | | | $ | 8.70 | | | $ | 9.14 | | | $ | 9.35 | | | $ | 7.92 | |
INCOME FROM INVESTMENT OPERATIONS | | | | | | | | | | | | | | | | | | | | | | | | |
Net investment income/(loss)(c) | | | 0.09 | | | | 0.04 | | | | 0.16 | | | | 0.23 | | | | 0.25 | | | | 0.24 | | | | 0.28 | |
Net gain/(loss) on securities (both realized and unrealized) | | | 1.27 | | | | 0.96 | | | | (0.91 | ) | | | 1.43 | | | | 0.08 | | | | 0.59 | | | | 1.40 | |
Total from investment operations | | | 1.36 | | | | 1.00 | | | | (0.75 | ) | | | 1.66 | | | | 0.33 | | | | 0.83 | | | | 1.68 | |
LESS DISTRIBUTIONS | | | | | | | | | | | | | | | | | | | | | | | | | | | | |
Dividends from net investment income | | | (0.09 | ) | | | (0.05 | ) | | | (0.16 | ) | | | (0.24 | ) | | | (0.29 | ) | | | (0.25 | ) | | | (0.25 | ) |
Distributions from capital gains | | | — | | | | (0.40 | ) | | | (0.33 | ) | | | (0.05 | ) | | | (0.48 | ) | | | (0.79 | ) | | | — | |
Total distributions | | | (0.09 | ) | | | (0.45 | ) | | | (0.49 | ) | | | (0.29 | ) | | | (0.77 | ) | | | (1.04 | ) | | | (0.25 | ) |
Net asset value, end of year or period | | $ | 10.65 | | | $ | 9.38 | | | $ | 8.83 | | | $ | 10.07 | | | $ | 8.70 | | | $ | 9.14 | | | $ | 9.35 | |
| | | | | | | | | | | | | | | | | | | | | | | | | | | | | |
Total return(i) | | | 14.51 | %(d) | | | 11.33 | %(d) | | | (7.69 | )% | | | 19.47 | % | | | 3.97 | % | | | 9.63 | % | | | 21.29 | % |
| | | | | | | | | | | | | | | | | | | | | | | | | | | | | |
RATIOS / SUPPLEMENTAL DATA | | | | | | | | | | | | | | | | | | | | | | | | | | | | |
Net assets, end of year (000s) | | $ | 6,327 | | | $ | 4,925 | | | $ | 4,797 | | | $ | 6,052 | | | $ | 5,540 | | | $ | 8,293 | | | $ | 15,868 | |
Ratio of expenses to average net assets: | | | | | | | | | | | | | | | | | | | | | | | | | | | | |
Before expense reimbursements | | | 1.72 | %(e) | | | 1.72 | %(e) | | | 1.83 | % | | | 1.77 | % | | | 1.73 | % | | | 1.84 | % | | | 1.79 | % |
After expense reimbursements(f) | | | 1.46 | %(e) | | | 1.48 | %(e) | | | 1.53 | % | | | 1.47 | % | | | 1.47 | % | | | 1.69 | %(j) | | | 1.75 | % |
Ratio of net investment income/(loss) to average net assets | | | | | | | | | | | | | | | | | | | | | | | | | | | | |
Before expense reimbursements | | | 1.52 | %(e) | | | 1.65 | %(e) | | | 1.45 | % | | | 2.20 | % | | | 2.62 | % | | | 2.48 | % | | | 3.10 | % |
After expense reimbursements | | | 1.78 | %(e) | | | 1.89 | %(e) | | | 1.75 | % | | | 2.50 | % | | | 2.88 | % | | | 2.63 | % | | | 3.14 | % |
Portfolio turnover | | | 40 | %(d) | | | 3 | %(d) | | | 24 | % | | | 144 | % | | | 156 | % | | | 160 | % | | | 168 | % |
(a) | Formerly named ICON Utilities Fund (see Note 7). |
(b) | Formerly named ICON Utilities Fund - Class S (see Note 7). |
(c) | Calculated based upon average shares outstanding. |
(f) | Effective for the year ended September 30, 2020, CCO Fees and reorganization costs are not included in the expense limitation. For all years presented, interest expense, when applicable, is not included in the expense limitation. |
(g) | Effective July 1, 2017, the annual expense limitation rate changed from 1.50% to 1.22%. |
(h) | Formerly named ICON Utilities Fund - Class A (see Note 7). |
(i) | The total return calculation excludes any sales charges. |
(j) | Effective July 1, 2017, the annual expense limitation rate changed from 1.75% to 1.47% |
See accompanying notes to financial statements.
31
ICON Funds | Notes to Financial Statements (Unaudited) | June 30, 2021 |
NOTE 1 – SUMMARY OF SIGNIFICANT ACCOUNTING POLICIES
SCM Trust (the “Trust”), a Massachusetts business trust formed in July 1988 is registered as an investment company under the Investment Company Act of 1940, as amended. The Trust consists of twelve separate series, seven of which are included in these financial statements. On August 13, 2020, the fiscal year end of the ICON Equity Fund, the ICON Equity Income Fund, the ICON Consumer Select Fund, the ICON Flexible Bond Fund, ICON Health and Information Technology Fund, The ICON Natural Resources Fund, and the ICON Utilities and Income Fund was changed from September 30 to December 31, effective December 31, 2020.
ICON Consumer Select Fund is an open-end non-diversified series of the Trust. The Fund’s investment objective is to seek long-term capital appreciation. The Fund is the successor fund to three series of ICON Funds, the ICON Consumer Discretionary Fund, the ICON Financial Fund, and the ICON Consumer Staples Fund. The ICON Consumer Discretionary Fund and the ICON Financial Fund were reorganized into the Fund pursuant to a reorganization that that took place after the close of business on July 10, 2020, which was the operational inception date of the fund. The ICON Consumer Staples Fund was reorganized into the Fund pursuant to a reorganization that took place after the close of business on July 31, 2020. All historic performance and financial information presented is that of the ICON Financial Fund, which was the accounting and performance survivor of the reorganizations. Historic information presented for the Institutional Class and Investor Classes shares is based on that of the Class S and Class A shares, respectively, of the ICON Financial Fund.
ICON Equity Fund is an open-end diversified series of the Trust. The Fund’s investment objective is to seek capital appreciation, with a secondary objective of capital preservation to provide long-term growth. The Fund is the successor fund to three series of ICON Funds, the ICON Fund, the ICON Long/Short Fund, and the ICON Opportunities Fund, pursuant to a reorganization that that took place after the close of business on July 10, 2020, which was the operational inception date of the fund. All historic performance and financial information presented is that of the ICON Long/Short Fund, which was the accounting and performance survivor of the reorganizations. Historic information presented for the Institutional Class and Investor Classes shares is based on that of the Class S and Class A shares, respectively, of the ICON Long/Short Fund. The ICON Fund and the ICON Long/Short Fund each also had Class C shares, each of which were reorganized into the Investor Class of the ICON Equity Fund.
ICON Equity Income Fund is an open-end diversified series of the Trust. The Fund’s investment objective is to seek modest capital appreciation and income. The Fund is the successor fund to two series of ICON Funds, the ICON Equity Income Fund (the “Predecessor Equity Income Fund”) and the ICON Risk-Managed Balanced Fund, pursuant to reorganizations that that took place after the close of business on July 10, 2020, which was the operational inception date of the fund, and September 25, 2020, respectively. All historic performance and financial information presented is that of the Predecessor Equity Income Fund, which was the accounting and performance survivor of the reorganizations. Historic information presented for the Institutional Class and Investor Classes shares is based on that of the Class S and Class A shares, respectively, of the Predecessor Equity Income Fund. The Predecessor Equity Income Fund and the ICON Risk-Managed Balanced Fund each also had Class C shares, each of which were reorganized into the Investor Class of the ICON Equity Income Fund.
ICON Flexible Bond Fund is an open-end diversified series of the Trust. The Fund’s investment objective is to seek maximum total return. The Fund is the successor fund to the ICON Flexible Bond Fund, a series of ICON Funds (the “Predecessor Flexible Bond Fund”), pursuant to a reorganization that that took place after the close of business on July 10, 2020, which was the operational inception date of the fund. All historic performance and financial information presented is that of the Predecessor Flexible Bond Fund, which was the accounting and performance survivor of the reorganization. Historic information presented for the Institutional Class and Investor Classes shares is based on that of the Class S and Class A shares, respectively, of the Predecessor Flexible Bond Fund. The Predecessor Flexible Bond Fund also had Class C shares, each of which were reorganized into the Investor Class of the ICON Flexible Bond Fund.
ICON Health and Information Technology Fund is an open-end non-diversified series of the Trust. The Fund’s investment objective is to seek long-term capital appreciation. The Fund is the successor fund to two series of ICON Funds, the ICON Information Technology Fund and the ICON Healthcare Fund pursuant to a reorganization that that took place after the close of business on July 10, 2020, which was the operational inception date of the fund. All historic performance and financial information presented is that of the ICON Information Technology Fund, which was the accounting and performance survivor of the reorganizations. Historic information presented for the Institutional Class and Investor Classes shares is based on that of the Class S and Class A shares, respectively, of the ICON Information Technology Fund.
ICON Natural Resources and Infrastructure Fund is an open-end non-diversified series of the Trust. The Fund’s investment objective is to seek long-term capital appreciation. The Fund is the successor fund to three series of ICON Funds, the ICON Energy Fund, the ICON Natural Resources Fund, and the ICON Industrials Fund, pursuant to a reorganization that that took place after the close of business on July 10, 2020, which was the operational inception date of the fund. All historic performance and financial information presented is that of the ICON Natural Resources Fund, which was the accounting and performance survivor of the reorganizations. Historic information presented for the Institutional Class and Investor Classes shares is based on that of the Class S and Class A shares, respectively, of the ICON Natural Resources Fund. The ICON Energy Fund and the ICON Natural Resources Fund each also had Class C shares, each of which were reorganized into the Investor Class of the ICON Natural Resources and Infrastructure Fund.
ICON Utilities and Income Fund is an open-end non-diversified series of the Trust. The Fund’s investment objective is to seek long-term capital appreciation. The Fund is the successor fund to the ICON Utilities Fund, a series of ICON Funds, pursuant to a reorganization that occurred after the close of business on July 10, 2020, which was the operational inception date of the fund. All historic performance and financial information presented is that of the ICON Utilities Fund, which was the accounting and performance survivor of the reorganizations. Historic information presented for the Institutional Class and Investor Classes shares is based on that of the Class S and Class A shares, respectively, of the ICON Utilities Fund.
The Trust follows the investment company accounting and reporting guidance of the Financial Accounting Standards Board (“FASB”) Accounting Standards Codification Topic 946, “Financial Services – Investment Companies”.
(a) Security Valuation — Inputs used to value corporate debt securities generally include relative credit information, observed market movements, sector news, U.S. Treasury yield curve or relevant benchmark curve, and other market information, which may include benchmark yields, reported trades, broker-dealer quotes, issuer spreads, benchmark securities, bids, offers, and reference data, such as market research publications, when available (“Other Market Information”). Equity securities listed on a national or international exchange are valued at the last reported sales price. Futures contracts are valued at the settle price, depending on the exchange the contract trades on, typically as of 4:15 p.m., Eastern Time. Municipal securities are valued by an independent pricing service at a price determined by a matrix pricing method. This technique generally considers such factors as yields or prices of bonds of comparable quality, type of issue, coupon, maturity, ratings and general market conditions. U.S. government securities for which
32
ICON Funds | Notes to Financial Statements (Unaudited) (Continued) | June 30, 2021 |
market quotations are readily available are valued at the mean between the closing bid and asked prices provided by an independent pricing service. U.S. agency securities consisting of mortgage pass-through certificates are valued using dealer quotations provided by an independent pricing service. U.S. Treasury Bills are valued at amortized cost which approximates market value. Securities with remaining maturities of 60 days or less are valued on the amortized cost basis as reflecting fair value.
Securities for which market quotes are not readily available from the Trust’s third-party pricing service are valued at fair value, determined in good faith and in accordance with procedures adopted by the Board of Trustees. The Board has delegated to the Advisor’s Pricing Committee the responsibility for determining the fair value, subject to the Board oversight and the review of the pricing decisions at its quarterly meetings. For a description of the Advisor, see Note 2.
(b) Federal Income Taxes — No provision is considered necessary for federal income taxes. The Funds intend to qualify for and elect the tax treatment applicable to regulated investment companies under the Internal Revenue Code and to distribute all their taxable income to shareholders.
(c) Short Sales — Short sales are transactions under which a Fund sells a security it does not own in anticipation of a decline in the value of that security. To complete such a transaction, the Fund must borrow the security to make delivery to the buyer. The Fund then is obligated to replace the security borrowed by purchasing the security at market price at the time of replacement. The price at such time may be more or less than the price at which the security was sold by the Fund. When a security is sold short a decrease in the value of the security will be recognized as a gain and an increase in the value of the security will be recognized as a loss, which is potentially limitless. Until the security is replaced, the Fund is required to pay the lender amounts equal to dividend or interest that accrue during the period of the loan which is recorded as an expense. To borrow the security, the Fund also may be required to pay a premium or an interest fee, which are recorded as interest expense. Cash or securities are segregated for the broker to meet the necessary margin requirements. The Fund is subject to the risk that it may not always be able to close out a short position at a particular time or at an acceptable price.
(d) Municipal Bonds — Municipal bonds are debt obligations issued by the states, possessions, or territories of the United States (including the District of Columbia) or a political subdivision, public instrumentality, agency, public authority or other governmental unit of such states, possessions, or territories (e.g., counties, cities, towns, villages, districts and authorities). Municipal bonds may be issued as taxable securities, or as federally tax-exempt securities. States, possessions, territories and municipalities may issue municipal bonds to raise funds for various public purposes such as airports, housing, hospitals, mass transportation, schools, water and sewer works, gas, and electric utilities. They may also issue municipal bonds to refund outstanding obligations and to meet general operating expenses. Municipal bonds may be general obligation bonds or revenue bonds. General obligation bonds are secured by the issuer’s pledge of its full faith, credit and taxing power for the payment of principal and interest. Revenue bonds are payable from revenues derived from particular facilities, from the proceeds of a special excise tax or from other specific revenue sources. They are not usually payable from the general taxing power of a municipality. In addition, certain types of “private activity” bonds may be issued by public authorities to obtain funding for privately operated facilities, such as housing and pollution control facilities, for industrial facilities and for water supply, gas, electricity and waste disposal facilities. Other types of private activity bonds are used to finance the construction, repair or improvement of, or to obtain equipment for, privately operated industrial or commercial facilities. Current federal tax laws place substantial limitations on the size of certain of such issues. In certain cases, the interest on a private activity bond may not be exempt from federal income tax or the alternative minimum tax.
(e) Security Transactions, Investment Income and Distributions to Shareholders — Security transactions are recorded on the trade date. Interest income is recorded on the accrual basis. Dividend income is recorded on the ex-dividend date. Withholding taxes on foreign dividends have been provided for, in accordance with the Trust’s understanding of the applicable country’s tax rules and rates. Discounts or premiums on debt securities are accreted or amortized to interest income over the lives of the respective securities using the effective interest method or, where applicable, to the first call date of the securities. Distributions to shareholders are recorded on the ex-dividend date for the Funds. Income distributions and capital gain distributions are determined in accordance with income tax regulations which may differ from accounting principles generally accepted in the United States of America. These differences are primarily due to differing treatments for PFICs, wash sales, REIT adjustments and post-October capital losses.
Distributions received from investments in securities that represent a return of capital or capital gains are recorded as a reduction of cost of investment or as a realized gain, respectively. The calendar year-end amounts of ordinary income, capital gains, and return of capital included in distributions received from a Fund’s investments in real estate investment trusts (“REITs”) are reported to the Fund after the end of the calendar year; accordingly, the Funds estimate these amounts for accounting purposes until the characterization of REIT distributions is reported to the Fund after the end of the calendar year. Estimates are based on the most recent REIT distribution information available.
These “Book/tax” differences are considered either temporary (i.e., deferred losses, capital loss carry forwards) or permanent in nature. To the extent these differences are permanent in nature, such amounts are reclassified within the composition of net assets based on their federal tax basis treatment; temporary differences do not require reclassification.
(f) Foreign Currency Translation — Investment securities and other assets and liabilities denominated in foreign currencies are translated into U.S. dollar amounts at the date of valuation. Purchases and sales of investment securities and income and expense items denominated in foreign currencies are translated into U.S. dollar amounts on the respective dates of such transactions. The Trust does not isolate that portion of the results of operations resulting from changes in foreign exchange rates on investments from the fluctuations arising from changes in market prices of securities held. Such fluctuations are included with the net realized and unrealized gain or loss from investments.
Reported net realized foreign exchange gains or losses arise from sales of foreign currencies, currency gains or losses realized between the trade and settlement dates on securities transactions, and the difference between the amounts of dividends, interest, and foreign withholding taxes recorded on the company’s books and the U.S. dollar equivalent of the amounts actually received or paid. Net unrealized foreign exchange gains and losses arise from changes in the fair values of assets and liabilities, other than investments in securities at fiscal period end, resulting from changes in exchange rates.
(g) Concentration — Cash & Cash Equivalents: The Funds consider their investment in a Federal Deposit Insurance Corporation (“FDIC”) insured interest bearing account to be cash and cash equivalents. Cash and cash equivalents are valued at cost plus any accrued interest. The Funds maintain cash balances, which, at times may exceed federally insured limits. The Funds maintain these balances with a high-quality financial institution.
Concentration of Credit Risk: Each Fund places its cash with a banking institution, which is insured by FDIC. The FDIC limit is $250,000. At various times throughout the year, the amount on deposit may exceed the FDIC limit and subject the Funds to a credit risk. The Funds do not believe that such deposits are subject to any unusual risk associated with investment activities.
33
ICON Funds | Notes to Financial Statements (Unaudited) (Continued) | June 30, 2021 |
(h) Use of Estimates in Financial Statements — In preparing financial statements in conformity with accounting principles generally accepted in the United States of America, Shelton Capital makes estimates and assumptions that affect the reported amounts of assets and liabilities at the date of the financial statements, as well as the reported amounts of income and expense during the year. Actual results may differ from these estimates.
(i) Share Valuations — The net asset value (“NAV”) per share of each Fund is calculated by dividing the sum of the value of the securities held by the Fund, plus cash or other assets, minus all liabilities (including estimated accrued expenses) by the total number of shares outstanding of the Fund, rounded to the nearest cent. A Fund’s shares will not be priced on the days on which the NYSE is closed for trading. The offering and redemption price per share of each Fund is equal to a Fund’s NAV per share.
(j) Accounting for Uncertainty in Income Taxes — The Funds recognize the tax benefits of uncertain tax positions only where the position is “more likely than not” to be sustained assuming examination by tax authorities. Shelton Capital has analyzed the Fund’s tax positions, and has concluded that no liability for unrecognized tax benefits should be recorded related to uncertain tax positions taken on returns filed for open tax years (2017-2019) or expected to be taken in the Fund’s 2020 tax returns. The Funds identify its major tax jurisdictions as U.S. Federal, however the Funds are not aware of any tax positions for which it is reasonably possible that the total amounts of unrecognized tax benefits will change materially in the next twelve months.
(k) Fair Value Measurements — The Funds utilize various methods to measure the fair value of most of its investments on a recurring basis. U.S. GAAP establishes a hierarchy that prioritizes inputs to valuation methods. The three levels of inputs are:
Level 1 – Unadjusted quoted prices in active markets for identical assets or liabilities that the company has the ability to access.
Level 2 – Observable inputs other than quoted prices included in Level 1 that are observable for the asset or liability, either directly or indirectly. These inputs may include quoted prices for the identical instrument on an inactive market, prices for similar instruments, interest rates, prepayment speeds, credit risk, yield curves, default rates and similar data.
Level 3 – Unobservable inputs for the asset or liability, to the extent relevant observable inputs are not available, representing the Fund’s own assumptions about the assumptions a market participant would use in valuing the asset or liability, and would be based on the best information available.
The availability of observable inputs can vary from security to security and is affected by a wide variety of factors, including, for example, the type of security, whether the security is new and not yet established in the marketplace, the liquidity of markets, and other characteristics particular to the security. To the extent that valuation is based on models or inputs that are less observable or unobservable in the market, the determination of fair value requires more judgment. Accordingly, the degree of judgment exercised in determining fair value is greatest for instruments categorized in Level 3.
The inputs used to measure fair value may fall into different levels of the fair value hierarchy. In such cases, for disclosure purposes, the level in the fair value hierarchy within which the fair value measurement falls in its entirety, is determined based on the lowest level input that is significant to the fair value measurement in its entirety.
The following table summarizes the valuation of the Trust’s securities at June 30, 2021 using fair value hierarchy:
| | | Level 1(a) | | | Level 2(a) | | | Level 3(a) | | | | | |
Fund | | Investments in
Securities(b) | | | Investments in
Securities(c) | | | Investments
in Securities | | | Total
Assets | |
ICON Consumer Select Fund | | $ | 60,038,037 | | | $ | — | | | $ | — | | | $ | 60,038,037 | |
ICON Equity Fund | | | 80,619,102 | | | | — | | | | — | | | | 80,619,102 | |
ICON Equity Income Fund | | | 86,031,057 | | | | 1,606,656 | | | | — | | | | 87,637,713 | |
ICON Flexible Bond Fund | | | 50,072,630 | | | | 94,773,842 | | | | — | | | | 144,846,472 | |
ICON Health and Information Technology Fund | | | 130,256,755 | | | | — | | | | — | | | | 130,256,755 | |
ICON Natural Resources & Infrastructure Fund | | | 131,081,019 | | | | — | | | | — | | | | 131,081,019 | |
ICON Utilities and Income Fund | | | 40,988,055 | | | | — | | | | — | | | | 40,988,055 | |
(a) | It is the Fund’s policy to recognize transfers between levels on the last day of the fiscal reporting period. There were no transfers in or out of Level 2, and Level 3 for the period ending June 30, 2021. |
(b) | All publicly traded common stocks and preferred stocks held in the Funds are Level 1 securities. For a detailed break-out of equity securities by major industry classification, please refer to the Portfolio of Investments. |
(c) | All fixed income securities held in the Funds are Level 2 securities. For a detailed break-out of fixed income securities by type, please refer to the Portfolio of Investments. |
(l) Disclosure about Derivative Instruments and Hedging Activities — The Fund has adopted enhanced disclosure regarding derivative and hedging activity intended to improve financial reporting of derivative instruments by enabling investors to understand how and why an entity uses derivatives, how derivatives are accounted for, and how derivative instruments affect an entity’s results of operations and financial position.
(m) LIBOR Transition Risk — The United Kingdom’s Financial Conduct Authority announced a phase out of the London Interbank Offered Rate (“LIBOR”) by the end of 2021, On November 30, 2020, the administrator of LIBOR announced its intention to delay the phase out of the majority of the U.S. dollar LIBOR publications until June 30, 2023, with the remainder of LIBOR publications to still end at the end of 2021. The Funds may be exposed to financial instruments tied to LIBOR to determine payment obligations, financing terms, hedging strategies or investment value. The transition process away from LIBOR might lead to increased volatility and illiquidity in markets for, and reduce the effectiveness of new hedges placed against, instruments whose terms currently include LIBOR. The ultimate effect of the LIBOR transition process on the Funds Is uncertain.
(n) COVID-19 Risks — An outbreak of respiratory disease caused by a novel coronavirus was first detected in December 2019 and has now spread internationally. This coronavirus has resulted in closing borders, enhanced health screenings, partial population vaccination, healthcare service preparation and delivery, quarantines, cancellations, disruptions to supply chains and customer activity, government sponsored fiscal stimulus programs, various moratoria on the applicability of certain laws and regulations, as well as general concern and uncertainty. The impact of this coronavirus, (and the variants of such virus) and other epidemics and pandemics that may arise in the future, could affect the economies of many nations, individual companies, their securities (including equity and debt), and the market in general in ways that cannot necessarily be foreseen at the present time. In
34
ICON Funds | Notes to Financial Statements (Unaudited) (Continued) | June 30, 2021 |
addition, the impact of infectious diseases in developing or emerging market countries may be greater due to less established health care systems. Health crises caused by the recent coronavirus outbreak may exacerbate other pre-existing political, social, financial, and economic risks in certain countries. The impact of the outbreak may last for an extended period of time.
NOTE 2 – INVESTMENT MANAGEMENT FEE AND OTHER RELATED PARTY TRANSACTIONS
Shelton provides each Fund with management and administrative services pursuant to investment management and administration servicing agreements.
In accordance with the terms of the management agreement, the Advisor receives compensation at the following annual rates:
Fund | | % of Net Assets | |
ICON Consumer Select Fund | | | 1.00 | % |
ICON Equity Fund | | | 0.75 | % |
ICON Equity Income Fund | | | 0.75 | % |
ICON Flexible Bond Fund | | | 0.60 | % |
ICON Health and Information Technology Fund | | | 1.00 | % |
ICON Natural Resources & Infrastructure Fund | | | 1.00 | % |
ICON Utilities and Income Fund | | | 1.00 | % |
The Advisor contractually agreed to reduce total operating expense to certain Funds of the Trust. This additional contractual reimbursement (excluding certain compliance costs, extraordinary expenses such as litigation or merger and reorganization expenses, for example) is effective until the dates listed below, unless renewed, and is subject to recoupment within three fiscal years following reimbursement. Recoupment is limited to the extent the reimbursement does not exceed any applicable expense limit and the effect of the reimbursement is measured after all ordinary operating expenses are calculated; any such reimbursement is subject to the Board of Trustees’ review and approval. Reimbursements from the Advisor to affected Funds, and the expense limits, for the period ended June 30, 2021 are as follows:
| | | Expense Limitation | |
Fund | | Institutional
Shares | | | Investor
Shares | | | Expiration | |
ICON Consumer Select Fund | | | 1.50 | % | | | 1.75 | % | | | 5/1/22 | |
ICON Equity Fund | | | 1.25 | % | | | 1.50 | % | | | 5/1/22 | |
ICON Equity Income Fund | | | 0.99 | % | | | 1.24 | % | | | 5/1/22 | |
ICON Flexible Bond Fund | | | 0.75 | % | | | 1.00 | % | | | 5/1/22 | |
ICON Health and Information Technology Fund | | | 1.50 | % | | | 1.75 | % | | | 5/1/22 | |
ICON Natural Resources & Infrastructure Fund | | | 1.50 | % | | | 1.75 | % | | | 5/1/22 | |
ICON Utilities and Income Fund | | | 1.22 | % | | | 1.47 | % | | | 5/1/22 | |
At June 30, 2021, the remaining cumulative unreimbursed amount paid and/or waived by the Advisor on behalf of the Funds that may be reimbursed was $145,696. The Advisor may recapture a portion of the above amount no later than the dates as stated below.
Fund | | Expires
9/30/2023 | | | Expires
12/31/23 | | | Total | |
ICON Consumer Select Fund | | $ | — | | | $ | — | | | $ | — | |
ICON Equity Fund | | | — | | | | — | | | | — | |
ICON Equity Income Fund | | | 17,775 | | | | 11,132 | | | | 28,907 | |
ICON Flexible Bond Fund | | | 45,652 | | | | 38,363 | | | | 84,015 | |
ICON Health and Information Technology Fund | | | — | | | | — | | | | — | |
ICON Natural Resources & Infrastructure Fund | | | — | | | | — | | | | — | |
ICON Utilities and Income Fund | | | 14,724 | | | | 18,050 | | | | 32,774 | |
Total | | $ | 78,151 | | | $ | 67,545 | | | $ | 145,696 | |
A Fund must pay its current ordinary operating expenses before the Advisor is entitled to any reimbursement of fees and/or expenses. Any such reimbursement is contingent upon the Board of Trustees review and approval prior to the time the reimbursement is initiated.
As compensation for administrative duties not covered by the management agreement, Shelton receives an administration fee, which was revised on January 1, 2011. The administration fee is based on assets held, in aggregate, by the SCM Trust and other funds within the same “family” of investment companies managed and administered by Shelton. The fee rates are 0.10% on the first $500 million, 0.08% on the next $500 million, and 0.06% on combined assets over $1 billion. Administration fees are disclosed in the Statement of Operations.
Certain officers and trustees of the Trust are also partners of Shelton. Steve Rogers has served as a trustee and Chairman of the Board of Trustees of the Trust since 1998, and President of the Trust since 1999. Mr. Rogers is also Chief Executive Officer of the Adviser. Gregory T. Pusch has served as the Chief Compliance Officer (“CCO”) of the Trust since March 2017. Mr. Pusch is also employed by Shelton, the Advisor and Administrator to the Trust. The Trust is responsible for the portion of his salary allocated to his duties as the CCO of the Trust during his employment, and Shelton is reimbursed by the Trust for this portion of his salary. The level of reimbursement is reviewed and determined by the Board of Trustees at least annually.
The Trust has adopted a Distribution Plan (the “Plan”), as amended July 29, 2017, pursuant to Rule 12b-1 under the Investment Company Act of 1940, whereby the Investor Shares of each Fund pays RFS Partners, the Funds’ distributor (the “Distributor”), an affiliate of the Advisor, for expenses that relate to the promotion and distribution of shares. Under the Plan, the Investor Shares of the Funds will pay the Distributor a fee at an annual rate of 0.25%, payable monthly, of the daily net assets attributable to such Fund’s Investor Shares.
35
ICON Funds | Notes to Financial Statements (Unaudited) (Continued) | June 30, 2021 |
For the period ended June 30, 2021 the following were paid:
Fund | | Investor Class
12b-1 Fees* | |
ICON Consumer Select Fund | | $ | 3,170 | |
ICON Equity Fund | | $ | 27,646 | |
ICON Equity Income Fund | | $ | 50,081 | |
ICON Flexible Bond Fund | | $ | 12,619 | |
ICON Health and Information Technology Fund | | $ | 4,004 | |
ICON Natural Resources & Infrastructure Fund | | $ | 8,686 | |
ICON Utilities and Income Fund | | $ | 7,136 | |
* | For the period January 1, 2021 through June 30, 2021. |
Management fees, administration fees, expense reimbursement from the Advisor, CCO fees and Trustees fees incurred during the period are included in the Statement of Operations.
NOTE 3 – PURCHASES AND SALES OF SECURITIES
Purchases and sales of securities other than short-term instruments for the period ended June 30, 2021 were as follows:
Fund | | Purchases | | | Sales | | | Purchases
(Excluding U.S.
Government
Obligations) | | | Sales
(Excluding U.S.
Government
Obligations) | |
ICON Consumer Select Fund | | $ | 6,801,875 | | | $ | 12,149,976 | | | $ | 6,801,875 | | | $ | 12,149,976 | |
ICON Equity Fund | | | 8,799,949 | | | | 12,607,672 | | | | 8,799,949 | | | | 12,607,672 | |
ICON Equity Income Fund | | | 13,574,212 | | | | 22,373,507 | | | | 13,574,212 | | | | 22,373,507 | |
ICON Flexible Bond Fund | | | 122,461,922 | | | | 123,108,609 | | | | 122,461,922 | | | | 123,108,609 | |
ICON Health and Information Technology Fund | | | 19,533,304 | | | | 33,322,781 | | | | 19,533,304 | | | | 33,322,781 | |
ICON Natural Resources & Infrastructure Fund | | | 99,395,405 | | | | 107,596,054 | | | | 99,395,405 | | | | 107,596,054 | |
ICON Utilities and Income Fund | | | 14,085,621 | | | | 7,464,749 | | | | 14,085,621 | | | | 7,464,749 | |
NOTE 4 – TAX CHARACTER
Reclassifications: Accounting principles generally accepted in the United States of America require certain components of net assets be reclassified between financial and tax reporting. These reclassifications have no effect on net assets or net asset value per share. The reclassification was as follows:
| | Increase/
(Decrease)
Paid-In Capital | | | Increase/
(Decrease)
Accumulated
Gain/(Loss) | |
ICON Consumer Select Fund | | $ | (65,239 | ) | | $ | 65,239 | |
ICON Equity Income Fund | | | (724,700 | ) | | | 724,700 | |
ICON Flexible Bond Fund | | | (2,487 | ) | | | 2,487 | |
ICON Health and Information Technology Fund | | | (230,504 | ) | | | 230,504 | |
ICON Utilities and Income Fund | | | (159,408 | ) | | | 159,408 | |
Tax Basis of Distributable Earnings: The tax character of distributable earnings at December 31, 2020 was as follows:
| | | Undistributed
Ordinary Income | | | Undistributed
Long-Term
Capital Gain | | | Capital
Loss Carry
Forwards | | | Unrealized
Appreciation/
(Depreciation) | | | Post October
and Other
Losses | | | Total
Distributable
Earnings | |
ICON Consumer Select Fund | | $ | — | | | $ | 702,402 | | | $ | (3,608,802 | ) | | $ | 14,617,599 | | | $ | — | | | $ | 11,711,199 | |
ICON Equity Fund | | | 1,233,662 | | | | 315,597 | | | | (1,215,894 | ) | | | 27,850,211 | | | | — | | | | 28,183,576 | |
ICON Equity Income Fund | | | — | | | | — | | | | (2,238,923 | ) | | | 12,210,313 | | | | — | | | | 9,971,390 | |
ICON Flexible Bond Fund | | | 638,340 | | | | — | | | | (5,568,488 | ) | | | 1,783,964 | | | | (496,401 | ) | | | (3,642,585 | ) |
ICON Health and Information Technology Fund | | | — | | | | 6,836,259 | | | | (1,407,266 | ) | | | 48,193,019 | | | | — | | | | 53,622,012 | |
ICON Natural Resources & Infrastructure Fund | | | 138,408 | | | | — | | | | (246,051,024 | ) | | | 22,038,037 | | | | — | | | | (223,874,579 | ) |
ICON Utilities and Income Fund | | | — | | | | — | | | | — | | | | 3,129,346 | | | | — | | | | 3,129,346 | |
The difference between book basis and tax basis unrealized appreciation/(depreciation) is attributable primarily to wash sales and PFICs.
36
ICON Funds | Notes to Financial Statements (Unaudited) (Continued) | June 30, 2021 |
Capital Losses: Capital loss carry forwards, as of December 31, 2020, available to offset future capital gains, if any, are as follows:
Expiring | | ICON Consumer
Select Fund* | | | ICON
Equity Fund** | | | ICON Equity
Income Fund | | | ICON Flexible
Bond Fund | |
Long Term with No Expiration | | $ | — | | | $ | — | | | $ | (2,238,923 | ) | | $ | (3,036,843 | ) |
Short Term with No Expiration | | | — | | | | — | | | | — | | | | (2,531,645 | ) |
Long Term with Expiration | | | (1,008,940 | ) | | | — | | | | — | | | | — | |
Short Term with Expiration | | | (2,599,862 | ) | | | (1,215,894 | ) | | | — | | | | — | |
Total | | $ | (3,608,802 | ) | | $ | (1,215,894 | ) | | $ | (2,238,923 | ) | | $ | (5,568,488 | ) |
Expiring | | ICON Health
and Information
Technology
Fund*** | | | ICON Natural
Resources &
Infrastructure
Fund**** | |
Long Term with No Expiration | | $ | — | | | $ | (27,912,820 | ) |
Short Term with No Expiration | | | — | | | | (9,420,845 | ) |
Long Term with Expiration | | | — | | | | (119,775,913 | ) |
Short Term with Expiration | | | (1,407,471 | ) | | | (88,941,446 | ) |
Total | | $ | (1,407,471 | ) | | $ | (246,051,024 | ) |
* | Subject to an annual limitation of $270,264 under §382 of the Code through year 14, year 15 limit is $252,613 and year 16 limit is $113,021. |
** | Subject to an annual limitation of $133,945 under §382 of the Code through 2030, year 12 limit is $10,389. |
*** | Subject to an annual limitation of $601,938 under §382 of the Code, $151,721 for year 2, $601,398 for year 3 and 4, and $203,390 for year 5. |
**** | Subject to an annual limitation of $678,984 under §382 of the Code through year 8, year 9 limit is $644,536 and an annual limitation if $577,350 thereafter. |
Distributions to Shareholders: Income distributions and capital gain distributions are determined in accordance with income tax regulations, which may differ from U.S. generally accepted accounting principles. These differences are primarily due to differing treatments of income and gains on various investment securities held by each Fund, timing differences and differing characterization of distributions made by each Fund. The tax character of distributions paid during the period and years ended December 31, 2020, September 30, 2020 and September 30, 2019 are as follows:
Fund | Year or Period
Ended(a) | | Return of
Capital | | | Ordinary
Income | | | Long-Term
Capital Gains(b) | | | Exempt-Interest
Dividends | | | Total
Distributions | |
ICON Consumer Select Fund | September 30, 2019 | | $ | — | | | $ | 244,510 | | | $ | — | | | $ | — | | | $ | 244,510 | |
| | September 30, 2020 | | | — | | | | 336,028 | | | | 471,401 | | | | — | | | | 807,429 | |
| | December 31, 2020 | | | — | | | | — | | | | — | | | | — | | | | — | |
ICON Equity Fund | September 30, 2019 | | | — | | | | — | | | | 312,036 | | | | — | | | | 312,036 | |
| | September 30, 2020 | | | — | | | | — | | | | 757,121 | | | | — | | | | 757,121 | |
| | December 31, 2020 | | | — | | | | — | | | | — | | | | | | | | — | |
ICON Equity Income Fund | September 30, 2019 | | | — | | | | 2,166,210 | | | | 39,923 | | | | — | | | | 2,206,133 | |
| | September 30, 2020 | | | — | | | | 2,533,730 | | | | 916,555 | | | | — | | | | 3,450,285 | |
| | December 31, 2020 | | | — | | | | 1,628,166 | | | | — | | | | | | | | 1,628,166 | |
ICON Flexible Bond Fund | September 30, 2019 | | | — | | | | 6,122,522 | | | | — | | | | — | | | | 6,122,522 | |
| | September 30, 2020 | | | — | | | | 7,062,566 | | | | — | | | | — | | | | 7,062,566 | |
| | December 31, 2020 | | | — | | | | 1,376,881 | | | | — | | | | — | | | | 1,376,881 | |
ICON Health and Information Technology Fund | September 30, 2019 | | | — | | | | 5,119,639 | | | | 2,164,142 | | | | — | | | | 7,283,781 | |
| | September 30, 2020 | | | — | | | | — | | | | 2,469,081 | | | | — | | | | 2,469,081 | |
| | December 31, 2020 | | | — | | | | — | | | | 4,329,118 | | | | — | | | | 4,329,118 | |
ICON Natural Resources & Infrastructure Fund | September 30, 2019 | | | — | | | | 5,186,377 | | | | 5,752,876 | | | | — | | | | 10,939,253 | |
| | September 30, 2020 | | | — | | | | 917,284 | | | | — | | | | — | | | | 917,284 | |
| | December 31, 2020 | | | — | | | | 349,796 | | | | — | | | | — | | | | 349,796 | |
ICON Utilities and Income Fund | September 30, 2019 | | | — | | | | 1,276,398 | | | | 164,374 | | | | — | | | | 1,440,772 | |
| | September 30, 2020 | | | — | | | | 1,935,482 | | | | 566,602 | | | | — | | | | 2,502,084 | |
| | December 31, 2020 | | | — | | | | 541,608 | | | | 862,023 | | | | — | | | | 1,403,631 | |
(a) | Distributions made prior to the reorganization dates listed in Note 7 for each Fund were distributed from each Fund’s predecessor Fund. See Note 7 in the Notes to Financial Statements for additional details. |
(b) | The Funds designate Long-Term Capital Gain dividends pursuant to Section 852(b)(3) of the Internal Revenue Code for the periods ended September 30, 2019, September 30, 2020 and December 31, 2020. |
37
ICON Funds | Notes to Financial Statements (Unaudited) (Continued) | June 30, 2021 |
NOTE 5 – OFFSETTING OF FINANCIAL INSTRUMENTS AND DERIVATIVE ASSETS AND LIABILITIES
The following tables present gross amounts of recognized assets and/or liabilities and the net amounts after deducting collateral that has been received by counterparties in connection with securities lending:
Fund | Counterparty | | Gross Amounts
of Recognized
Assets | | | Offsetting Asset
or Liability | | | Collateral Pledged | | | Net Amount | |
ICON Equity Fund: | US Bank, NA | | $ | 3,138,750 | | | $ | — | | | $ | (3,138,750 | ) | | $ | — | |
ICON Utilities and Income Fund: | US Bank, NA | | $ | 1,271,376 | | | $ | — | | | $ | (1,271,376 | ) | | $ | — | |
ICON Flexible Bond Fund: | US Bank, NA | | $ | 11,795,770 | | | $ | — | | | $ | (11,795,770 | ) | | $ | — | |
ICON Natural Resources and Infrastructure Fund: | US Bank, NA | | $ | 482,898 | | | $ | — | | | $ | (482,898 | ) | | $ | — | |
Amounts relate to master netting agreements and collateral agreements which have been determined by the company to be legally enforceable in the event of default but where certain other criteria are not met in accordance with applicable offsetting accounting guidance. The collateral amounts may exceed the related net amounts of financial assets and liabilities presented in the statement of assets and liabilities. Where this is the case, the total amount reported is limited to the net amounts of financial assets and liabilities with that counterparty.
NOTE 6 – RECENT ACCOUNTING PRONOUNCEMENTS
In August 2018, FASB issued Accounting Standards Update No. 2018-13, “Fair Value Measurement (Topic 820: Disclosure Framework — Changes to the Disclosure Requirements for Fair Value Measurement” (“ASU 2018-13”). ASU 2018-13 eliminates the requirement to disclose the amount of and reasons for transfers between Level 1 and Level 2 of the fair value hierarchy, the timing of transfers between levels of the fair value hierarchy and the valuation processes for Level 3 fair value measurements. ASU 2018-13 will require the need to disclose the range and weighted average used to develop significant unobservable inputs for Level 3 fair value measurements and the changes in unrealized gains and losses for recurring Level 3 fair value measurements. ASU 2018-13 will also require that information is provided about the measurement uncertainty of Level 3 fair value measurements as of the reporting date. The guidance is effective for fiscal years, and interim periods within those fiscal years, beginning after December 15, 2019, and allows for early adoption of either the entire standard or only the provisions that eliminate or modify the requirements. Management has elected to adopt early the provisions that eliminate the disclosure requirements. Management is still currently evaluating the impact of applying the rest of the guidance.
NOTE 7 – REORGANIZATIONS
On June 3, 2020, the shareholders of the ICON Consumer Discretionary Fund approved the agreement and plan of reorganization providing for the transfer of assets and assumption of liabilities into the ICON Consumer Select Fund. ICON Consumer Select Fund is the performance and accounting survivor of the reorganization, as well as the legal and tax survivor. The reorganization was effective as of the close of business on July 10, 2020. The following table illustrates the specifics of the Fund’s reorganization:
ICON Consumer
Discretionary Fund
Pre-Reorganization
Net Assets | New Shares issued
to Shareholders of
ICON Consumer
Discretionary Fund | Consumer Select
Fund Net Assets | Combined Net Assets | Tax Status of Transfer |
$18,792,740(a) | 2,150,511 | $25,279,178 | $44,071,918 | Non-taxable |
(a) | Includes accumulated realized losses and unrealized appreciation in the amounts of $(2,884,684) and $3,674,286, respectively, from the merged fund. |
As of close of business on July 10, 2020, the classes were converted at the following rates:
Pre-Merger Class | | Pre-Merger
NAV | | | Rate | | | Shares | | | Dollars | | | Post-Merger
NAV | | Post Merger Class |
ICON Consumer Discretionary Fund– A Class | | $ | 13.13 | | | | 1.5057 | | | | 60,322 | | | $ | 526,159 | | | $ | 8.72 | | ICON Consumer Select Fund – Investor Class |
ICON Consumer Discretionary Fund– S Class | | $ | 13.88 | | | | 1.5880 | | | | 2,090,189 | | | $ | 18,266,581 | | | $ | 8.74 | | ICON Consumer Select Fund – Institutional Class |
On June 16, 2020, the shareholders of the ICON Fund approved the agreement and plan of reorganization providing for the transfer of assets and assumption of liabilities into the ICON Equity Fund. The ICON Equity Fund is the performance and accounting survivor of the reorganization, as well as the legal and tax survivor. The reorganization was effective as of the close of business on July 10, 2020. The following table illustrates the specifics of the Fund’s reorganization:
ICON Fund Pre-
Reorganization Net Assets | New Shares issued
to Shareholders
of ICON Fund | ICON Equity Fund
Net Assets | Combined Net Assets | Tax Status of Transfer |
$36,394,016(a) | 1,450,487 | $14,773,317 | $63,726,389(b) | Non-taxable |
(a) | Includes appreciation in the amount of $8,350,876 from the merged fund. |
(b) | Combined net assets include the reorganization net assets of the ICON Fund and ICON Opportunities Fund. |
38
ICON Funds | Notes to Financial Statements (Unaudited) (Continued) | June 30, 2021 |
As of close of business on July 10, 2020, the classes were converted at the following rates:
Pre-Merger Class | | Pre-Merger
NAV | | | Rate | | | Shares | | | Dollars | | | Post-Merger
NAV | | Post Merger Class |
ICON Fund– A Class | | $ | 16.76 | | | | 0.6860 | | | | 282,617 | | | $ | 6,902,840 | | | $ | 24.42 | | ICON Equity Fund – Investor Class |
ICON Fund– C Class | | $ | 15.10 | | | | 0.6184 | | | | 255,155 | | | $ | 6,232,091 | | | $ | 24.42 | | ICON Equity Fund – Investor Class |
ICON Fund– S Class | | $ | 18.05 | | | | 0.7084 | | | | 912,715 | | | $ | 23,259,085 | | | $ | 25.48 | | ICON Equity Fund – Institutional Class |
On June 3, 2020, the shareholders of the ICON Opportunities Fund approved the agreement and plan of reorganization providing for the transfer of assets and assumption of liabilities into the ICON Equity Fund. The ICON Equity Fund is the performance and accounting survivor of the reorganization, as well as the legal and tax survivor. The reorganization was effective as of the close of business on July 10, 2020. The following table illustrates the specifics of the Fund’s reorganization:
ICON Opportunities
Fund Pre-Reorganization
Net Assets | New Shares issued to
Shareholders of ICON
Opportunities Fund | ICON Equity Fund
Net Assets | Combined Net Assets | Tax Status of Transfer |
$12,559,056(a) | 492,833 | $14,773,317 | $63,726,389(b) | Non-taxable |
(a) | Includes accumulated realized losses and unrealized depreciation in the amounts of $(1,285,585) and $(97,689), respectively, from the merged fund. |
(b) | Combined net assets include the reorganization net assets of the ICON Fund and ICON Opportunities Fund. |
As of close of business on July 10, 2020, the classes were converted at the following rates:
Pre-Merger Class | | Pre-Merger
NAV | | | Rate | | | Shares | | | Dollars | | | Post-Merger
NAV | | Post Merger Class |
ICON Opportunities Fund– S Class | | $ | 11.67 | | | | 0.4580 | | | | 492,833 | | | $ | 12,559,056 | | | $ | 25.48 | | ICON Equity Fund – Institutional Class |
On July 10, 2020, the shareholders of the ICON Energy Fund approved the agreement and plan of reorganization providing for the transfer of assets and assumption of liabilities into the ICON Natural Resources and Infrastructure Fund. The ICON Natural Resources and Infrastructure Fund is the performance and accounting survivor of the reorganization, as well as the legal and tax survivor. The reorganization was effective as of the close of business on July 10, 2020. The following table illustrates the specifics of the Fund’s reorganization:
ICON Energy Fund Pre-
Reorganization Net Assets | New Shares issued
to Shareholders of
ICON Energy Fund | ICON Natural Resources
and Infrastructure
Fund Net Assets | Combined Net Assets | Tax Status of Transfer |
$52,836,082(a) | 5,058,302 | $38,697,651 | $100,389,461(b) | Non-taxable |
(a) | Includes accumulated realized losses and unrealized depreciation in the amounts of $(208,827,696) and $(30,537,973), respectively, from the merged fund. |
(b) | Combined net assets include the reorganization net assets of the ICON Energy Fund and ICON Industrials Fund. |
As of close of business on July 10, 2020, the classes were converted at the following rates:
Pre-Merger Class | | Pre-Merger
NAV | | | Rate | | | Shares | | | Dollars | | | Post-Merger
NAV | | Post Merger Class |
ICON Energy Fund– A Class | | $ | 5.72 | | | | 0.5543 | | | | 147,022 | | | $ | 1,518,698 | | | $ | 10.33 | | ICON Natural Resources and Infrastructure Fund – Investor Class |
ICON Energy Fund– C Class | | $ | 5.42 | | | | 0.5245 | | | | 144,933 | | | $ | 1,497,135 | | | $ | 10.33 | | ICON Natural Resources and Infrastructure Fund – Investor Class |
ICON Energy Fund– S Class | | $ | 5.78 | | | | 0.5534 | | | | 4,766,347 | | | $ | 49,820,249 | | | $ | 10.45 | | ICON Natural Resources and Infrastructure Fund – Institutional Class |
39
ICON Funds | Notes to Financial Statements (Unaudited) (Continued) | June 30, 2021 |
On June 3, 2020, the shareholders of the ICON Industrials Fund approved the agreement and plan of reorganization providing for the transfer of assets and assumption of liabilities into the ICON Natural Resources and Infrastructure Fund. The ICON Natural Resources and Infrastructure Fund is the performance and accounting survivor of the reorganization, as well as the legal and tax survivor. The reorganization was effective as of the close of business on July 10, 2020. The following table illustrates the specifics of the Fund’s reorganization:
ICON Industrials Fund Pre-
Reorganization Net Assets | New Shares issued to
Shareholders of ICON
Industrials Fund | ICON Natural Resources
and Infrastructure
Fund Net Assets | Combined Net Assets | Tax Status of Transfer |
$9,305,728(a) | 890,908 | $38,697,651 | $100,389,461(b) | Non-taxable |
(a) | Includes accumulated realized losses and unrealized appreciation in the amounts of $(728,016) and $103,405, respectively, from the merged fund. |
(b) | Combined net assets include the reorganization net assets of the ICON Energy Fund and ICON Industrials Fund. |
As of close of business on July 10, 2020, the classes were converted at the following rates:
Pre-Merger Class | | Pre-Merger
NAV | | | Rate | | | Shares | | | Dollars | | | Post-Merger
NAV | | Post Merger Class |
ICON Industrials Fund– A Class | | $ | 13.29 | | | | 1.2869 | | | | 52,860 | | | $ | 546,034 | | | $ | 10.33 | | ICON Natural Resources and Infrastructure Fund – Investor Class |
ICON Industrials Fund– S Class | | $ | 13.54 | | | | 1.2958 | | | | 838,048 | | | $ | 8,759,694 | | | $ | 10.45 | | ICON Natural Resources and Infrastructure Fund – Institutional Class |
On July 10, 2020, the shareholders of the ICON Healthcare Fund approved the agreement and plan of reorganization providing for the transfer of assets and assumption of liabilities into the ICON Healthcare and Information Technology Fund. ICON Healthcare and Information Technology Fund is the performance and accounting survivor of the reorganization, as well as the legal and tax survivor. The reorganization was effective as of the close of business on July 10, 2020. The following table illustrates the specifics of the Fund’s reorganization:
ICON Healthcare Fund Pre-
Reorganization Net Assets | New Shares issued to
Shareholders of ICON
Healthcare Fund | ICON Healthcare and
Information Technology
Fund Net Assets | Combined Net Assets | Tax Status of Transfer |
$55,158,314(a) | 3,127,315 | $55,902,415 | $111,060,729 | Non-taxable |
(a) | Includes accumulated realized losses and unrealized appreciation in the amounts of $(1,709,471) and $11,006,000, respectively, from the merged fund. |
As of close of business on July 10, 2020, the classes were converted at the following rates:
Pre-Merger Class | | Pre-Merger
NAV | | | Rate | | | Shares | | | Dollars | | | Post-Merger
NAV | | Post Merger Class |
ICON Healthcare Fund – A Class | | $ | 16.62 | | | | 0.9910 | | | | 93,171 | | | $ | 1,563,188 | | | $ | 16.78 | | ICON Healthcare and Information Technology Fund – Investor Class |
ICON Healthcare Fund – S Class | | $ | 17.54 | | | | 0.9930 | | | | 3,034,144 | | | $ | 53,595,126 | | | $ | 17.66 | | ICON Healthcare and Information Technology Fund – Institutional Class |
On July 24, 2020, the shareholders of the ICON Consumer Staples Fund approved the agreement and plan of reorganization providing for the transfer of assets and assumption of liabilities into the ICON Consumer Select Fund. ICON Consumer Select Fund is the performance and accounting survivor of the reorganization, as well as the legal and tax survivor. The reorganization was effective as of the close of business on July 31, 2020. The following table illustrates the specifics of the Fund’s reorganization:
ICON Consumer Staples
Fund Pre-Reorganization
Net Assets | New Shares issued to
Shareholders of ICON
Consumer Staples Fund | Consumer Select
Fund Net Assets | Combined Net Assets | Tax Status of Transfer |
$5,946,877(a) | 657,151 | $45,061,186 | $51,008,063 | Non-taxable |
(a) | Includes accumulated realized losses and unrealized appreciation in the amounts of $(886,480) and $642,576, respectively, from the merged fund. |
40
ICON Funds | Notes to Financial Statements (Unaudited) (Continued) | June 30, 2021 |
As of close of business on July 31, 2020, the classes were converted at the following rates:
Pre-Merger Class | | Pre-Merger
NAV | | | Rate | | | Shares | | | Dollars | | | Post-Merger
NAV | | Post Merger Class |
ICON Consumer Staples Fund– A Class | | $ | 6.69 | | | | 0.7405 | | | | 128,098 | | | $ | 1,157,308 | | | $ | 9.03 | | ICON Consumer Select Fund – Investor Class |
ICON Consumer Staples Fund– S Class | | $ | 6.74 | | | | 0.7440 | | | | 529,053 | | | $ | 4,789,569 | | | $ | 9.05 | | ICON Consumer Select Fund – Institutional Class |
On August 20th, 2020, the shareholders of the ICON Risk-Managed Balanced Fund approved the agreement and plan of reorganization providing for the transfer of assets and assumption of liabilities into the ICON Equity Income Fund. The ICON Equity Income Fund is the performance and accounting survivor of the reorganization, as well as the legal and tax survivor. The reorganization was effective as of the close of business on September 25, 2020. The following table illustrates the specifics of the Fund’s reorganization:
ICON Risk-Managed
Balanced Fund Pre-
Reorganization Net Assets | New Shares issued
to Shareholders of
ICON Risk-Managed
Balanced Fund | ICON Equity Income
Fund Net Assets | Combined Net Assets | Tax Status of Transfer |
$23,191,045(a) | 1,422,769 | $56,406,450 | $79,597,495 | Non-taxable |
(a) | Includes accumulated realized losses and unrealized appreciation in the amounts of $(43,667) and $1,000,554, respectively, from the merged fund. |
As of close of business on September 25, 2020, the classes were converted at the following rates:
Pre-Merger Class | | Pre-Merger
NAV | | | Rate | | | Shares | | | Dollars | | | Post-Merger
NAV | | Post Merger Class |
ICON Risk-Managed Balanced Fund – A Class | | $ | 15.03 | | | | 0.9230 | | | | 152,538 | | | $ | 2,483,964 | | | $ | 16.28 | | ICON Equity Income Fund – Investor Class |
ICON Risk-Managed Balanced Fund – C Class | | $ | 14.00 | | | | 0.8599 | | | | 824,912 | | | $ | 13,433,024 | | | $ | 16.28 | | ICON Equity Income Fund – Investor Class |
ICON Risk-Managed Balanced Fund – S Class | | $ | 15.43 | | | | 0.9449 | | | | 445,319 | | | $ | 7,274,057 | | | $ | 16.33 | | ICON Equity Income Fund – Institutional Class |
Assuming the reorganizations had been completed on October 1, 2019, the beginning of the reporting period for each of the reorganizations, the pro forma results of operations for the year ended September 30, 2020, would be as follows:
| | ICON Consumer
Select Fund | | | ICON Equity Fund | | | ICON Health
and Information
Technology Fund | | | ICON Natural
Resources and
Infrastructure
Fund | |
Net investment income/(loss) | | $ | 16,351 | | | $ | (181,960 | ) | | $ | (516,488 | ) | | $ | 1,704,171 | |
Net realized gain/loss on investments | | | (2,394,731 | ) | | | (1,462,864 | ) | | | 3,555,717 | | | | (47,358,723 | ) |
Change in unrealized appreciation/(depreciation) on investments | | | 1,428,108 | | | | 4,049,456 | | | | 20,800,850 | | | | 16,294,264 | |
Net increase/(decrease) in net assets resulting from operations | | $ | (950,272 | ) | | $ | 2,404,632 | | | $ | 23,840,079 | | | $ | (29,360,288 | ) |
41
ICON Funds | Additional Information | June 30, 2021 |
Fund Holdings
The Fund holdings shown in this report are as of June 30, 2021. Holdings are subject to change at any time, so holdings shown in the report may not reflect current Fund holdings. The Funds’ Form N-PORT filings, when available, will be available on the SEC’s website at www.sec.gov. The information filed in the Form N-PORT, when available, also may be obtained by calling (800) 955-9988.
Proxy Voting Policy
The Fund’s Statement of Additional Information (“SAI”) containing a description of the policies and procedures that the SCM Trust uses to determine how to vote proxies relating to portfolio securities, is available upon request, at no charge, at the phone number above, or on the SEC’s website at www.sec.gov. Because the Funds are newly organized, the Funds did not vote any proxies prior to June 30, 2020 and have not filed a proxy voting record. When available, the Funds’ proxy voting records relating to portfolio securities held during the 12-month period ended June 30, 2021 will be available upon request, at no charge, at the phone number above, or on the SEC’s website at www.sec.gov.
42
Board of Trustees and Executive Officers |
Overall responsibility for management of the Funds rests with the Board of Trustees. The Trustees serve during the lifetime of the Trust and until its termination, or until death, resignation, retirement or removal. The Trustees, in turn, elect the officers of the Fund to actively supervise its day-to-day operations. The officers have been elected for an annual term. The following are the Trustees and Executive Officers of the Funds:
Name | Address | Year of Birth | Position Held with the Trust | Length of
Time Served |
Stephen C. Rogers | 1875 Lawrence Street,
Suite 300
Denver, CO 80202 | 1966 | Chairman of the Board,
Trustee,
President | Since August 1999
Since August 1999
Since August 1999 |
Kevin T. Kogler | 1875 Lawrence Street,
Suite 300
Denver, CO 80202 | 1966 | Trustee | Since May 2006 |
Marco L. Quazzo | 1875 Lawrence Street,
Suite 300
Denver, CO 80202 | 1962 | Trustee | Since August 2014 |
Stephen H. Sutro | 1875 Lawrence Street,
Suite 300
Denver, CO 80202 | 1969 | Trustee | Since May 2006 |
William P. Mock | 1875 Lawrence Street,
Suite 300
Denver, CO 80202 | 1966 | Treasurer | Since February 2010 |
Gregory T. Pusch | 1875 Lawrence Street,
Suite 300
Denver, CO 80202 | 1966 | Chief Compliance Officer, Secretary | Since March 2017 |
Each Trustee oversees the Trust’s four Funds. The principal occupations of the Trustees and Executive Officers of the Funds during the past five years and public directorships held by the Trustees are set forth below:
Stephen C. Rogers* | Chief Executive Officer, Shelton Capital Management, 1999 to present. |
Kevin T. Kogler | President & Founder of MicroBiz, LLC, 2012 to present; Principal, Robertson Piper Software Group, 2006 to 2012; Senior Vice President, Investment Banking, Friedman, Billings Ramsey, 2003 to 2006. |
Marco L. Quazzo | Principal, Bartko Zankel Bunzel & Miller, March 2015-Present; Partner, Barg Coffin Lewis & Trapp LLP (law firm), 2008 to March 2015. |
Stephen H. Sutro | Managing Partner, Duane Morris, LLP (law firm) 2014 to present; Partner, Duane Morris LLP (law firm), 2003 to present. |
William P. Mock | Portfolio Manager, Shelton Capital Management, 2010 to present. |
Gregory T. Pusch | Principal Occupations Past five years: Global Head of Risk & Compliance, Matthews Asia 2015-2016; Head of Legal & Regulatory Compliance / CCO, HarbourVest Partners 2012-2015. |
Additional information about the Trustees may be found in the SAI, which is available without charge by calling (800) 955-9988.
* | Trustee deemed to be an “interested person” of the Trust, as defined in the Investment Company Act of 1940. Mr. Rogers is an interested person because he is the CEO of Shelton Capital Management, the Trust’s Advisor and Administrator. |
43

ITEM 2. CODE OF ETHICS.
Not applicable for semi-annual report.
ITEM 3. AUDIT COMMITTEE FINANCIAL EXPERT.
Not applicable for semi-annual report.
ITEM 4. PRINCIPAL ACCOUNTANT FEES AND SERVICES.
Not applicable for semi-annual report.
ITEM 5. AUDIT COMMITTEE OF LISTED REGISTRANTS.
Not applicable for semi-annual report.
ITEM 6. SCHEDULE OF INVESTMENTS.
| | (a) | Investments in securities of unaffiliated issuers as of the close of the reporting period are included as part of the report to shareholders filed under Item 1 of this Form N-CSR. |
ITEM 7. DISCLOSURE OF PROXY VOTING POLICIES AND PROCEDURES FOR CLOSED-END MANAGEMENT INVESTMENT COMPANIES.
Not applicable.
ITEM 8. PORTFOLIO MANAGERS OF CLOSED-END MANAGEMENT INVESTMENT COMPANIES.
Not applicable.
ITEM 9. PURCHASES OF EQUITY SECURITIES BY CLOSED-END MANAGEMENT INVESTMENT COMPANY AND AFFILIATED PURCHASERS.
Not applicable.
ITEM 10. SUBMISSION OF MATTERS TO A VOTE OF SECURITY HOLDERS.
There have been no material changes to the procedures by which the shareholders may recommend nominees to the Registrant's board of trustees since the Registrant last provided disclosure in response to the requirements of Item 7(d)(2)(ii)(G) of Schedule 14A or this Item.
ITEM 11. CONTROLS AND PROCEDURES.
| | (a) | The Registrant's principal executive and principal financial officers, or persons performing similar functions, have concluded that the Registrant's disclosure controls and procedures (as defined in Rule 30a-3(c) under the Investment Company Act of 1940, as amended (the "1940 Act") (17 CFR 270.30a-3(c)) are effective as of a date within 90 days of the filing date of the report that includes the disclosure required by this paragraph, based on their evaluation of these controls and procedures required by Rule 30a-3(b) under the 1940 Act (17 CFR 270.30a-3(b)) and Rules 13a-15(b) or 15d-15(b) under the Securities Exchange Act of 1934, as amended (17 CFR 240.13a-15(b) or 240.15d-15(b)). |
| | (b) | There were no changes in the Registrant's internal control over financial reporting (as defined in Rule 30a-3(d) under the 1940 Act that occurred during the Registrant's last fiscal half-year (the Registrant's second fiscal half- year in the case of an annual report) that has materially affected, or is reasonably likely to materially affect, the Registrant's internal control over financial reporting |
ITEM 12. EXHIBITS.
| | (a)(1) | Code of Ethics not applicable for semi-annual report. |
SIGNATURES
Pursuant to the requirements of the Securities Exchange Act of 1934 and the Investment Company Act of 1940, the registrant has duly caused this report to be signed on its behalf by the undersigned, thereunto duly authorized.
SCM Trust
| By | /s/ Stephen C. Rogers | |
| | Stephen C. Rogers, Chairman | |
| | Date: August 27, 2021 | |
| | | |
| Pursuant to the requirements of the Securities Exchange Act of 1934 and the Investment Company Act of 1940, this report has been signed below by the following persons on behalf of the Registrant and in the capacities and on the dates indicated. |
| | | |
| By | /s/ Stephen C. Rogers | |
| | Stephen C. Rogers, Chairman | |
| | Date: August 27, 2021 | |
| | | |
| By | /s/ William P. Mock | |
| | William P. Mock, Treasurer | |
| | Date: August 27, 2021 | |