UNITED STATES
SECURITIES AND EXCHANGE COMMISSION
Washington, D.C. 20549
FORM N-CSR
CERTIFIED SHAREHOLDER REPORT OF REGISTERED MANAGEMENT
INVESTMENT COMPANIES
Investment Company Act file number 811-05620
Virtus Total Return Fund Inc.
(Exact name of registrant as specified in charter)
101 Munson Street
Greenfield, MA 01301-9683
(Address of principal executive offices) (Zip code)
Kathryn Santoro, Esq.
Vice President, Chief Legal Officer, Counsel and Secretary for Registrant
One Financial Plaza
Hartford, CT 06103-2608
(Name and address of agent for service)
Registrant’s telephone number, including area code: 866-270-7788
Date of fiscal year end: November 30
Date of reporting period: November 30, 2024
Form N-CSR is to be used by management investment companies to file reports with the Commission not later than 10 days after the transmission to stockholders of any report that is required to be transmitted to stockholders under Rule 30e-1 under the Investment Company Act of 1940 (17 CFR 270.30e-1). The Commission may use the information provided on Form N-CSR in its regulatory, disclosure review, inspection, and policymaking roles.
A registrant is required to disclose the information specified by Form N-CSR, and the Commission will make this information public. A registrant is not required to respond to the collection of information contained in Form N-CSR unless the Form displays a currently valid Office of Management and Budget (“OMB”) control number. Please direct comments concerning the accuracy of the information collection burden estimate and any suggestions for reducing the burden to Secretary, Securities and Exchange Commission, 100 F Street, NE, Washington, DC 20549-1090. The OMB has reviewed this collection of information under the clearance requirements of 44 U.S.C. § 3507.
Item 1. Reports to Stockholders.
| | (a) | Include a copy of the report transmitted to stockholders pursuant to Rule 30e-1 under the Act (17 CFR 270.30e-1). |
The Report to Shareholders is attached herewith.
| Virtus Global Multi-Sector Income Fund |
| Virtus Stone Harbor Emerging Markets Income Fund |
| Virtus Total Return Fund Inc. |
Not FDIC Insured • No Bank Guarantee • May Lose Value
FUND DISTRIBUTIONS AND MANAGED DISTRIBUTION PLAN
The Board of Directors (the “Board,” or the “Directors”) of Virtus Total Return Fund Inc. (the “Fund”) has adopted a Managed Distribution Plan (the “Plan”) which provides for the Fund to make a monthly distribution at the rate of $0.05 per share. Under the terms of the Plan, the Fund seeks to maintain a consistent distribution level that may be paid in part or in full from net investment income, realized capital gains, and a return of capital, or a combination thereof.
If the Fund estimates that it has distributed more than its income and capital gains in a particular period, a portion of your distribution may be a return of capital. A return of capital may occur, for example, when some or all of the money that you invested in the Fund is paid back to you. A return of capital distribution does not necessarily reflect the Fund’s investment performance and should not be confused with “yield” or “income.”
You should not draw any conclusions about the Fund’s investment performance from the amount of the Fund’s distributions or from the terms of the Fund’s Plan.
The amounts and sources of distributions reported in the Fund’s notices issued pursuant to Section 19(a) of the Investment Company Act of 1940 are only estimates and are not being provided for tax reporting purposes. The actual amounts and sources of the amounts for tax reporting purposes will depend upon the Fund’s investment results during its fiscal year and may be subject to changes based on tax regulations. The Fund will send shareholders a Form 1099-DIV for the calendar year that will tell you how to report distributions for federal income tax purposes.
The Board may amend, suspend or terminate the Plan at any time, without prior notice to shareholders, if it deems such action to be in the best interest of the Fund and its shareholders.
Information on the Fund is available through the closed-end fund section on the web at
www.Virtus.com. Section 19(a) notices are posted on the website at:
https://www.virtus.com/ZTR
To Virtus Closed-End Fund Shareholders:
I am pleased to present this annual report, which reviews the performance of your Fund for the 12 months ended November 30, 2024.
The 12-month period saw strong returns across asset classes. Despite several unpredictable global events, markets were fueled by investor optimism about artificial intelligence (AI), as well as continued improvement in inflation data. The Federal Reserve (the “Fed”) began its much-anticipated easing of monetary policy, lowering its benchmark interest rate by a total of 0.75% during the fiscal year. Investors continued to believe that an economic soft landing would be possible, driving markets higher.
Domestic and international equity indexes posted strong returns for the 12 months ended November 30, 2024. U.S. large-capitalization stocks returned 33.89%, as measured by the S&P 500® Index, while small-cap stocks returned 36.43%, as measured by the Russell 2000® Index. Within international equities, developed markets, as measured by the MSCI EAFE® Index (net), returned 11.88%, roughly the same as emerging markets, which were up 11.86% as measured by the MSCI Emerging Markets Index (net).
In fixed income markets, the yield on the 10-year Treasury fell to 4.18% on November 30, 2024, from 4.37% on November 30, 2023. The broader U.S. fixed income market, as represented by the Bloomberg U.S. Aggregate Bond Index, was up 6.88% for the 12-month period, while non-investment grade bonds, as measured by the Bloomberg U.S. Corporate High Yield Bond Index, posted a strong return of 12.71%.
For the fiscal year, the three sectors of emerging markets (EM) debt returned 13.16% for hard currency sovereign debt, as represented by the JPMorgan EMBI Global Diversified Index, 11.54% for hard currency corporate debt, as represented by the JPMorgan CEMBI Broad Diversified Index, and 2.73% for local currency sovereign debt, as represented by the JPMorgan GBI-EM Global Diversified Index.
If you need assistance or have any questions about your Fund, please call our shareholder service team at 1-866-270-7788. We are grateful for your business and committed to your long-term financial success.
Sincerely,
George R. Aylward
President and Chief Executive Officer
Virtus Closed-End Funds
January 2025
Refer to the Fund Summary section for your Fund’s performance. Performance data quoted represents past results. Past performance is no guarantee of future results, and current performance may be higher or lower than the performance shown.
Global Multi-Sector Income Fund
MANAGER’S DISCUSSION OF FUND PERFORMANCE (Unaudited)
November 30, 2024
About the Fund:
Virtus Global Multi-Sector Income Fund’s (NYSE: VGI) (the “Fund”) investment objective is to maximize current income while preserving capital. The Fund seeks to achieve its investment objective by applying extensive credit research to capitalize on opportunities across undervalued areas of the global bond markets. There is no guarantee that the Fund will achieve its investment objective.
The use of leverage allows the Fund to borrow at short-term rates with the expectation to invest at higher yields on its investments. As of November 30, 2024, the Fund’s leverage consisted of $43 million of borrowings made pursuant to margin financing, which represented approximately 30% of the Fund’s total assets.
Manager Comments – Newfleet Asset Management (“Newfleet”)
Newfleet’s multi-sector fixed income strategies team manages the Fund, leveraging the knowledge and skills of investment professionals with expertise in every sector of the bond market, including evolving, specialized, and out-of-favor sectors. The team employs active sector rotation and disciplined risk management for portfolio construction, avoiding interest rate bets and remaining duration neutral. The following commentary is provided by the respective portfolio team at Newfleet and covers the Fund’s portfolio for the fiscal year ended November 30, 2024.
How did the markets perform during the Fund’s fiscal year ended November 30, 2024?
After U.S. economic data from the first half of 2024 kept the Federal Reserve’s (the “Fed”) interest rate activity on hold, continued improvement in inflation data and a rise in the unemployment rate gave the Fed the confidence to adjust monetary policy. The Fed lowered its benchmark interest rate by 0.50% in September, with a subsequent 0.25% cut in November. These were the first reductions since March 2020, during the height of the COVID pandemic, and since the rate hiking cycle began in March 2022 that led to 11 consecutive rate increases for a cumulative 5.25% of monetary policy tightening. U.S. economic performance remained remarkably resilient in the face of higher rates, and at the end of the reporting period, the U.S. still appeared to be headed toward the often-elusive soft landing.
The Fed joined the ranks of other central banks that had already commenced monetary policy easing, including the European Central Bank (“ECB”), the Bank of England, and central banks in Switzerland, Sweden, and Canada. On the other hand, the Bank of Japan stood out with its tightening bias. Global monetary policy remained semi-desynchronized during the fiscal year, with uncertainty about the pace and magnitude of rate cuts. This condition contributed to a stretch of volatility during the period as popular currency trades were adjusted to reflect this reality.
Through the end of the reporting period, the world navigated a year in which political activity was the most active in recent history, including a tumultuous U.S. election cycle that culminated in a win for President-Elect Trump. While the common theme this year was one of several “surprise” outcomes, resulting local financial market volatility proved short-lived and ultimately rewarded active managers who took advantage of dislocations.
For information regarding the indexes and certain key investment terms, see Key Investment Terms starting on page 18.
Global Multi-Sector Income Fund
MANAGER’S DISCUSSION OF FUND PERFORMANCE (Unaudited) (Continued)
November 30, 2024
Most risk markets rejoiced at the Goldilocks environment of slowing inflation, low unemployment, resilient earnings, and economic growth that exceeded expectations during the 12-month period. However, sensitivity to this data remained high, and results were varied during the period. Fixed income sector performance was also variable, with interest rates lowering during the period. Spread sectors, or securities other than risk-free government debt, outperformed U.S. Treasuries and spreads tightened. Spread refers to the additional yield over the yield of a risk-free government bond. Within spread sectors, longer duration and risk asset classes outperformed. The U.S. Treasury yield curve shifted lower, and the shape of the curve normalized. The 2-year Treasury yield decreased 0.53%, the 5-year Treasury yield decreased by 0.22%, the 10-year Treasury yield decreased by 0.16%, and the 30-year Treasury yield moved 0.13% lower.
What factors affected the Fund’s performance during its fiscal year?
For the 12 months ended November 30, 2024, the Fund’s net asset value (“NAV”) returned 13.92%, while its market price returned 24.05%. The Bloomberg Global Aggregate Bond Index, which serves as the Fund’s benchmark, returned 4.64%.
The Fund’s underweight to U.S. Treasuries contributed to performance during the period. Allocation and selection within corporate high yield and emerging markets high yield, as well as Fund positioning within investment grade corporate bonds, had a positive impact on performance for the 12-month period.
The Fund’s overweight to high quality Yankee bonds and selection within bank loans had a negative impact on performance during the period.
Level distribution practice
The Fund has a practice of seeking to maintain a specified level of monthly distributions to shareholders, which may be changed at any time. As a result of this practice, the Fund may pay distributions in excess of the Fund’s taxable net investment income and net realized gains. During the most recent fiscal year, the practice did not have a material impact on the Fund’s investment strategy. Please refer to the financial highlights and federal income tax information note in this report for further information about the Fund’s distributions and its effect on net asset value.
The preceding information is the opinion of portfolio management only through the end of the period of the report as stated on the cover. Any such opinions are subject to change at any time based upon market conditions and should not be relied upon as investment advice.
The Fund’s portfolio holdings are subject to change and may not be representative of the portfolio managers’ current or future investment decisions. The mention of individual securities held by the Fund is for informational purposes only and should not be construed as a recommendation to purchase or sell any securities. Investors seeking financial advice regarding the appropriateness of investing in any securities or investment strategies discussed should consult their financial professional.
For information regarding the indexes and certain key investment terms, see Key Investment Terms starting on page 18.
Global Multi-Sector Income Fund
MANAGER’S DISCUSSION OF FUND PERFORMANCE (Unaudited) (Continued)
November 30, 2024
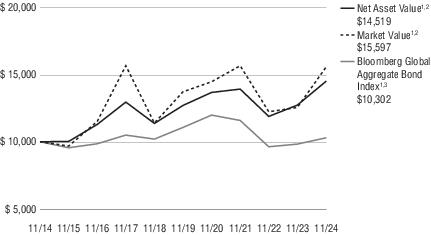
Average Annual Total Returns1 for periods ended 11/30/24
| | 1 Year | 5 Years | 10 Years |
| Market Value1,2 | 24.05% | 2.56% | 4.55% |
| Net Asset Value1,2 | 13.92% | 2.69% | 3.80% |
| Bloomberg Global Aggregate Bond Index1,3 | 4.64% | -1.42% | 0.30% |
All returns represent past performance which is no guarantee of future results. Current performance may be higher or lower than the performance shown. Please visit Virtus.com for performance data current to the most recent month-end.
Growth of $10,000 for periods ended 11/30
This graph shows the change in value of a hypothetical investment of $10,000 in the Fund for the years indicated. For comparison, the same investment is shown in the indicated index.
| 1 | Performance data quoted represents past results. Past performance is no guarantee of future results and current performance may be higher or lower than the performance shown. Investment return and principal value will fluctuate so your shares, when redeemed, may be worth more or less than their original cost. |
| 2 | Performance reflects the deduction of Fund operating expenses. Performance does not reflect the incurrence of brokerage expenses, which typically apply to exchange traded products. Total return net of brokerage expenses would be lower than the total returns on market value shown in the table. Average annual total return is the annual compound return for the indicated period. It reflects the change in share price and the reinvestment of all dividends and capital gains. Returns for periods of one year or less are cumulative returns. |
| 3 | The index is unmanaged and not available for direct investment; therefore, its performance does not reflect the expenses associated with active management of an actual portfolio. |
For information regarding the indexes and certain key investment terms, see Key Investment Terms starting on page 18.
STONE HARBOR EMERGING MARKETS INCOME FUND
MANAGER’S DISCUSSION OF FUND PERFORMANCE (Unaudited)
November 30, 2024
About the Fund:
Virtus Stone Harbor Emerging Markets Income Fund’s (NYSE: EDF) (the “Fund”) investment objective is to maximize total return, which consists of income on its investments and capital appreciation. The Fund normally will invest at least 80% of its net assets (plus any borrowings for investment purposes) in emerging markets securities. There is no guarantee that the Fund will achieve its investment objective.
Effective December 15, 2023, the Virtus Stone Harbor Emerging Markets Total Income Fund was reorganized into Virtus Stone Harbor Emerging Markets Income Fund. The two funds had substantially similar investment objectives and strategies, and the same fund management. The merger resulted in a higher combined level of assets that may offer reduced costs, economies of scale, and increased efficiencies.
The use of leverage currently enables the Fund to borrow at short-term rates with the expectation of investing at higher yields on its investments. During the period, the Fund utilized short-term reverse repurchase agreements through which it borrowed money by selling securities under the obligation to repurchase them at a later date at a fixed price. The Fund’s management team adjusted borrowing levels to reflect the team’s outlook on emerging markets risk, increasing borrowings when it felt opportunities had improved and reducing borrowings when, in the team’s judgment, macroeconomic risk had risen. At November 30, 2024, the Fund had borrowings of approximately $50 million, which represented about 26% of the Fund’s managed assets.
Manager Comments – Stone Harbor Investment Partners (“Stone Harbor”)
Stone Harbor is a global credit specialist with expertise in emerging and developed markets debt. With three decades of informed experience allocating risk in complex areas of the fixed income markets, Stone Harbor manages global credit portfolios for institutional clients around the world. The following commentary is provided by the respective portfolio team at Stone Harbor and covers the Fund’s portfolio for the fiscal year ended November 30, 2024.
How did the markets perform during the Fund’s fiscal year ended November 30, 2024?
U.S. economic data and its implications for monetary policy remained key drivers of risk sentiment throughout much of the reporting period. Following several stronger-than-expected inflation readings in the second quarter of the fiscal year, softer inflation readings finally materialized around the start of the third quarter. Market participants interpreted the disinflationary trend as a precursor for interest rate cuts. This expectation bolstered investor sentiment ahead of the larger-than-expected initial rate cut of 0.50% by the U.S. Federal Reserve (the “Fed”) at its September meeting.
The move by the Fed and subsequent compression of U.S. interest rates helped to spur emerging markets (“EM”) debt performance. Bilateral and multilateral support, including from the International Monetary Fund (“IMF”), was instrumental in supporting several challenged, higher volatility securities. The period was also punctuated by the U.S. presidential race and Donald Trump’s victory, which reignited concerns about trade relations with several large trading partners, including China and Mexico.
For information regarding the indexes and certain key investment terms, see Key Investment Terms starting on page 18.
STONE HARBOR EMERGING MARKETS INCOME FUND
MANAGER’S DISCUSSION OF FUND PERFORMANCE (Unaudited) (Continued)
November 30, 2024
Against this backdrop, the yield on the 10-year U.S. Treasury closed at 4.18% at the end of the reporting period after reaching a period high of 4.70% in April 2024 amid renewed uncertainty about U.S. interest rate policy. Total returns of indexes for emerging markets hard currency sovereign and corporate debt were 13.16% and 11.54%, as represented by the JPMorgan EMBI Global Diversified Index and the JPMorgan CEMBI Broad Diversified Index, respectively, for the 12-month period. Local currency sovereign debt, as represented by the JPMorgan GBI-EM Global Diversified Index, underperformed, posting a total return of 2.73%. The average yield of local currency sovereign debt during the period was 6.30%.
What factors affected the Fund’s performance during its fiscal year?
The Fund’s total return on net asset value (“NAV”) for the 12 months ended November 30, 2024 was 30.38%, while its market price returned 32.71%. For the same period, the Fund’s composite benchmark, which is composed of the three sectors of emerging markets debt (hard currency sovereign debt, corporate debt and local currency sovereign debt), returned 9.09%. A key driver of the Fund’s performance was positive returns from country selection in hard currency sovereign debt.
At the country level, the largest contributors to performance were U.S. dollar-denominated sovereign debt in Argentina, followed by Ecuador and Egypt. U.S. dollar-denominated corporate debt in Mexico, Indonesia, and Colombia also enhanced performance. Other contributors to performance included local currency debt exposure in South Africa, Colombia, and Indonesia.
Some of the positive attribution was offset by other local currency debt exposures, particularly in Brazil, Mexico, and Kazakhstan. The Fund’s exposure to hard currency sovereign debt in Panama, Oman, and Hungary also detracted from performance, although to a much lesser extent.
The Fund uses various derivative instruments to implement its strategies. These derivatives are utilized to manage the Fund’s credit risk, interest rate risk, and foreign exchange risk, and to efficiently gain certain investment exposures. Derivative positions may increase or decrease the Fund’s exposure to these risks. For the reporting period, derivatives contributed 6.41% to Fund performance.
Level distribution practice
The Fund has a practice of seeking to maintain a specified level of monthly distributions to shareholders, which may be changed at any time. As a result of this practice, the Fund may pay distributions in excess of the Fund’s taxable net investment income and net realized gains. During the most recent fiscal year, the practice did not have a material impact on the Fund’s investment strategy. Please refer to the financial highlights and federal income tax information note in this report for further information about the Fund’s distributions and its effect on net asset value.
The preceding information is the opinion of portfolio management only through the end of the period of the report as stated on the cover. Any such opinions are subject to change at any time based upon market conditions and should not be relied upon as investment advice.
For information regarding the indexes and certain key investment terms, see Key Investment Terms starting on page 18.
STONE HARBOR EMERGING MARKETS INCOME FUND
MANAGER’S DISCUSSION OF FUND PERFORMANCE (Unaudited) (Continued)
November 30, 2024
The Fund’s portfolio holdings are subject to change and may not be representative of the portfolio managers’ current or future investment decisions. The mention of individual securities held by the Fund is for informational purposes only and should not be construed as a recommendation to purchase or sell any securities. Investors seeking financial advice regarding the appropriateness of investing in any securities or investment strategies discussed should consult their financial professional.
For information regarding the indexes and certain key investment terms, see Key Investment Terms starting on page 18.
STONE HARBOR EMERGING MARKETS INCOME FUND
MANAGER’S DISCUSSION OF FUND PERFORMANCE (Unaudited) (Continued)
November 30, 2024
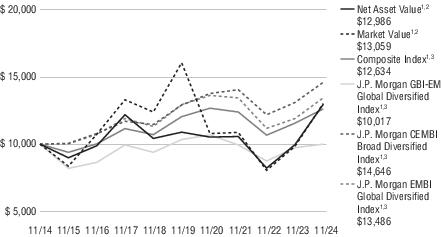
Average Annual Total Returns1 for periods ended 11/30/24
| | 1 Year | 5 Years | 10 Years |
| Market Value1,2 | 32.71% | -4.12% | 2.70% |
| Net Asset Value1,2 | 30.38% | 3.56% | 2.65% |
| Composite Index1,3 | 9.09% | 0.91% | 2.37% |
| J.P. Morgan GBI-EM Global Diversified Index1,3 | 2.73% | -0.67% | 0.02% |
| J.P. Morgan CEMBI Broad Diversified Index1,3 | 11.54% | 2.48% | 3.89% |
| J.P. Morgan EMBI Global Diversified Index1,3 | 13.16% | 0.80% | 3.04% |
All returns represent past performance which is no guarantee of future results. Current performance may be higher or lower than the performance shown. Please visit Virtus.com for performance data current to the most recent month-end.
Growth of $10,000 for periods ended 11/30
This graph shows the change in value of a hypothetical investment of $10,000 in the Fund for the years indicated. For comparison, the same investment is shown in the indicated index.
| 1 | Past performance is not indicative of future results. Current performance may be lower or higher than performance in historical periods. |
For information regarding the indexes and certain key investment terms, see Key Investment Terms starting on page 18.
STONE HARBOR EMERGING MARKETS INCOME FUND
MANAGER’S DISCUSSION OF FUND PERFORMANCE (Unaudited) (Continued)
November 30, 2024
| 2 | Total return on market value is calculated assuming a purchase of common shares on the opening of the first day and sale on the closing of the last day of each period reported. Dividends and distributions are assumed, for purposes of this calculation, to be reinvested at prices obtained under the Fund’s Automatic Reinvestment and Cash Purchase Plan. Total return on market value is not annualized for periods of less than one year. Brokerage commissions that a shareholder may pay are not reflected. Total return on market value does not reflect the deduction of taxes that a shareholder may pay on fund distributions or the sale of fund shares. Total return on net asset value uses the same methodology, but with use of net asset value for the beginning, ending and reinvestment values. |
| 3 | The indexes are unmanaged and not available for direct investment; therefore, their performance does not reflect the expenses associated with active management of an actual portfolio. |
For information regarding the indexes and certain key investment terms, see Key Investment Terms starting on page 18.
TOTAL RETURN FUND INC.
MANAGER’S DISCUSSION OF FUND PERFORMANCE (Unaudited)
November 30, 2024
About The Fund
Virtus Total Return Fund Inc. (NYSE: ZTR) (the “Fund”) has an investment objective of capital appreciation, with current income as a secondary objective. The Fund seeks to meet its objectives through a balance of equity and fixed income investments. There is no guarantee that the Fund will achieve its investment objectives.
The use of leverage currently enables the Fund to borrow at short-term rates with the expectation of investing at higher yields on its investments. As of November 30, 2024, the Fund’s leverage consisted of $168 million of borrowings made pursuant to margin financing, which represented approximately 28% of the Fund’s total assets.
On March 11, 2024, the Fund announced a Tender Offer Program intended to enhance shareholder value, provide shareholders with an additional source of liquidity for their investment, and provide the potential to reduce the Fund’s trading discount to its NAV over time. The Tender Offer Program consists of a tender offer for 10% of the Fund’s outstanding shares at 98% of NAV and two conditional tender offers. As part of the program, the Fund conducted a tender offer for 10% of its outstanding shares and on May 7, 2024, announced that the Fund accepted 6,857,832 shares for payment on May 8, 2024 at a price of 98% of NAV, or $5.9976. On December 2, 2024, after the Fund’s fiscal year-end of November 30, 2024, the Fund announced it met the conditions to trigger its first conditional tender offer when the average trading discount during the measurement period exceeded 12%. The Fund commenced the conditional tender offer for 10% of its outstanding shares at 98% of NAV on January 7, 2025 with an expiration on February 6, 2025, unless extended. The Tender Offer Program concludes with a second conditional tender offer for up to 10% of the Fund’s then outstanding shares at 98% of NAV if the Fund’s average trading discount exceeds 10% during the consecutive 180 calendar day period beginning April 1, 2025.
For the fiscal year ended November 30, 2024, the Fund’s NAV returned 24.24%, including $0.60 in reinvested distributions, and its market price returned 28.66%. For the same period, the Fund’s composite benchmark, which consists of 60% FTSE Developed Core Infrastructure 50/50 Index (net) (representing equities) and 40% Bloomberg U.S. Aggregate Bond Index (representing fixed income) returned 15.00%.
Manager Comments – Duff & Phelps Investment Management Co. (“DPIM”)
The equity portion of the Fund is invested globally in owners/operators of infrastructure in the communications, utility, energy, and transportation industries (also referred to as “essential services”). DPIM manages the equity portion of the Fund’s portfolio, utilizing its global infrastructure strategy that leverages the company’s in-depth fundamental research expertise in income-producing securities. The following commentary is provided by the portfolio management team at DPIM and covers the Fund’s equity portion for the fiscal year ended November 30, 2024.
For information regarding the indexes and certain key investment terms, see Key Investment Terms starting on page 18.
TOTAL RETURN FUND INC.
MANAGER’S DISCUSSION OF FUND PERFORMANCE (Unaudited) (Continued)
November 30, 2024
How did the equity markets perform during the Fund’s fiscal year ended November 30, 2024?
Global developed market equities rose 27.83%, as measured by the MSCI World Index (net), during the 2024 fiscal year. This was a spectacular return, particularly in a year that was overshadowed by geopolitical and economic uncertainty. Central banks initiated interest rate cuts, and investors increasingly believed a soft landing for the economy could be achieved. Optimism surrounding artificial intelligence (“AI”) was also a key driver of market performance, especially in the U.S. In November, the U.S. elections triggered a risk-on trade, while reactions were more cautious outside of the U.S. due to concerns about the potential for future trade conflicts.
The benchmark for the equity portion of the Fund, the FTSE Developed Core Infrastructure 50/50 Index (net), returned 20.58% for the 12-month period, trailing the broader market. Midstream energy and utilities led the way as AI emerged as a powerful new driver of long-term growth. The nearly insatiable power demands of AI data centers led to an “all-of-the-above” approach that featured natural gas-fired power generation and nuclear power in addition to renewables.
Communications and transportation lagged the infrastructure benchmark as macroeconomic conditions tempered investor enthusiasm. Tower stocks and toll roads were challenged by their interest rate sensitivity as rates remained high for most of the year. North American railroads trailed as an anticipated rebound in freight volumes and earnings growth was delayed. European airports provided a bright spot as passenger volumes continued a multi-year rebound.
What factors affected the performance of the Fund’s equity portfolio during the fiscal year?
For the 12 months ended November 30, 2024, the equity portion of the Fund, including the impact of leverage employed by the Fund, returned 31.14% (gross of fees and expenses), while the FTSE Developed Core Infrastructure 50/50 Index (net), which serves as the portfolio’s benchmark, returned 20.58%.
Overall, sector allocation negatively impacted relative returns, while stock selection had a positive impact. Sector allocation was hurt by overweight positions in communications and transportation, as well as an underweight in utilities. The portfolio’s overweight position in midstream energy had a positive allocation impact. Positive stock selection in transportation and communications was partly offset by negative selection in utilities and midstream energy.
For information regarding the indexes and certain key investment terms, see Key Investment Terms starting on page 18.
TOTAL RETURN FUND INC.
MANAGER’S DISCUSSION OF FUND PERFORMANCE (Unaudited) (Continued)
November 30, 2024
At the security level, the largest contributors to performance were NextEra Energy, Aena SME SA, and Targa Resources. NextEra Energy, an electric utility and leading provider of renewable energy in North America, restored investor confidence in its renewables development pipeline by posting record levels of new contracts. In addition, rate case reviews and investigations at its Florida Power & Light regulated utility subsidiary were resolved without any material impact to the company. Spanish airport operator Aena was supported by robust passenger traffic across Europe during the summer holiday season and solid schedules for the winter months. Targa Resources is an integrated midstream energy company that benefited from volume growth and reported sector-leading earnings growth during the fiscal year. Targa also executed significant share repurchases while announcing a substantial dividend increase and maintaining a robust capital spending program.
The largest detractors from performance in the portfolio were Energias de Portugal SA (EDP), Xcel Energy, and Atlas Arteria. EDP, an out-of-benchmark holding based in Portugal, is an integrated electric and gas utility that is also a leading developer of renewable energy. EDP’s stock declined amid commissioning delays at some renewable power projects and lower European power prices during the year. In addition, the stock came under pressure as investors feared that EDP’s renewables portfolio in the U.S. could face risks if the Inflation Reduction Act of 2022 (IRA) is repealed. Xcel Energy is a multi-state electric and natural gas utility. Xcel’s stock traded lower after one of the company’s electric transmission lines sparked a large wildfire in the panhandle of Texas. The Fund sold its position in Xcel Energy over concerns that the company’s large footprint in western U.S. states posed a risk due to the potential liabilities’ utilities may incur in the absence of improved state legislation. Atlas Arteria, an Australian toll road operator with toll roads in Europe and the U.S., was held at an underweight position and was ultimately sold during the reporting period. The stock lagged due to the approaching expiration of its stake in French toll roads, the company’s largest asset, and management has found it difficult to offset the upcoming value erosion.
Manager Comments - Newfleet Asset Management (“Newfleet”)
How did the fixed income markets perform during the Fund’s fiscal year ended November 30, 2024?
After U.S. economic data from the first half of 2024 kept the Federal Reserve’s (the “Fed”) interest rate activity on hold, continued improvement in inflation data and a rise in the unemployment rate gave the Fed the confidence to adjust monetary policy. The Fed lowered its benchmark interest rate by 0.50% in September, with a subsequent 0.25% cut in November. These were the first reductions since March 2020, during the height of the COVID pandemic, and since the rate hiking cycle began in March 2022 that led to 11 consecutive rate increases for a cumulative 5.25% of monetary policy tightening. U.S. economic performance remained remarkably resilient in the face of higher rates, and at the end of the reporting period, the U.S. still appeared to be headed toward the often-elusive soft landing.
For information regarding the indexes and certain key investment terms, see Key Investment Terms starting on page 18.
TOTAL RETURN FUND INC.
MANAGER’S DISCUSSION OF FUND PERFORMANCE (Unaudited) (Continued)
November 30, 2024
The Fed joined the ranks of other central banks that had already commenced monetary policy easing, including the European Central Bank (“ECB”), the Bank of England, and central banks in Switzerland, Sweden, and Canada. On the other hand, the Bank of Japan stood out with its tightening bias. Global monetary policy remained semi-desynchronized during the fiscal year, with uncertainty about the pace and magnitude of rate cuts. This condition contributed to a stretch of volatility during the period as popular currency trades were adjusted to reflect this reality.
Through the end of the reporting period, the world navigated a year in which political activity was the most active in recent history, including a tumultuous U.S. election cycle that culminated in a win for President-Elect Trump. While the common theme this year was one of several “surprise” outcomes, resulting local financial market volatility proved short-lived and ultimately rewarded active managers who took advantage of dislocations.
Most risk markets rejoiced at the Goldilocks environment of slowing inflation, low unemployment, resilient earnings, and economic growth that exceeded expectations during the 12-month period. However, sensitivity to this data remained high, and results were varied during the period. Fixed income sector performance was also variable, with interest rates lowering during the period. Spread sectors, or securities other than risk-free government debt, outperformed U.S. Treasuries and spreads tightened. Spread refers to the additional yield over the yield of a risk-free government bond. Within spread sectors, longer duration and risk asset classes outperformed. The U.S. Treasury yield curve shifted lower, and the shape of the curve normalized. The 2-year Treasury yield decreased 0.53%, the 5-year Treasury yield decreased by 0.22%, the 10-year Treasury yield decreased by 0.16%, and the 30-year Treasury yield moved 0.13% lower.
What factors affected the performance of the Fund’s fixed income portfolio during the fiscal year?
For the 12 months ended November 30, 2024, the fixed income portion of the Fund, including the impact of leverage employed by the Fund, returned 15.88% (gross of fees and expenses), while the Bloomberg U.S. Aggregate Bond Index, which serves as the portfolio’s benchmark, returned 6.88%.
The portfolio’s underweight to U.S. Treasuries contributed to performance for the period. Allocation and selection within corporate high yield, the portfolio’s allocation to emerging markets high yield, and positioning within investment grade corporate bonds had a positive impact on performance for the 12-month period.
The portfolio’s yield curve positioning relative to the Bloomberg U.S. Aggregate Index detracted from performance, as did the underweight to investment grade corporate bonds, which performed well during the period. Selection within bank loans and emerging markets high yield had a negative impact on performance during the period.
For information regarding the indexes and certain key investment terms, see Key Investment Terms starting on page 18.
TOTAL RETURN FUND INC.
MANAGER’S DISCUSSION OF FUND PERFORMANCE (Unaudited) (Continued)
November 30, 2024
Managed Distribution Plan
As discussed on the inside cover of this Report, the Fund currently operates under a Managed Distribution Plan (the “Plan”) pursuant to which the Fund makes a monthly distribution at a rate of $0.05 per share. As a result of execution on the Plan, the Fund may pay distributions in excess of the Fund’s taxable net investment income and net realized gains. During the most recent fiscal year, the Plan did not have a material impact on the Fund’s investment strategy. Please refer to the financial highlights and federal income tax information note in this report for further information about the Fund’s distributions and its effect on net asset value.
The preceding information is the opinion of portfolio management only through the end of the period of the report as stated on the cover. Any such opinions are subject to change at any time based upon market conditions and should not be relied upon as investment advice.
The Fund’s portfolio holdings are subject to change and may not be representative of the portfolio managers’ current or future investment decisions. The mention of individual securities held by the Fund is for informational purposes only and should not be construed as a recommendation to purchase or sell any securities. Investors seeking financial advice regarding the appropriateness of investing in any securities or investment strategies discussed should consult their financial professional.
For information regarding the indexes and certain key investment terms, see Key Investment Terms starting on page 18.
TOTAL RETURN FUND INC.
MANAGER’S DISCUSSION OF FUND PERFORMANCE (Unaudited) (Continued)
November 30, 2024
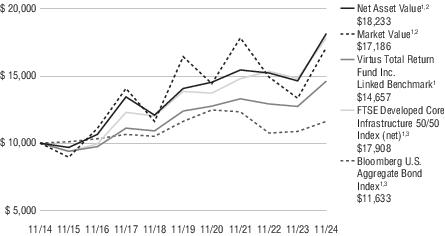
Average Annual Total Returns1 for periods ended 11/30/24
| | 1 Year | 5 Years | 10 Years |
| Market Value1,2 | 28.66% | 0.83% | 5.56% |
| Net Asset Value1,2 | 24.24% | 5.25% | 6.18% |
| Virtus Total Return Fund Inc. Linked Benchmark1 | 15.00% | 3.39% | 3.90% |
| Bloomberg U.S. Aggregate Bond Index1,3 | 6.88% | -0.01% | 1.52% |
| FTSE Developed Core Infrastructure 50/50 Index (net)1,3 | 20.58% | 5.23% | 6.00% |
All returns represent past performance which is no guarantee of future results. Current performance may be higher or lower than the performance shown. Please visit Virtus.com for performance data current to the most recent month-end.
Growth of $10,000 for periods ended 11/30
This graph shows the change in value of a hypothetical investment of $10,000 in the Fund for the years indicated. For comparison, the same investment is shown in the indicated index.
| 1 | Past performance is not indicative of future results. Current performance may be lower or higher than performance in historical periods. |
For information regarding the indexes and certain key investment terms, see Key Investment Terms starting on page 18.
TOTAL RETURN FUND INC.
MANAGER’S DISCUSSION OF FUND PERFORMANCE (Unaudited) (Continued)
November 30, 2024
| 2 | Total return on market value is calculated assuming a purchase of common shares on the opening of the first day and sale on the closing of the last day for each period reported. Dividends and distributions are assumed, for the purpose of this calculation, to be reinvested at prices under the Fund’s Automatic Reinvestment and Cash Purchase Plan. Total return on market value is not annualized for periods of less than one year. Brokerage commissions that a shareholder may pay are not reflected. Total return on market value does not reflect the deduction of taxes that a shareholder may pay on fund distributions or the sale of fund shares. Total return on net asset value uses the same methodology, but with the use of net asset value for beginning and ending values. |
| 3 | The index is unmanaged and not available for direct investment; therefore, its performance does not reflect the expenses associated with active management of an actual portfolio. |
For information regarding the indexes and certain key investment terms, see Key Investment Terms starting on page 18.
PORTFOLIO HOLDINGS SUMMARY WEIGHTINGS (Unaudited)
November 30, 2024
The following tables present the portfolio holdings within certain industries/sectors or countries as a percentage of total investments (excluding reverse repurchase agreements and swap contracts) at November 30, 2024.
Asset Allocation
Global Multi-Sector Income Fund
| Corporate Bonds and Notes | | 40% |
| Financials | 13% | |
| Energy | 9 | |
| Industrials | 4 | |
| All other Corporate Bonds and Notes | 14 | |
| Foreign Government Securities | | 30 |
| Mortgage-Backed Securities | | 12 |
| Leveraged Loans | | 10 |
| Asset-Backed Securities | | 7 |
| U.S. Government Securities | | 1 |
| Total | | 100% |
Stone Harbor Emerging Markets Income Fund
| Foreign Government Securities | | 71% |
| Corporate Bonds and Notes | | 27 |
| Exploration & Production | 14% | |
| Financial & Lease | 3 | |
| Electric | 3 | |
| Refining | 2 | |
| All other Corporate Bonds and Notes | 5 | |
| Credit Linked Notes | | 2 |
| Total | | 100% |
Total Return Fund Inc.
| Common Stocks | | 76% |
| Utilities | 37% | |
| Industrials | 20 | |
| Energy | 13 | |
| All Other Common Stocks | 6 | |
| Corporate Bonds and Notes | | 9 |
| Financials | 3 | |
| Energy | 2 | |
| Industrials | 1 | |
| All Other Corporate Bonds and Notes | 3 | |
| Mortgage-Backed Securities | | 5 |
| Leveraged Loans | | 3 |
| Asset-Backed Securities | | 3 |
| Foreign Government Securities | | 3 |
| U.S. Government Securities | | 1 |
| Total | | 100% |
PORTFOLIO HOLDINGS SUMMARY WEIGHTINGS (Unaudited) (Continued)
Global Multi-Sector Income Fund
| United States | 53% |
| Mexico | 4 |
| Turkey | 3 |
| Saudi Arabia | 3 |
| Indonesia | 3 |
| United Arab Emirates | 2 |
| Canada | 2 |
| Other | 30 |
| Total | 100% |
Stone Harbor Emerging Markets Income Fund
| Mexico | 14% |
| Argentina | 11 |
| Ecuador | 10 |
| Brazil | 6 |
| Egypt | 5 |
| Iraq | 5 |
| Gabon | 5 |
| Other | 44 |
| Total | 100% |
Total Return Fund Inc.
| United States | 62% |
| Spain | 9 |
| Canada | 8 |
| United Kingdom | 5 |
| Netherlands | 3 |
| Switzerland | 2 |
| Germany | 2 |
| Other | 9 |
| Total | 100% |
KEY INVESTMENT TERMS (Unaudited)
November 30, 2024
Bloomberg Global Aggregate Bond Index
The Bloomberg Global Aggregate Bond Index is a flagship measure of global investment grade debt from twenty-four local currency markets. This multi-currency benchmark includes treasury, government-related, corporate and securitized fixed-rate bonds from both developed and emerging markets issuers. The index is calculated on a total return basis. The index is unmanaged, its returns do not reflect any fees, expenses, or sales charges, and is not available for direct investment.
Bloomberg U.S. Aggregate Bond Index
The Bloomberg U.S. Aggregate Bond Index measures the U.S. investment-grade fixed-rate bond market. The index is calculated on a total return basis. The index is unmanaged, its returns do not reflect any fees, expenses, or sales charges, and it is not available for direct investment.
Bloomberg U.S. Corporate High Yield Bond Index
The Bloomberg U.S. Corporate High Yield Bond Index measures the U.S. dollar-denominated, high yield, fixed-rate corporate bond market. The index is calculated on a total return basis. The index is unmanaged, its returns do not reflect any fees, expenses, or sales charges, and it is not available for direct investment.
Stone Harbor Emerging Markets Income Fund Composite Index: 33% J.P. Morgan EMBI Global Diversified / 33% J.P. Morgan CEMBI Broad Diversified / 33% J.P. Morgan GBI-EM Global Diversified
The Stone Harbor Emerging Markets Income Fund composite index consists of 33.33% J.P. Morgan EMBI Global Diversified Index, 33.33% J.P. Morgan CEMBI Broad Diversified Index and 33.33% J.P. Morgan GBI-EM Global Diversified Index. The index is unmanaged, its returns do not reflect any fees, expenses, or sales charges, and it is not available for direct investment.
Designated Activity Company (“DAC”)
A new company type that was created as part of the New Companies Act 2014, which came into force on June 1st, 2015, in Ireland. This limited company type is applicable to those companies who wish to outline and define a specific type of business in their constitution, rather than have unlimited powers as per the LTD company type.
European Central Bank (“ECB”)
The ECB is responsible for conducting monetary policy for the Euro zone. The ECB was established as the core of the Eurosystem and the European System of Central Banks (“ESCB”). The ESCB comprises the ECB and the National Central Banks of all 17 European Union Member States whether or not they have adopted the Euro.
European Union (“EU”)
The EU is a unique economic and political union of 28 European countries. The EU was created in the aftermath of the Second World War and has developed an internal single market through a standardized system of laws that apply to all member states. A monetary union was established in 1999 and is composed of the 19 member states which use the Euro currency.
Exchange-Traded Fund (“ETF”)
An open-end fund that is traded on a stock exchange. Most ETFs have a portfolio of stocks or bonds that track a specific market index.
Federal Reserve (the “Fed”)
The central bank of the U.S., responsible for controlling money supply, interest rates and credit with the goal of keeping the U.S. economy and currency stable. Governed by a seven-member
KEY INVESTMENT TERMS (Unaudited) (Continued)
November 30, 2024
board, the system includes 12 regional Federal Reserve Banks, 25 branches, and all national and state banks that are part of the system.
FTSE Developed Core Infrastructure 50/50 Index (net)
The FTSE Developed Core Infrastructure 50/50 Index (net) is a free float-adjusted market capitalization-weighted index that gives participants an industry-defined interpretation of infrastructure and adjusts the exposure to certain infrastructure sub-sectors. The constituent weights for the index are 50% utilities, 30% transportation including capping of 7.5% for railroads/railways and a 20% mix of other sectors including pipelines, satellites, and telecommunication towers. The index is calculated on a total return basis with net dividends reinvested. The index is unmanaged, its returns do not reflect any fees, expenses, or sales charges, and is not available for direct investment.
Hard Currency
Hard currency refers to a currency that is generally issued by developed countries, globally traded, and seen as politically and economically stable. Generally, when a fund invests in hard currency sovereign debt, that debt is denominated in U.S. Dollars.
International Monetary Fund (“IMF”)
The International Monetary Fund is a major financial agency of the United Nations, and an international financial institution, headquartered in Washington, D.C., consisting of 190 countries. The IMF works to achieve sustainable growth and prosperity for all of its member countries by supporting economic policies that promote financial stability and monetary cooperation, which are essential to increase productivity, job creation, and economic well-being.
J.P. Morgan CEMBI Broad Diversified Index
The J.P. Morgan CEMBI Broad Diversified Index tracks total returns of U.S. dollar-denominated debt instruments issued by corporate entities in emerging market countries and consists of an investable universe of corporate bonds. The minimum amount outstanding required is $300 million for the J.P. Morgan CEMBI Broad Diversified. The J.P. Morgan CEMBI Broad Diversified limits the weights of those index countries with larger corporate debt stocks by only including a specified portion of these countries’ eligible current face amounts of debt outstanding. The index is calculated on a total return basis. The index is unmanaged, its returns do not reflect any fees, expenses, or sales charges, and it is not available for direct investment.
J.P. Morgan EMBI Global Diversified Index
The J.P. Morgan EMBI Global Diversified Index (EMBI Global Diversified) tracks total returns for U.S. dollar-denominated debt instruments issued by emerging markets sovereign and quasi-sovereign entities: Brady bonds, loans, and Eurobonds. The index limits the weights of those index countries with larger debt stocks by only including specified portions of these countries’ eligible current face amounts outstanding. The index is unmanaged, its returns do not reflect any fees, expenses, or sales charges, and it is not available for direct investment.
J.P. Morgan GBI-EM Global Diversified Index
The J.P. Morgan GBI-EM Global Diversified Index consists of regularly traded, liquid fixed-rate, domestic currency government bonds to which international investors can gain exposure. The weightings among the countries are more evenly distributed within this index. The index is calculated on a total return basis. The index is unmanaged, its returns do not reflect any fees, expenses, or sales charges, and it is not available for direct investment.
Joint Stock Company (“JSC”)
A joint-stock company is a business entity in which shares of the company’s stock can be bought and sold by shareholders. Each shareholder owns company stock in proportion, evidenced by
KEY INVESTMENT TERMS (Unaudited) (Continued)
November 30, 2024
their shares (certificates of ownership). Shareholders are able to transfer their shares to others without any effects to the continued existence of the company.
London Interbank Offered Rate (“LIBOR”)
A benchmark rate that some of the world’s leading banks charge each other for short-term loans and that serves as the first step to calculating interest rates on various loans throughout the world.
MSCI Emerging Markets Index (net)
The MSCI Emerging Markets Index (net) is a free float-adjusted market capitalization-weighted index designed to measure equity market performance in the global emerging markets. The index is calculated on a total return basis with net dividends reinvested. The index is unmanaged, its returns do not reflect any fees, expenses, or sales charges, and it is not available for direct investment.
MSCI EAFE® Index (net)
The MSCI EAFE® (Europe, Australasia, Far East) Index (net) is a free float-adjusted market capitalization-weighted index that measures developed foreign market equity performance, excluding the U.S. and Canada. The index is calculated on a total return basis with net dividends reinvested. The index is unmanaged, its returns do not reflect any fees, expenses, or sales charges, and it is not available for direct investment.
MSCI World Index (net)
The MSCI World Index (net) is a free float-adjusted market capitalization-weighted index that measures developed global market equity performance. The index is calculated on a total return basis with net dividends reinvested. The index is unmanaged, its returns do not reflect any fees, expenses, or sales charges, and it is not available for direct investment.
Russell 2000® Index
The Russell 2000® Index is a market capitalization-weighted index of the 2,000 smallest companies in the Russell Universe, which comprises the 3,000 largest U.S. companies. The index is calculated on a total return basis with dividends reinvested. The index is unmanaged, its returns do not reflect any fees, expenses, or sales charges, and it is not available for direct investment.
S&P 500® Index
The S&P 500® Index is a free-float market capitalization-weighted index of 500 of the largest U.S. companies. The index is calculated on a total return basis with dividends reinvested. The index is unmanaged, its returns do not reflect any fees, expenses, or sales charges, and it is not available for direct investment.
Secured Overnight Financing Rate (“SOFR”)
A broad measure of the cost of borrowing cash overnight collateralized by U.S. Treasury securities.
Virtus Total Return Fund Inc. Linked Benchmark
The Virtus Total Return Fund Inc. Linked Benchmark consists of 60% FTSE Developed Core Infrastructure 50/50 Index (net) and 40% Bloomberg U.S. Aggregate Bond Index. Performance of the Virtus Total Return Fund Linked benchmark prior to 3/1/2017 represents an allocation of 60% MSCI World Infrastructure Sector Capped lndex and 40% Bloomberg U.S. Aggregate Bond Index.
KEY INVESTMENT TERMS (Unaudited) (Continued)
November 30, 2024
Yield Curve
A line that plots the interest rates, at a set point in time, of bonds having equal credit quality, but differing maturity dates. The most frequently reported yield curve compares the three-month, two-year, five-year and 30-year U.S. Treasury debt. This yield curve is used as a benchmark for other debt in the market, such as mortgage rates or bank lending rates. The curve is also used to predict changes in economic output and growth.
Global Multi-Sector Income Fund
SCHEDULE OF INVESTMENTS
November 30, 2024
($ reported in thousands)
| | Par Value(1) | | Value |
| U.S. Government Securities—0.7% |
| U.S. Treasury Bonds | | | |
| 4.250%, 2/15/54 | $ 130 | | $ 127 |
| 4.625%, 5/15/54 | 575 | | 598 |
Total U.S. Government Securities
(Identified Cost $707) | | 725 |
| | | | |
| |
| Foreign Government Securities—42.5% |
| Abu Dhabi Government International Bond | | | |
144A
5.000%, 4/30/34(2)(3) | 245 | | 249 |
144A
3.875%, 4/16/50(2)(3) | 310 | | 248 |
Arab Republic of Egypt 144A
8.500%, 1/31/47(2) | 1,172 | | 943 |
Benin Government International Bond 144A
7.960%, 2/13/38(2) | 39 | | 38 |
Bolivarian Republic of Venezuela RegS
7.650%, 4/21/25(4)(5) | 1,380 | | 174 |
Brazil Notas do Tesouro Nacional Series F
10.000%, 1/1/31 | 1,200 BRL | | 171 |
Costa Rica Government 144A
6.550%, 4/3/34(2) | 341 | | 351 |
Czech Republic
1.750%, 6/23/32 | 5,200 CZK | | 188 |
| Dominican Republic | | | |
144A
5.500%, 2/22/29(2) | 142 | | 139 |
144A
4.875%, 9/23/32(2) | 899 | | 825 |
144A
6.850%, 1/27/45(2) | 305 | | 312 |
Dubai Government International Bonds RegS
3.900%, 9/9/50(3)(5) | 205 | | 150 |
Federal Republic of Ethiopia 144A
6.625%, 12/11/24(2)(4) | 470 | | 370 |
| Federative Republic of Brazil | | | |
| 6.000%, 10/20/33 | 297 | | 294 |
| | Par Value(1) | | Value |
| | | | |
| Foreign Government Securities—continued |
| 4.750%, 1/14/50 | $ 365 | | $ 267 |
| 7.125%, 5/13/54 | 907 | | 901 |
| Finance Department Government of Sharjah | | | |
144A
6.500%, 11/23/32(2) | 300 | | 316 |
144A
4.000%, 7/28/50(2) | 1,075 | | 719 |
Gaci First Investment Co. RegS
4.875%, 2/14/35(3)(5) | 560 | | 541 |
Honduras Government 144A
8.625%, 11/27/34(2) | 279 | | 278 |
Hungary Government International Bond 144A
6.250%, 9/22/32(2)(3) | 803 | | 829 |
Islamic Republic of Pakistan 144A
7.375%, 4/8/31(2) | 111 | | 93 |
Kingdom of Bahrain 144A
5.625%, 5/18/34(2) | 595 | | 548 |
Kingdom of Jordan 144A
5.850%, 7/7/30(2) | 250 | | 238 |
| Kingdom of Morocco | | | |
144A
3.000%, 12/15/32(2) | 193 | | 159 |
144A
5.500%, 12/11/42(2) | 95 | | 86 |
Lebanese Republic RegS
7.000%, 3/23/32(4)(5) | 570 | | 53 |
Malaysia Government Bond
2.632%, 4/15/31(3) | 920 MYR | | 194 |
Mex Bonos Desarr
7.750%, 11/13/42(3) | 4,700 MXN | | 184 |
| Oman Government International Bond | | | |
144A
7.375%, 10/28/32(2) | 595 | | 668 |
144A
6.750%, 1/17/48(2) | 52 | | 54 |
Republic of Angola 144A
8.750%, 4/14/32(2) | 912 | | 816 |
Republic of Argentina
0.750%, 7/9/30(6) | 2,620 | | 1,932 |
See Notes to Financial Statements
Global Multi-Sector Income Fund
SCHEDULE OF INVESTMENTS (Continued)
November 30, 2024
($ reported in thousands)
| | Par Value(1) | | Value |
| | | | |
| Foreign Government Securities—continued |
Republic of Armenia 144A
3.600%, 2/2/31(2) | $ 245 | | $ 204 |
Republic of Chile
5.330%, 1/5/54(3) | 1,061 | | 1,037 |
| Republic of Colombia | | | |
| 3.250%, 4/22/32(3) | 690 | | 540 |
| 8.000%, 11/14/35 | 743 | | 767 |
| 4.125%, 5/15/51 | 475 | | 284 |
| Republic of Ecuador | | | |
144A
6.900%, 7/31/30(2)(6) | 667 | | 451 |
RegS
6.900%, 7/31/30(5)(6) | 1,110 | | 751 |
Republic of El Salvador 144A
7.650%, 6/15/35(2) | 590 | | 558 |
Republic of Gabon 144A
6.950%, 6/16/25(2) | 100 | | 97 |
| Republic of Ghana | | | |
144A
0.000%, 7/3/26(2)(7) | 10 | | 9 |
144A
5.000%, 7/3/29(2)(6) | 236 | | 207 |
144A
0.000%, 1/3/30(2)(7) | 17 | | 14 |
144A
5.000%, 7/3/35(2)(6) | 665 | | 472 |
RegS
0.000%, 7/3/26(5)(7) | 8 | | 7 |
RegS
5.000%, 7/3/29(5)(6) | 61 | | 53 |
RegS
0.000%, 1/3/30(5)(7) | 14 | | 11 |
RegS
5.000%, 7/3/35(5)(6) | 87 | | 62 |
Republic of Guatemala 144A
6.600%, 6/13/36(2) | 727 | | 737 |
| Republic of Indonesia | | | |
| 2.850%, 2/14/30(3) | 1,272 | | 1,154 |
| 4.750%, 9/10/34(3) | 91 | | 89 |
| 5.100%, 2/10/54(3) | 59 | | 57 |
Republic of Iraq RegS
5.800%, 1/15/28(5) | 545 | | 529 |
| Republic of Ivory Coast | | | |
144A
6.375%, 3/3/28(2) | 20 | | 20 |
| | Par Value(1) | | Value |
| | | | |
| Foreign Government Securities—continued |
144A
6.125%, 6/15/33(2) | $ 435 | | $ 395 |
144A
8.250%, 1/30/37(2) | 623 | | 620 |
Republic of Kenya 144A
8.000%, 5/22/32(2) | 249 | | 228 |
| Republic of Nigeria | | | |
144A
7.143%, 2/23/30(2) | 153 | | 138 |
144A
7.375%, 9/28/33(2) | 880 | | 744 |
| Republic of Panama | | | |
| 7.500%, 3/1/31 | 34 | | 36 |
| 8.000%, 3/1/38 | 1,411 | | 1,494 |
Republic of Paraguay 144A
6.000%, 2/9/36(2) | 292 | | 300 |
Republic of Peru
5.875%, 8/8/54(3) | 241 | | 242 |
| Republic of Philippines | | | |
| 4.750%, 3/5/35(3) | 418 | | 408 |
| 3.700%, 3/1/41(3) | 793 | | 655 |
Republic of Poland
4.875%, 10/4/33(3) | 1,110 | | 1,092 |
Republic of Serbia 144A
6.500%, 9/26/33(2) | 497 | | 518 |
| Republic of South Africa | | | |
| 5.875%, 6/22/30 | 98 | | 96 |
| 5.650%, 9/27/47 | 360 | | 283 |
| 8.750%, 2/28/48 | 4,200 ZAR | | 191 |
144A
7.100%, 11/19/36(2) | 196 | | 198 |
Republic of Sri Lanka 144A
6.200%, 5/11/27(2)(4) | 508 | | 338 |
| Republic of Turkiye | | | |
| 7.625%, 4/26/29 | 1,175 | | 1,236 |
| 9.125%, 7/13/30 | 1,168 | | 1,311 |
| 7.625%, 5/15/34 | 533 | | 555 |
| 4.875%, 4/16/43 | 780 | | 567 |
| Republic of Zambia | | | |
144A
5.750%, 6/30/33(2)(6) | 200 | | 177 |
144A
0.500%, 12/31/53(2) | 53 | | 30 |
Republica Orient Uruguay
4.975%, 4/20/55 | 551 | | 511 |
See Notes to Financial Statements
Global Multi-Sector Income Fund
SCHEDULE OF INVESTMENTS (Continued)
November 30, 2024
($ reported in thousands)
| | Par Value(1) | | Value |
| | | | |
| Foreign Government Securities—continued |
Romania Government International Bond 144A
7.125%, 1/17/33(2) | $ 966 | | $ 1,001 |
| Saudi International Bond | | | |
144A
4.875%, 7/18/33(2)(3) | 1,098 | | 1,092 |
144A
4.500%, 10/26/46(2)(3) | 1,655 | | 1,407 |
| State of Qatar | | | |
144A
3.750%, 4/16/30(2)(3) | 450 | | 433 |
144A
4.400%, 4/16/50(2)(3) | 365 | | 323 |
Trinidad & Tobago Government International Bond 144A
6.400%, 6/26/34(2) | 113 | | 111 |
| Ukraine Government Bond | | | |
144A
1.750%, 2/1/29(2)(6) | 43 | | 28 |
144A
0.000%, 2/1/30(2)(6) | 8 | | 4 |
144A
0.000%, 2/1/34(2)(6) | 29 | | 12 |
144A
1.750%, 2/1/34(2)(6) | 43 | | 23 |
144A
0.000%, 2/1/35(2)(6) | 25 | | 14 |
144A
1.750%, 2/1/35(2)(6) | 162 | | 83 |
144A
0.000%, 2/1/36(2)(6) | 21 | | 12 |
144A
1.750%, 2/1/36(2)(6) | 7 | | 4 |
RegS
1.750%, 2/1/29(5)(6) | 51 | | 32 |
RegS
0.000%, 2/1/30(5)(6) | 9 | | 5 |
RegS
0.000%, 2/1/34(5)(6) | 34 | | 14 |
RegS
1.750%, 2/1/34(5)(6) | 51 | | 26 |
RegS
0.000%, 2/1/35(5)(6) | 29 | | 17 |
| | Par Value(1) | | Value |
| | | | |
| Foreign Government Securities—continued |
RegS
1.750%, 2/1/35(5)(6) | $ 59 | | $ 30 |
RegS
0.000%, 2/1/36(5)(6) | 24 | | 14 |
RegS
1.750%, 2/1/36(5)(6) | 8 | | 4 |
| United Mexican States | | | |
| 2.659%, 5/24/31(3) | 310 | | 258 |
| 6.350%, 2/9/35(3) | 628 | | 634 |
| 6.338%, 5/4/53(3) | 427 | | 400 |
| 6.400%, 5/7/54(3) | 750 | | 708 |
Uzbekistan International Bond 144A
6.900%, 2/28/32(2) | 405 | | 403 |
Total Foreign Government Securities
(Identified Cost $42,575) | | 40,893 |
| | | | |
| |
| Mortgage-Backed Securities—16.7% |
| Agency—6.3% | | |
| Federal Home Loan Mortgage Corporation | | | |
Pool #SD6322
4.500%, 8/1/53 | 869 | | 836 |
Pool #SD8382
5.000%, 12/1/53 | 1,408 | | 1,382 |
| Federal National Mortgage Association | | | |
Pool #FS4438
5.000%, 11/1/52 | 837 | | 824 |
Pool #FS7751
4.000%, 3/1/53 | 1,373 | | 1,285 |
Pool #MA4785
5.000%, 10/1/52 | 414 | | 407 |
Pool #MA4805
4.500%, 11/1/52 | 750 | | 721 |
Pool #MA5072
5.500%, 7/1/53 | 634 | | 634 |
| | | | 6,089 |
| | | | |
| |
See Notes to Financial Statements
Global Multi-Sector Income Fund
SCHEDULE OF INVESTMENTS (Continued)
November 30, 2024
($ reported in thousands)
| | Par Value(1) | | Value |
| | | | |
| Non-Agency—10.4% | | |
A&D Mortgage Trust 2023-NQM3, A1 144A
6.733%, 7/25/68(2)(8) | $ 122 | | $ 123 |
Ajax Mortgage Loan Trust 2022-B, A1 144A
3.500%, 3/27/62(2)(8) | 504 | | 477 |
Angel Oak Mortgage Trust 2023-1, A1 144A
4.750%, 9/26/67(2)(8) | 144 | | 142 |
Arroyo Mortgage Trust 2019-1, A1 144A
3.805%, 1/25/49(2)(8) | 62 | | 60 |
BBCMS Mortgage Trust 2018-TALL, A (1 month Term SOFR + 0.919%, Cap N/A, Floor 0.872%) 144A
5.529%, 3/15/37(2)(8) | 480 | | 451 |
Benchmark Mortgage Trust 2023-B38, A2
5.626%, 4/15/56 | 165 | | 166 |
BPR Trust 2022-OANA, A (1 month Term SOFR + 1.898%, Cap N/A, Floor 1.898%) 144A
6.507%, 4/15/37(2)(8) | 270 | | 271 |
BX Trust 2019-OC11, D 144A
4.075%, 12/9/41(2)(8) | 780 | | 711 |
CENT Trust 2023-CITY, A (1 month Term SOFR + 2.620%, Cap N/A, Floor 2.620%) 144A
7.229%, 9/15/38(2)(8) | 275 | | 277 |
Chase Home Lending Mortgage Trust 2023-RPL1, A1 144A
3.500%, 6/25/62(2)(3)(8) | 301 | | 278 |
| Chase Mortgage Finance Corp. | | | |
2016-SH1, M2 144A
3.750%, 4/25/45(2)(8) | 71 | | 64 |
2016-SH2, M2 144A
3.750%, 12/25/45(2)(8) | 184 | | 168 |
CIM Trust 2022-R2, A1 144A
3.750%, 12/25/61(2)(8) | 293 | | 273 |
| COLT Mortgage Loan Trust | | | |
2022-4, A1 144A
4.301%, 3/25/67(2)(8) | 131 | | 128 |
| | Par Value(1) | | Value |
| | | | |
| Non-Agency—continued | | |
2022-5, A1 144A
4.550%, 4/25/67(2)(8) | $ 389 | | $ 383 |
COMM Mortgage Trust 2013-300P, A1 144A
4.353%, 8/10/30(2) | 400 | | 386 |
Ellington Financial Mortgage Trust 2019-2, A3 144A
3.046%, 11/25/59(2)(8) | 25 | | 24 |
Fashion Show Mall LLC 2024-SHOW, A 144A
5.274%, 10/10/41(2)(8) | 280 | | 277 |
FirstKey Homes Trust 2020-SFR2, B 144A
1.567%, 10/19/37(2) | 475 | | 461 |
Homes Trust 2023-NQM2, A1 144A
6.456%, 2/25/68(2)(8) | 415 | | 418 |
JPMorgan Chase Mortgage Trust 2014-5, B2 144A
2.702%, 10/25/29(2)(8) | 163 | | 151 |
MFA Trust 2022-INV2, A1 144A
4.950%, 7/25/57(2)(8) | 606 | | 602 |
Mill City Mortgage Loan Trust 2017-3, B1 144A
3.250%, 1/25/61(2)(8) | 335 | | 297 |
MIRA Trust 2023-MILE, A 144A
6.755%, 6/10/38(2) | 170 | | 177 |
Morgan Stanley Bank of America Merrill Lynch Trust 2015-C22, AS
3.561%, 4/15/48 | 220 | | 214 |
| New Residential Mortgage Loan Trust | | | |
2016-3A, B1 144A
4.000%, 9/25/56(2)(8) | 141 | | 135 |
2016-4A, B1A 144A
4.500%, 11/25/56(2)(8) | 428 | | 415 |
Palisades Mortgage Loan Trust 2021-RTL1, A1 144A
3.487%, 6/25/26(2)(8) | 61 | | 61 |
Provident Funding Mortgage Trust 2019-1, A2 144A
3.000%, 12/25/49(2)(8) | 69 | | 59 |
See Notes to Financial Statements
Global Multi-Sector Income Fund
SCHEDULE OF INVESTMENTS (Continued)
November 30, 2024
($ reported in thousands)
| | Par Value(1) | | Value |
| | | | |
| Non-Agency—continued | | |
ROCK Trust 2024-CNTR, C 144A
6.471%, 11/13/41(2) | $ 215 | | $ 218 |
| Towd Point Mortgage Trust | | | |
2016-4, B1 144A
4.045%, 7/25/56(2)(8) | 260 | | 248 |
2017-1, M1 144A
3.750%, 10/25/56(2)(8) | 265 | | 258 |
2017-4, A2 144A
3.000%, 6/25/57(2)(8) | 171 | | 159 |
2018-6, A2 144A
3.750%, 3/25/58(2)(8) | 215 | | 197 |
Tricon Residential Trust 2021-SFR1, B 144A
2.244%, 7/17/38(2) | 150 | | 143 |
| Verus Securitization Trust | | | |
2022-4, A1 144A
4.474%, 4/25/67(2)(8) | 267 | | 265 |
2022-6, A1 144A
4.910%, 6/25/67(2)(8) | 183 | | 182 |
2022-6, A3 144A
4.910%, 6/25/67(2)(8) | 400 | | 396 |
2023-8, A1 144A
6.259%, 12/25/68(2)(8) | 253 | | 256 |
| | | | 9,971 |
| | | | |
| |
Total Mortgage-Backed Securities
(Identified Cost $16,396) | | 16,060 |
| | | | |
| |
| Asset-Backed Securities—10.7% |
| Automobiles—2.9% | | |
Arivo Acceptance Auto Loan Receivables Trust 2024-1A, B 144A
6.870%, 6/17/30(2) | 396 | | 406 |
DT Auto Owner Trust 2023-1A, D 144A
6.440%, 11/15/28(2) | 450 | | 457 |
Huntington Bank Auto Credit-Linked Notes 2024-1, B1 144A
6.153%, 5/20/32(2) | 223 | | 226 |
| LAD Auto Receivables Trust | | | |
2021-1A, D 144A
3.990%, 11/15/29(2) | 470 | | 465 |
| | Par Value(1) | | Value |
| | | | |
| Automobiles—continued | | |
2023-2A, D 144A
6.300%, 2/15/31(2) | $ 365 | | $ 369 |
OneMain Direct Auto Receivables Trust 2022-1A, C 144A
5.310%, 6/14/29(2) | 320 | | 320 |
U.S. Bank N.A. 2023-1, B 144A
6.789%, 8/25/32(2) | 212 | | 215 |
Veros Auto Receivables Trust 2024-1, C 144A
7.570%, 12/15/28(2) | 350 | | 357 |
| | | | 2,815 |
| | | | |
| |
| Consumer Loans—0.4% | | |
Affirm Asset Securitization Trust 2023-B, A 144A
6.820%, 9/15/28(2) | 350 | | 355 |
| Credit Card—0.4% | | |
Mission Lane Credit Card Master Trust 2023-B, A 144A
7.690%, 11/15/28(2) | 355 | | 358 |
| Other—7.0% | | |
Adams Outdoor Advertising LP 2023-1, A2 144A
6.967%, 7/15/53(2) | 365 | | 380 |
Aqua Finance Trust 2024-A, B 144A
5.060%, 4/18/50(2) | 355 | | 350 |
Auxilior Term Funding LLC 2023-1A, D 144A
7.270%, 12/16/30(2) | 240 | | 244 |
BXG Receivables Note Trust 2023-A, A 144A
5.770%, 11/15/38(2) | 302 | | 306 |
Commercial Equipment Finance LLC 2024-1A, A 144A
5.970%, 7/16/29(2) | 329 | | 332 |
FAT Brands Royalty LLC 2021-1A, A2 144A
5.750%, 4/25/51(2) | 468 | | 394 |
See Notes to Financial Statements
Global Multi-Sector Income Fund
SCHEDULE OF INVESTMENTS (Continued)
November 30, 2024
($ reported in thousands)
| | Par Value(1) | | Value |
| | | | |
| Other—continued | | |
Hardee’s Funding LLC 2024-1A, A2 144A
7.253%, 3/20/54(2) | $ 398 | | $ 407 |
Jersey Mike’s Funding LLC 2019-1A, A2 144A
4.433%, 2/15/50(2) | 1 | | 1 |
Libra Solutions LLC 2024-1A, A 144A
5.880%, 9/30/38(2) | 335 | | 329 |
MetroNet Infrastructure Issuer LLC 2024-1A, A2 144A
6.230%, 4/20/54(2) | 310 | | 317 |
MVW LLC 2024-1A, A 144A
5.320%, 2/20/43(2) | 352 | | 356 |
Octane Receivables Trust 2023-3A, C 144A
6.740%, 8/20/29(2) | 425 | | 437 |
Oportun Funding XIV LLC 2021-A, B 144A
1.760%, 3/8/28(2) | 100 | | 98 |
Planet Fitness Master Issuer LLC 2024-1A, A2I 144A
5.765%, 6/5/54(2) | 420 | | 423 |
Purchasing Power Funding LLC 2024-A, B 144A
6.430%, 8/15/28(2) | 420 | | 425 |
Reach ABS Trust 2024-1A, B 144A
6.290%, 2/18/31(2) | 425 | | 430 |
Retained Vantage Data Centers Issuer LLC 2024-1A, A2 144A
4.992%, 9/15/49(2) | 475 | | 461 |
Trinity Rail Leasing LLC 2019-1A, A 144A
3.820%, 4/17/49(2) | 273 | | 267 |
USQ Rail III LLC 2024-1A, A 144A
4.990%, 9/28/54(2) | 350 | | 343 |
| | Par Value(1) | | Value |
| | | | |
| Other—continued | | |
VFI ABS LLC 2022-1A, B 144A
3.040%, 7/24/28(2) | $ 221 | | $ 221 |
Zaxby’s Funding LLC 2021-1A, A2 144A
3.238%, 7/30/51(2) | 255 | | 232 |
| | | | 6,753 |
| | | | |
| |
Total Asset-Backed Securities
(Identified Cost $10,280) | | 10,281 |
| | | | |
| |
| Corporate Bonds and Notes—57.4% |
| Communication Services—2.8% | | |
Altice France Holding S.A. 144A
6.000%, 2/15/28(2) | 185 | | 49 |
| Altice France S.A. | | | |
| 144A 5.125%, 7/15/29(2)(3) | 125 | | 95 |
| 144A 5.500%, 10/15/29(2)(3) | 185 | | 142 |
CMG Media Corp. 144A
8.875%, 6/18/29(2)(3) | 225 | | 156 |
| CSC Holdings LLC | | | |
| 144A 7.500%, 4/1/28(2)(3) | 295 | | 213 |
| 144A 11.750%, 1/31/29(2) | 200 | | 198 |
DIRECTV Financing LLC 144A
8.875%, 2/1/30(2)(3) | 150 | | 151 |
Gray Television, Inc. 144A
7.000%, 5/15/27(2)(3) | 330 | | 323 |
Hughes Satellite Systems Corp.
6.625%, 8/1/26(3) | 170 | | 139 |
Level 3 Financing, Inc. 144A
3.625%, 1/15/29(2) | 365 | | 291 |
Millennium Escrow Corp. 144A
6.625%, 8/1/26(2)(3) | 250 | | 181 |
Rackspace Technology Global, Inc. 144A
5.375%, 12/1/28(2) | 275 | | 83 |
Sprint Capital Corp.
8.750%, 3/15/32(3) | 235 | | 286 |
See Notes to Financial Statements
Global Multi-Sector Income Fund
SCHEDULE OF INVESTMENTS (Continued)
November 30, 2024
($ reported in thousands)
| | Par Value(1) | | Value |
| | | | |
| Communication Services—continued | | |
Telesat Canada 144A
6.500%, 10/15/27(2)(3) | $ 180 | | $ 59 |
Univision Communications, Inc. 144A
6.625%, 6/1/27(2) | 300 | | 299 |
| | | | 2,665 |
| | | | |
| |
| Consumer Discretionary—2.3% | | |
Aptiv plc
6.875%, 12/15/54(3) | 270 | | 262 |
Ashton Woods USA LLC 144A
4.625%, 4/1/30(2)(3) | 80 | | 74 |
Clarios Global LP 144A
8.500%, 5/15/27(2)(3) | 245 | | 246 |
Ford Motor Credit Co. LLC
7.350%, 3/6/30(3) | 200 | | 215 |
Great Canadian Gaming Corp. 144A
8.750%, 11/15/29(2)(3) | 50 | | 52 |
Meritage Homes Corp. 144A
3.875%, 4/15/29(2)(3) | 183 | | 173 |
Newell Brands, Inc.
6.625%, 9/15/29(3) | 227 | | 233 |
Nissan Motor Acceptance Co. LLC 144A
7.050%, 9/15/28(2)(3) | 145 | | 148 |
Ontario Gaming GTA LP 144A
8.000%, 8/1/30(2)(3) | 175 | | 180 |
PetSmart, Inc. 144A
7.750%, 2/15/29(2)(3) | 145 | | 143 |
Prime Security Services Borrower LLC 144A
6.250%, 1/15/28(2)(3) | 215 | | 215 |
Weekley Homes LLC 144A
4.875%, 9/15/28(2)(3) | 270 | | 258 |
| | | | 2,199 |
| | | | |
| |
| Consumer Staples—1.5% | | |
BAT Capital Corp.
7.750%, 10/19/32(3) | 270 | | 313 |
Herbalife Nutrition Ltd. 144A
7.875%, 9/1/25(2)(3) | 250 | | 250 |
| | Par Value(1) | | Value |
| | | | |
| Consumer Staples—continued | | |
| Kronos Acquisition Holdings, Inc. | | | |
| 144A 8.250%, 6/30/31(2)(3) | $ 180 | | $ 174 |
| 144A 10.750%, 6/30/32(2) | 215 | | 196 |
Pilgrim’s Pride Corp.
6.250%, 7/1/33(3) | 215 | | 225 |
Post Holdings, Inc. 144A
6.375%, 3/1/33(2)(3) | 120 | | 120 |
Triton Water Holdings, Inc. 144A
6.250%, 4/1/29(2)(3) | 125 | | 124 |
| | | | 1,402 |
| | | | |
| |
| Energy—12.9% | | |
Adnoc Murban Rsc Ltd. 144A
4.500%, 9/11/34(2)(3) | 621 | | 594 |
Aker BP ASA 144A
5.125%, 10/1/34(2) | 355 | | 344 |
Alliance Resource Operating Partners LP 144A
8.625%, 6/15/29(2)(3) | 150 | | 158 |
Ascent Resources Utica Holdings LLC 144A
8.250%, 12/31/28(2)(3) | 255 | | 261 |
BP Capital Markets plc
4.875% (3)(9) | 375 | | 363 |
| Columbia Pipelines Operating Co. LLC | | | |
| 144A 6.036%, 11/15/33(2)(3) | 215 | | 227 |
| 144A 6.714%, 8/15/63(2)(3) | 40 | | 45 |
Coronado Finance Pty Ltd. 144A
9.250%, 10/1/29(2)(3) | 150 | | 155 |
CVR Energy, Inc. 144A
8.500%, 1/15/29(2)(3) | 215 | | 211 |
| Ecopetrol S.A. | | | |
| 4.625%, 11/2/31(3) | 195 | | 162 |
| 8.875%, 1/13/33 | 97 | | 100 |
Encino Acquisition Partners Holdings LLC 144A
8.750%, 5/1/31(2)(3) | 65 | | 69 |
Energy Transfer LP Series H
6.500% (9) | 245 | | 245 |
See Notes to Financial Statements
Global Multi-Sector Income Fund
SCHEDULE OF INVESTMENTS (Continued)
November 30, 2024
($ reported in thousands)
| | Par Value(1) | | Value |
| | | | |
| Energy—continued | | |
Flex Intermediate Holdco LLC 144A
3.363%, 6/30/31(2)(3) | $ 290 | | $ 252 |
Genesis Energy LP
8.875%, 4/15/30(3) | 250 | | 261 |
Greensaif Pipelines Bidco S.a.r.l. 144A
6.129%, 2/23/38(2)(3) | 235 | | 240 |
Gulfport Energy Operating Corp. 144A
6.750%, 9/1/29(2)(3) | 80 | | 82 |
Helix Energy Solutions Group, Inc. 144A
9.750%, 3/1/29(2)(3) | 185 | | 200 |
International Petroleum Corp. 144A, RegS
7.250%, 2/1/27(2)(3)(5) | 500 | | 493 |
KazMunayGas National Co. JSC 144A
6.375%, 10/24/48(2) | 244 | | 235 |
Kraken Oil & Gas Partners LLC 144A
7.625%, 8/15/29(2)(3) | 155 | | 154 |
Magnolia Oil & Gas Operating LLC 144A
6.875%, 12/1/32(2)(3) | 30 | | 30 |
Mesquite Energy, Inc. 144A
7.250%, 2/15/23(2) | 135 | | 2 |
Nabors Industries, Inc. 144A
7.375%, 5/15/27(2)(3) | 10 | | 10 |
| Occidental Petroleum Corp. | | | |
| 5.550%, 10/1/34(3) | 70 | | 70 |
| 6.200%, 3/15/40(3) | 140 | | 143 |
| Pertamina Persero PT | | | |
| 144A 2.300%, 2/9/31(2)(3) | 1,075 | | 912 |
| RegS 6.450%, 5/30/44(5) | 231 | | 247 |
Petroleos de Venezuela S.A. 144A
6.000%, 5/16/24(2)(4) | 1,390 | | 128 |
| Petroleos Mexicanos | | | |
| 6.500%, 3/13/27 | 625 | | 610 |
| 6.500%, 1/23/29 | 125 | | 118 |
| 6.700%, 2/16/32 | 648 | | 574 |
| 7.690%, 1/23/50 | 185 | | 145 |
| 6.375%, 1/23/45 | 730 | | 510 |
| | Par Value(1) | | Value |
| | | | |
| Energy—continued | | |
| 6.350%, 2/12/48 | $ 520 | | $ 357 |
Petronas Capital Ltd. 144A
3.500%, 4/21/30(2)(3) | 653 | | 614 |
Plains All American Pipeline LP
5.700%, 9/15/34(3) | 280 | | 287 |
QatarEnergy 144A
2.250%, 7/12/31(2)(3) | 561 | | 481 |
Saudi Arabian Oil Co. 144A
5.250%, 7/17/34(2)(3) | 957 | | 963 |
South Bow Canadian Infrastructure Holdings Ltd. 144A
7.500%, 3/1/55(2)(3) | 85 | | 89 |
Teine Energy Ltd. 144A
6.875%, 4/15/29(2)(3) | 250 | | 245 |
| Transocean, Inc. | | | |
| 144A 8.250%, 5/15/29(2)(3) | 35 | | 35 |
| 144A 8.750%, 2/15/30(2)(3) | 191 | | 199 |
| 144A 8.500%, 5/15/31(2)(3) | 130 | | 132 |
| Venture Global LNG, Inc. | | | |
| 144A 9.000%(2)(3)(9) | 80 | | 83 |
| 144A 9.875%, 2/1/32(2)(3) | 190 | | 211 |
Western Midstream Operating LP
5.250%, 2/1/50(3) | 160 | | 143 |
Williams Cos., Inc. (The)
5.150%, 3/15/34(3) | 280 | | 279 |
| | | | 12,468 |
| | | | |
| |
| Financials—18.9% | | |
| Acrisure LLC | | | |
| 144A 8.250%, 2/1/29(2) | 90 | | 92 |
| 144A 6.000%, 8/1/29(2)(3) | 145 | | 139 |
AerCap Ireland Capital DAC
6.950%, 3/10/55(3) | 150 | | 156 |
Aethon United BR LP 144A
7.500%, 10/1/29(2)(3) | 20 | | 21 |
Allianz SE 144A
6.350%, 9/6/53(2)(3) | 200 | | 210 |
Allstate Corp. (The) Series B (3 month Term SOFR + 3.200%)
7.723%, 8/15/53(3)(8) | 391 | | 392 |
Altice Financing S.A. 144A
5.000%, 1/15/28(2)(3) | 355 | | 283 |
See Notes to Financial Statements
Global Multi-Sector Income Fund
SCHEDULE OF INVESTMENTS (Continued)
November 30, 2024
($ reported in thousands)
| | Par Value(1) | | Value |
| | | | |
| Financials—continued | | |
American Express Co.
5.625%, 7/28/34(3) | $ 160 | | $ 165 |
Apollo Debt Solutions BDC 144A
6.900%, 4/13/29(2)(3) | 170 | | 177 |
Ashtead Capital, Inc. 144A
5.550%, 5/30/33(2)(3) | 310 | | 312 |
Aston Martin Capital Holdings Ltd. 144A
10.000%, 3/31/29(2) | 215 | | 211 |
| Banco de Credito del Peru S.A. | | | |
| 144A 3.125%, 7/1/30(2)(3) | 685 | | 672 |
| RegS 3.125%, 7/1/30(3)(5) | 124 | | 122 |
Banco de Credito e Inversiones S.A. 144A
8.750% (2)(3)(9) | 448 | | 471 |
Banco Mercantil del Norte S.A. 144A
6.625% (2)(9) | 647 | | 581 |
Banco Nacional de Comercio Exterior SNC 144A
4.375%, 10/14/25(2)(3) | 510 | | 506 |
Bancolombia S.A.
4.625%, 12/18/29 | 76 | | 76 |
| Bank of America Corp. | | | |
| 5.015%, 7/22/33(3) | 155 | | 156 |
| 5.425%, 8/15/35(3) | 350 | | 350 |
Bank of New York Mellon Corp. (The) Series G
4.700% (3)(9) | 140 | | 138 |
Barclays plc
7.437%, 11/2/33(3) | 295 | | 333 |
BBVA Bancomer S.A. 144A
5.125%, 1/18/33(2) | 519 | | 484 |
Blackstone Private Credit Fund
2.625%, 12/15/26(3) | 155 | | 147 |
Block, Inc. 144A
6.500%, 5/15/32(2)(3) | 110 | | 113 |
Blue Owl Credit Income Corp.
4.700%, 2/8/27(3) | 174 | | 171 |
BNSF Funding Trust I
6.613%, 12/15/55(3) | 210 | | 211 |
BroadStreet Partners, Inc. 144A
5.875%, 4/15/29(2)(3) | 160 | | 154 |
Capital One Financial Corp.
2.359%, 7/29/32(3) | 145 | | 119 |
| | Par Value(1) | | Value |
| | | | |
| Financials—continued | | |
Charles Schwab Corp. (The) Series H
4.000% (9) | $ 360 | | $ 316 |
Chobani Holdco II LLC 144A
8.750%, 10/1/29(2) | 5 | | 5 |
| Citigroup, Inc. | | | |
| 6.270%, 11/17/33(3) | 270 | | 290 |
| 6.174%, 5/25/34(3) | 134 | | 140 |
Series X
3.875%(3)(9) | 155 | | 150 |
Citizens Financial Group, Inc.
5.718%, 7/23/32(3) | 20 | | 20 |
Corebridge Financial, Inc.
6.375%, 9/15/54(3) | 331 | | 332 |
Deutsche Bank AG
5.403%, 9/11/35(3) | 280 | | 273 |
Drawbridge Special Opportunities Fund LP 144A
3.875%, 2/15/26(2)(3) | 585 | | 568 |
Export-Import Bank Korea
5.125%, 1/11/33 | 670 | | 690 |
F&G Annuities & Life, Inc.
6.500%, 6/4/29(3) | 230 | | 237 |
Fifth Third Bancorp
4.337%, 4/25/33(3) | 245 | | 233 |
Foundry JV Holdco LLC 144A
6.250%, 1/25/35(2)(3) | 275 | | 284 |
| Global Atlantic Fin Co. | | | |
| 144A 7.950%, 6/15/33(2)(3) | 137 | | 155 |
| 144A 7.950%, 10/15/54(2)(3) | 70 | | 73 |
| Goldman Sachs Group, Inc. (The) | | | |
| 3.102%, 2/24/33(3) | 175 | | 154 |
| 6.450%, 5/1/36(3) | 135 | | 148 |
Grifols S.A. 144A
4.750%, 10/15/28(2)(3) | 175 | | 160 |
HA Sustainable Infrastructure Capital, Inc. 144A
6.375%, 7/1/34(2)(3) | 266 | | 268 |
HUB International Ltd. 144A
7.375%, 1/31/32(2)(3) | 35 | | 36 |
Huntington Bancshares, Inc.
5.709%, 2/2/35(3) | 270 | | 276 |
Icon Investments Six DAC
6.000%, 5/8/34(3) | 265 | | 272 |
See Notes to Financial Statements
Global Multi-Sector Income Fund
SCHEDULE OF INVESTMENTS (Continued)
November 30, 2024
($ reported in thousands)
| | Par Value(1) | | Value |
| | | | |
| Financials—continued | | |
ION Trading Technologies S.a.r.l. 144A
9.500%, 5/30/29(2)(3) | $ 105 | | $ 108 |
| JPMorgan Chase & Co. | | | |
| 5.350%, 6/1/34 | 135 | | 138 |
| 6.254%, 10/23/34(3) | 200 | | 216 |
Liberty Mutual Group, Inc. 144A
4.125%, 12/15/51(2)(3) | 155 | | 147 |
Melco Resorts Finance Ltd. 144A
5.375%, 12/4/29(2) | 963 | | 884 |
MetLife, Inc. Series G
3.850% (9) | 220 | | 216 |
Midcap Financial Issuer Trust 144A
6.500%, 5/1/28(2)(3) | 370 | | 362 |
| Morgan Stanley | | | |
| 6.342%, 10/18/33(3) | 160 | | 173 |
| 5.948%, 1/19/38(3) | 174 | | 178 |
MSCI, Inc. 144A
3.625%, 9/1/30(2)(3) | 261 | | 241 |
National Rural Utilities Cooperative Finance Corp. (3 month Term SOFR + 3.172%)
7.761%, 4/30/43(3)(8) | 165 | | 165 |
Nationstar Mortgage Holdings, Inc. 144A
5.750%, 11/15/31(2)(3) | 225 | | 219 |
NatWest Group plc
6.475%, 6/1/34 | 200 | | 207 |
NewCo Holding USD 20 S.a.r.l. 144A
9.375%, 11/7/29(2) | 167 | | 168 |
Nippon Life Insurance Co. 144A
6.250%, 9/13/53(2)(3) | 200 | | 211 |
OneMain Finance Corp.
7.125%, 11/15/31(3) | 285 | | 294 |
Panther Escrow Issuer LLC 144A
7.125%, 6/1/31(2)(3) | 20 | | 21 |
Prudential Financial, Inc.
6.750%, 3/1/53(3) | 220 | | 231 |
Societe Generale S.A. 144A
6.066%, 1/19/35(2)(3) | 370 | | 377 |
| | Par Value(1) | | Value |
| | | | |
| Financials—continued | | |
South Bow USA Infrastructure Holdings LLC 144A
5.584%, 10/1/34(2)(3) | $ 120 | | $ 120 |
State Street Corp. Series I
6.700% (3)(9) | 170 | | 175 |
| Synchrony Financial | | | |
| 4.875%, 6/13/25(3) | 65 | | 65 |
| 3.700%, 8/4/26(3) | 93 | | 91 |
Toronto-Dominion Bank (The)
8.125%, 10/31/82(3) | 235 | | 247 |
| UBS Group AG | | | |
| 144A 9.250%(2)(3)(9) | 35 | | 40 |
| 144A 4.988%, 8/5/33(2)(3) | 310 | | 307 |
| Wells Fargo & Co. | | | |
| 5.389%, 4/24/34(3) | 145 | | 147 |
Series BB
3.900%(9) | 400 | | 389 |
| | | | 18,179 |
| | | | |
| |
| Health Care—2.1% | | |
Catalent Pharma Solutions, Inc. 144A
3.500%, 4/1/30(2)(3) | 255 | | 251 |
Community Health Systems, Inc. 144A
5.250%, 5/15/30(2)(3) | 230 | | 196 |
DENTSPLY SIRONA, Inc.
3.250%, 6/1/30 | 335 | | 300 |
Endo Finance Holdings, Inc. 144A
8.500%, 4/15/31(2) | 130 | | 138 |
HCA, Inc.
5.500%, 6/1/33 | 220 | | 222 |
| LifePoint Health, Inc. | | | |
| 144A 9.875%, 8/15/30(2)(3) | 360 | | 391 |
| 144A 10.000%, 6/1/32(2) | 85 | | 89 |
Molina Healthcare, Inc. 144A
6.250%, 1/15/33(2)(3) | 60 | | 61 |
Prime Healthcare Services, Inc. 144A
9.375%, 9/1/29(2)(3) | 65 | | 66 |
| Universal Health Services, Inc. | | | |
| 2.650%, 1/15/32(3) | 156 | | 131 |
See Notes to Financial Statements
Global Multi-Sector Income Fund
SCHEDULE OF INVESTMENTS (Continued)
November 30, 2024
($ reported in thousands)
| | Par Value(1) | | Value |
| | | | |
| Health Care—continued | | |
| 5.050%, 10/15/34(3) | $ 145 | | $ 139 |
| | | | 1,984 |
| | | | |
| |
| Industrials—6.1% | | |
Adani Ports & Special Economic Zone Ltd. 144A
4.375%, 7/3/29(2)(3) | 999 | | 872 |
Alaska Airlines Pass-Through Trust 2020-1, A 144A
4.800%, 2/15/29(2) | 305 | | 303 |
Amentum Holdings, Inc. 144A
7.250%, 8/1/32(2)(3) | 30 | | 31 |
Avolon Holdings Funding Ltd. 144A
4.375%, 5/1/26(2)(3) | 161 | | 157 |
Boeing Co. (The)
5.930%, 5/1/60(3) | 160 | | 151 |
British Airways Pass-Through Trust 2021-1, A 144A
2.900%, 9/15/36(2)(3) | 352 | | 316 |
Builders FirstSource, Inc. 144A
6.375%, 3/1/34(2)(3) | 235 | | 239 |
Cimpress plc 144A
7.375%, 9/15/32(2)(3) | 150 | | 150 |
Cornerstone Building Brands, Inc. 144A
9.500%, 8/15/29(2)(3) | 210 | | 209 |
CoStar Group, Inc. 144A
2.800%, 7/15/30(2)(3) | 401 | | 354 |
Garda World Security Corp. 144A
8.375%, 11/15/32(2)(3) | 145 | | 149 |
Global Infrastructure Solutions, Inc. 144A
7.500%, 4/15/32(2)(3) | 265 | | 269 |
Hertz Corp. (The) 144A
4.625%, 12/1/26(2) | 240 | | 208 |
Huntington Ingalls Industries, Inc.
5.749%, 1/15/35(3) | 280 | | 285 |
| Icahn Enterprises LP | | | |
| 6.250%, 5/15/26(3) | 235 | | 231 |
| 144A 10.000%, 11/15/29(2)(3) | 70 | | 72 |
LBM Acquisition LLC 144A
6.250%, 1/15/29(2)(3) | 250 | | 234 |
| | Par Value(1) | | Value |
| | | | |
| Industrials—continued | | |
Regal Rexnord Corp.
6.400%, 4/15/33(3) | $ 371 | | $ 391 |
Sempra Infrastructure Partners LP 144A
3.250%, 1/15/32(2)(3) | 405 | | 344 |
TransDigm, Inc. 144A
6.625%, 3/1/32(2)(3) | 235 | | 241 |
United Airlines Pass-Through Trust 2023-1, A
5.800%, 7/15/37 | 235 | | 243 |
Veralto Corp.
5.450%, 9/18/33(3) | 170 | | 174 |
VistaJet Malta Finance plc 144A
9.500%, 6/1/28(2) | 215 | | 215 |
| | | | 5,838 |
| | | | |
| |
| Information Technology—0.8% | | |
AppLovin Corp.
5.500%, 12/1/34 | 100 | | 101 |
Booz Allen Hamilton, Inc. 144A
4.000%, 7/1/29(2)(3) | 145 | | 138 |
CommScope Technologies LLC 144A
6.000%, 6/15/25(2)(3) | 225 | | 220 |
| Consensus Cloud Solutions, Inc. | | | |
| 144A 6.000%, 10/15/26(2)(3) | 35 | | 35 |
| 144A 6.500%, 10/15/28(2)(3) | 55 | | 54 |
Helios Software Holdings, Inc. 144A
8.750%, 5/1/29(2)(3) | 85 | | 87 |
Insight Enterprises, Inc. 144A
6.625%, 5/15/32(2)(3) | 20 | | 21 |
Rocket Software, Inc. 144A
9.000%, 11/28/28(2)(3) | 100 | | 104 |
| | | | 760 |
| | | | |
| |
| Materials—3.6% | | |
ASP Unifrax Holdings, Inc. 144A
5.250%, 9/30/28(2) | 455 | | 219 |
Bayport Polymers LLC 144A
5.140%, 4/14/32(2)(3) | 370 | | 353 |
Berry Global, Inc. 144A
5.650%, 1/15/34(2)(3) | 220 | | 225 |
See Notes to Financial Statements
Global Multi-Sector Income Fund
SCHEDULE OF INVESTMENTS (Continued)
November 30, 2024
($ reported in thousands)
| | Par Value(1) | | Value |
| | | | |
| Materials—continued | | |
Corp. Nacional del Cobre de Chile 144A
5.950%, 1/8/34(2)(3) | $ 489 | | $ 496 |
Graham Packaging Co., Inc. 144A
7.125%, 8/15/28(2)(3) | 320 | | 316 |
Illuminate Buyer LLC 144A
9.000%, 7/1/28(2)(3) | 220 | | 223 |
INEOS Quattro Finance 2 plc 144A
9.625%, 3/15/29(2)(3) | 255 | | 271 |
LSB Industries, Inc. 144A
6.250%, 10/15/28(2)(3) | 260 | | 253 |
Mauser Packaging Solutions Holding Co. 144A
9.250%, 4/15/27(2)(3) | 215 | | 220 |
Samarco Mineracao S.A. PIK 144A
9.000%, 6/30/31(2)(10) | 173 | | 168 |
Sealed Air Corp. 144A
6.500%, 7/15/32(2)(3) | 65 | | 66 |
Taseko Mines Ltd. 144A
8.250%, 5/1/30(2)(3) | 215 | | 222 |
Trivium Packaging Finance B.V. 144A
8.500%, 8/15/27(2)(3) | 259 | | 260 |
WR Grace Holdings LLC 144A
5.625%, 8/15/29(2)(3) | 172 | | 161 |
| | | | 3,453 |
| | | | |
| |
| Real Estate—1.2% | | |
EPR Properties
3.600%, 11/15/31(3) | 345 | | 304 |
Office Properties Income Trust 144A
9.000%, 9/30/29(2) | 539 | | 470 |
Safehold GL Holdings LLC
6.100%, 4/1/34(3) | 170 | | 177 |
| VICI Properties LP | | | |
| 5.125%, 5/15/32(3) | 185 | | 183 |
| | Par Value(1) | | Value |
| | | | |
| Real Estate—continued | | |
| 144A 4.625%, 6/15/25(2)(3) | $ 70 | | $ 70 |
| | | | 1,204 |
| | | | |
| |
| Utilities—5.2% | | |
AES Corp. (The)
7.600%, 1/15/55(3) | 135 | | 141 |
CMS Energy Corp.
4.750%, 6/1/50 | 355 | | 337 |
Dominion Energy, Inc.
6.625%, 5/15/55(3) | 260 | | 266 |
| Electricite de France S.A. | | | |
| 144A 6.250%, 5/23/33(2)(3) | 200 | | 214 |
| 144A 6.900%, 5/23/53(2)(3) | 180 | | 203 |
Enel Finance International N.V. 144A
7.500%, 10/14/32(2)(3) | 275 | | 314 |
Entergy Corp.
7.125%, 12/1/54(3) | 210 | | 215 |
Eskom Holdings SOC Ltd. 144A
7.125%, 2/11/25(2) | 640 | | 640 |
| Ferrellgas LP | | | |
| 144A 5.375%, 4/1/26(2)(3) | 90 | | 89 |
| 144A 5.875%, 4/1/29(2)(3) | 170 | | 159 |
KeySpan Gas East Corp. 144A
5.994%, 3/6/33(2)(3) | 255 | | 264 |
Lightning Power LLC 144A
7.250%, 8/15/32(2)(3) | 15 | | 16 |
| NGL Energy Operating LLC | | | |
| 144A 8.125%, 2/15/29(2)(3) | 30 | | 31 |
| 144A 8.375%, 2/15/32(2)(3) | 155 | | 159 |
NRG Energy, Inc. 144A
7.000%, 3/15/33(2)(3) | 320 | | 350 |
Perusahaan Perseroan Persero PT Perusahaan Listrik Negara 144A
4.125%, 5/15/27(2)(3) | 950 | | 933 |
Southern Co. (The) Series 21-A
3.750%, 9/15/51(3) | 490 | | 471 |
Vistra Corp. 144A
8.000% (2)(9) | 125 | | 128 |
See Notes to Financial Statements
Global Multi-Sector Income Fund
SCHEDULE OF INVESTMENTS (Continued)
November 30, 2024
($ reported in thousands)
| | Par Value(1) | | Value |
| | | | |
| Utilities—continued | | |
Vistra Operations Co. LLC 144A
6.875%, 4/15/32(2)(3) | $ 120 | | $ 124 |
| | | | 5,054 |
| | | | |
| |
Total Corporate Bonds and Notes
(Identified Cost $56,823) | | 55,206 |
| | | | |
| |
| Leveraged Loans—14.6% |
| Aerospace—0.1% | | |
Peraton Corp. Tranche B, First Lien (1 month Term SOFR + 3.850%)
8.423%, 2/1/28(8) | 145 | | 136 |
| Chemicals—0.4% | | |
Ineos Finance plc 2030 (1 month Term SOFR + 3.250%)
7.823%, 2/18/30(8) | 135 | | 136 |
Lummus Technology Hodings V LLC 2024, Tranche B (1 month Term SOFR + 3.614%)
8.187%, 12/31/29(8) | 80 | | 80 |
Nouryon Finance B.V. 2024, Tranche B-1 (3 month Term SOFR + 3.250%)
7.657%, 4/3/28(8) | 58 | | 59 |
USALCO LLC (1 month Term SOFR + 4.000%)
8.573%, 9/30/31(8) | 84 | | 84 |
| | | | 359 |
| | | | |
| |
| Consumer Durables—0.1% | | |
Gloves Buyer, Inc. First Lien (1 month Term SOFR + 4.114%)
8.687%, 12/29/27(8) | 104 | | 104 |
| Consumer Non-Durables—0.6% | | |
Albion Financing 3 S.a.r.l. 2024 (3 month Term SOFR + 4.512%)
9.096%, 8/16/29(8) | 85 | | 86 |
DS Parent, Inc. Tranche B (3 month Term SOFR + 5.500%)
10.104%, 1/31/31(8) | 169 | | 161 |
| | Par Value(1) | | Value |
| | | | |
| Consumer Non-Durables—continued | | |
Kronos Acquisition Holdings, Inc. 2024 (3 month Term SOFR + 4.000%)
8.584%, 7/8/31(8) | $ 147 | | $ 138 |
Osmosis Buyer Ltd. Tranche B (1 month Term SOFR + 3.500%)
8.156%, 7/31/28(8) | 138 | | 139 |
Varsity Brands, Inc. (3 month Term SOFR + 3.750%)
8.271%, 8/26/31(8) | 95 | | 95 |
| | | | 619 |
| | | | |
| |
| Energy—0.4% | | |
Epic Crude Services LP Tranche B (3 month Term SOFR + 3.000%)
7.656%, 10/10/31(8) | 130 | | 131 |
Hamilton Projects Acquiror LLC First Lien (1 month Term SOFR + 3.750%)
8.323%, 5/31/31(8) | 30 | | 30 |
NGP XI Midstream Holdings LLC (3 month Term SOFR + 4.000%)
8.604%, 7/25/31(8) | 60 | | 60 |
Traverse Midstream Partners LLC Tranche B (3 month Term SOFR + 3.500%)
8.085%, 2/16/28(8) | 140 | | 141 |
| | | | 362 |
| | | | |
| |
| Financials—0.3% | | |
Acrisure LLC 2024 (1 month Term SOFR + 3.250%)
7.849%, 11/6/30(8) | 99 | | 100 |
AssuredPartners, Inc. 2024 (1 month Term SOFR + 3.500%)
8.073%, 2/14/31(8) | 60 | | 60 |
Asurion LLC Tranche B-9 (1 month Term SOFR + 3.364%)
7.937%, 7/31/27(8) | 134 | | 134 |
See Notes to Financial Statements
Global Multi-Sector Income Fund
SCHEDULE OF INVESTMENTS (Continued)
November 30, 2024
($ reported in thousands)
| | Par Value(1) | | Value |
| | | | |
| Financials—continued | | |
Dynamo U.S. Bidco, Inc. Tranche B (6 month Term SOFR + 4.000%)
8.245%, 9/25/31(8) | $ 30 | | $ 30 |
| | | | 324 |
| | | | |
| |
| Food / Tobacco—0.5% | | |
Aspire Bakeries Holdings LLC (1 month Term SOFR + 4.250%)
8.823%, 12/23/30(8) | 70 | | 70 |
| Del Monte Foods, Inc. | | | |
(3 month Term SOFR + 4.900%)
9.847%, 8/2/28(8)(11) | 99 | | 18 |
(3 month Term SOFR + 8.150%)
13.166%, 8/2/28(8) | 50 | | 49 |
(3-6 month Term SOFR + 4.400%)
8.866% - 9.347%, 8/2/28(8) | 43 | | 26 |
Naked Juice LLC (3 month Term SOFR + 3.350%)
7.954%, 1/24/29(8) | 146 | | 101 |
Pegasus Bidco B.V. 2024 (3 month Term SOFR + 3.250%)
7.773%, 7/12/29(8) | 118 | | 119 |
Sigma Bidco B.V. Tranche B-10 (6 month Term SOFR + 4.410%)
9.077%, 1/3/28(8) | 133 | | 133 |
| | | | 516 |
| | | | |
| |
| Forest Prod / Containers—0.7% | | |
Clydesdale Acquisition Holdings, Inc. Tranche B (1 month Term SOFR + 3.175%)
7.748%, 4/13/29(8) | 215 | | 216 |
Klockner Pentaplast of America, Inc. Tranche B (6 month Term SOFR + 4.975%)
9.723%, 2/12/26(8) | 223 | | 214 |
| | Par Value(1) | | Value |
| | | | |
| Forest Prod / Containers—continued | | |
TricorBraun, Inc. (1 month Term SOFR + 3.364%)
7.937%, 3/3/28(8) | $ 210 | | $ 209 |
| | | | 639 |
| | | | |
| |
| Gaming / Leisure—0.6% | | |
ECL Entertainment LLC Tranche B (1 month Term SOFR + 3.500%)
8.073%, 8/31/30(8) | 154 | | 155 |
Motion Finco LLC Tranche B-3 (3 month Term SOFR + 3.500%)
8.104%, 11/12/29(8) | 85 | | 84 |
Ontario Gaming GTA Ltd. Partnership Tranche B (3 month Term SOFR + 4.250%)
8.893%, 8/1/30(8) | 99 | | 99 |
Scientific Games Holdings LP 2024 (3 month Term SOFR + 3.000%)
7.590%, 4/4/29(8) | 215 | | 216 |
| | | | 554 |
| | | | |
| |
| Health Care—2.2% | | |
Bausch & Lomb Corp. (1 month Term SOFR + 4.000%)
8.573%, 9/29/28(8) | 99 | | 99 |
CHG Healthcare Services, Inc. First Lien (1-3 month Term SOFR + 3.762%)
8.187% - 8.276%, 9/29/28(8) | 106 | | 107 |
Cotiviti, Inc. (1 month Term SOFR + 2.750%)
7.303%, 5/1/31(8) | 134 | | 135 |
Endo Finance Holdings, Inc. Tranche B (1 month Term SOFR + 4.000%)
8.573%, 4/23/31(8) | 25 | | 25 |
See Notes to Financial Statements
Global Multi-Sector Income Fund
SCHEDULE OF INVESTMENTS (Continued)
November 30, 2024
($ reported in thousands)
| | Par Value(1) | | Value |
| | | | |
| Health Care—continued | | |
Gainwell Acquisition Corp. Tranche B (3 month Term SOFR + 4.100%)
8.704%, 10/1/27(8) | $ 146 | | $ 140 |
Grifols Worldwide Operations USA, Inc. Tranche B (3 month Term SOFR + 2.150%)
6.735%, 11/15/27(8) | 290 | | 284 |
Hanger, Inc. (1 month Term SOFR + 3.500%)
8.073%, 10/23/31(8) | 141 | | 142 |
Hunter Holdco 3 Ltd. First Lien (3 month Term SOFR + 4.350%)
8.954%, 8/19/28(8) | 114 | | 111 |
Lannett Co., Inc. First Lien (3 month Term SOFR + 2.000%)
2.000%, 6/16/30(8)(11) | 10 | | 3 |
| LifePoint Health, Inc. | | | |
2024 (3 month Term SOFR + 4.000%)
8.632%, 5/17/31(8) | 25 | | 25 |
Tranche B (3 month Term SOFR + 3.750%)
8.406%, 5/16/31(8) | 150 | | 150 |
Modivcare, Inc. (3 month Term SOFR + 4.750%)
9.343%, 7/1/31(8) | 35 | | 34 |
One Call Corp. Tranche B, First Lien (3 month Term SOFR + 5.762%)
10.387%, 4/22/27(8) | 150 | | 146 |
PointClickCare Technologies, Inc. 2024, Tranche B (1 month Term SOFR + 3.250%)
7.821%, 11/3/31(8) | 55 | | 55 |
Radiology Partners, Inc. Tranche C (3 month Term SOFR + 3.762%)
8.275%, 1/31/29(8) | 136 | | 135 |
Star Parent, Inc. Tranche B (3 month Term SOFR + 3.750%)
8.354%, 9/27/30(8) | 169 | | 166 |
Upstream Newco, Inc. 2021 (3 month Term SOFR + 4.512%)
9.097%, 11/20/26(8) | 185 | | 153 |
| | Par Value(1) | | Value |
| | | | |
| Health Care—continued | | |
| Viant Medical Holdings, Inc. | | | |
(3 month Term SOFR + 4.000%)
8.585%, 10/17/31(8) | $ 20 | | $ 21 |
Tranche B (3 month Term SOFR + 4.000%)
8.585%, 10/17/31(8) | 187 | | 188 |
| | | | 2,119 |
| | | | |
| |
| Housing—0.5% | | |
Chariot Buyer LLC First Lien (1 month Term SOFR + 3.750%)
8.323%, 11/3/28(8) | 119 | | 120 |
Hunter Douglas Holding B.V. Tranche B-1 (3 month Term SOFR + 3.500%)
8.021%, 2/26/29(8) | 148 | | 149 |
LBM Acquisition LLC Tranche B (1 month Term SOFR + 3.850%)
8.472%, 6/6/31(8) | 165 | | 162 |
| | | | 431 |
| | | | |
| |
| Information Technology—2.6% | | |
| Applied Systems, Inc. | | | |
2024, Second Lien (3 month Term SOFR + 5.250%)
9.854%, 2/23/32(8) | 15 | | 15 |
Tranche B-1 (3 month Term SOFR + 3.000%)
7.604%, 2/24/31(8) | 134 | | 135 |
BMC Software 2031, Tranche B, First Lien (3 month Term SOFR + 3.750%)
8.335%, 7/30/31(8) | 140 | | 141 |
Central Parent LLC 2024 (3 month Term SOFR + 3.250%)
7.854%, 7/6/29(8) | 143 | | 143 |
Cloud Software Group, Inc. Tranche B (1 month Term SOFR + 3.750%)
3.750%, 5/26/31(8) | 140 | | 141 |
ConnectWise LLC (3 month Term SOFR + 3.762%)
8.365%, 9/29/28(8) | 82 | | 82 |
See Notes to Financial Statements
Global Multi-Sector Income Fund
SCHEDULE OF INVESTMENTS (Continued)
November 30, 2024
($ reported in thousands)
| | Par Value(1) | | Value |
| | | | |
| Information Technology—continued | | |
Delivery Hero SE Tranche B (3 month Term SOFR + 5.000%)
9.522%, 12/12/29(8) | $ 139 | | $ 140 |
| Ellucian Holding, Inc. | | | |
Second Lien (1 month Term SOFR + 4.750%)
9.335%, 11/15/32(8) | 20 | | 20 |
Tranche B-1 (1 month Term SOFR + 3.000%)
7.595%, 10/9/29(8) | 87 | | 88 |
Epicor Software Corp. Tranche E (1 month Term SOFR + 3.250%)
7.823%, 5/30/31(8) | 192 | | 194 |
Infinite Bidco LLC First Lien (3 month Term SOFR + 4.012%)
8.597%, 3/2/28(8) | 148 | | 146 |
ION Trading Finance Ltd. 2024 (3 month Term SOFR + 4.000%)
9.016%, 4/1/28(8) | 121 | | 121 |
Mcafee Corp. Tranche B-1 (1 month Term SOFR + 3.250%)
7.906%, 3/1/29(8) | 215 | | 215 |
Mosel Bidco SE Tranche B (3 month Term SOFR + 4.500%)
9.104%, 9/16/30(8) | 92 | | 93 |
NCR Atleos Corp. Tranche B (3 month Term SOFR + 3.750%)
8.397%, 3/27/29(8) | 89 | | 89 |
Proofpoint, Inc. 2024 (1 month Term SOFR + 3.000%)
7.573%, 8/31/28(8) | 40 | | 40 |
RealPage, Inc. First Lien (1 month Term SOFR + 3.114%)
7.687%, 4/24/28(8) | 144 | | 143 |
Rocket Software, Inc. (1 month Term SOFR + 4.250%)
8.823%, 11/28/28(8) | 149 | | 150 |
| | Par Value(1) | | Value |
| | | | |
| Information Technology—continued | | |
S2P Acquisition Borrower, Inc. (1 month Term SOFR + 3.250%)
3.250%, 10/8/31(8) | $ 125 | | $ 126 |
Thunder Generation Funding LLC Tranche B (3 month Term SOFR + 3.000%)
7.610%, 10/3/31(8) | 145 | | 146 |
UKG, Inc. Tranche B (3 month Term SOFR + 3.000%)
7.617%, 2/10/31(8) | 145 | | 146 |
| | | | 2,514 |
| | | | |
| |
| Manufacturing—0.8% | | |
CPM Holdings, Inc. (1 month Term SOFR + 4.500%)
9.172%, 9/28/28(8) | 165 | | 160 |
Cube Industrials Buyer, Inc. (3 month Term SOFR + 3.500%)
8.132%, 10/9/31(8) | 95 | | 96 |
Glatfelter Corp. Tranche B (3 month Term SOFR + 4.250%)
8.764%, 10/10/31(8) | 210 | | 210 |
LSF12 Crown U.S. Commercial Bidco LLC (1 month Term SOFR + 4.250%)
8.803%, 10/10/31(8) | 245 | | 245 |
Star U.S. Bidco LLC (1 month Term SOFR + 3.750%)
8.323%, 3/17/27(8) | 86 | | 87 |
| | | | 798 |
| | | | |
| |
| Media / Telecom - Broadcasting—0.2% | | |
Univision Communications, Inc. 2024, First Lien (1 month Term SOFR + 3.614%)
8.187%, 1/31/29(8) | 175 | | 175 |
See Notes to Financial Statements
Global Multi-Sector Income Fund
SCHEDULE OF INVESTMENTS (Continued)
November 30, 2024
($ reported in thousands)
| | Par Value(1) | | Value |
| | | | |
Media / Telecom - Cable/Wireless
Video—0.7% | | |
Cogeco Communications Finance USA LP Tranche B-1 (1 month Term SOFR + 3.250%)
7.823%, 9/18/30(8) | $ 219 | | $ 219 |
CSC Holdings LLC 2022 (1 month Term SOFR + 4.500%)
9.109%, 1/18/28(8) | 218 | | 214 |
DIRECTV Financing LLC 2024, Tranche B (3 month Term SOFR + 5.512%)
10.097%, 8/2/29(8) | 218 | | 214 |
| | | | 647 |
| | | | |
| |
Media / Telecom - Diversified
Media—0.6% | | |
Century DE Buyer LLC (3 month Term SOFR + 4.000%)
8.589%, 10/30/30(8) | 108 | | 108 |
McGraw-Hill Education, Inc. 2024, Tranche B (3 month Term SOFR + 4.000%)
8.604%, 8/1/31(8) | 113 | | 114 |
MH Sub I LLC 2023 (1 month Term SOFR + 4.250%)
8.823%, 5/3/28(8) | 119 | | 119 |
Neptune Bidco U.S., Inc. Tranche B (3 month Term SOFR + 5.100%)
9.758%, 4/11/29(8) | 172 | | 157 |
Terrier Media Buyer, Inc. (2 month Term SOFR + 3.500%)
8.071%, 6/18/29(8) | 131 | | 115 |
| | | | 613 |
| | | | |
| |
Media / Telecom -
Telecommunications—0.2% | | |
| Numericable U.S. LLC | | | |
Tranche B-11 (6 month LIBOR + 2.750%)
7.432%, 7/31/25(8)(12) | 213 | | 195 |
| | Par Value(1) | | Value |
| | | | |
Media / Telecom -
Telecommunications—continued | | |
Tranche B-12 (6 month LIBOR + 3.688%)
8.370%, 1/31/26(8)(12) | $ 20 | | $ 17 |
| | | | 212 |
| | | | |
| |
Media / Telecom - Wireless
Communications—0.1% | | |
Viasat, Inc. (1 month Term SOFR + 4.500%)
9.073%, 3/2/29(8) | 139 | | 121 |
| Retail—0.5% | | |
CNT Holdings I Corp. First Lien (3 month Term SOFR + 3.500%)
8.085%, 11/8/27(8) | 149 | | 150 |
Harbor Freight Tools USA, Inc. (1-6 month Term SOFR + 2.500%)
7.073% - 7.241%, 6/11/31(8) | 150 | | 147 |
Petco Health & Wellness Co., Inc. First Lien (3 month Term SOFR + 3.512%)
8.115%, 3/3/28(8) | 155 | | 148 |
| | | | 445 |
| | | | |
| |
| Service—2.0% | | |
AAL Delaware Holdco, Inc. Tranche B (1 month Term SOFR + 3.500%)
8.073%, 7/30/31(8) | 35 | | 35 |
Allied Universal Holdco LLC (1 month Term SOFR + 3.850%)
8.423%, 5/12/28(8) | 145 | | 146 |
Ascend Learning LLC (1 month Term SOFR + 3.600%)
8.173%, 12/11/28(8) | 152 | | 153 |
BIFM U.S. Finance LLC (1 month Term SOFR + 4.250%)
8.823%, 5/31/28(8) | 75 | | 75 |
See Notes to Financial Statements
Global Multi-Sector Income Fund
SCHEDULE OF INVESTMENTS (Continued)
November 30, 2024
($ reported in thousands)
| | Par Value(1) | | Value |
| | | | |
| Service—continued | | |
Crisis Prevention Institute, Inc. (3 month Term SOFR + 4.750%)
9.354%, 4/9/31(8) | $ 80 | | $ 80 |
DG Investment Intermediate Holdings 2, Inc. First Lien (1 month Term SOFR + 3.864%)
8.437%, 3/31/28(8) | 220 | | 222 |
DXP Enterprises, Inc. 2024 (1 month Term SOFR + 3.750%)
8.323%, 10/11/30(8) | 109 | | 110 |
Ensemble RCM LLC Tranche B (3 month Term SOFR + 3.000%)
7.585%, 8/1/29(8) | 60 | | 61 |
Garda World Security Corp. (1 month Term SOFR + 3.500%)
8.109%, 2/1/29(8) | 154 | | 156 |
Grant Thornton Advisors LLC Tranche B (1 month Term SOFR + 3.250%)
7.823%, 6/2/31(8) | 70 | | 70 |
Kuehg Corp. (3 month Term SOFR + 3.250%)
7.839%, 6/12/30(8) | 93 | | 93 |
Omnia Partners LLC (3 month Term SOFR + 3.250%)
7.867%, 7/25/30(8) | 75 | | 76 |
Spin Holdco, Inc. (3 month Term SOFR + 4.262%)
9.256%, 3/4/28(8) | 154 | | 130 |
The Hertz Corp. 2023 (1 month Term SOFR + 3.750%)
8.338%, 6/30/28(8) | 162 | | 143 |
TMF Sapphire Bidco B.V. Tranche B-3 (3 month Term SOFR + 3.500%)
8.090%, 5/3/28(8) | 69 | | 70 |
| | Par Value(1) | | Value |
| | | | |
| Service—continued | | |
Trugreen Ltd. Partnership First Lien (1 month Term SOFR + 4.100%)
8.673%, 11/2/27(8) | $ 148 | | $ 143 |
WIN Waste Innovations Holdings, Inc. (1 month Term SOFR + 2.864%)
7.437%, 3/24/28(8) | 153 | | 148 |
| | | | 1,911 |
| | | | |
| |
| Transportation - Automotive—0.3% | | |
First Brands Group LLC 2022 (3 month Term SOFR + 5.262%)
9.847%, 3/30/27(8) | 149 | | 144 |
PAI Holdco, Inc. Tranche B (3 month Term SOFR + 4.012%)
8.597%, 10/28/27(8) | 136 | | 122 |
| | | | 266 |
| | | | |
| |
| Utilities—0.2% | | |
Cornerstone Generation LLC Tranche B (1 month Term SOFR + 3.250%)
3.250%, 10/28/31(8) | 70 | | 71 |
Waterbridge NDB Operating LLC (3 month Term SOFR + 4.500%)
9.022%, 5/10/29(8) | 130 | | 131 |
| | | | 202 |
| | | | |
| |
Total Leveraged Loans
(Identified Cost $14,202) | | 14,067 |
See Notes to Financial Statements
Global Multi-Sector Income Fund
SCHEDULE OF INVESTMENTS (Continued)
November 30, 2024
($ reported in thousands)
| | Shares | | Value |
| Preferred Stocks—0.6% |
| Financials—0.6% | | |
| Capital Farm Credit ACA Series 1 144A, 5.000%(2) | 275 (13) | | $ 269 |
| Truist Financial Corp. Series Q, 5.100% | 315 (13) | | 303 |
| | | | 572 |
| | | | |
| |
Total Preferred Stocks
(Identified Cost $591) | | 572 |
| | | | |
| |
| Common Stocks—0.1% |
| Consumer Discretionary—0.1% | | |
| MYT Holding LLC Class B(11)(14) | 29,850 | | 6 |
| NMG Parent LLC(11)(14) | 618 | | 68 |
| | | | 74 |
| | | | |
| |
| Health Care—0.0% | | |
| Lannett Co., Inc.(11)(14) | 1,663 | | — |
Total Common Stocks
(Identified Cost $275) | | 74 |
| | | | |
| |
Total Long-Term Investments—143.3%
(Identified Cost $141,849) | | 137,878 |
| | | | |
| |
TOTAL INVESTMENTS—143.3%
(Identified Cost $141,849) | | $137,878 |
| Other assets and liabilities, net—(43.3)% | | (41,633 ) |
| NET ASSETS—100.0% | | $ 96,245 |
| Abbreviations: |
| ABS | Asset-Backed Securities |
| ACA | American Capital Access Financial Guarantee Corp. |
| BDC | Business Development Companies |
| DAC | Designated Activity Company |
| JSC | Joint Stock Company |
| LIBOR | London Interbank Offered Rate |
| LLC | Limited Liability Company |
| LP | Limited Partnership |
| MSCI | Morgan Stanley Capital International |
| PIK | Payment-in-Kind Security |
| SOFR | Secured Overnight Financing Rate |
| Foreign Currencies: |
| BRL | Brazilian Real |
| CZK | Czech Koruna |
| MXN | Mexican Peso |
| MYR | Malaysian Ringgit |
| ZAR | South African Rand |
| Footnote Legend: |
| (1) | Par Value disclosed in foreign currency is reported in thousands. |
| (2) | Security exempt from registration under Rule 144A of the Securities Act of 1933. These securities may be resold in transactions exempt from registration, normally to qualified institutional buyers. At November 30, 2024, these securities amounted to a value of $75,283 or 78.2% of net assets. |
| (3) | All or a portion of securities is segregated as collateral for margin loan financing. The value of securities segregated as collateral is $54,691. |
| (4) | Security in default; no interest payments are being received. |
| (5) | Regulation S security. Security is offered and sold outside of the United States; therefore, it is exempt from registration with the SEC under Rules 903 and 904 of the Securities Act of 1933. |
| (6) | Represents step coupon bond. Rate shown reflects the rate in effect as of November 30, 2024. |
| (7) | Issued with a zero coupon. Income is recognized through the accretion of discount. |
| (8) | Variable rate security. Rate disclosed is as of November 30, 2024. Information in parenthesis represents benchmark and reference rate for each security. Certain variable rate securities are not based on a published reference rate and spread but are determined by the issuer or agent and are based on current market conditions, or, for mortgage-backed securities, are impacted by the individual mortgages which are paying off over time. These securities do not indicate a reference rate and spread in their descriptions. |
| (9) | No contractual maturity date. |
| (10) | 100% of the income received was in PIK. |
For information regarding the abbreviations, see the Key Investment Terms starting on page 18.
See Notes to Financial Statements
Global Multi-Sector Income Fund
SCHEDULE OF INVESTMENTS (Continued)
November 30, 2024
($ reported in thousands)
| (11) | The value of this security was determined using significant unobservable inputs and is reported as a Level 3 security in the Fair Value Hierarchy table located after the Schedule of Investments. |
| (12) | As of November 30, 2024, the Fund held investments that utilized synthetic LIBOR as a benchmark. The United Kingdom’s Financial Conduct Authority, which regulates LIBOR, has ceased publishing all LIBOR settings. However, certain USD LIBOR settings had continued to be published under a synthetic methodology until September 30, 2024, for certain legacy contracts. At the investment’s next reset date, an alternative rate will be used in accordance with governing documents. |
| (13) | Value shown as par value. |
| (14) | Non-income producing. |
As of November 30, 2024, the Fund has the following unfunded loan commitment:
| Borrower | | Par Value | | Commitment | | Value | | Unrealized
Appreciation
(Depreciation) |
| Hanger, Inc., 10/23/31(1) | | $18 | | $18 | | $18 | | $— (2) |
| USALCO LLC, 9/30/31(1) | | 9 | | 9 | | 9 | | — (2) |
| Total | | $27 | | $27 | | $27 | | $— (2) |
| (1) | This loan will settle after November 30, 2024, at which time the interest rate, calculated on the base lending rate and the agreed upon spread on trade date, will be reflected. |
| (2) | Amount is less than $500 (not in thousands). |
See Notes to Financial Statements
Global Multi-Sector Income Fund
SCHEDULE OF INVESTMENTS (Continued)
November 30, 2024
($ reported in thousands)
The following table summarizes the value of the Fund’s investments as of November 30, 2024, based on the inputs used to value them (See Security Valuation Note 2A in the Notes to Financial Statements):
| | Total
Value at
November 30, 2024 | | Level 2
Significant
Observable
Inputs | | Level 3
Significant
Unobservable
Inputs |
| Assets: | | | | | |
| Debt Instruments: | | | | | |
| U.S. Government Securities | $ 725 | | $ 725 | | $— |
| Foreign Government Securities | 40,893 | | 40,893 | | — |
| Mortgage-Backed Securities | 16,060 | | 16,060 | | — |
| Asset-Backed Securities | 10,281 | | 10,281 | | — |
| Corporate Bonds and Notes | 55,206 | | 55,206 | | — |
| Leveraged Loans | 14,067 | | 14,046 | | 21 |
| Equity Securities: | | | | | |
| Preferred Stocks | 572 | | 572 | | — |
| Common Stocks | 74 | | — | | 74 (1) |
| Total Investments | $137,878 | | $137,783 | | $95 |
| (1) | Includes internally fair valued securities currently priced at zero ($0). |
There were no securities valued using quoted prices (Level 1) at November 30, 2024.
There were no transfers into or out of Level 3 related to securities held at November 30, 2024.
Some of the Fund’s investments that were categorized as Level 3 may have been valued utilizing third party pricing information without adjustment. If applicable, such valuations are based on unobservable inputs. A significant change in third party information could result in a significantly lower or higher value of Level 3 investments.
Management has determined that the amount of Level 3 securities compared to total net assets is not material; therefore, the roll-forward of Level 3 securities and assumptions are not shown for the period ended November 30, 2024.
See Notes to Financial Statements
STONE HARBOR EMERGING MARKETS INCOME FUND
SCHEDULE OF INVESTMENTS
November 30, 2024
($ reported in thousands)
| | Par Value(1) | | Value |
| Foreign Government Securities—94.0% |
| Angola —5.8% | | |
| Republic of Angola | | | |
144A
9.500%, 11/12/25(2)(3) | $ 3,860 | | $ 3,892 |
144A
8.250%, 5/9/28(2) | 808 | | 766 |
144A
8.750%, 4/14/32(2) | 222 | | 199 |
RegS
8.250%, 5/9/28(3)(4) | 1,850 | | 1,754 |
Republic of Angola Via Avenir Issuer II Ireland DAC RegS
6.927%, 2/19/27(4)(5) | 1,478 | | 1,412 |
| | | | 8,023 |
| | | | |
| |
| Argentina—13.6% | | |
Provincia De Buenos Aires RegS
6.625%, 9/1/37(4)(6) | 4,307 | | 2,757 |
| Republic of Argentina | | | |
| 1.000%, 7/9/29 | 13,947 | | 10,826 |
| 0.750%, 7/9/30(6) | 7,210 | | 5,317 |
| | | | 18,900 |
| | | | |
| |
| Brazil—4.2% | | |
| Brazil Notas do Tesouro Nacional | | | |
Series F
10.000%, 1/1/31 | 22,300 BRL | | 3,184 |
Series F
10.000%, 1/1/33 | 18,800 BRL | | 2,615 |
| | | | 5,799 |
| | | | |
| |
| Colombia—3.0% | | |
Republic of Colombia
4.500%, 3/15/29(3) | 1,336 | | 1,245 |
| Titulos De Tesoreria | | | |
| 7.000%, 6/30/32 | 7,900,000 COP | | 1,459 |
| 7.250%, 10/18/34 | 8,275,000 COP | | 1,464 |
| | | | 4,168 |
| | | | |
| |
| | Par Value(1) | | Value |
| | | | |
| Dominican Republic—0.5% | | |
Dominican Republic RegS
5.875%, 1/30/60(4) | $ 762 | | $ 681 |
| Ecuador—14.0% | | |
| Republic of Ecuador | | | |
144A
6.900%, 7/31/30(2)(6) | 914 | | 618 |
RegS
6.900%, 7/31/30(4)(6) | 27,815 | | 18,810 |
| | | | 19,428 |
| | | | |
| |
| Egypt—7.3% | | |
| Arab Republic of Egypt | | | |
144A
3.875%, 2/16/26(2)(3) | 2,741 | | 2,631 |
144A
4.750%, 4/16/26(2) | 7,000 EUR | | 7,245 |
144A
6.375%, 4/11/31(2) | 246 EUR | | 231 |
| | | | 10,107 |
| | | | |
| |
| El Salvador—3.1% | | |
| Republic of El Salvador | | | |
RegS
5.875%, 1/30/25(3)(4) | 2,368 | | 2,354 |
RegS
6.375%, 1/18/27(3)(4) | 1,298 | | 1,286 |
RegS
8.625%, 2/28/29(4) | 683 | | 699 |
| | | | 4,339 |
| | | | |
| |
| Ethiopia—0.7% | | |
Federal Republic of Ethiopia 144A
6.625%, 12/11/24(2)(7) | 1,212 | | 953 |
| Gabon—6.4% | | |
| Republic of Gabon | | | |
144A
6.950%, 6/16/25(2) | 5,910 | | 5,753 |
See Notes to Financial Statements
STONE HARBOR EMERGING MARKETS INCOME FUND
SCHEDULE OF INVESTMENTS (Continued)
November 30, 2024
($ reported in thousands)
| | Par Value(1) | | Value |
| | | | |
| Gabon—continued | | |
144A
7.000%, 11/24/31(2)(3) | $ 1,800 | | $ 1,404 |
RegS
6.950%, 6/16/25(4) | 1,800 | | 1,752 |
| | | | 8,909 |
| | | | |
| |
| Indonesia—3.4% | | |
| Indonesia Government Bond | | | |
| 8.375%, 3/15/34 | 27,400,000 IDR | | 1,884 |
| 8.375%, 4/15/39 | 40,300,000 IDR | | 2,835 |
| | | | 4,719 |
| | | | |
| |
| Iraq—3.0% | | |
Republic of Iraq RegS
5.800%, 1/15/28(4) | 4,338 | | 4,209 |
| Ivory Coast—0.8% | | |
| Republic of Ivory Coast | | | |
RegS
5.250%, 3/22/30(4) | 553 EUR | | 554 |
RegS
5.875%, 10/17/31(4) | 565 EUR | | 563 |
| | | | 1,117 |
| | | | |
| |
| Kenya—1.0% | | |
Republic of Kenya 144A
7.000%, 5/22/27(2)(3) | 1,475 | | 1,455 |
| Lebanon—0.0% | | |
Lebanese Republic RegS
6.400%, 5/26/23(4)(7) | 848 | | 78 |
| Mexico—4.6% | | |
| Mex Bonos Desarr | | | |
| 7.750%, 11/23/34 | 58,000 MXN | | 2,471 |
| 7.750%, 11/13/42 | 98,800 MXN | | 3,870 |
| | | | 6,341 |
| | | | |
| |
| | Par Value(1) | | Value |
| | | | |
| Mozambique—1.3% | | |
Republic of Mozambique 144A
9.000%, 9/15/31(2)(3)(6) | $ 2,168 | | $ 1,802 |
| Nigeria—4.9% | | |
| Republic of Nigeria | | | |
144A
6.500%, 11/28/27(2)(3) | 1,493 | | 1,418 |
144A
6.125%, 9/28/28(2)(3) | 2,743 | | 2,494 |
144A
7.875%, 2/16/32(2)(3) | 3,220 | | 2,903 |
| | | | 6,815 |
| | | | |
| |
| Pakistan—2.0% | | |
Islamic Republic of Pakistan 144A
6.000%, 4/8/26(2)(3) | 3,023 | | 2,828 |
| Panama—1.9% | | |
Republic of Panama
6.400%, 2/14/35(3) | 2,721 | | 2,618 |
| Papua New Guinea —1.0% | | |
Papua New Guinea Government International Bond RegS
8.375%, 10/4/28(3)(4) | 1,464 | | 1,441 |
| South Africa—3.6% | | |
| Republic of South Africa | | | |
| 6.250%, 3/31/36 | 16,700 ZAR | | 678 |
| 6.500%, 2/28/41 | 38,600 ZAR | | 1,459 |
| 8.750%, 1/31/44 | 25,700 ZAR | | 1,178 |
| 8.750%, 2/28/48 | 36,800 ZAR | | 1,678 |
| | | | 4,993 |
| | | | |
| |
| Sri Lanka—0.3% | | |
Republic of Sri Lanka 144A
7.850%, 3/14/29(2)(7) | 560 | | 379 |
See Notes to Financial Statements
STONE HARBOR EMERGING MARKETS INCOME FUND
SCHEDULE OF INVESTMENTS (Continued)
November 30, 2024
($ reported in thousands)
| | Par Value(1) | | Value |
| | | | |
| Tunisia—1.0% | | |
| Tunisian Republic | | | |
144A
5.750%, 1/30/25(2) | $ 860 | | $ 845 |
144A
6.375%, 7/15/26(2) | 608 EUR | | 600 |
| | | | 1,445 |
| | | | |
| |
| Turkey—2.6% | | |
Republic of Turkiye
9.875%, 1/15/28 | 1,297 | | 1,450 |
| Turkiye Government Bond | | | |
| 0.000%, 4/9/25(8) | 30,000 TRY | | 754 |
| 12.600%, 10/1/25 | 57,000 TRY | | 1,355 |
| | | | 3,559 |
| | | | |
| |
| Ukraine—0.5% | | |
| Ukraine Government Bond | | | |
144A
0.000%, 2/1/30(2)(6) | 46 | | 23 |
144A
0.000%, 2/1/34(2)(6) | 174 | | 69 |
144A
1.750%, 2/1/34(2)(6) | 384 | | 201 |
144A
0.000%, 2/1/35(2)(6) | 147 | | 86 |
144A
1.750%, 2/1/35(2)(6) | 299 | | 153 |
144A
0.000%, 2/1/36(2)(6) | 123 | | 71 |
144A
1.750%, 2/1/36(2)(6) | 171 | | 86 |
| | | | 689 |
| | | | |
| |
| Zambia—3.5% | | |
| Republic of Zambia | | | |
144A
5.750%, 6/30/33(2)(3)(6) | 4,594 | | 4,064 |
| | Par Value(1) | | Value |
| | | | |
| Zambia—continued | | |
144A
0.500%, 12/31/53(2) | $ 1,462 | | $ 830 |
RegS
0.500%, 12/31/53(4) | — (9) | | — (9) |
| | | | 4,894 |
| | | | |
| |
Total Foreign Government Securities
(Identified Cost $127,322) | | 130,689 |
| | | | |
| |
| Corporate Bonds and Notes—35.6% |
| Argentina—0.7% | | |
Generacion Mediterranea S.A. 144A
11.000%, 11/1/31(2) | 1,061 | | 1,021 |
| Brazil—4.1% | | |
MC Brazil Downstream Trading S.a.r.l. 144A
7.250%, 6/30/31(2)(3) | 1,626 | | 1,343 |
NewCo Holding USD 20 S.a.r.l. 144A
9.375%, 11/7/29(2) | 813 | | 819 |
OHI Group S.A. 144A
13.000%, 7/22/29(2)(3) | 1,374 | | 1,368 |
Samarco Mineracao S.A. PIK 144A
9.000%, 6/30/31(2)(3)(10) | 2,230 | | 2,168 |
| | | | 5,698 |
| | | | |
| |
| Chile—0.3% | | |
ATP Tower Holdings LLC 144A
4.050%, 4/27/26(2) | 500 | | 481 |
See Notes to Financial Statements
STONE HARBOR EMERGING MARKETS INCOME FUND
SCHEDULE OF INVESTMENTS (Continued)
November 30, 2024
($ reported in thousands)
| | Par Value(1) | | Value |
| | | | |
| Colombia—2.3% | | |
Gran Tierra Energy, Inc. 144A
9.500%, 10/15/29(2)(3) | $ 3,445 | | $ 3,260 |
| Ghana—2.6% | | |
| Kosmos Energy Ltd. | | | |
| 144A 8.750%, 10/1/31(2) | 629 | | 601 |
| RegS 7.750%, 5/1/27(4) | 600 | | 581 |
Tullow Oil plc RegS
7.000%, 3/1/25(3)(4) | 2,600 | | 2,478 |
| | | | 3,660 |
| | | | |
| |
| India—0.4% | | |
| Vedanta Resources Finance II plc | | | |
| 144A 13.875%, 12/9/28(2) | 136 | | 136 |
| 144A 10.875%, 9/17/29(2) | 343 | | 350 |
| | | | 486 |
| | | | |
| |
| Israel—0.6% | | |
Leviathan Bond Ltd. 144A, RegS
6.750%, 6/30/30(2)(4) | 800 | | 767 |
| Kazakhstan—2.0% | | |
| Development Bank of Kazakhstan JSC | | | |
| 144A 10.950%, 5/6/26(2) | 506,000 KZT | | 933 |
| 144A 13.000%, 4/15/27(2) | 270,000 KZT | | 492 |
| 144A 13.489%, 5/23/28(2) | 590,000 KZT | | 1,105 |
QazaqGaz NC JSC 144A
4.375%, 9/26/27(2) | 275 | | 263 |
| | | | 2,793 |
| | | | |
| |
| | Par Value(1) | | Value |
| | | | |
| Mexico—14.2% | | |
| Banco Mercantil del Norte S.A. | | | |
| 144A 5.875%(2)(3)(11) | $ 1,268 | | $ 1,212 |
| 144A 6.625%(2)(11) | 866 | | 777 |
Braskem Idesa SAPI 144A
6.990%, 2/20/32(2) | 1,750 | | 1,312 |
| Petroleos Mexicanos | | | |
| 8.750%, 6/2/29(3) | 3,165 | | 3,212 |
| 7.690%, 1/23/50(3) | 4,750 | | 3,720 |
| RegS 6.700%, 2/16/32(4) | 293 | | 261 |
Series 14-2
7.470%, 11/12/26 | 25,240 MXN | | 1,134 |
Poinsettia Finance Ltd. RegS
6.625%, 6/17/31(4) | 9,048 | | 8,106 |
| | | | 19,734 |
| | | | |
| |
| Nigeria—1.2% | | |
| IHS Holding Ltd. | | | |
| 144A 5.625%, 11/29/26(2) | 283 | | 280 |
| 144A 6.250%, 11/29/28(2) | 683 | | 645 |
| 144A 8.250%, 11/29/31(2) | 800 | | 786 |
| | | | 1,711 |
| | | | |
| |
| Peru—2.0% | | |
| Petroleos del Peru S.A. | | | |
| RegS 4.750%, 6/19/32(3)(4) | 2,625 | | 2,002 |
| RegS 5.625%, 6/19/47(4) | 1,225 | | 798 |
| | | | 2,800 |
| | | | |
| |
See Notes to Financial Statements
STONE HARBOR EMERGING MARKETS INCOME FUND
SCHEDULE OF INVESTMENTS (Continued)
November 30, 2024
($ reported in thousands)
| | Par Value(1) | | Value |
| | | | |
| South Africa—1.4% | | |
Eskom Holdings SOC Ltd. 144A
8.450%, 8/10/28(2)(3) | $ 1,840 | | $ 1,927 |
| Turkey—1.5% | | |
Aydem Yenilenebilir Enerji AS 144A
7.750%, 2/2/27(2)(3) | 1,067 | | 1,061 |
Yapi ve Kredi Bankasi AS 144A
9.250%, 1/17/34(2)(3) | 963 | | 1,011 |
| | | | 2,072 |
| | | | |
| |
| Uzbekistan—1.5% | | |
Uzauto Motors AJ 144A
4.850%, 5/4/26(2)(3) | 2,166 | | 2,068 |
| Vietnam—0.8% | | |
Mong Duong Finance Holdings B.V. 144A
5.125%, 5/7/29(2)(3) | 1,144 | | 1,095 |
Total Corporate Bonds and Notes
(Identified Cost $50,414) | | 49,573 |
| | | |
| Purchased Options—0.1% |
| (See open purchased options schedule) | |
Total Purchased Options
(Premiums paid $83) | 72 |
| | Par Value(1) | |
| Credit Linked Notes—3.4% |
| Iraq—3.4% | |
| Republic of Iraq | | |
(Counterparty: BOA)
2.536%, 1/1/28(12) | 156,609 JPY | 984 |
(Counterparty: BOA)
3.404%, 1/1/28(12)(13) | 344,303 JPY | 2,159 |
(Counterparty: BOA)
3.540%, 1/6/28(12)(13) | 257,609 JPY | 1,617 |
| | | Value |
| Iraq—continued | |
Total Credit Linked Notes
(Identified Cost $6,564) | $ 4,760 |
| | | |
| |
Total Long-Term Investments—133.1%
(Identified Cost $184,383) | 185,094 |
| | | |
| |
TOTAL INVESTMENTS—133.1%
(Identified Cost $184,383) | $ 185,094 |
| Other assets and liabilities, net—(33.1)% | (46,027) |
| NET ASSETS—100.0% | $ 139,067 |
| Abbreviations: |
| CDS | Credit Default Swap |
| DAC | Designated Activity Company |
| JSC | Joint Stock Company |
| LLC | Limited Liability Company |
| PIK | Payment-in-Kind Security |
| PLC | Public Limited Company |
| Footnote Legend: |
| (1) | Par Value disclosed in foreign currency is reported in thousands. |
| (2) | Security exempt from registration under Rule 144A of the Securities Act of 1933. These securities may be resold in transactions exempt from registration, normally to qualified institutional buyers. At November 30, 2024, these securities amounted to a value of $71,280 or 51.3% of net assets. |
| (3) | All or a portion is segregated as collateral for reverse repurchase agreements. On November 30, 2024, securities valued at $63.638 were pledged as collateral for reverse repurchase agreements. |
| (4) | Regulation S security. Security is offered and sold outside of the United States; therefore, it is exempt from registration with the SEC under Rules 903 and 904 of the Securities Act of 1933. |
For information regarding the abbreviations, see the Key Investment Terms starting on page 18.
See Notes to Financial Statements
STONE HARBOR EMERGING MARKETS INCOME FUND
(continued)
November 30, 2024
($ reported in thousands)
| (5) | This Note was issued for the sole purpose of funding a leveraged loan between the issuer and the borrower. As the credit risk for this security lies solely with the borrower, the name represented here is that of the borrower. |
| (6) | Represents step coupon bond. Rate shown reflects the rate in effect as of November 30, 2024. |
| (7) | Security in default; no interest payments are being received. |
| (8) | Issued with a zero coupon. Income is recognized through the accretion of discount. |
| (9) | Amount is less than $500 (not in thousands). |
| (10) | 100% of the income received was in PIK. |
| (11) | No contractual maturity date. |
| (12) | The value of this security was determined using significant unobservable inputs and is reported as a Level 3 security in the Fair Value Hierarchy table located after the Schedule of Investments. |
| (13) | Variable rate security. Rate disclosed is as of November 30, 2024. Information in parenthesis represents benchmark and reference rate for each security. Certain variable rate securities are not based on a published reference rate and spread but are determined by the issuer or agent and are based on current market conditions, or, for mortgage-backed securities, are impacted by the individual mortgages which are paying off over time. These securities do not indicate a reference rate and spread in their descriptions. |
| Counterparties: | |
| BCLY | Barclays |
| BOA | Bank of America |
| GS | Goldman Sachs & Co. |
| JPM | JPMorgan Chase Bank N.A. |
| Foreign Currencies: |
| AUD | Australian Dollar |
| BRL | Brazilian Real |
| CNH | Chinese Yuan Offshore |
| COP | Colombian Peso |
| EUR | Euro |
| IDR | Indonesian Rupiah |
| JPY | Japanese Yen |
| KZT | Kazakhstani Tenge |
| MXN | Mexican Peso |
| TRY | Turkish Lira |
| USD | United States Dollar |
| ZAR | South African Rand |
| Reverse Repurchase Agreements as of November 30, 2024 were as follows: |
| Counterparty | Interest Rate | Acquisition Date* | Amount |
| JPM | 5.12% | 11/08/24 | $ (924) |
| JPM | 5.13 | 11/08/24 | (1,553) |
| JPM | 5.15 | 11/08/24 | (1,045) |
| JPM | 5.15 | 11/08/24 | (1,607) |
| JPM | 5.15 | 11/08/24 | (2,641) |
| JPM | 5.15 | 11/08/24 | (867) |
| JPM | 5.15 | 11/08/24 | (1,653) |
| JPM | 5.15 | 11/08/24 | (2,272) |
| JPM | 5.20 | 11/08/24 | (2,138) |
See Notes to Financial Statements
STONE HARBOR EMERGING MARKETS INCOME FUND
(continued)
November 30, 2024
($ reported in thousands)
| Reverse Repurchase Agreements as of November 30, 2024 were as follows (continued): |
| Counterparty | Interest Rate | Acquisition Date* | Amount |
| JPM | 5.20% | 11/08/24 | $ (1,177) |
| JPM | 5.20 | 11/08/24 | (1,202) |
| JPM | 5.25 | 11/08/24 | (1,141) |
| JPM | 5.25 | 11/08/24 | (1,480) |
| JPM | 5.25 | 11/08/24 | (920) |
| JPM | 5.25 | 11/08/24 | (3,192) |
| JPM | 5.25 | 11/12/24 | (2,016) |
| JPM | 5.25 | 11/12/24 | (2,406) |
| JPM | 5.30 | 11/08/24 | (1,032) |
| JPM | 5.30 | 11/08/24 | (1,920) |
| JPM | 5.30 | 11/08/24 | (1,124) |
| JPM | 5.30 | 11/08/24 | (2,134) |
| JPM | 5.30 | 11/08/24 | (1,170) |
| JPM | 5.35 | 11/08/24 | (1,476) |
| JPM | 5.35 | 11/26/24 | (3,163) |
| JPM | 5.35 | 11/26/24 | (1,737) |
| JPM | 5.35 | 11/26/24 | (889) |
| JPM | 5.35 | 11/26/24 | (2,744) |
| JPM | 5.55 | 11/26/24 | (815) |
| JPM | 5.60 | 11/25/24 | (3,116) |
| Total | | | $(49,554) |
| Footnote Legend: |
| * | All agreements can be terminated by either party on demand at value plus accrued interest. |
See Notes to Financial Statements
STONE HARBOR EMERGING MARKETS INCOME FUND
(continued)
November 30, 2024
($ reported in thousands)
| Open purchased option contracts as of November 30, 2024 were as follows: |
| Description of Options | Counterparty | Number of
Contracts | Contract
Notional
Amount | Strike
Price(1) | Expiration
Date | Value |
| Call Options(2) | | | | | | |
Call USD 1,216 versus
Put CNH 8,969 | GS | 1,216,268 | $ 8,969 | 7.37 | 05/14/25 | $10 |
Call USD 2,041 versus
Put CNH 15,048 | GS | 2,041,000 | 15,048 | 7.37 | 05/30/25 | 18 |
| Put Option(2) | | | | | | |
Put AUD 5,124 versus
Call USD 3,212 | GS | 5,124,000 | 3,212 | 0.63 | 05/30/25 | 44 |
| Total | | $72 |
| Footnote Legend: |
| (1) | Strike price not reported in thousands. |
| (2) | Over-the-counter options. |
| Forward foreign currency exchange contracts as of November 30, 2024 were as follows: |
Currency
Purchased | Currency
Amount
Purchased | Currency
Sold | Currency
Amount
Sold | Counterparty | Settlement
Date | Unrealized
Appreciation | | Unrealized
Depreciation |
| BRL | 16,300 | USD | 2,789 | JPM | 02/04/25 | $ — | | $ (103) |
| MXN | 66,000 | USD | 3,190 | JPM | 01/21/25 | 33 | | — |
| USD | 4,895 | JPY | 715,762 | JPM | 01/10/25 | 83 | | — |
| USD | 3,268 | MXN | 66,000 | JPM | 01/21/25 | 45 | | — |
| USD | 1,033 | ZAR | 18,500 | JPM | 01/21/25 | 11 | | — |
| USD | 2,836 | BRL | 16,300 | JPM | 02/04/25 | 150 | | — |
| ZAR | 18,500 | USD | 1,036 | JPM | 01/21/25 | — | | (15) |
| Total | | | | | | $322 | | $ (118) |
See Notes to Financial Statements
STONE HARBOR EMERGING MARKETS INCOME FUND
(continued)
November 30, 2024
($ reported in thousands)
| Over-the-counter credit default swaps - sell protection(1) outstanding as of November 30, 2024 were as follows: |
| Reference Entity | Payment
Frequency | Counterparty | Fixed
Rate | Expiration
Date | Notional
Amount(2) | | Value | | Premiums
Paid
(Received) | | Unrealized
Appreciation | | Unrealized
Depreciation |
Republic of Argentina 5 Year CDS,
CCC /BL(3),* | Quarterly | BCLY | 5.000% | 12/20/25 | $11,200 | | $(396) | | $(744) | | $348 | | $— |
| Total | | | | | | | $(396) | | $(744) | | $348 | | $— |
| Footnote Legend: |
| (1) | If the Fund is a seller of protection and a credit event occurs, as defined under the terms of that particular swap agreement, the Fund will either (i) pay to the buyer of protection an amount equal to the notional amount of the swap and take delivery of the referenced obligation or underlying investments comprising the referenced index or (ii) pay a net settlement amount in the form of cash or investments equal to the notional amount of the swap less the recovery value of the referenced obligation or underlying investments comprising the referenced index. |
| (2) | The maximum potential amount the Fund could be required to pay as a seller of credit protection or receive as a buyer of credit protection if a credit event occurs as defined under the terms of that particular swap agreement. |
| (3) | Based on Republic of Argentina Sovereign Debt Obligation, USD Denominated 1.00% fixed coupon, 07/09/2029 maturity. |
| * | S&P / Morningstar DBRS, respectively. |
See Notes to Financial Statements
STONE HARBOR EMERGING MARKETS INCOME FUND
(continued)
November 30, 2024
($ reported in thousands)
The following table summarizes the value of the Fund’s investments as of November 30, 2024, based on the inputs used to value them (See Security Valuation Note 2A in the Notes to Financial Statements):
| | Total
Value at
November 30, 2024 | | Level 2
Significant
Observable
Inputs | | Level 3
Significant
Unobservable
Inputs |
| Assets: | | | | | |
| Debt Instruments: | | | | | |
| Foreign Government Securities | $ 130,689 | | $ 130,689 | | $ — |
| Corporate Bonds and Notes | 49,573 | | 49,573 | | — |
| Credit Linked Notes | 4,760 | | — | | 4,760 |
| Other Financial Instruments: | | | | | |
| Purchased Options | 72 | | 72 | | — |
| Forward Foreign Currency Exchange Contracts* | 322 | | 322 | | — |
| Total Assets | 185,416 | | 180,656 | | 4,760 |
| Liabilities: | | | | | |
| Other Financial Instruments: | | | | | |
| Over-the-Counter Credit Default Swap | (396) | | (396) | | — |
| Reverse Repurchase Agreements* | (49,554) | | (49,554) | | — |
| Forward Foreign Currency Exchange Contracts* | (118) | | (118) | | — |
| Total Liabilities | (50,068) | | (50,068) | | — |
| Total Investments | $ 135,348 | | $ 130,588 | | $4,760 |
| * | Other financial instruments are derivative instruments reflected in the Schedule of Investments. Swap contracts and forward currency exchange contracts are valued at the net unrealized appreciation (depreciation) on the instrument by level and counterparty. For liabilities arising from reverse repurchase agreements, the carrying amount approximates fair value due to the short-term maturity of these financial instruments. |
There were no securities valued using quoted prices (Level 1) at November 30, 2024.
There were no transfers into or out of Level 3 related to securities held at November 30, 2024.
Some of the Fund’s investments that were categorized as Level 3 may have been valued utilizing third party pricing information without adjustment. If applicable, such valuations are based on unobservable inputs. A significant change in third party information could result in a significantly lower or higher value of Level 3 investments.
See Notes to Financial Statements
STONE HARBOR EMERGING MARKETS INCOME FUND
(continued)
November 30, 2024
($ reported in thousands)
The following is a reconciliation of assets of the Fund for Level 3 investments for which significant unobservable inputs were used to determine fair value.
| | Total | | Credit
Linked
Notes |
| Investments in Securities | | | |
| Balance as of November 30, 2023: | $ 2,833 | | $ 2,833 |
| Accrued discount/(premium) | 165 | | 165 |
| Net realized gain (loss) | (303) | | (303) |
| Net change in unrealized appreciation (depreciation)(a) | 168 | | 168 |
| Purchases | 3,322 | | 3,322 |
| Sales (b) | (1,425) | | (1,425) |
| Balance as of November 30, 2024 | $ 4,760 | | $ 4,760 |
(a) The net change in unrealized appreciation (depreciation) on investments still held at November 30, 2024, was $168.
(b) Includes paydowns on securities.
See Notes to Financial Statements
Total Return Fund Inc.
SCHEDULE OF INVESTMENTS
November 30, 2024
($ reported in thousands)
| | Par Value(1) | | Value |
| U.S. Government Securities—0.9% |
| U.S. Treasury Bonds | | | |
| 1.875%, 11/15/51 | $ 635 | | $ 378 |
| 4.750%, 11/15/53(2) | 610 | | 646 |
| 4.250%, 2/15/54(2) | 1,620 | | 1,582 |
| 4.625%, 5/15/54 | 1,265 | | 1,315 |
Total U.S. Government Securities
(Identified Cost $3,926) | | 3,921 |
| | | | |
| |
| Foreign Government Securities—3.9% |
| Abu Dhabi Government International Bond | | | |
144A
5.000%, 4/30/34(3) | 115 | | 117 |
144A
3.875%, 4/16/50(3) | 179 | | 143 |
| Arab Republic of Egypt | | | |
144A
7.600%, 3/1/29(3) | 171 | | 166 |
144A
8.500%, 1/31/47(3) | 262 | | 211 |
Benin Government International Bond 144A
7.960%, 2/13/38(3) | 15 | | 15 |
| Bolivarian Republic of Venezuela | | | |
| 9.375%, 1/13/34(4) | 225 | | 33 |
RegS
8.250%, 10/13/24(4)(5) | 85 | | 11 |
Brazil Notas do Tesouro Nacional Series F
10.000%, 1/1/31 | 1,800 BRL | | 257 |
| Costa Rica Government | | | |
144A
6.550%, 4/3/34(3) | 74 | | 76 |
144A
7.300%, 11/13/54(3) | 45 | | 48 |
Czech Republic
1.750%, 6/23/32 | 7,800 CZK | | 283 |
| Dominican Republic | | | |
144A
5.500%, 2/22/29(3) | 120 | | 118 |
144A
4.875%, 9/23/32(3) | 417 | | 383 |
| | Par Value(1) | | Value |
| | | | |
| Foreign Government Securities—continued |
Federal Republic of Ethiopia 144A
6.625%, 12/11/24(3)(4) | $ 166 | | $ 131 |
| Federative Republic of Brazil | | | |
| 6.250%, 3/18/31 | 45 | | 46 |
| 6.000%, 10/20/33 | 234 | | 231 |
| 7.125%, 5/13/54 | 282 | | 280 |
Finance Department Government of Sharjah 144A
4.000%, 7/28/50(3) | 470 | | 314 |
Gaci First Investment Co. RegS
4.875%, 2/14/35(5) | 245 | | 237 |
Honduras Government 144A
8.625%, 11/27/34(3) | 108 | | 108 |
Hungary Government International Bond 144A
6.250%, 9/22/32(3) | 284 | | 293 |
Islamic Republic of Pakistan 144A
7.375%, 4/8/31(3) | 57 | | 48 |
Kingdom of Bahrain 144A
5.625%, 5/18/34(3) | 211 | | 194 |
Kingdom of Jordan 144A
5.850%, 7/7/30(3) | 88 | | 84 |
Kingdom of Morocco 144A
3.000%, 12/15/32(3) | 105 | | 87 |
Lebanese Republic RegS
7.000%, 3/23/32(4)(5) | 207 | | 19 |
Malaysia Government Bond
2.632%, 4/15/31 | 1,360 MYR | | 287 |
Mex Bonos Desarr
7.750%, 11/13/42 | 7,000 MXN | | 274 |
Oman Government International Bond 144A
6.750%, 1/17/48(3) | 245 | | 256 |
Republic of Angola 144A
8.750%, 4/14/32(3) | 348 | | 311 |
Republic of Argentina
0.750%, 7/9/30(6) | 1,019 | | 752 |
Republic of Armenia 144A
3.600%, 2/2/31(3) | 95 | | 79 |
Republic of Chile
5.330%, 1/5/54 | 334 | | 326 |
See Notes to Financial Statements
Total Return Fund Inc.
SCHEDULE OF INVESTMENTS (Continued)
November 30, 2024
($ reported in thousands)
| | Par Value(1) | | Value |
| | | | |
| Foreign Government Securities—continued |
Republic of Colombia
8.000%, 11/14/35 | $ 606 | | $ 625 |
| Republic of Ecuador | | | |
144A
6.900%, 7/31/30(3)(6) | 352 | | 238 |
RegS
6.900%, 7/31/30(5)(6) | 321 | | 217 |
Republic of El Salvador 144A
7.650%, 6/15/35(3) | 205 | | 194 |
Republic of Gabon 144A
6.950%, 6/16/25(3) | 42 | | 41 |
| Republic of Ghana | | | |
144A
5.000%, 7/3/29(3)(6) | 282 | | 247 |
144A
5.000%, 7/3/35(3)(6) | 99 | | 70 |
Republic of Guatemala 144A
6.600%, 6/13/36(3) | 239 | | 242 |
| Republic of Indonesia | | | |
| 2.850%, 2/14/30 | 310 | | 281 |
| 4.750%, 9/10/34 | 267 | | 260 |
Republic of Iraq RegS
5.800%, 1/15/28(5) | 194 | | 188 |
| Republic of Ivory Coast | | | |
144A
6.375%, 3/3/28(3) | 210 | | 209 |
144A
8.250%, 1/30/37(3) | 189 | | 188 |
Republic of Kenya 144A
8.000%, 5/22/32(3) | 89 | | 82 |
| Republic of Nigeria | | | |
144A
7.143%, 2/23/30(3) | 158 | | 143 |
144A
7.375%, 9/28/33(3) | 232 | | 196 |
| Republic of Panama | | | |
| 3.875%, 3/17/28 | 135 | | 127 |
| 7.500%, 3/1/31 | 46 | | 48 |
| 8.000%, 3/1/38 | 367 | | 388 |
Republic of Paraguay 144A
6.000%, 2/9/36(3) | 103 | | 106 |
Republic of Peru
5.875%, 8/8/54 | 85 | | 85 |
| Republic of Philippines | | | |
| 4.750%, 3/5/35 | 135 | | 132 |
| 3.700%, 3/1/41 | 374 | | 309 |
| | Par Value(1) | | Value |
| | | | |
| Foreign Government Securities—continued |
Republic of Poland
4.875%, 10/4/33 | $ 394 | | $ 388 |
Republic of Serbia 144A
6.500%, 9/26/33(3) | 171 | | 178 |
| Republic of South Africa | | | |
| 5.875%, 6/22/30 | 362 | | 354 |
| 8.750%, 2/28/48 | 6,300 ZAR | | 287 |
144A
7.100%, 11/19/36(3) | 54 | | 55 |
Republic of Sri Lanka 144A
6.200%, 5/11/27(3)(4) | 180 | | 120 |
| Republic of Turkiye | | | |
| 7.625%, 4/26/29 | 185 | | 195 |
| 9.125%, 7/13/30 | 731 | | 821 |
| 7.625%, 5/15/34 | 200 | | 208 |
| 6.625%, 2/17/45 | 178 | | 156 |
| Republic of Zambia | | | |
144A
5.750%, 6/30/33(3)(6) | 108 | | 96 |
144A
0.500%, 12/31/53(3) | 20 | | 11 |
Republica Orient Uruguay
4.975%, 4/20/55 | 151 | | 140 |
Romania Government International Bond 144A
7.125%, 1/17/33(3) | 343 | | 355 |
| Saudi International Bond | | | |
144A
4.875%, 7/18/33(3) | 316 | | 314 |
144A
4.500%, 10/26/46(3) | 745 | | 633 |
State of Qatar 144A
3.750%, 4/16/30(3) | 255 | | 246 |
Trinidad & Tobago Government International Bond 144A
6.400%, 6/26/34(3) | 40 | | 39 |
| Ukraine Government Bond | | | |
144A
1.750%, 2/1/29(3)(6) | 15 | | 10 |
144A
0.000%, 2/1/30(3)(6) | 3 | | 1 |
144A
0.000%, 2/1/34(3)(6) | 10 | | 4 |
144A
1.750%, 2/1/34(3)(6) | 15 | | 8 |
See Notes to Financial Statements
Total Return Fund Inc.
SCHEDULE OF INVESTMENTS (Continued)
November 30, 2024
($ reported in thousands)
| | Par Value(1) | | Value |
| | | | |
| Foreign Government Securities—continued |
144A
0.000%, 2/1/35(3)(6) | $ 9 | | $ 5 |
144A
1.750%, 2/1/35(3)(6) | 18 | | 9 |
144A
0.000%, 2/1/36(3)(6) | 7 | | 4 |
144A
1.750%, 2/1/36(3)(6) | 3 | | 1 |
RegS
1.750%, 2/1/29(5)(6) | 42 | | 27 |
RegS
0.000%, 2/1/30(5)(6) | 8 | | 4 |
RegS
0.000%, 2/1/34(5)(6) | 28 | | 11 |
RegS
1.750%, 2/1/34(5)(6) | 42 | | 22 |
RegS
0.000%, 2/1/35(5)(6) | 50 | | 29 |
RegS
1.750%, 2/1/35(5)(6) | 49 | | 25 |
RegS
0.000%, 2/1/36(5)(6) | 20 | | 12 |
RegS
1.750%, 2/1/36(5)(6) | 7 | | 4 |
| United Mexican States | | | |
| 3.500%, 2/12/34 | 530 | | 436 |
| 6.350%, 2/9/35 | 66 | | 67 |
| 6.338%, 5/4/53 | 205 | | 192 |
| 6.400%, 5/7/54 | 300 | | 283 |
Uzbekistan International Bond 144A
6.900%, 2/28/32(3) | 144 | | 143 |
Total Foreign Government Securities
(Identified Cost $16,854) | | 16,727 |
| | | | |
| |
| Mortgage-Backed Securities—6.9% |
| Agency—1.7% | | |
| Federal Home Loan Mortgage Corporation | | | |
Pool #SD6322
4.500%, 8/1/53 | 820 | | 788 |
| | Par Value(1) | | Value |
| | | | |
| Agency—continued | | |
Pool #SD8350
6.000%, 8/1/53 | $ 482 | | $ 488 |
Pool #SD8382
5.000%, 12/1/53 | 1,456 | | 1,430 |
| Federal National Mortgage Association | | | |
Pool #CB6857
4.500%, 8/1/53 | 370 | | 356 |
Pool #FS4438
5.000%, 11/1/52 | 789 | | 776 |
Pool #FS7751
4.000%, 3/1/53 | 1,402 | | 1,312 |
Pool #FS8791
6.000%, 8/1/54 | 569 | | 577 |
Pool #MA4785
5.000%, 10/1/52 | 778 | | 766 |
Pool #MA4805
4.500%, 11/1/52 | 833 | | 801 |
| | | | 7,294 |
| | | | |
| |
| Non-Agency—5.2% | | |
Ajax Mortgage Loan Trust 2019-D, A1 144A
2.956%, 9/25/65(3)(7) | 168 | | 159 |
American Homes 4 Rent Trust 2015-SFR2, C 144A
4.691%, 10/17/52(3) | 240 | | 238 |
| AMSR Trust | | | |
2021-SFR2, C 144A
1.877%, 8/17/38(3) | 245 | | 230 |
2021-SFR3, D 144A
2.177%, 10/17/38(3) | 260 | | 245 |
Angel Oak Mortgage Trust 2023-1, A1 144A
4.750%, 9/26/67(3)(7) | 368 | | 363 |
| Arroyo Mortgage Trust | | | |
2019-1, A1 144A
3.805%, 1/25/49(3)(7) | 308 | | 298 |
2019-2, A1 144A
3.347%, 4/25/49(3)(7) | 116 | | 112 |
Benchmark Mortgage Trust 2023-B38, A2
5.626%, 4/15/56 | 210 | | 211 |
See Notes to Financial Statements
Total Return Fund Inc.
SCHEDULE OF INVESTMENTS (Continued)
November 30, 2024
($ reported in thousands)
| | Par Value(1) | | Value |
| | | | |
| Non-Agency—continued | | |
BPR Trust 2022-OANA, A (1 month Term SOFR + 1.898%, Cap N/A, Floor 1.898%) 144A
6.507%, 4/15/37(3)(7) | $ 435 | | $ 437 |
BX Commercial Mortgage Trust 2024-XL5, A (1 month Term SOFR + 1.392%, Cap N/A, Floor 1.392%) 144A
6.001%, 3/15/41(3)(7) | 322 | | 322 |
| BX Trust | | | |
2019-OC11, D 144A
4.075%, 12/9/41(3)(7) | 825 | | 752 |
2022-CLS, A 144A
5.760%, 10/13/27(3) | 663 | | 662 |
CENT Trust 2023-CITY, A (1 month Term SOFR + 2.620%, Cap N/A, Floor 2.620%) 144A
7.229%, 9/15/38(3)(7) | 340 | | 343 |
| Chase Home Lending Mortgage Trust | | | |
2023-RPL1, A1 144A
3.500%, 6/25/62(3)(7) | 215 | | 198 |
2024-RPL4, A1A 144A
3.375%, 12/25/64(3)(7) | 251 | | 226 |
| Chase Mortgage Finance Corp. | | | |
2016-SH1, M2 144A
3.750%, 4/25/45(3)(7) | 85 | | 77 |
2016-SH2, M2 144A
3.750%, 12/25/45(3)(7) | 295 | | 270 |
CIM Trust 2022-R2, A1 144A
3.750%, 12/25/61(3)(7) | 366 | | 342 |
Citigroup Mortgage Loan Trust, Inc. 2018-RP1, A1 144A
3.000%, 9/25/64(3)(7) | 146 | | 142 |
COMM Mortgage Trust 2013-300P, A1 144A
4.353%, 8/10/30(3) | 350 | | 338 |
| CoreVest American Finance Trust | | | |
2019-3, C 144A
3.265%, 10/15/52(3) | 400 | | 361 |
| | Par Value(1) | | Value |
| | | | |
| Non-Agency—continued | | |
2022-1, A 144A
4.744%, 6/17/55(3)(7) | $ 342 | | $ 341 |
Credit Suisse Mortgage Capital Trust 2020-RPL4, A1 144A
2.000%, 1/25/60(3)(7) | 253 | | 224 |
Deephaven Residential Mortgage Trust 2022-1, A1 144A
2.205%, 1/25/67(3)(7) | 243 | | 219 |
Ellington Financial Mortgage Trust 2019-2, A3 144A
3.046%, 11/25/59(3)(7) | 28 | | 27 |
ELM Trust 2024-ELM, A10 144A
5.994%, 6/10/39(3)(7) | 317 | | 320 |
Fashion Show Mall LLC 2024-SHOW, A 144A
5.274%, 10/10/41(3)(7) | 470 | | 465 |
FirstKey Homes Trust 2021-SFR1, D 144A
2.189%, 8/17/38(3) | 330 | | 313 |
Galton Funding Mortgage Trust 2018-1, A23 144A
3.500%, 11/25/57(3)(7) | 14 | | 13 |
JPMorgan Chase Commercial Mortgage Securities Trust 2024-OMNI, A 144A
5.990%, 10/5/39(3)(7) | 430 | | 436 |
| JPMorgan Chase Mortgage Trust | | | |
2014-5, B2 144A
2.702%, 10/25/29(3)(7) | 205 | | 190 |
2017-3, 2A2 144A
2.500%, 8/25/47(3)(7) | 65 | | 57 |
Legends Outlets Kansas City KS Mortgage Secured Pass-Through Trust 2024-LGND, A 144A
6.247%, 11/5/39(3)(7) | 325 | | 325 |
| MetLife Securitization Trust | | | |
2017-1A, M1 144A
3.285%, 4/25/55(3)(7) | 241 | | 213 |
2019-1A, A1A 144A
3.750%, 4/25/58(3)(7) | 32 | | 31 |
See Notes to Financial Statements
Total Return Fund Inc.
SCHEDULE OF INVESTMENTS (Continued)
November 30, 2024
($ reported in thousands)
| | Par Value(1) | | Value |
| | | | |
| Non-Agency—continued | | |
| MFA Trust | | | |
2022-INV2, A1 144A
4.950%, 7/25/57(3)(7) | $ 590 | | $ 586 |
2022-NQM2, A1 144A
4.000%, 5/25/67(3)(7) | 183 | | 176 |
2024-NQM2, A1 144A
5.272%, 8/25/69(3)(7) | 286 | | 283 |
| Mill City Mortgage Loan Trust | | | |
2017-3, B1 144A
3.250%, 1/25/61(3)(7) | 413 | | 366 |
2019-1, M2 144A
3.500%, 10/25/69(3)(7) | 354 | | 322 |
Morgan Stanley Bank of America Merrill Lynch Trust 2015-C25, A4
3.372%, 10/15/48 | 300 | | 297 |
MSSG Trust 2017-237P, A 144A
3.397%, 9/13/39(3) | 445 | | 409 |
| New Residential Mortgage Loan Trust | | | |
2014-1A, A 144A
3.750%, 1/25/54(3)(7) | 30 | | 29 |
2016-3A, A1 144A
3.750%, 9/25/56(3)(7) | 40 | | 38 |
2016-3A, B1 144A
4.000%, 9/25/56(3)(7) | 156 | | 150 |
2016-4A, A1 144A
3.750%, 11/25/56(3)(7) | 18 | | 16 |
2016-4A, B1A 144A
4.500%, 11/25/56(3)(7) | 836 | | 810 |
2017-2A, A3 144A
4.000%, 3/25/57(3)(7) | 619 | | 591 |
2019-RPL2, M2 144A
3.750%, 2/25/59(3)(7) | 440 | | 388 |
Palisades Mortgage Loan Trust 2021-RTL1, A1 144A
3.487%, 6/25/26(3)(7) | 114 | | 114 |
Progress Residential Trust 2021-SFR3, D 144A
2.288%, 5/17/26(3) | 830 | | 794 |
RCKT Mortgage Trust 2020-1, A1 144A
3.000%, 2/25/50(3)(7) | 169 | | 146 |
| | Par Value(1) | | Value |
| | | | |
| Non-Agency—continued | | |
ROCK Trust 2024-CNTR, C 144A
6.471%, 11/13/41(3) | $ 330 | | $ 335 |
Sequoia Mortgage Trust 2013-8, B1
3.481%, 6/25/43(7) | 58 | | 56 |
| Towd Point Mortgage Trust | | | |
2016-4, B1 144A
4.045%, 7/25/56(3)(7) | 480 | | 459 |
2017-1, A2 144A
3.500%, 10/25/56(3)(7) | 237 | | 234 |
2017-1, M1 144A
3.750%, 10/25/56(3)(7) | 385 | | 374 |
2017-4, A2 144A
3.000%, 6/25/57(3)(7) | 610 | | 567 |
2018-6, A1B 144A
3.750%, 3/25/58(3)(7) | 330 | | 315 |
2018-6, A2 144A
3.750%, 3/25/58(3)(7) | 480 | | 439 |
2019-2, A2 144A
3.750%, 12/25/58(3)(7) | 515 | | 467 |
2019-4, A2 144A
3.250%, 10/25/59(3)(7) | 445 | | 402 |
2021-1, A2 144A
2.750%, 11/25/61(3)(7) | 465 | | 386 |
| Tricon American Homes Trust | | | |
2019-SFR1, C 144A
3.149%, 3/17/38(3) | 590 | | 573 |
2020-SFR2, D 144A
2.281%, 11/17/39(3) | 660 | | 601 |
Tricon Residential Trust 2021-SFR1, B 144A
2.244%, 7/17/38(3) | 185 | | 176 |
| Verus Securitization Trust | | | |
2022-4, A1 144A
4.474%, 4/25/67(3)(7) | 331 | | 329 |
2022-6, A1 144A
4.910%, 6/25/67(3)(7) | 221 | | 220 |
2022-6, A3 144A
4.910%, 6/25/67(3)(7) | 465 | | 460 |
2022-7, A1 144A
5.152%, 7/25/67(3)(7) | 471 | | 468 |
2023-8, A1 144A
6.259%, 12/25/68(3)(7) | 278 | | 280 |
See Notes to Financial Statements
Total Return Fund Inc.
SCHEDULE OF INVESTMENTS (Continued)
November 30, 2024
($ reported in thousands)
| | Par Value(1) | | Value |
| | | | |
| Non-Agency—continued | | |
| Visio Trust | | | |
2020-1R, A2 144A
1.567%, 11/25/55(3) | $ 42 | | $ 39 |
2022-1, A2 144A
5.850%, 8/25/57(3)(7) | 226 | | 225 |
Wells Fargo Mortgage Backed Securities Trust 2020-4, A1 144A
3.000%, 7/25/50(3)(7) | 111 | | 95 |
| | | | 22,515 |
| | | | |
| |
Total Mortgage-Backed Securities
(Identified Cost $30,964) | | 29,809 |
| | | | |
| |
| Asset-Backed Securities—4.1% |
| Automobiles—1.1% | | |
ACM Auto Trust 2023-2A, A 144A
7.970%, 6/20/30(3) | 86 | | 86 |
Arivo Acceptance Auto Loan Receivables Trust 2024-1A, B 144A
6.870%, 6/17/30(3) | 462 | | 474 |
Carvana Auto Receivables Trust 2023-N4, C 144A
6.590%, 2/11/30(3) | 485 | | 500 |
Exeter Automobile Receivables Trust 2023-3A, D
6.680%, 4/16/29 | 530 | | 542 |
| LAD Auto Receivables Trust | | | |
2023-1A, D 144A
7.300%, 6/17/30(3) | 550 | | 565 |
2023-2A, D 144A
6.300%, 2/15/31(3) | 450 | | 455 |
2023-4A, C 144A
6.760%, 3/15/29(3) | 412 | | 425 |
Lendbuzz Securitization Trust 2024-3A, B 144A
5.030%, 11/15/30(3) | 425 | | 421 |
OneMain Direct Auto Receivables Trust 2022-1A, C 144A
5.310%, 6/14/29(3) | 410 | | 409 |
| | Par Value(1) | | Value |
| | | | |
| Automobiles—continued | | |
United Auto Credit Securitization Trust 2024-1, C 144A
7.060%, 10/10/29(3) | $ 405 | | $ 411 |
Westlake Automobile Receivables Trust 2024-2A, B 144A
5.620%, 3/15/30(3) | 360 | | 364 |
| | | | 4,652 |
| | | | |
| |
| Consumer Loans—0.1% | | |
Reach ABS Trust 2024-1A, B 144A
6.290%, 2/18/31(3) | 500 | | 506 |
| Credit Card—0.2% | | |
Mercury Financial Credit Card Master Trust 2023-1A, A 144A
8.040%, 9/20/27(3) | 555 | | 556 |
Mission Lane Credit Card Master Trust 2023-A, A 144A
7.230%, 7/17/28(3) | 447 | | 450 |
| | | | 1,006 |
| | | | |
| |
| Equipment—0.1% | | |
Auxilior Term Funding LLC 2023-1A, D 144A
7.270%, 12/16/30(3) | 290 | | 295 |
| Other—2.6% | | |
Applebee’s Funding LLC 2023-1A, A2 144A
7.824%, 3/5/53(3) | 242 | | 250 |
Aqua Finance Trust 2019-A, C 144A
4.010%, 7/16/40(3) | 409 | | 394 |
| BHG Securitization Trust | | | |
2023-B, A 144A
6.920%, 12/17/36(3) | 206 | | 213 |
2024-1CON, A 144A
5.810%, 4/17/35(3) | 292 | | 295 |
See Notes to Financial Statements
Total Return Fund Inc.
SCHEDULE OF INVESTMENTS (Continued)
November 30, 2024
($ reported in thousands)
| | Par Value(1) | | Value |
| | | | |
| Other—continued | | |
Bojangles Issuer LLC 2024-1A, A2 144A
6.584%, 11/20/54(3) | $ 375 | | $ 374 |
BXG Receivables Note Trust 2020-A, B 144A
2.490%, 2/28/36(3) | 188 | | 176 |
Cajun Global LLC 2021-1, A2 144A
3.931%, 11/20/51(3) | 335 | | 319 |
CCG Receivables Trust 2023-1, A2 144A
5.820%, 9/16/30(3) | 282 | | 284 |
Dext ABS LLC 2023-2, B 144A
6.410%, 5/15/34(3) | 405 | | 412 |
Diamond Resorts Owner Trust 2021-1A, B 144A
2.050%, 11/21/33(3) | 93 | | 90 |
FAT Brands Royalty LLC 2021-1A, A2 144A
5.750%, 4/25/51(3) | 575 | | 485 |
Hardee’s Funding LLC 2024-1A, A2 144A
7.253%, 3/20/54(3) | 458 | | 468 |
HIN Timeshare Trust 2020-A, C 144A
3.420%, 10/9/39(3) | 189 | | 180 |
Jack in the Box Funding LLC 2022-1A, A2I 144A
3.445%, 2/26/52(3) | 520 | | 494 |
Jersey Mike’s Funding LLC 2019-1A, A2 144A
4.433%, 2/15/50(3) | 302 | | 298 |
Libra Solutions LLC 2024-1A, A 144A
5.880%, 9/30/38(3) | 350 | | 344 |
MetroNet Infrastructure Issuer LLC 2024-1A, A2 144A
6.230%, 4/20/54(3) | 360 | | 368 |
Momnt Technologies Trust 2023-1A, A 144A
6.920%, 3/20/45(3) | 215 | | 216 |
| | Par Value(1) | | Value |
| | | | |
| Other—continued | | |
NBC Funding LLC 2021-1, A2 144A
2.989%, 7/30/51(3) | $ 468 | | $ 446 |
Octane Receivables Trust 2023-3A, C 144A
6.740%, 8/20/29(3) | 545 | | 561 |
Oportun Issuance Trust 2024-2, B 144A
5.830%, 2/9/32(3) | 425 | | 426 |
PEAC Solutions Receivables LLC 2024-1A, B 144A
5.790%, 11/20/30(3) | 365 | | 371 |
Purchasing Power Funding LLC 2024-A, B 144A
6.430%, 8/15/28(3) | 510 | | 516 |
RCKT Mortgage Trust 2024-CES1, A1A 144A
6.025%, 2/25/44(3)(7) | 254 | | 255 |
Retained Vantage Data Centers Issuer LLC 2024-1A, A2 144A
4.992%, 9/15/49(3) | 495 | | 481 |
Subway Funding LLC 2024-1A, A2II 144A
6.268%, 7/30/54(3) | 355 | | 361 |
Taco Bell Funding LLC 2016-1A, A23 144A
4.970%, 5/25/46(3) | 351 | | 351 |
Trafigura Securitisation Finance plc 2024-1A, A2 144A
5.980%, 11/15/27(3) | 365 | | 370 |
TSC SPV Funding LLC 2024-1A, A2 144A
6.291%, 8/20/54(3) | 370 | | 370 |
USQ Rail III LLC 2024-1A, A 144A
4.990%, 9/28/54(3) | 360 | | 352 |
See Notes to Financial Statements
Total Return Fund Inc.
SCHEDULE OF INVESTMENTS (Continued)
November 30, 2024
($ reported in thousands)
| | Par Value(1) | | Value |
| | | | |
| Other—continued | | |
Westgate Resorts LLC 2024-1A, A 144A
6.060%, 1/20/38(3) | $ 267 | | $ 269 |
Zaxby’s Funding LLC 2021-1A, A2 144A
3.238%, 7/30/51(3) | 553 | | 505 |
| | | | 11,294 |
| | | | |
| |
Total Asset-Backed Securities
(Identified Cost $17,785) | | 17,753 |
| | | | |
| |
| Corporate Bonds and Notes—12.5% |
| Communication Services—0.8% | | |
Altice France Holding S.A. 144A
6.000%, 2/15/28(3) | 200 | | 53 |
| Altice France S.A. | | | |
| 144A 5.125%, 1/15/29(3) | 300 | | 227 |
| 144A 5.125%, 7/15/29(3) | 175 | | 133 |
CCO Holdings LLC 144A
4.750%, 3/1/30(2)(3) | 305 | | 283 |
CMG Media Corp. 144A
8.875%, 6/18/29(3) | 395 | | 273 |
| CSC Holdings LLC | | | |
| 144A 7.500%, 4/1/28(3) | 365 | | 264 |
| 144A 11.750%, 1/31/29(3) | 250 | | 248 |
DIRECTV Financing LLC 144A
8.875%, 2/1/30(3) | 195 | | 196 |
Gray Television, Inc. 144A
7.000%, 5/15/27(3) | 350 | | 343 |
Hughes Satellite Systems Corp.
6.625%, 8/1/26 | 215 | | 176 |
Level 3 Financing, Inc. 144A
3.625%, 1/15/29(3) | 335 | | 267 |
Millennium Escrow Corp. 144A
6.625%, 8/1/26(3) | 350 | | 254 |
Rackspace Technology Global, Inc. 144A
5.375%, 12/1/28(3) | 490 | | 147 |
Sprint Capital Corp.
8.750%, 3/15/32(2) | 230 | | 280 |
| | Par Value(1) | | Value |
| | | | |
| Communication Services—continued | | |
Telesat Canada 144A
6.500%, 10/15/27(3) | $ 270 | | $ 88 |
| | | | 3,232 |
| | | | |
| |
| Consumer Discretionary—0.5% | | |
Aptiv plc
6.875%, 12/15/54(2) | 280 | | 272 |
Ashtead Capital, Inc. 144A
5.500%, 8/11/32(2)(3) | 260 | | 261 |
Ford Motor Credit Co. LLC
7.350%, 3/6/30(2) | 192 | | 206 |
Great Canadian Gaming Corp. 144A
8.750%, 11/15/29(3) | 65 | | 67 |
Meritage Homes Corp. 144A
3.875%, 4/15/29(2)(3) | 283 | | 267 |
Newell Brands, Inc.
6.625%, 9/15/29(2) | 238 | | 244 |
Ontario Gaming GTA LP 144A
8.000%, 8/1/30(2)(3) | 150 | | 155 |
PetSmart, Inc. 144A
7.750%, 2/15/29(2)(3) | 200 | | 197 |
Prime Security Services Borrower LLC 144A
6.250%, 1/15/28(2)(3) | 250 | | 250 |
Weekley Homes LLC 144A
4.875%, 9/15/28(2)(3) | 355 | | 339 |
| | | | 2,258 |
| | | | |
| |
| Consumer Staples—0.5% | | |
BAT Capital Corp.
7.750%, 10/19/32(2) | 238 | | 276 |
Herbalife Nutrition Ltd. 144A
7.875%, 9/1/25(2)(3) | 230 | | 230 |
HLF Financing S.a.r.l. LLC 144A
4.875%, 6/1/29(3) | 220 | | 159 |
| Kronos Acquisition Holdings, Inc. | | | |
| 144A 8.250%, 6/30/31(2)(3) | 225 | | 218 |
| 144A 10.750%, 6/30/32(3) | 270 | | 247 |
See Notes to Financial Statements
Total Return Fund Inc.
SCHEDULE OF INVESTMENTS (Continued)
November 30, 2024
($ reported in thousands)
| | Par Value(1) | | Value |
| | | | |
| Consumer Staples—continued | | |
Philip Morris International, Inc.
4.900%, 11/1/34 | $ 290 | | $ 286 |
Pilgrim’s Pride Corp.
6.250%, 7/1/33(2) | 230 | | 241 |
Post Holdings, Inc. 144A
6.375%, 3/1/33(2)(3) | 160 | | 159 |
Triton Water Holdings, Inc. 144A
6.250%, 4/1/29(3) | 145 | | 144 |
| | | | 1,960 |
| | | | |
| |
| Energy—2.3% | | |
Adnoc Murban Rsc Ltd. 144A
4.500%, 9/11/34(3) | 321 | | 307 |
Aker BP ASA 144A
5.125%, 10/1/34(3) | 295 | | 285 |
Alliance Resource Operating Partners LP 144A
8.625%, 6/15/29(2)(3) | 190 | | 201 |
Ascent Resources Utica Holdings LLC 144A
8.250%, 12/31/28(2)(3) | 410 | | 420 |
BP Capital Markets plc
4.875% (2)(8) | 437 | | 423 |
| Columbia Pipelines Operating Co. LLC | | | |
| 144A 6.036%, 11/15/33(3) | 260 | | 274 |
| 144A 6.714%, 8/15/63(2)(3) | 50 | | 56 |
Coronado Finance Pty Ltd. 144A
9.250%, 10/1/29(2)(3) | 185 | | 191 |
CrownRock LP 144A
5.000%, 5/1/29(3) | 170 | | 172 |
CVR Energy, Inc. 144A
8.500%, 1/15/29(2)(3) | 340 | | 334 |
Ecopetrol S.A.
4.625%, 11/2/31 | 110 | | 92 |
Encino Acquisition Partners Holdings LLC 144A
8.750%, 5/1/31(2)(3) | 85 | | 90 |
Energy Transfer LP Series H
6.500% (8) | 350 | | 350 |
Flex Intermediate Holdco LLC 144A
3.363%, 6/30/31(2)(3) | 467 | | 406 |
| | Par Value(1) | | Value |
| | | | |
| Energy—continued | | |
Genesis Energy LP
8.875%, 4/15/30(2) | $ 245 | | $ 255 |
Greensaif Pipelines Bidco S.a.r.l. 144A
6.129%, 2/23/38(3) | 100 | | 102 |
Gulfport Energy Operating Corp. 144A
6.750%, 9/1/29(2)(3) | 100 | | 102 |
Helix Energy Solutions Group, Inc. 144A
9.750%, 3/1/29(2)(3) | 275 | | 297 |
International Petroleum Corp. 144A, RegS
7.250%, 2/1/27(2)(3)(5) | 380 | | 375 |
KazMunayGas National Co. JSC 144A
6.375%, 10/24/48(3) | 86 | | 83 |
Kinder Morgan Energy Partners LP
7.500%, 11/15/40 | 239 | | 280 |
Kraken Oil & Gas Partners LLC 144A
7.625%, 8/15/29(2)(3) | 90 | | 89 |
Magnolia Oil & Gas Operating LLC 144A
6.875%, 12/1/32(3) | 40 | | 40 |
Mesquite Energy, Inc. 144A
7.250%, 2/15/23(3) | 105 | | 2 |
Nabors Industries, Inc. 144A
7.375%, 5/15/27(3) | 170 | | 170 |
Occidental Petroleum Corp.
6.200%, 3/15/40 | 215 | | 220 |
Pertamina Persero PT 144A
2.300%, 2/9/31(3) | 616 | | 523 |
Petroleos de Venezuela S.A. 144A
6.000%, 5/16/24(3)(4) | 665 | | 61 |
| Petroleos Mexicanos | | | |
| 6.500%, 3/13/27 | 390 | | 381 |
| 6.700%, 2/16/32 | 425 | | 377 |
| 7.690%, 1/23/50 | 180 | | 141 |
Petronas Capital Ltd. 144A
3.500%, 4/21/30(3) | 231 | | 217 |
Plains All American Pipeline LP
5.700%, 9/15/34(2) | 250 | | 257 |
See Notes to Financial Statements
Total Return Fund Inc.
SCHEDULE OF INVESTMENTS (Continued)
November 30, 2024
($ reported in thousands)
| | Par Value(1) | | Value |
| | | | |
| Energy—continued | | |
QatarEnergy 144A
2.250%, 7/12/31(3) | $ 230 | | $ 197 |
Saudi Arabian Oil Co. 144A
5.250%, 7/17/34(3) | 322 | | 324 |
South Bow Canadian Infrastructure Holdings Ltd. 144A
7.500%, 3/1/55(2)(3) | 90 | | 94 |
Teine Energy Ltd. 144A
6.875%, 4/15/29(2)(3) | 330 | | 324 |
Transcanada Trust
5.600%, 3/7/82(2) | 305 | | 292 |
| Transocean, Inc. | | | |
| 144A 8.250%, 5/15/29(3) | 50 | | 50 |
| 144A 8.750%, 2/15/30(2)(3) | 242 | | 252 |
| 144A 8.500%, 5/15/31(3) | 160 | | 162 |
| Venture Global LNG, Inc. | | | |
| 144A 9.000%(2)(3)(8) | 100 | | 104 |
| 144A 9.875%, 2/1/32(2)(3) | 255 | | 284 |
Western Midstream Operating LP
5.250%, 2/1/50(2) | 285 | | 254 |
| | | | 9,910 |
| | | | |
| |
| Financials—4.3% | | |
| Acrisure LLC | | | |
| 144A 8.250%, 2/1/29(3) | 130 | | 134 |
| 144A 6.000%, 8/1/29(3) | 135 | | 129 |
AerCap Ireland Capital DAC
6.950%, 3/10/55(2) | 150 | | 156 |
Aethon United BR LP 144A
7.500%, 10/1/29(2)(3) | 20 | | 21 |
Allianz SE 144A
6.350%, 9/6/53(2)(3) | 200 | | 210 |
Allstate Corp. (The) Series B (3 month Term SOFR + 3.200%)
7.723%, 8/15/53(2)(7) | 275 | | 276 |
Altice Financing S.A. 144A
5.000%, 1/15/28(3) | 515 | | 411 |
American Express Co.
5.625%, 7/28/34(2) | 208 | | 214 |
Apollo Debt Solutions BDC 144A
6.900%, 4/13/29(2)(3) | 223 | | 232 |
| | Par Value(1) | | Value |
| | | | |
| Financials—continued | | |
Ascot Group Ltd. 144A
4.250%, 12/15/30(2)(3) | $ 509 | | $ 438 |
Aston Martin Capital Holdings Ltd. 144A
10.000%, 3/31/29(3) | 320 | | 314 |
| Banco de Credito del Peru S.A. | | | |
| 144A 3.125%, 7/1/30(3) | 214 | | 210 |
| RegS 3.125%, 7/1/30(5) | 73 | | 72 |
Banco de Credito e Inversiones S.A. 144A
8.750% (3)(8) | 159 | | 167 |
Banco Mercantil del Norte S.A. 144A
6.625% (3)(8) | 150 | | 135 |
| Bank of America Corp. | | | |
| 5.015%, 7/22/33(2) | 137 | | 137 |
| 5.288%, 4/25/34(2) | 140 | | 142 |
| 5.425%, 8/15/35(2) | 220 | | 220 |
Bank of New York Mellon Corp. (The) Series G
4.700% (2)(8) | 427 | | 422 |
Barclays plc
7.437%, 11/2/33 | 259 | | 292 |
BBVA Bancomer S.A. 144A
5.125%, 1/18/33(3) | 262 | | 244 |
Blackstone Private Credit Fund
2.625%, 12/15/26(2) | 256 | | 242 |
Block, Inc. 144A
6.500%, 5/15/32(2)(3) | 165 | | 169 |
Blue Owl Credit Income Corp.
4.700%, 2/8/27(2) | 216 | | 212 |
Blue Owl Finance LLC
3.125%, 6/10/31(2) | 330 | | 290 |
BNSF Funding Trust I
6.613%, 12/15/55(2) | 245 | | 247 |
BPCE S.A. 144A
7.003%, 10/19/34(2)(3) | 250 | | 273 |
BroadStreet Partners, Inc. 144A
5.875%, 4/15/29(3) | 270 | | 260 |
| Capital One Financial Corp. | | | |
| 2.359%, 7/29/32(2) | 180 | | 148 |
| 6.377%, 6/8/34 | 135 | | 143 |
See Notes to Financial Statements
Total Return Fund Inc.
SCHEDULE OF INVESTMENTS (Continued)
November 30, 2024
($ reported in thousands)
| | Par Value(1) | | Value |
| | | | |
| Financials—continued | | |
Charles Schwab Corp. (The) Series H
4.000% (8) | $ 334 | | $ 293 |
Chobani Holdco II LLC 144A
8.750%, 10/1/29(3) | 5 | | 5 |
| Citigroup, Inc. | | | |
| 6.270%, 11/17/33(2) | 194 | | 208 |
| 6.174%, 5/25/34 | 202 | | 211 |
Series X
3.875%(2)(8) | 170 | | 164 |
Corebridge Financial, Inc.
6.375%, 9/15/54(2) | 321 | | 322 |
Deutsche Bank AG
5.403%, 9/11/35(2) | 220 | | 214 |
Drawbridge Special Opportunities Fund LP 144A
3.875%, 2/15/26(2)(3) | 480 | | 466 |
Export-Import Bank Korea
5.125%, 1/11/33 | 235 | | 242 |
F&G Annuities & Life, Inc.
6.500%, 6/4/29 | 180 | | 185 |
Fifth Third Bancorp
4.337%, 4/25/33(2) | 273 | | 259 |
Foundry JV Holdco LLC 144A
6.250%, 1/25/35(2)(3) | 325 | | 336 |
| Global Atlantic Fin Co. | | | |
| 144A 7.950%, 6/15/33(2)(3) | 169 | | 191 |
| 144A 7.950%, 10/15/54(2)(3) | 85 | | 89 |
| Goldman Sachs Group, Inc. (The) | | | |
| 3.102%, 2/24/33(2) | 245 | | 216 |
| 6.450%, 5/1/36 | 190 | | 208 |
Grifols S.A. 144A
4.750%, 10/15/28(3) | 245 | | 224 |
HA Sustainable Infrastructure Capital, Inc. 144A
6.375%, 7/1/34(2)(3) | 276 | | 278 |
HUB International Ltd. 144A
7.375%, 1/31/32(3) | 55 | | 56 |
Huntington Bancshares, Inc.
5.709%, 2/2/35(2) | 255 | | 261 |
Icon Investments Six DAC
6.000%, 5/8/34(2) | 205 | | 211 |
| | Par Value(1) | | Value |
| | | | |
| Financials—continued | | |
ION Trading Technologies S.a.r.l. 144A
9.500%, 5/30/29(2)(3) | $ 275 | | $ 284 |
JPMorgan Chase & Co.
1.953%, 2/4/32(2) | 300 | | 253 |
KeyCorp
6.401%, 3/6/35(2) | 221 | | 236 |
Liberty Mutual Group, Inc. 144A
4.125%, 12/15/51(2)(3) | 185 | | 176 |
Melco Resorts Finance Ltd. 144A
5.375%, 12/4/29(3) | 341 | | 313 |
Merlin Entertainments Group U.S. Holdings, Inc. 144A
7.375%, 2/15/31(2)(3) | 245 | | 240 |
MetLife, Inc. Series G
3.850% (2)(8) | 340 | | 334 |
Midcap Financial Issuer Trust 144A
6.500%, 5/1/28(3) | 265 | | 259 |
| Morgan Stanley | | | |
| 6.342%, 10/18/33(2) | 182 | | 197 |
| 5.948%, 1/19/38(2) | 208 | | 213 |
MSCI, Inc. 144A
3.625%, 9/1/30(2)(3) | 256 | | 237 |
National Rural Utilities Cooperative Finance Corp. (3 month Term SOFR + 3.172%)
7.761%, 4/30/43(7) | 270 | | 270 |
Nationstar Mortgage Holdings, Inc. 144A
5.750%, 11/15/31(3) | 360 | | 350 |
NatWest Group plc
6.475%, 6/1/34 | 220 | | 228 |
NewCo Holding USD 20 S.a.r.l. 144A
9.375%, 11/7/29(3) | 65 | | 65 |
Nippon Life Insurance Co. 144A
6.250%, 9/13/53(2)(3) | 200 | | 211 |
Nuveen LLC 144A
5.850%, 4/15/34(2)(3) | 245 | | 254 |
See Notes to Financial Statements
Total Return Fund Inc.
SCHEDULE OF INVESTMENTS (Continued)
November 30, 2024
($ reported in thousands)
| | Par Value(1) | | Value |
| | | | |
| Financials—continued | | |
OneMain Finance Corp.
7.125%, 11/15/31(2) | $ 370 | | $ 381 |
Panther Escrow Issuer LLC 144A
7.125%, 6/1/31(2)(3) | 30 | | 31 |
| Prudential Financial, Inc. | | | |
| 5.125%, 3/1/52(2) | 148 | | 143 |
| 6.750%, 3/1/53(2) | 120 | | 126 |
Societe Generale S.A. 144A
6.066%, 1/19/35(2)(3) | 200 | | 204 |
South Bow USA Infrastructure Holdings LLC 144A
5.584%, 10/1/34(2)(3) | 130 | | 130 |
| State Street Corp. | | | |
| 6.123%, 11/21/34(2) | 70 | | 75 |
Series I
6.700%(2)(8) | 200 | | 205 |
Synchrony Financial
4.875%, 6/13/25(2) | 80 | | 80 |
Texas Capital Bancshares, Inc.
4.000%, 5/6/31 | 495 | | 474 |
Toronto-Dominion Bank (The)
8.125%, 10/31/82 | 239 | | 251 |
| UBS Group AG | | | |
| 144A 9.250%(3)(8) | 35 | | 40 |
| 144A 4.988%, 8/5/33(2)(3) | 289 | | 287 |
| Wells Fargo & Co. | | | |
| 5.389%, 4/24/34 | 270 | | 273 |
Series BB
3.900%(2)(8) | 470 | | 457 |
| | | | 18,476 |
| | | | |
| |
| Health Care—0.6% | | |
Catalent Pharma Solutions, Inc. 144A
3.500%, 4/1/30(2)(3) | 395 | | 389 |
| Community Health Systems, Inc. | | | |
| 144A 5.250%, 5/15/30(3) | 55 | | 47 |
| 144A 4.750%, 2/15/31(3) | 285 | | 231 |
DENTSPLY SIRONA, Inc.
3.250%, 6/1/30 | 388 | | 348 |
Endo Finance Holdings, Inc. 144A
8.500%, 4/15/31(3) | 185 | | 197 |
| | Par Value(1) | | Value |
| | | | |
| Health Care—continued | | |
HCA, Inc.
5.500%, 6/1/33 | $ 229 | | $ 231 |
| LifePoint Health, Inc. | | | |
| 144A 9.875%, 8/15/30(2)(3) | 305 | | 331 |
| 144A 10.000%, 6/1/32(3) | 110 | | 115 |
Medline Borrower LP 144A
5.250%, 10/1/29(2)(3) | 205 | | 200 |
Molina Healthcare, Inc. 144A
6.250%, 1/15/33(3) | 80 | | 81 |
Par Pharmaceutical, Inc.
7.500%, 4/1/27(9) | 187 | | — |
Prime Healthcare Services, Inc. 144A
9.375%, 9/1/29(2)(3) | 170 | | 173 |
Smith & Nephew plc
5.400%, 3/20/34(2) | 220 | | 223 |
Universal Health Services, Inc.
2.650%, 1/15/32(2) | 262 | | 219 |
| | | | 2,785 |
| | | | |
| |
| Industrials—1.3% | | |
Adani Ports & Special Economic Zone Ltd. 144A
4.375%, 7/3/29(3) | 355 | | 310 |
Alaska Airlines Pass-Through Trust 2020-1, A 144A
4.800%, 2/15/29(2)(3) | 443 | | 439 |
Amentum Holdings, Inc. 144A
7.250%, 8/1/32(2)(3) | 40 | | 41 |
Aviation Capital Group LLC 144A
3.500%, 11/1/27(2)(3) | 254 | | 244 |
Avolon Holdings Funding Ltd. 144A
4.375%, 5/1/26(2)(3) | 243 | | 238 |
Boeing Co. (The)
5.930%, 5/1/60 | 222 | | 210 |
Builders FirstSource, Inc. 144A
6.375%, 3/1/34(2)(3) | 245 | | 250 |
Cimpress plc 144A
7.375%, 9/15/32(2)(3) | 195 | | 195 |
See Notes to Financial Statements
Total Return Fund Inc.
SCHEDULE OF INVESTMENTS (Continued)
November 30, 2024
($ reported in thousands)
| | Par Value(1) | | Value |
| | | | |
| Industrials—continued | | |
Cornerstone Building Brands, Inc. 144A
9.500%, 8/15/29(3) | $ 260 | | $ 259 |
CoStar Group, Inc. 144A
2.800%, 7/15/30(2)(3) | 363 | | 320 |
DP World Ltd. 144A
6.850%, 7/2/37(3) | 15 | | 17 |
Garda World Security Corp. 144A
8.375%, 11/15/32(3) | 190 | | 195 |
Global Infrastructure Solutions, Inc. 144A
7.500%, 4/15/32(2)(3) | 360 | | 365 |
Hertz Corp. (The) 144A
4.625%, 12/1/26(3) | 340 | | 294 |
Huntington Ingalls Industries, Inc.
5.749%, 1/15/35 | 290 | | 295 |
| Icahn Enterprises LP | | | |
| 6.250%, 5/15/26 | 165 | | 163 |
| 5.250%, 5/15/27 | 40 | | 38 |
| 144A 10.000%, 11/15/29(3) | 90 | | 92 |
LBM Acquisition LLC 144A
6.250%, 1/15/29(3) | 300 | | 281 |
Regal Rexnord Corp.
6.400%, 4/15/33(2) | 329 | | 347 |
Sempra Infrastructure Partners LP 144A
3.250%, 1/15/32(2)(3) | 475 | | 403 |
United Airlines Pass-Through Trust 2023-1, A
5.800%, 7/15/37(2) | 289 | | 299 |
VistaJet Malta Finance plc 144A
9.500%, 6/1/28(3) | 420 | | 420 |
| | | | 5,715 |
| | | | |
| |
| Information Technology—0.2% | | |
AppLovin Corp.
5.500%, 12/1/34 | 220 | | 222 |
Booz Allen Hamilton, Inc. 144A
4.000%, 7/1/29(2)(3) | 90 | | 86 |
CommScope Technologies LLC 144A
6.000%, 6/15/25(3) | 270 | | 264 |
| | Par Value(1) | | Value |
| | | | |
| Information Technology—continued | | |
Consensus Cloud Solutions, Inc. 144A
6.500%, 10/15/28(2)(3) | $ 115 | | $ 114 |
Helios Software Holdings, Inc. 144A
8.750%, 5/1/29(2)(3) | 100 | | 102 |
Insight Enterprises, Inc. 144A
6.625%, 5/15/32(2)(3) | 25 | | 26 |
Vontier Corp.
2.950%, 4/1/31(2) | 200 | | 173 |
| | | | 987 |
| | | | |
| |
| Materials—0.8% | | |
ASP Unifrax Holdings, Inc. 144A
5.250%, 9/30/28(3) | 565 | | 272 |
Bayport Polymers LLC 144A
5.140%, 4/14/32(2)(3) | 415 | | 395 |
Corp. Nacional del Cobre de Chile 144A
5.950%, 1/8/34(3) | 256 | | 260 |
Illuminate Buyer LLC 144A
9.000%, 7/1/28(3) | 365 | | 370 |
INEOS Quattro Finance 2 plc 144A
9.625%, 3/15/29(3) | 270 | | 287 |
LSB Industries, Inc. 144A
6.250%, 10/15/28(3) | 240 | | 233 |
Mauser Packaging Solutions Holding Co. 144A
9.250%, 4/15/27(3) | 250 | | 256 |
New Enterprise Stone & Lime Co., Inc. 144A
9.750%, 7/15/28(3) | 230 | | 235 |
Samarco Mineracao S.A. PIK 144A
9.000%, 6/30/31(3)(10) | 67 | | 65 |
Sealed Air Corp. 144A
6.500%, 7/15/32(2)(3) | 90 | | 92 |
Sonoco Products Co.
5.000%, 9/1/34(2) | 225 | | 220 |
Taseko Mines Ltd. 144A
8.250%, 5/1/30(2)(3) | 265 | | 274 |
Trivium Packaging Finance B.V. 144A
8.500%, 8/15/27(3) | 382 | | 383 |
See Notes to Financial Statements
Total Return Fund Inc.
SCHEDULE OF INVESTMENTS (Continued)
November 30, 2024
($ reported in thousands)
| | Par Value(1) | | Value |
| | | | |
| Materials—continued | | |
WR Grace Holdings LLC 144A
5.625%, 8/15/29(3) | $ 209 | | $ 195 |
| | | | 3,537 |
| | | | |
| |
| Real Estate—0.2% | | |
EPR Properties
3.600%, 11/15/31 | 325 | | 287 |
Office Properties Income Trust 144A
9.000%, 9/30/29(3) | 220 | | 192 |
Safehold GL Holdings LLC
6.100%, 4/1/34(2) | 215 | | 223 |
| VICI Properties LP | | | |
| 5.125%, 5/15/32 | 135 | | 133 |
| 144A 4.625%, 6/15/25(2)(3) | 65 | | 65 |
| 144A 4.125%, 8/15/30(2)(3) | 95 | | 89 |
| | | | 989 |
| | | | |
| |
| Utilities—1.0% | | |
AES Corp. (The)
7.600%, 1/15/55(2) | 175 | | 182 |
CMS Energy Corp.
4.750%, 6/1/50 | 366 | | 347 |
Dominion Energy, Inc.
6.625%, 5/15/55 | 295 | | 302 |
| Electricite de France S.A. | | | |
| 144A 6.250%, 5/23/33(3) | 184 | | 197 |
| 144A 6.900%, 5/23/53(2)(3) | 176 | | 198 |
Enel Finance International N.V. 144A
7.500%, 10/14/32(3) | 231 | | 264 |
Entergy Corp.
7.125%, 12/1/54(2) | 290 | | 297 |
| Ferrellgas LP | | | |
| 144A 5.375%, 4/1/26(2)(3) | 125 | | 124 |
| 144A 5.875%, 4/1/29(2)(3) | 275 | | 258 |
KeySpan Gas East Corp. 144A
5.994%, 3/6/33(3) | 276 | | 286 |
Lightning Power LLC 144A
7.250%, 8/15/32(2)(3) | 15 | | 16 |
| NGL Energy Operating LLC | | | |
| 144A 8.125%, 2/15/29(3) | 55 | | 56 |
| 144A 8.375%, 2/15/32(3) | 240 | | 246 |
| | Par Value(1) | | Value |
| | | | |
| Utilities—continued | | |
NRG Energy, Inc. 144A
7.000%, 3/15/33(2)(3) | $ 328 | | $ 359 |
PacifiCorp
5.800%, 1/15/55(2) | 214 | | 220 |
Perusahaan Perseroan Persero PT Perusahaan Listrik Negara 144A
4.125%, 5/15/27(3) | 250 | | 245 |
Southern Co. (The) Series 21-A
3.750%, 9/15/51(2) | 419 | | 403 |
Vistra Corp. 144A
8.000% (2)(3)(8) | 190 | | 195 |
Vistra Operations Co. LLC 144A
5.700%, 12/30/34(3) | 30 | | 30 |
| | | | 4,225 |
| | | | |
| |
Total Corporate Bonds and Notes
(Identified Cost $55,235) | | 54,074 |
| | | | |
| |
| Leveraged Loans—4.6% |
| Aerospace—0.0% | | |
Peraton Corp. Tranche B, First Lien (1 month Term SOFR + 3.850%)
8.423%, 2/1/28(7) | 143 | | 134 |
| Chemicals—0.2% | | |
Ineos Finance plc 2030 (1 month Term SOFR + 3.250%)
7.823%, 2/18/30(7) | 161 | | 162 |
Innophos Holdings, Inc. (1 month Term SOFR + 3.864%)
8.437%, 2/5/27(7) | 163 | | 162 |
LSF11 A5 Holdco LLC 2024 (1 month Term SOFR + 3.614%)
8.187%, 10/15/28(7) | 173 | | 174 |
See Notes to Financial Statements
Total Return Fund Inc.
SCHEDULE OF INVESTMENTS (Continued)
November 30, 2024
($ reported in thousands)
| | Par Value(1) | | Value |
| | | | |
| Chemicals—continued | | |
Lummus Technology Holdings V LLC 2024, Tranche B (1 month Term SOFR + 3.614%)
8.187%, 12/31/29(7) | $ 95 | | $ 95 |
Nouryon Finance B.V. 2024, Tranche B-1 (3 month Term SOFR + 3.250%)
7.657%, 4/3/28(7) | 161 | | 163 |
| | | | 756 |
| | | | |
| |
| Consumer Durables—0.1% | | |
Gloves Buyer, Inc. First Lien (1 month Term SOFR + 4.114%)
8.687%, 12/29/27(7) | 119 | | 119 |
Madison Safety & Flow LLC (1 month Term SOFR + 3.250%)
7.823%, 9/26/31(7) | 135 | | 136 |
White Cap Buyer LLC Tranche C (1 month Term SOFR + 3.250%)
7.823%, 10/19/29(7) | 115 | | 116 |
| | | | 371 |
| | | | |
| |
| Consumer Non-Durables—0.1% | | |
Albion Financing 3 S.a.r.l. 2024 (3 month Term SOFR + 4.512%)
9.096%, 8/16/29(7) | 90 | | 91 |
DS Parent, Inc. Tranche B (3 month Term SOFR + 5.500%)
10.104%, 1/31/31(7) | 209 | | 199 |
Kronos Acquisition Holdings, Inc. 2024 (3 month Term SOFR + 4.000%)
8.584%, 7/8/31(7) | 137 | | 129 |
| | Par Value(1) | | Value |
| | | | |
| Consumer Non-Durables—continued | | |
Varsity Brands, Inc. (3 month Term SOFR + 3.750%)
8.271%, 8/26/31(7) | $ 100 | | $ 100 |
| | | | 519 |
| | | | |
| |
| Energy—0.1% | | |
Epic Crude Services LP Tranche B (3 month Term SOFR + 3.000%)
7.656%, 10/10/31(7) | 140 | | 141 |
Freeport LNG Investments LLP Tranche B (3 month Term SOFR + 3.500%)
8.379%, 12/21/28(7) | 173 | | 173 |
Hamilton Projects Acquiror LLC First Lien (1 month Term SOFR + 3.750%)
8.323%, 5/31/31(7) | 35 | | 35 |
NGP XI Midstream Holdings LLC (3 month Term SOFR + 4.000%)
8.604%, 7/25/31(7) | 65 | | 65 |
Traverse Midstream Partners LLC Tranche B (3 month Term SOFR + 3.500%)
8.085%, 2/16/28(7) | 127 | | 128 |
| | | | 542 |
| | | | |
| |
| Financials—0.2% | | |
| Acrisure LLC | | | |
2024 (1 month Term SOFR + 3.250%)
7.849%, 11/6/30(7) | 114 | | 115 |
2024, Tranche B (1 month Term SOFR + 3.000%)
7.599%, 2/16/27(7) | 126 | | 126 |
See Notes to Financial Statements
Total Return Fund Inc.
SCHEDULE OF INVESTMENTS (Continued)
November 30, 2024
($ reported in thousands)
| | Par Value(1) | | Value |
| | | | |
| Financials—continued | | |
AssuredPartners, Inc. 2024 (1 month Term SOFR + 3.500%)
8.073%, 2/14/31(7) | $ 60 | | $ 60 |
Asurion LLC Tranche B-9 (1 month Term SOFR + 3.364%)
7.937%, 7/31/27(7) | 211 | | 210 |
Dynamo U.S. Bidco, Inc. Tranche B (6 month Term SOFR + 4.000%)
8.245%, 9/25/31(7) | 35 | | 35 |
PEX Holdings LLC (1 month Term SOFR + 2.750%)
7.339%, 11/20/31(7) | 205 | | 206 |
| | | | 752 |
| | | | |
| |
| Food / Tobacco—0.2% | | |
Aspire Bakeries Holdings LLC (1 month Term SOFR + 4.250%)
8.823%, 12/23/30(7) | 258 | | 259 |
| Del Monte Foods, Inc. | | | |
(3 month Term SOFR + 4.900%)
9.847%, 8/2/28(7)(9) | 188 | | 34 |
(3 month Term SOFR + 8.150%)
13.166%, 8/2/28(7) | 95 | | 93 |
(3-6 month Term SOFR + 4.400%)
8.866% - 9.347%, 8/2/28(7) | 83 | | 49 |
Naked Juice LLC (3 month Term SOFR + 3.350%)
7.954%, 1/24/29(7) | 190 | | 132 |
Pegasus Bidco B.V. 2024 (3 month Term SOFR + 3.250%)
7.773%, 7/12/29(7) | 112 | | 113 |
Sigma Bidco B.V. Tranche B-10 (6 month Term SOFR + 4.410%)
9.076%, 1/3/28(7) | 168 | | 169 |
| | | | 849 |
| | | | |
| |
| | Par Value(1) | | Value |
| | | | |
| Forest Prod / Containers—0.2% | | |
Clydesdale Acquisition Holdings, Inc. Tranche B (1 month Term SOFR + 3.175%)
7.748%, 4/13/29(7) | $ 225 | | $ 227 |
Klockner Pentaplast of America, Inc. Tranche B (6 month Term SOFR + 4.975%)
9.723%, 2/12/26(7) | 201 | | 192 |
Mauser Packaging Solutions Holding Co. (1 month PRIME + 3.000%)
7.589%, 4/15/27 | 180 | | 181 |
TricorBraun, Inc. (1 month Term SOFR + 3.364%)
7.937%, 3/3/28(7) | 213 | | 212 |
| | | | 812 |
| | | | |
| |
| Gaming / Leisure—0.3% | | |
ECL Entertainment LLC Tranche B (1 month Term SOFR + 3.500%)
8.073%, 8/31/30(7) | 184 | | 185 |
Entain plc Tranche B-3 (6 month Term SOFR + 2.750%)
8.014%, 10/31/29(7) | 164 | | 165 |
Great Canadian Gaming 2024, Tranche B (1 month Term SOFR + 4.750%)
9.272%, 11/1/29(7) | 75 | | 75 |
J&J Ventures Gaming LLC (1 month Term SOFR + 4.114%)
8.714%, 4/26/28(7) | 148 | | 149 |
Motion Finco LLC Tranche B-3 (3 month Term SOFR + 3.500%)
8.104%, 11/12/29(7) | 189 | | 187 |
Ontario Gaming GTA Ltd. Partnership Tranche B (3 month Term SOFR + 4.250%)
8.893%, 8/1/30(7) | 133 | | 134 |
See Notes to Financial Statements
Total Return Fund Inc.
SCHEDULE OF INVESTMENTS (Continued)
November 30, 2024
($ reported in thousands)
| | Par Value(1) | | Value |
| | | | |
| Gaming / Leisure—continued | | |
Scientific Games Holdings LP 2024 (3 month Term SOFR + 3.000%)
7.590%, 4/4/29(7) | $ 225 | | $ 225 |
Seaworld Parks & Entertainment, Inc. Tranche B-3 (1 month Term SOFR + 2.000%)
6.524%, 12/4/31(7) | 115 | | 115 |
| | | | 1,235 |
| | | | |
| |
| Health Care—0.6% | | |
Agiliti Health, Inc. 2023, Tranche B (3-6 month Term SOFR + 3.000%)
7.262% - 7.593%, 5/1/30(7) | 150 | | 148 |
Bausch & Lomb Corp. (1 month Term SOFR + 4.000%)
8.573%, 9/29/28(7) | 119 | | 119 |
CHG Healthcare Services, Inc. First Lien (1-3 month Term SOFR + 3.762%)
8.187% - 8.276%, 9/29/28(7) | 154 | | 155 |
Cotiviti, Inc. (1 month Term SOFR + 2.750%)
7.303%, 5/1/31(7) | 159 | | 160 |
Gainwell Acquisition Corp. Tranche B (3 month Term SOFR + 4.100%)
8.704%, 10/1/27(7) | 181 | | 173 |
Global Medical Response, Inc. 2024 (1 month Term SOFR + 5.500%)
10.099%, 10/31/28(7) | 155 | | 155 |
Grifols Worldwide Operations USA, Inc. Tranche B (3 month Term SOFR + 2.150%)
6.735%, 11/15/27(7) | 300 | | 293 |
Hunter Holdco 3 Ltd. First Lien (3 month Term SOFR + 4.350%)
8.954%, 8/19/28(7) | 189 | | 185 |
| | Par Value(1) | | Value |
| | | | |
| Health Care—continued | | |
Lannett Co., Inc. First Lien (3 month Term SOFR + 2.000%)
2.000%, 6/16/30(7)(9) | $ 23 | | $ 8 |
| LifePoint Health, Inc. | | | |
2024 (3 month Term SOFR + 4.000%)
8.632%, 5/17/31(7) | 30 | | 30 |
Tranche B (3 month Term SOFR + 3.750%)
8.406%, 5/16/31(7) | 155 | | 155 |
Modivcare, Inc. (3 month Term SOFR + 4.750%)
9.343%, 7/1/31(7) | 40 | | 38 |
One Call Corp. Tranche B, First Lien (3 month Term SOFR + 5.762%)
10.387%, 4/22/27(7) | 155 | | 151 |
Packaging Coordinators Midco, Inc. 2024 (3 month Term SOFR + 3.250%)
7.835%, 11/30/27(7) | 207 | | 209 |
PointClickCare Technologies, Inc. 2024, Tranche B (1 month Term SOFR + 3.250%)
7.821%, 11/3/31(7) | 55 | | 55 |
Radiology Partners, Inc. Tranche C (3 month Term SOFR + 3.762%)
8.275%, 1/31/29(7) | 141 | | 140 |
Star Parent, Inc. Tranche B (3 month Term SOFR + 3.750%)
8.354%, 9/27/30(7) | 204 | | 200 |
Upstream Newco, Inc. 2021 (3 month Term SOFR + 4.512%)
9.097%, 11/20/26(7) | 226 | | 187 |
| | | | 2,561 |
| | | | |
| |
| Housing—0.2% | | |
| Chariot Buyer LLC | | | |
(1 month Term SOFR + 3.250%)
7.923%, 11/3/28(7) | 90 | | 90 |
See Notes to Financial Statements
Total Return Fund Inc.
SCHEDULE OF INVESTMENTS (Continued)
November 30, 2024
($ reported in thousands)
| | Par Value(1) | | Value |
| | | | |
| Housing—continued | | |
First Lien (1 month Term SOFR + 3.750%)
8.323%, 11/3/28(7) | $ 139 | | $ 140 |
Cornerstone Building Brands, Inc. Tranche B (1 month Term SOFR + 3.250%)
7.959%, 4/12/28(7) | 169 | | 159 |
Hunter Douglas Holding B.V. Tranche B-1 (3 month Term SOFR + 3.500%)
8.021%, 2/26/29(7) | 173 | | 174 |
LBM Acquisition LLC Tranche B (1 month Term SOFR + 3.850%)
8.472%, 6/6/31(7) | 170 | | 167 |
| | | | 730 |
| | | | |
| |
| Information Technology—0.7% | | |
| Applied Systems, Inc. | | | |
2024, Second Lien (3 month Term SOFR + 5.250%)
9.854%, 2/23/32(7) | 20 | | 21 |
Tranche B-1 (3 month Term SOFR + 3.000%)
7.604%, 2/24/31(7) | 168 | | 170 |
BMC Software 2031, Tranche B, First Lien (3 month Term SOFR + 3.750%)
8.335%, 7/30/31(7) | 230 | | 231 |
Central Parent LLC 2024 (3 month Term SOFR + 3.250%)
7.854%, 7/6/29(7) | 213 | | 213 |
Cloud Software Group, Inc. Tranche B (1 month Term SOFR + 3.750%)
3.750%, 5/26/31(7) | 145 | | 146 |
ConnectWise LLC (3 month Term SOFR + 3.762%)
8.365%, 9/29/28(7) | 176 | | 177 |
Delivery Hero SE Tranche B (3 month Term SOFR + 5.000%)
9.522%, 12/12/29(7) | 134 | | 134 |
| | Par Value(1) | | Value |
| | | | |
| Information Technology—continued | | |
| Ellucian Holding, Inc. | | | |
Second Lien (1 month Term SOFR + 4.750%)
9.335%, 11/15/32(7) | $ 20 | | $ 20 |
Tranche B-1 (1 month Term SOFR + 3.000%)
7.595%, 10/9/29(7) | 141 | | 142 |
| Icon Parent I | | | |
(3 month Term SOFR + 3.000%)
7.516%, 11/13/31(7) | 65 | | 65 |
Second Lien (3 month Term SOFR + 5.000%)
9.516%, 9/10/32(7) | 45 | | 46 |
Infinite Bidco LLC First Lien (3 month Term SOFR + 4.012%)
8.597%, 3/2/28(7) | 148 | | 146 |
ION Trading Finance Ltd. 2024 (3 month Term SOFR + 4.000%)
9.016%, 4/1/28(7) | 125 | | 125 |
Mcafee Corp. Tranche B-1 (1 month Term SOFR + 3.250%)
7.906%, 3/1/29(7) | 225 | | 226 |
Mosel Bidco SE Tranche B (3 month Term SOFR + 4.500%)
9.104%, 9/16/30(7) | 113 | | 114 |
NCR Atleos Corp. Tranche B (3 month Term SOFR + 3.750%)
8.397%, 3/27/29(7) | 98 | | 98 |
Proofpoint, Inc. 2024 (1 month Term SOFR + 3.000%)
7.573%, 8/31/28(7) | 140 | | 141 |
RealPage, Inc. First Lien (1 month Term SOFR + 3.114%)
7.687%, 4/24/28(7) | 177 | | 176 |
See Notes to Financial Statements
Total Return Fund Inc.
SCHEDULE OF INVESTMENTS (Continued)
November 30, 2024
($ reported in thousands)
| | Par Value(1) | | Value |
| | | | |
| Information Technology—continued | | |
Rocket Software, Inc. (1 month Term SOFR + 4.250%)
8.823%, 11/28/28(7) | $ 239 | | $ 240 |
S2P Acquisition Borrower, Inc. (1 month Term SOFR + 3.250%)
3.250%, 10/8/31(7) | 130 | | 131 |
Thunder Generation Funding LLC Tranche B (3 month Term SOFR + 3.000%)
7.610%, 10/3/31(7) | 155 | | 156 |
UKG, Inc. Tranche B (3 month Term SOFR + 3.000%)
7.617%, 2/10/31(7) | 236 | | 237 |
| | | | 3,155 |
| | | | |
| |
| Manufacturing—0.2% | | |
Arcline FM Holdings LLC 2024 (6 month Term SOFR + 4.500%)
9.054%, 6/23/28(7) | 165 | | 166 |
CPM Holdings, Inc. (1 month Term SOFR + 4.500%)
9.172%, 9/28/28(7) | 198 | | 193 |
Cube Industrials Buyer, Inc. (3 month Term SOFR + 3.500%)
8.132%, 10/9/31(7) | 95 | | 96 |
Glatfelter Corp. Tranche B (3 month Term SOFR + 4.250%)
8.764%, 10/10/31(7) | 220 | | 220 |
LSF12 Crown U.S. Commercial Bidco LLC Tranche B (1 month Term SOFR + 4.250%)
8.803%, 10/10/31(7) | 250 | | 250 |
Star U.S. Bidco LLC (1 month Term SOFR + 3.750%)
8.323%, 3/17/27(7) | 128 | | 129 |
| | | | 1,054 |
| | | | |
| |
| | Par Value(1) | | Value |
| | | | |
| Media / Telecom - Broadcasting—0.1% | | |
Gray Television, Inc. Tranche D (1 month Term SOFR + 3.000%)
7.786%, 12/1/28(7) | $ 163 | | $ 151 |
Terrier Media Buyer, Inc. (2 month Term SOFR + 3.500%)
8.071%, 6/18/29(7) | 162 | | 142 |
Univision Communications, Inc. 2024, First Lien (1 month Term SOFR + 3.614%)
8.187%, 1/31/29(7) | 185 | | 185 |
| | | | 478 |
| | | | |
| |
Media / Telecom - Cable/Wireless
Video—0.2% | | |
Cogeco Communications Finance USA LP Tranche B-1 (1 month Term SOFR + 3.250%)
7.823%, 9/18/30(7) | 178 | | 177 |
CSC Holdings LLC 2022 (1 month Term SOFR + 4.500%)
9.109%, 1/18/28(7) | 333 | | 326 |
DIRECTV Financing LLC 2024, Tranche B (3 month Term SOFR + 5.512%)
10.097%, 8/2/29(7) | 213 | | 210 |
Eagle Broadband Investments LLC (3 month Term SOFR + 3.262%)
7.865%, 11/12/27(7) | 192 | | 193 |
Virgin Media Bristol LLC Tranche N (1 month Term SOFR + 2.614%)
7.012%, 1/31/28(7) | 225 | | 223 |
| | | | 1,129 |
| | | | |
| |
See Notes to Financial Statements
Total Return Fund Inc.
SCHEDULE OF INVESTMENTS (Continued)
November 30, 2024
($ reported in thousands)
| | Par Value(1) | | Value |
| | | | |
Media / Telecom - Diversified
Media—0.1% | | |
Century DE Buyer LLC (3 month Term SOFR + 4.000%)
8.589%, 10/30/30(7) | $ 124 | | $ 125 |
Creative Artists Agency LLC Tranche B (1 month Term SOFR + 2.750%)
7.323%, 10/1/31(7) | 45 | | 45 |
McGraw-Hill Education, Inc. 2024, Tranche B (3 month Term SOFR + 4.000%)
8.604%, 8/1/31(7) | 143 | | 145 |
MH Sub I LLC 2023 (1 month Term SOFR + 4.250%)
8.823%, 5/3/28(7) | 129 | | 129 |
Neptune Bidco U.S., Inc. Tranche B (3 month Term SOFR + 5.100%)
9.758%, 4/11/29(7) | 137 | | 124 |
| | | | 568 |
| | | | |
| |
Media / Telecom -
Telecommunications—0.1% | | |
| Numericable U.S. LLC | | | |
Tranche B-11 (6 month LIBOR + 2.750%)
7.432%, 7/31/25(7)(11) | 247 | | 227 |
Tranche B-12 (6 month LIBOR + 3.688%)
8.370%, 1/31/26(7)(11) | 50 | | 42 |
| | | | 269 |
| | | | |
| |
Media / Telecom - Wireless
Communications—0.0% | | |
Viasat, Inc. (1 month Term SOFR + 4.500%)
9.073%, 3/2/29(7) | 158 | | 138 |
| Metals / Minerals—0.1% | | |
Arsenal AIC Parent LLC 2024, Tranche B (1 month Term SOFR + 3.250%)
7.823%, 8/18/30(7) | 94 | | 95 |
| | Par Value(1) | | Value |
| | | | |
| Metals / Minerals—continued | | |
Covia Holdings Corp. (3 month Term SOFR + 4.262%)
8.851%, 7/31/26(7) | $ 275 | | $ 274 |
| | | | 369 |
| | | | |
| |
| Retail—0.1% | | |
CNT Holdings I Corp. First Lien (3 month Term SOFR + 3.500%)
8.085%, 11/8/27(7) | 202 | | 203 |
Harbor Freight Tools USA, Inc. (1-6 month Term SOFR + 2.500%)
7.073% - 7.241%, 6/11/31(7) | 155 | | 152 |
Petco Health & Wellness Co., Inc. First Lien (3 month Term SOFR + 3.512%)
8.115%, 3/3/28(7) | 165 | | 158 |
| | | | 513 |
| | | | |
| |
| Service—0.6% | | |
AAL Delaware Holdco, Inc. Tranche B (1 month Term SOFR + 3.500%)
8.073%, 7/30/31(7) | 35 | | 35 |
Allied Universal Holdco LLC (1 month Term SOFR + 3.850%)
8.423%, 5/12/28(7) | 150 | | 151 |
Ascend Learning LLC (1 month Term SOFR + 3.600%)
8.173%, 12/11/28(7) | 135 | | 136 |
BIFM U.S. Finance LLC (1 month Term SOFR + 4.250%)
8.823%, 5/31/28(7) | 85 | | 85 |
DG Investment Intermediate Holdings 2, Inc. First Lien (1 month Term SOFR + 3.864%)
8.437%, 3/31/28(7) | 225 | | 227 |
See Notes to Financial Statements
Total Return Fund Inc.
SCHEDULE OF INVESTMENTS (Continued)
November 30, 2024
($ reported in thousands)
| | Par Value(1) | | Value |
| | | | |
| Service—continued | | |
DXP Enterprises, Inc. 2024 (1 month Term SOFR + 3.750%)
8.323%, 10/11/30(7) | $ 129 | | $ 130 |
Ensemble RCM LLC Tranche B (3 month Term SOFR + 3.000%)
7.585%, 8/1/29(7) | 60 | | 61 |
Garda World Security Corp. (1 month Term SOFR + 3.500%)
8.109%, 2/1/29(7) | 184 | | 186 |
Grant Thornton Advisors LLC Tranche B (1 month Term SOFR + 3.250%)
7.823%, 6/2/31(7) | 70 | | 70 |
Husky Injection Molding Systems Ltd. (1 month Term SOFR + 5.000%)
9.573%, 2/15/29(7) | 145 | | 145 |
Kuehg Corp. (3 month Term SOFR + 3.250%)
7.839%, 6/12/30(7) | 123 | | 125 |
Lernen Bidco Ltd. Tranche B-2 (7 month Term SOFR + 4.000%)
8.591%, 10/27/31(7) | 110 | | 111 |
NAB Holdings LLC 2024 (3 month Term SOFR + 2.750%)
7.354%, 11/23/28(7) | 144 | | 144 |
Omnia Partners LLC (3 month Term SOFR + 3.250%)
7.867%, 7/25/30(7) | 75 | | 75 |
Spin Holdco, Inc. (3 month Term SOFR + 4.262%)
9.256%, 3/4/28(7) | 158 | | 134 |
The Hertz Corp. 2023 (1 month Term SOFR + 3.750%)
8.338%, 6/30/28(7) | 192 | | 170 |
| | Par Value(1) | | Value |
| | | | |
| Service—continued | | |
TMF Sapphire Bidco B.V. Tranche B-3 (3 month Term SOFR + 3.500%)
8.090%, 5/3/28(7) | $ 124 | | $ 125 |
Trugreen Ltd. Partnership First Lien (1 month Term SOFR + 4.100%)
8.673%, 11/2/27(7) | 262 | | 254 |
WIN Waste Innovations Holdings, Inc. (1 month Term SOFR + 2.864%)
7.437%, 3/24/28(7) | 178 | | 172 |
| | | | 2,536 |
| | | | |
| |
| Transportation - Automotive—0.1% | | |
First Brands Group LLC 2022 (3 month Term SOFR + 5.262%)
9.847%, 3/30/27(7) | 189 | | 182 |
PAI Holdco, Inc. Tranche B (3 month Term SOFR + 4.012%)
8.597%, 10/28/27(7) | 160 | | 144 |
| | | | 326 |
| | | | |
| |
| Utilities—0.1% | | |
Cornerstone Generation LLC Tranche B (1 month Term SOFR + 3.250%)
3.250%, 10/28/31(7) | 75 | | 76 |
Hunterstown Generation LLC (1 month Term SOFR + 3.500%)
8.032%, 10/29/31(7) | 40 | | 40 |
Waterbridge NDB Operating LLC (3 month Term SOFR + 4.500%)
9.022%, 5/10/29(7) | 150 | | 151 |
See Notes to Financial Statements
Total Return Fund Inc.
SCHEDULE OF INVESTMENTS (Continued)
November 30, 2024
($ reported in thousands)
| | Par Value(1) | | Value |
| | | | |
| Utilities—continued | | |
WEC U.S. Holdings Ltd. (1 month Term SOFR + 2.250%)
6.803%, 1/27/31(7) | $ 115 | | $ 115 |
| | | | 382 |
| | | | |
| |
Total Leveraged Loans
(Identified Cost $20,414) | | 20,178 |
| | Shares | |
| Preferred Stocks—0.2% |
| Financials—0.2% | |
| Capital Farm Credit ACA Series 1 144A, 5.000%(2)(3) | 310 (12) | 303 |
| JPMorgan Chase & Co. Series HH, 4.600%(2) | 151 (12) | 150 |
| Truist Financial Corp. Series Q, 5.100%(2) | 301 (12) | 290 |
| | | 743 |
| | | |
| |
Total Preferred Stocks
(Identified Cost $764) | 743 |
| | | |
| |
| Common Stocks—104.7% |
| Communication Services—2.4% | |
| Cellnex Telecom S.A. | 283,512 | 10,180 |
| Consumer Discretionary—0.0% | |
| MYT Holding LLC Class B(9)(13) | 22,362 | 4 |
| NMG Parent LLC(9)(13) | 368 | 41 |
| West Marine(9)(13) | 475 | 1 |
| | | 46 |
| | | |
| |
| Energy—18.4% | |
| Cheniere Energy, Inc.(2) | 58,265 | 13,052 |
| DT Midstream, Inc.(2) | 41,965 | 4,453 |
| Enbridge, Inc.(2) | 218,979 | 9,499 |
| Koninklijke Vopak N.V. | 99,841 | 4,674 |
| ONEOK, Inc.(2) | 84,350 | 9,582 |
| Pembina Pipeline Corp.(2) | 176,392 | 7,267 |
| Targa Resources Corp.(2) | 32,244 | 6,588 |
| TC Energy Corp.(2) | 258,752 | 12,661 |
| | Shares | | Value |
| | | | |
| Energy—continued | | |
| Williams Cos., Inc. (The)(2) | 202,048 | | $ 11,824 |
| | | | 79,600 |
| | | | |
| |
| Health Care—0.0% | | |
| Endo GUC Trust Class A(9)(13) | 7,168 | | — |
| Endo, Inc.(13) | 1,929 | | 44 |
| Lannett Co., Inc.(9)(13) | 3,742 | | — |
| | | | 44 |
| | | | |
| |
| Industrials—27.2% | | |
| Aena SME S.A.(2) | 129,827 | | 28,098 |
| Auckland International Airport Ltd.(2) | 2,027,923 | | 9,320 |
| Canadian Pacific Kansas City Ltd.(2) | 109,576 | | 8,383 |
| Ferrovial SE | 210,137 | | 8,665 |
| Flughafen Zurich AG Registered Shares(2) | 52,537 | | 12,488 |
| Grupo Aeroportuario del Centro Norte SAB de C.V. Class B | 289,600 | | 2,347 |
| Norfolk Southern Corp.(2) | 41,468 | | 11,439 |
| Transurban Group(2) | 1,281,825 | | 10,702 |
| Union Pacific Corp.(2) | 81,268 | | 19,883 |
| Vinci S.A.(2) | 56,575 | | 5,970 |
| | | | 117,295 |
| | | | |
| |
| Real Estate—6.1% | | |
| American Tower Corp.(2) | 104,504 | | 21,841 |
| Crown Castle, Inc.(2) | 42,717 | | 4,539 |
| | | | 26,380 |
| | | | |
| |
| Utilities—50.6% | | |
| Alliant Energy Corp.(2) | 110,568 | | 6,988 |
| Ameren Corp.(2) | 81,345 | | 7,678 |
| Atmos Energy Corp.(2) | 60,674 | | 9,181 |
| CenterPoint Energy, Inc.(2) | 212,058 | | 6,917 |
| DTE Energy Co.(2) | 36,046 | | 4,534 |
| Duke Energy Corp.(2) | 59,657 | | 6,983 |
| E.ON SE(2) | 459,216 | | 5,913 |
| EDP S.A.(2) | 1,670,420 | | 6,041 |
| Emera, Inc.(2) | 171,022 | | 6,525 |
| Entergy Corp.(2) | 51,944 | | 8,112 |
| Evergy, Inc.(2) | 90,145 | | 5,826 |
See Notes to Financial Statements
Total Return Fund Inc.
SCHEDULE OF INVESTMENTS (Continued)
November 30, 2024
($ reported in thousands)
| | Shares | | Value |
| | | | |
| Utilities—continued | | |
| Eversource Energy(2) | 78,769 | | $ 5,080 |
| Iberdrola S.A.(2) | 411,373 | | 5,864 |
| National Grid plc | 1,292,625 | | 16,326 |
| NextEra Energy, Inc.(2) | 288,020 | | 22,659 |
| NiSource, Inc.(2) | 273,674 | | 10,424 |
| OGE Energy Corp.(2) | 106,049 | | 4,662 |
| PG&E Corp.(2) | 566,446 | | 12,252 |
| PPL Corp.(2) | 195,989 | | 6,846 |
| Redeia Corp. S.A.(2) | 303,098 | | 5,413 |
| RWE AG(2) | 155,674 | | 5,243 |
| Sempra (2) | 194,399 | | 18,209 |
| Severn Trent plc | 137,641 | | 4,724 |
| Southern Co. (The)(2) | 106,416 | | 9,485 |
| United Utilities Group plc | 558,403 | | 7,954 |
| WEC Energy Group, Inc.(2) | 86,091 | | 8,700 |
| | | | 218,539 |
| | | | |
| |
Total Common Stocks
(Identified Cost $409,971) | | 452,084 |
| | | | |
| |
Total Long-Term Investments—137.8%
(Identified Cost $555,913) | | 595,289 |
| | | | |
| |
TOTAL INVESTMENTS—137.8%
(Identified Cost $555,913) | | $ 595,289 |
| Other assets and liabilities, net—(37.8)% | | (163,394) |
| NET ASSETS—100.0% | | $ 431,895 |
| Abbreviations: |
| ABS | Asset-Backed Securities |
| ACA | American Capital Access Financial Guarantee Corp. |
| BDC | Business Development Companies |
| DAC | Designated Activity Company |
| JSC | Joint Stock Company |
| LIBOR | London Interbank Offered Rate |
| LLC | Limited Liability Company |
| LLP | Limited Liability Partnership |
| LP | Limited Partnership |
| MSCI | Morgan Stanley Capital International |
| PIK | Payment-in-Kind Security |
| SOFR | Secured Overnight Financing Rate |
| Foreign Currencies: |
| BRL | Brazilian Real |
| CZK | Czech Koruna |
| MXN | Mexican Peso |
| MYR | Malaysian Ringgit |
| ZAR | South African Rand |
| Footnote Legend: |
| (1) | Par Value disclosed in foreign currency is reported in thousands. |
| (2) | All or a portion of securities is segregated as collateral for margin loan financing. The value of securities segregated as collateral is $319,438. |
| (3) | Security exempt from registration under Rule 144A of the Securities Act of 1933. These securities may be resold in transactions exempt from registration, normally to qualified institutional buyers. At November 30, 2024, these securities amounted to a value of $79,821 or 18.5% of net assets. |
| (4) | Security in default; no interest payments are being received. |
| (5) | Regulation S security. Security is offered and sold outside of the United States; therefore, it is exempt from registration with the SEC under Rules 903 and 904 of the Securities Act of 1933. |
| (6) | Represents step coupon bond. Rate shown reflects the rate in effect as of November 30, 2024. |
| (7) | Variable rate security. Rate disclosed is as of November 30, 2024. Information in parenthesis represents benchmark and reference rate for each security. Certain variable rate securities are not based on a published reference rate and spread but are determined by the issuer or agent and are based on current market conditions, or, for mortgage-backed securities, are impacted by the individual mortgages which are paying off over time. These securities do not indicate a reference rate and spread in their descriptions. |
| (8) | No contractual maturity date. |
For information regarding the abbreviations, see the Key Investment Terms starting on page 18.
See Notes to Financial Statements
Total Return Fund Inc.
SCHEDULE OF INVESTMENTS (Continued)
November 30, 2024
($ reported in thousands)
| (9) | The value of this security was determined using significant unobservable inputs and is reported as a Level 3 security in the Fair Value Hierarchy table located after the Schedule of Investments. |
| (10) | 100% of the income received was in PIK. |
| (11) | As of November 30, 2024, the Fund held investments that utilized synthetic LIBOR as a benchmark. The United Kingdom’s Financial Conduct Authority, which regulates LIBOR, has ceased publishing all LIBOR settings. However, certain USD LIBOR settings had continued to be published under a synthetic methodology until September 30, 2024, for certain legacy contracts. At the investment’s next reset date, an alternative rate will be used in accordance with governing documents. |
| (12) | Value shown as par value. |
| (13) | Non-income producing. |
| Country Weightings† |
| United States | 62% |
| Spain | 9 |
| Canada | 8 |
| United Kingdom | 5 |
| Netherlands | 3 |
| Switzerland | 2 |
| Germany | 2 |
| Other | 9 |
| Total | 100% |
| †% of total investments as of November 30, 2024. |
The following table summarizes the value of the Fund’s investments as of November 30, 2024, based on the inputs used to value them (See Security Valuation Note 2A in the Notes to Financial Statements):
| | Total
Value at
November 30, 2024 | | Level 1
Quoted Prices | | Level 2
Significant
Observable
Inputs | | Level 3
Significant
Unobservable
Inputs |
| Assets: | | | | | | | |
| Debt Instruments: | | | | | | | |
| U.S. Government Securities | $ 3,921 | | $ — | | $ 3,921 | | $— |
| Foreign Government Securities | 16,727 | | — | | 16,727 | | — |
| Mortgage-Backed Securities | 29,809 | | — | | 29,809 | | — |
| Asset-Backed Securities | 17,753 | | — | | 17,753 | | — |
| Corporate Bonds and Notes | 54,074 | | — | | 54,074 | | — (1) |
| Leveraged Loans | 20,178 | | — | | 20,136 | | 42 |
| Equity Securities: | | | | | | | |
| Preferred Stocks | 743 | | — | | 743 | | — |
| Common Stocks | 452,084 | | 452,038 | | — | | 46 (1) |
| Total Investments | $595,289 | | $452,038 | | $143,163 | | $88 |
| (1) | Includes internally fair valued securities currently priced at zero ($0). |
Security held by the Fund with an end of period value of $1 was transferred from Level 2 to Level 3 due to a decrease in trading activities during the period.
Some of the Fund’s investments that were categorized as Level 3 may have been valued utilizing third party pricing information without adjustment. If applicable, such valuations are based on unobservable inputs. A significant change in third party information could result in a significantly lower or higher value of Level 3 investments.
See Notes to Financial Statements
Total Return Fund Inc.
SCHEDULE OF INVESTMENTS (Continued)
November 30, 2024
($ reported in thousands)
Management has determined that the amount of Level 3 securities compared to total net assets is not material; therefore, the roll-forward of Level 3 securities and assumptions are not shown for the period ended November 30, 2024.
See Notes to Financial Statements
STATEMENTS OF ASSETS AND LIABILITIES
November 30, 2024
(Reported in thousands except shares and per share amounts)
| | Global Multi-Sector Income Fund | | Stone Harbor Emerging Markets Income Fund | | Total Return Fund Inc. |
| Assets | | | | | |
Investment in securities at value(1)
| $ 137,878 | | $ 185,094 | | $ 595,289 |
Cash
| 1,512 | | — | | 5,636 |
Cash collateral pledged for swaps
| — | | 620 | | — |
Cash pledged as collateral for reverse repurchase agreements
| — | | 261 | | — |
Unrealized appreciation on forward foreign currency exchange contracts
| — | | 322 | | — |
| Receivables | | | | | |
Investment securities sold
| 538 | | 3,707 | | 565 |
Fund shares issued
| — | | 37 | | — |
Dividends and interest
| 1,689 | | 3,984 | | 2,697 |
Unrealized appreciation on unfunded loan commitment(3)
| — (a) | | — | | — |
Tax reclaims
| — | | 4 | | 368 |
Prepaid Trustees’ retainer
| 1 | | 1 | | 3 |
Prepaid expenses and other assets (Note 4)
| 54 | | 140 | | 231 |
Total assets
| 141,672 | | 194,170 | | 604,789 |
| Liabilities | | | | | |
Due to custodian
| — | | 217 | | — (a) |
Borrowings (Note 8)
| 43,000 | | 49,554 | | 168,300 |
Over-the-counter swaps at value(2)
| — | | 396 | | — |
| Payables | | | | | |
Investment securities purchased
| 1,958 | | 4,397 | | 3,009 |
Interest on borrowings (Note 8)
| 228 | | 131 | | 794 |
Investment advisory fees (Note 4)
| 108 | | 148 | | 337 |
Trustee/Director deferred compensation plan (Note 4)
| 52 | | 12 | | 228 |
Professional fees
| 40 | | 64 | | 45 |
Administration and accounting fees
| 13 | | 16 | | 52 |
Unrealized depreciation on forward foreign currency exchange contracts
| — | | 118 | | — |
Other accrued expenses
| 28 | | 50 | | 129 |
Total liabilities
| 45,427 | | 55,103 | | 172,894 |
Net Assets
| $ 96,245 | | $ 139,067 | | $ 431,895 |
See Notes to Financial Statements
STATEMENTS OF ASSETS AND LIABILITIES (Continued)
November 30, 2024
(Reported in thousands except shares and per share amounts)
| | Global Multi-Sector Income Fund | | Stone Harbor Emerging Markets Income Fund | | Total Return Fund Inc. |
| Net Assets Consist of: | | | | | |
Common stock (no par value, unlimited authorization)(Note 10)
| $ — | | $ 29 | | $ 62 |
Capital paid on shares of beneficial interest
| 137,288 | | 375,458 | | 394,136 |
Total distributable earnings (accumulated losses)
| (41,043) | | (236,420) | | 37,697 |
Net Assets
| $ 96,245 | | $ 139,067 | | $ 431,895 |
Common Shares Outstanding
| 11,313,094 | | 29,291,260 | | 61,720,496 |
Net Asset Value Per Share(4)
| $ 8.51 | | $ 4.75 | | $ 7.00 |
(1)Investment in securities at cost
| $ 141,849 | | $ 184,383 | | $ 555,913 |
(2) Includes premiums paid (received) on over-the-counter credit default swaps
| — | | (744) | | — |
| (3) | See Schedule of Investments for schedule of unfunded loan commitments. |
| (4) | Net Asset Value Per Share is calculated using unrounded net assets. |
| (a) | Amount is less than $500 (not in thousands). |
See Notes to Financial Statements
STATEMENTS OF OPERATIONS
YEAR ENDED November 30, 2024
($ reported in thousands)
| | Global Multi-Sector Income Fund | | Stone Harbor Emerging Markets Income Fund |
| Investment Income | | | |
Interest
| $ 9,225 | | $ 17,102 |
Dividends
| 119 | | 247 |
Foreign taxes withheld
| — | | (57) |
Total investment income
| 9,344 | | 17,292 |
| Expenses | | | |
Investment advisory fees
| 1,329 | | 1,689 |
Administration and accounting fees
| 155 | | 186 |
Professional fees
| 103 | | 94 |
Printing fees and expenses
| 31 | | 50 |
Transfer agent fees and expenses
| 12 | | 14 |
Trustees’/Directors’ fees and expenses
| 9 | | 12 |
Custodian fees
| 6 | | 10 |
Miscellaneous expenses
| 44 | | 50 |
Total expenses before interest expense
| 1,689 | | 2,105 |
Interest expense on borrowings (Note 8)
| 2,656 | | 2,223 |
Total expenses after interest expense
| 4,345 | | 4,328 |
Net investment income (loss)
| 4,999 | | 12,964 |
| Net Realized and Unrealized Gain (Loss) on Investments | | | |
| Net realized gain (loss) from: | | | |
Investments
| (2,471) | | 800 |
Foreign currency transactions
| (51) | | 62 |
Forward foreign currency exchange contracts
| — | | 76 |
Swaps
| — | | 1,273 |
| Net change in unrealized appreciation (depreciation) on: | | | |
Investments
| 9,051 | | 12,284 |
Foreign currency transactions
| (—) (a) | | (69) |
Forward foreign currency exchange contracts
| — | | 204 |
Swaps
| — | | 5,052 |
Net realized and unrealized gain (loss) on investments
| 6,529 | | 19,682 |
Net increase (decrease) in net assets resulting from operations
| $11,528 | | $32,646 |
| (a) | Amount is less than $500 (not in thousands). |
See Notes to Financial Statements
STATEMENTS OF OPERATIONS (Continued)
YEAR ENDED November 30, 2024
($ reported in thousands)
| | Total Return Fund Inc. |
| Investment Income | |
Dividends
| $ 15,991 |
Interest
| 9,887 |
Foreign taxes withheld
| (845) |
Total investment income
| 25,033 |
| Expenses | |
Investment advisory fees
| 4,142 |
Administration and accounting fees
| 636 |
Printing fees and expenses
| 367 |
Transfer agent fees and expenses
| 310 |
Professional fees
| 232 |
Trustees’/Directors’ fees and expenses
| 39 |
Custodian fees
| 10 |
Miscellaneous expenses
| 117 |
Total expenses before interest expense
| 5,853 |
Interest expense on borrowings (Note 8)
| 10,831 |
Total expenses after interest expense
| 16,684 |
Net investment income (loss)
| 8,349 |
| Net Realized and Unrealized Gain (Loss) on Investments | |
| Net realized gain (loss) from: | |
Investments
| 16,046 |
Foreign currency transactions
| (32) |
| Net change in unrealized appreciation (depreciation) on: | |
Investments
| 58,237 |
Foreign currency transactions
| (3) |
Net realized and unrealized gain (loss) on investments
| 74,248 |
Net increase (decrease) in net assets resulting from operations
| $82,597 |
See Notes to Financial Statements
STATEMENTS OF CHANGES IN NET ASSETS
($ reported in thousands)
| | Global Multi-Sector Income Fund |
| | Year Ended
November 30, 2024 | | Year Ended
November 30, 2023 |
Increase (Decrease) In Net Assets
From Operations | | | |
Net investment income (loss)
| $ 4,999 | | $ 4,513 |
Net realized gain (loss)
| (2,522) | | (7,168) |
Net change in unrealized appreciation (depreciation)
| 9,051 | | 7,930 |
Increase (decrease) in net assets resulting from operations
| 11,528 | | 5,275 |
| From Dividends and Distributions to Shareholders | | | |
Net investment income and net realized gains
| (5,055) | | (4,629) |
Return of capital
| (5,806) | | (6,232) |
Dividends and Distributions to Shareholders
| (10,861) | | (10,861) |
Net increase (decrease) in net assets
| 667 | | (5,586) |
| Net Assets | | | |
Beginning of period
| 95,578 | | 101,164 |
End of period
| $ 96,245 | | $ 95,578 |
See Notes to Financial Statements
STATEMENTS OF CHANGES IN NET ASSETS (Continued)
($ reported in thousands)
| | Stone Harbor Emerging Markets Income Fund |
| | Year Ended
November 30, 2024 | | Year Ended
November 30, 2023 |
Increase (Decrease) In Net Assets
From Operations | | | |
Net investment income (loss)
| $ 12,964 | | $ 8,151 |
Net realized gain (loss)
| 2,211 | | (14,912) |
Net change in unrealized appreciation (depreciation)
| 17,471 | | 20,687 |
Increase (decrease) in net assets resulting from operations
| 32,646 | | 13,926 |
| From Dividends and Distributions to Shareholders | | | |
Net investment income and net realized gains
| (20,130) | | (11,445) |
Return of capital
| (99) | | (951) |
Dividends and Distributions to Shareholders
| (20,229) | | (12,396) |
| From Capital Share Transactions | | | |
Net proceeds from shares issued through at-the-market offering (101,763 and 0 shares, respectively) (Note 11)
| 508 | | — |
Reinvestment of distributions resulting in the issuance of common stock (239,537 and 249,112 shares, respectively)
| 1,182 | | 1,083 |
Plan of reorganization (Note 13)
| 51,054 | | — |
Increase (decrease) in net assets from capital transactions
| 52,744 | | 1,083 |
Net increase (decrease) in net assets
| 65,161 | | 2,613 |
| Net Assets | | | |
Beginning of period
| 73,906 | | 71,293 |
End of period
| $ 139,067 | | $ 73,906 |
Supplemental – Other Information
Capital share transactions were as follows: | | | |
Common shares outstanding at beginning of period
| 17,351,391 | | 17,102,279 |
Shares issued through at-the-market offering
| 101,763 | | — |
Reinvestment of distributions resulting in the issuance of common stock
| 239,537 | | 249,112 |
Plan of reorganization (Note 13)
| 11,598,569 | | — |
Common shares outstanding at end of period
| 29,291,260 | | 17,351,391 |
See Notes to Financial Statements
STATEMENTS OF CHANGES IN NET ASSETS (Continued)
($ reported in thousands)
| | Total Return Fund Inc. |
| | Year Ended
November 30, 2024 | | Year Ended
November 30, 2023 |
Increase (Decrease) In Net Assets
From Operations | | | |
Net investment income (loss)
| $ 8,349 | | $ 9,208 |
Net realized gain (loss)
| 16,014 | | (15,269) |
Net change in unrealized appreciation (depreciation)
| 58,234 | | (20,929) |
Increase (decrease) in net assets resulting from operations
| 82,597 | | (26,990) |
| From Dividends and Distributions to Shareholders | | | |
Net investment income and net realized gains
| (8,721) | | (9,660) |
Return of capital
| (30,026) | | (50,003) |
Dividends and Distributions to Shareholders
| (38,747) | | (59,663) |
| From Capital Share Transactions | | | |
Net proceeds from the sale of shares during rights offering (net of expenses of $600)
| — | | 150 (1) |
Payment for tendered shares (Note 10)
| (41,131) | | — |
Increase (decrease) in net assets from capital transactions
| (41,131) | | 150 |
Net increase (decrease) in net assets
| 2,719 | | (86,503) |
| Net Assets | | | |
Beginning of period
| 429,176 | | 515,679 |
End of period
| $431,895 | | $429,176 |
| (1) | Adjustment to bring estimated costs in connection with rights offering to actual. |
See Notes to Financial Statements
STATEMENTS OF CASH FLOWS
YEAR ENDED November 30, 2024
($ reported in thousands)
| | Global Multi-Sector Income Fund | | Virtus Stone Harbor Emerging Markets Income Fund |
| Increase (Decrease) in cash | | | |
| Cash flows provided by (used for) operating activities: | | | |
Net increase (decrease) in net assets resulting from operations
| $ 11,528 | | $ 32,646 |
| Adjustments to reconcile net increase (decrease) in net assets resulting from operations to net cash provided by (used for) operating activities: | | | |
Proceeds from sales and paydowns of long-term investments
| 116,225 | | 107,947 |
(Increase) Decrease in investment securities sold receivable
| 697 | | (3,174) |
Purchases of long-term investments
| (110,912) | | (138,630) |
Increase (Decrease) in investment securities purchased payable
| 320 | | 4,016 |
Net (purchases) or sales of short-term investments
| (372) | | 200 |
Net (purchases) or sales in purchased options
| — | | (24) |
Net change in unrealized (appreciation)/depreciation on investments
| (9,051) | | (12,284) |
Net change in unrealized (appreciation)/depreciation of foreign currency exchange contracts
| — | | (204) |
Net realized (gain)/loss on investments
| 2,471 | | (800) |
Net realized (gains)/loss on sales of investments from changes in the foreign exchange rates
| 45 | | (21) |
Amortization of premiums and inflation income and accretion of discounts on investments
| (600) | | (5,030) |
(Increase) Decrease in tax reclaims receivable
| — | | 2 |
(Increase) Decrease in dividends and interest receivable
| (52) | | (1,179) |
(Increase) Decrease in prepaid expenses and other assets
| — | | (114) |
(Increase) Decrease in prepaid Trustees’ retainer
| — | | (1) |
Increase (Decrease) in interest payable on borrowings
| (263) | | 64 |
Increase (Decrease) in over-the-counter swaps at value
| — | | (5,758) |
Increase (Decrease) in affiliated expenses payable
| 1 | | 60 |
Increase (Decrease) in non-affiliated expenses payable
| — | | (242) |
Cash provided by (used for) operating activities
| 10,037 | | (22,526) |
| Cash provided (used for) financing activities: | | | |
Cash receipts from borrowings
| — | | 218,219 |
Cash payments to reduce borrowings
| — | | (184,560) |
Cash distributions paid to shareholders
| (10,861) | | (19,047) |
Decrease in cash overdraft from plan of reorganization (Note 12)
| — | | (10) |
Net proceeds from issuance of common stock through at-the-market offering
| — | | 471 |
Due to custodian
| — | | (217) |
Cash provided (used for) financing activities:
| (10,861) | | 14,856 |
Net increase/decrease in cash
| (824) | | (7,670) |
Restricted and unrestricted cash at beginning of period
| 2,336 | | 8,551 |
Restricted and unrestricted cash at end of period
| $ 1,512 | | $ 881 |
See Notes to Financial Statements
STATEMENTS OF CASH FLOWS (Continued)
YEAR ENDED November 30, 2024
($ reported in thousands)
| | Global Multi-Sector Income Fund | | Virtus Stone Harbor Emerging Markets Income Fund |
| | | | |
| Supplemental cash flow information: | | | |
Reinvestment of dividends and distributions
| $ — | | $ 1,182 |
Cash paid during the period for interest expense on borrowings
| $ 2,919 | | $ 2,159 |
| | | | |
| Reconciliation of restricted and unrestricted cash at the end of period to the statement of assets and liabilities: | | | |
Cash
| $ 1,512 | | $ — |
Cash pledged as collateral for swaps
| $ — | | $ 620 |
Cash pledged as collateral for reverse repurchase agreements
| $ — | | $ 261 |
| | $ 1,512 | | $ 881 |
Non cash transactions from plan of reorganization:
| | | |
Investment in securities, identified cost
| $ — | | $ 54,382 |
Other assets
| $ — | | $ 1,042 |
Borrowings
| $ — | | $ 1,723 |
Other liabilities
| $ — | | $ 203 |
Capital
| $ — | | $ 53,488 |
See Notes to Financial Statements
STATEMENTS OF CASH FLOWS (Continued)
YEAR ENDED November 30, 2024
($ reported in thousands)
| | Total Return Fund Inc. |
| Increase (Decrease) in cash | |
| Cash flows provided by (used for) operating activities: | |
Net increase (decrease) in net assets resulting from operations
| $ 82,597 |
| Adjustments to reconcile net increase (decrease) in net assets resulting from operations to net cash provided by (used for) operating activities: | |
Proceeds from sales and paydowns of long-term investments
| 441,803 |
(Increase) Decrease in investment securities sold receivable
| 745 |
Purchases of long-term investments
| (350,091) |
Increase (Decrease) in investment securities purchased payable
| 1,513 |
Net (purchases) or sales of short-term investments
| (131) |
Net change in unrealized (appreciation)/depreciation on investments
| (58,237) |
Net realized (gain)/loss on sales of investments from changes in the foreign exchange rates
| (24) |
Net realized (gain)/loss on investments
| (16,046) |
Return of capital distributions on investments
| 535 |
Amortization of premiums and inflation income and accretion of discounts on investments
| (516) |
(Increase) Decrease in tax reclaims receivable
| 50 |
(Increase) Decrease in dividends and interest receivable
| 111 |
(Increase) Decrease in prepaid expenses and other assets
| 5 |
Increase (Decrease) in interest payable on borrowings
| (190) |
Increase (Decrease) in affiliated expenses payable
| (3) |
Increase (Decrease) in non-affiliated expenses payable
| (2) |
Cash provided by (used for) operating activities
| 102,119 |
| Cash provided (used for) financing activities: | |
Cash payments to reduce borrowings
| (18,700) |
Cash distributions paid to shareholders
| (38,747) |
Payments for tendered shares
| (41,131) |
Due to custodian
| — (a) |
Cash provided by (used for) financing activities
| (98,578) |
Net increase (decrease) in cash
| 3,541 |
Restricted and unrestricted cash at beginning of period
| 2,095 |
Restricted and unrestricted cash at end of period
| $ 5,636 |
| Supplemental cash flow information: | |
Cash paid during the period for interest expense on borrowings
| $ 11,021 |
| | |
| Reconciliation of restricted and unrestricted cash at the end of period to the statement of assets and liabilities: | |
Cash
| $ 5,636 |
| | $ 5,636 |
| | |
| (a) Amount is less than $500 (not in thousands). | |
See Notes to Financial Statements
GLOBAL MULTI-SECTOR INCOME FUND
FINANCIAL HIGHLIGHTS
SELECTED PER SHARE DATA AND RATIOS FOR A SHARE OUTSTANDING
THROUGHOUT EACH PERIOD
| | Year Ended November 30, |
| | 2024 | | 2023 | | 2022 | | 2021 | | 2020 |
| PER SHARE DATA: | | | | | | | | | |
Net asset value, beginning of period
| $ 8.45 | | $ 8.94 | | $ 11.67 | | $ 12.55 | | $ 13.16 |
| Income (loss) from investment operations: | | | | | | | | | |
Net investment income (loss)(1)
| 0.44 | | 0.40 | | 0.46 | | 0.52 | | 0.55 |
Net realized and unrealized gain (loss)
| 0.58 | | 0.07 | | (2.23) | | (0.32) | | 0.20 |
Total from investment operations
| 1.02 | | 0.47 | | (1.77) | | 0.20 | | 0.75 |
| Dividends and Distributions to Shareholders: | | | | | | | | | |
Net investment income
| (0.45) | | (0.41) | | (0.46) | | (0.52) | | (0.51) |
Return of capital
| (0.51) | | (0.55) | | (0.50) | | (0.56) | | (0.85) |
Total dividends and distributions to shareholders
| (0.96) | | (0.96) | | (0.96) | | (1.08) | | (1.36) |
Net asset value, end of period
| $ 8.51 | | $ 8.45 | | $ 8.94 | | $ 11.67 | | $ 12.55 |
Market value, end of period(2)
| $ 8.06 | | $ 7.35 | | $ 8.12 | | $ 11.56 | | $ 11.69 |
Total return, net asset value(3)
| 13.92% | | 7.19% | | (14.70)% | | 1.76% | | 7.70% |
Total return, market value(3)
| 24.05% | | 2.66% | | (21.78)% | | 8.22% | | 5.28% |
| RATIOS/SUPPLEMENTAL DATA: | | | | | | | | | |
Ratio of total expenses after interest expense to average net assets(4)
| 4.48% | | 4.46% | | 2.76% | | 2.14% | | 2.40% |
Ratio of net investment income (loss) to average net assets
| 5.16% | | 4.59% | | 4.62% | | 4.28% | | 4.51% |
Portfolio turnover rate
| 80% | | 57% | | 44% | | 54% | | 75% |
Net assets, end of period (000’s)
| $96,245 | | $95,578 | | $101,164 | | $132,058 | | $141,880 |
Borrowings, end of period (000’s)
| $43,000 | | $43,000 | | $ 45,400 | | $ 52,500 | | $ 52,500 |
Asset coverage, per $1,000 principal amount of borrowings(5)
| $ 3,238 | | $ 3,223 | | $ 3,228 | | $ 3,515 | | $ 3,702 |
| (1) | Calculated using average shares outstanding. |
| (2) | Closing Price – New York Stock Exchange. |
| (3) | Total return on market value is calculated assuming a purchase of common shares on the opening of the first day and sale on the closing of the last day of each period reported. Dividends and distributions are assumed, for purposes of this calculation, to be reinvested at prices obtained under the Fund’s Automatic Reinvestment and Cash Purchase Plan. Total return on market value is not annualized for periods of less than one year. Brokerage commissions that a shareholder may pay are not reflected. Total return on market value does not reflect the deduction of taxes that a shareholder may pay on fund distributions or the sale of fund shares. Total return on net asset value uses the same methodology, but with use of net asset value for the beginning, ending and reinvestment values. |
| (4) | Ratio of total expenses, before interest expense on borrowings, was 1.74%, 1.71%, 1.74%, 1.74% and 1.74% for the years ended November 30, 2024, 2023, 2022, 2021 and 2020, respectively. |
| (5) | Represents value of net assets plus the borrowings at the end of the period divided by the borrowings at the end of the period multiplied by $1,000. |
See Notes to Financial Statements
STONE HARBOR EMERGING MARKETS INCOME FUND
FINANCIAL HIGHLIGHTS
SELECTED PER SHARE DATA AND RATIOS FOR A SHARE OUTSTANDING
THROUGHOUT EACH PERIOD
| | Year Ended November 30, |
| | 2024 | | 2023 | | 2022 | | 2021 | | 2020 |
| PER SHARE DATA: | | | | | | | | | |
Net asset value, beginning of period
| $ 4.26 | | $ 4.17 | | $ 6.24 | | $ 7.04 | | $ 8.91 |
| Income (loss) from investment operations: | | | | | | | | | |
Net investment income (loss)(1)
| 0.45 | | 0.47 | | 0.52 | | 0.60 | | 0.64 |
Net realized and unrealized gain (loss)
| 0.76 | | 0.34 | | (1.87) | | (0.52) | | (1.08) |
Total from investment operations
| 1.21 | | 0.81 | | (1.35) | | 0.08 | | (0.44) |
| Dividends and Distributions to Shareholders: | | | | | | | | | |
Net investment income
| (0.72) | | (0.66) | | (0.09) | | (0.57) | | (0.28) |
Return of capital
| — (2) | | (0.06) | | (0.63) | | (0.31) | | (1.15) |
Total dividends and distributions to shareholders
| (0.72) | | (0.72) | | (0.72) | | (0.88) | | (1.43) |
Accretion on net asset value as a result of at-the-market share issuance (Note 11)
| — (2) | | — | | — | | — | | — |
Net asset value, end of period
| $ 4.75 | | $ 4.26 | | $ 4.17 | | $ 6.24 | | $ 7.04 |
Market value, end of period
| $ 5.02 | | $ 4.38 | | $ 4.24 | | $ 6.65 | | $ 7.40 |
Total return, net asset value(3)
| 30.38% | | 21.20% | | (22.31)% | | 0.36% | | (3.32)% |
Total return, market value(3)
| 32.71% | | 22.14% | | (25.98)% | | 0.66% | | (32.92)% |
| RATIOS/SUPPLEMENTAL DATA: | | | | | | | | | |
Ratio of total expenses after
interest expense to average
net assets(4)
| 3.28% (5) | | 3.70% (6) | | 2.95% | | 2.37% | | 2.56% |
Ratio of net investment income
(loss) to average net assets
| 9.84% | | 11.21% (6) | | 10.55% | | 8.57% | | 9.04% |
Portfolio turnover rate
| 69% | | 76% | | 37% | | 47% | | 127% |
Net assets, end of period (000’s)
| $139,067 | | $73,906 | | $71,293 | | $105,134 | | $117,235 |
Borrowings, end of period (000’s)
| $ 49,554 | | $14,172 | | $28,600 | | $ 45,481 | | $ 46,000 |
Asset coverage, per $1,000 of borrowings(7)
| $ 3,806 | | $ 6,215 | | $ 3,493 | | $ 3,312 | | $ 3,545 |
| | |
| (1) | Calculated using average shares outstanding. |
| (2) | Amount is less than $0.005 per share. |
| (3) | Total return on market value is calculated assuming a purchase of common shares on the opening of the first day and sale on the closing of the last day of each period reported. Dividends and distributions are assumed, for purposes of this calculation, to be reinvested at prices obtained under the Fund’s Automatic Reinvestment and Cash Purchase Plan. Total return on market value is not annualized for periods of less than one year. Brokerage commissions that a shareholder may pay are not reflected. Total return on market value does not reflect the deduction of taxes that a shareholder may pay on fund distributions or the sale of fund shares. Total return on net asset value uses the same methodology, but with use of net asset value for the beginning, ending and reinvestment values. |
| (4) | Ratio of total expenses before interest expense to average net assets was 1.60%, 2.11%, 2.03%, 1.96% and 1.99% for the years ended November 30, 2024, 2023, 2022, 2021 and 2020, respectively. |
| (5) | The Fund is currently under its expense limitation. |
| (6) | The Fund incurred some non-recurring reorganization expenses in 2023. When excluding these costs, the ratio of total expenses after interest expense to average net assets would be 3.33% and the ratio of net investment income to average net assets would be 11.58%. |
| (7) | Represents value of net assets plus the borrowings at the end of the period divided by the borrowings at the end of the period multiplied by $1,000. |
See Notes to Financial Statements
TOTAL RETURN FUND INC.
FINANCIAL HIGHLIGHTS
SELECTED PER SHARE DATA AND RATIOS FOR A SHARE OUTSTANDING
THROUGHOUT EACH PERIOD
| | Year Ended November 30, |
| | 2024 | | 2023 | | 2022 | | 2021 | | 2020 |
| PER SHARE DATA: | | | | | | | | | |
Net asset value, beginning of period
| $ 6.26 | | $ 7.52 | | $ 8.92 | | $ 9.31 | | $ 10.33 |
| Income (loss) from investment operations: | | | | | | | | | |
Net investment income (loss)(1)
| 0.13 | | 0.13 | | 0.19 | | 0.22 | | 0.25 |
Net realized and unrealized gain (loss)
| 1.19 | | (0.52) | | (0.37) | | 0.35 | | (0.11) |
Total from investment operations
| 1.32 | | (0.39) | | (0.18) | | 0.57 | | 0.14 |
| Dividends and Distributions to Shareholders: | | | | | | | | | |
Net investment income
| (0.14) | | (0.14) | | (0.47) | | (0.24) | | (0.27) |
Return of capital
| (0.46) | | (0.73) | | (0.49) | | (0.72) | | (0.89) |
Total dividends and distributions to shareholders
| (0.60) | | (0.87) | | (0.96) | | (0.96) | | (1.16) |
| Fund Share Transactions (Note 10) | | | | | | | | | |
Dilutive effect on net asset value as a result of rights offering(2)
| — | | — (3) | | (0.26) | | — | | — |
Anti-dilutive impact of tender offer (Note 10)
| 0.02 | | — | | — | | — | | — |
Net asset value, end of period
| $ 7.00 | | $ 6.26 | | $ 7.52 | | $ 8.92 | | $ 9.31 |
Market value, end of period(4)
| $ 6.23 | | $ 5.38 | | $ 6.95 | | $ 9.37 | | $ 8.41 |
Total return, net asset value(5)
| 24.24% | | (3.96)% | | (1.45)% | | 6.36% | | 3.25% |
Total return, market value(5)
| 28.66% | | (10.69)% | | (16.43)% (6) | | 23.68% | | (12.25)% |
| RATIOS/SUPPLEMENTAL DATA: | | | | | | | | | |
Ratio of total expenses after interest expense to average net assets(7)
| 4.02% (8) | | 3.87% | | 2.26% | | 1.73% | | 2.05% |
Ratio of net investment income (loss) to average net assets
| 2.01% (8) | | 1.99% | | 2.30% | | 2.34% | | 2.73% |
Portfolio turnover rate
| 59% | | 36% | | 47% | | 44% | | 46% |
Net assets, end of period (000’s)
| $431,895 | | $429,176 | | $515,679 | | $426,461 | | $441,552 |
Borrowings, end of period (000’s)
| $168,300 | | $187,000 | | $207,000 | | $159,750 | | $159,750 |
Asset coverage, per $1,000 principal amount of borrowings(9)
| $ 3,566 | | $ 3,295 | | $ 3,491 | | $ 3,670 | | $ 3,764 |
| (1) | Calculated using average shares outstanding. |
| (2) | Shares were sold at a 5% discount from a 5-day average market price from 9/12/22 to 9/16/22. |
| (3) | Amount is less than $0.005 per share. |
| (4) | Closing Price – New York Stock Exchange. |
| (5) | Total return on market value is calculated assuming a purchase of common shares on the opening of the first day and sale on the closing of the last day for each period reported. Dividends and distributions are assumed, for the purpose of this calculation, to be reinvested at prices under the Fund’s Automatic Reinvestment and Cash Purchase Plan. Total return on market value is not annualized for periods of less than one year. Brokerage commissions that a shareholder may pay are not reflected. Total return on market value does not reflect the deduction of taxes that a shareholder may pay on fund distributions or the sale of fund shares. Total return on net asset value uses the same methodology, but with the use of net asset value for beginning and ending values. |
| (6) | Total return on market value includes the dilutive effect of the 2022 rights offering. Without this effect, the total market return would have been (16.12%). |
| (7) | Ratio of total expenses, before interest expense on borrowings, was 1.41%, 1.31%, 1.32%, 1.34% and 1.38% for the years ended November 30, 2024, 2023, 2022, 2021 and 2020, respectively. |
| (8) | The Fund incurred certain non-recurring tender offer costs in 2024. When excluding these costs, the ratio of total expenses to average net assets would be 3.92% and the ratio of net investment income (loss) to average net assets would be 2.11%. |
See Notes to Financial Statements
TOTAL RETURN FUND INC.
FINANCIAL HIGHLIGHTS (Continued)
SELECTED PER SHARE DATA AND RATIOS FOR A SHARE OUTSTANDING
THROUGHOUT EACH PERIOD
| (9) | Represents value of net assets plus the borrowings at the end of the period divided by the borrowings at the end of the period multiplied by $1,000. |
See Notes to Financial Statements
NOTES TO FINANCIAL STATEMENTS
November 30, 2024
Note 1. Organization
Global Multi-Sector Income Fund, Stone Harbor Emerging Markets Income Fund, and Total Return Fund Inc. (each, a “Fund” and, collectively, the “Funds”) are closed-end, management investment companies registered under the Investment Company Act of 1940, as amended (the “1940 Act”). Global Multi-Sector Income Fund is diversified and was formed as a statutory trust under the laws of the State of Delaware on August 23, 2011. Stone Harbor Emerging Markets Income Fund is non-diversified and was organized as a Massachusetts business trust under the laws of the Commonwealth of Massachusetts on December 22, 2010. Total Return Fund Inc. is diversified and was incorporated under the laws of the State of Maryland on July 21, 1988. Each Fund’s investment objective is outlined in the respective Manager’s Discussion of Fund Performance pages. There is no guarantee that the Funds will achieve their investment objective.
Note 2. Significant Accounting Policies
Each Fund is an investment company that follows the accounting and reporting guidance of the Financial Accounting Standards Board (“FASB”) Accounting Standards Codification Topic 946 Financial Services – Investment Companies.
The following is a summary of significant accounting policies consistently followed by the Funds in the preparation of their financial statements and for derivatives, included in Note 3 below. The preparation of financial statements in conformity with U.S. generally accepted accounting principles (“U.S. GAAP”) requires management to make estimates and assumptions that affect the reported amounts of assets and liabilities, disclosure of contingent assets and liabilities at the date of the financial statements, and the reported amounts of increases and decreases in net assets from operations during the reporting period. Actual results could differ from those estimates and those differences could be significant.
| A. | Security Valuation |
| | The Funds’ Boards of Trustees/Directors have designated the investment adviser as the valuation designee to perform fair valuations pursuant to Rule 2a-5 under the 1940 Act. Each Fund utilizes a fair value hierarchy that prioritizes the inputs to valuation techniques used to measure fair value into three broad levels. The Funds’ policy is to recognize transfers into or out of Level 3 at the end of the reporting period. |
| | • Level 1 – quoted prices in active markets for identical securities (security types generally include listed equities). • Level 2 – prices determined using other significant observable inputs (including quoted prices for similar securities, interest rates, prepayment speeds, credit risk, etc.). • Level 3 – prices determined using significant unobservable inputs (including the investment adviser’s Valuation Committee’s own assumptions in determining the fair value of investments). |
A description of the valuation techniques applied to a Fund’s major categories of assets and liabilities measured at fair value on a recurring basis is as follows:
Equity securities are valued at the official closing price (typically last sale) on the exchange on which the securities are primarily traded or, if no closing price is available,
NOTES TO FINANCIAL STATEMENTS (Continued)
November 30, 2024
at the last bid price and are categorized as Level 1 in the hierarchy. Illiquid, restricted equity securities and illiquid private placements are internally fair valued by the investment adviser’s Valuation Committee, and are generally categorized as Level 3 in the hierarchy.
Certain non-U.S. securities may be fair valued in cases where closing prices are not readily available or are deemed not reflective of readily available market prices. For example, significant events (such as movement in the U.S. securities market, or other regional and local developments) may occur between the time that non-U.S. markets close (where the security is principally traded) and the time that a Fund calculates its net asset value (“NAV”) at the close of regular trading on the New York Stock Exchange (“NYSE”) (generally 4 p.m. Eastern time) that may impact the value of securities traded in these non-U.S. markets. In such cases, the Funds fair value non-U.S. securities using an independent pricing service which considers the correlation of the trading patterns of the non-U.S. security to the intraday trading in the U.S. markets for investments such as American Depositary Receipts, financial futures, and certain indexes, as well as prices for similar securities. Such fair valuations are categorized as Level 2 in the hierarchy. Because the frequency of significant events is not predictable, fair valuation of certain non-U.S. common stocks may occur on a frequent basis.
Debt instruments, including convertible bonds, and restricted securities, are valued based on evaluated quotations received from independent pricing services or from dealers who make markets in such securities. For most bond types, the pricing service utilizes matrix pricing that considers one or more of the following factors: yield or price of bonds of comparable quality, coupon, maturity, current cash flows, type, activity of the underlying equities, and current day trade information, as well as dealer supplied prices. These valuations are generally categorized as Level 2 in the hierarchy. Structured debt instruments, such as mortgage-backed and asset-backed securities may also incorporate collateral analysis and utilize cash flow models for valuation and are generally categorized as Level 2 in the hierarchy. Pricing services do not provide pricing for all securities and therefore indicative bids from dealers are utilized which are based on pricing models used by market makers in the security and are generally categorized as Level 2 in the hierarchy. Debt instruments that are internally fair valued by the investment adviser’s Valuation Committee are generally categorized as Level 3 in the hierarchy.
Listed derivatives, such as options and futures, that are actively traded are valued at the last posted settlement price from the exchange where they are principally traded and are categorized as Level 1 in the hierarchy. Over-the-counter (“OTC”) derivative contracts, which include forward currency contracts, swaps, swaptions, options and equity linked instruments, are valued based on model prices provided by independent pricing services or from dealer quotes. Depending on the derivative type and the specific terms of the transaction, these models vary and include observable inputs in actively quoted markets including but not limited to: underlying reference entity details, indices, spreads, interest rates, yield curves, dividend and exchange rates. These instruments are generally categorized as Level 2 in the hierarchy. Centrally cleared swaps listed or traded on a bilateral or trade facility platform, such as a registered exchange, are valued at the last posted settlement price determined by the respective exchange. These securities are generally categorized as Level 2 within the hierarchy.
NOTES TO FINANCIAL STATEMENTS (Continued)
November 30, 2024
Investments in open-end mutual funds are valued at NAV. Investments in closed-end funds and ETFs are valued as of the close of regular trading on the NYSE each business day. Each is categorized as Level 1 in the hierarchy.
A summary of the inputs used to value a Fund’s net assets by each major security type is disclosed at the end of the Schedule of Investments for each Fund. The inputs or methodologies used for valuing securities are not necessarily an indication of the risk associated with investing in those securities.
| B. | Security Transactions and Investment Income |
| | Security transactions are recorded on the trade date. Realized gains and losses from the sale of securities are determined on the identified cost basis. Dividend income and capital gain distributions are recognized on the ex-dividend date or, in the case of certain foreign securities, as soon as a Fund is notified. Interest income is recorded on the accrual basis. Each Fund amortizes premiums and accretes discounts using the effective interest method. Premiums on callable debt instruments are amortized to interest income to the earliest call date using the effective interest method. Conversion premium is not amortized. Any distributions from underlying funds are recorded in accordance with the character of the distributions as designated by the underlying funds. |
| | Dividend income from real estate investment trusts (“REITs”) is recorded using management’s estimate of the percentage of income included in distributions received from such investments based on historical information and other industry sources. The return of capital portion of the estimate is a reduction to investment income and a reduction in the cost basis of each investment which increases net realized gain (loss) and net change in unrealized appreciation (depreciation). |
| | If the return of capital distributions exceed their cost basis, the distributions are treated as realized gains. The actual amounts of income, return of capital, and capital gains are only determined by each REIT after its fiscal year-end, and may differ from the estimated amounts. |
| C. | Income Taxes |
| | Each Fund is treated as a separate taxable entity. It is the intention of each Fund to comply with the requirements of Subchapter M of the Internal Revenue Code of 1986, as amended (the “Code”) and to distribute substantially all of its taxable income and capital gains, if any, to its shareholders. Therefore, no provision for federal income taxes or excise taxes has been made. |
| | Each Fund may be subject to foreign taxes on income, gains on investments or currency repatriation, a portion of which may be recoverable. Each Fund will accrue such taxes and recoveries as applicable based upon current interpretations of the tax rules and regulations that exist in the markets in which it invests. |
| | Management of the Funds has concluded that there are no significant uncertain tax positions that would require recognition in the financial statements. Each Fund’s U.S. federal income tax return is generally subject to examination by the Internal Revenue Service for a period of three years after it is filed. State, local and/or non-U.S. tax returns and/or other filings may be subject to examination for different periods, depending upon the tax rules of each applicable jurisdiction. |
NOTES TO FINANCIAL STATEMENTS (Continued)
November 30, 2024
| D. | Distributions to Shareholders |
| | Global Multi-Sector Income Fund and Stone Harbor Emerging Markets Income Fund declare distributions on a monthly basis. Distributions are recorded by the Funds on the ex-dividend date. Income and capital gain distributions are determined in accordance with income tax regulations which may differ from U.S. GAAP. |
| | Total Return Fund Inc. has a Managed Distribution Plan which currently provides for the Fund to make a monthly distribution of $0.05 per share. Shareholders should not draw any conclusions about the Fund’s investment performance from the terms of the Fund’s Managed Distribution Plan. |
| | Distributions may represent earnings from net investment income, realized capital gains, or, if necessary, return of capital. |
| E. | Foreign Currency Transactions |
| | Non-U.S. investment securities and other assets and liabilities denominated in foreign currencies are translated into U.S. dollar amounts at the foreign currency exchange rate effective at the end of the reporting period. Cost of investments is translated at the currency exchange rate effective at the trade date. The gain or loss resulting from a change in currency exchange rates between the trade and settlement date of a portfolio transaction is treated as a gain or loss on foreign currency. Likewise, the gain or loss resulting from a change in currency exchange rates between the date income is accrued and the date it is paid is treated as a gain or loss on foreign currency. For fixed income instruments, the Funds bifurcate that portion of the results of operations arising from changes in foreign exchange rates on investments from the fluctuations arising from changes in the market prices of securities held and such fluctuations are included with the net realized and unrealized gain or loss on foreign currency transactions. For equity securities, the Funds do not isolate that portion of the results of operations arising from changes in foreign exchange rates on investments from the fluctuations arising from changes in the market prices of securities held and such fluctuations are included with the net realized and unrealized gain or loss on investments. |
| F. | Credit Linked Notes |
| | Stone Harbor Emerging Markets Income Fund may invest in credit linked notes to obtain economic exposure to high yield, emerging markets or other securities. Investments in a credit linked note typically provide the holder with a return based on the return of an underlying reference instrument, such as an emerging market bond. Like an investment in a bond, investments in credit linked securities represent the right to receive periodic income payments (in the form of distributions) and payment of principal at the end of the term of the security. In addition to the risks associated with the underlying reference instrument, an investment in a credit linked note is also subject to liquidity risk, market risk, interest rate risk and the risk that the counterparty will be unwilling or unable to meet its obligations under the note. |
| G. | Payment-In-Kind Securities |
| | The Funds may invest in payment-in-kind securities, which are debt or preferred stock securities that require or permit payment of interest in the form of additional securities. Payment-in-kind securities allow the issuer to avoid or delay the need to generate cash to meet current interest payments and, as a result, may involve greater risk than securities that pay interest currently or in cash. |
NOTES TO FINANCIAL STATEMENTS (Continued)
November 30, 2024
| H. | When-Issued Purchases and Forward Commitments (Delayed Delivery) |
| | The Funds may engage in when-issued or forward commitment transactions. Securities purchased on a when-issued or forward commitment basis are also known as delayed delivery transactions. Delayed delivery transactions involve a commitment by a Fund to purchase or sell a security at a future date (ordinarily up to 90 days later). When-issued or forward commitments enable the Funds to lock in what is believed to be an attractive price or yield on a particular security for a period of time, regardless of future changes in interest rates. The Funds record when-issued and forward commitment securities on the trade date. The Funds maintain collateral for the securities purchased. Securities purchased on a when-issued or forward commitment basis begin earning interest on the settlement date. |
| I. | Leveraged Loans |
| | The Funds may invest in direct debt instruments which are interests in amounts owed by a corporate, governmental, or other borrower to lenders or lending syndicates. Leveraged loans are generally non-investment grade and often involve borrowers that are highly leveraged. The Funds may invest in obligations of borrowers who are in bankruptcy proceedings. Leveraged loans are typically senior in the corporate capital structure of the borrower. A loan is often administered by a bank or other financial institution (the “lender”) that acts as agent for all holders. The agent administers the terms of the loan, as specified in the leveraged loan. A Fund’s investments in loans may be in the form of participations in loans or assignments of all or a portion of loans from third parties. When investing in loan participations, a Fund has the right to receive payments of principal, interest and any fees to which it is entitled only from the lender selling the loan participation and only upon receipt by the lender of payments from the borrower. A Fund generally has no right to enforce compliance with the terms of the leveraged loan with the borrower. As a result, a Fund may be subject to the credit risk of both the borrower and the lender that is selling the leveraged loan. When a Fund purchases assignments from lenders it acquires direct rights against the borrower on the loan. |
| | A Fund may invest in multiple series or tranches of a loan, which may have varying terms and carry different associated risks. Leveraged loans may involve foreign borrowers and investments may be denominated in foreign currencies. Direct indebtedness of emerging countries involves a risk that the government entities responsible for the repayment of the debt may be unable, or unwilling, to pay the principal and interest when due. |
| | The leveraged loans have floating rate loan interests which generally pay interest at rates that are periodically determined by reference to a base lending rate plus a premium. The base lending rates are generally LIBOR, SOFR, the prime rate offered by one or more U.S. banks or the certificate of deposit rate. When a leveraged loan is purchased a Fund may pay an assignment fee. On an ongoing basis, a Fund may receive a commitment fee based on the undrawn portion of the underlying line of credit portion of a leveraged loan. Prepayment penalty fees are received upon the prepayment of a leveraged loan by a borrower. Prepayment penalty, facility, commitment, consent and amendment fees are recorded to income as earned or paid. |
| | A Fund may invest in both secured loans and “covenant lite” loans which have few or no financial maintenance covenants that would require a borrower to maintain certain |
NOTES TO FINANCIAL STATEMENTS (Continued)
November 30, 2024
| | financial metrics. The lack of financial maintenance covenants in covenant lite loans increases the risk that the applicable Fund will experience difficulty or delays in enforcing its rights on its holdings of such loans, which may result in losses, especially during a downturn in the credit cycle. |
| J. | Expenses |
| | Expenses incurred together by a Fund and other affiliated mutual funds are allocated in proportion to the net assets of each such fund, except where allocation of direct expenses to a Fund and each such other fund, or an alternative allocation method, can be more appropriately used. |
| | In addition to the net annual operating expenses that a Fund bears directly, the shareholders of a Fund indirectly bear the pro-rata expenses of any underlying mutual funds in which the Fund invests. |
| K. | Cash and Cash Equivalents |
| | Cash and cash equivalents include deposits held at financial institutions, and are inclusive of dollar denominated cash, foreign currency, cash collateral pledged for swaps, and cash pledged as collateral for reverse repurchase agreements. |
Note 3. Derivative Financial Instruments and Transactions
($ reported in thousands)
Disclosures about derivative instruments and hedging activities are intended to enable investors to understand how and why a Fund uses derivatives, how derivatives are accounted for, and how derivative instruments affect a Fund’s results of operations and financial position. Summarized below are such disclosures and accounting policies for each specific type of derivative instrument used by Stone Harbor Emerging Markets Income Fund.
| A. | Forward Foreign Currency Exchange Contracts |
| | A forward foreign currency exchange contract is an agreement between two parties to buy and sell a currency at a set exchange rate on a future date. Forward foreign currency exchange contracts, when used by a Fund, help to manage the overall exposure to the currencies in which some of the investments held by a Fund are denominated. The contract is marked-to-market daily and the change in market value is recorded by a Fund as an unrealized appreciation or depreciation. When the contract is closed, a Fund records a realized gain or loss equal to the difference between the value at the time it was opened and the value at the time it was closed. The use of forward foreign currency exchange contracts involves the risk that the value of the contract changes unfavorably due to movements in the value of the referenced foreign currencies. Non-deliverable forward foreign currency exchange contracts are settled with the counterparty in U.S. dollars without the delivery of foreign currency. |
| | During the fiscal year ended November 30, 2024, Stone Harbor Emerging Markets Income Fund entered into forward foreign currency exchange contracts as an economic hedge against either specific transactions or portfolio instruments or to obtain exposure to, or hedge exposure away from, foreign currencies (foreign currency exchange rate risk). Forward foreign currency contracts outstanding at period end, if any, are listed after a Fund’s Schedule of Investments. |
NOTES TO FINANCIAL STATEMENTS (Continued)
November 30, 2024
| B. | Options Contracts |
| | An options contract provides the purchaser with the right, but not the obligation, to buy (call option) or sell (put option) a financial instrument at an agreed upon price. The Funds may purchase or write both put and call options on portfolio securities. When doing so, the Fund is subject to equity price risk and/or foreign currency risk in the normal course of pursuing its investment objectives. |
| | When a Fund purchases an option, it pays a premium and an amount equal to that premium is recorded as an asset. When a Fund writes an option, it receives a premium and an amount equal to that premium is recorded as a liability. The asset or liability is adjusted daily to reflect the current market value of the option. Holdings of the Fund designated to cover outstanding written options are noted in the Schedules of Investments. Purchased options are reported as an asset within “Investment in securities at value” in the Statements of Assets and Liabilities. Written options are reported as a liability within “Written options at value.” Changes in value of the purchased option are included in “Net change in unrealized appreciation (depreciation) from investments” in the Statements of Operations. Changes in value of written options are included in “Net change in unrealized appreciation (depreciation) from written options” in the Statements of Operations. |
| | If an option expires unexercised, the Fund realizes a gain or loss to the extent of the premium received or paid. If an option is exercised, the premium received or paid is recorded as an adjustment to the proceeds from the sale or the cost basis of the purchase. The difference between the premium and the amount received or paid on effecting a closing purchase or sale transaction is also treated as a realized gain or loss. Gain or loss on purchased options is included in “Net realized gain (loss) on investments” in the Statements of Operations. Gain or loss on written options is presented separately as “Net realized gain (loss) from written options” in the Statements of Operations. |
| | The risk in writing call options is that the Fund gives up the opportunity for profit if the market price/foreign currency rate of the referenced security/currency increases and the option is exercised. The risk in writing put options is that the Fund may incur a loss if the market price/foreign currency rate of the referenced security/currency decreases and the option is exercised. The risk in buying options is that the Fund pays a premium whether or not the option is exercised. The use of such instruments may involve certain additional risks as a result of unanticipated movements in the market. Writers (sellers) of options are subject to unlimited risk of loss, as the seller will be obligated to deliver or take delivery of the security at a predetermined price which may, upon exercise of the option, be significantly different from the then-market value. As the writer of a covered call option, the Fund forgoes, during the option’s life, the opportunity to profit from increases in the market value of the security covering the call option above the sum of the premium and the strike price of the call, but retains the risk of loss should the price of the underlying security decline. |
| | During the fiscal year ended November 30, 2024, Stone Harbor Emerging Markets Income Fund invested in purchased call and put options contracts in an attempt to manage foreign currency risk and with the purpose of generating realized gains. |
NOTES TO FINANCIAL STATEMENTS (Continued)
November 30, 2024
| C. | Swaps |
| | A Fund enters into swap agreements, in which a Fund and a counterparty agree either to make periodic net payments on a specified notional amount or a net payment upon termination. Swap agreements are negotiated in the Over-the-Counter (“OTC”) market and may be entered into as a bilateral contract (“OTC swaps”) or centrally cleared (“centrally cleared swaps”). The value of the swap is reflected on the Statement of Assets and Liabilities as “Over-the-counter swaps at value” and as “Variation margin receivable/payable on cleared swaps” for centrally cleared swaps. Swaps are marked-to-market daily and changes in value are recorded as “Net change in unrealized appreciation (depreciation) on swaps” in the Statement of Operations. |
| | Any upfront premiums paid are recorded as assets and any upfront fees received are recorded as liabilities and are shown under “Over-the-counter swaps at value” in the Statement of Assets and Liabilities and are amortized over the term of the swap for OTC swaps. When a swap is terminated, a Fund records a realized gain or loss equal to the difference between the proceeds from (or cost of) the closing transaction and a Fund’s basis in the contract, if any. Generally, the basis of the contracts is the unamortized premium received or paid. Cash settlements between a Fund and the counterparty are recognized as “Net realized gain (loss) on swaps” in the Statement of Operations. Swap contracts outstanding at period end, if any, are listed after a Fund’s Schedule of Investments. |
| | In a centrally cleared swap, immediately following execution of the swap agreement, the swap agreement is submitted to a central counterparty (the “CCP”) and a Fund’s counterparty on the swap agreement becomes the CCP. A Fund is required to interface with the CCP through a clearing broker. Upon entering into a centrally cleared swap, a Fund is required to deposit initial margin with the clearing broker in the form of cash or securities in an amount that varies depending on the size and risk profile of the particular swap. |
| | Securities deposited as margin are designated on the Schedule of Investments and cash deposited is recorded on the Statement of Assets and Liabilities as “Cash collateral pledged for swaps.” |
| | Swap transactions involve, to varying degrees, elements of interest rate, credit and market risk in excess of the amounts recognized in the Statement of Assets and Liabilities. Such risks involve the possibility that there will be no liquid market for these agreements, that the counterparty to the agreements may default on its obligation to perform or disagree as to the meaning of the contractual terms in the agreements, and that there may be unfavorable changes in interest rates and/or market values associated with these transactions. |
| | Credit default swaps – A Fund may either buy or sell (write) credit default swaps on single-name issuers (corporate or sovereign), a combination or basket of single-name issuers or traded indexes. Credit default swaps on single-name issuers are agreements in which the buyer pays fixed periodic payments to the seller in consideration for a guarantee from the protection seller to make specific payment should a negative credit event take place with respect to the referenced entity (e.g., bankruptcy, failure to pay, obligation accelerators, repudiation, moratorium or restructuring). Credit default swaps on a combination or basket of single-name issuers are agreements in which the buyer pays fixed periodic payments to the seller in consideration for a guarantee from the |
NOTES TO FINANCIAL STATEMENTS (Continued)
November 30, 2024
| | protection seller to make specific payment should a negative credit event take place with respect to any of the referenced entities (e.g., bankruptcy, failure to pay, obligation accelerators, repudiation, moratorium or restructuring). Credit default swaps on traded indexes are agreements in which the buyer pays fixed periodic payments to the seller in consideration for a guarantee from the seller to make a specific payment should a write-down, principal or interest shortfall or default of all or individual underlying securities included in the index occurs. As a buyer, if an underlying credit event occurs, a Fund will either receive from the seller an amount equal to the notional amount of the swap and deliver the referenced security or underlying securities comprising the index or receive a net settlement of cash equal to the notional amount of the swap less the recovery value of the security or underlying securities comprising the index. As a seller (writer), if an underlying credit event occurs, a Fund will either pay the buyer an amount equal to the notional amount of the swap and take delivery of the referenced security or underlying securities comprising the index or pay a net settlement of cash equal to the notional amount of the swap less the recovery value of the security or underlying securities comprising the index. A Fund may enter into credit default swaps to manage their exposure to the market or certain sectors of the market, to reduce their risk exposure to defaults of corporate and/or sovereign issuers or to create exposure to corporate and/or sovereign issuers to which they are not otherwise exposed (credit risk). |
| | During the fiscal year ended November 30, 2024, Stone Harbor Emerging Markets Income Fund utilized single name credit default swaps to short individual securities or to gain exposure to a credit or asset-backed index. |
| | The following is a summary of derivative instruments categorized by primary risk exposure, and location as presented in the Statement of Assets and Liabilities at November 30, 2024: |
| Statement Line Description | | Primary Risk | Stone Harbor Emerging Markets Income Fund |
| Asset Derivatives |
| Over-the-counter swaps at value(1) | | Credit contracts | $ 348 | |
Unrealized appreciation on forward
foreign currency exchange contracts | | Foreign currency contracts | 322 | |
| Purchased options at value(2) | | Foreign currency contracts | 72 | |
| Total Assets | | | $ 742 | |
| Liability Derivatives |
Unrealized depreciation on forward
foreign currency exchange contracts | | Foreign currency contracts | $ (118) | |
| Total Liabilities | | | $ (118) | |
| | |
| (1) | Represents cumulative appreciation (depreciation) on swap contracts as reported in the Schedule of Investments. For OTC swap contracts, the value (including premiums) at November 30, 2024 is shown in the Statement of Assets and Liabilities. |
| (2) | Amount included in Investment in securities at value. |
NOTES TO FINANCIAL STATEMENTS (Continued)
November 30, 2024
The following is a summary of derivative instruments categorized by primary risk exposure, and location as presented in the Statements of Operations for the fiscal year ended November 30, 2024:
| Statement Line Description | | Primary Risk | Stone Harbor Emerging Markets Income Fund |
| Net Realized Gain (Loss) from | | |
| Purchased options(1) | | Foreign currency contracts | $ 59 | |
| Forward foreign currency exchange contracts | | Foreign currency contracts | 76 | |
| Swaps | | Credit contracts | 1,273 | |
| Total | | | $1,408 | |
| Net Change in Unrealized Appreciation (Depreciation) on | | |
| Purchased options(2) | | Foreign currency contracts | $ (11) | |
| Forward foreign currency exchange contracts | | Foreign currency contracts | 204 | |
| Swaps | | Credit contracts | 5,052 | |
| Total | | | $5,245 | |
| |
| (1) Amount included in Net realized gain (loss) on investments. |
| (2) Amount included in Net change in unrealized appreciation (depreciation) on investments. |
The table below shows the quarterly average volume (unless otherwise specified) of the
derivatives held by Stone Harbor Emerging Markets Income Fund for the fiscal year ended November 30, 2024.
| | |
Purchased Options(1)
| $ 66 |
Forward Foreign Currency Exchange Purchase Contracts(2)
| 1,403 |
Forward Foreign Currency Exchange Sale Contracts(2)
| 3,363 |
Credit Default Swap Contracts - Sell Protection(2)
| 11,200 |
| (1) Average premium amount. |
| (2) Average notional amount. |
| D. | Derivative Risks |
| | A derivative contract may suffer a mark-to-market loss if the value of the contract decreases due to an unfavorable change in the market rates or values of the underlying instrument. Losses can also occur if the counterparty does not perform under the contract. |
| | A Fund’s risk of loss from counterparty credit risk on derivatives bought or sold OTC rather than traded on a securities exchange, is generally limited to the aggregate |
NOTES TO FINANCIAL STATEMENTS (Continued)
November 30, 2024
| | unrealized gain netted against any collateral held by a Fund. For OTC purchased options, a Fund bears the risk of loss of the amount of the premiums paid plus the positive change in market values net of any collateral held by such Fund should the counterparty fail to perform under the contracts. Options written by a Fund do not typically give rise to counterparty credit risk, as options written generally obligate a Fund, and not the counterparty to perform. |
| | With exchange traded purchased options and futures and centrally cleared swaps generally speaking, there is less counterparty credit risk to a Fund since the exchange or clearinghouse, as counterparty to such instruments, guarantees against a possible default. The clearinghouse stands between the buyer and the seller of the contract; therefore, credit risk is limited to failure of the clearinghouse. While offset rights may exist under applicable law, a Fund does not have a contractual right of offset against a clearing broker or clearinghouse in the event of a default (including the bankruptcy or insolvency) of the clearing broker or clearinghouse. Additionally, credit risk exists in exchange traded futures and centrally cleared swaps with respect to initial and variation margin that is held in a clearing broker’s customer accounts. While clearing brokers are required to segregate customer margin from their own assets, in the event that a clearing broker becomes insolvent or goes into bankruptcy and at that time there is a shortfall in the aggregate amount of margin held by the clearing broker for all its clients, typically the shortfall would be allocated on a pro-rata basis across all the clearing broker’s customers, potentially resulting in losses to a Fund. |
| | In order to better define its contractual rights and to secure rights that will help a Fund mitigate its counterparty risk, a Fund may enter into an International Swaps and Derivatives Association, Inc. Master Agreement (“ISDA Master Agreement”) or similar agreement with its derivative contract counterparties. An ISDA Master Agreement is a bilateral agreement between a Fund and a counterparty that governs certain OTC derivatives and typically contains, among other things, collateral posting terms and netting provisions in the event of a default and/or termination event. Under an ISDA Master Agreement, a Fund may, under certain circumstances, offset with the counterparty certain derivative financial instruments’ payables and/or receivables with collateral held and/or posted and create one single net payment. The provisions of the ISDA Master Agreement typically permit a single net payment in the event of default including the bankruptcy or insolvency of the counterparty. However, bankruptcy or insolvency laws of a particular jurisdiction may impose restrictions on or prohibitions against the right of offset in bankruptcy, insolvency or other events. In addition, certain ISDA Master Agreements allow counterparties to OTC derivatives to terminate derivative contracts prior to maturity in the event a Fund’s net assets decline by a stated percentage or a Fund fails to meet the terms of its ISDA Master Agreements, which would cause a Fund to accelerate payment of any net liability owed to the counterparty. |
| E. | Collateral Requirements and Master Netting Agreements (“MNA”) |
| | For derivatives traded under an ISDA Master Agreement, the collateral requirements are typically calculated by netting the mark-to-market amount for each transaction under such agreement and comparing that amount to the value of any collateral currently pledged by a Fund and the counterparty. |
| | Cash collateral that has been pledged to cover obligations of a Fund and cash collateral received from the counterparty, if any, is reported separately on the Statement of Assets |
NOTES TO FINANCIAL STATEMENTS (Continued)
November 30, 2024
| | and Liabilities as cash pledged as collateral and cash received as collateral, respectively. Non-cash collateral pledged by a Fund, if any, is noted in the Schedule of Investments. Typically, a Fund and counterparties are not permitted to sell, re-pledge or use the collateral they receive. To the extent amounts due to a Fund from its counterparties are not fully collateralized, contractually or otherwise, a Fund bears the risk of loss from counterparty non-performance. A Fund attempts to mitigate counterparty risk by only entering into agreements with counterparties that it believes have the financial resources to honor its obligations and by monitoring the financial stability of those counterparties. |
| | For financial reporting purposes, a Fund does not offset derivative assets and liabilities that are subject to netting arrangements in the Statement of Assets and Liabilities. |
| | The following tables present Stone Harbor Emerging Markets Income Fund’s derivative assets and liabilities by counterparty net of amounts available for offset under a MNA and net of the related collateral received/pledged by a Fund as of November 30, 2024: |
| At November 30, 2024, Stone Harbor Emerging Markets Income Fund’s derivative assets and liabilities (by type) are as follows: | | |
| | Assets | Liabilities |
Derivative Financial
Instruments: | | |
Forward foreign currency
exchange contracts | $322 | $118 |
| OTC swaps | — | 396 |
| Purchased options | 72 | — |
Total derivative assets and liabilities in
the Statement of Assets and Liabilities | $394 | $514 |
Derivatives not subject to a MNA
or similar agreement | — | — |
Total assets and liabilities
subject to a MNA | $394 | $514 |
NOTES TO FINANCIAL STATEMENTS (Continued)
November 30, 2024
The following tables present Stone Harbor Emerging Markets Income Fund’s derivative assets and liabilities by counterparty net of amounts available for offset under a MNA and net of the related collateral received/pledged by each Fund as of November 30, 2024:
| Counterparty | | Gross Derivative
Assets
Subject to
a MNA by
Counterparty | | Derivatives
Available
for Offset | | Non-cash
Collateral
Received(1) | | Cash
Collateral
Received(1) | | Net
Amount of
Derivative
Assets(1) |
Goldman Sachs & Co.
| | $ 72 | | $ — | | $— | | $— | | $ 72 |
JPMorgan Chase Bank N.A.
| | 322 | | (118) | | — | | — | | 204 |
Total
| | $394 | | $(118) | | $— | | $— | | $276 |
| Counterparty | | Gross Derivatives
Liabilities
Subject to
a MNA by
Counterparty | | Derivatives
Available
for Offset | | Non-cash
Collateral
Pledged(1) | | Cash
Collateral
Pledged(1) | | Net
Amount of
Derivative
Liabilities(1) |
Barclays
| | $396 | | $ — | | $— | | $(396) | | $— |
JPMorgan Chase Bank N.A.
| | 118 | | (118) | | — | | — | | — |
Total
| | $514 | | $(118) | | $— | | $(396) | | $— |
(1) These amounts are limited to the derivatives asset/liability balance and, accordingly, do not include excess collateral received/pledged.
Note 4. Investment Advisory Fees and Related Party Transactions
($ reported in thousands)
| A. | Investment Adviser |
| | Virtus Investment Advisers, Inc., an indirect, wholly-owned subsidiary of Virtus Investment Partners, Inc. (“Virtus”), is the investment adviser to Global Multi-Sector Income Fund and Total Return Fund Inc. Virtus Alternative Investment Advisers, Inc. (collectively with Virtus Investment Advisers, Inc., the “Adviser”), an indirect, wholly-owned subsidiary of Virtus, is the investment adviser to Stone Harbor Emerging Markets Income Fund. The Adviser manages the Funds’ investment program and general operations of the Funds, including oversight of the Funds’ subadvisers. |
| | As compensation for its services to the Funds, the Adviser is entitled to a fee, which is calculated daily and paid monthly based upon the following annual rates as a percentage of the average daily total managed assets of each Fund. “Managed Assets” is defined as the average daily value of the total assets of each Fund minus the sum of |
NOTES TO FINANCIAL STATEMENTS (Continued)
November 30, 2024
| | all accrued liabilities of the Fund (other than the aggregate amount of any outstanding borrowings or other indebtedness, entered into for the purpose of leverage). |
| Fund | | Advisory Fee |
Global Multi-Sector Income Fund
| | 0.95% |
Stone Harbor Emerging Markets Income Fund
| | 1.00* |
Total Return Fund Inc.
| | 0.70 |
*Provided the Advisory Fee does not exceed 1.50% of the Fund’s net assets.
| B. | Subadvisers |
| | The subadvisers are responsible for the day-to-day portfolio management of each Fund for which they are paid a fee by the Adviser. A list of the subadvisers and the Funds they serve as of the end of the year is as follows: |
| Fund | | Subadviser |
Global Multi-Sector Income Fund
| | Newfleet(1) |
Stone Harbor Emerging Markets Income Fund
| | SHIP(2) |
Total Return Fund Inc. (Equity Portfolio)
| | DPIM(3) |
Total Return Fund Inc. (Fixed Income Portfolio)
| | Newfleet(1) |
| (1) | Newfleet Asset Management (“Newfleet”), a division of Virtus Fixed Income Advisers LLC (“VFIA”), an indirect wholly owned subsidiary of Virtus. |
| (2) | Stone Harbor Investment Partners (“SHIP”), a division of VFIA. |
| (3) | Duff & Phelps Investment Management Co. (“DPIM”), an indirect, wholly-owned subsidiary of Virtus. |
| C. | Expense Limitation |
| | The Adviser has contractually agreed to limit Stone Harbor Emerging Markets Income Fund’s annual total operating expenses, subject to the exclusions listed below, so that such expenses do not exceed, on an annualized basis, 0.58% of average daily net assets through April 10, 2025. Following the contractual period, the Adviser may discontinue these expense reimbursement arrangements at any time. The reimbursements are accrued daily and received monthly. |
| | The exclusions include investment advisory fees, interest, any other fees or expenses relating to financial leverage, preferred shares (such as dividends on preferred shares, auction agent fees and commissions and rating agency fees) or borrowing (such as interest, commitment, amendment and renewal expenses on credit or redemption facilities), taxes, extraordinary, unusual or infrequently occurring expenses (such as litigation), costs related to share offerings, brokerage commissions, expenses incurred in connection with any merger or reorganization, underlying fund expenses and dividend expenses, if any (each expressed as a percentage of average daily net assets attributable to common shares). |
| | During the fiscal year ended November 30, 2024, Stone Harbor Emerging Markets Income Fund’s expenses were below its expense limitation. |
| D. | Expense Recapture |
| | Under certain conditions, the Adviser may recapture operating expenses reimbursed or fees waived under these arrangements within three years after the date on which such amounts were incurred or waived. A Fund must pay its ordinary operating expenses |
NOTES TO FINANCIAL STATEMENTS (Continued)
November 30, 2024
| | before the Adviser is entitled to any reimbursement and must remain in compliance with any applicable expense limitations or, if none, the expense limitation in effect at the time of the waiver or reimbursement. |
| | During the fiscal year ended November 30, 2024, the Adviser did not recapture reimbursed expenses or waived fees. |
| E. | Administration Services |
| | Virtus Fund Services, LLC, an indirect, wholly-owned subsidiary of Virtus, serves as administrator to the Funds. For the services provided by the administrator under the Administration Agreement, the Funds pay the administrator an asset-based fee calculated on each Fund’s average daily Managed Assets. This fee is calculated daily and paid monthly. |
| | For the fiscal year ended November 30, 2024, the Funds incurred administration fees totaling $900 which are included in the Statement of Operations within the line item “Administration and accounting fees.” |
| F. | Trustees’/Directors’ Fees |
| | For the fiscal year ended November 30, 2024, the Funds incurred independent Trustees’/Directors’ fees totaling $53 which are included in the Statement of Operations within the line item “Trustees’/Directors’ fees and expenses.” No remuneration was paid to the officers or affiliated trustee. |
| G. | Investments with Affiliates |
| | The Funds are permitted to purchase assets from or sell assets to certain related affiliates under specified conditions outlined in procedures adopted by the Board. The procedures have been designed to ensure that any purchase or sale of assets by the Funds from or to another fund or portfolio that are, or could be, considered an affiliate by virtue of having a common investment adviser (or affiliated investment advisers), common Trustees and/or common officers comply with Rule 17a-7 under the 1940 Act. Further, as defined under the procedures, each transaction is effected at the current market price. |
| | During the fiscal year ended November 30, 2024, the Funds did not engage in any transactions pursuant to Rule 17a-7 under the 1940 Act. |
| H. | Trustees/Director Deferred Compensation Plan |
| | The Funds provide a deferred compensation plan for its Trustees/Directors who receive compensation from the Funds. Under the deferred compensation plan, Trustees/Directors may elect to defer all or a portion of their compensation. Amounts deferred are retained by each Fund, and then, to the extent permitted by the 1940 Act, in turn, may be invested in the shares of affiliated or unaffiliated mutual funds selected by the participating Trustees/Directors. Investments in such instruments are included in “Prepaid expenses and other assets” in the Statement of Assets and Liabilities at November 30, 2024. |
NOTES TO FINANCIAL STATEMENTS (Continued)
November 30, 2024
Note 5. Purchases and Sales of Securities
($ reported in thousands)
Purchases and sales of securities (excluding U.S. government and agency securities and short-term securities) during the fiscal year ended November 30, 2024, were as follows:
| | Purchases | | Sales |
Global Multi-Sector Income Fund
| $ 94,917 | | $ 99,465 |
Stone Harbor Emerging Markets Income Fund
| 138,630 | | 107,947 |
Total Return Fund Inc.
| 314,919 | | 404,401 |
Purchases and sales of long-term U.S. government and agency securities during the fiscal year ended November 30, 2024, were as follows:
| | Purchases | | Sales |
Global Multi-Sector Income Fund
| $15,995 | | $16,760 |
Total Return Fund Inc.
| 35,172 | | 37,402 |
| | | | |
Note 6. Federal Income Tax Information
($ reported in thousands)
At November 30, 2024, the approximate cost basis and aggregate unrealized appreciation (depreciation) of investments and other financial instruments held by the Funds for federal income tax purposes were as follows:
| Fund | | Federal
Tax Cost | | Unrealized
Appreciation | | Unrealized
(Depreciation) | | Net Unrealized
Appreciation
(Depreciation) |
Global Multi-Sector Income Fund
| | $ 142,062 | | $ 2,531 | | $ (6,715) | | $ (4,184) |
Stone Harbor Emerging Markets Income Fund
| | 185,180 | | 11,404 | | (10,938) | | 466 |
Total Return Fund Inc.
| | 556,049 | | 60,331 | | (21,091) | | 39,240 |
The Funds have capital loss carryovers available to offset future realized capital gains, if any, to the extent permitted by the Code. Net capital losses are carried forward without expiration and generally retain their short-term and/or long-term tax character, as applicable. For the fiscal year ended November 30, 2024, the Funds’ capital loss carryovers are as follows:
| | | | |
| Fund | | Short-Term | | Long-Term |
Global Multi-Sector Income Fund
| | $ 8,873 | | $ 27,895 |
Stone Harbor Emerging Markets Income Fund
| | 94,193 | | 142,592 |
Total Return Fund Inc.
| | — | | 1,308 |
NOTES TO FINANCIAL STATEMENTS (Continued)
November 30, 2024
The components of distributable earnings on a tax basis and certain tax attributes for the Funds consist of the following:
| Fund | | Post-October
Capital Loss
Deferred | | Capital Loss
Deferred |
Global Multi-Sector Income Fund
| | $ 40 | | $ 36,768 |
Stone Harbor Emerging Markets Income Fund
| | 31 | | 236,785 |
Total Return Fund Inc.
| | — | | 1,308 |
The differences between the book and tax basis of distributable earnings relate principally to the timing of recognition of income and gains for federal income tax purposes. Short-term gain distributions, if any, are reported as ordinary income for federal tax purposes. Distributions are determined on a tax basis and may differ from net investment income and realized capital gains for financial reporting purposes.
The tax character of dividends and distributions paid during the fiscal years ended November 30, 2024 and 2023 was as follows:
| | Ordinary
Income | | Return of
Capital | | Total |
Global Multi-Sector Income Fund
| | | | | |
11/30/24
| $ 5,055 | | $ 5,806 | | $10,861 |
11/30/23
| 4,629 | | 6,232 | | 10,861 |
Stone Harbor Emerging Markets Income Fund
| | | | | |
11/30/24
| 20,130 | | 99 | | 20,229 |
11/30/23
| 11,445 | | 951 | | 12,396 |
Total Return Fund Inc.
| | | | | |
11/30/24
| 8,721 | | 30,026 | | 38,747 |
11/30/23
| 9,660 | | 50,003 | | 59,663 |
Certain capital accounts in the financial statements are periodically adjusted for permanent differences in order to reflect their tax character. Permanent reclassifications can arise from differing treatment of certain income and gain transactions and nondeductible current year net operating losses. These adjustments have no impact on net assets or net asset value per share of the Fund. Temporary differences that arise from recognizing certain items of income, expense, gain or loss in different periods for financial statement and tax purposes will likely reverse at some time in the future.
Note 7. Credit and Market Risk and Asset Concentration
Local, regional or global events such as war or military conflict, acts of terrorism, the spread of infectious illness or other public health issue, recessions, or other events could have a significant impact on the Funds and their investments, including hampering the ability of each Fund’s portfolio manager(s) to invest each Fund’s assets as intended.
Emerging market countries typically have economic and political systems that are less fully developed, and can be expected to be less stable than those of more developed countries. For example, the economies of such countries can be subject to rapid and unpredictable
NOTES TO FINANCIAL STATEMENTS (Continued)
November 30, 2024
rates of inflation or deflation. Since these markets are often small, they may be more likely to suffer sharp and frequent price changes or long-term price depression because of adverse publicity, investor perceptions or the actions of a few large investors. They may also have policies that restrict investment by foreigners, or that prevent foreign investors from withdrawing their money at will.
Certain emerging markets may also face other significant internal or external risks, including the risk of war and civil unrest. Each of these factors can affect the value and liquidity of the assets of the Fund. Failure to generate adequate earnings from foreign trade would make it difficult for an emerging market country to service foreign debt. Disruptions resulting from social and political factors may cause the securities markets of emerging market countries to close. If this were to occur, the liquidity and value of each Fund’s assets invested in corporate debt obligations of emerging market companies would decline.
The imposition of sanctions, exchange controls (including repatriation restrictions), confiscation of assets and property, trade restrictions (including tariffs) and other government restrictions by the U.S. or other governments, or from problems in registration, settlement or custody, may also result in losses. The type and severity of sanctions and other similar measures, including counter sanctions and other retaliatory actions, that may be imposed could vary broadly in scope, and their impact is impossible to predict. For example, the imposition of sanctions and other similar measures could, among other things, cause a decline in the value and/or liquidity of securities issued by the sanctioned country or companies located in or economically tied to the sanctioned country and increase market volatility and disruption in the sanctioned country and throughout the world. Sanctions and other similar measures could limit or prevent the Funds from buying and selling securities (in the sanctioned country and other markets), significantly delay or prevent the settlement of securities transactions, and significantly impact each Fund’s liquidity and performance.
Sanctions threatened or imposed may result in a decline in the value and liquidity of each Fund’s assets. The securities of the Funds may be deemed to have a zero value. The Funds may make investments that are illiquid or that may become less liquid in response to market developments or adverse investor perceptions. Illiquid investments may be more difficult to value. If the Funds are forced to sell securities at an unfavorable time and/or under unfavorable conditions, such sales may adversely affect each Fund’s NAV and dilute investors’ interests. Liquidity risk may be the result of, among other things, the reduced number and capacity of traditional market participants to make a market in fixed income securities or the lack of an active market. The potential for liquidity risk may be magnified by a rising interest rate environment or other circumstances where investor redemptions from fixed income funds may be higher than normal, potentially causing increased supply in the market due to selling activity. These risks may be more pronounced in connection with the Funds’ investments in securities of issuers located in emerging market countries.
For all these reasons, investments in emerging markets may be considered speculative. To the extent that the Funds invests a significant portion of its assets in a particular emerging market, the Funds will be more vulnerable to financial, economic, political and other developments in that country, and conditions that negatively impact that country will have a greater impact on the Funds as compared with a fund that does not have its holdings concentrated in a particular country.
High-yield/high-risk securities typically entail greater price volatility and/or principal and
NOTES TO FINANCIAL STATEMENTS (Continued)
November 30, 2024
interest rate risk. There is a greater chance that an issuer will not be able to make principal and interest payments on time. Analysis of the creditworthiness of issuers of high-yield/high-risk securities may be complex, and as a result, it may be more difficult for the Adviser and/or subadviser to accurately predict risk.
The Funds may invest a high percentage of their assets in specific sectors of the market in the pursuit of their investment objectives. Fluctuations in these sectors of concentration may have a greater impact on the Funds, positive or negative, than if the Funds did not concentrate their investments in such sectors.
At November 30, 2024, Total Return Fund Inc. held securities issued by various companies in specific sectors as detailed below:
| Sector | | Percentage of
Total Investments |
| Utilities | | 37% |
Stone Harbor Emerging Markets Income Fund leverages its portfolio through entering into reverse repurchase agreements or the issuance of debt securities. Global Multi-Sector Income Fund and Total Return Fund Inc. borrow through their margin financing facility for the purpose of leveraging their portfolio. While leverage presents opportunities for increasing each Fund’s total return, it also has the effect of potentially increasing losses. Accordingly, any event which adversely affects the value of an investment held by the Funds would be magnified to the extent the Funds are leveraged.
Note 8. Borrowings
($ reported in thousands)
Margin Financing
Global Multi-Sector Income Fund had a Credit Agreement (the “Agreement”), with a commercial bank (the “Bank”) that allowed the Fund to borrow cash from the Bank, up to $55,000 (“Commitment Amount”). Borrowings under the Agreement were collateralized by investments of the Fund. The Agreement resulted in the Fund being subject to certain covenants including asset coverage and portfolio composition (among others). If the Fund failed to meet or maintain certain covenants as required under the Agreement, the Fund could have been required to repay immediately, in part or in full, the loan balance outstanding under the Agreement, necessitating the sale of securities at potentially inopportune times. Interest was charged at SOFR plus an additional percentage rate on the amount borrowed. Commitment fees were charged on the undrawn balance. Total interest and commitment fees accrued from December 1, 2023 through January 4, 2024 were $265 and are included in the “Interest expense on borrowings” line of the Statement of Operations.
As of January 5, 2024, Global Multi-Sector Income Fund entered into a Master Margin Loan Agreement (the “New Agreement”) with a commercial bank (the “New Bank”) that allows the Fund to borrow cash from the New Bank, up to a limit of $55,000 (the “New Commitment Amount”). The New Agreement replaces the Agreement described above. Borrowings under the New Agreement are covered by investments of the Fund. The New Agreement results in the Fund being subject to certain covenants including posting collateral. If the Fund may be required to repay immediately, in part or in full, the borrowed sum, necessitating the sale of securities at potentially inopportune times. Interest is charged at Overnight Bank Funding
NOTES TO FINANCIAL STATEMENTS (Continued)
November 30, 2024
Rate (“OBFR”) plus an additional percentage rate on the amount borrowed, and commitment fees are charged on the undrawn balance, if less than 75% of the New Commitment Amount is borrowed at a given time.
For the year ended November 30, 2024, the Fund had average borrowings of $43,000 with an average interest rate of 6.09%. Interest and commitment fees accrued from January 5, 2024 through November 30, 2024 were $2,391 and $2, respectively, and are included in the “Interest expense on borrowings” line of the Statement of Operations. The carrying value approximates the fair value of the borrowing at November 30, 2024.
Outstanding
Borrowings | | Interest
Rate |
| $43,000 | | 5.43% |
Total Return Fund Inc. has a Master Margin Loan Agreement (the “Agreement”) with a commercial bank (the “Bank”) that allows the Fund to borrow cash from the Bank, up to a limit of $200,000 (the “Commitment Amount”). Prior to May 2, 2024, the Commitment Amount was $235,000. Cash borrowings under the Agreement are secured by assets of the Fund that are held with the Fund’s custodian in a separate account. Interest is charged at the OBFR plus an additional percentage rate on the amount borrowed, and commitment fees are charged on the undrawn balance, if less than 75% of the Commitment Amount is borrowed at a given time. For the fiscal year ended November 30, 2024, the Fund had average borrowings of $176,395 with an average interest rate of 6.06%. For the same period, the interest expense related to the borrowings amounted to $10,831 and is included with in the “Interest expense on borrowings” line on the Statement of Operations. The carrying value approximates fair value of the borrowing at November 30, 2024.
At November 30, 2024, the amount of outstanding borrowings was as follows:
Outstanding
Borrowings | | Interest
Rate |
| $168,300 | | 5.41% |
Reverse Repurchase Agreements
Stone Harbor Emerging Markets Income Fund may borrow from banks and other financial institutions and may also borrow additional funds by entering into reverse repurchase agreements or the issuance of debt securities (collectively, “Borrowings”) in an amount that does not exceed 33 1/3% of the Fund’s Managed Assets (defined in Note 4) immediately after such transactions. It is possible that following such Borrowings, the assets of the Fund will decline due to market conditions such that this 33 1/3% limit will be exceeded. In that case, the leverage risk to Common Shareholders will increase.
In a reverse repurchase agreement, the Fund delivers a security to a financial institution, the counterparty, in exchange for cash with a simultaneous agreement to repurchase the same or substantially the same security at an agreed upon price and date. The Fund is entitled to receive principal and interest payments, if any, made on the security delivered to the counterparty during the term of the agreement. Cash received in exchange for securities delivered plus accrued interest payments to be made by the Fund to counterparties are reflected as a liability on the Statement of Assets and Liabilities. Interest payments made by the Fund to counterparties are recorded as a component of interest expense on the
NOTES TO FINANCIAL STATEMENTS (Continued)
November 30, 2024
Statement of Operations. In periods of increased demand for the security, the Fund may receive a fee for use of the security by the counterparty, which may result in interest income to the Fund. The Fund will segregate assets determined to be liquid to cover its obligations under reverse repurchase agreements. The segregated assets are found on the Fund’s Schedule of Investments as full or partially pledged securities. The total amount of securities pledged and cash collateral pledge at November 30, 2024 was $61,899 and $261, respectively. As all agreements can be terminated by either party on demand, face value approximates fair value at November 30, 2024. For the fiscal year ended November 30, 2024, the average amount of reverse repurchase agreements outstanding was $37,114, at a weighted average interest rate of 5.89%.
The following table indicates the total amount of reverse repurchase agreements, reconciled to gross liability as of November 30, 2024:
| | Overnight & Continuous |
| | |
| Sovereign Debt Obligations | $28,796 |
| Corporate Bonds | 20,758 |
| Total | $49,554 |
| Gross amount of unrecognized liabilities of reverse repurchase agreements |
Note 9. Indemnifications
Under the Funds’ organizational documents, the Funds, Trustees/Directors and officers are indemnified against certain liabilities arising out of the performance of their duties to the Funds. In addition, in the normal course of business, the Funds enter into contracts that provide a variety of indemnifications to other parties. The Funds maximum exposure under these arrangements is unknown as this would involve future claims that may be made against the Funds and that have not occurred. However, the Funds have not had prior claims or losses pursuant to these arrangements and expects the risk of loss to be remote.
Note 10. Capital Shares and Capital Transactions
At November 30, 2024, Global Multi-Sector Income Fund has one class of common stock with no par value of which unlimited shares are authorized and 11,313,094 shares are outstanding.
At November 30, 2024, Stone Harbor Emerging Markets Income Fund has one class of common stock with $0.001 par value of which unlimited shares are authorized and 29,291,260 shares are outstanding.
At November 30, 2024, Total Return Fund Inc. had one class of common stock, par value $0.001 per share, of which 500,000,000 shares are authorized and 61,720,496 shares are outstanding.
On April 2, 2024, Total Return Fund Inc. announced the commencement of a 10% tender offer (6,857,832 shares) at a price equal to 98% of the Fund’s NAV per share as of the close of regular trading on the business day immediately following the day the expiration date of the tender offer. The tender offer expired on May 1, 2024. Total Return Fund Inc. purchased the maximum number of shares covered by the offer price of $5.9976 per share, which
NOTES TO FINANCIAL STATEMENTS (Continued)
November 30, 2024
represented a price equal to 98% of the NAV per share as of the close of trading on the NYSE on May 2, 2024. As a result of the tender offer, $41,131 (reported in thousands) was distributed to shareholders and there was an accretion of $0.02 to the NAV per share of all the outstanding shares after the close of the tender offer.
As announced on March 11, 2024, Total Return Fund Inc.’s Board of Directors approved two additional conditional tender offers. The first conditional tender offer is for up to 10% of the Fund’s then outstanding shares at a price equal to 98% of the Fund’s NAV if the simple average trading discount, calculated using the NYSE closing market price on each day the NYSE is open for trading, is equal to or greater than 12% during the period May 31, 2024 through November 26, 2024. The second conditional tender offer is for up to 10% of the Fund’s then outstanding shares at a price equal to 98% of the Fund’s NAV if the simple average trading discount, calculated using the NYSE closing market price on each day the NYSE is open for trading, is equal to or greater than 10% during the consecutive 180 calendar day period beginning April 1, 2025.
Note 11. Offering of Common Shares
($ reported in thousands)
Stone Harbor Emerging Markets Income Fund has an effective shelf registration statement offering up to $80,000 common shares of beneficial interest, par value $0.001 (“common shares”) (the “Offering”). The common shares may be offered and sold directly to purchasers, through at-the-market offerings using a distributor, or through a combination of these methods. Stone Harbor Emerging Markets Income Fund entered into an agreement with Foreside Fund Services, LLC to serve as the Fund’s distributor (“Distributor”). The Distributor entered into a sub-placement agent agreement with UBS Securities LLC. Initial costs incurred in connection with the Offering are recorded as “Prepaid expenses” on the Statement of Assets and Liabilities. As shares are sold, the portion of the costs attributed to the shares sold are amortized.
For the fiscal year ended November 30, 2024, Stone Harbor Emerging Markets Income Fund issued 101,763 shares, resulting in net proceeds of $509 and amortized $1 in offering costs recorded as a reduction in paid in surplus on common shares.
Note 12. Restricted Securities
Restricted securities are not registered under the Securities Act of 1933, as amended (the “1933 Act”). Generally, 144A securities are excluded from this category. Each Fund will bear any costs, including those involved in registration under the 1933 Act, in connection with the disposition of such securities. At November 30, 2024, the Funds did not hold any securities that were restricted.
Note 13. Reorganization
($ reported in thousands)
On May 22, 2023, the shareholders of Stone Harbor Emerging Markets Fund (the “Acquiring Fund”) approved the issuance of additional common shares in connection with the proposed reorganization of Virtus Stone Harbor Emerging Markets Total Income Fund (the “Acquired Fund”) with and into the Acquiring Fund. Pursuant to an agreement and plan of reorganization, the Acquiring Fund acquired substantially all of the assets and assumed substantially all of the liabilities of the Acquired Fund in exchange for an equal aggregate
NOTES TO FINANCIAL STATEMENTS (Continued)
November 30, 2024
value of the Acquiring Fund’s shares. The Acquiring Fund is the legal and accounting survivor out of the reorganization.
Each shareholder of the Acquired Fund received shares of the Acquiring Fund equal to the NAV of their Acquired Fund shares, as determined at the close of business on December 15, 2023. The reorganization was accomplished by a tax-free exchange of shares and was effective after the close of business on December 15, 2023. The share transactions associated with the reorganization are as follows:
Acquired Fund
Shares Outstanding | | Shares Converted
to the Acquiring Fund | | Acquired Fund
Net Assets | | Conversion
Ratio |
| 10,053,109 | | 11,598,599 | | $51,054* | | 1.153733 |
* Includes net unrealized depreciation of $(2,434) at the close of business on December 15, 2023.
The net assets and composition of net assets for the Fund on December 15, 2023, were as follows:
Acquiring Fund’s Net
Assets | | Common Stock
($0.001 par value
unlimited shares
authorized) | | Capital paid in
on shares of
beneficial interest | | Total distributable
earnings
(accumulated
losses) |
| $76,378 | | $17 | | $224,724 | | $(148,363) |
For financial reporting purposes, assets received and shares issued by the Acquiring Fund were recorded at fair value; however, the cost basis of the investments received from the Acquired Fund was carried forward to align ongoing reporting of the Acquiring Fund’s realized and unrealized gains and losses with amounts distributable to shareholders for tax purposes. The aggregate net assets of the Acquiring Fund immediately after the acquisition amounted to $127,432.
Assuming the acquisition had been completed on December 1, 2023, the beginning of the fiscal period of the Acquiring Fund, the pro forma results of operations for the period ended November 30, 2024 would have been as follows:
Net investment income (loss)
| $13,157 (a) |
Net realized and unrealized gain (loss) on investments
| 21,194 (b) |
Net increase (decrease) in net assets resulting from operations
| $34,351 |
(a) $12,964, as reported in the Statement of Operations, plus $193 net investment income from the Acquired Fund pre-reorganization.
(b) $19,682, as reported in the Statement of Operations, plus $1,512 net realized and unrealized gain (loss) on investments from the Acquired Fund pre-merger.
Because the Acquiring Fund and the Acquired Fund have been managed as an integrated single fund since the merger was completed, it is also not feasible to separate the
NOTES TO FINANCIAL STATEMENTS (Continued)
November 30, 2024
income/(losses) and gains/(losses) of the Acquired Fund that have been included in the Acquiring Fund’s Statement of Operations since December 15, 2023.
Note 14. Regulatory Matters and Litigation
From time to time, the Funds, the Adviser, the subadvisers, and/or their respective affiliates may be involved in litigation and arbitration as well as examinations and investigations by various regulatory bodies, including the SEC, involving compliance with, among other things, securities laws, client investment guidelines, and laws and regulations affecting their activities. At this time, the Funds and the Adviser believe that the outcomes of such matters are not likely, either individually or in the aggregate, to be material to these financial statements.
Note 15. Recent Accounting Pronouncements
In November 2023, the FASB issued Accounting Standards Update (ASU), ASU 2023-07, Segment Reporting (Topic 280) – Improvements to Reportable Segment Disclosures, which improves reportable segment disclosure requirements, primarily through enhanced disclosures about segment expenses. In addition, the ASU clarifies that a public entity with a single reportable segment provide all disclosures required by the ASU and all existing segment disclosures in Topic 280. The amendments under this ASU are effective for fiscal years beginning after December 15, 2023. Management is assessing the impact of this guidance on the funds’ financial statements.
Note 16. Subsequent Events
Management has evaluated the impact of all subsequent events on the Funds through the date the financial statements were available for issuance, and has determined that the following events require recognition or disclosure in these financial statements.
On December 2, 2024, Total Return Fund Inc. announced it met the conditions to trigger its first conditional tender offer (“Tender Offer”) to acquire another 10% of the Fund’s outstanding shares. The Tender Offer period commenced January 7, 2025 and will expire on or about February 6, 2025 (“Expiration date”), unless extended. Under this Tender Offer, the Fund will seek to acquire 10% of its then outstanding shares in exchange for cash at a price equal to 98% of its NAV (net of expenses related to the Tender Offer) as of the close of regular trading on the Expiration date.
On January 2, 2025, effective January 1, 2025, Stone Harbor Emerging Markets Income Fund (“EDF”) announced that as a result of a company legal entity transition, Virtus Investment Advisers, LLC (“VIA”) has replaced Virtus Alternative Investment Advisers, Inc. (“VAIA”) as the Fund’s Adviser. As a result, VAIA’s rights and obligations under the investment advisory, subadvisory and expense limitation agreements for EDF have been transferred to, and assumed by, VIA. Both VIA and VAIA are wholly owned indirect subsidiaries of Virtus Investment Partners, Inc. No changes have been made to the investment advisory fees payable by EDF, the subadviser, or the portfolio managers managing EDF.
Report of Independent Registered Public Accounting Firm
To the Board of Trustees and Shareholders of Virtus Global Multi-Sector Income Fund and Virtus Stone Harbor Emerging Markets Income Fund and Board of Directors and Shareholders of Virtus Total Return Fund Inc.
Opinions on the Financial Statements
We have audited the accompanying statements of assets and liabilities, including the schedules of investments, of Virtus Global Multi-Sector Income Fund, Virtus Stone Harbor Emerging Markets Income Fund, and Virtus Total Return Fund Inc. (the “Funds”) as of November 30, 2024, the related statements of operations and cash flows for the year ended November 30, 2024, the statements of changes in net assets for each of the two years in the period ended November 30, 2024, including the related notes, and the financial highlights for each of the five years in the period ended November 30, 2024 for Virtus Global Multi-Sector Income Fund and Virtus Total Return Fund Inc. and for each of the two years in the period ended November 30, 2024 for Virtus Stone Harbor Emerging Markets Income Fund (collectively referred to as the “financial statements”). In our opinion, the financial statements present fairly, in all material respects, the financial position of each of the Funds as of November 30, 2024, the results of each of their operations and each of their cash flows for the year then ended, the changes in each of their net assets for each of the two years in the period ended November 30, 2024 and each of their financial highlights for each of the five years in the period ended November 30, 2024 for Virtus Global Multi-Sector Income Fund and Virtus Total Return Fund Inc. and for each of the two years in the period ended November 30, 2024 for Virtus Stone Harbor Emerging Markets Income Fund in conformity with accounting principles generally accepted in the United States of America.
The financial statements of Virtus Stone Harbor Emerging Markets Income Fund as of and for the year ended November 30, 2022 and the financial highlights for each of the periods ended on or prior to November 30, 2022 (not presented herein, other than the financial highlights) were audited by other auditors whose report dated January 27, 2023 expressed an unqualified opinion on those financial statements and financial highlights.
Basis for Opinions
These financial statements are the responsibility of the Funds’ management. Our responsibility is to express an opinion on the Funds’ financial statements based on our audits. We are a public accounting firm registered with the Public Company Accounting Oversight Board (United States) (PCAOB) and are required to be independent with respect to the Funds in accordance with the U.S. federal securities laws and the applicable rules and regulations of the Securities and Exchange Commission and the PCAOB.
We conducted our audits of these financial statements in accordance with the standards of the PCAOB. Those standards require that we plan and perform the audit to obtain
reasonable assurance about whether the financial statements are free of material misstatement, whether due to error or fraud.
Our audits included performing procedures to assess the risks of material misstatement of the financial statements, whether due to error or fraud, and performing procedures that respond to those risks. Such procedures included examining, on a test basis, evidence regarding the amounts and disclosures in the financial statements. Our audits also included evaluating the accounting principles used and significant estimates made by management, as well as evaluating the overall presentation of the financial statements.
Our procedures included confirmation of securities owned as of November 30, 2024 by correspondence with the custodian, transfer agent, agent banks and brokers; when replies were not received from brokers, we performed other auditing procedures. We believe that our audits provide a reasonable basis for our opinions.
/s/ PricewaterhouseCoopers LLP
Philadelphia, Pennsylvania
January 24, 2025
We have served as the auditor of one or more of the investment companies in the Virtus group of investment companies since at least 1977. We have not been able to determine the specific year we began serving as auditor.
TAX INFORMATION NOTICE (Unaudited)
November 30, 2024
The following information ($ reported in thousands) is being provided in order to meet reporting requirements set forth by the Code and/or to meet state specific requirements. In early 2025, the Funds will notify applicable shareholders of amounts for use in preparing 2024 U.S. federal income tax forms. Shareholders should consult their tax advisors.
With respect to distributions paid during the fiscal year ended November 30, 2024, the Fund designates the following amounts (or, if subsequently determined to be different, the maximum amount allowable):
| | QDI | | DRD | | Long-Term
Capital Gain
Distributions ($) |
Total Return Fund Inc.
| 100.00% | | 77.83 % | | $ 0 |
CERTIFICATION
Each Fund files the required annual Chief Executive Officer (“CEO”) certification regarding compliance with the NYSE’s listing standards no more than 30 days after each annual shareholder meeting for the Fund. Each Fund has included the certifications of the Fund’s CEO and Principal Financial Officer required by Section 302 of the Sarbanes-Oxley Act in the Fund’s Form N-CSR filed with the SEC for the period of this report.
KEY INFORMATION
Shareholder Relations: 1-866-270-7788
For general information and literature, as well as updates on net asset value, share price, major industry groups and other key information.
REINVESTMENT PLAN
The Dividend Reinvestment Plan offers shareholders of Stone Harbor Emerging Markets Income Fund a convenient way to acquire additional shares of the Fund. Registered holders will be automatically placed in the Dividend Reinvestment Plan and may opt out by calling Shareholder Relations at the number listed above. If shares are held at a brokerage firm, contact your broker about participation in the Dividend Reinvestment Plan.
The Automatic Reinvestment and Cash Purchase Plan and Dividend Reinvestment Plan (the “Plan”) offers shareholders of Global Multi-Sector Income Fund and Total Return Fund, a convenient way to acquire additional shares of the Funds. Registered holders will be automatically placed in the Plan and may opt out by calling Shareholder Relations at the number listed above. If shares are held at a brokerage firm, contact your broker about participation in the Plan.
REPURCHASE OF SECURITIES
Notice is hereby given in accordance with Section 23(c) of the 1940 Act that each Fund may from time to time purchase its shares of common stock in the open market when Fund shares are trading at a discount from their net asset value.
PROXY VOTING INFORMATION (FORM N-PX)
The subadviser votes proxies relating to portfolio securities in accordance with procedures that have been approved by each Fund’s Board. You may obtain a description of these procedures, along with information regarding how each Fund voted proxies during the most recent 12-month period ended June 30, free of charge, by calling toll-free 1-866-270-7788. This information is also available through the SEC’s website at https://www.sec.gov.
PORTFOLIO HOLDINGS INFORMATION
Each Fund files its complete schedule of portfolio holdings with the SEC for the first and third quarters of each fiscal year as an exhibit to its reports on Form NPORT-P. Form NPORT-P is available on the SEC’s website at https://www.sec.gov.
ADDITIONAL INFORMATION
Since November 30, 2023: (i) there have been no material changes in the Funds’ investment objectives or policies that have not been approved by the shareholders; (ii) there have been no changes in the Funds’ charter or by-laws that would delay or prevent a change in control of the Funds’ which have not been approved by the shareholders; (iii) there have been no material changes in the principal risk factors associated with an investment in the Funds; and (iv) there have been no changes in the persons who are primarily responsible for the day-to-day management of Global Multi-Sector Income Fund’s portfolio. On March 1, 2024, Stone Harbor Emerging Markets Income Fund announced it added Darin Batchman and Richard Lange to its team of investment professionals. Darin Batchman, with 23 years of experience, and Richard Lange, with 18 years of experience, both serve as portfolio managers in emerging markets corporate debt at Stone Harbor Investment Partners, the Fund’s subadviser. In addition, on August 13, 2024, the Fund announced that Peter Wilby, CFA, and Kumaran Damodaran, Ph.D., would step down as portfolio managers effective September 30, 2024, and on December 11, 2024, the Fund announced that David A. Oliver would step down as portfolio manager effective December 31, 2024. On March 1, 2024, Total Return Fund Inc. announced it added Rodney C. Clayton, CFA, and Steven Wittwer, CFA to its portfolio investment team. Rodney Clayton is a portfolio manager and senior research analyst and Steven Wittwer is an executive managing director and senior portfolio manager at Duff & Phelps Investment Management Co., a subadviser to the Fund.
Additional information relating to the Funds’ Trustees/Directors and officers, and any other information found elsewhere in this annual report, may be requested by contacting the Funds at the address provided on the back cover of this report.
GLOBAL MULTI-SECTOR INCOME FUND
INVESTMENT OBJECTIVE, PRINCIPAL STRATEGIES AND PRINCIPAL RISKS (Unaudited)
Investment Objective: The Fund’s investment objective is to maximize current income while preserving capital.
Principal Strategies:
The Fund seeks to generate high current income and total return by applying extensive credit research to capitalize on opportunities across undervalued sectors of the global bond markets.
The portfolio seeks global diversification among 14 sectors in order to potentially increase return and manage risk.
Principal Risks:
Credit: There is a risk that the issuer of a debt instrument will fail to pay interest or principal in a timely manner, or that negative perceptions of the issuer’s ability to make such payments will cause the price of the instrument to decline. Debt instruments rated below investment-grade are especially susceptible to this risk.
Interest Rate: The values of debt instruments usually rise and fall in response to changes in interest rates. Declining interest rates generally increase the value of existing debt instruments, and rising interest rates generally decrease the value of existing debt instruments. Changes in a debt instrument’s value usually will not affect the amount of interest income paid to the Fund, but will affect the value of the Fund’s shares. Interest rate risk is generally greater for investments with longer maturities.
Certain instruments pay interest at variable or floating rates. Variable rate instruments reset at specified intervals, while floating rate instruments reset whenever there is a change in a specified index rate. In most cases, these reset provisions reduce the effect of changes in market interest rates on the value of the instrument. However, some instruments do not track the underlying index directly, but reset based on formulas that can produce an effect similar to leveraging; others may also provide for interest payments that vary inversely with market rates. The market prices of these instruments may fluctuate significantly when interest rates change.
Some investments give the issuer the option to call or redeem an investment before its maturity date. If an issuer calls or redeems an investment during a time of declining interest rates, the Fund might have to reinvest the proceeds in an investment offering a lower yield, and therefore it might not benefit from any increase in value as a result of declining interest rates.
Management: The Fund is subject to management risk because it is an actively managed investment portfolio. The subadviser’s judgments about the attractiveness and potential appreciation of an investment may prove to be inaccurate and may not produce the desired results. The subadviser will apply its investment techniques and risk analyses in making investment decisions for the Fund, but there is no guarantee that its decisions will produce the intended result.
Foreign Investing: Investing in securities of non-U.S. companies involves special risks and considerations not typically associated with investing in U.S. companies, and the values of non-U.S. securities may be more volatile than those of U.S. securities. The values of non-U.S. securities are subject to economic and political developments in countries and regions where the issuers operate or are domiciled, or where the securities are traded, such as changes in economic or monetary policies, and to changes in currency exchange rates. Values may also be affected by restrictions on receiving the investment proceeds from a non-U.S. country.
GLOBAL MULTI-SECTOR INCOME FUND
INVESTMENT OBJECTIVE, PRINCIPAL STRATEGIES AND PRINCIPAL RISKS (Unaudited) (Continued)
Emerging Markets: The risks of foreign investments are generally greater in countries whose markets are still developing than they are in more developed markets. Emerging market countries typically have economic and political systems that are less fully developed, and can be expected to be less stable than those of more developed countries. For example, the economies of such countries can be subject to rapid and unpredictable rates of inflation or deflation. Since these markets are often small, they may be more likely to suffer sharp and frequent price changes or long-term price depression because of adverse publicity, investor perceptions or the actions of a few large investors. They may also have policies that restrict investment by foreigners, or that prevent foreign investors from withdrawing their money at will. Certain emerging markets may also face other significant internal or external risks, including the risk of war and civil unrest. For all of these reasons, investments in emerging markets may be considered speculative. To the extent that the Fund invests a significant portion of its assets in a particular emerging market, the Fund will be more vulnerable to financial, economic, political and other developments in that country, and conditions that negatively impact that country will have a greater impact on the Fund as compared with a fund that does not have its holdings concentrated in a particular country.
Sanctions: The imposition of sanctions and other similar measures could cause a decline in the value and/or liquidity of securities issued by or tied to the sanctioned country and increase market volatility and disruption in the sanctioned country and throughout the world. Sanctions and other similar measures could limit or prevent the Fund from buying and selling securities (in the sanctioned country and other markets), significantly delay or prevent the settlement of transactions, and negatively impact the Fund’s liquidity and performance.
High Yield Fixed Income Securities: Securities rated below the four highest rating categories of a nationally recognized statistical rating organization, may be known as “high-yield” securities and commonly referred to as “junk bonds.” The highest of the ratings among these nationally recognized statistical rating organizations is used to determine the security’s classification. Such securities entail greater price volatility and credit and interest rate risk than investment-grade securities. Analysis of the creditworthiness of high-yield/high-risk issuers is more complex than for higher-rated securities, making it more difficult for the Fund’s subadviser to accurately predict risk. There is a greater risk with high-yield/high-risk fixed income securities that an issuer will not be able to make principal and interest payments when due. If the Fund pursues missed payments, there is a risk that the Fund’s expenses could increase. In addition, lower-rated securities may not trade as often and may be less liquid than higher-rated securities, especially during periods of economic uncertainty or change. As a result of all of these factors, these bonds are generally considered to be speculative.
Asset-Backed and Mortgage-Backed Securities: Mortgage-backed securities represent interests in pools of residential mortgage loans purchased from individual lenders by a federal agency or originated and issued by private lenders. Asset-backed securities represent interests in pools of underlying assets such as motor vehicle installment sales or installment loan contracts, leases of various types of real and personal property, and receivables from credit card arrangements. These two types of securities share many of the same risks. The impairment of the value of collateral or other assets underlying a mortgage-backed or asset-backed security, such as that resulting from non-payment of loans, may result in a reduction in the value of such security and losses to the Fund.
Early payoffs in the loans underlying such securities may result in the Fund receiving less income than originally anticipated. The variability in prepayments will tend to limit price gains
GLOBAL MULTI-SECTOR INCOME FUND
INVESTMENT OBJECTIVE, PRINCIPAL STRATEGIES AND PRINCIPAL RISKS (Unaudited) (Continued)
when interest rates drop and exaggerate price declines when interest rates rise. In the event of high prepayments, the Fund may be required to invest proceeds at lower interest rates, causing the Fund to earn less than if the prepayments had not occurred. Conversely, rising interest rates may cause prepayments to occur at a slower than expected rate, which may effectively change a security that was considered short- or intermediate-term into a long-term security. Long-term securities tend to fluctuate in value more widely in response to changes in interest rates than shorter-term securities.
Bank Loans: Investing in loans (including floating rate loans, loan assignments, loan participations and other loan instruments) carries certain risks in addition to the risks typically associated with high-yield/high-risk fixed income securities. Loans may be unsecured or not fully collateralized, may be subject to restrictions on resale and sometimes trade infrequently on the secondary market. In the event a borrower defaults, the Fund’s access to the collateral may be limited or delayed by bankruptcy or other insolvency laws. There is a risk that the value of the collateral securing the loan may decline after the Fund invests and that the collateral may not be sufficient to cover the amount owed to the Fund. If the loan is unsecured, there is no specific collateral on which the Fund can foreclose. In addition, if a secured loan is foreclosed, the Fund may bear the costs and liabilities associated with owning and disposing of the collateral, including the risk that collateral may be difficult to sell. Certain loans may not be considered “securities,” and purchasers, such as the Fund, therefore may not be entitled to rely on the strong anti-fraud protections of the federal securities laws. With loan participations, the Fund may not be able to control the exercise of any remedies that the lender would have under the loan and likely would not have any rights against the borrower directly, so that delays and expense may be greater than those that would be involved if the Fund could enforce its rights directly against the borrower.
Transactions in many loans settle on a delayed basis that may take more than seven days. As a result, sale proceeds related to the sale of loans may not be available until potentially a substantial period of time after the sale of the loans. No active trading market may exist for some loans, which may impact the ability of the Fund to realize full value in the event of the need to liquidate such assets. Adverse market conditions may impair the liquidity of some actively traded loans. Loans also may be subject to restrictions on resale, which can delay the sale and adversely impact the sale price. Difficulty in selling a loan can result in a loss. Loans made to finance highly leveraged corporate acquisitions may be especially vulnerable to adverse changes in economic or market conditions.
Leverage: The Fund employs leverage through a line of credit. While this leverage often serves to increase yield, it also subjects the Fund to increased risks. These risks may include the likelihood of increased price and NAV volatility and the possibility that the Fund’s common stock income will fall if the interest rate on any borrowings rises. The use of leverage is premised upon the expectation that the cost of leverage will be lower than the return on the investments made with the proceeds. However, if the income or capital appreciation from the securities purchased with such proceeds is not sufficient to cover the cost of leverage or if the Fund incurs capital losses, the return to common stockholders will be less than if the leverage had not been used. There can be no assurance that a leveraging strategy will be successful during any period in which it is employed.
Market Volatility: The value of the securities in which the Fund invests may go up or down in response to the prospects of individual companies and/or general economic conditions. Price changes may be temporary or may last for extended periods. Local, regional, or global events
GLOBAL MULTI-SECTOR INCOME FUND
INVESTMENT OBJECTIVE, PRINCIPAL STRATEGIES AND PRINCIPAL RISKS (Unaudited) (Continued)
such as war (e.g., Russia’s invasion of Ukraine), acts of terrorism, the spread of infectious illness (e.g., COVID-19 pandemic) or other public health issues, recessions, or other events could have a significant impact on the Fund and its investments, including hampering the ability of the Fund’s portfolio managers to invest the Fund’s assets as intended.
Closed-End Funds: Closed-end funds may trade at a discount or premium from their net asset values, which may affect whether an investor will realize gains or losses. They may also
employ leverage, which may increase volatility.
No Guarantee: There is no guarantee that the Fund will meet its objective.
STONE HARBOR EMERGING MARKETS INCOME FUND
INVESTMENT OBJECTIVE, PRINCIPAL STRATEGIES AND PRINCIPAL RISKS (Unaudited)
The Fund’s investment objective is to maximize total return, which consists of income on its investments and capital appreciation. The Fund normally will invest at least 80% of its net assets (plus any borrowings for investment purposes) in Emerging Markets Securities (the “80% policy”). “Emerging Markets Securities” include fixed income securities and other instruments (including derivatives) that are economically tied to emerging market countries, that are denominated in the predominant currency of the local market of an emerging market country or whose performance is linked to those countries’ markets, currencies, economies or ability to repay loans. A security or instrument is economically tied to an emerging market country if it is principally traded on the country’s securities markets or if the issuer is organized or principally operates in the country, derives a majority of its income from its operations within the country or has a majority of its assets within the country.
The Fund considers emerging market countries as those countries identified by the World Bank Group as being “low income economies” or which are included in a J.P. Morgan emerging market bond index. It is anticipated that the Fund will focus most of its investments in Asia, Africa, the Middle East, Latin America and the developing countries of Europe. The Fund’s investments may include, among other things, sovereign debt obligations, corporate debt securities, structured notes, convertible securities, securities issued by supranational organizations, floating rate commercial loans, securitized loan participations, restricted securities, non-U.S. currencies, currency forward contracts and other foreign currency transactions, and derivatives related to or referencing these types of securities and instruments. The Fund may use derivatives to a significant extent for hedging, investment or leverage purposes. Although Emerging Markets Securities may include any derivative or other instrument that provides the Fund exposure to emerging markets, the Fund currently expects that its derivatives transactions or instruments will consist primarily of the following instruments and transactions: credit linked notes, foreign currency forward contracts, credit default swaps, interest rate swaps, total return swaps on individual securities and groups or indices of securities, and interest rate futures contracts and options. The Fund may use these instruments for hedging purposes, for leverage or otherwise to gain, or reduce, long or short exposure to emerging securities markets (for example, credit linked notes may be used to gain exposure to certain emerging markets fixed income securities). Emerging Markets Securities may be denominated in non-U.S. currencies or the U.S. dollar.
The Fund seeks income and capital appreciation through country selection, sector selection, security selection and currency selection. In selecting Emerging Markets Securities for investment, the Fund’s subadviser will apply a market risk analysis contemplating the assessment of various factors, such as liquidity, volatility, tax implications, interest rate sensitivity, counterparty risks, economic factors, currency exchange rates and technical market considerations.
The Fund may invest, without limitation, in debt securities that are rated below investment grade by a nationally recognized statistical rating organization or unrated securities that are deemed to be of comparable quality by the Fund’s subadviser, including defaulted securities. Debt securities rated below investment grade are commonly known as “junk bonds” and are regarded as predominantly speculative with respect to the issuer’s capacity to pay interest and repay principal in accordance with the terms of the obligations and involve major risk exposure to adverse conditions.
The Fund’s holdings may range in maturity from overnight to 30 years or more. The Fund’s subadviser does not manage the Fund to have a specific average maturity or duration. The
STONE HARBOR EMERGING MARKETS INCOME FUND
INVESTMENT OBJECTIVE, PRINCIPAL STRATEGIES AND PRINCIPAL RISKS (Unaudited) (Continued)
Fund may also invest in currencies, money market and short-term debt securities and cash equivalents, warrants, structured investments or other derivatives, which may be used to maintain exposure of at least 80% of its net assets (plus borrowings for investment purposes) to Emerging Markets Securities. Under certain limited circumstances, the Fund may obtain substantially all of its investment exposure to Emerging Markets Securities through the use of derivatives.
The Fund intends to invest less than 50% of its assets in a single country.
In addition, the Fund may invest the remainder of its assets in securities which will not be used to achieve the Fund’s 80% policy, such as shares of open- and closed-end investment companies, common stocks, bonds and convertible securities.
The Fund’s investment objective and 80% policy are non-fundamental, and may be changed without shareholder approval; however, shareholders will be notified in writing of any material changes to the investment objective or the 80% policy at least 60 days prior to any change. There have been no changes to the Fund’s investment objectives and policies during the reporting period. This information may not reflect all of the changes that have occurred since you purchased the Fund.
The Fund may borrow from banks and other financial institutions and may also borrow additional funds through reverse repurchase agreements or the issuance of debt securities (collectively, “Borrowings”) Under normal market conditions, the Fund intends to leverage the Fund by engaging in Borrowings and/or issuing preferred shares. The aggregate amount of the Fund’s Borrowings and the liquidation value of any preferred shares will generally not exceed 33 1/3% of the Fund’s Managed Assets measured immediately after the transaction giving rise to the leverage. The Fund may also enter into other transactions that are not subject to this 33 1/3% threshold but that may give rise to a form of leverage including, among others, credit default swaps and other derivatives transactions, loans of portfolio securities and when-issued, delayed delivery or forward commitment transactions. At all times, however, the Fund’s use of these transactions will be limited by the Fund’s policies relating to asset segregation and “coverage” of these types of transactions.
Principal Risk Factors
Investing in the Fund involves risks, including the risk that you may receive little or no return on your investment or that you may lose part or even all of your investment.
Non-Diversification: As a non-diversified investment company, the Fund is not limited in the proportion of assets that it may invest in the securities of any one issuer. If the Fund takes concentrated positions in a small number of issuers, the Fund may be more susceptible to the risks associated with those issuers, or to a single economic, political, regulatory or other event affecting those issuers.
Management: The Fund is subject to management risk because it is an actively managed investment portfolio. The subadviser ’s judgments about the attractiveness and potential appreciation of an investment may prove to be inaccurate and may not produce the desired results. The subadviser will apply its investment techniques and risk analyses in making investment decisions for the Fund, but there is no guarantee that its decisions will produce the intended result.
STONE HARBOR EMERGING MARKETS INCOME FUND
INVESTMENT OBJECTIVE, PRINCIPAL STRATEGIES AND PRINCIPAL RISKS (Unaudited) (Continued)
Market Volatility: The value of the securities in which the Fund invests may go up or down in response to the prospects of individual issuers and/or general economic conditions. Such price changes may be temporary or may last for extended periods. Local, regional, or global events such as war (e.g., Russia’s invasion of Ukraine), acts of terrorism, the spread of infectious illness (e.g., COVID-19 pandemic) or other public health issues, recessions, or other events could have a significant impact on the Fund and its investments, including hampering the ability of the Fund’s portfolio managers to invest the Fund’s assets as intended.
Foreign Investing: Investing in securities of non-U.S. companies involves special risks and considerations not typically associated with investing in U.S. companies, and the values of non-U.S. securities may be more volatile than those of U.S. securities. The values of non-U.S. securities are subject to economic and political developments in countries and regions where the issuers operate or are domiciled, or where the securities are traded, such as changes in economic or monetary policies, and to changes in currency exchange rates. Values may also be affected by restrictions on receiving the investment proceeds from a non-U.S. country.
In general, less information is publicly available about non-U.S. companies than about U.S. companies. Non-U.S. companies are generally not subject to the same accounting, auditing and financial reporting standards as are U.S. companies. Certain foreign issuers classified as passive foreign investment companies may be subject to additional taxation risk.
Emerging Market Investing: The risks of foreign investments are generally greater in countries whose markets are still developing than they are in more developed markets. Emerging market countries typically have economic and political systems that are less fully developed, and can be expected to be less stable than those of more developed countries. For example, the economies of such countries can be subject to rapid and unpredictable rates of inflation or deflation. Since these markets are often small, they may be more likely to suffer sharp and frequent price changes or long-term price depression because of adverse publicity, investor perceptions or the actions of a few large investors. They may also have policies that restrict investment by foreigners, or that prevent foreign investors from withdrawing their money at will. Certain emerging markets may also face other significant internal or external risks, including the imposition of sanctions, the risk of war and civil unrest. For all of these reasons, investments in emerging markets may be considered speculative. To the extent that the Fund invests a significant portion of its assets in a particular emerging market, the Fund will be more vulnerable to financial, economic, political and other developments in that country, and conditions that negatively impact that country will have a greater impact on the Fund as compared with a fund that does not have its holdings concentrated in a particular country.
Sanctions: The imposition of sanctions and other similar measures could cause a decline in the value and/or liquidity of securities issued by or tied to the sanctioned country and increase market volatility and disruption in the sanctioned country and throughout the world. Sanctions and other similar measures could limit or prevent the Fund from buying and selling securities (in the sanctioned country and other markets), significantly delay or prevent the settlement of transactions, and negatively impact the Fund’s liquidity and performance.
Currency Rate: Because the foreign securities in which the Fund invests generally trade in currencies other than the U.S. dollar, changes in currency exchange rates will affect the Fund’s net asset value, the value of dividends and interest earned, and gains and losses realized on the sale of securities. Because the value of the Fund’s shares is calculated in U.S. dollars, it is possible for the Fund to lose money by investing in a foreign security if the local currency of a
STONE HARBOR EMERGING MARKETS INCOME FUND
INVESTMENT OBJECTIVE, PRINCIPAL STRATEGIES AND PRINCIPAL RISKS (Unaudited) (Continued)
foreign market depreciates against the U.S. dollar, even if the local currency value of the Fund’s holdings goes up. Generally, a strong U.S. dollar relative to such other currencies will adversely affect the value of the Fund’s holdings in foreign securities.
Foreign Currency Transactions: The Fund may engage in foreign currency transactions, including foreign currency forward contracts, options, swaps and other similar strategic transactions. These transactions may be for the purposes of hedging or efficient portfolio management, or may be for investment purposes, and they may be exchange traded or traded directly with market counterparties. Such transactions may not prove successful or may have the effect of limiting gains from favorable markets movements.
The Fund may use derivatives to acquire positions in various currencies, which presents the risk that the Fund could lose money on its exposure to a particular currency and also lose money on the derivative. The Fund also may take positions in currencies that do not correlate to the currency exposure presented by the Fund’s other investments. As a result, the Fund’s currency exposure may differ, in some cases significantly, from the currency exposure of its other investments and/or its benchmarks.
Sovereign Debt Obligations: When the Fund invests in debt instruments issued by a government outside the U.S., the Fund is exposed to the risks that: (a) the governmental entity that controls the repayment of government debt may not be willing or able to repay the principal and/or to pay the interest when it becomes due, due to factors such as political considerations, the relative size of the governmental entity’s debt position in relation to the economy, cash flow problems, insufficient foreign currency reserves, the failure to put in place economic reforms required by the International Monetary Fund or other multilateral agencies, and/or other national economic factors; (b) the issuing government may default on its debt instruments, which may require holders of such securities to participate in debt rescheduling; and (c) there is no legal or bankruptcy process by which defaulted government debt may be collected in whole or in part.
Credit: There is a risk that the issuer of a debt instrument will fail to pay interest or principal in a timely manner, or that negative perceptions of the issuer’s ability to make such payments will cause the price of the instrument to decline. Debt instruments rated below investment-grade are especially susceptible to this risk.
Interest Rate: The values of debt instruments usually rise and fall in response to changes in interest rates. Declining interest rates generally increase the value of existing debt instruments, and rising interest rates generally decrease the value of existing debt instruments. Changes in a debt instrument’s value usually will not affect the amount of interest income paid to the Fund, but will affect the value of the Fund’s shares. Interest rate risk is generally greater for investments with longer maturities. It is difficult to predict the pace at which central banks or monetary authorities may change interest rates or the timing, frequency, or magnitude of such changes. Any such changes could be sudden and could expose debt markets to significant volatility and reduced liquidity for investments.
Certain instruments pay interest at variable or floating rates. Variable rate instruments reset at specified intervals, while floating rate instruments reset whenever there is a change in a specified index rate. In most cases, these reset provisions reduce the effect of changes in market interest rates on the value of the instrument. However, some instruments do not track the underlying index directly, but reset based on formulas that can produce an effect similar to
STONE HARBOR EMERGING MARKETS INCOME FUND
INVESTMENT OBJECTIVE, PRINCIPAL STRATEGIES AND PRINCIPAL RISKS (Unaudited) (Continued)
leveraging; others may also provide for interest payments that vary inversely with market rates. The market prices of these instruments may fluctuate significantly when interest rates change.
Some investments give the issuer the option to call or redeem an investment before its maturity date. If an issuer calls or redeems an investment during a time of declining interest rates, the Fund might have to reinvest the proceeds in an investment offering a lower yield, and therefore it might not benefit from any increase in value as a result of declining interest rates.
Derivatives: Derivative are contracts whose value is derived from the value of an underlying asset, index or rate, including futures, options, non-deliverable forwards, forward foreign currency exchange contracts and swap agreements. The Fund may use derivatives to hedge against factors that affect the value of its investments, such as interest rates and foreign currency exchange rates. The Fund may also utilize derivatives as part of its overall investment technique to gain or lessen exposure to various securities, markets, volatility, dividend payments and currencies.
Derivatives typically involve greater risks than traditional investments. It is generally more difficult to ascertain the risk of, and to properly value, derivative contracts. Many derivatives, and particularly those that are privately negotiated, are complex and often valued subjectively. Improper valuations can result in increased cash payment requirements to counterparties or a loss of value to the Fund. The prices of derivatives may move in unexpected ways, especially in abnormal market conditions. Derivatives are usually less liquid than traditional securities and are subject to counterparty risk (the risk that the other party to the contract will default or otherwise not be able to perform its contractual obligations). In addition, some derivatives transactions may involve potentially unlimited losses.
Derivative contracts entered into for hedging purposes may also subject the Fund to losses if the contracts do not correlate with the assets, indexes or rates they were designed to hedge. Gains and losses derived from hedging transactions are, therefore, more dependent upon the subadviser’s ability to correctly predict the movement of the underlying asset prices, indexes or rates.
As an investment company registered with the SEC, the Fund is subject to Rule 18f-4 under the 1940 Act, which applies to the Fund’s use of derivative investments and certain financing transactions (e.g., reverse repurchase agreements). Among other things, Rule 18f-4 requires a fund to apply a value-at-risk based limit to its use of certain derivative instruments and financing transactions and to adopt and implement a derivatives risk management program. The application of Rule 18f-4 to the Fund could restrict the Fund’s ability to utilize derivative investments and financing transactions and prevent the Fund from implementing its principal investment strategies as described herein, which may result in changes to the Fund’s principal investment strategies and could adversely affect the Fund’s performance and its ability to achieve its investment objective. Governments, agencies and/or other regulatory bodies may further adopt or change laws or regulations that could adversely affect the Fund’s ability to invest in derivatives as the Fund’s subadviser intends.
There are also special tax rules applicable to certain types of derivatives, which could affect the amount, timing and character of the Fund’s income or loss and hence of its distributions to shareholders by causing holding period adjustments, converting short-term capital losses into long-term capital losses, and accelerating the Fund’s income or deferring its losses. The Fund’s use of derivatives may also increase the amount of taxes payable by shareholders or
STONE HARBOR EMERGING MARKETS INCOME FUND
INVESTMENT OBJECTIVE, PRINCIPAL STRATEGIES AND PRINCIPAL RISKS (Unaudited) (Continued)
the resources required by the Fund or its adviser and/or subadviser to comply with particular regulatory requirements.
Reverse Repurchase Agreements: The Fund may generate leverage by entering into reverse repurchase agreements, under which the Fund sells portfolio securities to financial institutions such as banks and broker-dealers and agrees to repurchase them at a particular date and price. Such agreements, which are in effect collateralized borrowings by the Fund, are considered to be senior securities under Investment Company Act of 1940, as amended unless the Fund designates on its books and records an amount of assets equal to the amount of the Fund’s obligations under the reverse repurchase agreements.
Counterparty: When the Fund engages in investment techniques in which it relies on another party to consummate the transaction, the Fund is subject to the risk of default by the other party. To the extent that the Fund enters into multiple transactions with a single or limited number of counterparties, the Fund will be subject to increased levels of counterparty risk.
High Yield Fixed Income Securities: Securities rated below the four highest rating categories of a nationally recognized statistical rating organization, may be known as “high-yield” securities and commonly referred to as “junk bonds.” The highest of the ratings among these nationally recognized statistical rating organizations is used to determine the security’s classification. Such securities entail greater price volatility and credit and interest rate risk than investment-grade securities. Analysis of the creditworthiness of high-yield/high-risk issuers is more complex than for higher-rated securities, making it more difficult for the Fund’s subadviser to accurately predict risk. There is a greater risk with high-yield/high-risk fixed income securities that an issuer will not be able to make principal and interest payments when due. If the Fund pursues missed payments, there is a risk that the Fund’s expenses could increase. In addition, lower-rated securities may not trade as often and may be less liquid than higher-rated securities, especially during periods of economic uncertainty or change. As a result of all of these factors, these bonds are generally considered to be speculative.
Leverage: Although the Fund presently intends to utilize leverage, there can be no assurance that the Fund will do so, or that, if utilized, it will be successful during any period in which it is employed. The use of leverage by the Fund would result in more risk to the Fund’s shareholders than if leverage had not been used and can magnify the effect of any losses. If the income and gains earned on securities to which the Fund has exposure through the use of leverage are greater than the Fund’s costs of borrowing, the costs of derivatives transactions used to generate leverage the Fund’s returns will be greater than if leverage had not been used. Conversely, if the income and gains from those securities do not cover the payments due in connection with the leverage used, the return will be less than if the economic leverage had not been used. The expenses of a borrowing program and/or of a derivatives transaction will be borne by shareholders and, consequently, will result in a reduction of the NAV of the Fund’s common shares. During periods in which the Fund is using leverage, the fees paid by the Fund for investment advisory and administrative services will be higher than if the Fund did not use leverage, as such fees will be calculated on the basis of the Fund’s managed assets, which includes assets attributable to borrowings.
Closed-End Fund: Closed-end funds may trade at a discount or premium from their net asset values, which may affect whether an investor will realize gains or losses. They may also employ leverage, which may increase volatility.
STONE HARBOR EMERGING MARKETS INCOME FUND
INVESTMENT OBJECTIVE, PRINCIPAL STRATEGIES AND PRINCIPAL RISKS (Unaudited) (Continued)
No Guarantee: There is no guarantee that the Fund will meet its objective.
TOTAL RETURN FUND INC.
INVESTMENT OBJECTIVE, PRINCIPAL STRATEGIES AND PRINCIPAL RISKS (Unaudited)
Investment Objective: The Fund’s investment objective is capital appreciation, with current income as a secondary objective.
Principal Strategies:
The Fund seeks to meet its objectives through a balance of equity and fixed income investments.
The equity portion of the Fund invests globally in owners/operators of infrastructure in the communications, utility, energy, and transportation industries.
The fixed income portion of the Fund is designed to generate high current income and total return through the application of active sector rotation, extensive credit research, and disciplined risk management designed to capitalize on opportunities across undervalued areas of the fixed income markets.
Principal Risks:
Equity Securities: Generally, prices of equity securities are more volatile than those of fixed income securities. The prices of equity securities will rise and fall in response to a number of different factors. In particular, equity securities will respond to events that affect entire financial markets or industries (such as changes in inflation or consumer demand) and to events that affect particular issuers (such as news about the success or failure of a new product). Equity securities also are subject to “stock market risk,” meaning that stock prices in general may decline over short or extended periods of time. When the value of the stocks held by the Fund goes down, the net asset value of the Fund’s shares will be affected.
Management: The Fund is subject to management risk because it is an actively managed investment portfolio. The subadviser’s judgments about the attractiveness and potential appreciation of an investment may prove to be inaccurate and may not produce the desired results. The subadviser will apply its investment techniques and risk analyses in making investment decisions for the Fund, but there is no guarantee that its decisions will produce the intended result.
Infrastructure-Related Investments: Infrastructure-related entities are subject to a variety of factors that may adversely affect their businesses or operations, including high interest costs in connection with capital construction programs, costs associated with environmental and other regulations, the effects of economic slowdown and surplus capacity, increased competition from other providers of services, uncertainties concerning the availability of fuel at reasonable prices, the effects of energy conservation policies and other factors. Additionally, infrastructure-related entities may be subject to regulation by various governmental authorities and may also be affected by governmental regulation of rates charged to customers, service interruption due to environmental, operational or other mishaps and the imposition of special tariffs and changes in tax laws, regulatory policies and accounting standards.
Foreign Investing: Investing in securities of non-U.S. companies involves special risks and considerations not typically associated with investing in U.S. companies, and the values of non-U.S. securities may be more volatile than those of U.S. securities. The values of non-U.S. securities are subject to economic and political developments in countries and regions where the issuers operate or are domiciled, or where the securities are traded, such as changes in economic or monetary policies, and to changes in currency exchange rates. Values may also be affected by restrictions on receiving the investment proceeds from a non-U.S. country.
TOTAL RETURN FUND INC.
INVESTMENT OBJECTIVE, PRINCIPAL STRATEGIES AND PRINCIPAL RISKS (Unaudited) (Continued)
In general, less information is publicly available about non-U.S. companies than about U.S. companies. Non-U.S. companies are generally not subject to the same accounting, auditing and financial reporting standards as are U.S. companies. Certain foreign issuers classified as passive foreign investment companies may be subject to additional taxation risk.
Utilities Industry: Public utility companies are subject to intrinsic risks, including difficulty in obtaining an adequate return on invested capital, difficulty in financing large construction programs during an inflationary period, restrictions on operations and increased costs and delays attributable to environmental considerations and regulation, difficulty in raising capital in adequate amounts on reasonable terms in periods of high inflation and unsettled capital markets, technological innovations that may render existing plants, equipment or products obsolete, the potential impact of natural or man-made disasters, increased costs and reduced availability of certain types of fuel, occasional reduced availability and high costs of natural gas and other fuels, the effects of energy conservation, the effects of a national energy policy and lengthy delays and greatly increased costs and other problems associated with the design, construction, licensing, regulation and operation of nuclear facilities for electric generation, including, among other considerations, the problems associated with the use of radioactive materials, the disposal of radioactive wastes, shutdown of facilities or release of radiation resulting from catastrophic events, disallowance of costs by regulators which may reduce profitability, and changes in market structure that increase competition. There are substantial differences among the regulatory practices and policies of various jurisdictions, and any given regulatory agency may make major shifts in policy from time to time.
Bank Loans: Investing in loans (including floating rate loans, loan assignments, loan participations and other loan instruments) carries certain risks in addition to the risks typically associated with high-yield/high-risk fixed income securities. Loans may be unsecured or not fully collateralized, may be subject to restrictions on resale and sometimes trade infrequently on the secondary market. In the event a borrower defaults, the Fund’s access to the collateral may be limited or delayed by bankruptcy or other insolvency laws. There is a risk that the value of the collateral securing the loan may decline after the Fund invests and that the collateral may not be sufficient to cover the amount owed to the Fund. If the loan is unsecured, there is no specific collateral on which the Fund can foreclose. In addition, if a secured loan is foreclosed, the Fund may bear the costs and liabilities associated with owning and disposing of the collateral, including the risk that collateral may be difficult to sell.
Transactions in many loans settle on a delayed basis that may take more than seven days. As a result, sale proceeds related to the sale of loans may not be available until potentially a substantial period of time after the sale of the loans. No active trading market may exist for some loans, which may impact the ability of the Fund to realize full value in the event of the need to liquidate such assets. Adverse market conditions may impair the liquidity of some actively traded loans. Loans also may be subject to restrictions on resale, which can delay the sale and adversely impact the sale price. Difficulty in selling a loan can result in a loss. Loans made to finance highly leveraged corporate acquisitions may be especially vulnerable to adverse changes in economic or market conditions. Certain loans may not be considered “securities,” and purchasers, such as the Fund, therefore may not be entitled to rely on the strong anti-fraud protections of the federal securities laws. With loan participations, the Fund may not be able to control the exercise of any remedies that the lender would have under the loan and likely would not have any rights against the borrower directly, so that delays and
TOTAL RETURN FUND INC.
INVESTMENT OBJECTIVE, PRINCIPAL STRATEGIES AND PRINCIPAL RISKS (Unaudited) (Continued)
expense may be greater than those that would be involved if the Fund could enforce its rights directly against the borrower.
Credit: There is a risk that the issuer of a security will fail to pay interest or principal in a timely manner, or that negative perceptions of the issuer’s ability to make such payments will cause the price of the security to decline. Debt instruments rated below investment-grade are especially susceptible to this risk.
Interest Rate: The values of debt instruments usually rise and fall in response to changes in interest rates. Declining interest rates generally increase the value of existing debt instruments, and rising interest rates generally decrease the value of existing debt instruments. Changes in a debt instrument’s value usually will not affect the amount of interest income paid to the Fund, but will affect the value of the Fund’s shares. Interest rate risk is generally greater for investments with longer maturities.
Certain instruments pay interest at variable or floating rates. Variable rate instruments reset at specified intervals, while floating rate instruments reset whenever there is a change in a specified index rate. In most cases, these reset provisions reduce the effect of changes in market interest rates on the value of the instrument. However, some instruments do not track the underlying index directly, but reset based on formulas that can produce an effect similar to leveraging; others may also provide for interest payments that vary inversely with market rates. The market prices of these instruments may fluctuate significantly when interest rates change.
Some investments give the issuer the option to call or redeem an investment before its maturity date. If an issuer calls or redeems an investment during a time of declining interest rates, the Fund might have to reinvest the proceeds in an investment offering a lower yield, and therefore it might not benefit from any increase in value as a result of declining interest rates.
High Yield Fixed Income Securities: Securities rated below the four highest rating categories of a nationally recognized statistical rating organization, may be known as “high-yield” securities and commonly referred to as “junk bonds.” The highest of the ratings among these nationally recognized statistical rating organizations is used to determine the security’s classification. Such securities entail greater price volatility and credit and interest rate risk than investment-grade securities. Analysis of the creditworthiness of high-yield/high-risk issuers is more complex than for higher-rated securities, making it more difficult for the Fund’s subadviser to accurately predict risk. There is a greater risk with high-yield/high-risk fixed income securities that an issuer will not be able to make principal and interest payments when due. If the Fund pursues missed payments, there is a risk that the Fund’s expenses could increase. In addition, lower-rated securities may not trade as often and may be less liquid than higher-rated securities, especially during periods of economic uncertainty or change. As a result of all of these factors, these bonds are generally considered to be speculative.
Asset-Backed and Mortgage-Backed Securities: Mortgage-backed securities represent interests in pools of residential mortgage loans purchased from individual lenders by a federal agency or originated and issued by private lenders. Asset-backed securities represent interests in pools of underlying assets such as motor vehicle installment sales or installment loan contracts, leases of various types of real and personal property, and receivables from credit card arrangements. These two types of securities share many of the same risks.
The impairment of the value of collateral or other assets underlying a mortgage-backed or asset-backed security, such as that resulting from non-payment of loans, may result in a
TOTAL RETURN FUND INC.
INVESTMENT OBJECTIVE, PRINCIPAL STRATEGIES AND PRINCIPAL RISKS (Unaudited) (Continued)
reduction in the value of such security and losses to the Fund. Early payoffs in the loans underlying such securities may result in the Fund receiving less income than originally anticipated. The variability in prepayments will tend to limit price gains when interest rates drop and exaggerate price declines when interest rates rise. In the event of high prepayments, the Fund may be required to invest proceeds at lower interest rates, causing the Fund to earn less than if the prepayments had not occurred. Conversely, rising interest rates may cause prepayments to occur at a slower than expected rate, which may effectively change a security that was considered short- or intermediate-term into a long-term security. Long-term securities tend to fluctuate in value more widely in response to changes in interest rates than shorter-term securities.
Leverage: The Fund employs leverage through margin financing. While this leverage often serves to increase yield, it also subjects the Fund to increased risks. These risks may include the likelihood of increased price and NAV volatility and the possibility that the Fund’s common stock income will fall if the interest rate on any borrowings rises. The use of leverage is premised upon the expectation that the cost of leverage will be lower than the return on the investments made with the proceeds. However, if the income or capital appreciation from the securities purchased with such proceeds is not sufficient to cover the cost of leverage or if the Fund incurs capital losses, the return to common stockholders will be less than if the leverage had not been used. There can be no assurance that a leveraging strategy will be successful during any period in which it is employed.
Market Volatility: The value of the securities in which the Fund invests may go up or down in response to the prospects of individual companies and/or general economic conditions. Price changes may be temporary or may last for extended periods. Local, regional, or global events such as war (e.g., Russia’s invasion of Ukraine), acts of terrorism, the spread of infectious illness (e.g., COVID-19 pandemic) or other public health issues, recessions, or other events could have a significant impact on the Fund and its investments, including hampering the ability of the Fund’s portfolio managers to invest the Fund’s assets as intended.
Closed End Funds: Closed-end funds may trade at a discount or premium from their net asset values, which may affect whether an investor will realize gains or losses. They may also employ leverage, which may increase volatility.
No Guarantee: There is no guarantee that the Fund will meet its objective.
Managed Distribution Plan: The Board of Directors has adopted a Managed Distribution Plan (the “Plan”) which currently provides for the Fund to make a monthly distribution at the rate of $0.05 per share. Under the terms of the Plan, the Fund seeks to maintain a consistent distribution level that may be paid in part or in full from net investment income, realized capital gains, and a return of capital, or a combination thereof. The Board may amend, suspend or terminate the Plan at any time, without prior notice to shareholders, if it deems such action to be in the best interests of the Fund and its shareholders.
GLOBAL MULTI-SECTOR INCOME FUND
Automatic Reinvestment and Cash Purchase Plan (Unaudited)
Global Multi-Sector Income Fund (the “Fund”) allows you to conveniently reinvest distributions monthly in additional Fund shares thereby enabling you to compound your returns from the Fund. By choosing to reinvest, you’ll be able to invest money regularly and automatically, and watch your investment grow.
It is important to note that an automatic reinvestment plan does not ensure a profit, nor does it protect you against loss in a declining market.
Enrollment in the Reinvestment Plan
It is the policy of the Fund to automatically reinvest distributions payable to shareholders. A “registered” shareholder automatically becomes a participant in the Fund’s Automatic Reinvestment and Cash Purchase Plan (the “Plan”). The Plan authorizes the Fund to credit all shares of common stock to participants upon a distribution regardless of whether the shares are trading at a discount or premium to the net asset value. Registered shareholders may terminate their participation and receive distributions in cash by contacting Computershare Trust Company, N.A. (the “Plan Administrator”). The termination will become effective with the next distribution if the Plan Administrator is notified at least 7 business days prior to the distribution payment date. Registered shareholders that wish to change their distribution option from cash payment to reinvest may do so by contacting the Fund at 1-866-270-7788. In the case of banks, brokers, or other nominees which hold your shares for you as the beneficial owner, the Plan Administrator will administer the Plan based on the information provided by the bank, broker or nominee. To the extent that you wish to participate in the Plan, you should contact the broker, bank or nominee holding your shares to ensure that your account is properly represented. If necessary, you may have your shares taken out of the name of the broker, bank or nominee and register them in your own name.
How shares are purchased through the Reinvestment Plan
When a distribution is declared, nonparticipants in the plan will receive cash. Participants in the Plan will receive shares of the Fund valued as described below:
If on the payable date of the distribution, the market price of the Fund’s common stock is less than the net asset value, the Plan Administrator will buy Fund shares on behalf of the Participant in the open market, on the New York Stock Exchange (NYSE) or elsewhere. The price per share will be equal to the weighted average price of all shares purchased, including commissions. Commission rates are currently $0.02 per share, although the rate is subject to change and may vary. If, following the commencement of purchases and before the Plan Administrator has completed its purchases, the trading price equals or exceeds the most recent net asset value of the common shares, the Plan Administrator may cease purchasing shares on the open market and the Fund may issue the remaining shares at a price equal to the greater of (a) the net asset value on the last day the Plan Administrator purchased shares or (b) 95% of the market price on such day. In the case where the Plan Administrator has terminated open market purchase and the Fund has issued the remaining shares, the number of shares received by the Participant in respect of the cash distribution will be based on the weighted average of prices paid for shares purchased in the open market and the price at which the Fund issued the remaining shares. Under certain circumstances, the rules and regulations of the Securities and Exchange Commission may require limitation or temporary suspension of market purchases of shares under the Plan. The Plan Administrator will not be accountable for its inability to make a purchase during such a period.
GLOBAL MULTI-SECTOR INCOME FUND
Automatic Reinvestment and Cash Purchase Plan
(Unaudited) (Continued)
If on the payable date of the distribution, the market price is equal to or exceeds the net asset value, Participants will be issued new shares by the Fund at the greater of the (a) the net asset value on the payable date or (b) 95% of the market price on such date.
The automatic reinvestment of distributions will not relieve Participants of any income tax which may be payable on such distributions. A Participant in the Plan will be treated for federal income tax purposes, as having received on a payment date, a distribution in an amount equal to the cash the participant could have received instead of shares. If you participate in the Plan, you will receive a Form 1099-DIV concerning the Federal tax status of distributions paid during the year.
Charges to Participate in the Plan
As a Participant in the Plan, you will not pay any charge to have your distributions reinvested in additional shares. The Plan Administrator’s fees for handling the reinvestment of distributions will be paid by the Fund. There will be no brokerage commissions for shares issued directly by the Fund in payment of distributions. However, each Participant will pay a pro rata share of brokerage commissions incurred (currently $0.02 per share, but may vary and is subject to change) with respect to the Plan Administrator’s open market purchases in connection with the reinvestment of distributions.
Voluntary Cash Purchase Plan
Participants in the Plan have the option of making additional cash payments for investment in shares of the Fund. Such payments can be made in any amount from $100 per payment to $3,000 per month. The Plan Administrator will use the funds received to purchase Fund shares in the open market on the 15th of each month or the next business day if the 15th falls on a weekend or holiday (the “Investment Date”). The purchase price per share will be equal to the weighted average price of all shares purchased on the Investment Date, including commissions. There is no charge to shareholders for Cash Purchases. The plan administrator’s fee will be paid by the Fund. However, each participating shareholder will pay pro rata share of brokerage commissions incurred (currently $0.02 per share, but may vary and is subject to change) with respect to the Plan Administrator’s open market purchases in connection with all cash investments. Voluntary cash payments should be sent to Computershare, P.O. Box 6006, Carol Stream, IL 60197-6006.
Participants have an unconditional right to obtain the return of any cash payment if the Plan Administrator receives written notice at least 5 business days before such payment is to be invested.
Automatic Monthly Investment
Participants in the Plan may purchase additional shares by means of an Automatic Monthly Investment of not less than $100 nor more than $3,000 per month by electronic funds transfer from a predesignated U.S bank account. If a Participant has already established a Plan account and wishes to initiate Automatic Monthly Investments, the Participant must complete and sign an automatic monthly investment form and return it to the Plan Administrator together with a voided check or deposit slip for the account from which funds are to be withdrawn. Automatic monthly investment forms may be obtained from the Fund by calling 1-866-270-7788.
GLOBAL MULTI-SECTOR INCOME FUND
Automatic Reinvestment and Cash Purchase Plan
(Unaudited) (Continued)
Termination of Shares
Shareholders wishing to liquidate shares held with the Plan Administrator must do so in writing or by calling 1-866-270-7788. The Plan Administrator does not charge a fee for liquidating your shares; however, a brokerage commission of $0.02 will be charged. This charge may vary and is subject to change.
Once terminated, you may re-enroll in the Plan (provided you still have shares registered in your name) by contacting the Fund at 1-866-270-7788.
Additional Information
For more information regarding the Automatic Reinvestment and Cash Purchase Plan, please contact the Fund at 1-866-270-7788 or visit Virtus.com.
The Fund reserves the right to amend or terminate the Plan as applied to any voluntary cash payments made and any dividend or distribution paid subsequent to written notice of the change sent to the members of the Plan at least 90 days before the record date for such distribution. The Plan also may be amended or terminated by the Plan Administrator with at least 90 days’ written notice to participants in the Plan.
TOTAL RETURN FUND INC.
Automatic Reinvestment and Cash Purchase Plan (Unaudited)
Total Return Fund Inc. (the “Fund”) allows you to conveniently reinvest distributions monthly in additional Fund shares thereby enabling you to compound your returns from the Fund. By choosing to reinvest, you’ll be able to invest money regularly and automatically, and watch your investment grow.
It is important to note that an automatic reinvestment plan does not ensure a profit, nor does it protect you against loss in a declining market.
Enrollment in the Reinvestment Plan
It is the policy of the Fund to automatically reinvest distributions payable to shareholders. A “registered” shareholder automatically becomes a participant in the Fund’s Automatic Reinvestment and Cash Purchase Plan (the “Plan”). The Plan authorizes the Fund to credit all shares of common stock to participants upon a distribution regardless of whether the shares are trading at a discount or premium to the net asset value. Registered shareholders may terminate their participation and receive distributions in cash by contacting Computershare Trust Company, N.A. (the “Plan Administrator”). The termination will become effective with the next distribution if the Plan Administrator is notified at least 7 business days prior to the distribution payment date. Registered shareholders that wish to change their distribution option from cash payment to reinvest may do so by contacting the Fund at 1-866-270-7788. In the case of banks, brokers, or other nominees which hold your shares for you as the beneficial owner, the Plan Administrator will administer the Plan based on the information provided by the bank, broker or nominee. To the extent that you wish to participate in the Plan, you should contact the broker, bank or nominee holding your shares to ensure that your account is properly represented. If necessary, you may have your shares taken out of the name of the broker, bank or nominee and register them in your own name.
How shares are purchased through the Reinvestment Plan
When a distribution is declared, nonparticipants in the plan will receive cash. Participants in the Plan will receive shares of the Fund valued as described below:
If on the payable date of the distribution, the market price of the Fund’s common stock is less than the net asset value, the Plan Administrator will buy Fund shares on behalf of the Participant in the open market, on the New York Stock Exchange (NYSE) or elsewhere. The price per share will be equal to the weighted average price of all shares purchased, including commissions. Commission rates are currently $0.02 per share, although the rate is subject to change and may vary. If, following the commencement of purchases and before the Plan Administrator has completed its purchases, the trading price equals or exceeds the most recent net asset value of the common shares, the Plan Administrator may cease purchasing shares on the open market and the Fund may issue the remaining shares at a price equal to the greater of (a) the net asset value on the last day the Plan Administrator purchased shares or (b) 95% of the market price on such day. In the case where the Plan Administrator has terminated open market purchase and the Fund has issued the remaining shares, the number of shares received by the Participant in respect of the cash distribution will be based on the weighted average of prices paid for shares purchased in the open market and the price at which the Fund issued the remaining shares. Under certain circumstances, the rules and regulations of the Securities and Exchange Commission may require limitation or temporary suspension of market purchases of shares under the Plan. The Plan Administrator will not be accountable for its inability to make a purchase during such a period.
TOTAL RETURN FUND INC.
Automatic Reinvestment and Cash Purchase Plan
(Unaudited) (Continued)
If on the payable date of the distribution, the market price is equal to or exceeds the net asset value, Participants will be issued new shares by the Fund at the greater of the (a) the net asset value on the payable date or (b) 95% of the market price on such date.
The automatic reinvestment of distributions will not relieve Participants of any income tax which may be payable on such distributions. A Participant in the Plan will be treated for federal income tax purposes, as having received on a payment date, a distribution in an amount equal to the cash the participant could have received instead of shares. If you participate in the Plan, you will receive a Form 1099-DIV concerning the Federal tax status of distributions paid during the year.
Charges to Participate in the Plan
As a Participant in the Plan, you will not pay any charge to have your distributions reinvested in additional shares. The Plan Administrator’s fees for handling the reinvestment of distributions will be paid by the Fund. There will be no brokerage commissions for shares issued directly by the Fund in payment of distributions. However, each Participant will pay a pro rata share of brokerage commissions incurred (currently $0.02 per share, but may vary and is subject to change) with respect to the Plan Administrator’s open market purchases in connection with the reinvestment of distributions.
Voluntary Cash Purchase Plan
Participants in the Plan have the option of making additional cash payments for investment in shares of the Fund. Such payments can be made in any amount from $100 per payment to $3,000 per month. The Plan Administrator will use the funds received to purchase Fund shares in the open market on the 15th of each month or the next business day if the 15th falls on a weekend or holiday (the “Investment Date”). The purchase price per share will be equal to the weighted average price of all shares purchased on the Investment Date, including commissions. There is no charge to shareholders for Cash Purchases. The plan administrator’s fee will be paid by the Fund. However, each participating shareholder will pay pro rata share of brokerage commissions incurred (currently $0.02 per share, but may vary and is subject to change) with respect to the Plan Administrator’s open market purchases in connection with all cash investments. Voluntary cash payments should be sent to Computershare, P.O. Box 6006, Carol Stream, IL 60197-6006.
Participants have an unconditional right to obtain the return of any cash payment if the Plan Administrator receives written notice at least 5 business days before such payment is to be invested.
Automatic Monthly Investment
Participants in the Plan may purchase additional shares by means of an Automatic Monthly Investment of not less than $100 nor more than $3,000 per month by electronic funds transfer from a predesignated U.S bank account. If a Participant has already established a Plan account and wishes to initiate Automatic Monthly Investments, the Participant must complete and sign an automatic monthly investment form and return it to the Plan Administrator together with a voided check or deposit slip for the account from which funds are to be withdrawn. Automatic monthly investment forms may be obtained from the Fund by calling 1-866-270-7788.
TOTAL RETURN FUND INC.
Automatic Reinvestment and Cash Purchase Plan
(Unaudited) (Continued)
Termination of Shares
Shareholders wishing to liquidate shares held with the Plan Administrator must do so in writing or by calling 1-866-270-7788. The Plan Administrator does not charge a fee for liquidating your shares; however, a brokerage commission of $0.02 will be charged. This charge may vary and is subject to change.
Once terminated, you may re-enroll in the Plan (provided you still have shares registered in your name) by contacting the Fund at 1-866-270-7788.
Additional Information
For more information regarding the Automatic Reinvestment and Cash Purchase Plan, please contact the Fund at 1-866-270-7788 or visit Virtus.com.
The Fund reserves the right to amend or terminate the Plan as applied to any voluntary cash payments made and any dividend or distribution paid subsequent to written notice of the change sent to the members of the Plan at least 90 days before the record date for such distribution. The Plan also may be amended or terminated by the Plan Administrator with at least 90 days’ written notice to participants in the Plan.
STONE HARBOR EMERGING MARKETS INCOME FUND
Dividend Reinvestment Plan (Unaudited)
Unless the registered owner of Common Shares elects to receive cash by contacting Computershare (the “Plan Administrator”), all dividends declared on Common Shares will be automatically reinvested by the Plan Administrator for shareholders in the Fund’s Automatic Dividend Reinvestment Plan (the “Plan”), in additional Common Shares. Common Shareholders who elect not to participate in the Plan will receive all dividends and other distributions in cash paid by check mailed directly to the shareholder of record (or, if the Common Shares are held in street or other nominee name, then to such nominee) by the Plan Administrator as dividend disbursing agent. Participation in the Plan is completely voluntary and may be terminated or resumed at any time without penalty by notice if received and processed by the Plan Administrator prior to the dividend record date; otherwise such termination or resumption will be effective with respect to any subsequently declared dividend or other distribution. Such notice will be effective with respect to a particular dividend or other distribution (together, a “Dividend”). Some brokers may automatically elect to receive cash on behalf of Common Shareholders and may re-invest that cash in additional Common Shares, which may result in a higher cost to such shareholders as compared to shareholders who participate in the Plan.
The Plan Administrator will open an account for each Common Shareholder under the Plan in the same name in which such Common Shareholder’s Common Shares are registered. Whenever the Fund declares a Dividend payable in cash, non-participants in the Plan will receive cash and participants in the Plan will receive the equivalent in Common Shares. The Common Shares will be acquired by the Plan Administrator for the participants’ accounts, depending upon the circumstances described below, either (i) through receipt of additional unissued but authorized Common Shares from the Fund (“Newly Issued Common Shares”) or (ii) by purchase of outstanding Common Shares on the open market (“Open-Market Purchases”) on the NYSE or elsewhere. If, on the payment date for any Dividend, the closing market price plus estimated brokerage commissions per Common Share is equal to or greater than the NAV per Common Share, the Plan Administrator will invest the Dividend amount in Newly Issued Common Shares on behalf of the participants. The number of Newly Issued Common Shares to be credited to each participant’s account will be determined by dividing the dollar amount of the Dividend by the NAV per Common Share on the payment date; provided that, if the NAV is less than or equal to 95% of the closing market value on the payment date, the dollar amount of the Dividend will be divided by 95% of the closing market price per Common Share on the payment date. If, on the payment date for any Dividend, the NAV per Common Share is greater than the closing market value plus estimated brokerage commissions, the Plan Administrator will invest the Dividend amount in Common Shares acquired on behalf of the participants in Open-Market Purchases.
In the event of a market discount on the payment date for any Dividend, the Plan Administrator will have until the last business day before the next date on which the Common Shares trade on an “ex-dividend” basis or 30 days after the payment date for such Dividend, whichever is sooner (the “Last Purchase Date”), to invest the Dividend amount in Common Shares acquired in Open-Market Purchases. It is contemplated that the Fund will pay monthly income Dividends. If, before the Plan Administrator has completed its Open-Market Purchases, the market price per Common Share exceeds the NAV per Common Share, the average per Common Share purchase price paid by the Plan Administrator may exceed the NAV of the Common Shares, resulting in the acquisition of fewer Common Shares than if the Dividend had been paid in Newly Issued Common Shares on the Dividend payment date. Because of the foregoing difficulty with respect to Open-Market Purchases, the Plan provides that if the Plan
STONE HARBOR EMERGING MARKETS INCOME FUND
Dividend Reinvestment Plan (Unaudited) (Continued)
Administrator is unable to invest the full Dividend amount in Open-Market Purchases during the purchase period or if the market discount shifts to a market premium during the purchase period, the Plan Administrator may cease making Open-Market Purchases and may invest the uninvested portion of the Dividend amount in Newly Issued Common Shares at the NAV per Common Share at the close of business on the Last Purchase Date provided that, if the NAV is less than or equal to 95% of the then current market price per Common Share, the dollar amount of the Dividend will be divided by 95% of the market price on the payment date for purposes of determining the number of shares issuable under the Plan.
The Plan Administrator maintains all shareholders’ accounts in the Plan and furnishes written confirmation of all transactions in the accounts, including information needed by shareholders for tax records. Common Shares in the account of each Plan participant will be held by the Plan Administrator on behalf of the Plan participant, and each shareholder proxy will include those shares purchased or received pursuant to the Plan. The Plan Administrator will forward all proxy solicitation materials to participants and vote proxies for shares held under the Plan in accordance with the instructions of the participants.
In the case of Common Shareholders such as banks, brokers or nominees which hold shares for others who are the beneficial owners, the Plan Administrator will administer the Plan on the basis of the number of Common Shares certified from time to time by the record shareholder’s name and held for the account of beneficial owners who participate in the Plan.
There will be no brokerage charges with respect to Common Shares issued directly by the Fund. However, each participant will pay a pro rata share of brokerage commissions incurred in connection with Open-Market Purchases. The automatic reinvestment of Dividends will not relieve participants of any federal, state or local income tax that may be payable (or required to be withheld) on such Dividends. Participants that request a sale of Common Shares through the Plan Administrator are subject to brokerage commissions.
The Fund reserves the right to amend or terminate the Plan. There is no direct service charge to participants with regard to purchases in the Plan; however, the Fund reserves the right to amend the Plan to include a service charge payable by the participants.
All correspondence or questions concerning the Plan should be directed to the Plan Administrator at 1-866-270-7788.
CONSIDERATION OF ADVISORY AND SUBADVISORY AGREEMENTS
BY THE BOARD OF TRUSTEES OF
VIRTUS GLOBAL MULTI-SECTOR INCOME FUND
(Unaudited)
The Board of Trustees (the “Board”) of Virtus Global Multi-Sector Income Fund (the “Fund”) is responsible for determining whether to approve the continuation of the investment advisory agreement (the “Advisory Agreement”) between the Fund and Virtus Investment Advisers, LLC (formerly, Virtus Investment Advisers, Inc.) (“VIA”) and the continuation of the subadvisory agreement (the “Subadvisory Agreement” and, together with the Advisory Agreement, the “Agreements”) with Virtus Fixed Income Advisers, LLC, acting through its division Newfleet Asset Management (the “Subadviser”). At a meeting held on October 29, 2024, in a virtual meeting format, and at an in-person meeting held on November 18-20, 2024 (the “Meetings”), the Board, including a majority of the Trustees who are not interested persons, as defined in the Investment Company Act of 1940, as amended (the “1940 Act”), of the Fund (the “Independent Trustees”) considered and approved the continuation of each Agreement, as further discussed below.
In connection with the approval of the Agreements, the Board requested and evaluated information provided by VIA and the Subadviser which, in the Board’s view, constituted information necessary for the Board to evaluate each of the Agreements. The Board also considered information furnished throughout the year at regular Board meetings with respect to the services provided by VIA and the Subadviser, including quarterly performance reports prepared by management containing reviews of investment results and periodic presentations from the Subadviser with respect to the Fund. The Board noted the affiliation of the Subadviser with VIA and any potential conflicts of interest.
The Board was separately advised by independent legal counsel throughout the process. For each Agreement, the Board considered each of the relevant factors with respect to the Fund and its shareholders. The Board considered all factors that it considered relevant, including those discussed below. The Board did not identify any one factor as all-important or controlling, and each Trustee may have attributed different weights to the various factors. The Independent Trustees also discussed the proposed approval of the Agreements in executive sessions with their independent legal counsel at which no representatives of VIA or the Subadviser were present.
Nature, Extent and Quality of Services
The Board received in advance of the Meetings various data and information regarding the nature, extent and quality of the services provided under the Agreements, including responses by VIA and the Subadviser to detailed requests submitted either by independent legal counsel to the Independent Trustees on their behalf or VIA, as the case may be, as well as responses by VIA and the Subadviser to follow-up questions. The Board also previously had received presentations by VIA’s and the Subadviser’s senior management personnel. The responses to the information requests and the presentations included, among other things, information about the background, experience and investment philosophy of senior management and investment personnel responsible for managing the Fund; the resources, operations and compliance structure of VIA and the Subadviser; and the investment process, investment strategies, personnel, compliance procedures, and overall performance of VIA and the Subadviser.
In considering the Agreement with VIA, the Board considered VIA’s process for supervising and managing the Subadviser, including: (a) VIA’s ability to select and monitor the Subadviser; (b) VIA’s ability to provide the services necessary to monitor the Subadviser’s compliance with the Fund’s investment objective, policies and restrictions, as well as to provide other oversight activities; and (c) VIA’s ability and willingness to identify instances in which the Subadviser
CONSIDERATION OF ADVISORY AND SUBADVISORY AGREEMENTS
BY THE BOARD OF TRUSTEES OF
VIRTUS GLOBAL MULTI-SECTOR INCOME FUND
(Unaudited) (Continued)
should be replaced and to carry out the required changes. The Board also considered: (a) the experience and capability of VIA’s management and other personnel; (b) the financial condition of VIA, and whether it had the financial wherewithal to continue to provide a high level of and quality services to the Fund; (c) the quality of VIA’s own regulatory and legal compliance policies, procedures and systems; (d) the nature, extent and quality of administrative and other services provided by VIA and its affiliates to the Fund; (e) VIA’s supervision of the Fund’s other service providers; and (f) VIA’s risk management processes. It was noted that an affiliate of VIA serves as administrator to the Fund. The Board also took into account its knowledge of VIA’s management and the quality of the performance of VIA’s duties to the Fund and other funds managed through Board meetings, discussions, and reports during the preceding year, as well as information from the Fund’s Chief Compliance Officer regarding the Fund’s compliance policies and procedures established pursuant to Rule 38a-1 under the 1940 Act.
With respect to the services provided by the Subadviser, the Board considered information provided to the Board by the Subadviser, as well as information provided throughout the past year. The Board noted that the Subadviser provided information regarding its portfolio management services, compliance with the Fund’s investment policies and procedures, and compliance with applicable securities laws and assurances thereof. The Board also noted that VIA’s and the Subadviser’s management of the Fund is subject to the oversight of the Board and must be carried out in accordance with the Fund’s investment objective, policies and restrictions. The Board considered the Subadviser’s portfolio management services, including: (a) the scope of its operations; (b) its portfolio management capabilities; (c) the breadth and depth of its management, investment and research personnel; and (d) the various support services that it provides to the Fund. The Board considered the investment management process and strategies employed by the Subadviser, and experience and capability of the Subadviser’s management and other personnel committed by the Subadviser to the Fund. The Board also considered: (a) the quality of the Subadviser’s compliance policies, procedures, and systems; and (b) the Subadviser’s brokerage and trading practices, including with respect to best execution and soft dollars. The Board also took into account the Subadviser’s risk assessment and monitoring process.
Investment Performance
The Board considered performance reports and discussions at Board meetings throughout the year, as well as a report (the “Broadridge Report”) for the Fund prepared by Broadridge Financial Solutions, Inc., an independent third party provider of investment company data, furnished in connection with the contract renewal process. The Broadridge Report presented the Fund’s performance relative to a peer group of other closed-end funds (the “Performance Universe”) and relevant indexes, as selected by Broadridge. The Board also considered performance information presented by management and took into account management’s discussion of the same, including the effect of market conditions on the Fund’s performance. The Board noted that it also reviews on a quarterly basis detailed information about both the Fund’s performance results and portfolio composition, as well as the Subadviser’s investment strategies. The Board noted VIA’s expertise and resources in monitoring the performance, investment style, and risk-adjusted performance of the Subadviser. The Board also took into account its discussions with management regarding factors that contributed to the performance of the Fund.
The Board noted that the Fund underperformed the median of its Performance Universe for the year-to-date, 1-, 3-, 5-, and 10-year periods ended March 31, 2024. The Board also noted that
CONSIDERATION OF ADVISORY AND SUBADVISORY AGREEMENTS
BY THE BOARD OF TRUSTEES OF
VIRTUS GLOBAL MULTI-SECTOR INCOME FUND
(Unaudited) (Continued)
the Fund outperformed its benchmark for the year-to-date, 1-, 3-, 5-, and 10-year periods ended March 31, 2024. The Board discussed the Fund’s underperformance and the reasons therefor among themselves and with management.
Management Fees and Total Expenses
The Board considered the fees charged to the Fund for advisory services as well as the total expense level of the Fund. This information included comparisons of the Fund’s contractual and net management fee and net total expense level to those of its peer universe (the “Expense Universe”) and, with respect to the Fund’s contractual and net management fee, ranked according to quintile (the first quintile being lowest and, therefore, best in these expense component rankings, and fifth being highest and, therefore, worst in these expense component rankings). In comparing the Fund’s net management fee to the Expense Universe, the Board noted that in the materials presented by management such fee was comprised of advisory fees. The Board also noted that the subadvisory fees were paid by VIA out of its management fees rather than paid separately by the Fund. In this regard, the Board took into account management’s discussion with respect to the advisory/subadvisory fee subadvisory fee. The Board also considered the fee rates payable by comparable accounts managed by the Subadviser, if any.
In addition to the foregoing, the Board considered, among other data, the information set forth below with respect to the Fund’s fees and expenses. The Board took into account management’s discussion of the Fund’s expenses, including the type and size of the Fund relative to the other funds in its Expense Universe.
The Board noted that the Fund’s gross management fees and the Fund’s total expenses were above the median of the Expense Universe.
Profitability
The Board also considered certain information relating to profitability that had been provided by VIA. In this regard, the Board considered information regarding the overall profitability of VIA for its management of the Fund, as well as its profits and those of the Subadviser. In addition to the fees paid to VIA and its affiliates, including the Subadviser, the Board considered other benefits derived by VIA or its affiliates from their relationships with the Fund. The Board reviewed the methodology used to allocate costs to the Fund, taking into account the fact that allocation methodologies are inherently subjective and various allocation methodologies may each be reasonable while producing different results. The Board concluded that the profitability to VIA and its affiliates from the Fund was within a reasonable range in light of the quality of the services rendered to the Fund by VIA and its affiliates, and other factors considered.
In considering the profitability to the Subadviser in connection with its relationship to the Fund, the Board noted that the fee payable under the Subadvisory Agreement is paid by VIA out of the fee that VIA receives under the Advisory Agreement, and not by the Fund. In considering the fee payable by VIA to the Subadviser, the Board noted that, because the Subadviser is an affiliate of VIA, its profitability should be considered as part of the profitability of VIA and, therefore, the Board considered the profitability of VIA and the Subadviser together.
Economies of Scale
The Board considered the extent to which economies of scale would be realized as the Fund’s assets grow, and whether the fee levels reflect these economies of scale for the benefit of
CONSIDERATION OF ADVISORY AND SUBADVISORY AGREEMENTS
BY THE BOARD OF TRUSTEES OF
VIRTUS GLOBAL MULTI-SECTOR INCOME FUND
(Unaudited) (Continued)
Fund shareholders. The Board noted that economies of scale may develop for certain funds as their assets increase and their fixed fund-level expenses decline as a percentage of assets, but that closed-end funds such as the Fund typically do not have the ability to increase substantially their asset base as do open-end funds.
The Board also considered the advisory fee rate in relation to the current asset size of the Fund, and whether any economies of scale exist at that size. The Board concluded that, given the Fund’s closed-end structure, no changes to the Fund’s advisory and subadvisory fee structure were necessary or advisable at this time. The Board agreed that it would be appropriate to monitor this matter in the event that the assets of the Fund were to increase substantially via a secondary or rights offering, capital appreciation, reinvested dividends, the use of increased leverage or some other means.
Other Factors
The Board considered information regarding potential “fallout” or ancillary benefits that may be realized by VIA, the Subadviser and their respective affiliates as a result of their relationships with the Fund. The Board noted that an affiliate of VIA provides administrative services to the Fund. The Board noted management’s discussion of the fact that, while the Subadviser is an affiliate of VIA, there are no other direct benefits received by the Subadviser or VIA in providing investment advisory services to the Fund, other than the fees earned under the respective Agreement.
The Board concluded that potential “fallout” benefits that VIA and the Subadviser may receive, such as greater name recognition or increased ability to obtain research and brokerage services, as applicable, may, in some cases, benefit the Fund.
Conclusion
After considering all factors that it considered relevant, the Board, including a majority of the Independent Trustees, approved the Agreements with respect to the Fund.
CONSIDERATION OF ADVISORY AND SUBADVISORY AGREEMENTS
BY THE BOARD OF TRUSTEES OF
VIRTUS STONE HARBOR EMERGING MARKETS INCOME FUND
(Unaudited)
The Board of Trustees (the “Board”) of Virtus Stone Harbor Emerging Markets Income Fund (the “Fund”) is responsible for determining whether to approve the continuation of the investment advisory agreement (the “Advisory Agreement”) between the Fund and Virtus Alternative Investment Advisers, Inc. (“VAIA”) and the continuation of the subadvisory agreement (the “Subadvisory Agreement” and, together with the Advisory Agreement, the “Investment Management Agreements”) with Virtus Fixed Income Advisers, LLC, acting through its division Stone Harbor Investment Partners (the “Subadviser”). At a meeting held on October 29, 2024, in a virtual meeting format, and at an in-person meeting held on November 18-20, 2024 (the “Meetings”), the Board, including a majority of the Trustees who are not interested persons, as defined in the Investment Company Act of 1940, as amended (the “1940 Act”), of the Fund (the “Independent Trustees”) considered and approved the continuation of each Investment Management Agreement, as further discussed below. The Board also authorized the appointment of Virtus Investment Advisers, LLC (formerly, Virtus Investment Advisers, Inc.) (“VIA”; VIA and VAIA each an “Adviser” and, collectively, the “Advisers”) as adviser to the Fund replacing VAIA effective January 1, 2025, and the transfer to, and assumption by, VIA of VAIA’s rights and obligations pursuant to the Investment Management Agreements, effective January 1, 2025 (the “Transfer and Assumption Agreement”) (together with the Investment Management Agreements, the “Agreements”). The above changes were proposed in connection with a corporate reorganization of the Adviser to streamline and organizationally align the provision of advisory services (the “Reorganization”).
In connection with the approval of the Agreements, the Board requested and evaluated information provided by each Adviser and the Subadviser which, in the Board’s view, constituted information necessary for the Board to form a judgment as to whether the renewal of each of the Investment Management Agreements and approval of the Transfer and Assumption Agreement would be in the best interests of the Fund and its shareholders.. With respect to the consideration of the Transfer and Assumption Agreement, the Board considered Management’s discussion of the benefits to shareholders of the Reorganization and Management’s assertion that the Reorganization would not result in a change of control of the or a change in the management of the Fund, including the personnel providing investment management and other services to the Fund. With respect to the Investment Management Agreements, the Board also considered information furnished throughout the year at regular Board meetings with respect to the services provided by VAIA and the Subadviser, including quarterly performance reports prepared by management containing reviews of investment results and periodic presentations from the Subadviser with respect to the Fund. The Board noted the affiliation of the Subadviser with the Advisers and any potential conflicts of interest.
The Board was separately advised by independent legal counsel throughout the process. For each Agreement, the Board considered the relevant factors with respect to the Fund and its shareholders. The Board considered all factors that it considered relevant, including those discussed below. The Board did not identify any one factor as all-important or controlling, and each Trustee may have attributed different weightsl to the various factors. The Independent Trustees also discussed the proposed approval of the Agreements in executive sessions with their independent legal counsel at which no representatives of VAIA or the Subadviser were present.
Nature, Extent and Quality of Services
The Board received in advance of the Meetings various data and information regarding the nature, extent and quality of the services provided under the Agreements, including responses
CONSIDERATION OF ADVISORY AND SUBADVISORY AGREEMENTS
BY THE BOARD OF TRUSTEES OF
VIRTUS STONE HARBOR EMERGING MARKETS INCOME FUND
(Unaudited) (Continued)
by each Adviser and the Subadviser to detailed requests submitted either by independent legal counsel to the Independent Trustees on their behalf or the Adviser, as the case may be, as well as responses by each Adviser and the Subadviser to follow-up questions. The Board also previously had received presentations by each Adviser’s and the Subadviser’s senior management personnel. The responses to the information requests and the presentations included, among other things, information about the background, experience and investment philosophy of senior management and investment personnel responsible for managing the Fund; the resources, operations and compliance structure of each Adviser and the Subadviser; and the investment process, investment strategies, personnel, compliance procedures, and overall performance of each Adviser and the Subadviser.
In considering the Agreement with VAIA and the Transfer and Assumption Agreement with VIA, the Board considered each Adviser’s process for supervising and managing the Subadviser, including: (a) each Adviser’s ability to select and monitor the Subadviser; (b) each Adviser’s ability to provide the services necessary to monitor the Subadviser’s compliance with the Fund’s investment objective, policies and restrictions, as well as to provide other oversight activities; and (c) each Adviser’s ability and willingness to identify instances in which the Subadviser should be replaced and to carry out the required changes. For each Adviser, the Board also considered: (a) the experience and capability of the Adviser’s management and other personnel; (b) the financial condition of the Adviser, and whether it had the financial wherewithal to continue to provide a high level and quality of services to the Fund; (c) the quality of the Adviser’s own regulatory and legal compliance policies, procedures and systems; (d) the nature, extent and quality of administrative and other services provided by the Adviser and its affiliates to the Fund; (e) the Adviser’s supervision of the Fund’s other service providers; and (f) the Adviser’s risk management processes. It was noted that an affiliate of the Advisers serves as administrator to the Fund. The Board also took into account its knowledge of each Adviser’s management and the quality of the performance of each Adviser’s duties to the Fund and other funds managed through Board meetings, discussions, and reports during the preceding year, as well as information from the Fund’s Chief Compliance Officer regarding the Fund’s compliance policies and procedures established pursuant to Rule 38a-1 under the 1940 Act.
With respect to the services provided by the Subadviser, the Board considered information provided to the Board by the Subadviser, as well as information provided throughout the past year. The Board noted that the Subadviser provided information regarding its portfolio management services, compliance with the Fund’s investment policies and procedures, and compliance with applicable securities laws and assurances thereof. The Board also noted that each Adviser’s and the Subadviser’s management of the Fund is subject to the oversight of the Board and must be carried out in accordance with the Fund’s investment objective, policies and restrictions. The Board considered the Subadviser’s portfolio management services, including: (a) the scope of its operations; (b) its portfolio management capabilities; (c) the breadth and depth of its management, investment and research personnel; and (d) the various support services that it provides to the Fund. The Board considered the investment management process and strategies employed by the Subadviser, and experience and capability of the Subadviser’s management and other personnel committed by the Subadviser to the Fund. The Board also considered: (a) the quality of the Subadviser’s compliance policies, procedures, and systems; and (b) the Subadviser’s brokerage and trading practices, including with respect to best execution and soft dollars. The Board also took into account the Subadviser’s risk assessment and monitoring process.
CONSIDERATION OF ADVISORY AND SUBADVISORY AGREEMENTS
BY THE BOARD OF TRUSTEES OF
VIRTUS STONE HARBOR EMERGING MARKETS INCOME FUND
(Unaudited) (Continued)
Investment Performance
The Board considered performance reports and discussions at Board meetings throughout the year, as well as a report (the “Broadridge Report”) for the Fund prepared by Broadridge Financial Solutions, Inc., an independent third party provider of investment company data, furnished in connection with the contract renewal process. The Broadridge Report presented the Fund’s performance relative to a peer group of other closed-end funds (the “Performance Universe”) and relevant indexes, as selected by Broadridge. The Board also considered performance information presented by management and took into account management’s discussion of the same, including the effect of market conditions on the Fund’s performance. The Board noted that it also reviews on a quarterly basis detailed information about both the Fund’s performance results and portfolio composition, as well as the Subadviser’s investment strategies. The Board noted each Adviser’s expertise and resources in monitoring the performance, investment style and risk-adjusted performance of the Subadviser. The Board also took into account its discussions with management regarding factors that contributed to the performance of the Fund.
The Board noted that the Fund outperformed the median of its Performance Universe for the year-to-date, 1-, 3-, 5-, and 10-year periods ended March 31, 2024. The Board also noted that the Fund outperformed its benchmark for the year-to-date, 1-, and 3-year periods ended March 31, 2024 and underperformed its benchmark for the 5- and 10-year periods ended March 31,2024. The Board discussed the Fund’s underperformance and the reasons therefor among themselves and with management.
Management Fees and Total Expenses
The Board considered the fees charged to the Fund for advisory services as well as the total expense level of the Fund. This information included comparisons of the Fund’s contractual and net management fee and net total expense level to those of its peer universe (the “Expense Universe”). In comparing the Fund’s net management fee to the Expense Universe, the Board noted that in the materials presented by management such fee was comprised of advisory fees. The Board also noted that the subadvisory fees were paid by VAIA, and will be paid by VIA, out of their management fees rather than paid separately by the Fund. In this regard, the Board took into account management’s discussion with respect to the advisory/subadvisory fee structure, including the amount of the advisory fee retained by VAIA and to be retained by VIA after payment of the subadvisory fee. The Board also considered the fee rates payable by comparable accounts managed by the Subadviser, if any.
In addition to the foregoing, the Board considered, among other data, the information set forth below with respect to the Fund’s fees and expenses. The Board took into account management’s discussion of the Fund’s expenses, including the type and size of the Fund relative to the other funds in its Expense Universe.
The Board noted that the Fund’s gross management fees were above the median of the Expense Universe and total expenses were at the median of the Expense Universe.
Profitability
The Board also considered certain information relating to profitability provided byVAIA. In this regard, the Board considered information regarding the overall profitability of VAIAfor its management of the Fund and the anticipated profitability of VIA, as well as its profits and those
CONSIDERATION OF ADVISORY AND SUBADVISORY AGREEMENTS
BY THE BOARD OF TRUSTEES OF
VIRTUS STONE HARBOR EMERGING MARKETS INCOME FUND
(Unaudited) (Continued)
of the Subadviser. In addition to the fees paid to VAIA and its affiliates, including the Subadviser, the Board considered other benefits derived by VAIA or its affiliates, and the anticipated benefits to be derived by VIA, from their relationships with the Fund. The Board reviewed the methodology used to allocate costs to the Fund, taking into account the fact that allocation methodologies are inherently subjective and various allocation methodologies may each be reasonable while producing different results. The Board concluded that the profitability to VAIAand its affiliates from the Fund, and the anticipated profitability to VIA, was within a reasonable range in light of the quality of the services rendered to the Fund and other factors considered.
In considering the profitability to the Subadviser in connection with its relationship to the Fund, the Board noted that the fee payable under the Subadvisory Agreement is paid by the Adviser out of the fee that the Adviser receives under the Advisory Agreement, and not by the Fund. In considering the fee payable by the Adviser to the Subadviser, the Board noted that, because the Subadviser is an affiliate of the Adviser, its profitability should be considered as part of the profitability of the Adviser and, therefore, the Board considered the profitability of the Adviser and the Subadviser together.
Economies of Scale
The Board considered the extent to which economies of scale would be realized as the Fund’s assets grow, and whether the fee levels reflect these economies of scale for the benefit of Fund shareholders. The Board noted that economies of scale may develop for certain funds as their assets increase and their fixed fund-level expenses decline as a percentage of assets, but that closed-end funds such as the Fund typically do not have the ability to increase substantially their asset base as do open-end funds.
The Board also considered the advisory fee rate in relation to the current asset size of the Fund, and whether any economies of scale exist at that size. The Board concluded that, given the Fund’s closed-end structure, no changes to the Fund’s advisory and subadvisory fee structure were necessary or advisable at this time. The Board agreed that it would be appropriate to monitor this matter in the event that the assets of the Fund were to increase substantially via the at the market offering, another secondary or rights offering, capital appreciation, reinvested dividends, the use of increased leverage or some other means.
Other Factors
The Board considered information regarding potential “fallout” or ancillary benefits that may be realized by each Adviser, the Subadviser and their respective affiliates as a result of their relationships with the Fund. The Board noted that an affiliate of the Advisers provides administrative services to the Fund. The Board noted management’s discussion of the fact that, while the Subadviser is an affiliate of each Adviser, there are no other direct benefits received by the Subadviser or each Adviser in providing investment advisory services to the Fund, other than the fees earned under the respective Agreement.
The Board concluded that potential “fallout” benefits that each Adviser and the Subadviser may receive, such as greater name recognition or increased ability to obtain research and brokerage services, as applicable, may, in some cases, benefit the Fund.
Conclusion
CONSIDERATION OF ADVISORY AND SUBADVISORY AGREEMENTS
BY THE BOARD OF TRUSTEES OF
VIRTUS STONE HARBOR EMERGING MARKETS INCOME FUND
(Unaudited) (Continued)
After considering all factors that it considered relevant, the Board, including a majority of the Independent Trustees, approved the Agreements with respect to the Fund.
CONSIDERATION OF ADVISORY AND SUBADVISORY AGREEMENTS
BY THE BOARD OF DIRECTORS OF
VIRTUS TOTAL RETURN FUND INC.
(Unaudited)
The Board of Directors (the “Board”) of Virtus Total Return Fund Inc. (the “Fund”) is responsible for determining whether to approve the continuation of the investment advisory agreement (the “Advisory Agreement”) between the Fund and Virtus Investment Advisers, LLC (formerly, Virtus Investment Advisers, Inc.) (“VIA”) and the continuation of each of the subadvisory agreements (the “Subadvisory Agreements”, and collectively with the Advisory Agreement, the “Agreements”) with Virtus Fixed Income Advisers, LLC, acting through its division Newfleet Asset Management, and Duff & Phelps Investment Management Company (each, a “Subadviser” and together, “Subadvisers”). At a meeting held on October 29, 2024, in a virtual meeting format, and at an in-person meeting held on November 18-20, 2024 (the “Meetings”), the Board, including a majority of the Directors who are not interested persons, as defined in the Investment Company Act of 1940, as amended (the “1940 Act”), of the Fund (the “Independent Directors”) considered and approved the continuation of each Agreement, as further discussed below.
In connection with the approval of the Agreements, the Board requested and evaluated information provided by VIA and the Subadvisers which, in the Board’s view, constituted information necessary for the Board to evaluate each of the Agreements. The Board also considered information furnished throughout the year at regular Board meetings with respect to the services provided by VIA and the Subadvisers, including quarterly performance reports prepared by management containing reviews of investment results and periodic presentations from each of the Subadvisers with respect to the Fund. The Board noted the affiliation of the Subadvisers with VIA and any potential conflicts of interest.
The Board was separately advised by independent legal counsel throughout the process. For each Agreement, the Board considered each of the relevant factors with respect to the Fund and its shareholders. The Board considered all factors that it considered relevant, including those discussed below. The Board did not identify any one factor as all-important or controlling, and each Director may have attributed different weights to the various factors. The Independent Directors also discussed the proposed approval of the Agreements in executive sessions with their independent legal counsel at which no representatives of VIA or the Subadvisers were present.
Nature, Extent and Quality of Services
The Board received in advance of the Meetings various data and information regarding the nature, extent and quality of the services provided under the Agreements, including responses by VIA and the Subadvisers to detailed requests submitted either by independent legal counsel to the Independent Directors on their behalf or VIA, as the case may be, as well as responses by VIA and the Subadvisers to follow-up questions. The Board also previously had received presentations by VIA’s and each Subadviser’s senior management personnel. The responses to the information requests and the presentations included, among other things, information about the background, experience and investment philosophy of senior management and investment personnel responsible for managing the Fund; the resources, operations and compliance structure of VIA and the Subadvisers; and the investment process, investment strategies, personnel, compliance procedures, and overall performance of VIA and the Subadvisers.
In considering the Agreement with VIA, the Board considered VIA’s process for supervising and managing the Subadvisers, including: (a) VIA’s ability to select and monitor the Subadvisers; (b) VIA’s ability to provide the services necessary to monitor each Subadviser’s compliance
CONSIDERATION OF ADVISORY AND SUBADVISORY AGREEMENTS
BY THE BOARD OF DIRECTORS OF
VIRTUS TOTAL RETURN FUND INC.
(Unaudited) (Continued)
with the Fund’s investment objectives, policies and restrictions, as well as to provide other oversight activities; and (c) VIA’s ability and willingness to identify instances in which a Subadviser should be replaced and to carry out the required changes. The Board also considered: (a) the experience and capability of VIA’s management and other personnel; (b) the financial condition of VIA, and whether it had the financial wherewithal to continue to provide a high level and quality of services to the Fund; (c) the quality of VIA’s own regulatory and legal compliance policies, procedures and systems; (d) the nature, extent and quality of administrative and other services provided by VIA and its affiliates to the Fund; (e) VIA’s supervision of the Fund’s other service providers; and (f) VIA’s risk management processes. It was noted that an affiliate of VIA serves as administrator to the Fund. The Board also took into account its knowledge of VIA’s management and the quality of the performance of VIA’s duties to the Fund and other funds managed through Board meetings, discussions, and reports during the preceding year, as well as information from the Fund’s Chief Compliance Officer regarding the Fund’s compliance policies and procedures established pursuant to Rule 38a-1 under the 1940 Act.
With respect to the services provided by each of the Subadvisers, the Board considered information provided to the Board by the Subadvisers, as well as information provided throughout the past year. The Board noted that each Subadviser provided information regarding its portfolio management services, compliance with the Fund’s investment policies and procedures, and compliance with applicable securities laws and assurances thereof. The Board also noted that VIA’s and each Subadviser’s management of the Fund is subject to the oversight of the Board and must be carried out in accordance with the Fund’s investment objectives, policies and restrictions. The Board considered each Subadviser’s portfolio management services, including: (a) the scope of its operations; (b) its portfolio management capabilities; (c) the breadth and depth of its management, investment and research personnel; and (d) the various support services that it provides to the Fund. The Board considered the investment management process and strategies employed by each Subadviser, and the experience and capability of each Subadviser’s management and other personnel committed by each Subadviser to the Fund. The Board also considered: (a) the quality of each Subadviser’s compliance policies, procedures, and systems; and (b) each Subadviser’s brokerage and trading practices, including with respect to best execution and soft dollars. The Board also took into account each Subadviser’s risk assessment and monitoring process.
Investment Performance
The Board considered performance reports and discussions at Board meetings throughout the year, as well as a report (the “Broadridge Report”) for the Fund prepared by Broadridge Financial Solutions, Inc., an independent third party provider of investment company data, furnished in connection with the contract renewal process. The Broadridge Report presented the Fund’s performance relative to a peer group of other closed-end funds (the “Performance Universe”) and relevant indexes, as selected by Broadridge. The Board also considered performance information presented by management and took into account management’s discussion of the same, including the effect of market conditions on the Fund’s performance. The Board noted that it also reviews on a quarterly basis detailed information about both the Fund’s performance results and portfolio composition, as well as each Subadviser’s investment strategies. The Board noted VIA’s expertise and resources in monitoring the performance,
CONSIDERATION OF ADVISORY AND SUBADVISORY AGREEMENTS
BY THE BOARD OF DIRECTORS OF
VIRTUS TOTAL RETURN FUND INC.
(Unaudited) (Continued)
investment style and risk-adjusted performance of each Subadviser. The Board also took into account its discussions with management regarding factors that contributed to the performance of the Fund.
The Board noted that the Fund’s performance prior to November 18, 2019 reflected the performance of a predecessor fund. The Board noted that the Fund underperformed the median of its Performance Universe for the year-to-date, 1-, 3-, 5-, and 10-year periods ended March 31, 2024. The Board also noted that the Fund underperformed its benchmark for the year-to date, 1-, 3-, and 5- year periods ended March 31, 2024 and outperformed its benchmark for 10-year period ended March 31, 2024. The Board discussed the Fund’s underperformance and the reasons therefor among themselves and with management.
Management Fees and Total Expenses
The Board considered the fees charged to the Fund for advisory services as well as the total expense level of the Fund. This information included comparisons of the Fund’s contractual and net management fee and net total expense level to those of its peer universe (the “Expense Universe”) and, with respect to the Fund’s contractual and net management fee, ranked according to quintile (the first quintile being lowest and, therefore, best in these expense component rankings, and fifth being highest and, therefore, worst in these expense component rankings). In comparing the Fund’s net management fee to the Expense Universe, the Board noted that in the materials presented by management such fee was comprised of advisory fees. The Board also noted that the subadvisory fees were paid by VIA out of its management fees rather than paid separately by the Fund. In this regard, the Board took into account management’s discussion with respect to the advisory/subadvisory fee structure, including the amount of the advisory fee retained by VIA after payment of the subadvisory fee. The Board also considered the fee rates payable by comparable accounts managed by each of the Subadvisers, if any.
In addition to the foregoing, the Board considered, among other data, the information set forth below with respect to the Fund’s fees and expenses. The Board took into account management’s discussion of the Fund’s expenses, including the type and size of the Fund relative to the other funds in its Expense Universe.
The Board noted that the Fund’s gross management fees were below the median of the Expense Universe, and that the Fund’s total expenses were above the median of the Expense Universe.
Profitability
The Board also considered certain information relating to profitability that had been provided by VIA. In this regard, the Board considered information regarding the overall profitability of VIA for its management of the Fund, as well as its profits and those of each Subadviser. In addition to the fees paid to VIA and its affiliates, including each of the Subadvisers, the Board considered other benefits derived by VIA or its affiliates from their relationships with the Fund. The Board reviewed the methodology used to allocate costs to the Fund, taking into account the fact that allocation methodologies are inherently subjective and various allocation methodologies may each be reasonable while producing different results. The Board concluded that the profitability to VIA and its affiliates from the Fund was within a reasonable range in light of the quality of the services rendered to the Fund by VIA and its affiliates, and other factors considered.
CONSIDERATION OF ADVISORY AND SUBADVISORY AGREEMENTS
BY THE BOARD OF DIRECTORS OF
VIRTUS TOTAL RETURN FUND INC.
(Unaudited) (Continued)
In considering the profitability to each Subadviser in connection with its relationship to the Fund, the Board noted that the fees payable under the Subadvisory Agreements are paid by VIA out of the fee that VIA receives under the Advisory Agreement, and not by the Fund. In considering the fee payable by VIA to each Subadviser, the Board noted that, because each Subadviser is an affiliate of VIA, its profitability should be considered as part of the profitability of VIA and, therefore, the Board considered the profitability of VIA and the Subadvisers together.
Economies of Scale
The Board considered the extent to which economies of scale would be realized as the Fund’s assets grow, and whether the fee levels reflect these economies of scale for the benefit of Fund shareholders. The Board noted that economies of scale may develop for certain funds as their assets increase and their fixed fund-level expenses decline as a percentage of assets, but that closed-end funds such as the Fund typically do not have the ability to increase substantially their asset base as do open-end funds.
The Board also considered the advisory fee rate in relation to the current asset size of the Fund, and whether any economies of scale exist at that size. The Board concluded that, given the Fund’s closed-end structure, no changes to the Fund’s advisory and subadvisory fee structure were necessary or advisable at this time. The Board agreed that it would be appropriate to monitor this matter in the event that the assets of the Fund were to increase substantially via a secondary offering, additional rights offering, capital appreciation, reinvested dividends, the use of increased leverage or some other means.
Other Factors
The Board considered information regarding potential “fallout” or ancillary benefits that may be realized by VIA, the Subadvisers and their respective affiliates as a result of their relationships with the Fund. The Board noted that an affiliate of VIA provides administrative services to the Fund. The Board noted management’s discussion of the fact that, while each Subadviser is an affiliate of VIA, there are no other direct benefits received by the Subadvisers or VIA in providing investment advisory services to the Fund, other than the fees earned under the respective Agreement.
The Board concluded that potential “fallout” benefits that VIA and the Subadvisers may receive, such as greater name recognition or increased ability to obtain research and brokerage services, as applicable, may, in some cases, benefit the Fund.
Conclusion
After considering all factors that it considered relevant, the Board, including a majority of the Independent Directors, approved the Agreements with respect to the Fund.
FUND MANAGEMENT TABLES (Unaudited)
Information pertaining to the Trustees/Directors and Officers of the Funds as of the date of the issuance of this report is set forth below. The address of each individual, unless otherwise noted, is c/o the respective Fund, One Financial Plaza, Hartford, CT 06103.
Independent Trustees
Name, Year of Birth,
Length of Time Served,
and Number of
Portfolios in Fund
Complex Overseen by
Trustee | Principal Occupation(s) During Past 5 Years | Other Trusteeships Held by Trustee |
Burke, Donald C.
YOB: 1960
Served Since:
VGI: 2020, Class II
EDF: 2020, Class II
ZTR: 2022, Class I
100 Portfolios | Private investor (since 2009). Formerly, President and Chief Executive Officer, BlackRock U.S. Funds (2007 to 2009); Managing Director, BlackRock, Inc. (2006 to 2009); and Managing Director, Merrill Lynch Investment Managers (1990 to 2006). | Director (2014 to 2021), Duff & Phelps Utility and Corporate Bond Trust Inc.; Director (since 2011), Avista Corp. (energy company); Trustee (2010 to 2014), Goldman Sachs Fund Complex; and Director (2006 to 2010), BlackRock Luxembourg and Cayman Funds. |
Cogan, Sarah E.
YOB: 1956
Served Since:
VGI: 2021, Class II
EDF: 2022, Class II
ZTR: 2021, Class I
89 Portfolios | Retired Partner, Simpson Thacher & Bartlett LLP (“STB”) (law firm) (since 2019); Director, Girl Scouts of Greater New York (since 2016); Trustee, Natural Resources Defense Council, Inc. (since 2013); and formerly, Partner, STB (1989 to 2018). | Trustee (since 2019), PIMCO Closed-End Funds* (30 portfolios). |
DeCotis, Deborah A.
YOB: 1952
Served Since:
VGI: 2021, Class I
EDF: 2022, Class I
ZTR: 2021, Class I
89 Portfolios | Director, Cadre Holdings Inc. (since 2022); Advisory Director, Morgan Stanley & Co., Inc. (since 1996); Member, Circle Financial Group (since 2009); Member, Council on Foreign Relations (since 2013); and Trustee, Smith College (since 2017). Formerly, Director, Watford Re (2017 to 2021); Co-Chair Special Projects Committee, Memorial Sloan Kettering (2005 to 2015); and Trustee, Stanford University (2010 to 2015). | Trustee (since 2011), PIMCO Closed-End Funds* (30 portfolios). |
FUND MANAGEMENT TABLES (Unaudited) (Continued)
Name, Year of Birth,
Length of Time Served,
and Number of
Portfolios in Fund
Complex Overseen by
Trustee | Principal Occupation(s) During Past 5 Years | Other Trusteeships Held by Trustee |
Drummond, F. Ford
YOB: 1962
Served Since:
VGI: 2021, Class III
EDF: 2022, Class III
ZTR: 2021, Class II
89 Portfolios | President (since 1998), F.G. Drummond Ranches, Inc.; Formerly, Director (1998 to 2008), The Cleveland Bank; and General Counsel (1998 to 2008), BMIHealth Plans (benefits administration). | President Elect (since 2023), Oklahoma Cattlemen’s Association; Chairman, Oklahoma Nature Conservancy (2019 to 2020); Director (since 2015), Texas and Southwestern Cattle Raisers Association; Trustee (since 2014), Frank Phillips Foundation; Trustee (since 2008), Oklahoma Nature Conservancy; Director (since 2011), Bancfirst Corporation; and Board Member (2006 to 2020), Oklahoma Water Resources Board. |
Mallin, John R.
YOB: 1950
Served Since:
VGI: 2020, Class II
EDF: 2022, Class I
ZTR: 2020, Class II
83 Portfolios | Partner/Attorney (since 2003), McCarter & English LLP (law firm) Real Property Practice Group; and Member (2014 to 2022), Counselors of Real Estate. | Director (since 2019), 1892 Club, Inc. (non-profit); Director (2013 to 2020), Horizons, Inc. (non-profit). |
McDaniel, Connie D.
YOB: 1958
Served Since:
VGI: 2020, Class III
EDF: 2022, Class II
ZTR: 2020, Class III
97 Portfolios | Retired (since 2013). Vice President, Chief of Internal Audit, Corporate Audit Department (2009 to 2013); Vice President Global Finance Transformation (2007 to 2009); and Vice President and Controller (1999 to 2007), The Coca-Cola Company. | Director (since 2019), Global Payments Inc.; Chairperson (since 2021), Governance & Nominating Committee, Global Payments Inc; Director (since 2021), North Florida Land Trust; Director (2014 to 2019), Total System Services, Inc.; Member (2011 to 2022) and Chair (2014 to 2016), Georgia State University, Robinson College of Business Board of Advisors; and Trustee (2005 to 2017), RidgeWorth Funds. |
McLoughlin, Philip R.
YOB: 1946
Served Since:
VGI: 2011, Class III
EDF: 2022, Class III
ZTR: 2014, Class II
Chairman
92 Portfolios | Private investor since 2010. | Director (1996 to 2021), Duff & Phelps Utility and Corporate Bond Trust Inc.; and Director (1991 to 2019) and Chairman (2010 to 2019), Lazard World Trust Fund (closed-end investment firm in Luxembourg). |
McNamara, Geraldine M.
YOB: 1951
Served Since:
VGI: 2020, Class I
EDF: 2022, Class III
ZTR: 2020, Class III
92 Portfolios | Private investor (since 2006); and Managing Director, U.S. Trust Company of New York (1982 to 2006). | Director (2003 to 2021), Duff & Phelps Utility and Corporate Bond Trust Inc. |
FUND MANAGEMENT TABLES (Unaudited) (Continued)
Name, Year of Birth,
Length of Time Served,
and Number of
Portfolios in Fund
Complex Overseen by
Trustee | Principal Occupation(s) During Past 5 Years | Other Trusteeships Held by Trustee |
Walton, R. Keith
YOB: 1964
Served Since:
VGI: 2016, Class I
EDF: 2022, Class I
ZTR: 2004, Class III
97 Portfolios | Senior Adviser (since 2022), Brightwood Capital LLC; Venture and Operating Partner (2020 to 2021), Plexo Capital, LLC; Venture Partner (2019 to 2021) and Senior Adviser (2018 to 2019), Plexo, LLC; and Partner (since 2006), Global Infrastructure Partners. Formerly, Managing Director (2020 to 2021), Lafayette Square Holding Company LLC; Senior Adviser (2018 to 2019), Vatic Labs, LLC; Executive Vice President, Strategy (2017 to 2019), Zero Mass Water, LLC; and Vice President, Strategy (2013 to 2017), Arizona State University. | Director (since 2017), certain funds advised by Bessemer Investment Management LLC (9 portfolios); Director (2006 to 2019), Systematica Investments Limited Funds; Director (2006 to 2017), BlueCrest Capital Management Funds; and Trustee (2014 to 2017), AZ Service. |
Zino, Brian T.
YOB: 1952
Served Since:
VGI: 2016, Class I
EDF: 2022, Class II
ZTR: 2014, Class III
89 Portfolios | Retired. Various roles at J. & W. Seligman & Co. Incorporated (1982 to 2009), including President (1994 to 2009). | Trustee (since 2011), Bentley University; Director (1986 to 2009) and President (1994 to 2009), J&W Seligman Co. Inc.; Director (1998 to 2009), Chairman (2002 to 2004) and Vice Chairman (2000 to 2002), ICI Mutual Insurance Company; and Member, Board of Governors of ICI (1998 to 2008). |
* PIMCO Closed End Funds are not part of the Virtus’ Fund Complex: PCM Fund, Inc.; PIMCO Access Income Fund; PIMCO California Flexible Municipal Income Fund; PIMCO California Municipal Income Fund; PIMCO California Municipal Income Fund II; PIMCO California Municipal Income Fund Ill; PIMCO Corporate & Income Strategy Fund; PIMCO Corporate & Income Opportunity Fund; PIMCO Dynamic Income Fund; PIMCO Dynamic Income Opportunities Fund; PIMCO Dynamic Income Strategy Fund; PIMCO Flexible Credit Income Fund; PIMCO Flexible Emerging Markets Income Fund; PIMCO Flexible Municipal Income Fund; PIMCO Global Stocks PLUS® & Income Fund; PIMCO High Income Fund; PIMCO Income Strategy Fund; PIMCO Income Strategy Fund II; PIMCO Managed Accounts Trust (5 portfolios); PIMCO Municipal Income Fund; PIMCO Municipal Income Fund II; PIMCO Municipal Income Fund III; PIMCO New York Municipal Income Fund; PIMCO New York Municipal Income Fund II; PIMCO New York Municipal Income Fund Ill; and PIMCO Strategic Income Fund, Inc.
FUND MANAGEMENT TABLES (Unaudited) (Continued)
Interested Trustee
The individual listed below is an “interested person” of the Fund, as defined in Section 2(a)(19) of the 1940 Act, as amended, and the rules and regulations thereunder.
Name, Year of Birth,
Length of Time Served
and Number of
Portfolios in Fund
Complex Overseen by
Trustee | Principal Occupation(s)
During Past
5 Years | Other Trusteeships Held by Trustee |
Aylward, George R.**
Trustee and President
YOB: 1964
Served Since:
VGI: 2014, Class III
EDF: 2022, Class I
ZTR: 2006, Class II
110 Portfolios | Director, President and Chief Executive Officer (since 2008), Virtus Investment Partners, Inc. and/or certain of its subsidiaries; and various senior officer positions with Virtus affiliates (since 2005). | Director (since 2023), Stone Harbor Investment Funds plc (12 sub-funds), Stone Harbor Global Funds plc (3 sub-funds) and Virtus Global Funds ICAV (8 sub-funds); Member (since 2021), Board of Governors of the Investment Company Institute; and Director (since 2013), Virtus Global Funds, plc (5 sub-funds). |
** Mr. Aylward is an “interested person,” as defined in the 1940 Act, by reason of his position as President and Chief Executive Officer of Virtus Investment Partners, Inc. (“Virtus”), the ultimate parent company of the Adviser, and various positions with its affiliates, including the Adviser.
FUND MANAGEMENT TABLES (Unaudited) (Continued)
Officers Who Are Not Trustees
| Name and Year of Birth | Position(s) Held
with Fund and
Length of
Time Served | Principal Occupation(s) During Past 5 Years |
Batchelar, Peter J.
YOB: 1970 | Senior Vice President (since 2017) and Vice President (2016 to 2017). | Senior Vice President, Product Development (since 2017), Vice President, Product Development (2008 to 2017) and various officer positions (since 2008), Virtus Investment Partners, Inc. and/or certain of its subsidiaries; and various officer positions (since 2008) of various registered funds advised by subsidiaries of Virtus Investment Partners, Inc. |
Bradley, W. Patrick
YOB: 1972 | Executive Vice President (since 2016); Senior Vice President (2013 to 2016); Vice President (2011 to 2013); and Chief Financial Officer and Treasurer (since 2011). | Executive Vice President, Fund Services (since 2016), Senior Vice President, Fund Services (2010 to 2016) and various officer positions (since 2004), Virtus Investment Partners, Inc. and/or certain of its subsidiaries; Director (since 2023), Stone Harbor Investment Funds plc and Stone Harbor Global Funds plc; Director (since 2019), Virtus Global Funds ICAV; Director (since 2013), Virtus Global Funds, plc; various officer positions (since 2006) of various registered funds advised by subsidiaries of Virtus Investment Partners, Inc.; and Member (since 2022), BNY Mellon Asset Servicing Client Advisory Board. |
Branigan, Timothy
YOB: 1976 | Vice President and Fund Chief Compliance Officer (since 2022) and Assistant Vice President and Deputy Fund Chief Compliance Officer (March to May 2022). | Various officer positions (since 2019) of various registered funds advised by subsidiaries of Virtus Investment Partners, Inc. |
Chisolm, Daphne
YOB: 1969 | Vice President, Counsel and Assistant Secretary (since 2023). | Vice President and Senior Counsel (since 2023), Virtus Investment Partners, Inc. and/or certain of its subsidiaries; Attorney at Law engaged in private practice as a solo practitioner (2018 to 2023); and various officer positions (since 2023) of various registered funds advised by subsidiaries of Virtus Investment Partners, Inc. |
Fromm, Jennifer
YOB: 1973 | Vice President, Counsel and Assistant Secretary (since 2024); Vice President, Chief Legal Officer, Counsel and Secretary (2020 to 2024). | Vice President (since 2016) and Senior Counsel, Legal (since 2007) and various officer positions (since 2008), Virtus Investment Partners, Inc. and/or certain of its subsidiaries; and various officer positions (since 2008) of various registered funds advised by subsidiaries of Virtus Investment Partners, Inc. |
Hackett, Amy
YOB: 1968 | Vice President (since 2013) and Assistant Treasurer (since 2011). | Vice President (since 2010) and Assistant Vice President (2007 to 2010), Fund Services, Virtus Investment Partners, Inc. and/or certain of its subsidiaries; and various officer positions (since 2007) of various registered funds advised by subsidiaries of Virtus Investment Partners, Inc. |
FUND MANAGEMENT TABLES (Unaudited) (Continued)
| Name and Year of Birth | Position(s) Held
with Fund and
Length of
Time Served | Principal Occupation(s) During Past 5 Years |
Krishnan, Suneeta
YOB: 1965 | Vice President (since 2018) and Assistant Treasurer (since 2011). | Vice President (since 2017) and Assistant Treasurer (since 2007), Mutual Fund Administration, Virtus Investment Partners, Inc. and/or certain of its subsidiaries; and various officer positions (since 2009) of various registered funds advised by subsidiaries of Virtus Investment Partners, Inc. |
Rahman, Mahmood
YOB: 1967 | Assistant Vice President (since 2021). | Vice President (since 2023), Tax Director (since 2020) and Assistant Vice President, Fund Administration (2020 to 2023), Virtus Investment Partners, Inc.; Assistant Vice President (since 2021) of various registered funds advised by subsidiaries of Virtus Investment Partners, Inc.; and Assistant Treasurer and Tax Director, Grantham, Mayo, Van Otterloo & Co. LLC (2007 to 2019). |
Santoro, Kathryn
YOB: 1974 | Vice President, Chief Legal Officer, Counsel and Secretary (since 2024). | Vice President and Senior Attorney (since 2024), Virtus Investment Partners, Inc. and/or certain of its subsidiaries; and various officer positions (since 2024) of various registered funds advised by subsidiaries of Virtus Investment Partners, Inc.; Vice President, General Counsel, and Secretary, Anuvu Corp. (2021 to 2023); Managing Counsel, Janus Henderson Investors and various officer positions of registered funds advised by Janus Henderson Investors (2016 to 2020). |
Short, Julia R.
YOB: 1972 | Senior Vice President (since 2018). | Senior Vice President, Product Development (since 2017), Virtus Investment Partners, Inc. and/or certain of its subsidiaries; Senior Vice President (since 2017) of various registered funds advised by subsidiaries of Virtus Investment Partners, Inc.; and Managing Director, Product Manager, RidgeWorth Investments (2004 to 2017). |
Smirl, Richard W.
YOB: 1967 | Executive Vice President (since 2021). | Chief Operating Officer (since 2021), Virtus Investment Partners, Inc.; Executive Vice President (since 2021), Virtus Investment Partners, Inc. and/or certain of its subsidiaries; Executive Vice President (since 2021) of various registered funds advised by subsidiaries of Virtus Investment Partners, Inc.; Chief Operating Officer (2018 to 2021), Russell Investments; Executive Director (Jan. to July 2018), State of Wisconsin Investment Board; and Partner and Chief Operating Officer (2004 to 2018), William Blair Investment Management. |
Thaker, Nikita K.
YOB: 1978 | Vice President and Controller (since 2021) and Assistant Treasurer (since 2017) | Vice President (since 2021) and Assistant Vice President (2016 to 2021), Mutual Fund Administration, Virtus Investment Partners, Inc. and/or certain of its subsidiaries; and various officer positions (since 2013) of various registered funds advised by subsidiaries of Virtus Investment Partners, Inc. |
THIS PAGE INTENTIONALLY BLANK.
THIS PAGE INTENTIONALLY BLANK.
THIS PAGE INTENTIONALLY BLANK.
101 Munson Street
Greenfield, MA 01301-9668
Board of Trustees/Directors
George R. Aylward
Donald C. Burke
Sarah E. Cogan
Deborah A. DeCotis
F. Ford Drummond
John R. Mallin
Connie D. McDaniel, Vice Chair
Philip R. McLoughlin, Chair
Geraldine M. McNamara
R. Keith Walton
Brian T. Zino
Principal Officers
George R. Aylward, President and Chief Executive Officer
Peter Batchelar, Senior Vice President
W. Patrick Bradley, Executive Vice President, Chief Financial Officer, and Treasurer
Timothy Branigan, Vice President and Fund Chief Compliance Officer
Kathryn L. Santoro, Vice President, Chief Legal Officer, Counsel and Secretary
Julia R. Short, Senior Vice President
Richard W. Smirl, Executive Vice President
Nikita Thaker, Vice President, Controller and Assistant Treasurer
Investment Advisers
Virtus Investment Advisers, LLC
One Financial Plaza
Hartford, CT 06103-2608
Administrator
Virtus Fund Services, LLC
One Financial Plaza
Hartford, CT 06103
Custodian
The Bank of New York Mellon
240 Greenwich Street
New York, NY 10286-1048
Transfer Agent
Computershare Trust Company, N.A.
P.O. Box 43078
Providence, RI 02940-3078
Independent Registered Public
Accounting Firm
PricewaterhouseCoopers LLP
2001 Market Street
Philadelphia, PA 19103-7042
How to Contact Us
| Shareholder Services | 1-866-270-7788 |
| Website | www.Virtus.com |
Important Notice to Shareholders
The Securities and Exchange Commission has modified mailing regulations for semiannual and annual shareholder fund reports to allow mutual fund companies to send a single copy of these reports to shareholders who share the same mailing address. If you would like additional copies, please call Mutual Fund Services at 1-866-270-7788.
c/o Computershare Investor Services
P.O. Box 43078
Providence, RI 02940-3078
For more information about
Virtus Closed-End Funds, please
contact us at 1-866-270-7788
or closedendfunds@virtus.com
or visit Virtus.com.
Virtus Stone Harbor Emerging Markets Income Fund (the “Fund”)
Annual Report dated November 30, 2024 – Additional Information
UPDATE TO INFORMATION IN REGISTRATION STATEMENT AND PROSPECTUS SUPPLEMENT
The following sections titled “Summary of Fund Expenses, “Senior Securities” and “Net Asset Value and Market Price Information” are being provided as an update to the information provided in the Fund’s registration statement on Form N-2, File No. 333-281241 and accompanying prospectus supplement pertaining to the offer and sale of the Fund’s common shares (“Common Shares”) in an at-the-market offering program (the “Offering”) and are incorporated by reference therein.
SUMMARY OF FUND EXPENSES (UNAUDITED)
The following table is intended to assist investors in understanding the annualized fees and expenses that an investor in the Fund’s Common Shares would bear, directly or indirectly. The table is based on the Fund’s capital structure as of November 30, 2024.
| | | | |
SHAREHOLDER TRANSACTION EXPENSES |
Sales Load (as a percentage of offering price)1 | | 1.00% | | |
Offering Expenses Borne by the Fund (as a percentage of offering price)2 | | 0.25% | | |
Dividend Reinvestment and Cash Purchase Plan Fees3 | | None | | |
ANNUAL EXPENSES (as a percentage of net assets attributable to Common Shares) | | |
Management Fees4 | | 1.28% | | |
Administration Fees4 | | 0.12% | | |
Interest Payments on Borrowed Funds5 | | 1.69% | | |
Other Expenses6 | | 0.19% | | |
TOTAL ANNUAL EXPENSES | | 3.28% | | |
| 1 | Represents the estimated commission that the Fund will pay to Foreside Fund Services, LLC. with respect to the Common Shares being sold in this offering. Pursuant to the Distribution Agreement, Foreside will be entitled to compensation of 1.00% of the gross sales price per share of Common Shares sold under the Distribution Agreement. Commission payments will reduce the net proceeds from this offering and will be indirectly borne by all holders of the Fund’s Common Shares. |
| 2 | Offering expenses payable by the Fund will reduce the net proceeds from this offering and will be indirectly borne by all holders of the Fund’s Common Shares. |
| 3 | There will be no brokerage charges with respect to Common Shares issued directly by the Fund under its dividend reinvestment plan. You will pay brokerage charges in connection with open market purchases or if you direct the Plan Administrator, as defined below, to sell your Common Shares held in a dividend reinvestment account. |
| 4 | The contractual management fee and administration fee are asset-based fees calculated using the average daily Managed Assets (defined as the average daily value of the Fund’s total assets (including any assets attributable to any leverage used) minus the Fund’s accrued liabilities (other than Fund liabilities incurred for any leverage)), of the Fund. The calculation reflects the Fund’s use of leverage during the twelve months ended November 30, 2024. The management fee cannot exceed 1.50% of the Fund’s net assets. |
| 5 | Assumed Borrowings, as defined below, in an aggregate amount of 28% of average Net Assets for the twelve months ended November 30, 2024. The expenses and rates associated with leverage may vary as and when Borrowings are made. |
| 6 | Other Expenses are based on amounts incurred for the fiscal year ended November 30, 2024. |
THE FOREGOING FEE TABLE IS INTENDED TO ASSIST FUND INVESTORS IN UNDERSTANDING THE VARIOUS COSTS AND EXPENSES THAT AN INVESTOR IN THE FUND WILL BEAR DIRECTLY OR INDIRECTLY.
Expense Example
The following example illustrates the expenses that a shareholder would pay on a $1,000 investment that is held for the time periods provided in the table. The examples assume that all dividends and other distributions are reinvested and that the Fund’s Total Annual Expenses of 3.28% remain the same for the time periods shown. The example set forth below assumes a 5% annual rate of return. Actual annual rates of return may be greater or lesser than 5%.
The example should not be considered a representation of future expenses. Actual expenses may be greater or lesser than those shown.
The following example assumes a sales load of 1.00% and estimated costs of this offering of 0.25% as a percentage of the Common Shares offering price:
| | | | | | | | |
| | | 1 Year | | 3 Years | | 5 Years | | 10 Years |
| You would pay the following expenses on a $1,000 investment, assuming a 5% annual return | | $45 | | $112 | | $182 | | $366 |
SENIOR SECURITIES (UNAUDITED)
The following table sets forth information about the Fund’s outstanding senior securities at the end of each fiscal year for the last ten fiscal years. The Fund’s senior securities during the periods shown are comprised of borrowings that constitute a “senior security” as defined in the 1940 Act. The information in the table below was derived from the Fund’s audited financial statements for each fiscal year in the ten-year period ended November 30, 2024.
| | | | | | | | | | |
Senior Securities Representing Indebtedness | |
Fiscal Year Ended | | Title of Security | |
| Total Principal Amount
Outstanding (1) |
| |
| Asset Coverage Per
$1,000 of Principal Amount (2) |
|
November 30, 2024 | | Reverse repurchase agreements | | $ | 49,554,000 | | | $ | 3,806 | |
November 30, 2023 | | Reverse repurchase agreements | | $ | 14,172,000 | | | $ | 6,215 | |
November 30, 2022 | | Reverse repurchase agreements | | $ | 28,600,000 | | | $ | 3,493 | |
November 30, 2021 | | Reverse repurchase agreements | | $ | 45,481,000 | | | $ | 3,312 | |
November 30, 2020 | | Reverse repurchase agreements | | $ | 46,057,000 | | | $ | 3,545 | |
November 30, 2019 | | Reverse repurchase agreements | | $ | 8,976,000 | | | $ | 17,290 | |
November 30, 2018 | | Reverse repurchase agreements | | $ | 84,687,000 | | | $ | 3,019 | |
November 30, 2017 | | Reverse repurchase agreements | | $ | 64,505,000 | | | $ | 4,632 | |
November 30, 2016 | | Reverse repurchase agreements | | $ | 100,841,000 | | | $ | 3,161 | |
November 30, 2015 | | Reverse repurchase agreements | | $ | 89,815,000 | | | $ | 3,558 | |
| 1 | Principal amount outstanding represents the principal amount as of the end of the relevant fiscal year owed by the Fund to counterparties under reverse repurchase agreements in place at the time. |
| 2 | Represents the value of net assets plus the total principal amount outstanding at the end of the period divided by the total principal amount outstanding at the end of the period, multiplied by $1,000. |
NET ASSET VALUE AND MARKET PRICE INFORMATION (UNAUDITED)
The following table sets forth for the quarters indicated, the high and low sale prices on the New York Stock Exchange per common share and the net asset value and the premium or discount from net asset value per share at which the common shares were trading, expressed as a percentage of net asset value, at each of the high and low sale prices provided.
| | | | | | | | | | | | | | | | | | | | | | | | |
Fiscal Quarter | | Market Price | | NAV per Common
Share on Date of Market
Price High and Low | | Premium/(Discount) on
Date of Market Price
High and Low |
| | | | | | |
| | | High | | Low | | High | | Low | | High | | Low |
November 30, 2024 | | $ | 5.32 | | | $ | 4.77 | | | $ | 4.79 | | | $ | 4.71 | | | | 11.06% | | | | 1.27% | |
August 31, 2024 | | $ | 5.68 | | | $ | 5.11 | | | $ | 4.56 | | | $ | 4.53 | | | | 24.56% | | | | 12.80% | |
May 31, 2024 | | $ | 5.67 | | | $ | 4.81 | | | $ | 4.71 | | | $ | 4.59 | | | | 20.38% | | | | 4.79% | |
February 29, 2024 | | $ | 4.81 | | | $ | 4.23 | | | $ | 4.55 | | | $ | 4.44 | | | | 5.71% | | | | (4.73%) | |
November 30, 2023 | | $ | 4.83 | | | $ | 3.60 | | | $ | 4.22 | | | $ | 4.01 | | | | 14.45% | | | | (15.49%) | |
August 31, 2023 | | $ | 4.95 | | | $ | 4.00 | | | $ | 4.36 | | | $ | 4.01 | | | | 13.53% | | | | (0.25%) | |
May 31, 2023 | | $ | 5.03 | | | $ | 3.97 | | | $ | 4.35 | | | $ | 3.96 | | | | 15.63% | | | | (0.50%) | |
February 28, 2023 | | $ | 5.51 | | | $ | 4.07 | | | $ | 4.62 | | | $ | 4.22 | | | | 19.26% | | | | (3.55%) | |
Item 2. Code of Ethics.
| | (a) | The registrant, as of the end of the period covered by this report, has adopted a code of ethics that applies to the registrant’s principal executive officer, principal financial officer, principal accounting officer or controller, or persons performing similar functions, regardless of whether these individuals are employed by the registrant or a third party (the “Code of Ethics”). |
| | (c) | There have been no amendments, during the period covered by this report, to a provision of the Code of Ethics that applies to the registrant’s principal executive officer, principal financial officer, principal accounting officer or controller, or persons performing similar functions, regardless of whether these individuals are employed by the registrant or a third party, and that relates to any element of the code of ethics definition enumerated in Item 2(b) of Form N-CSR. |
| | (d) | The registrant has not granted any waivers, including an implicit waiver, from a provision of the code of ethics that applies to the registrant’s principal executive officer, principal financial officer, principal accounting officer or controller, or persons performing similar functions, regardless of whether these individuals are employed by the registrant or a third party, that relates to one or more of the items set forth in Item 2(b) of Form N-CSR. |
| | (f) | A copy of the Code of Ethics is filed as an Exhibit. |
Item 3. Audit Committee Financial Expert.
(a)(1) The Registrant’s Board of Directors (the “Board”) has determined that the Registrant has at least one “audit committee financial expert” serving on its Audit Committee.
| (a)(2) | As of the end of the period covered by the report, the registrant’s Board determined that each of Donald C. Burke and Brian T. Zino is qualified to serve as an audit committee financial expert serving on its audit committee and that each is “independent,” as defined by Item 3 of Form N-CSR. |
(a)(3) Not applicable.
Item 4. Principal Accountant Fees and Services.
Audit Fees
| | (a) | The aggregate fees billed for each of the last two fiscal years for professional services rendered by the principal accountant for the audit of the registrant’s annual financial statements or services that are normally provided by the accountant in connection with statutory and regulatory filings or engagements for those fiscal years are $31,848 for 2024 and $33,881 for 2023. |
Audit-Related Fees
| | (b) | The aggregate fees billed in each of the last two fiscal years for assurance and related services by the principal accountant that are reasonably related to the performance of the audit of the registrant’s financial statements and are not reported under paragraph (a) of this Item are $3,500 for 2024 and $7,931 for 2023. Such audit-related fees include out of pocket expenses. |
Tax Fees
| | (c) | The aggregate fees billed in each of the last two fiscal years for professional services rendered by the principal accountant for tax compliance, tax advice, and tax planning are $ 5,147 for 2024 and $ 5,147 for 2023. |
“Tax Fees” are those primarily associated with review of the Fund’s tax provision and qualification as a regulated investment company (RIC) in connection with audits of the Fund’s financial statement, review of year-end distributions by the Fund to avoid excise tax, periodic discussion with management on tax issues affecting the Fund and reviewing and signing the Fund’s federal income tax returns.
All Other Fees
| | (d) | The aggregate fees billed in each of the last two fiscal years for products and services provided by the principal accountant, other than the services reported in paragraphs (a) through (c) of this Item are $0 for 2024 and $0 for 2023. |
| (e)(1) | Disclose the audit committee’s pre-approval policies and procedures described in paragraph (c)(7) of Rule 2-01 of Regulation S-X. |
The Virtus Total Return Fund Inc. (the “Fund”) Board has adopted policies and procedures with regard to the pre-approval of services provided by PwC. Audit, audit-related and tax compliance services provided to the Fund on an annual basis require specific pre-approval by the Board. As noted above, the Board must also approve other non-audit services provided to the Fund and those non-audit services provided to the Fund’s Affiliate Service Providers that related directly to the operations and financial reporting of the Fund. Certain of these non-audit services that the Board believes are a) consistent with the SEC’s auditor independence rules and b) routine and recurring services that will not impair the independence of the independent auditors may be approved by the Board without consideration on a specific case-by-case basis (“general pre-approval”).
The Audit Committee has determined that the Chair of the Audit Committee, may provide pre-approval for such services that meet the above requirements but are not included in the general pre-approval in the event such approval is sought between regularly scheduled meetings. In any event, the Board is informed of each service approved subject to general pre-approval at the next regularly scheduled in-person board meeting.
| (e)(2) | The percentage of services described in each of paragraphs (b) through (d) of this Item that were approved by the audit committee pursuant to paragraph (c)(7)(i)(C) of Rule 2-01 of Regulation S-X are as follows: |
| | (f) | The percentage of hours expended on the principal accountant’s engagement to audit the registrant’s financial statements for the most recent fiscal year that were attributed to work performed by persons other than the principal accountant’s full-time, permanent employees was less than fifty percent. |
| | (g) | The aggregate non-audit fees billed by the registrant’s accountant for services rendered to the registrant, and rendered to the registrant’s investment adviser (not including any subadviser whose role is primarily portfolio management and is subcontracted with or overseen by another investment adviser), and any entity controlling, controlled by, or under common control with the adviser that provides ongoing services to the registrant for each of the last two fiscal years of the registrant was $5,147 for 2024 and $5,147 for 2023. |
| | (h) | The registrant’s audit committee of the Board has considered whether the provision of non-audit services that were rendered to the registrant’s investment adviser (not including any subadviser whose role is primarily portfolio management and is subcontracted with or overseen by another investment adviser), and any entity controlling, controlled by, or under common control with the investment adviser that provides ongoing services to the registrant that were not pre-approved pursuant to paragraph (c)(7)(ii) of Rule 2-01 of Regulation S-X is compatible with maintaining the principal accountant’s independence. |
Item 5. Audit Committee of Listed Registrants.
(a) The registrant has a separately designated audit committee. During the period covered by this report, the members of the audit committee were Donald C. Burke, Deborah A. DeCotis, John R. Mallin, Geraldine M. McNamara and Brian T. Zino.
(b) Not applicable.
Item 6. Investments.
| (a) | Schedule of Investments in securities of unaffiliated issuers as of the close of the reporting period is included as part of the report to shareholders filed under Item 1(a) of this form. |
Item 7. Financial Statements and Financial Highlights for Open-End Management Investment Companies.
| (a) | Not applicable for Closed-End Management Investment Companies. |
| (b) | Not applicable for Closed-End Management Investment Companies. |
Item 8. Changes in and Disagreements with Accountants for Open-End Management Investment Companies.
Not applicable for Closed-End Management Investment Companies.
Item 9. Proxy Disclosures for Open-End Management Investment Companies.
Not applicable for Closed-End Management Investment Companies.
Item 10. Remuneration Paid to Directors, Officers, and Others of Open-End Management Investment Companies.
Not applicable for Closed-End Management Investment Companies.
Item 11. Statement Regarding Basis for Approval of Investment Advisory Contract.
The information required by this Item is included as part of the annual report to shareholders filed under Item 1 of this Form N-CSR.
Item 12. Disclosure of Proxy Voting Policies and Procedures for Closed-End Management Investment Companies.
The Fund has adopted a Policy Regarding Proxy Voting (the “Policy”) stating the Fund’s intention to exercise stock ownership rights with respect to portfolio securities in a manner that is reasonably anticipated to further the best economic interests of shareholders of the Fund. The Fund or its voting delegates will endeavor to analyze and vote all proxies that are likely to have financial implications, and where appropriate, to participate in corporate governance, shareholder proposals, management communications and legal proceedings. The Fund or its voting delegates must also identify potential or actual conflicts of interest in voting proxies and must address any such conflict of interest in accordance with the Policy.
In the absence of a specific direction to the contrary from the Board, the adviser or the subadviser that is managing the Fund is responsible for voting proxies for the Fund, or for delegating such responsibility to a qualified, independent organization engaged by the Adviser or respective subadviser to vote proxies on its behalf. The applicable voting party will vote proxies in accordance with the Policy or its own policies and procedures, which must be reasonably designed to further the best economic interests of the affected fund shareholders. Because the Policy and the applicable voting party’s policies and procedures used to vote proxies for the funds both are designed to further the best economic interests of the affected fund shareholders, they are not expected to conflict with one another although the types of factors considered by the applicable voting party under its own policies and procedures may be in addition to or different from the ones listed below for the Policy.
The Policy specifies the types of factors to be considered when analyzing and voting proxies on certain issues when voting in accordance with the Policy, including, but not limited to:
| | • | | Anti-takeover measures – the overall long-term financial performance of the target company relative to its industry competition. |
| | • | | Corporate Governance Matters – tax and economic benefits of changes in the state of incorporation; dilution or improved accountability associated with changes in capital structure. |
| | • | | Contested elections – the qualifications of all nominees; independence and attendance record of board and key committee members; entrenchment devices in place that may reduce accountability. |
| | • | | Stock Option and Other Management Compensation Issues—executive pay and spending on perquisites, particularly in conjunction with sub-par performance and employee layoffs. |
| | • | | Shareholder proposals – whether the proposal is likely to enhance or protect shareholder value; whether identified issues are more appropriately or effectively addressed by legal or regulatory changes; whether the issuer has already appropriately addressed the identified issues; whether the proposal is unduly burdensome or prescriptive; whether the issuer’s existing approach to the identified issues is comparable to industry best practice. |
The Fund and its voting delegates seek to avoid actual or perceived conflicts of interest of Fund shareholders, on the one hand, and those of the adviser, subadviser, other voting delegate, Distributor, or any affiliated person of the Fund, on the other hand.
Depending on the type and materiality, the Board or its delegates may take the following actions, among others, in addressing any material conflicts of interest that arise with respect to voting (or directing voting delegates to vote): (i) rely on the recommendations of an established, independent third party proxy voting vendor; (ii) vote pursuant to the recommendation of the proposing delegate; (iii) abstain; (iv) where two or more delegates provide conflicting requests, vote shares in proportion to the assets under management of each proposing delegate; (v) vote shares in the same proportion as the vote of all other shareholders of such issuer; or (vi) the adviser may vote proxies where the subadviser has a direct conflict of interest. The Policy requires each adviser/subadviser that is a voting delegate to notify the Chief Compliance Officer of the Fund (or, in the case of a subadviser, the Chief Compliance Officer of the adviser) of any actual or potential conflict of interest that is identified, and provide a recommended course of action for protecting the best interests of the affected fund’s shareholders. No adviser/subadviser or other voting delegate may waive any conflict of interest or vote any conflicted proxies without the prior written approval of the Board (or the Executive Committee thereof) or the Chief Compliance Officer of the Fund.
The Policy further imposes certain record-keeping and reporting requirements on each adviser/subadviser or other voting delegate.
Information regarding how the funds voted proxies relating to portfolio securities during the most recent 12-month period ended September 30 will be available, no later than August 31 of each year, free of charge by calling, toll-free, 866.270.7788, or on the SEC’s Web site at www.sec.gov.
During the period of the report, any proxies for the Fund were handled by the Fund’s subadvisers, Duff & Phelps Investment Management Co. (“Duff & Phelps”) and/or Newfleet Asset Management, a
division of Virtus Fixed Income Advisers, LLC (“Newfleet”). Following are summaries of their proxy voting policies.
Duff & Phelps
Duff & Phelps has adopted proxy voting guidelines (the “Guidelines”) in an effort to ensure shares are voted in the best interests of its clients and the value of the investment, and to address any real or perceived conflicts of interest in proxy voting. The Guidelines allow Duff & Phelps to utilize a qualified, non-affiliated third-party vendor to assist in the review of proxy proposals and making of voting recommendations on behalf of clients consistent with the Guidelines to address conflicts of interest or potential conflicts of interest relating to proxy proposals. Generally, where the Guidelines outline a voting position, either as for or against such proxy proposal, voting will be according to either the Guidelines or the third-party vendor’s policies. The Proxy Committee will vote the proxy according to either its determination of the client’s best interests or by client direction. In performing its analysis of how to vote on a proposal, the Proxy Committee will begin by considering the voting recommendation of the third-party vendor and will then override such vendor’s recommendation if the Proxy Committee determines that such recommendation is not in the best interest of Duff & Phelps clients. The Proxy Committee incorporates consideration of ESG issues into its evaluation of recommendations of the proxy advisory firm and the voting of proxies generally. The firm has additionally adopted proxy voting guidelines that serve as a guide to voting with regard to certain recurring proposals. The vote the Proxy Committee selects will depend on the facts and circumstances of each situation as well as requirements of applicable law.
Duff & Phelps may choose not to vote proxies in certain situations or for certain accounts, such as when:
| • | it deems the cost of voting to exceed any anticipated benefit to client; |
| • | a proxy is received for a security it no longer manages due to the entire position being sold; or |
| • | exercising voting rights could restrict the ability of the portfolio manager to freely trade the security. |
Duff & Phelps may also not be able to vote proxies for any client account that participates in securities lending programs.
A complete copy of Duff & Phelps’ current Proxy Voting Policies, Procedures and Guidelines may be obtained by sending a written request to Duff & Phelps Investment Management Co., Attn: Compliance, 10 South Wacker Drive, 19th Floor, Chicago, Illinois 60606.
Newfleet
Although the nature of Newfleet’s portfolios is such that ballots are rarely required, Newfleet has adopted pre-determined proxy voting guidelines (the “Guidelines”) to make every effort to ensure the manner in which shares are voted is in the best interest of its clients and the value of the investment. Under the Guidelines, Newfleet sometimes delegates to a non-affiliated third party vendor the responsibility to review proxy proposals and make voting recommendations on behalf of Newfleet. Newfleet may also vote a proxy contrary to the Guidelines if it determines that such action in the best interest of its clients including the Fund.
A complete copy of Newfleet’s current Proxy Voting Policies & Procedures is available by sending a written request to Newfleet Asset Management, Attn: Compliance Department, One Financial Plaza, Hartford, CT 06103. Email requests may be sent to: james.sena@virtus.com.
Item 13. Portfolio Managers of Closed-End Management Investment Companies.
| (a)(1) | Identification of Portfolio Manager(s) or Management Team Members and Description of Role of Portfolio Manager(s) or Management Team Members |
As of the date of filing this report, the Fund’s subadvisers are Duff & Phelps Investment Management Co. (“Duff & Phelps”) and Newfleet Asset Management, LLC (“Newfleet”). The names, titles and length of service of the person or persons employed by or associated with the registrant or an investment adviser of the registrant who are primarily responsible for the day-to-day management of the registrant’s portfolio (“Portfolio Manager”) and each Portfolio Manager’s business experience during the past 5 years as of the date of filing of this report:
Duff & Phelps
Connie M. Luecke, CFA
Connie Luecke is a senior managing director and senior portfolio manager at Duff & Phelps Investment Management Co., an investment management affiliate of Virtus. She is the senior portfolio manager for the firm’s global listed infrastructure strategies and has been chief investment officer of DNP Select Income Fund Inc. (NYSE: DNP) since 2018.
She has been a portfolio manager for the Fund since 2011, as well as portfolio manager for the Virtus Duff & Phelps Global Infrastructure Fund since its inception in 2004. Prior to joining Duff & Phelps in 1992, Ms. Luecke served as a financial valuation consultant at Coopers & Lybrand, and as a research associate at Harris Associates L.P.
Ms. Luecke earned a B.S. from DePaul University and an M.B.A. from Loyola University of Chicago. She is a Chartered Financial Analyst® (CFA®) charterholder, a member of the CFA Institute, the CFA Society of Chicago, and a past president of the Utility and Telecommunications Securities Club of Chicago. She began her career in the investment industry in 1983.
Steven G. Wittwer, CFA
Steven Wittwer is an executive managing director and a senior portfolio manager at Duff & Phelps Investment Management, Co., an investment management affiliate of Virtus Investment Partners. Mr. Wittwer is the head of Duff & Phelps’ Infrastructure and Utilities Group and serves as a senior portfolio manager for the Global Listed Infrastructure strategies.
He has been a portfolio manager for the Fund since 2024, as well as portfolio manager for the Virtus Duff & Phelps Global Infrastructure Fund since 2018 and the Virtus Duff & Phelps Real Asset Fund since 2020. Prior to joining Duff & Phelps in 2017, Mr. Wittwer was a portfolio manager and senior equity analyst at Great Lakes Advisors in Chicago. Previously, he worked for UBS Global Asset Management for 14 years in various capacities, including head of the global telecom team, conducting research in the United States, Asia, and Europe, and a key participant on the UBS global technology team.
Mr. Wittwer holds a B.B.A. in accounting from the Wisconsin School of Business, University of Wisconsin, and an M.B.A. in finance from the Ross School of Business, University of Michigan-Ann Arbor. He is a Chartered Financial Analyst® (CFA®) charterholder, and a Certified Public Accountant (CPA) (inactive). He began his career in the investment industry in 1997.
Rodney C. Clayton, CFA
Rodney Clayton is a managing director, portfolio manager, and senior research analyst for MLPs and energy infrastructure at Duff & Phelps Investment Management Co., an investment management affiliate of Virtus Investment Partners. Mr. Clayton concentrates his research on North American midstream energy companies.
He has been a portfolio manager for the Fund since 2024, as well as portfolio manager for the Virtus Duff & Phelps Select MLP and Energy Fund since 2020 and the Virtus Duff & Phelps Global Infrastructure Fund since 2024. Prior to joining Duff & Phelps in April 2016, Mr. Clayton served as a senior manager due diligence analyst at UBS Financial Services, focusing on MLP, large-cap value, and equity income strategies. Previously, he worked as an equity research analyst at J.P. Morgan Securities, covering the exploration and production, engineering and construction, and environmental services industries.
Mr. Clayton completed his undergraduate studies and holds an M.B.A. from Florida A&M University. He is a Chartered Financial Analyst® (CFA®) charterholder and has been working in the investment industry since 2004.
Newfleet
David L. Albrycht, CFA
David Albrycht is president and chief investment officer of Newfleet, an affiliated manager of Virtus. Prior to joining Newfleet in 2011, Mr. Albrycht was executive managing director and senior portfolio manager with Goodwin Capital Advisers, a former affiliate of Virtus. He joined the Goodwin multi-sector fixed income team in 1985 as a credit analyst and has managed fixed income portfolios since 1991.
Mr. Albrycht has been a portfolio manager of the Fund and its predecessor since 2016, Virtus Newfleet Multi-Sector Short Term Bond Fund since 1993, Virtus Newfleet Multi-Sector Intermediate Bond Fund since 1994, and co-manager of Virtus Newfleet Senior Floating Rate Fund since 2008, Virtus Tactical Allocation Fund and Virtus Newfleet High Yield Fund since 2011, Virtus Newfleet Core Plus Bond Fund and Virtus Newfleet Low Duration Income Fund since 2012. He also co-manages two variable investment options and is manager of another closed-end fund, Virtus Global Multi-Sector Income Fund (NYSE: VGI). He also is a manager of four exchange-traded funds, Virtus Newfleet Multi-Sector Bond ETF (NYSE: NFLT), Virtus Newfleet Short Duration High Yield Bond ETF (NYSE: VSHY), Virtus Newfleet ABS/MBS ETF (NYSE: VABS), and Virtus Newfleet Short Duration Core Plus Bond ETF (NYSE: SDCP), and two offshore funds, the Virtus GF Multi-Sector Short Duration Bond Fund and Virtus GF Multi-Sector Income Fund.
Mr. Albrycht earned a B.A., cum laude, from Central Connecticut State University and an M.B.A., with honors, from the University of Connecticut. He is a Chartered Financial Analyst® (CFA®) charterholder and has been working in the investment industry since 1985.
(a)(2) Other Accounts Managed by Portfolio Manager(s) or Management Team Member and Potential Conflicts of Interest
There may be certain inherent conflicts of interest that arise in connection with the portfolio managers’ management of the Fund’s investments and the investments of any other accounts they manage. Such conflicts could include the aggregation of orders for all accounts managed by a particular portfolio manager, the allocation of purchases across all such accounts, the allocation of IPOs and any soft dollar arrangements that the adviser/subadviser may have in place that could benefit the Fund and/or such other accounts. The Board has adopted policies and procedures designed to address any such conflicts of interest to ensure that all transactions are executed in the best interest of the Fund’s shareholders. Each adviser/subadviser is required to certify its compliance with these procedures on a quarterly basis. There have been no material compliance issues with respect to any of these policies and procedures during the Fund’s most recent fiscal year. Additionally, there are no material conflicts of interest between the investment strategy of the Fund and the investment strategy of other accounts managed by the portfolio managers since the portfolio managers generally manage funds and other accounts having similar investment strategies.
The following table provides information as of November 30, 2024, regarding any other accounts managed by the portfolio managers and portfolio management team members for the Fund. As noted in the table, the portfolio managers managing the Fund may also manage or be members of management teams for other mutual funds within the Virtus Fund complex or other similar accounts.
Other Accounts Managed by Portfolio Manager(s) or Management Team Member
| | | | | | | | | | |
Name of Portfolio Manager or Team Member | | Type of Accounts | | Total
No. of Accounts
Managed | | Total
Assets
(in millions) | | No. of
Accounts where
Advisory Fee is
Based on
Performance | | Total Assets in
Accounts where
Advisory Fee is
Based on
Performance |
David L. Albrycht | | Registered
Investment
Companies: | | 17 | | $8,302.9 | | 1 | | $210.4 |
| | | Other Pooled
Investment
Vehicles: | | 2 | | 124.8 | | 0 | | 0 |
| | | Other Accounts: | | 1 | | 35.6 | | 0 | | 0 |
Connie M. Luecke | | Registered
Investment
Companies: | | 2 | | 4,805.4 | | 0 | | 0 |
| | | Other Pooled
Investment
Vehicles: | | 2 | | 265.2 | | 0 | | 0 |
| | | Other Accounts: | | 0 | | 0 | | 0 | | 0 |
Steven G. Wittwer | | Registered
Investment
Companies: | | 2 | | 155.2 | | 0 | | 0 |
| | | Other Pooled
Investment
Vehicles: | | 1 | | 62.6 | | 0 | | 0 |
| | | | | | | | | | |
| | | Other Accounts: | | 0 | | 0 | | 0 | | 0 |
Rodney C. Clayton | | Registered
Investment
Companies: | | 2 | | 202.0 | | 0 | | 0 |
| | | Other Pooled
Investment
Vehicles: | | 0 | | 0 | | 0 | | 0 |
| | | Other Accounts | | 0 | | 0 | | 0 | | 0 |
| | | | | | | | | | | |
(a)(3) Compensation Structure of Portfolio Manager(s) or Management Team Members
Virtus, along with certain of its affiliated investment management firms, including Duff & Phelps and Newfleet (collectively, “Virtus”), believes that the firm’s compensation program is adequate and competitive to attract and retain high-caliber investment professionals. Investment professionals at Virtus receive a competitive base salary, an incentive bonus opportunity, and a benefits package. Certain professionals who supervise and manage others also participate in a management incentive program reflecting their personal contribution and team performance. Certain key individuals also have the opportunity to take advantage of a long-term incentive compensation program, including potential awards of Virtus restricted stock units (“RSUs”) with multi-year vesting, subject to Virtus board of directors’ approval.
Following is a more detailed description of the compensation structure:
| | • | | Base Salary: Each portfolio manager is paid a fixed based salary, which is designed to be competitive in light of the individual’s experience and responsibilities. Base salary is determined using compensation survey results of investment industry compensation conducted by an independent third party in evaluating competitive market compensation for its investment management professionals. |
| | • | | Incentive Bonus: Annual incentive payments are based on targeted compensation levels, adjusted based on profitability and investment performance factors, and a subjective assessment of contribution to the team effort. The short-term incentive payment is generally paid in cash, but a portion may be payable in RSUs and mutual fund investments that appreciate or depreciate in value based on the returns of one or more mutual funds managed by the investment professional. Individual payments are assessed using comparisons of actual investment performance with specific peer group or index measures. Performance of funds managed is generally measured over one-, three-, and five-year periods and an individual manager’s participation is based on the performance of each fund/account managed. |
| | • | | Other Benefits: Portfolio managers are also eligible to participate in broad-based plans offered generally to employees of Virtus and its affiliates, including 401(k), health, and other employee benefit plans. |
While portfolio managers compensation contains a performance component, this component is adjusted to reward investment personnel for managing within the stated framework and for not taking unnecessary risk. This approach helps ensure that investment management personnel remain focused on managing and acquiring securities that correspond to a fund’s mandate and risk profile and are
discouraged from taking on more risk and unnecessary exposure to chase performance for personal gain. Virtus believes it has appropriate controls in place to handle any potential conflicts that may result from a substantial portion of portfolio manager compensation being tied to performance.
(a)(4) Disclosure of Securities Ownership
For the most recently completed fiscal year ended November 30, 2024, beneficial ownership of shares of the Fund by Mr. Albrycht, Mr. Clayton, Ms. Luecke, and Mr. Wittwer are as follows. Beneficial ownership was determined in accordance with rule 16a-1(a)(2) under the Securities Exchange Act of 1934 (17 CFR 240.161-1(a)(2)).
| | |
Name of Portfolio Manager or Team Member | | Dollar ($) Range of Fund Shares Beneficially Owned |
| |
David L. Albrycht | | $0 |
| |
Connie M. Luecke | | $100,001-500,000 |
Steven G. Wittwer | | $10,001 - $50,000 |
Rodney C. Clayton | | $0 |
Item 14. Purchases of Equity Securities by Closed-End Management Investment Company and Affiliated Purchasers.
(a) Not applicable.
Item 15. Submission of Matters to a Vote of Security Holders.
There have been no material changes to the procedures by which the shareholders may recommend nominees to the registrant’s Board, where those changes were implemented after the registrant last provided disclosure in response to the requirements of Item 407(c)(2)(iv) of Regulation S-K (17 CFR 229.407) (as required by Item 22(b)(15) of Schedule 14A (17 CFR 240.14a-101)), or this Item.
Item 16. Controls and Procedures.
| | (a) | The registrant’s principal executive and principal financial officers, or persons performing similar functions, have concluded that the registrant’s disclosure controls and procedures (as defined in Rule 30a-3(c) under the Investment Company Act of 1940, as amended (the “1940 Act”) (17 CFR 270.30a-3(c))) are effective, as of a date within 90 days of the filing date of the report that includes the disclosure required by this paragraph, based on their evaluation of these controls and procedures required by Rule 30a-3(b) under the 1940 Act (17 CFR 270.30a-3(b)) and Rules 13a-15(b) or 15d-15(b) under the Securities Exchange Act of 1934, as amended (17 CFR 240.13a-15(b) or 240.15d-15(b)). |
| | (b) | There were no changes in the registrant’s internal control over financial reporting (as defined in Rule 30a-3(d) under the 1940 Act (17 CFR 270.30a-3(d))) that occurred during the period |
| | covered by this report that has materially affected, or is reasonably likely to materially affect, the registrant’s internal control over financial reporting. |
Item 17. Disclosure of Securities Lending Activities for Closed-End Management Investment Companies.
Item 18. Recovery of Erroneously Awarded Compensation.
Not Applicable.
Item 19. Exhibits.
| (a)(4) | There were no written solicitations to purchase securities under Rule 23c-1 under the Act sent or given during the period covered by the report by or on behalf of the Registrant to 10 or more persons. |
| (a)(5) | There was no change in the Registrant’s independent public accountant during the period covered by the report. |
SIGNATURES
Pursuant to the requirements of the Securities Exchange Act of 1934 and the Investment Company Act of 1940, the registrant has duly caused this report to be signed on its behalf by the undersigned, thereunto duly authorized.
(Registrant) Virtus Total Return Fund Inc.
| | |
| By (Signature and Title)* /s/ George R. Aylward |
| | George R. Aylward, President and Chief Executive Officer |
| | (principal executive officer) |
Date 2/7/2025
Pursuant to the requirements of the Securities Exchange Act of 1934 and the Investment Company Act of 1940, this report has been signed below by the following persons on behalf of the registrant and in the capacities and on the dates indicated.
| | |
| By (Signature and Title)* /s/ George R. Aylward |
| | George R. Aylward, President and Chief Executive Officer |
| | (principal executive officer) |
Date 2/7/2025
| | |
| By (Signature and Title)* /s/ W. Patrick Bradley |
| | W. Patrick Bradley, Executive Vice President, Chief Financial Officer, and Treasurer |
| | (principal financial officer) |
Date 2/7/2025
* Print the name and title of each signing officer under his or her signature.