As filed with the U.S. Securities and Exchange Commission on May 19, 2009
Securities Act File No. 333-156437
UNITED STATES
SECURITIES AND EXCHANGE COMMISSION
Washington, D.C. 20549
FORM N-14
x | REGISTRATION STATEMENT UNDER THE SECURITIES ACT OF 1933 |
x | Pre-Effective Amendment No. 2 |
¨ | Post-Effective Amendment No. |
(Check appropriate box or boxes)
MORGAN STANLEY INSTITUTIONAL FUND, INC.
(Exact Name of Registrant as Specified in Charter)
522 Fifth Avenue
New York, New York 10036
(Address of Principal Executive Offices: (Number, Street, City, State, Zip Code))
(212) 296-6970
(Area Code and Telephone Number)
Stefanie V. Chang Yu, Esq.
Morgan Stanley Investment Management Inc.
522 Fifth Avenue
New York, New York 10036
(Name and Address of Agent for Service)
Copy to:
Carl Frischling, Esq. |
| Stuart M. Strauss, Esq. |
Approximate Date of Proposed Public Offering: As soon as practicable after this Registration Statement becomes effective. It is proposed that this filing will become effective on June 19, 2009 pursuant to Rule 488.
No filing fee is required because an indefinite number of common shares of beneficial interest of Morgan Stanley Institutional Fund, Inc. have previously been registered pursuant to Rule 24f-2 under the Investment Company Act of 1940.
MORGAN STANLEY INSTITUTIONAL FUND, INC.
GLOBAL VALUE EQUITY PORTFOLIO
522 Fifth Avenue
New York, New York 10036
(800) 548-7786
NOTICE OF SPECIAL MEETING OF STOCKHOLDERS
TO BE HELD AUGUST 27, 2009
To the Stockholders of Global Value Equity Portfolio:
Notice is hereby given of a Special Meeting of the Stockholders of the Global Value Equity Portfolio ("Global Value Equity"), a series of Morgan Stanley Institutional Fund, Inc. (the "Company"), to be held in Conference Room 3R, Floor 3, 522 Fifth Avenue, New York, NY 10036, at 9:00 a.m., New York time, on August 27, 2009, and any adjournments thereof (the "Meeting"), for the following purposes:
1. To consider and vote upon an Agreement and Plan of Reorganization, dated November 20, 2008 (the "Reorganization Agreement"), between the Company, on behalf of Global Value Equity, and the Company, on behalf of the Global Franchise Portfolio ("Global Franchise"), pursuant to which substantially all of the assets of Global Value Equity would be combined with those of Global Franchise and stockholders of Global Value Equity would become stockholders of Global Franchise receiving shares of common stock of Global Franchise with a value equal to the value of their holdings in Global Value Equity (the "Reorganization"); and
2. To act upon such other matters as may properly come before the Meeting.
The Reorganization is more fully described in the accompanying Proxy Statement and Prospectus and a copy of the Reorganization Agreement is attached as Exhibit A thereto. Stockholders of record at the close of business on June 11, 2009 are entitled to notice of, and to vote at, the Meeting. Please read the Proxy Statement and Prospectus carefully before telling us, through your Proxy or in person, how you wish your shares to be voted. Alternatively, if you are eligible to vote telephonically by touchtone telephone or electronically on the Internet (as discussed in the enclosed Proxy Statement) you may do so in lieu of attending the Meeting in person. The Board of Directors of the Company recommends you vote in favor of the Reorganization. WE URGE YOU TO SIGN, DATE AND MAIL THE ENCLOSED PROXY PROMPTLY.
By Order of the Board of Directors,
MARY E. MULLIN
Secretary
June 19, 2009
You can help avoid the necessity and expense of sending follow-up letters to ensure a quorum by promptly returning the enclosed Proxy. If you are unable to be present in person, please fill in, sign and return the enclosed Proxy in order that the necessary quorum be represented at the Meeting. The enclosed envelope requires no postage if mailed in the United States. Stockholders will be able to vote telephonically by touchtone telephone or electronically on the Internet by following instructions on their proxy cards or on the enclosed Voting Information Card.
MORGAN STANLEY INSTITUTIONAL FUND, INC.
GLOBAL FRANCHISE PORTFOLIO
522 Fifth Avenue
New York, New York 10036
(800) 548-7786
Acquisition of the Assets of
Global Value Equity Portfolio
By and in Exchange for Shares of
Global Franchise Portfolio
This Proxy Statement and Prospectus is being furnished to stockholders of the Global Value Equity Portfolio ("Global Value Equity"), a series of Morgan Stanley Institutional Fund, Inc. (the "Company"), in connection with an Agreement and Plan of Reorganization, dated November 20, 2008 (the "Reorganization Agreement"), pursuant to which substantially all the assets of Global Value Equity will be combined with those of the Global Franchise Portfolio ("Global Franchise"), a series of the Company, in exchange for shares of Global Franchise (the "Reorganization"). As a result of this transaction, stockholders of Global Value Equity will become stockholders of Global Franchise and will receive shares of common stock of Global Franchise with a value equal to the value of their holdings in Global Value Equity. The terms and conditions of this transaction are more fully described in this Proxy Statement and Prospectus and in the Reorganization Agreement between the Company, on behalf of Global Value Equity, and the Company, on behalf of Global Franchise, attached hereto as Exhibit A. The address and telephone number of Global Value Equity are the same as those of Global Franchise set forth above. This Proxy Statement also constitutes a Prospectus of Global Franchise, which is dated June 19, 2009, filed by the Company with the Securities and Exchange Commission (the "Commission") as part of its Registration Statement on Form N-14 (the "Registration Statement").
The Company is an open-end management investment company. Global Franchise's investment objective is to seek long-term capital appreciation.
This Proxy Statement and Prospectus sets forth concisely information about Global Franchise that stockholders of Global Value Equity should know before voting on the Reorganization Agreement. A copy of the Prospectus for Global Value Equity and Global Franchise dated May 1, 2009, as may be supplemented, is attached as Exhibit B and incorporated herein by reference. Also enclosed and incorporated herein by reference is the Company's Annual Report, including each of Global Value Equity's and Global Franchise's financial statements, for the fiscal year ended December 31, 2008. A Statement of Additional Information relating to the Reorganization, described in this Proxy Statement and Prospectus, dated June 19, 2009, has been filed with the Commission and is also incorporated herein by reference. Such documents are available upon request and without charge by calling (800) 548-7786 (toll-free) or by visiting the Commission's website at www.sec.gov.
Investors are advised to read and retain this Proxy Statement and Prospectus for future reference.
The Securities and Exchange Commission has not approved or disapproved these securities or passed upon the adequacy of this Prospectus. Any representation to the contrary is a criminal offense.
This Proxy Statement and Prospectus is dated June 19, 2009.
TABLE OF CONTENTS
PROXY STATEMENT AND PROSPECTUS
| Page | |||||||
| Introduction | 1 | ||||||
| General | 1 | ||||||
| Record Date; Share Information | 1 | ||||||
| Proxies | 2 | ||||||
| Expenses of Solicitation | 3 | ||||||
| Vote Required | 3 | ||||||
| Synopsis | 3 | ||||||
| The Reorganization | 4 | ||||||
| Past Performance | |||||||
| Fee Table | 5 | ||||||
| Tax Consequences of the Reorganization | 7 | ||||||
| Comparison of Global Franchise and Global Value Equity | 7 | ||||||
| Principal Risk Factors | 10 | ||||||
| The Reorganization | 11 | ||||||
| The Proposal | 11 | ||||||
| The Board's Considerations | 11 | ||||||
| The Reorganization Agreement | 12 | ||||||
| Tax Aspects of the Reorganization | 13 | ||||||
| Description of Shares | 14 | ||||||
| Capitalization Table (unaudited) | 15 | ||||||
| Appraisal Rights | 15 | ||||||
| Comparison of Investment Objectives, Policies and Restrictions | 15 | ||||||
| Investment Objectives and Policies | 15 | ||||||
| Investment Restrictions | 16 | ||||||
| Additional Information About Global Franchise and Global Value Equity | 17 | ||||||
| General | 17 | ||||||
| Financial Information | 17 | ||||||
| Management | 17 | ||||||
| Description of Shares and Stockholder Inquiries | 17 | ||||||
| Dividends, Distributions and Taxes | 17 | ||||||
| Purchases, Exchanges and Redemptions | 17 | ||||||
| Financial Statements and Experts | 17 | ||||||
| Legal Matters | 18 | ||||||
| Available Information | 18 | ||||||
| Other Business | 18 | ||||||
| Exhibit A – Agreement and Plan of Reorganization | A-1 | ||||||
| Exhibit B – Prospectus of Global Value Equity and Global Franchise dated May 1, 2009, as may be supplemented | B-1 | ||||||
| Exhibit C – Annual Report for the Company for the fiscal year ended December 31, 2008 | C-1 | ||||||
MORGAN STANLEY INSTITUTIONAL FUND, INC.
GLOBAL VALUE EQUITY PORTFOLIO
522 Fifth Avenue
New York, New York 10036
(800) 548-7786
PROXY STATEMENT AND PROSPECTUS
SPECIAL MEETING OF STOCKHOLDERS
TO BE HELD AUGUST 27, 2009
INTRODUCTION
General
This Proxy Statement and Prospectus is being furnished to the stockholders of the Global Value Equity Portfolio ("Global Value Equity"), a series of Morgan Stanley Institutional Fund, Inc. (the "Company"), an open-end management investment company, in connection with the solicitation by the Board of Directors of the Company (the "Board") on behalf of Global Value Equity of proxies ("Proxies") to be used at the Special Meeting of Stockholders of Global Value Equity to be held in Conference Room 3R, Floor 3, 522 Fifth Avenue, New York, NY 10036, at 9:00 a.m., New York time, on August 27, 2009 and any adjournments thereof (the "Meeting"). It is expected that the first mailing of this Proxy Statement and Prospectus will be made on or about June 27, 2009.
At the Meeting, Global Value Equity stockholders ("Stockholders") will consider and vote upon an Agreement and Plan of Reorganization, dated November 20, 2008 (the "Reorganization Agreement"), between the Company, on behalf of Global Value Equity, and the Company, on behalf of the Global Franchise Portfolio ("Global Franchise"), pursuant to which substantially all of the assets of Global Value Equity will be combined with those of Global Franchise in exchange for shares of common stock of Global Franchise ("Global Franchise Shares"). As a result of this transaction, Stockholders of Global Value Equity will become stockholders of Global Franchise and will receive Global Franchise Shares equal to the value of their holdings in Global Value Equity on the date of such transaction (the "Reorganization"). Pursuant to the Reorganization, each Stockholder will receive the class of Global Franchise Shares that corresponds to the class of shares of common stock of Global Value Equity currently held by that Stockholder. Accordingly, as a result of the Reorganization, each Class I and Class P Stockholder of Global Value Equity will receive Class I and Class P shares of Global Franchise, respectively. The Global Franchise Shares to be issued pursuant to the Reorganization will be issued at net asset value without an initial sales charge. Further information relating to Global Franchise is set forth herein and in Global Franchise's current Prospectus, dated May 1, 2009, as may be supplemented ("Global Franchise's Prospectus"), attached to this Proxy Statement and Prospectus as Exhibit B and incorporated herein by reference.
The Company suspended offering Class I and Class P shares of Global Franchise and Global Value Equity to new investors. See "—Comparison of Global Franchise and Global Value Equity—Purchases, Exchanges and Redemptions." The Company's Board has authorized the issuance of the Global Franchise Shares to Stockholders of Global Value Equity in connection with the Reorganization.
Global Franchise and Global Value Equity are each referred to herein as a "Portfolio" and, together, the "Portfolios."
The information concerning Global Franchise and Global Value Equity contained herein has been supplied by the Company, on behalf of Global Franchise and Global Value Equity, respectively.
Record Date; Share Information
The Board has fixed the close of business on June 11, 2009 as the record date (the "Record Date") for the determination of the Stockholders entitled to notice of, and to vote at, the Meeting. As of the Record Date, there
1
were _______ shares of Global Franchise and _______ shares of Global Value Equity issued and outstanding. Stockholders on the Record Date are entitled to one vote per share and a fractional vote for a fractional share on each matter submitted to a vote at the Meeting. Stockholders of each class will vote together as a single class in connection with the Reorganization Agreement. The presence in person or represented by Proxy of one-third of the outstanding shares entitled to vote will constitute a quorum at the Meeting.
The following persons were known to own of record or beneficially 5% or more of the outstanding shares of a class of Global Franchise as of the Record Date:
| Stockholder | Number of Shares | Percentage of Outstanding Shares | |||||||||
| [TO BE PROVIDED] | |||||||||||
| Class I | |||||||||||
| Class P | |||||||||||
[As of the Record Date, the directors and officers of the Company, as a group, owned less than 1% of the outstanding shares of Global Franchise.]
The following persons were known to own of record or beneficially 5% or more of the outstanding shares of a class of Global Value Equity as of the Record Date:
| Stockholder | Number of Shares | Percentage of Outstanding Shares | |||||||||
| [TO BE PROVIDED] | |||||||||||
| Class I | |||||||||||
| Class P | |||||||||||
[As of the Record Date, the directors and officers of the Company, as a group, owned less than 1% of the outstanding shares of Global Value Equity.]
Proxies
The enclosed form of Proxy, if properly executed and returned, will be voted in accordance with the choice specified thereon. The Proxy will be voted in favor of the Reorganization Agreement unless a choice is indicated to vote against or to abstain from voting on the Reorganization Agreement. The Board knows of no business, other than that set forth in the Notice of Special Meeting of Stockholders, to be presented for consideration at the Meeting. However, the Proxy confers discretionary authority upon the persons named therein to vote as they determine on other business, not currently contemplated, which may come before the Meeting. Abstentions and, if applicable, broker "non-votes" will not count as votes in favor of the Reorganization Agreement, and broker "non-votes" will not be deemed to be present at the meeting for purposes of determining whether the Reorganization Agreement has been approved. Broker "non-votes" are shares held in street name for which the broker indicates that instructions have not been received from the beneficial owners or other persons entitled to vote and for which the broker does not have discretionary voting authority. If a Stockholder executes and returns a Proxy but fails to indicate how the votes should be cast, the Proxy will be voted in favor of the Reorganization Agreement. The Proxy may be revoked at any time prior to the voting thereof by: (i) delivering written notice of revocation to the Secretary of Global Value Equity, 522 Fifth Avenue, New York, New York 10036; (ii) attending the Meeting and voting in person; or (iii) completing and returning a new Proxy (whether by mail or, as discussed below, by touchtone telephone or the Internet) (if returned and received in time to be voted). Attendance at the Meeting will not in and of itself revoke a Proxy.
In the event that the necessary quorum to transact business or the vote required to approve or reject the Reorganization Agreement is not obtained at the Meeting, the persons named as Proxies may propose one or more adjournments of the Meeting to permit further solicitation of Proxies. Any such adjournment will require the affirmative vote of the holders of a majority of shares of Global Value Equity present in person or by Proxy at the Meeting. The persons named as Proxies will vote in favor of such adjournment those Proxies which they are entitled
2
to vote in favor of the Reorganization Agreement and will vote against any such adjournment those Proxies required to be voted against the Reorganization Agreement. Abstentions and, if applicable, broker "non-votes" will not be counted for purposes of approving an adjournment.
Expenses of Solicitation
The expenses of this solicitation, including the cost of preparing and mailing this Proxy Statement and Prospectus, all of which will be borne by Morgan Stanley Investment Management Inc. (the "Adviser"), are expected to be approximately $200,000.
The solicitation of Proxies will be by mail, which may be supplemented by solicitation by mail, telephone or otherwise through directors and officers of the Company, on behalf of Global Value Equity, or officers and employees of the Adviser, Morgan Stanley Services Company Inc. (the "Transfer Agent") and/or Morgan Stanley & Co. Incorporated, without special compensation therefor. As described below, Global Value Equity will employ Computershare Fund Services, Inc. ("Computershare") to make telephone calls to Stockholders to remind them to vote. In addition, Global Value Equity may also employ Computershare as proxy solicitor if it appears that the required number of votes to achieve a quorum will not be received. In the event that Computershare is retained as proxy solicitor, Computershare will be paid a project management fee as well as telephone solicitation expenses incurred for reminder calls, outbound telephone voting, confirmation of telephone votes, inbound telephone contact, obtaining stockholders' telephone numbers and providing additional materials upon stockholder request, at an estimated cost of $5,442 and the expenses outlined below.
Stockholders will be able to vote their shares by touchtone telephone or by Internet by following the instructions on the proxy card or on the Voting Information Card accompanying this Proxy Statement. To vote by Internet or by telephone, Stockholders can access the website or call the toll-free number listed on the proxy card or noted in the enclosed voting instructions. To vote by touchtone telephone, stockholders will need the number that appears on the Proxy Card.
In certain instances, Computershare may call Stockholders to ask if they would be willing to have their votes recorded by telephone. The telephone voting procedure is designed to authenticate Stockholders' identities, to allow Stockholders to authorize the voting of their shares in accordance with their instructions and to confirm that their instructions have been recorded properly. No recommendation will be made as to how a Stockholder should vote on any proposal other than to refer to the recommendations of the Board. Global Value Equity has been advised by counsel that these procedures are consistent with the requirements of applicable law. Stockholders voting by telephone in this manner will be asked for identifying information and will be given an opportunity to authorize Proxies to vote their shares in accordance with their instructions. To ensure that the Stockholders' instructions have been recorded correctly they will receive a confirmation of their instructions in the mail. A special toll-free number set forth in the confirmation will be available in case the information contained in the confirmation is incorrect. Although a Stockholder's vote may be taken by telephone, each Stockholder will receive a copy of this Proxy Statement and may vote by mail using the enclosed proxy card or by touchtone telephone or the Internet as set forth above. The last proxy vote received in time to be voted, whether by proxy card, touchtone telephone or Internet, will be the vote that is counted and will revoke all previous votes by the Stockholder.
Vote Required
Approval of the Reorganization Agreement by Stockholders requires the affirmative vote of the holders of a majority of the outstanding shares of Global Value Equity entitled to vote thereon, provided a quorum is present at the Meeting. If the Reorganization Agreement is not approved by Stockholders, Global Value Equity will continue in existence and the Board will consider alternative actions.
SYNOPSIS
The following is a synopsis of certain information contained in or incorporated by reference in this Proxy Statement and Prospectus. This synopsis is only a summary and is qualified in its entirety by the more detailed information contained or incorporated by reference in this Proxy Statement and Prospectus and the Reorganization
3
Agreement. Stockholders should carefully review this Proxy Statement and Prospectus and Reorganization Agreement in their entirety and, in particular, Global Franchise's Prospectus, as may be supplemented, which is attached to this Proxy Statement as Exhibit B and incorporated herein by reference.
The Reorganization
The Reorganization Agreement provides for the transfer of substantially all the assets of Global Value Equity, subject to stated liabilities, to Global Franchise in exchange for the Global Franchise Shares. The aggregate net asset value of the Global Franchise Shares issued in the exchange will equal the aggregate value of the net assets of Global Value Equity received by Global Franchise. On or after the closing date scheduled for the Reorganization (the "Closing Date"), Global Value Equity will distribute the Global Franchise Shares received by Global Value Equity to Stockholders as of the Valuation Date (as defined below under "The Reorganization Agreement") in complete liquidation of Global Value Equity, and Global Value Equity will be terminated as a series of the Company. As a result of the Reorganization, each Stockholder will receive that number of full and fractional Global Franchise Shares equal in value to such Stockholder's pro rata interest in the net assets of Global Value Equity transferred to Global Franchise. Pursuant to the Reorganization, each Stockholder will receive the class of Global Franchise Shares that corresponds to the class of shares of common stock of Global Value Equity currently held by that Stockholder. Accordingly, as a result of the Reorganization, each Class I and Class P Stockholder of Global Value Equity will become a holder of Class I and Class P shares of Global Franchise, respectively. The Board has determined that the interests of Stockholders will not be diluted as a result of the Reorganization. The "Valuation Date" is the third business day following the receipt of the requisite approval of the Reorganization Agreement by the Stockholders or at such other time as Global Franchise and Global Value Equity may agree, on which date the number of Global Franchise Shares to be delivered to Global Value Equity will be determined.
The Company suspended offering Class I and Class P shares of Global Franchise and Global Value Equity to new investors. See "—Comparison of Global Franchise and Global Value Equity—Purchases, Exchanges and Redemptions." The Company's Board has authorized the issuance of the Global Franchise Shares to Stockholders of Global Value Equity in connection with the Reorganization.
At least one but not more than 20 business days prior to the Valuation Date, Global Value Equity may declare and pay a dividend or dividends which, together with all previous such dividends, will have the effect of distributing to Stockholders all of Global Value Equity's investment company taxable income for all periods since the inception of Global Value Equity through and including the Valuation Date (computed without regard to any dividends paid deduction), and all of Global Value Equity's net capital gain, if any, realized in such periods (after reduction for any capital loss carryforwards).
For the reasons set forth below under "The Reorganization—The Board's Considerations," the Board, including the directors who are not "interested persons" of the Company ("Independent Directors"), as that term is defined in the Investment Company Act of 1940, as amended (the "1940 Act"), has concluded that the Reorganization is in the best interests of Global Value Equity and its Stockholders and recommends approval of the Reorganization Agreement.
4
Fee Table
The following table briefly describes the fees and expenses that a Stockholder of Global Franchise and Global Value Equity may pay if they buy and hold shares of each respective Portfolio. These expenses are deducted from each respective Portfolio's assets and are based on expenses paid by each Portfolio for its fiscal year ended December 31, 2008. Global Franchise and Global Value Equity each pays expenses for management of its assets, distribution of its shares and other services, and those expenses are reflected in the net asset value per share of each Portfolio. The table also sets forth pro forma fees for the surviving combined portfolio (Global Franchise) (the "Combined Portfolio") reflecting what the fee schedule would have been on December 31, 2008, if the Reorganization had been consummated twelve (12) months prior to that date.
Stockholder Fees
| Global Franchise | Global Value Equity | Pro Forma Combined Portfolio | |||||||||||||
| Maximum Sales Charge (Load) Imposed on Purchases (as a percentage of offering price) | |||||||||||||||
| Class I | None | None | None | ||||||||||||
| Class P | None | None | None | ||||||||||||
| Maximum Deferred Sales Charge (Load) (as a percentage based on the lesser of the offering price or net asset value at redemption) | |||||||||||||||
| Class I | None | None | None | ||||||||||||
| Class P | None | None | None | ||||||||||||
| Maximum Sales Charge (Load) Imposed on Reinvested Dividends | |||||||||||||||
| Class I | None | None | None | ||||||||||||
| Class P | None | None | None | ||||||||||||
| Redemption Fees | |||||||||||||||
| Class I | None | None | None | ||||||||||||
| Class P | None | None | None | ||||||||||||
| Exchange Fee | |||||||||||||||
| Class I | None | None | None | ||||||||||||
| Class P | None | None | None | ||||||||||||
(continued on following page)
5
Annual Portfolio Operating Expenses
(expenses that are deducted from Portfolio assets)
| Global Franchise | Global Value Equity | Pro Forma Combined Portfolio | |||||||||||||
| Advisory Fees* | |||||||||||||||
| Class I | 0.80 | % | 0.67 | % | 0.80 | % | |||||||||
| Class P | 0.80 | % | 0.67 | % | 0.80 | % | |||||||||
| Distribution and/or Service (12b-1) Fees | |||||||||||||||
| Class I | None | None | None | ||||||||||||
| Class P | 0.25 | % | 0.25 | % | 0.25 | % | |||||||||
| Other Expenses* | |||||||||||||||
| Class I | 0.21 | % | 0.35 | % | 0.20 | % | |||||||||
| Class P | 0.21 | % | 0.35 | % | 0.20 | % | |||||||||
| Acquired Fund Fees and Expenses** | |||||||||||||||
| Class I | N/A | 0.02 | % | N/A | |||||||||||
| Class P | N/A | 0.02 | % | N/A | |||||||||||
| Total Annual Portfolio Operating Expenses*(1) | |||||||||||||||
| Class I | 1.01 | % | 1.04 | % | 1.00 | % | |||||||||
| Class P | 1.26 | % | 1.29 | % | 1.25 | % | |||||||||
* The advisory fees for the Portfolios shown in the table above are the highest that could be charged. This table does not show the effects of the Adviser's voluntary fee waivers and/or expense reimbursements. The Adviser has voluntarily agreed to reduce its advisory fee and/or reimburse each Portfolio, so that total annual operating expenses, excluding certain investment related expenses (such as foreign country tax expense and interest expense on borrowing), will not exceed 1.00% for Class I shares and 1.25% for Class P shares of each Portfolio. The above referenced fee waivers and/or expense reimbursements of the Portfolios are voluntary and the Adviser reserves the right to terminate any waiver and/or reimbursement at any time and without notice.
The Adviser has voluntarily agreed, for at least one year, to reduce its advisory fee and/or reimburse the Combined Portfolio, so that total annual portfolio operating expenses, excluding certain investment related expenses (such as foreign country tax expense and interest expense on borrowing), will not exceed 1.00% for Class I shares and 1.25% for Class P shares of the Combined Portfolio.
** The Portfolio may invest a portion of its assets in other investment companies (the "Acquired Funds"). The Portfolio's stockholders indirectly bear a pro rata portion of the expenses of the Acquired Funds in which the Portfolio invests. The estimate is based upon the average allocation of the Portfolio's investments in the Acquired Funds and upon the actual total operating expenses of the Acquired Funds (including any current waivers and expense limitations) for the fiscal year ended December 31, 2008. Actual Acquired Fund expenses incurred by the Portfolio may vary with changes in the allocation of Portfolio assets among the Acquired Funds and with other events that directly affect the expenses of the Acquired Funds. Since "Acquired Fund Fees & Expenses" are not directly borne by the Portfolio, they are not reflected in the Portfolio's financial statements, with the result that the information presented in the table may differ from that presented in the Financial Highlights.
(1) The total annual Portfolio operating expenses listed above are based on the average net assets of the Portfolio as of its fiscal year ended December 31, 2008. To the extent that the Portfolio's average net assets decrease over the Portfolio's next fiscal year, such expenses can be expected to increase, potentially significantly, because certain fixed costs will be spread over a smaller amount of assets.
6
Example
To attempt to show the effect of these expenses on an investment over time, the hypothetical shown below has been created. The example assumes that an investor invests $10,000 in either Global Franchise or Global Value Equity or the Combined Portfolio, that the investment has a 5% return each year and that the operating expenses for each Portfolio remain the same (as set forth in the chart above). Although a Stockholder's actual costs may be higher or lower, the table below shows a Stockholder's costs at the end of each period based on these assumptions.
| 1 Year | 3 Years | 5 Years | 10 Years | ||||||||||||||||
| Global Franchise | |||||||||||||||||||
| Class I | $ | 103 | $ | 322 | $ | 558 | $ | 1,236 | |||||||||||
| Class P | $ | 128 | $ | 400 | $ | 692 | $ | 1,523 | |||||||||||
| Global Value Equity | |||||||||||||||||||
| Class I | $ | 106 | $ | 331 | $ | 574 | $ | 1,271 | |||||||||||
| Class P | $ | 131 | $ | 409 | $ | 708 | $ | 1,556 | |||||||||||
| Pro Forma Combined Portfolio | |||||||||||||||||||
| Class I | $ | 102 | $ | 318 | $ | 552 | $ | 1,225 | |||||||||||
| Class P | $ | 127 | $ | 397 | $ | 686 | $ | 1,511 | |||||||||||
The purpose of the foregoing fee table is to assist the Stockholder in understanding the various costs and expenses that a Stockholder in each Portfolio will bear directly or indirectly. For a more complete description of these costs and expenses, see "Comparison of Global Franchise and Global Value Equity—Investment Advisory and Shareholder Services Plan Fees; Other Significant Fees; and Purchases, Exchanges and Redemptions" below.
Tax Consequences of the Reorganization
As a condition to the Reorganization, the Company, on behalf of Global Value Equity, has requested an opinion of Clifford Chance US LLP to the effect that the Reorganization will constitute a tax-free reorganization for federal income tax purposes, and that no gain or loss will be recognized by Global Franchise, Global Value Equity or their stockholders for federal income tax purposes as a result of the transactions included in the Reorganization. Receipt of such opinion is a condition to the Reorganization. For further information about the tax consequences of the Reorganization, see "The Reorganization—Tax Aspects of the Reorganization" below.
Comparison of Global Franchise and Global Value Equity
Investment Objectives and Policies. The investment objective of Global Franchise is to seek long-term capital appreciation. The investment objective of Global Value Equity is to seek long-term capital appreciation by investing primarily in equity securities of issuers throughout the world, including U.S. issuers.
Global Franchise seeks long-term capital appreciation by investing primarily in equity securities of issuers located throughout the world that Global Franchise's sub-advisers, Morgan Stanley Investment Management Company and Morgan Stanley Investment Management Limited (the "Sub-Advisers"), believe have, among other things, resilient business franchises and growth potential. The Sub-Advisers emphasize individual stock selection and seek to identify undervalued securities of issuers located throughout the world, including both developed and emerging market countries. Under normal market conditions, the Portfolio invests in securities of issuers from at least three different countries, which may include the United States.
Global Value Equity seeks long-term capital appreciation by seeking to maintain a diversified portfolio of global equity securities based on individual stock selection and emphasizes a bottom-up approach to investing that seeks to identify securities of issuers which the Portfolio's "Sub-Advisers," Morgan Stanley Investment Management Company and Morgan Stanley Investment Management Limited, believe are undervalued.
On November 20, 2008, the Board of the Company approved certain changes to Global Value Equity's investment policies (the "Investment Policy Changes") to make them substantially similar to those of Global
7
Franchise. In connection with the Investment Policy Changes, the Board also approved changes to Global Value Equity's portfolio management team, which is now the same as Global Franchise's portfolio management team.
Effective June 15, 2009, the responsibility for the day-to-day management of each Portfolio was assumed by the International Equity team comprised of William D. Lock and Walter B. Riddell, each a Managing Director of Morgan Stanley Investment Management Limited, Peter J. Wright, a Managing Director of Morgan Stanley Investment Management Company, and John S. Goodacre and Christian Derold, each an Executive Director of Morgan Stanley Investment Management Limited. Mr. Lock has been associated with Morgan Stanley Investment Management Limited in an investment management capacity since 1994. Mr. Riddell has been associated with Morgan Stanley Investment Management Limited in an investment management capacity since 1995. Mr. Wright has been associated with Morgan Stanley Investment Management Company or its affiliates since 1996. Mr. Goodacre has been associated with Morgan Stanley Investment Management Limited in an investment management capacity since 2003. Mr. Derold has been associated with Morgan Stanley Investment Management Limited in an investment management capacity since May 2006. Prior to May 2006, Mr. Derold was a consultant at DCFN Research and Head of Research at Millgate Capital Inc. The composition of each portfolio management team may change from time to time.
The Company's Statement of Additional Information provides additional information about the portfolio managers' compensation structure, other accounts managed by the portfolio managers and the portfolio managers' ownership of securities in the Portfolios.
The principal differences between the Portfolios' investment policies are more fully described under "Comparison of Investment Objectives, Policies and Restrictions" below.
The investment policies of both Global Franchise and Global Value Equity are not fundamental and may be changed by the Company's Board of Directors.
Investment Advisory and Shareholder Services Plan Fees. Global Franchise and Global Value Equity both obtain advisory services from the Adviser. For the fiscal year ended December 31, 2008, Global Franchise and Global Value Equity paid the Adviser compensation, calculated daily, equal to 0.80% and 0.67%, respectively (before giving effect to any voluntary fee waivers). Each class of shares of the Portfolios is subject to the same advisory fee rates applicable to the respective Portfolio.
With respect to each Portfolio, the Adviser pays each Sub-Adviser an annual fee out of its own advisory fee compensation.
The Company has adopted a Shareholder Services Plan with respect to the Class P shares of each Portfolio pursuant to Rule 12b-1 (the "Plan") under the 1940 Act. There are no 12b-1 fees applicable to each Portfolio's Class I shares. Under the Plan, each Portfolio pays Morgan Stanley Distribution, Inc. (the "Distributor") a shareholder services fee of up to 0.25% of the Class P shares' average daily net assets on an annualized basis. The Distributor may compensate other parties for providing shareholder support services to investors who purchase Class P shares. For further information relating to the shareholder services fees applicable to Class P shares of Global Franchise, see the section entitled "Shareholder Information—Distribution of Portfolio Shares" in Global Franchise's Prospectus attached hereto as Exhibit B.
Other Significant Fees. Both Global Franchise and Global Value Equity pay additional fees in connection with their operations, including legal, auditing, transfer agent and custodial fees. See "Synopsis—Fee Table" above for the percentage of average net assets represented by such "Other Expenses."
Purchases, Exchanges and Redemptions. The Company has suspended offering Class I and Class P shares of Global Franchise and Global Value Equity to new investors. The following exceptions apply with respect to the purchase of Class I and Class P shares of Global Franchise. The Company will continue to offer Class I and Class P shares of Global Franchise (1) through certain retirement plan accounts, (2) to clients of registered investment advisors who currently offer shares of Global Franchise in their discretionary asset allocation programs, (3) through certain endowments and foundations, (4) to clients of family office practices where shares of Global Franchise are held by family members of such clients, (5) to directors and trustees of the Morgan Stanley Funds, (6) to Morgan Stanley and its affiliates and their employees and (7) to benefit plans sponsored by Morgan Stanley and its
8
affiliates. The Company will continue to offer Class I and Class P shares of Global Franchise and Global Value Equity to existing stockholders and may recommence offering Class I and Class P shares of Global Franchise and Global Value Equity to other new investors in the future. Any such offerings of Global Franchise's shares and Global Value Equity's shares may be limited in amount and may commence and terminate without any prior notice. The Company's Board has authorized the issuance of the Global Franchise Shares in connection with the Reorganization.
With respect to each Portfolio, the minimum initial investment generally is $5,000,000 for Class I shares and $1,000,000 for Class P shares. The minimum initial investment will be waived for certain investments, including sales through banks, broker-dealers and other financial institutions (including registered investment advisers and financial planners) purchasing shares on behalf of their clients in (i) discretionary and non-discretionary advisory programs, (ii) fund supermarkets, (iii) asset allocation programs or (iv) other programs in which the client pays an asset-based fee for advice or for executing transactions in Portfolio shares or for otherwise participating in the program; certain retirement plans with plan assets of at least $5 million investing directly with the Fund; retirement plans investing through certain retirement plan platforms; certain endowments, foundations and other not for profit entities with at least $5 million of investable assets investing directly with the Fund; certain unit investment trusts sponsored by Morgan Stanley or any of its affiliates; other registered investment companies advised by Morgan Stanley Investment Management or any of its affiliates; Morgan Stanley Investment Management and its affiliates with respect to shares held in connection with certain retirement and deferred compensation programs established for their employees; the independent Directors of the Fund; and clients who owned Portfolio shares as of December 31, 2007. If the value of an investor's account falls below the minimum initial investment amount for Class I or Class P shares as a result of share redemptions or an investor no longer meets one of the waiver criteria set forth above, the investor's account may be subject to involuntary conversion or involuntary redemption. For further information relating to minimum investment requirements of Global Franchise, please see the section entitled "Shareholder Information—How to Purchase Class I and Class P Shares" in Global Franchise's Prospectus attached hereto as Exhibit B.
Both Class I and Class P shares of each Portfolio are offered at net asset value with no initial sales charge.
Shares of each class of Global Franchise and Global Value Equity may be exchanged for shares of the same class of any other available portfolio of the Company (each, an "Exchange Portfolio") without the imposition of an exchange fee. In addition, Class I and Class P shares of each Portfolio may be exchanged for Institutional Class and Class P shares, respectively, of available portfolios of Morgan Stanley Institutional Fund Trust (also, each an "Exchange Portfolio"). Upon consummation of the Reorganization, the foregoing exchange privileges will still be applicable to stockholders of the Combined Portfolio.
Both Global Franchise and Global Value Equity provide telephone exchange privileges to their stockholders. For greater details relating to exchange privileges applicable to Global Franchise, see the section entitled "Shareholder Information—How to Redeem Class I and Class P Shares—Exchange Privilege" in Global Franchise's Prospectus, as may be supplemented.
Stockholders of Global Franchise and Global Value Equity may redeem their shares for cash at any time at the net asset value per share next determined.
Dividends. Each Portfolio declares dividends separately for each of its classes. Each Portfolio pays dividends from net investment income, if any, annually and distributes net realized capital gains, if any, at least annually. With respect to each Portfolio, dividends and capital gains distributions are automatically reinvested in additional shares of the same class of shares of the Portfolio at net asset value unless the Stockholder elects to receive cash.
9
PRINCIPAL RISK FACTORS
The value of an investment in either Portfolio is based on the market prices of the securities the Portfolio holds. These prices change daily due to economic and other events that affect markets generally, as well as those that affect particular regions, countries, industries, companies or governments.
Both Portfolios invest in equity securities. In general, prices of equity securities are more volatile than those of fixed income securities. The prices of equity securities will rise and fall in response to a number of different factors. In particular, prices of equity securities will respond to events that affect entire financial markets or industries (changes in inflation or consumer demand, for example) and to events that affect particular issuers (news about the success or failure of a new product, for example).
Each Portfolio may invest in foreign securities. Investing in foreign countries, particularly those located in emerging market or developing countries, entails the risk that news and events unique to a country or region will affect those markets and their issuers. The value of a Portfolio's shares may vary widely in response to political and economic factors affecting companies in foreign countries. These same events will not necessarily have an effect on the U.S. economy or similar issuers located in the United States. In addition, a Portfolio's investments in foreign countries generally will be denominated in foreign currencies. As a result, changes in the value of a country's currency compared to the U.S. dollar may affect the value of a Portfolio's investments. These changes may occur separately from and in response to events that do not otherwise affect the value of the security in the issuer's home country.
Each Portfolio may invest in certain instruments, such as derivatives, and may use certain techniques, such as hedging, to manage these risks. However, the Sub-Advisers cannot guarantee that it will be practical to hedge these risks in certain markets or under particular conditions or that it will succeed in doing so.
Each Portfolio may invest in emerging market or developing countries, which are countries that major international financial institutions, such as the World Bank, generally consider to be less economically mature than developed nations, such as the United States or most nations in Western Europe. Emerging market or developing countries can include every nation in the world except the United States, Canada, Japan, Australia, New Zealand and most countries located in Western Europe. Emerging market or developing countries may be more likely to experience political turmoil or rapid changes in economic conditions than more developed countries, and the financial condition of issuers in emerging market or developing countries may be more precarious than in other countries. In addition, emerging market securities generally are less liquid and subject to wider price and currency fluctuations than securities issued in more developed countries. These characteristics result in greater risk of price volatility in emerging market or developing countries, which may be heightened by currency fluctuations relative to the U.S. dollar.
Each Portfolio may invest in the equity securities of any size company. While the Sub-Advisers believe that smaller companies provide greater growth potential than larger, more established firms, investing in the securities of smaller companies also involves greater risk and price volatility.
Each Portfolio's portfolio management team believes that the number of issuers with strong business franchises meeting its criteria may be limited and, accordingly, each Portfolio may consist of less holdings than a fund without such a specifically defined investment program. Each Portfolio generally emphasizes a strategy that focuses on larger investments in a few select companies rather than smaller investments in a larger number of issuers. To the extent each Portfolio focuses its investments in this way, it may be subject to more risk than a less focused fund because changes affecting a single issuer may cause greater fluctuations in the value of each Portfolio's shares.
Global Franchise is a "non-diversified" portfolio, and as such, its investments are not required to meet certain diversification requirements under federal securities law. Compared with "diversified" funds or portfolios, Global Franchise may invest in securities of a limited number of issuers. As a result, the performance of a particular investment or a small group of investments may affect Global Franchise's performance more than if Global Franchise were diversified. However, the investments of Global Franchise are currently diversified.
10
The foregoing discussion is a summary of the principal risk factors. For a more complete discussion of the risks of each Portfolio, see "Global Franchise Portfolio—Risks," "Global Value Equity Portfolio—Risks" and "Additional Risk Factors and Information" in the Prospectus, as may be supplemented, relating to both Portfolios, which is incorporated herein by reference.
THE REORGANIZATION
The Proposal
The Board of Directors of the Company, including the Independent Directors, having reviewed the financial position of Global Value Equity and the prospects for achieving economies of scale through the Reorganization and having determined that the Reorganization is in the best interests of Global Value Equity and its Stockholders and that the interests of Stockholders will not be diluted as a result thereof, recommends approval of the Reorganization by Stockholders of Global Value Equity.
The Board's Considerations
At a meeting held on November 19-20, 2008, the Board, including the Independent Directors, unanimously approved the Reorganization Agreement on behalf of Global Value Equity and determined to recommend that Stockholders approve the Reorganization Agreement. In reaching this decision, the Board made an extensive inquiry into a number of factors, particularly Global Value Equity's inability to gain assets as expected and the comparative expenses currently incurred in the operations of Global Value Equity and Global Franchise. The Board also considered other factors, including, but not limited to: the general compatibility of the investment objectives, policies and restrictions of Global Franchise and Global Value Equity, including the recent Investment Policy Changes of Global Value Equity authorized by the Board; the common portfolio management team of each Portfolio following the recent changes in personnel approved by the Board; the terms and conditions of the Reorganization which would affect the price of shares to be issued in the Reorganization; the tax-free nature of the Reorganization; and the expenses of this solicitation, including the cost of preparing and mailing this Proxy Statement and Prospectus, all of which will be borne by the Adviser in connection with the Reorganization.
In recommending the Reorganization to Stockholders, the Board of the Company considered that the Reorganization would have the following benefits to Stockholders:
1. Once the Reorganization is consummated, the expenses which would be borne by stockholders of each class of the Combined Portfolio will be lower on a percentage basis than the expenses of each corresponding class of Global Value Equity. The Board compared the annual advisory fee (as a percentage of assets) payable by the Combined Portfolio to that payable by Global Franchise and Global Value Equity. The Board noted that while Global Franchise's advisory fee rate (0.80% of average daily net assets) is higher than Global Value Equity's advisory fee rate (0.67% of average daily net assets), the total annual portfolio operating expenses for the Combined Portfolio will be lower than that of each of Global Value Equity and Global Franchise. The Board also noted that the Adviser has agreed, for at least one year, to voluntarily reduce its advisory fee and/or reimburse the Combined Portfolio, so that total annual portfolio operating expenses, excluding certain investment related expenses (such as foreign country tax expense and interest expense on borrowing), will not exceed 1.00% for Class I shares and 1.25% for Class P shares of the Combined Portfolio. The Board also noted that, given the likelihood of continuing redemptions from Global Value Equity, its "Other Expenses" (as a percentage of average daily net assets) were likely to increase in the current and future fiscal years. Furthermore, to the extent that the Reorganization would result in Stockholders becoming stockholders of a combined larger fund, further economies of scale could be achieved since various fixed expenses (e.g., auditing and legal) can be spread over a larger number of shares.
2. Stockholders will have continued participation in a fund that invests in issuers throughout the world. The Board also considered that the Reorganization will create a clearer, more understandable product offering, which should support a more focused sales and marketing effort on fewer portfolios within the "global" product category.
11
3. The Reorganization is intended to qualify as a tax-free reorganization for federal income tax purposes, pursuant to which no gain or loss will be recognized by Global Franchise, Global Value Equity or their stockholders for federal income tax purposes as a result of transactions included in the Reorganization.
4. The Board noted that Global Franchise suspended offering Class I and Class P shares of Global Franchise to new investors subject to certain exceptions and that Stockholders of Global Value Equity would have the ability to gain exposure to Global Franchise only through the Reorganization (unless such stockholders already hold shares in Global Franchise).
The Board of the Company, on behalf of Global Franchise, including a majority of the Independent Directors, also has determined that the Reorganization is in the best interests of Global Franchise and its stockholders and that the interests of existing stockholders of Global Franchise will not be diluted as a result thereof. The Board believes that the transaction will enable Global Franchise to acquire investment securities which are consistent with Global Franchise's investment objective, without the brokerage costs attendant to the purchase of such securities in the market, and that Global Franchise's stockholders will benefit from more effective distribution efforts following the elimination of a similar competing Morgan Stanley portfolio. The Board considered that even if the benefits enumerated above are not realized, the costs to Global Franchise are sufficiently minor to warrant taking the opportunity to realize those benefits.
The Reorganization Agreement
The terms and conditions under which the Reorganization would be consummated, as summarized below, are set forth in the Reorganization Agreement. This summary is qualified in its entirety by reference to the form of Reorganization Agreement, a copy of which is attached as Exhibit A to this Proxy Statement and Prospectus.
The Reorganization Agreement provides that (i) Global Value Equity will transfer all of its assets, including portfolio securities, cash, cash equivalents and receivables to Global Franchise on the Closing Date in exchange for the assumption by Global Franchise of stated liabilities of Global Value Equity, including all expenses, costs, charges and reserves, as reflected on an unaudited statement of assets and liabilities of Global Value Equity prepared by the Treasurer of Global Value Equity as of the Valuation Date (as defined below) in accordance with generally accepted accounting principles consistently applied from the prior audited period, and the delivery of the Global Franchise Shares; (ii) such Global Franchise Shares would be distributed to Stockholders on the Closing Date or as soon as practicable thereafter; (iii) Global Value Equity would be liquidated and terminated as a series of the Company; and (iv) the outstanding shares of Global Value Equity would be canceled.
The number of Global Franchise Shares to be delivered to Global Value Equity will be determined by dividing the aggregate net asset value of each class of shares of Global Value Equity acquired by Global Franchise by the net asset value per share of the corresponding class of shares of Global Franchise; these values will be calculated as of the close of business of the New York Stock Exchange on the third business day following the receipt of the requisite approval by Stockholders of the Reorganization Agreement or at such other time as Global Franchise and Global Value Equity may agree (the "Valuation Date"). As an illustration, assume that on the Valuation Date, Class P shares of Global Value Equity had an aggregate net asset value of $100,000. If the net asset value per Class P share of Global Franchise were $10 per share at the close of business on the Valuation Date, the number of Class P shares of Global Franchise to be issued would be 10,000 ($100,000 ÷ $10). These 10,000 Class P shares of Global Franchise would be distributed to the former Class P stockholders of Global Value Equity. This example is given for illustration purposes only and does not bear any relationship to the dollar amounts or shares expected to be involved in the Reorganization.
On the Closing Date or as soon as practicable thereafter, Global Value Equity will distribute pro rata to its Stockholders of record as of the close of business on the Valuation Date, the Global Franchise Shares it receives. Each Stockholder will receive the class of shares of Global Franchise that corresponds to the class of shares of Global Value Equity currently held by that Stockholder. Accordingly, the Global Franchise Shares will be distributed as follows: each of the Class I and Class P shares of Global Franchise will be distributed to holders of the Class I and
12
Class P shares of Global Value Equity, respectively. Global Franchise will cause its transfer agent to credit and confirm an appropriate number of Global Franchise Shares to each Stockholder.
The Closing Date will be the Valuation Date or the next business day following the Valuation Date. The consummation of the Reorganization is contingent upon the approval of the Reorganization by the Stockholders and the receipt of the other opinions and certificates set forth in Sections 6, 7 and 8 of the Reorganization Agreement and the occurrence of the events described in those Sections, certain of which may be waived by Global Franchise or Global Value Equity. The Reorganization Agreement may be amended in any mutually agreeable manner.
The Reorganization Agreement may be terminated and the Reorganization abandoned at any time, before or after approval by Stockholders or by mutual consent of the Company, on behalf of Global Franchise and Global Value Equity. In addition, either party may terminate the Reorganization Agreement upon the occurrence of a material breach of the Reorganization Agreement by the other party or if, by February 28, 2010, any condition set forth in the Reorganization Agreement has not been fulfilled or waived by the party entitled to its benefits.
Under the Reorganization Agreement, within one year after the Closing Date, Global Value Equity shall either pay or make provision for all of its liabilities to former Stockholders of Global Value Equity that received Global Franchise Shares. Global Value Equity shall be terminated as a series of the Company promptly following the distribution of Global Franchise Shares to Stockholders of record of Global Value Equity.
The effect of the Reorganization is that Stockholders who vote their shares in favor of the Reorganization Agreement are electing to sell their shares of Global Value Equity and reinvest the proceeds in Global Franchise Shares at net asset value and without recognition of taxable gain or loss for federal income tax purposes. See "Tax Aspects of the Reorganization" below. As noted in "Tax Aspects of the Reorganization" below, if Global Value Equity recognizes net gain from the sale of securities prior to the Closing Date, such gain, to the extent not offset by capital loss carryforwards, will be distributed to Stockholders prior to the Closing Date and will be taxable to Stockholders as capital gain.
Stockholders will continue to be able to redeem their shares of Global Value Equity at net asset value next determined after receipt of the redemption request until the close of business on the business day next preceding the Closing Date. Redemption requests received by Global Value Equity thereafter will be treated as requests for redemption of shares of Global Franchise.
Tax Aspects of the Reorganization
Tax Consequences of the Reorganization to the Stockholders. The Reorganization is intended to qualify for federal income tax purposes as a tax-free reorganization under Section 368(a)(1)(C) of the Internal Revenue Code of 1986, as amended (the "Code").
As a condition to the Reorganization, the Company, on behalf of each of Global Franchise and Global Value Equity, has requested an opinion of Clifford Chance US LLP to the effect that, based on certain assumptions, facts, the terms of the Reorganization Agreement and representations set forth in the Reorganization Agreement or otherwise provided by Global Franchise and Global Value Equity:
1. The transfer of Global Value Equity's assets in exchange for the Global Franchise Shares and the assumption by Global Franchise of certain stated liabilities of Global Value Equity followed by the distribution by Global Value Equity of the Global Franchise Shares to Stockholders in exchange for their Global Value Equity shares pursuant to and in accordance with the terms of the Reorganization Agreement will constitute a "reorganization" within the meaning of Section 368(a)(1)(C) of the Code, and Global Franchise and Global Value Equity will each be a "party to a reorganization" within the meaning of Section 368(b) of the Code;
2. No gain or loss will be recognized by Global Franchise upon the receipt of the assets of Global Value Equity solely in exchange for the Global Franchise Shares and the assumption by Global Franchise of the stated liabilities of Global Value Equity;
13
3. No gain or loss will be recognized by Global Value Equity upon the transfer of the assets of Global Value Equity to Global Franchise in exchange for the Global Franchise Shares and the assumption by Global Franchise of the stated liabilities or upon the distribution of Global Franchise Shares to Stockholders in exchange for their Global Value Equity shares;
4. No gain or loss will be recognized by Stockholders upon the exchange of the shares of Global Value Equity for the Global Franchise Shares;
5. The aggregate tax basis for the Global Franchise Shares received by each of the Stockholders pursuant to the Reorganization will be the same as the aggregate tax basis of the shares in Global Value Equity held by each such Stockholder immediately prior to the Reorganization;
6. The holding period of the Global Franchise Shares to be received by each Stockholder will include the period during which the shares in Global Value Equity surrendered in exchange therefor were held (provided such shares in Global Value Equity were held as capital assets on the date of the Reorganization);
7. The tax basis of the assets of Global Value Equity acquired by Global Franchise will be the same as the tax basis of such assets of Global Value Equity immediately prior to the Reorganization; and
8. The holding period of the assets of Global Value Equity in the hands of Global Franchise will include the period during which those assets were held by Global Value Equity.
The advice of counsel is not binding on the Internal Revenue Service (the "IRS") or the courts and neither Global Franchise nor Global Value Equity has sought a ruling with respect to the tax treatment of the Reorganization. The opinion of counsel, if delivered, will be based on the Code, regulations issued by the Treasury Department under the Code, court decisions, and administrative pronouncements issued by the IRS with respect to all of the foregoing, all as in effect on the date of the opinion, and all of which may be repealed, revoked or modified thereafter, possibly on a retroactive basis.
Stockholders should consult their tax advisors regarding the effect, if any, of the proposed Reorganization in light of their individual circumstances. Because the foregoing discussion only relates to the federal income tax consequences of the proposed Reorganization, Stockholders should also consult their tax advisors as to state and local tax consequences, if any, of the proposed Reorganization.
Tax Consequences of the Reorganization to Global Franchise and Global Value Equity. Under the Code, the Reorganization may result in limitations on the utilization of the capital loss carryovers of Global Franchise and Global Value Equity. The effect of any such limitations will depend on the existence and amount of Global Franchise and Global Value Equity capital loss carryovers, built-in capital losses and built-in capital gains at the time of the Reorganization. In general, a fund or portfolio will have built-in capital gains if the fair market value of its assets on the date of the Reorganization exceeds its tax basis in such assets and a fund or portfolio will have built-in capital losses if its tax basis in its assets exceeds the fair market value of such assets on the date of the Reorganization.
As of December 31, 2008, Global Franchise had capital loss carryovers of approximately $275,000 and built-in capital losses of approximately $19,476,000. As of December 31, 2008, Global Value Equity had no capital loss carryovers and built-in capital gains of approximately $3,000,000.
Description of Shares
Global Franchise Shares to be issued pursuant to the Reorganization Agreement will, when issued, be fully paid and non-assessable by Global Franchise and transferable without restrictions and will have no preemptive rights. For greater details regarding each Portfolio's shares, see "Shareholder Information" in each Portfolio's Prospectus, as supplemented.
14
Capitalization Table (unaudited)
The following table sets forth the capitalization of Global Value Equity and Global Franchise as of December 31, 2008 and on a pro forma combined basis as if the Reorganization had occurred on that date:
| Net Assets | Shares Outstanding | Net Asset Value Per Share | |||||||||||||
| Class I | |||||||||||||||
| Global Franchise | $ | 78,029,520 | 7,211,644 | $ | 10.82 | ||||||||||
| Global Value Equity | $ | 24,110,464 | 2,541,790 | $ | 9.49 | ||||||||||
| Combined Portfolio (pro forma) | $ | 102,139,984 | 9,439,925 | $ | 10.82 | ||||||||||
| Class P | |||||||||||||||
| Global Franchise | $ | 2,891,978 | 270,080 | $ | 10.71 | ||||||||||
| Global Value Equity | $ | 11,887,677 | 1,268,600 | $ | 9.37 | ||||||||||
| Combined Portfolio (pro forma) | $ | 14,779,655 | 1,379,986 | $ | 10.71 | ||||||||||
| Total Class I and P | |||||||||||||||
| Global Franchise | $ | 80,921,498 | 7,481,724 | $ | 10.82 | ||||||||||
| Global Value Equity | $ | 35,998,141 | 3,810,390 | $ | 9.45 | ||||||||||
| Combined Portfolio (pro forma) | $ | 116,919,639 | 10,819,911 | $ | 10.81 | ||||||||||
Appraisal Rights
Stockholders will have no appraisal rights in connection with the Reorganization.
COMPARISON OF INVESTMENT OBJECTIVES, POLICIES AND RESTRICTIONS
Investment Objectives and Policies
The investment objective of Global Franchise is to seek long-term capital appreciation. The investment objective of Global Value Equity is to seek long-term capital appreciation by investing primarily in equity securities of issuers throughout the world, including U.S. issuers.
Global Franchise
Global Franchise's Sub-Advisers seek long-term capital appreciation by investing primarily in equity securities of issuers located throughout the world that they believe have, among other things, resilient business franchises and growth potential. The Sub-Advisers emphasize individual stock selection and seek to identify undervalued securities of issuers located throughout the world, including both developed and emerging market countries. Under normal market conditions, Global Franchise invests in securities of issuers from at least three different countries, which may include the United States.
The Sub-Advisers seek to invest in companies that they believe have resilient business franchises, strong cash flows, modest capital requirements, capable managements and growth potential. Securities are selected on a global basis with a strong bias towards value. The franchise focus of Global Franchise is based on the Sub-Advisers' belief that the intangible assets underlying a strong business franchise (such as patents, copyrights, brand names, licenses or distribution methods) are difficult to create or to replicate and that carefully selected franchise companies can yield above-average potential for long-term capital appreciation.
The Sub-Advisers rely on their research capabilities, analytical resources and judgment to identify and monitor franchise businesses meeting their investment criteria. The Sub-Advisers believe that the number of issuers with strong business franchises meeting its criteria may be limited, and accordingly, Global Franchise may concentrate its holdings in a relatively small number of companies and may invest up to 25% of its assets in a single issuer. The Sub-Advisers generally consider selling a portfolio holding when they determine that the holding no longer satisfies
15
its investment criteria or that replacing the holding with another investment should improve the Portfolio's valuation and/or quality.
Derivative instruments used by Global Franchise will be counted toward Global Franchise's exposure in the types of securities listed above to the extent they have economic characteristics similar to such securities.
Global Value Equity
Global Value Equity's Sub-Advisers seek to maintain a diversified portfolio of global equity securities based on individual stock selection and emphasizes a bottom-up approach to investing that seeks to identify securities of issuers which they believe are undervalued.
Effective November 20, 2008, the Board approved the Investment Policy Changes for Global Value Equity to make its investment policies substantially similar to those of Global Franchise. Following these changes, the Sub-Advisers seek to invest in companies that they believe have resilient business franchises, strong cash flows, modest capital requirements, capable managements and growth potential. Securities are selected on a global basis with a strong bias towards value. The franchise focus of Global Franchise is based on the Sub-Advisers' belief that the intangible assets underlying a strong business franchise (such as patents, copyrights, brand names, licenses or distribution methods) are difficult to create or to replicate and that carefully selected franchise companies can yield above-average potential for long-term capital appreciation.
The Sub-Advisers rely on its research capabilities, analytical resources and judgment to identify and monitor franchise businesses meeting its investment criteria. The Sub-Advisers believe that the number of issuers with strong business franchises meeting their criteria may be limited, and accordingly, Global Franchise may concentrate its holdings in a relatively small number of companies and may invest up to 25% of its assets in a single issuer. The Sub-Advisers generally consider selling a portfolio holding when they determine that the holding no longer satisfies their investment criteria or that replacing the holding with another investment should improve the Portfolio's valuation and/or quality.
Under normal circumstances, at least 80% of Global Value Equity's assets will be invested in equity securities. This policy may be changed without stockholder approval; however, you would be notified in writing of any changes. Derivative instruments used by Global Value Equity will be counted toward the 80% policy discussed above to the extent they have economic characteristics similar to the securities included within that policy.
Investment Restrictions
The investment restrictions adopted by Global Franchise and Global Value Equity as fundamental limitations are substantially similar and are summarized under the caption "Investment Limitations" in the Statement of Additional Information dated May 1, 2009 relating to both Portfolios. A fundamental investment restriction cannot be changed without the vote of the lesser of: (i) at least 67% of the voting securities of a fund or portfolio present at a meeting if the holders of more than 50% of the outstanding voting securities of a fund or portfolio are present or represented by Proxy; or (ii) more than 50% of the outstanding voting securities of a fund or portfolio.
Global Value Equity has one fundamental limitation which is materially different from Global Franchise: Global Value Equity is a diversified fund and, in connection therewith, will not, with respect to 75% of its total assets (i) purchase more than 10% of any class of the outstanding voting securities of any issuer and (ii) purchase securities of an issuer (except obligations of the U.S. Government and its agencies and instrumentalities) if as a result more than 5% of the total assets in its portfolio, at market value, would be invested in the securities of such issuer. Global Franchise is a non-diversified fund and, therefore, does not have this fundamental limitation. However, the investments of Global Franchise are currently diversified.
16
ADDITIONAL INFORMATION ABOUT GLOBAL FRANCHISE
AND GLOBAL VALUE EQUITY
General
For a discussion of the organization and operation of Global Franchise and Global Value Equity, see "Investment Summary" and "Fund Management" in their Prospectus, as may be supplemented (the "Prospectus"). For a discussion of the organization and operation of the Company, see "General Information—Fund History" in the Statement of Additional Information relating to both Portfolios.
Financial Information
For certain financial information about Global Franchise and Global Value Equity, see "Financial Highlights" with respect to each Portfolio in their Prospectus.
Management
For information about the Board of Directors, the Adviser and the Distributor of Global Franchise and Global Value Equity, see "Fund Management—Investment Adviser" in their Prospectus and "Management of the Fund" in the Company's Statement of Additional Information. In connection with the Investment Policy Changes, the Board also made changes to the portfolio management team of Global Value Equity so that its portfolio management team is now the same as the portfolio management team of Global Franchise.
Description of Shares and Stockholder Inquiries
For a description of the nature and most significant attributes of shares of Global Franchise and Global Value Equity, and information regarding Stockholder inquiries, see "General Information" in the Company's Statement of Additional Information as well as "Shareholder Information" and "Where to Find Additional Information" in their Prospectus.
Dividends, Distributions and Taxes
For a discussion of Global Franchise's and Global Value Equity's policies with respect to dividends, distributions and taxes, see "Shareholder Information—Dividends and Distributions; Taxes" in their Prospectus, "Taxes" in the Company's Statement of Additional Information, and the discussions herein under "Synopsis—Comparison of Global Franchise and Global Value Equity—Dividends," "Synopsis—Tax Consequences of the Reorganization" and "The Reorganization—Tax Aspects of the Reorganization."
Purchases, Exchanges and Redemptions
For a discussion of how Global Franchise's and Global Value Equity's shares may be purchased, exchanged and redeemed, see "Shareholder Information—How to Purchase Class I and Class P Shares; Exchange Features; How to Redeem Class I and Class P Shares" in their Prospectus, "Purchase of Shares" and "Redemption of Shares" in the Company's Statement of Additional Information, and the discussion herein under "Synopsis—Comparison of Global Franchise and Global Value Equity—Purchases, Exchanges and Redemptions."
FINANCIAL STATEMENTS AND EXPERTS
The financial statements of Global Franchise, for the fiscal year ended December 31, 2008, and Global Value Equity, for the fiscal year ended December 31, 2008, that are incorporated by reference in the Statement of Additional Information relating to the Registration Statement on Form N-14 of which this Proxy Statement and Prospectus forms a part, have been audited by Ernst & Young LLP, the Company's independent registered public accounting firm. The financial statements are incorporated by reference in reliance upon such reports given upon the authority of said firm as experts in accounting and auditing.
17
LEGAL MATTERS
Certain legal matters concerning the issuance of Global Franchise Shares will be passed upon by Clifford Chance US LLP, New York, New York. Such firm will rely on Maryland counsel as to matters of Maryland law.
AVAILABLE INFORMATION
Additional information about Global Franchise and Global Value Equity is available, as applicable, in the following documents which are incorporated herein by reference: (i) Global Franchise's and Global Value Equity's Prospectus dated May 1, 2009, as may be supplemented, attached to this Proxy Statement and Prospectus, which Prospectus forms a part of Post-Effective Amendment No. 75 to the Company's Registration Statement on Form N-1A (File Nos. 033-23166; 811-05624); and (ii) the Company's Annual Report for its fiscal year ended December 31, 2008, accompanying this Proxy Statement and Prospectus. The foregoing documents may be obtained upon request and without charge by calling (800) 548-7786 (toll-free).
Global Franchise and Global Value Equity are subject to the informational requirements of the Securities Exchange Act of 1934, as amended, and in accordance therewith, file reports and other information with the Commission. Proxy material, reports and other information about Global Franchise and Global Value Equity which are of public record can be viewed and copied at the Commission's Public Reference Room in Washington, D.C. Information about the Reference Room's operations may be obtained by calling the Commission at (202) 942-8090. Reports and other information about each Portfolio and the Company are available on the EDGAR Database on the Commission's Internet site (www.sec.gov) and copies of this information may be obtained, after paying a duplicating fee, by electronic request at the following E-mail address: publicinfo@sec.gov, or by writing the Public Reference Branch, Office of Consumer Affairs and Information Services, Securities and Exchange Commission, Washington, D.C. 20549-0102.
OTHER BUSINESS
Management of Global Value Equity knows of no business other than the matters specified above which will be presented at the Meeting. Since matters not known at the time of the solicitation may come before the Meeting, the Proxy as solicited confers discretionary authority with respect to such matters as properly come before the Meeting, including any adjournment or adjournments thereof, and it is the intention of the persons named as attorneys-in-fact in the Proxy to vote this Proxy in accordance with their judgment on such matters.
By Order of the Board of Directors,
Mary E. Mullin
Secretary
June 19, 2009
18
Exhibit A
AGREEMENT AND PLAN OF REORGANIZATION
THIS AGREEMENT AND PLAN OF REORGANIZATION ("Agreement") is made as of November 20, 2008, by and between MORGAN STANLEY INSTITUTIONAL FUND, INC. (the "Company"), a Maryland corporation, on behalf of GLOBAL FRANCHISE PORTFOLIO ("Acquiring Portfolio"), and the Company, on behalf of GLOBAL VALUE EQUITY PORTFOLIO ("Acquired Portfolio"). Each of Acquiring Portfolio and Acquired Portfolio is a separate series of the Company.
This Agreement is intended to be and is adopted as a "plan of reorganization" within the meaning of Treas. Reg. 1.368-2(g), for a reorganization under Section 368(a)(1) of the Internal Revenue Code of 1986, as amended (the "Code"). The reorganization ("Reorganization") will consist of the transfer to Acquiring Portfolio of substantially all of the assets of Acquired Portfolio in exchange for the assumption by Acquiring Portfolio of all stated liabilities of Acquired Portfolio and the issuance by Acquiring Portfolio of shares of common stock, par value $0.001 per share (the "Acquiring Portfolio Shares"), to be distributed, after the Closing Date hereinafter referred to, to the stockholders of Acquired Portfolio in liquidation of Acquired Portfolio as provided herein, all upon the terms and conditions hereinafter set forth in this Agreement.
In consideration of the premises and of the covenants and agreements hereinafter set forth, the parties hereto covenant and agree as follows:
1. The Reorganization and Liquidation of Acquired Portfolio
1.1 Subject to the terms and conditions herein set forth and on the basis of the representations and warranties contained herein, the Company, on behalf of Acquired Portfolio, agrees to assign, deliver and otherwise transfer the Acquired Portfolio Assets (as defined in paragraph 1.2) to Acquiring Portfolio and the Company, on behalf of Acquiring Portfolio, agrees in exchange therefor to assume all of Acquired Portfolio's stated liabilities on the Closing Date as set forth in paragraph 1.3 and to deliver to Acquired Portfolio the number of Acquiring Portfolio Shares, including fractional Acquiring Portfolio Shares, determined in the manner set forth in paragraph 2.3. Such transactions shall take place at the closing provided for in paragraph 3.1 ("Closing").
1.2 (a) The "Acquired Portfolio Assets" shall consist of all property, including without limitation, all cash, cash equivalents, securities and dividend and interest receivables owned by Acquired Portfolio, and any deferred or prepaid expenses shown as an asset on Acquired Portfolio's books on the Valuation Date.
(b) On or prior to the Valuation Date, the Company, on behalf of Acquired Portfolio, will provide Acquiring Portfolio with a list of all of Acquired Portfolio's assets to be assigned, delivered and otherwise transferred to Acquiring Portfolio and a list of the stated liabilities to be assumed by Acquiring Portfolio pursuant to this Agreement. The Company, on behalf of Acquired Portfolio, reserves the right to sell any of the securities on such list but will not, without the prior approval of the Company, on behalf of Acquiring Portfolio, acquire any additional securities other than securities of the type in which Acquiring Portfolio is permitted to invest and in amounts agreed to in writing by the Company, on behalf of Acquiring Portfolio. The Company, on behalf of Acquiring Portfolio, will, within a reasonable time prior to the Valuation Date, furnish Acquired Portfolio with a statement of Acquiring Portfolio's investment objective, policies and restrictions and a list of the securities, if any, on the list referred to in the first sentence of this paragraph that do not conform to Acquiring Portfolio's investment objective, policies and restrictions. In the event that Acquired Portfolio holds any investments that Acquiring Portfolio is not permitted to hold, the Company, on behalf of Acquired Portfolio, will dispose of such securities on or prior to the Valuation Date. In addition, if it is determined that the portfolios of Acquired Portfolio and Acquiring Portfolio, when aggregated, would contain investments exceeding certain percentage limitations imposed upon Acquiring Portfolio with respect to such investments, the Company, on behalf of Acquired Portfolio, if requested by the Company, on behalf of Acquiring Portfolio, will, on or prior to the Valuation Date, dispose of and/or reinvest a sufficient amount of such investments as may be necessary to avoid violating such limitations as of the Closing Date (as defined in paragraph 3.1).
A-1
1.3 The Company, on behalf of Acquired Portfolio, will endeavor to discharge all of Acquired Portfolio's liabilities and obligations on or prior to the Valuation Date. The Company, on behalf of Acquiring Portfolio, will assume all stated liabilities, which includes, without limitation, all expenses, costs, charges and reserves reflected on an unaudited Statement of Assets and Liabilities of Acquired Portfolio prepared by the Treasurer of Acquired Portfolio as of the Valuation Date in accordance with generally accepted accounting principles consistently applied from the prior audited period.
1.4 In order for the Acquired Portfolio to comply with Section 852(a)(1) of the Code and to avoid having any investment company taxable income or net capital gain (as defined in Sections 852(b)(2) and 1222(11) of the Code, respectively) in the short taxable year ending with its dissolution, the Company, on behalf of Acquired Portfolio, will on or before the Valuation Date (a) declare a dividend in an amount large enough so that Acquired Portfolio will have declared dividends of substantially all of its investment company taxable income and net capital gain, if any, for such taxable year (determined without regard to any deduction for dividends paid) and (b) distribute such dividend.
1.5 On the Closing Date or as soon as practicable thereafter, Acquired Portfolio will distribute Acquiring Portfolio Shares received by Acquired Portfolio pursuant to paragraph 1.1 pro rata to Acquired Portfolio's stockholders of record determined as of the close of business on the Valuation Date ("Acquired Portfolio Stockholders"). Each Acquired Portfolio Stockholder will receive the class of shares of Acquiring Portfolio that corresponds to the class of shares of Acquired Portfolio currently held by that Acquired Portfolio Stockholder. Accordingly, the Acquiring Portfolio Shares will be distributed as follows: each of the Class I and Class P shares of Acquiring Portfolio will be distributed to holders of Class I and Class P shares of Acquired Portfolio, respectively. Such distribution will be accomplished by an instruction, signed by Acquired Portfolio's Secretary, to transfer Acquiring Portfolio Shares then credited to Acquired Portfolio's account on the books of Acquiring Portfolio to open accounts on the books of Acquiring Portfolio in the names of the Acquired Portfolio Stockholders and representing the respective pro rata number of Acquiring Portfolio Shares due such Acquired Portfolio Stockholders. All issued and outstanding shares of Acquired Portfolio simultaneously will be canceled on Acquired Portfolio's books.
1.6 Ownership of Acquiring Portfolio Shares will be shown on the books of Acquiring Portfolio's transfer agent. Acquiring Portfolio Shares will be issued in the manner described in Acquiring Portfolio's current Prospectus, as supplemented, and the Company's Statement of Additional Information.
1.7 Any transfer taxes payable upon issuance of Acquiring Portfolio Shares in a name other than the registered holder of Acquiring Portfolio Shares on Acquired Portfolio's books as of the close of business on the Valuation Date shall, as a condition of such issuance and transfer, be paid by the person to whom Acquiring Portfolio Shares are to be issued and transferred.
1.8 Any reporting responsibility of Acquired Portfolio is and shall remain the responsibility of Acquired Portfolio up to and including the date on which Acquired Portfolio is dissolved and terminated pursuant to paragraph 1.9.
1.9 Within one year after the Closing Date, the Company, on behalf of Acquired Portfolio, shall pay or make provision for the payment of all Acquired Portfolio's liabilities and taxes. If and to the extent that any trust, escrow account, or other similar entity continues after the close of such one-year period in connection either with making provision for payment of liabilities or taxes or with distributions to stockholders of Acquired Portfolio, such entity shall either (i) qualify as a liquidating trust under Section 7701 of the Code (and applicable Treasury Regulations thereunder) or other entity which does not constitute a continuation of Acquired Portfolio for federal income tax purposes, or (ii) be subject to a waiver under Section 368(a)(2)(G)(ii) of the complete distribution requirement of Section 368(a)(2)(G)(i) of the Code. Acquired Portfolio shall be terminated as a series of the Company promptly following the making of all distributions pursuant to paragraph 1.5 (and, in any event, within one year after the Closing Date).
1.10 Copies of all books and records maintained on behalf of Acquired Portfolio in connection with its obligations under the Investment Company Act of 1940, as amended (the "1940 Act"), the Code, state blue sky laws
A-2
or otherwise in connection with this Agreement will promptly be delivered after the Closing to officers of Acquiring Portfolio or their designee, and Acquiring Portfolio or its designee shall comply with applicable record retention requirements to which Acquired Portfolio is subject under the 1940 Act.
2. Valuation
2.1 The value of the Acquired Portfolio Assets shall be the value of such assets computed as of 4:00 p.m. on the New York Stock Exchange on the third business day following the receipt of the requisite approval of this Agreement by stockholders of Acquired Portfolio or at such time on such earlier or later date after such approval as may be mutually agreed upon in writing (such time and date being hereinafter called the "Valuation Date"), using the valuation procedures set forth in Acquiring Portfolio's then current Prospectus, as supplemented, and the Company's Statement of Additional Information.
2.2 The net asset value of an Acquiring Portfolio Share shall be the net asset value per share computed on the Valuation Date, using the valuation procedures set forth in Acquiring Portfolio's then current Prospectus, as supplemented, and the Company's Statement of Additional Information.
2.3 The number of Acquiring Portfolio Shares (including fractional shares, if any) to be issued hereunder shall be determined, with respect to each class, by dividing the aggregate net asset value of each class of Acquired Portfolio shares (determined in accordance with paragraph 2.1) by the net asset value per share of the corresponding class of shares of Acquiring Portfolio (determined in accordance with paragraph 2.2).
2.4 All computations of value shall be made by Morgan Stanley Services Company Inc. ("Morgan Stanley Services") in accordance with its regular practice in pricing Acquiring Portfolio. The Company, on behalf of Acquiring Portfolio, shall cause Morgan Stanley Services to deliver a copy of Acquiring Portfolio's valuation report at the Closing.
3. Closing and Closing Date
3.1 The Closing shall take place on the Valuation Date or on the next business day following the Valuation Date (the "Closing Date"). The Closing shall be held as of 9:00 a.m. Eastern time, or at such other time as the parties may agree. The Closing shall be held in a location mutually agreeable to the parties hereto. All acts taking place at the Closing shall be deemed to take place simultaneously as of 9:00 a.m. Eastern time on the Closing Date unless otherwise provided.
3.2 Portfolio securities held by Acquired Portfolio and represented by a certificate or other written instrument shall be presented by it or on its behalf to JPMorgan Chase Bank, N.A. (the "Custodian"), as custodian for Acquiring Portfolio, for examination no later than five business days preceding the Valuation Date. Such portfolio securities (together with any cash or other assets) shall be delivered by the Company, on behalf of Acquired Portfolio, to the Custodian for the account of Acquiring Portfolio on or before the Closing Date in conformity with applicable custody provisions under the 1940 Act and duly endorsed in proper form for transfer in such condition as to constitute good delivery thereof in accordance with the custom of brokers. The portfolio securities shall be accompanied by all necessary federal and state stock transfer stamps or a check for the appropriate purchase price of such stamps. Portfolio securities and instruments deposited with a securities depository (as defined in Rule 17f-4 under the 1940 Act) shall be delivered on or before the Closing Date by book-entry in accordance with customary practices of such depository and the Custodian. The cash delivered shall be in the form of a Federal Funds wire, payable to the order of "JPMorgan Chase Bank, N.A., Custodian for Morgan Stanley Institutional Fund, Inc."
3.3 In the event that on the Valuation Date, (a) the New York Stock Exchange shall be closed to trading or trading thereon shall be restricted or (b) trading or the reporting of trading on such Exchange or elsewhere shall be disrupted so that, in the judgment of both the Company, on behalf of Acquiring Portfolio, and the Company, on behalf of Acquired Portfolio, accurate appraisal of the value of the net assets of Acquiring Portfolio or the Acquired Portfolio Assets is impracticable, the Valuation Date shall be postponed until the first business day after the day when trading shall have been fully resumed without restriction or disruption and reporting shall have been restored.
A-3
3.4 If requested, the Company, on behalf of Acquired Portfolio, shall deliver to the Company, on behalf of Acquiring Portfolio, or its designee (a) at the Closing, a list, certified by Acquired Portfolio's Secretary, of the names, addresses and taxpayer identification numbers of the Acquired Portfolio Stockholders and the number and percentage ownership of outstanding Acquired Portfolio shares owned by each such Acquired Portfolio Stockholder, all as of the Valuation Date, and (b) as soon as practicable after the Closing, all original documentation (including Internal Revenue Service forms, certificates, certifications and correspondence) relating to the Acquired Portfolio Stockholders' taxpayer identification numbers and their liability for or exemption from back-up withholding. The Company, on behalf of Acquiring Portfolio, shall issue and deliver to such Secretary a confirmation evidencing delivery of Acquiring Portfolio Shares to be credited on the Closing Date to Acquired Portfolio or provide evidence satisfactory to the Company, on behalf of Acquired Portfolio, that such Acquiring Portfolio Shares have been credited to Acquired Portfolio's account on the books of Acquiring Portfolio. At the Closing, each party shall deliver to the other such bills of sale, checks, assignments, share certificates, if any, receipts or other documents as such other party or its counsel may reasonably request.
4. Covenants of Acquiring Portfolio and Acquired Portfolio
4.1 Except as otherwise expressly provided herein with respect to Acquired Portfolio, the Company, on behalf of Acquiring Portfolio and Acquired Portfolio, will operate the business of each of Acquiring Portfolio and Acquired Portfolio in the ordinary course between the date hereof and the Closing Date, it being understood that such ordinary course of business will include customary dividends and other distributions.
4.2 The Company will prepare and file with the Securities and Exchange Commission ("Commission") a registration statement on Form N-14 under the Securities Act of 1933, as amended ("1933 Act"), relating to Acquiring Portfolio Shares ("Registration Statement"). The Company, on behalf of Acquired Portfolio, will provide the Proxy Materials as described in paragraph 4.3 below for inclusion in the Registration Statement. The Company agrees that each of Acquired Portfolio and Acquiring Portfolio will further provide such other information and documents as are reasonably necessary for the preparation of the Registration Statement.
4.3 The Company, on behalf of Acquired Portfolio, will call a meeting of Acquired Portfolio's stockholders to consider and act upon this Agreement and to take all other action necessary to obtain approval of the transactions contemplated herein. The Company, on behalf of Acquired Portfolio, will prepare the notice of meeting, form of proxy and proxy statement (collectively, "Proxy Materials") to be used in connection with such meeting; provided that the Company, on behalf of Acquiring Portfolio, will furnish Acquired Portfolio with its currently effective prospectus for inclusion in the Proxy Materials and with such other information relating to Acquiring Portfolio as is reasonably necessary for the preparation of the Proxy Materials.
4.4 The Company, on behalf of Acquired Portfolio, will assist Acquiring Portfolio in obtaining such information as Acquiring Portfolio reasonably requests concerning the beneficial ownership of Acquired Portfolio shares.
4.5 Subject to the provisions of this Agreement, the Company agrees that Acquiring Portfolio and Acquired Portfolio will each take, or cause to be taken, all action, and do or cause to be done, all things reasonably necessary, proper or advisable to consummate and make effective the transactions contemplated by this Agreement.
4.6 The Company, on behalf of Acquired Portfolio, shall furnish or cause to be furnished to Acquiring Portfolio within 30 days after the Closing Date a statement of Acquired Portfolio's assets and liabilities as of the Closing Date, which statement shall be certified by the Company's Treasurer and shall be in accordance with generally accepted accounting principles consistently applied. As promptly as practicable, but in any case within 60 days after the Closing Date, the Company, on behalf of Acquired Portfolio, shall furnish Acquiring Portfolio, in such form as is reasonably satisfactory to Acquiring Portfolio, a statement certified by the Company's Treasurer of Acquired Portfolio's earnings and profits for federal income tax purposes that will be carried over to Acquiring Portfolio pursuant to Section 381 of the Code.
4.7 As soon after the Closing Date as is reasonably practicable, the Company (a) shall prepare and file all federal and other tax returns and reports of Acquired Portfolio required by law to be filed with respect to all periods
A-4
ending on or before the Closing Date but not theretofore filed and (b) shall pay all federal and other taxes shown as due thereon and/or all federal and other taxes that were unpaid as of the Closing Date, including without limitation, all taxes for which the provision for payment was made as of the Closing Date (as represented in paragraph 5.2(k)).
4.8 The Company agrees to use all reasonable efforts to obtain the approvals and authorizations required by the 1933 Act and the 1940 Act and to make such filings required by the state Blue Sky and securities laws as it may deem appropriate in order to continue the Acquiring Portfolio's operations after the Closing Date.
5. Representations and Warranties
5.1 The Company, on behalf of Acquiring Portfolio, represents and warrants to the Company, on behalf of Acquired Portfolio, as follows:
(a) Acquiring Portfolio is a series of the Company, a validly existing Maryland corporation with full power to carry on its business as presently conducted;
(b) the Company is a duly registered, open-end, management investment company, and its registration with the Commission as an investment company under the 1940 Act and the registration of its shares under the 1933 Act are in full force and effect;
(c) All of the issued and outstanding shares of Acquiring Portfolio have been offered and sold in compliance in all material respects with applicable registration requirements of the 1933 Act and state securities laws. Shares of Acquiring Portfolio are registered in all jurisdictions in which they are required to be registered under state securities laws and other laws, and said registrations, including any periodic reports or supplemental filings, are complete and current, all fees required to be paid have been paid, and Acquiring Portfolio is not subject to any stop order and is fully qualified to sell its shares in each state in which its shares have been registered;
(d) The current Prospectus of the Acquiring Portfolio and Statement of Additional Information of the Company conform in all material respects to the applicable requirements of the 1933 Act and the 1940 Act and the regulations thereunder and do not include any untrue statement of a material fact or omit to state any material fact required to be stated therein or necessary to make the statements therein, in light of the circumstances under which they were made, not misleading;
(e) The Company is not in, and the execution, delivery and performance of this Agreement will not result in a, material violation of any provision of its Articles of Incorporation or By-Laws, each as amended, or of any agreement, indenture, instrument, contract, lease or other undertaking to which Acquiring Portfolio is a party or by which it is bound;
(f) No litigation or administrative proceeding or investigation of or before any court or governmental body is presently pending or, to its knowledge, threatened against the Company, Acquiring Portfolio or any of their properties or assets which, if adversely determined, would materially and adversely affect Acquiring Portfolio's financial condition or the conduct of its business; and the Company knows of no facts that might form the basis for the institution of such proceedings and is not a party to or subject to the provisions of any order, decree or judgment of any court or governmental body which materially and adversely affects, or is reasonably likely to materially and adversely affect, its business or its ability to consummate the transactions herein contemplated;
(g) The Statement of Assets and Liabilities, Statement of Operations, Statement of Changes in Net Assets and Financial Highlights for the year ended December 31, 2008, of Acquiring Portfolio audited by Ernst & Young LLP (copies of which will be furnished to Acquired Portfolio), fairly present, in all material respects, Acquiring Portfolio's financial condition as of such date in accordance with generally accepted accounting principles, and its results of such operations, changes in its net assets and financial highlights for such period, and as of such date there will be no known liabilities of Acquiring Portfolio (contingent or otherwise) not disclosed therein that would be required in accordance with generally accepted accounting principles to be disclosed therein;
(h) All issued and outstanding Acquiring Portfolio Shares are, and at the Closing Date will be, duly and validly issued and outstanding, fully paid and nonassessable with no personal liability attaching to the
A-5
ownership thereof. Acquiring Portfolio does not have outstanding any options, warrants or other rights to subscribe for or purchase any of its shares;
(i) The execution, delivery and performance of this Agreement have been duly authorized by all necessary action on the part of the Company, and this Agreement constitutes a valid and binding obligation of Acquiring Portfolio enforceable in accordance with its terms, subject as to enforcement, to bankruptcy, insolvency, reorganization, moratorium and other laws relating to or affecting creditors' rights and to general equity principles. No other consents, authorizations or approvals are necessary in connection with Acquiring Portfolio's performance of this Agreement;
(j) Acquiring Portfolio Shares to be issued and delivered to Acquired Portfolio, for the account of the Acquired Portfolio Stockholders, pursuant to the terms of this Agreement will at the Closing Date have been duly authorized and, when so issued and delivered, will be duly and validly issued Acquiring Portfolio Shares, and will be fully paid and non-assessable with no personal liability attaching to the ownership thereof;
(k) All material federal and other tax returns and reports of Acquiring Portfolio required by law to be filed on or before the Closing Date have been filed and are correct, and all federal and other taxes shown as due or required to be shown as due on said returns and reports have been paid or provision has been made for the payment thereof, and to the best of the Company's knowledge, no such return is currently under audit and no assessment has been asserted with respect to any such return;
(l) For each taxable year since its inception, Acquiring Portfolio has met the requirements of Subchapter M of the Code for qualification and treatment as a "regulated investment company" and neither the execution or delivery of nor the performance of the Company's obligations with respect to Acquiring Portfolio under this Agreement will adversely affect, and no other events are reasonably likely to occur which will adversely affect, the ability of Acquiring Portfolio to continue to meet the requirements of Subchapter M of the Code;
(m) Since December 31, 2008, there has been no change by Acquiring Portfolio in accounting methods, principles, or practices, including those required by generally accepted accounting principles;
(n) The information furnished or to be furnished by the Company on behalf of Acquiring Portfolio for use in registration statements, proxy materials and other documents which may be necessary in connection with the transactions contemplated hereby shall be accurate and complete in all material respects and shall comply in all material respects with federal securities and other laws and regulations applicable thereto; and
(o) The Proxy Materials to be included in the Registration Statement (only insofar as they relate to Acquiring Portfolio) will, on the effective date of the Registration Statement and on the Closing Date, not contain any untrue statement of a material fact or omit to state a material fact required to be stated therein or necessary to make the statements therein, in light of the circumstances under which such statements were made, not materially misleading.
5.2 The Company, on behalf of Acquired Portfolio, represents and warrants to the Company, on behalf of Acquiring Portfolio, as follows:
(a) Acquired Portfolio is a series of the Company, a validly existing Maryland corporation with full power to carry on its business as presently conducted;
(b) the Company is a duly registered, open-end, management investment company, and its registration with the Commission as an investment company under the 1940 Act and the registration of its shares under the 1933 Act are in full force and effect;
(c) All of the issued and outstanding shares of Acquired Portfolio have been offered and sold in compliance in all material respects with applicable requirements of the 1933 Act and state securities laws. Shares of Acquired Portfolio are registered in all jurisdictions in which they are required to be registered and said registrations, including any periodic reports or supplemental filings, are complete and current, all fees required to
A-6
be paid have been paid, and Acquired Portfolio is not subject to any stop order and is fully qualified to sell its shares in each state in which its shares have been registered;
(d) The current Prospectus, as supplemented, of Acquired Portfolio and Statement of Additional Information of the Company conform in all material respects to the applicable requirements of the 1933 Act and the 1940 Act and the regulations thereunder and do not include any untrue statement of a material fact or omit to state any material fact required to be stated therein or necessary to make the statements therein, in light of the circumstances under which they were made, not misleading;
(e) The Company is not in, and the execution, delivery and performance of this Agreement will not result in a, material violation of any provision of its Articles of Incorporation or By-Laws, each as amended, or of any agreement, indenture, instrument, contract, lease or other undertaking to which Acquired Portfolio is a party or by which it is bound;
(f) No litigation or administrative proceeding or investigation of or before any court or governmental body is presently pending or, to its knowledge, threatened against the Company, Acquired Portfolio or any of its properties or assets which, if adversely determined, would materially and adversely affect Acquired Portfolio's financial condition or the conduct of its business; and the Company knows of no facts that might form the basis for the institution of such proceedings and is not a party to or subject to the provisions of any order, decree or judgment of any court or governmental body which materially and adversely affects, or is reasonably likely to materially and adversely affect, its business or its ability to consummate the transactions herein contemplated;
(g) The Statement of Assets and Liabilities, Statement of Operations, Statement of Changes in Net Assets and Financial Highlights of Acquired Portfolio for the year ended December 31, 2008, audited by Ernst & Young LLP (copies of which have been or will be furnished to Acquiring Portfolio) fairly present, in all material respects, Acquired Portfolio's financial condition as of such date, and its results of operations, changes in its net assets and financial highlights for such period in accordance with generally accepted accounting principles, and as of such date there were no known liabilities of Acquired Portfolio (contingent or otherwise) not disclosed therein that would be required in accordance with generally accepted accounting principles to be disclosed therein;
(h) Acquired Portfolio has no material contracts or other commitments (other than this Agreement) that will be terminated with liability to it prior to the Closing Date;
(i) All issued and outstanding shares of Acquired Portfolio are, and at the Closing Date will be, duly and validly issued and outstanding, fully paid and nonassessable with no personal liability attaching to the ownership thereof. Acquired Portfolio does not have outstanding any options, warrants or other rights to subscribe for or purchase any of its shares, nor is there outstanding any security convertible to any of its shares. All such shares will, at the time of Closing, be held by the persons and in the amounts set forth in the list of stockholders submitted to Acquiring Portfolio pursuant to paragraph 3.4;
(j) The execution, delivery and performance of this Agreement will have been duly authorized prior to the Closing Date by all necessary action on the part of the Company, and subject to the approval of Acquired Portfolio's stockholders, this Agreement constitutes a valid and binding obligation of Acquired Portfolio, enforceable in accordance with its terms, subject as to enforcement to bankruptcy, insolvency, reorganization, moratorium and other laws relating to or affecting creditors' rights and to general equity principles. No other consents, authorizations or approvals are necessary in connection with Acquired Portfolio's performance of this Agreement;
(k) All material federal and other tax returns and reports of Acquired Portfolio required by law to be filed on or before the Closing Date shall have been filed and are correct and all federal and other taxes shown as due or required to be shown as due on said returns and reports have been paid or provision has been made for the payment thereof, and to the best of the Company's knowledge, no such return is currently under audit and no assessment has been asserted with respect to any such return;
(l) For each taxable year since its inception, Acquired Portfolio has met all the requirements of Subchapter M of the Code for qualification and treatment as a "regulated investment company" and neither the
A-7
execution or delivery of nor the performance of the Company's obligations with respect to Acquired Portfolio under this Agreement will adversely affect, and no other events are reasonably likely to occur which will adversely affect, the ability of Acquired Portfolio to continue to meet the requirements of Subchapter M of the Code;
(m) At the Closing Date, the Company, on behalf of Acquired Portfolio, will have good and valid title to the Acquired Portfolio Assets, subject to no liens (other than the obligation, if any, to pay the purchase price of portfolio securities purchased by Acquired Portfolio which have not settled prior to the Closing Date), security interests or other encumbrances, and full right, power and authority to assign, deliver and otherwise transfer such assets hereunder, and upon delivery and payment for such assets, the Company, on behalf of Acquiring Portfolio, will acquire good and marketable title thereto, subject to no restrictions on the full transfer thereof, including any restrictions as might arise under the 1933 Act;
(n) On the effective date of the Registration Statement, at the time of the meeting of Acquired Portfolio's stockholders and on the Closing Date, the Proxy Materials (exclusive of the currently effective Acquiring Portfolio Prospectus contained therein) will (i) comply in all material respects with the provisions of the 1933 Act, the Securities Exchange Act of 1934, as amended ("1934 Act"), and the 1940 Act and the regulations thereunder and (ii) not contain any untrue statement of a material fact or omit to state a material fact required to be stated therein or necessary to make the statements therein not misleading. Any other information furnished by the Company on behalf of Acquired Portfolio for use in the Registration Statement or in any other manner that may be necessary in connection with the transactions contemplated hereby shall be accurate and complete and shall comply in all material respects with applicable federal securities and other laws and regulations thereunder;
(o) Acquired Portfolio will, on or prior to the Valuation Date, declare one or more dividends or other distributions to stockholders that, together with all previous dividends and other distributions to stockholders, shall have the effect of distributing to the stockholders all of its investment company taxable income and net capital gain, if any, through the Valuation Date (computed without regard to any deduction for dividends paid);
(p) Acquired Portfolio has maintained or has caused to be maintained on its behalf all books and accounts as required of a registered investment company in compliance with the requirements of Section 31 of the 1940 Act and the rules thereunder; and
(q) Acquired Portfolio is not acquiring Acquiring Portfolio Shares to be issued hereunder for the purpose of making any distribution thereof other than in accordance with the terms of this Agreement.
6. Conditions Precedent to Obligations of Acquired Portfolio
The obligations of the Company, with respect to Acquired Portfolio, to consummate the transactions provided for herein shall be subject, at its election, to the performance by the Company, on behalf of Acquiring Portfolio, of all the obligations to be performed by it hereunder on or before the Closing Date and, in addition thereto, the following conditions:
6.1 All representations and warranties of the Company made on behalf of Acquiring Portfolio contained in this Agreement shall be true and correct in all material respects as of the date hereof and, except as they may be affected by the transactions contemplated by this Agreement, as of the Closing Date with the same force and effect as if made on and as of the Closing Date;
6.2 The Company, on behalf of Acquiring Portfolio, shall have delivered to Acquired Portfolio a certificate of the Company's President and Treasurer, in a form reasonably satisfactory to Acquired Portfolio and dated as of the Closing Date, to the effect that the representations and warranties of the Company, on behalf of Acquiring Portfolio, made in this Agreement are true and correct at and as of the Closing Date, except as they may be affected by the transactions contemplated by this Agreement, and as to such other matters as the Company, on behalf of Acquired Portfolio, shall reasonably request;
A-8
6.3 The Company, on behalf of Acquired Portfolio, shall have received a favorable opinion from Clifford Chance US LLP, counsel to Acquiring Portfolio, dated as of the Closing Date, to the effect that:
(a) Acquiring Portfolio is a series of the Company, a validly existing Maryland corporation, and has the power to own all of its properties and assets and to carry on its business as presently conducted (Maryland counsel may be relied upon in delivering such opinion); (b) the Company is a duly registered, open-end, management investment company, and its registration with the Commission as an investment company under the 1940 Act is in full force and effect; (c) this Agreement has been duly authorized, executed and delivered by the Company and, assuming that the Registration Statement complies with the 1933 Act, the 1934 Act and the 1940 Act and regulations thereunder and assuming due authorization, execution and delivery of this Agreement by the Company, on behalf of Acquired Portfolio, is a valid and binding obligation of Acquiring Portfolio enforceable against Acquiring Portfolio in accordance with its terms, subject as to enforcement, to bankruptcy, insolvency, reorganization, moratorium and other laws relating to or affecting creditors' rights and to general equity principles; (d) Acquiring Portfolio Shares to be issued to Acquired Portfolio Stockholders as provided by this Agreement are duly authorized and upon such delivery will be validly issued, fully paid and non-assessable, and no Stockholder of Acquiring Portfolio has any preemptive rights to subscription or purchase in respect thereof (Maryland counsel may be relied upon in delivering such opinion); (e) the execution and delivery of this Agreement did not, and the consummation of the transactions contemplated hereby will not, violate the Company's Articles of Incorporation or By-Laws, each as amended; and (f) to the knowledge of such counsel, no consent, approval, authorization or order of any court or governmental authority of the United States or any state is required for the consummation by Acquiring Portfolio of the transactions contemplated herein, except such as have been obtained under the 1933 Act, the 1934 Act and the 1940 Act and such as may be required under state securities laws; and
6.4 As of the Closing Date, there shall have been no material change in the investment objective, policies and restrictions of Acquiring Portfolio or any increase in the investment management fees or annual fees pursuant to Acquiring Portfolio's shareholder services plan from those described in Acquiring Portfolio's Prospectus dated May 1, 2009, as may be supplemented, and the Company's Statement of Additional Information dated May 1, 2009, as may be supplemented.
7. Conditions Precedent to Obligations of Acquiring Portfolio
The obligations of the Company, on behalf of Acquiring Portfolio, to complete the transactions provided for herein shall be subject, at its election, to the performance by the Company, on behalf of Acquired Portfolio, of all the obligations to be performed by it hereunder on or before the Closing Date and, in addition thereto, the following conditions:
7.1 All representations and warranties of the Company made on behalf of Acquired Portfolio contained in this Agreement shall be true and correct in all material respects as of the date hereof and, except as they may be affected by the transactions contemplated by this Agreement, as of the Closing Date with the same force and effect as if made on and as of the Closing Date;
7.2 The Company, on behalf of Acquired Portfolio, shall have delivered to Acquiring Portfolio at the Closing a certificate of the Company's President and its Treasurer, in form and substance satisfactory to Acquiring Portfolio and dated as of the Closing Date, to the effect that the representations and warranties of the Company, on behalf of Acquired Portfolio, made in this Agreement are true and correct at and as of the Closing Date, except as they may be affected by the transactions contemplated by this Agreement, and as to such other matters as the Company, on behalf of Acquiring Portfolio, shall reasonably request;
7.3 Acquired Portfolio shall have delivered to Acquiring Portfolio a statement of the Acquired Portfolio Assets and its liabilities, together with a list of Acquired Portfolio's portfolio securities and other assets showing the respective adjusted bases and holding periods thereof for income tax purposes, as of the Closing Date, certified by the Treasurer of the Company;
A-9
7.4 The Company, on behalf of Acquiring Portfolio, shall have received at the Closing a favorable opinion from Clifford Chance US LLP, counsel to Acquired Portfolio, dated as of the Closing Date to the effect that:
(a) Acquired Portfolio is a series of the Company, a validly existing Maryland corporation, and has the power to own all of its properties and assets and to carry on its business as presently conducted (Maryland counsel may be relied upon in delivering such opinion); (b) the Company is a duly registered, open-end, management investment company under the 1940 Act, and its registration with the Commission as an investment company under the 1940 Act is in full force and effect; (c) this Agreement has been duly authorized, executed and delivered by the Company, on behalf of Acquired Portfolio, and, assuming that the Registration Statement complies with the 1933 Act, the 1934 Act and the 1940 Act and the regulations thereunder and assuming due authorization, execution and delivery of this Agreement by the Company, on behalf of Acquiring Portfolio, is a valid and binding obligation of Acquired Portfolio enforceable against Acquired Portfolio in accordance with its terms, subject as to enforcement, to bankruptcy, insolvency, reorganization, moratorium and other laws relating to or affecting creditors' rights and to general equity principles; (d) the execution and delivery of this Agreement did not, and the consummation of the transactions contemplated hereby will not, violate the Company's Articles of Incorporation or By-Laws, each as amended; and (e) to the knowledge of such counsel, no consent, approval, authorization or order of any court or governmental authority of the United States or any state is required for the consummation by Acquired Portfolio of the transactions contemplated herein, except such as have been obtained under the 1933 Act, the 1934 Act and the 1940 Act and such as may be required under state securities laws; and
7.5 On the Closing Date, the Acquired Portfolio Assets shall include no assets that the Acquiring Portfolio, by reason of limitations of the Company's Articles of Incorporation, as amended, or otherwise, may not properly acquire.
8. Further Conditions Precedent to Obligations of Acquiring Portfolio and Acquired Portfolio
The obligations of the Company, on behalf of Acquired Portfolio, and the Company, on behalf of Acquiring Portfolio, hereunder are each subject to the further conditions that on or before the Closing Date:
8.1 This Agreement and the transactions contemplated herein shall have been approved by the requisite vote of the holders of the outstanding shares of Acquired Portfolio in accordance with the provisions of the Company's Articles of Incorporation, as amended, and certified copies of the resolutions evidencing such approval shall have been delivered to Acquiring Portfolio;
8.2 On the Closing Date, no action, suit or other proceeding shall be pending before any court or governmental agency in which it is sought to restrain or prohibit, or obtain damages or other relief in connection with, this Agreement or the transactions contemplated herein;
8.3 All consents of other parties and all other consents, orders and permits of federal, state and local regulatory authorities (including those of the Commission and of state Blue Sky and securities authorities, including "no-action" positions of and exemptive orders from such federal and state authorities) deemed necessary by the Company, on behalf of both Acquiring Portfolio and Acquired Portfolio, to permit consummation, in all material respects, of the transactions contemplated herein shall have been obtained, except where failure to obtain any such consent, order or permit would not involve risk of a material adverse effect on the assets or properties of Acquiring Portfolio or Acquired Portfolio;
8.4 The Registration Statement shall have become effective under the 1933 Act, no stop orders suspending the effectiveness thereof shall have been issued and, to the best knowledge of the parties hereto, no investigation or proceeding for that purpose shall have been instituted or be pending, threatened or contemplated under the 1933 Act;
8.5 The Company, on behalf of Acquired Portfolio, shall have declared and paid a dividend or dividends and/or other distribution or distributions that, together with all previous such dividends or distributions, shall have the effect of distributing to the Acquired Portfolio Stockholders all of Acquired Portfolio's investment company taxable income (computed without regard to any deduction for dividends paid) and all of its net capital gain (after
A-10
reduction for any capital loss carry-forward and computed without regard to any deduction for dividends paid) for all taxable years ending on or before the Closing Date; and
8.6 The parties shall have received the opinion of the law firm of Clifford Chance US LLP (based on such representations as such law firm shall reasonably request), addressed to Acquiring Portfolio and Acquired Portfolio, which opinion may be relied upon by the stockholders of Acquired Portfolio, substantially to the effect that, for federal income tax purposes:
(a) The transfer of Acquired Portfolio's assets in exchange for Acquiring Portfolio Shares and the assumption by Acquiring Portfolio of certain stated liabilities of Acquired Portfolio followed by the distribution by Acquired Portfolio of Acquiring Portfolio Shares to the Acquired Portfolio Stockholders in exchange for their Acquired Portfolio shares pursuant to and in accordance with the terms of the Reorganization Agreement will constitute a "reorganization" within the meaning of Section 368(a)(1)(C) of the Code, and Acquired Portfolio and Acquiring Portfolio will each be a "party to a reorganization" within the meaning of Section 368(b) of the Code;
(b) No gain or loss will be recognized by Acquiring Portfolio upon the receipt of the assets of Acquired Portfolio solely in exchange for Acquiring Portfolio Shares and the assumption by Acquiring Portfolio of the stated liabilities of Acquired Portfolio;
(c) No gain or loss will be recognized by Acquired Portfolio upon the transfer of the assets of Acquired Portfolio to Acquiring Portfolio in exchange for Acquiring Portfolio Shares and the assumption by Acquiring Portfolio of the stated liabilities or upon the distribution of Acquiring Portfolio Shares to the Acquired Portfolio Stockholders in exchange for their Acquired Portfolio shares;
(d) No gain or loss will be recognized by the Acquired Portfolio Stockholders upon the exchange of the Acquired Portfolio shares for Acquiring Portfolio Shares;
(e) The aggregate tax basis for Acquiring Portfolio Shares received by each Acquired Portfolio Stockholder pursuant to the reorganization will be the same as the aggregate tax basis of the Acquired Portfolio shares held by each such Acquired Portfolio Stockholder immediately prior to the Reorganization;
(f) The holding period of Acquiring Portfolio Shares to be received by each Acquired Portfolio Stockholder will include the period during which the Acquired Portfolio shares surrendered in exchange therefor were held (provided such Acquired Portfolio shares were held as capital assets on the date of the Reorganization);
(g) The tax basis of the assets of Acquired Portfolio acquired by Acquiring Portfolio will be the same as the tax basis of such assets to Acquired Portfolio immediately prior to the Reorganization; and
(h) The holding period of the assets of Acquired Portfolio in the hands of Acquiring Portfolio will include the period during which those assets were held by Acquired Portfolio.
Notwithstanding anything herein to the contrary, neither the Company, on behalf of Acquiring Portfolio, nor the Company, on behalf of Acquired Portfolio, may waive the conditions set forth in this paragraph 8.6.
9. Fees and Expenses
9.1 (a) Morgan Stanley Investment Management Inc. shall bear all the expenses incurred in connection with the entering into, and carrying out of, the provisions of this Agreement, including printing, filing and proxy solicitation expenses, legal, accounting, Commission registration fees and Blue Sky expenses.
(b) In the event the transactions contemplated herein are not consummated by reason of Acquired Portfolio being either unwilling or unable to go forward (other than by reason of the nonfulfillment or failure of any condition to Acquired Portfolio's obligations specified in this Agreement), Acquired Portfolio's only obligation hereunder shall be to reimburse Acquiring Portfolio for all reasonable out-of-pocket fees and expenses incurred by Acquiring Portfolio in connection with those transactions.
(c) In the event the transactions contemplated herein are not consummated by reason of Acquiring Portfolio being either unwilling or unable to go forward (other than by reason of the nonfulfillment or failure of any
A-11
condition to Acquiring Portfolio's obligations specified in this Agreement), Acquiring Portfolio's only obligation hereunder shall be to reimburse Acquired Portfolio for all reasonable out-of-pocket fees and expenses incurred by Acquired Portfolio in connection with those transactions.
10. Entire Agreement; Survival of Warranties
10.1 This Agreement constitutes the entire agreement between the parties.
10.2 The representations, warranties and covenants contained in this Agreement or in any document delivered pursuant hereto or in connection herewith shall survive the consummation of the transactions contemplated herein, except that the representations, warranties and covenants of the Company made on behalf of Acquired Portfolio hereunder shall not survive the dissolution and complete liquidation of Acquired Portfolio in accordance with paragraph 1.9.
11. Termination
11.1 This Agreement may be terminated and the transactions contemplated hereby may be abandoned at any time prior to the Closing:
(a) by the mutual written consent of the Company, on behalf of Acquired Portfolio, and the Company, on behalf of Acquiring Portfolio;
(b) by either the Company, on behalf of Acquiring Portfolio, or the Company, on behalf of Acquired Portfolio, by notice to the other, without liability to the terminating party on account of such termination (providing the terminating party is not otherwise in material default or breach of this Agreement), if the Closing shall not have occurred on or before February 28, 2010; or
(c) by either the Company, on behalf of Acquiring Portfolio, or the Company, on behalf of Acquired Portfolio, in writing without liability to the terminating party on account of such termination (provided the terminating party is not otherwise in material default or breach of this Agreement), if (i) the other party shall fail to perform in any material respect its agreements contained herein required to be performed on or prior to the Closing Date, (ii) the other party materially breaches any of its representations, warranties or covenants contained herein, (iii) the Acquired Portfolio stockholders fail to approve this Agreement at any meeting called for such purpose at which a quorum was present or (iv) any other condition herein expressed to be precedent to the obligations of the terminating party has not been met and it reasonably appears that it will not or cannot be met.
11.2 (a) Termination of this Agreement pursuant to paragraphs 11.1(a) or (b) shall terminate all obligations of the parties hereunder and there shall be no liability for damages on the part of the Company, Acquiring Portfolio or Acquired Portfolio, or the directors or officers of the Company, on behalf of Acquiring Portfolio or Acquired Portfolio, to any other party or its directors, trustees or officers.
(b) Termination of this Agreement pursuant to paragraph 11.1(c) shall terminate all obligations of the parties hereunder and there shall be no liability for damages on the part of the Company, Acquiring Portfolio or Acquired Portfolio, or the directors or officers of the Company, on behalf of Acquiring Portfolio or Acquired Portfolio, except that any party in breach of this Agreement shall, upon demand, reimburse the non-breaching party for all reasonable out-of-pocket fees and expenses incurred in connection with the transactions contemplated by this Agreement, including legal, accounting and filing fees.
12. Amendments
This Agreement may be amended, modified or supplemented in such manner as may be mutually agreed upon in writing by the parties.
13. Miscellaneous
13.1 The article and paragraph headings contained in this Agreement are for reference purposes only and shall not affect in any way the meaning or interpretation of this Agreement.
A-12
13.2 This Agreement may be executed in any number of counterparts, each of which shall be deemed an original.
13.3 This Agreement shall be governed by and construed in accordance with the laws of the State of Maryland.
13.4 This Agreement shall bind and inure to the benefit of the parties hereto and their respective successors and assigns, but no assignment or transfer hereof or of any rights or obligations hereunder shall be made by any party without the written consent of the other party. Nothing herein expressed or implied is intended or shall be construed to confer upon or give any person, firm or corporation, other than the parties hereto and their respective successors and assigns, any rights or remedies under or by reason of this Agreement.
13.5 The obligations and liabilities of Acquiring Portfolio hereunder are solely those of Acquiring Portfolio. It is expressly agreed that no stockholder, nominee, director, officer, agent, or employee of Acquiring Portfolio, or the directors or officers of the Company, acting on behalf of Acquiring Portfolio, shall be personally liable hereunder. The execution and delivery of this Agreement have been authorized by the directors of Acquiring Portfolio and signed by authorized officers of the Company, acting on behalf of Acquiring Portfolio, and neither such authorization by such directors nor such execution and delivery by such officers shall be deemed to have been made by any of them individually or to impose any liability on any of them personally.
13.6 The obligations and liabilities of Acquired Portfolio hereunder are solely those of Acquired Portfolio. It is expressly agreed that no stockholder, nominee, director, officer, agent, or employee of Acquired Portfolio, or the directors or officers of the Company, acting on behalf of Acquired Portfolio, shall be personally liable hereunder. The execution and delivery of this Agreement have been authorized by the directors of the Acquired Portfolio and signed by authorized officers of the Company, acting on behalf of Acquired Portfolio, and neither such authorization by such directors nor such execution and delivery by such officers shall be deemed to have been made by any of them individually or to impose any liability on any of them personally.
A-13
IN WITNESS WHEREOF, each of the parties hereto has caused this Agreement to be executed by a duly authorized officer.
| MORGAN STANLEY INSTITUTIONAL FUND, INC., on behalf of the Global Value Equity Portfolio | |||
| By: /s/ Randy Takian Name: Randy Takian Title: President | |||
| MORGAN STANLEY INSTITUTIONAL FUND, INC., on behalf of the Global Franchise Portfolio | |||
| By: /s/ Stefanie V. Chang Yu Name: Stefanie V. Chang Yu Title: Vice-President | |||
A-14
Morgan Stanley Investment Management

Morgan Stanley
Institutional Fund, Inc.
Non U.S. and Global Portfolios
Active International Allocation Portfolio
Emerging Markets Portfolio
Global Franchise Portfolio
Global Value Equity Portfolio
International Equity Portfolio
International Growth Equity Portfolio
International Small Cap Portfolio
May 1, 2009
Prospectus
The Securities and Exchange Commission has not approved or disapproved these securities or passed upon the adequacy of this Prospectus. Any representation to the contrary is a criminal offense.
Table of Contents
| Page | |||||||
| Investment Summary | |||||||
| Portfolios | |||||||
| Active International Allocation Portfolio | 1 | ||||||
| Emerging Markets Portfolio | 3 | ||||||
| Global Franchise Portfolio | 5 | ||||||
| Global Value Equity Portfolio | 7 | ||||||
| International Equity Portfolio | 9 | ||||||
| International Growth Equity Portfolio | 11 | ||||||
| International Small Cap Portfolio | 13 | ||||||
| Fees and Expenses of the Portfolios | 15 | ||||||
| Additional Risk Factors and Information | 18 | ||||||
| Fund Management | 21 | ||||||
| Shareholder Information | 25 | ||||||
| Financial Highlights | 30 | ||||||
| Active International Allocation Portfolio | 30 | ||||||
| Emerging Markets Portfolio | 32 | ||||||
| Global Franchise Portfolio | 34 | ||||||
| Global Value Equity Portfolio | 36 | ||||||
| International Equity Portfolio | 38 | ||||||
| International Growth Equity Portfolio | 40 | ||||||
| International Small Cap Portfolio | 42 | ||||||
Morgan Stanley Institutional Fund, Inc. Prospectus
Investment Summary
Active International
Allocation Portfolio
Objective
The Active International Allocation Portfolio seeks long-term capital appreciation by investing primarily, in accordance with country and sector weightings determined by the Adviser, Morgan Stanley Investment Management Inc., in equity securities of non-U.S. issuers which, in the aggregate, replicate broad market indices.
Approach
The Adviser seeks to maintain a diversified portfolio of international equity securities based on a top-down approach that emphasizes country and sector selection and weighting rather than individual stock selection. The Adviser seeks to capitalize on the significance of country and sector selection in international equity portfolio returns by over and underweighting countries and/or sectors based primarily on three factors: (i) valuation; (ii) dynamics/fundamental change; and (iii) market momentum/technicals.
Process
The Adviser's Active International Allocation team analyzes both the global economic environment and the economies of countries throughout the world, focusing mainly on the industrialized countries comprising the MSCI Europe, Australasia, Far East Index (the "MSCI EAFE Index"). EAFE countries include Japan, most nations in Western Europe, Australia, New Zealand, Hong Kong and Singapore. The Adviser views each country and sector as a unique investment opportunity and evaluates factors such as valuation, growth, inflation, interest rates, corporate earnings growth, liquidity and risk characteristics, investor sentiment and economic and currency outlook. The Adviser – on an ongoing basis – establishes the proportion or weighting for each country and sector (e.g., overweight, underweight or neutral) relative to the MSCI EAFE Index for investment by the Portfolio. The Adviser invests the Portfolio's assets within each country and/or sector based on its assigned weighting. Within each country and/or sector, the Adviser will try to replicate, in the aggregate, the performance of a broad local market index by investing in "baskets" of common stocks and other equity securities. The Portfolio may invest in emerging market or developing countries and, with regard to such investments, may make global, regional and sector allocations to emerging markets, as well as allocations to specific emerging market or developing countries. The Adviser generally considers selling a portfolio holding when it determines that the holding no longer satisfies its investment criteria. The Portfolio may invest up to 10% of its net assets in foreign real estate companies.
Derivative instruments used by the Portfolio will be counted toward the Portfolio's exposure in the types of securities listed above to the extent they have economic characteristics similar to such securities.
Risks
The Portfolio's principal investment strategies are subject to the following principal risks:
Investing in the Portfolio may be appropriate for you if you are willing to accept the risks and uncertainties of investing in the equity securities of issuers in foreign countries, including emerging market or developing countries. In general, prices of equity securities are more volatile than those of fixed income securities. The prices of equity securities will rise and fall in response to a number of different factors. In particular, prices of equity securities will respond to events that affect entire financial markets or industries (changes in inflation or consumer demand, for example) and to events that affect particular issuers (news about the success or failure of a new product, for example). In addition, at times the Portfolio's market sector, foreign equity securities, may underperform relative to other sectors or the overall market.
Investing in the securities of foreign issuers, particularly those located in emerging market or developing countries, entails the risk that news and events unique to a country or region will affect those markets and their issuers. The value of the Portfolio's shares may vary widely in response to political and economic factors affecting companies in foreign countries. These same events will not necessarily have an effect on the U.S.
1
Active International
Allocation Portfolio (Cont'd)
economy or similar issuers located in the United States. In addition, the Portfolio's investments in foreign issuers generally will be denominated in foreign currencies. As a result, changes in the value of a country's currency compared to the U.S. dollar may affect the value of the Portfolio's investments. These changes may occur separately from and in response to events that do not otherwise affect the value of the security in the issuer's home country.
The Adviser may invest in certain instruments, such as derivatives, and may use certain techniques, such as hedging, to manage these risks. However, the Adviser cannot guarantee that it will be practical to hedge these risks in certain markets or under particular conditions or that it will succeed in doing so. The Adviser may use derivatives for other purposes, such as gaining exposure to foreign markets.
Foreign real estate companies are similar to entities organized and operated as real estate investment trusts ("REITs") in the United States. Investing in foreign real estate companies makes the Fund susceptible to the risks associated with the ownership of real estate and with the real estate industry in general, as well as risks that relate specifically to the way foreign real estate companies are organized and operated. Foreign real estate companies may be subject to laws, rules and regulations governing those entities and their failure to comply with those laws, rules and regulations could negatively impact the performance of those entities. In addition, foreign real estate companies, like U.S. REITs and mutual funds, have expenses, including management and administration fees, that are paid by their shareholders. As a result, shareholders will absorb their proportional share of duplicate levels of fees when the Portfolio invests in foreign real estate companies.
Please see "Additional Risk Factors and Information" for further information about these and other risks of investing in the Portfolio.
Annual Total Returns (Class I Share)
Commenced operations on January 17, 1992

Average Annual Total Returns
(for the calendar periods ended December 31, 2008)
| Past One Year | Past Five Years | Past Ten Years | |||||||||||||
| Class I (commenced operations on January 17, 1992) | |||||||||||||||
| Return before Taxes | -39.25 | % | 3.13 | % | 1.94 | % | |||||||||
| Return after Taxes on Distributions | -39.69 | % | 2.33 | % | 0.80 | % | |||||||||
| Return after Taxes on Distributions and Sale of Portfolio Shares | -24.35 | % | 2.77 | % | 1.30 | % | |||||||||
| MSCI EAFE Index (reflects no deduction for fees, expenses or taxes)1 | -43.38 | % | 1.66 | % | 0.80 | % | |||||||||
| Lipper International Large-Cap Core Funds Index (reflects no deduction for taxes)2 | -43.31 | % | 1.26 | % | 1.73 | % | |||||||||
| Class P (commenced operations on January 2, 1996) | |||||||||||||||
| Return before Taxes | -39.41 | % | 2.86 | % | 1.63 | % | |||||||||
| MSCI EAFE Index (reflects no deduction for fees, expenses or taxes)1 | -43.38 | % | 1.66 | % | 0.80 | % | |||||||||
| Lipper International Large-Cap Core Funds Index (reflects no deduction for taxes)2 | -43.31 | % | 1.26 | % | 1.73 | % | |||||||||
The Portfolio's past performance, before and after taxes, is not necessarily an indication of how the Portfolio will perform in the future.
The bar chart and table show the performance of the Portfolio year-by-year and as an average over different periods of time. The bar chart shows returns for Class I shares only. The Portfolio's Class P shares would have had similar annual returns, but returns would have been generally lower as expenses of this class are higher. Together, the bar chart and table demonstrate the variability of performance over time and provide an indication of the risks of investing in the Portfolio. The table also compares the performance of the Portfolio to indices of similar securities. An index is a hypothetical measure of performance based on the ups and downs of securities that make up a particular market. The indices do not show actual investment returns or reflect payment of management or brokerage fees or taxes, which would lower the indices' performance. The indices are unmanaged and should not be considered an investment. It is not possible to invest directly in an index.
After-tax returns are calculated using the historical highest individual federal marginal income tax rates during the period shown, and do not reflect the impact of state and local taxes. Actual after-tax returns depend on the investor's tax situation and may differ from those shown, and after-tax returns are not relevant to investors who hold their Portfolio shares through tax deferred arrangements such as 401(k) plans or individual retirement accounts. After-tax returns may be higher than before-tax returns due to an assumed benefit from capital losses that would have been realized had Portfolio shares been sold at the end of the relevant periods.
1 The Morgan Stanley Capital International (MSCI) EAFE Index (Europe, Australasia, Far East) is a free float-adjusted market capitalization index that is designed to measure the international equity market performance of developed markets, excluding the United States and Canada. The term "free float" represents the portion of shares outstanding that are deemed to be available for purchase in the public equity markets by investors. The MSCI EAFE Index currently consists of 21 developed market country indices. The performance of the Index is listed in U.S. dollars and assumes reinvestment of net dividends.
2 The Lipper International Large-Cap Core Funds Index is an equally weighted performance index of the largest qualifying funds (based on net assets) in the Lipper International Large-Cap Core Funds classification. The Index, which is adjusted for capital gains distributions and income dividends, is unmanaged and should not be considered an investment. There are currently 30 funds represented in this Index. As of the date of this Prospectus, the Portfolio is in the Lipper International Large-Cap Core Funds classification.
2
Morgan Stanley Institutional Fund, Inc. Prospectus
Investment Summary
Emerging Markets Portfolio
Objective
The Emerging Markets Portfolio seeks long-term capital appreciation by investing primarily in growth-oriented equity securities of issuers in emerging market countries.
Approach
The Adviser, Morgan Stanley Investment Management Inc., and Sub-Advisers, Morgan Stanley Investment Management Company and Morgan Stanley Investment Management Limited (the "Sub-Advisers"), seek to maximize returns by investing primarily in growth-oriented equity securities in emerging markets. The Adviser's and Sub-Advisers' investment approach combines top-down country allocation with bottom-up stock selection. Investment selection criteria include attractive growth characteristics, reasonable valuations and company managements with strong shareholder value orientation.
Process
The Adviser's and Sub-Advisers' global strategists analyze the global economic environment, particularly its impact on emerging markets, and allocate the Portfolio's assets among emerging markets based on relative economic, political and social fundamentals, stock valuations and investor sentiment. The Adviser and/or Sub-Advisers invest in countries based on the work of country specialists who conduct extensive fundamental analysis of companies within these markets and seeks to identify companies with strong earnings growth prospects. To manage risk, the Adviser and/or Sub-Advisers emphasize macroeconomic and fundamental research. The Adviser and/or Sub-Advisers generally consider selling a portfolio holding when it determines that the holding no longer satisfies its investment criteria.
Under normal circumstances, at least 80% of the Portfolio's assets will be invested in equity securities of issuers located in emerging market countries. This policy may be changed without shareholder approval; however, you would be notified in writing of any changes. Derivative instruments used by the Portfolio will be counted toward the 80% policy discussed above to the extent they have economic characteristics similar to the securities included within that policy. The Portfolio may invest up to 10% of its net assets in foreign real estate companies.
The Adviser and/or Sub-Advisers consider an issuer to be located in an emerging market country if (i) its principal securities trading market is in an emerging market country, (ii) alone or on a consolidated basis it derives 50% or more of its annual revenue from goods produced, sales made or services performed in emerging market countries or (iii) it is organized under the laws of, or has a principal office in, an emerging market country.
Emerging market or developing countries are countries that major international financial institutions, such as the World Bank, generally consider to be less economically mature than developed nations, such as the United States or most nations in Western Europe. Emerging market or developing countries can include every nation in the world except the United States, Canada, Japan, Australia, New Zealand and most countries located in Western Europe.
Risks
The Portfolio's principal investment strategies are subject to the following principal risks:
Investing in the Portfolio may be appropriate for you if you are willing to accept the risks and uncertainties of investing in the equity securities of issuers in emerging markets. In general, prices of equity securities are more volatile than those of fixed income securities. The prices of equity securities will rise and fall in response to a number of different factors. In particular, prices of equity securities will respond to events that affect entire financial markets or industries (changes in inflation or consumer demand, for example) and to events that affect particular issuers (news about the success or failure of a new product, for example).
Investing in the securities of foreign issuers, particularly those located in emerging market or developing countries, entails the risk that news and events unique to a country or region will affect those markets and their issuers. The value of the Portfolio's shares may vary widely in response to political and economic factors affecting companies in foreign countries. These same events will not necessarily have an effect on the U.S. economy or similar issuers located in the United States. In addition, the Portfolio's investments in foreign issuers generally will be denominated in foreign currencies. As a result, changes in the value of a country's currency compared to the U.S. dollar may affect the value of the Portfolio's investments. These changes may occur separately from and in response to events that do not otherwise affect the value of the security in the issuer's home country.
The Adviser and/or Sub-Advisers may invest in certain instruments, such as derivatives, and may use certain techniques such as hedging, to manage these risks. However, the Adviser and/or Sub-Advisers cannot guarantee that it will be practical to hedge these risks in certain markets or under particular conditions or that it will succeed in doing so. The Adviser and/or Sub-Advisers, may use derivatives for other purposes such as gaining exposure to foreign markets.
3
Emerging Markets Portfolio (Cont'd)
Foreign real estate companies are similar to entities organized and operated as REITs in the United States. Investing in foreign real estate companies makes the Fund susceptible to the risks associated with the ownership of real estate and with the real estate industry in general, as well as risks that relate specifically to the way foreign real estate companies are organized and operated. Foreign real estate companies may be subject to laws, rules and regulations governing those entities and their failure to comply with those laws, rules and regulations could negatively impact the performance of those entities. In addition, foreign real estate companies, like U.S. REITs and mutual funds, have expenses, including management and administration fees, that are paid by their shareholders. As a result, shareholders will absorb their proportional share of duplicate levels of fees when the Portfolio invests in foreign real estate companies.
Please see "Additional Risk Factors and Information" for further information about these and other risks of investing in the Portfolio.
Annual Total Returns (Class I)
Commenced operations on September 25, 1992
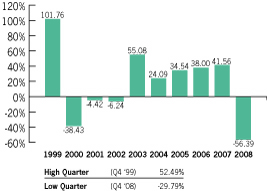
Average Annual Total Returns
(for the calendar periods ended December 31, 2008)
| Past One Year | Past Five Years | Past Ten Years | |||||||||||||
| Class I (commenced operations on September 25, 1992) | |||||||||||||||
| Return before Taxes | -56.39 | % | 7.30 | % | 9.40 | % | |||||||||
| Return after Taxes on Distributions | -56.97 | % | 5.78 | % | 8.57 | % | |||||||||
| Return after Taxes on Distributions and Sale of Portfolio Shares | -35.65 | % | 7.30 | % | 8.91 | % | |||||||||
| MSCI Emerging Markets Net Index (reflects no deduction for fees, expenses or taxes)1 | -53.33 | % | 7.66 | % | 9.05 | % | |||||||||
| Lipper Emerging Markets Funds Index (reflects no deduction for taxes)2 | -54.76 | % | 6.30 | % | 8.64 | % | |||||||||
| Class P (commenced operations on January 2, 1996) | |||||||||||||||
| Return before Taxes | -56.50 | % | 7.03 | % | 9.12 | % | |||||||||
| MSCI Emerging Markets Net Index (reflects no deduction for fees, expenses or taxes)1 | -53.33 | % | 7.66 | % | 9.05 | % | |||||||||
| Lipper Emerging Markets Funds Index (reflects no deduction for taxes)2 | -54.76 | % | 6.30 | % | 8.64 | % | |||||||||
The Portfolio's past performance, before and after taxes, is not necessarily an indication of how the Portfolio will perform in the future.
The bar chart and table show the performance of the Portfolio year-by-year and as an average over different periods of time. The bar chart shows returns for Class I shares only. The Portfolio's Class P shares would have had similar annual returns, but returns would have been generally lower as expenses of this class are higher. Together, the bar chart and table demonstrate the variability of performance over time and provide an indication of the risks of investing in the Portfolio. The table also compares the performance of the Portfolio to indices of similar securities. An index is a hypothetical measure of performance based on the ups and downs of securities that make up a particular market. The indices do not show actual investment returns or reflect payment of management or brokerage fees or taxes, which would lower the indices' performance. The indices are unmanaged and should not be considered an investment. It is not possible to invest directly in an index.
After-tax returns are calculated using the historical highest individual federal marginal income tax rates during the period shown, and do not reflect the impact of state and local taxes. Actual after-tax returns depend on the investor's tax situation and may differ from those shown, and after-tax returns are not relevant to investors who hold their Portfolio shares through tax deferred arrangements such as 401(k) plans or individual retirement accounts. After-tax returns may be higher than before-tax returns due to an assumed benefit from capital losses that would have been realized had Portfolio shares been sold at the end of the relevant periods.
1 The Morgan Stanley Capital International (MSCI) Emerging Markets Net Index is a free float-adjusted market capitalization weighted index that is designed to measure equity market performance of emerging markets. The term "free float" represents the portion of shares outstanding that are deemed to be available for purchase in the public equity markets by investors. The MSCI Emerging Markets Net Index currently consists of 23 emerging market country indices. The performance of the Index is listed in U.S. dollars and assumes reinvestment of net dividends.
2 The Lipper Emerging Markets Funds Index is an equally weighted performance index of the largest qualifying funds (based on net assets) in the Lipper Emerging Markets Funds classification. The Index, which is adjusted for capital gains distributions and income dividends, is unmanaged and should not be considered an investment. There are currently 30 funds represented in this Index. As of the date of this Prospectus, the Portfolio is in the Lipper Emerging Markets Funds classification.
4
Morgan Stanley Institutional Fund, Inc. Prospectus
Investment Summary
Global Franchise Portfolio
Objective
The Global Franchise Portfolio seeks long-term capital appreciation.
Approach
The Portfolio's Sub-Advisers, Morgan Stanley Investment Management Limited and Morgan Stanley Investment Management Company, seek long-term capital appreciation by investing primarily in equity securities of issuers located throughout the world that they believe have, among other things, resilient business franchises and growth potential. The Sub-Advisers emphasize individual stock selection and seek to identify undervalued securities of issuers located throughout the world, including both developed and emerging market countries. Under normal market conditions, the Portfolio invests in securities of issuers from at least three different countries, which may include the United States.
Process
The Sub-Advisers seek to invest in companies that they believe have resilient business franchises, strong cash flows, modest capital requirements, capable managements and growth potential. Securities are selected on a global basis with a strong bias towards value. The franchise focus of the Portfolio is based on the Sub-Advisers' belief that the intangible assets underlying a strong business franchise (such as patents, copyrights, brand names, licenses or distribution methods) are difficult to create or to replicate and that carefully selected franchise companies can yield above-average potential for long-term capital appreciation.
The Sub-Advisers rely on their research capabilities, analytical resources and judgment to identify and monitor franchise businesses meeting their investment criteria. The Sub-Advisers believe that the number of issuers with strong business franchises meeting its criteria may be limited, and accordingly, the Portfolio may concentrate its holdings in a relatively small number of companies and may invest up to 25% of its assets in a single issuer. The Sub-Advisers generally consider selling a portfolio holding when they determine that the holding no longer satisfies their investment criteria or that replacing the holding with another investment should improve the Portfolio's valuation and/or quality.
Derivative instruments used by the Portfolio will be counted toward the Portfolio's exposure in the types of securities listed above to the extent they have economic characteristics similar to such securities.
Risks
The Portfolio's principal investment strategies are subject to the following principal risks:
Investing in the Portfolio may be appropriate for you if you are willing to accept the risks and uncertainties of investing in a portfolio of equity securities of issuers throughout the world, including emerging market or developing countries. In general, prices of equity securities are more volatile than those of fixed income securities. The prices of equity securities will rise and fall in response to a number of different factors. In particular, prices of equity securities will respond to events that affect entire financial markets or industries (changes in inflation or consumer demand, for example) and to events that affect particular issuers (news about the success or failure of a new product, for example).
Investing in the securities of foreign issuers, particularly those located in emerging market or developing countries, entails the risk that news and events unique to a country or region will affect those markets and their issuers. The value of the Portfolio's shares may vary widely in response to political and economic factors affecting companies in foreign countries. These same events will not necessarily have an effect on the U.S. economy or similar issuers located in the United States. In addition, the Portfolio's investments in foreign issuers generally will be denominated in foreign currencies. As a result, changes in the value of a country's currency compared to the U.S. dollar may affect the value of the Portfolio's investments. These changes may occur separately from and in response to events that do not otherwise affect the value of the security in the issuer's home country.
The Sub-Advisers may invest in certain instruments, such as derivatives, and may use certain techniques, such as hedging, to manage these risks. However, the Sub-Advisers cannot guarantee that it will be practical
5
Global Franchise Portfolio (Cont'd)
to hedge these risks in certain markets or under particular conditions or that they will succeed in doing so.
The Portfolio may also invest in the equity securities of any size company. While the Sub-Advisers believe that smaller companies may provide greater growth potential than larger, more established firms, investing in the securities of smaller companies also involves greater risk and price volatility.
The risks of investing in the Portfolio may be intensified because the Portfolio is non-diversified, which means that it may invest in securities of a limited number of issuers. As a result, the performance of a particular investment or a small group of investments may affect the Portfolio's performance more than if the Portfolio were diversified.
Please see "Additional Risk Factors and Information" for further information about these and other risks of investing in the Portfolio.
Annual Total Returns (Class I)
Commenced operations on November 28, 2001
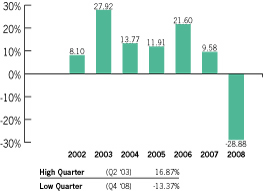
Average Annual Total Returns
(for the calendar periods ended December 31, 2008)
| Past One Year | Past Five Years | Since Inception | |||||||||||||
| Class I (commenced operations on November 28, 2001) | |||||||||||||||
| Return before Taxes | -28.88 | % | 3.83 | % | 8.20 | % | |||||||||
| Return after Taxes on Distributions | -29.91 | % | 2.46 | % | 7.17 | % | |||||||||
| Return after Taxes on Distributions and Sale of Portfolio Shares | -17.59 | % | 3.54 | % | 7.38 | % | |||||||||
| MSCI World Index (reflects no deduction for fees, expenses or taxes)1 | -40.71 | % | -0.51 | % | 0.79 | % | |||||||||
| Lipper Global Multi-Cap Core Funds Index (reflects no deduction for taxes)2 | -36.70 | % | 0.88 | % | 2.02 | % | |||||||||
| Class P (commenced operations on November 28, 2001) | |||||||||||||||
| Return before Taxes | -29.00 | % | 3.57 | % | 7.91 | % | |||||||||
| MSCI World Index (reflects no deduction for fees, expenses or taxes)1 | -40.71 | % | -0.51 | % | 0.79 | % | |||||||||
| Lipper Global Multi-Cap Core Funds Index (reflects no deduction for taxes)2 | -36.70 | % | 0.88 | % | 2.02 | % | |||||||||
The Portfolio's past performance, before and after taxes, is not necessarily an indication of how the Portfolio will perform in the future.
The bar chart and table show the performance of the Portfolio year-by-year and as an average over different periods of time. The bar chart shows returns for Class I shares only. The Portfolio's Class P shares would have had similar annual returns, but returns would have been generally lower as expenses of this class are higher. Together, the bar chart and table demonstrate the variability of performance over time and provide an indication of the risks of investing in the Portfolio. The table also compares the performance of the Portfolio to indices of similar securities. An index is a hypothetical measure of performance based on the ups and downs of securities that make up a particular market. The indices do not show actual investment returns or reflect payment of management or brokerage fees or taxes, which would lower the indices' performance. The indices are unmanaged and should not be considered an investment. It is not possible to invest directly in an index.
After-tax returns are calculated using the historical highest individual federal marginal income tax rates during the period shown, and do not reflect the impact of state and local taxes. Actual after-tax returns depend on the investor's tax situation and may differ from those shown, and after-tax returns are not relevant to investors who hold their Portfolio shares through tax deferred arrangements such as 401(k) plans or individual retirement accounts. After-tax returns may be higher than before-tax returns due to an assumed benefit from capital losses that would have been realized had Portfolio shares been sold at the end of the relevant periods.
1 The Morgan Stanley Capital International (MSCI) World Index is a free float-adjusted market capitalization weighted index that is designed to measure global equity market performance of developed markets. The term "free float" represents the portion of shares outstanding that are deemed to be available for purchase in the public equity markets by investors. The MSCI World Index currently consists of 23 developed market country indices. The performance of the Index is listed in U.S. dollars and assumes reinvestment of net dividends.
2 The Lipper Global Multi-Cap Core Funds Index is an equally weighted performance index of the largest qualifying funds (based on net assets) in the Lipper Global Multi-Cap Core Funds classification. The Index, which is adjusted for capital gains distributions and income dividends, is unmanaged and should not be considered an investment. There are currently 30 funds represented in this Index. As of the date of this Prospectus, the Portfolio is in the Lipper Global Multi-Cap Core Funds classification.
6
Morgan Stanley Institutional Fund, Inc. Prospectus
Investment Summary
Global Value Equity Portfolio
The Board of Directors of the Fund has approved a proposed reorganization of the Global Value Equity Portfolio into the Global Franchise Portfolio. The proposed reorganization will be presented to stockholders of the Global Value Equity Portfolio for approval at a special meeting of stockholders. If the proposed reorganization is approved, the Global Value Equity Portfolio stockholders will receive shares of common stock of the Global Franchise Portfolio in exchange for their shares of the Global Value Equity Portfolio. Stockholders will receive the same class of shares of the Global Franchise Portfolio equal in value to their class of shares of the Global Value Equity Portfolio. Upon completion of the reorganization, the Global Value Equity Portfolio will dissolve pursuant to a plan of dissolution adopted by the Board.
Objective
The Global Value Equity Portfolio seeks long-term capital appreciation by investing primarily in equity securities of issuers throughout the world, including U.S. issuers.
Approach
The Portfolio's Sub-Advisers, Morgan Stanley Investment Management Limited and Morgan Stanley Investment Management Company, seek to maintain a diversified portfolio of global equity securities based on individual stock selection and emphasizes a bottom-up approach to investing that seeks to identify securities of issuers which they believe are undervalued.
Process
The Sub-Advisers seek to invest in companies that they believe have resilient business franchises, strong cash flows, modest capital requirements, capable managements and growth potential. Securities are selected on a global basis with a strong bias towards value. The franchise focus of the Portfolio is based on the Sub-Advisers' belief that the intangible assets underlying a strong business franchise (such as patents, copyrights, brand names, licenses or distribution methods) are difficult to create or to replicate and that carefully selected franchise companies can yield above-average potential for long-term capital appreciation.
The Sub-Advisers rely on their research capabilities, analytical resources and judgment to identify and monitor franchise businesses meeting its investment criteria. The Sub-Advisers believe that the number of issuers with strong business franchises meeting its criteria may be limited, and accordingly, the Portfolio may concentrate its holdings in a relatively small number of companies and may invest up to 25% of its assets in a single issuer. The Sub-Advisers generally consider selling a portfolio holding when they determine that the holding no longer satisfies their investment criteria or that replacing the holding with another investment should improve the Portfolio's valuation and/or quality.
Under normal circumstances, at least 80% of the Portfolio's assets will be invested in equity securities. This policy may be changed without shareholder approval; however, you would be notified in writing of any changes. Derivative instruments used by the Portfolio will be counted toward the 80% policy discussed above to the extent they have economic characteristics similar to the securities included within that policy.
Risks
The Portfolio's principal investment strategies are subject to the following principal risks:
Investing in the Portfolio may be appropriate for you if you are willing to accept the risks and uncertainties of investing in a portfolio of equity securities of issuers throughout the world. In general, prices of equity securities are more volatile than those of fixed income securities. The prices of equity securities will rise and fall in response to a number of different factors. In particular, prices of equity securities will respond to events that affect entire financial markets or industries (changes in inflation or consumer demand, for example) and to events that affect particular issuers (news about the success or failure of a new product, for example).
Investing in the securities of foreign issuers, particularly those located in emerging market or developing countries, entails the risk that news and events unique to a
7
Global Value Equity Portfolio (Cont'd)
country or region will affect those markets and their issuers. The value of the Portfolio's shares may vary widely in response to political and economic factors affecting companies in foreign countries. These same events will not necessarily have an effect on the U.S. economy or similar issuers located in the United States. In addition, the Portfolio's investments in foreign issuers generally will be denominated in foreign currencies. As a result, changes in the value of a country's currency compared to the U.S. dollar may affect the value of the Portfolio's investments. These changes may occur separately from and in response to events that do not otherwise affect the value of the security in the issuer's home country.
The Sub-Advisers may invest in certain instruments, such as derivatives, and may use certain techniques, such as hedging, to manage these risks. However, the Sub-Advisers cannot guarantee that it will be practical to hedge these risks in certain markets or under particular conditions or that they will succeed in doing so.
The Portfolio may also invest in the equity securities of any size company. While the Sub-Advisers believe that smaller companies may provide greater growth potential than larger, more established firms, investing in the securities of smaller companies also involves greater risk and price volatility.
The Portfolio's portfolio management team believes that the number of issuers with strong business franchises meeting its criteria may be limited, and accordingly, the Portfolio may consist of less holdings than a fund without such a specifically defined investment program. The Portfolio generally emphasizes a strategy that focuses on larger investments in a few select companies rather than smaller investments in a larger number of issuers. To the extent the Portfolio focuses its investments in this way, it may be subject to more risk than a less focused fund because changes affecting a single issuer may cause greater fluctuations in the value of the Portfolio's shares.
Please see "Additional Risk Factors and Information" for further information about these and other risks of investing in the Portfolio.
Annual Total Returns (Class I)
Commenced operations on July 15, 1992

Average Annual Total Returns
(for the calendar periods ended December 31, 2008)
| Past One Year | Past Five Years | Past Ten Years | |||||||||||||
| Class I (commenced operations on July 15, 1992) | |||||||||||||||
| Return before Taxes | -41.82 | % | -1.88 | % | 0.34 | % | |||||||||
| Return after Taxes on Distributions | -42.70 | % | -3.11 | % | -1.22 | % | |||||||||
| Return after Taxes on Distributions and Sale of Portfolio Shares | -26.33 | % | -1.16 | % | 0.16 | % | |||||||||
| MSCI World Index (reflects no deduction for fees, expenses or taxes)1 | -40.71 | % | -0.51 | % | -0.64 | % | |||||||||
| Lipper Global Large-Cap Value Funds Median (reflects no deduction for taxes)2 | -43.19 | % | -2.46 | % | 0.30 | % | |||||||||
| Class P (commenced operations on January 2, 1996) | |||||||||||||||
| Return before Taxes | -41.98 | % | -2.14 | % | 0.08 | % | |||||||||
| MSCI World Index (reflects no deduction for fees, expenses or taxes)1 | -40.71 | % | -0.51 | % | -0.64 | % | |||||||||
| Lipper Global Large-Cap Value Funds Median (reflects no deduction for taxes)2 | -43.19 | % | -2.46 | % | 0.30 | % | |||||||||
The Portfolio's past performance, before and after taxes, is not necessarily an indication of how the Portfolio will perform in the future.
The bar chart and table show the performance of the Portfolio year-by-year and as an average over different periods of time. The bar chart shows returns for Class I shares only. The Portfolio's Class P shares would have had similar annual returns, but returns would have been generally lower as expenses of this class are higher. Together, the bar chart and table demonstrate the variability of performance over time and provide an indication of the risks of investing in the Portfolio. The table also compares the performance of the Portfolio to indices of similar securities. An index is a hypothetical measure of performance based on the ups and downs of securities that make up a particular market. The indices do not show actual investment returns or reflect payment of management or brokerage fees or taxes, which would lower the indices' performance. The indices are unmanaged and should not be considered an investment. It is not possible to invest directly in an index.
After-tax returns are calculated using the historical highest individual federal marginal income tax rates during the period shown, and do not reflect the impact of state and local taxes. Actual after-tax returns depend on the investor's tax situation and may differ from those shown, and after-tax returns are not relevant to investors who hold their Portfolio shares through tax deferred arrangements such as 401(k) plans or individual retirement accounts. After-tax returns may be higher than before-tax returns due to an assumed benefit from capital losses that would have been realized had Portfolio shares been sold at the end of the relevant periods.
1 The Morgan Stanley Capital International (MSCI) World Index is a free float-adjusted market capitalization weighted index that is designed to measure global equity market performance of developed markets. The term "free float" represents the portion of shares outstanding that are deemed to be available for purchase in the public equity markets by investors. The MSCI World Index currently consists of 23 developed market country indices. The performance of the Index is listed in U.S. dollars and assumes reinvestment of net dividends.
2 The Lipper Global Large-Cap Value Funds Median tracks the performance of all funds in the Lipper Global Large-Cap Value Funds classification. The Median, which is adjusted for capital gains distribution and income dividends, is unmanaged and should not be considered an investment. As of the date of this Prospectus, the Portfolio is in the Lipper Global Large-Cap Value Funds classification.
8
Morgan Stanley Institutional Fund, Inc. Prospectus
Investment Summary
International Equity Portfolio
Objective
The International Equity Portfolio seeks long-term capital appreciation by investing primarily in equity securities of non-U.S. issuers.
Approach
The Portfolio's Sub-Advisers, Morgan Stanley Investment Management Limited and Morgan Stanley Investment Management Company (the "Sub-Advisers"), seek to maintain a diversified portfolio of equity securities of non-U.S. issuers based on individual stock selection. The Sub-Advisers emphasize a bottom-up approach to investing that seeks to identify securities of issuers they believe are undervalued. The Sub-Advisers focus on developed markets, but they may invest in emerging markets.
Process
The Sub-Advisers select issuers from a universe comprised of approximately 1,200 companies in non-U.S. markets. The investment process is value driven and based on individual stock selection. In assessing investment opportunities, the Sub-Advisers consider value criteria with an emphasis on cash flow and the intrinsic value of company assets. Securities which appear undervalued according to these criteria are then subjected to in-depth fundamental analysis. The Sub-Advisers conduct a thorough investigation of the issuer's balance sheet, cash flow and income statement and assesses the company's business franchise, including product competitiveness, market positioning and industry structure. Meetings with senior company management are integral to the investment process. The Sub-Advisers generally consider selling a portfolio holding when they determine that the holding has reached its fair value target.
Under normal circumstances, at least 80% of the Portfolio's assets will be invested in equity securities. This policy may be changed without shareholder approval; however, you would be notified in writing of any changes. Derivative instruments used by the Portfolio will be counted toward the 80% policy discussed above to the extent they have economic characteristics similar to the securities included within that policy.
Risks
The Portfolio's principal investment strategies are subject to the following principal risks:
Investing in the Portfolio may be appropriate for you if you are willing to accept the risks and uncertainties of investing in equity securities of non-U.S. issuers. In general, prices of equity securities are more volatile than those of fixed income securities. The prices of equity securities will rise and fall in response to a number of different factors. In particular, prices of equity securities will respond to events that affect entire financial markets or industries (changes in inflation or consumer demand, for example) and to events that affect particular issuers (news about the success or failure of a new product, for example). In addition, at times the Portfolio's market sector, equity securities of foreign issuers, may underperform relative to other sectors or the overall market. Investing in the securities of foreign issuers, particularly those located in emerging market or developing countries, entails the risk that news and events unique to a country or region will affect those markets and their issuers. The value of the Portfolio's shares may vary widely in response to political and economic factors affecting companies in foreign countries. These same events will not necessarily have an effect on the U.S. economy or similar issuers located in the United States. In addition, the Portfolio's investments in foreign issuers generally will be denominated in foreign currencies. As a result, changes in the value of a country's currency compared to the U.S. dollar may affect the value of the Portfolio's investments. These changes may occur separately from and in response to events that do not otherwise affect the value of the security in the issuer's home country.
The Sub-Advisers may invest in certain instruments, such as derivatives, and may use certain techniques, such as hedging, to manage these risks. However, the Sub-Advisers cannot guarantee that it will be practical to hedge these risks in certain markets or under particular conditions or that they will succeed in doing so.
Please see "Additional Risk Factors and Information" for further information about these and other risks of investing in the Portfolio.
9
International Equity Portfolio (Cont'd)
Annual Total Returns (Class I)
Commenced operations on August 4, 1989

Average Annual Total Returns
(for the calendar periods ended December 31, 2008)
| Past One Year | Past Five Years | Past Ten Years | |||||||||||||
| Class I (commenced operations on August 4, 1989) | |||||||||||||||
| Return before Taxes | -33.12 | % | 2.82 | % | 5.38 | % | |||||||||
| Return after Taxes on Distributions | -34.38 | % | 0.72 | % | 3.49 | % | |||||||||
| Return after Taxes on Distributions and Sale of Portfolio Shares | -19.84 | % | 2.67 | % | 4.41 | % | |||||||||
| MSCI EAFE Index (reflects no deduction for fees, expenses or taxes)1 | -43.38 | % | 1.66 | % | 0.80 | % | |||||||||
| Lipper International Large-Cap Value Funds Average (reflects no deduction for taxes)2 | -43.78 | % | 1.69 | % | 3.31 | % | |||||||||
| Class P (commenced operations on January 2, 1996) | |||||||||||||||
| Return before Taxes | -33.21 | % | 2.58 | % | 5.14 | % | |||||||||
| MSCI EAFE Index (reflects no deduction for fees, expenses or taxes)1 | -43.38 | % | 1.66 | % | 0.80 | % | |||||||||
| Lipper International Large-Cap Value Funds Average (reflects no deduction for taxes)2 | -43.78 | % | 1.69 | % | 3.31 | % | |||||||||
The Portfolio's past performance, before and after taxes, is not necessarily an indication of how the Portfolio will perform in the future.
The bar chart and table show the performance of the Portfolio year-by-year and as an average over different periods of time. The bar chart shows returns for Class I shares only. The Portfolio's Class P shares would have had similar annual returns, but returns would have been generally lower as expenses of this class are higher. Together, the bar chart and table demonstrate the variability of performance over time and provide an indication of the risks of investing in the Portfolio. The table also compares the performance of the Portfolio to indices of similar securities. An index is a hypothetical measure of performance based on the ups and downs of securities that make up a particular market. The indices do not show actual investment returns or reflect payment of management or brokerage fees or taxes, which would lower the indices' performance. The indices are unmanaged and should not be considered an investment. It is not possible to invest directly in an index.
After-tax returns are calculated using the historical highest individual federal marginal income tax rates during the period shown, and do not reflect the impact of state and local taxes. Actual after-tax returns depend on the investor's tax situation and may differ from those shown, and after-tax returns are not relevant to investors who hold their Portfolio shares through tax deferred arrangements such as 401(k) plans or individual retirement accounts. After-tax returns may be higher than before-tax returns due to an assumed benefit from capital losses that would have been realized had Portfolio shares been sold at the end of the relevant periods.
1 The Morgan Stanley Capital International (MSCI) EAFE Index (Europe, Australasia, Far East) is a free float-adjusted market capitalization index that is designed to measure the international equity market performance, excluding the United States and Canada. The term "free float" represents the portion of shares outstanding that are deemed to be available for purchase in the public equity markets by investors. The MSCI EAFE Index currently consists of 21 developed market country indices. The performance of the Index is listed in U.S. dollars and assumes reinvestment of net dividends.
2 The Lipper International Large-Cap Value Funds Average tracks the performance of all funds in the Lipper International Large-Cap Value Funds classification. The Average, which is adjusted for capital gains distributions and income dividends, is unmanaged and should not be considered an investment. As of the date of this Prospectus, the Portfolio is in the Lipper International Large-Cap Value Funds classification.
10
Morgan Stanley Institutional Fund, Inc. Prospectus
Investment Summary
International Growth Equity Portfolio
Objective
The International Growth Equity Portfolio seeks long-term capital appreciation, with a secondary objective of income.
The Portfolio's investment objective may be changed by the Fund's Board of Directors without shareholder approval, but no change is anticipated. If the Portfolio's investment objective changes, the Portfolio will notify shareholders and shareholders should consider whether the Portfolio remains an appropriate investment in light of the change.
Approach
The Adviser, Morgan Stanley Investment Management Inc., seeks to achieve the Portfolio's investment objective by investing primarily in a diversified portfolio of equity securities of issuers located in countries other than the United States.
Process
The Adviser generally seeks to identify securities of issuers that it believes share the following characteristics: (1) industry leaders in their country, their region or the world, (2) strong balance sheets, (3) market capitalization typically greater than $1 billion, (4) attractive price-to-earnings ratios compared with earnings growth potential (PEG ratio) and (5) attractive earnings momentum as measured by earnings estimates revisions. The Adviser generally considers selling a portfolio security when a security no longer fits the Portfolio's investment criteria or has had a substantial decline within the Adviser's quantitative rankings, or when a more attractive opportunity elsewhere in the market has been identified.
While a substantial portion of the Portfolio's assets generally are invested in the developed countries of Europe and the Far East, the Portfolio may invest up to 15% of its assets in securities of issuers in emerging market or developing countries. The Portfolio may invest up to 20% of its assets in debt securities issued or guaranteed by non-U.S. governments, but will invest only in securities issued or guaranteed by the governments of countries which are members of the Organization for Economic Co-operation and Development (OECD). The Portfolio may purchase and sell certain derivative instruments, such as options, futures contracts, options on futures contracts, structured investments and currency-related transactions involving options, futures contracts, forward contracts, swaps and contracts for difference ("CFDs") for various portfolio management purposes, including to facilitate portfolio management and to mitigate risks.
Under normal market conditions, the Portfolio invests at least 80% of its assets in equity securities of issuers from at least three different foreign countries. The Portfolio considers an issuer to be from a particular country if (i) its principal securities trading market is in that country; (ii) alone or on a consolidated basis it derives 50% or more of its annual revenue from either goods produced, sales made or services performed in that country; or (iii) it is organized under the laws of, or has a principal office in that country. By applying these tests, it is possible that a particular issuer could be deemed to be from more than one country. This policy may be changed without shareholder approval; however, you will be notified in writing of any changes. Derivative instruments used by the Portfolio will be counted toward the 80% policy discussed above to the extent they have economic characteristics similar to the securities included within that policy.
Risks
The Portfolio's principal investment strategies are subject to the following principal risks:
Investing in the Portfolio may be appropriate for you if you are willing to accept the risks and uncertainties of investing in a portfolio of equity securities of issuers located in countries other than the United States, including emerging market or developing countries. In general, prices of equity securities are more volatile than those of fixed income securities. The prices of equity securities will rise and fall in response to a number of different factors. In particular, prices of equity securities will respond to events that affect entire financial markets or industries (changes in inflation or consumer demand, for example) and to events that affect particular issuers (news about the success or failure of a new product, for example).
Investing in the securities of foreign issuers, particularly those located in emerging market or developing countries, entails the risk that news and events unique to a country or region will affect those markets and their issuers. The value of the Portfolio's shares may vary widely in response to political and economic factors affecting companies in foreign countries. These same events will not necessarily have an effect on the U.S. economy or similar issuers located in the United States. In addition, the Portfolio's investments in foreign issuers generally will be denominated in foreign currencies. As a result, changes in the value of a country's currency compared to the U.S. dollar may affect the value of the Portfolio's investments. These changes may occur separately from and in response to events that do not otherwise affect the value of the security in the issuer's home country.
11
International Growth Equity Portfolio (Cont'd)
The Adviser may invest in certain instruments, such as derivatives, and may use certain techniques, such as hedging, to manage these risks. However, the Adviser cannot guarantee that it will be practical to hedge these risks in certain markets or under particular conditions or that it will succeed in doing so.
The Portfolio may invest in the equity securities of any size company. Investing in the securities of smaller companies involves greater risk and price volatility than investing in larger, more established firms.
Please see "Additional Risk Factors and Information" for further information about these and other risks of investing in the Portfolio.
Annual Total Returns (Class I)
Commenced operations on December 27, 2005
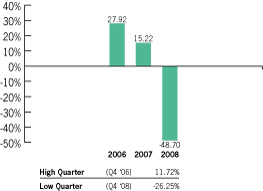
Average Annual Total Returns
(for the calendar periods ended December 31, 2008)
| Past One Year | Since Inception | ||||||||||
| Class I (commenced operations on December 27, 2005) | |||||||||||
| Return before Taxes | -48.70 | % | -9.08 | % | |||||||
| Return after Taxes on Distributions | -49.12 | % | -9.56 | % | |||||||
| Return after Taxes on Distributions and Sale of Portfolio Shares | -31.16 | % | -7.38 | % | |||||||
| MSCI EAFE Index (reflects no deduction for fees, expenses or taxes)1 | -43.38 | % | -7.45 | % | |||||||
| Lipper International Large-Cap Growth Funds Index (reflects no deduction for taxes)2 | -42.68 | % | -6.47 | % | |||||||
| Class P (commenced operations on December 27, 2005) | |||||||||||
| Return before Taxes | -48.82 | % | -9.30 | % | |||||||
| MSCI EAFE Index (reflects no deduction for fees, expenses or taxes)1 | -43.38 | % | -7.45 | % | |||||||
| Lipper International Large-Cap Growth Funds Index (reflects no deduction for taxes)2 | -42.68 | % | -6.47 | % | |||||||
The Portfolio's past performance, before and after taxes, is not necessarily an indication of how the Portfolio will perform in the future.
The bar chart and table show the performance of the Portfolio year-by-year and as an average over different periods of time. The bar chart shows returns for Class I shares only. The Portfolio's Class P shares would have had similar annual returns, but returns would have been generally lower as expenses of this class are higher. Together, the bar chart and table demonstrate the variability of performance over time and provide an indication of the risks of investing in the Portfolio. The table also compares the performance of the Portfolio to indices of similar securities. An index is a hypothetical measure of performance based on the ups and downs of securities that make up a particular market. The indices do not show actual investment returns or reflect payment of management or brokerage fees or taxes, which would lower the indices' performance. The indices are unmanaged and should not be considered an investment. It is not possible to invest directly in an index.
After-tax returns are calculated using the historical highest individual federal marginal income tax rates during the period shown, and do not reflect the impact of state and local taxes. Actual after-tax returns depend on the investor's tax situation and may differ from those shown, and after-tax returns are not relevant to investors who hold their Portfolio shares through tax deferred arrangements such as 401(k) plans or individual retirement accounts. After-tax returns may be higher than before-tax returns due to an assumed benefit from capital losses that would have been realized had Portfolio shares been sold at the end of the relevant periods.
1 The Morgan Stanley Capital International (MSCI) EAFE Index (Europe, Australasia, Far East) is a free float-adjusted market capitalization index that is designed to measure the international equity market performance, excluding the United States and Canada. The term "free float" represents the portion of shares outstanding that are deemed to be available for purchase in the public equity markets by investors. The MSCI EAFE Index currently consists of 21 developed market country indices. The performance of the Index is listed in U.S. dollars and assumes reinvestment of net dividends.
2 The Lipper International Large-Cap Growth Funds Index is an equally weighted performance index of the largest qualifying funds (based on net assets) in the Lipper International Large-Cap Growth Funds classification. The Index, which is adjusted for capital gains distributions and income dividends, is unmanaged and should not be considered an investment. There are currently 10 funds represented in this Index. As of the date of this Prospectus, the Portfolio is in the Lipper International Large-Cap Growth Funds classification.
12
Morgan Stanley Institutional Fund, Inc. Prospectus
Investment Summary
International Small Cap Portfolio
Objective
The International Small Cap Portfolio seeks long-term capital appreciation by investing primarily in equity securities of small non-U.S. companies.
Approach
The Portfolio's Sub-Adviser, Morgan Stanley Investment Management Limited, seeks to maintain a diversified portfolio of equity securities of small non-U.S. issuers based on individual stock selection. The Sub-Adviser emphasizes a bottom-up approach to investing that seeks to identify securities of issuers it believes are undervalued.
Process
The Sub-Adviser selects issuers from a universe comprised of small cap companies (those with total market capitalizations of $5 billion or less) in non-U.S. markets, including emerging markets. The investment process is value driven and based on individual stock selection. In assessing investment opportunities, the Sub-Adviser considers value criteria with an emphasis on cash flow and the intrinsic value of company assets. Securities which appear undervalued according to these criteria are then subjected to in-depth fundamental analysis. The Sub-Adviser conducts a thorough investigation of the issuer's balance sheet, cash flow and income statement and assesses the company's business franchise, including product competitiveness, market positioning and industry structure. Meetings with senior company management are integral to the investment process. The Sub-Adviser generally considers selling a portfolio holding when it determines that the holding has reached its fair value target.
Under normal circumstances, at least 80% of the assets of the Portfolio will be invested in equity securities of non-U.S. small cap companies. This policy may be changed without shareholder approval; however, you would be notified in writing of any changes. Derivative instruments used by the Portfolio will be counted toward the 80% policy discussed above to the extent they have economic characteristics similar to the securities included within that policy.
A company is considered to be a small cap company if it has a total market capitalization at the time of purchase of $5 billion or less. The market capitalization limit is subject to adjustment annually based upon the Sub-Adviser's assessment as to the capitalization range of companies which possess the fundamental characteristics of small cap companies.
Risks
The Portfolio's principal investment strategies are subject to the following principal risks:
Investing in the Portfolio may be appropriate for you if you are willing to accept the risks and uncertainties of investing in the equity securities of small non-U.S. issuers. In general, prices of equity securities are more volatile than those of fixed income securities. The prices of equity securities will rise and fall in response to a number of different factors. In particular, prices of equity securities will respond to events that affect entire financial markets or industries (changes in inflation or consumer demand, for example) and to events that affect particular issuers (news about the success or failure of a new product, for example). In addition, at times the Portfolio's market sector, equity securities of smaller foreign issuers, may underperform relative to other sectors or the overall market.
The risk of investing in equity securities is intensified in the case of the small cap companies in which the Portfolio invests. Market prices for such companies' equity securities tend to be more volatile than those of larger, more established companies. Small cap companies may themselves be more vulnerable to economic or company specific problems.
13
International Small Cap
Portfolio (Cont'd)
Investing in the securities of foreign issuers, particularly those located in emerging market or developing countries, entails the risk that news and events unique to a country or region will affect those markets and their issuers. The value of the Portfolio's shares may vary widely in response to political and economic factors affecting companies in foreign countries. These same events will not necessarily have an effect on the U.S. economy or similar issuers located in the United States. In addition, the Portfolio's investments in foreign issuers generally will be denominated in foreign currencies. As a result, changes in the value of a country's currency compared to the U.S. dollar may affect the value of the Portfolio's investments. These changes may occur separately from and in response to events that do not otherwise affect the value of the security in the issuer's home country.
The Sub-Adviser may invest in certain instruments, such as derivatives, and may use certain techniques, such as hedging, to manage these risks. However, the Sub-Adviser cannot guarantee that it will be practical to hedge these risks in certain markets or under particular conditions or that it will succeed in doing so.
Please see "Additional Risk Factors and Information" for further information about these and other risks of investing in the Portfolio.
Annual Total Returns (Class I)
Commenced operations on December 15, 1992

Average Annual Total Returns
(for the calendar periods ended December 31, 2008)
| Past One Year | Past Five Years | Past Ten Years | |||||||||||||
| Class I (commenced operations on December 15, 1992) | |||||||||||||||
| Return before Taxes | -38.33 | % | 1.51 | % | 7.03 | % | |||||||||
| Return after Taxes on Distributions | -39.01 | % | -0.81 | % | 5.01 | % | |||||||||
| Return after Taxes on Distributions and Sale of Portfolio Shares | -23.10 | % | 2.30 | % | 6.31 | % | |||||||||
| MSCI EAFE Small Cap Total Return Index (reflects no deduction for fees, expenses or taxes)1 | -47.01 | % | 1.14 | % | 3.72 | % | |||||||||
| Lipper International Small/Mid-Cap Core Funds Index (reflects no deduction for taxes)2 | -43.23 | % | 2.79 | % | 7.18 | % | |||||||||
| Class P3 (commenced operations on October 21, 2008) | |||||||||||||||
| Return before Taxes | N/A | N/A | N/A | ||||||||||||
| MSCI EAFE Small Cap Total Return Index (reflects no deduction for fees, expenses or taxes)1 | N/A | N/A | N/A | ||||||||||||
| Lipper International Small/Mid-Cap Core Funds Index (reflects no deduction for taxes)2 | N/A | N/A | N/A | ||||||||||||
Class A shares have been redesignated as Class I shares.
The Portfolio's past performance, before and after taxes, is not necessarily an indication of how the Portfolio will perform in the future.
The bar chart and table show the performance of the Portfolio year-by-year and as an average over different periods of time. The bar chart shows returns for Class I shares only. The Portfolio's Class P shares would have had similar annual returns, but returns would have been generally lower as expenses of this class are higher. Together, the bar chart and table demonstrate the variability of performance over time and provide an indication of the risks of investing in the Portfolio. The table also compares the performance of the Portfolio to indices of similar securities. An index is a hypothetical measure of performance based on the ups and downs of securities that make up a particular market. The indices do not show actual investment returns or reflect payment of management or brokerage fees or taxes, which would lower the indices' performance. The indices are unmanaged and should not be considered an investment. It is not possible to invest directly in an index.
After-tax returns are calculated using the historical highest individual federal marginal income tax rates during the period shown, and do not reflect the impact of state and local taxes. Actual after-tax returns depend on the investor's tax situation and may differ from those shown, and after-tax returns are not relevant to investors who hold their Portfolio shares through tax deferred arrangements such as 401(k) plans or individual retirement accounts. After-tax returns may be higher than before-tax returns due to an assumed benefit from capital losses that would have been realized had Portfolio shares been sold at the end of the relevant periods.
1 The Morgan Stanley Capital International (MSCI) EAFE Small Cap Total Return Index is an unmanaged, market value weighted average of the performance of over 900 securities of companies listed on the stock exchanges of countries in Europe, Australasia and the Far East, including price performance and income from dividend payments. The MSCI EAFE Small Cap Total Return Index commenced as of January 31, 2002. Returns, including periods prior to January 31, 2002, are calculated using the return data of the MSCI EAFE Small Cap Index through January 30, 2002 and the return data of the MSCI EAFE Small Cap Total Return Index since January 31, 2002.
2 The Lipper International Small/Mid-Cap Core Funds Index is an equally weighted performance index of the largest qualifying funds (based on net assets) in the Lipper International Small/Mid-Cap Core Funds classification. The Index, which is adjusted for capital gains distributions and income dividends, is unmanaged and should not be considered an investment. There are currently 10 funds represented in this Index. The Lipper International Small/Mid-Cap Core Funds Index commenced operations on March 31, 2002. Performance data prior to December 31, 2002 reflects that of the Lipper International Small/Mid-Cap Core Funds Average. As of the date of this Prospectus, the Portfolio is in the Lipper International Small/Mid-Cap Core Funds classification.
3 Class P had not completed a full calendar year of operations as of December 31, 2008 and therefore Class P does not have annualized return information to report. Return information for the Portfolio's Class P shares will be shown in the Average Annual Total Returns Table in future prospectuses offering the Portfolio's Class P shares after the Portfolio's Class P shares have return information to report. Class P shares would have had similar annual returns to the returns for Class I, but returns for Class P would generally have been lower as expenses of Class P are higher.
14
Morgan Stanley Institutional Fund, Inc. Prospectus
Fees and Expenses of the Portfolios
Fees and Expenses
of the Portfolios
The Securities and Exchange Commission (the "Commission") requires that the Fund disclose in this table the fees and expenses that you may pay if you buy and hold shares of the Portfolios. The Total Annual Portfolio Operating Expenses in the table do not reflect voluntary fee waivers and/or expense reimbursements from the Adviser, which are described in the footnotes.
| Active International Allocation Portfolio | Emerging Markets Portfolio | Global Franchise Portfolio | Global Value Equity Portfolio | International Equity Portfolio | International Growth Equity Portfolio | International Small Cap Portfolio | |||||||||||||||||||||||||
| Shareholder Fees (fees paid directly from your investment) | |||||||||||||||||||||||||||||||
| Redemption Fee (as a % of the amount redeemed)† | |||||||||||||||||||||||||||||||
| Class I | 2.00 | % | 2.00 | % | NONE | NONE | 2.00 | % | 2.00 | % | 2.00 | % | |||||||||||||||||||
| Class P | 2.00 | % | 2.00 | % | NONE | NONE | 2.00 | % | 2.00 | % | 2.00 | % | |||||||||||||||||||
| Annual Portfolio Operating Expenses (expenses that are deducted from Portfolio assets) | |||||||||||||||||||||||||||||||
| Advisory Fees* | |||||||||||||||||||||||||||||||
| Class I | 0.65 | % | 1.16 | % | 0.80 | % | 0.67 | % | 0.80 | % | 0.75 | % | 0.95 | % | |||||||||||||||||
| Class P | 0.65 | % | 1.16 | % | 0.80 | % | 0.67 | % | 0.80 | % | 0.75 | % | 0.95 | % | |||||||||||||||||
| Distribution and/or Service (12b-1) Fees | |||||||||||||||||||||||||||||||
| Class I | NONE | NONE | NONE | NONE | NONE | NONE | NONE | ||||||||||||||||||||||||
| Class P | 0.25 | % | 0.25 | % | 0.25 | % | 0.25 | % | 0.25 | % | 0.25 | % | 0.25 | % | |||||||||||||||||
| Other Expenses* | |||||||||||||||||||||||||||||||
| Class I | 0.17 | % | 0.27 | % | 0.21 | % | 0.35 | % | 0.15 | % | 0.36 | % | 0.20 | % | |||||||||||||||||
| Class P | 0.17 | % | 0.27 | % | 0.21 | % | 0.35 | % | 0.15 | % | 0.36 | % | 0.20 | %‡ | |||||||||||||||||
| Acquired Fund Fees & Expenses** | |||||||||||||||||||||||||||||||
| Class I | 0.01 | % | 0.02 | % | N/A | 0.02 | % | N/A | N/A | N/A | |||||||||||||||||||||
| Class P | 0.01 | % | 0.02 | % | N/A | 0.02 | % | N/A | N/A | N/A | |||||||||||||||||||||
| Total Annual Portfolio Operating Expenses*# | |||||||||||||||||||||||||||||||
| Class I | 0.83 | % | 1.45 | % | 1.01 | % | 1.04 | % | 0.95 | % | 1.11 | % | 1.15 | % | |||||||||||||||||
| Class P | 1.08 | % | 1.70 | % | 1.26 | % | 1.29 | % | 1.20 | % | 1.36 | % | 1.40 | % | |||||||||||||||||
(footnotes on following page)
15
Fees and Expenses
of the Portfolios (Cont'd)
† Payable to the Portfolio on shares redeemed within 30 days of purchase. The redemption fee is based on the redemption proceeds. See "Shareholder Information—How To Redeem Class I and Class P Shares" and "Shareholder Information—Frequent Purchases and Redemptions of Shares" for more information on redemption fees.
‡ Other expenses have been estimated for the International Small Cap Portfolio's Class P shares for the current fiscal year.
* This table does not show the effects of the Adviser's voluntary fee waivers and/or expense reimbursements. The Adviser has voluntarily agreed to reduce its advisory fee and/or reimburse the Portfolios so that total annual Portfolio operating expenses, excluding certain investment related expenses (such as foreign country tax expense and interest expense on borrowing), will not exceed 0.80% for Class I shares and 1.05% for Class P shares of Active International Allocation Portfolio, 1.65% for Class I shares and 1.90% for Class P shares of Emerging Markets Portfolio, 1.00% for Class I shares and 1.25% for Class P shares of the Global Franchise, Global Value Equity, International Equity and International Growth Equity Portfolios, and 1.15% for Class I shares and 1.40% for Class P shares of the International Small Cap Portfolio.
For the fiscal year ended December 31, 2008, after giving effect to the Adviser's voluntary fee waiver and/or expense reimbursement, the total annual portfolio operating expenses incurred by investors, including certain investment related expenses, were 0.79% for Class I and 1.04% for Class P shares of the Active International Allocation Portfolio and 1.00% for Class I and 1.25% for Class P shares of the International Growth Equity Portfolio. Excluding the investment related expenses described in the preceding paragraph, the total annual portfolio operating expenses for Class I and Class P shares of the Active International Allocation Portfolio and International Growth Equity Portfolio after fee waivers and/or expense reimbursements were the amounts shown in the first paragraph of this note.
After giving effect to advisory fee waivers and/or expense reimbursements, the total annual portfolio operating expenses, including certain investment related expenses, for Class P shares of the International Small Cap Portfolio are estimated to be 1.40%.
Fee waivers and/or expense reimbursements are voluntary and the Adviser reserves the right to terminate any waiver and/or reimbursement at any time and without notice.
** The Portfolio may invest a portion of its assets in other investment companies (the "Acquired Funds"). The Portfolio's shareholders indirectly bear a pro rata portion of the expenses of the Acquired Funds in which the Portfolio invests. "Acquired Fund Fees & Expenses" in the table is an estimate of those expenses. The estimate is based upon the average allocation of the Portfolio's investments in the Acquired Funds and upon the actual total operating expenses of the Acquired Funds (including any current waivers and expense limitations) for the fiscal year ended December 31, 2008. Actual Acquired Fund expenses incurred by the Portfolio may vary with changes in the allocation of Portfolio assets among the Acquired Funds and with other events that directly affect the expenses of the Acquired Funds. Since "Acquired Fund Fees & Expenses" are not directly borne by the Portfolio, they are not reflected in the Portfolio's financial statements, with the result that the information presented in the table will differ from that presented in the Financial Highlights.
# The total annual Portfolio operating expenses listed above are based on the average net assets of the Portfolio as of its fiscal year ended December 31, 2008. To the extent that the Portfolio's average net assets decrease over the Portfolio's next fiscal year, such expenses can be expected to increase, potentially significantly, because certain fixed costs will be spread over a smaller amount of assets.
16
Morgan Stanley Institutional Fund, Inc. Prospectus
Fees and Expenses of the Portfolios
Fees and Expenses
of the Portfolios (Cont'd)
The example assumes that you invest $10,000 in each Portfolio for the time periods indicated and then redeem all of your shares at the end of those periods. The example assumes that your investment has a 5% return each year and that each Portfolio's operating expenses remain the same. Although your actual costs may be higher or lower, based on these assumptions, your costs would be equal to the amounts reflected in the table to the right.
Example
| 1 Year | 3 Years | 5 Years | 10 Years | ||||||||||||||||
| Active International Allocation Portfolio | |||||||||||||||||||
| Class I | $ | 85 | $ | 265 | $ | 460 | $ | 1,025 | |||||||||||
| Class P | $ | 110 | $ | 343 | $ | 595 | $ | 1,317 | |||||||||||
| Emerging Markets Portfolio | |||||||||||||||||||
| Class I | $ | 148 | $ | 459 | $ | 792 | $ | 1,735 | |||||||||||
| Class P | $ | 173 | $ | 536 | $ | 923 | $ | 2,009 | |||||||||||
| Global Franchise Portfolio | |||||||||||||||||||
| Class I | $ | 103 | $ | 322 | $ | 558 | $ | 1,236 | |||||||||||
| Class P | $ | 128 | $ | 400 | $ | 692 | $ | 1,523 | |||||||||||
| Global Value Equity Portfolio | |||||||||||||||||||
| Class I | $ | 106 | $ | 331 | $ | 574 | $ | 1,271 | |||||||||||
| Class P | $ | 131 | $ | 409 | $ | 708 | $ | 1,556 | |||||||||||
| International Equity Portfolio | |||||||||||||||||||
| Class I | $ | 97 | $ | 303 | $ | 525 | $ | 1,166 | |||||||||||
| Class P | $ | 122 | $ | 381 | $ | 660 | $ | 1,455 | |||||||||||
| International Growth Equity Portfolio | |||||||||||||||||||
| Class I | $ | 113 | $ | 353 | $ | 612 | $ | 1,352 | |||||||||||
| Class P | $ | 138 | $ | 431 | $ | 745 | $ | 1,635 | |||||||||||
| International Small Cap Portfolio | |||||||||||||||||||
| Class I | $ | 117 | $ | 365 | $ | 633 | $ | 1,398 | |||||||||||
| Class P* | $ | 143 | $ | 443 | $ | 766 | $ | 1,680 | |||||||||||
* The figures shown reflect the estimated expenses of Class P shares of the International Small Cap Portfolio.
17
Additional Risk Factors
and Information
This section discusses additional risk factors and information relating to the Portfolios. The Portfolios' investment practices and limitations are described in more detail in the Statement of Additional Information ("SAI"), which is incorporated by reference and legally is a part of this Prospectus. For details on how to obtain a copy of the SAI and other reports and information, see the back cover of this Prospectus.
Equity Securities
Equity securities include common stock, preferred stock, convertible securities, depositary receipts, rights and warrants. The Portfolios may invest in equity securities that are publicly-traded on securities exchanges or over the counter or in equity securities that are not publicly traded. Securities that are not publicly traded may be more difficult to sell and their value may fluctuate more dramatically than other securities. The prices of convertible securities are affected by changes similar to those of equity and fixed income securities. The value of a convertible security tends to decline as interest rates rise and, because of the conversion feature, tends to vary with fluctuations in the market value of the underlying equity security.
Price Volatility
The value of your investment in a Portfolio is based on the market prices of the securities the Portfolio holds. These prices change daily due to economic and other events that affect markets generally, as well as those that affect particular regions, countries, industries, companies or governments. These price movements, sometimes called volatility, may be greater or less depending on the types of securities the Portfolio owns and the markets in which the securities trade. Over time, equity securities have generally shown gains superior to fixed income securities, although they have tended to be more volatile in the short term. Fixed income securities, regardless of credit quality, also experience price volatility, especially in response to interest rate changes. As a result of price volatility, there is a risk that you may lose money by investing in a Portfolio.
Foreign Investing
To the extent that a Portfolio invests in foreign issuers, there is the risk that news and events unique to a country or region will affect those markets and their issuers. These same events will not necessarily have an effect on the U.S. economy or similar issuers located in the United States. In addition, some of the Portfolios' securities, including underlying securities represented by depositary receipts, generally will be denominated in foreign currencies. As a result, changes in the value of a country's currency compared to the U.S. dollar may affect the value of a Portfolio's investments. These changes may happen separately from, and in response to, events that do not otherwise affect the value of the security in the issuer's home country. These risks may be intensified for a Portfolio's investments in securities of issuers located in emerging market or developing countries.
Foreign Securities
Foreign issuers generally are subject to different accounting, auditing and financial reporting standards than U.S. issuers. There may be less information available to the public about foreign issuers. Securities of foreign issuers can be less liquid and experience greater price movements. In some foreign countries, there is also the risk of government expropriation, excessive taxation, political or social instability, the imposition of currency controls or diplomatic developments that could affect a Portfolio's investment. There also can be difficulty obtaining and enforcing judgments against issuers in foreign countries. Foreign stock exchanges, broker-dealers and listed issuers may be subject to less government regulation and oversight. The cost of investing in foreign securities, including brokerage commissions and custodial expenses, can be higher than in the United States.
The Emerging Markets Portfolio may invest in debt obligations known as "sovereign debt," which are obligations of governmental issuers in emerging market or developing countries and industrialized countries. Certain emerging market or developing countries are among the largest debtors to commercial banks and foreign governments. The issuer or governmental authority that controls the repayment of sovereign debt may not be willing or able to repay the principal and/or pay interest when due in accordance with the terms of such obligations.
Emerging Market Risks
The Portfolios may invest in emerging market or developing countries, which are countries that major international financial institutions, such as the World Bank, generally consider to be less economically mature than developed nations, such as the United States or most nations in Western Europe. Emerging market or developing countries can include every nation in the world except the United States, Canada, Japan, Australia, New Zealand and most countries located in Western Europe. Emerging market or developing countries may be more likely to experience political turmoil or rapid changes in economic conditions than more developed countries, and the financial condition of issuers in emerging market or developing countries may be more precarious than in other countries. In addition, emerging market securities generally are less liquid and subject to wider price and currency fluctuations than securities issued in more developed countries. These characteristics result in greater risk of price volatility in emerging market or developing countries, which may be heightened by currency fluctuations relative to the U.S. dollar.
Foreign Currency
The investments of the Portfolios generally will be denominated in foreign currencies. The value of foreign currencies may fluctuate relative to the value of the U.S. dollar. Since the Portfolios may invest in such non-U.S. dollar-denominated securities and therefore may convert the value of such securities into U.S. dollars, changes in currency exchange rates can increase or decrease the U.S. dollar value of the Portfolios' assets.
18
Morgan Stanley Institutional Fund, Inc. Prospectus
Additional Risk Factors and Information
Additional Risk Factors
and Information (Cont'd)
The Adviser and/or the Sub-Advisers may use derivatives to reduce this risk. The Adviser and/or the Sub-Advisers may in their discretion choose not to hedge against currency risk. In addition, certain market conditions may make it impossible or uneconomical to hedge against currency risk.
Derivatives and Other Investments
The Portfolios may use various instruments that derive their values from those of specified securities, indices, currencies or other points of reference for both hedging and non-hedging purposes. Derivatives include futures, options, forward contracts, swaps, CFDs and structured investments. These derivatives, including those used to manage risk, are themselves subject to risks of the different markets in which they trade and, therefore, may not serve their intended purposes.
A futures contract provides for the future sale by one party and purchase by another party of a specified amount of a specific obligation underlying the contract at a specified future time and at a specified price. A Portfolio may use futures contracts to gain or modify exposure to an entire market (e.g., stock index futures) or to control its exposure to changing foreign currency exchange rates.
If a Portfolio buys an option, it buys a legal contract giving it the right to buy or sell a specific amount of a security or futures contract at an agreed-upon price. If the Portfolio "writes" an option, it sells to another person the right to buy from or sell to the Portfolio a specific amount of a security or futures contract at an agreed-upon price. The use of options would subject the Portfolio to certain risks. The Adviser's and/or Sub-Advisers' predictions of movements in the direction of the securities markets may be inaccurate, and the adverse consequences to the Portfolio (e.g., a reduction in the Portfolio's net asset value or a reduction in the amount of income available for distribution) may leave the Portfolio in a worse position than if the options had not been used. Other risks inherent in the use of options include, for example, the possible imperfect correlation between the price of option contracts and movements in the prices of the securities included in the indices underlying the options.
The Active International Allocation Portfolio may also purchase options on various indices in which the Portfolio may invest. These options (including listed and over-the-counter ("OTC") options) may be used to increase, limit or modify exposure to various securities, indices, countries or regions. In addition, the Portfolio may sell or "write" put options and/or covered call options on these indices in order to gain additional income. OTC covered call options are negotiated with dealers and there is no secondary market for these investments. OTC options are also subject to counterparty risk. To minimize this risk, the Portfolio will enter into OTC option transactions only with counterparties that meet certain requirements for credit quality and collateral.
A forward contract is an obligation to purchase or sell a security or a specific currency at a future date, which may be any fixed number of days from the date of the contract agreed upon by the parties, at a price set at the time of the contract. Forward foreign currency exchange contracts may be used to hedge against adverse price movements in its portfolio securities, to protect against uncertainty in the level of future foreign currency exchange rates or to gain or modify exposure to a particular currency. A Portfolio's participation in forward foreign currency exchange contracts also involves risks. If the Adviser and/or Sub-Advisers employ a strategy that does not correlate well with the Portfolio's investments or the currencies in which the investments are denominated, currency contracts could result in a loss. The contracts also may increase the Portfolio's volatility and may involve significant risk.
The Active International Allocation, Emerging Markets, International Equity, International Growth Equity and International Small Cap Portfolios may purchase and sell CFDs. A CFD is a privately negotiated contract between two parties, buyer and seller, stipulating that the seller will pay to or receive from the buyer the difference between the nominal value of the underlying instrument at the opening of the contract and that instrument's value at the end of the contract. The underlying instrument may be a single security, stock basket or index. A CFD can be set up to take either a short or long position on the underlying instrument.
A Portfolio may enter into swap transactions, which are contracts in which the Portfolio agrees to exchange the return or interest rate on one instrument for the return or interest rate on another instrument. Payments may be based on currencies, interest rates, securities indices or commodity indices. Swaps may be used to manage the maturity and duration of a fixed income portfolio, or to gain exposure to a market without directly investing in securities traded in that market.
Structured investments are securities that are convertible into, or the value of which is based upon the value of, other fixed income or equity securities or indices upon certain terms and conditions. The amount a Portfolio receives when it sells a structured investment or at maturity of a structured investment is not fixed, but is based on the price of the underlying security or index.
19
Additional Risk Factors
and Information (Cont'd)
Risks of Derivatives
The primary risks of derivatives are: (i) changes in the market value of securities held by a Portfolio, and of derivatives relating to those securities, may not be proportionate, (ii) there may not be a liquid market for a Portfolio to sell a derivative, which could result in difficulty closing a position and (iii) certain derivatives can magnify the extent of losses incurred due to changes in the market value of the securities to which they relate. In addition, some derivatives are subject to counterparty risk. To minimize this risk, a Portfolio may enter into derivatives transactions only with counterparties that meet certain requirements for credit quality and collateral. Also, a Portfolio may invest in certain derivatives that require the Portfolio to segregate some or all of its cash or liquid securities to cover its obligations under those instruments. At certain levels, this can cause the Portfolio to lose flexibility in managing its investments properly, responding to shareholder redemption requests or meeting other obligations. If a Portfolio is in that position, it could be forced to sell other securities that it wanted to retain.
Hedging a Portfolio's currency risks involves the risk of mismatching the Portfolio's obligations under a forward or futures contract with the value of securities denominated in a particular currency.
Investment Discretion
In pursuing the Portfolios' investment objectives, the Adviser or Sub-Advisers have considerable leeway in deciding which investments they buy, hold or sell on a day-to-day basis, and which trading stategies they use. For example, the Adviser and/or Sub-Advisers in their discretion may determine to use some permitted trading strategies while not using others. The success or failure of such decisions will affect the Portfolios' performance.
Bank Investors
An investment in a Portfolio is not a deposit of a bank and is not insured or guaranteed by the Federal Deposit Insurance Corporation (FDIC) or any other government agency.
Temporary Defensive Investments
When the Adviser or Sub-Advisers believe that changes in economic, financial or political conditions warrant, each Portfolio may invest without limit in certain short- and medium-term fixed income securities for temporary defensive purposes that may be inconsistent with a Portfolio's principal investment strategies. If the Adviser or Sub-Advisers incorrectly predict the effects of these changes, such defensive investments may adversely affect a Portfolio's performance and the Portfolio may not achieve its investment objective.
Portfolio Turnover
Consistent with its investment policies, the Global Franchise Portfolio and the Global Value Equity Portfolio will purchase and sell securities without regard to the effect on portfolio turnover. Higher portfolio turnover (e.g., over 100% per year) will cause the Global Franchise Portfolio and the Global Value Equity Portfolio to incur additional transaction costs and may result in taxable gains being passed through to shareholders. Each Portfolio may engage in frequent trading of securities to achieve its investment objective.
20
Morgan Stanley Institutional Fund, Inc. Prospectus
Fund Management
Investment Adviser
Morgan Stanley Investment Management Inc., with principal offices at 522 Fifth Avenue, New York, New York 10036, conducts a worldwide portfolio management business and provides a broad range of portfolio management services to customers in the United States and abroad. Morgan Stanley is the direct parent of the Adviser and the indirect parent of
Morgan Stanley Distribution, Inc. ("Morgan Stanley Distribution"), the Fund's Distributor. Morgan Stanley is a preeminent global financial services firm engaged in securities trading and brokerage activities, as well as providing investment banking, research and analysis, financing and financial advisory services. As of March 31, 2009, the Adviser, together with its affiliated asset management companies, had approximately $351 billion in assets under management or supervision.
Sub-Advisers
The Adviser has entered into Sub-Advisory Agreements with Morgan Stanley Investment Management Limited ("MSIM Limited"), located at 25 Cabot Square, Canary Wharf, London, England E14 4QA (with respect to the Emerging Markets, Global Franchise, Global Value Equity, International Equity and International Small Cap Portfolios) and Morgan Stanley Investment Management Company ("MSIM Company"), located at 23 Church Street, 16-01 Capital Square, Singapore 04948 (with respect to the Emerging Markets, Global Franchise, Global Value Equity and International Equity Portfolios). The Sub-Advisers are wholly owned subsidiaries of Morgan Stanley. The Sub-Advisers provide the relevant Portfolios with investment advisory services subject to the overall supervision of the Adviser and the Fund's Officers and Directors. The Adviser pays the Sub-Advisers on a monthly basis a portion of the net advisory fees the Adviser receives from the relevant Portfolios.
Advisory Fees
For the fiscal year ended December 31, 2008, the Adviser received from each Portfolio the advisory fee (net of fee waivers and/or expense reimbursements) set forth in the table below.
Adviser's Rates of Compensation
(as a percentage of average net assets)
| Active International Allocation Portfolio | 0.63 | % | |||||
| Emerging Markets Portfolio | 1.16 | % | |||||
| Global Franchise Portfolio | 0.79 | % | |||||
| Global Value Equity Portfolio | 0.65 | % | |||||
| International Equity Portfolio | 0.80 | % | |||||
| International Growth Equity Portfolio | 0.64 | % | |||||
| International Small Cap Portfolio | 0.93 | % | |||||
21
Portfolio Management
Active International Allocation Portfolio
The Portfolio is managed within the Active International Allocation team. The team consists of portfolio managers and analysts. The current member of the team primarily responsible for the day-to-day management of the Portfolio is Ann D. Thivierge, a Managing Director of the Adviser.
Ms. Thivierge has been associated with the Adviser in an investment management capacity since June 1986 and began managing the Portfolio in June 1995.
Emerging Markets Portfolio
The Portfolio is managed within the Emerging Markets Equity team. The team consists of portfolio managers and analysts. The team works collaboratively when making portfolio decisions. Current members of the team jointly and primarily responsible for the day-to-day management of the Portfolio are Ruchir Sharma, a Managing Director of the Adviser, James Cheng, a Managing Director of MSIM Company, Paul Psaila and Eric Carlson, each a Managing Director of the Adviser, William Scott Piper, an Executive Director of the Adviser, and Ana Cristina Piedrahita, an Executive Director of MSIM Limited.
Mr. Sharma has been associated with the Adviser in an investment management capacity since 1996 and began managing the Portfolio in April 2002. Mr. Cheng has been associated with MSIM Company in an investment management capacity and began managing the Portfolio in August 2006. Prior to August 2006, Mr. Cheng worked in an investment management capacity at Invesco Asia Limited, Asia Strategic Investment Management Limited and Munich Re Asia Capital Management Limited. Mr. Psaila has been associated with the Adviser in an investment management capacity and began managing the Portfolio in February 1994. Mr. Carlson has been associated with the Adviser in an investment management capacity and began managing the Portfolio in September 1997. Mr. Piper has been associated with the Adviser in an investment management capacity and began managing the Portfolio in December 2002. Ms. Piedrahita has been associated with MSIM Limited or its affiliates in an investment management capacity and began managing the Portfolio in January 2002.
The Emerging Markets Equity team is comprised of dedicated portfolio managers/analysts that have extensive experience in analyzing emerging markets equity securities for investors. Mr. Sharma is the lead portfolio manager and is responsible for the overall portfolio performance and construction. Mr. Sharma focuses on country allocation, relying heavily on input from the regional co-portfolio manager teams who are responsible for stock selection for their respective regions. Portfolio managers generally specialize by region, with the exception of a few specialized groups focusing on specific sectors.
Global Franchise Portfolio
The Portfolio is managed within the Global Franchise team. The team consists of portfolio managers. Current members of the team jointly and primarily responsible for the day-to-day management of the Portfolio are Hassan Elmasry, Paras Dodhia and Michael Allison, each an Executive Director of MSIM Limited, and Jayson Vowles, a Vice President of the Sub-Adviser. John Kelly-Jones, a Managing Director of MSIM Limited, is the Portfolio specialist for the Portfolio.
Mr. Elmasry has been associated with MSIM Limited or its affiliates in an investment management capacity since 1995 and began managing the Portfolio in April 2002. Mr. Dodhia has been associated with MSIM Limited in an investment management capacity and began managing the Portfolio in July 2002. Mr. Allison has been associated with MSIM Limited in an investment management capacity since 2000 and began managing the Portfolio in February 2005. Mr. Vowles has been associated with MSIM Limited in an investment management capacity and began managing the Portfolio in August 2003. Mr. Kelly-Jones has been associated with MSIM Limited or its affiliates since 1998, joined the Franchise team in July 2007 and has been a portfolio specialist for the Portfolio since July 2007. Prior to July 2007, Mr. Kelly-Jones was a portfolio specialist for MSIM Limited's Global Value Equity team.
On or before June 15, 2009, the portfolio management team listed above will no longer be responsible for the day-to-day management of the Portfolio. At such time, responsibility for the day-to-day management of the Portfolio will be assumed by the International Equity team comprised of William D. Lock and Walter B. Riddell, each a Managing Director of MSIM Limited, Peter J. Wright, a Managing Director of MSIM Company and John S. Goodacre and Christian Derold, each an Executive Director of MSIM Limited. Mr. Lock has been associated with MSIM Limited in an investment management capacity since 1994. Mr. Riddell has been associated with MSIM Limited in an investment management capacity since 1995. Mr. Wright has been associated with MSIM Company or its affiliates since 1996. Mr.Goodacre has been associated with MSIM Limited in an investment management capacity since 2003. Mr. Derold has been associated with MSIM
22
Morgan Stanley Institutional Fund, Inc. Prospectus
Fund Management
Portfolio Management (Cont'd)
Limited in an investment management capacity since May 2006. Prior to May 2006, Mr. Derold was a consultant at DCFN Research and Head of Research at Millgate Capital Inc.
Global Value Equity Portfolio
The Portfolio is managed within the Global Franchise team. The team consists of portfolio managers. Current members of the team jointly and primarily responsible for the day-to-day management of the Portfolio are Hassan Elmasry, Paras Dodhia and Michael Allison, each an Executive Director of MSIM Limited, and Jayson Vowles, a Vice President of MSIM Limited.
Mr. Elmasry has been associated with MSIM Limited or its affiliates in an investment management capacity since 1995 and began managing the Portfolio in April 2002. Mr. Dodhia has been associated with MSIM Limited in an investment management capacity since 2002 and began managing the Portfolio in November 2008. Mr. Allison has been associated with MSIM Limited in an investment management capacity since 2000 and began managing the Portfolio in November 2008. Mr. Vowles has been associated with MSIM Limited in an investment management capacity since 2003 and began managing the Portfolio in November 2008.
On or before June 15, 2009, the portfolio management team listed above will no longer be responsible for the day-to-day management of the Portfolio. At such time, responsibility for the day-to-day management of the Portfolio will be assumed by the International Equity team comprised of William D. Lock and Walter B. Riddell, each a Managing Director of MSIM Limited, Peter J. Wright, a Managing Director of MSIM Company and John S. Goodacre and Christian Derold, each an Executive Director of MSIM Limited. Mr. Lock has been associated with MSIM Limited in an investment management capacity since 1994. Mr. Riddell has been associated with MSIM Limited in an investment management capacity since 1995. Mr. Wright has been associated with MSIM Company or its affiliates since 1996. Mr.Goodacre has been associated with MSIM Limited in an investment management capacity since 2003. Mr. Derold has been associated with MSIM Limited in an investment management capacity since May 2006. Prior to May 2006, Mr. Derold was a consultant at DCFN Research and Head of Research at Millgate Capital Inc.
International Equity Portfolio
The Portfolio is managed within the International Equity team. The team consists of portfolio managers and analysts. Current members of the team jointly and primarily responsible for the day-to-day management of the Portfolio are William D. Lock and Walter B. Riddell, each a Managing Director of MSIM Limited, Peter J. Wright, a Managing Director of MSIM Company, and John S. Goodacre and Christian Derold, each an Executive Director of MSIM Limited.
Mr. Lock has been associated with MSIM Limited in an investment management capacity since 1994 and began managing the Portfolio in May 1999. Mr. Riddell has been associated with MSIM Limited in an investment management capacity since 1995 and began managing the Portfolio in May 1999. Mr. Wright has been associated with MSIM Company or its affiliates in an investment management capacity since 1996 and began managing the Portfolio in May 1999. Mr. Goodacre has been associated with MSIM Limited in an investment management capacity since 2003 and began managing the Portfolio in February 2006. Mr. Derold has been associated with MSIM Limited in an investment management capacity and began managing the Portfolio in May 2006. Prior to May 2006, Mr. Derold was a consultant at DCFN Research and Head of Research at Millgate Capital Inc.
Each member of the team has both global sector research responsibilities and makes investment management decisions for the Portfolio. Messrs. Lock, Wright, Riddell, Goodacre and Derold have day-to-day portfolio administration responsibilities as well.
International Growth Equity Portfolio
The Portfolio is managed within the International Growth team. The team consists of portfolio managers and analysts. Current members of the team jointly and primarily responsible for the day-to-day management of the Portfolio are Johannes B. van den Berg, a Managing Director of the Adviser, and David Sugimoto and Brian Arcese, each an Executive Director of the Adviser.
Mr. van den Berg has been associated with the Adviser in an investment management capacity since July 2005 and began managing the Portfolio at its inception in December 2005. Prior to July 2005, Mr. van den Berg was a Managing Director and portfolio manager for 1838 Investment Advisors. Mr. Sugimoto has been associated with the Adviser in an investment management capacity since July 2005 and began managing the Portfolio at its inception in December 2005. Prior to July 2005, Mr. Sugimoto was a Director and portfolio manager of 1838 Investment Advisors. Mr. Arcese has been associated with the Adviser in an investment management capacity since November 2006 and began managing the Portfolio in April 2008. Prior to
23
Portfolio Management (Cont'd)
November 2006, he was an equity analyst at BlackRock (from April 2005 to November 2006) and an equity analyst and manager of high net worth client portfolios at 1838 Investment Advisors (from August 2001 to April 2005).
Mr. van den Berg is the lead manager of the Portfolio and is responsible for the execution of the overall strategy of the Portfolio.
International Small Cap Portfolio
The Portfolio is managed within the International Small Cap team. The team consists of portfolio managers and analysts. Current members of the team jointly and primarily responsible for the day-to-day management of the Portfolio are Margaret Naylor and Nathalie Degans, each a Managing Director of MSIM Limited, and Arthur Pollock and Alistair Corden-Lloyd, each an Executive Director of MSIM Limited, and Jean Beaubois and Alexander Vislykh, each a Vice President of MSIM Limited.
Ms. Naylor has been associated with MSIM Limited in an investment management capacity since 1987 and began managing the Portfolio in December 1992. Ms. Degans has been associated with MSIM Limited in an investment management capacity since 1993 and began managing the Portfolio in May 1999. Mr. Pollock has been associated with MSIM Limited in an investment management capacity since 1999 and began managing the Portfolio in May 2000. Mr. Corden-Lloyd has been associated with MSIM Limited in an investment management capacity since 1997 and began managing the Portfolio in April 2004. Mr. Beaubois has been associated with MSIM Limited in an investment management capacity since 2003 and began managing the Portfolio in April 2007. Mr. Vislkyh has been associated with MSIM Limited in an investment management capacity since 2002 and began managing the Portfolio in April 2009.
Additional Information
The Fund's SAI provides additional information about the portfolio managers' compensation structure, other accounts managed by the portfolio managers and the portfolio managers' ownership of securities in the Portfolios.
The composition of each team may change from time to time.
A discussion regarding the Board of Directors' approval of the Investment Advisory Agreement and the Sub-Advisory Agreements is available in the Fund's semiannual report to shareholders for the period ended June 30, 2008.
24
Morgan Stanley Institutional Fund, Inc. Prospectus
Shareholder Information
Shareholder Information
Share Class
This Prospectus offers Class I and Class P shares of each of the Portfolios. Neither Class I shares nor Class P shares are subject to a sales charge, and Class I shares are not subject to a shareholder services fee. Both Class I and Class P shares generally are restricted to investments in minimum amounts that are substantially higher than Class H shares.
Distribution of Portfolio Shares
Morgan Stanley Distribution is the exclusive Distributor of Class I and Class P shares of each Portfolio. Morgan Stanley Distribution receives no compensation from the Fund for distributing Class I shares of the Portfolios. The Fund has adopted a Shareholder Services Plan with respect to the Class P shares of each Portfolios (the "Plan") pursuant to Rule 12b-1 under the Investment Company Act of 1940. Under the Plan, each Portfolio pays the Distributor a shareholder services fee of up to 0.25% of the Class P shares' average daily net assets on an annualized basis. The Distributor may compensate other parties for providing shareholder support services to investors who purchase Class P shares. Such fees relate solely to the Class P shares and will reduce the net investment income and total return of the Class P shares.
The Adviser and/or Distributor may pay compensation (out of their own funds and not as an expense of the Portfolios) to certain affiliated or unaffiliated brokers or other service providers in connection with the sale or retention of a Portfolio's shares and/or shareholder servicing. Such compensation may be significant in amount and the prospect of receiving any such additional compensation may provide affiliated or unaffiliated entities with an incentive to favor sales of shares of the Portfolios over other investment options. Any such payments will not change the net asset value ("NAV") or the price of a Portfolio's shares. For more information, please see the Fund's SAI.
About Net Asset Value
The NAV per share of a class of shares of a Portfolio is determined by dividing the total of the value of the Portfolio's investments and other assets attributable to the class, less any liabilities attributable to the class, by the total number of outstanding shares of that class of the Portfolio. In making this calculation, each Portfolio generally values securities at market price. If market prices are unavailable or may be unreliable because of events occurring after the close of trading, including circumstances under which the Adviser or Sub-Adviser determines that a security's market price is not accurate, fair value prices may be determined in good faith using methods approved by the Board of Directors.
In addition, with respect to securities that primarily are listed on foreign exchanges, when an event occurs after the close of such exchanges that is likely to have changed the value of the securities (for example, a percentage change in value of one or more U.S. securities indices in excess of specified thresholds), such securities will be valued at their fair value, as determined under procedures established by the Fund's Board of Directors. Securities also may be fair valued in the event of a significant development affecting a country or region or an issuer-specific development which is likely to have changed the value of the security. In these cases, a Portfolio's NAV will reflect certain portfolio securities' fair value rather than their market price. To the extent the Portfolio invests in open-end management companies that are registered under the Investment Company Act of 1940, the Portfolio's NAV is calculated based upon the NAV of such funds. The prospectuses for such funds explain the circumstances under which they will use fair value pricing and its effects.
Fair value pricing involves subjective judgments and it is possible that the fair value determined for a security is materially different than the value that could be realized upon the sale of that security. With respect to securities that are primarily listed on foreign exchanges, the values of a Portfolio's investment securities may change on days when you will not be able to purchase or sell your shares.
Pricing of Portfolio Shares
You may buy or sell (redeem) Class I and Class P shares of the Portfolios at the NAV next determined for the class after receipt of your order. The Fund determines the NAV per share for the Portfolios as of the close of the New York Stock Exchange ("NYSE") (normally 4:00 p.m. Eastern Time) on each day that the NYSE is open for business (the "Pricing Time").
Portfolio Holdings
A description of the Fund's policies and procedures with respect to the disclosure of each Portfolio's securities is available in the Fund's SAI.
How To Purchase Class I and Class P Shares
The Fund suspended offering Class I and Class P shares of the Global Franchise and Global Value Equity Portfolios to new investors. The following exceptions apply with respect to the purchase of Class I and Class P shares of the Global Franchise Portfolio. The Fund will continue to offer Class I and Class P shares of the Global Franchise Portfolio (1) through certain retirement plan accounts, (2) to clients of registered investment advisors who currently offer shares of the Global Franchise Portfolio in their discretionary asset allocation programs, (3) through certain endowments and foundations, (4) to clients of family office practices where shares of the Global Franchise Portfolio are held by family members of such clients, (5) to directors and trustees of the Morgan Stanley Funds, (6) to Morgan Stanley and its affiliates and their employees and (7) to benefit plans sponsored by Morgan Stanley and its affiliates. The Fund will continue to offer Class I and Class P shares of the Global Franchise and Global Value Equity Portfolios to existing shareholders and may recommence offering Class I and Class P shares of the Global Franchise and
25
Shareholder Information (Cont'd)
Global Value Equity Portfolios to other new investors in the future. Any such offerings of the shares of the Global Franchise and Global Value Equity Portfolios may be limited in amount and may commence and terminate without any prior notice.
You may purchase Class I and Class P shares of each Portfolio directly from the Fund, from the Distributor or through certain third parties ("Financial Intermediaries") on each day that the Portfolios are open for business.
Investors purchasing Class I and Class P shares through a Financial Intermediary may be charged a transaction-based or other fee by the Financial Intermediary for its services. If you are purchasing Class I or Class P shares through a Financial Intermediary, please consult your Financial Intermediary for purchase instructions.
The minimum initial investment generally is $5,000,000 for Class I shares and $1,000,000 for Class P shares of the Portfolios. The minimum initial or additional investment will be waived for certain investments, including sales through banks, broker-dealers and other financial institutions (including registered investment advisers and financial planners) purchasing shares on behalf of their clients in (i) discretionary and non-discretionary advisory programs, (ii) fund supermarkets, (iii) asset allocation programs or (iv) other programs in which the client pays an asset-based fee for advice or for executing transactions in Portfolio shares or for otherwise participating in the program; certain retirement plans with plan assets of at least $5 million investing directly with the Fund; retirement plans investing through certain retirement plan platforms; certain endowments, foundations and other not for profit entities with at least $5 million of investable assets investing directly with the Fund; certain unit investment trusts sponsored by Morgan Stanley or any of its affiliates; other registered investment companies advised by Morgan Stanley Investment Management or any of its affiliates; Morgan Stanley Investment Management and its affiliates with respect to shares held in connection with certain retirement and deferred compensation programs established for their employees; the independent Directors of the Fund; and clients who owned Portfolio shares as of December 31, 2007. If the value of your account falls below the minimum initial investment amount for Class I or Class P shares as a result of share redemptions or you no longer meet one of the waiver criteria set forth above, your account may be subject to involuntary conversion or involuntary redemption. You will be notified prior to any such conversions or redemptions.
Initial Purchase by Mail
You may open an account, subject to acceptance by the Fund, by completing and signing an Account Registration Form provided by Morgan Stanley Services Company Inc. ("Morgan Stanley Services"), the Fund's transfer agent, which you can obtain by calling Morgan Stanley Services at 1-800-548-7786 and mailing it to Morgan Stanley Institutional Fund, Inc., c/o Morgan Stanley Services Company Inc., P.O. Box 219804, Kansas City, MO 64121-9804 together with a check payable to Morgan Stanley Institutional Fund, Inc.
Please note that payments to investors who redeem Class I and Class P shares purchased by check will not be made until payment of the purchase has been collected, which may take up to eight business days after purchase. You can avoid this delay by purchasing Class I and Class P shares by wire.
Initial Purchase by Wire
You may purchase Class I and Class P shares of each Portfolio by wiring Federal Funds (monies credited by a Federal Reserve Bank) to JPMorgan Chase Bank, N.A., the Portfolios' custodian (the "Custodian"). You should forward a completed Account Registration Form to Morgan Stanley Services in advance of the wire. See the section above entitled "Pricing of Portfolio Shares." Instruct your bank to send a Federal Funds wire in a specified amount to the Custodian using the following wire instructions:
JPMorgan Chase Bank, N.A.
270 Park Avenue
New York, NY 10017
ABA #021000021
DDA #910-2-733293
Attn: Morgan Stanley Institutional Fund, Inc.
Subscription Account
Ref: (Portfolio Name, Account Number,
Account Name)
Additional Investments
You may purchase additional Class I and Class P shares for your account at any time by purchasing shares at NAV by any of the methods described above. For additional purchases directly from the Fund, your account name, the Portfolio name and the class selected must be specified in the letter to assure proper crediting to your account. In addition, you may purchase additional shares by wire by following instructions under "Initial Purchase by Wire."
General
Class I and Class P shares may, in the Fund's discretion, be purchased with investment securities (in lieu of or, in conjunction with, cash) acceptable to the Fund. The securities would be accepted by the Fund at their market value in return for Portfolio shares of equal value, taking into account any applicable sales charge.
To help the government fight the funding of terrorism and money laundering activities, federal law requires all financial institutions to obtain, verify and record information that identifies each person who opens an account. What this means to you: when you open an account, we will ask your name, address, date of birth and other information that will allow us to identify you. If we are unable to verify your identity, we reserve the right to
26
Morgan Stanley Institutional Fund, Inc. Prospectus
Shareholder Information
Shareholder Information (Cont'd)
restrict additional transactions and/or liquidate your account at the next calculated NAV after your account is closed (less any applicable sales/account charges and/or tax penalties) or take any other action required by law. In accordance with federal law requirements, the Fund has implemented an anti-money laundering compliance program, which includes the designation of an anti-money laundering compliance officer.
Other Transaction Information
The Fund may suspend the offering of shares, or any class of shares, of the Portfolios or reject any purchase orders when we think it is in the best interests of the Fund.
Certain patterns of exchange and/or purchase or sale transactions involving the Portfolios may result in the Fund rejecting, limiting or prohibiting, at its sole discretion, and without prior notice, additional purchases and/or exchanges and may result in a shareholder's account being closed. Determination in this regard may be made based on the frequency or dollar amount of the previous exchange or purchase or sale transaction. See "Frequent Purchases and Redemptions of Shares."
How To Redeem Class I and Class P Shares
You may redeem Class I and Class P shares of a Portfolio by mail or, if authorized, by telephone, at no charge other than as described below. The value of shares redeemed may be more or less than the purchase price, depending on the NAV at the time of redemption. Class I and Class P shares of a Portfolio will be redeemed at the NAV next determined after we receive your redemption request in good order.
Requests should be addressed to Morgan Stanley Institutional Fund, Inc., c/o Morgan Stanley Services Company Inc., P.O. Box 219804, Kansas City, MO 64121-9804.
To be in good order, redemption requests must include the following documentation:
(a) A letter of instruction, if required, or a stock assignment specifying the number of shares or dollar amount to be redeemed, signed by all registered owners of the shares in the exact names in which the shares are registered;
(b) The share certificates, if issued;
(c) Any required signature guarantees; and
(d) Other supporting legal documents, if required, in the case of estates, trusts, guardianships, custodianship, corporations, pension and profit sharing plans and other organizations.
You automatically have telephone redemption and exchange privileges unless you indicate otherwise by checking the applicable box on the new account application form or calling Morgan Stanley Services to opt out of such privileges. You may request a redemption of Class I and Class P shares by calling the Fund at 1-800-548-7786 and requesting that the redemption proceeds be mailed or wired to you. You cannot redeem Class I and Class P shares by telephone if you hold share certificates for those shares. For your protection when calling the Fund, we will employ reasonable procedures to confirm that instructions communicated over the telephone are genuine. These procedures may include requiring various forms of personal identification such as name, mailing address, social security number or other tax identification number. Telephone instructions may also be recorded. If reasonable procedures are employed, none of Morgan Stanley, Morgan Stanley Services or the Fund will be liable for following telephone instructions which it reasonably believes to be genuine. Telephone redemptions and exchanges may not be available if you cannot reach Morgan Stanley Services by telephone, whether because all telephone lines are busy or for any other reason; in such case, a shareholder would have to use the Fund's other redemption and exchange procedures described in this prospectus. During periods of drastic economic or market changes, it is possible that the telephone privileges may be difficult to implement, although this has not been the case with the Fund in the past. To opt out of telephone privileges, please contact Morgan Stanley Services at 1-800-548-7786.
The Fund will ordinarily distribute redemption proceeds in cash within one business day of your redemption request, but it may take up to seven days. However, if you purchased Class I and Class P shares by check, the Fund will not distribute redemption proceeds until it has collected your purchase payment, which may take up to eight days.
If we determine that it is in the best interest of the Fund or Portfolio not to pay redemption proceeds in cash, we may distribute to you securities held by the Portfolio from which you are redeeming. If requested, we will pay a portion of your redemption(s) in cash (during any 90 day period) up to the lesser of $250,000 or 1% of the net assets of the Portfolio at the beginning of such period. Such in-kind securities may be illiquid and difficult or impossible for a shareholder to sell at a time and at a price that a shareholder would like. Redemptions paid in such securities generally will give rise to income, gain or loss for income tax purposes in the same manner as redemptions paid in cash. In addition, you may incur brokerage costs and a further gain or loss for income tax purposes when you ultimately sell the securities.
Class I and Class P shares of a Portfolio (except Global Franchise and Global Value Equity Portfolios) redeemed within 30 days of purchase will be subject to a 2% redemption fee, payable to the Portfolio. The redemption fee is designed to protect the Portfolios and their remaining shareholders from the effects of short-term trading. The redemption fee is not imposed on redemptions made: (i) through systematic withdrawal/exchange plans, (ii) through pre-approved asset allocation programs,
27
Shareholder Information (Cont'd)
(iii) of shares received by reinvesting income dividends or capital gain distributions, (iv) through certain collective trust funds or other pooled vehicles and (v) on behalf of advisory accounts where client allocations are solely at the discretion of the Morgan Stanley Investment Management investment team. The redemption fee is based on, and deducted from, the redemption proceeds. Each time you redeem or exchange Class I and Class P shares, the shares held the longest will be redeemed or exchanged first.
The redemption fee may not be imposed on transactions that occur through certain omnibus accounts at Financial Intermediaries. Certain Financial Intermediaries may not have the ability to assess a redemption fee. Certain Financial Intermediaries may apply different methodologies than those described above in assessing redemption fees, may impose their own redemption fee that may differ from a Portfolio's redemption fee or may impose certain trading restrictions to deter market-timing and frequent trading. If you invest in a Portfolio through a Financial Intermediary, please read that Financial Intermediary's materials carefully to learn about any other restrictions or fees that may apply.
Exchange Privilege
You may exchange Class I and Class P shares for the same class of shares of other available portfolios of the Fund and available portfolios of Morgan Stanley Institutional Fund Trust. Exchanges are effected based on the respective NAVs of the applicable portfolios (subject to any applicable redemption fee). To obtain a prospectus for another portfolio, call the Fund at 1-800-548-7786 or contact your Financial Intermediary. If you purchased Portfolio shares through a Financial Intermediary, certain portfolios may be unavailable for exchange. Contact your Financial Intermediary to determine which portfolios are available for exchange.
You can process your exchange by contacting your Financial Intermediary. Otherwise, you should send exchange requests to Morgan Stanley Services by mail to Morgan Stanley Institutional Fund, Inc., c/o Morgan Stanley Services Company Inc., P.O. Box 219804, Kansas City, MO 64121-9804. Exchange requests can also be made by calling 1-800-548-7786.
When you exchange for Class I or Class P shares of another portfolio, your transaction will be treated the same as an initial purchase. You will be subject to the same minimum initial investment and account size as an initial purchase. Your exchange price will be the price calculated at the next Pricing Time after the Fund receives your exchange order. The Fund, in its sole discretion, may waive the minimum initial investment amount in certain cases. An exchange of Portfolio (except the Global Franchise and the Global Value Equity Portfolios) shares held for less than 30 days from the date of purchase will be subject to the 2% redemption fee described above. The Fund may terminate or revise the exchange privilege upon required notice or in certain cases without notice.
Frequent Purchases and Redemptions of Shares
Frequent purchases and redemptions of shares by Portfolio shareholders are referred to as "market-timing" or "short-term trading" and may present risks for other shareholders of a Portfolio, which may include, among other things, diluting the value of a Portfolio's shares held by long-term shareholders, interfering with the efficient management of the Portfolio, increasing brokerage and administrative costs, incurring unwanted taxable gains and forcing the Portfolio to hold excess levels of cash.
In addition, a Portfolio is subject to the risk that market-timers and/or short-term traders may take advantage of time zone differences between the foreign markets on which a Portfolio's securities trade and the time as of which the Portfolio's NAV is calculated ("time-zone arbitrage"). For example, a market-timer may purchase shares of a Portfolio based on events occurring after foreign market closing prices are established, but before the Portfolio's NAV calculation, that are likely to result in higher prices in foreign markets the following day. The market-timer would redeem the Portfolio's shares the next day when the Portfolio's share price would reflect the increased prices in foreign markets for a quick profit at the expense of long-term Portfolio shareholders.
Investments in other types of securities also may be susceptible to short-term trading strategies. These investments include securities that are, among other things, thinly traded, traded infrequently or relatively illiquid, which have the risk that the current market price for the securities may not accurately reflect current market values. A shareholder may seek to engage in short-term trading to take advantage of these pricing differences (referred to as "price arbitrage").
The Fund discourages and does not accommodate frequent purchases and redemptions of Portfolio shares by Portfolio shareholders and the Fund's Board of Directors has adopted policies and procedures with respect to such frequent purchases and redemptions.
The Fund's policies with respect to purchases and redemptions of Portfolio shares are described in the "Shareholder Information—How To Purchase Class I and Class P Shares," "Shareholder Information—Other Transaction Information" and "Shareholder Information—How To Redeem Class I and Class P Shares" sections of this Prospectus. Except as described in each of these sections, and with respect to trades that occur through omnibus accounts at Financial Intermediaries, as described below, the Fund's policies regarding frequent trading of Portfolio shares are applied uniformly to all shareholders. With respect to trades that occur through omnibus accounts at intermediaries, such as investment advisers, broker-dealers, transfer agents and third party administrators, the Fund (i) has requested
28
Morgan Stanley Institutional Fund, Inc. Prospectus
Shareholder Information
Shareholder Information (Cont'd)
assurance that such Financial Intermediaries currently selling Portfolio shares have in place internal policies and procedures reasonably designed to address market-timing concerns and has instructed such Financial Intermediaries to notify the Fund immediately if they are unable to comply with such policies and procedures and (ii) requires all prospective Financial Intermediaries to agree to cooperate in enforcing the Fund's policies with respect to frequent purchases, redemptions and exchanges of Portfolio shares.
With respect to trades that occur through omnibus accounts at Financial Intermediaries, to some extent, the Fund relies on the Financial Intermediary to monitor frequent short-term trading within a Portfolio by the Financial Intermediary's customers and to collect the Portfolio's redemption fee from its customers. However, the Fund has entered into agreements with Financial Intermediaries whereby Financial Intermediaries are required to provide certain customer identification and transaction information upon the Fund's request. The Fund may use this information to help identify and prevent market-timing activity in the Fund. There can be no assurances that the Fund will be able to identify or prevent all market-timing activities.
Dividends and Distributions
Each Portfolio's policy is to distribute to shareholders substantially all of its net investment income, if any, in the form of an annual dividend and to distribute net realized capital gains, if any, at least annually.
The Fund automatically reinvests all dividends and distributions in additional shares. However, you may elect to receive distributions in cash by giving written notice to the Fund or your Financial Intermediary or by checking the appropriate box in the Distribution Option section on the Account Registration Form.
Taxes
The dividends and distributions you receive from a Portfolio may be subject to federal, state and local taxation, depending on your tax situation. The tax treatment of dividends and distributions is the same whether or not you reinvest them. For taxable years beginning before January 1, 2011, dividends paid by a Portfolio that are attributable to "qualified dividends" received by the Portfolio may be taxed at reduced rates to individual shareholders (15% at the maximum), if certain requirements are met by the Portfolio and the shareholders. "Qualified dividends" include dividends distributed by certain foreign corporations (generally, corporations incorporated in a possession of the United States, some corporations eligible for treaty benefits under a treaty with the United States, and corporations whose stock with respect to which such dividend is paid is readily tradable on an established securities market in the Unites States). Dividends paid by a Portfolio not attributable to "qualified dividends" received by the Portfolio, including distributions of short-term capital gains, will be taxed at normal tax rates applicable to ordinary income. Long-term capital gains distributions to individuals are taxed at a reduced rate (15% at the maximum) before January 1, 2011, regardless of how long you have held your shares. Unless further Congressional legislative action is taken, reduced rates for dividends and long-term capital gain will cease to be in effect after December 31, 2010. A Portfolio may be able to pass through to you a credit for foreign income taxes it pays. The Fund will tell you annually how to treat dividends and distributions.
If you redeem shares of a Portfolio, you may be subject to tax on any gains you earn based on your holding period for the shares and your marginal tax rate. An exchange of shares of a Portfolio for shares of another portfolio is treated for tax purposes as a sale of the original shares in the Portfolio, followed by the purchase of shares in the other portfolio. Conversions of shares between classes will not result in taxation.
Because each investor's tax circumstances are unique and the tax laws may change, you should consult your tax advisor about your investment.
The Fund currently consists of the following portfolios:
U.S. Equity
Capital Growth Portfolio
Focus Growth Portfolio
Large Cap Relative Value Portfolio
Small Company Growth Portfolio*
U.S. Real Estate Portfolio
U.S. Small/Mid Cap Value Portfolio
Global and International Equity
Active International Allocation Portfolio
Emerging Markets Portfolio
Global Franchise Portfolio**
Global Real Estate Portfolio
Global Value Equity Portfolio*
International Equity Portfolio
International Growth Equity Portfolio
International Real Estate Portfolio
International Small Cap Portfolio
Fixed Income
Emerging Markets Debt Portfolio
* Portfolio is currently closed to new investors
** Portfolio is currently closed to new investors with certain exceptions
29
Financial Highlights
The financial highlights tables that follow are intended to help you understand the financial performance of the Class I and Class P shares of each Portfolio for the past five years or since inception if less than five years. Certain information reflects financial results for a single Portfolio share. The total returns in the tables represent the rate that an investor would have earned (or lost) on an investment in each Portfolio (assuming reinvestment of all dividends and distributions). The information has been audited by Ernst & Young LLP, an independent registered public accounting firm. Ernst & Young LLP's report, along with the Portfolios' financial statements, are incorporated by reference into the Fund's SAI and are included in the Fund's Annual Report to Shareholders. The Annual Report and the Portfolios' financial statements, as well as the SAI, are available at no cost from the Fund at the toll-free number noted on the back cover to this Prospectus.
Active International Allocation Portfolio
| Year Ended December 31, | |||||||||||||||||||||||
| Class I | 2008 | 2007 | 2006 | 2005 | 2004 | ||||||||||||||||||
| Selected Per Share Data and Ratios | |||||||||||||||||||||||
| Net Asset Value, Beginning of Period | $ | 15.92 | $ | 15.10 | $ | 12.43 | $ | 10.96 | $ | 9.58 | |||||||||||||
| Income (Loss) from Investment Operations | |||||||||||||||||||||||
| Net Investment Income† | 0.35 | 0.30 | 0.27 | 0.21 | 0.13 | ||||||||||||||||||
| Net Realized and Unrealized Gain (Loss) on Investments | (6.41 | ) | 1.96 | 2.75 | 1.40 | 1.46 | |||||||||||||||||
| Total from Investment Operations | (6.06 | ) | 2.26 | 3.02 | 1.61 | 1.59 | |||||||||||||||||
| Distributions from and/or in Excess of | |||||||||||||||||||||||
| Net Investment Income | (0.14 | ) | (0.54 | ) | (0.35 | ) | (0.14 | ) | (0.21 | ) | |||||||||||||
| Net Realized Gain | (0.61 | ) | (0.90 | ) | – | – | – | ||||||||||||||||
| Total Distributions | (0.75 | ) | (1.44 | ) | (0.35 | ) | (0.14 | ) | (0.21 | ) | |||||||||||||
| Redemption Fees | 0.00 | ‡ | 0.00 | ‡ | 0.00 | ‡ | 0.00 | ‡ | – | ||||||||||||||
| Net Asset Value, End of Period | $ | 9.11 | $ | 15.92 | $ | 15.10 | $ | 12.43 | $ | 10.96 | |||||||||||||
| Total Return++ | (39.25 | )% | 15.30 | % | 24.34 | % | 14.85 | % | 16.64 | % | |||||||||||||
| Ratios and Supplemental Data: | |||||||||||||||||||||||
| Net Assets, End of Period (Thousands) | $ | 565,313 | $ | 1,093,735 | $ | 967,361 | $ | 792,329 | $ | 580,851 | |||||||||||||
| Ratio of Expenses to Average Net Assets(1) | 0.79 | %+ | 0.80 | %+ | 0.80 | % | 0.80 | % | 0.80 | % | |||||||||||||
| Ratio of Expenses to Average Net Assets Excluding Non Operating Expenses | 0.79 | %+ | 0.80 | %+ | 0.80 | % | 0.80 | % | 0.80 | % | |||||||||||||
| Ratio of Net Investment Income to Average Net Assets(1) | 2.70 | %+ | 1.93 | %+ | 1.99 | % | 1.84 | % | 1.28 | % | |||||||||||||
| Portfolio Turnover Rate | 34 | % | 28 | % | 16 | % | 24 | % | 24 | % | |||||||||||||
| (1)Supplemental Information on the Ratios to Average Net Assets: | |||||||||||||||||||||||
| Ratios before expense limitation: | |||||||||||||||||||||||
| Expenses to Average Net Assets | 0.82 | %+ | 0.81 | %+ | 0.82 | % | 0.83 | % | 0.91 | % | |||||||||||||
| Net Investment Income to Average Net Assets | 2.67 | %+ | 1.92 | %+ | 1.97 | % | 1.81 | % | 1.18 | % | |||||||||||||
† Per share amount is based on average shares outstanding.
‡ Amount is less than $0.005 per share.
++ Calculated based on the net asset value as of the last business day of the period.
+ Reflects rebate of certain Portfolio expenses in connection with the investments in Morgan Stanley Institutional Liquidity Money Market Portfolio—Institutional Class during the period. As a result of such rebate, the expenses as a percentage of its net assets were effected by approximately 0.01% and less than 0.005% for the years ended December 31, 2008 and December 31, 2007, respectively.
30
Morgan Stanley Institutional Fund, Inc. Prospectus
Financial Highlights
Active International Allocation Portfolio
| Year Ended December 31, | |||||||||||||||||||||||
| Class P | 2008 | 2007 | 2006 | 2005 | 2004 | ||||||||||||||||||
| Selected Per Share Data and Ratios | |||||||||||||||||||||||
| Net Asset Value, Beginning of Period | $ | 16.20 | $ | 15.36 | $ | 12.64 | $ | 11.13 | $ | 9.72 | |||||||||||||
| Income (Loss) from Investment Operations | |||||||||||||||||||||||
| Net Investment Income† | 0.29 | 0.24 | 0.22 | 0.19 | 0.10 | ||||||||||||||||||
| Net Realized and Unrealized Gain (Loss) on Investments | (6.48 | ) | 2.01 | 2.81 | 1.43 | 1.35 | |||||||||||||||||
| Total from Investment Operations | (6.19 | ) | 2.25 | 3.03 | 1.62 | 1.45 | |||||||||||||||||
| Distributions from and/or in Excess of | |||||||||||||||||||||||
| Net Investment Income | (0.13 | ) | (0.51 | ) | (0.31 | ) | (0.11 | ) | (0.17 | ) | |||||||||||||
| Net Realized Gain | (0.61 | ) | (0.90 | ) | – | – | – | ||||||||||||||||
| Total Distributions | (0.74 | ) | (1.41 | ) | (0.31 | ) | (0.11 | ) | (0.17 | ) | |||||||||||||
| Redemption Fees | 0.00 | ‡ | 0.00 | ‡ | 0.00 | ‡ | 0.00 | ‡ | 0.13 | ||||||||||||||
| Net Asset Value, End of Period | $ | 9.27 | $ | 16.20 | $ | 15.36 | $ | 12.64 | $ | 11.13 | |||||||||||||
| Total Return++ | (39.41 | )% | 14.95 | % | 23.95 | % | 14.67 | % | 16.29 | % | |||||||||||||
| Ratios and Supplemental Data: | |||||||||||||||||||||||
| Net Assets, End of Period (Thousands) | $ | 7,614 | $ | 5,285 | $ | 3,573 | $ | 2,215 | $ | 2,623 | |||||||||||||
| Ratio of Expenses to Average Net Assets(1) | 1.04 | %+ | 1.05 | %+ | 1.05 | % | 1.05 | % | 1.05 | % | |||||||||||||
| Ratio of Expenses to Average Net Assets Excluding Non Operating Expenses | 1.04 | %+ | 1.05 | %+ | 1.05 | % | 1.05 | % | 1.05 | % | |||||||||||||
| Ratio of Net Investment Income to Average Net Assets(1) | 2.32 | %+ | 1.52 | %+ | 1.61 | % | 1.69 | % | 1.03 | % | |||||||||||||
| Portfolio Turnover Rate | 34 | % | 28 | % | 16 | % | 24 | % | 24 | % | |||||||||||||
| (1)Supplemental Information on the Ratios to Average Net Assets: | |||||||||||||||||||||||
| Ratios before expense limitation: | |||||||||||||||||||||||
| Expenses to Average Net Assets | 1.07 | %+ | 1.06 | %+ | 1.07 | % | 1.08 | % | 1.16 | % | |||||||||||||
| Net Investment Income to Average Net Assets | 2.29 | %+ | 1.51 | %+ | 1.59 | % | 1.66 | % | 0.92 | % | |||||||||||||
† Per share amount is based on average shares outstanding.
‡ Amount is less than $0.005 per share.
++ Calculated based on the net asset value as of the last business day of the period.
+ Reflects rebate of certain Portfolio expenses in connection with the investments in Morgan Stanley Institutional Liquidity Money Market Portfolio—Institutional Class during the period. As a result of such rebate, the expenses as a percentage of its net assets were effected by approximately 0.01% and less than 0.005% for the years ended December 31, 2008 and December 31, 2007, respectively.
31
Emerging Markets Portfolio
| Year Ended December 31, | |||||||||||||||||||||||
| Class I | 2008 | 2007 | 2006 | 2005 | 2004 | ||||||||||||||||||
| Selected Per Share Data and Ratios | |||||||||||||||||||||||
| Net Asset Value, Beginning of Period | $ | 34.02 | $ | 29.29 | $ | 25.36 | $ | 19.10 | $ | 15.52 | |||||||||||||
| Income (Loss) from Investment Operations | |||||||||||||||||||||||
| Net Investment Income† | 0.19 | 0.10 | 0.18 | 0.25 | 0.19 | ||||||||||||||||||
| Net Realized and Unrealized Gain (Loss) on Investments | (18.78 | ) | 11.76 | 9.22 | 6.36 | 3.54 | |||||||||||||||||
| Total from Investment Operations | (18.59 | ) | 11.86 | 9.40 | 6.61 | 3.73 | |||||||||||||||||
| Distributions from and/or in Excess of | |||||||||||||||||||||||
| Net Investment Income | – | (0.13 | ) | (0.29 | ) | (0.35 | ) | (0.15 | ) | ||||||||||||||
| Net Realized Gain | (1.64 | ) | (7.01 | ) | (5.18 | ) | – | – | |||||||||||||||
| Total Distributions | (1.64 | ) | (7.14 | ) | (5.47 | ) | (0.35 | ) | (0.15 | ) | |||||||||||||
| Redemption Fees | 0.00 | ‡ | 0.01 | 0.00 | ‡ | 0.00 | ‡ | 0.00 | ‡ | ||||||||||||||
| Net Asset Value, End of Period | $ | 13.79 | $ | 34.02 | $ | 29.29 | $ | 25.36 | $ | 19.10 | |||||||||||||
| Total Return++ | (56.39 | )% | 41.56 | % | 38.00 | % | 34.54 | % | 24.09 | % | |||||||||||||
| Ratios and Supplemental Data: | |||||||||||||||||||||||
| Net Assets, End of Period (Thousands) | $ | 1,191,199 | $ | 3,323,130 | $ | 2,283,535 | $ | 1,749,671 | $ | 1,249,299 | |||||||||||||
| Ratio of Expenses to Average Net Assets | 1.43 | %+ | 1.35 | %+ | 1.40 | % | 1.41 | % | 1.52 | %^^ | |||||||||||||
| Ratio of Expenses to Average Net Assets Excluding Non Operating Expenses | 1.43 | %+ | 1.35 | %+ | 1.40 | % | 1.41 | % | 1.52 | % | |||||||||||||
| Ratio of Net Investment Income to Average Net Assets | 0.78 | %+ | 0.28 | %+ | 0.62 | % | 1.17 | % | 1.09 | % | |||||||||||||
| Portfolio Turnover Rate | 96 | % | 101 | % | 82 | % | 59 | % | 73 | % | |||||||||||||
† Per share amount is based on average shares outstanding.
‡ Amount is less than $0.005 per share.
++ Calculated based on the net asset value as of the last business day of the period.
+ Reflects rebate of certain Portfolio expenses in connection with the investments in Morgan Stanley Institutional Liquidity Money Market Portfolio—Institutional Class during the period. As a result of such rebate, the expenses as a percentage of its net assets were effected by less than 0.005%.
^^ Effective November 1, 2004, the Adviser has voluntarily agreed to limit the ratio of expenses to average net assets to the maximum ratio of 1.65% for Class I shares. Prior to November 1, 2004, the maximum ratio was 1.75% for Class I shares.
32
Morgan Stanley Institutional Fund, Inc. Prospectus
Financial Highlights
Emerging Markets Portfolio
| Year Ended December 31, | |||||||||||||||||||||||
| Class P | 2008 | 2007 | 2006 | 2005 | 2004 | ||||||||||||||||||
| Selected Per Share Data and Ratios | |||||||||||||||||||||||
| Net Asset Value, Beginning of Period | $ | 33.46 | $ | 28.91 | $ | 25.07 | $ | 18.90 | $ | 15.36 | |||||||||||||
| Income (Loss) from Investment Operations | |||||||||||||||||||||||
| Net Investment Income† | 0.13 | 0.01 | 0.13 | 0.19 | 0.15 | ||||||||||||||||||
| Net Realized and Unrealized Gain (Loss) on Investments | (18.44 | ) | 11.60 | 9.09 | 6.26 | 3.49 | |||||||||||||||||
| Total from Investment Operations | (18.31 | ) | 11.61 | 9.22 | 6.45 | 3.64 | |||||||||||||||||
| Distributions from and/or in Excess of | |||||||||||||||||||||||
| Net Investment Income | – | (0.05 | ) | (0.20 | ) | (0.29 | ) | (0.11 | ) | ||||||||||||||
| Net Realized Gain | (1.64 | ) | (7.01 | ) | (5.18 | ) | – | – | |||||||||||||||
| Total Distributions | (1.64 | ) | (7.06 | ) | (5.38 | ) | (0.29 | ) | (0.11 | ) | |||||||||||||
| Redemption Fees | 0.00 | ‡ | 0.00 | ‡ | 0.00 | ‡ | 0.01 | 0.01 | |||||||||||||||
| Net Asset Value, End of Period | $ | 13.51 | $ | 33.46 | $ | 28.91 | $ | 25.07 | $ | 18.90 | |||||||||||||
| Total Return++ | (56.50 | )% | 41.20 | % | 37.65 | % | 34.17 | % | 23.84 | % | |||||||||||||
| Ratios and Supplemental Data: | |||||||||||||||||||||||
| Net Assets, End of Period (Thousands) | $ | 67,559 | $ | 179,834 | $ | 126,450 | $ | 103,482 | $ | 71,254 | |||||||||||||
| Ratio of Expenses to Average Net Assets | 1.68 | %+ | 1.60 | %+ | 1.65 | % | 1.66 | % | 1.77 | %^^ | |||||||||||||
| Ratio of Expenses to Average Net Assets Excluding Non Operating Expenses | 1.68 | %+ | 1.60 | %+ | 1.65 | % | 1.66 | % | 1.77 | % | |||||||||||||
| Ratio of Net Investment Income to Average Net Assets | 0.52 | %+ | 0.02 | %+ | 0.47 | % | 0.90 | % | 0.89 | % | |||||||||||||
| Portfolio Turnover Rate | 96 | % | 101 | % | 82 | % | 59 | % | 73 | % | |||||||||||||
† Per share amount is based on average shares outstanding.
‡ Amount is less than $0.005 per share.
++ Calculated based on the net asset value as of the last business day of the period.
+ Reflects rebate of certain Portfolio expenses in connection with the investments in Morgan Stanley Institutional Liquidity Money Market Portfolio—Institutional Class during the period. As a result of such rebate, the expenses as a percentage of its net assets were effected by less than 0.005%.
^^ Effective November 1, 2004, the Adviser has voluntarily agreed to limit the ratio of expenses to average net assets to the maximum ratio of 1.90% for Class P shares. Prior to November 1, 2004, the maximum ratio was 2.00% for Class P shares.
33
Global Franchise Portfolio
| Year Ended December 31, | |||||||||||||||||||||||
| Class I | 2008 | 2007 | 2006 | 2005 | 2004 | ||||||||||||||||||
| Selected Per Share Data and Ratios | |||||||||||||||||||||||
| Net Asset Value, Beginning of Period | $ | 16.62 | $ | 17.98 | $ | 15.69 | $ | 15.12 | $ | 14.29 | |||||||||||||
| Income (Loss) from Investment Operations | |||||||||||||||||||||||
| Net Investment Income† | 0.35 | 0.40 | 0.30 | 0.26 | 0.27 | ||||||||||||||||||
| Net Realized and Unrealized Gain (Loss) on Investments | (5.11 | ) | 1.30 | 3.07 | 1.52 | 1.66 | |||||||||||||||||
| Total from Investment Operations | (4.76 | ) | 1.70 | 3.37 | 1.78 | 1.93 | |||||||||||||||||
| Distributions from and/or in Excess of | |||||||||||||||||||||||
| Net Investment Income | (0.84 | ) | (0.15 | ) | (0.13 | ) | (0.31 | ) | – | ||||||||||||||
| Net Realized Gain | (0.20 | ) | (2.91 | ) | (0.95 | ) | (0.90 | ) | (1.13 | ) | |||||||||||||
| Total Distributions | (1.04 | ) | (3.06 | ) | (1.08 | ) | (1.21 | ) | (1.13 | ) | |||||||||||||
| Redemption Fees | – | – | 0.00 | ‡ | 0.00 | ‡ | 0.03 | ||||||||||||||||
| Net Asset Value, End of Period | $ | 10.82 | $ | 16.62 | $ | 17.98 | $ | 15.69 | $ | 15.12 | |||||||||||||
| Total Return++ | (28.88 | )% | 9.58 | % | 21.60 | % | 11.91 | % | 13.77 | % | |||||||||||||
| Ratios and Supplemental Data: | |||||||||||||||||||||||
| Net Assets, End of Period (Thousands) | $ | 78,029 | $ | 110,135 | $ | 128,434 | $ | 85,018 | $ | 58,223 | |||||||||||||
| Ratio of Expenses to Average Net Assets(1) | 1.00 | %+ | 0.99 | %+ | 1.00 | % | 1.00 | % | 1.00 | % | |||||||||||||
| Ratio of Expenses to Average Net Assets Excluding Non Operating Expenses | 1.00 | %+ | 0.98 | %+ | 1.00 | % | 1.00 | % | N/A | ||||||||||||||
| Ratio of Net Investment Income to Average Net Assets(1) | 2.49 | %+ | 2.10 | %+ | 1.74 | % | 1.67 | % | 1.82 | % | |||||||||||||
| Portfolio Turnover Rate | 31 | % | 22 | % | 35 | % | 19 | % | 21 | % | |||||||||||||
| (1)Supplemental Information on the Ratios to Average Net Assets: | |||||||||||||||||||||||
| Ratios before expense limitation: | |||||||||||||||||||||||
| Expenses to Average Net Assets | 1.01 | %+ | N/A | 1.01 | % | 1.07 | % | 1.16 | % | ||||||||||||||
| Net Investment Income to Average Net Assets | 2.48 | %+ | N/A | 1.73 | % | 1.60 | % | 1.66 | % | ||||||||||||||
† Per share amount is based on average shares outstanding.
‡ Amount is less than $0.005 per share.
++ Calculated based on the net asset value as of the last business day of the period.
+ Reflects rebate of certain Portfolio expenses in connection with the investments in Morgan Stanley Institutional Liquidity Money Market Portfolio—Institutional Class during the period. As a result of such rebate, the expenses as a percentage of its net assets were effected by approximately 0.01% and less than 0.005% for the years ended December 31, 2008 and December 31, 2007, respectively.
34
Morgan Stanley Institutional Fund, Inc. Prospectus
Financial Highlights
Global Franchise Portfolio
| Year Ended December 31, | |||||||||||||||||||||||
| Class P | 2008 | 2007 | 2006 | 2005 | 2004 | ||||||||||||||||||
| Selected Per Share Data and Ratios | |||||||||||||||||||||||
| Net Asset Value, Beginning of Period | $ | 16.44 | $ | 17.82 | $ | 15.56 | $ | 15.01 | $ | 14.22 | |||||||||||||
| Income (Loss) from Investment Operations | |||||||||||||||||||||||
| Net Investment Income† | 0.34 | 0.30 | 0.24 | 0.24 | 0.22 | ||||||||||||||||||
| Net Realized and Unrealized Gain (Loss) on Investments | (5.07 | ) | 1.34 | 3.04 | 1.48 | 1.69 | |||||||||||||||||
| Total from Investment Operations | (4.73 | ) | 1.64 | 3.28 | 1.72 | 1.91 | |||||||||||||||||
| Distributions from and/or in Excess of | |||||||||||||||||||||||
| Net Investment Income | (0.80 | ) | (0.11 | ) | (0.07 | ) | (0.27 | ) | – | ||||||||||||||
| Net Realized Gain | (0.20 | ) | (2.91 | ) | (0.95 | ) | (0.90 | ) | (1.13 | ) | |||||||||||||
| Total Distributions | (1.00 | ) | (3.02 | ) | (1.02 | ) | (1.17 | ) | (1.13 | ) | |||||||||||||
| Redemption Fees | – | – | 0.00 | ‡ | – | 0.01 | |||||||||||||||||
| Net Asset Value, End of Period | $ | 10.71 | $ | 16.44 | $ | 17.82 | $ | 15.56 | $ | 15.01 | |||||||||||||
| Total Return++ | (29.00 | )% | 9.26 | % | 21.31 | % | 11.53 | % | 13.56 | % | |||||||||||||
| Ratios and Supplemental Data: | |||||||||||||||||||||||
| Net Assets, End of Period (Thousands) | $ | 2,892 | $ | 6,327 | $ | 4,135 | $ | 4,401 | $ | 3,941 | |||||||||||||
| Ratio of Expenses to Average Net Assets(1) | 1.25 | %+ | 1.24 | %+ | 1.25 | % | 1.25 | % | 1.25 | % | |||||||||||||
| Ratio of Expenses to Average Net Assets Excluding Non Operating Expenses | 1.25 | %+ | 1.23 | %+ | 1.25 | % | 1.25 | % | N/A | ||||||||||||||
| Ratio of Net Investment Income to Average Net Assets(1) | 2.43 | %+ | 1.62 | %+ | 1.43 | % | 1.52 | % | 1.47 | % | |||||||||||||
| Portfolio Turnover Rate | 31 | % | 22 | % | 35 | % | 19 | % | 21 | % | |||||||||||||
| (1)Supplemental Information on the Ratios to Average Net Assets: | |||||||||||||||||||||||
| Ratios before expense limitation: | |||||||||||||||||||||||
| Expenses to Average Net Assets | 1.26 | %+ | N/A | 1.26 | % | 1.32 | % | 1.41 | % | ||||||||||||||
| Net Investment Income to Average Net Assets | 2.42 | %+ | N/A | 1.42 | % | 1.45 | % | 1.31 | % | ||||||||||||||
† Per share amount is based on average shares outstanding.
‡ Amount is less than $0.005 per share.
++ Calculated based on the net asset value as of the last business day of the period.
+ Reflects rebate of certain Portfolio expenses in connection with the investments in Morgan Stanley Institutional Liquidity Money Market Portfolio—Institutional Class during the period. As a result of such rebate, the expenses as a percentage of its net assets were effected by approximately 0.01% and less than 0.005% for the years ended December 31, 2008 and December 31, 2007, respectively.
35
Global Value Equity Portfolio
| Year Ended December 31, | |||||||||||||||||||||||
| Class I | 2008 | 2007 | 2006 | 2005 | 2004 | ||||||||||||||||||
| Selected Per Share Data and Ratios | |||||||||||||||||||||||
| Net Asset Value, Beginning of Period | $ | 17.70 | $ | 20.24 | $ | 17.85 | $ | 17.81 | $ | 15.84 | |||||||||||||
| Income (Loss) from Investment Operations | |||||||||||||||||||||||
| Net Investment Income† | 0.40 | 0.33 | 0.33 | 0.31 | 0.22 | ||||||||||||||||||
| Net Realized and Unrealized Gain (Loss) on Investments | (7.74 | ) | 0.96 | 3.44 | 0.72 | 2.02 | |||||||||||||||||
| Total from Investment Operations | (7.34 | ) | 1.29 | 3.77 | 1.03 | 2.24 | |||||||||||||||||
| Distributions from and/or in Excess of | |||||||||||||||||||||||
| Net Investment Income | (0.66 | ) | (0.34 | ) | (0.34 | ) | (0.31 | ) | (0.22 | ) | |||||||||||||
| Net Realized Gain | (0.21 | ) | (3.49 | ) | (1.05 | ) | (0.68 | ) | (0.05 | ) | |||||||||||||
| Total Distributions | (0.87 | ) | (3.83 | ) | (1.39 | ) | (0.99 | ) | (0.27 | ) | |||||||||||||
| Redemption Fees | 0.00 | ‡ | 0.00 | ‡ | 0.01 | 0.00 | ‡ | 0.00 | ‡ | ||||||||||||||
| Net Asset Value, End of Period | $ | 9.49 | $ | 17.70 | $ | 20.24 | $ | 17.85 | $ | 17.81 | |||||||||||||
| Total Return++ | (41.82 | )% | 6.65 | % | 21.40 | % | 5.81 | % | 14.13 | % | |||||||||||||
| Ratios and Supplemental Data: | |||||||||||||||||||||||
| Net Assets, End of Period (Thousands) | $ | 24,110 | $ | 66,035 | $ | 101,163 | $ | 86,000 | $ | 68,505 | |||||||||||||
| Ratio of Expenses to Average Net Assets(1) | 1.00 | %+ | 0.90 | %+ | 0.91 | % | 0.90 | % | 1.00 | % | |||||||||||||
| Ratio of Expenses to Average Net Assets Excluding Non Operating Expenses | 1.00 | %+ | 0.90 | %+ | N/A | N/A | 1.00 | % | |||||||||||||||
| Ratio of Net Investment Income to Average Net Assets(1) | 2.82 | %+ | 1.58 | %+ | 1.71 | % | 1.74 | % | 1.31 | % | |||||||||||||
| Portfolio Turnover Rate | 86 | % | 31 | % | 29 | % | 29 | % | 30 | % | |||||||||||||
| (1)Supplemental Information on the Ratios to Average Net Assets: | |||||||||||||||||||||||
| Ratios before expense limitation: | |||||||||||||||||||||||
| Expenses to Average Net Assets | 1.02 | %+ | N/A | N/A | N/A | 1.07 | % | ||||||||||||||||
| Net Investment Income to Average Net Assets | 2.80 | %+ | N/A | N/A | N/A | 1.24 | % | ||||||||||||||||
† Per share amount is based on average shares outstanding.
‡ Amount is less than $0.005 per share.
++ Calculated based on the net asset value as of the last business day of the period.
+ Reflects rebate of certain Portfolio expenses in connection with the investments in Morgan Stanley Institutional Liquidity Money Market Portfolio—Institutional Class during the period. As a result of such rebate, the expenses as a percentage of its net assets were effected by less than 0.005%.
36
Morgan Stanley Institutional Fund, Inc. Prospectus
Financial Highlights
Global Value Equity Portfolio
| Year Ended December 31, | |||||||||||||||||||||||
| Class P | 2008 | 2007 | 2006 | 2005 | 2004 | ||||||||||||||||||
| Selected Per Share Data and Ratios | |||||||||||||||||||||||
| Net Asset Value, Beginning of Period | $ | 17.48 | $ | 20.03 | $ | 17.69 | $ | 17.64 | $ | 15.70 | |||||||||||||
| Income (Loss) from Investment Operations | |||||||||||||||||||||||
| Net Investment Income† | 0.38 | 0.29 | 0.28 | 0.27 | 0.17 | ||||||||||||||||||
| Net Realized and Unrealized Gain (Loss) on Investments | (7.66 | ) | 0.93 | 3.40 | 0.71 | 2.00 | |||||||||||||||||
| Total from Investment Operations | (7.28 | ) | 1.22 | 3.68 | 0.98 | 2.17 | |||||||||||||||||
| Distributions from and/or in Excess of | |||||||||||||||||||||||
| Net Investment Income | (0.62 | ) | (0.28 | ) | (0.29 | ) | (0.25 | ) | (0.18 | ) | |||||||||||||
| Net Realized Gain | (0.21 | ) | (3.49 | ) | (1.05 | ) | (0.68 | ) | (0.05 | ) | |||||||||||||
| Total Distributions | (0.83 | ) | (3.77 | ) | (1.34 | ) | (0.93 | ) | (0.23 | ) | |||||||||||||
| Redemption Fees | 0.00 | ‡ | 0.00 | ‡ | 0.00 | ‡ | 0.00 | ‡ | 0.00 | ‡ | |||||||||||||
| Net Asset Value, End of Period | $ | 9.37 | $ | 17.48 | $ | 20.03 | $ | 17.69 | $ | 17.64 | |||||||||||||
| Total Return++ | (41.98 | )% | 6.37 | % | 21.05 | % | 5.59 | % | 13.78 | % | |||||||||||||
| Ratios and Supplemental Data: | |||||||||||||||||||||||
| Net Assets, End of Period (Thousands) | $ | 11,888 | $ | 24,199 | $ | 27,773 | $ | 21,938 | $ | 30,598 | |||||||||||||
| Ratio of Expenses to Average Net Assets(1) | 1.25 | %+ | 1.15 | %+ | 1.16 | % | 1.15 | % | 1.25 | % | |||||||||||||
| Ratio of Expenses to Average Net Assets Excluding Non Operating Expenses | 1.25 | %+ | 1.15 | %+ | N/A | N/A | 1.25 | % | |||||||||||||||
| Ratio of Net Investment Income to Average Net Assets(1) | 2.65 | %+ | 1.36 | %+ | 1.47 | % | 1.53 | % | 1.07 | % | |||||||||||||
| Portfolio Turnover Rate | 86 | % | 31 | % | 29 | % | 29 | % | 30 | % | |||||||||||||
| (1)Supplemental Information on the Ratios to Average Net Assets: | |||||||||||||||||||||||
| Ratios before expense limitation: | |||||||||||||||||||||||
| Expenses to Average Net Assets | 1.27 | %+ | N/A | N/A | N/A | 1.32 | % | ||||||||||||||||
| Net Investment Income to Average Net Assets | 2.63 | %+ | N/A | N/A | N/A | 0.99 | % | ||||||||||||||||
† Per share amount is based on average shares outstanding.
‡ Amount is less than $0.005 per share.
++ Calculated based on the net asset value as of the last business day of the period.
+ Reflects rebate of certain Portfolio expenses in connection with the investments in Morgan Stanley Institutional Liquidity Money Market Portfolio—Institutional Class during the period. As a result of such rebate, the expenses as a percentage of its net assets were effected by less than 0.005%.
37
International Equity Portfolio
| Year Ended December 31, | |||||||||||||||||||||||
| Class I | 2008 | 2007 | 2006 | 2005 | 2004 | ||||||||||||||||||
| Selected Per Share Data and Ratios | |||||||||||||||||||||||
| Net Asset Value, Beginning of Period | $ | 18.92 | $ | 20.58 | $ | 20.34 | $ | 20.99 | $ | 19.06 | |||||||||||||
| Income (Loss) from Investment Operations | |||||||||||||||||||||||
| Net Investment Income† | 0.44 | 0.43 | 0.64 | 0.43 | 0.30 | ||||||||||||||||||
| Net Realized and Unrealized Gain (Loss) on Investments | (6.76 | ) | 1.53 | 3.93 | 0.93 | 3.50 | |||||||||||||||||
| Total from Investment Operations | (6.32 | ) | 1.96 | 4.57 | 1.36 | 3.80 | |||||||||||||||||
| Distributions from and/or in Excess of | |||||||||||||||||||||||
| Net Investment Income | (0.41 | ) | (0.46 | ) | (0.59 | ) | (0.35 | ) | (0.37 | ) | |||||||||||||
| Net Realized Gain | (1.18 | ) | (3.16 | ) | (3.74 | ) | (1.66 | ) | (1.50 | ) | |||||||||||||
| Total Distributions | (1.59 | ) | (3.62 | ) | (4.33 | ) | (2.01 | ) | (1.87 | ) | |||||||||||||
| Redemption Fees | 0.00 | ‡ | 0.00 | ‡ | 0.00 | ‡ | 0.00 | ‡ | 0.00 | ‡ | |||||||||||||
| Net Asset Value, End of Period | $ | 11.01 | $ | 18.92 | $ | 20.58 | $ | 20.34 | $ | 20.99 | |||||||||||||
| Total Return++ | (33.12 | )% | 9.84 | % | 22.50 | % | 6.45 | % | 19.96 | % | |||||||||||||
| Ratios and Supplemental Data: | |||||||||||||||||||||||
| Net Assets, End of Period (Thousands) | $ | 2,606,704 | $ | 5,105,807 | $ | 5,900,906 | $ | 6,704,732 | $ | 7,200,606 | |||||||||||||
| Ratio of Expenses to Average Net Assets | 0.95 | %+ | 0.93 | %+ | 0.94 | % | 0.93 | % | 0.98 | % | |||||||||||||
| Ratio of Expenses to Average Net Assets Excluding Non Operating Expenses | 0.95 | %+ | 0.93 | %+ | 0.94 | % | 0.93 | % | N/A | ||||||||||||||
| Ratio of Net Investment Income to Average Net Assets | 2.73 | %+ | 1.97 | %+ | 2.88 | % | 2.04 | % | 1.48 | % | |||||||||||||
| Portfolio Turnover Rate | 34 | % | 31 | % | 38 | % | 28 | % | 41 | % | |||||||||||||
† Per share amount is based on average shares outstanding.
‡ Amount is less than $0.005 per share.
++ Calculated based on the net asset value as of the last business day of the period.
+ Reflects rebate of certain Portfolio expenses in connection with the investments in Morgan Stanley Institutional Liquidity Money Market Portfolio—Institutional Class during the period. As a result of such rebate, the expenses as a percentage of its net assets were effected by less than 0.005%.
38
Morgan Stanley Institutional Fund, Inc. Prospectus
Financial Highlights
International Equity Portfolio
| Year Ended December 31, | |||||||||||||||||||||||
| Class P | 2008 | 2007 | 2006 | 2005 | 2004 | ||||||||||||||||||
| Selected Per Share Data and Ratios | |||||||||||||||||||||||
| Net Asset Value, Beginning of Period | $ | 18.73 | $ | 20.40 | $ | 20.19 | $ | 20.85 | $ | 18.96 | |||||||||||||
| Income (Loss) from Investment Operations | |||||||||||||||||||||||
| Net Investment Income† | 0.38 | 0.37 | 0.60 | 0.37 | 0.24 | ||||||||||||||||||
| Net Realized and Unrealized Gain (Loss) on Investments | (6.66 | ) | 1.52 | 3.87 | 0.93 | 3.47 | |||||||||||||||||
| Total from Investment Operations | (6.28 | ) | 1.89 | 4.47 | 1.30 | 3.71 | |||||||||||||||||
| Distributions from and/or in Excess of | |||||||||||||||||||||||
| Net Investment Income | (0.37 | ) | (0.40 | ) | (0.52 | ) | (0.30 | ) | (0.32 | ) | |||||||||||||
| Net Realized Gain | (1.18 | ) | (3.16 | ) | (3.74 | ) | (1.66 | ) | (1.50 | ) | |||||||||||||
| Total Distributions | (1.55 | ) | (3.56 | ) | (4.26 | ) | (1.96 | ) | (1.82 | ) | |||||||||||||
| Redemption Fees | 0.00 | ‡ | 0.00 | ‡ | 0.00 | ‡ | 0.00 | ‡ | 0.00 | ‡ | |||||||||||||
| Net Asset Value, End of Period | $ | 10.90 | $ | 18.73 | $ | 20.40 | $ | 20.19 | $ | 20.85 | |||||||||||||
| Total Return++ | (33.21 | )% | 9.52 | % | 22.21 | % | 6.20 | % | 19.67 | % | |||||||||||||
| Ratios and Supplemental Data: | |||||||||||||||||||||||
| Net Assets, End of Period (Thousands) | $ | 687,196 | $ | 1,019,595 | $ | 1,152,822 | $ | 1,206,125 | $ | 1,073,278 | |||||||||||||
| Ratio of Expenses to Average Net Assets | 1.20 | %+ | 1.18 | %+ | 1.19 | % | 1.18 | % | 1.23 | % | |||||||||||||
| Ratio of Expenses to Average Net Assets Excluding Non Operating Expenses | 1.20 | %+ | 1.18 | %+ | 1.19 | % | 1.18 | % | N/A | ||||||||||||||
| Ratio of Net Investment Income to Average Net Assets | 2.43 | %+ | 1.71 | %+ | 2.71 | % | 1.77 | % | 1.21 | % | |||||||||||||
| Portfolio Turnover Rate | 34 | % | 31 | % | 38 | % | 28 | % | 41 | % | |||||||||||||
† Per share amount is based on average shares outstanding.
‡ Amount is less than $0.005 per share.
++ Calculated based on the net asset value as of the last business day of the period.
+ Reflects rebate of certain Portfolio expenses in connection with the investments in Morgan Stanley Institutional Liquidity Money Market Portfolio—Institutional Class during the period. As a result of such rebate, the expenses as a percentage of its net assets were effected by less than 0.005%.
39
International Growth Equity Portfolio
Year Ended December 31, | Period from December 27, 2005^ to December 31, | ||||||||||||||||||
| Class I | 2008 | 2007 | 2006 | 2005 | |||||||||||||||
| Selected Per Share Data and Ratios | |||||||||||||||||||
| Net Asset Value, Beginning of Period | $ | 13.76 | $ | 12.55 | $ | 9.93 | $ | 10.00 | |||||||||||
| Income (Loss) from Investment Operations | |||||||||||||||||||
| Net Investment Income† | 0.31 | 0.13 | 0.10 | (0.00 | )‡ | ||||||||||||||
| Net Realized and Unrealized Gain (Loss) on Investments | (6.98 | ) | 1.75 | 2.67 | (0.07 | ) | |||||||||||||
| Total from Investment Operations | (6.67 | ) | 1.88 | 2.77 | (0.07 | ) | |||||||||||||
| Distributions from and/or in Excess of | |||||||||||||||||||
| Net Investment Income | (0.32 | ) | (0.12 | ) | (0.09 | ) | – | ||||||||||||
| Net Realized Gain | (0.05 | ) | (0.55 | ) | (0.06 | ) | – | ||||||||||||
| Total Distributions | (0.37 | ) | (0.67 | ) | (0.15 | ) | – | ||||||||||||
| Net Asset Value, End of Period | $ | 6.72 | $ | 13.76 | $ | 12.55 | $ | 9.93 | |||||||||||
| Total Return++ | (48.70 | )% | 15.22 | % | 27.92 | % | (0.70 | )%# | |||||||||||
| Ratios and Supplemental Data: | |||||||||||||||||||
| Net Assets, End of Period (Thousands) | $ | 40,756 | $ | 22,523 | $ | 6,753 | $ | 4,864 | |||||||||||
| Ratio of Expenses to Average Net Assets(1) | 1.00 | %+ | 1.00 | %+ | 1.01 | % | 1.00 | %* | |||||||||||
| Ratio of Expenses to Average Net Assets Excluding Non Operating Expenses | 1.00 | %+ | 1.00 | %+ | 1.00 | % | N/A | ||||||||||||
| Ratio of Net Investment Income (Loss) to Average Net Assets(1) | 2.86 | %+ | 0.94 | %+ | 0.89 | % | (0.86 | )%* | |||||||||||
| Portfolio Turnover Rate | 49 | % | 32 | % | 24 | % | 4 | %# | |||||||||||
| (1)Supplemental Information on the Ratios to Average Net Assets: | |||||||||||||||||||
| Ratios before expense limitation: | |||||||||||||||||||
| Expenses to Average Net Assets | 1.11 | %+ | 2.42 | %+ | 2.74 | % | 31.60 | %* | |||||||||||
| Net Investment Income (Loss) to Average Net Assets | 2.75 | %+ | (0.48 | )%+ | (0.84 | )% | (31.46 | )%* | |||||||||||
^ Commencement of Operations.
† Per share amount is based on average shares outstanding.
‡ Amount is less than $0.005 per share.
++ Calculated based on the net asset value as of the last business day of the period.
# Not Annualized.
+ Reflects rebate of certain Portfolio expenses in connection with the investments in Morgan Stanley Institutional Liquidity Money Market Portfolio—Institutional Class during the period. As a result of such rebate, the expenses as a percentage of its net assets were effected by less than 0.005%.
* Annualized.
40
Morgan Stanley Institutional Fund, Inc. Prospectus
Financial Highlights
International Growth Equity Portfolio
Year Ended December 31, | Period from December 27, 2005^ to December 31, | ||||||||||||||||||
| Class P | 2008 | 2007 | 2006 | 2005 | |||||||||||||||
| Selected Per Share Data and Ratios | |||||||||||||||||||
| Net Asset Value, Beginning of Period | $ | 13.78 | $ | 12.56 | $ | 9.93 | $ | 10.00 | |||||||||||
| Income (Loss) from Investment Operations | |||||||||||||||||||
| Net Investment Income† | 0.30 | 0.10 | 0.09 | 0.00 | ‡ | ||||||||||||||
| Net Realized and Unrealized Gain (Loss) on Investments | (7.00 | ) | 1.76 | 2.64 | (0.07 | ) | |||||||||||||
| Total from Investment Operations | (6.70 | ) | 1.86 | 2.73 | (0.07 | ) | |||||||||||||
| Distributions from and/or in Excess of | |||||||||||||||||||
| Net Investment Income | (0.29 | ) | (0.09 | ) | (0.04 | ) | – | ||||||||||||
| Net Realized Gain | (0.05 | ) | (0.55 | ) | (0.06 | ) | – | ||||||||||||
| Total Distributions | (0.34 | ) | (0.64 | ) | (0.10 | ) | – | ||||||||||||
| Net Asset Value, End of Period | $ | 6.74 | $ | 13.78 | $ | 12.56 | $ | 9.93 | |||||||||||
| Total Return++ | (48.82 | )% | 15.03 | % | 27.49 | % | (0.70 | )%# | |||||||||||
| Ratios and Supplemental Data: | |||||||||||||||||||
| Net Assets, End of Period (Thousands) | $ | 237 | $ | 531 | $ | 325 | $ | 99 | |||||||||||
| Ratio of Expenses to Average Net Assets(1) | 1.25 | %+ | 1.25 | %+ | 1.27 | % | 1.25 | %* | |||||||||||
| Ratio of Expenses to Average Net Assets Excluding Non Operating Expenses | 1.25 | %+ | 1.25 | %+ | 1.25 | % | N/A | ||||||||||||
| Ratio of Net Investment Income (Loss) to Average Net Assets(1) | 2.72 | %+ | 0.70 | %+ | 0.78 | % | (1.16 | )%* | |||||||||||
| Portfolio Turnover Rate | 49 | % | 32 | % | 24 | % | 4 | %# | |||||||||||
| (1)Supplemental Information on the Ratios to Average Net Assets: | |||||||||||||||||||
| Ratios before expense limitation: | |||||||||||||||||||
| Expenses to Average Net Assets | 1.36 | %+ | 2.67 | %+ | 3.07 | % | 31.85 | %* | |||||||||||
| Net Investment Income (Loss) to Average Net Assets | 2.61 | %+ | (0.72 | )%+ | (1.02 | )% | (31.76 | )%* | |||||||||||
^ Commencement of Operations.
† Per share amount is based on average shares outstanding.
‡ Amount is less than $0.005 per share.
++ Calculated based on the net asset value as of the last business day of the period.
# Not Annualized.
+ Reflects rebate of certain Portfolio expenses in connection with the investments in Morgan Stanley Institutional Liquidity Money Market Portfolio—Institutional Class during the period. As a result of such rebate, the expenses as a percentage of its net assets were effected by less than 0.005%.
* Annualized.
41
International Small Cap Portfolio
| Year Ended December 31, | |||||||||||||||||||||||
| Class I | 2008 | 2007 | 2006 | 2005 | 2004 | ||||||||||||||||||
| Selected Per Share Data and Ratios | |||||||||||||||||||||||
| Net Asset Value, Beginning of Period | $ | 17.08 | $ | 23.72 | $ | 24.14 | $ | 25.11 | $ | 20.52 | |||||||||||||
| Income (Loss) from Investment Operations | |||||||||||||||||||||||
| Net Investment Income† | 0.34 | 0.27 | 0.32 | 0.32 | 0.24 | ||||||||||||||||||
| Net Realized and Unrealized Gain (Loss) on Investments | (6.66 | ) | (1.11 | ) | 4.27 | 2.89 | 6.59 | ||||||||||||||||
| Total from Investment Operations | (6.32 | ) | (0.84 | ) | 4.59 | 3.21 | 6.83 | ||||||||||||||||
| Distributions from and/or in Excess of | |||||||||||||||||||||||
| Net Investment Income | (0.41 | ) | (0.27 | ) | (0.41 | ) | (0.47 | ) | (0.35 | ) | |||||||||||||
| Net Realized Gain | (0.82 | ) | (5.53 | ) | (4.60 | ) | (3.71 | ) | (1.89 | ) | |||||||||||||
| Total Distributions | (1.23 | ) | (5.80 | ) | (5.01 | ) | (4.18 | ) | (2.24 | ) | |||||||||||||
| Redemption Fees | 0.00 | ‡ | 0.00 | ‡ | 0.00 | ‡ | 0.00 | ‡ | 0.00 | ‡ | |||||||||||||
| Net Asset Value, End of Period | $ | 9.53 | $ | 17.08 | $ | 23.72 | $ | 24.14 | $ | 25.11 | |||||||||||||
| Total Return++ | (38.33 | )% | (3.22 | )% | 19.61 | % | 13.07 | % | 33.53 | % | |||||||||||||
| Ratios and Supplemental Data: | |||||||||||||||||||||||
| Net Assets, End of Period (Thousands) | $ | 316,526 | $ | 796,050 | $ | 1,312,064 | $ | 1,389,078 | $ | 1,276,083 | |||||||||||||
| Ratio of Expenses to Average Net Assets(1) | 1.13 | %+ | 1.09 | %+ | 1.10 | % | 1.10 | % | 1.15 | % | |||||||||||||
| Ratio of Expenses to Average Net Assets Excluding Non Operating Expenses | 1.12 | %+ | 1.09 | %+ | 1.10 | % | 1.10 | % | 1.15 | % | |||||||||||||
| Ratio of Net Investment Income to Average Net Assets(1) | 2.47 | %+ | 1.10 | %+ | 1.25 | % | 1.22 | % | 1.04 | % | |||||||||||||
| Portfolio Turnover Rate | 49 | % | 53 | % | 40 | % | 47 | % | 38 | % | |||||||||||||
| (1)Supplemental Information on the Ratios to Average Net Assets: | |||||||||||||||||||||||
| Ratios before expense limitation: | |||||||||||||||||||||||
| Expenses to Average Net Assets | 1.15 | %+ | N/A | N/A | N/A | 1.16 | % | ||||||||||||||||
| Net Investment Income to Average Net Assets | 2.44 | %+ | N/A | N/A | N/A | 1.03 | % | ||||||||||||||||
† Per share amount is based on average shares outstanding.
‡ Amount is less than $0.005 per share.
++ Calculated based on the net asset value as of the last business day of the period.
+ Reflects rebate of certain Portfolio expenses in connection with the investments in Morgan Stanley Institutional Liquidity Money Market Portfolio—Institutional Class during the period. As a result of such rebate, the expenses as a percentage of its net assets were effected by less than 0.005%.
42
Morgan Stanley Institutional Fund, Inc. Prospectus
Financial Highlights
International Small Cap Portfolio
Class P | Period from October 21, 2008^ to December 31, 2008 | ||||||
| Selected Per Share Data and Ratios | |||||||
| Net Asset Value, Beginning of Period | $ | 9.80 | |||||
| Income (Loss) from Investment Operations | |||||||
| Net Investment Income† | 0.00 | ‡ | |||||
| Net Realized and Unrealized Gain (Loss) on Investments | 0.14 | ||||||
| Total from Investment Operations | 0.14 | ||||||
| Distributions from and/or in Excess of | |||||||
| Net Investment Income | (0.41 | ) | |||||
| Total Distributions | (0.41 | ) | |||||
| Net Asset Value, End of Period | $ | 9.53 | |||||
| Total Return++ | 1.56 | %# | |||||
| Ratios and Supplemental Data: | |||||||
| Net Assets, End of Period (Thousands) | $ | 119 | |||||
| Ratio of Expenses to Average Net Assets(1) | 1.39 | %*+ | |||||
| Ratio of Expenses to Average Net Assets Excluding Non Operating Expenses(1) | 1.39 | %*+ | |||||
| Ratio of Net Investment Income to Average Net Assets(1) | 0.09 | %*+ | |||||
| Portfolio Turnover Rate | 49 | %# | |||||
| (1)Supplemental Information on the Ratios to Average Net Assets: | |||||||
| Ratios before expense limitation: | |||||||
| Expenses to Average Net Assets | 1.86 | %*+ | |||||
| Net Investment Income (Loss) to Average Net Assets | (0.38 | )%*+ | |||||
^ Commencement of Operations
† Per share amount is based on average shares outstanding.
++ Calculated based on the net asset value which does not reflect sales charges, if applicable, as of the last business day of the period.
# Not Annualized
* Annualized
+ Reflects rebate of certain Portfolio expenses in connection with the investments in Morgan Stanley Institutional Liquidity Money Market Portfolio—Institutional Class during the period. As a result of such rebate, the expenses as a percentage of its net assets were effected by less than 0.005%.
43
The page has been left blank intentionally
Morgan Stanley Institutional Fund, Inc. Prospectus
Additional Information
Where to Find
Additional Information
In addition to this Prospectus, the Fund has an SAI, dated May 1, 2009, which contains additional, more detailed information about the Fund and the Portfolios. The SAI is incorporated by reference into this Prospectus and, therefore, legally forms a part of this Prospectus.
Shareholder Reports
The Fund publishes annual and semiannual reports ("Shareholder Reports") that contain additional information about each Portfolio's investments. In the Fund's annual report, you will find a discussion of the market conditions and the investment strategies that significantly affected each Portfolio's performance during the last fiscal year. For additional Fund information, including information regarding the investments comprising each of the Portfolios, please call the toll-free number below.
You may obtain the SAI and Shareholder Reports without charge by contacting the Fund at the toll-free number below or on our internet site at: www.morganstanley.com/im. If you purchased shares through a Financial Intermediary, you may also obtain these documents, without charge, by contacting your Financial Intermediary.
Information about the Fund, including the SAI, and Shareholder Reports, may be obtained from the Commission in any of the following ways: (1) In person: you may review and copy documents in the Commission's Public Reference Room in Washington D.C. (for information call 1-202-551-8090); (2) On-line: you may retrieve information from the Commission's web site at http://www.sec.gov; (3) By mail: you may request documents, upon payment of a duplicating fee, by writing to Securities and Exchange Commission, Public Reference Section, Washington, D.C. 20549-0102; or (4) By e-mail: you may request documents, upon payment of a duplicating fee, by e-mailing the Commission at the following address: publicinfo@sec.gov. To aid you in obtaining this information, the Fund's Investment Company Act registration number is 811-05624.
Morgan Stanley Institutional Fund, Inc.
c/o Morgan Stanley Services Company Inc.
P.O. Box 219804
Kansas City, MO 64121-9804
For Shareholder Inquiries,
call 1-800-548-7786.
Prices and Investment Results are available at www.morganstanley.com/im.
MSIGLINPRO-0509
| 2008 Annual Report |
| |
December 31, 2008 |
Morgan Stanley Institutional Fund, Inc.
Global and International Equity Portfolios
Active International Allocation
Emerging Markets
Global Franchise
Global Real Estate
Global Value Equity
International Equity
International Growth Active Extension
International Growth Equity
International Real Estate
International Small Cap
U.S. Equity Portfolios
Capital Growth
Focus Growth
Large Cap Relative Value
Small Company Growth
U.S. Real Estate
U.S. Small/Mid Cap Value
Fixed Income Portfolio
Emerging Markets Debt
| 2008 Annual Report |
|
|
| December 31, 2008 |
Table of Contents
Shareholder’s Letter | 3 |
Performance Summary | 4 |
Expense Examples | 6 |
Portfolios of Investments Global and International Equity Portfolios: |
|
Active International Allocation | 8 |
Emerging Markets | 20 |
Global Franchise | 25 |
Global Real Estate | 28 |
Global Value Equity | 34 |
International Equity | 38 |
International Growth Active Extension | 43 |
International Growth Equity | 49 |
International Real Estate | 54 |
International Small Cap | 59 |
U.S. Equity Portfolios: |
|
Capital Growth | 64 |
Focus Growth | 67 |
Large Cap Relative Value | 70 |
Small Company Growth | 74 |
U.S. Real Estate | 78 |
U.S. Small/Mid Cap Value | 83 |
Fixed Income Portfolio: |
|
Emerging Markets Debt | 87 |
Statements of Assets and Liabilities | 92 |
Statements of Operations | 100 |
Statements of Changes in Net Assets | 104 |
Statement of Cash Flows | 116 |
Financial Highlights | 117 |
Notes to Financial Statements | 143 |
U.S. Privacy Policy | 161 |
Director and Officer Information | 164 |
This report is authorized for distribution only when preceded or accompanied by prospectuses of the Morgan Stanley Institutional Fund, Inc. To receive a prospectus and/or SAI, which contains more complete information such as investment objectives, charges, expenses, policies for voting proxies, risk considerations, and describes in detail each of the Portfolio’s investment policies to the prospective investor, please call 1 (800) 548-7786. Please read the prospectuses carefully before you invest or send money. Additionally, you can access portfolio information including performance, characteristics, and investment team commentary through Morgan Stanley Investment Management’s website: www.morganstanley.com/msim.
Market forecasts provided in this report may not necessarily come to pass. There is no guarantee that any sectors mentioned will continue to perform as discussed herein or that securities in such sectors will be held by the Portfolio in the future. There is no assurance that a Portfolio will achieve its investment objective. Portfolios are subject to market risk, which is the possibility that market values of securities owned by the Portfolio will decline and, therefore, the value of the Portfolio’s shares may be less than what you paid for them. Accordingly, you can lose money investing in Portfolios. Please see the prospectus for more complete information on investment risks.
|
| 1 |
(This Page has been left blank intentionally.)
2 |
|
|
| 2008 Annual Report |
|
|
| December 31, 2008 |
Shareholder’s Letter
Dear Shareholders:
We are pleased to present to you the Fund’s Annual Report for the year ended December 31, 2008. Our Fund currently offers 17 portfolios providing investors with a full array of global and domestic equity and fixed-income products. The Fund’s portfolios, together with the portfolios of the Morgan Stanley Institutional Fund Trust, provide investors with a means to help them meet specific investment needs and to allocate their investments among equities (e.g., value and growth; small, medium, and large capitalization) and fixed income (e.g., short, medium, and long duration; investment grade and high yield).
Sincerely,
![]()
Randy Takian
President and Principal Executive Officer
January 2009
|
| 3 |
2008 Annual Report |
|
|
|
December 31, 2008 |
|
Performance Summary
|
|
|
|
|
|
|
|
|
|
|
| One Year |
|
|
| Five Year | |||||||||
|
| Inception Dates |
| Total Return |
|
|
| Average Annual Total Return | |||||||||||||||||
|
|
|
|
|
|
|
|
|
|
|
|
|
| Comparable |
|
|
|
|
|
| Comparable |
|
| ||
|
| Class I |
| Class P |
| Class H |
| Class L |
| Class I |
| Class P |
| Indices |
|
| Class I |
| Class P |
| Indices |
|
| ||
Global and International Equity Portfolios: |
|
|
|
|
|
|
|
|
|
|
|
|
|
|
|
|
|
|
|
|
|
|
|
|
|
Active International Allocation |
| 1/17/92 |
| 1/2/96 |
| — |
| — |
| (39.25 | )% | (39.41 | ) | (43.38 | )% | (1) | 3.13 | % | 2.86 | % | 1.66 | % | (1) | ||
Emerging Markets |
| 9/25/92 |
| 1/2/96 |
| — |
| — |
| (56.39 | ) | (56.50 | ) | (53.33 | ) | (2) | 7.30 |
| 7.03 |
| 7.66 |
| (2) | ||
Global Franchise |
| 11/28/01 |
| 11/28/01 |
| — |
| — |
| (28.88 | ) | (29.00 | ) | (40.71 | ) | (3) | 3.83 |
| 3.57 |
| (0.51 | ) | (3) | ||
Global Real Estate |
| 8/30/06 |
| 8/30/06 |
| 1/2/08 |
| 6/16/08 |
| (45.00 | ) | (45.15 | ) | (47.83 | ) | (4) | — |
| — |
| — |
| (4) | ||
Global Value Equity |
| 7/15/92 |
| 1/2/96 |
| — |
| — |
| (41.82 | ) | (41.98 | ) | (40.71 | ) | (3) | (1.88 | ) | (2.14 | ) | (0.51 | ) | (3) | ||
International Equity |
| 8/4/89 |
| 1/2/96 |
| — |
| — |
| (33.12 | ) | (33.21 | ) | (43.38 | ) | (1) | 2.82 |
| 2.58 |
| 1.66 |
| (1) | ||
International Growth Active Extension |
| 7/31/07 |
| 7/31/07 |
| 1/2/08 |
| 6/16/08 |
| (54.13 | ) | (54.48 | ) | (43.38 | ) | (1) | — |
| — |
| — |
| (1) | ||
International Growth Equity |
| 12/27/05 |
| 12/27/05 |
| — |
| — |
| (48.70 | ) | (48.82 | ) | (43.38 | ) | (1) | — |
| — |
| — |
| (1) | ||
International Real Estate |
| 10/1/97 |
| 10/1/97 |
| — |
| — |
| (49.95 | ) | (50.05 | ) | (51.38 | ) | (5) | 1.86 |
| 1.63 |
| 1.39 |
| (5) | ||
International Small Cap |
| 12/15/92 |
| 10/21/08 |
| — |
| — |
| (38.33 | ) | — |
| (47.01 | ) | (6) | 1.51 |
| — |
| 1.14 |
| (6) | ||
U.S. Equity Portfolios: |
|
|
|
|
|
|
|
|
|
|
|
|
|
|
|
|
|
|
|
|
|
|
| ||
Capital Growth |
| 4/2/91 |
| 1/2/96 |
| — |
| — |
| (50.47 | ) | (50.57 | ) | (38.44 | ) | (8) | (4.70 | ) | (4.94 | ) | (3.42 | ) | (8) | ||
Focus Growth |
| 3/8/95 |
| 1/2/96 |
| — |
| — |
| (52.19 | ) | (52.27 | ) | (38.44 | ) | (8) | (5.17 | ) | (5.40 | ) | (3.42 | ) | (8) | ||
Large Cap Relative Value |
| 1/31/90 |
| 1/2/96 |
| — |
| — |
| (32.01 | ) | (32.21 | ) | (36.85 | ) | (7) | 0.59 |
| 0.30 |
| (0.79 | ) | (7) | ||
Small Company Growth |
| 11/1/89 |
| 1/2/96 |
| — |
| — |
| (41.84 | ) | (41.97 | ) | (38.54 | ) | (9) | (1.93 | ) | (2.17 | ) | (2.35 | ) | (9) | ||
U.S. Real Estate |
| 2/24/95 |
| 1/2/96 |
| — |
| — |
| (38.07 | ) | (38.26 | ) | (37.73 | ) | (10) | 2.97 |
| 2.72 |
| 0.91 |
| (10) | ||
U.S. Small/Mid Cap Value |
| 9/27/07 |
| 9/27/07 |
| — |
| — |
| (38.03 | ) | (38.21 | ) | (31.99 | ) | (11) | — |
| — |
| — |
| (11) | ||
Fixed Income Portfolio: |
|
|
|
|
|
|
|
|
|
|
|
|
|
|
|
|
|
|
|
|
|
|
| ||
Emerging Markets Debt |
| 2/1/94 |
| 1/2/96 |
| 1/2/08 |
| 6/16/08 |
| (10.07 | ) | (10.34 | ) | (5.22 | ) | (12) | 5.26 |
| 4.98 |
| 6.60 |
| (12) | ||
4 |
|
|
| 2008 Annual Report |
|
|
| December 31, 2008 |
Performance Summary (cont’d)
Ten Year |
|
|
|
|
|
| Since Inception |
|
|
|
|
|
|
| ||||||||||
Average Annual Total Return |
|
|
|
|
|
| Average Annual Total Return |
|
|
|
|
|
|
| ||||||||||
|
|
|
|
|
|
|
|
| Comparable |
|
|
| Comparable |
|
|
| Comparable |
|
|
| Comparable |
|
|
|
|
|
|
| Comparable |
|
|
|
| Indices - |
|
|
| Indices - |
|
|
| Indices - |
|
|
| Indices - |
|
|
|
Class I |
| Class P |
| Indices |
|
| Class I |
| Class I |
| Class P |
| Class P |
| Class H |
| Class H |
| Class L |
| Class L |
|
|
|
1.94 | % | 1.63 | % | 0.80 | % | (1) | 5.28 | % | 4.33 | % | 4.07 | % | 2.63 | % | — | % | — | % | — | % | — | % | (1) | |
9.40 |
| 9.12 |
| 9.05 |
| (2) | 7.09 |
| 6.44 |
| 5.27 |
| 3.94 |
| — |
| — |
| — |
| — |
| (2) | |
— |
| — |
| — |
| (3) | 8.20 |
| 0.79 |
| 7.91 |
| 0.79 |
| — |
| — |
| — |
| — |
| (3) | |
— |
| — |
| — |
| (4) | (19.99 | ) | (21.54 | ) | (20.22 | ) | (21.54 | ) | (44.88 | )† | (47.68 | ) | (63.88 | )†† | (43.95 | ) | (4) | |
0.34 |
| 0.08 |
| (0.64 | ) | (3) | 7.36 |
| 5.33 |
| 4.32 |
| 3.30 |
| — |
| — |
| — |
| — |
| (3) | |
5.38 |
| 5.14 |
| 0.80 |
| (1) | 8.93 |
| 3.03 |
| 7.72 |
| 2.63 |
| — |
| — |
| — |
| — |
| (1) | |
— |
| — |
| — |
| (1) | (39.60 | ) | (32.15 | ) | (39.96 | ) | (32.15 | ) | (54.42 | )† | (43.38 | ) | (73.12 | )†† | (38.46 | ) | (1) | |
— |
| — |
| — |
| (1) | (9.08 | ) | (7.45 | ) | (9.30 | ) | (7.45 | ) | — |
| — |
| — |
| — |
| (1) | |
7.23 |
| 6.96 |
| 6.31 |
| (5) | 6.39 |
| 5.18 |
| 6.13 |
| 5.18 |
| — |
| — |
| — |
| — |
| (5) | |
7.03 |
| — |
| 3.72 |
| (6) | 8.65 |
| 3.22 |
| 1.56 | ††† | (4.31 | ) | — |
| — |
| — |
| — |
| (6) | |
|
|
|
|
|
|
|
|
|
|
|
|
|
|
|
|
|
|
|
|
|
|
|
| |
(2.78 | ) | (3.02 | ) | (4.27 | ) | (8) | 6.22 |
| 5.48 |
| 3.11 |
| 2.79 |
| — |
| — |
| — |
| — |
| (8) | |
(2.40 | ) | (2.63 | ) | (4.27 | ) | (8) | 6.54 |
| 4.61 |
| 3.87 |
| 2.79 |
| — |
| — |
| — |
| — |
| (8) | |
2.87 |
| 2.62 |
| 1.36 |
| (7) | 8.06 |
| 8.69 |
| 6.04 |
| 6.12 |
| — |
| — |
| — |
| — |
| (7) | |
5.06 |
| 4.81 |
| (0.76 | ) | (9) | 9.01 |
| 4.55 |
| 6.75 |
| 1.26 |
| — |
| — |
| — |
| — |
| (9) | |
8.34 |
| 8.05 |
| 7.42 |
| (10) | 10.94 |
| 8.66 |
| 9.71 |
| 8.08 |
| — |
| — |
| — |
| — |
| (10) | |
— |
| — |
| — |
| (11) | (34.44 | ) | (30.83 | ) | (34.65 | ) | (30.83 | ) | — |
| — |
| — |
| — |
| (11) | |
|
|
|
|
|
|
|
|
|
|
|
|
|
|
|
|
|
|
|
|
|
|
|
| |
11.48 |
| 11.17 |
| 10.91 |
| (12) | 9.27 |
| 9.48 |
| 9.54 |
| 10.66 |
| (10.70 | )† | (5.62 | ) | (20.75 | )†† | (6.28 | ) | (12) | |
† | Performance figures are cumulative since inception as Class H shares commenced operations on January 2, 2008. |
|
|
†† | Performance figures are cumulative since inception as Class L shares commenced operations on June 16, 2008. |
|
|
††† | Performance figures are cumulative since inception as Class P shares commenced operations on October 21, 2008. |
Performance data quoted assumes that all dividends and distributions, if any, were reinvested and represents past performance, which is no guarantee of future results. Returns do not reflect the deduction of any applicable sales charges for Class H shares. Such costs would lower performance. Current performance may be lower or higher than the figures shown. For the most recent month-end performance figures, please visit www.morganstanley.com/msim or call 1-800-548-7786. Investment returns and principal value will fluctuate and fund shares, when redeemed, may be worth more or less than their original cost.
Indices:
(1) |
| MSCI EAFE (Europe, Australasia, and Far East) |
(2) |
| MSCI Emerging Markets Net |
(3) |
| MSCI World |
(4) |
| FTSE EPRA/NAREIT Global Real Estate — Net Total Return to U.S. Investors |
(5) |
| FTSE EPRA/NAREIT Global ex-North America Real Estate (80% Europe/20% Asia) |
(6) |
| MSCI EAFE Small Cap Total Return |
(7) |
| Russell 1000® Value |
(8) |
| Russell 1000® Growth |
(9) |
| Russell 2000® Growth |
(10) |
| FTSE NAREIT Equity REIT |
(11) |
| Russell 2500® Value |
(12) |
| J.P. Morgan EMBI Global Bond /J.P. Morgan GBI-EM Global Diversified Bond |
|
| 5 |
2008 Annual Report |
|
|
|
December 31, 2008 |
|
Expense Examples (unaudited)
Expense Examples
As a shareholder of a Portfolio, you may incur two types of costs: (1) transactional costs, including redemptions fees, and (2) ongoing costs, including management fees, shareholder servicing and distribution fees (in the case of Class P, Class H and Class L) and other Portfolio expenses. These examples are intended to help you understand your ongoing costs (in dollars) of investing in a Portfolio and to compare these costs with the ongoing costs of investing in other mutual funds.
The examples are based on an investment of $1,000 invested at the beginning of the six-month period ended December 31, 2008 and held for the entire six-month period.
Actual Expenses
The table below provides information about actual account values and actual expenses. You may use the information in this table, together with the amount you invested, to estimate the expenses that you paid over the period. Simply divide your account value by $1,000 (for example, an $8,600 account value divided by $1,000 = 8.6), then multiply the result by the number in the table under the heading entitled “Actual Expenses Paid During Period” to estimate the expenses you paid on your account during this period.
Please note that the Class P shares of the International Small Cap Portfolio commenced operations on October 21, 2008, however, expenses did not begin accruing until October 22, 2008; therefore, “Actual Expenses Paid During Period” reflect activity from October 22, 2008 through December 31, 2008.
Please note that “Actual Expenses Paid During Period” are grossed up to reflect Portfolio expenses prior to the effect of Expense Offset (See Note F in the Notes to Financial Statements). Therefore, the annualized net expense ratios may differ from the ratio of expenses to average net assets shown in the Financial Highlights.
Hypothetical Example for Comparison Purposes
The table below provides information about hypothetical account values and hypothetical expenses based on the Portfolio’s actual expense ratio and an assumed rate of return of 5% per year before expenses, which is not the Portfolio’s actual return. The hypothetical account values and expenses may not be used to estimate the actual ending account balance or expenses you paid for the period. You may use this information to compare the ongoing costs of investing in the Portfolio and other funds. To do so, compare this 5% hypothetical example with the 5% hypothetical examples that appear in the shareholder reports of the other funds.
Please note that while the Class P shares of the International Small CapPortfolio commenced operations on October 21, 2008, the “Hypothetical Expenses Paid During the Period” reflect projected activity for the full six month period for the purposes of comparability. This projection assumes that the annualized expense ratios for the Class P shares were in effect during the period from July 1, 2008 through December 31, 2008.
Please note that the expenses shown in the table are meant to highlight your ongoing costs only and do not reflect any transactional costs, such as redemption fees. Therefore, the second line of the table is useful in comparing ongoing costs only, and will not help you determine the relative total costs of owning different funds. In addition, if these transactional costs were included, your costs would have been higher. Expenses are calculated using each Fund’s annualized expense ratio (as disclosed), multiplied by the average account value over the period, and multiplied by 184/366(to reflect the most recent one-half year period).
6 |
|
|
| 2008 Annual Report |
|
|
| December 31, 2008 |
Expense Examples (cont’d)
|
|
|
|
|
|
|
| Actual |
|
|
| Net |
|
|
| Beginning |
| Actual Ending |
|
|
| Expenses |
|
|
| Expense |
|
|
| Account |
| Account |
| Hypothetical |
| Paid |
| Hypothetical |
| Ratio |
|
|
| Value |
| Value |
| Ending Account |
| During |
| Expenses Paid |
| During |
|
|
| 7/1/08 |
| 12/31/08 |
| Value |
| Period* |
| During Period* |
| Period |
|
Active International Allocation Class I |
| $1,000.00 |
| $ 670.70 |
| $1,021.17 |
| $ 3.32 |
| $ 4.01 |
| 0.79 | % |
Active International Allocation Class P |
| 1,000.00 |
| 669.10 |
| 1,019.91 |
| 4.36 |
| 5.28 |
| 1.04 |
|
Emerging Markets Class I |
| 1,000.00 |
| 516.90 |
| 1,017.34 |
| 5.91 |
| 7.86 |
| 1.55 |
|
Emerging Markets Class P |
| 1,000.00 |
| 516.30 |
| 1,016.09 |
| 6.86 |
| 9.12 |
| 1.80 |
|
Global Franchise Class I |
| 1,000.00 |
| 826.60 |
| 1,020.11 |
| 4.59 |
| 5.08 |
| 1.00 |
|
Global Franchise Class P |
| 1,000.00 |
| 825.50 |
| 1,018.85 |
| 5.74 |
| 6.34 |
| 1.25 |
|
Global Real Estate Class I |
| 1,000.00 |
| 631.80 |
| 1,019.76 |
| 4.39 |
| 5.43 |
| 1.07 |
|
Global Real Estate Class P |
| 1,000.00 |
| 631.00 |
| 1,018.55 |
| 5.37 |
| 6.65 |
| 1.31 |
|
Global Real Estate Class H |
| 1,000.00 |
| 630.40 |
| 1,021.52 |
| 2.95 |
| 3.66 |
| 0.72 |
|
Global Real Estate Class L |
| 1,000.00 |
| 630.20 |
| 1,016.54 |
| 7.01 |
| 8.67 |
| 1.71 |
|
Global Value Equity Class I |
| 1,000.00 |
| 686.50 |
| 1,020.06 |
| 4.28 |
| 5.13 |
| 1.01 |
|
Global Value Equity Class P |
| 1,000.00 |
| 685.20 |
| 1,018.85 |
| 5.30 |
| 6.34 |
| 1.25 |
|
International Equity Class I |
| 1,000.00 |
| 723.00 |
| 1,020.21 |
| 4.24 |
| 4.98 |
| 0.98 |
|
International Equity Class P |
| 1,000.00 |
| 722.70 |
| 1,018.95 |
| 5.33 |
| 6.24 |
| 1.23 |
|
International Growth Active Extension Class I |
| 1,000.00 |
| 519.10 |
| 1,013.88 |
| 8.55 |
| 11.34 |
| 2.24 |
|
International Growth Active Extension Class P |
| 1,000.00 |
| 515.80 |
| 1,012.62 |
| 9.49 |
| 12.60 |
| 2.49 |
|
International Growth Active Extension Class H |
| 1,000.00 |
| 515.10 |
| 1,010.91 |
| 10.78 |
| 14.30 |
| 2.83 |
|
International Growth Active Extension Class L |
| 1,000.00 |
| 520.50 |
| 1,014.48 |
| 8.10 |
| 10.74 |
| 2.12 |
|
International Growth Equity Class I |
| 1,000.00 |
| 573.80 |
| 1,020.11 |
| 3.96 |
| 5.08 |
| 1.00 |
|
International Growth Equity Class P |
| 1,000.00 |
| 573.30 |
| 1,018.85 |
| 4.94 |
| 6.34 |
| 1.25 |
|
International Real Estate Class I |
| 1,000.00 |
| 585.40 |
| 1,020.36 |
| 3.79 |
| 4.82 |
| 0.95 |
|
International Real Estate Class P |
| 1,000.00 |
| 584.90 |
| 1,019.10 |
| 4.78 |
| 6.09 |
| 1.20 |
|
International Small Cap Class I |
| 1,000.00 |
| 683.10 |
| 1,019.36 |
| 4.87 |
| 5.84 |
| 1.15 |
|
International Small Cap Class P |
| 1,000.00 |
| 1,015.60 |
| 1,016.19 |
| 3.53 | ** | 9.02 |
| 1.78 |
|
Capital Growth Class I |
| 1,000.00 |
| 551.00 |
| 1,021.87 |
| 2.53 |
| 3.30 |
| 0.65 |
|
Capital Growth Class P |
| 1,000.00 |
| 550.10 |
| 1,020.61 |
| 3.51 |
| 4.57 |
| 0.90 |
|
Focus Growth Class I |
| 1,000.00 |
| 516.80 |
| 1,020.06 |
| 3.85 |
| 5.13 |
| 1.01 |
|
Focus Growth Class P |
| 1,000.00 |
| 516.80 |
| 1,018.80 |
| 4.80 |
| 6.39 |
| 1.26 |
|
Large Cap Relative Value Class I |
| 1,000.00 |
| 777.10 |
| 1,021.52 |
| 3.22 |
| 3.66 |
| 0.72 |
|
Large Cap Relative Value Class P |
| 1,000.00 |
| 775.30 |
| 1,020.26 |
| 4.33 |
| 4.93 |
| 0.97 |
|
Small Company Growth Class I |
| 1,000.00 |
| 669.90 |
| 1,019.96 |
| 4.32 |
| 5.23 |
| 1.03 |
|
Small Company Growth Class P |
| 1,000.00 |
| 669.50 |
| 1,018.70 |
| 5.37 |
| 6.50 |
| 1.28 |
|
U.S. Real Estate Class I |
| 1,000.00 |
| 646.40 |
| 1,020.21 |
| 4.06 |
| 4.98 |
| 0.98 |
|
U.S. Real Estate Class P |
| 1,000.00 |
| 645.70 |
| 1,018.90 |
| 5.13 |
| 6.29 |
| 1.24 |
|
U.S. Small/Mid Cap Value Class I |
| 1,000.00 |
| 698.60 |
| 1,018.40 |
| 5.72 |
| 6.80 |
| 1.34 |
|
U.S. Small/Mid Cap Value Class P |
| 1,000.00 |
| 697.50 |
| 1,017.14 |
| 6.78 |
| 8.06 |
| 1.59 |
|
Emerging Markets Debt Class I |
| 1,000.00 |
| 873.40 |
| 1,020.26 |
| 4.57 |
| 4.93 |
| 0.97 |
|
Emerging Markets Debt Class P |
| 1,000.00 |
| 872.10 |
| 1,019.30 |
| 5.46 |
| 5.89 |
| 1.16 |
|
Emerging Markets Debt Class H |
| 1,000.00 |
| 873.00 |
| 1,018.85 |
| 5.89 |
| 6.34 |
| 1.25 |
|
Emerging Markets Debt Class L |
| 1,000.00 |
| 871.20 |
| 1,016.84 |
| 7.76 |
| 8.36 |
| 1.65 |
|
* | Expenses are calculated using each Portfolio Class’ annualized net expense ratio (as disclosed), multiplied by the average account value over the period, and multiplied by 184/366 (to reflect the most recent one-half year period). |
** | Expenses are calculated using each Portfolio Class’ annualized net expense ratio (as disclosed), multiplied by the average account value over the period, and multiplied by 72/366 (to reflect the most recent one-half year period). |
|
| 7 |
2008 Annual Report |
|
|
|
December 31, 2008 |
|
Investment Overview (unaudited)
Active International Allocation Portfolio
The Active International Allocation Portfolio (the “Portfolio”) seeks long-term capital appreciation by investing primarily, in accordance with country and sector weightings determined by the Adviser, in equity securities of non-U.S. issuers which, in the aggregate, replicate broad market indices.
Foreign investing involves certain risks, including currency fluctuations and controls, restrictions on foreign investments, less governmental supervision and regulation, less liquidity and the potential for market volatility and political instability. The risks of investing in emerging-market countries are greater than the risks generally associated with foreign investments.
Performance
For the year ended December 31, 2008, the Portfolio had a total return based on net asset value and reinvestment of distributions per share of -39.25%, net of fees, for Class I shares. The Portfolio’s Class I shares outperformed against its benchmark, the Morgan Stanley Capital International (MSCI) EAFE Index (the “Index”) which returned -43.38%.
Factors Affecting Performance
· The value destruction of 2008 was mitigated slightly in the month of December by a 6% rise in international equities (as measured by the MSCI EAFE Index). This did little to soften the 2008 returns however, with the Index down 43.38% in U.S. dollar terms. Regional returns (as measured by the Index) in U.S. dollars were roughly: Japan, -29%; Europe, -46%; Asia ex-Japan, -50% and the emerging markets, -53%. Sector performance for the year was entirely negative, as follows: health care, -18%; utilities, -28%; consumer staples, -31%; information technology, -45%; industrials, -44%, materials, -52%; and financials, -55%. There were huge and divergent currency moves relative to the U.S. dollar for the year, with the Japanese yen up 23%, while the euro lost 5% and the British pound collapsed 28%.
· Relative to the Index, the Portfolio’s outperformance was due to its underweight position in financials. However, this was slightly offset by an overweight to technology. We positioned the Portfolio cyclically in the first half of the year and more defensively in the latter half. On average, the Portfolio held approximately 6% cash in the second half, which we reduced to about 3% during December, due to the oversold condition of the market.
Management Strategies
· Economic reports continue to confirm the worst global, synchronized slowdown in at least three decades. Along with a plunge in industrial activity, global business surveys collapsed, and consumers in Europe, Japan and the U.S. drastically reduced spending. In our view, keeping hope and confidence alive is vital to putting a floor under this recession. The good news is that the global authorities have started to implement massive fiscal stimulus and slash taxes and short-term interest rates and that the cost of gasoline has fallen sharply. Equally important, we think, was the U.S. Federal Reserve’s decision to buy $500-$600 billion of mortgage debt directly from the Government Sponsored Enterprises (GSEs) and $200-$300 billion of asset-backed securities to support consumer lending. Federal Reserve Chairman Bernanke also said the Fed is open to buying longer-dated Treasuries and even corporate debt.
· Resolutions of every prior major banking crisis were elusive, until bad assets were removed (or written off) from the banks’ balance sheets. This has not completely happened yet in the U.S. and Europe. Many of the bad assets are synthetic, leveraged instruments collateralized by mortgages, consumer loans, and commercial real estate. Because the reasonable price of these assets is unknowable until the extent of the economic downturn and the medium-term cost of capital is clearer, sellers are reluctant to sell, and buyers are not buying. Private equity firms are under pressure to spend their funds on working capital, rather than acquisitions; sovereign wealth funds need to conserve capital for domestic purposes; and distressed bond funds are still only picking at the margin. Everything governments and central banks have done to encourage the pricing and clearing of these assets (including TARP) has been helpful but up to now, insufficient in our view. That said, governments and central banks have so far been able to buy time as they wind down the shadow banking system and work to repair the financial system and credit conduits.
· As we look out on the prospects for 2009, there is virtually no clarity yet on economic growth for 2009 and 2010. Large swathes of the credit markets, while better, are still not functioning and toxic assets remain on bank balance sheets. In our view, without the availability of credit, the economy, and therefore equities, will not be able to decisively sustain a recovery.
8 |
|
|
| 2008 Annual Report |
|
|
| December 31, 2008 |
Investment Overview (cont’d)
Active International Allocation Portfolio
· That said, we believe equity markets are oversold and prone to sharp tactical rallies, as the economic, fiscal and monetary news unfolds. Our work shows us that equity valuations are reasonably priced, but not necessarily cheap, given the level of economic and financial distress. We remain cautious.
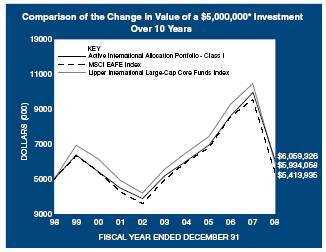
* Minimum Investment
In accordance with SEC regulations, Portfolio’s performance shown assumes that all recurring fees (including management fees) were deducted and all dividends and distributions were reinvested. The performance of Class P shares will vary from the Class I shares based upon their different inception dates and will be negatively impacted by additional fees assessed to that class.
Performance Compared to the Morgan Stanley Capital International (MSCI) EAFE Index(1) and the Lipper International Large-Cap Core Funds Index(2)
|
| Total Returns(3) |
| |||||||
|
|
|
| Average Annual |
| |||||
|
| One |
| Five |
| Ten |
| Since |
| |
|
| Year |
| Years |
| Years |
| Inception(6) |
| |
|
|
|
|
|
|
|
|
|
| |
Portfolio — Class I (4) |
| (39.25 | )% | 3.13 | % | 1.94 | % | 5.28 | % | |
MSCI EAFE Index |
| (43.38 | ) | 1.66 |
| 0.80 |
| 4.33 |
| |
Lipper International Large-Cap Core Funds Index |
| (43.31 | ) | 1.26 |
| 1.73 |
| 5.78 |
| |
|
|
|
|
|
|
|
|
|
| |
Portfolio — Class P (5) |
| (39.41 | ) | 2.86 |
| 1.63 |
| 4.07 |
| |
MSCI EAFE Index |
| (43.38 | ) | 1.66 |
| 0.80 |
| 2.63 |
| |
Lipper International Large-Cap Core Funds Index |
| (43.31 | ) | 1.26 |
| 1.73 |
| 4.18 |
| |
Performance data quoted represents past performance, which is no guarantee of future results, and current performance may be lower or higher than the figures shown. Performance assumes that all dividends and distributions, if any, were reinvested. For the most recent month-end performance figures, please visit www.morganstanley.com/msim. Investment return and principal value will fluctuate so that Portfolio shares, when redeemed, may be worth more or less than their original cost. Total returns do not reflect the deduction of taxes that a shareholder would pay on Portfolio distributions or the redemption of Portfolio shares. Performance of share classes will vary due to difference in expenses.
(1) |
| The Morgan Stanley Capital International (MSCI) EAFE Index (Europe, Australasia, Far East) is a free float-adjusted market capitalization index that is designed to measure the international equity market performance of developed markets, excluding the US & Canada. The term “free float” represents the portion of shares outstanding that are deemed to be available for purchase in the public equity markets by investors. The MSCI EAFE Index currently consists of 21 developed market country indices. The performance of the Index is listed in U.S. dollars and assumes reinvestment of net dividends. The Index is unmanaged and its returns do not include any sales charges or fees. Such costs would lower performance. It is not possible to invest directly in an index. |
(2) |
| The Lipper International Large-Cap Core Funds Index is an equally weighted performance index of the largest qualifying funds (based on net assets) in the Lipper International Large-Cap Core Funds classification. The Index, which is adjusted for capital gains distributions and income dividends, is unmanaged and should not be considered an investment. There are currently 30 funds represented in this Index. As of the date of this report, the Portfolio was in the Lipper International Large-Cap Core Funds classification. |
(3) |
| Total returns for the Portfolio reflect fees waived and expenses reimbursed, if applicable, by the Adviser. Without such waivers and reimbursements, total returns would have been lower. Fee waivers and/or expense reimbursements are voluntary and the Adviser reserves the right to commence or terminate any waiver and/or reimbursement at any time. |
(4) |
| Commenced operations on January 17, 1992 |
(5) |
| Commenced operations on January 2, 1996 |
(6) |
| For comparative purposes, average annual since inception returns listed for the Indexes refer to the inception date or initial offering of the respective share class of the Portfolio, not the inception of the Index. |
Portfolio Composition**
|
| Percentage of |
| |
Classification |
| Total Investments |
| |
Pharmaceuticals |
| 11.0 | % | |
Oil, Gas & Consumable Fuels |
| 8.2 |
| |
Commercial Banks |
| 7.8 |
| |
Food Products |
| 5.6 |
| |
Other*** |
|
| 67.4 |
|
Total Investments |
|
| 100.0 | % |
** | Percentages indicated are based upon total investments (excluding Securities held as collateral on Loaned Securities) as of December 31, 2008. |
*** | Industries which do not appear in the above table, as well as those which represent less than 5% of total investments, if applicable, are included in the category labeled “Other”. |
|
| 9 |
2008 Annual Report |
|
|
|
December 31, 2008 |
|
Portfolio of Investments
Active International Allocation Portfolio
|
|
|
| Value |
| |
|
| Shares |
| (000) |
| |
Common Stocks (97.0%) |
|
|
|
|
| |
Australia (2.0%) |
|
|
|
|
| |
AGL Energy Ltd. |
| 13,793 |
| $ 147 |
| |
Alumina Ltd. |
| 37,564 |
| 37 |
| |
Amcor Ltd. |
| 42,601 |
| 173 |
| |
AMP Ltd. |
| 50,078 |
| 190 |
| |
Ansell Ltd. (c) |
| 2,311 |
| 20 |
| |
Aristocrat Leisure Ltd. |
| 5,302 |
| 15 |
| |
Asciano Group |
| 14,978 |
| 16 |
| |
ASX Ltd. |
| 2,832 |
| 66 |
| |
Australia & New Zealand Banking Group Ltd. |
| 39,773 |
| 427 |
| |
AXA Asia Pacific Holdings Ltd. |
| 15,474 |
| 54 |
| |
Bendigo & Adelaide Bank Ltd. |
| 4,692 |
| 36 |
| |
BHP Billiton Ltd. |
| 105,286 |
| 2,217 |
| |
Billabong International Ltd. |
| 2,929 |
| 16 |
| |
BlueScope Steel Ltd. |
| 24,370 |
| 60 |
| |
Boart Longyear Group |
| 25,056 |
| 4 |
| |
Boral Ltd. (c) |
| 29,092 |
| 94 |
| |
Brambles Ltd. |
| 35,595 |
| 185 |
| |
Caltex Australia Ltd. (c) |
| 11,082 |
| 56 |
| |
CFS Retail Property Trust REIT (c) |
| 29,725 |
| 39 |
| |
Coca-Cola Amatil Ltd. |
| 16,092 |
| 104 |
| |
Cochlear Ltd. |
| 924 |
| 36 |
| |
Commonwealth Bank of Australia |
| 26,065 |
| 528 |
| |
Computershare Ltd. |
| 8,016 |
| 44 |
| |
Crown Ltd. |
| 7,679 |
| 32 |
| |
CSL Ltd. |
| 13,430 |
| 317 |
| |
CSR Ltd. (c) |
| 50,798 |
| 63 |
| |
Dexus Property Group REIT |
| 45,764 |
| 27 |
| |
Fairfax Media Ltd. (c) |
| 37,059 |
| 43 |
| |
Fortescue Metals Group Ltd. (a)(c) |
| 23,253 |
| 32 |
| |
Foster’s Group Ltd. |
| 57,016 |
| 219 |
| |
Goodman Fielder Ltd. |
| 22,864 |
| 21 |
| |
Goodman Group REIT |
| 35,527 |
| 19 |
| |
GPT Group REIT |
| 72,261 |
| 47 |
| |
Harvey Norman Holdings Ltd. (c) |
| 8,905 |
| 17 |
| |
Incitec Pivot Ltd. |
| 21,387 |
| 38 |
| |
Insurance Australia Group Ltd. |
| 53,694 |
| 146 |
| |
James Hardie Industries N.V. (c) |
| 23,021 |
| 75 |
| |
Leighton Holdings Ltd. (c) |
| 5,464 |
| 106 |
| |
Lend Lease Corp. Ltd. |
| 11,733 |
| 59 |
| |
Lion Nathan Ltd. |
| 4,844 |
| 28 |
| |
Macquarie Airports |
| 11,500 |
| 19 |
| |
Macquarie Group Ltd. (c) |
| 7,701 |
| 157 |
| |
Macquarie Infrastructure Group |
| 70,911 |
| 85 |
| |
Macquarie Office Trust REIT |
| 34,843 |
| 6 |
| |
Metcash Ltd. |
| 13,117 |
| 40 |
| |
Mirvac Group REIT |
| 18,051 |
| 16 |
| |
National Australia Bank Ltd. (c) |
| 32,949 |
| 483 |
| |
Newcrest Mining Ltd. |
| 14,215 |
| 337 |
| |
OneSteel Ltd. |
| 26,367 |
| 46 |
| |
Orica Ltd. |
| 15,355 |
| 151 |
| |
Origin Energy Ltd. |
| 25,507 |
| 288 |
| |
OZ Minerals Ltd. (c)(d) |
| 54,866 |
|
| 23 |
|
Paladin Energy Ltd. (a) |
| 10,336 |
| 18 |
| |
PaperlinX Ltd. |
| 14,803 |
| 7 |
| |
Perpetual Ltd. |
| 681 |
| 18 |
| |
Qantas Airways Ltd. |
| 15,466 |
| 28 |
| |
QBE Insurance Group Ltd. (c) |
| 24,116 |
| 438 |
| |
Rio Tinto Ltd. (c) |
| 9,106 |
| 244 |
| |
Santos Ltd. |
| 18,197 |
| 190 |
| |
Sims Metal Management Ltd. |
| 2,800 |
| 34 |
| |
Sonic Healthcare Ltd. |
| 7,528 |
| 77 |
| |
Stockland REIT |
| 27,296 |
| 79 |
| |
Suncorp-Metway Ltd. |
| 24,003 |
| 142 |
| |
TABCORP Holdings Ltd. |
| 14,239 |
| 70 |
| |
Tatts Group Ltd. |
| 18,850 |
| 37 |
| |
Telstra Corp. Ltd. |
| 99,265 |
| 266 |
| |
Toll Holdings Ltd. (c) |
| 15,272 |
| 66 |
| |
Transurban Group (c) |
| 29,438 |
| 113 |
| |
Virgin Blue Holdings Ltd. |
| 12,474 |
| 3 |
| |
Wesfarmers Ltd. |
| 24,285 |
| 307 |
| |
Wesfarmers Ltd. PPS |
| 7,385 |
| 93 |
| |
Westfield Group REIT |
| 31,278 |
| 288 |
| |
Westpac Banking Corp. |
| 49,286 |
| 587 |
| |
Woodside Petroleum Ltd. |
| 15,968 |
| 412 |
| |
Woolworths Ltd. |
| 34,418 |
| 642 |
| |
WorleyParsons Ltd. |
| 2,684 |
| 27 |
| |
|
|
|
| 11,690 |
| |
Austria (0.0%) |
|
|
|
|
| |
Erste Group Bank AG (c) |
| 205 |
| 5 |
| |
Belgium (0.4%) |
|
|
|
|
| |
Anheuser-Busch InBev N.V. (c) |
| 28,900 |
| 670 |
| |
Anheuser-Busch InBev N.V. VVPR (a) |
| 17,784 |
| — | @ | |
Belgacom S.A. (c) |
| 8,877 |
| 339 |
| |
Groupe Bruxelles Lambert S.A. (c) |
| 4,777 |
| 380 |
| |
KBC Groep N.V. |
| 8,099 |
| 245 |
| |
Nationale a Portefeuille |
| 2,339 |
| 114 |
| |
Solvay S.A., Class A (c) |
| 3,665 |
| 272 |
| |
UCB S.A. (c) |
| 8,995 |
| 293 |
| |
Umicore (c) |
| 7,660 |
| 151 |
| |
|
|
|
| 2,464 |
| |
Brazil (0.2%) |
|
|
|
|
| |
All America Latina Logistica S.A. |
| 43,200 |
| 193 |
| |
Banco do Brasil S.A. |
| 34,500 |
| 224 |
| |
Cia Energetica de Minas Gerais S.A. (Preference) |
| 1 |
| — | @ | |
Cyrela Brazil Realty S.A. |
| 42,900 |
| 173 |
| |
Cyrela Commercial Properties S.A. Empreendimentos e Participacoes |
| 8,580 |
| 22 |
| |
Lojas Renner S.A. |
| 29,100 |
| 199 |
| |
Perdigao S.A. (a) |
| 21,300 |
| 277 |
| |
Sadia S.A. (Preference) |
| 76,877 |
| 125 |
| |
|
|
|
| 1,213 |
| |
10 | The accompanying notes are an integral part of the financial statements. |
|
| 2008 Annual Report |
|
|
| December 31, 2008 |
Portfolio of Investments (cont’d)
Active International Allocation Portfolio
|
|
|
| Value |
|
|
| Shares |
| (000) |
|
Denmark (0.6%) |
|
|
|
|
|
AP Moller - Maersk A/S |
| 76 |
| $ 407 |
|
DSV A/S |
| 11,750 |
| 128 |
|
GN Store Nord A/S (a) |
| 25,467 |
| 50 |
|
Novo-Nordisk A/S, Class B |
| 40,029 |
| 2,037 |
|
Novozymes A/S, Class B |
| 2,864 |
| 228 |
|
Vestas Wind Systems A/S (a) |
| 9,602 |
| 571 |
|
|
|
|
| 3,421 |
|
Finland (1.2%) |
|
|
|
|
|
Fortum Oyj (c) |
| 27,278 |
| 586 |
|
Kesko Oyj, Class B (c) |
| 13,895 |
| 348 |
|
Kone Oyj, Class B (c) |
| 8,819 |
| 193 |
|
Metso Oyj (c) |
| 8,674 |
| 105 |
|
Neste Oil Oyj (c) |
| 8,252 |
| 123 |
|
Nokia Oyj (c) |
| 272,204 |
| 4,220 |
|
Outokumpu Oyj |
| 9,991 |
| 117 |
|
Rautaruukki Oyj (c) |
| 5,946 |
| 103 |
|
Sampo Oyj, Class A |
| 17,422 |
| 326 |
|
Stora Enso Oyj, Class R (c) |
| 42,157 |
| 329 |
|
UPM-Kymmene Oyj |
| 36,668 |
| 465 |
|
Wartsila Oyj (c) |
| 3,594 |
| 107 |
|
|
|
|
| 7,022 |
|
France (10.5%) |
|
|
|
|
|
Accor S.A. (c) |
| 13,357 |
| 657 |
|
Air Liquide S.A. (c) |
| 21,898 |
| 2,004 |
|
Alcatel-Lucent (a)(c) |
| 130,864 |
| 283 |
|
Alstom (c) |
| 15,984 |
| 944 |
|
ArcelorMittal (c) |
| 62,821 |
| 1,514 |
|
Atos Origin S.A. |
| 2,078 |
| 52 |
|
AXA S.A. (c) |
| 70,219 |
| 1,566 |
|
BNP Paribas |
| 53,510 |
| 2,260 |
|
Bouygues |
| 35,272 |
| 1,493 |
|
Cap Gemini S.A. (c) |
| 13,103 |
| 505 |
|
Carrefour S.A. (c) |
| 90,417 |
| 3,472 |
|
Casino Guichard Perrachon S.A. (c) |
| 10,592 |
| 806 |
|
Cie de Saint-Gobain (c) |
| 18,240 |
| 860 |
|
Cie Generale d’Optique Essilor International S.A. (c) |
| 18,913 |
| 887 |
|
CNP Assurances |
| 2,798 |
| 203 |
|
Compagnie Generale des Etablissements Michelin, Class B (c) |
| 5,304 |
| 278 |
|
Credit Agricole S.A. |
| 34,143 |
| 388 |
|
Dassault Systemes S.A. (c) |
| 5,663 |
| 256 |
|
Electricite de France |
| 187 |
| 11 |
|
Eurazeo |
| 1,498 |
| 70 |
|
European Aeronautic Defense & Space Co. N.V. (c) |
| 14,653 |
| 247 |
|
France Telecom S.A. (c) |
| 169,302 |
| 4,736 |
|
GDF Suez S.A. (c) |
| 51,961 |
| 2,573 |
|
Groupe Danone (c) |
| 32,872 |
| 1,984 |
|
Hermes International (c) |
| 4,191 |
| 585 |
|
Imerys S.A. |
| 2,425 |
| 110 |
|
Lafarge S.A. (c) |
| 13,126 |
| 798 |
|
Lagardere S.C.A. (c) |
| 11,315 |
| 459 |
|
L’Oreal S.A. (c) |
| 12,243 |
| 1,064 |
|
LVMH Moet Hennessy Louis Vuitton S.A. (c) |
| 16,196 |
| 1,088 |
|
Neopost S.A. |
| 2,954 |
| 267 |
|
Pernod-Ricard S.A. (c) |
| 3,180 |
| 236 |
|
Peugeot S.A. (c) |
| 5,883 |
| 100 |
|
PPR (c) |
| 3,223 |
| 211 |
|
Publicis Groupe (c) |
| 5,491 |
| 141 |
|
Renault S.A. (c) |
| 6,055 |
| 158 |
|
Safran S.A. |
| 4,812 |
| 65 |
|
Sanofi-Aventis S.A. (c) |
| 103,353 |
| 6,564 |
|
Schneider Electric S.A. (c) |
| 26,873 |
| 2,007 |
|
SCOR SE |
| 4,069 |
| 94 |
|
Societe BIC S.A. |
| 1,790 |
| 103 |
|
Societe Generale |
| 20,040 |
| 1,015 |
|
Societe Television Francaise 1 (c) |
| 12,949 |
| 189 |
|
Sodexo (c) |
| 6,417 |
| 355 |
|
Technip S.A. (c) |
| 9,503 |
| 291 |
|
Thales S.A. (c) |
| 6,584 |
| 275 |
|
Total S.A. (c) |
| 190,600 |
| 10,391 |
|
Unibail-Rodamco REIT |
| 67 |
| 10 |
|
Valeo S.A. (c) |
| 5,824 |
| 87 |
|
Vallourec |
| 2,485 |
| 283 |
|
Veolia Environnement (c) |
| 49,288 |
| 1,547 |
|
Vinci S.A. |
| 16,850 |
| 710 |
|
Vivendi (c) |
| 94,582 |
| 3,079 |
|
Zodiac S.A. |
| 774 |
| 28 |
|
|
|
|
| 60,359 |
|
Germany (8.8%) |
|
|
|
|
|
Adidas AG (c) |
| 12,872 |
| 495 |
|
Allianz SE (Registered) (c) |
| 18,800 |
| 2,017 |
|
BASF AG (c) |
| 85,333 |
| 3,372 |
|
Bayer AG (c) |
| 58,974 |
| 3,464 |
|
Bayerische Motoren Werke AG (c) |
| 340 |
| 11 |
|
Beiersdorf AG (c) |
| 11,711 |
| 697 |
|
Celesio AG (c) |
| 6,826 |
| 186 |
|
Commerzbank AG (c) |
| 18,707 |
| 178 |
|
Daimler AG (c) |
| 52,640 |
| 2,000 |
|
Deutsche Bank AG (Registered) (c) |
| 14,584 |
| 582 |
|
Deutsche Boerse AG (c) |
| 19,320 |
| 1,407 |
|
Deutsche Lufthansa AG (Registered) |
| 14,582 |
| 231 |
|
Deutsche Post AG (Registered) (c) |
| 46,451 |
| 786 |
|
Deutsche Postbank AG (c) |
| 3,501 |
| 77 |
|
Deutsche Telekom AG (c) |
| 237,372 |
| 3,607 |
|
E.ON AG (c) |
| 221,594 |
| 8,961 |
|
Fresenius Medical Care AG & Co. KGaA (c) |
| 16,666 |
| 782 |
|
Henkel KGaA (Non-Voting Shares) (c) |
| 17,347 |
| 556 |
|
Hochtief AG |
| 3,004 |
| 152 |
|
Infineon Technologies AG (a)(c) |
| 36,889 |
| 51 |
|
K&S AG (c) |
| 21,305 |
| 1,223 |
|
Linde AG (c) |
| 8,476 |
| 717 |
|
MAN AG |
| 7,562 |
| 417 |
|
Merck KGaA |
| 5,489 |
| 499 |
|
| The accompanying notes are an integral part of the financial statements. | 11 |
2008 Annual Report |
|
| |
December 31, 2008 |
Portfolio of Investments (cont’d)
Active International Allocation Portfolio
|
|
|
| Value |
|
|
| Shares |
| (000) |
|
Germany (cont’d) |
|
|
|
|
|
Metro AG (c) |
| 26,325 |
| $ 1,067 |
|
Muenchener Rueckversicherungs AG (Registered) (c) |
| 9,485 |
| 1,491 |
|
Porsche Automobil Holding SE (Non-Voting Shares) (c) |
| 7,903 |
| 616 |
|
Puma AG Rudolf Dassler Sport |
| 571 |
| 113 |
|
RWE AG (c) |
| 47,334 |
| 4,255 |
|
RWE AG (Non-Voting Shares) |
| 3,634 |
| 275 |
|
SAP AG (c) |
| 79,020 |
| 2,832 |
|
Siemens AG (Registered) (c) |
| 46,346 |
| 3,471 |
|
Suedzucker AG (c) |
| 9,046 |
| 138 |
|
ThyssenKrupp AG (c) |
| 22,339 |
| 604 |
|
TUI AG (c) |
| 9,833 |
| 112 |
|
Volkswagen AG |
| 7,913 |
| 2,772 |
|
Volkswagen AG (Non-Voting Shares) (c) |
| 6,000 |
| 320 |
|
|
|
|
| 50,534 |
|
Greece (0.3%) |
|
|
|
|
|
Alpha Bank A.E. |
| 32,683 |
| 307 |
|
EFG Eurobank Ergasias S.A. |
| 23,085 |
| 183 |
|
National Bank of Greece S.A. |
| 42,489 |
| 787 |
|
OPAP S.A. |
| 9,540 |
| 275 |
|
Piraeus Bank S.A. |
| 26,875 |
| 242 |
|
Titan Cement Co., S.A. |
| 3,950 |
| 76 |
|
|
|
|
| 1,870 |
|
Hong Kong (2.5%) |
|
|
|
|
|
Agile Property Holdings Ltd. |
| 291,280 |
| 154 |
|
Bank of East Asia Ltd. |
| 119,000 |
| 251 |
|
BOC Hong Kong Holdings Ltd. |
| 327,000 |
| 373 |
|
Cathay Pacific Airways Ltd. |
| 112,000 |
| 126 |
|
Chaoda Modern Agriculture Holdings Ltd. (c) |
| 176,904 |
| 114 |
|
Cheung Kong Holdings Ltd. |
| 113,000 |
| 1,077 |
|
Cheung Kong Infrastructure Holdings Ltd. |
| 38,000 |
| 143 |
|
China Resources Enterprise Ltd. (c) |
| 102,000 |
| 179 |
|
China Resources Land Ltd. |
| 145,000 |
| 179 |
|
China Travel International Investment Hong Kong Ltd. (c) |
| 768,000 |
| 151 |
|
Chow Sang Sang Holdings |
| 57,438 |
| 30 |
|
CLP Holdings Ltd. (c) |
| 156,000 |
| 1,061 |
|
Daphne International Holdings Ltd. (c) |
| 321,200 |
| 53 |
|
Esprit Holdings Ltd. |
| 94,600 |
| 539 |
|
Hang Lung Group Ltd. |
| 68,000 |
| 208 |
|
Hang Lung Properties Ltd. (c) |
| 320,500 |
| 703 |
|
Hang Seng Bank Ltd. (c) |
| 70,900 |
| 936 |
|
Henderson Land Development Co., Ltd. |
| 90,000 |
| 336 |
|
Hong Kong & China Gas Co., Ltd. (c) |
| 330,000 |
| 500 |
|
Hong Kong Exchanges & Clearing Ltd. |
| 82,400 |
| 790 |
|
HongKong Electric Holdings |
| 100,000 |
| 563 |
|
Hopewell Holdings Ltd. |
| 50,000 |
| 165 |
|
Hutchison Telecommunications International Ltd. |
| 115,000 |
| 31 |
|
Hutchison Whampoa Ltd. |
| 183,000 |
| 923 |
|
Hysan Development Co., Ltd. |
| 45,000 |
| 73 |
|
Kerry Properties Ltd. |
| 65,000 |
| 175 |
|
Li & Fung Ltd. (c) |
| 332,000 |
| 573 |
|
Li Ning Co. Ltd. (c) |
| 94,000 |
| 148 |
|
Link (The) REIT |
| 151,000 |
| 251 |
|
MTR Corp. (c) |
| 119,500 |
| 279 |
|
New World China Land Ltd. |
| 271,600 |
| 83 |
|
New World Development Ltd. |
| 209,000 |
| 214 |
|
Noble Group Ltd. |
| 173,000 |
| 124 |
|
NWS Holdings Ltd. |
| 12,000 |
| 18 |
|
PCCW Ltd. (c) |
| 242,000 |
| 116 |
|
Rexcapital Financial Holdings Ltd. (a) |
| 891,948 |
| 22 |
|
Shangri-La Asia Ltd. |
| 6,000 |
| 7 |
|
Sino Land Co. |
| 144,000 |
| 150 |
|
Sun Hung Kai Properties Ltd. |
| 129,500 |
| 1,089 |
|
Swire Pacific Ltd., Class A |
| 65,000 |
| 451 |
|
Wharf Holdings Ltd. |
| 115,000 |
| 318 |
|
Wheelock & Co., Ltd. |
| 82,000 |
| 182 |
|
Wing Hang Bank Ltd. |
| 15,000 |
| 87 |
|
Yue Yuen Industrial Holdings Ltd. |
| 54,000 |
| 107 |
|
|
|
|
| 14,052 |
|
Indonesia (0.1%) |
|
|
|
|
|
Astra International Tbk PT |
| 258,000 |
| 260 |
|
Ireland (0.1%) |
|
|
|
|
|
CRH plc |
| 554 |
| 14 |
|
Experian plc |
| 35,818 |
| 224 |
|
|
|
|
| 238 |
|
Italy (0.7%) |
|
|
|
|
|
Alleanza Assicurazioni S.p.A. |
| 10,973 |
| 89 |
|
Assicurazioni Generali S.p.A. |
| 31,368 |
| 860 |
|
Banco Popolare S.C. |
| 441 |
| 3 |
|
Enel S.p.A. |
| 3,756 |
| 24 |
|
ENI S.p.A. |
| 37,836 |
| 897 |
|
Intesa Sanpaolo S.p.A. |
| 462,253 |
| 1,665 |
|
Telecom Italia S.p.A. |
| 10,225 |
| 17 |
|
UniCredit S.p.A. |
| 200,060 |
| 498 |
|
Unione di Banche Italiane SCPA |
| 468 |
| 7 |
|
|
|
|
| 4,060 |
|
Japan (29.8%) |
|
|
|
|
|
77 Bank Ltd. (The) |
| 76,000 |
| 413 |
|
Acom Co., Ltd. (c) |
| 2,980 |
| 125 |
|
Advantest Corp. (c) |
| 18,390 |
| 298 |
|
Aeon Co., Ltd. (c) |
| 45,700 |
| 458 |
|
Aeon Credit Service Co., Ltd. |
| 3,600 |
| 38 |
|
Aeon Mall Co., Ltd. |
| 400 |
| 8 |
|
Aiful Corp. (c) |
| 2,500 |
| 7 |
|
Aioi Insurance Co., Ltd. |
| 3,000 |
| 16 |
|
Ajinomoto Co., Inc. (c) |
| 73,400 |
| 800 |
|
Alps Electric Co., Ltd. |
| 16,000 |
| 78 |
|
Amada Co., Ltd. |
| 28,000 |
| 135 |
|
Aozora Bank Ltd. |
| 3,100 |
| 3 |
|
Asahi Breweries Ltd. |
| 22,600 |
| 389 |
|
Asahi Glass Co., Ltd. |
| 123,800 |
| 703 |
|
Asahi Kasei Corp. |
| 121,000 |
| 532 |
|
12 | The accompanying notes are an integral part of the financial statements. |
|
| 2008 Annual Report |
|
|
| December 31, 2008 |
Portfolio of Investments (cont’d)
Active International Allocation Portfolio
|
|
|
| Value |
|
|
| Shares |
| (000) |
|
Japan (cont’d) |
|
|
|
|
|
Asatsu-DK, Inc. (c) |
| 3,600 |
| $ 81 |
|
Astellas Pharma, Inc. |
| 46,700 |
| 1,900 |
|
Bank of Kyoto Ltd. (The) (c) |
| 29,000 |
| 325 |
|
Bank of Yokohama Ltd. (The) |
| 180,000 |
| 1,065 |
|
Benesse Corp. |
| 5,900 |
| 258 |
|
Bridgestone Corp. (c) |
| 91,000 |
| 1,367 |
|
Canon, Inc. |
| 96,300 |
| 3,023 |
|
Casio Computer Co., Ltd. |
| 38,500 |
| 242 |
|
Central Japan Railway Co. |
| 150 |
| 1,296 |
|
Chiba Bank Ltd. (The) |
| 77,000 |
| 481 |
|
Chiyoda Corp. |
| 20,000 |
| 111 |
|
Chubu Electric Power Co., Inc. |
| 55,600 |
| 1,690 |
|
Chugai Pharmaceutical Co., Ltd. |
| 24,507 |
| 474 |
|
Chuo Mitsui Trust Holdings, Inc. |
| 62,545 |
| 306 |
|
Citizen Holdings Co., Ltd. (c) |
| 32,800 |
| 119 |
|
Coca-Cola West Co., Ltd. (c) |
| 700 |
| 15 |
|
COMSYS Holdings Corp. (c) |
| 17,000 |
| 158 |
|
Credit Saison Co., Ltd. |
| 6,700 |
| 92 |
|
CSK Holdings Corp. (c) |
| 7,100 |
| 39 |
|
Dai Nippon Printing Co., Ltd. |
| 44,600 |
| 492 |
|
Daicel Chemical Industries Ltd. (c) |
| 15,000 |
| 71 |
|
Daiichi Sankyo Co., Ltd. |
| 63,400 |
| 1,507 |
|
Daikin Industries Ltd. (c) |
| 17,800 |
| 469 |
|
Dainippon Ink & Chemicals, Inc. |
| 66,000 |
| 138 |
|
Daito Trust Construction Co., Ltd. |
| 16,500 |
| 864 |
|
Daiwa House Industry Co., Ltd. (c) |
| 85,600 |
| 838 |
|
Daiwa Securities Group, Inc. |
| 186,000 |
| 1,108 |
|
Denki Kagaku Kogyo KK |
| 42,000 |
| 103 |
|
Denso Corp. |
| 65,350 |
| 1,087 |
|
Dowa Holdings, Co., Ltd. (c) |
| 57,000 |
| 210 |
|
East Japan Railway Co. |
| 369 |
| 2,882 |
|
Ebara Corp. (c) |
| 32,800 |
| 76 |
|
Eisai Co., Ltd. |
| 21,802 |
| 903 |
|
FamilyMart Co., Ltd. |
| 5,900 |
| 256 |
|
Fanuc Ltd. (c) |
| 18,500 |
| 1,316 |
|
Fast Retailing Co., Ltd. |
| 9,000 |
| 1,312 |
|
Fuji Electric Holdings Co., Ltd. (c) |
| 15,000 |
| 23 |
|
Fuji Media Holdings, Inc. |
| 36 |
| 51 |
|
Fuji Soft, Inc. (c) |
| 3,500 |
| 74 |
|
FUJIFILM Holdings Corp. |
| 45,700 |
| 1,006 |
|
Fujikura Ltd. |
| 24,000 |
| 79 |
|
Fujitsu Ltd. (c) |
| 172,200 |
| 832 |
|
Fukuoka Financial Group, Inc. |
| 105,000 |
| 457 |
|
Furukawa Electric Co., Ltd. (c) |
| 58,800 |
| 286 |
|
Gunma Bank Ltd. (The) |
| 3,000 |
| 19 |
|
H2O Retailing Corp. (c) |
| 10,000 |
| 75 |
|
Hachijuni Bank Ltd. (The) |
| 3,000 |
| 17 |
|
Hirose Electric Co., Ltd. (c) |
| 2,800 |
| 283 |
|
Hiroshima Bank Ltd. (The) |
| 5,000 |
| 22 |
|
Hitachi Construction Machinery Co., Ltd. (c) |
| 3,100 |
| 37 |
|
Hitachi Ltd. |
| 313,000 |
| 1,214 |
|
Hokkaido Electric Power Co., Inc. (c) |
| 11,000 |
| 278 |
|
Hokuhoku Financial Group, Inc. |
| 199,000 |
| 471 |
|
Honda Motor Co., Ltd. |
| 155,204 |
| 3,366 |
|
Hoya Corp. (c) |
| 38,600 |
| 671 |
|
Ibiden Co., Ltd. (c) |
| 11,200 |
| 231 |
|
IHI Corp. (c) |
| 102,000 |
| 129 |
|
INPEX Corp. |
| 47 |
| 371 |
|
Isetan Mitsukoshi Holdings Ltd. (a) |
| 31,680 |
| 273 |
|
IT Holdings Corp. (a) |
| 3,304 |
| 51 |
|
Ito En Ltd. (c) |
| 2,100 |
| 31 |
|
Ito En Ltd. (Preference) |
| 630 |
| 6 |
|
Itochu Corp. |
| 164,000 |
| 823 |
|
Itochu Techno-Solutions Corp. (c) |
| 2,900 |
| 71 |
|
J Front Retailing Co., Ltd. |
| 38,000 |
| 157 |
|
Jafco Co., Ltd. |
| 300 |
| 8 |
|
Japan Airlines Corp. (a)(c) |
| 89,000 |
| 211 |
|
Japan Prime Realty Investment Corp. REIT |
| 3 |
| 7 |
|
Japan Real Estate Investment Corp. REIT |
| 53 |
| 476 |
|
Japan Retail Fund Investment Corp. REIT |
| 48 |
| 208 |
|
Japan Tobacco, Inc. |
| 392 |
| 1,298 |
|
JFE Holdings, Inc. (c) |
| 37,500 |
| 992 |
|
JGC Corp. |
| 26,000 |
| 391 |
|
Joyo Bank Ltd. (The) |
| 139,000 |
| 792 |
|
JS Group Corp. |
| 24,500 |
| 379 |
|
JSR Corp. (c) |
| 14,800 |
| 167 |
|
Kajima Corp. |
| 127,400 |
| 446 |
|
Kamigumi Co., Ltd. (c) |
| 1,000 |
| 9 |
|
Kaneka Corp. |
| 24,000 |
| 153 |
|
Kansai Electric Power Co., Inc. (The) |
| 79,400 |
| 2,301 |
|
Kao Corp. |
| 59,000 |
| 1,787 |
|
Kawasaki Heavy Industries Ltd. (c) |
| 102,000 |
| 207 |
|
Kawasaki Kisen Kaisha Ltd. (c) |
| 6,000 |
| 28 |
|
Keihin Electric Express Railway Co., Ltd. (c) |
| 39,000 |
| 344 |
|
Keio Corp. (c) |
| 24,000 |
| 144 |
|
Keyence Corp. |
| 3,300 |
| 676 |
|
Kikkoman Corp. |
| 12,000 |
| 142 |
|
Kinden Corp. |
| 1,000 |
| 9 |
|
Kintetsu Corp. (c) |
| 171,200 |
| 787 |
|
Kirin Brewery Co., Ltd. |
| 55,400 |
| 730 |
|
Kobe Steel Ltd. (c) |
| 189,000 |
| 348 |
|
Kokuyo Co., Ltd. |
| 6,600 |
| 48 |
|
Komatsu Ltd. |
| 108,300 |
| 1,372 |
|
Konami Corp. (c) |
| 9,900 |
| 255 |
|
Konica Minolta Holdings, Inc. |
| 42,500 |
| 329 |
|
Kubota Corp. |
| 148,000 |
| 1,064 |
|
Kuraray Co., Ltd. |
| 34,000 |
| 265 |
|
Kurita Water Industries Ltd. (c) |
| 6,500 |
| 175 |
|
Kyocera Corp. |
| 15,200 |
| 1,096 |
|
Kyowa Hakko Kogyo Co., Ltd. |
| 28,028 |
| 293 |
|
Kyushu Electric Power Co., Inc. |
| 34,600 |
| 920 |
|
Lawson, Inc. |
| 5,600 |
| 323 |
|
Leopalace21 Corp. |
| 12,300 |
| 125 |
|
Mabuchi Motor Co., Ltd. (c) |
| 2,900 |
| 120 |
|
Marubeni Corp. |
| 222,000 |
| 846 |
|
| The accompanying notes are an integral part of the financial statements. | 13 |
2008 Annual Report
December 31, 2008
Portfolio of Investments (cont’d)
Active International Allocation Portfolio
|
|
|
| Value |
|
|
| Shares |
| (000) |
|
Japan (cont’d) |
|
|
|
|
|
Marui Group Co., Ltd. |
| 41,100 |
| $ 239 |
|
Matsui Securities Co., Ltd. (c) |
| 18,100 |
| 151 |
|
Meiji Dairies Corp. |
| 19,000 |
| 102 |
|
Meiji Seika Kaisha Ltd. (c) |
| 22,000 |
| 106 |
|
Meitec Corp. |
| 2,700 |
| 47 |
|
Millea Holdings, Inc. |
| 84,052 |
| 2,463 |
|
Minebea Co., Ltd. |
| 35,000 |
| 120 |
|
Mitsubishi Chemical Holdings Corp. |
| 88,500 |
| 391 |
|
Mitsubishi Corp. |
| 146,700 |
| 2,059 |
|
Mitsubishi Electric Corp. |
| 209,800 |
| 1,313 |
|
Mitsubishi Estate Co., Ltd. |
| 109,000 |
| 1,798 |
|
Mitsubishi Heavy Industries Ltd. (c) |
| 356,000 |
| 1,588 |
|
Mitsubishi Logistics Corp. |
| 8,000 |
| 101 |
|
Mitsubishi Materials Corp. |
| 187,000 |
| 471 |
|
Mitsubishi Rayon Co., Ltd. (c) |
| 48,000 |
| 145 |
|
Mitsubishi UFJ Financial Group, Inc. (o) |
| 819,746 |
| 5,087 |
|
Mitsubishi UFJ Lease & Finance Co., Ltd. (o) |
| 600 |
| 15 |
|
Mitsui & Co., Ltd. |
| 178,800 |
| 1,829 |
|
Mitsui Chemicals, Inc. (c) |
| 48,000 |
| 177 |
|
Mitsui Fudosan Co., Ltd. |
| 77,400 |
| 1,286 |
|
Mitsui Mining & Smelting Co., Ltd. |
| 110,000 |
| 232 |
|
Mitsui OSK Lines Ltd. (c) |
| 15,000 |
| 92 |
|
Mitsui Sumitomo Insurance Group Holdings, Inc. |
| 41,400 |
| 1,320 |
|
Mizuho Financial Group, Inc. (c) |
| 1,063 |
| 3,164 |
|
Mizuho Trust & Banking Co., Ltd. |
| 6,000 |
| 8 |
|
Murata Manufacturing Co., Ltd. |
| 18,900 |
| 741 |
|
Namco Bandai Holdings, Inc. (c) |
| 2,400 |
| 26 |
|
NEC Corp. |
| 186,400 |
| 626 |
|
NEC Electronics Corp. (a) |
| 4,500 |
| 42 |
|
NGK Insulators Ltd. (c) |
| 37,600 |
| 423 |
|
NGK Spark Plug Co., Ltd. (c) |
| 23,000 |
| 184 |
|
Nidec Corp. |
| 10,200 |
| 397 |
|
Nikon Corp. (c) |
| 30,000 |
| 359 |
|
Nintendo Co., Ltd. |
| 7,400 |
| 2,843 |
|
Nippon Building Fund, Inc. REIT |
| 65 |
| 713 |
|
Nippon Electric Glass Co., Ltd. |
| 29,500 |
| 155 |
|
Nippon Express Co., Ltd. |
| 89,800 |
| 378 |
|
Nippon Meat Packers, Inc. |
| 21,600 |
| 326 |
|
Nippon Mining Holdings, Inc. |
| 49,500 |
| 213 |
|
Nippon Oil Corp. |
| 157,800 |
| 795 |
|
Nippon Paper Group, Inc. |
| 83 |
| 339 |
|
Nippon Sheet Glass Co., Ltd. (c) |
| 41,000 |
| 135 |
|
Nippon Steel Corp. (c) |
| 487,000 |
| 1,599 |
|
Nippon Telegraph & Telephone Corp. |
| 284 |
| 1,526 |
|
Nippon Yusen KK |
| 115,000 |
| 709 |
|
Nipponkoa Insurance Co., Ltd. |
| 3,000 |
| 23 |
|
Nishi-Nippon City Bank Ltd. (The) |
| 58,000 |
| 168 |
|
Nissan Chemical Industries Ltd. |
| 13,000 |
| 126 |
|
Nissan Motor Co., Ltd. (c) |
| 230,800 |
| 836 |
|
Nisshin Seifun Group, Inc. |
| 15,000 |
| 197 |
|
Nisshinbo Industries, Inc. |
| 7,000 |
| 53 |
|
Nissin Foods Holdings Co., Ltd. |
| 7,400 |
| 260 |
|
Nitto Denko Corp. |
| 20,700 |
| 398 |
|
Nomura Holdings, Inc. |
| 262,300 |
| 2,163 |
|
Nomura Real Estate Holdings, Inc. (c) |
| 500 |
| 10 |
|
Nomura Real Estate Office Fund, Inc. REIT |
| 1 |
| 6 |
|
Nomura Research Institute Ltd. (c) |
| 12,600 |
| 239 |
|
NSK Ltd. |
| 69,000 |
| 259 |
|
NTN Corp. (c) |
| 49,000 |
| 148 |
|
NTT Data Corp. |
| 142 |
| 570 |
|
NTT DoCoMo, Inc. |
| 387 |
| 763 |
|
NTT Urban Development Corp. |
| 7 |
| 8 |
|
Obayashi Corp. |
| 85,000 |
| 507 |
|
Obic Co., Ltd. |
| 830 |
| 136 |
|
OJI Paper Co., Ltd. (c) |
| 112,400 |
| 661 |
|
Oki Electric Industry Co., Ltd. (a)(c) |
| 51,000 |
| 33 |
|
Okumura Corp. (c) |
| 23,000 |
| 116 |
|
Olympus Corp. (c) |
| 13,000 |
| 261 |
|
Omron Corp. |
| 20,500 |
| 275 |
|
Onward Holdings Co., Ltd. |
| 20,000 |
| 159 |
|
Oracle Corp. Japan (c) |
| 3,300 |
| 143 |
|
Oriental Land Co., Ltd. (c) |
| 6,700 |
| 551 |
|
ORIX Corp. |
| 1,040 |
| 59 |
|
Osaka Gas Co., Ltd. |
| 206,600 |
| 954 |
|
Panasonic Corp. |
| 205,000 |
| 2,569 |
|
Panasonic Electric Works Co., Ltd. |
| 30,000 |
| 267 |
|
Pioneer Corp. |
| 16,854 |
| 31 |
|
Promise Co., Ltd. (c) |
| 3,500 |
| 89 |
|
Resona Holdings, Inc. (c) |
| 529 |
| 839 |
|
Ricoh Co., Ltd. |
| 61,000 |
| 777 |
|
Rohm Co., Ltd. |
| 13,400 |
| 677 |
|
Sanken Electric Co., Ltd. (c) |
| 14,000 |
| 55 |
|
Sanyo Electric Co., Ltd. (a)(c) |
| 171,000 |
| 320 |
|
Sapporo Hokuyo Holdings, Inc. |
| 2 |
| 8 |
|
Sapporo Holdings Ltd. (c) |
| 12,000 |
| 76 |
|
SBI Holdings, Inc. (c) |
| 948 |
| 146 |
|
Secom Co., Ltd. (c) |
| 17,100 |
| 881 |
|
Seiko Epson Corp. (c) |
| 11,200 |
| 178 |
|
Sekisui Chemical Co., Ltd. |
| 52,000 |
| 325 |
|
Sekisui House Ltd. |
| 103,600 |
| 907 |
|
Seven & I Holdings Co., Ltd. (c) |
| 75,200 |
| 2,576 |
|
Sharp Corp. (c) |
| 85,200 |
| 611 |
|
Shimachu Co., Ltd. |
| 6,300 |
| 142 |
|
Shimamura Co., Ltd. |
| 2,400 |
| 186 |
|
Shimano, Inc. |
| 10,200 |
| 409 |
|
Shimizu Corp. (c) |
| 88,600 |
| 517 |
|
Shin-Etsu Chemical Co., Ltd. |
| 39,596 |
| 1,816 |
|
Shinko Securities Co., Ltd. |
| 67,000 |
| 147 |
|
Shinsei Bank Ltd. |
| 168,000 |
| 266 |
|
Shionogi & Co., Ltd. |
| 25,000 |
| 642 |
|
Shiseido Co., Ltd. |
| 37,000 |
| 757 |
|
Shizuoka Bank Ltd. (The) |
| 67,000 |
| 776 |
|
Showa Denko KK |
| 59,000 |
| 85 |
|
Showa Shell Sekiyu KK |
| 16,700 |
| 165 |
|
SMC Corp. |
| 6,600 |
| 675 |
|
14 | The accompanying notes are an integral part of the financial statements. |
|
| 2008 Annual Report |
|
|
| December 31, 2008 |
Portfolio of Investments (cont’d)
Active International Allocation Portfolio
|
|
|
| Value |
|
|
| Shares |
| (000) |
|
Japan (cont’d) |
|
|
|
|
|
Softbank Corp. |
| 94,700 |
| $ 1,715 |
|
Sompo Japan Insurance, Inc. |
| 95,000 |
| 696 |
|
Sony Corp. |
| 72,497 |
| 1,576 |
|
Sony Financial Holdings, Inc. |
| 8 |
| 31 |
|
Stanley Electric Co., Ltd. |
| 7,300 |
| 77 |
|
Sumitomo Chemical Co., Ltd. |
| 137,600 |
| 470 |
|
Sumitomo Corp. (c) |
| 107,500 |
| 947 |
|
Sumitomo Electric Industries Ltd. |
| 67,200 |
| 517 |
|
Sumitomo Heavy Industries Ltd. |
| 42,000 |
| 167 |
|
Sumitomo Metal Industries Ltd. |
| 290,000 |
| 715 |
|
Sumitomo Metal Mining Co., Ltd. |
| 106,800 |
| 1,135 |
|
Sumitomo Mitsui Financial Group, Inc. (c) |
| 532 |
| 2,304 |
|
Sumitomo Realty & Development Co., Ltd. (c) |
| 33,000 |
| 492 |
|
Sumitomo Trust & Banking Co., Ltd. (The) |
| 143,000 |
| 846 |
|
Suruga Bank Ltd. |
| 2,000 |
| 20 |
|
T&D Holdings, Inc. |
| 26,050 |
| 1,092 |
|
Taiheiyo Cement Corp. |
| 61,000 |
| 118 |
|
Taisei Corp. |
| 122,000 |
| 336 |
|
Taisho Pharmaceutical Co., Ltd. |
| 13,441 |
| 286 |
|
Taiyo Yuden Co., Ltd. |
| 8,000 |
| 45 |
|
Takara Holdings, Inc. |
| 7,000 |
| 41 |
|
Takashimaya Co., Ltd. |
| 38,000 |
| 288 |
|
Takeda Pharmaceutical Co., Ltd. |
| 77,000 |
| 3,994 |
|
Takefuji Corp. |
| 4,690 |
| 38 |
|
TDK Corp. |
| 11,700 |
| 430 |
|
Teijin Ltd. |
| 85,400 |
| 241 |
|
Terumo Corp. |
| 20,100 |
| 941 |
|
THK Co., Ltd. |
| 3,900 |
| 41 |
|
Tobu Railway Co., Ltd. (c) |
| 92,400 |
| 550 |
|
Toho Co., Ltd. |
| 7,300 |
| 157 |
|
Tohoku Electric Power Co., Inc. |
| 47,100 |
| 1,275 |
|
Tokyo Broadcasting System, Inc. |
| 10,500 |
| 160 |
|
Tokyo Electric Power Co., Inc. (The) |
| 115,600 |
| 3,860 |
|
Tokyo Electron Ltd. |
| 20,400 |
| 716 |
|
Tokyo Gas Co., Ltd. |
| 241,600 |
| 1,224 |
|
Tokyo Tatemono Co., Ltd. |
| 25,000 |
| 114 |
|
Tokyu Corp. |
| 105,400 |
| 530 |
|
Tokyu Land Corp. |
| 2,000 |
| 8 |
|
TonenGeneral Sekiyu KK (c) |
| 33,000 |
| 330 |
|
Toppan Printing Co., Ltd. |
| 43,600 |
| 336 |
|
Toray Industries, Inc. (c) |
| 121,100 |
| 617 |
|
Toshiba Corp. |
| 268,000 |
| 1,103 |
|
Tosoh Corp. |
| 49,000 |
| 120 |
|
Toto Ltd. (c) |
| 49,600 |
| 311 |
|
Toyo Seikan Kaisha Ltd. |
| 18,900 |
| 326 |
|
Toyoda Gosei Co., Ltd. (c) |
| 800 |
| 9 |
|
Toyota Industries Corp. |
| 9,350 |
| 200 |
|
Toyota Motor Corp. |
| 251,000 |
| 8,216 |
|
Trend Micro, Inc. (a) |
| 10,700 |
| 374 |
|
Unicharm Corp. (c) |
| 4,000 |
| 302 |
|
UNY Co., Ltd. |
| 12,000 |
| 132 |
|
Urban Corp. |
| 1,600 |
| — | @ |
Ushio, Inc. |
| 4,000 |
| 53 |
|
USS Co., Ltd. |
| 3,120 |
| 165 |
|
Wacoal Holdings Corp. (c) |
| 7,000 |
| 91 |
|
West Japan Railway Co. |
| 38 |
| 173 |
|
Yahoo! Japan Corp. (c) |
| 1,691 |
| 692 |
|
Yakult Honsha Co., Ltd. (c) |
| 10,100 |
| 216 |
|
Yamada Denki Co., Ltd. |
| 11,320 |
| 786 |
|
Yamaha Corp. |
| 10,200 |
| 95 |
|
Yamaha Motor Co., Ltd. (c) |
| 3,100 |
| 32 |
|
Yamato Holdings Co., Ltd. |
| 28,000 |
| 365 |
|
Yamazaki Baking Co., Ltd. (c) |
| 10,000 |
| 154 |
|
Yokogawa Electric Corp. (c) |
| 19,600 |
| 129 |
|
|
|
|
| 170,702 |
|
Mexico (0.2%) |
|
|
|
|
|
Corp. GEO S.A.B. de C.V., Class B (a)(c) |
| 91,400 |
| 103 |
|
Desarrolladora Homex S.A.B. de C.V. ADR (a) |
| 8,600 |
| 197 |
|
Urbi Desarrollos Urbanos S.A.B de C.V. (a) |
| 46,400 |
| 63 |
|
Wal-Mart de Mexico S.A.B. de C.V., Class V |
| 168,417 |
| 450 |
|
|
|
|
| 813 |
|
Netherlands (2.4%) |
|
|
|
|
|
Aegon N.V. |
| 96,896 |
| 618 |
|
Akzo Nobel N.V. |
| 15,894 |
| 655 |
|
ASML Holding N.V. (c) |
| 31,721 |
| 566 |
|
Fugro N.V. CVA |
| 4,917 |
| 141 |
|
Heineken N.V. |
| 22,255 |
| 684 |
|
ING Groep N.V. CVA |
| 86,743 |
| 907 |
|
Koninklijke Ahold N.V. |
| 1,806 |
| 22 |
|
Koninklijke DSM N.V. (c) |
| 9,080 |
| 233 |
|
Koninklijke KPN N.V. |
| 138,789 |
| 2,013 |
|
Koninklijke Numico N.V. (a) |
| 9,003 |
| 688 |
|
Koninklijke Philips Electronics N.V. (c) |
| 50,999 |
| 992 |
|
Reed Elsevier N.V. |
| 42,115 |
| 496 |
|
SBM Offshore N.V. (c) |
| 12,147 |
| 159 |
|
TNT N.V. |
| 32,654 |
| 627 |
|
Unilever N.V. CVA (c) |
| 188,158 |
| 4,559 |
|
Wolters Kluwer N.V. |
| 27,245 |
| 515 |
|
|
|
|
| 13,875 |
|
New Zealand (0.0%) |
|
|
|
|
|
Telecom Corp. of New Zealand Ltd. |
| 19,672 |
| 26 |
|
Norway (0.6%) |
|
|
|
|
|
Aker Kvaerner ASA |
| 13,920 |
| 92 |
|
DNB NOR ASA |
| 22,725 |
| 91 |
|
Norsk Hydro ASA (c) |
| 52,107 |
| 210 |
|
Orkla ASA (c) |
| 47,680 |
| 317 |
|
Prosafe Production Public Ltd. (a)(c) |
| 29,937 |
| 48 |
|
SeaDrill Ltd. (c) |
| 23,700 |
| 193 |
|
StatoilHydro ASA |
| 101,843 |
| 1,677 |
|
Telenor ASA (c) |
| 58,103 |
| 389 |
|
Yara International ASA (c) |
| 27,938 |
| 611 |
|
|
|
|
| 3,628 |
|
| The accompanying notes are an integral part of the financial statements. | 15 |
2008 Annual Report
December 31, 2008
Portfolio of Investments (cont’d)
Active International Allocation Portfolio
|
|
|
| Value |
|
|
| Shares |
| (000) |
|
Portugal (0.2%) |
|
|
|
|
|
Banco Comercial Portugues S.A. (Registered), Class R (a)(c) |
| 115,280 |
| $ 132 |
|
Brisa-Auto Estradas de Portugal S.A. (c) |
| 23,604 |
| 177 |
|
Energias de Portugal S.A. |
| 40,425 |
| 152 |
|
Portugal Telecom SGPS S.A. (c) |
| 53,269 |
| 452 |
|
Zon Multimedia Servicos de Telecommicacoes e Multimedia SGPS S.A. (c) |
| 17,308 |
| 90 |
|
|
|
|
| 1,003 |
|
Russia (0.0%) |
|
|
|
|
|
Unified Energy System OAO GDR (a) |
| 1,348 |
| 31 |
|
Wimm-Bill-Dann Foods OJSC ADR (a)(c) |
| 5,600 |
| 147 |
|
|
|
|
| 178 |
|
Singapore (1.5%) |
|
|
|
|
|
Ascendas REIT |
| 106,000 |
| 103 |
|
CapitaCommercial Trust REIT (c) |
| 106,000 |
| 66 |
|
CapitaLand Ltd. |
| 183,000 |
| 402 |
|
CapitaMall Trust REIT (c) |
| 120,514 |
| 134 |
|
City Developments Ltd. |
| 64,741 |
| 289 |
|
ComfortDelgro Corp., Ltd. |
| 196,538 |
| 199 |
|
Cosco Corp. Singapore Ltd. (c) |
| 117,000 |
| 79 |
|
DBS Group Holdings Ltd. |
| 126,678 |
| 752 |
|
Fraser & Neave Ltd. |
| 106,000 |
| 219 |
|
Golden Agri-Resources Ltd. |
| 551,842 |
| 92 |
|
Jardine Cycle & Carriage Ltd. |
| 22,034 |
| 146 |
|
Keppel Corp. Ltd. (c) |
| 139,000 |
| 421 |
|
Olam International Ltd. |
| 145,000 |
| 117 |
|
Oversea-Chinese Banking Corp. Ltd. (c) |
| 264,758 |
| 922 |
|
Parkway Holdings Ltd. |
| 52,000 |
| 45 |
|
Raffles Education Corp. Ltd. |
| 52,862 |
| 21 |
|
SembCorp Industries Ltd. |
| 106,183 |
| 173 |
|
SembCorp Marine Ltd. |
| 94,000 |
| 111 |
|
Singapore Airlines Ltd. |
| 78,010 |
| 612 |
|
Singapore Exchange Ltd. (c) |
| 92,581 |
| 332 |
|
Singapore Press Holdings Ltd. |
| 134,083 |
| 290 |
|
Singapore Telecommunications Ltd. |
| 851,115 |
| 1,515 |
|
United Overseas Bank Ltd. |
| 136,448 |
| 1,232 |
|
UOL Group Ltd. |
| 56,217 |
| 87 |
|
Venture Corp., Ltd. (c) |
| 25,530 |
| 78 |
|
Wilmar International Ltd. |
| 94,000 |
| 184 |
|
|
|
|
| 8,621 |
|
South Africa (0.0%) |
|
|
|
|
|
Mondi Ltd. |
| 1,426 |
| 5 |
|
Spain (3.4%) |
|
|
|
|
|
Abertis Infraestructuras S.A. (c) |
| 20,913 |
| 372 |
|
Acerinox S.A. (c) |
| 11,233 |
| 180 |
|
ACS Actividades de Construccion y Servicios S.A. |
| 225 |
| 10 |
|
Banco Bilbao Vizcaya Argentaria S.A. |
| 90,633 |
| 1,112 |
|
Banco Popular Espanol S.A. (c) |
| 59,122 |
| 513 |
|
Banco Santander S.A. |
| 240,553 |
| 2,322 |
|
Cintra Concesiones de Infraestructuras de Transporte S.A. |
| 9,914 |
| 75 |
|
Gas Natural SDG S.A. |
| 14,077 |
| 384 |
|
Iberdrola S.A. |
| 186,112 |
| 1,728 |
|
Inditex S.A. (c) |
| 40,797 |
| 1,803 |
|
Indra Sistemas S.A. (c) |
| 3,088 |
| 70 |
|
Mapfre S.A. (c) |
| 29,616 |
| 101 |
|
Repsol YPF S.A. |
| 79,530 |
| 1,694 |
|
Telefonica S.A. |
| 395,687 |
| 8,870 |
|
Union Fenosa S.A. |
| 13,754 |
| 340 |
|
|
|
|
| 19,574 |
|
Sweden (1.7%) |
|
|
|
|
|
Alfa Laval AB (c) |
| 4,456 |
| 39 |
|
Assa Abloy AB, Class B (c) |
| 18,241 |
| 207 |
|
Atlas Copco AB, Class A (c) |
| 120,279 |
| 1,035 |
|
Atlas Copco AB, Class B |
| 21,894 |
| 168 |
|
Electrolux AB, Class B (c) |
| 12,800 |
| 110 |
|
Getinge AB, Class B (c) |
| 15,247 |
| 183 |
|
Hennes & Mauritz AB, Class B |
| 20,492 |
| 801 |
|
Holmen AB, Class B |
| 3,400 |
| 84 |
|
Husqvarna AB, Class B (c) |
| 12,800 |
| 68 |
|
Investor AB, Class B (c) |
| 26,655 |
| 401 |
|
Lundin Petroleum AB (a)(c) |
| 18,642 |
| 99 |
|
Modern Times Group AB, Class B |
| 3,950 |
| 86 |
|
Nordea Bank AB (c) |
| 178,500 |
| 1,256 |
|
Sandvik AB (c) |
| 59,290 |
| 377 |
|
Securitas AB, Class B (c) |
| 800 |
| 6 |
|
Skanska AB, Class B (c) |
| 18,129 |
| 181 |
|
Ssab Svenskt Stal AB, Class A (c) |
| 11,481 |
| 101 |
|
Svenska Cellulosa AB, Class B |
| 39,566 |
| 338 |
|
Svenska Handelsbanken AB, Class A |
| 39,509 |
| 643 |
|
Swedish Match AB |
| 23,165 |
| 332 |
|
Tele2 AB, Class B |
| 11,276 |
| 100 |
|
Telefonaktiebolaget LM Ericsson, Class B (c) |
| 255,283 |
| 1,958 |
|
TeliaSonera AB |
| 120,137 |
| 598 |
|
Volvo AB, Class A (c) |
| 26,675 |
| 150 |
|
Volvo AB, Class B (c) |
| 64,025 |
| 354 |
|
|
|
|
| 9,675 |
|
Switzerland (9.8%) |
|
|
|
|
|
ABB Ltd. (Registered) (a) |
| 137,881 |
| 2,078 |
|
Baloise Holding AG |
| 2,281 |
| 171 |
|
Compagnie Financiere Richemont S.A. (c) |
| 39,899 |
| 775 |
|
Credit Suisse Group (Registered) |
| 77,714 |
| 2,130 |
|
Geberit AG (Registered) |
| 2,713 |
| 292 |
|
Givaudan S.A. (Registered) |
| 527 |
| 415 |
|
Holcim Ltd. (Registered) |
| 17,313 |
| 997 |
|
Julius Baer Holding AG |
| 12,453 |
| 479 |
|
Logitech International S.A. (Registered) (a)(c) |
| 18,316 |
| 286 |
|
Lonza Group AG (Registered) (c) |
| 3,536 |
| 327 |
|
Nestle S.A. (Registered) |
| 417,300 |
| 16,447 |
|
Nobel Biocare Holding AG (Registered) (c) |
| 12,695 |
| 260 |
|
Novartis AG (Registered) |
| 229,942 |
| 11,521 |
|
OC Oerlikon Corp. AG (Registered) (a) |
| 464 |
| 31 |
|
Roche Holding AG (Genusschein) |
| 69,154 |
| 10,645 |
|
Schindler Holding AG |
| 4,342 |
| 198 |
|
STMicroelectronics N.V. |
| 55,320 |
| 371 |
|
Straumann Holding AG (Registered) (c) |
| 830 |
| 146 |
|
16 | The accompanying notes are an integral part of the financial statements. |
|
| 2008 Annual Report |
|
|
| December 31, 2008 |
Portfolio of Investments (cont’d)
Active International Allocation Portfolio
|
|
|
| Value |
|
|
| Shares |
| (000) |
|
Switzerland (cont’d) |
|
|
|
|
|
Sulzer AG (Registered) |
| 313 |
| $ 18 |
|
Swatch Group AG (The) |
| 4,317 |
| 118 |
|
Swatch Group AG (The), Class B |
| 2,368 |
| 331 |
|
Swiss Life Holding AG (a) |
| 1,526 |
| 106 |
|
Swiss Reinsurance (Registered) |
| 30,710 |
| 1,492 |
|
Swisscom AG (Registered) |
| 1,991 |
| 643 |
|
Syngenta AG (Registered) |
| 11,596 |
| 2,247 |
|
Synthes, Inc. |
| 6,408 |
| 810 |
|
UBS AG (Registered) (a) |
| 69,907 |
| 1,014 |
|
Zurich Financial Services AG (Registered) |
| 8,104 |
| 1,759 |
|
|
|
|
| 56,107 |
|
United Kingdom (20.0%) |
|
|
|
|
|
3I Group plc |
| 28,582 |
| 113 |
|
AMEC plc |
| 18,916 |
| 135 |
|
Anglo American plc |
| 80,866 |
| 1,847 |
|
AstraZeneca plc |
| 152,431 |
| 6,176 |
|
Aviva plc |
| 195,010 |
| 1,104 |
|
BAE Systems plc |
| 220,384 |
| 1,201 |
|
Balfour Beatty plc |
| 32,230 |
| 154 |
|
Barclays plc |
| 393,205 |
| 886 |
|
Berkeley Group Holdings plc (a) |
| 5,144 |
| 65 |
|
BG Group plc |
| 252,960 |
| 3,512 |
|
BHP Billiton plc |
| 131,572 |
| 2,478 |
|
BP plc |
| 1,475,305 |
| 11,304 |
|
British Airways plc |
| 41,427 |
| 108 |
|
British American Tobacco plc |
| 192,660 |
| 5,006 |
|
British Sky Broadcasting Group plc |
| 128,380 |
| 893 |
|
BT Group plc, Class A |
| 741,822 |
| 1,458 |
|
Bunzl plc |
| 27,598 |
| 236 |
|
Burberry Group plc |
| 27,861 |
| 89 |
|
Cadbury plc |
| 91,543 |
| 801 |
|
Capita Group plc (The) |
| 8,472 |
| 90 |
|
Carnival plc |
| 10,876 |
| 237 |
|
Centrica plc |
| 321,961 |
| 1,237 |
|
Close Brothers Group plc |
| 3,491 |
| 27 |
|
Cobham plc |
| 75,726 |
| 225 |
|
Compass Group plc |
| 133,577 |
| 663 |
|
Daily Mail & General Trust, Class A |
| 22,419 |
| 88 |
|
Diageo plc |
| 233,128 |
| 3,243 |
|
Firstgroup plc |
| 28,266 |
| 177 |
|
Friends Provident plc |
| 146,894 |
| 184 |
|
G4S plc |
| 13,896 |
| 41 |
|
GKN plc |
| 27,325 |
| 39 |
|
GlaxoSmithKline plc |
| 527,967 |
| 9,801 |
|
Hays plc |
| 19,415 |
| 20 |
|
HBOS plc |
| 251,970 |
| 256 |
|
Home Retail Group plc |
| 35,804 |
| 110 |
|
HSBC Holdings plc |
| 388,568 |
| 3,719 |
|
ICAP plc |
| 3,278 |
| 14 |
|
IMI plc |
| 29,947 |
| 118 |
|
Imperial Tobacco Group plc |
| 63,422 |
| 1,694 |
|
Intercontinental Hotels Group plc |
| 21,651 |
| 176 |
|
International Power plc |
| 29,339 |
| 102 |
|
Invensys plc (a) |
| 11,595 |
| 29 |
|
ITV plc |
| 435,223 |
| 250 |
|
J. Sainsbury plc |
| 91,679 |
| 436 |
|
Johnson Matthey plc |
| 13,060 |
| 207 |
|
Kingfisher plc |
| 51,136 |
| 100 |
|
Ladbrokes plc |
| 35,645 |
| 95 |
|
Legal & General Group plc |
| 503,163 |
| 561 |
|
Lloyds TSB Group plc |
| 414,342 |
| 758 |
|
LogicaCMG plc |
| 74,870 |
| 75 |
|
London Stock Exchange Group plc |
| 1,887 |
| 14 |
|
Man Group plc |
| 153,007 |
| 528 |
|
Marks & Spencer Group plc |
| 74,430 |
| 232 |
|
Meggitt plc |
| 34,216 |
| 79 |
|
National Express Group plc |
| 8,751 |
| 62 |
|
National Grid plc |
| 363,951 |
| 3,597 |
|
Next plc |
| 11,465 |
| 180 |
|
Old Mutual plc |
| 157,558 |
| 126 |
|
Pearson plc |
| 58,216 |
| 540 |
|
Prudential plc |
| 144,016 |
| 877 |
|
Reckitt Benckiser Group plc |
| 111,990 |
| 4,172 |
|
Reed Elsevier plc |
| 79,548 |
| 580 |
|
Rexam plc |
| 38,576 |
| 197 |
|
Rio Tinto plc |
| 60,296 |
| 1,306 |
|
Rolls-Royce Group plc (a) |
| 120,169 |
| 589 |
|
Rolls-Royce Group plc, C Shares (a) |
| 6,202,196 |
| 9 |
|
Royal Bank of Scotland Group plc |
| 1,000,961 |
| 724 |
|
Royal Dutch Shell plc, Class A |
| 307,145 |
| 8,029 |
|
Royal Dutch Shell plc, Class B |
| 196,948 |
| 4,957 |
|
RSA Insurance Group plc |
| 100,260 |
| 200 |
|
SABMiller plc |
| 60,834 |
| 1,024 |
|
Sage Group plc (The) |
| 128,663 |
| 316 |
|
Schroders plc |
| 3,605 |
| 45 |
|
Scottish & Southern Energy plc |
| 114,674 |
| 2,019 |
|
Serco Group plc |
| 5,648 |
| 37 |
|
Severn Trent plc |
| 37,996 |
| 658 |
|
Smith & Nephew plc |
| 163,605 |
| 1,038 |
|
Smiths Group plc |
| 25,466 |
| 328 |
|
Stagecoach Group plc |
| 21,928 |
| 45 |
|
Standard Chartered plc |
| 42,603 |
| 545 |
|
Standard Life plc |
| 39,731 |
| 117 |
|
Tate & Lyle plc |
| 49,884 |
| 290 |
|
Tesco plc |
| 515,043 |
| 2,683 |
|
Thomson Reuters plc |
| 17,278 |
| 382 |
|
TI Automotive Ltd., Class A (a)(d)(l) |
| 1,505 |
| — |
|
Tomkins plc |
| 64,434 |
| 115 |
|
Unilever plc |
| 133,905 |
| 3,043 |
|
United Business Media Ltd. |
| 18,172 |
| 134 |
|
United Utilities Group plc |
| 20,334 |
| 184 |
|
Vodafone Group plc |
| 5,074,363 |
| 10,215 |
|
Whitbread plc |
| 12,255 |
| 162 |
|
Wolseley plc |
| 38,214 |
| 213 |
|
WPP plc |
| 175,391 |
| 1,022 |
|
Xstrata plc |
| 39,767 |
| 371 |
|
|
|
|
| 114,322 |
|
Total Common Stocks (Cost $686,644) |
|
|
| 555,717 |
|
| The accompanying notes are an integral part of the financial statements. | 17 |
2008 Annual Report |
|
|
|
December 31, 2008 |
|
Portfolio of Investments (cont’d)
Active International Allocation Portfolio
|
| No. of |
| Value |
|
|
| Rights |
| (000) |
|
Rights (0.0%) |
|
|
|
|
|
Australia (0.0%) |
|
|
|
|
|
Macquarie Office Trust, expires 1/20/09 (a) |
| 34,843 |
| $ 1 |
|
Belgium (0.0%) |
|
|
|
|
|
Fortis, expires 12/31/49 (a)(c) |
| 94,211 |
| — |
|
Japan (0.0%) |
|
|
|
|
|
Dowa Holdings, Co., Ltd., expires 1/29/10 (a) |
| 49,000 |
| — |
|
Singapore (0.0%) |
|
|
|
|
|
DBS Group Holdings Ltd., expires 1/20/09 (a) |
| 63,339 |
| 137 |
|
United States (0.0%) |
|
|
|
|
|
HBOS plc, expires 1/9/09 (a) |
| 348,701 |
| — |
|
Lloyds TSB Group, expires 1/9/09 (a) |
| 180,114 |
| — |
|
|
|
|
| — |
|
Total Rights (Cost $—) |
|
|
| 138 |
|
|
|
|
|
|
|
|
| No. of |
|
|
|
|
| Warrants |
|
|
|
Warrants (0.0%) |
|
|
|
|
|
Malaysia (0.0%) |
|
|
|
|
|
IJM Land Bhd, expires 9/11/13 |
|
|
|
|
|
(Cost $—) (a) |
| 39,680 |
| 2 |
|
|
|
|
|
|
|
|
| Shares |
|
|
|
Short-Term Investments (21.3%) |
|
|
|
|
|
Securities held as Collateral on Loaned Securities (21.3%) |
|
|
|
|
|
Investment Company (17.1%) |
|
|
|
|
|
Morgan Stanley Institutional Liquidity Money Market Portfolio —Institutional Class (o) |
| 97,759,879 |
| 97,760 |
|
|
|
|
|
|
|
|
| Face |
|
|
|
|
| Amount |
|
|
|
|
| (000) |
|
|
|
Repurchase Agreement (4.2%) |
|
|
|
|
|
Goldman Sachs & Co., 0.06%, dated 12/31/08, due 1/2/09, repurchase price $24,016; fully collateralized by U.S. government agency securities at the date of this Portfolio of Investments as follows: Federal Home Loan Mortgage Corp., Gold Pools: rates ranging from 4.50% to 6.00%, due 11/1/19 - 12/1/38; Federal National Mortgage Association, Fixed Rate Mortgages: rates ranging from 4.00% - 7.00%, due 9/1/18 - 1/1/39; Government National Mortgage Association, Fixed Rate Mortgages: rates ranging from 4.50% to 11.50%, due 6/15/16 - 12/20/38, valued at $24,496. |
| $ 24,016 |
| 24,016 |
|
|
|
|
| 121,776 |
|
Total Short-Term Investments (Cost $121,776) |
|
|
| 121,776 |
|
Total Investments (118.3%) (Cost $808,420) — |
|
|
|
|
|
including $115,931 of Securities Loaned (v) |
|
|
| 677,633 |
|
Liabilities in Excess of Other Assets (-18.3%) |
|
|
| (104,706 | ) |
Net Assets (100%) |
|
|
| $ 572,927 |
|
(a) |
| Non-income producing security. |
(c) |
| All or a portion of security on loan at December 31, 2008. |
(d) |
| At December 31, 2008, the Portfolio held approximately $23,000 of fair valued securities, representing less than 0.05% of net assets. These securities have been fair valued as determined in good faith under procedures established by and under the general supervision of the Portfolio’s Directors. |
(l) |
| Security has been deemed illiquid at December 31, 2008. |
(o) |
| See Note G to the financial statements regarding investment in Mitsubishi UFJ Financial Group, Inc., Mitsubishi UFJ Lease & Finance Co., Ltd. and Morgan Stanley Institutional Liquidity Money Market Portfolio — Institutional Class. |
(v) |
| The approximate market value and percentage of total investments, $554,008,000 and 81.8%, respectively, represent the securities that have been fair valued under the fair valuation policy for international investments as disclosed in Note A within the Notes to Financial Statements. |
@ |
| Value is less than $500. |
ADR |
| American Depositary Receipt |
CVA |
| Certificaten Van Aandelen |
GDR |
| Global Depositary Receipt |
PPS |
| Price Protected Shares |
REIT |
| Real Estate Investment Trust |
VVPR |
| Verminderde Voorheffing Precompte Reduit |
18 | The accompanying notes are an integral part of the financial statements. |
|
| 2008 Annual Report |
|
|
| December 31, 2008 |
Portfolio of Investments (cont’d)
Active International Allocation Portfolio
Foreign Currency Exchange Contract Information:
The Portfolio had the following foreign currency exchange contract(s) open at period end:
Currency |
|
| Value |
|
| Settlement |
| In |
| Value |
| Net |
| ||||||
EUR | 7,905 |
|
| $ 10,983 |
|
| 1/15/09 |
| USD | 10,150 |
|
| $ 10,150 |
|
| $ (833) |
|
| |
EUR | 7,905 |
|
| 10,983 |
|
| 1/15/09 |
| USD | 10,150 |
|
| 10,150 |
|
| (833) |
|
| |
EUR | 7,089 |
|
| 9,849 |
|
| 1/15/09 |
| USD | 9,132 |
|
| 9,132 |
|
| (717) |
|
| |
EUR | 206 |
|
| 287 |
|
| 1/15/09 |
| USD | 266 |
|
| 266 |
|
| (21) |
|
| |
EUR | 4,389 |
|
| 6,101 |
|
| 1/2/09 |
| USD | 6,210 |
|
| 6,210 |
|
| 109 |
|
| |
EUR | 4,145 |
|
| 5,762 |
|
| 1/2/09 |
| USD | 5,802 |
|
| 5,802 |
|
| 40 |
|
| |
EUR | 2,468 |
|
| 3,429 |
|
| 1/15/09 |
| USD | 3,180 |
|
| 3,180 |
|
| (249) |
|
| |
GBP | 11,741 |
|
| 16,875 |
|
| 1/15/09 |
| USD | 17,288 |
|
| 17,288 |
|
| 413 |
|
| |
GBP | 2,285 |
|
| 3,285 |
|
| 1/15/09 |
| USD | 3,377 |
|
| 3,377 |
|
| 92 |
|
| |
JPY | 11,960 |
|
| 132 |
|
| 1/5/09 |
| USD | 133 |
|
| 133 |
|
| 1 |
|
| |
JPY | 298,638 |
|
| 3,295 |
|
| 1/15/09 |
| USD | 3,306 |
|
| 3,306 |
|
| 11 |
|
| |
JPY | 742,833 |
|
| 8,196 |
|
| 1/15/09 |
| USD | 8,043 |
|
| 8,043 |
|
| (153) |
|
| |
JPY | 38,523 |
|
| 425 |
|
| 1/15/09 |
| USD | 417 |
|
| 417 |
|
| (8) |
|
| |
JPY | 6,587,063 |
|
| 72,680 |
|
| 1/15/09 |
| USD | 71,282 |
|
| 71,282 |
|
| (1,398) |
|
| |
NOK | 232 |
|
| 34 |
|
| 1/2/09 |
| USD | 33 |
|
| 33 |
|
| (1) |
|
| |
SEK | 326 |
|
| 42 |
|
| 1/2/09 |
| USD | 41 |
|
| 41 |
|
| (1) |
|
| |
USD | 12,020 |
|
| 12,020 |
|
| 1/15/09 |
| EUR | 8,417 |
|
| 11,694 |
|
| (326) |
|
| |
USD | 5,624 |
|
| 5,624 |
|
| 1/15/09 |
| EUR | 4,380 |
|
| 6,085 |
|
| 461 |
|
| |
USD | 20,541 |
|
| 20,541 |
|
| 1/15/09 |
| EUR | 15,942 |
|
| 22,151 |
|
| 1,610 |
|
| |
USD | 3,010 |
|
| 3,010 |
|
| 1/15/09 |
| EUR | 2,336 |
|
| 3,245 |
|
| 235 |
|
| |
USD | 5,872 |
|
| 5,872 |
|
| 1/15/09 |
| EUR | 4,579 |
|
| 6,362 |
|
| 490 |
|
| |
USD | 820 |
|
| 820 |
|
| 1/15/09 |
| GBP | 555 |
|
| 798 |
|
| (22) |
|
| |
USD | 2,420 |
|
| 2,420 |
|
| 1/15/09 |
| GBP | 1,640 |
|
| 2,357 |
|
| (63) |
|
| |
USD | 8,066 |
|
| 8,066 |
|
| 1/15/09 |
| GBP | 5,465 |
|
| 7,855 |
|
| (211) |
|
| |
USD | 32,772 |
|
| 32,772 |
|
| 1/15/09 |
| JPY | 3,028,464 |
|
| 33,415 |
|
| 643 |
|
| |
USD | 15,262 |
|
| 15,262 |
|
| 1/15/09 |
| JPY | 1,412,182 |
|
| 15,582 |
|
| 320 |
|
| |
USD | 8,690 |
|
| 8,690 |
|
| 1/15/09 |
| JPY | 802,531 |
|
| 8,855 |
|
| 165 |
|
| |
USD | 14,748 |
|
| 14,748 |
|
| 1/15/09 |
| JPY | 1,364,559 |
|
| 15,056 |
|
| 308 |
|
| |
USD | 5,207 |
|
| 5,207 |
|
| 1/15/09 |
| JPY | 481,787 |
|
| 5,316 |
|
| 109 |
|
| |
|
|
|
| $287,410 |
|
|
|
|
|
|
|
| $287,581 |
|
| $ 171 |
|
| |
EUR | — Euro |
GBP | — British Pound |
JPY | — Japanese Yen |
NOK | — Norwegian Krone |
SEK | — Swedish Krona |
USD | — United States Dollar |
Futures Contracts:
The Portfolio had the following futures contract(s) open at period end:
|
|
|
|
|
|
|
| Net |
| ||
|
|
|
|
|
|
|
| Unrealized |
| ||
|
| Number |
|
|
|
|
| Appreciation |
| ||
|
| of |
| Value |
| Expiration |
| (Depreciation) |
| ||
|
| Contracts |
| (000) |
| Date |
| (000) |
| ||
Long: |
|
|
|
|
|
|
|
|
| ||
DJ Euro STOXX 50 |
|
|
|
|
|
|
|
|
| ||
(Germany) |
| 503 |
| $17,130 |
| Mar-09 |
|
| $235 |
|
|
|
|
|
|
|
|
|
|
|
|
|
|
Short: |
|
|
|
|
|
|
|
|
|
|
|
TOPIX Index |
|
|
|
|
|
|
|
|
|
|
|
(Japan) |
| (68) |
| (6,466 | ) | Mar-09 |
|
| (7 | ) |
|
|
|
|
|
|
|
|
|
| $228 |
|
|
| The accompanying notes are an integral part of the financial statements. | 19 |
2008 Annual Report |
|
|
|
December 31, 2008 |
|
Investment Overview (unaudited)
Emerging Markets Portfolio
The Emerging Markets Portfolio (the “Portfolio”) seeks long-term capital appreciation by investing primarily in growth-oriented equity securities of issuers in emerging market countries. Foreign investing involves certain risks, including currency fluctuations and controls, restrictions on foreign investments, less governmental supervision and regulation, less liquidity and the potential for market volatility and political instability. In addition, investing in emerging markets may involve a relative higher degree of volatility.
Performance
For the year ended December 31, 2008, the Portfolio had a total return based on net asset value and reinvestment of distributions per share of -56.39%, net of fees, for the Class I shares. The Portfolio’s Class I shares underperformed against its benchmark the Morgan Stanley Capital International (MSCI) Emerging Markets Net Index (the “Index”) which returned -53.33%.
Factors Affecting Performance
· The MSCI Emerging Markets Index declined 53.3% in 2008, underperforming the developed markets for the one-year period. Latin America declined 51.4%, followed by Asia, which was down 53%. Emerging Europe, Middle East and Africa was the worst performing region, falling 55.7%.
· The year 2008 began with a prevailing concern for inflation in emerging markets as oil prices continued to outpace economic growth. In the second half of the year, while the price of oil and other commodities prices did retreat, the U.S. experienced an unprecedented credit crisis that led to global liquidity tightening, a sharp rise in risk aversion and further declines in the emerging markets. On the positive side, central bank tightening measures taken in the first half of 2008, coupled with falling commodity prices, have driven inflation lower in many emerging market economies and have allowed governments to cut interest rates at a fast pace. That said, however, good quality companies with strong balance sheets have largely become victims of collateral damage from the global credit crisis. We see this as an opportunity in our portfolio to buy and hold what we believe to be companies with higher-quality management, strong corporate governance and a competitive advantage.
· Overall, country allocation contributed favorably to relative performance. An overweight allocation to Panama and underweight allocations to Brazil, Russia and Hungary bolstered relative performance. Stock selection in India also added to relative gains.
· However, stock selection in China, Brazil and Mexico detracted from relative returns. An underweight allocation to Taiwan and stock selection within the country also hurt relative performance. Furthering dampening relative gains was an underweight allocation to Israel.
Management Strategies
· Early in 2008, we began reducing the Portfolio’s weightings in those countries with heavy energy and materials exposure. As such, during the year, we increased our underweight in Brazil and Russia. In South Africa, we shifted positions away from commodity-oriented stocks and into consumer staples stocks.
· Concurrently, we increased the Portfolio’s weightings in stocks and countries that we believe will benefit from easing commodity prices and moderating inflation pressures, such as Turkey, Poland and India. We believe these countries, and other net energy importers, are likely to show improvement in their current account deficits and may benefit from a lessening in pressure on their fiscal budgets. Falling prices for energy and other commodities are helping to reduce inflationary pressures in these countries and allowing their central banks to begin cutting interest rates. On a sector basis, the Portfolio is overwhelmingly overweight consumer discretionary, consumer staples and financials.
· At period-end, key overweight positions were Poland, Turkey, India, Indonesia and the Czech Republic. The largest underweight positions were Brazil, Taiwan, Malaysia, Israel and Korea.
· In the emerging markets, the era of high economic growth has ended but we believe growth at lower levels is likely to continue. By our analysis, growth may average pre-2002 levels of 3.5% to 4%, driven primarily by domestic consumption as the growth model that once depended on foreign flows will now depend on domestic savings.
20
| 2008 Annual Report |
|
|
| December 31, 2008 |
Investment Overview (cont’d)
Emerging Markets Portfolio
· Emerging markets consumers — in sharp contrast to their U.S. counterparts — remain underleveraged. Thus, as inflation further settles down and interest rates fall, domestic consumption in emerging markets could resume and provide some cushion to the investment and global economic slowdown. From an investment perspective, emerging markets were trading at a discount of some 25% to developed markets at the end of the period. In a low return world, we believe the emerging markets may hold relatively more appeal than the U.S. due to growth differentials.

* Minimum Investment
In accordance with SEC regulations, Portfolio’s performance shown assumes that all recurring fees (including management fees) were deducted and all dividends and distributions were reinvested. The performance of Class P shares will vary from the Class I shares based upon their different inception dates and will be negatively impacted by additional fees assessed to that class.
Performance Compared to the Morgan Stanley Capital International (MSCI) Emerging Markets Net Index(1) and the Lipper Emerging Markets Funds Index(2)
|
|
|
|
| Total Returns(3) |
| ||||
|
|
|
|
| Average Annual |
| ||||
|
| One |
| Five |
| Ten |
| Since |
| |
|
| Year |
| Years |
| Years |
| Inception | (6) | |
Portfolio — Class I (4) |
| (56.39 | )% | 7.30 | % | 9.40 | % | 7.09 | % | |
MSCI Emerging Markets Net Index |
| (53.33 | ) | 7.66 |
| 9.05 |
| 6.44 |
| |
Lipper Emerging Markets Funds Index |
| (54.76 | ) | 6.30 |
| 8.64 |
| — |
| |
|
|
|
|
|
|
|
|
|
| |
Portfolio — Class P (5) |
| (56.50 | ) | 7.03 |
| 9.12 |
| 5.27 |
| |
MSCI Emerging Markets Net Index |
| (53.33 | ) | 7.66 |
| 9.05 |
| 3.94 |
| |
Lipper Emerging Markets Funds Index |
| (54.76 | ) | 6.30 |
| 8.64 |
| 4.03 |
| |
Performance data quoted represents past performance, which is no guarantee of future results, and current performance may be lower or higher than the figures shown. Performance assumes that all dividends and distributions, if any, were reinvested. For the most recent month-end performance figures, please visit www.morganstanley.com/msim. Investment return and principal value will fluctuate so that Portfolio shares, when redeemed, may be worth more or less than their original cost. Total returns do not reflect the deduction of taxes that a shareholder would pay on Portfolio distributions or the redemption of Portfolio shares. Performance of share classes will vary due to difference in expenses.
(1) The Morgan Stanley Capital International (MSCI) Emerging Markets Net Index is a free float-adjusted market capitalization weighted index that is designed to measure equity market performance of emerging markets. The term “free float” represents the portion of shares outstanding that are deemed to be available for purchase in the public equity markets by investors. The MSCI Emerging Markets Index currently consists of 23 emerging market country indices. The performance of the Index is listed in U.S. dollars and assumes reinvestment of net dividends. The Index is unmanaged and its returns do not include any sales charges or fees. Such costs would lower performance. It is not possible to invest directly in an index.
(2) The Lipper Emerging Markets Funds Index is an equally weighted performance index of the largest qualifying funds (based on net assets) in the Lipper Emerging Markets Funds classification. The Index, which is adjusted for capital gains distributions and income dividends, is unmanaged and should not be considered an investment. There are currently 30 funds represented in this Index. As of the date of this report, the Portfolio was in the Lipper Emerging Markets Funds classification.
(3) Total returns for the Portfolio reflect fees waived and expenses reimbursed, if applicable, by the Adviser. Without such waivers and reimbursements, total returns would have been lower. Fee waivers and/or expense reimbursements are voluntary and the Adviser reserves the right to commence or terminate any waiver and/or reimbursement at any time.
(4) Commenced operations on September 25, 1992
(5) Commenced operations on January 2, 1996
(6) For comparative purposes, average annual since inception returns listed for the Indexes refer to the inception date or initial offering of the respective share class of the Portfolio, not the inception of the Index.
Portfolio Composition**
|
| Percentage of |
| |
Classification |
| Total Investments |
| |
Commercial Banks |
| 19.8 | % | |
Wireless Telecommunication Services |
| 14.0 |
| |
Oil, Gas & Consumable Fuels |
| 9.3 |
| |
Other*** |
| 52.9 |
| |
Short-Term Investment |
| 4.0 |
| |
Total Investments |
|
| 100.0 | % |
** Percentages indicated are based upon total investments (excluding Securities held as collateral on Loaned Securities) as of December 31, 2008.
*** Industries which do not appear in the above table, as well as those which represent less than 5% of total investments, if applicable, are included in the category labeled “Other”.
21
2008 Annual Report |
|
|
|
December 31, 2008 |
|
Portfolio of Investments
Emerging Markets Portfolio
|
|
|
| Value |
| |
|
| Shares |
| (000) |
| |
Common Stocks (95.5%) |
|
|
|
|
| |
Brazil (9.3%) |
|
|
|
|
| |
Banco Bradesco S.A. ADR (c) |
| 769,400 |
| $ | 7,594 |
|
Banco Bradesco S.A. (Preference) |
| 240,100 |
| 2,346 |
| |
Banco do Brasil S.A. |
| 374,108 |
| 2,424 |
| |
Banco Itau Holding Financeira S.A. ADR (c) |
| 898,000 |
| 10,417 |
| |
Banco Nacional S.A. (Preference) (a)(d)(l) |
| 295,998,880 |
| — |
| |
Cia de Bebidas das Americas (Preference) ADR (c) |
| 176,100 |
| 7,803 |
| |
Cia Vale do Rio Doce ADR (c) |
| 1,545,275 |
| 16,457 |
| |
Cia Vale do Rio Doce (Preference), Class A |
| 31,084 |
| 327 |
| |
Cyrela Brazil Realty S.A. |
| 755,196 |
| 3,043 |
| |
NET Servicos de Comunicacao S.A. (Preference) (a) |
| 1,263,479 |
| 7,284 |
| |
PDG Realty S.A. Empreendimentos e Participacoes |
| 564,700 |
| 2,768 |
| |
Perdigao S.A. |
| 677,676 |
| 8,823 |
| |
Petroleo Brasileiro S.A. ADR (c) |
| 709,324 |
| 14,477 |
| |
Petroleo Brasileiro S.A. (Preference) |
| 982,272 |
| 9,892 |
| |
Ultrapar Participacoes S.A. (Preference) |
| 188,700 |
| 4,142 |
| |
Unibanco - Uniao de Bancos Brasileiros S.A. ADR (c) |
| 229,356 |
| 14,821 |
| |
Unibanco - Uniao de Bancos Brasileiros S.A. |
| 186,342 |
| 1,194 |
| |
Vivo Participacoes S.A. ADR (c) |
| 269,000 |
| 3,373 |
| |
|
|
|
| 117,185 |
| |
China/Hong Kong (18.8%) |
|
|
|
|
| |
Anhui Conch Cement Co., Ltd., Class H (a)(c) |
| 2,705,000 |
| 12,568 |
| |
Beijing Enterprises Holdings Ltd. |
| 872,000 |
| 3,585 |
| |
BYD Electronic International Co., Ltd. |
| 6,130,000 |
| 2,189 |
| |
China Coal Energy Co. (c) |
| 3,911,000 |
| 3,161 |
| |
China Communications Services Corp., Ltd., Class H |
| 7,736,000 |
| 4,891 |
| |
China Construction Bank Corp., Class H (c) |
| 34,903,000 |
| 19,315 |
| |
China Life Insurance Co., Ltd., Class H (c) |
| 8,529,000 |
| 26,283 |
| |
China Mobile Ltd. (c) |
| 5,696,500 |
| 57,756 |
| |
China Resources Power Holdings Co., Ltd. (c) |
| 3,731,000 |
| 7,251 |
| |
China Unicom Hong Kong Ltd. (c) |
| 3,738,000 |
| 4,547 |
| |
Datang International Power Generation Co., Ltd., Class H (c) |
| 8,904,000 |
| 4,759 |
| |
Dongfeng Motor Group Co., Ltd., Class H |
| 29,845,000 |
| 9,732 |
| |
Focus Media Holding Ltd. ADR (a)(c) |
| 549,600 |
| 4,996 |
| |
GOME Electrical Appliances Holdings Ltd. (c) |
| 75,157,000 |
| 10,861 |
| |
Industrial & Commercial Bank of China, Class H (c) |
| 31,606,000 |
| 16,798 |
| |
Maanshan Iron & Steel, Class H (c) |
| 13,963,000 |
| 5,060 |
| |
PetroChina Co., Ltd., Class H |
| 25,170,000 |
| 22,302 |
| |
Ping An Insurance Group Co. of China Ltd., Class H |
| 2,147,000 |
| 10,492 |
| |
Shanghai Industrial Holdings Ltd. (c) |
| 4,265,000 |
| 9,814 |
| |
|
|
|
| 236,360 |
| |
Colombia (0.7%) |
|
|
|
|
| |
BanColombia S.A. ADR (c) |
| 374,952 |
| 8,755 |
| |
Czech Republic (2.2%) |
|
|
|
|
| |
CEZ |
| 301,619 |
| 12,258 |
| |
Komercni Banka A.S. |
| 51,686 |
| 7,954 |
| |
Telefonica O2 Czech Republic A.S. |
| 343,413 |
| 7,553 |
| |
|
|
|
| 27,765 |
| |
Hungary (0.7%) |
|
|
|
|
| |
Richter Gedeon Nyrt |
| 58,000 |
| 8,638 |
| |
India (8.4%) |
|
|
|
|
| |
Bharat Heavy Electricals Ltd. |
| 391,590 |
| 11,094 |
| |
Bharti Airtel Ltd. (a) |
| 636,672 |
| 9,405 |
| |
Deccan Chronicle Holdings Ltd. |
| 2,251,920 |
| 2,024 |
| |
Glenmark Pharmaceuticals Ltd. (a) |
| 551,600 |
| 3,395 |
| |
HDFC Bank Ltd. ADR (c) |
| 51,600 |
| 3,683 |
| |
HDFC Bank Ltd. |
| 452,300 |
| 9,397 |
| |
Hero Honda Motors Ltd. |
| 210,500 |
| 3,514 |
| |
Hindustan Unilever Ltd. |
| 2,186,500 |
| 11,288 |
| |
Housing Development Finance Corp. |
| 123,900 |
| 3,864 |
| |
India Cements Ltd. |
| 2,173,792 |
| 4,385 |
| |
Infosys Technologies Ltd. |
| 554,772 |
| 12,847 |
| |
ITC Ltd. |
| 1,181,500 |
| 4,198 |
| |
Maruti Suzuki India Ltd. |
| 430,100 |
| 4,658 |
| |
Reliance Industries Ltd. |
| 224,200 |
| 5,712 |
| |
State Bank of India Ltd. (d) |
| 440,200 |
| 11,919 |
| |
Television Eighteen India Ltd. (d) |
| 634,100 |
| 1,222 |
| |
Union Bank Of India (d) |
| 796,000 |
| 2,760 |
| |
|
|
|
| 105,365 |
| |
Indonesia (2.9%) |
|
|
|
|
| |
Astra International Tbk PT |
| 4,033,500 |
| 4,069 |
| |
Bank Central Asia Tbk PT |
| 25,858,500 |
| 7,824 |
| |
Bank Mandiri Persero Tbk PT |
| 16,878,000 |
| 3,217 |
| |
Bank Rakyat Indonesia Tbk PT |
| 11,931,500 |
| 5,274 |
| |
Bumi Resources Tbk PT |
| 17,791,000 |
| 1,535 |
| |
Perusahaan Gas Negara PT |
| 12,491,000 |
| 2,259 |
| |
Telekomunikasi Indonesia Tbk PT |
| 19,742,000 |
| 12,840 |
| |
|
|
|
| 37,018 |
| |
Luxembourg (0.7%) |
|
|
|
|
| |
Millicom International Cellular S.A. (c) |
| 200,915 |
| 9,023 |
| |
Malaysia (1.0%) |
|
|
|
|
| |
Bumiputra-Commerce Holdings Bhd |
| 518,000 |
| 882 |
| |
Digi.com Bhd |
| 666,300 |
| 4,203 |
| |
Sime Darby Bhd |
| 2,159,300 |
| 3,267 |
| |
Tenaga Nasional Bhd |
| 2,189,900 |
| 3,981 |
| |
|
|
|
| 12,333 |
| |
Mexico (6.2%) |
|
|
|
|
| |
America Movil S.A.B. de C.V., Class L ADR |
| 932,744 |
| 28,906 |
| |
Corp. GEO S.A.B. de C.V., Class B (a)(c) |
| 1,683,714 |
| 1,897 |
| |
Empresas ICA S.A.B de C.V. (a)(c) |
| 1,825,529 |
| 3,012 |
| |
Fomento Economico Mexicano S.A.B. de C.V. ADR |
| 535,000 |
| 16,119 |
| |
Grupo Financiero Banorte S.A.B. de C.V., Class O (c) |
| 3,235,800 |
| 5,841 |
| |
Grupo Televisa S.A. ADR |
| 676,500 |
| 10,107 |
| |
22 | The accompanying notes are an integral part of the financial statements. |
|
| 2008 Annual Report |
|
|
| December 31, 2008 |
Portfolio of Investments (cont’d)
Emerging Markets Portfolio
|
|
|
| Value |
|
|
| Shares |
| (000) |
|
Mexico (cont’d) |
|
|
|
|
|
Urbi Desarrollos Urbanos S.A.B de C.V. (a) |
| 1,657,300 |
| $ 2,262 |
|
Wal-Mart de Mexico S.A.B. de C.V. ADR (c) |
| 38,343 |
| 1,035 |
|
Wal-Mart de Mexico S.A.B. de C.V., Class V (c) |
| 3,330,672 |
| 8,899 |
|
|
|
|
| 78,078 |
|
Nigeria (0.1%) |
|
|
|
|
|
Guaranty Trust Bank plc GDR |
| 307,681 |
| 1,227 |
|
Pakistan (0.8%) |
|
|
|
|
|
MCB Bank Ltd. |
| 1,416,600 |
| 2,254 |
|
National Bank of Pakistan |
| 2,749,780 |
| 1,736 |
|
Oil & Gas Development Co., Ltd. |
| 4,635,100 |
| 2,925 |
|
Pakistan State Oil Co., Ltd. |
| 653,400 |
| 1,196 |
|
Pakistan Telecommunication Co., Ltd. (a) |
| 7,087,500 |
| 1,515 |
|
|
|
|
| 9,626 |
|
Panama (0.7%) |
|
|
|
|
|
Copa Holdings S.A., Class A |
| 310,568 |
| 9,416 |
|
Poland (4.2%) |
|
|
|
|
|
Bank Pekao S.A. |
| 370,297 |
| 15,846 |
|
Bank Zachodni WBK S.A. |
| 132,774 |
| 4,988 |
|
KGHM Polska Miedz S.A. |
| 114,897 |
| 1,097 |
|
PBG S.A. (a) |
| 52,941 |
| 3,502 |
|
Polimex Mostostal S.A. |
| 1,039,195 |
| 1,070 |
|
Polskie Gornictwo Naftowe I Gazownictwo S.A. |
| 851,625 |
| 1,038 |
|
Powszechna Kasa Oszczednosci Bank Polski S.A. |
| 1,396,394 |
| 16,729 |
|
Telekomunikacja Polska S.A. |
| 1,310,286 |
| 8,490 |
|
|
|
|
| 52,760 |
|
Russia (4.7%) |
|
|
|
|
|
Alliance Cellulose Ltd. (a)(d)(l) |
| 592,359 |
| — |
|
Gazprom OAO ADR (c) |
| 698,367 |
| 10,010 |
|
LUKOIL ADR (c) |
| 677,039 |
| 21,952 |
|
Mobile Telesystems OJSC ADR |
| 146,300 |
| 3,903 |
|
Rosneft Oil Co. GDR (a) |
| 2,978,604 |
| 11,308 |
|
RusHydro (a) |
| 226,674,300 |
| 4,746 |
|
Vimpel-Communications ADR |
| 1,029,925 |
| 7,374 |
|
|
|
|
| 59,293 |
|
South Africa (8.5%) |
|
|
|
|
|
AngloGold Ashanti Ltd. ADR |
| 40,420 |
| 1,120 |
|
AngloGold Ashanti Ltd. |
| 320,790 |
| 8,908 |
|
Harmony Gold Mining Co., Ltd. ADR (a)(c) |
| 93,500 |
| 1,026 |
|
Harmony Gold Mining Co., Ltd. (a) |
| 536,700 |
| 5,855 |
|
Massmart Holdings Ltd. |
| 994,871 |
| 9,131 |
|
Mr. Price Group Ltd. |
| 2,215,500 |
| 5,954 |
|
MTN Group Ltd. |
| 2,196,448 |
| 25,988 |
|
Naspers Ltd., Class N |
| 728,800 |
| 13,247 |
|
Raubex Group Ltd. |
| 1,226,052 |
| 2,893 |
|
SABMiller plc |
| 789,342 |
| 13,910 |
|
Sasol Ltd. |
| 210,831 |
| 6,440 |
|
Tiger Brands Ltd. |
| 774,400 |
| 12,055 |
|
|
|
|
| 106,527 |
|
South Korea (11.9%) |
|
|
|
|
|
Amorepacific Corp. (a) |
| 12,010 |
| 6,279 |
|
Cheil Industries, Inc. (a) |
| 227,922 |
| 7,411 |
|
Cheil Worldwide, Inc. (a) |
| 40,296 |
| 6,291 |
|
Hyundai Development Co. (a) |
| 151,800 |
| 4,002 |
|
Hyundai Motor Co. |
| 157,898 |
| 5,083 |
|
KB Financial Group, Inc. (a) |
| 106,070 |
| 2,907 |
|
KT&G Corp. |
| 33,250 |
| 2,079 |
|
LG Chem Ltd. |
| 174,541 |
| 10,037 |
|
LG Electronics, Inc. |
| 77,588 |
| 4,737 |
|
LG Telecom Ltd. |
| 284,100 |
| 2,231 |
|
NHN Corp. (a) |
| 135,053 |
| 13,704 |
|
Samsung Electronics Co., Ltd. |
| 92,720 |
| 33,668 |
|
Samsung Electronics Co., Ltd. (Preference) |
| 21,673 |
| 4,500 |
|
Samsung Fire & Marine Insurance Co., Ltd. |
| 70,620 |
| 10,747 |
|
Shinhan Financial Group Co., Ltd. (a) |
| 292,674 |
| 6,779 |
|
SK Telecom Co., Ltd. ADR (c) |
| 140,000 |
| 2,545 |
|
SK Telecom Co., Ltd. |
| 77,172 |
| 12,739 |
|
SSCP Co., Ltd. (a) |
| 271,644 |
| 1,597 |
|
Woongjin Coway Co., Ltd. (a) |
| 598,322 |
| 12,855 |
|
|
|
|
| 150,191 |
|
Taiwan (7.5%) |
|
|
|
|
|
Acer, Inc. |
| 5,950,120 |
| 7,801 |
|
Asustek Computer, Inc. |
| 7,293,646 |
| 8,284 |
|
Cathay Financial Holding Co., Ltd. |
| 6,163,500 |
| 6,917 |
|
Chinatrust Financial Holding Co., Ltd. |
| 12,627,543 |
| 5,445 |
|
Chunghwa Telecom Co., Ltd. |
| 3,446,090 |
| 5,499 |
|
First Financial Holding Co., Ltd. |
| 7,734,352 |
| 4,100 |
|
HON HAI Precision Industry Co., Ltd. |
| 5,867,750 |
| 11,568 |
|
HTC Corp. |
| 996,200 |
| 10,049 |
|
Taiwan Fertilizer Co., Ltd. |
| 662,000 |
| 1,064 |
|
Taiwan Semiconductor Manufacturing Co., Ltd. |
| 14,713,162 |
| 20,138 |
|
Wistron Corp. |
| 3,423,000 |
| 2,631 |
|
Yuanta Financial Holding Co., Ltd. |
| 22,944,000 |
| 10,444 |
|
|
|
|
| 93,940 |
|
Thailand (1.7%) |
|
|
|
|
|
Advanced Info Service PCL (Foreign) (d) |
| 1,747,700 |
| 3,945 |
|
Bangkok Bank PCL NVDR (c)(d) |
| 1,962,300 |
| 3,990 |
|
Kasikornbank PCL (Foreign) |
| 88,100 |
| 116 |
|
Kasikornbank PCL NVDR (c)(d) |
| 3,607,700 |
| 4,779 |
|
PTT Exploration & Production PCL (Foreign) (d) |
| 1,086,700 |
| 3,338 |
|
PTT PCL (Foreign) (d) |
| 502,800 |
| 2,591 |
|
Siam Commercial Bank PCL (Foreign) (d) |
| 2,195,800 |
| 3,094 |
|
|
|
|
| 21,853 |
|
Turkey (4.5%) |
|
|
|
|
|
Akbank T.A.S. |
| 3,572,213 |
| 11,151 |
|
Anadolu Efes Biracilik Ve Malt Sanayii A.S. |
| 890,939 |
| 5,964 |
|
Haci Omer Sabanci Holding A.S. |
| 2,015,455 |
| 4,602 |
|
Turkcell Iletisim Hizmet A.S. |
| 2,162,754 |
| 12,448 |
|
Turkiye Garanti Bankasi A.S. (a) |
| 8,153,525 |
| 13,922 |
|
| The accompanying notes are an integral part of the financial statements. | 23 |
2008 Annual Report |
|
|
|
December 31, 2008 |
|
Portfolio of Investments (cont’d)
Emerging Markets Portfolio
|
|
|
| Value |
| |
|
| Shares |
| (000) |
| |
Turkey (cont’d) |
|
|
|
|
| |
Turkiye Halk Bankasi A.S. |
| 1,313,885 |
| $ | 3,945 |
|
Turkiye Is Bankasi A.S., Class C |
| 1,929,092 |
| 5,189 |
| |
|
|
|
| 57,221 |
| |
Total Common Stocks (Cost $1,763,473) |
|
|
| 1,202,574 |
| |
Investment Company (0.9%) |
|
|
|
|
| |
India (0.9%) |
|
|
|
|
| |
Morgan Stanley Growth Fund |
|
|
|
|
| |
(Cost $3,415) (a)(o) |
| 17,282,900 |
| 11,192 |
| |
Short-Term Investments (16.1%) |
|
|
|
|
| |
Securities held as Collateral on Loaned Securities (12.0%) |
|
|
|
|
| |
Investment Company (9.6%) |
|
|
|
|
| |
Morgan Stanley Institutional Liquidity Money Market Portfolio — Institutional Class (o) |
| 121,387,381 |
| 121,388 |
| |
|
|
|
|
|
| |
|
| Face |
|
|
| |
|
| Amount |
|
|
| |
|
| (000) |
|
|
| |
Repurchase Agreement (2.4%) |
|
|
|
|
| |
Goldman Sachs & Co., 0.06%, dated 12/31/08, due 1/2/09, repurchase price $29,820; fully collateralized by U.S. government agency securities at the date of this Portfolio of Investments as follows: Federal Home Loan Mortgage Corp., Gold Pools: rates ranging from 4.50% to 6.00%, due 11/1/19 - 12/1/38; Federal National Mortgage Association, Fixed Rate Mortgages: rates ranging from 4.00% - 7.00%, due 9/1/18 - 1/1/39; Government National Mortgage Association, Fixed Rate Mortgages: rates ranging from 4.50% to 11.50%, due 6/15/16 - 12/20/38, valued at $30,416. | $ | 29,820 |
| 29,820 |
| |
|
|
|
| 151,208 |
| |
|
|
|
|
|
| |
|
| Shares |
|
|
| |
Investment Company (4.1%) |
|
|
|
|
| |
Morgan Stanley Institutional Liquidity Money Market Portfolio — Institutional Class (o) |
| 50,786,430 |
| 50,786 |
| |
Total Short-Term Investments (Cost $201,994) |
|
|
| 201,994 |
| |
Total Investments (112.5%) (Cost $1,968,882) — |
|
|
|
|
| |
including $142,125 of Securities Loaned (v) |
|
|
| 1,415,760 |
| |
Liabilities in Excess of Other Assets (-12.5%) |
|
|
| (157,002 | ) | |
Net Assets (100%) |
|
|
| $1,258,758 |
| |
(a) Non-income producing security.
(c) All or a portion of security on loan at December 31, 2008.
(d) At December 31, 2008, the Portfolio held approximately $37,638,000 of fair valued securities, representing 3.0% of net assets. These securities have been fair valued as determined in good faith under the general supervision of the Portfolio’s Directors.
(l) Security has been deemed illiquid at December 31, 2008.
(o) See Note G to the financial statements regarding investment in Morgan Stanley Growth Fund and Morgan Stanley Institutional Liquidity Funds Money Market Portfolio — Institutional Class.
(v) The approximate market value and percentage of total investments, $997,339,000 and 70.4%, respectively, represent the securities that have been fair valued under the fair valuation policy for international investments as disclosed in Note A within the Notes to Financial Statements.
@ Value is less than $500.
ADR American Depositary Receipt
GDR Global Depositary Receipt
NVDR Non-Voting Depositary Receipt
Foreign Currency Exchange Contract Information:
The Portfolio had the following foreign currency exchange contract(s) open at period end:
|
|
|
|
|
|
|
|
|
|
|
|
|
| Net | ||||||||||||
Currency |
|
|
|
|
| In |
|
|
| Unrealized | ||||||||||||||||
to |
|
|
|
|
| Exchange |
|
|
| Appreciation | ||||||||||||||||
Deliver |
| Value |
| Settlement |
| For |
| Value |
| (Depreciation) | ||||||||||||||||
(000) |
| (000) |
| Date |
| (000) |
| (000) |
| (000) |
| |||||||||||||||
CZK |
| 178,484 |
| $ | 9,214 |
| 3/19/09 |
| USD |
| 9,508 |
| $ | 9,508 |
| $ | 294 |
|
| |||||||
PLN |
| 55,986 |
| 18,744 |
| 3/19/09 |
| USD |
| 19,015 |
| 19,015 |
| 271 |
|
| ||||||||||
TRY |
| 599 |
| 388 |
| 1/2/09 |
| USD |
| 392 |
| 392 |
| 4 |
|
| ||||||||||
USD |
| 75 |
| 75 |
| 1/2/09 |
| HKD |
| 583 |
| 75 |
| — | @ |
| ||||||||||
USD |
| 77 |
| 77 |
| 1/5/09 |
| HKD |
| 595 |
| 77 |
| — | @ |
| ||||||||||
USD |
| 67 |
| 67 |
| 1/2/09 |
| MYR |
| 233 |
| 67 |
| — | @ |
| ||||||||||
USD |
| 780 |
| 780 |
| 1/5/09 |
| PLN |
| 2,290 |
| 773 |
| (7 | ) |
| ||||||||||
USD |
| 626 |
| 626 |
| 1/6/09 |
| PLN |
| 1,854 |
| 626 |
| — | @ |
| ||||||||||
USD |
| 388 |
| 388 |
| 1/7/09 |
| PLN |
| 1,148 |
| 387 |
| (1 | ) |
| ||||||||||
|
|
|
|
| $ | 30,359 |
|
|
|
|
|
|
|
| $ | 30,920 |
|
| $ | 561 |
|
| ||||
|
|
|
|
|
|
|
|
|
|
|
|
|
|
|
|
| ||||||||||
CZK | — Czech Koruna |
HKD | — Hong Kong Dollar |
MYR | — Malaysian Ringgit |
PLN | — Polish Zloty |
TRY | — Turkish Lira |
USD | — United States Dollar |
24 | The accompanying notes are an integral part of the financial statements. |
|
| 2008 Annual Report |
|
|
| December 31, 2008 |
Investment Overview (unaudited)
Global Franchise Portfolio
The Global Franchise Portfolio (the “Portfolio”) seeks long-term capital appreciation by investing primarily in equity securities of issuers located throughout the world, that it believes have, among other things, resilient business franchises and growth potential. This Portfolio’s concentration of its assets in a smaller number of companies may subject it to greater investment risk than a portfolio with a larger number of companies. Foreign investing involves certain risks, including currency fluctuations and controls, restrictions on foreign investments, less governmental supervision and regulation, less liquidity and the potential for market volatility and political instability.
Performance
For the year ended December 31, 2008, the Portfolio had a total return based on net asset value and reinvestment of distributions per share of -28.88%, net of fees, for the Class I shares. The Portfolio’s Class I shares outperformed against its benchmark the Morgan Stanley Capital International (MSCI) World Index (the “Index”) which returned -40.71%.
Factors Affecting Performance
· The 12-month period was a very difficult year for global markets. All sectors had substantially negative returns, with financials, materials and industrials the weakest groups. Although the Portfolio also registered declines in each of its sectors, it preserved capital better than the Index during the period. Although past performance is no guarantee of future results, the Portfolio has historically generated a substantial portion of its outperformance by preserving capital in falling markets.
· Generally the Portfolio’s performance in 2008 was divided into two distinct periods, corresponding to the surge and then the pullback in commodity prices. In the first half of the year, the Portfolio underperformed the Index as strongly rising commodity prices created a wide dispersion in sector returns. While energy and materials produced solid gains, other sectors such as consumer staples (in which the Portfolio holds a large weighting) declined considerably as their margins were squeezed by rising input costs. However, market conditions shifted dramatically in July. Commodity prices began a swift retreat that persisted through the end of the year, and global stock markets endured a major correction in the third and fourth quarters. Sectors perceived to preserve capital better in economic downturns, such as consumer staples, began to rebound as lower energy and raw materials costs eased the pressure on consumer staples companies’ margins. In this environment, the Portfolio outperformed the Index in the second half of 2008.
· For the period overall, the Portfolio’s underweights in the market’s weakest sectors (financials and materials), along with good stock selection decisions in industrials, materials and financials, were beneficial to relative returns. This positioning allowed the Portfolio to register a significantly less negative return than the Index in the very difficult environment.
· However, some of the other sectors that outperformed the broad Index during the period, including health care and utilities, were held by the Portfolio in smaller proportions than in the Index. As a result, these underweight positions detracted from performance on a relative basis for the 12-month period.
· Positive contributors to performance during the period were Kao Corporation, McGraw-Hill, and Scotts Miracle-Gro.
· The largest detractors were Imperial Tobacco, British American Tobacco, Swedish Match, Harley-Davidson and Unilever.
Management Strategies
· The Portfolio’s turnover in 2008, at 15.3%, remained roughly in line with historical averages. During the year, we sold three of the Portfolio’s four pharmaceutical holdings. In our view, the strength of these franchises was eroding, given the anticipated patent expirations over the next several years. Purchases in 2008 included Procter & Gamble, Estee Lauder, Starbucks, eBay and McGraw Hill, and the repurchase of Danone. The recent market correction has presented us an opportunity to take positions in companies that we have been watching for some time but previously have been too expensive.
· We do not attempt to predict from a macro perspective the direction of the markets. Our focus remains on the Global Franchise philosophy of seeking exceptional quality at compelling value. As a result of the market correction, we are finding opportunities to add quality franchises to the Portfolio in companies that were previously not available to us for valuation reasons.
25
2008 Annual Report |
|
|
|
December 31, 2008 |
|
Investment Overview (cont’d)
Global Franchise Portfolio
· We continue to seek investment opportunities in companies with strong business franchises protected by a dominant intangible asset. Additionally, we demand sound management, substantial free cash flow and growth potential. We invest in these high quality companies only when we can identify compelling value as measured by a current free cash flow yield in excess of the risk-free bond yield. We seek to deliver attractive returns while minimizing business and valuation risk. Our goal is for the Portfolio to outperform broadly-based benchmarks over the long term with less than average volatility.

* Minimum Investment
** Commenced operations on November 28, 2001.
In accordance with SEC regulations, Portfolio’s performance shown assumes that all recurring fees (including management fees) were deducted and all dividends and distributions were reinvested. The performance of Class P shares will vary from the Class I shares based upon their different inception dates and will be negatively impacted by additional fees assessed to that class.
Performance Compared to the Morgan Stanley Capital International (MSCI) World Index(1) and the Lipper Global Multi-Cap Core Funds Index(2)
|
|
|
|
| Total Returns(3) |
| ||
|
|
|
|
| Average Annual |
| ||
|
| One |
| Five |
| Since |
| |
|
| Year |
| Years |
| Inception | (5) | |
Portfolio — Class I (4) |
| (28.88 | )% | 3.83 | % | 8.20 | % | |
MSCI World Index |
| (40.71 | ) | (0.51 | ) | 0.79 |
| |
Lipper Global Multi-Cap Core Funds Index |
| (36.70 | ) | 0.88 |
| 2.02 |
| |
|
|
|
|
|
|
|
| |
Portfolio — Class P (4) |
| (29.00 | ) | 3.57 |
| 7.91 |
| |
MSCI World Index |
| (40.71 | ) | (0.51 | ) | 0.79 |
| |
Lipper Global Multi-Cap Core Funds Index |
| (36.70 | ) | 0.88 |
| 2.02 |
| |
Performance data quoted represents past performance, which is no guarantee of future results, and current performance may be lower or higher than the figures shown. Performance assumes that all dividends and distributions, if any, were reinvested. For the most recent month-end performance figures, please visit www.morganstanley.com/msim. Investment return and principal value will fluctuate so that Portfolio shares, when redeemed, may be worth more or less than their original cost. Total returns do not reflect the deduction of taxes that a shareholder would pay on Portfolio distributions or the redemption of Portfolio shares. Performance of share classes will vary due to difference in expenses.
(1) The Morgan Stanley Capital International (MSCI) World Index is a free float-adjusted market capitalization weighted index that is designed to measure the global equity market performance of developed markets. The term “free float” represents the portion of shares outstanding that are deemed to be available for purchase in the public equity markets by investors. The MSCI World Index currently consists of 23 developed market country indices. The performance of the Index is listed in U.S. dollars and assumes reinvestment of net dividends. The Index is unmanaged and its returns do not include any sales charges or fees. Such costs would lower performance. It is not possible to invest directly in an index.
(2) The Lipper Global Multi-Cap Core Funds Index is an equally weighted performance index of the largest qualifying funds (based on net assets) in the Lipper Global Multi-Cap Core Funds classification. The Index, which is adjusted for capital gains distributions and income dividends, is unmanaged and should not be considered an investment. There are currently 30 funds represented in this Index. As of the date of this report, the Portfolio was in the Lipper Global Multi-Cap Core Funds classification.
(3) Total returns for the Portfolio reflect fees waived and expenses reimbursed, if applicable, by the Adviser. Without such waivers and reimbursements, total returns would have been lower. Fee waivers and/or expense reimbursements are voluntary and the Adviser reserves the right to commence or terminate any waiver and/or reimbursement at any time.
(4) Commenced operations on November 28, 2001
(5) For comparative purposes, average annual since inception returns listed for the Indexes refer to the inception date or initial offering of the respective share class of the Portfolio, not the inception of the Index.
Portfolio Composition
|
| Percentage of |
| |
Classification |
| Total Investments |
| |
Tobacco |
| 23.7 | % | |
Food Products |
| 17.3 |
| |
Household Products |
| 10.1 |
| |
Media |
| 9.3 |
| |
Beverages |
| 8.5 |
| |
Other* |
| 27.5 |
| |
Short-Term Investment |
| 3.6 |
| |
Total Investments |
|
| 100.0 | % |
* Industries which do not appear in the above table, as well as those which represent less than 5% of total investments, if applicable, are included in the category labeled “Other”.
26
| 2008 Annual Report |
|
|
| December 31, 2008 |
Portfolio of Investments
Global Franchise Portfolio
|
|
|
| Value |
| |
|
| Shares |
| (000) |
| |
Common Stocks (96.6%) |
|
|
|
|
| |
Finland (2.2%) |
|
|
|
|
| |
Kone Oyj, Class B |
| 82,062 |
| $ | 1,799 |
|
France (5.7%) |
|
|
|
|
| |
Groupe Danone |
| 41,591 |
| 2,510 |
| |
Pernod-Ricard S.A. |
| 28,490 |
| 2,113 |
| |
|
|
|
| 4,623 |
| |
Ireland (5.0%) |
|
|
|
|
| |
C&C Group plc |
| 354,111 |
| 717 |
| |
Experian plc |
| 524,593 |
| 3,285 |
| |
|
|
|
| 4,002 |
| |
Japan (3.2%) |
|
|
|
|
| |
Kao Corp. |
| 86,000 |
| 2,605 |
| |
Netherlands (7.7%) |
|
|
|
|
| |
Reed Elsevier N.V. |
| 241,615 |
| 2,847 |
| |
Wolters Kluwer N.V. |
| 178,356 |
| 3,368 |
| |
|
|
|
| 6,215 |
| |
Sweden (4.2%) |
|
|
|
|
| |
Swedish Match AB |
| 237,458 |
| 3,399 |
| |
Switzerland (6.7%) |
|
|
|
|
| |
Nestle S.A. (Registered) |
| 77,376 |
| 3,050 |
| |
Novartis AG (Registered) |
| 47,823 |
| 2,396 |
| |
|
|
|
| 5,446 |
| |
United Kingdom (28.7%) |
|
|
|
|
| |
British American Tobacco plc |
| 253,849 |
| 6,596 |
| |
Cadbury plc |
| 345,602 |
| 3,025 |
| |
Diageo plc |
| 145,106 |
| 2,019 |
| |
Imperial Tobacco Group plc |
| 192,498 |
| 5,142 |
| |
Reckitt Benckiser Group plc |
| 80,472 |
| 2,998 |
| |
Unilever plc |
| 152,658 |
| 3,469 |
| |
|
|
|
| 23,249 |
| |
United States (33.2%) |
|
|
|
|
| |
Brown-Forman Corp., Class B |
| 40,096 |
| 2,064 |
| |
Career Education Corp. (a) |
| 82,871 |
| 1,487 |
| |
eBay, Inc. (a) |
| 111,309 |
| 1,554 |
| |
Estee Lauder Cos., Inc. (The) |
| 63,823 |
| 1,976 |
| |
Fortune Brands, Inc. |
| 47,889 |
| 1,977 |
| |
Harley-Davidson, Inc. |
| 78,919 |
| 1,339 |
| |
Kellogg Co. |
| 44,171 |
| 1,937 |
| |
McGraw-Hill Cos., Inc. (The) |
| 54,101 |
| 1,255 |
| |
Moody’s Corp. |
| 69,437 |
| 1,395 |
| |
Philip Morris International, Inc. |
| 93,218 |
| 4,056 |
| |
Procter & Gamble Co. |
| 42,157 |
| 2,606 |
| |
Scotts Miracle-Gro, Co. (The), Class A |
| 61,783 |
| 1,836 |
| |
Starbucks Corp. (a) |
| 150,522 |
| 1,424 |
| |
Weight Watchers International, Inc. |
| 65,263 |
| 1,920 |
| |
|
|
|
| 26,826 |
| |
Total Common Stocks (Cost $91,641) |
|
|
| 78,164 |
| |
Short-Term Investment (3.6%) |
|
|
|
|
| |
Investment Company (3.6%) |
|
|
|
|
| |
Morgan Stanley Institutional Liquidity Funds — Government Portfolio — Institutional Class |
|
|
|
|
| |
(Cost $2,897) (o) |
| 2,896,582 |
|
| 2,897 |
|
Total Investments (100.2%) (Cost $94,538) (v) |
|
|
| 81,061 |
| |
Liabilities in Excess of Other Assets (-0.2%) |
|
|
| (140 | ) | |
Net Assets (100%) |
|
|
| $ | 80,921 |
|
(a) Non-income producing security.
(o) See Note G to the financial statements regarding investment in Morgan Stanley Institutional Liquidity Government Portfolio — Institutional Class.
(v) The approximate market value and percentage of total investments, $51,338,000 and 63.3%, respectively, represent the securities that have been fair valued under the fair valuation policy for international investments as disclosed in Note A within the Notes to Financial Statements.
Foreign Currency Exchange Contract Information:
The Portfolio had the following foreign currency exchange contract(s) open at period end:
|
|
|
|
|
|
|
|
|
|
|
| Net |
| |||||||
Currency |
|
|
|
|
| In |
|
|
| Unrealized |
| |||||||||
to |
|
|
|
|
| Exchange |
|
|
| Appreciation |
| |||||||||
Deliver |
|
| Value |
| Settlement |
| For |
|
| Value |
| (Depreciation) |
| |||||||
(000) |
|
| (000) |
| Date |
| (000) |
|
| (000) |
| (000) |
| |||||||
GBP |
| 1,950 |
|
| $2,802 |
| 1/26/09 |
| USD |
| 2,913 |
|
|
| $2,913 |
|
| $111 |
|
|
GBP |
| 1,950 |
| 2,802 |
| 1/26/09 |
| USD |
| 2,916 |
|
|
| 2,916 |
|
| 114 |
|
| |
GBP |
| 445 |
| 639 |
| 1/26/09 |
| USD |
| 665 |
|
|
| 665 |
|
| 26 |
|
| |
GBP |
| 1,960 |
| 2,816 |
| 1/26/09 |
| USD |
| 2,934 |
|
|
| 2,934 |
|
| 118 |
|
| |
|
|
|
|
| $9,059 |
|
|
|
|
|
|
|
| $9,428 |
|
| $369 |
|
| |
|
|
|
|
|
|
|
|
|
|
|
|
|
|
|
|
|
|
|
| |
GBP | — | British Pound |
USD | — | United States Dollar |
| The accompanying notes are an integral part of the financial statements. | 27 |
2008 Annual Report |
|
|
|
December 31, 2008 |
|
Investment Overview (unaudited)
Global Real Estate Portfolio
The Global Real Estate Portfolio (the “Portfolio”) seeks to provide current income and capital appreciation by investing primarily in equity securities of companies in the real estate industry located throughout the world, including real estate operating companies, real estate investment trusts and similar entities established outside the U.S. (foreign real estate companies). Foreign investing involves certain risks, including currency fluctuations and controls, restrictions on foreign investments, less governmental supervision and regulation, less liquidity and the potential for market volatility and political instability. The risks of investing in emerging-market countries are greater than the risks generally associated with foreign investments. In addition, the risks associated with ownership of real estate and the real estate industry in general include, fluctuations in the value of underlying property, defaults by borrowers or tenants, market saturation, decreases in market rents, interest rates, property taxes, increases in operating expenses and political or regulatory occurrences adversely affecting real estate.
Performance
For the year ended December 31, 2008, the Portfolio had a total return based on net asset value and reinvestment of distributions per share of -45.00% for the Class I shares, net of fees. The Portfolio’s Class I shares outperformed against the FTSE EPRA/NAREIT Global Real Estate Index — Net Total Return to U.S. Investors (the “Index”) which returned -47.83% and underperformed against the MSCI World Index which returned -40.71%.
Factors Affecting Performance
· The Portfolio outperformed the benchmark, the FTSE EPRA/NAREIT Global Real Estate Index — Net Total Return to U.S. Investors, for the period. Among the three regional portfolios, the Asian and U.S. portfolios contributed to performance, while the European portfolio detracted from returns. With regard to global allocation among the regions, the underweight to Europe (on average for the period) contributed to performance, while the overweight to Asia and underweight to the U.S. detracted from returns.
· In Asia, the Portfolio benefited from stock selection within and an underweight to Australia, an overweight to Japan and stock selection in Hong Kong; this was modestly offset by the overweight to Hong Kong.
· In Europe, the Portfolio benefited from stock selection within and an underweight to Austria and stock selection in France and Sweden. The benefit was offset by stock selection within and an overweight to the U.K. as well as an underweight to Belgium and Switzerland.
· In the U.S., the Portfolio benefited from stock selection in the shopping center, mall and office sectors as well as stock selection within (and an overweight to) the apartment sector. This was partially offset by an overweight to the hotel sector, an underweight to the storage and health care sectors and stock selection in the industrial sector.
Management Strategies
· The Portfolio is comprised of three regional portfolios with a global allocation which weights each of the three major regions (U.S., Europe and Asia) based on our view of the relative attractiveness of each region in terms of underlying real estate fundamentals and public market valuations. Moreover, each of the regional portfolios reflects our core investment philosophy as a real estate value investor, which results in the ownership of stocks that we believe provide the best valuation relative to their underlying real estate values, while maintaining portfolio diversification.
· Our company-specific research has led us to specific preferences for sub-segments within each of the property sectors and countries. At the end of the period, the Portfolio was overweight the Asian listed property sector, neutral to the European listed property sector and underweight the U.S. listed property sector.
· We believe the Asian listed property sector will continue to exhibit stable underlying property fundamentals and asset values. The overweight to the Asian region was predominated by the real estate operating companies (REOCs) in Hong Kong and Japan, which continue to trade at very large discounts to NAV. Despite only modest weakening in underlying fundamentals and favorable supply dynamics in the Hong Kong and Japanese real estate markets, the Hong Kong and Japanese REOCs experienced significant share price declines in the year. We continue to prefer the Asian REOCs, as we believe these companies continue to offer better value relative to the REITs and possess the ability to engage in value-added opportunities such as the development of new assets and redevelopment of existing assets, as opposed to the Asian REITs which are externally managed vehicles and limited to property ownership.
· The Portfolio was considerably underweight the Australian Listed Property Trust (LPT) sector, which ended the period trading at a discount to NAVs which still do not yet fully reflect prospective asset value declines.
· In Europe, stocks on the Continent posted large declines and ended the year trading at a discount to reported NAVs, which only reflect modest capital value declines since the start of the credit crisis. Property stocks in the
28
| 2008 Annual Report |
|
|
| December 31, 2008 |
Investment Overview (cont’d)
Global Real Estate Portfolio
U.K. also experienced significant declines, and the stocks continue to trade at discounted valuations that appear too wide, especially since NAVs already reflect a sharp correction in asset values.
· Within Europe, the Portfolio continues to be underweight the Continent and overweight the U.K., as we believe the U.K. property market continues to offer better relative value.
· The Portfolio was underweight the U.S., which trades at a discount to NAVs based on consensus estimates of significant downward adjustment to asset values, and the market faces prospects for additional declines in underlying asset values as a result of the continued impairment of the credit markets and negative outlook for fundamentals given the economic recession. In contrast to the stable outlook for underlying property fundamentals in Asia-ex-Australia, in the U.S., Europe and Australia, there are expectations for substantial weakness in underlying property fundamentals and asset values. However, the key question to us remains the magnitude of asset value declines since there continues to be limited transactional evidence. This situation is due to the lack of liquidity for direct real estate assets, which has resulted in a wide bid-ask spread between buyers and sellers. In some sub-segments of these markets, we believe current share price valuations already more than reflect any prospective weakening in underlying fundamentals and asset values.
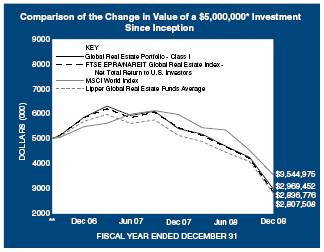
* Minimum Investment
** Commenced operations on August 30, 2006.
In accordance with SEC regulations, Portfolio’s performance shown assumes that all recurring fees (including management fees) were deducted and all dividends and distributions were reinvested. The performance of Class P, Class H, and Class L shares will vary from the Class I shares based upon their different inception dates and will be negatively impacted by additional fees assessed to those classes.
Performance Compared to the FTSE EPRA/NAREIT Global Real Estate Index — Net Total Return to U.S. Investors(1), the Morgan Stanley Capital International (MSCI) World Index(2) and the Lipper Global Real Estate Funds Average(3)
|
|
| Total Returns(4) |
| ||
|
|
|
| Average Annual |
| |
|
| One |
| Since |
| |
|
| Year |
| Inception | (8) | |
Portfolio — Class I (5) |
| (45.00 | )% | (19.99 | )% | |
FTSE EPRA/NAREIT Global Real Estate Index — |
|
|
|
|
| |
Net Total Return to U.S. Investors |
| (47.83 | ) | (21.54 | ) | |
MSCI World Index |
| (40.71 | ) | (13.68 | ) | |
Lipper Global Real Estate Funds Average |
| (45.33 | ) | (21.87 | ) | |
|
|
|
|
|
| |
Portfolio — Class P (5) |
| (45.15 | ) | (20.22 | ) | |
FTSE EPRA/NAREIT Global Real Estate Index — |
|
|
|
|
| |
Net Total Return to U.S. Investors |
| (47.83 | ) | (21.54 | ) | |
MSCI World Index |
| (40.71 | ) | (13.68 | ) | |
Lipper Global Real Estate Funds Average |
| (45.33 | ) | (21.87 | ) | |
|
|
|
|
|
| |
|
|
|
| Cumulative |
| |
|
|
|
| Since |
| |
|
|
|
| Inception | (8) | |
Portfolio — Class H w/o sales charges (6) |
| — |
| (44.88 | ) | |
Portfolio — Class H with maximum 4.75% sale charges (6) |
| — |
| (47.51 | ) | |
FTSE EPRA/NAREIT Global Real Estate Index — Net Total Return to U.S. Investors |
| — |
| (47.68 | ) | |
MSCI World Index |
| — |
| (40.32 | ) | |
Lipper Global Real Estate Funds Average |
| — |
| (43.68 | ) | |
|
|
|
|
|
| |
Portfolio — Class L (7) |
| — |
| (42.45 | ) | |
FTSE EPRA/NAREIT Global Real Estate Index — Net Total Return to U.S. Investors |
| — |
| (43.95 | ) | |
MSCI World Index |
| — |
| (36.63 | ) | |
Lipper Global Real Estate Funds Average |
| — |
| (37.11 | ) | |
Performance data quoted represents past performance, which is no guarantee of future results, and current performance may be lower or higher than the figures shown. Performance assumes that all dividends and distributions, if any, were reinvested. For the most recent month-end performance figures, please visit www.morganstanley.com/msim. Investment return and principal value will fluctuate so that Portfolio shares, when redeemed, may be worth more or less than their original cost. Total returns do not reflect the deduction of taxes that a shareholder would pay on Portfolio distributions or the redemption of Portfolio shares. Performance of share classes will vary due to difference in sales charges and expenses.
(1) The FTSE EPRA/NAREIT Global Real Estate Index — Net Total Return to U.S. investors is a market capitalization weighted index designed to reflect the stock performance of companies engaged in the North American, European and Asian real estate markets. The performance of the Index is listed in U.S. dollars and assumes reinvestment of dividends. “Net Total Return to U.S. investors” reflects a reduction in total returns after taking into account the withholding tax on dividends by certain foreign countries represented in the Index for periods after 1/31/05 (gross returns used prior to 1/31/05). The Index is unmanaged and its returns do not include any sales charges or fees. Such costs would lower performance. It is not possible to invest directly in an index.
(2) The Morgan Stanley Capital International (MSCI) World Index is a free float-adjusted market capitalization weighted index that is designed to measure the global equity market performance of developed markets. The term “free float” represents the portion of shares outstanding that are deemed to be available for purchase in the public equity markets by investors. The MSCI World Index currently consists of
29
2008 Annual Report |
|
|
|
December 31, 2008 |
|
Investment Overview (cont’d)
Global Real Estate Portfolio
23 developed market country indices. The performance of the Index is listed in U.S. dollars and assumes reinvestment of net dividends. The Index is unmanaged and its returns do not include any sales charges or fees. Such costs would lower performance. It is not possible to invest directly in an index.
(3) The Lipper Global Real Estate Funds Average tracks the performance of all funds in the Lipper Global Real Estate Funds classification. The Average, which is adjusted for capital gains distributions and income dividends, is unmanaged and should not be considered an investment. As of the date of this report, the Portfolio was in the Lipper Global Real Estate Funds classification.
(4) Total returns for the Portfolio reflect fees waived and expenses reimbursed, if applicable, by the Adviser. Without such waivers and reimbursements, total returns would have been lower. Fee waivers and/or expense reimbursements are voluntary and the Adviser reserves the right to commence or terminate any waiver and/or reimbursement at any time.
(5) Commenced operations on August 30, 2006.
(6) Commenced operations on January 2, 2008.
(7) Commenced operations on June 16, 2008.
(8) For comparative purposes, average annual since inception returns listed for the Indexes refer to the inception date or initial offering of the respective share class of the Portfolio, not the inception of the Index.
Portfolio Composition*
|
| Percentage of |
| |
Classification |
| Total Investments |
| |
Diversified |
| 37.9 | % | |
Retail |
| 16.3 |
| |
Office |
| 14.8 |
| |
Residential |
| 13.7 |
| |
Health Care |
| 5.1 |
| |
Other** |
| 10.7 |
| |
Short-Term Investment |
| 1.5 |
| |
Total Investments |
|
| 100.0 | % |
* Percentages indicated are based upon total investments (excluding Securities held as collateral on Loaned Securities) as of December 31, 2008.
** Industries which do not appear in the above table, as well as those which represent less than 5% of total investments, if applicable, are included in the category labeled “Other”.
30
| 2008 Annual Report |
|
|
| December 31, 2008 |
Portfolio of Investments
Global Real Estate Portfolio
|
|
|
| Value |
| |
|
| Shares |
| (000) |
| |
Common Stocks (97.1%) |
|
|
|
|
| |
Australia (5.8%) |
|
|
|
|
| |
CFS Retail Property Trust REIT (c) |
| 1,114,211 |
| $ | 1,461 |
|
GPT Group REIT |
| 419,966 |
| 272 |
| |
Stockland REIT (c) |
| 1,003,864 |
| 2,905 |
| |
Westfield Group REIT (c) |
| 2,743,634 |
| 25,279 |
| |
|
|
|
| 29,917 |
| |
Austria (0.2%) |
|
|
|
|
| |
CA Immobilien Anlagen AG (a)(c) |
| 50,567 |
| 302 |
| |
Conwert Immobilien Invest SE (a)(c) |
| 162,805 |
| 731 |
| |
|
|
|
| 1,033 |
| |
Brazil (0.4%) |
|
|
|
|
| |
BR Malls Participacoes S.A. (a) |
| 482,540 |
| 1,915 |
| |
Canada (0.2%) |
|
|
|
|
| |
Extendicare REIT |
| 116,590 |
| 553 |
| |
RioCan REIT |
| 52,965 |
| 586 |
| |
|
|
|
| 1,139 |
| |
Finland (0.3%) |
|
|
|
|
| |
Citycon Oyj (c) |
| 151,291 |
| 355 |
| |
Sponda Oyj |
| 226,132 |
| 990 |
| |
|
|
|
| 1,345 |
| |
France (5.2%) |
|
|
|
|
| |
Fonciere Des Regions REIT (c) |
| 15,185 |
| 1,039 |
| |
Gecina S.A. REIT (c) |
| 23,647 |
| 1,642 |
| |
ICADE REIT (c) |
| 31,607 |
| 2,631 |
| |
Klepierre REIT (c) |
| 85,956 |
| 2,107 |
| |
Silic REIT |
| 23,708 |
| 2,204 |
| |
Unibail-Rodamco REIT |
| 117,313 |
| 17,473 |
| |
|
|
|
| 27,096 |
| |
Germany (0.3%) |
|
|
|
|
| |
Alstria Office AG REIT |
| 185,691 |
| 1,296 |
| |
Hong Kong (18.6%) |
|
|
|
|
| |
China Overseas Land & Investment Ltd. (c) |
| 4,623,000 |
| 6,499 |
| |
China Resources Land Ltd. (c) |
| 4,485,000 |
| 5,553 |
| |
Guangzhou R&F Properties Co., Ltd., Class H (c) |
| 11,886,700 |
| 13,287 |
| |
Hang Lung Properties Ltd. (c) |
| 2,110,000 |
| 4,628 |
| |
Henderson Land Development Co., Ltd. (c) |
| 1,485,000 |
| 5,547 |
| |
Hongkong Land Holdings Ltd. (c) |
| 5,795,000 |
| 14,519 |
| |
Hysan Development Co., Ltd. (c) |
| 2,474,868 |
| 4,019 |
| |
Kerry Properties Ltd. |
| 4,895,220 |
| 13,176 |
| |
Sun Hung Kai Properties Ltd. (c) |
| 3,403,000 |
| 28,614 |
| |
Swire Pacific Ltd., Class A (c) |
| 89,500 |
| 620 |
| |
|
|
|
| 96,462 |
| |
Italy (0.2%) |
|
|
|
|
| |
Beni Stabili S.p.A. (c) |
| 1,612,891 |
| 1,127 |
| |
Risanamento S.p.A. (a) |
| 258,173 |
| 157 |
| |
|
|
|
| 1,284 |
| |
Japan (17.4%) |
|
|
|
|
| |
Japan Real Estate Investment Corp. REIT |
| 258 |
| 2,319 |
| |
Mitsubishi Estate Co., Ltd. |
| 1,916,000 |
| 31,597 |
| |
Mitsui Fudosan Co., Ltd. |
| 1,737,000 |
| 28,865 |
| |
Nippon Building Fund, Inc. REIT |
| 489 |
| 5,367 |
| |
NTT Urban Development Corp. |
| 5,634 |
| 6,079 |
| |
Sumitomo Realty & Development Co., Ltd. (c) |
| 1,089,000 |
| 16,225 |
| |
|
|
|
| 90,452 |
| |
Netherlands (1.7%) |
|
|
|
|
| |
Corio N.V. REIT |
| 83,627 |
| 3,834 |
| |
Eurocommercial Properties N.V. CVA REIT |
| 29,499 |
| 992 |
| |
ProLogis European Properties |
| 205,934 |
| 923 |
| |
Vastned Retail N.V. REIT |
| 21,993 |
| 1,103 |
| |
Wereldhave N.V. REIT (c) |
| 23,701 |
| 2,093 |
| |
|
|
|
| 8,945 |
| |
Singapore (2.3%) |
|
|
|
|
| |
CapitaCommercial Trust REIT (c) |
| 3,000 |
| 2 |
| |
CapitaLand Ltd. |
| 1,097,000 |
| 2,410 |
| |
Macquarie Prime REIT |
| 5,109,000 |
| 1,848 |
| |
United Industrial Corp., Ltd. |
| 8,725,000 |
| 6,378 |
| |
Wheelock Properties Singapore Ltd. |
| 1,476,000 |
| 1,071 |
| |
|
|
|
| 11,709 |
| |
Sweden (0.7%) |
|
|
|
|
| |
Castellum AB |
| 127,786 |
| 994 |
| |
Hufvudstaden AB, Class A |
| 392,369 |
| 2,762 |
| |
|
|
|
| 3,756 |
| |
Switzerland (0.5%) |
|
|
|
|
| |
PSP Swiss Property AG (Registered) (a) |
| 55,033 |
| 2,744 |
| |
United Kingdom (7.0%) |
|
|
|
|
| |
Big Yellow Group plc REIT |
| 469,512 |
| 1,625 |
| |
British Land Co. plc REIT |
| 852,274 |
| 6,832 |
| |
Brixton plc REIT |
| 914,584 |
| 1,754 |
| |
Capital & Regional plc |
| 441,930 |
| 300 |
| |
Derwent London plc REIT |
| 211,512 |
| 2,222 |
| |
Grainger plc |
| 424,691 |
| 836 |
| |
Great Portland Estates plc REIT |
| 290,164 |
| 1,090 |
| |
Hammerson plc REIT |
| 559,206 |
| 4,332 |
| |
Invista Foundation Property Trust Ltd. REIT |
| 77,300 |
| 19 |
| |
Land Securities Group plc REIT |
| 694,528 |
| 9,257 |
| |
Liberty International plc REIT |
| 340,659 |
| 2,361 |
| |
Minerva plc (a) |
| 712,164 |
| 139 |
| |
Quintain Estates & Development plc |
| 694,795 |
| 371 |
| |
Safestore Holdings plc |
| 735,221 |
| 584 |
| |
Segro plc REIT |
| 948,582 |
| 3,393 |
| |
Shaftesbury plc REIT |
| 47,642 |
| 249 |
| |
Unite Group plc |
| 405,751 |
| 861 |
| |
Workspace Group plc REIT |
| 87,560 |
| 78 |
| |
|
|
|
| 36,303 |
| |
United States (36.3%) |
|
|
|
|
| |
Acadia Realty Trust REIT |
| 105,947 |
| 1,512 |
| |
AMB Property Corp. REIT |
| 138,689 |
| 3,248 |
| |
Assisted Living Concepts, Inc., Class A (a) |
| 310,387 |
| 1,288 |
| |
AvalonBay Communities, Inc. REIT |
| 240,488 |
| 14,569 |
| |
Boston Properties, Inc. REIT |
| 240,975 |
| 13,254 |
| |
Brandywine Realty Trust REIT |
| 2,924 |
| 22 |
| |
Brookfield Properties Corp. |
| 1,122,873 |
| 8,680 |
| |
| The accompanying notes are an integral part of the financial statements. | 31 |
2008 Annual Report |
|
|
|
December 31, 2008 |
|
Portfolio of Investments (cont’d)
Global Real Estate Portfolio
|
|
|
| Value |
| |||
|
| Shares |
| (000) |
| |||
United States (cont’d) |
|
|
|
|
| |||
Cabot Industrial Value Fund III, LP (a)(i) |
| 221 |
| $ | 111 |
| ||
Camden Property Trust REIT |
| 262,953 |
| 8,241 |
| |||
Care Investment Trust, Inc. REIT |
| 36,365 |
| 283 |
| |||
DCT Industrial Trust, Inc. REIT |
| 208,380 |
| 1,054 |
| |||
DiamondRock Hospitality Co. REIT |
| 80,060 |
| 406 |
| |||
Douglas Emmett, Inc. REIT |
| 57,630 |
| 753 |
| |||
Duke Realty Corp. REIT |
| 219,759 |
| 2,408 |
| |||
Equity Lifestyle Properties, Inc. REIT (a) |
| 100,671 |
| 3,862 |
| |||
Equity Residential REIT |
| 374,923 |
| 11,180 |
| |||
Exeter Industrial Value Fund, LP (d) |
| 800,000 |
| 800 |
| |||
Federal Realty Investment Trust REIT |
| 126,154 |
| 7,832 |
| |||
Forest City Enterprises, Inc., Class A |
| 380,881 |
| 2,552 |
| |||
HCP, Inc. REIT |
| 193,146 |
| 5,364 |
| |||
Healthcare Realty Trust, Inc. REIT |
| 342,507 |
| 8,042 |
| |||
Host Hotels & Resorts, Inc. REIT |
| 1,048,764 |
| 7,939 |
| |||
LaSalle Hotel Properties REIT |
| 15,630 |
| 173 |
| |||
Liberty Property Trust REIT |
| 236,174 |
| 5,392 |
| |||
Macerich Co. (The) REIT |
| 5,878 |
| 107 |
| |||
Mack-Cali Realty Corp. REIT |
| 229,448 |
| 5,621 |
| |||
Morgans Hotel Group Co. (a) |
| 122,919 |
| 573 |
| |||
Parkway Properties, Inc. REIT |
| 902 |
| 16 |
| |||
Post Properties, Inc. REIT |
| 249,293 |
| 4,113 |
| |||
PS Business Parks, Inc. REIT |
| 22,123 |
| 988 |
| |||
Public Storage REIT |
| 109,945 |
| 8,741 |
| |||
Ramco-Gershenson Properties Trust REIT |
| 33,055 |
| 204 |
| |||
Regency Centers Corp. REIT |
| 231,201 |
| 10,797 |
| |||
Senior Housing Properties Trust REIT |
| 367,674 |
| 6,589 |
| |||
Simon Property Group, Inc. REIT |
| 300,585 |
| 15,970 |
| |||
Sovran Self Storage, Inc. REIT |
| 5,079 |
| 183 |
| |||
Starwood Hotels & Resorts Worldwide, Inc. |
| 673,860 |
| 12,062 |
| |||
Strategic Hotels & Resorts, Inc. REIT |
| 474,011 |
| 796 |
| |||
Taubman Centers, Inc. REIT |
| 42,475 |
| 1,081 |
| |||
Ventas, Inc. REIT |
| 107,300 |
| 3,602 |
| |||
Vornado Realty Trust REIT |
| 130,930 |
| 7,902 |
| |||
|
|
|
| 188,310 |
| |||
Total Common Stocks (Cost $947,562) |
|
|
| 503,706 |
| |||
|
|
|
|
|
| |||
|
| No. of |
|
|
| |||
|
| Rights |
|
|
| |||
Rights (0.0%) |
|
|
|
|
| |||
Hong Kong (0.0%) |
|
|
|
|
| |||
China Overseas Land & Investment Ltd., |
| 189,240 |
| 71 |
| |||
|
|
|
|
|
| |||
|
| Shares |
|
|
| |||
Short-Term Investments (11.3%) |
|
|
|
|
| |||
Securities held as Collateral on Loaned Securities (9.8%) |
|
|
|
|
| |||
Investment Company (7.9%) |
|
|
|
|
| |||
Morgan Stanley Institutional Liquidity Money Market Portfolio — Institutional Class (o) |
| 40,941,177 |
| 40,941 |
| |||
|
|
|
|
|
| |||
|
| Face |
|
|
| |||
|
| Amount |
|
|
| |||
|
| (000) |
|
|
| |||
Repurchase Agreement (1.9%) |
|
|
|
|
|
|
| |
Goldman Sachs & Co., 0.06%, dated 12/31/08, due 1/2/09, repurchase price $10,058; fully collateralized by U.S. government agency securities at the date of this Portfolio of Investments as follows: Federal Home Loan Mortgage Corp., Gold Pools: rates ranging from 4.50% to 6.00%, due 11/1/19 - 12/1/38; Federal National Mortgage Association, Fixed Rate Mortgages: rates ranging from 4.00% - 7.00%, due 9/1/18 - 1/1/39; Government National Mortgage Association, Fixed Rate Mortgages: rates ranging from 4.50% to 11.50%, due 6/15/16 - 12/20/38, valued at $10,259. |
| $ | 10,058 |
|
| 10,058 |
| |
|
|
|
| 50,999 |
| |||
|
|
|
|
|
| |||
|
| Shares |
|
|
| |||
Investment Company (1.5%) |
|
|
|
|
| |||
Morgan Stanley Institutional Liquidity Money Market Portfolio — Institutional Class (o) |
| 7,525,268 |
| 7,525 |
| |||
Total Short-Term Investments (Cost $58,524) |
|
|
| 58,524 |
| |||
Total Investments (108.4%) (Cost $1,006,086) — including $48,070 of Securities Loaned (v) |
|
|
| 562,301 |
| |||
Liabilities in Excess of Other Assets (-8.4%) |
|
|
| (43,635) |
| |||
Net Assets (100%) |
|
|
| $518,666 |
| |||
(a) Non-income producing security.
(c) All or a portion of security on loan at December 31, 2008.
(d) At December 31, 2008, the Portfolio held approximately $800,000 of fair valued securities, representing 0.2% of net assets. These securities have been fair valued as determined in good faith under procedures established by and under the general supervision of the Portfolio’s Directors.
(i) Restricted security valued at fair value and not registered under the Securities Act of 1933, Cabot Industrial Value Fund, LP was aquired on 6/08 and has a current cost basis of $111,000. At December 31, 2008, this security had an aggregate market value of 111,000 representing 0.02% of net assets.
(o) See Note G to the financial statements regarding investment in Morgan Stanley Institutional Liquidity Money Market Portfolio — Institutional Class.
(v) The approximate market value and percentage of total investments, $314,258,000 and 55.9%, respectively, represent the securities that have been fair valued under the fair valuation policy for international investments as disclosed in Note A within the Notes to Financial Statements.
@ Value is less than $500.
CVA Certificaten Van Aandelen
REIT Real Estate Investment Trust
32 | The accompanying notes are an integral part of the financial statements. |
|
| 2008 Annual Report |
|
|
| December 31, 2008 |
Portfolio of Investments (cont’d)
Global Real Estate Portfolio
Foreign Currency Exchange Contract Information:
The Portfolio had the following foreign currency exchange contract(s) open at period end:
|
|
|
|
|
|
|
|
|
|
|
| Net |
| |||||||
Currency |
|
|
|
|
| In |
|
|
| Unrealized |
| |||||||||
to |
|
|
|
|
| Exchange |
|
|
| Appreciation |
| |||||||||
Deliver |
| Value |
| Settlement |
| For |
| Value |
| (Depreciation) |
| |||||||||
(000) |
| (000) |
| Date |
| (000) |
| (000) |
| (000) |
| |||||||||
AUD |
| 926 |
|
| $ 645 |
| 1/5/09 |
| USD |
| 637 |
|
|
| $ 637 |
|
| $(8 | ) |
|
HKD |
| 12,345 |
|
| 1,593 |
| 1/5/09 |
| USD |
| 1,593 |
|
|
| 1,593 |
|
| — | @ |
|
HKD |
| 4,404 |
|
| 568 |
| 1/2/09 |
| USD |
| 568 |
|
|
| 568 |
|
| — | @ |
|
SGD |
| 158 |
|
| 110 |
| 1/5/09 |
| USD |
| 110 |
|
|
| 110 |
|
| — | @ |
|
SGD |
| 117 |
|
| 81 |
| 1/5/09 |
| USD |
| 81 |
|
|
| 81 |
|
| — | @ |
|
|
|
|
|
| $ 2,997 |
|
|
|
|
|
|
|
|
| $2,989 |
|
| $(8 | ) |
|
|
|
|
|
|
|
|
|
|
|
|
|
|
|
|
|
|
|
|
|
|
AUD — Australian Dollar
HKD — Hong Kong Dollar
SGD — Singapore Dollar
USD — United States Dollar
| The accompanying notes are an integral part of the financial statements. | 33 |
2008 Annual Report |
|
|
|
December 31, 2008 |
|
Investment Overview (unaudited)
Global Value Equity Portfolio
The Global Value Equity Portfolio (the “Portfolio”) seeks long-term capital appreciation by investing primarily in equity securities of issuers throughout the world, including U.S. issuers. Foreign investing involves certain risks, including currency fluctuations and controls, restrictions on foreign investments, less governmental supervision and regulation, less liquidity and the potential for market volatility and political instability.
Performance
For the year ended December 31, 2008, the Portfolio had a total return based on net asset value and reinvestment of distributions per share of -41.82%, net of fees, for Class I shares. The Portfolio’s Class I shares underperformed against its benchmark, the Morgan Stanley Capital International (MSCI) World Index (the “Index”) which returned -40.71%.
Factors Affecting Performance
· Global equities declined precipitously during the period under review. In 2008, the U.S. market had its worst one-year performance since the 1930s. The complete reshuffling of Wall Street and dire global economic conditions were met with unprecedented policy response by governments and central banks around the world. The shift from inflation fears to deflation fears as the primary threat to the global economy’s recovery further impelled the massive fiscal and monetary stimulus. Falling commodity prices (since July 2008), declining home values and a substantial drop in consumer demand exerted downward pressure on prices such that deflation became policymakers’ chief concern.
· Although the interventions were initially met with disappointment among investors, equity prices appeared to stabilize in December and a key liquidity measure showed some improvement. However, certain “fear gauges” remained troubling at year end, including the CBOE VIX volatility index. Without more positive readings here, we believe any equity rally will be short-lived and substantial improvements in economic and financial conditions will be delayed.
· By the end of the period, most of the developed world had entered into recession, and outlooks remained gloomy. The U.S. and Europe grappled with a wave of negative economic data, while Japan continued to suffer from weak domestic demand and falling exports. The Asia Pacific region excluding Japan dealt with the impact of languishing growth both in the developed world and in China, which until then had served as the region’s economic engine.
· During the period, the Portfolio was well served by its defensive positioning, with overweights to health care and telecommunication services, and underweights to cyclical sectors such as materials, energy and industrials. As the global economic outlook became increasingly dire, negative sentiment fueled a strong sell-off in economically sensitive sectors. The Portfolio’s underweights there buffered the impact of those sectors’ substantial declines. At the same time, stock selection and relative overweights in both the health care (where the Portfolio holds predominantly pharmaceuticals stocks) and telecommunication services sectors added relative value, as these sectors outperformed the Index during the period.
· However, other positions were disappointments. Weaker than expected results from food producers and tobacco companies led to losses in the Portfolio’s consumer staples segment. These companies suffered from the expectation that high raw materials and energy costs earlier in 2008 would crimp profit margins. The financials sector was another significant detractor for the period. The benefit of an underweight to the sector was overwhelmed by the considerably negative impact of stock selection. On valuations, many of the financial stocks looked compellingly cheap. But with the credit crisis accelerating and the operating environment deteriorating much faster than anticipated, a number of the Portfolio’s holdings within the sector were negatively impacted.
Management Strategies
· At the end of November, the responsibility for the management of the Portfolio’s assets was assumed by another team, and the composition of the Portfolio changed to reflect the Global Franchise investment philosophy. The most noticeable change at year end was a significant reduction in the financials allocation. Generally, the Global Franchise management team avoids companies that rely on substantial leverage to generate returns on their capital and, as such, historically the team’s portfolios have not been invested in banks, insurance companies, or property companies.
· In keeping with the Global Franchise philosophy, the team seeks to invest in companies with strong business franchises protected by a dominant intangible asset. Additionally, the team demands sound management, substantial free cash flow and growth potential. The team invests in these high quality companies only when it can identify compelling value as measured by a current free cash flow yield in excess of the risk-free bond yield. The team seeks to deliver attractive returns while minimizing
34
| 2008 Annual Report |
|
|
| December 31, 2008 |
Investment Overview (cont’d)
Global Value Equity Portfolio
business and valuation risk. The goal is for the Portfolio to outperform broadly-based benchmarks over the long term with less than average volatility.
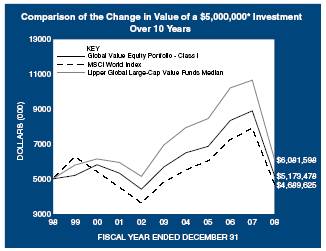
* Minimum Investment
In accordance with SEC regulations, Portfolio’s performance shown assumes that all recurring fees (including management fees) were deducted and all dividends and distributions were reinvested. The performance of Class P shares will vary from the Class I shares based upon their different inception dates and will be negatively impacted by additional fees assessed to that class.
Performance Compared to the Morgan Stanley Capital International (MSCI) World Index(1) and the Lipper Global Large-Cap Value Funds Median(2)
|
|
| Total Returns(3) |
| ||||||
|
|
|
| Average Annual |
| |||||
|
| One |
| Five |
| Ten |
| Since |
| |
|
| Year |
| Years |
| Years |
| Inception | (6) | |
Portfolio — Class I (4) |
| (41.82 | )% | (1.88 | ) | 0.34 | % | 7.36 | % | |
MSCI World Index |
| (40.71 | ) | (0.51 | ) | (0.64 | ) | 5.33 |
| |
Lipper Global Large-Cap Value Funds Median |
| (43.19 | ) | (2.46 | ) | 0.30 |
| 7.11 |
| |
Portfolio — Class P (5) |
| (41.98 | ) | (2.14 | ) | 0.08 |
| 4.32 |
| |
MSCI World Index |
| (40.71 | ) | (0.51 | ) | (0.64 | ) | 3.30 |
| |
Lipper Global Large-Cap Value Funds Median |
| (43.19 | ) | (2.46 | ) | 0.30 |
| 4.19 |
| |
Performance data quoted represents past performance, which is no guarantee of future results, and current performance may be lower or higher than the figures shown. Performance assumes that all dividends and distributions, if any, were reinvested. For the most recent month-end performance figures, please visit www.morganstanley.com/msim. Investment return and principal value will fluctuate so that Portfolio shares, when redeemed, may be worth more or less than their original cost. Total returns do not reflect the deduction of taxes that a shareholder would pay on Portfolio distributions or the redemption of Portfolio shares. Performance of share classes will vary due to differences in expenses.
(1) The Morgan Stanley Capital International (MSCI) World Index is a free float-adjusted market capitalization weighted index that is designed to measure the global equity market performance of developed markets. The term “free float” represents the portion of shares outstanding that are deemed to be available for purchase in the public equity markets by investors. The MSCI World Index currently consists of 23 developed market country indices. The performance of the Index is listed in U.S. dollars and assumes reinvestment of net dividends. The Index is unmanaged and its returns do not include any sales charges or fees. Such costs would lower performance. It is not possible to invest directly in an index.
(2) The Lipper Global Large-Cap Value Funds Median tracks the performance of all funds in the Lipper Global Large-Cap Value Funds classification. The Median, which is adjusted for capital gains distribution and income dividends, is unmanaged and should not be considered an investment. As of the date of this report, the Portfolio was in the Lipper Global Large-Cap Value Funds classification.
(3) Total returns for the Portfolio reflect fees waived and expenses reimbursed, if applicable, by the Adviser. Without such waivers and reimbursements, total returns would have been lower. Fee waivers and/or expense reimbursements are voluntary and the Adviser reserves the right to commence or terminate any waiver and/or reimbursement at any time.
(4) Commenced operations on July 15, 1992
(5) Commenced operations on January 2, 1996
(6) For comparative purposes, average annual since inception returns listed for the Indexes refer to the inception date or initial offering of the respective share class of the Portfolio, not the inception of the Index.
Portfolio Composition**
|
| Percentage of |
| |
Classification |
| Total Investments |
| |
Tobacco |
| 23.8 | % | |
Food Products |
| 17.5 |
| |
Household Products |
| 10.3 |
| |
Media |
| 9.4 |
| |
Beverages |
| 8.7 |
| |
Other*** |
| 28.1 |
| |
Short-Term Investment |
| 2.2 |
| |
Total Investments |
|
| 100.0 | % |
** Percentages indicated are based upon total investments (excluding Securities held as collateral on Loaned Securities) as of December 31, 2008.
*** Industries which do not appear in the above table, as well as those which represent less than 5% of total investments, if applicable, are included in the category labeled “Other”.
35
2008 Annual Report |
|
|
|
December 31, 2008 |
|
Portfolio of Investments
Global Value Equity Portfolio
|
|
|
| Value |
| |
|
| Shares |
| (000) |
| |
Common Stocks (97.5%) |
|
|
|
|
| |
Finland (2.2%) |
|
|
|
|
| |
Kone Oyj, Class B (c) |
| 36,816 |
| $ | 807 |
|
France (5.8%) |
|
|
|
|
| |
Groupe Danone (c) |
| 18,659 |
| 1,126 |
| |
Pernod-Ricard S.A. (c) |
| 12,781 |
| 948 |
| |
|
|
|
| 2,074 |
| |
Ireland (5.0%) |
|
|
|
|
| |
C&C Group plc |
| 158,443 |
| 321 |
| |
Experian plc |
| 235,352 |
| 1,474 |
| |
|
|
|
| 1,795 |
| |
Japan (3.3%) |
|
|
|
|
| |
Kao Corp. |
| 39,000 |
| 1,181 |
| |
Netherlands (7.8%) |
|
|
|
|
| |
Reed Elsevier N.V. |
| 108,398 |
| 1,277 |
| |
Wolters Kluwer N.V. (c) |
| 80,017 |
| 1,511 |
| |
|
|
|
| 2,788 |
| |
Sweden (4.2%) |
|
|
|
|
| |
Swedish Match AB |
| 106,533 |
| 1,525 |
| |
Switzerland (6.8%) |
|
|
|
|
| |
Nestle S.A. (Registered) |
| 34,713 |
| 1,368 |
| |
Novartis AG (Registered) |
| 21,455 |
| 1,075 |
| |
|
|
|
| 2,443 |
| |
United Kingdom (28.9%) |
|
|
|
|
| |
British American Tobacco plc |
| 111,571 |
| 2,899 |
| |
Cadbury plc |
| 155,050 |
| 1,357 |
| |
Diageo plc |
| 68,023 |
| 946 |
| |
Imperial Tobacco Group plc |
| 86,361 |
| 2,307 |
| |
Reckitt Benckiser Group plc |
| 36,102 |
| 1,345 |
| |
Rolls-Royce Group plc, C Shares (a) |
| 4,500,610 |
| 7 |
| |
Unilever plc |
| 68,488 |
| 1,556 |
| |
|
|
|
| 10,417 |
| |
United States (33.5%) |
|
|
|
|
| |
Brown-Forman Corp., Class B |
| 17,493 |
| 901 |
| |
Career Education Corp. (a) |
| 37,179 |
| 667 |
| |
eBay, Inc. (a) |
| 50,272 |
| 702 |
| |
Estee Lauder Cos., Inc. (The) (c) |
| 28,990 |
| 897 |
| |
Fortune Brands, Inc. (c) |
| 21,676 |
| 895 |
| |
Harley-Davidson, Inc. (c) |
| 35,872 |
| 609 |
| |
Kellogg Co. |
| 19,817 |
| 869 |
| |
McGraw-Hill Cos., Inc. (The) |
| 24,592 |
| 570 |
| |
Moody’s Corp. |
| 31,587 |
| 635 |
| |
Philip Morris International, Inc. |
| 41,821 |
| 1,820 |
| |
Procter & Gamble Co. (c) |
| 18,913 |
| 1,169 |
| |
Scotts Miracle-Gro, Co. (The), Class A |
| 27,718 |
| 824 |
| |
Starbucks Corp. (a) |
| 68,293 |
| 646 |
| |
Weight Watchers International, Inc. (c) |
| 29,279 |
| 861 |
| |
|
|
|
| 12,065 |
| |
Total Common Stocks (Cost $32,842) |
|
|
| 35,095 |
| |
Short-Term Investments (11.6%) |
|
|
|
|
| |
Securities held as Collateral on Loaned Securities (9.3%) |
|
|
|
|
| |
Investment Company (7.5%) |
|
|
|
|
| |
Morgan Stanley Institutional Liquidity Funds — Money Market Portfolio — Institutional Class (o) |
| 2,694,327 |
| 2,694 |
| |
|
|
|
|
|
| |
|
| Face |
|
|
| |
|
| Amount |
|
|
| |
|
| (000) |
|
|
| |
Repurchase Agreement (1.8%) |
|
|
|
|
| |
Goldman Sachs & Co., 0.06%, dated 12/31/08, due 1/2/09, repurchase price $662; fully collateralized by U.S. government agency securities at the date of this Portfolio of Investments as follows: Federal Home Loan Mortgage Corp., Gold Pools: rates ranging from 4.50% to 6.00%, due 11/1/19 - 12/1/38; Federal National Mortgage Association, Fixed Rate Mortgages: rates ranging from 4.00% - 7.00%, due 9/1/18 - 1/1/39; Government National Mortgage Association, Fixed Rate Mortgages: rates ranging from 4.50% to 11.50%, due 6/15/16 - 12/20/38, valued at $675. |
| $ 662 |
| 662 |
| |
|
|
|
| 3,356 |
| |
|
|
|
|
|
| |
|
| Shares |
|
|
| |
Investment Company (2.3%) |
|
|
|
|
| |
Morgan Stanley Institutional Liquidity Money Market Portfolio — Institutional Class (o) |
| 804,637 |
| 805 |
| |
Total Short-Term Investments (Cost $4,161) |
|
|
| 4,161 |
| |
Total Investments (109.1%) (Cost $37,003) — |
|
|
| 39,256 |
| |
Liabilities in Excess of Other Assets (-9.1%) |
|
|
| (3,258) |
| |
Net Assets (100%) |
|
|
| $ | 35,998 |
|
(a) Non-income producing security.
(c) All or a portion of security on loan at December 31, 2008.
(o) See Note G to the financial statements regarding investment in Morgan Stanley Institutional Liquidity Money Market Portfolio — Institutional Class.
(v) The approximate market value and percentage of total investments, $23,024,000 and 58.7%, respectively, represent the securities that have been fair valued under the fair valuation policy for international investments as disclosed in Note A within the Notes to Financial Statements.
36 | The accompanying notes are an integral part of the financial statements. |
|
| 2008 Annual Report |
|
|
| December 31, 2008 |
Portfolio of Investments (cont’d)
Global Value Equity Portfolio
Foreign Currency Exchange Contract Information:
The Portfolio had the following foreign currency exchange contract(s) open at period end:
Currency |
| Value |
| Settlement |
| In |
| Value |
| Net |
| ||||||||
GBP | 700 |
|
| $1,006 |
|
| 1/26/09 |
| USD | 1,039 |
|
| $1,039 |
|
| $ 33 |
|
| |
GBP | 650 |
|
| 934 |
|
| 1/26/09 |
| USD | 965 |
|
| 965 |
|
| 31 |
|
| |
GBP | 700 |
|
| 1,006 |
|
| 1/26/09 |
| USD | 1,039 |
|
| 1,039 |
|
| 33 |
|
| |
GBP | 700 |
|
| 1,006 |
|
| 1/26/09 |
| USD | 1,040 |
|
| 1,040 |
|
| 34 |
|
| |
|
|
|
| $3,952 |
|
|
|
|
|
|
|
| $4,083 |
|
| $131 |
|
| |
GBP — British Pound
USD — United States Dollar
The accompanying notes are an integral part of the financial statements. | 37 |
2008 Annual Report |
|
|
|
December 31, 2008 |
|
Investment Overview (unaudited)
International Equity Portfolio
The International Equity Portfolio (the “Portfolio”) seeks long-term capital appreciation by investing primarily in equity securities of non-U.S. issuers. Foreign investing involves certain risks, including currency fluctuations and controls, restrictions on foreign investments, less governmental supervision and regulation, less liquidity and the potential for market volatility and political instability. The risks of investing in emerging-market countries are greater than the risks generally associated with foreign investments.
Performance
For the year ended December 31, 2008, the Portfolio had a total return based on net asset value and reinvestment of distributions per share of -33.12% net of fees, for Class I shares. The Portfolio’s Class I shares outperformed against its benchmark, the Morgan Stanley Capital International (MSCI) EAFE Index (the “Index”) which returned -43.38%.
Factors Affecting Performance
· The Index rose 6.01% in December, most of which was generated by U.S. dollar weakness as the rise was a more muted 1.2% in local currency terms. This brought the Index return for 2008 to -43.4% in U.S. dollar terms — the largest ever collapse in the EAFE Index over a one-year period.
· Currency movements had a significant impact on U.S. dollar-based returns among the various local markets. The old order of strength was re-established with the yen in the vanguard (+13% vs. U.S. dollar) and sterling (-19% vs. U.S. dollar) in the rear. This transformed the Japanese stock market’s local return of -43% for the year into one of the least negative in dollar terms at -30%, and the U.K.’s local return of -31% into a crunching -50% in U.S. dollars. Beyond the travails of the large markets there was chaos in some smaller markets, particularly on the euro periphery where a decade or more of easy money had monstrously inflated immature banking systems. Years of massive increases in bank balance sheets came home to roost in Ireland (-73%), Austria (-69%) and Greece (-67%), where only inclusion in the euro zone stood between them and the fate of Iceland (whose market fell 87% in dollar terms).
· The banking crisis was the determining feature of 2008, and as bank nationalizations followed bank bail-outs, the market had to face the potential for unlimited dilution and for share prices to fall to zero in “broken” banks. Additionally, it was also the year where the banking crisis went far beyond subprime mortgages and spread to every corner of economic activity. Cyclical sectors that had previously been considered immune were massively downgraded by the market and declined sharply. One of the most surprising features of 2008 was the degree of loss in sectors with traditional defensive characteristics like consumer staples, telecommunications and utilities.
Unlike previous recent bear markets, such as the Asian crisis in 1998 and the tech-media-telecom (TMT) crash of 2001-2003, the degree of forced selling and the impenetrability of the looming storm clouds meant there were no safe havens in which to hide.
Management Strategies
· The Portfolio’s positioning in anticipation of financial and cyclical sector weakness served it well in 2008 on a relative basis. The underweights in European and Australian financials, commodity materials, capital goods, the emerging markets (where the Portfolio had zero exposure), and consumer discretionary sectors added value. Positive stock selection was significant in our financial, materials and technology holdings. In particular, our Japanese financials were significantly insulated from losses in Western securities; however, this was offset by continued weakness in our Japanese industrials and technology positions as the yen strengthened. Our consumer staples positions declined with the sector in the general panic, and those domiciled in the U.K. particularly suffered in dollar terms as the sterling depreciated, despite their predominantly non- sterling based profits. Our cash position and hedging strategy proved profitable in an absolute return sense.
· We believe that the first central issue that markets will have to face in 2009 will be the viciousness of profit evaporation in cyclical sectors and companies. While there is a consensus that profits will be weak in cyclicals, we believe the potential weakness is woefully underestimated. Despite the recent sales declines in capital equipment and other industrials, inventories continue to build. As a result, we anticipate that sales declines and inventory write-offs will increase and cash flows will turn more steeply negative.
· The second major issue for 2009 in our view will be the impact on banks of the vast surplus of capacity that has accumulated in manufacturing during the boom years of 2004-2007. Even if governments can kick-start the global economy, which we doubt, we believe working off this excess capacity will take much longer and cyclicals will remain off the table for some time. We also believe that, simply put, banks have hardly raised enough capital
38 |
|
|
| 2008 Annual Report |
|
|
| December 31, 2008 |
Investment Overview (cont’d)
International Equity Portfolio
to deal with their securities writedowns of 2008 and will continue to restrict lending wherever possible to lower their leverage levels. The likely failure of the banking system to pass on the credit so keenly offered by central banks will mean systemic bank nationalizations in places like the U.K. and Ireland is a real possibility this year.
· Finally, can emerging markets come to the rescue in 2009? We believe emerging markets do not have the same degree of risk in their finance industries as Western markets, but their exposure to the secondary effects of these fireworks is likely to be just as problematic on their still relatively expensive stock markets.
· As always, our key reference point for investing is valuation. In the cyclical areas of the market we believe valuation levels have moved back to discounting average mid-cycle margins. We think a scenario far worse than this is likely over the medium term and so, in the main, we believe valuations there are not yet attractive. The exception to this is Japan, where valuation levels are lower, but here the strength of the yen means that cyclical exporters are right to be discounting additional weakness. We believe Western banks remain dangerous for the reasons explained above. Defensive sectors such as consumer staples, however, with defendable (and growing) free cash streams valued on a free cash flow yield of 7% do look attractive, particularly given the disinflation bias we think is highly probable for the global economy. We feel that a relative re-rating of defensives is due after the indiscriminate destruction of 2008. Overall, we continue to feel pessimistic about the market’s ability to shrug off the effects of a massive structural withdrawal of credit, and remain defensively positioned in the best business franchises we can find at good to excellent prices.

* Minimum Investment
In accordance with SEC regulations, Portfolio’s performance shown assumes that all recurring fees (including management fees) were deducted and all dividends and distributions were reinvested. The performance of Class P shares will vary from the Class I shares based upon their different inception dates and will be negatively impacted by additional fees assessed to that class.
Performance Compared to the Morgan Stanley Capital International (MSCI) EAFE Index(1) and the Lipper International Large-Cap Value Funds Average(2)
|
|
| Total Returns(3) |
| ||||||
|
|
|
| Average Annual |
| |||||
|
| One |
| Five |
| Ten |
| Since | (6) | |
Portfolio – Class I (4) |
| (33.12 | )% | 2.82 | % | 5.38 | % | 8.93 | % | |
MSCI EAFE Index |
| (43.38 | ) | 1.66 |
| 0.80 |
| 3.03 |
| |
Lipper International Large-Cap Value Funds Average |
| (43.78 | ) | 1.69 |
| 3.31 |
| 8.17 |
| |
Portfolio – Class P (5) |
| (33.21 | ) | 2.58 |
| 5.14 |
| 7.72 |
| |
MSCI EAFE Index |
| (43.38 | ) | 1.66 |
| 0.80 |
| 2.63 |
| |
Lipper International Large-Cap Value Funds Average |
| (43.78 | ) | 1.69 |
| 3.31 |
| 5.79 |
| |
Performance data quoted represents past performance, which is no guarantee of future results, and current performance may be lower or higher than the figures shown. Performance assumes that all dividends and distributions, if any, were reinvested. For the most recent month-end performance figures, please visit www.morganstanley.com/msim. Investment return and principal value will fluctuate so that Portfolio shares, when redeemed, may be worth more or less than their original cost. Total returns do not reflect the deduction of taxes that a shareholder would pay on Portfolio distributions or the redemption of Portfolio shares. Performance of share classes will vary due to difference in expenses.
|
| 39 |
2008 Annual Report |
|
|
|
December 31, 2008 |
|
Investment Overview (cont’d)
International Equity Portfolio
(1) The Morgan Stanley Capital International (MSCI) EAFE Index (Europe, Australasia, Far East) is a free float-adjusted market capitalization index that is designed to measure the international equity market performance of developed markets, excluding the US & Canada. The term “free float” represents the portion of shares outstanding that are deemed to be available for purchase in the public equity markets by investors. The MSCI EAFE Index curently consists of 21 developed market country indices. The performance of the Index is listed in U.S. dollars and assumes reinvestment of net dividends. The Index is unmanaged and its returns do not include any sales charges or fees. Such costs would lower performance. It is not possible to invest directly in an index.
(2) The Lipper International Large-Cap Value Funds Average tracks the performance of all funds in the Lipper International Large-Cap Value Funds classification. The Average, which is adjusted for capital gains distributions and income dividends, is unmanaged and should not be considered an investment. As of the date of this report, the Portfolio was in the Lipper International Large-Cap Value Funds classification.
(3) Total returns for the Portfolio reflect fees waived and expenses reimbursed, if applicable, by the Adviser. Without such waivers and/or reimbursements, total returns would have been lower. Fee waivers and/or expense reimbursements are voluntary and the Adviser reserves the right to commence or terminate any waiver and/or reimbursement at any time.
(4) Commenced operations on August 4, 1989
(5) Commenced operations on January 2, 1996
(6) For comparative purposes, average annual since inception returns listed for the Indexes refer to the inception date or initial offering of the respective share class of the Portfolio, not the inception of the Index.
Portfolio Composition*
|
| Percentage of |
| |
Classification |
| Total Investments |
| |
Oil, Gas & Consumable Fuels |
| 10.2 | % | |
Food Products |
| 7.7 |
| |
Pharmaceuticals |
| 6.7 |
| |
Tobacco |
| 6.2 |
| |
Electronic Equipment & Instruments |
| 5.9 |
| |
Insurance |
| 5.0 |
| |
Other** |
| 53.5 |
| |
Short-Term Investment |
|
| 4.8 |
|
Total Investments |
|
| 100.0 | % |
* | Percentages indicated are based upon total investments (excluding Securities held as collateral on Loaned Securities) as of December 31, 2008. |
** | Industries which do not appear in the above table, as well as those which represent less than 5% of total investments, if applicable, are included in the category labeled “Other”. |
40 |
|
|
| 2008 Annual Report |
|
|
| December 31, 2008 |
Portfolio of Investments
International Equity Portfolio
|
|
|
| Value |
| |
|
| Shares |
| (000) |
| |
Common Stocks (93.9%) |
|
|
|
|
| |
Australia (3.6%) |
|
|
|
|
| |
AMP Ltd. |
| 7,502,580 |
| $ 28,522 |
| |
Foster’s Group Ltd. |
| 5,764,385 |
| 22,176 |
| |
Orica Ltd. |
| 674,055 |
| 6,618 |
| |
OZ Minerals Ltd. (d) |
| 44,323,307 |
| 18,265 |
| |
Santos Ltd. |
| 3,990,606 |
| 41,706 |
| |
|
|
|
| 117,287 |
| |
Austria (0.7%) |
|
|
|
|
| |
Telekom Austria AG |
| 1,694,331 |
| 24,490 |
| |
Belgium (0.4%) |
|
|
|
|
| |
KBC Groep N.V. |
| 402,948 |
| 12,171 |
| |
Canada (0.9%) |
|
|
|
|
| |
EnCana Corp. |
| 644,309 |
| 29,729 |
| |
Finland (0.5%) |
|
|
|
|
| |
Nokia Oyj (c) |
| 1,018,799 |
| 15,794 |
| |
France (6.8%) |
|
|
|
|
| |
ArcelorMittal (c) |
| 405,776 |
| 9,781 |
| |
Electricite de France (c) |
| 1,202,197 |
| 69,873 |
| |
France Telecom S.A. (c) |
| 664,186 |
| 18,578 |
| |
Legrand S.A. (c) |
| 2,200,936 |
| 42,291 |
| |
Total S.A. (c) |
| 917,435 |
| 50,016 |
| |
Vallourec (c) |
| 296,406 |
| 33,712 |
| |
|
|
|
| 224,251 |
| |
Germany (5.6%) |
|
|
|
|
| |
Bayer AG (c) |
| 865,029 |
| 50,816 |
| |
Continental AG (a) |
| 250,579 |
| 25,382 |
| |
E.ON AG (c) |
| 1,418,550 |
| 57,362 |
| |
Porsche Automobil Holding SE |
|
|
|
|
| |
(Non-Voting Shares) (c) |
| 136,603 |
| 10,642 |
| |
RWE AG (c) |
| 456,071 |
| 40,999 |
| |
|
|
|
| 185,201 |
| |
Greece (0.9%) |
|
|
|
|
| |
OPAP S.A. |
| 1,059,423 |
| 30,478 |
| |
Hong Kong (0.4%) |
|
|
|
|
| |
Esprit Holdings Ltd. |
| 2,583,500 |
| 14,726 |
| |
Ireland (1.5%) |
|
|
|
|
| |
CRH plc |
| 1,961,453 |
| 49,503 |
| |
Italy (2.2%) |
|
|
|
|
| |
ENI S.p.A. |
| 2,087,446 |
| 49,464 |
| |
UniCredit S.p.A. |
| 9,166,527 |
| 22,820 |
| |
|
|
|
| 72,284 |
| |
Japan (27.6%) |
|
|
|
|
| |
Asatsu-DK, Inc. (c) |
| 647,085 |
| 14,507 |
| |
Astellas Pharma, Inc. |
| 856,300 |
| 34,844 |
| |
Canon, Inc. |
| 428,100 |
| 13,439 |
| |
Chiba Bank Ltd. (The) |
| 3,900,000 |
| 24,368 |
| |
Fukuoka Financial Group, Inc. |
| 5,631,000 |
| 24,527 |
| |
Hoya Corp. (c) |
| 2,669,800 |
| 46,379 |
| |
INPEX Corp. |
| 4,568 |
| 36,090 |
| |
JSR Corp. (c) |
| 1,228,300 |
| 13,824 |
| |
Kao Corp. |
| 1,007,000 |
|
| 30,495 |
|
Keyence Corp. (c) |
| 290,100 |
| 59,400 |
| |
Komatsu Ltd. |
| 834,200 |
| 10,567 |
| |
Kyocera Corp. |
| 239,600 |
| 17,285 |
| |
Mitsubishi Electric Corp. |
| 5,323,000 |
| 33,310 |
| |
Mitsubishi Estate Co., Ltd. |
| 2,335,000 |
| 38,507 |
| |
Mitsui Sumitomo Insurance Group Holdings, Inc. |
| 1,588,600 |
| 50,666 |
| |
Murata Manufacturing Co., Ltd. (c) |
| 1,128,800 |
| 44,249 |
| |
NGK Spark Plug Co., Ltd. (c) |
| 3,559,000 |
| 28,523 |
| |
Nintendo Co., Ltd. |
| 44,000 |
| 16,905 |
| |
Nitto Denko Corp. |
| 757,700 |
| 14,557 |
| |
NTT DoCoMo, Inc. |
| 21,494 |
| 42,371 |
| |
Omron Corp. |
| 1,936,700 |
| 25,994 |
| |
Rohm Co., Ltd. |
| 682,100 |
| 34,443 |
| |
Sega Sammy Holdings, Inc. (c) |
| 1,574,000 |
| 18,264 |
| |
Sekisui House Ltd. (c) |
| 3,997,000 |
| 34,986 |
| |
Sumitomo Mitsui Financial Group, Inc. (c) |
| 9,193 |
| 39,822 |
| |
T&D Holdings, Inc. |
| 1,965,950 |
| 82,433 |
| |
Taiyo Nippon Sanso Corp. |
| 5,776,000 |
| 44,524 |
| |
Teijin Ltd. (c) |
| 4,334,000 |
| 12,251 |
| |
Toyota Motor Corp. |
| 643,700 |
| 21,070 |
| |
|
|
|
| 908,600 |
| |
Netherlands (4.3%) |
|
|
|
|
| |
Akzo Nobel N.V. |
| 995,361 |
| 41,046 |
| |
CSM N.V. (c) |
| 1,000,281 |
| 16,070 |
| |
Unilever N.V. CVA |
| 3,503,508 |
| 84,891 |
| |
|
|
|
| 142,007 |
| |
Spain (2.0%) |
|
|
|
|
| |
Telefonica S.A. |
| 2,951,310 |
| 66,155 |
| |
Sweden (0.3%) |
|
|
|
|
| |
Ssab Svenskt Stal AB, Class A (c) |
| 949,597 |
| 8,364 |
| |
Switzerland (9.8%) |
|
|
|
|
| |
Givaudan S.A. (Registered) |
| 22,306 |
| 17,572 |
| |
Holcim Ltd. (Registered) (c) |
| 662,899 |
| 38,169 |
| |
Nestle S.A. (Registered) |
| 3,155,236 |
| 124,356 |
| |
Novartis AG (Registered) |
| 1,227,834 |
| 61,520 |
| |
Roche Holding AG (Genusschein) |
| 456,984 |
| 70,345 |
| |
UBS AG (Registered) (a) |
| 830,602 |
| 12,047 |
| |
|
|
|
| 324,009 |
| |
United Kingdom (25.5%) |
|
|
|
|
| |
BG Group plc |
| 2,218,585 |
| 30,802 |
| |
BHP Billiton plc |
| 3,870,456 |
| 72,907 |
| |
BP plc |
| 7,174,526 |
| 54,973 |
| |
British American Tobacco plc |
| 3,859,534 |
| 100,284 |
| |
British Land Co. plc REIT |
| 1,966,935 |
| 15,767 |
| |
Cadbury plc |
| 2,795,494 |
| 24,472 |
| |
Drax Group plc |
| 818,593 |
| 6,636 |
| |
Hays plc |
| 34,939,263 |
| 35,224 |
| |
Imperial Tobacco Group plc |
| 3,794,176 |
| 101,354 |
| |
Intercontinental Hotels Group plc |
| 4,403,562 |
| 35,830 |
| |
Ladbrokes plc |
| 5,337,007 |
| 14,274 |
| |
Lonmin plc |
| 1,514,669 |
| 19,996 |
| |
| The accompanying notes are an integral part of the financial statements. | 41 |
2008 Annual Report |
|
|
|
December 31, 2008 |
|
Portfolio of Investments (cont’d)
International Equity Portfolio
|
|
|
| Value |
|
|
| Shares |
| (000) |
|
United Kingdom (cont’d) |
|
|
|
|
|
National Grid plc |
| 709,740 |
| $ 7,014 |
|
Reckitt Benckiser Group plc |
| 2,089,669 |
| 77,850 |
|
Reed Elsevier plc |
| 5,928,800 |
| 43,214 |
|
Royal Bank of Scotland Group plc |
| 9,537,505 |
| 6,895 |
|
Royal Dutch Shell plc, Class A |
| 1,519,499 |
| 39,603 |
|
Scottish & Southern Energy plc |
| 1,347,091 |
| 23,719 |
|
Smiths Group plc |
| 3,089,754 |
| 39,781 |
|
Vodafone Group plc |
| 32,534,330 |
| 65,495 |
|
Wolseley plc |
| 4,156,534 |
| 23,175 |
|
|
|
|
| 839,265 |
|
United States (0.9%) |
|
|
|
|
|
Dr. Pepper Snapple Group, Inc. (a) |
| 1,767,407 |
| 28,720 |
|
Total Common Stocks (Cost $3,826,005) |
|
|
| 3,093,034 |
|
Short-Term Investments (13.1%) |
|
|
|
|
|
Securities held as Collateral on Loaned Securities (8.4%) |
|
|
|
|
|
Investment Company (6.7%) |
|
|
|
|
|
Morgan Stanley Institutional Liquidity Money Market Portfolio — Institutional Class (o) |
| 220,548,120 |
| 220,548 |
|
|
|
|
|
|
|
|
| Face |
|
|
|
|
| Amount |
|
|
|
|
| (000) |
|
|
|
Repurchase Agreement (1.7%) |
|
|
|
|
|
Goldman Sachs & Co., 0.06%, dated 12/31/08, due 1/2/09, repurchase price $54,180; fully collateralized by U.S. government agency securities at the date of this Portfolio of Investments as follows: Federal Home Loan Mortgage Corp., Gold Pools: rates ranging from 4.50% to 6.00%, due 11/1/19 - 12/1/38; Federal National Mortgage Association, Fixed Rate Mortgages: rates ranging from 4.00% - 7.00%, due 9/1/18 - 1/1/39; Government National Mortgage Association, Fixed Rate Mortgages: rates ranging from 4.50% to 11.50%, due 6/15/16 - 12/20/38, valued at $55,264. |
| $ 54,180 |
| 54,180 |
|
|
|
|
| 274,728 |
|
|
|
|
|
|
|
|
| Shares |
|
|
|
Investment Company (4.7%) |
|
|
|
|
|
Morgan Stanley Institutional Liquidity Money Market Portfolio — Institutional Class (o) |
| 155,575,139 |
| 155,575 |
|
Total Short-Term Investments (Cost $430,303) |
|
|
| 430,303 |
|
Total Investments (107.0%) (Cost $4,256,308) — including $261,509 of Securities Loaned (v) |
|
|
| 3,523,337 |
|
Liabilities in Excess of Other Assets (-7.0%) |
|
|
| (229,437 | ) |
Net Assets (100%) |
|
|
| $3,293,900 |
|
(a) | Non-income producing security. |
(c) | All or a portion of security on loan at December 31, 2008. |
(d) | At December 31, 2008, the Portfolio held approximately $18,265,000 of fair valued securities, representing 0.6% of net assets. These securities have been fair valued as determined in good faith under procedures established by and under the general supervision of the Portfolio’s Directors. |
(o) | See Note G to the financial statements regarding investment in Morgan Stanley Institutional Liquidity Money Market Portfolio — Institutional Class. |
(v) | The approximate market value and percentage of total investments, $3,016,320,000 and 85.6%, respectively, represent the securities that have been fair valued under the fair valuation policy for international investments as disclosed in Note A within the Notes to Financial Statements. |
CVA | Certificaten Van Aandelen |
REIT | Real Estate Investment Trust |
Foreign Currency Exchange Contract Information:
The Portfolio had the following foreign currency exchange contract(s) open at period end:
Currency |
| Value |
| Settlement |
| In |
| Value |
| Net |
| ||||||||
GBP | 52,000 |
|
| $ 74,748 |
|
| 1/12/09 |
| AUD | 115,852 |
|
| $ 80,707 |
|
|
| $ 5,959 |
|
|
GBP | 52,000 |
|
| 74,749 |
|
| 1/12/09 |
| EUR | 65,315 |
|
| 90,763 |
|
|
| 16,014 |
|
|
GBP | 26,000 |
|
| 37,374 |
|
| 1/12/09 |
| SGD | 67,730 |
|
| 46,999 |
|
|
| 9,625 |
|
|
|
|
|
| $186,871 |
|
|
|
|
|
|
|
| $218,469 |
|
|
| $31,598 |
|
|
AUD — Australian Dollar
EUR — Euro
GBP — British Pound
SGD — Singapore Dollar
42 | The accompanying notes are an integral part of the financial statements. |
|
| 2008 Annual Report |
|
|
| December 31, 2008 |
Investment Overview (unaudited)
International Growth Active Extension Portfolio
The International Growth Active Extension Portfolio (the “Portfolio”) seeks long-term capital appreciation with a secondary objective of income. The Adviser seeks to construct a diversified portfolio primarily consisting of equity securities of issuers located in countries other than the United States using a quantitative security selection model and fundamental analysis. In addition to purchasing equity securities (i.e., taking long positions), the Adviser attempts to identify stocks that it believes will underperform relative to the average stock in the MSCI EAFE Index and will sell these securities short on behalf of the Portfolio.
Investments in foreign markets entail special risks such as currency, political, economic, and market risks. The risks of investing in emerging-market countries are greater than the risks generally associated with foreign investments. Short sales expose the Portfolio to the risk that it will be required to cover its short positions at a time when securities have appreciated in value, thus resulting in a loss to the portfolio. Leverage may cause the Portfolio’s net asset value to be more volatile than if it had not been leveraged because leverage tends to magnify the effect of any increases or decreases in the value of Portfolio’s securities. The Portfolio cannot assure you that the use of leverage will result in a higher return on your investment.
Performance
For the year ended December 31, 2008, the Portfolio had a total return based on net asset value and reinvestment of distributions per share of -54.13%, net of fees, for Class I shares. The Portfolio’s Class I shares underperformed against its benchmark, the MSCI EAFE Index (the “Index”) which returned -43.38% for the same period.
Factors Affecting Performance
· International equity markets experienced record price declines in calendar year 2008, fueled by the global financial maelstrom, frozen credit markets, and high volatility in the world’s commodity prices. For the year ending December 31, 2008, the Index showed a net total return of -43.38%, the biggest yearly decline in the 39-year history of the Index.
· In 2008, all regional benchmarks, along with the Index, had negative returns. Within EAFE, the Asia Pacific Ex-Japan region was down the most in the year -50.50%. Japan was down the least in the year -29.21%, helped by the strong yen. EAFE sector returns were down universally as well for the year. In 2008, health care was the best performing sector on a relative basis -18.66%, while financials was the worst performing sector -54.87%. Additionally, investors in foreign shares were disadvantaged by global central banks that were slow to cut rates relative to the U.S. Federal Reserve, which has lowered interest rates by 5.0% since the beginning of 2007. The U.S. dollar gained against most foreign currencies including 4.4% versus the euro and 35.9% versus the pound; however, the dollar lost 18.9% versus the yen for the year.
· Underperformance in the Portfolio in 2008 can be attributed to selections in Japan and Europe. Additionally, in Japan, the strengthening yen negatively impacted returns due to the Portfolio’s underweight in the country relative to the Index and positions in Japanese exporters. For example, the Portfolio held a long position in the world’s second largest camera maker, which cut its full-year net income forecast by 40% in the fourth quarter, citing lower investment by chipmakers and a stronger yen. A short position in a Japanese rail operator also detracted from performance, as the company boosted its full year sales forecast after revealing its plan to lift its stake in a travel agency. In Europe, bank stock performance ebbed for much of the year. Long positions in the Portfolio that underperformed included a large French bank, which was under pressure to increase its shareholder equity at year end after a disappointing fourth quarter earnings release and a regulatory challenge to a planned acquisition, and a leading Greek lender, which posted a lower third-quarter profit on higher impairment costs and plans to tap the Greek government’s liquidity support plan. Finally, a short position in a French clothing and handbag designer detracted from performance as takeover speculation boosted its shares.
· While the Asia Pacific ex-Japan region was the worst performing region in absolute terms, it was the best performing region in the Portfolio relative to the Index in the year. A long position in an Australian health care company, which is the world’s second largest maker of blood plasma products, performed well on announced plans to boost research spending at the fastest pace in four years to accelerate the development of flu vaccines and drugs for cancer and rheumatoid arthritis in anticipation of rising demand. A short position in New Zealand’s largest phone company helped performance as the company announced both a decline in prices for calling and Internet services and rising costs to meet government regulations.
43
2008 Annual Report |
|
|
|
December 31, 2008 |
|
Investment Overview (cont’d)
International Growth Active Extension Portfolio
· On a sector basis, Portfolio holdings in the telecommunications sector were the largest underperformers relative to the Index for the year. A long position in a large Nordic phone company slumped after the company agreed in October to buy 60% of an Indian telecom. We believed this strategy increased the company’s overall risk profile and the position was sold in the fourth quarter. The financials sector also contributed to the Portfolio’s relative underperformance for the year. In addition to the aforementioned banks, a long position in Norway’s largest publicly traded insurer lagged after it reported its first quarterly loss in more than five years as weakening financial markets reduced the value of its investments.
· Performance in the materials sector was positive relative to Index for the year. A long position in the world’s largest maker of carbon and graphite products was additive, as the company reported a third-quarter profit increase of 70% on demand from steel and aluminum customers as well as from a price increase in its graphite electrodes, which are used in smelting furnaces. A short position in a Greek cement company also helped performance as the stock price fell on higher production costs and slowing demand.
Management Strategies
· While the initial impact of the financial crisis was directly on the U.S. economy, the surprise in 2008 was the subsequent global scale of the impact and collective decline of international equity markets. During the year, a broad number of country indexes fell by more than 40%, including Germany, France, Japan, Hong Kong, China and India. Given the broad-based market sell-off, our high-quality, predominantly large-cap growth investment style faced stiff headwinds in the latter part of the third quarter and in the beginning of the fourth quarter as investors indiscriminately sold highly liquid equities, value was briefly in favor, and lower-quality stocks outperformed higher-quality stocks. These conditions contributed to the Portfolio’s relative underperformance.
· The outlook for a sustained recovery in non-U.S. equity markets is contingent on credit market improvements in the U.S. and abroad, which we began to see toward the end of the year. For example, over the last five weeks of 2008 (November 24th to December 31st), the Index rallied 10.72%. As global markets began to digest the massive fiscal and monetary policy efforts, various classes of bond spreads to government bonds declined. Equity market volatility dropped below its November peak, providing further stability to the equity markets. While the economic news may continue to deteriorate into 2009, we believe equity markets may steady. Stocks typically move earlier, quicker, and sharper, than business and economic fundamentals. Given the uncertain economic conditions, we believe investors may gravitate toward growth stocks and their stable cash flow generation. Additionally, in our view, growth companies’ relatively healthy cash balances will also help reduce their vulnerability to tight credit conditions. Given our bottom-up investment process of building a diversified portfolio comprised of high-quality growth stocks, we believe the Portfolio is well positioned in the current economic environment.

* | Minimum Investment |
** | Commenced operations on July 31, 2007. |
In accordance with SEC regulations, Portfolio’s performance shown assumes that all recurring fees (including management fees) were deducted and all dividends and distributions were reinvested. The performance of Class P, Class H, and Class L shares will vary from the Class I shares based upon their different inception dates and will be negatively impacted by additional fees assessed to those classes.
44
| 2008 Annual Report |
|
|
| December 31, 2008 |
Investment Overview (cont’d)
International Growth Active Extension Portfolio
Performance Compared to the Morgan Stanley Capital International (MSCI) EAFE Index(1) and the Lipper International Large-Cap Growth Funds Index(2)
|
| Total Returns(3) |
| ||
|
|
|
| Average Annual | |
|
| One |
| Since |
|
|
| Year |
| Inception | (7) |
Portfolio – Class I (4) |
| (54.13 | )% | (39.60 | )% |
MSCI EAFE Index |
| (43.38 | ) | (32.15 | ) |
Lipper International Large-Cap Growth Funds Index |
| (42.68 | ) | (29.95 | ) |
|
|
|
|
|
|
Portfolio – Class P (4) |
| (54.48 | ) | (39.96 | ) |
MSCI EAFE Index |
| (43.38 | ) | (32.15 | ) |
Lipper International Large-Cap Growth Funds Index |
| (42.68 | ) | (29.95 | ) |
|
|
|
|
|
|
|
|
|
| Cumulative |
|
|
|
|
| Since |
|
|
|
|
| Inception | (7) |
Portfolio – Class H w/o sales charges (5) |
| — |
| (54.42 | ) |
Portfolio – Class H with maximum 4.75% sales charges (5) |
| — |
| (56.59 | ) |
MSCI EAFE Index |
| — |
| (43.38 | ) |
Lipper International Large-Cap Growth Funds Index |
| — |
| (42.34 | ) |
|
|
|
|
|
|
Portfolio – Class L (6) |
| — |
| (50.96 | ) |
MSCI EAFE Index |
| — |
| (38.46 | ) |
Lipper International Large-Cap Growth Funds Index |
| — |
| (38.54 | ) |
Performance data quoted represents past performance, which is no guarantee of future results, and current performance may be lower or higher than the figures shown. Performance assumes that all dividends and distributions, if any, were reinvested. For the most recent month-end performance figures, please visit www.morganstanley.com/msim. Investment return and principal value will fluctuate so that Portfolio shares, when redeemed, may be worth more or less than their original cost. Total returns do not reflect the deduction of taxes that a shareholder would pay on Portfolio distributions or the redemption of Portfolio shares. Performance of share classes will vary due to difference in sales charges and expenses.
(1) The Morgan Stanley Capital International (MSCI) EAFE Index (Europe, Australasia, Far East) is a free float-adjusted market capitalization index that is designed to measure the international equity market performance of developed markets, excluding the US & Canada. The term “free float” represents the portion of shares outstanding that are deemed to be available for purchase in the public equity markets by investors. The MSCI EAFE Index currently consists of 21 developed market country indices. The performance of the Index is listed in U.S. dollars and assumes reinvestment of net dividends. The Index is unmanaged and its returns do not include any sales charges or fees. Such costs would lower performance. It is not possible to invest directly in an index.
(2) The Lipper International Large-Cap Growth Funds Index is an equally weighted performance index of the largest qualifying funds (based on net assets) in the Lipper International Large-Cap Growth Funds classification. The Index, which is adjusted for capital gains distributions and income dividends, is unmanaged and should not be considered an investment. There are currently 10 funds represented in this Index. As of the date of this report, the Portfolio was in the Lipper International Large-Cap Growth Funds classification.
(3) Total returns for the Portfolio reflect fees waived and expenses reimbursed, if applicable, by the Adviser. Without such waivers and reimbursements, total returns would have been lower. Fee waivers and/or expense reimbursements are voluntary and the Adviser reserves the right to commence or terminate any waiver and/or reimbursement at any time.
(4) Commenced operations on July 31, 2007
(5) Commenced operations on January 2, 2008
(6) Commenced operations on June 16, 2008
(7) For comparative purposes, average annual since inception returns listed for the Indexes refer to the inception date or initial offering of the respective share class of the Portfolio, not the inception of the Index.
Portfolio Composition
|
| Percentage of |
| |
Classification |
| Total Investments |
| |
Commercial Banks |
| 10.9 | % | |
Oil, Gas & Consumable Fuels |
| 6.7 |
| |
Pharmaceuticals |
| 6.1 |
| |
Health Care Equipment & Supplies |
| 5.4 |
| |
Other* |
| 70.7 |
| |
Short-Term Investment |
|
| 0.2 |
|
Total Investments |
|
| 100.0 | % |
* | Industries which do not appear in the above table, as well as those which represent less than 5% of total investments, if applicable, are included in the category labeled “Other”. |
45
2008 Annual Report |
|
|
|
December 31, 2008 |
|
Portfolio of Investments
International Growth Active Extension Portfolio
|
|
|
| Value |
|
|
| Shares |
| (000) |
|
Long Positions (130.7%) |
|
|
|
|
|
Common Stocks (128.5%) |
|
|
|
|
|
Australia (3.6%) |
|
|
|
|
|
BHP Billiton Ltd. (q) |
| 3,924 |
| $ 83 |
|
CSL Ltd. |
| 4,121 |
| 97 |
|
|
|
|
| 180 |
|
Austria (3.2%) |
|
|
|
|
|
Erste Group Bank AG (q) |
| 2,900 |
| 68 |
|
Vienna Insurance Group |
| 2,712 |
| 94 |
|
|
|
|
| 162 |
|
Canada (3.5%) |
|
|
|
|
|
EnCana Corp. (q) |
| 1,850 |
| 85 |
|
Petrobank Energy & Resources Ltd. (a) |
| 2,500 |
| 41 |
|
Research In Motion Ltd. (a)(q) |
| 1,200 |
| 49 |
|
|
|
|
| 175 |
|
Denmark (1.9%) |
|
|
|
|
|
Vestas Wind Systems A/S (a) |
| 1,571 |
| 93 |
|
Egypt (1.0%) |
|
|
|
|
|
Orascom Construction Industries GDR (q) |
| 986 |
| 50 |
|
Finland (3.6%) |
|
|
|
|
|
Fortum Oyj (q) |
| 4,131 |
| 89 |
|
Kone Oyj, Class B (q) |
| 4,120 |
| 90 |
|
|
|
|
| 179 |
|
France (13.0%) |
|
|
|
|
|
ArcelorMittal |
| 1,780 |
| 43 |
|
AXA S.A. (q) |
| 3,855 |
| 86 |
|
BNP Paribas (q) |
| 1,636 |
| 69 |
|
Cie Generale d’Optique Essilor International S.A. |
| 3,685 |
| 173 |
|
LVMH Moet Hennessy Louis Vuitton S.A. (q) |
| 1,198 |
| 81 |
|
Total S.A. (q) |
| 3,695 |
| 201 |
|
|
|
|
| 653 |
|
Germany (14.5%) |
|
|
|
|
|
Adidas AG |
| 2,395 |
| 92 |
|
Bayer AG |
| 1,485 |
| 87 |
|
E.ON AG |
| 4,955 |
| 200 |
|
Linde AG |
| 1,638 |
| 139 |
|
SAP AG |
| 2,736 |
| 98 |
|
SGL Carbon AG (a) |
| 3,359 |
| 115 |
|
|
|
|
| 731 |
|
Greece (3.2%) |
|
|
|
|
|
Coca-Cola Hellenic Bottling Co. S.A. |
| 6,296 |
| 92 |
|
National Bank of Greece S.A. |
| 3,760 |
| 70 |
|
|
|
|
| 162 |
|
Hong Kong (8.6%) |
|
|
|
|
|
Bank of East Asia Ltd. |
| 30,800 |
| 65 |
|
China Resources Power Holdings Co., Ltd. |
| 52,000 |
| 101 |
|
CNOOC Ltd. |
| 104,000 |
| 99 |
|
Esprit Holdings Ltd. |
| 13,500 |
| 77 |
|
Parkson Retail Group Ltd. |
| 81,000 |
| 92 |
|
|
|
|
| 434 |
|
Indonesia (0.3%) |
|
|
|
|
|
Bumi Resources Tbk PT |
| 186,500 |
| 16 |
|
Ireland (1.7%) |
|
|
|
|
|
Ryanair Holdings plc ADR (a) |
| 3,000 |
| 87 |
|
Israel (2.4%) |
|
|
|
|
|
Teva Pharmaceutical Industries Ltd. ADR (q) |
| 2,900 |
| 123 |
|
Japan (20.8%) |
|
|
|
|
|
Canon, Inc. (q) |
| 3,300 |
| 104 |
|
FamilyMart Co., Ltd. |
| 2,900 |
| 126 |
|
Fast Retailing Co., Ltd. |
| 1,100 |
| 160 |
|
Komatsu Ltd. (q) |
| 6,300 |
| 80 |
|
Mitsubishi Estate Co., Ltd. |
| 6,000 |
| 99 |
|
Nikon Corp. |
| 4,000 |
| 48 |
|
Nippon Electric Glass Co., Ltd. |
| 9,000 |
| 47 |
|
Rakuten, Inc. (a) |
| 139 |
| 88 |
|
Shin-Etsu Chemical Co., Ltd. (q) |
| 2,000 |
| 92 |
|
Shionogi & Co., Ltd. |
| 1,000 |
| 26 |
|
Stanley Electric Co., Ltd. |
| 6,900 |
| 73 |
|
Terumo Corp. (q) |
| 2,200 |
| 103 |
|
|
|
|
| 1,046 |
|
Luxembourg (1.4%) |
|
|
|
|
|
Millicom International Cellular S.A. (q) |
| 1,600 |
| 72 |
|
Mexico (1.7%) |
|
|
|
|
|
America Movil S.A.B. de C.V., Class L ADR (q) |
| 2,700 |
| 84 |
|
Netherlands (2.6%) |
|
|
|
|
|
Reed Elsevier N.V. (q) |
| 10,951 |
| 129 |
|
Norway (0.9%) |
|
|
|
|
|
Storebrand ASA |
| 18,812 |
| 46 |
|
Portugal (3.9%) |
|
|
|
|
|
Banco Espirito Santo S.A. (Registered) |
| 11,800 |
| 111 |
|
Jeronimo Martins SGPS S.A. |
| 15,209 |
| 84 |
|
|
|
|
| 195 |
|
Singapore (2.6%) |
|
|
|
|
|
DBS Group Holdings Ltd. |
| 12,000 |
| 71 |
|
Keppel Corp. Ltd. |
| 19,000 |
| 58 |
|
|
|
|
| 129 |
|
Spain (1.9%) |
|
|
|
|
|
Banco Santander S.A. |
| 9,752 |
| 94 |
|
Sweden (1.6%) |
|
|
|
|
|
Tele2 AB, Class B |
| 8,876 |
| 79 |
|
Switzerland (14.6%) |
|
|
|
|
|
ABB Ltd. (Registered) (a)(q) |
| 5,787 |
| 87 |
|
EFG International AG (q) |
| 4,356 |
| 78 |
|
Nestle S.A. (Registered) (q) |
| 5,552 |
| 219 |
|
Roche Holding AG (Genusschein) (q) |
| 1,081 |
| 167 |
|
SGS S.A. (Registered) (q) |
| 175 |
| 183 |
|
|
|
|
| 734 |
|
Taiwan (1.8%) |
|
|
|
|
|
Delta Electronics, Inc. |
| 47,080 |
| 92 |
|
46 | The accompanying notes are an integral part of the financial statements. |
|
| 2008 Annual Report |
|
|
| December 31, 2008 |
Portfolio of Investments (cont’d)
International Growth Active Extension Portfolio
|
|
|
| Value |
|
|
| Shares |
| (000) |
|
United Kingdom (14.2%) |
|
|
|
|
|
G4S plc |
| 33,259 |
| $ 99 |
|
HSBC Holdings plc |
| 10,178 |
| 97 |
|
Man Group plc |
| 12,068 |
| 42 |
|
Prudential plc (q) |
| 14,128 |
| 86 |
|
Reckitt Benckiser Group plc (q) |
| 4,482 |
| 167 |
|
SABMiller plc (q) |
| 4,657 |
| 78 |
|
Smith & Nephew plc |
| 12,582 |
| 80 |
|
Standard Chartered plc (q) |
| 5,099 |
| 65 |
|
|
|
|
| 714 |
|
Total Common Stocks (Cost $10,893) |
|
|
| 6,459 |
|
|
|
|
|
|
|
|
| No. of |
|
|
|
|
| Rights |
|
|
|
Rights (0.2%) |
|
|
|
|
|
Singapore (0.2%) |
|
|
|
|
|
DBS Group Holdings Ltd., expires 1/20/09 |
|
|
|
|
|
(Cost $—) (a) |
| 6,000 |
| 13 |
|
|
|
|
|
|
|
|
| No. of |
|
|
|
|
| Warrants |
|
|
|
Warrant (1.6%) |
|
|
|
|
|
India (1.6%) |
|
|
|
|
|
Bharti Airtel Ltd., expires 3/17/11 |
|
|
|
|
|
(Cost $129) (a)(e) |
| 5,500 |
| 81 |
|
|
|
|
|
|
|
|
| Shares |
|
|
|
Short-Term Investment (0.2%) |
|
|
|
|
|
Investment Company (0.2%) |
|
|
|
|
|
Morgan Stanley Institutional Liquidity Money Market Portfolio — Institutional Class |
| 11,683 |
| 12 |
|
Total Investments (130.5%) (Cost $11,034) (v) |
|
|
| 6,565 |
|
Liabilities in Excess of Other Assets (-30.5%) |
|
|
| (1,536 | ) |
Net Assets (100%) |
|
|
| $ 5,029 |
|
Short Positions (34.4%)* |
|
|
|
|
|
Common Stocks (32.4%) |
|
|
|
|
|
Belgium (0.9%) |
|
|
|
|
|
Solvay S.A., Class A |
| 586 |
| 44 |
|
France (5.0%) |
|
|
|
|
|
BioMerieux |
| 657 |
| 55 |
|
Hermes International |
| 329 |
| 46 |
|
Legrand S.A. |
| 4,100 |
| 79 |
|
Pernod-Ricard S.A. |
| 965 |
| 71 |
|
|
|
|
| 251 |
|
Germany (1.2%) |
|
|
|
|
|
Fraport AG Frankfurt Airport Services Worldwide |
| 1,444 |
| 63 |
|
Hong Kong (1.0%) |
|
|
|
|
|
Sino Land Co. |
| 48,000 |
| 50 |
|
Italy (2.7%) |
|
|
|
|
|
Lottomtica S.p.A. |
| 2,714 |
| 67 |
|
Mediaset S.p.A. |
| 11,816 |
| 67 |
|
|
|
|
| 134 |
|
Japan (9.0%) |
|
|
|
|
|
Dai Nippon Printing Co., Ltd. |
| 7,000 |
| 77 |
|
Daiwa Securities Group, Inc. |
| 10,000 |
| 60 |
|
Kintetsu Corp. |
| 24,000 |
| 110 |
|
Ono Pharmaceutical Co., Ltd. |
| 1,100 |
| 57 |
|
Sompo Japan Insurance, Inc. |
| 11,000 |
| 81 |
|
Toyota Motor Corp. |
| 2,100 |
| 69 |
|
|
|
|
| 454 |
|
Mexico (0.9%) |
|
|
|
|
|
Wal-Mart de Mexico S.A.B. de C.V., Class V |
| 16,900 |
| 45 |
|
New Zealand (0.9%) |
|
|
|
|
|
Telecom Corp. of New Zealand Ltd. |
| 32,298 |
| 43 |
|
Sweden (3.6%) |
|
|
|
|
|
Svenska Handelsbanken AB, Class A |
| 4,194 |
| 68 |
|
Telefonaktiebolaget LM Ericsson, Class B |
| 8,647 |
| 66 |
|
Volvo AB, Class B |
| 8,400 |
| 47 |
|
|
|
|
| 181 |
|
Switzerland (4.3%) |
|
|
|
|
|
Givaudan S.A. (Registered) |
| 88 |
| 69 |
|
Kaba Holding AG |
| 355 |
| 88 |
|
Lindt & Spruengli AG |
| 33 |
| 61 |
|
|
|
|
| 218 |
|
United Kingdom (2.9%) |
|
|
|
|
|
GlaxoSmithKline plc |
| 4,047 |
| 75 |
|
Kingfisher plc |
| 36,210 |
| 71 |
|
|
|
|
| 146 |
|
Total Common Stocks (Proceeds $2,163) |
|
|
| 1,629 |
|
Investment Company (2.0%) |
|
|
|
|
|
United States (2.0%) |
|
|
|
|
|
Vanguard Emerging Markets ETF (Cost $175) |
| 4,200 |
| 100 |
|
Total Investment Companies (Proceeds $175) |
|
|
| 100 |
|
Total Short Positions (Proceeds $2,338) |
|
|
| $ 1,729 |
|
* | Percentage is based on Net Assets. |
(a) | Non-income producing security. |
(e) | 144A security — Certain conditions for public sale may exist. Unless otherwise noted, these securities are deemed to be liquid. |
(o) | See Note G to the financial statements regarding investment in Morgan Stanley Institutional Liquidity Money Market Portfolio — Institutional Class. |
(q) | Securities are pledged with a broker as collateral for short sales. |
(v) | The approximate market value and percentage of total investments, $6,099,000 and 92.8%, respectively, represent the securities that have been fair valued under the fair valuation policy for international investments as disclosed in Note A within the Notes to Financial Statements. |
@ | Value is less than $500. |
| The accompanying notes are an integral part of the financial statements. | 47 |
2008 Annual Report
December 31, 2008
Portfolio of Investments (cont’d)
International Growth Active Extension Portfolio
Foreign Currency Exchange Contract Information:
The Portfolio had the following foreign currency exchange contract(s) open at period end:
Currency |
| Value |
| Settlement |
| In |
| Value |
| Net |
| ||||||||
USD | 9 |
|
| $ 9 |
|
| 1/6/09 |
| CHF | 10 |
|
| $ 9 |
|
|
| $(— | )@ |
|
USD | 1 |
|
| 1 |
|
| 1/7/09 |
| CHF | 1 |
|
| 1 |
|
|
| (— | )@ |
|
|
|
|
| $10 |
|
|
|
|
|
|
|
| $10 |
|
|
| $(— | )@ |
|
CHF — Swiss Franc
USD — United States Dollar
Futures Contracts:
The Portfolio had the following futures contract(s) open at period end:
|
| Number |
| Value |
| Expiration |
| Net |
| ||
Long: |
|
|
|
|
|
|
|
|
|
| |
TOPIX Index |
|
|
|
|
|
|
|
|
|
| |
(Japan) |
| 2 |
| $190 |
| Mar-09 |
| $10 |
|
| |
|
|
|
|
|
|
|
|
|
|
| |
Short: |
|
|
|
|
|
|
|
|
|
| |
DJ Euro STOXX 50 |
|
|
|
|
|
|
|
|
|
| |
(Germany) |
| (5) |
| (170) |
| Mar-09 |
|
| (6 | ) |
|
|
|
|
|
|
|
|
|
| $ 4 |
|
|
Contracts for Difference:
The Portfolio had the following contracts for difference open at period end:
Contracts to Buy/Sell |
|
|
|
|
| Shares |
| Net |
| |||
Titan Cement Co. |
|
|
|
|
| (2,446 | ) |
| $52 |
|
| |
LG Display Co., Ltd. |
|
|
|
|
| (3,170 | ) |
| 29 |
|
| |
Tesco plc |
|
|
|
|
| 28,927 |
|
|
| (9 | ) |
|
|
|
|
|
|
|
|
|
| $72 |
|
| |
48 | The accompanying notes are an integral part of the financial statements. |
|
| 2008 Annual Report |
|
|
| December 31, 2008 |
Investment Overview (unaudited)
International Growth Equity Portfolio
The International Growth Equity Portfolio (the “Portfolio”) seeks long-term capital appreciation, with a secondary objective of income by investing primarily in a diversified portfolio of equity securities of issuers located in countries other than the U.S. Foreign investing involves certain risks, including currency fluctuations and controls, restrictions on foreign investments, less governmental supervision and regulation, less liquidity and the potential for market volatility and political instability. The risks of investing in emerging-market countries are greater than the risks generally associated with foreign investments.
Performance
For the year ended December 31, 2008, the Portfolio had a total return based on net asset value and reinvestment of distributions per share of -48.70%, net of fees, for Class I shares. The Portfolio’s Class I shares underperformed against its benchmark, the Morgan Stanley Capital International (MSCI) EAFE Index (the “Index”) which returned -43.38%.
Factors Affecting Performance
· International equity markets experienced record price declines in calendar year 2008, fueled by the global financial maelstrom, frozen credit markets, and high volatility in the world’s commodity prices. For the year ending December 31, 2008, the Index showed a net total return of -43.38%, the biggest yearly decline in the 39-year history of the Index.
· In 2008, all regional benchmarks, along with the MSCI Emerging Markets Index, had negative returns. Within EAFE, the Asia Pacific Ex-Japan region was down the most in the year -50.50%. Japan was down the least in the year -29.21%, helped by the strong yen. EAFE sector returns were down universally as well for the year. In 2008, health care was the best performing sector on a relative basis -18.66%, while financials was the worst performing sector -54.87%. Additionally, investors in foreign shares were disadvantaged by global central banks that were slow to cut rates relative to the U.S. Federal Reserve, which has lowered interest rates by 5.0% since the beginning of 2007. The U.S. dollar gained against most foreign currencies including 4.4% versus the euro and 35.9% versus the pound; however, the dollar lost 18.9% versus the yen for the year.
· Underperformance in the Portfolio in 2008 can be attributed to selections in Japan and Europe. Additionally, in Japan, the strengthening yen negatively impacted returns due to the Portfolio’s underweight in the country relative to the Index and positions in Japanese exporters. For example, the Portfolio held a position in the world’s second largest camera maker, which cut its full-year net income forecast by 40% in the fourth quarter citing lower investment by chipmakers and a stronger yen. In Europe, bank stock performance ebbed for much of the year. Positions in the Portfolio that underperformed included a large French bank, which was under pressure to increase its shareholder equity at year end after a disappointing fourth quarter earnings release and a regulatory challenge to a planned acquisition; an Austrian bank, which lowered its 2008 earnings outlook due to the decline in global markets and subsequent widening of credit spreads; and a leading Greek lender, which posted a lower third-quarter profit on higher impairment costs and plans to tap the Greek government’s liquidity support plan.
· While the Asia Pacific ex-Japan region was the worst performing region in absolute terms, it was the best performing region in the Portfolio relative to the Index in the year. A position in an Australian health care company, which is the world’s second largest maker of blood plasma products, performed well on announced plans to boost research spending at the fastest pace in four years to accelerate the development of flu vaccines and drugs for cancer and rheumatoid arthritis in anticipation of rising demand.
· On a sector basis, Portfolio holdings in the telecommunications sector were the largest underperformers relative to the Index for the year. A large Nordic phone company slumped after agreeing in October to buy 60% of an Indian telecom. We believed this strategy increased the company’s overall risk profile and the position was sold in the fourth quarter. The financials sector also contributed to the Portfolio’s relative underperformance for the year. In addition to the aforementioned banks, relative performance was hurt by Norway’s largest publicly traded insurer, which reported its first quarterly loss in more than five years as weakening financial markets reduced the value of its investments.
· Performance in the materials sector was positive relative to Index for the year. The Portfolio’s positions included the world’s largest maker of carbon and graphite products, which reported a third-quarter profit increase of 70% on demand from steel and aluminum customers as well as from a price increase in its graphite electrodes, which are used in smelting furnaces. Also held by the Portfolio was the world’s largest silicon wafer manufacturer, which saw its first-half profit slightly exceed its forecast supported by increased sales of its polyvinyl chloride products.
49
2008 Annual Report
December 31, 2008
Investment Overview (cont’d)
International Growth Equity Portfolio
Management Strategies
· While the initial impact of the financial crisis was directly on the U.S. economy, the surprise in 2008 was the subsequent global scale of the impact and collective decline of international equity markets. During the year, a broad number of country indexes fell by more than 40%, including Germany, France, Japan, Hong Kong, China and India. Given the broad-based market sell-off, our high-quality, predominantly large-cap growth investment style faced stiff headwinds in the latter part of the third quarter and in the beginning of the fourth quarter as investors indiscriminately sold highly liquid equities, value was briefly in favor, and lower-quality stocks outperformed higher-quality stocks. These conditions contributed to the Portfolio’s relative underperformance.
· The outlook for a sustained recovery in non-U.S. equity markets is contingent on credit market improvements in the U.S. and abroad, which we began to see toward the end of the year. For example, over the last five weeks of 2008 (November 24th to December 31st), the Index rallied 10.72%. As global markets began to digest the massive fiscal and monetary policy efforts, various classes of bond spreads to government bonds declined. Equity market volatility dropped below its November peak, providing further stability to the equity markets. While the economic news may continue to deteriorate into 2009, we believe equity markets may steady. Stocks typically move earlier, quicker, and sharper, than business and economic fundamentals. Given the uncertain economic conditions, we believe investors may gravitate toward growth stocks and their stable cash flow generation. Additionally, in our view, growth companies’ relatively healthy cash balances will also help reduce their vulnerability to tight credit conditions. Given our bottom-up investment process of building a diversified portfolio comprised of high-quality growth stocks, we believe the portfolio is well positioned in the current economic environment.
* | Minimum Investment |
** | Commenced operations on December 27, 2005. |
In accordance with SEC regulations, Portfolio’s performance shown assumes that all recurring fees (including management fees) were deducted and all dividends and distributions were reinvested. The performance of Class P shares will vary from the Class I shares based upon their different inception dates and will be negatively impacted by additional fees assessed to that class.
Performance Compared to the Morgan Stanley Capital International (MSCI) EAFE Index(1) and the Lipper International Large-Cap Growth Funds Index(2)
|
|
| Total Returns(3) |
| ||
|
|
|
| Average Annual | ||
|
| One |
| Since |
| |
|
| Year |
| Inception | (5) | |
Portfolio – Class I (4) |
| (48.70 | )% | (9.08 | )% | |
MSCI EAFE Index |
| (43.38 | ) | (7.45 | ) | |
Lipper International Large-Cap Growth Funds Index |
| (42.68 | ) | (6.47 | ) | |
|
|
|
|
|
| |
Portfolio – Class P (4) |
| (48.82 | ) | (9.30 | ) | |
MSCI EAFE Index |
| (43.38 | ) | (7.45 | ) | |
Lipper International Large-Cap Growth Funds Index |
| (42.68 | ) | (6.47 | ) | |
Performance data quoted represents past performance, which is no guarantee of future results, and current performance may be lower or higher than the figures shown. Performance assumes that all dividends and distributions, if any, were reinvested. For the most recent month-end performance figures, please visit www.morganstanley.com/msim. Investment return and principal value will fluctuate so that Portfolio shares, when redeemed, may be worth more or less than their original cost. Total returns do not reflect the deduction of taxes that a shareholder would pay on Portfolio distributions or the redemption of Portfolio shares. Performance of share classes will vary due to difference in expenses.
(1) The Morgan Stanley Capital International (MSCI) EAFE Index (Europe, Australasia, Far East) is a free float-adjusted market capitalization index that is designed to measure the international equity market performance of developed markets, excluding the US & Canada. The term “free float” represents the portion of shares outstanding that are deemed to be available for purchase in the public equity markets by investors. The MSCI EAFE Index currently consists of 21 developed market country indices. The performance of the Index is listed in U.S. dollars and assumes reinvestment of net dividends. The Index is unmanaged and its returns do
50
| 2008 Annual Report |
|
|
| December 31, 2008 |
Investment Overview (cont’d)
International Growth Equity Portfolio
not include any sales charges or fees. Such costs would lower performance. It is not possible to invest directly in an index.
(2) The Lipper International Large-Cap Growth Funds Index is an equally weighted performance index of the largest qualifying funds (based on net assets) in the Lipper International Large-Cap Growth Funds classification. The Index, which is adjusted for capital gains distributions and income dividends, is unmanaged and should not be considered an investment. There are currently 10 funds represented in this Index. As of the date of this report, the Portfolio was in the Lipper International Large-Cap Growth Funds classification.
(3) Total returns for the Portfolio reflect fees waived and expenses reimbursed, if applicable, by the Adviser. Without such waivers and reimbursements, total returns would have been lower. Fee waivers and/or expense reimbursements are voluntary and the Adviser reserves the right to commence or terminate any waiver and/or reimbursement at any time.
(4) Commenced operations on December 27, 2005
(5) For comparative purposes, average annual since inception returns listed for the Indexes refer to the inception date or initial offering of the respective share class of the Portfolio, not the inception of the Indexes.
Portfolio Composition*
|
| Percentage of |
| |
Classification |
| Total Investments |
| |
Commercial Banks |
| 10.9 | % | |
Oil, Gas & Consumable Fuels |
| 6.6 |
| |
Pharmaceuticals |
| 6.4 |
| |
Health Care Equipment & Supplies |
| 5.2 |
| |
Other** |
| 69.2 |
| |
Short-Term Investment |
|
| 1.7 |
|
Total Investments |
|
| 100.0 | % |
* | Percentages indicated are based upon total investments (excluding Securities held as collateral on Loaned Securities) as of December 31, 2008. |
** | Industries which do not appear in the above table, as well as those which represent less than 5% of total investments, if applicable, are included in the category labeled “Other”. |
51
2008 Annual Report
December 31, 2008
Portfolio of Investments
International Growth Equity Portfolio
|
|
|
| Value |
|
|
| Shares |
| (000) |
|
Common Stocks (99.1%) |
|
|
|
|
|
Australia (2.8%) |
|
|
|
|
|
BHP Billiton Ltd. |
| 24,494 |
| $ 516 |
|
CSL Ltd. |
| 26,533 |
| 626 |
|
|
|
|
| 1,142 |
|
Austria (2.6%) |
|
|
|
|
|
Erste Group Bank AG (c) |
| 18,672 |
| 438 |
|
Vienna Insurance Group (c) |
| 17,462 |
| 602 |
|
|
|
|
| 1,040 |
|
Canada (2.9%) |
|
|
|
|
|
EnCana Corp. |
| 11,925 |
| 550 |
|
Petrobank Energy & Resources Ltd. (a)(c) |
| 16,250 |
| 268 |
|
Research In Motion Ltd. (a) |
| 8,900 |
| 361 |
|
|
|
|
| 1,179 |
|
Denmark (1.4%) |
|
|
|
|
|
Vestas Wind Systems A/S (a) |
| 9,804 |
| 583 |
|
Egypt (0.8%) |
|
|
|
|
|
Orascom Construction Industries GDR |
| 6,296 |
| 321 |
|
Finland (2.7%) |
|
|
|
|
|
Fortum Oyj (c) |
| 25,788 |
| 554 |
|
Kone Oyj, Class B (c) |
| 25,717 |
| 564 |
|
|
|
|
| 1,118 |
|
France (9.6%) |
|
|
|
|
|
ArcelorMittal (c) |
| 11,456 |
| 276 |
|
AXA S.A. |
| 24,066 |
| 537 |
|
BNP Paribas |
| 9,765 |
| 412 |
|
Cie Generale d’Optique Essilor International S.A. |
| 21,480 |
| 1,008 |
|
LVMH Moet Hennessy Louis Vuitton S.A. (c) |
| 7,714 |
| 518 |
|
Total S.A. |
| 21,924 |
| 1,195 |
|
|
|
|
| 3,946 |
|
Germany (10.5%) |
|
|
|
|
|
Adidas AG |
| 13,836 |
| 532 |
|
Bayer AG (c) |
| 9,268 |
| 545 |
|
E.ON AG (c) |
| 29,507 |
| 1,193 |
|
Linde AG (c) |
| 9,482 |
| 802 |
|
SAP AG |
| 15,738 |
| 564 |
|
SGL Carbon AG (a)(c) |
| 19,406 |
| 663 |
|
|
|
|
| 4,299 |
|
Greece (2.5%) |
|
|
|
|
|
Coca-Cola Hellenic Bottling Co. S.A. |
| 39,960 |
| 583 |
|
National Bank of Greece S.A. |
| 23,863 |
| 442 |
|
|
|
|
| 1,025 |
|
Hong Kong (6.8%) |
|
|
|
|
|
Bank of East Asia Ltd. (c) |
| 198,200 |
| 418 |
|
China Resources Power Holdings Co., Ltd. (c) |
| 334,000 |
| 649 |
|
CNOOC Ltd. |
| 668,700 |
| 635 |
|
Esprit Holdings Ltd. |
| 87,100 |
| 497 |
|
Parkson Retail Group Ltd. (c) |
| 522,500 |
| 598 |
|
|
|
|
| 2,797 |
|
India (1.3%) |
|
|
|
|
|
Bharti Airtel Ltd. (a) |
| 34,494 |
| 510 |
|
Indonesia (0.3%) |
|
|
|
|
|
Bumi Resources Tbk PT |
| 1,216,000 |
| 105 |
|
Ireland (0.2%) |
|
|
|
|
|
Ryanair Holdings plc ADR (a) |
| 2,900 |
| 84 |
|
Israel (2.3%) |
|
|
|
|
|
Teva Pharmaceutical Industries Ltd. ADR (c) |
| 22,152 |
| 943 |
|
Japan (15.8%) |
|
|
|
|
|
Canon, Inc. |
| 21,000 |
| 659 |
|
FamilyMart Co., Ltd. |
| 17,200 |
| 747 |
|
Fast Retailing Co., Ltd. |
| 6,300 |
| 918 |
|
Komatsu Ltd. |
| 40,300 |
| 511 |
|
Mitsubishi Estate Co., Ltd. |
| 36,000 |
| 594 |
|
Nikon Corp. |
| 28,000 |
| 335 |
|
Nippon Electric Glass Co., Ltd. |
| 56,000 |
| 294 |
|
Rakuten, Inc. (a)(c) |
| 807 |
| 514 |
|
Shin-Etsu Chemical Co., Ltd. |
| 13,000 |
| 596 |
|
Shionogi & Co., Ltd. |
| 8,000 |
| 206 |
|
Stanley Electric Co., Ltd. (c) |
| 44,700 |
| 472 |
|
Terumo Corp. |
| 13,500 |
| 632 |
|
|
|
|
| 6,478 |
|
Luxembourg (1.1%) |
|
|
|
|
|
Millicom International Cellular S.A. |
| 10,331 |
| 464 |
|
Mexico (1.3%) |
|
|
|
|
|
America Movil S.A.B. de C.V., Class L ADR |
| 17,503 |
| 542 |
|
Netherlands (1.8%) |
|
|
|
|
|
Reed Elsevier N.V. |
| 63,487 |
| 748 |
|
Norway (0.7%) |
|
|
|
|
|
Storebrand ASA |
| 121,108 |
| 299 |
|
Portugal (2.6%) |
|
|
|
|
|
Banco Espirito Santo S.A. (Registered) |
| 68,641 |
| 645 |
|
Jeronimo Martins SGPS S.A. |
| 76,179 |
| 423 |
|
|
|
|
| 1,068 |
|
Singapore (2.1%) |
|
|
|
|
|
DBS Group Holdings Ltd. |
| 81,000 |
| 480 |
|
Keppel Corp. Ltd. |
| 123,000 |
| 373 |
|
|
|
|
| 853 |
|
Spain (1.4%) |
|
|
|
|
|
Banco Santander S.A. |
| 57,038 |
| 551 |
|
Sweden (1.2%) |
|
|
|
|
|
Tele2 AB, Class B |
| 55,927 |
| 497 |
|
Switzerland (10.1%) |
|
|
|
|
|
ABB Ltd. (Registered) (a)(c) |
| 36,123 |
| 545 |
|
EFG International AG |
| 25,203 |
| 451 |
|
Nestle S.A. (Registered) |
| 32,845 |
| 1,294 |
|
Roche Holding AG (Genusschein) |
| 6,283 |
| 967 |
|
SGS S.A. (Registered) (c) |
| 846 |
| 886 |
|
|
|
|
| 4,143 |
|
Taiwan (1.4%) |
|
|
|
|
|
Delta Electronics, Inc. |
| 299,420 |
| 583 |
|
52 | The accompanying notes are an integral part of the financial statements. |
|
| 2008 Annual Report |
|
|
| December 31, 2008 |
Portfolio of Investments (cont’d)
International Growth Equity Portfolio
|
|
|
| Value |
| |
|
| Shares |
| (000) |
| |
United Kingdom (12.9%) |
|
|
|
|
| |
G4S plc |
| 214,115 |
| $ 635 |
| |
HSBC Holdings plc |
| 60,504 |
| 579 |
| |
Man Group plc |
| 77,694 |
| 268 |
| |
Prudential plc |
| 90,955 |
| 554 |
| |
Reckitt Benckiser Group plc |
| 26,185 |
| 976 |
| |
SABMiller plc |
| 29,066 |
| 489 |
| |
Smith & Nephew plc |
| 78,535 |
| 498 |
| |
Standard Chartered plc |
| 32,826 |
| 420 |
| |
Tesco plc |
| 169,273 |
| 882 |
| |
|
|
|
| 5,301 |
| |
Total Common Stocks (Cost $71,414) |
|
|
| 40,619 |
| |
|
|
|
|
|
| |
|
| No. of |
|
|
| |
|
| Rights |
|
|
| |
Rights (0.2%) |
|
|
|
|
| |
Singapore (0.2%) |
|
|
|
|
| |
DBS Group Holdings Ltd., expires 1/20/09 |
|
|
|
|
| |
(Cost $—) (a) |
| 40,500 |
| 88 |
| |
|
|
|
|
|
| |
|
| Shares |
|
|
| |
Short-Term Investments (23.3%) |
|
|
|
|
| |
Securities held as Collateral on Loaned Securities (21.6%) |
|
|
|
|
| |
Investment Company (17.3%) |
|
|
|
|
| |
Morgan Stanley Institutional Liquidity Money Market Portfolio — Institutional Class (o) |
| 7,098,005 |
| 7,098 |
| |
|
|
|
|
|
| |
|
| Face |
|
|
| |
|
| Amount |
|
|
| |
|
| (000) |
|
|
| |
Repurchase Agreement (4.3%) |
|
|
|
|
| |
Goldman Sachs & Co., 0.06%, dated 12/31/08, due 1/2/09, repurchase price $1,743; fully collateralized by U.S. government agency securities at the date of this Portfolio of Investments as follows: Federal Home Loan Mortgage Corp., Gold Pools: rates ranging from 4.50% to 6.00%, due 11/1/19 - 12/1/38; Federal National Mortgage Association, Fixed Rate Mortgages: rates ranging from 4.00% - 7.00%, due 9/1/18 - 1/1/39; Government National Mortgage Association, Fixed Rate Mortgages: rates ranging from 4.50% to 11.50%, due 6/15/16 - 12/20/38, valued at $1,779. |
| $ | 1,743 |
| 1,743 |
|
|
|
|
| 8,841 |
| |
|
|
|
|
|
| |
|
| Shares |
|
|
| |
Investment Company (1.7%) |
|
|
|
|
| |
Morgan Stanley Institutional Liquidity Money Market Portfolio — Institutional Class (o) |
| 711,559 |
| 712 |
| |
Total Short-Term Investments (Cost $9,553) |
|
|
| 9,553 |
| |
Total Investments (122.6%) (Cost $80,967) — including $8,480 of Securities Loaned (v) |
|
|
| 50,260 |
| |
Liabilities in Excess of Other Assets (-22.6%) |
|
|
| (9,267 | ) | |
Net Assets (100%) |
|
|
| $40,993 |
| |
(a) | Non-income producing security. |
(c) | All or a portion of security on loan at December 31, 2008. |
(o) | See Note G to the financial statements regarding investment in Morgan Stanley Institutional Liquidity Money Market Portfolio — Institutional Class. |
(v) | The approximate market value and percentage of total investments, $37,086,000 and 73.7%, respectively, represent the securities that have been fair valued under the fair valuation policy for international investments as disclosed in Note A within the Notes to Financial Statements. |
ADR | American Depositary Receipt |
GDR | Global Depositary Receipt |
| The accompanying notes are an integral part of the financial statements. | 53 |
2008 Annual Report
December 31, 2008
Investment Overview (unaudited)
International Real Estate Portfolio
The International Real Estate Portfolio (the “Portfolio”) seeks to provide current income and long-term capital appreciation by investing primarily in equity securities of companies in the real estate industry located throughout the world (excluding the United States and Canada). Foreign investing involves certain risks, including currency fluctuations and controls, restrictions on foreign investments, less governmental supervision and regulation, less liquidity and the potential for market volatility and political instability. The risks of investing in emerging-market countries are greater than the risks generally associated with foreign investments. In addition to the risks associated with ownership of real estate and the real estate industry in general include, fluctuations in the value of underlying property, defaults by borrowers or tenants, market saturation, decreases in market rents, interest rates, property taxes, increases in operating expenses and political or regulatory occurrences adversely affecting real estate.
Performance
For the year ended December 31, 2008, the Portfolio had a total return based on net asset value and reinvestment of distributions per share of -49.95% for the Class I shares, net of fees. The Portfolio’s Class I shares outperformed against the FTSE EPRA/NAREIT Global ex-North America Real Estate Index (80% Europe/20% Asia) which returned -51.38%, the FTSE EPRA/NAREIT Global Real Estate Index: Europe Series which returned -51.46%, the FTSE EPRA/NAREIT Global Real Estate Index: Asia Series which returned -52.51% and underperformed against the MSCI EAFE Index which returned -43.38%.
Factors Affecting Performance
· The Portfolio outperformed the benchmark, the FTSE EPRA/NAREIT Global ex-North America Real Estate Index (80% Europe/20% Asia) (the “Index”), for the period. The Portfolio’s Asian portfolio contributed to performance, while the European portfolio detracted from returns. With regard to global allocation between the regions, the Portfolio’s overweight to Asia and underweight to Europe both contributed to performance.
· In Asia, the Portfolio benefited from stock selection within and an underweight to Australia, an overweight to Japan and stock selection in Hong Kong; this was modestly offset by stock selection in Japan.
· In Europe, the Portfolio benefited from stock selection within and an underweight to Austria and stock selection in France and Sweden. This was offset by stock selection within and an overweight to the U.K. as well as underweights to Belgium and Switzerland.
Management Strategies
· The Portfolio is comprised of two regional portfolios with a global allocation which weights each major region (Europe and Asia) based on our view of its relative attractiveness in terms of underlying real estate fundamentals and public market valuations. Moreover, each regional portfolio reflects our core investment philosophy as a real estate value investor, which results in the ownership of stocks that we believe provide the best valuation relative to their underlying real estate values, while maintaining portfolio diversification. Our company specific research leads us to specific preferences for sub-segments within each country. At the end of the period, the Portfolio was overweight the Asian listed property sector and underweight the European listed property sector.
· We believe the Asian listed property sector will continue to exhibit stable underlying property fundamentals and asset values. The Portfolio’s overweight to the Asian region was predominated by real estate operating companies (REOCs) in Hong Kong and Japan, which continue to trade at very large discounts to NAV. Despite only modest weakening in underlying fundamentals and favorable supply dynamics in the Hong Kong and Japanese real estate markets, the Hong Kong and Japanese REOCs experienced significant share price declines in the year. We continue to prefer the Asian REOCs, as we believe these companies continue to offer better value relative to the REITs and possess the ability to engage in value-added opportunities such as the development of new assets and redevelopment of existing assets, as opposed to the Asian REITs which are externally managed vehicles and limited to property ownership.
· The Portfolio was considerably underweight the Australian LPT sector, which ended the period trading at a discount to NAVs which still do not yet fully reflect prospective asset value declines.
· In Europe, stocks on the Continent posted large declines and ended the year trading at a discount to reported NAVs, which only reflect modest capital value declines since the start of the credit crisis. Property stocks in the U.K. also experienced significant declines, and the stocks continue to trade at discounted valuations that appear too wide, especially since NAVs already reflect a sharp correction in asset values.
54
| 2008 Annual Report |
|
|
| December 31, 2008 |
Investment Overview (cont’d)
International Real Estate Portfolio
· Within Europe, the Portfolio continues to be underweight the Continent and overweight the U.K., as we believe the U.K. property market continues to offer better relative value.
· In contrast to the stable outlook for underlying property fundamentals in Asia-ex-Australia, in Europe and Australia, there are expectations for weakening underlying property fundamentals and asset values. However, there is considerable debate with regard to the magnitude of asset value declines since there continues to be limited transactional evidence due to the lack of liquidity for direct real estate assets which has resulted in a wide bid-ask spread between buyers and sellers. In some sub-segments of these markets, we believe current share price valuations already more than reflect any prospective weakening in underlying fundamentals and asset values.

* Minimum Investment
In accordance with SEC regulations, Portfolio’s performance shown assumes that all recurring fees (including management fees) were deducted and all dividends and distributions were reinvested. The performance of Class P shares will vary from the Class I shares based upon their different inception dates and will be negatively impacted by additional fees assessed to that class.
Performance Compared to the FTSE EPRA/NAREIT Global ex-North America Real Estate Index (80% Europe/20% Asia)(1), FTSE EPRA/NAREIT Global Real Estate Index: Europe Series(2), the FTSE EPRA/NAREIT Global Real Estate Index: Asia Series(3) and the Morgan Stanley Capital International (MSCI) EAFE Index(4)
|
|
| Total Returns(5) |
| ||||||
|
|
|
| Average Annual |
| |||||
|
| One |
| Five |
| Ten |
| Since | (7) | |
Portfolio – Class I (6) |
| (49.95 | )% | 1.86 | % | 7.23 | % | 6.39 | % | |
FTSE EPRA/NAREIT Global ex-North America Real Estate Index |
|
|
|
|
|
|
|
|
| |
(80% Europe/20% Asia) |
| (51.38 | ) | 1.39 |
| 6.31 |
| 5.18 |
| |
FTSE EPRA/NAREIT Global Real Estate |
|
|
|
|
|
|
|
|
| |
Index: Europe Series |
| (51.46 | ) | 0.29 |
| 5.92 |
| 5.50 |
| |
FTSE EPRA/NAREIT Global Real Estate |
|
|
|
|
|
|
|
|
| |
Index: Asia Series |
| (52.51 | ) | 4.70 |
| 6.65 |
| 1.58 |
| |
MSCI EAFE Index |
| (43.38 | ) | 1.66 |
| 0.80 |
| 1.59 |
| |
|
|
|
|
|
|
|
|
|
| |
Portfolio – Class P (6) |
| (50.05 | ) | 1.63 |
| 6.96 |
| 6.13 |
| |
FTSE EPRA/NAREIT Global ex-North America Real Estate Index |
|
|
|
|
|
|
|
|
| |
(80% Europe/20% Asia) |
| (51.38 | ) | 1.39 |
| 6.31 |
| 5.18 |
| |
FTSE EPRA/NAREIT Global Real Estate |
|
|
|
|
|
|
|
|
| |
Index: Europe Series |
| (51.46 | ) | 0.29 |
| 5.92 |
| 5.50 |
| |
FTSE EPRA/NAREIT Global Real Estate |
|
|
|
|
|
|
|
|
| |
Index: Asia Series |
| (52.51 | ) | 4.70 |
| 6.65 |
| 1.58 |
| |
MSCI EAFE Index |
| (43.38 | ) | 1.66 |
| 0.80 |
| 1.59 |
| |
Performance data quoted represents past performance, which is no guarantee of future results, and current performance may be lower or higher than the figures shown. Performance assumes that all dividends and distributions, if any, were reinvested. For the most recent month-end performance figures, please visit www.morganstanley.com/msim. Investment return and principal value will fluctuate so that Portfolio shares, when redeemed, may be worth more or less than their original cost. Total returns do not reflect the deduction of taxes that a shareholder would pay on Portfolio distributions or the redemption of Portfolio shares. Performance of share classes will vary due to difference in expenses.
(1) The FTSE EPRA/NAREIT Global ex-North America Real Estate Index (80% Europe 20% Asia) — Net Total Return to U.S. investors is a customized benchmark, 80% of which consists of the performance of the FTSE EPRA/NAREIT Global Real Estate Index: Europe Series — Net Total Return to U.S. investors and 20% of which consists of the performance of the FTSE EPRA/NAREIT Global Real Estate Index: Asia Series — Net Total Return to U.S. investors. These series are components of the FTSE EPRA/NAREIT Global Real Estate Index — Net Total Return to U.S. investors, which is a market capitalization weighted index designed to reflect the stock performance of companies engaged in the North American, European and Asian real estate markets. The performance of the Index is listed in U.S. dollars and assumes reinvestment of dividends. “Net Total Return to U.S. investors” reflects a reduction in total returns after taking into account the withholding tax on dividends by certain foreign countries represented in the Index for periods after 1/31/05 (gross returns used prior to 1/31/05). The Index is unmanaged and its returns do not include any sales charges or fees. Such costs would lower performance. It is not possible to invest directly in an index.
(2) The FTSE EPRA/NAREIT Global Real Estate Index: Europe Series — Net Total Return to US investors is the European component of the FTSE EPRA/NAREIT Global Real
55
2008 Annual Report
December 31, 2008
Investment Overview (cont’d)
International Real Estate Portfolio
Estate Index — Net Total Return to U.S. investors, which is a market capitalization weighted index designed to reflect the stock performance of companies engaged in the North American, European and Asian real estate markets. The performance of the Index is listed in U.S. dollars and assumes reinvestment of dividends. “Net Total Return to U.S. investors” reflects a reduction in total returns after taking into account the witholding tax on dividends by certain foreign countries represented in the Index for periods after 1/31/05 (gross returns used prior to 1/31/05). The Index is unmanaged and its returns do not include any sales charges or fees. Such costs would lower performance. It is not possible to invest directly in an index.
(3) The FTSE EPRA/NAREIT Global Real Estate Index: Asia Series — Net Total Return to US investors is the Asian component of the FTSE EPRA/NAREIT Global Real Estate Index — Net Total Return to U.S. investors, which is a market capitalization weighted index designed to reflect the stock performance of companies engaged in the North American, European and Asian real estate markets. The performance of the Index is listed in U.S. dollars and assumes reinvestment of dividends. “Net Total Return to U.S. investors” reflects a reduction in total returns after taking into account the witholding tax on dividends by certain foreign countries represented in the Index for periods after 1/31/05 (gross returns used prior to 1/31/05). The Index is unmanaged and its returns do not include any sales charges or fees. Such costs would lower performance. It is not possible to invest directly in an index.
(4) The Morgan Stanley Capital International (MSCI) EAFE Index (Europe, Australasia, Far East) is a free float-adjusted market capitalization index that is designed to measure the international equity market performance of developed markets, excluding the U.S. & Canada. The term “free float” represents the portion of shares outstanding that are deemed to be available for purchase in the public equity markets by investors. The MSCI EAFE Index currently consists of 21 developed market country indices. The performance of the Index is listed in U.S. dollars and assumes reinvestment of net dividends. The Index is unmanaged and its returns do not include any sales charges or fees. Such costs would lower performance. It is not possible to invest directly in an index.
(5) Total returns for the Portfolio reflect fees waived and expenses reimbursed, if applicable, by the Adviser. Without such waivers and reimbursements, total returns would have been lower. Fee waivers and/or expense reimbursements are voluntary and the Adviser reserves the right to commence or terminate any waiver and/or reimbursement at any time.
(6) Commenced operations on October 1, 1997
(7) For comparative purposes, average annual since inception returns listed for the Indexes refer to the inception date or initial offering of the respective share class of the Portfolio, not the inception of the Index.
Portfolio Composition*
|
| Percentage of |
| |
Classification |
| Total Investments |
| |
Diversified |
| 54.4 | % | |
Office |
| 16.0 |
| |
Retail |
| 16.0 |
| |
Residential |
| 5.0 |
| |
Other** |
| 7.4 |
| |
Short-Term Investment |
|
| 1.2 |
|
Total Investments |
|
| 100.0 | % |
* | Percentages indicated are based upon total investments (excluding Securities held as collateral on Loaned Securities) as of December 31, 2008. |
** | Industries which do not appear in the above table, as well as those which represent less than 5% of total investments, if applicable, are included in the category labeled “Other”. |
56
| 2008 Annual Report |
|
|
| December 31, 2008 |
Portfolio of Investments
International Real Estate Portfolio
|
|
|
| Value |
|
|
| Shares |
| (000) |
|
Common Stocks (98.4%) |
|
|
|
|
|
Australia (3.7%) |
|
|
|
|
|
CFS Retail Property Trust REIT (c) |
| 611,410 |
| $ 802 |
|
GPT Group REIT |
| 85,506 |
| 155 |
|
Stockland REIT (c) |
| 564,939 |
| 1,635 |
|
Westfield Group REIT |
| 1,499,658 |
| 13,817 |
|
|
|
|
| 16,309 |
|
Austria (1.0%) |
|
|
|
|
|
CA Immobilien Anlagen AG (a)(c) |
| 278,157 |
| 1,659 |
|
Conwert Immobilien Invest SE (a)(c) |
| 624,347 |
| 2,803 |
|
|
|
|
| 4,462 |
|
Finland (1.1%) |
|
|
|
|
|
Citycon Oyj (c) |
| 567,107 |
| 1,330 |
|
Sponda Oyj |
| 801,232 |
| 3,509 |
|
|
|
|
| 4,839 |
|
France (21.9%) |
|
|
|
|
|
Fonciere Des Regions REIT (c) |
| 53,788 |
| 3,683 |
|
Gecina S.A. REIT (c) |
| 85,177 |
| 5,915 |
|
ICADE REIT |
| 111,924 |
| 9,316 |
|
Klepierre REIT (c) |
| 295,597 |
| 7,245 |
|
Silic REIT (c) |
| 80,828 |
| 7,515 |
|
Unibail-Rodamco REIT |
| 414,887 |
| 61,794 |
|
|
|
|
| 95,468 |
|
Germany (1.1%) |
|
|
|
|
|
Alstria Office AG REIT |
| 658,471 |
| 4,596 |
|
Hong Kong (13.2%) |
|
|
|
|
|
China Overseas Land & Investment Ltd. (c) |
| 2,831,000 |
| 3,980 |
|
China Resources Land Ltd. (c) |
| 2,751,000 |
| 3,406 |
|
Guangzhou R&F Properties Co., Ltd., |
|
|
|
|
|
Class H (c) |
| 6,921,200 |
| 7,737 |
|
Hang Lung Properties Ltd. (c) |
| 1,221,000 |
| 2,678 |
|
Henderson Land Development Co., Ltd. |
| 847,000 |
| 3,164 |
|
Hongkong Land Holdings Ltd. (c) |
| 3,580,000 |
| 8,969 |
|
Hysan Development Co., Ltd. |
| 1,569,185 |
| 2,548 |
|
Kerry Properties Ltd. (c) |
| 2,758,271 |
| 7,424 |
|
Sun Hung Kai Properties Ltd. |
| 2,081,000 |
| 17,498 |
|
Swire Pacific Ltd., Class A (c) |
| 53,000 |
| 368 |
|
|
|
|
| 57,772 |
|
Italy (1.3%) |
|
|
|
|
|
Beni Stabili S.p.A. (c) |
| 6,771,199 |
| 4,730 |
|
Risanamento S.p.A. (a)(c) |
| 1,841,837 |
| 1,121 |
|
|
|
|
| 5,851 |
|
Japan (11.7%) |
|
|
|
|
|
Japan Real Estate Investment Corp. REIT |
| 195 |
| 1,753 |
|
Mitsubishi Estate Co., Ltd. |
| 1,037,000 |
| 17,101 |
|
Mitsui Fudosan Co., Ltd. |
| 934,000 |
| 15,521 |
|
Nippon Building Fund, Inc. REIT (c) |
| 322 |
| 3,534 |
|
NTT Urban Development Corp. |
| 3,122 |
| 3,368 |
|
Sumitomo Realty & Development Co., Ltd. (c) |
| 658,000 |
| 9,804 |
|
|
|
|
| 51,081 |
|
Netherlands (7.4%) |
|
|
|
|
|
Corio N.V. REIT |
| 286,518 |
| 13,137 |
|
Eurocommercial Properties N.V. CVA REIT |
| 122,297 |
| 4,112 |
|
ProLogis European Properties |
| 729,008 |
| 3,267 |
|
Vastned Retail N.V. REIT |
| 75,384 |
| 3,779 |
|
Wereldhave N.V. REIT (c) |
| 90,006 |
| 7,950 |
|
|
|
|
| 32,245 |
|
Singapore (1.7%) |
|
|
|
|
|
CapitaLand Ltd. |
| 643,000 |
| 1,413 |
|
Macquarie Prime REIT |
| 3,561,000 |
| 1,288 |
|
United Industrial Corp., Ltd. |
| 4,928,000 |
| 3,603 |
|
Wheelock Properties Singapore Ltd. |
| 1,237,000 |
| 897 |
|
|
|
|
| 7,201 |
|
Sweden (3.1%) |
|
|
|
|
|
Castellum AB (c) |
| 453,002 |
| 3,522 |
|
Hufvudstaden AB, Class A (c) |
| 1,447,974 |
| 10,194 |
|
|
|
|
| 13,716 |
|
Switzerland (2.2%) |
|
|
|
|
|
PSP Swiss Property AG (Registered) (a) |
| 190,068 |
| 9,476 |
|
United Kingdom (29.0%) |
|
|
|
|
|
Big Yellow Group plc REIT |
| 1,662,488 |
| 5,754 |
|
British Land Co. plc REIT |
| 2,929,436 |
| 23,482 |
|
Brixton plc REIT |
| 2,951,864 |
| 5,661 |
|
Capital & Regional plc |
| 1,887,697 |
| 1,282 |
|
Derwent London plc REIT |
| 749,014 |
| 7,869 |
|
Grainger plc |
| 1,503,898 |
| 2,962 |
|
Great Portland Estates plc REIT |
| 1,027,537 |
| 3,860 |
|
Hammerson plc REIT |
| 1,785,712 |
| 13,833 |
|
Invista Foundation Property Trust Ltd. REIT |
| 778,960 |
| 192 |
|
Land Securities Group plc REIT |
| 2,416,167 |
| 32,204 |
|
Liberty International plc REIT |
| 1,318,814 |
| 9,139 |
|
Minerva plc (a) |
| 3,795,400 |
| 740 |
|
Quintain Estates & Development plc |
| 2,563,343 |
| 1,368 |
|
Safestore Holdings plc |
| 2,859,115 |
| 2,272 |
|
Segro plc REIT |
| 3,299,460 |
| 11,803 |
|
Shaftesbury plc REIT |
| 162,424 |
| 848 |
|
Unite Group plc |
| 1,386,449 |
| 2,943 |
|
Workspace Group plc REIT |
| 332,010 |
| 296 |
|
|
|
|
| 126,508 |
|
Total Common Stocks (Cost $1,016,304) |
|
|
| 429,524 |
|
|
|
|
|
|
|
|
| No. of |
|
|
|
|
| Rights |
|
|
|
Rights (0.0%) |
|
|
|
|
|
Hong Kong (0.0%) |
|
|
|
|
|
China Overseas Land & Investment Ltd., expires 1/21/09 (Cost $—) (a) |
| 113,240 |
| 42 |
|
| The accompanying notes are an integral part of the financial statements. | 57 |
2008 Annual Report
December 31, 2008
Portfolio of Investments (cont’d)
International Real Estate Portfolio
|
|
|
| Value |
| |
|
| Shares |
| (000) |
| |
Short-Term Investments (12.4%) |
|
|
|
|
| |
Securities held as Collateral on Loaned Securities (11.2%) |
|
|
|
|
| |
Investment Company (9.0%) |
|
|
|
|
| |
Morgan Stanley Institutional Liquidity Money Market Portfolio — Institutional Class (o) |
| 39,134,663 |
| $ 39,135 |
| |
|
|
|
|
|
| |
|
| Face |
|
|
| |
|
| Amount |
|
|
| |
|
| (000) |
|
|
| |
Repurchase Agreement (2.2%) |
|
|
|
|
| |
Goldman Sachs & Co., 0.06%, dated 12/31/08, due 1/2/09, repurchase price $9,614; fully collateralized by U.S. government agency securities at the date of this Portfolio of Investments as follows: Federal Home Loan Mortgage Corp., Gold Pools: rates ranging from 4.50% to 6.00%, due 11/1/19 - 12/1/38; Federal National Mortgage Association, Fixed Rate Mortgages: rates ranging from 4.00% - 7.00%, due 9/1/18 - 1/1/39; Government National Mortgage Association, Fixed Rate Mortgages: rates ranging from 4.50% to 11.50%, due 11/15/16 - 12/15/38, valued at $9,806. |
| $ | 9,614 |
| 9,614 |
|
|
|
|
| 48,749 |
| |
|
|
|
|
|
| |
|
| Shares |
|
|
| |
Investment Company (1.2%) |
|
|
|
|
| |
Morgan Stanley Institutional Liquidity Money Market Portfolio — Institutional Class (o) |
| 5,282,570 |
| 5,283 |
| |
Total Short-Term Investments (Cost $54,032) |
|
|
| 54,032 |
| |
Total Investments (110.8%) (Cost $1,070,336) — including $46,081 of Securities Loaned (v) |
|
|
| 483,598 |
| |
Liabilities in Excess of Other Assets (-10.8%) |
|
|
| (47,308 | ) | |
Net Assets (100%) |
|
|
| $436,290 |
| |
(a) | Non-income producing security. |
(c) | All or a portion of security on loan at December 31, 2008. |
(o) | See Note G to the financial statements regarding investment in Morgan Stanley Institutional Liquidity Money Market Portfolio — Institutional Class. |
(v) | The approximate market value and percentage of total investments, $429,524,000 and 88.8%, respectively, represent the securities that have been fair valued under the fair valuation policy for international investments as disclosed in Note A within the Notes to Financial Statements. |
@ | Value is less than $500. |
CVA | Certificaten Van Aandelen |
REIT | Real Estate Investment Trust |
Foreign Currency Exchange Contract Information:
The Portfolio had the following foreign currency exchange contract(s) open at period end:
Currency |
| Value |
| Settlement |
| In |
| Value |
| Net |
| ||||||||
EUR | 444 |
|
| $617 |
|
| 1/2/09 |
| USD | 621 |
|
| $621 |
|
|
| $4 |
|
|
SGD | 76 |
|
| 53 |
|
| 1/5/09 |
| USD | 53 |
|
| 53 |
|
|
| — | @ |
|
SGD | 28 |
|
| 20 |
|
| 1/5/09 |
| USD | 20 |
|
| 20 |
|
|
| — | @ |
|
USD | 86 |
|
| 86 |
|
| 1/5/09 |
| AUD | 124 |
|
| 87 |
|
|
| 1 |
|
|
|
|
|
| $776 |
|
|
|
|
|
|
|
| $781 |
|
|
| $5 |
|
|
AUD | — | Australian Dollar |
EUR | — | Euro |
SGD | — | Singapore Dollar |
USD | — | United States Dollar |
58 | The accompanying notes are an integral part of the financial statements. |
|
| 2008 Annual Report |
|
|
| December 31, 2008 |
Investment Overview (unaudited)
International Small Cap Portfolio
The International Small Cap Portfolio (the “Portfolio”) seeks long-term capital appreciation by investing primarily in equity securities of small non-U.S. companies. Investments in small sized corporations are more vulnerable to financial risks and other risks than larger corporations and may involve a higher degree of price volatility than investments in the general equity markets. Foreign investing involves certain risks, including currency fluctuations and controls, restrictions on foreign investments, less governmental supervision and regulation, less liquidity and the potential for market volatility and political instability. The risks of investing in emerging-market countries are greater than the risks generally associated with foreign investments.
Performance
For the year ended December 31, 2008, the Portfolio had a total return based on net asset value and reinvestment of distributions per share of -38.33%, net of fees, for the Class I shares. The Portfolio’s Class I shares outperformed against its benchmark, the Morgan Stanley Capital International (MSCI) EAFE Small Cap Total Return Index (the “Index”) which returned -47.01%.
Factors Affecting Performance
· In the final month of 2008, stocks posted a modest gain but the scale of the full-year correction will go down in history. For the first six months of the year, equity markets were modestly weaker but were supported by the energy and materials sectors that were anointed the “new defensives”. Since then, however, the financial system crisis in September and October, and the significant and rapid deterioration in the global economy left the equity market in tatters. For the full year, the MSCI EAFE Index returned -43.4%, the MSCI EAFE Small Cap Index (“the Index”) ended down 47.0%, the S&P 500® Index fell 37.0% and the Russell 2000® Index declined 33.8%.
· In the Index, cyclical sectors (materials, consumer discretionary, industrials, financials and information technology) were sharply downgraded on the back of fear over a slowdown in China, a collapse in non-residential construction, contracting global capital expenditure and a retrenchment of the consumer. Energy stocks, which had risen in lock step with the oil price, reversed direction on the dramatic decline in oil and the sector lost 59.0% for the year, to become the worst performing sector. Health care and consumer staples showed relatively greater resilience in the second half of the year with returns of -32.3% and -36.9% for the full year.
Management Strategies
· Relative performance for the year was driven by positive stock selection in seven out of the 10 sectors in the Index and an overweight to defensives, primarily consumer staples and health care. The primary sectors that added value from stock selection were utilities, materials, and consumer discretionary.
· In particular, the overweight to consumer staples was a major contributor to performance but stock selection offset the relative gain of the allocation. The Portfolio benefited from strong outperformance from a number of its holdings but the sector’s performance was dominated by the volatile performance of one stock in particular (whose performance rebounded in December).
· The Portfolio’s overweight to health care was also a positive contributor but stock selection, primarily in the last quarter of 2008, was a detractor. Poor performance from a German supplier to the biotech industry, which had disappointing third quarter results as its customers are reducing their inventories for production equipment, was the most significant detractor. Stock selection in pharmaceuticals was mixed. Several companies including a French pharmaceutical company involved in oncology and endocrinology and a Norwegian pharmaceutical firm with a leading omega-3 drug reported strong sales and new drugs in their pipelines.
· On a country basis, the Portfolio’s stock selection and overweight to Japan was a positive contributor to relative performance as the market benefitted from the strengthening yen.
· Finally, an average allocation of 3% to cash also contributed positively to performance.
· The macro news at the close of 2008 and going into 2009 remains grim as the global recession takes hold. Governments continue to attempt to moderate the downturn with various bailout packages of historic size. We remain concerned that the current credit environment will persist for some time. As a result we will continue to focus on companies that have negligible debt requirements and the ability to finance their capital needs internally. The Portfolio remains defensively positioned with a substantial overweight to consumer staples and health care, and a broadly based underweight to cyclicals.
59
2008 Annual Report |
|
|
|
December 31, 2008 |
|
Investment Overview (cont’d)
International Small Cap Portfolio
· Despite its strong relative outperformance last year, we are finding some extraordinary value in Japan. The bear market for Japanese small caps started in 2006 and we believe that the market now offers some compelling value in quality cyclicals as many have seen extreme falls. Importantly, we believe Japan has entered the downturn in considerably better shape than much of the world and does not have the same credit excesses to work through. We have started to take profits on some of the Portfolio’s holdings in Japanese defensives following their strong bounce, and are slowly building positions in some more cyclical names.
· In contrast, recognition of the scale of the downturn in Europe only really started to take hold in the fourth quarter last year. Analysts have not yet fully reflected this outlook in their earnings estimates and we expect further downgrades. Moreover, in 2008, European defensives sold off sharply, in line with the more cyclical names. As a result some already attractively valued defensives have become extremely cheap. We believe they continue to offer more attractive value than most European cyclicals.
· Asia ex-Japan is now offering better value as the region has declined nearly 64% from its 2007 highs but we do remain cautious as the region is highly dependent on cyclical companies. Valuations are not yet as striking as those on offer in Japan.
· Whilst we anticipate a deep and prolonged downturn, we feel there are some extraordinary valuations now on offer in some very high quality companies. The equity markets are likely to remain volatile and we will need to be nimble but we have great confidence that our total focus on fundamental analysis and valuation will stand us in good stead in the coming months.
* Minimum Investment
+ The Lipper International Small/Mid-Cap Core Funds Index commenced operations on March 31, 2002. Performance data prior to December 31, 2002 is from the Lipper International Small/Mid-Cap Core Funds Average.
In accordance with SEC regulations, Portfolio performance shown assumes that all recurring fees (including management fees) were deducted and all dividends and distributions were reinvested. The performance of Class P shares will vary from the Class I shares based upon their different inception dates and will be negatively impacted by additional fees assessed to that class.
Performance Compared to the Morgan Stanley Capital International (MSCI) EAFE Small Cap Total Return Index(1) and the Lipper International Small/Mid-Cap Core Funds Index(2)
|
| Total Returns(3) |
| ||||||||||
|
|
|
| Average Annual | |||||||||
|
| One |
|
| Five |
|
| Ten |
|
| Since | (6) |
|
Portfolio – Class I (4) |
| (38.33 | )% |
| 1.51 | % |
| 7.03 | % |
| 8.65 | % |
|
MSCI EAFE Small Cap Total Return Index |
| (47.01 | ) |
| 1.14 |
|
| 3.72 |
|
| 3.22 |
|
|
Lipper International Small/Mid-Cap Core Funds Index |
| (43.23 | ) |
| 2.79 |
|
| 7.18 |
|
| — |
|
|
|
|
|
|
|
|
|
|
|
|
|
|
|
|
Portfolio – Class P (5) |
| — |
|
| — |
|
| — |
|
| 1.56 |
|
|
MSCI EAFE Small Cap Total Return Index |
| — |
|
| — |
|
| — |
|
| (4.31 | ) |
|
Lipper International Small/Mid-Cap Core Funds Index |
| — |
|
| — |
|
| — |
|
| (1.02 | ) |
|
Performance data quoted represents past performance, which is no guarantee of future results, and current performance may be lower or higher than the figures shown. Performance assumes that all dividends and distributions, if any, were reinvested. For the most recent month-end performance figures, please visit www.morganstanley.com/msim. Investment return and principal value will fluctuate so that Portfolio shares, when redeemed, may be worth more or less than their original cost. Total returns do not reflect the deduction of taxes that a shareholder would pay on Portfolio distributions or the redemption of Portfolio shares. Performance of share classes will vary due to difference in expenses.
60
| 2008 Annual Report |
|
|
| December 31, 2008 |
Investment Overview (cont’d)
International Small Cap Portfolio
(1) | The Morgan Stanley Capital International (MSCI) EAFE Small Cap Total Return Index is an unmanaged, market value weighted average of the performance of over 900 securities of companies listed on the stock exchanges of countries in Europe, Australasia and the Far East, including price performance and income from dividend payments. The MSCI EAFE Small Cap Total Return Index commenced as of January 31, 2002. Returns, including periods prior to January 31, 2002, are calculated using the return data of the MSCI EAFE Small Cap Index through January 30, 2002 and the return data of the MSCI EAFE Small Cap Total Return Index since January 31, 2002. The Index is unmanaged and its returns do not include any sales charges or fees. Such costs would lower performance. It is not possible to invest directly in an index. |
(2) | The Lipper International Small/Mid-Cap Core Funds Index is an equally weighted performance index of the largest qualifying funds (based on net assets) in the Lipper International Small/Mid-Cap Core Funds classification. The Index, which is adjusted for capital gains distributions and income dividends, is unmanaged and should not be considered an investment. There are currently 10 funds represented in this Index. As of the date of this report, the Portfolio was in the Lipper International Small/Mid-Cap Core Funds classification. |
(3) | Total returns for the Portfolio reflect fees waived and expenses reimbursed, if applicable, by the Adviser. Without such waivers and reimbursements, total returns would have been lower. Fee waivers and/or expense reimbursements are voluntary and the Adviser reserves the right to commence or terminate any waiver and/or reimbursement at any time. |
(4) | Commenced operations on December 15, 1992 |
(5) | Commenced operations on October 21, 2008 |
(6) | For comparative purposes, average annual since inception returns listed for the Indexes refer to the inception date or initial offering of the respective share class of the Portfolio, not the inception of the Index. |
Portfolio Composition
|
| Percentage of | ||
Classification |
| Total Investments | ||
Food Products |
|
| 15.0 | % |
Beverages |
|
| 5.8 |
|
Health Care Equipment & Supplies |
|
| 5.5 |
|
Other* |
|
| 69.9 |
|
Short-Term Investment |
|
| 3.8 |
|
Total Investments |
|
| 100.0 | % |
* Industries which do not appear in the above table, as well as those which represent less than 5% of total investments, if applicable, are included in the category labeled “Other”.
61
2008 Annual Report |
|
|
|
December 31, 2008 |
|
Portfolio of Investments
International Small Cap Portfolio
|
| Shares |
| Value |
|
Common Stocks (96.5%) |
|
|
|
|
|
Australia (4.1%) |
|
|
|
|
|
Goodman Fielder Ltd. |
| 4,827,274 |
| $ 4,493 |
|
Infomedia Ltd. |
| 7,808,192 |
| 1,568 |
|
MYOB Ltd. |
| 4,953,000 |
| 3,834 |
|
Pacific Brands Ltd. |
| 3,043,137 |
| 918 |
|
Ramsay Health Care Ltd. |
| 280,484 |
| 2,061 |
|
|
|
|
| 12,874 |
|
Belgium (0.8%) |
|
|
|
|
|
Omega Pharma S.A. |
| 68,222 |
| 2,577 |
|
Denmark (3.3%) |
|
|
|
|
|
Danisco A/S |
| 122,989 |
| 5,013 |
|
Royal Unibrew A/S |
| 60,941 |
| 1,367 |
|
Topdanmark A/S (a) |
| 30,503 |
| 3,960 |
|
|
|
|
| 10,340 |
|
Finland (3.3%) |
|
|
|
|
|
Elisa Oyj |
| 368,448 |
| 6,377 |
|
HKScan Oyj |
| 325,076 |
| 2,013 |
|
Oriola-KD OYJ |
| 1,217,747 |
| 2,227 |
|
|
|
|
| 10,617 |
|
France (4.0%) |
|
|
|
|
|
Bull S.A. (a) |
| 861,076 |
| 1,385 |
|
ICADE REIT |
| 33,730 |
| 2,808 |
|
Ipsen S.A. |
| 94,405 |
| 3,686 |
|
Teleperformance |
| 175,104 |
| 4,883 |
|
|
|
|
| 12,762 |
|
Germany (3.8%) |
|
|
|
|
|
Alstria Office AG REIT |
| 156,592 |
| 1,093 |
|
K&S AG |
| 20,840 |
| 1,197 |
|
MTU Aero Engines Holding AG |
| 121,384 |
| 3,345 |
|
Sartorius AG (Non-Voting Shares) |
| 245,110 |
| 2,825 |
|
SCS Standard Computersysteme AG (a)(d)(i)(l) |
| 21,289 |
| — |
|
Symrise AG |
| 255,439 |
| 3,608 |
|
|
|
|
| 12,068 |
|
Hong Kong (0.7%) |
|
|
|
|
|
Solomon Systech International Ltd. |
| 38,775,900 |
| 898 |
|
Yip’s Chemical Holdings Ltd. |
| 4,628,000 |
| 1,248 |
|
|
|
|
| 2,146 |
|
Ireland (5.1%) |
|
|
|
|
|
DCC plc |
| 177,149 |
| 2,578 |
|
Glanbia plc |
| 1,768,177 |
| 5,262 |
|
Kerry Group plc, Class A |
| 402,563 |
| 7,341 |
|
Smurfit Kappa Group plc |
| 365,604 |
| 925 |
|
|
|
|
| 16,106 |
|
Italy (3.8%) |
|
|
|
|
|
Davide Campari-Milano S.p.A. |
| 1,263,373 |
| 8,539 |
|
Interpump S.p.A. |
| 364,605 |
| 2,224 |
|
SAES Getters S.p.A. |
| 87,654 |
| 738 |
|
Sogefi S.p.A. |
| 304,959 |
| 532 |
|
|
|
|
| 12,033 |
|
Japan (45.1%) |
|
|
|
|
|
Ariake Japan Co., Ltd. |
| 752,700 |
| 14,176 |
|
Axell Corp. |
| 389 |
| 1,342 |
|
Daibiru Corp. |
| 246,200 |
| 2,618 |
|
Doutor Nichires Holdings Co., Ltd. |
| 600,889 |
| 13,130 |
|
Fuyo General Lease Co., Ltd. |
| 181,600 |
| 3,539 |
|
Harmonic Drive Systems Inc. |
| 326 |
| 551 |
|
Hikari Tsushin, Inc. |
| 334,119 |
| 6,422 |
|
Jaccs Co., Ltd. (a) |
| 2,144,000 |
| 4,079 |
|
Japan Pure Chemical Co. Ltd. |
| 254 |
| 570 |
|
Japan Securities Finance Co., Ltd. |
| 1,343,492 |
| 6,539 |
|
Leopalace21 Corp. |
| 162,800 |
| 1,651 |
|
Maxvalu Tokai Co., Ltd. |
| 46,000 |
| 792 |
|
Milbon Co., Ltd. |
| 168,322 |
| 4,716 |
|
Miraial Co., Ltd. |
| 193,700 |
| 1,848 |
|
Nakanishi, Inc. |
| 63,386 |
| 4,013 |
|
Nihon Micro Coating Co., Ltd. |
| 364,700 |
| 342 |
|
Nihon Trim Co., Ltd. |
| 109,300 |
| 2,689 |
|
Ohara, Inc. |
| 83,100 |
| 673 |
|
Okinawa Cellular Telephone Co. |
| 2,967 |
| 6,448 |
|
Okinawa Electric Power Co., Inc. (The) |
| 151,319 |
| 11,274 |
|
Osaki Engineering Co., Ltd. |
| 616 |
| 544 |
|
OZEKI Co., Ltd. |
| 53,800 |
| 1,542 |
|
Rengo Co., Ltd. |
| 332,000 |
| 2,715 |
|
Sawada Holdings Co., Ltd. (a) |
| 331,400 |
| 797 |
|
Shinkawa Ltd. |
| 310,000 |
| 3,675 |
|
Snow Brand Milk Products Co., Ltd. |
| 286,500 |
| 1,094 |
|
Sumitomo Osaka Cement Co., Ltd. |
| 4,810,970 |
| 12,318 |
|
Sun Frontier Fudousan Co., Ltd. |
| 8,879 |
| 3,043 |
|
TOC Co., Ltd. |
| 821,000 |
| 4,221 |
|
Toei Animation Co., Ltd. |
| 374,000 |
| 7,086 |
|
Tokyo Tomin Bank Ltd. (The) |
| 368,581 |
| 5,963 |
|
Vantec Group Holdings Corp. |
| 2,162 |
| 3,880 |
|
Yachiyo Bank Ltd. (The) |
| 2,635 |
| 8,470 |
|
|
|
|
| 142,760 |
|
Netherlands (0.8%) |
|
|
|
|
|
Advanced Metallurgical Group N.V. (a) |
| 87,713 |
| 860 |
|
Smartrac N.V. (a) |
| 107,471 |
| 1,838 |
|
|
|
|
| 2,698 |
|
New Zealand (1.7%) |
|
|
|
|
|
Fisher & Paykel Healthcare Corp., Ltd. |
| 2,239,326 |
| 4,148 |
|
Warehouse Group Ltd. (The) |
| 597,914 |
| 1,234 |
|
|
|
|
| 5,382 |
|
Norway (3.3%) |
|
|
|
|
|
Cermaq ASA |
| 462,845 |
| 1,776 |
|
Fred Olsen Energy ASA |
| 47,725 |
| 1,283 | �� |
Pronova BioPharma A/S (a) |
| 1,250,382 |
| 4,156 |
|
Schibsted ASA |
| 151,279 |
| 1,807 |
|
TGS Nopec Geophysical Co. ASA (a) |
| 281,641 |
| 1,433 |
|
|
|
|
| 10,455 |
|
Spain (0.6%) |
|
|
|
|
|
Miquel y Costas & Miquel S.A. |
| 119,548 |
| 1,929 |
|
62 | The accompanying notes are an integral part of the financial statements. |
|
| 2008 Annual Report |
|
|
| December 31, 2008 |
Portfolio of Investments (cont’d)
International Small Cap Portfolio
|
| Shares |
| Value |
|
Sweden (2.1%) |
|
|
|
|
|
Billerud AB |
| 411,279 |
| $ 1,116 |
|
Micronic Laser Systems AB (a) |
| 484,283 |
| 367 |
|
Saab AB, Class B |
| 563,750 |
| 5,152 |
|
|
|
|
| 6,635 |
|
Switzerland (4.2%) |
|
|
|
|
|
Bucher Industries AG (Registered) |
| 10,320 |
| 1,044 |
|
Coltene Holding AG |
| 95,940 |
| 3,896 |
|
Galenica AG (Registered) |
| 14,583 |
| 4,729 |
|
LEM Holding S.A. (Registered) |
| 10,581 |
| 1,315 |
|
Schindler Holding AG |
| 48,440 |
| 2,214 |
|
|
|
|
| 13,198 |
|
United Kingdom (9.8%) |
|
|
|
|
|
Ark Therapeutics Group plc (a) |
| 3,635,466 |
| 2,055 |
|
Britvic plc |
| 2,249,260 |
| 8,582 |
|
Charter International plc |
| 210,519 |
| 1,005 |
|
CVS Group plc (a) |
| 1,176,101 |
| 2,159 |
|
Filtrona plc |
| 1,208,114 |
| 2,388 |
|
Luminar Group Holdings plc |
| 1,236,573 |
| 2,408 |
|
Premier Foods plc |
| 14,753,827 |
| 6,498 |
|
Spirax-Sarco Engineering plc |
| 206,957 |
| 2,712 |
|
Wincanton plc |
| 1,240,296 |
| 3,204 |
|
|
|
|
| 31,011 |
|
Total Common Stocks (Cost $419,460) |
|
|
| 305,591 |
|
Short-Term Investment (3.8%) |
|
|
|
|
|
Investment Company (3.8%) |
|
|
|
|
|
Morgan Stanley Institutional Liquidity Money Market Portfolio — Institutional Class (Cost $12,029) (o) |
| 12,029,067 |
| 12,029 |
|
Total Investments (100.3%) (Cost $431,489) (v) |
|
|
| 317,620 |
|
Liabilities in Excess of Other Assets (-0.3%) |
|
|
| (975 | ) |
Net Assets (100%) |
|
|
| $316,645 |
|
(a) | Non-income producing security. |
(d) | At December 31, 2008, the Portfolio held less than $500 of fair valued securities, representing less than 0.05% of net assets. These securities have been fair valued as determined in good faith under procedures established by and under the general supervision of the Portfolio’s Directors. |
(i) | Restricted security valued at fair value and not registered under the Securities Act of 1933. SCS Standard Computersysteme AG was acquired 4/04 and has a current cost basis of $0. At December 31, 2008, these securities had an aggregate market value of $0 representing 0.0% of net assets. |
(l) | Security has been deemed illiquid at December 31, 2008. |
(o) | See Note G to the financial statements regarding investment in Morgan Stanley Institutional Liquidity Money Market Portfolio — Institutional Class. |
(v) | The approximate market value and percentage of total investments, $305,591,000 and 96.2%, respectively, represent the securities that have been fair valued under the fair valuation policy for international investments as disclosed in Note A within the Notes to Financial Statements. |
@ | Value is less than $500. |
REIT | Real Estate Investment Trust |
Foreign Currency Exchange Contract Information:
The Portfolio had the following foreign currency exchange contract(s) open at period end:
Currency |
| Value |
| Settlement |
| In |
| Value |
| Net |
| ||||||||
JPY | 28,328 |
|
| $313 |
|
| 1/7/09 |
| USD | 313 |
|
| $313 |
|
|
| $— | @ |
|
NOK | 2,179 |
|
| 311 |
|
| 1/2/09 |
| USD | 303 |
|
| 303 |
|
|
| (8 | ) |
|
SEK | 44 |
|
| 6 |
|
| 1/5/09 |
| USD | 6 |
|
| 6 |
|
|
| — | @ |
|
SEK | 94 |
|
| 12 |
|
| 1/2/09 |
| USD | 12 |
|
| 12 |
|
|
| — | @ |
|
SEK | 56 |
|
| 7 |
|
| 1/7/09 |
| USD | 7 |
|
| 7 |
|
|
| — | @ |
|
USD | 92 |
|
| 92 |
|
| 1/5/09 |
| JPY | 8,334 |
|
| 92 |
|
|
| — | @ |
|
USD | 32 |
|
| 32 |
|
| 1/6/09 |
| JPY | 2,948 |
|
| 32 |
|
|
| — | @ |
|
|
|
|
| $773 |
|
|
|
|
|
|
|
| $765 |
|
|
| $(8 | ) |
|
JPY | — Japanese Yen |
NOK | — Norwegian Krone |
SEK | — Swedish Krona |
USD | — United States Dollar |
| The accompanying notes are an integral part of the financial statements. | 63 |
2008 Annual Report |
|
|
|
December 31, 2008 |
|
Investment Overview (unaudited)
Capital Growth Portfolio
The Capital Growth Portfolio (the “Portfolio”) seeks long-term capital appreciation by investing primarily in growth-oriented equity securities of large capitalization companies. In general equity securities’ values also fluctuate in response to activities specific to a company. Investments in foreign markets entail special risks such as currency, political, economic, and market risks. The risks of investing in emerging-market countries are greater than the risks generally associated with foreign investments.
Performance
For the year ended December 31, 2008, the Portfolio had a total return based on net asset value and reinvestment of distributions per share of -50.47%, net of fees, for Class I shares. The Portfolio’s Class I shares underperformed against its benchmark, the Russell 1000® Growth Index (the “Index”) which returned -38.44%.
Factors Affecting Performance
· The market environment was extremely challenging in the 12-month period ended December 31, 2008. Paralysis in the credit markets and a complete reshaping of the financial industry prompted a significant loss of investor confidence. Risk aversion soared, as investors fled all segments of the stock and bond markets for the perceived safety of U.S. Treasuries and cash. Although the federal government and the Federal Reserve intervened with unprecedented policy measures, investors remained uncertain about the effectiveness of the response, particularly as the U.S. economy was officially declared in recession since December 2007. These events kept the stock market volatile through the end of the period.
· By far, stock selection in consumer discretionary had the largest negative impact on relative performance, despite the positive influence of an overweight to the sector. The main detractors within the sector were holdings in commercial services and hotel/motel stocks.
· Relative performance was also hurt by stock selection and an overweight in the financial services sector. Here, diversified financial services stocks were the primary area of weakness.
· Stock selection in technology was also a source of relative weakness, where holdings in communications technology lagged.
· In contrast, stock selection in the other energy sector was the largest positive contributor to relative performance, primarily due to natural gas producers. An overweight in the other energy sector slightly offset some of the relative gain.
· Both stock selection and an overweight in autos and transportation added relative value, driven by miscellaneous transportation (logistics) holdings.
· Finally, the Portfolio benefited from stock selection in the materials and processing sector, especially in steel companies.
Management Strategies
· In our view, market volatility is far greater than fundamental business volatility. The market is fearful, with investors making little differentiation on fundamentals and quality. It is our goal to hold a portfolio of high-quality growth stocks we believe will perform well regardless of the market environment. To that end, the investment team continues to focus on quality — evaluating the nature and sustainability of a company’s competitive advantage and balance sheet strength. We continue to favor companies that have some uniqueness or dynamic competitive advantage in their business model, with a high quality stream of cash flow and earnings growth and the ability to redeploy capital at a high rate of return.
· At the margin, we have eliminated names that are more cyclical or where we believe there are stronger long-term opportunities elsewhere. We believe the Portfolio is well positioned for when the market once again begins to differentiate on fundamentals.

* Minimum Investment
In accordance with SEC regulations, Portfolio’s performance shown assumes that all recurring fees (including management fees) were deducted and all dividends and distributions were reinvested. The performance of Class P shares will vary from the Class I shares based upon their different inception dates and will be negatively impacted by additional fees assessed to that class.
64
| 2008 Annual Report |
|
|
| December 31, 2008 |
Investment Overview (cont’d)
Capital Growth Portfolio
Performance Compared to the Russell 1000® Growth Index(1) and the Lipper Large-Cap Growth Funds Index(2)
|
| Total Returns(3) |
| ||||||||||
|
|
|
| Average Annual | |||||||||
|
| One |
|
| Five |
|
| Ten |
|
| Since | (6) |
|
Portfolio – Class I (4) |
| (50.47 | )% |
| (4.70 | )% |
| (2.78 | )% |
| 6.22 | % |
|
Russell 1000® Growth Index |
| (38.44 | ) |
| (3.42 | ) |
| (4.27 | ) |
| 5.48 |
|
|
Lipper Large-Cap Growth Funds Index |
| (41.39 | ) |
| (3.99 | ) |
| (4.76 | ) |
| 4.96 |
|
|
|
|
|
|
|
|
|
|
|
|
|
|
|
|
Portfolio – Class P (5) |
| (50.57 | ) |
| (4.94 | ) |
| (3.02 | ) |
| 3.11 |
|
|
Russell 1000® Growth Index |
| (38.44 | ) |
| (3.42 | ) |
| (4.27 | ) |
| 2.79 |
|
|
Lipper Large-Cap Growth Funds Index |
| (41.39 | ) |
| (3.99 | ) |
| (4.76 | ) |
| 1.95 |
|
|
Performance data quoted represents past performance, which is no guarantee of future results, and current performance may be lower or higher than the figures shown. Performance assumes that all dividends and distributions, if any, were reinvested. For the most recent month-end performance figures, please visit www.morganstanley.com/msim. Investment return and principal value will fluctuate so that Portfolio shares, when redeemed, may be worth more or less than their original cost. Total returns do not reflect the deduction of taxes that a shareholder would pay on Portfolio distributions or the redemption of Portfolio shares. Performance of share classes will vary due to difference in expenses.
(1) | The Russell 1000® Growth Index measures the performance of the large-cap growth segment of the U.S. equity universe. It includes those Russell 1000® Index companies with higher price-to-book ratios and higher forecasted growth values. The Index is unmanaged and its returns do not include any sales charges or fees. Such costs would lower performance. It is not possible to invest directly in an index. |
(2) | The Lipper Large-Cap Growth Funds Index is an equally weighted performance index of the largest qualifying funds (based on net assets) in the Lipper Large-Cap Growth Funds classification. The Index, which is adjusted for capital gains distributions and income dividends, is unmanaged and should not be considered an investment. There are currently 30 funds represented in this Index. As of the date of this report, the Portfolio was in the Lipper Large-Cap Growth Funds classification. |
(3) | Total returns for the Portfolio reflect fees waived and expenses reimbursed, if applicable, by the Adviser. Without such waivers and reimbursements, total returns would have been lower. Fee waivers and/or expense reimbursements are voluntary and the Adviser reserves the right to commence or terminate any waiver and/or reimbursement at any time. |
(4) | Commenced operations on April 2, 1991 |
(5) | Commenced operations on January 2, 1996 |
(6) | For comparative purposes, average annual since inception returns listed for the Indexes refer to the inception date or initial offering of the respective share class of the Portfolio, not the inception of the Index. |
Portfolio Composition
|
| Percentage of | ||
Classification |
| Total Investments | ||
Financial – Miscellaneous |
|
| 11.3 | % |
Communications Technology |
|
| 10.7 |
|
Computer Services Software & Systems |
|
| 10.7 |
|
Energy – Miscellaneous |
|
| 7.8 |
|
Retail |
|
| 6.7 |
|
Chemicals |
|
| 6.4 |
|
Services: Commercial |
|
| 6.0 |
|
Other* |
|
| 38.4 |
|
Short-Term Investment |
|
| 2.0 |
|
Total Investments |
|
| 100.0 | % |
* Industries which do not appear in the above table, as well as those which represent less than 5% of total investments, if applicable, are included in the category labeled “Other”.
65
2008 Annual Report |
|
|
|
December 31, 2008 |
|
Portfolio of Investments
Capital Growth Portfolio
|
| Shares |
| Value |
| |
Common Stocks (98.3%) |
|
|
|
|
| |
Advertising Agencies (0.7%) |
|
|
|
|
| |
Monster Worldwide, Inc. (a) |
| 338,123 |
| $ 4,088 |
| |
Air Transport (3.0%) |
|
|
|
|
| |
Expeditors International Washington, Inc. |
| 552,014 |
| 18,365 |
| |
Biotechnology Research & Production (3.7%) |
|
|
|
|
| |
Genentech, Inc. (a) |
| 121,885 |
| 10,105 |
| |
Illumina, Inc. (a) |
| 475,199 |
| 12,379 |
| |
|
|
|
| 22,484 |
| |
Building: Cement (3.7%) |
|
|
|
|
| |
Cemex S.A.B. de C.V. ADR (a) |
| 816,225 |
| 7,460 |
| |
Martin Marietta Materials, Inc. |
| 150,060 |
| 14,568 |
| |
|
|
|
| 22,028 |
| |
Casinos & Gambling (3.2%) |
|
|
|
|
| |
Wynn Resorts Ltd. (a) |
| 453,030 |
| 19,145 |
| |
Chemicals (6.5%) |
|
|
|
|
| |
Monsanto Co. |
| 554,548 |
| 39,012 |
| |
Communications Technology (10.7%) |
|
|
|
|
| |
America Movil S.A.B. de C.V., Class L ADR |
| 446,486 |
| 13,837 |
| |
China Mobile Ltd. ADR |
| 223,641 |
| 11,372 |
| |
Cisco Systems, Inc. (a) |
| 801,116 |
| 13,058 |
| |
QUALCOMM, Inc. |
| 394,824 |
| 14,146 |
| |
Research In Motion Ltd. (a) |
| 302,627 |
| 12,281 |
| |
|
|
|
| 64,694 |
| |
Computer Services Software & Systems (10.7%) |
|
|
|
|
| |
Baidu, Inc. ADR (a) |
| 59,403 |
| 7,756 |
| |
Google, Inc., Class A (a) |
| 127,162 |
| 39,121 |
| |
Tencent Holdings Ltd. |
| 2,030,000 |
| 13,216 |
| |
VMware, Inc., Class A (a) |
| 196,232 |
| 4,649 |
| |
|
|
|
| 64,742 |
| |
Computer Technology (4.5%) |
|
|
|
|
| |
Apple, Inc. (a) |
| 321,085 |
| 27,405 |
| |
Seagate Technology, Inc. (a)(d)(l) |
| 186,100 |
| — |
| |
|
|
|
| 27,405 |
| |
Diversified Financial Services (2.0%) |
|
|
|
|
| |
CME Group, Inc. |
| 58,059 |
| 12,083 |
| |
Drugs & Pharmaceuticals (2.1%) |
|
|
|
|
| |
Allergan, Inc. |
| 187,112 |
| 7,544 |
| |
Gen-Probe, Inc. (a) |
| 124,944 |
| 5,353 |
| |
|
|
|
| 12,897 |
| |
Electronics: Semi-Conductors/Components (1.0%) |
|
|
|
|
| |
First Solar, Inc. (a) |
| 43,461 |
| 5,996 |
| |
Energy — Miscellaneous (7.9%) |
|
|
|
|
| |
Southwestern Energy Co. (a) |
| 661,943 |
| 19,176 |
| |
Ultra Petroleum Corp. (a) |
| 822,797 |
| 28,395 |
| |
|
|
|
| 47,571 |
| |
Finance Companies (1.4%) |
|
|
|
|
| |
BM&F Bovespa S.A. |
| 3,209,237 |
| 8,445 |
| |
Financial — Miscellaneous (11.3%) |
|
|
|
|
| |
American Express Co. |
| 447,593 |
| 8,303 |
| |
Berkshire Hathaway, Inc., Class B (a) |
| 5,634 |
| 18,108 |
| |
Mastercard, Inc., Class A |
| 130,162 |
| 18,604 |
| |
Redecard S.A. |
| 1,426,211 |
| 15,902 |
| |
Visa, Inc., Class A |
| 140,483 |
| 7,368 |
| |
|
|
|
| 68,285 |
| |
Health Care Equipment & Supplies (1.1%) |
|
|
|
|
| |
Intuitive Surgical, Inc. (a) |
| 50,687 |
| 6,437 |
| |
Insurance: Multi-Line (1.6%) |
|
|
|
|
| |
Loews Corp. |
| 345,094 |
| 9,749 |
| |
Real Estate Investment Trusts (REIT) (4.2%) |
|
|
|
|
| |
Brookfield Asset Management, Inc., Class A |
| 1,653,741 |
| 25,253 |
| |
Restaurants (2.1%) |
|
|
|
|
| |
Starbucks Corp. (a) |
| 1,339,498 |
| 12,672 |
| |
Retail (6.7%) |
|
|
|
|
| |
Amazon.com, Inc. (a) |
| 787,574 |
| 40,387 |
| |
Services: Commercial (6.0%) |
|
|
|
|
| |
Corporate Executive Board Co. (The) |
| 271,990 |
| 6,000 |
| |
eBay, Inc. (a) |
| 837,243 |
| 11,688 |
| |
Leucadia National Corp. (a) |
| 936,989 |
| 18,552 |
| |
|
|
|
| 36,240 |
| |
Shipping (2.2%) |
|
|
|
|
| |
C.H. Robinson Worldwide, Inc. |
| 245,689 |
| 13,520 |
| |
Wholesalers (2.0%) |
|
|
|
|
| |
Li & Fung Ltd. |
| 6,881,601 |
| 11,873 |
| |
Total Common Stocks (Cost $890,175) |
|
|
| 593,371 |
| |
Short-Term Investment (2.0%) |
|
|
|
|
| |
Investment Company (2.0%) |
|
|
|
|
| |
Morgan Stanley Institutional Liquidity Money Market Portfolio — Institutional Class (Cost $11,972) (o) |
| 11,972,287 |
| 11,972 |
| |
Total Investments (100.3%) (Cost $902,147) (v) |
|
|
| 605,343 |
| |
Liabilities in Excess of Other Assets (-0.3%) |
|
|
| (1,619 | ) | |
Net Assets (100%) |
|
|
| $603,724 |
| |
|
| |||||
(a) | Non-income producing security. | |||||
(d) | At December 31, 2008, the Portfolio held less than $500 of fair valued securities, representing less than 0.05% of net assets. These securities have been fair valued as determined in good faith under procedures established by and under the general supervision of the Portfolio’s Directors. | |||||
(l) | Security has been deemed illiquid at December 31, 2008. | |||||
(o) | See Note G to the financial statements regarding investment in Morgan Stanley Institutional Liquidity Money Market Portfolio — Institutional Class. | |||||
(v) | The approximate market value and percentage of total investments, $49,436,000 and 8.2%, respectively, represent the securities that have been fair valued under the fair valuation policy for international investments as disclosed in Note A within the Notes to Financial Statements. | |||||
ADR | American Depositary Receipt | |||||
66 | The accompanying notes are an integral part of the financial statements. |
|
| 2008 Annual Report |
|
|
| December 31, 2008 |
Investment Overview (unaudited)
Focus Growth Portfolio
The Focus Growth Portfolio (formerly Focus Equity Portfolio) (the “Portfolio”) seeks capital appreciation by investing primarily in growth-oriented equity securities of large capitalization companies. The Portfolio’s concentration of its assets in a small number of issuers will subject it to greater risks. Investments in foreign markets entail special risks such as currency, political, economic, and market risks. The risks of investing in emerging-market countries are greater than the risks generally associated with foreign investments.
Performance
For the year ended December 31, 2008, the Portfolio had a total return based on net asset value per share of -52.19%, net of fees, for Class I shares. The Portfolio’s Class I shares underperformed against its benchmark, the Russell 1000® Growth Index (the “Index”) which returned -38.44%.
Factors Affecting Performance
· The market environment was extremely challenging in the 12-month period ended December 31, 2008. Paralysis in the credit markets and a complete reshaping of the financial industry prompted a significant loss of investor confidence. Risk aversion soared, as investors fled all segments of the stock and bond markets for the perceived safety of U.S. Treasuries and cash. Although the federal government and the Federal Reserve intervened with unprecedented policy measures, investors remained uncertain about the effectiveness of the response, particularly as the U.S. economy was officially declared in recession since December 2007. These events kept the stock market volatile through the end of the period.
· By far, stock selection in consumer discretionary had the largest negative impact on relative performance, despite the positive influence of an overweight to the sector. The main detractors within the sector were holdings in commercial services and consumer electronics stocks.
· Relative performance was also hurt by stock selection and an overweight in the financial services sector. Here, diversified financial services stocks were the primary area of weakness.
· Stock selection in technology was also a source of relative weakness, where holdings in communications technology lagged.
· In contrast, both stock selection and an overweight in autos and transportation added relative value, driven by miscellaneous transportation (logistics) holdings.
· The Portfolio also benefited from an avoidance of the producer durables sector.
· Finally, an overweight in the utilities sector was a positive contributor, more than offsetting the negative impact of stock selection within the sector.
Management Strategies
· In our view, market volatility is far greater than fundamental business volatility. The market is fearful, with investors making little differentiation on fundamentals and quality. It is our goal to hold a portfolio of high-quality growth stocks we believe will perform well regardless of the market environment. To that end, the investment team continues to focus on quality — evaluating the nature and sustainability of a company’s competitive advantage and balance sheet strength. We continue to favor companies that have some uniqueness or dynamic competitive advantage in their business model, with a high quality stream of cash flow and earnings growth and the ability to redeploy capital at a high rate of return.
· At the margin, we have eliminated names that are more cyclical or where we believe there are stronger long-term opportunities elsewhere. We believe the Portfolio is well positioned for when the market once again begins to differentiate on fundamentals.

* Minimum Investment
In accordance with SEC regulations, Portfolio’s performance shown assumes that all recurring fees (including management fees) were deducted and all dividends and distributions were reinvested. The performance of Class P shares will vary from the Class I shares based upon their different inception dates and will be negatively impacted by additional fees assessed to that class.
67
2008 Annual Report |
|
December 31, 2008 |
Investment Overview (cont’d)
Focus Growth Portfolio
Performance Compared to the Russell 1000® Growth Index(1) and the Lipper Large-Cap Growth Funds Index(2)
|
| Total Returns(3) |
| ||||||||||
|
|
|
| Average Annual | |||||||||
|
| One |
|
| Five |
|
| Ten |
|
| Since | (6) |
|
Portfolio – Class I (4) |
| (52.19 | )% |
| (5.17 | )% |
| (2.40 | )% |
| 6.54 | % |
|
Russell 1000® Growth Index |
| (38.44 | ) |
| (3.42 | ) |
| (4.27 | ) |
| 4.61 |
|
|
Lipper Large-Cap Growth Funds Index |
| (41.39 | ) |
| (3.99 | ) |
| (4.76 | ) |
| 3.80 |
|
|
|
|
|
|
|
|
|
|
|
|
|
|
|
|
Portfolio – Class P (5) |
| (52.27 | ) |
| (5.40 | ) |
| (2.63 | ) |
| 3.87 |
|
|
Russell 1000® Growth Index |
| (38.44 | ) |
| (3.42 | ) |
| (4.27 | ) |
| 2.79 |
|
|
Lipper Large-Cap Growth Funds Index |
| (41.39 | ) |
| (3.99 | ) |
| (4.76 | ) |
| 1.95 |
|
|
Performance data quoted represents past performance, which is no guarantee of future results, and current performance may be lower or higher than the figures shown. Performance assumes that all dividends and distributions, if any, were reinvested. For the most recent month-end performance figures, please visit www.morganstanley.com/msim. Investment return and principal value will fluctuate so that Portfolio shares, when redeemed, may be worth more or less than their original cost. Total returns do not reflect the deduction of taxes that a shareholder would pay on Portfolio distributions or the redemption of Portfolio shares. Performance of share classes will vary due to difference in expenses.
(1) | The Russell 1000® Growth Index measures the performance of the large-cap growth segment of the U.S. equity universe. It includes those Russell 1000® Index companies with higher price-to-book ratios and higher forecasted growth values. The Index is unmanaged and its returns do not include any sales charges or fees. Such costs would lower performance. It is not possible to invest directly in an index. |
(2) | The Lipper Large-Cap Growth Funds Index is an equally weighted performance index of the largest qualifying funds (based on net assets) in the Lipper Large-Cap Growth Funds classification. The Index, which is adjusted for capital gains distributions and income dividends, is unmanaged and should not be considered an investment. There are currently 30 funds represented in this Index. As of the date of this report, the Portfolio was in the Lipper Large-Cap Growth Funds classification. |
(3) | Total returns for the Portfolio reflect fees waived and expenses reimbursed, if applicable, by the Adviser. Without such waivers and reimbursements, total returns would have been lower. Fee waivers and/or expense reimbursements are voluntary and the Adviser reserves the right to commence or terminate any waiver and/or reimbursement at any time. |
(4) | Commenced operations on March 8, 1995 |
(5) | Commenced operations on January 2, 1996 |
(6) | For comparative purposes, average annual since inception returns listed for the Indexes refer to the inception date or initial offering of the respective share class of the Portfolio, not the inception of the Index. |
Portfolio Composition
|
| Percentage of | ||
Classification |
| Total Investments | ||
Computer Services Software & Systems |
|
| 13.9 | % |
Retail |
|
| 10.4 |
|
Financial – Miscellaneous |
|
| 8.7 |
|
Chemicals |
|
| 8.6 |
|
Energy – Miscellaneous |
|
| 8.5 |
|
Services: Commercial |
|
| 8.2 |
|
Communications Technology |
|
| 7.8 |
|
Computer Technology |
|
| 6.2 |
|
Real Estate Investment Trusts (REIT) |
|
| 5.2 |
|
Other* |
|
| 21.7 |
|
Short-Term Investment |
|
| 0.8 |
|
Total Investments |
|
| 100.0 | % |
* Industries which do not appear in the above table, as well as those which represent less than 5% of total investments, if applicable, are included in the category labeled “Other”.
68
| 2008 Annual Report |
|
|
| December 31, 2008 |
Portfolio of Investments
Focus Growth Portfolio
|
| Shares |
| Value |
|
Common Stocks (100.4%) |
|
|
|
|
|
Air Transport (4.9%) |
|
|
|
|
|
Expeditors International Washington, Inc. |
| 8,743 |
| $ 291 |
|
Building: Cement (1.2%) |
|
|
|
|
|
Cemex S.A.B. de C.V. ADR (a) |
| 7,943 |
| 73 |
|
Casinos & Gambling (4.0%) |
|
|
|
|
|
Wynn Resorts Ltd. (a) |
| 5,669 |
| 239 |
|
Chemicals (8.7%) |
|
|
|
|
|
Monsanto Co. |
| 7,372 |
| 519 |
|
Communications Technology (7.9%) |
|
|
|
|
|
America Movil S.A.B. de C.V., Class L ADR |
| 7,171 |
| 222 |
|
Cisco Systems, Inc. (a) |
| 4,173 |
| 68 |
|
Research In Motion Ltd. (a) |
| 4,392 |
| 178 |
|
|
|
|
| 468 |
|
Computer Services Software & Systems (14.0%) |
|
|
|
|
|
Baidu, Inc. ADR (a) |
| 1,001 |
| 131 |
|
Google, Inc., Class A (a) |
| 1,597 |
| 491 |
|
Tencent Holdings Ltd. |
| 32,600 |
| 212 |
|
|
|
|
| 834 |
|
Computer Technology (6.3%) |
|
|
|
|
|
Apple, Inc. (a) |
| 4,366 |
| 373 |
|
Diversified Financial Services (3.2%) |
|
|
|
|
|
CME Group, Inc. |
| 903 |
| 188 |
|
Energy — Miscellaneous (8.6%) |
|
|
|
|
|
Ultra Petroleum Corp. (a) |
| 14,841 |
| 512 |
|
Finance Companies (2.8%) |
|
|
|
|
|
BM&F Bovespa S.A. |
| 63,349 |
| 167 |
|
Financial — Miscellaneous (8.8%) |
|
|
|
|
|
Berkshire Hathaway, Inc., Class B (a) |
| 69 |
| 222 |
|
Mastercard, Inc., Class A |
| 2,105 |
| 301 |
|
|
|
|
| 523 |
|
Real Estate Investment Trusts (REIT) (5.3%) |
|
|
|
|
|
Brookfield Asset Management, Inc., Class A |
| 20,500 |
| 313 |
|
Retail (10.5%) |
|
|
|
|
|
Amazon.com, Inc. (a) |
| 12,221 |
| 627 |
|
Services: Commercial (8.3%) |
|
|
|
|
|
Corporate Executive Board Co. (The) |
| 3,448 |
| 76 |
|
eBay, Inc. (a) |
| 11,645 |
| 163 |
|
Leucadia National Corp. (a) |
| 12,907 |
| 255 |
|
|
|
|
| 494 |
|
Shipping (3.4%) |
|
|
|
|
|
C.H. Robinson Worldwide, Inc. |
| 3,645 |
| 200 |
|
Wholesalers (2.5%) |
|
|
|
|
|
Li & Fung Ltd. |
| 88,100 |
| 152 |
|
Total Common Stocks (Cost $9,775) |
|
|
| 5,973 |
|
Short-Term Investment (0.9%) |
|
|
|
|
|
Investment Company (0.9%) |
|
|
|
|
|
Morgan Stanley Institutional Liquidity Money Market Portfolio — Institutional Class (Cost $51) (o) |
| 51,084 |
| 51 |
|
Total Investments (101.3%) (Cost $9,826) (v) |
|
|
| 6,024 |
|
Liabilities in Excess of Other Assets (-1.3%) |
|
|
| (76 | ) |
Net Assets (100%) |
|
|
| $5,948 |
|
(a) | Non-income producing security. |
(o) | See Note G to the financial statements regarding investment in Morgan Stanley Institutional Liquidity Money Market Portfolio — Institutional Class. |
(v) | The approximate market value and percentage of total investments, $531,000 and 8.8%, respectively, represent the securities that have been fair valued under the fair valuation policy for international investments as disclosed in Note A within the Notes to Financial Statements. |
ADR | American Depositary Receipt |
| The accompanying notes are an integral part of the financial statements. | 69 |
2008 Annual Report |
|
|
|
December 31, 2008 |
|
Investment Overview (unaudited)
Large Cap Relative Value Portfolio
The Large Cap Relative Value Portfolio (the “Portfolio”) seeks high total return by investing primarily in equity securities that the Adviser believes to be undervalued relative to the stock market in general at the time of purchase. Investments in foreign markets entail special risks such as currency, political, economic, and market risks.
Performance
For the year ended December 31, 2008, the Portfolio had a total return based on net asset value and reinvestment of distributions per share of -32.01%, net of fees, for Class I shares. The Portfolio’s Class I shares outperformed against its benchmark, the Russell 1000® Value Index (the “Index”) which returned -36.85%.
Factors Affecting Performance
· In 2008, U.S. financial markets endured one of the worst years in history. With credit markets nearly frozen, major banks collapsing, and a lackluster policy response to the accelerating financial crisis, investors suffered a severe loss of confidence. No segment of the stock or bond markets was spared from high volatility and falling prices as investors fled to the relative safety of U.S. Treasury securities and cash. Economic woes further dampened investor sentiment. The official declaration that the U.S. economy had been in recession since December 2007 was hardly surprising to investors and consumers alike, as consumers have been pulling back spending for more than a year in response to falling real estate values, rising unemployment and lack of access to credit.
· Against this backdrop, all sectors of the stock market posted substantial declines for the 12-month period. Large-capitalization value stocks (in which the Portfolio primarily invests) lost considerable value, but growth stocks and all other market capitalization ranges showed similarly negative returns.
· All sectors in the Russell 1000® Value Index had negative absolute returns for the period. Although the same was true for the Portfolio, on a relative basis the Portfolio lost less value than the Index. Specifically, stock selection in the financial services sector was a positive contributor to relative performance. The Portfolio had better relative performance in diversified financial services, due to a holding that was more resilient than many of its peers because of its lower subprime mortgage exposure. The Portfolio’s insurance stocks, particularly in the property and casualty segment, also held up relatively well because of these companies’ comparatively more conservative balance sheets.
· An overweight position in the consumer staples sector was another positive relative contributor. Within the sector, the Portfolio held a food and staples retailer that benefited from prudent inventory management and scaling down its growth strategy.
· Stock selection in the materials sector helped the Portfolio sidestep some of the sector’s volatility. The Portfolio avoided exposure to the heavily commodity-oriented companies that declined strongly when commodity prices began to fall and instead owned a gold mining company which held up better than its peers in the difficult environment.
· However, the Portfolio’s underweight positions in the energy and utilities sectors were relative detractors. Although the sectors had negative returns for the period, they were among the better performing sectors in the Index.
· Stock selection in the consumer discretionary sector was an area of weakness, as retail holdings were hurt by falling consumer spending and media holdings saw declining advertising revenues.
Management Strategies
· The turmoil of the past year has not changed our underlying investment philosophy or our stock selection process. We continue to seek undervalued companies that are experiencing a positive change or catalyst that should have a positive impact on the stock valuation. Such catalysts could be new company management, growth or consolidation within an industry or sector, or new products.
· As a result of this process, during the year the Portfolio’s financials and energy weightings increased. The consumer staples weighting declined as we pared down good performing holdings that no longer fit our risk-return profile. The Portfolio’s top five sectors as of the end of the period were financials, health care, consumer staples, consumer discretionary, and energy.
70
| 2008 Annual Report |
|
|
| December 31, 2008 |
Investment Overview (cont’d)
Large Cap Relative Value Portfolio
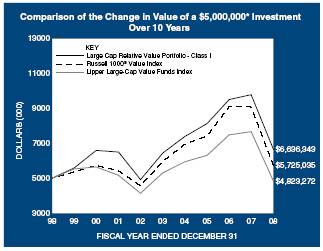
* Minimum Investment
In accordance with SEC regulations, Portfolio’s performance shown assumes that all recurring fees (including management fees) were deducted and all dividends and distributions were reinvested. The performance of Class P shares will vary from the Class I shares based upon their different inception dates and will be negatively impacted by additional fees assessed to that class.
Performance Compared to the Russell 1000® Value Index(1) and the Lipper Large-Cap Value Funds Index(2)
|
| Total Returns(3) |
| ||||||||||
|
|
|
| Average Annual | |||||||||
|
| One |
|
| Five |
|
| Ten |
|
| Since | (6) |
|
Portfolio – Class I (4) |
| (32.01 | )% |
| 0.59 | % |
| 2.87 | % |
| 8.06 | % |
|
Russell 1000® Value Index |
| (36.85 | ) |
| (0.79 | ) |
| 1.36 |
|
| 8.69 |
|
|
Lipper Large-Cap Value Funds Index |
| (37.00 | ) |
| (1.90 | ) |
| (0.36 | ) |
| 7.47 |
|
|
|
|
|
|
|
|
|
|
|
|
|
|
|
|
Portfolio – Class P (5) |
| (32.21 | ) |
| 0.30 |
|
| 2.62 |
|
| 6.04 |
|
|
Russell 1000® Value Index |
| (36.85 | ) |
| (0.79 | ) |
| 1.36 |
|
| 6.12 |
|
|
Lipper Large-Cap Value Funds Index |
| (37.00 | ) |
| (1.90 | ) |
| (0.36 | ) |
| 4.46 |
|
|
Performance data quoted represents past performance, which is no guarantee of future results, and current performance may be lower or higher than the figures shown. Performance assumes that all dividends and distributions, if any, were reinvested. For the most recent month-end performance figures, please visit www.morganstanley.com/msim. Investment return and principal value will fluctuate so that Portfolio shares, when redeemed, may be worth more or less than their original cost. Total returns do not reflect the deduction of taxes that a shareholder would pay on Portfolio distributions or the redemption of Portfolio shares. Performance of share classes will vary due to difference in expenses.
(1) | The Russell 1000® Value Index measures the performance of the large-cap value segment of the U.S. equity universe. It includes those Russell 1000® Index companies with lower price-to-book ratios and lower expected growth values. The Index is unmanaged and its returns do not include any sales charges or fees. Such costs would lower performance. It is not possible to invest directly in an index. |
(2) | The Lipper Large-Cap Value Funds Index is an equally weighted performance index of the largest qualifying funds (based on net assets) in the Lipper Large-Cap Value Fund classification. The Index, which is adjusted for capital gains distributions and income dividends, is unmanaged and should not be considered an investment. There are currently 30 funds represented in this Index. As of the date of this report, the Portfolio was in the Lipper Large-Cap Value Funds classification. |
(3) | Total returns for the Portfolio reflect fees waived and expenses reimbursed, if applicable, by the Adviser. Without such waivers and reimbursements, total returns would have been lower. Fee waivers and/or expense reimbursements are voluntary and the Adviser reserves the right to commence or terminate any waiver and/or reimbursement at any time. |
(4) | Commenced operations on January 31, 1990 |
(5) | Commenced operations on January 2, 1996 |
(6) | For comparative purposes, average annual since inception returns listed for the Indexes refer to the inception date or initial offering of the respective share class of the Portfolio, not the inception of the Index. |
Portfolio Composition
|
| Percentage of | ||
Classification |
| Total Investments | ||
Drugs & Pharmaceuticals |
|
| 11.8 | % |
Foods |
|
| 7.3 |
|
Communications & Media |
|
| 6.8 |
|
Oil: Integrated |
|
| 5.7 |
|
Utilities: Electrical |
|
| 5.3 |
|
Other** |
|
| 57.7 |
|
Short-Term Investment |
|
| 5.4 |
|
Total Investments |
|
| 100.0 | % |
** | Industries which do not appear in the above table, as well as those which represent less than 5% of total investments, if applicable, are included in the category labeled “Other”. |
71
2008 Annual Report |
|
|
|
December 31, 2008 |
|
Portfolio of Investments
Large Cap Relative Value Portfolio
|
| Shares |
| Value |
|
Common Stocks (92.1%) |
|
|
|
|
|
Aerospace & Defense (2.2%) |
|
|
|
|
|
Raytheon Co. |
| 81,110 |
| $ 4,140 |
|
Air Transport (0.6%) |
|
|
|
|
|
Continental Airlines, Inc., Class B (a) |
| 60,010 |
| 1,084 |
|
Auto Components (0.3%) |
|
|
|
|
|
Autoliv, Inc. |
| 21,865 |
| 469 |
|
Banks: Outside New York City (2.9%) |
|
|
|
|
|
PNC Financial Services Group, Inc. |
| 65,536 |
| 3,211 |
|
SunTrust Banks, Inc. |
| 71,254 |
| 2,105 |
|
|
|
|
| 5,316 |
|
Beverages: Soft Drinks (1.0%) |
|
|
|
|
|
Coca-Cola Co. (The) |
| 39,740 |
| 1,799 |
|
Chemicals (2.5%) |
|
|
|
|
|
Bayer AG ADR |
| 76,510 |
| 4,545 |
|
Commercial Banks (1.5%) |
|
|
|
|
|
KeyCorp |
| 121,355 |
| 1,034 |
|
Mitsubishi UFJ Financial Group, Inc. ADR (o) |
| 59,212 |
| 368 |
|
Mizuho Financial Group, Inc. ADR |
| 118,142 |
| 682 |
|
Sumitomo Mitsui Financial Group, Inc. |
| 143 |
| 619 |
|
|
|
|
| 2,703 |
|
Communications & Media (6.8%) |
|
|
|
|
|
Comcast Corp., Class A |
| 205,595 |
| 3,470 |
|
Time Warner, Inc. |
| 531,578 |
| 5,348 |
|
Viacom, Inc., Class B (a) |
| 194,692 |
| 3,711 |
|
|
|
|
| 12,529 |
|
Communications Technology (1.6%) |
|
|
|
|
|
Alcatel-Lucent ADR (a) |
| 309,100 |
| 665 |
|
Cisco Systems, Inc. (a) |
| 136,530 |
| 2,225 |
|
|
|
|
| 2,890 |
|
Computer Services Software & Systems (0.2%) |
|
|
|
|
|
Symantec Corp. (a) |
| 28,542 |
| 386 |
|
Computer Technology (1.7%) |
|
|
|
|
|
EMC Corp. (a) |
| 38,040 |
| 398 |
|
Hewlett-Packard Co. |
| 75,949 |
| 2,756 |
|
|
|
|
| 3,154 |
|
Consumer Electronics (1.1%) |
|
|
|
|
|
Sony Corp. ADR |
| 92,200 |
| 2,016 |
|
Consumer Staples — Miscellaneous (0.4%) |
|
|
|
|
|
Kimberly-Clark Corp. |
| 15,390 |
| 812 |
|
Cosmetics (0.9%) |
|
|
|
|
|
Estee Lauder Cos., Inc. (The) |
| 55,500 |
| 1,718 |
|
Diversified Financial Services (1.5%) |
|
|
|
|
|
Bank of America Corp. |
| 200,697 |
| 2,826 |
|
Drugs & Pharmaceuticals (11.8%) |
|
|
|
|
|
Abbott Laboratories |
| 72,600 |
| 3,875 |
|
Bristol-Myers Squibb Co. |
| 162,980 |
| 3,789 |
|
Cardinal Health, Inc. |
| 36,100 |
| 1,244 |
|
Novartis AG ADR |
| 58,120 |
| 2,892 |
|
Roche Holding AG ADR |
| 42,000 |
| 3,215 |
|
Schering-Plough Corp. |
| 285,360 |
| 4,860 |
|
Wyeth |
| 52,250 |
| 1,960 |
|
|
|
|
| 21,835 |
|
Electronics: Semi-Conductors/Components (1.5%) |
|
|
|
|
|
ASML Holding N.V. (NY Shares) |
| 65,300 |
| 1,180 |
|
Intel Corp. |
| 113,731 |
| 1,667 |
|
|
|
|
| 2,847 |
|
Energy — Miscellaneous (3.7%) |
|
|
|
|
|
Anadarko Petroleum Corp. |
| 36,800 |
| 1,419 |
|
Devon Energy Corp. |
| 23,710 |
| 1,558 |
|
Occidental Petroleum Corp. |
| 63,560 |
| 3,813 |
|
|
|
|
| 6,790 |
|
Energy Equipment (0.6%) |
|
|
|
|
|
Schlumberger Ltd. |
| 27,740 |
| 1,174 |
|
Financial — Miscellaneous (3.5%) |
|
|
|
|
|
Marsh & McLennan Cos., Inc. |
| 264,447 |
| 6,418 |
|
Foods (7.4%) |
|
|
|
|
|
Cadbury plc ADR |
| 128,619 |
| 4,588 |
|
Kraft Foods, Inc., Class A |
| 67,078 |
| 1,801 |
|
Philip Morris International, Inc. |
| 42,730 |
| 1,859 |
|
Unilever N.V. |
| 219,040 |
| 5,378 |
|
|
|
|
| 13,626 |
|
Insurance: Property & Casualty (4.2%) |
|
|
|
|
|
Chubb Corp. |
| 74,480 |
| 3,798 |
|
Travelers Cos., Inc. (The) |
| 87,400 |
| 3,951 |
|
|
|
|
| 7,749 |
|
Investment Management Companies (4.8%) |
|
|
|
|
|
JPMorgan Chase & Co. |
| 284,604 |
| 8,974 |
|
Manufacturing (1.5%) |
|
|
|
|
|
Siemens AG ADR |
| 23,210 |
| 1,758 |
|
Tyco International Ltd. |
| 43,545 |
| 941 |
|
|
|
|
| 2,699 |
|
Materials & Processing — Miscellaneous (1.4%) |
|
|
|
|
|
Newmont Mining Corp. |
| 63,050 |
| 2,566 |
|
Medical & Dental Instruments & Supplies (1.9%) |
|
|
|
|
|
Boston Scientific Corp. (a) |
| 178,110 |
| 1,379 |
|
Covidien Ltd. |
| 60,855 |
| 2,205 |
|
|
|
|
| 3,584 |
|
Multi-Sector Companies (1.1%) |
|
|
|
|
|
General Electric Co. |
| 124,520 |
| 2,017 |
|
Oil, Gas & Consumable Fuels (0.4%) |
|
|
|
|
|
Hess Corp. |
| 14,700 |
| 789 |
|
Oil: Integrated (5.7%) |
|
|
|
|
|
BP plc ADR |
| 41,430 |
| 1,937 |
|
ConocoPhillips |
| 21,610 |
| 1,119 |
|
Exxon Mobil Corp. |
| 49,600 |
| 3,960 |
|
Royal Dutch Shell plc ADR |
| 66,950 |
| 3,544 |
|
|
|
|
| 10,560 |
|
Recreational Vehicles & Boats (0.4%) |
|
|
|
|
|
Harley-Davidson, Inc. |
| 48,877 |
| 829 |
|
72 | The accompanying notes are an integral part of the financial statements. |
|
| 2008 Annual Report |
|
|
| December 31, 2008 |
Portfolio of Investments (cont’d)
Large Cap Relative Value Portfolio
|
| Shares |
| Value |
|
Restaurants (0.5%) |
|
|
|
|
|
Starbucks Corp. (a) |
| 101,630 |
| $ 961 |
|
Retail (4.5%) |
|
|
|
|
|
Home Depot, Inc. |
| 150,116 |
| 3,456 |
|
Macy’s, Inc. |
| 107,520 |
| 1,113 |
|
Wal-Mart Stores, Inc. |
| 67,040 |
| 3,758 |
|
|
|
|
| 8,327 |
|
Securities Brokerage & Services (1.2%) |
|
|
|
|
|
Charles Schwab Corp. (The) |
| 141,372 |
| 2,286 |
|
Services: Commercial (2.0%) |
|
|
|
|
|
eBay, Inc. (a) |
| 192,390 |
| 2,686 |
|
Manpower, Inc. |
| 19,100 |
| 649 |
|
Robert Half International, Inc. |
| 17,500 |
| 364 |
|
|
|
|
| 3,699 |
|
Soaps & Household Chemicals (1.1%) |
|
|
|
|
|
Procter & Gamble Co. |
| 32,550 |
| 2,012 |
|
Utilities: Electrical (5.3%) |
|
|
|
|
|
American Electric Power Co., Inc. |
| 144,980 |
| 4,825 |
|
Entergy Corp. |
| 24,590 |
| 2,044 |
|
FirstEnergy Corp. |
| 59,350 |
| 2,883 |
|
|
|
|
| 9,752 |
|
Utilities: Telecommunications (2.4%) |
|
|
|
|
|
Verizon Communications, Inc. |
| 131,665 |
| 4,463 |
|
Total Common Stocks (Cost $215,179) |
|
|
| 170,344 |
|
Preferred Stock (0.6%) |
|
|
|
|
|
Diversified Financial Services (0.6%) |
|
|
|
|
|
Bank of America Corp. (Convertible) |
|
|
|
|
|
(Cost $1,538) (a) |
| 1,601 |
| 1,041 |
|
Investment Companies (2.2%) |
|
|
|
|
|
Financial Select Sector SPDR Fund |
| 242,451 |
| 3,060 |
|
Regional Bank Holders Trust |
| 4,579 |
| 346 |
|
SPDR KBW Regional Banking ETF |
| 20,243 |
| 590 |
|
Total Investment Companies (Cost $6,952) |
|
|
| 3,996 |
|
Short-Term Investment (5.4%) |
|
|
|
|
|
Investment Company (5.4%) |
|
|
|
|
|
Morgan Stanley Institutional Liquidity Funds — Money Market Portfolio — Institutional Class (Cost $10,002) (o) |
| 10,002,575 |
| 10,003 |
|
Total Investments (100.3%) (Cost $233,671) (v) |
|
|
| 185,384 |
|
Liabilities in Excess of Other Assets (-0.3%) |
|
|
| (503 | ) |
Net Assets (100%) |
|
|
| $184,881 |
|
(a) | Non-income producing security. |
(o) | See Note G to the financial statements regarding investments in Mitsubishi UFJ Financial Group, Inc. ADR and Morgan Stanley Institutional Liquidity Funds — Money Market Portfolio — Institutional Class. |
(v) | The approximate market value and percentage of total investments, $619,000 and 0.3%, respectively, represent the securities that have been fair valued under the fair valuation policy for international investments as disclosed in Note A within the Notes to Financial Statements. |
ADR | American Depositary Receipt |
ETF | Exchange Traded Fund |
SPDR | Standard & Poor’s Depositary Receipt |
| The accompanying notes are an integral part of the financial statements. | 73 |
2008 Annual Report |
|
|
|
December 31, 2008 |
|
Investment Overview (unaudited)
Small Company Growth Portfolio
The Small Company Growth Portfolio (the “Portfolio”) seeks long-term capital appreciation by investing primarily in growth-oriented equity securities of small capitalization companies. Investments in small sized corporations are more vulnerable to financial risks and other risks than larger corporations and may involve a higher degree of price volatility than investments in the general equity markets.
Performance
For the year ended December 31, 2008, the Portfolio had a total return based on net asset value and reinvestment of distributions per share of -41.84%, net of fees, for Class I shares. The Portfolio’s Class I shares underperformed against its benchmark, the Russell 2000® Growth Index (the “Index”) which returned -38.54%.
Factors Affecting Performance
· The market environment was extremely challenging in the 12-month period ended December 31, 2008. Paralysis in the credit markets and a complete reshaping of the financial industry prompted a significant loss of investor confidence. Risk aversion soared, as investors fled all segments of the stock and bond markets for the perceived safety of U.S. Treasuries and cash. Although the federal government and the Federal Reserve intervened with unprecedented policy measures, investors remained uncertain about the effectiveness of the response, particularly as the U.S. economy was officially declared in recession since December 2007. These events kept the stock market volatile through the end of the period. Small-cap stocks, in which the Portfolio invests, finished the year with a substantial loss.
· Stock selection in the technology sector had the largest negative impact on relative performance, despite the positive influence of an underweight in the sector. Within the sector, the Portfolio was hurt by exposure to the miscellaneous technology (business software and services) industry.
· Stock selection and an overweight in the consumer discretionary sector also had a detrimental effect on relative performance. Within the sector, commercial services and retail holdings lagged.
· Finally, in the financial services sector, stock selection hampered relative performance, offsetting the benefit of an overweight in the sector. The group’s leading detractor was a real estate investment trust.
· However, stock selection and an underweight in the other energy sector was by far the largest contributor to relative performance, driven by natural gas producers.
· Stock selection in health care also had a positive effect on relative performance, although an underweight to the sector dampened some of the relative gain. Within the sector, health care services holdings led stronger relative performance.
· Rounding out the top three positive contributors was the materials and processing sector, where stock selection and an overweight in the sector both added value.
Management Strategies
· This period was an unusual year for small-cap funds, as portfolios aligned more closely to the benchmark outperformed the more concentrated, less “benchmark aware” portfolios such as ours. Historically, over time, active managers have outperformed small-cap benchmarks.
· In our view, market volatility is far greater than fundamental business volatility. The market is fearful, with investors making little differentiation on fundamentals and quality. It is our goal to hold a portfolio of high-quality growth stocks we believe will perform well regardless of the market environment. To that end, the investment team continues to focus on quality — evaluating the nature and sustainability of a company’s competitive advantage and balance sheet strength. We continue to favor companies that have some uniqueness or dynamic competitive advantage in their business model, with a high quality stream of cash flow and earnings growth and the ability to redeploy capital at a high rate of return.
· At the margin, we have eliminated names that are more cyclical or where we believe there are stronger long-term opportunities. We believe the Portfolio is well positioned for when the market once again begins to differentiate on fundamentals.
74
| 2008 Annual Report |
|
|
| December 31, 2008 |
Investment Overview (cont’d)
Small Company Growth Portfolio

* Minimum Investment
In accordance with SEC regulations, Portfolio’s performance shown assumes that all recurring fees (including management fees) were deducted and all dividends and distributions were reinvested. The performance of Class P shares will vary from the Class I shares based upon their different inception dates and will be negatively impacted by additional fees assessed to that class.
Performance Compared to the Russell 2000® Growth Index(1) and the Lipper Small-Cap Growth Funds Index(2)
|
| Total Returns(3) | |||||||
|
|
|
| Average Annual | |||||
|
| One |
| Five |
| Ten |
| Since |
|
|
| Year |
| Years |
| Years |
| Inception | (6) |
Portfolio — Class I (4) |
| (41.84 | )% | (1.93 | )% | 5.06 | % | 9.01 | % |
Russell 2000® Growth Index |
| (38.54 | ) | (2.35 | ) | (0.76 | ) | 4.55 |
|
Lipper Small-Cap Growth Funds Index |
| (42.62 | ) | (4.06 | ) | 0.92 |
| 6.70 |
|
|
|
|
|
|
|
|
|
|
|
Portfolio — Class P (5) |
| (41.97 | ) | (2.17 | ) | 4.81 |
| 6.75 |
|
Russell 2000® Growth Index |
| (38.54 | ) | (2.35 | ) | (0.76 | ) | 1.26 |
|
Lipper Small-Cap Growth Funds Index |
| (42.62 | ) | (4.06 | ) | 0.92 |
| 2.87 |
|
Performance data quoted represents past performance, which is no guarantee of future results, and current performance may be lower or higher than the figures shown. Performance assumes that all dividends and distributions, if any, were reinvested. For the most recent month-end performance figures, please visit www.morganstanley.com/msim. Investment return and principal value will fluctuate so that Portfolio shares, when redeemed, may be worth more or less than their original cost. Total returns do not reflect the deduction of taxes that a shareholder would pay on Portfolio distributions or the redemption of Portfolio shares. Performance of share classes will vary due to difference in expenses.
(1) The Russell 2000® Growth Index measures the performance of the small-cap growth segment of the U.S. equity universe. It includes those Russell 2000® Index companies with higher price-to-book ratios and higher forecasted growth values. The Index is unmanaged and its returns do not include any sales charges or fees. Such costs would lower performance. It is not possible to invest directly in an index.
(2) The Lipper Small-Cap Growth Funds Index is an equally weighted performance index of the largest qualifying funds (based on net assets) in the Lipper Small-Cap Growth Funds classification. The Index, which is adjusted for capital gains distributions and income dividends, is unmanaged and should not be considered an investment. There are currently 30 funds represented in this Index. As of the date of this report, the Portfolio was in the Lipper Small-Cap Growth Funds classification.
(3) Total returns for the Portfolio reflect fees waived and expenses reimbursed, if applicable, by the Adviser. Without such waivers and expense reimbursements, total returns would have been lower. Fee waivers and/or expense reimbursements are voluntary and the Adviser reserves the right to commence or terminate any waiver and/or reimbursement at any time.
(4) Commenced operations on November 1, 1989
(5) Commenced operations on January 2, 1996
(6) For comparative purposes, average annual since inception returns listed for the Indexes refer to the inception date or initial offering of the respective share class of the Portfolio, not the inception of the Index.
Portfolio Composition
|
| Percentage of | ||
Classification |
| Total Investments | ||
Computer Services Software & Systems |
| 11.1 | % | |
Services: Commercial |
| 9.8 |
| |
Retail |
| 6.8 |
| |
Medical & Dental Instruments & Supplies |
| 6.7 |
| |
Investment Management Companies |
| 5.8 |
| |
Building: Cement |
| 5.1 |
| |
Other** |
| 53.0 |
| |
Short-Term Investment |
| 1.7 |
| |
Total Investments |
|
| 100.0 | % |
** Industries which do not appear in the above table, as well as those which represent less than 5% of total investments, if applicable, are included in the category labeled “Other”.
75
2008 Annual Report |
|
|
|
December 31, 2008 |
|
Portfolio of Investments
Small Company Growth Portfolio
|
|
|
| Value |
| |
|
| Shares |
| (000) |
| |
Common Stocks (96.6%) |
|
|
|
|
| |
Biotechnology Research & Production (4.2%) |
|
|
|
|
| |
Alnylam Pharmaceuticals, Inc. (a) |
| 900,786 |
| $ | 22,277 |
|
Illumina, Inc. (a) |
| 738,470 |
| 19,237 |
| |
|
|
|
| 41,514 |
| |
Building: Cement (5.1%) |
|
|
|
|
| |
Eagle Materials, Inc. |
| 1,361,917 |
| 25,073 |
| |
Texas Industries, Inc. |
| 738,699 |
| 25,485 |
| |
|
|
|
| 50,558 |
| |
Casinos & Gambling (0.3%) |
|
|
|
|
| |
Lakes Entertainment, Inc. (a) |
| 613,119 |
| 2,465 |
| |
Communications & Media (0.4%) |
|
|
|
|
| |
CKX, Inc. (a) |
| 1,117,557 |
| 4,101 |
| |
Communications Technology (2.3%) |
|
|
|
|
| |
Gmarket, Inc. ADR (a) |
| 695,472 |
| 11,997 |
| |
GSI Commerce, Inc. (a) |
| 1,047,523 |
| 11,020 |
| |
|
|
|
| 23,017 |
| |
Computer Services Software & Systems (11.2%) |
|
|
|
|
| |
Bankrate, Inc. (a) |
| 329,016 |
| 12,503 |
| |
Blackboard, Inc. (a) |
| 650,745 |
| 17,069 |
| |
comScore, Inc. (a) |
| 535,398 |
| 6,826 |
| |
Forrester Research, Inc. (a) |
| 1,145,683 |
| 32,320 |
| |
Longtop Financial Technologies Ltd. ADR (a) |
| 1,088,234 |
| 16,454 |
| |
Sina Corp. (a) |
| 352,953 |
| 8,171 |
| |
Solera Holdings, Inc. (a) |
| 712,090 |
| 17,161 |
| |
|
|
|
| 110,504 |
| |
Education Services (4.0%) |
|
|
|
|
| |
Ambassadors Group, Inc. |
| 1,021,275 |
| 9,396 |
| |
American Public Education, Inc. (a) |
| 256,799 |
| 9,550 |
| |
Strayer Education, Inc. |
| 93,311 |
| 20,007 |
| |
|
|
|
| 38,953 |
| |
Electronics: Semi-Conductors/Components (1.2%) |
|
|
|
|
| |
Tessera Technologies, Inc. (a) |
| 970,576 |
| 11,531 |
| |
Electronics: Technology (1.3%) |
|
|
|
|
| |
Cogent Communications Group, Inc. (a) |
| 1,976,323 |
| 12,905 |
| |
Energy — Miscellaneous (4.6%) |
|
|
|
|
| |
Contango Oil & Gas Co. (a) |
| 800,188 |
| 45,051 |
| |
Engineering & Contracting Services (2.2%) |
|
|
|
|
| |
Grupo Aeroportuario del Pacifico S.A.B. de C.V. ADR |
| 918,391 |
| 21,141 |
| |
Finance Companies (0.3%) |
|
|
|
|
| |
Climate Exchange plc (a) |
| 213,895 |
| 2,721 |
| |
Financial — Miscellaneous (4.7%) |
|
|
|
|
| |
Interactive Data Corp. |
| 594,014 |
| 14,648 |
| |
Riskmetrics Group, Inc. (a) |
| 2,089,651 |
| 31,115 |
| |
|
|
|
| 45,763 |
| |
Homebuilding (1.3%) |
|
|
|
|
| |
Brascan Residential Properties S.A. |
| 3,224,207 |
| 3,445 |
| |
Gafisa S.A. ADR |
| 983,576 |
| 9,108 |
| |
|
|
|
| 12,553 |
| |
Hotel/Motel (0.6%) |
|
|
|
|
| |
Mandarin Oriental International Ltd. |
| 6,241,693 |
|
| 6,198 |
|
Insurance: Multi-Line (1.9%) |
|
|
|
|
| |
Greenlight Capital Re Ltd., Class A (a) |
| 1,198,300 |
| 15,566 |
| |
Pico Holdings, Inc. (a) |
| 111,103 |
| 2,953 |
| |
|
|
|
| 18,519 |
| |
Investment Management Companies (5.8%) |
|
|
|
|
| |
Capital Southwest Corp. |
| 32,715 |
| 3,539 |
| |
Greenhill & Co., Inc. |
| 773,905 |
| 53,995 |
| |
|
|
|
| 57,534 |
| |
Leisure Time (1.0%) |
|
|
|
|
| |
Aruze Corp. |
| 879,600 |
| 8,877 |
| |
Premier Exhibitions, Inc. (a) |
| 917,249 |
| 1,009 |
| |
|
|
|
| 9,886 |
| |
Machinery: Industrial/Specialty (0.8%) |
|
|
|
|
| |
Middleby Corp. (a) |
| 278,215 |
| 7,587 |
| |
Medical & Dental Instruments & Supplies (6.8%) |
|
|
|
|
| |
Cepheid, Inc. (a) |
| 629,832 |
| 6,538 |
| |
Techne Corp. |
| 938,521 |
| 60,553 |
| |
|
|
|
| 67,091 |
| |
Oil: Crude Producers (2.6%) |
|
|
|
|
| |
Carrizo Oil & Gas, Inc. (a) |
| 444,989 |
| 7,164 |
| |
GMX Resources, Inc. (a) |
| 722,787 |
| 18,301 |
| |
|
|
|
| 25,465 |
| |
Printing & Copying Services (1.0%) |
|
|
|
|
| |
VistaPrint Ltd. (a) |
| 534,406 |
| 9,945 |
| |
Publishing — Miscellaneous (1.2%) |
|
|
|
|
| |
Morningstar, Inc. (a) |
| 329,472 |
| 11,696 |
| |
Real Estate Investment Trusts (REIT) (0.5%) |
|
|
|
|
| |
Consolidated-Tomoka Land Co. |
| 131,943 |
| 5,039 |
| |
Restaurants (3.6%) |
|
|
|
|
| |
BJ’s Restaurants, Inc. (a) |
| 1,042,269 |
| 11,225 |
| |
P.F. Chang’s China Bistro, Inc. (a) |
| 1,144,323 |
| 23,962 |
| |
|
|
|
| 35,187 |
| |
Retail (6.8%) |
|
|
|
|
| |
Blue Nile, Inc. (a) |
| 1,074,431 |
| 26,313 |
| |
Citi Trends, Inc. (a) |
| 860,234 |
| 12,663 |
| |
Ctrip.com International Ltd. ADR |
| 810,649 |
| 19,293 |
| |
Dena Co., Ltd. |
| 2,794 |
| 8,982 |
| |
|
|
|
| 67,251 |
| |
Services: Commercial (9.9%) |
|
|
|
|
| |
Advisory Board Co. (The) (a) |
| 1,116,930 |
| 24,908 |
| |
Corporate Executive Board Co. (The) |
| 419,678 |
| 9,258 |
| |
CoStar Group, Inc. (a) |
| 959,295 |
| 31,599 |
| |
Information Services Group, Inc. (a) |
| 2,373,870 |
| 8,071 |
| |
MercadoLibre, Inc. (a) |
| 630,330 |
| 10,344 |
| |
New Oriental Education & Technology Group ADR (a) |
| 244,135 |
| 13,405 |
| |
|
|
|
| 97,585 |
| |
76 | The accompanying notes are an integral part of the financial statements. |
|
| 2008 Annual Report |
|
|
| December 31, 2008 |
Portfolio of Investments (cont’d)
Small Company Growth Portfolio
|
|
|
| Value |
| |
|
| Shares |
| (000) |
| |
Shoes (1.0%) |
|
|
|
|
| |
Lululemon Athletica, Inc. (a) |
| 1,246,740 |
| $ | 9,887 |
|
Technology — Miscellaneous (3.7%) |
|
|
|
|
| |
athenahealth, Inc. (a) |
| 708,315 |
| 26,647 |
| |
iRobot Corp. (a) |
| 703,141 |
| 6,349 |
| |
Market Leader, Inc. (a) |
| 1,024,170 |
| 1,741 |
| |
Rediff.com India Ltd. ADR (a) |
| 804,484 |
| 1,617 |
| |
|
|
|
| 36,354 |
| |
Toys (3.0%) |
|
|
|
|
| |
Marvel Entertainment, Inc. (a) |
| 964,468 |
| 29,657 |
| |
Transportation — Miscellaneous (0.5%) |
|
|
|
|
| |
Integrated Distribution Services Group Ltd. |
| 4,778,400 |
| 5,270 |
| |
Utilities: Electrical (2.8%) |
|
|
|
|
| |
Brookfield Infrastructure Partners LP |
| 2,482,297 |
| 27,802 |
| |
Total Common Stocks (Cost $1,423,530) |
|
|
| 950,730 |
| |
Preferred Stocks (2.6%) |
|
|
|
|
| |
Biotechnology Research & Production (0.6%) |
|
|
|
|
| |
Pacific Biosciences of California, Inc. (Convertible) (a)(d)(l) |
| 1,046,420 |
| 5,860 |
| |
Diversified Financial Services (0.5%) |
|
|
|
|
| |
Ning, Inc. (Convertible) (a)(d)(l) |
| 1,132,800 |
| 5,670 |
| |
Drugs & Pharmaceuticals (1.5%) |
|
|
|
|
| |
Ironwood Pharmaceutical, Inc. (Convertible) (a)(d)(l) |
| 1,212,976 |
| 14,556 |
| |
Total Preferred Stocks (Cost $23,006) |
|
|
| 26,086 |
| |
Short-Term Investment (1.8%) |
|
|
|
|
| |
Investment Company (1.8%) |
|
|
|
|
| |
Morgan Stanley Institutional Liquidity Money Market Portfolio — Institutional Class |
| 17,235,166 |
| 17,235 |
| |
Total Investments (101.0%) (Cost $1,463,771) (v) |
|
|
| 994,051 |
| |
Liabilities in Excess of Other Assets (-1.0%) |
|
|
| (10,190 | ) | |
Net Assets (100%) |
|
|
| $ | 983,861 |
|
(a) Non-income producing security.
(d) At December 31, 2008, the Portfolio held approximately $26,086,000 of fair valued securities, representing 2.7% of net assets. These securities have been fair valued as determined in good faith under procedures established by and under the general supervision of the Portfolio’s Directors.
(l) Security has been deemed illiquid at December 31, 2008.
(o) See Note G to the financial statements regarding investment in Morgan Stanley Institutional Liquidity Money Market Portfolio — Institutional Class.
(v) The approximate market value and percentage of total investments, $35,493,000 and 3.6%, respectively, represent the securities that have been fair valued under the fair valuation policy for international investments as disclosed in Note A within the Notes to Financial Statements.
ADR American Depositary Receipt
| The accompanying notes are an integral part of the financial statements. | 77 |
2008 Annual Report |
|
|
|
December 31, 2008 |
|
Investment Overview (unaudited)
U.S. Real Estate Portfolio
The U.S. Real Estate Portfolio (the “Portfolio”) seeks to provide above average current income and long-term capital appreciation by investing primarily in equity securities of companies in the U.S. real estate industry, including real estate investment trusts (“REITs”). The Portfolio’s concentration in the real estate sector makes it subject to greater risk and volatility than other portfolios that are more diversified, and the value of its shares may be substantially affected by economic events in the real estate industry. In addition to the risks associated with ownership of real estate and the real estate industry in general include, fluctuations in the value of underlying property, defaults by borrowers or tenants, market saturation, decreases in market rents, interest rates, property taxes, increases in operating expenses and political or regulatory occurrences adversely affecting real estate.
Performance
For the year ended December 31, 2008, the Portfolio had a total return based on net asset value and reinvestment of distributions per share of -38.07%, net of fees, for Class I shares. The Portfolio’s Class I shares underperformed against its benchmarks, the FTSE NAREIT Equity REIT Index (the “Index”) which returned -37.73% and the S&P 500® Index which returned -37.00%.
Factors Affecting Performance
· The real estate investment trust (REIT) market experienced a significant decline of 37.73% in the year ending December 31, 2008, as measured by the FTSE NAREIT Equity REIT Index (the “Index”).
· Despite the continued deterioration of the credit markets and weakened outlook for economic growth, REITs posted modest gains through September. It appeared that movements in REIT share prices through September were most impacted by investor sentiment, as the sector may have been viewed as a defensive investment due to the lagged negative impact of a weaker economy on company earnings and limited transactional evidence of declines in asset values.
· In wide contrast, the REIT market subsequently declined 38.8% in the fourth quarter, reflecting investor concerns with regard to growing evidence of an economic recession and a further deterioration of the financial and credit markets. Indeed, the profound lack of debt capital and absence of liquidity for assets has caused companies to become highly conservative with regard to their capital planning and investors to question the viability of a number of listed property companies facing significant upcoming debt maturities.
· Among the major U.S. REIT sectors, the apartment sector significantly outperformed, the office sector modestly underperformed and the retail sector significantly underperformed the Index. Apartment stocks appeared to outperform as investors viewed them as marginally safer than other sectors given their favorable operating performance through the third quarter despite a continued weak employment picture. Perhaps of greater importance, these companies continue to have access to debt financing from Fannie Mae and Freddie Mac, which currently differentiates them from owners of commercial assets. The office sector modestly underperformed as investors weighed the benefit of their longer-term lease structure versus the likely negative impact on leasing from continued corporate layoff announcements. The retail sector significantly underperformed as it is expected that weaker retail properties may suffer meaningful occupancy declines due to store closures. In addition, the sector features a number of companies with higher than average leverage and near-term debt maturities, which investors believe will likely be problematic in the current credit environment.
· The smaller REIT sectors had the most significant disparities from the Index. The strongest performers were the storage and health care sectors, which are perceived as defensive sectors in a weak economic environment. The hotel REITs significantly underperformed the Index due to a continued weakening of demand. The weakest performer was the industrial sector as investors became increasingly concerned that the massive global development business platforms for the two largest industrial REITs will be severely impaired in this economic environment and that these companies may face significant refinancing issues.
· The Portfolio modestly underperformed the Index in the period. Bottom-up stock selection contributed to performance and top-down sector allocation detracted from returns. Stock selection was strong in the shopping center, mall and apartment sectors; this was partially offset by stock selection in the hotel and industrial sectors. From a top-down perspective, the Portfolio benefited from an underweight to the industrial sector, an overweight to the apartment sector and from a higher than average level of cash. This was offset by an overweight to the hotel sector and an underweight to the storage and health care sectors.
Management Strategies
· We have maintained our core investment philosophy as a real estate value investor. This results in the ownership of stocks whose share prices provide real estate exposure at what we believe to be the best valuation relative to their underlying asset values.
78
| 2008 Annual Report |
|
|
| December 31, 2008 |
Investment Overview (cont’d)
U.S. Real Estate Portfolio
· Given the unprecedented current lack of clarity on underlying asset values due to the lack of liquidity for assets, we have favored stocks whose share prices already more than reflect prospective declines in underlying asset values. In addition, we seek to invest in companies that we believe are well-positioned to weather the current liquidity crisis and have a capital plan that is appropriately conservative due to the uncertain timing of the recovery of the credit markets.
· Our company-specific research has led us to an overweighting in the Portfolio to a group of companies that are focused in the ownership of upscale urban hotels and apartment properties, as well as an underweighting to companies concentrated in the ownership of storage, industrial, health care and shopping center assets.
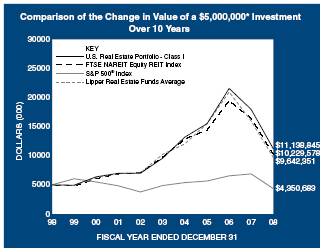
* Minimum Investment
In accordance with SEC regulations, Portfolio’s performance shown assumes that all recurring fees (including management fees) were deducted and all dividends and distributions were reinvested. The performance of Class P shares will vary from the Class I shares based upon their different inception dates and will be negatively impacted by additional fees assessed to that class.
Performance Compared to the FTSE NAREIT Equity REIT Index(1), the S&P 500® Index(2) and the Lipper Real Estate Funds Average(3)
|
| Total Returns(4) |
| ||||||
|
|
|
| Average Annual |
| ||||
|
| One |
| Five |
| Ten |
| Since |
|
|
| Year |
| Years |
| Years |
| Inception | (7) |
Portfolio – Class I (5) |
| (38.07 | )% | 2.97 | % | 8.34 | % | 10.94 | % |
FTSE NAREIT Equity REIT Index |
| (37.73 | ) | 0.91 |
| 7.42 |
| 8.66 |
|
S&P 500® Index |
| (37.00 | ) | (2.19 | ) | (1.38 | ) | 6.42 |
|
Lipper Real Estate Funds Index |
| (39.92 | ) | (0.67 | ) | 6.82 |
| 8.63 |
|
|
|
|
|
|
|
|
|
|
|
Portfolio – Class P (6) |
| (38.26 | ) | 2.72 |
| 8.05 |
| 9.71 |
|
FTSE NAREIT Equity REIT Index |
| (37.73 | ) | 0.91 |
| 7.42 |
| 8.08 |
|
S&P 500® Index |
| (37.00 | ) | (2.19 | ) | (1.38 | ) | 4.72 |
|
Lipper Real Estate Funds Index |
| (39.92 | ) | (0.67 | ) | 6.82 |
| 7.77 |
|
Performance data quoted represents past performance, which is no guarantee of future results, and current performance may be lower or higher than the figures shown. Performance assumes that all dividends and distributions, if any, were reinvested. For the most recent month-end performance figures, please visit www.morganstanley.com/msim. Investment return and principal value will fluctuate so that Portfolio shares, when redeemed, may be worth more or less than their original cost. Total returns do not reflect the deduction of taxes that a shareholder would pay on Portfolio distributions or the redemption of Portfolio shares. Performance of share classes will vary due to difference in expenses.
(1) The FTSE NAREIT (National Association of Real Estate Investment Trusts) Equity REIT Index is an unmanaged market weighted index of tax-qualified REITs listed on the New York Stock Exchange, American Stock Exchange and the NASDAQ National Market System. The Index is unmanaged and its returns do not include any sales charges or fees. Such costs would lower performance. It is not possible to invest directly in an index.
(2) The Standard & Poor’s 500® Index (S&P 500®) measures the performance of the large cap segment of the U.S. equities market, covering approximately 75% of the U.S. equities market. The Index includes 500 leading companies in leading industries of the U.S. economy. The Index is unmanaged and its returns do not include any sales charges or fees. Such costs would lower performance. It is not possible to invest directly in an index.
(3) The Lipper Real Estate Funds Average tracks the performance of all funds in the Lipper Real Estate Funds classification. The Average, which is adjusted for capital gains distributions and income dividends, is unmanaged and should not be considered an investment. As of the date of this report, the Portfolio was in the Lipper Real Estate Funds classification.
(4) Total returns for the Portfolio reflect fees waived and expenses reimbursed, if applicable, by the Adviser. Without such waivers and reimbursements, total returns would have been lower. Fee waivers and/or expense reimbursements are voluntary and the Adviser reserves the right to commence or terminate any waiver and/or reimbursement at any time.
(5) Commenced operations on February 24, 1995
(6) Commenced operations on January 2, 1996
(7) For comparative purposes, average annual since inception returns listed for the Indexes refer to the inception date or initial offering of the respective share class of the Portfolio, not the inception of the Index.
79
2008 Annual Report |
|
|
|
December 31, 2008 |
|
Investment Overview (cont’d)
U.S. Real Estate Portfolio
Portfolio Composition*
|
| Percentage of | ||
Classification |
| Total Investments | ||
Residential Apartments |
| 19.0 | % | |
Office |
| 15.0 |
| |
Health Care |
| 13.5 |
| |
Lodging/Resorts |
| 10.6 |
| |
Retail Strip Centers |
| 10.4 |
| |
Retail Regional Malls |
| 9.3 |
| |
Other** |
|
| 21.3 |
|
Short-Term Investment |
|
| 0.9 |
|
Total Investments |
|
| 100.0 | % |
* Percentages indicated are based upon total investments (excluding Securities held as collateral on Loaned Securities) as of December 31, 2008.
** Industries which do not appear in the above table, as well as those which represent less than 5% of total investments, if applicable, are included in the category labeled “Other”.
80
| 2008 Annual Report |
|
|
| December 31, 2008 |
Portfolio of Investments
U.S. Real Estate Portfolio
|
|
|
| Value |
| ||
|
| Shares |
| (000) |
| ||
Common Stocks (98.0%) |
|
|
|
|
| ||
Diversified (4.7%) |
|
|
|
|
| ||
Forest City Enterprises, Inc., Class A (c) |
| 768,371 |
| $ | 5,148 |
| |
Vornado Realty Trust REIT (c) |
| 339,635 |
| 20,497 |
| ||
|
|
|
| 25,645 |
| ||
Health Care (13.3%) |
|
|
|
|
| ||
Assisted Living Concepts, Inc., Class A (a)(c) |
| 1,110,310 |
| 4,608 |
| ||
Care Investment Trust, Inc. REIT |
| 126,450 |
| 985 |
| ||
Extendicare REIT |
| 44,700 |
| 212 |
| ||
HCP, Inc. REIT |
| 530,449 |
| 14,730 |
| ||
Healthcare Realty Trust, Inc. REIT (c) |
| 971,390 |
| 22,808 |
| ||
Senior Housing Properties Trust REIT |
| 1,130,292 |
| 20,255 |
| ||
Ventas, Inc. REIT |
| 268,550 |
| 9,015 |
| ||
|
|
|
| 72,613 |
| ||
Industrial (4.3%) |
|
|
|
|
| ||
AMB Property Corp. REIT (c) |
| 255,623 |
| 5,987 |
| ||
Cabot Industrial Value Fund II, LP (a)(d)(i)(l) |
| 12,667 |
| 6,334 |
| ||
Cabot Industrial Value Fund III, LP (a)(i) |
| 221 |
| 111 |
| ||
DCT Industrial Trust, Inc. REIT (c) |
| 379,190 |
| 1,918 |
| ||
Exeter Industrial Value Fund, LP (d) |
| 3,400,000 |
| 3,400 |
| ||
Keystone Industrial Fund, LP (d)(i)(l) |
| 6,525,000 |
| 5,401 |
| ||
|
|
|
| 23,151 |
| ||
Lodging/Resorts (10.5%) |
|
|
|
|
| ||
Host Hotels & Resorts, Inc. REIT (c) |
| 2,953,112 |
| 22,355 |
| ||
Morgans Hotel Group Co. (a) |
| 648,265 |
| 3,021 |
| ||
Starwood Hotels & Resorts Worldwide, Inc. (c) |
| 1,624,665 |
| 29,082 |
| ||
Strategic Hotels & Resorts, Inc. REIT |
| 1,481,244 |
| 2,488 |
| ||
|
|
|
| 56,946 |
| ||
Office (14.8%) |
|
|
|
|
| ||
Boston Properties, Inc. REIT |
| 652,181 |
| 35,870 |
| ||
BRCP REIT I, LLC (a)(d)(i)(l) |
| 6,101,396 |
| 2,287 |
| ||
BRCP REIT II, LLC (a)(d)(i)(l) |
| 5,586,430 |
| 4,469 |
| ||
Brookfield Properties Corp. |
| 2,405,542 |
| 18,595 |
| ||
Douglas Emmett, Inc. REIT (c) |
| 126,623 |
| 1,654 |
| ||
Mack-Cali Realty Corp. REIT (c) |
| 735,001 |
| 18,007 |
| ||
|
|
|
| 80,882 |
| ||
Office/Industrial (3.0%) |
|
|
|
|
| ||
Duke Realty Corp. REIT (c) |
| 322,712 |
| 3,537 |
| ||
Liberty Property Trust REIT (c) |
| 442,470 |
| 10,101 |
| ||
PS Business Parks, Inc. REIT |
| 65,512 |
| 2,926 |
| ||
|
|
|
| 16,564 |
| ||
Residential Apartments (18.8%) |
|
|
|
|
| ||
Atlantic Gulf Communities Corp. (a)(i)(l) |
| 140,284 |
| — |
| ||
AvalonBay Communities, Inc. REIT (c) |
| 653,034 |
| 39,561 |
| ||
Camden Property Trust REIT (c) |
| 659,218 |
| 20,660 |
| ||
Equity Residential REIT (c) |
| 989,591 |
| 29,510 |
| ||
Post Properties, Inc. REIT |
| 780,813 |
| 12,883 |
| ||
|
|
| �� | 102,614 |
| ||
Residential Manufactured Homes (2.0%) |
|
|
|
|
| ||
Equity Lifestyle Properties, Inc. REIT (c) |
| 278,334 |
| 10,677 |
| ||
Retail Regional Malls (9.2%) |
|
|
|
|
| ||
Macerich Co. (The) REIT (c) |
| 8,089 |
|
| 147 |
| |
Simon Property Group, Inc. REIT (c) |
| 887,864 |
| 47,172 |
| ||
Taubman Centers, Inc. REIT |
| 104,503 |
| 2,661 |
| ||
|
|
|
| 49,980 |
| ||
Retail Strip Centers (10.3%) |
|
|
|
|
| ||
Acadia Realty Trust REIT (c) |
| 364,383 |
| 5,200 |
| ||
BPP Liquidating Trust REIT (a)(d)(l) |
| 113,290 |
| — |
| ||
Federal Realty Investment Trust REIT (c) |
| 331,404 |
| 20,574 |
| ||
Ramco-Gershenson Properties Trust REIT (c) |
| 135,525 |
| 837 |
| ||
Regency Centers Corp. REIT (c) |
| 630,107 |
| 29,426 |
| ||
Weingarten Realty Investors REIT (c) |
| 13,050 |
| 270 |
| ||
|
|
|
| 56,307 |
| ||
Self Storage (4.0%) |
|
|
|
|
| ||
Public Storage REIT |
| 240,528 |
| 19,122 |
| ||
Sovran Self Storage, Inc. REIT (c) |
| 69,962 |
| 2,519 |
| ||
|
|
|
| 21,641 |
| ||
Timber (3.1%) |
|
|
|
|
| ||
Plum Creek Timber Co., Inc. REIT (c) |
| 480,608 |
| 16,696 |
| ||
Total Common Stocks (Cost $808,500) |
|
|
| 533,716 |
| ||
Preferred Stocks (0.0%) |
|
|
|
|
| ||
Residential Apartments (0.0%) |
|
|
|
|
| ||
Atlantic Gulf Communities Corp., Series B (a)(d)(i)(l) |
| 107,021 |
| — |
| ||
Atlantic Gulf Communities Corp., Series B (Convertible) (a)(d)(i)(l) |
| 75,765 |
| — |
| ||
Total Preferred Stocks (Cost $1,828) |
|
|
| — |
| ||
Short-Term Investments (25.1%) |
|
|
|
|
| ||
Securities held as Collateral on Loaned Securities (24.2%) |
|
|
|
|
| ||
Investment Company (19.4%) |
|
|
|
|
| ||
Morgan Stanley Institutional Liquidity Money Market Portfolio — Institutional Class (o) |
| 105,764,317 |
| 105,764 |
| ||
|
|
|
|
|
| ||
|
| Face |
|
|
| ||
|
| Amount |
|
|
| ||
|
| (000) |
|
|
| ||
Repurchase Agreement (4.8%) |
|
|
|
|
| ||
Goldman Sachs & Co., 0.06%, dated 12/31/08, due 1/2/09, repurchase price $25,982; fully collateralized by U.S. government agency securities at the date of this Portfolio of Investments as follows: Federal Home Loan Mortgage Corp., Gold Pools: rates ranging from 4.50% to 6.00%, due 11/1/19 - 12/1/38; Federal National Mortgage Association, Fixed Rate Mortgages: rates ranging from 4.00% - 7.00%, due 9/1/18 - 1/1/39; Government National Mortgage Association, Fixed Rate Mortgages: rates ranging from 4.50% to 11.50%, due 6/15/16 - 12/20/38, valued at $26,502. |
| $ 25,982 |
| 25,982 |
| ||
|
|
|
| 131,746 |
| ||
| The accompanying notes are an integral part of the financial statements. | 81 |
2008 Annual Report |
|
|
|
December 31, 2008 |
|
Portfolio of Investments (cont’d)
U.S. Real Estate Portfolio
|
|
|
| Value |
| |
|
| Shares |
| (000) |
| |
Investment Company (0.9%) |
|
|
|
|
| |
Morgan Stanley Institutional Liquidity Money Market Portfolio — Institutional Class (o) |
| 5,079,104 |
| $ | 5,079 |
|
Total Short-Term Investments (Cost $136,825) |
|
|
| 136,825 |
| |
Total Investments (123.1%) (Cost $947,153) —including $128,396 of Securities Loaned |
|
|
| 670,541 |
| |
Liabilities in Excess of Other Assets (-23.1%) |
|
|
| (125,816 | ) | |
Net Assets (100%) |
|
|
| $ | 544,725 |
|
(a) |
| Non-income producing security. |
(c) |
| All or a portion of security on loan at December 31, 2008. |
(d) |
| At December 31, 2008, the Portfolio held approximately $21,891,000 of fair valued securities, representing 4.0% of net assets. These securities have been fair valued as determined in good faith under procedures established by and under the general supervision of the Portfolio’s Directors. |
(i) |
| Restricted security valued at fair value and not registered under the Securities Act of 1933. Atlantic Gulf Communities Corp. was acquired in 6/97 and has a current cost basis of $790,000. Atlantic Gulf Communities Corp., Series B Preferred was acquired in 11/97 and has a current cost basis of $758,000. Atlantic Gulf Communities Corp., Series B (Convertible) Preferred was acquired in 6/97 and has a current cost basis of $1,070,000. BRCP REIT I, LLC was acquired between 5/03 - 5/08 and has a current cost basis of $2,464,000. BRCP REIT II, LLC was acquired between 10/06 - 12/07 and has a current cost basis of $5,586,000. Cabot Industrial Value Fund II, LP was acquired between 11/05 - 11/08 and has a current cost basis of $6,334,000, Cabot Industrial Value Fund III, LP was acquired on 12/08 and has a current cost basis of $111,000, Keystone Industrial Fund, LP was acquired between 3/06 - 9/07 and has a current cost basis of $5,401,000. At December 31, 2008, these securities had an aggregate market value of $18,602,000 representing 3.4% of net assets. |
(l) |
| Security has been deemed illiquid at December 31, 2008. |
(o) |
| See Note G to the financial statements regarding investment in Morgan Stanley Institutional Liquidity Money Market Portfolio — Institutional Class. |
REIT | Real Estate Investment Trust | |
82 | The accompanying notes are an integral part of the financial statements. |
|
| 2008 Annual Report |
|
|
| December 31, 2008 |
Investment Overview (unaudited)
U.S. Small/Mid Cap Value Portfolio
U.S. Small/Mid Cap Value Portfolio (the “Portfolio”) seeks long-term capital appreciation by investing primarily in common stocks and other equity securities, including convertible securities, of small- and mid-size companies that the Adviser believes are undervalued relative to the marketplace or to similar companies. Stocks of small and medium-sized companies entail special risks, such as limited product lines, markets, and financial resources, and greater market volatility than securities of larger, more-established companies. In addition to the risks associated with common stocks, investments in convertible securities are subject to the risks associated with fixed-income securities, namely credit, price and interest-rate risks.
Performance
For the year ended December 31, 2008, the Portfolio had a total return based on net asset value and reinvestment of distributions per share of -38.03%, net of fees, for Class I shares. The Portfolio’s Class I shares underperformed against its benchmark, the Russell 2500® Value Index (the “Index”) which returned -31.99%.
Factors Affecting Performance
· Following a volatile start to 2008, the broad stock market enjoyed a relative upswing from mid-March through mid-May. The market was supported by renewed confidence that capital markets were beginning to stabilize and expectations that a recession, if one occurred, would be shorter and shallower than initially expected.
· However, the sense of relief was soon overshadowed by more bad news from the financial sector and the economy, including drastically lower consumer sentiment measures and concerns about the solvency of Fannie Mae and Freddie Mac.
· A series of problems with major financial institutions, and subsequent government interventions with forced consolidations within the sector, led to wild swings in the stock market in September and October. Credit conditions, which had been tight since the demise of the subprime mortgage market, froze, exacerbating the deterioration of investor confidence. Recession expectations turned more pessimistic, leading to a steep drop in commodity prices. Additionally, mutual fund tax-loss selling, which occurs in October, and forced selling by hedge funds further contributed to volatility.
· Governments and central banks around the world responded quickly to the accelerating crisis with aggressive fiscal and monetary policy.
· In November, market volatility remained heightened. The official announcement that the U.S. had been in recession since December 2007 was hardly surprising to observers, amid bad news from nearly every segment of the economy and the appeal by U.S. automakers for a government bailout.
· Sentiment turned more upbeat in December, however. With oil prices substantially off their highs, inflation concerns were put to rest (although they were replaced by deflation concerns). The Federal Reserve reduced the target federal funds rate and indicated rates were likely to remain low for some time, while Congress approved loans to U.S. automakers. Observers kept a close eye on the cabinet choices and proposed stimulus plan of the incoming Obama Administration. Volatility in equity prices moderated somewhat and liquidity measures showed slight improvement. However, considerable uncertainty remained.
· Across the market capitalization spectrum, no particular segment outperformed, with all segments posting considerable declines for the period. Value stocks held up better than growth stocks in every market cap range, but particularly so in small-caps. Within the Index, the utilities, consumer staples, and financial services sectors had the smallest declines; while energy, consumer discretionary, and technology were the weakest performers.
· Relative to the Index, the Portfolio’s performance was bolstered by stock selection in the consumer discretionary sector, where selected business services holdings were particularly beneficial.
· Stock selection within the health care sector also drove relative gains, due to a health care services company and a specialty pharmaceuticals company.
· Although the Portfolio has minimal exposure to the autos and transportation sector, an aerospace-related holding added value.
· Finally, an underweight in the energy sector helped the Portfolio avoid some of the sector’s decline.
· However, stock selection in the producer durables sector was less favorable. The slowing economy and drop in end-market demand hurt many companies in this sector, including the Portfolio’s holdings in aerospace, telecommunications equipment, and office supplies and equipment companies.
83
2008 Annual Report
December 31, 2008
Investment Overview (cont’d)
U.S. Small/Mid Cap Value Portfolio
· The materials and processing sector was another area of weakness, as selected holdings dampened relative performance.
· An underweight position and stock selection within the financial services sector had a negative impact, with an underweight to banks, positions in several insurance companies, and a hotel real estate investment trust (REIT) holding being the primary detractors.
· An overweight to the technology sector, one of the worst performing sectors in the Index, further hampered relative results.
Management Strategies
· The Portfolio began the year with an overweight in producer durables but finished the year with a neutral weighting in the sector. Outside of that change, the Portfolio’s positioning shifted very little during the period.
· At the end of the period, as a result of our bottom-up, value-driven stock selection process, the Portfolio held significant underweights in financial services, especially banks and REITs (although insurance represented an overweight), and in utilities. The largest overweights in the Portfolio were consumer discretionary, especially business services, technology, and health care.
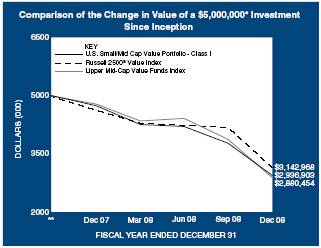
* | Minimum Investment |
** | Commenced operations on September 27, 2007. |
In accordance with SEC regulations, Portfolio’s performance shown assumes that all recurring fees (including management fees) were deducted and all dividends and distributions were reinvested. The performance of Class P shares will vary from the Class I shares based upon their different inception dates and will be negatively impacted by additional fees assessed to that class.
Performance Compared to the Russell 2500® Value Index(1) and the Lipper Mid-Cap Value Funds Index(2)
|
| Total Returns(3) | ||||||||
|
|
|
| Average Annual | ||||||
|
| One |
| Five |
| Ten |
| Since |
| |
|
| Year |
| Years |
| Years |
| Inception(5) |
| |
Portfolio – Class I (4) |
| (38.03 | )% | — |
| — |
| (34.44 | )% | |
Russell 2500® Value Index |
| (31.99 | ) | — |
| — |
| (30.83 | ) | |
Lipper Mid-Cap Value Funds Index |
| (39.71 | ) | — |
| — |
| (35.46 | ) | |
|
|
|
|
|
|
|
|
|
| |
Portfolio – Class P (4) |
| (38.21 | ) | — |
| — |
| (34.65 | ) | |
Russell 2500® Value Index |
| (31.99 | ) | — |
| — |
| (30.83 | ) | |
Lipper Mid-Cap Value Funds Index |
| (39.71 | ) | — |
| — |
| (35.46 | ) | |
Performance data quoted represents past performance, which is no guarantee of future results, and current performance may be lower or higher than the figures shown. Performance assumes that all dividends and distributions, if any, were reinvested. For the most recent month-end performance figures, please visit www.morganstanley.com/msim. Investment return and principal value will fluctuate so that Portfolio shares, when redeemed, may be worth more or less than their original cost. Total returns do not reflect the deduction of taxes that a shareholder would pay on Portfolio distributions or the redemption of Portfolio shares. Performance of share classes will vary due to difference in expenses.
(1) | The Russell 2500® Value Index measures the performance of those companies in the Russell 2500® Index with lower price -to-book ratios and lower forecasted growth values. The Index is unmanaged and its returns do not include any sales charges or fees. Such costs would lower performance. It is not possible to invest directly in an index. |
(2) | The Lipper Mid-Cap Value Funds Index is an equally weighted performance index of the largest qualifying funds (based on net assets) in the Lipper Mid-Cap Value Funds classification. The Index, which is adjusted for capital gains distributions and income dividends, is unmanaged and should not be considered an investment. There are currently 30 funds represented in this Index. As of the date of this report, the Portfolio was in the Lipper Mid-Cap Value Funds classification. |
(3) | Total returns for the Portfolio reflect fees waived and expenses reimbursed, if applicable, by the Adviser. Without such waivers and reimbursements, total returns would have been lower. Fee waivers and/or expense reimbursements are voluntary and the Adviser reserves the right to commence or terminate any waiver and/or reimbursement at any time. |
(4) | Commenced operations on September 27, 2007 |
(5) | For comparative purposes, cumulative since inception returns listed for the Indexes refer to the inception date or initial offering of the respective share class of the Portfolio, not the inception of the Index. |
Portfolio Composition
|
| Percentage of |
| ||
Classification |
| Total Investments |
| ||
Insurance |
| 18.6 | % | ||
Aerospace & Defense |
| 9.7 |
| ||
Information Technology Services |
| 9.2 |
| ||
Commercial Services & Supplies |
| 6.2 |
| ||
Other*** |
| 51.1 |
| ||
Short-Term Investment |
|
| 5.2 |
| |
Total Investments |
|
| 100.0 | % | |
*** Industries which do not appear in the above table, as well as those which represent less than 5% of total investments, if applicable, are included in the category labeled “Other”.
84
| 2008 Annual Report |
|
|
| December 31, 2008 |
Portfolio of Investments
U.S. Small/Mid Cap Value Portfolio
|
|
|
| Value |
| ||
|
| Shares |
| (000) |
| ||
Common Stocks (93.1%) |
|
|
|
|
| ||
Aerospace & Defense (9.7%) |
|
|
|
|
| ||
AAR Corp. (a) |
| 34,500 |
| $ | 635 |
| |
Alliant Techsystems, Inc. (a) |
| 5,000 |
| 429 |
| ||
Goodrich Corp. |
| 11,200 |
| 415 |
| ||
Spirit Aerosystems Holdings, Inc., Class A (a) |
| 12,800 |
| 130 |
| ||
|
|
|
| 1,609 |
| ||
Beverages (2.5%) |
|
|
|
|
| ||
Molson Coors Brewing Co., Class B |
| 8,500 |
| 416 |
| ||
Chemicals (3.2%) |
|
|
|
|
| ||
Cytec Industries, Inc. |
| 9,900 |
| 210 |
| ||
Lubrizol Corp. |
| 8,800 |
| 320 |
| ||
|
|
|
| 530 |
| ||
Commercial Services & Supplies (6.1%) |
|
|
|
|
| ||
Brink’s Co. (The) |
| 12,400 |
| 333 |
| ||
Brink’s Home Security Holdings Inc. (a) |
| 12,400 |
| 272 |
| ||
Cenveo, Inc. (a) |
| 28,700 |
| 128 |
| ||
Copart, Inc. (a) |
| 3,100 |
| 84 |
| ||
RR Donnelley & Sons Co. |
| 14,700 |
| 200 |
| ||
|
|
|
| 1,017 |
| ||
Computers & Peripherals (3.4%) |
|
|
|
|
| ||
MSC.Software Corp. (a) |
| 28,600 |
| 191 |
| ||
Teradata Corp. (a) |
| 25,200 |
| 374 |
| ||
|
|
|
| 565 |
| ||
Containers & Packaging (3.8%) |
|
|
|
|
| ||
Owens-Illinois, Inc. (a) |
| 7,400 |
| 202 |
| ||
Pactiv Corp. (a) |
| 16,200 |
| 403 |
| ||
Smurfit-Stone Container Corp. (a) |
| 114,100 |
| 29 |
| ||
|
|
|
| 634 |
| ||
Diversified Telecommunication Services (2.4%) |
|
|
|
|
| ||
CenturyTel, Inc. |
| 14,700 |
| 402 |
| ||
Electrical Equipment (2.0%) |
|
|
|
|
| ||
Belden, Inc. |
| 15,500 |
| 323 |
| ||
Energy Equipment & Services (2.2%) |
|
|
|
|
| ||
Exterran Holdings, Inc. (a) |
| 11,500 |
| 245 |
| ||
Superior Energy Services, Inc. (a) |
| 8,000 |
| 127 |
| ||
|
|
|
| 372 |
| ||
Food Products (3.2%) |
|
|
|
|
| ||
ConAgra Foods, Inc. |
| 14,800 |
| 244 |
| ||
Corn Products International, Inc. |
| 9,800 |
| 283 |
| ||
|
|
|
| 527 |
| ||
Gas Utilities (2.6%) |
|
|
|
|
| ||
UGI Corp. |
| 17,400 |
| 425 |
| ||
Health Care Providers & Services (3.8%) |
|
|
|
|
| ||
IMS Health, Inc. |
| 15,500 |
| 235 |
| ||
PerkinElmer, Inc. |
| 28,800 |
| 400 |
| ||
|
|
|
| 635 |
| ||
Hotels Restaurants & Leisure (0.8%) |
|
|
|
|
| ||
AFC Enterprises, Inc. (a) |
| 26,500 |
|
| 124 |
| |
Household Durables (4.3%) |
|
|
|
|
| ||
Snap-On, Inc. |
| 12,100 |
| 477 |
| ||
Stanley Works (The) |
| 6,900 |
| 235 |
| ||
|
|
|
| 712 |
| ||
Information Technology Services (9.2%) |
|
|
|
|
| ||
Broadridge Financial Solutions, Inc. |
| 34,000 |
| 426 |
| ||
Computer Sciences Corp. (a) |
| 12,000 |
| 422 |
| ||
MAXIMUS, Inc. |
| 19,300 |
| 678 |
| ||
|
|
|
| 1,526 |
| ||
Insurance (18.6%) |
|
|
|
|
| ||
Assurant, Inc. |
| 20,700 |
| 621 |
| ||
Axis Capital Holdings Ltd. |
| 9,400 |
| 274 |
| ||
Conseco, Inc. (a) |
| 75,700 |
| 392 |
| ||
Hanover Insurance Group, Inc. (The) |
| 15,059 |
| 647 |
| ||
Markel Corp. (a) |
| 1,400 |
| 419 |
| ||
Reinsurance Group of America Inc. |
| 16,800 |
| 719 |
| ||
|
|
|
| 3,072 |
| ||
Media (1.3%) |
|
|
|
|
| ||
Scripps Networks Interactive, Inc., Class A |
| 9,500 |
| 209 |
| ||
Office Electronics (2.2%) |
|
|
|
|
| ||
Zebra Technologies Corp., Class A (a) |
| 18,100 |
| 367 |
| ||
Oil, Gas & Consumable Fuels (0.9%) |
|
|
|
|
| ||
Pioneer Natural Resources Co. |
| 8,700 |
| 141 |
| ||
Pharmaceuticals (4.5%) |
|
|
|
|
| ||
Mylan, Inc. (a) |
| 25,200 |
| 249 |
| ||
NBTY, Inc. (a) |
| 9,000 |
| 141 |
| ||
Perrigo Co. |
| 11,000 |
| 355 |
| ||
|
|
|
| 745 |
| ||
Software (4.4%) |
|
|
|
|
| ||
Amdocs Ltd. (a) |
| 17,300 |
| 317 |
| ||
Check Point Software Technologies (a) |
| 21,500 |
| 408 |
| ||
|
|
|
| 725 |
| ||
Thrifts & Mortgage Finance (2.0%) |
|
|
|
|
| ||
TFS Financial Corp. |
| 25,800 |
| 333 |
| ||
Total Common Stocks (Cost $21,143) |
|
|
| 15,409 |
| ||
|
|
|
|
|
| ||
|
| Face |
|
|
| ||
|
| Amount |
|
|
| ||
|
| (000) |
|
|
| ||
Fixed Income (1.4%) |
|
|
|
|
| ||
Life Science Tools & Services (1.4%) |
|
|
|
|
| ||
Life Technologies Corp. (Convertible), 1.50%, 2/15/24 (Cost $309) |
| $ | 309 |
| 233 |
| |
| The accompanying notes are an integral part of the financial statements. | 85 |
2008 Annual Report
December 31, 2008
Portfolio of Investments (cont’d)
U.S. Small/Mid Cap Value Portfolio
|
|
|
| Value |
| |
|
| Shares |
| (000) |
| |
Short-Term Investment (5.2%) |
|
|
|
|
| |
Investment Company (5.2%) |
|
|
|
|
| |
Morgan Stanley Institutional Liquidity Funds — Money Market Portfolio — Institutional Class (Cost $861) (o) |
| 860,939 |
| $ | 861 |
|
Total Investments (99.7%) (Cost $22,313) |
|
|
| 16,503 |
| |
Other Assets in Excess of Liabilities (0.3%) |
|
|
| 47 |
| |
Net Assets (100%) |
|
|
| $ | 16,550 |
|
(a) Non-income producing security
(o) See Note G to the financial statements regarding investment in Morgan Stanley Institutional Liquidity Money Market Portfolio — Institutional Class.
86 | The accompanying notes are an integral part of the financial statements. |
|
| 2008 Annual Report |
|
|
| December 31, 2008 |
Investment Overview (unaudited)
Emerging Markets Debt Portfolio
The Emerging Markets Debt Portfolio (the “Portfolio”) seeks high total return by investing primarily in fixed income securities of government and government-related issuers and, to a lesser extent, of corporate issuers in emerging market countries. Foreign investing involves certain risks, including currency fluctuations and controls, restrictions on foreign investments, less governmental supervision and regulation, less liquidity and the potential for market volatility and political instability. In addition, investing in emerging markets may involve a relatively higher degree of volatility. Fixed income securities are subject to credit and interest-rate risk. Credit risk refers to the ability of an issuer to make timely payments of interest and principal. Interest-rate risk refers to fluctuations in the value of a fixed-income security resulting from changes in the general level of interest rates. In a declining interest-rate environment, the portfolio may generate less income. In a rising interest-rate environment, bond prices fall.
Performance
For the year ended December 31, 2008, the Portfolio had a total return based on net asset value and reinvestment of distributions per share of -10.07%, net of fees, for Class I shares. The Portfolio’s Class I shares underperformed against its benchmark, the JP Morgan EMBI Global Bond Index / JP Morgan GBI-EM Diversified Bond Index, which returned -5.22%.
Factors Affecting Performance
· In the first half of 2008, the global economy avoided a serious recession and the prospect of the rest of the world “decoupling” from the U.S.-centered credit crisis was considered a possibility. The most serious threat to the economic performance of emerging market (EM) countries during this time was inflationary pressures coming from high food and commodity prices. While economic data began to show signs of deterioration in the U.S. and other developed countries, economic growth in the emerging world remained strong, driven by the continued growth of external accounts and increasing domestic demand. EM bonds, both in U.S. dollars and in local currency, performed relatively well with spreads trading in a fairly narrow range.
· Late in the third quarter, the Lehman Brothers bankruptcy and the associated freezing of credit markets turned the economic headwinds decidedly more negative. Investor confidence plummeted, risk appetite collapsed, and forced selling of all sorts of risky assets ensued. Credit in global markets dried up, marking a turning point for those countries that had managed to remain on the sidelines of the crisis. EM countries endured a series of shocks including manic selling by leveraged investors, an unprecedented drop in commodity prices, and a sharp contraction in developed market growth. Most asset classes declined regardless of fundamentals as indiscriminate deleveraging generated a vicious cycle in which falling prices further undermined investor confidence, fueling additional unwinding of positions.
· Central Banks across the globe pursued aggressive monetary policies in the last quarter of the year, including considerable reductions in benchmark interest rates, which helped EM local bonds recover some of the losses incurred in the prior months. For the overall year, however, EM government bonds underperformed developed bonds as investors sought the relative safety of U.S. Treasury bonds, yet outperformed other risky asset classes such as U.S. high yield bonds, leveraged loans and commercial mortgage-backed securities. The J. P. Morgan GBI-EM Diversified Bond Index declined 5.22% in 2008, and the yield rose from 8.22% to 8.34%.
· The Fund’s underweights to Hungary and Russia in the latter part of the year, as well as overweights to Mexico and Nigeria aided relative returns. Conversely, an overweight to Argentina early in the year and underweights to the Czech Republic and Thailand detracted from relative returns.
Management Strategies
· We favored securities in Brazil, Mexico and Malaysia during the reporting period.
· The Fund maintained a neutral risk posture throughout most of the period, but had a moderately lower interest-rate duration relative to the Index.
· While EM debt and credit fundamentals remained strong at year end, particularly for the systematically important EM countries, risk premiums and domestic interest rates remain elevated. There was some improvement in the credit markets late in the year, which allowed issuers to borrow from the capital markets and trading volumes to improve slightly. We believe that the destruction of value in the last months of the year has created good opportunities in those EM countries with still strong fundamentals that should well position them to weather the global economic recession.
87
2008 Annual Report |
|
December 31, 2008 |
Investment Overview (cont’d)
Emerging Markets Debt Portfolio

* Minimum Investment
In accordance with SEC regulations, Portfolio’s performance shown assumes that all recurring fees (including management fees) were deducted and all dividends and distributions were reinvested. The performance of Class P, Class H, and Class L shares will vary from the Class I shares based upon their different inception dates and will be negatively impacted by additional fees assessed to those classes.
Performance Compared to the JP Morgan EMBI Global Bond Index/JP Morgan GBI-EM Diversified Bond Index(1) and the Lipper Emerging Markets Debt Funds Index(2).
|
| Total Returns(3) | |||||||
|
|
|
| Average Annual | |||||
|
| One |
| Five |
| Ten |
| Since |
|
|
| Year |
| Years |
| Years |
| Inception | (8) |
Portfolio – Class I (4) |
| (10.07) | % | 5.26 | % | 11.48 | % | 9.27 | % |
JP Morgan EMBI Global Bond Index/JP Morgan GBI-EM Diversified Bond Index |
| (5.22) |
| 6.60 |
| 10.91 |
| 9.48 |
|
Lipper Emerging Markets Debt Funds Index |
| (20.11) |
| 4.21 |
| 10.79 |
| — |
|
Portfolio – Class P (5) |
| (10.34) |
| 4.98 |
| 11.17 |
| 9.54 |
|
JP Morgan EMBI Global Bond Index/JP Morgan GBI-EM Diversified Bond Index |
| (5.22) |
| 6.60 |
| 10.91 |
| 10.66 |
|
Lipper Emerging Markets Debt Funds Index |
| (20.11) |
| 4.21 |
| 10.79 |
| 9.10 |
|
|
| Total Returns(3) | |||||||
|
|
|
| Average Annual | |||||
|
| One |
| Five |
| Ten |
| Since | |
|
| Year |
| Years |
| Years |
| Inception (8) | |
Portfolio – Class H w/o sales charges (6) |
| — |
| — |
| — |
| (10.70) | % |
Portfolio – Class H with maximum 3.50% sales charges (6) |
| — |
| — |
| — |
| (13.84) |
|
JP Morgan EMBI Global Bond Index/JP Morgan GBI-EM Diversified Bond Index |
| — |
| — |
| — |
| (5.62) |
|
Lipper Emerging Markets Debt Funds Index |
| — |
| — |
| — |
| (20.28) |
|
Portfolio – Class L(7) |
| — |
| — |
| — |
| (11.85) |
|
JP Morgan EMBI Global Bond Index/JP Morgan GBI-EM Diversified Bond Index |
| — |
| — |
| — |
| (6.28) |
|
Lipper Emerging Markets Debt Funds Index |
| — |
| — |
| — |
| (19.62) |
|
Performance data quoted represents past performance, which is no guarantee of future results, and current performance may be lower or higher than the figures shown. Performance assumes that all dividends and distributions, if any, were reinvested. For the most recent month-end performance figures, please visit www.morganstanley.com/msim. Investment return and principal value will fluctuate so that Portfolio shares, when redeemed, may be worth more or less than their original cost. Total returns do not reflect the deduction of taxes that a shareholder would pay on Portfolio distributions or the redemption of Portfolio shares. Performance of share classes will vary due to difference in sales charges and expenses.
(1) | JP Morgan EMBI Global Bond Index/JP Morgan GBI-EM Diversified Bond Index is a custom index represented by performance of the JP Morgan EMBI Global Bond Index (which tracks the performance U.S. dollar - denominated debt instruments issued by emerging markets) for periods from the Portfolio’s inception to September 30, 2007 and the JP Morgan GBI-EM Diversified Bond Index (which tracks local currency government bonds issued by emerging markets) for periods thereafter. The Index is unmanaged and its returns do not include any sales charges or fees. Such costs would lower performance. It is not possible to invest directly in an index. |
(2) | The Lipper Emerging Markets Debt Funds Index is an equally weighted performance index of the largest qualifying funds (based on net assets) in the Lipper Emerging Markets Debt Funds classification. The Index, which is adjusted for capital gains distributions and income dividends, is unmanaged and should not be considered an investment. There are currently 10 funds represented in this Index. As of the date of this report, the Portfolio was in the Lipper Emerging Markets Debt Funds classification. |
(3) | Total returns for the Portfolio reflect fees waived and expenses reimbursed, if applicable, by the Adviser. Without such waivers and reimbursements, total returns would have been lower. Fee waivers and/or expense reimbursements are voluntary and the Adviser reserves the right to commence or terminate any waiver and/or reimbursement at any time. |
(4) | Commenced operations on February 1, 1994. |
(5) | Commenced operations on January 2, 1996. |
(6) | Commenced operations on January 2, 2008. |
(7) | Commenced operations on June 16, 2008. |
(8) | For comparative purposes, average annual since inception returns listed for the Indexes refer to the inception date or initial offering of the respective share class of the Portfolio, not the inception of the Index. |
Portfolio Composition
|
| Percentage of |
| |
Classification |
| Total Investments |
| |
Sovereign |
| 83.6 | % | |
Other** |
| 3.9 |
| |
Short-Term Investment |
|
| 12.5 |
|
Total Investments |
|
| 100.0 | % |
** Industries which do not appear in the above table, as well as those which represent less than 5% of total investments, if applicable, are included in the category labeled “Other”.
88
| 2008 Annual Report |
|
|
| December 31, 2008 |
Portfolio of Investments
Emerging Markets Debt Portfolio
|
| Face |
|
|
| ||||||
|
| Amount |
| Value |
| ||||||
|
| (000) |
| (000) |
| ||||||
Debt Instruments (92.9%) |
|
|
|
|
| ||||||
Brazil (12.9%) |
|
|
|
|
| ||||||
Corporate (0.3%) |
|
|
|
|
| ||||||
Banco ABN Amro Real S.A., |
|
|
|
|
| ||||||
16.20%, 2/22/10 |
| BRL | 170 |
| $ | 74 |
| ||||
Sovereign (12.6%) |
|
|
|
|
| ||||||
Brazil Notas do Tesouro Nacional, Series F, |
|
|
|
|
| ||||||
10.00%, 1/1/14 |
| 9,131 |
| 3,499 |
| ||||||
|
|
|
| 3,573 |
| ||||||
Colombia (1.3%) |
|
|
|
|
| ||||||
Sovereign (1.3%) |
|
|
|
|
| ||||||
Republic of Colombia, |
|
|
|
|
| ||||||
12.00%, 10/22/15 |
| COP | 713,000 |
| 350 |
| |||||
Hungary (10.3%) |
|
|
|
|
| ||||||
Sovereign (10.3%) |
|
|
|
|
| ||||||
Republic of Hungary, |
|
|
|
|
| ||||||
6.25%, 8/24/10 |
| HUF | 144,850 |
| 719 |
| |||||
6.75%, 4/12/10 |
| 118,430 |
| 601 |
| ||||||
Republic of Hungary, 12/B, |
|
|
|
|
| ||||||
7.25%, 6/12/12 |
| 290,140 |
| 1,418 |
| ||||||
Republic of Hungary, 17/B, |
|
|
|
|
| ||||||
6.75%, 2/24/17 |
| 20,280 |
| 95 |
| ||||||
|
|
|
| 2,833 |
| ||||||
Indonesia (7.8%) |
|
|
|
|
| ||||||
Corporate (0.0%) |
|
|
|
|
| ||||||
Tjiwi Kimia Finance Mauritius Ltd., Tranche A, |
|
|
|
|
| ||||||
5.53%, 4/28/15 (e)(h) |
| $ | — | @ | — | @ | |||||
Sovereign (7.8%) |
|
|
|
|
| ||||||
Barclays plc, Republic of Indonesia Government Bond, Credit Linked Notes, |
|
|
|
|
| ||||||
9.00%, 9/15/18 |
| IDR | 10,000,000 |
| 758 |
| |||||
JPMorgan Chase & Co., Republic of Indonesia Government Bond, Credit Linked Notes, |
|
|
|
|
| ||||||
Zero Coupon, 9/20/09 |
| 8,500,000 |
| 715 |
| ||||||
9.00%, 9/15/18 |
| 3,300,000 |
| 251 |
| ||||||
UBS AG, Republic of Indonesia Government Bond, Credit Linked Notes, |
|
|
|
|
| ||||||
9.00%, 9/15/18 |
| 5,850,000 |
| 443 |
| ||||||
|
|
|
| 2,167 |
| ||||||
|
|
|
| 2,167 |
| ||||||
Malaysia (12.6%) |
|
|
|
|
| ||||||
Sovereign (12.6%) |
|
|
|
|
| ||||||
Government of Malaysia, |
|
|
|
|
| ||||||
3.76%, 4/28/11 |
| MYR | 597 |
| 175 |
| |||||
3.83%, 9/28/11 |
| 11,186 |
| 3,302 |
| ||||||
|
|
|
| 3,477 |
| ||||||
Mexico (12.2%) |
|
|
|
|
| ||||||
Sovereign (12.2%) |
|
|
|
|
| ||||||
Mexican Bonos, |
|
|
|
|
| ||||||
10.00%, 12/5/24 |
| MXN | 20,880 |
| 1,736 |
| |||||
Mexican Bonos, M 10, |
|
|
|
|
| ||||||
8.00%, 12/17/15 |
| 12,344 |
| 895 |
| ||||||
Mexican Bonos, MI10, |
|
|
|
|
| ||||||
9.50%, 12/18/14 |
|
| 2,555 |
| 199 |
| |||||
United Mexican States, |
|
|
|
|
| ||||||
5.95%, 3/19/19 |
| $ | 544 |
| 547 |
| |||||
|
|
|
| 3,377 |
| ||||||
Nigeria (2.6%) |
|
|
|
|
| ||||||
Corporate (2.2%) |
|
|
|
|
| ||||||
Shell Petroleum Development Co., Credit Linked Notes, |
|
|
|
|
| ||||||
Zero Coupon, 5/15/09 |
| 800 |
| 620 |
| ||||||
Sovereign (0.4%) |
|
|
|
|
| ||||||
UBS AG, Federal Republic of Nigeria, Credit Linked Notes, |
|
|
|
|
| ||||||
Zero Coupon, 3/5/09 |
| NGN | 14,400 |
| 102 |
| |||||
|
|
|
| 722 |
| ||||||
Peru (1.4%) |
|
|
|
|
| ||||||
Sovereign (1.4%) |
|
|
|
|
| ||||||
Republic of Peru, |
|
|
|
|
| ||||||
12.25%, 8/10/11 |
| PEN | 1,105 |
| 396 |
| |||||
Poland (5.7%) |
|
|
|
|
| ||||||
Sovereign (5.7%) |
|
|
|
|
| ||||||
Republic of Poland, |
|
|
|
|
| ||||||
4.25%, 5/24/11 |
| PLN | 4,740 |
| 1,562 |
| |||||
South Africa (9.9%) |
|
|
|
|
| ||||||
Corporate (1.4%) |
|
|
|
|
| ||||||
International Finance Corp., |
|
|
|
|
| ||||||
11.00%, 7/1/09 |
| ZAR | 3,660 |
| 393 |
| |||||
Sovereign (8.5%) |
|
|
|
|
| ||||||
Republic of South Africa, |
|
|
|
|
| ||||||
13.00%, 8/31/10 |
| 19,989 |
| 2,352 |
| ||||||
|
|
|
| 2,745 |
| ||||||
Thailand (4.9%) |
|
|
|
|
| ||||||
Sovereign (4.9%) |
|
|
|
|
| ||||||
Kingdom of Thailand, |
|
|
|
|
| ||||||
4.25%, 3/13/13 |
| THB | 39,400 |
| 1,232 |
| |||||
5.25%, 7/13/13 |
| 4,070 |
| 133 |
| ||||||
|
|
|
| 1,365 |
| ||||||
Turkey (9.8%) |
|
|
|
|
| ||||||
Sovereign (9.8%) |
|
|
|
|
| ||||||
Republic of Turkey, |
|
|
|
|
| ||||||
Zero Coupon, 8/5/09 - 6/23/10 |
| TRY | 4,317 |
| 2,348 |
| |||||
16.00%, 3/7/12 |
| 559 |
| 356 |
| ||||||
|
|
|
| 2,704 |
| ||||||
Venezuela (1.5%) |
|
|
|
|
| ||||||
Sovereign (1.5%) |
|
|
|
|
| ||||||
Republic of Venezuela, |
|
|
|
|
| ||||||
9.25%, 5/7/28 |
| $ | 940 |
|
| 400 |
| ||||
Total Debt Instruments (Cost $28,701) |
|
|
| 25,671 |
| ||||||
| The accompanying notes are an integral part of the financial statements. | 89 |
2008 Annual Report |
|
December 31, 2008 |
Portfolio of Investments (cont’d)
Emerging Markets Debt Portfolio
|
| No. of |
| Value |
| |
|
| Warrants |
| (000) |
| |
Warrants (0.0%) |
|
|
|
|
| |
Venezuela (0.0%) |
|
|
|
|
| |
Republic of Venezuela, Oil-Linked Payment Obligation, expires 4/15/20 (Cost $—) |
| 495 |
| $ | 13 |
|
|
|
|
|
|
| |
|
| Shares |
|
|
| |
Short-Term Investment (13.3%) |
|
|
|
|
| |
Investment Company (13.3%) |
|
|
|
|
| |
Morgan Stanley Institutional Liquidity Money Market Portfolio — Institutional Class |
| 3,665,444 |
| 3,665 |
| |
Total Investments (106.2%) (Cost $32,366) |
|
|
| 29,349 |
| |
Liabilities in Excess of Other Assets (-6.2%) |
|
|
| (1,722 | ) | |
Net Assets (100%) |
|
|
| $ | 27,627 |
|
(e) 144A security — Certain conditions for public sale may exist. Unless otherwise noted, these securities are deemed to be liquid.
(h) Variable/Floating Rate Security — Interest rate changes on these instruments are based on changes in a designated base rate. The rates shown are those in effect on December 31, 2008.
(o) See Note G to the financial statements regarding investment in Morgan Stanley Institutional Liquidity Money Market Portfolio — Institutional Class.
@ Face Amount/Value is less than $500.
Foreign Currency Exchange Contract Information:
The Portfolio had the following foreign currency exchange contract(s) open at period end:
|
|
|
|
|
|
|
|
|
| Net |
| |||||||||||
Currency |
|
|
|
|
| In |
|
|
| Unrealized |
| |||||||||||
to |
|
|
|
|
| Exchange |
|
|
| Appreciation |
| |||||||||||
Deliver |
| Value |
| Settlement |
| For |
| Value |
| (Depreciation) |
| |||||||||||
(000) |
| (000) |
| Date |
| (000) |
| (000) |
| (000) |
| |||||||||||
BRL | 1,090 |
|
| $ | 467 |
|
| 1/5/09 |
| USD | 470 |
|
| $ 470 |
|
|
| $ | 3 |
|
| |
MXN | 6,580 |
|
| 476 |
|
| 1/2/09 |
| USD | 500 |
|
| 500 |
|
|
| 24 |
|
| |||
USD | 348 |
|
| 348 |
|
| 1/2/09 |
| BRL | 837 |
|
| 359 |
|
|
| 11 |
|
| |||
USD | 456 |
|
| 456 |
|
| 1/5/09 |
| BRL | 1,090 |
|
| 467 |
|
|
| 11 |
|
| |||
USD | 139 |
|
| 139 |
|
| 1/12/09 |
| EUR | 108 |
|
| 150 |
|
|
| 11 |
|
| |||
USD | 351 |
|
| 351 |
|
| 1/5/09 |
| HUF | 65,336 |
|
| 342 |
|
|
| (9 | ) |
| |||
USD | 498 |
|
| 498 |
|
| 1/2/09 |
| MXN | 6,700 |
|
| 484 |
|
|
| (14 | ) |
| |||
USD | 487 |
|
| 487 |
|
| 1/2/09 |
| MXN | 6,580 |
|
| 475 |
|
|
| (12 | ) |
| |||
USD | 138 |
|
| 138 |
|
| 1/12/09 |
| MXN | 1,880 |
|
| 135 |
|
|
| (3 | ) |
| |||
USD | 497 |
|
| 497 |
|
| 1/23/09 |
| MXN | 6,580 |
|
| 472 |
|
|
| (25 | ) |
| |||
USD | 256 |
|
| 256 |
|
| 1/5/09 |
| PLN | 754 |
|
| 255 |
|
|
| (1 | ) |
| |||
USD | 250 |
|
| 250 |
|
| 1/5/09 |
| TRY | 382 |
|
| 248 |
|
|
| (2 | ) |
| |||
|
|
| $ | 4,363 |
|
|
|
|
|
|
| $4,357 |
|
|
| $ | (6 | ) |
| |||
BRL | — Brazilian Real |
COP | — Colombian Peso |
EUR | — Euro |
HUF | — Hungarian Forint |
IDR | — Indonesian Rupiah |
MXN | — Mexican Peso |
MYR | — Malaysian Ringgit |
NGN | — Nigerian Naira |
PEN | — Peruvian Sol |
PLN | — Polish Zloty |
THB | — Thailand Baht |
TRY | — Turkish Lira |
USD | — United States Dollar |
ZAR | — South African Rand |
90 | The accompanying notes are an integral part of the financial statements. |
|
| 2008 Annual Report |
|
|
| December 31, 2008 |
Portfolio of Investments (cont’d)
Emerging Markets Debt Portfolio
Interest Rate Swap Contracts
The Portfolio had the following interest rate swap agreement(s) open at period end:
|
|
|
|
|
|
|
|
|
|
|
| Unrealized |
| |||
|
|
|
|
|
|
|
|
|
| Notional |
| Appreciation |
| |||
|
| Floating Rate |
| Pay/Receive |
| Fixed |
| Termination |
| Amount |
| (Depreciation) |
| |||
Swap Counterparty |
| Index |
| Floating Rate |
| Rate |
| Date |
| (000) |
| (000) |
| |||
JPMorgan Chase |
| 3 Month JIBAR |
| Pay |
| 10.93 | % | 8/26/10 |
| $4,800 |
|
| $ | 18 |
|
|
|
| MXN-TIIE-Banxico |
| Pay |
| 9.41 |
| 7/8/13 |
| 5,500 |
|
| 21 |
|
| |
|
| 3 Month JIBAR |
| Receive |
| 9.67 |
| 8/27/18 |
| 1,300 |
|
| (18 | ) |
| |
|
|
|
|
|
|
|
|
|
|
|
|
| $ | 21 |
|
|
|
|
|
|
|
|
|
|
|
|
|
|
|
|
|
| |
JIBAR | — Johannesburg Interbank Agreed Rate |
MXN-TIIE | — Mexican Inter Bank Equilibrium Interest Rate |
| The accompanying notes are an integral part of the financial statements. | 91 |
2008 Annual Report |
|
December 31, 2008 |
Statements of Assets and Liabilities
|
| Active |
|
|
|
|
|
|
| ||||
|
| International |
| Emerging |
| Global |
| Global Real |
| ||||
|
| Allocation |
| Markets |
| Franchise |
| Estate |
| ||||
|
| Portfolio |
| Portfolio |
| Portfolio |
| Portfolio |
| ||||
|
| (000) |
| (000) |
| (000) |
| (000) |
| ||||
Assets: |
|
|
|
|
|
|
|
|
| ||||
Investments in Securities of Unaffiliated Issuers, at Cost: |
| $ | 701,822 |
| $ | 1,793,293 |
| $ | 91,641 |
| $ | 957,620 |
|
Investment in Securities of Affiliated Issuers, at Cost: |
| 106,598 |
| 175,589 |
| 2,897 |
| 48,466 |
| ||||
Total Investments in Securities, at Cost: |
| 808,420 |
| 1,968,882 |
| 94,538 |
| 1,006,086 |
| ||||
Foreign Currency, at Cost: |
| 2,058 |
| 3,146 |
| 109 |
| 1,790 |
| ||||
Investments in Securities of Unaffiliated Issuers, at Value:(1) |
| 574,771 |
| 1,232,394 |
| 78,164 |
| 513,835 |
| ||||
Investment in Securities of Affiliated Issuers, at Value: |
| 102,862 |
| 183,366 |
| 2,897 |
| 48,466 |
| ||||
Total Investments in Securities, at Value: |
| 677,633 |
| 1,415,760 |
| 81,061 |
| 562,301 |
| ||||
Foreign Currency, at Value: |
| 2,051 |
| 3,194 |
| 111 |
| 1,780 |
| ||||
Cash |
| — |
| — |
| 31 |
| — |
| ||||
Due from Broker |
| 3,141 |
| — |
| — |
| — |
| ||||
Receivable for Portfolio Shares Sold |
| 237 |
| 2,914 |
| — |
| 501 |
| ||||
Receivable for Investments Sold |
| 13,883 |
| 2,536 |
| — |
| 4,264 |
| ||||
Unrealized Appreciation on Foreign Currency Exchange Contracts |
| 5,007 |
| 569 |
| 369 |
| — | @ | ||||
Tax Reclaim Receivable |
| 53 |
| 1,068 |
| 90 |
| 261 |
| ||||
Receivable from Affiliates |
| 8 |
| 54 |
| 4 |
| 10 |
| ||||
Capital Gain Country Tax Receivable |
| 5 |
| — |
| — |
| — |
| ||||
Dividends Receivable |
| 833 |
| 2,087 |
| 108 |
| 2,650 |
| ||||
Interest Receivable |
| 37 |
| — |
| — |
| — |
| ||||
Other Assets |
| 10 |
| 25 |
| 1 |
| 10 |
| ||||
Total Assets |
| 702,898 |
| 1,428,207 |
| 81,775 |
| 571,777 |
| ||||
Liabilities: |
|
|
|
|
|
|
|
|
| ||||
Collateral on Securities Loaned, at Value: |
| 121,776 |
| 151,208 |
| — |
| 50,999 |
| ||||
Unrealized Depreciation on Foreign Currency Exchange Contracts |
| 4,836 |
| 8 |
| — |
| 8 |
| ||||
Payable for Investments Purchased |
| — |
| 11,911 |
| 35 |
| — |
| ||||
Bank Overdraft |
| 1,283 |
| — |
| — |
| 133 |
| ||||
Payable for Portfolio Shares Redeemed |
| 1,010 |
| 359 |
| 603 |
| 547 |
| ||||
Payable for Investment Advisory Fees |
| 791 |
| 3,827 |
| 149 |
| 1,168 |
| ||||
Payable for Administration Fees |
| 38 |
| 82 |
| 5 |
| 33 |
| ||||
Payable for Custodian Fees |
| 68 |
| 717 |
| 5 |
| 58 |
| ||||
Payable for Directors’ Fees and Expenses |
| 8 |
| 32 |
| 1 |
| 1 |
| ||||
Payable for Transfer Agent Fees |
| 5 |
| 11 |
| 4 |
| 8 |
| ||||
Payable for Shareholder Servicing Fees — Class P |
| 1 |
| 14 |
| 1 |
| 8 |
| ||||
Payable for Shareholder Servicing Fees — Class H |
| — |
| — |
| — |
| — | @ | ||||
Payable for Distribution and Shareholder Servicing Fees — Class L |
| — |
| — |
| — |
| — | @ | ||||
Payable for Sub Transfer Agency Fees — Class I |
| 23 |
| 962 |
| 22 |
| 39 |
| ||||
Payable for Sub Transfer Agency Fees — Class P |
| 1 |
| 71 |
| 2 |
| 2 |
| ||||
Payable for Transfer Agency Fees — Class H |
| — |
| — |
| — |
| — | @ | ||||
Payable for Transfer Agency Fees — Class L |
| — |
| — |
| — |
| — | @ | ||||
Other Liabilities |
| 131 |
| 247 |
| 27 |
| 107 |
| ||||
Total Liabilities |
| 129,971 |
| 169,449 |
| 854 |
| 53,111 |
| ||||
Net Assets |
| $ | 572,927 |
| $ | 1,258,758 |
| $ | 80,921 |
| $ | 518,666 |
|
Net Assets Consist Of: |
|
|
|
|
|
|
|
|
| ||||
Paid-in Capital |
| $ | 733,790 |
| $ | 2,069,937 |
| $ | 94,167 |
| $ | 1,078,666 |
|
Undistributed (Distributions in Excess of) Net Investment Income |
| 903 |
| (8,440 | ) | 689 |
| (132 | ) | ||||
Accumulated Net Realized Loss |
| (31,305 | ) | (250,086 | ) | (837 | ) | (116,001 | ) | ||||
Unrealized Appreciation (Depreciation) on: |
|
|
|
|
|
|
|
|
| ||||
Investments |
| (130,787 | ) | (553,122 | ) | (13,477 | ) | (443,785 | ) | ||||
Foreign Currency Exchange Contracts and Translations |
| 98 |
| 469 |
| 379 |
| (82 | ) | ||||
Futures Contracts |
| 228 |
| — |
| — |
| — |
| ||||
Net Assets |
| $ | 572,927 |
| $ | 1,258,758 |
| $ | 80,921 |
| $ | 518,666 |
|
92 | The accompanying notes are an integral part of the financial statements. |
|
| 2008 Annual Report |
|
|
| December 31, 2008 |
Statements of Assets and Liabilities
|
| Active |
|
|
|
|
|
|
| |||||
|
| International |
| Emerging |
| Global |
| Global Real |
| |||||
|
| Allocation |
| Markets |
| Franchise |
| Estate |
| |||||
|
| Portfolio |
| Portfolio |
| Portfolio |
| Portfolio |
| |||||
|
| (000) |
| (000) |
| (000) |
| (000) |
| |||||
CLASS I: |
|
|
|
|
|
|
|
|
| |||||
Net Assets |
| $ | 565,313 |
| $ | 1,191,199 |
| $ | 78,029 |
| $ | 473,459 |
| |
Shares Outstanding $0.001 par value shares of beneficial interest(500,000,000 shares authorized) (not in 000’s) |
| 62,085,367 |
| 86,372,818 |
| 7,211,644 |
| 86,199,530 |
| |||||
Net Asset Value, Offering and Redemption Price Per Share |
| $ | 9.11 |
| $ | 13.79 |
| $ | 10.82 |
| $ | 5.49 |
| |
CLASS P: |
|
|
|
|
|
|
|
|
| |||||
Net Assets |
| $ | 7,614 |
| $ | 67,559 |
| $ | 2,892 |
| $ | 44,555 |
| |
Shares Outstanding $0.001 par value shares of beneficial interest (500,000,000 shares authorized) (not in 000’s) |
| 821,677 |
| 5,000,693 |
| 270,080 |
| 8,137,881 |
| |||||
Net Asset Value, Offering and Redemption Price Per Share |
| $ | 9.27 |
| $ | 13.51 |
| $ | 10.71 |
| $ | 5.47 |
| |
CLASS H: |
|
|
|
|
|
|
|
|
| |||||
Net Assets |
| $ | — |
| $ | — |
| $ | — |
| $ | 391 |
| |
Shares Outstanding $0.001 par value shares of beneficial interest (500,000,000 shares authorized) (not in 000’s) |
| — |
| — |
| — |
| 71,541 |
| |||||
Net Asset Value and Redemption Price Per Share |
| $ | — |
| $ | — |
| $ | — |
| $ | 5.47 |
| |
Maximum Sales Load |
| — |
| — |
| — |
| 4.75 | % | |||||
Maximum Sales Charge |
| $ | — |
| $ | — |
| $ | — |
| $ | 0.27 |
| |
Maximum Offering Price Per Share |
| $ | — |
| $ | — |
| $ | — |
| $ | 5.74 |
| |
CLASS L: |
|
|
|
|
|
|
|
|
| |||||
Net Assets |
| $ | — |
| $ | — |
| $ | — |
| $ | 261 |
| |
Shares Outstanding $0.001 par value shares of beneficial interest (500,000,000 shares authorized) (not in 000’s) |
| — |
| — |
| — |
| 48,126 |
| |||||
Net Asset Value, Offering and Redemption Price Per Share |
| $ | — |
| $ | — |
| $ | — |
| $ | 5.43 |
| |
|
|
|
|
|
|
|
|
|
|
|
|
|
| |
(1) | Including: |
|
|
|
|
|
|
|
|
| ||||
| Securities on Loan, at Value: |
| $ | 115,931 |
| $ | 142,125 |
| $ | — |
| $ | 48,070 |
|
@ Amount is less than $500. |
|
|
|
|
|
|
|
|
| |||||
| The accompanying notes are an integral part of the financial statements. | 93 |
2008 Annual Report |
|
December 31, 2008 |
Statements of Assets and Liabilities
|
|
|
|
|
| International |
|
|
| ||||||
|
| Global Value |
| International |
| Growth Active |
| International |
| ||||||
|
| Equity |
| Equity |
| Extension |
| Growth Equity |
| ||||||
|
| Portfolio |
| Portfolio |
| Portfolio |
| Portfolio |
| ||||||
|
| (000) |
| (000) |
| (000) |
| (000) |
| ||||||
Assets: |
|
|
|
|
|
|
|
|
| ||||||
Investments in Securities of Unaffiliated Issuers, at Cost: |
| $ | 33,504 |
| $ | 3,880,185 |
| $ | 11,022 |
|
| $ | 73,157 |
|
|
Investment in Securities of Affiliated Issuers, at Cost: |
| 3,499 |
| 376,123 |
| 12 |
|
| 7,810 |
|
| ||||
Total Investments in Securities, at Cost: |
| 37,003 |
| 4,256,308 |
| 11,034 |
|
| 80,967 |
|
| ||||
Foreign Currency, at Cost: |
| 19 |
| 7,627 |
| 6 |
|
| 8 |
|
| ||||
Investments in Securities of Unaffiliated Issuers, at Value: (1) |
| 35,757 |
| 3,147,214 |
| 6,553 |
|
| 42,450 |
|
| ||||
Investment in Securities of Affiliated Issuers, at Value: |
| 3,499 |
| 376,123 |
| 12 |
|
| 7,810 |
|
| ||||
Total Investments in Securities, at Value: |
| 39,256 |
| 3,523,337 |
| 6,565 |
|
| 50,260 |
|
| ||||
Foreign Currency, at Value: |
| 19 |
| 7,573 |
| 6 |
|
| 8 |
|
| ||||
Cash |
| 15 |
| — |
| — |
|
| — |
|
| ||||
Due from Adviser |
| — |
| — |
| 17 |
|
| — |
|
| ||||
Due from Broker |
| — |
| — |
| 166 |
|
| — |
|
| ||||
Receivable for Portfolio Shares Sold |
| 5 |
| 18,954 |
| — |
|
| 16 |
|
| ||||
Receivable for Investments Sold |
| — |
| — |
| 9 |
|
| 57 |
|
| ||||
Unrealized Appreciation on Contracts for Difference Agreements |
| — |
| — |
| 81 |
|
| — |
|
| ||||
Unrealized Appreciation on Foreign Currency Exchange Contracts |
| 131 |
| 31,598 |
| — |
|
| — |
|
| ||||
Tax Reclaim Receivable |
| 2 |
| 598 |
| 1 |
|
| 5 |
|
| ||||
Receivable from Affiliates |
| 3 |
| 156 |
| — | @ |
| 1 |
|
| ||||
Dividends Receivable |
| 60 |
| 1,691 |
| 4 |
|
| 23 |
|
| ||||
Interest Receivable |
| — |
| 8 |
| — |
|
| — |
|
| ||||
Other Assets |
| 1 |
| 63 |
| — | @ |
| 1 |
|
| ||||
Total Assets |
| 39,492 |
| 3,583,978 |
| 6,849 |
|
| 50,371 |
|
| ||||
Liabilities: |
|
|
|
|
|
|
|
|
|
|
| ||||
Collateral on Securities Loaned, at Value: |
| 3,356 |
| 274,728 |
| — |
|
| 8,841 |
|
| ||||
Unrealized Depreciation on Foreign Currency Exchange Contracts |
| — |
| — |
| — | @ |
| — |
|
| ||||
Payable for Investments Purchased |
| 18 |
| — |
| 10 |
|
| — |
|
| ||||
Bank Overdraft |
| — |
| — |
| 46 |
|
| 1 |
|
| ||||
Unrealized Depreciation on Contracts for Difference Agreements |
| — |
| — |
| 9 |
|
| — |
|
| ||||
Payable for Portfolio Shares Redeemed |
| — |
| 6,066 |
| 1 |
|
| 452 |
|
| ||||
Payable for Investment Advisory Fees |
| 49 |
| 6,477 |
| — |
|
| 49 |
|
| ||||
Payable for Administration Fees |
| 3 |
| 212 |
| — | @ |
| 3 |
|
| ||||
Payable for Custodian Fees |
| 4 |
| 243 |
| 7 |
|
| 10 |
|
| ||||
Payable for Directors’ Fees and Expenses |
| 4 |
| 90 |
| — |
|
| 1 |
|
| ||||
Payable for Transfer Agent Fees |
| 4 |
| 21 |
| 4 |
|
| 4 |
|
| ||||
Payable for Shareholder Servicing Fees — Class P |
| 2 |
| 134 |
| — | @ |
| — | @ |
| ||||
Payable for Shareholder Servicing Fees — Class H |
| — |
| — |
| — | @ |
| — |
|
| ||||
Payable for Distribution and Shareholder Servicing Fees — Class L |
| — |
| — |
| — | @ |
| — |
|
| ||||
Payable for Sub Transfer Agency Fees — Class I |
| 21 |
| 1,083 |
| — |
|
| — | @ |
| ||||
Payable for Sub Transfer Agency Fees — Class P |
| 8 |
| 388 |
| — |
|
| — | @ |
| ||||
Payable for Transfer Agency Fees — Class H |
| — |
| — |
| — | @ |
| — |
|
| ||||
Payable for Transfer Agency Fees — Class L |
| — |
| — |
| — | @ |
| — |
|
| ||||
Payable for Dividend Income on Short Positions |
| — |
| — |
| 1 |
|
| — |
|
| ||||
Payable for Securities Sold Short, at Value (Proceeds $2,338) |
| — |
| — |
| 1,729 |
|
| — |
|
| ||||
Other Liabilities |
| 25 |
| 636 |
| 13 |
|
| 17 |
|
| ||||
Total Liabilities |
| 3,494 |
| 290,078 |
| 1,820 |
|
| 9,378 |
|
| ||||
Net Assets |
| $ | 35,998 |
| $ | 3,293,900 |
| $ | 5,029 |
|
| $ | 40,993 |
|
|
Net Assets Consist Of: |
|
|
|
|
|
|
|
|
|
|
| ||||
Paid-in Capital |
| $ | 48,209 |
| $ | 4,162,080 |
| $ | 10,662 |
|
| $ | 81,674 |
|
|
Undistributed (Distributions in Excess of) Net Investment Income |
| 150 |
| 4,431 |
| — | @ |
| (13 | ) |
| ||||
Accumulated Net Realized Loss |
| (14,745 | ) | (171,171 | ) | (1,849 | ) |
| (9,961 | ) |
| ||||
Unrealized Appreciation (Depreciation) on: |
|
|
|
|
|
|
|
|
|
|
| ||||
Investments |
| 2,253 |
| (732,971 | ) | (4,469 | ) |
| (30,707 | ) |
| ||||
Contracts for Difference |
| — |
| — |
| 72 |
|
| — |
|
| ||||
Foreign Currency Exchange Contracts and Translations |
| 131 |
| 31,531 |
| — | @ |
| — | @ |
| ||||
Futures Contracts |
| — |
| — |
| 4 |
|
| — |
|
| ||||
Securities Sold Short |
| — |
| — |
| 609 |
|
| — |
|
| ||||
Net Assets |
| $ | 35,998 |
| $ | 3,293,900 |
| $ | 5,029 |
|
| $ | 40,993 |
|
|
94 | The accompanying notes are an integral part of the financial statements. |
|
| 2008 Annual Report |
|
|
| December 31, 2008 |
|
|
Statements of Assets and Liabilities |
|
|
|
|
|
|
| International |
|
|
| |||||||
|
| Global Value |
| International |
| Growth Active |
| International |
| |||||||
|
| Equity |
| Equity |
| Extension |
| Growth Equity |
| |||||||
|
| Portfolio |
| Portfolio |
| Portfolio |
| Portfolio |
| |||||||
|
| (000) |
| (000) |
| (000) |
| (000) |
| |||||||
CLASS I: |
|
|
|
|
|
|
|
|
|
|
| |||||
Net Assets |
| $ | 24,110 |
| $ | 2,606,704 |
| $ | 4,697 |
|
| $ | 40,756 |
|
| |
Shares Outstanding $0.001 par value shares of beneficial interest (500,000,000 shares authorized) (not in 000’s) |
| 2,541,790 |
| 236,687,734 |
| 990,000 |
|
| 6,063,329 |
|
| |||||
Net Asset Value, Offering and Redemption Price Per Share |
| $ | 9.49 |
| $ | 11.01 |
| $ | 4.74 |
|
| $ | 6.72 |
|
| |
CLASS P: |
|
|
|
|
|
|
|
|
|
|
| |||||
Net Assets |
| $ | 11,888 |
| $ | 687,196 |
| $ | 47 |
|
| $ | 237 |
|
| |
Shares Outstanding $0.001 par value shares of beneficial interest (500,000,000 shares authorized) (not in 000’s) |
| 1,268,600 |
| 63,059,748 |
| 10,000 |
|
| 35,150 |
|
| |||||
Net Asset Value, Offering and Redemption Price Per Share |
| $ | 9.37 |
| $ | 10.90 |
| $ | 4.73 |
|
| $ | 6.74 |
|
| |
CLASS H: |
|
|
|
|
|
|
|
|
|
|
| |||||
Net Assets |
| $ | — |
| $ | — |
| $ | 266 |
|
| $ | — |
|
| |
Shares Outstanding $0.001 par value shares of beneficial interest (500,000,000 shares authorized) (not in 000’s) |
| — |
| — |
| 56,222 |
|
| — |
|
| |||||
Net Asset Value and Redemption Price Per Share |
| $ | — |
| $ | — |
| $ | 4.73 |
|
| $ | — |
|
| |
Maximum Sales Load |
| — |
| — |
| 4.75 | % |
| — |
|
| |||||
Maximum Sales Charge |
| $ | — |
| $ | — |
| $ | 0.24 |
|
| $ | — |
|
| |
Maximum Offering Price Per Share |
| $ | — |
| $ | — |
| $ | 4.97 |
|
| $ | — |
|
| |
CLASS L: |
|
|
|
|
|
|
|
|
|
|
| |||||
Net Assets |
| $ | — |
| $ | — |
| $ | 19 |
|
| $ | — |
|
| |
Shares Outstanding $0.001 par value shares of beneficial interest (500,000,000 shares authorized) (not in 000’s) |
| — |
| — |
| 3,950 |
|
| — |
|
| |||||
Net Asset Value, Offering and Redemption Price Per Share |
| $ | — |
| $ | — |
| $ | 4.70 |
|
| $ | — |
|
| |
(1) Including: |
|
|
|
|
|
|
|
|
|
|
| |||||
Securities on Loan, at Value: |
| $ | 3,217 |
| $ | 261,509 |
| $ | — |
|
| $ | 8,480 |
|
| |
@ Amount is less than $500. |
|
|
|
|
|
|
|
|
|
|
| |||||
| The accompanying notes are an integral part of the financial statements. | 95 |
2008 Annual Report |
|
December 31, 2008 |
Statements of Assets and Liabilities
|
| International |
| International |
|
|
|
|
| |||||||||
|
| Real Estate |
| Small Cap |
| Capital Growth |
| Focus Growth |
| |||||||||
|
| Portfolio |
| Portfolio |
| Portfolio |
| Portfolio |
| |||||||||
|
| (000) |
| (000) |
| (000) |
| (000) |
| |||||||||
Assets: |
|
|
|
|
|
|
|
|
|
|
| |||||||
Investments in Securities of Unaffiliated Issuers, at Cost: |
| $ | 1,025,918 |
| $ | 419,460 |
| $ | 890,175 |
|
| $ | 9,775 |
|
| |||
Investment in Securities of Affiliated Issuers, at Cost: |
| 44,418 |
| 12,029 |
| 11,972 |
|
| 51 |
|
| |||||||
Total Investments in Securities, at Cost: |
| 1,070,336 |
| 431,489 |
| 902,147 |
|
| 9,826 |
|
| |||||||
Foreign Currency, at Cost: |
| 175 |
| 25 |
| 2 |
|
| — |
|
| |||||||
Investments in Securities of Unaffiliated Issuers, at Value:(1) |
| 439,180 |
| 305,591 |
| 593,371 |
|
| 5,973 |
|
| |||||||
Investment in Securities of Affiliated Issuers, at Value: |
| 44,418 |
| 12,029 |
| 11,972 |
|
| 51 |
|
| |||||||
Total Investments in Securities, at Value: |
| 483,598 |
| 317,620 |
| 605,343 |
|
| 6,024 |
|
| |||||||
Foreign Currency, at Value: |
| 175 |
| 26 |
| 2 |
|
| — |
|
| |||||||
Cash |
| — |
| — |
| 4 |
|
| — |
|
| |||||||
Receivable for Portfolio Shares Sold |
| 937 |
| 211 |
| 1,707 |
|
| 1 |
|
| |||||||
Receivable for Investments Sold |
| 1,106 |
| 881 |
| — |
|
| — |
|
| |||||||
Unrealized Appreciation on Foreign Currency Exchange Contracts |
| 5 |
| 1 |
| — |
|
| — |
|
| |||||||
Tax Reclaim Receivable |
| 894 |
| 991 |
| — |
|
| — |
|
| |||||||
Receivable from Affiliates |
| 9 |
| 8 |
| 33 |
|
| — | @ |
| |||||||
Dividends Receivable |
| 723 |
| 658 |
| 139 |
|
| 1 |
|
| |||||||
Other Assets |
| 8 |
| 6 |
| 14 |
|
| — | @ |
| |||||||
Total Assets |
| 487,455 |
| 320,402 |
| 607,242 |
|
| 6,026 |
|
| |||||||
Liabilities: |
|
|
|
|
|
|
|
|
|
|
| |||||||
Collateral on Securities Loaned, at Value: |
| 48,749 |
| — |
| — |
|
| — |
|
| |||||||
Unrealized Depreciation on Foreign Currency Exchange Contracts |
| — |
| 8 |
| — |
|
| — |
|
| |||||||
Payable for Investments Purchased |
| 96 |
| 357 |
| — |
|
| — |
|
| |||||||
Payable for Portfolio Shares Redeemed |
| 1,018 |
| 2,426 |
| 2,284 |
|
| 40 |
|
| |||||||
Payable for Investment Advisory Fees |
| 981 |
| 749 |
| 852 |
|
| 8 |
|
| |||||||
Payable for Administration Fees |
| 29 |
| 21 |
| 41 |
|
| 1 |
|
| |||||||
Payable for Custodian Fees |
| 63 |
| 48 |
| 31 |
|
| 2 |
|
| |||||||
Payable for Directors’ Fees and Expenses |
| — |
| 8 |
| 21 |
|
| 4 |
|
| |||||||
Payable for Transfer Agent Fees |
| 14 |
| 4 |
| 8 |
|
| 4 |
|
| |||||||
Payable for Shareholder Servicing Fees — Class P |
| 2 |
| — | @ | 13 |
|
| — | @ |
| |||||||
Payable for Sub Transfer Agency Fees — Class I |
| 59 |
| 33 |
| 36 |
|
| 4 |
|
| |||||||
Payable for Sub Transfer Agency Fees — Class P |
| 18 |
| — |
| 27 |
|
| 1 |
|
| |||||||
Other Liabilities |
| 137 |
| 103 |
| 205 |
|
| 14 |
|
| |||||||
Total Liabilities |
| 51,166 |
| 3,757 |
| 3,518 |
|
| 78 |
|
| |||||||
Net Assets |
| $ | 436,289 |
| $ | 316,645 |
| $ | 603,724 |
|
| $ | 5,948 |
|
| |||
Net Assets Consist Of: |
|
|
|
|
|
|
|
|
|
|
| |||||||
Paid-in Capital |
| $ | 1,188,083 |
| $ | 524,678 |
| $ | 1,011,773 |
|
| $ | 26,605 |
|
| |||
Undistributed (Distributions in Excess of) Net Investment Income |
| (2,134 | ) | 713 |
| (39 | ) |
| (5 | ) |
| |||||||
Accumulated Net Realized Loss |
| (162,652 | ) | (94,978 | ) | (111,206 | ) |
| (16,850 | ) |
| |||||||
Unrealized Appreciation (Depreciation) on: |
|
|
|
|
|
|
|
|
|
|
| |||||||
Investments |
| (586,739 | ) | (113,869 | ) | (296,804 | ) |
| (3,802 | ) |
| |||||||
Foreign Currency Exchange Contracts and Translations |
| (269 | ) | 101 |
| — | @ |
| — |
|
| |||||||
Net Assets |
| $ | 436,289 |
| $ | 316,645 |
| $ | 603,724 |
|
| $ | 5,948 |
|
| |||
CLASS I: |
|
|
|
|
|
|
|
|
|
|
| |||||||
Net Assets |
| $ | 427,148 |
| $ | 316,526 |
| $ | 543,841 |
|
| $ | 4,879 |
|
| |||
Shares Outstanding $0.001 par value shares of beneficial interest (500,000,000 shares authorized) (not in 000’s) |
| 33,920,543 |
| 33,206,836 |
| 44,879,158 |
|
| 544,938 |
|
| |||||||
Net Asset Value, Offering and Redemption Price Per Share |
| $ | 12.59 |
| $ | 9.53 |
| $ | 12.12 |
|
| $ | 8.95 |
|
| |||
CLASS P: |
|
|
|
|
|
|
|
|
|
|
| |||||||
Net Assets |
| $ | 9,141 |
| $ | 119 |
| $ | 59,883 |
|
| $ | 1,069 |
|
| |||
Shares Outstanding $0.001 par value shares of beneficial interest (500,000,000 shares authorized) (not in 000’s) |
| 726,812 |
| 12,531 |
| 5,014,582 |
|
| 122,403 |
|
| |||||||
Net Asset Value, Offering and Redemption Price Per Share |
| $ | 12.58 |
| $ | 9.53 |
| $ | 11.94 |
|
| $ | 8.73 |
|
| |||
(1) Including: |
|
|
|
|
|
|
|
|
|
|
| |||||||
Securities on Loan, at Value: |
| $ | 46,081 |
| $ | — | �� | $ | — |
|
| $ | — |
|
| |||
@ Amount is less than $500. |
|
|
|
|
|
|
|
|
|
|
| |||||||
96 | The accompanying notes are an integral part of the financial statements. |
|
| 2008 Annual Report |
|
|
| December 31, 2008 |
Statements of Assets and Liabilities |
|
|
| Large Cap |
| Small Company |
|
|
| U.S. Small/Mid |
| ||||||||
|
| Relative Value |
| Growth |
| U.S. Real Estate |
| Cap Value |
| ||||||||
|
| Portfolio |
| Portfolio |
| Portfolio |
| Portfolio |
| ||||||||
|
| (000) |
| (000) |
| (000) |
| (000) |
| ||||||||
Assets: |
|
|
|
|
|
|
|
|
| ||||||||
Investments in Securities of Unaffiliated Issuers, at Cost: |
| $ | 223,119 |
| $ | 1,446,536 |
| $ | 836,310 |
| $ | 21,452 |
| ||||
Investment in Securities of Affiliated Issuers, at Cost: |
| 10,552 |
| 17,235 |
| 110,843 |
| 861 |
| ||||||||
Total Investments in Securities, at Cost: |
| 233,671 |
| 1,463,771 |
| 947,153 |
| 22,313 |
| ||||||||
Foreign Currency, at Cost: |
| — |
| 2 |
| — | @ | — |
| ||||||||
Investments in Securities of Unaffiliated Issuers, at Value:(1) |
| 175,013 |
| 976,816 |
| 559,698 |
| 15,642 |
| ||||||||
Investment in Securities of Affiliated Issuers, at Value: |
| 10,371 |
| 17,235 |
| 110,843 |
| 861 |
| ||||||||
Total Investments in Securities, at Value: |
| 185,384 |
| 994,051 |
| 670,541 |
| 16,503 |
| ||||||||
Foreign Currency, at Value: |
| — |
| 1 |
| — |
| — |
| ||||||||
Cash |
| — |
| — |
| 286 |
| — |
| ||||||||
Receivable for Portfolio Shares Sold |
| 169 |
| 2,112 |
| 1,521 |
| — | @ | ||||||||
Receivable for Investments Sold |
| 223 |
| — |
| 2,332 |
| 60 |
| ||||||||
Receivable from Affiliates |
| 13 |
| 17 |
| 2 |
| 1 |
| ||||||||
Dividends Receivable |
| 299 |
| 136 |
| 5,818 |
| 11 |
| ||||||||
Interest Receivable |
| — |
| — |
| — |
| 2 |
| ||||||||
Other Assets |
| 4 |
| 19 |
| 12 |
| 21 |
| ||||||||
Total Assets |
| 186,092 |
| 996,336 |
| 680,512 |
| 16,598 |
| ||||||||
Liabilities: |
|
|
|
|
|
|
|
|
| ||||||||
Collateral on Securities Loaned, at Value: |
| — |
| — |
| 131,746 |
| — |
| ||||||||
Payable for Investments Purchased |
| 546 |
| 739 |
| — |
| 2 |
| ||||||||
Payable for Portfolio Shares Redeemed |
| 235 |
| 8,914 |
| 2,450 |
| — | @ | ||||||||
Payable for Investment Advisory Fees |
| 229 |
| 2,274 |
| 1,158 |
| 27 |
| ||||||||
Payable for Administration Fees |
| 12 |
| 64 |
| 35 |
| 1 |
| ||||||||
Payable for Custodian Fees |
| 7 |
| 12 |
| 8 |
| 2 |
| ||||||||
Payable for Directors’ Fees and Expenses |
| 10 |
| 6 |
| 10 |
| — |
| ||||||||
Payable for Transfer Agent Fees |
| 7 |
| 23 |
| 20 |
| 3 |
| ||||||||
Payable for Shareholder Servicing Fees — Class P |
| 7 |
| 70 |
| 19 |
| — |
| ||||||||
Payable for Sub Transfer Agency Fees — Class I |
| 82 |
| 23 |
| 69 |
| — |
| ||||||||
Payable for Sub Transfer Agency Fees — Class P |
| 21 |
| 84 |
| 6 |
| — |
| ||||||||
Other Liabilities |
| 55 |
| 266 |
| 266 |
| 13 |
| ||||||||
Total Liabilities |
| 1,211 |
| 12,475 |
| 135,787 |
| 48 |
| ||||||||
Net Assets |
| $ | 184,881 |
| $ | 983,861 |
| $ | 544,725 |
| $ | 16,550 |
| ||||
Net Assets Consist Of: |
|
|
|
|
|
|
|
|
| ||||||||
Paid-in Capital |
| $ | 296,170 |
| $ | 1,476,727 |
| $ | 905,894 |
| $ | 27,000 |
| ||||
Undistributed (Distributions in Excess of) Net Investment Income |
| 22 |
| (24 | ) | 258 |
| 1 |
| ||||||||
Accumulated Net Realized Loss |
| (63,024 | ) | (23,122 | ) | (84,815 | ) | (4,641 | ) | ||||||||
Unrealized Appreciation (Depreciation) on: |
| (48,287 | ) | (469,720 | ) | (276,612 | ) | (5,810 | ) | ||||||||
Foreign Currency Exchange Contracts and Translations |
| — |
| — | @ | — | @ | — |
| ||||||||
Net Assets |
| $ | 184,881 |
| $ | 983,861 |
| $ | 544,725 |
| $ | 16,550 |
| ||||
CLASS I: |
|
|
|
|
|
|
|
|
| ||||||||
Net Assets |
| $ | 150,025 |
| $ | 638,559 |
| $ | 448,897 |
| $ | 16,492 |
| ||||
Shares Outstanding $0.001 par value shares of beneficial interest (500,000,000 shares authorized) (not in 000’s) |
| 19,110,237 |
| 83,633,371 |
| 50,590,945 |
| 2,813,394 |
| ||||||||
Net Asset Value, Offering and Redemption Price Per Share |
| $ | 7.85 |
| $ | 7.64 |
| $ | 8.87 |
| $ | 5.86 |
| ||||
CLASS P: |
|
|
|
|
|
|
|
|
| ||||||||
Net Assets |
| $ | 34,856 |
| $ | 345,302 |
| $ | 95,828 |
| $ | 58 |
| ||||
Shares Outstanding $0.001 par value shares of beneficial interest (500,000,000 shares authorized) (not in 000’s) |
| 4,443,185 |
| 48,028,593 |
| 10,976,391 |
| 10,000 |
| ||||||||
Net Asset Value, Offering and Redemption Price Per Share |
| $ | 7.84 |
| $ | 7.19 |
| $ | 8.73 |
| $ | 5.84 |
| ||||
(1) Including: |
|
|
|
|
|
|
|
|
| ||||||||
Securities on Loan, at Value: |
| $ | — |
| $ | — |
| $ | 128,396 |
| $ | — |
| ||||
@ Amount is less than $500. |
|
|
|
|
|
|
|
|
| ||||||||
| The accompanying notes are an integral part of the financial statements. | 97 |
2008 Annual Report |
|
|
|
December 31, 2008 |
|
Statements of Assets and Liabilities
|
| Emerging |
| ||
|
| Markets Debt |
| ||
|
| Portfolio |
| ||
|
| (000) |
| ||
Assets: |
|
|
| ||
Investments in Securities of Unaffiliated Issuers, at Cost: |
| $ | 28,701 |
| |
Investment in Securities of Affiliated Issuers, at Cost: |
| 3,665 |
| ||
Total Investments in Securities, at Cost: |
| 32,366 |
| ||
Foreign Currency, at Cost: |
| 50 |
| ||
Investments in Securities of Unaffiliated Issuers, at Value:(1) |
| 25,684 |
| ||
Investment in Securities of Affiliated Issuers, at Value: |
| 3,665 |
| ||
Total Investments in Securities, at Value: |
| 29,349 |
| ||
Foreign Currency, at Value: |
| 47 |
| ||
Due from Adviser |
| 49 |
| ||
Receivable for Portfolio Shares Sold |
| 58 |
| ||
Unrealized Appreciation on Swap Agreements |
| 39 |
| ||
Unrealized Appreciation on Foreign Currency Exchange Contracts |
| 60 |
| ||
Receivable from Affiliates |
| — | @ | ||
Dividends Receivable |
| 2 |
| ||
Interest Receivable |
| 633 |
| ||
Other Assets |
| — | @ | ||
Total Assets |
| 30,237 |
| ||
Liabilities: |
|
|
| ||
Unrealized Depreciation on Foreign Currency Exchange Contracts |
| 66 |
| ||
Payable for Investments Purchased |
| 2,449 |
| ||
Bank Overdraft |
| — | @ | ||
Unrealized Depreciation on Swap Agreements |
| 18 |
| ||
Payable for Administration Fees |
| 2 |
| ||
Payable for Custodian Fees |
| 35 |
| ||
Payable for Directors’ Fees and Expenses |
| 4 |
| ||
Payable for Transfer Agent Fees |
| 5 |
| ||
Payable for Shareholder Servicing Fees — Class P |
| 1 |
| ||
Payable for Shareholder Servicing Fees — Class H |
| — | @ | ||
Payable for Distribution and Shareholder Servicing Fees — Class L |
| — | @ | ||
Payable for Sub Transfer Agency Fees — Class I |
| — | @ | ||
Payable for Sub Transfer Agency Fees — Class P |
| — | @ | ||
Payable for Transfer Agency Fees — Class H |
| — | @ | ||
Payable for Transfer Agency Fees — Class L |
| — | @ | ||
Other Liabilities |
| 30 |
| ||
Total Liabilities |
| 2,610 |
| ||
Net Assets |
| $ | 27,627 |
| |
Net Assets Consist Of: |
|
|
| ||
Paid-in Capital |
| $ | 32,377 |
| |
Undistributed Net Investment Income |
| 4 |
| ||
Accumulated Net Realized Loss |
| (1,702 | ) | ||
Unrealized Appreciation (Depreciation) on: |
| (3,017 | ) | ||
Foreign Currency Exchange Contracts and Translations |
| (56 | ) | ||
Swap Agreements |
| 21 |
| ||
Net Assets |
| $ | 27,627 |
| |
98 | The accompanying notes are an integral part of the financial statements. |
|
| 2008 Annual Report |
|
|
| December 31, 2008 |
Statements of Assets and Liabilities
|
| Emerging |
| |||
|
| Markets Debt |
| |||
|
| Portfolio |
| |||
|
| (000) |
| |||
CLASS I: |
|
|
| |||
Net Assets |
| $ | 21,887 |
| ||
Shares Outstanding $0.001 par value shares of beneficial interest (500,000,000 shares authorized) (not in 000’s)† |
| 2,202,505 |
| |||
Net Asset Value, Offering and Redemption Price Per Share |
| $ | 9.94 |
| ||
CLASS P: |
|
|
| |||
Net Assets |
| $ | 3,640 |
| ||
Shares Outstanding $0.001 par value shares of beneficial interest (500,000,000 shares authorized) (not in 000’s)† |
| 357,603 |
| |||
Net Asset Value, Offering and Redemption Price Per Share |
| $ | 10.18 |
| ||
CLASS H: |
|
|
| |||
Net Assets |
| $ | 1,758 |
| ||
Shares Outstanding $0.001 par value shares of beneficial interest (500,000,000 shares authorized) (not in 000’s)† |
| 172,791 |
| |||
Net Asset Value and Redemption Price Per Share |
| $ | 10.18 |
| ||
Maximum Sales Load |
| 3.50 | % | |||
Maximum Sales Charge |
| $ | 0.37 |
| ||
Maximum Offering Price Per Share |
| $ | 10.55 |
| ||
CLASS L: |
|
|
| |||
Net Assets |
| $ | 342 |
| ||
Shares Outstanding $0.001 par value shares of beneficial interest (500,000,000 shares authorized) (not in 000’s)† |
| 33,885 |
| |||
Net Asset Value, Offering and Redemption Price Per Share |
| $ | 10.09 |
| ||
@ | Amount is less than $500. | |||||
† | $ 0.003 par value shares of beneficial interest for Emerging Markets Debt Portfolio. | |||||
| The accompanying notes are an integral part of the financial statements. | 99 |
2008 Annual Report |
|
December 31, 2008 |
Statements of Operations
For the Year Ended December 31, 2008
|
| Active |
|
|
|
|
|
|
| Global |
| |||||||||||||
|
| International |
| Emerging |
| Global |
| Global Real |
| Value |
| |||||||||||||
|
| Allocation |
| Markets |
| Franchise |
| Estate |
| Equity |
| |||||||||||||
|
| Portfolio |
| Portfolio |
| Portfolio |
| Portfolio |
| Portfolio |
| |||||||||||||
|
| (000) |
| (000) |
| (000) |
| (000) |
| (000) |
| |||||||||||||
Investment Income: |
|
|
|
|
|
|
|
|
|
|
| |||||||||||||
Dividends from Securities of Unaffiliated Issuers |
| $ | 27,188 |
| $ | 55,427 |
| $ | 3,803 |
| $ | 21,967 |
| $ | 2,142 |
| ||||||||
Dividends from Securities of Affiliated Issuers |
| 3,097 |
| 2,320 |
| 89 |
| 762 |
| 56 |
| |||||||||||||
Interest from Securities of Unaffiliated Issuers |
| 1,999 |
| 1,289 |
| 3 |
| 146 |
| 41 |
| |||||||||||||
Less: Foreign Taxes Withheld |
| (2,357 | ) | (4,938 | ) | (265 | ) | (876 | ) | (109 | ) | |||||||||||||
Total Investment Income |
| 29,927 |
| 54,098 |
| 3,630 |
| 21,999 |
| 2,130 |
| |||||||||||||
Expenses: |
|
|
|
|
|
|
|
|
|
|
| |||||||||||||
Investment Advisory Fees (Note B) |
| 5,556 |
| 28,482 |
| 832 |
| 6,238 |
| 372 |
| |||||||||||||
Administration Fees (Note C) |
| 685 |
| 1,962 |
| 83 |
| 588 |
| 44 |
| |||||||||||||
Custodian Fees (Note F) |
| 328 |
| 3,073 |
| 26 |
| 253 |
| 23 |
| |||||||||||||
Directors’ Fees and Expenses |
| 11 |
| 27 |
| 3 |
| 13 |
| — |
| |||||||||||||
Professional Fees |
| 49 |
| 119 |
| 30 |
| 176 |
| 31 |
| |||||||||||||
Shareholder Reporting Fees |
| 273 |
| 382 |
| 18 |
| 198 |
| 24 |
| |||||||||||||
Shareholder Servicing Fees — Class P (Note D) |
| 12 |
| 313 |
| 11 |
| 51 |
| 43 |
| |||||||||||||
Shareholder Servicing Fees — Class H (Note D) |
| — |
| — |
| — |
| 1 |
| — |
| |||||||||||||
Distribution and Shareholder Servicing Fees — Class L (Note D) |
| — |
| — |
| — |
| 1 |
| — |
| |||||||||||||
Sub Transfer Agency Fees — Class I |
| 23 |
| 827 |
| 16 |
| — |
| 16 |
| |||||||||||||
Sub Transfer Agency Fees — Class P |
| — | @ | 44 |
| 1 |
| — |
| 7 |
| |||||||||||||
Transfer Agency Fees (Note E) |
| 14 |
| 30 |
| 8 |
| 15 |
| 9 |
| |||||||||||||
Registration Fees |
| 73 |
| 68 |
| 26 |
| 152 |
| 28 |
| |||||||||||||
Country Tax Expense# |
| — | @ | 2 |
| — |
| — |
| — |
| |||||||||||||
Other Expenses |
| 39 |
| 74 |
| 12 |
| 29 |
| 12 |
| |||||||||||||
Expenses Before Non Operating Expenses |
| 7,063 |
| 35,403 |
| 1,066 |
| 7,715 |
| 609 |
| |||||||||||||
Bank Overdraft Expense |
| 3 |
| 53 |
| — | @ | 5 |
| 2 |
| |||||||||||||
Investment Related Expenses |
| — |
| — |
| — |
| 79 |
| — |
| |||||||||||||
Transfer Agency Fees — Class H (Note E) |
| — |
| — |
| — |
| 2 |
| — |
| |||||||||||||
Transfer Agency Fees — Class L (Note E) |
| — |
| — |
| — |
| — | @ | — |
| |||||||||||||
Total Expenses |
| 7,066 |
| 35,456 |
| 1,066 |
| 7,801 |
| 611 |
| |||||||||||||
Voluntary Waiver of Investment Advisory Fees (Note B) |
| (202 | ) | — |
| (15 | ) | (4 | ) | (13 | ) | |||||||||||||
Rebate from Morgan Stanley Affiliated Cash Sweep (Note G) |
| (83 | ) | (54 | ) | (5 | ) | (27 | ) | (1 | ) | |||||||||||||
Expense Offset (Note F) |
| (4 | ) | (11 | ) | — | @ | (5 | ) | — | @ | |||||||||||||
Net Expenses |
| 6,777 |
| 35,391 |
| 1,046 |
| 7,765 |
| 597 |
| |||||||||||||
Net Investment Income |
| 23,150 |
| 18,707 |
| 2,584 |
| 14,234 |
| 1,533 |
| |||||||||||||
Realized Gain (Loss): |
|
|
|
|
|
|
|
|
|
|
| |||||||||||||
Investments Sold |
| 10,065 | * | (214,184 | )* | (751 | ) | (109,327 | ) | (13,757 | ) | |||||||||||||
Foreign Currency Transactions |
| (10,907 | ) | (5,351 | ) | 3,607 |
| (884 | ) | 962 |
| |||||||||||||
Futures Contracts |
| (35,040 | ) | — |
| — |
| — |
| — |
| |||||||||||||
Net Realized Gain (Loss) |
| (35,882 | ) | (219,535 | ) | 2,856 |
| (110,211 | ) | (12,795 | ) | |||||||||||||
Change in Unrealized Appreciation (Depreciation): |
|
|
|
|
|
|
|
|
|
|
| |||||||||||||
Investments |
| (384,461 | )** | (1,629,891 | ) | (40,540 | ) | (373,101 | ) | (17,955 | ) | |||||||||||||
Foreign Currency Exchange Contracts and Translations |
| 737 |
| 359 |
| (19 | ) | (96 | ) | 30 |
| |||||||||||||
Futures Contracts |
| (1,928 | ) | — |
| — |
| — |
| — |
| |||||||||||||
Net Change in Unrealized Appreciation (Depreciation) |
| (385,652 | ) | (1,629,532 | ) | (40,559 | ) | (373,197 | ) | (17,925 | ) | |||||||||||||
Total Net Realized Loss and Change in |
|
|
|
|
|
|
|
|
|
|
| |||||||||||||
Unrealized Appreciation (Depreciation) |
| (421,534 | ) | (1,849,067 | ) | (37,703 | ) | (483,408 | ) | (30,720 | ) | |||||||||||||
Net Decrease in Net Assets Resulting from Operations |
| $ | (398,384 | ) | $ | (1,830,360 | ) | $ | (35,119 | ) | $ | (469,174 | ) | $ | (29,187 | ) | ||||||||
@ |
| Amount is less than $500. | ||||||||||||||||||||||
# |
| CPMF (Provisional Contribution on Financial Transactions) is a Brazilian federal tax imposed on certain banking transactions and account withdrawals. The tax is charged based on the value of the transaction. | ||||||||||||||||||||||
* |
| Net of Capital Gain Country Tax of $224 and $275 for Active International Allocation and Emerging Markets, respectively. | ||||||||||||||||||||||
** |
| Net of decrease in Deferred Capital Gain Country Tax Accrual on unrealized appreciation of $440 for Active International Allocation. | ||||||||||||||||||||||
100 | The accompanying notes are an integral part of the financial statements. |
|
| 2008 Annual Report |
|
|
| December 31, 2008 |
Statements of Operations
For the Year Ended December 31, 2008
|
|
|
| International |
|
|
|
|
|
|
| |||||||||||
|
|
|
| Growth |
| International |
|
|
|
|
| |||||||||||
|
| International |
| Active |
| Growth |
| International |
| International |
| |||||||||||
|
| Equity |
| Extension |
| Equity |
| Real Estate |
| Small Cap |
| |||||||||||
|
| Portfolio |
| Portfolio |
| Portfolio |
| Portfolio |
| Portfolio |
| |||||||||||
|
| (000) |
| (000) |
| (000) |
| (000) |
| (000) |
| |||||||||||
Investment Income: |
|
|
|
|
|
|
|
|
|
|
| |||||||||||
Dividends from Securities of Unaffiliated Issuers |
| $ | 174,790 |
| $ | 422 |
| $ | 2,485 |
| $ | 35,024 |
| $ | 20,709 |
| ||||||
Dividends from Securities of Affiliated Issuers |
| 8,215 |
| 4 |
| 129 |
| 938 |
| 267 |
| |||||||||||
Interest from Securities of Unaffiliated Issuers |
| 4,060 |
| — |
| 61 |
| 293 |
| 32 |
| |||||||||||
Less: Foreign Taxes Withheld |
| (13,791 | ) | (36 | ) | (178 | ) | (2,296 | ) | (1,537 | ) | |||||||||||
Total Investment Income |
| 173,274 |
| 390 |
| 2,497 |
| 33,959 |
| 19,471 |
| |||||||||||
Expenses: |
|
|
|
|
|
|
|
|
|
|
| |||||||||||
Investment Advisory Fees (Note B) |
| 37,736 |
| 99 |
| 486 |
| 7,446 |
| 5,131 |
| |||||||||||
Administration Fees (Note C) |
| 3,777 |
| 7 |
| 52 |
| 746 |
| 433 |
| |||||||||||
Custodian Fees (Note F) |
| 1,047 |
| 28 |
| 57 |
| 323 |
| 199 |
| |||||||||||
Directors’ Fees and Expenses |
| 26 |
| — |
| 2 |
| 20 |
| 7 |
| |||||||||||
Professional Fees |
| 109 |
| 36 |
| 64 |
| 41 |
| 71 |
| |||||||||||
Shareholder Reporting Fees |
| 946 |
| 32 |
| 9 |
| 165 |
| 152 |
| |||||||||||
Shareholder Servicing Fees — Class P (Note D) |
| 2,185 |
| — | @ | 1 |
| 145 |
| — | @ | |||||||||||
Shareholder Servicing Fees — Class H (Note D) |
| — |
| 1 |
| — |
| — |
| — |
| |||||||||||
Distribution and Shareholder Servicing Fees — Class L (Note D) |
| — |
| — | @ | — |
| — |
| — |
| |||||||||||
Sub Transfer Agency Fees — Class I |
| 879 |
| — |
| — | @ | 147 |
| 82 |
| |||||||||||
Sub Transfer Agency Fees — Class P |
| 200 |
| — |
| — | @ | 10 |
| — | @ | |||||||||||
Transfer Agency Fees (Note E) |
| 57 |
| 7 |
| 9 |
| 29 |
| 11 |
| |||||||||||
Registration Fees |
| 67 |
| 48 |
| 26 |
| 50 |
| 42 |
| |||||||||||
Other Expenses |
| 116 |
| 12 |
| 11 |
| 48 |
| 24 |
| |||||||||||
Expenses Before Non Operating Expenses |
| 47,145 |
| 270 |
| 717 |
| 9,170 |
| 6,152 |
| |||||||||||
Bank Overdraft Expense |
| 1 |
| 1 |
| 1 |
| 55 |
| 57 |
| |||||||||||
Dividend Expense on Short Positions |
| — |
| 120 |
| — |
| — |
| — |
| |||||||||||
Stock Loan Fee |
| — |
| 21 |
| — |
| — |
| — |
| |||||||||||
Transfer Agency Fees — Class H (Note E) |
| — |
| 2 |
| — |
| — |
| — |
| |||||||||||
Transfer Agency Fees — Class L (Note E) |
| — |
| — | @ | — |
| — |
| — |
| |||||||||||
Total Expenses |
| 47,146 |
| 414 |
| 718 |
| 9,225 |
| 6,209 |
| |||||||||||
Voluntary Waiver of Investment Advisory Fees (Note B) |
| — |
| (99 | ) | (69 | ) | — |
| — |
| |||||||||||
Expenses Reimbursed by Adviser (Note B) |
| — |
| (63 | ) | — |
| — |
| — |
| |||||||||||
Rebate from Morgan Stanley Affiliated Cash Sweep (Note G) |
| (187 | ) | — | @ | (2 | ) | (24 | ) | (11 | ) | |||||||||||
Voluntary Waiver of Sub Transfer Agent Fees — Class I |
| — |
| — |
| — |
| (147 | ) | (82 | ) | |||||||||||
Voluntary Waiver of Sub Transfer Agent Fees — Class P |
| — |
| — |
| — |
| (10 | ) | — | @ | |||||||||||
Expense Offset (Note F) |
| (2 | ) | — | @ | (1 | ) | (8 | ) | — | @ | |||||||||||
Net Expenses |
| 46,957 |
| 252 |
| 646 |
| 9,036 |
| 6,116 |
| |||||||||||
Net Investment Income |
| 126,317 |
| 138 |
| 1,851 |
| 24,923 |
| 13,355 |
| |||||||||||
Realized Gain (Loss): |
|
|
|
|
|
|
|
|
|
|
| |||||||||||
Investments Sold |
| 15,488 |
| (1,744 | ) | (9,951 | ) | (144,283 | ) | (89,028 | ) | |||||||||||
Foreign Currency Transactions |
| (11,434 | ) | 1 |
| 17 |
| (783 | ) | 733 |
| |||||||||||
Futures Contracts |
| — |
| (20 | ) | — |
| — |
| — |
| |||||||||||
Net Realized Gain (Loss) |
| 4,054 |
| (1,763 | ) | (9,934 | ) | (145,066 | ) | (88,295 | ) | |||||||||||
Change in Unrealized Appreciation (Depreciation): |
|
|
|
|
|
| �� |
|
|
|
| |||||||||||
Investments |
| (1,982,419 | ) | (5,044 | ) | (32,556 | )** | (426,168 | ) | (169,350 | ) | |||||||||||
Contracts for Difference |
| — |
| 72 |
| — |
| — |
| — |
| |||||||||||
Foreign Currency Exchange Contracts and Translations |
| 31,578 |
| — | @ | 19 |
| (243 | ) | (131 | ) | |||||||||||
Futures Contracts |
| — |
| 4 |
| — |
| — |
| — |
| |||||||||||
Securities Sold Short |
| — |
| 423 |
| — |
| — |
| — |
| |||||||||||
Net Change in Unrealized Appreciation (Depreciation) |
| (1,950,841 | ) | (4,545 | ) | (32,537 | ) | (426,411 | ) | (169,481 | ) | |||||||||||
Total Net Realized Loss and Change in |
|
|
|
|
|
|
|
|
|
|
| |||||||||||
Unrealized Appreciation (Depreciation) |
| (1,946,787 | ) | (6,308 | ) | (42,471 | ) | (571,477 | ) | (257,776 | ) | |||||||||||
Net Decrease in Net Assets Resulting from Operations |
| $ | (1,820,470 | ) | $ | (6,170 | ) | $ | (40,620 | ) | $ | (546,554 | ) | $ | (244,421 | ) | ||||||
@ | Amount is less than $500. |
|
|
|
|
|
|
|
|
|
|
| ||||||||||
** | Net of decrease in Deferred Capital Gain Country Tax Accrual on unrealized appreciation of $1 for International Growth Equity. | |||||||||||||||||||||
| The accompanying notes are an integral part of the financial statements. | 101 |
2008 Annual Report |
|
December 31, 2008 |
Statements of Operations
For the Year Ended December 31, 2008
|
|
|
|
|
| Large Cap |
| Small |
|
|
| |||||||
|
| Capital |
| Focus |
| Relative |
| Company |
| U.S. Real |
| |||||||
|
| Growth |
| Growth |
| Value |
| Growth |
| Estate |
| |||||||
|
| Portfolio |
| Portfolio |
| Portfolio |
| Portfolio |
| Portfolio |
| |||||||
|
| (000) |
| (000) |
| (000) |
| (000) |
| (000) |
| |||||||
Investment Income: |
|
|
|
|
|
|
|
|
|
|
| |||||||
Dividends from Securities of Unaffiliated Issuers |
| $ | 9,799 |
| $ | 115 |
| $ | 6,240 |
| $ | 12,731 |
| $ | 27,574 |
| ||
Dividends from Securities of Affiliated Issuers |
| 564 |
| 14 |
| 302 |
| 578 |
| 1,557 |
| |||||||
Interest from Securities of Unaffiliated Issuers |
| 5 |
| — |
| 12 |
| 43 |
| 656 |
| |||||||
Less: Foreign Taxes Withheld |
| (112 | ) | — |
| — |
| (42 | ) | (205 | ) | |||||||
Total Investment Income |
| 10,256 |
| 129 |
| 6,554 |
| 13,310 |
| 29,582 |
| |||||||
Expenses: |
|
|
|
|
|
|
|
|
|
|
| |||||||
Investment Advisory Fees (Note B) |
| 5,781 |
| 63 |
| 1,153 |
| 12,723 |
| 7,247 |
| |||||||
Administration Fees (Note C) |
| 946 |
| 10 |
| 192 |
| 1,137 |
| 751 |
| |||||||
Custodian Fees (Note F) |
| 112 |
| 10 |
| 24 |
| 69 |
| 33 |
| |||||||
Directors’ Fees and Expenses |
| 8 |
| — |
| 1 |
| 23 |
| 12 |
| |||||||
Professional Fees |
| 41 |
| 28 |
| 26 |
| 36 |
| 41 |
| |||||||
Shareholder Reporting Fees |
| 371 |
| 8 |
| 84 |
| 382 |
| 391 |
| |||||||
Shareholder Servicing Fees — Class P (Note D) |
| 309 |
| 5 |
| 103 |
| 1,317 |
| 363 |
| |||||||
Sub Transfer Agency Fees — Class I |
| 36 |
| 4 |
| 69 |
| 274 |
| 74 |
| |||||||
Sub Transfer Agency Fees — Class P |
| 4 |
| 1 |
| 14 |
| 162 |
| 13 |
| |||||||
Transfer Agency Fees (Note E) |
| 19 |
| 7 |
| 15 |
| 43 |
| 39 |
| |||||||
Registration Fees |
| 49 |
| 26 |
| 32 |
| 78 |
| 59 |
| |||||||
Other Expenses |
| 35 |
| 5 |
| 12 |
| 41 |
| 39 |
| |||||||
Expenses Before Non Operating Expenses |
| 7,711 |
| 167 |
| 1,725 |
| 16,285 |
| 9,062 |
| |||||||
Bank Overdraft Expense |
| 7 |
| 1 |
| — | @ | 4 |
| 22 |
| |||||||
Investment Related Expenses |
| — |
| — |
| — |
| — |
| 263 |
| |||||||
Total Expenses |
| 7,718 |
| 168 |
| 1,725 |
| 16,289 |
| 9,347 |
| |||||||
Voluntary Waiver of Investment Advisory Fees (Note B) |
| — |
| (37 | ) | — |
| — |
| — |
| |||||||
Rebate from Morgan Stanley Affiliated Cash Sweep (Note G) |
| (21 | ) | — | @ | (12 | ) | (20 | ) | (37 | ) | |||||||
Voluntary Waiver of Sub Transfer Agent Fees — Class I |
| — |
| — |
| — |
| (274 | ) | (74 | ) | |||||||
Voluntary Waiver of Sub Transfer Agent Fees — Class P |
| — |
| — |
| — |
| (162 | ) | (13 | ) | |||||||
Expense Offset (Note F) |
| (1 | ) | — | @ | (1 | ) | (6 | ) | (1 | ) | |||||||
Net Expenses |
| 7,696 |
| 131 |
| 1,712 |
| 15,827 |
| 9,222 |
| |||||||
Net Investment Income (Loss) |
| 2,560 |
| (2 | ) | 4,842 |
| (2,517 | ) | 20,360 |
| |||||||
Realized Gain (Loss): |
|
|
|
|
|
|
|
|
|
|
| |||||||
Investments Sold |
| (110,540 | ) | (366 | ) | (13,809 | ) | (7,371 | ) | (84,612 | ) | |||||||
Foreign Currency Transactions |
| 55 |
| 3 |
| — | @ | (98 | ) | (12 | ) | |||||||
Futures Contracts |
| — |
| — |
| (7 | ) | — |
| — |
| |||||||
Net Realized Loss |
| (110,485 | ) | (363 | ) | (13,816 | ) | (7,469 | ) | (84,624 | ) | |||||||
Change in Unrealized Appreciation (Depreciation): |
|
|
|
|
|
|
|
|
|
|
| |||||||
Investments |
| (615,295 | ) | (7,132 | ) | (81,222 | ) | (736,061 | ) | (315,804 | ) | |||||||
Foreign Currency Exchange Contracts and Translations |
| — | @ | — | @ | — |
| — | @ | (1 | ) | |||||||
Net Change in Unrealized Appreciation (Depreciation) |
| (615,295 | ) | (7,132 | ) | (81,222 | ) | (736,061 | ) | (315,805 | ) | |||||||
Total Net Realized Loss and Change in |
|
|
|
|
|
|
|
|
|
|
| |||||||
Unrealized Appreciation (Depreciation) |
| (725,780 | ) | (7,495 | ) | (95,038 | ) | (743,530 | ) | (400,429 | ) | |||||||
Net Decrease in Net Assets Resulting from Operations |
| $ | (723,220 | ) | $ | (7,497 | ) | $ | (90,196 | ) | $ | (746,047 | ) | $ | (380,069 | ) | ||
@ Amount is less than $500. |
|
|
|
|
|
|
|
|
|
|
| |||||||
102 | The accompanying notes are an integral part of the financial statements. |
|
| 2008 Annual Report |
|
|
| December 31, 2008 |
Statements of Operations
For the Year Ended December 31, 2008
|
| U.S. |
| Emerging |
| |||||
|
| Small/Mid |
| Markets |
| |||||
|
| Cap Value |
| Debt |
| |||||
|
| Portfolio |
| Portfolio |
| |||||
|
| (000) |
| (000) |
| |||||
Investment Income: |
|
|
|
|
| |||||
Dividends from Securities of Unaffiliated Issuers |
| $ | 207 |
| $ | — |
| |||
Dividends from Securities of Affiliated Issuers |
| 36 |
| 74 |
| |||||
Interest from Securities of Unaffiliated Issuers |
| 7 |
| 3,491 |
| |||||
Less: Foreign Taxes Withheld |
| — |
| (25 | ) | |||||
Total Investment Income |
| 250 |
| 3,540 |
| |||||
Expenses: |
|
|
|
|
| |||||
Investment Advisory Fees (Note B) |
| 141 |
| 269 |
| |||||
Administration Fees (Note C) |
| 17 |
| 29 |
| |||||
Custodian Fees (Note F) |
| 12 |
| 105 |
| |||||
Directors’ Fees and Expenses |
| 1 |
| — |
| |||||
Professional Fees |
| 27 |
| 50 |
| |||||
Shareholder Reporting Fees |
| 6 |
| 50 |
| |||||
Shareholder Servicing Fees — Class P (Note D) |
| — |
| 4 |
| |||||
Shareholder Servicing Fees — Class H (Note D) |
| — |
| 8 |
| |||||
Distribution and Shareholder Servicing Fees — Class L (Note D) |
| — |
| 1 |
| |||||
Transfer Agency Fees (Note E) |
| 7 |
| 10 |
| |||||
Registration Fees |
| 28 |
| 50 |
| |||||
Country Tax Expense# |
| — |
| 14 |
| |||||
Other Expenses |
| 8 |
| 11 |
| |||||
Expenses Before Non Operating Expenses |
| 247 |
| 601 |
| |||||
Bank Overdraft Expense |
| — | @ | 4 |
| |||||
Transfer Agency Fees — Class H (Note E) |
| — |
| 2 |
| |||||
Transfer Agency Fees — Class L (Note E) |
| — |
| — | @ | |||||
Total Expenses |
| 247 |
| 607 |
| |||||
Voluntary Waiver of Investment Advisory Fees (Note B) |
| — |
| (278 | ) | |||||
Expenses Reimbursed by Adviser (Note B) |
| — |
| (11 | ) | |||||
Rebate from Morgan Stanley Affiliated Cash Sweep (Note G) |
| (1 | ) | (3 | ) | |||||
Expense Offset (Note F) |
| (1 | ) | (1 | ) | |||||
Net Expenses |
| 245 |
| 314 |
| |||||
Net Investment Income |
| 5 |
| 3,226 |
| |||||
Realized Gain (Loss): |
|
|
|
|
| |||||
Investments Sold |
| (4,586 | ) | (1,756 | ) | |||||
Foreign Currency Transactions |
| — |
| (1,557 | ) | |||||
Swap Agreements |
| — |
| 1 |
| |||||
Net Realized Gain (Loss) |
| (4,586 | ) | (3,312 | ) | |||||
Change in Unrealized Appreciation (Depreciation): |
|
|
|
|
| |||||
Investments |
| (4,738 | ) | (2,423 | ) | |||||
Foreign Currency Exchange Contracts and Translations |
| — |
| (40 | ) | |||||
Swap Agreements |
| — |
| 21 |
| |||||
Net Change in Unrealized Appreciation (Depreciation) |
| (4,738 | ) | (2,442 | ) | |||||
Total Net Realized Loss and Change in Unrealized Appreciation (Depreciation) |
| (9,324 | ) | (5,754 | ) | |||||
Net Decrease in Net Assets Resulting from Operations |
| $ | (9,319 | ) | $ | (2,528 | ) | |||
@ | Amount is less than $500. | |||||||||
# | CPMF (Provisional Contribution on Financial Transactions) is a Brazilian federal tax imposed on certain banking transactions and account withdrawals. The tax is charged based on the value of the transaction. | |||||||||
| The accompanying notes are an integral part of the financial statements. | 103 |
2008 Annual Report |
|
|
|
|
|
December 31, 2008 |
|
|
Statements of Changes in Net Assets
|
| Active International Allocation |
| Emerging Markets |
| |||||||||||||
|
| Portfolio |
| Portfolio |
| |||||||||||||
|
| Year Ended |
| Year Ended |
| Year Ended |
| Year Ended |
| |||||||||
|
| December 31, |
| December 31, |
| December 31, |
| December 31, |
| |||||||||
|
| 2008 |
| 2007 |
| 2008 |
| 2007 |
| |||||||||
|
| (000) |
| (000) |
| (000) |
| (000) |
| |||||||||
Increase (Decrease) in Net Assets |
|
|
|
|
|
|
|
|
| |||||||||
Operations: |
|
|
|
|
|
|
|
|
| |||||||||
Net Investment Income |
| $ | 23,150 |
| $ | 20,592 |
| $ | 18,707 |
| $ | 7,932 |
| |||||
Net Realized Gain (Loss) |
| (35,882 | ) | 124,998 |
| (219,535 | ) | 658,240 |
| |||||||||
Net Change in Unrealized Appreciation (Depreciation) |
| (385,652 | ) | 2,501 |
| (1,629,532 | ) | 328,393 |
| |||||||||
Net Increase (Decrease) in Net Assets Resulting from Operations |
| (398,384 | ) | 148,091 |
| (1,830,360 | ) | 994,565 |
| |||||||||
Distributions from and/or in Excess of: |
|
|
|
|
|
|
|
|
| |||||||||
Class I: |
|
|
|
|
|
|
|
|
| |||||||||
Net Investment Income |
| (9,076 | ) | (34,919 | ) | — |
| (10,445 | ) | |||||||||
Net Realized Gain |
| (39,989 | ) | (58,076 | ) | (148,947 | ) | (571,529 | ) | |||||||||
Class P: |
|
|
|
|
|
|
|
|
| |||||||||
Net Investment Income |
| (91 | ) | (149 | ) | — |
| (208 | ) | |||||||||
Net Realized Gain |
| (199 | ) | (273 | ) | (8,146 | ) | (30,744 | ) | |||||||||
Total Distributions |
| (49,355 | ) | (93,417 | ) | (157,093 | ) | (612,926 | ) | |||||||||
Capital Share Transactions:(1) |
|
|
|
|
|
|
|
|
| |||||||||
Class I: |
|
|
|
|
|
|
|
|
| |||||||||
Subscribed |
| 215,834 |
| 172,124 |
| 370,659 |
| 660,992 |
| |||||||||
Distributions Reinvested |
| 42,354 |
| 77,571 |
| 146,475 |
| 569,830 |
| |||||||||
Redeemed |
| (340,922 | ) | (177,984 | ) | (762,206 | ) | (557,714 | ) | |||||||||
Class P: |
|
|
|
|
|
|
|
|
| |||||||||
Subscribed |
| 5,298 |
| 3,372 |
| 24,253 |
| 81,605 |
| |||||||||
Distributions Reinvested |
| 290 |
| 422 |
| 8,134 |
| 30,914 |
| |||||||||
Redeemed |
| (1,338 | ) | (2,096 | ) | (44,234 | ) | (74,740 | ) | |||||||||
Net Increase (Decrease) in Net Assets Resulting from Capital Share Transactions |
| (78,484 | ) | 73,409 |
| (256,919 | ) | 710,887 |
| |||||||||
Redemption Fees |
| 130 |
| 3 |
| 166 |
| 453 |
| |||||||||
Total Increase (Decrease) in Net Assets |
| (526,093 | ) | 128,086 |
| (2,244,206 | ) | 1,092,979 |
| |||||||||
Net Assets: |
|
|
|
|
|
|
|
|
| |||||||||
Beginning of Period |
| 1,099,020 |
| 970,934 |
| 3,502,964 |
| 2,409,985 |
| |||||||||
End of Period |
| $ | 572,927 |
| $ | 1,099,020 |
| $ | 1,258,758 |
| $ | 3,502,964 |
| |||||
Undistributed (Distributions in Excess of) Net Investment Income Included in End of Period Net Assets |
| $ | 903 |
| $ | (2,542 | ) | $ | (8,440 | ) | $ | (24,956 | ) | |||||
(1) Capital Share Transactions: |
|
|
|
|
|
|
|
|
| |||||||||
Class I: |
|
|
|
|
|
|
|
|
| |||||||||
Shares Subscribed |
| 21,061 |
| 10,505 |
| 14,823 |
| 19,285 |
| |||||||||
Shares Issued on Distributions Reinvested |
| 3,453 |
| 5,006 |
| 6,573 |
| 17,164 |
| |||||||||
Shares Redeemed |
| (31,149 | ) | (10,838 | ) | (32,695 | ) | (16,736 | ) | |||||||||
Net Increase (Decrease) in Class I Shares Outstanding |
| (6,635 | ) | 4,673 |
| (11,299 | ) | 19,713 |
| |||||||||
Class P: |
|
|
|
|
|
|
|
|
| |||||||||
Shares Subscribed |
| 575 |
| 193 |
| 1,118 |
| 2,355 |
| |||||||||
Shares Issued on Distributions Reinvested |
| 25 |
| 27 |
| 372 |
| 950 |
| |||||||||
Shares Redeemed |
| (104 | ) | (126 | ) | (1,863 | ) | (2,305 | ) | |||||||||
Net Increase (Decrease) in Class P Shares Outstanding |
| 496 |
| 94 |
| (373 | ) | 1,000 |
| |||||||||
104 | The accompanying notes are an integral part of the financial statements. |
|
| 2008 Annual Report |
|
|
| December 31, 2008 |
Statements of Changes in Net Assets
|
| Global Franchise |
| Global Real Estate |
| ||||||||||||
|
| Portfolio |
| Portfolio |
| ||||||||||||
|
| Year Ended |
| Year Ended |
| Year Ended |
| Year Ended |
| ||||||||
|
| December 31, |
| December 31, |
| December 31, |
| December 31, |
| ||||||||
|
| 2008 |
| 2007 |
| 2008 |
| 2007 |
| ||||||||
|
| (000) |
| (000) |
| (000) |
| (000) |
| ||||||||
Increase (Decrease) in Net Assets |
|
|
|
|
|
|
|
|
| ||||||||
Operations: |
|
|
|
|
|
|
|
|
| ||||||||
Net Investment Income |
| $ | 2,584 |
| $ | 2,753 |
| $ | 14,234 |
| $ | 6,981 |
| ||||
Net Realized Gain (Loss) |
| 2,856 |
| 15,352 |
| (110,211 | ) | 11,995 |
| ||||||||
Net Change in Unrealized Appreciation (Depreciation) |
| (40,559 | ) | (6,597 | ) | (373,197 | ) | (96,771 | ) | ||||||||
Net Increase (Decrease) in Net Assets Resulting from Operations |
| (35,119 | ) | 11,508 |
| (469,174 | ) | (77,795 | ) | ||||||||
Distributions from and/or in Excess of: |
|
|
|
|
|
|
|
|
| ||||||||
Class I: |
|
|
|
|
|
|
|
|
| ||||||||
Net Investment Income |
| (5,813 | ) | (870 | ) | (1,495 | ) | (21,830 | ) | ||||||||
Net Realized Gain |
| (1,417 | ) | (17,250 | ) | (2,187 | ) | (12,446 | ) | ||||||||
Class P: |
|
|
|
|
|
|
|
|
| ||||||||
Net Investment Income |
| (214 | ) | (39 | ) | (86 | ) | (398 | ) | ||||||||
Net Realized Gain |
| (65 | ) | (940 | ) | (38 | ) | (256 | ) | ||||||||
Class H: |
|
|
|
|
|
|
|
|
| ||||||||
Net Investment Income |
| — |
| — |
| — |
| — |
| ||||||||
Net Realized Gain |
| — |
| — |
| (2 | ) | — |
| ||||||||
Class L: |
|
|
|
|
|
|
|
|
| ||||||||
Net Investment Income |
| — |
| — |
| — |
| — |
| ||||||||
Net Realized Gain |
| — |
| — |
| — | @ | — |
| ||||||||
Total Distributions |
| (7,509 | ) | (19,099 | ) | (3,808 | ) | (34,930 | ) | ||||||||
Capital Share Transactions:(1) |
|
|
|
|
|
|
|
|
| ||||||||
Class I: |
|
|
|
|
|
|
|
|
| ||||||||
Subscribed |
| 11,091 |
| 4,659 |
| 524,819 |
| 665,106 |
| ||||||||
Distributions Reinvested |
| 6,932 |
| 17,953 |
| 3,480 |
| 32,111 |
| ||||||||
Redeemed |
| (9,303 | ) | (33,859 | ) | (231,460 | ) | (193,108 | ) | ||||||||
Class P: |
|
|
|
|
|
|
|
|
| ||||||||
Subscribed |
| 205 |
| 3,728 |
| 56,573 |
| 22,603 |
| ||||||||
Distributions Reinvested |
| 229 |
| 862 |
| 124 |
| 638 |
| ||||||||
Redeemed |
| (2,067 | ) | (1,859 | ) | (8,907 | ) | (7,482 | ) | ||||||||
Class H*: |
|
|
|
|
|
|
|
|
| ||||||||
Subscribed |
| — |
| — |
| 744 |
| — |
| ||||||||
Distributions Reinvested |
| — |
| — |
| 1 |
| — |
| ||||||||
Redeemed |
| — |
| — |
| (62 | ) | — |
| ||||||||
Class L*: |
|
|
|
|
|
|
|
|
| ||||||||
Subscribed |
| — |
| — |
| 390 |
| — |
| ||||||||
Distributions Reinvested |
| — |
| — |
| — | @ | — |
| ||||||||
Redeemed |
| — |
| — |
| — |
| — |
| ||||||||
Net Increase (Decrease) in Net Assets Resulting from Capital Share Transactions |
| 7,087 |
| (8,516 | ) | 345,702 |
| 519,868 |
| ||||||||
Redemption Fees |
| — |
| — |
| 22 |
| 18 |
| ||||||||
Total Increase (Decrease) in Net Assets |
| (35,541 | ) | (16,107 | ) | (127,258 | ) | 407,161 |
| ||||||||
Net Assets: |
|
|
|
|
|
|
|
|
| ||||||||
Beginning of Period |
| 116,462 |
| 132,569 |
| 645,924 |
| 238,763 |
| ||||||||
End of Period |
| $ | 80,921 |
| $ | 116,462 |
| $ | 518,666 |
| $ | 645,924 |
| ||||
Undistributed (Distributions in Excess of) Net Investment Income Included in End of Period Net Assets |
| $ | 689 |
| $ | 525 |
| $ | 132 |
| $ | (13,261 | ) | ||||
| The accompanying notes are an integral part of the financial statements. | 105 |
2008 Annual Report |
|
December 31, 2008 |
Statements of Changes in Net Assets
|
| Global Franchise |
| Global Real Estate |
| |||||||||||
|
| Portfolio |
| Portfolio |
| |||||||||||
|
| Year Ended |
| Year Ended |
| Year Ended |
| Year Ended |
| |||||||
|
| December 31, |
| December 31, |
| December 31, |
| December 31, |
| |||||||
|
| 2008 |
| 2007 |
| 2008 |
| 2007 |
| |||||||
|
| (000) |
| (000) |
| (000) |
| (000) |
| |||||||
(1) Capital Share Transactions: |
|
|
|
|
|
|
|
|
| |||||||
Class I: |
|
|
|
|
|
|
|
|
| |||||||
Shares Subscribed |
| 721 |
| 242 |
| 58,712 |
| 55,916 |
| |||||||
Shares Issued on Distributions Reinvested |
| 605 |
| 1,063 |
| 499 |
| 3,196 |
| |||||||
Shares Redeemed |
| (742 | ) | (1,821 | ) | (36,048 | ) | (16,713 | ) | |||||||
Net Increase (Decrease) in Class I Shares Outstanding |
| 584 |
| (516 | ) | 23,163 |
| 42,399 |
| |||||||
Class P: |
|
|
|
|
|
|
|
|
| |||||||
Shares Subscribed |
| 13 |
| 198 |
| 8,112 |
| 1,903 |
| |||||||
Shares Issued on Distributions Reinvested |
| 20 |
| 52 |
| 20 |
| 64 |
| |||||||
Shares Redeemed |
| (148 | ) | (97 | ) | (1,311 | ) | (660 | ) | |||||||
Net Increase (Decrease) in Class P Shares Outstanding |
| (115 | ) | 153 |
| 6,821 |
| 1,307 |
| |||||||
Class H*: |
|
|
|
|
|
|
|
|
| |||||||
Shares Subscribed |
| — |
| — |
| 79 |
| — |
| |||||||
Shares Issued on Distributions Reinvested |
| — |
| — |
| — | # | — |
| |||||||
Shares Redeemed |
| — |
| — |
| (7 | ) | — |
| |||||||
Net Increase in Class H Shares Outstanding |
| — |
| — |
| 72 |
| — |
| |||||||
Class L*: |
|
|
|
|
|
|
|
|
| |||||||
Shares Subscribed |
| — |
| — |
| 48 |
| — |
| |||||||
Shares Issued on Distributions Reinvested |
| — |
| — |
| — | # | — |
| |||||||
Shares Redeemed |
| — |
| — |
| — |
| — |
| |||||||
Net Increase in Class L Shares Outstanding |
| — |
| — |
| 48 |
| — |
| |||||||
@ | Amount is less than $500. | |||||||||||||||
# | Shares are less than 500. | |||||||||||||||
* | The Global Real Estate Portfolio’s Class H and Class L commenced operations on January 2, 2008 and June 16, 2008, respectively. | |||||||||||||||
106 | The accompanying notes are an integral part of the financial statements. |
|
| 2008 Annual Report |
|
|
| December 31, 2008 |
Statements of Changes in Net Assets
|
| Global Value Equity |
| International Equity |
| ||||||||
|
| Portfolio |
| Portfolio |
| ||||||||
|
| Year Ended |
| Year Ended |
| Year Ended |
| Year Ended | |||||
|
| December 31, |
| December 31, |
| December 31, |
| December 31, | |||||
|
| 2008 |
| 2007 |
| 2008 |
| 2007 | |||||
|
| (000) |
| (000) |
| (000) |
| (000) | |||||
Increase (Decrease) in Net Assets |
|
|
|
|
|
|
|
|
| ||||
Operations: |
|
|
|
|
|
|
|
|
| ||||
Net Investment Income |
| $ | 1,533 |
| $ | 1,558 |
| $ | 126,317 |
| $ | 134,498 |
|
Net Realized Gain (Loss) |
| (12,795) |
| 15,162 |
| 4,054 |
| 871,941 |
| ||||
Net Change in Unrealized Appreciation (Depreciation) |
| (17,925) |
| (10,156) |
| (1,950,841) |
| (340,830) |
| ||||
Net Increase (Decrease) in Net Assets Resulting from Operations |
| (29,187) |
| 6,564 |
| (1,820,470) |
| 665,609 |
| ||||
Distributions from and/or in Excess of: |
|
|
|
|
|
|
|
|
| ||||
Class I: |
|
|
|
|
|
|
|
|
| ||||
Net Investment Income |
| (1,652) |
| (1,044) |
| (85,581) |
| (105,722) |
| ||||
Net Realized Gain |
| (558) |
| (10,780) |
| (246,224) |
| (731,331) |
| ||||
Class P: |
|
|
|
|
|
|
|
|
| ||||
Net Investment Income |
| (746) |
| (322) |
| (19,871) |
| (18,724) |
| ||||
Net Realized Gain |
| (228) |
| (3,997) |
| (63,382) |
| (149,480) |
| ||||
Total Distributions |
| (3,184) |
| (16,143) |
| (415,058) |
| (1,005,257) |
| ||||
Capital Share Transactions:(1) |
|
|
|
|
|
|
|
|
| ||||
Class I: |
|
|
|
|
|
|
|
|
| ||||
Subscribed |
| 2,804 |
| 3,698 |
| 609,414 |
| 746,973 |
| ||||
Distributions Reinvested |
| 2,130 |
| 11,789 |
| 310,637 |
| 780,820 |
| ||||
Redeemed |
| (23,799) |
| (43,789) |
| (1,608,578) |
| (2,044,329) |
| ||||
Class P: |
|
|
|
|
|
|
|
|
| ||||
Subscribed |
| 3,042 |
| 4,116 |
| 554,769 |
| 321,010 |
| ||||
Distributions Reinvested |
| 975 |
| 4,319 |
| 83,112 |
| 168,106 |
| ||||
Redeemed |
| (7,018) |
| (9,264) |
| (545,639) |
| (561,568) |
| ||||
Net Decrease in Net Assets Resulting from Capital Share Transactions |
| (21,866) |
| (29,131) |
| (596,285) |
| (588,988) |
| ||||
Redemption Fees |
| 1 |
| 8 |
| 311 |
| 310 |
| ||||
Total Decrease in Net Assets |
| (54,236) |
| (38,702) |
| (2,831,502) |
| (928,326) |
| ||||
Net Assets: |
|
|
|
|
|
|
|
|
| ||||
Beginning of Period |
| 90,234 |
| 128,936 |
| 6,125,402 |
| 7,053,728 |
| ||||
End of Period |
| $ | 35,998 |
| $ | 90,234 |
| $ | 3,293,900 |
| $ | 6,125,402 |
|
Undistributed (Distributions in Excess of) Net Investment Income Included in End of Period Net Assets |
| $ | 150 |
| $ | 58 |
| $ | 4,431 |
| $ | (3,623) |
|
(1) Capital Share Transactions: |
|
|
|
|
|
|
|
|
| ||||
Class I: |
|
|
|
|
|
|
|
|
| ||||
Shares Subscribed |
| 182 |
| 173 |
| 39,005 |
| 34,520 |
| ||||
Shares Issued on Distributions Reinvested |
| 203 |
| 671 |
| 29,205 |
| 42,066 |
| ||||
Shares Redeemed |
| (1,574) |
| (2,112) |
| (101,449) |
| (93,380) |
| ||||
Net Decrease in Class I Shares Outstanding |
| (1,189) |
| (1,268) |
| (33,239) |
| (16,794) |
| ||||
Class P: |
|
|
|
|
|
|
|
|
| ||||
Shares Subscribed |
| 282 |
| 194 |
| 37,546 |
| 14,903 |
| ||||
Shares Issued on Distributions Reinvested |
| 95 |
| 248 |
| 7,895 |
| 9,151 |
| ||||
Shares Redeemed |
| (492) |
| (445) |
| (36,829) |
| (26,119) |
| ||||
Net Increase (Decrease) in Class P Shares Outstanding |
| (115) |
| (3) |
| 8,612 |
| (2,065) |
| ||||
| The accompanying notes are an integral part of the financial statements. | 107 |
2008 Annual Report |
|
December 31, 2008 |
Statements of Changes in Net Assets
|
| International Growth Active |
| International Growth Equity |
| ||||||||||||
|
| Extension Portfolio |
| Portfolio |
| ||||||||||||
|
| Year Ended |
| Year Ended |
| Year Ended |
| Year Ended | |||||||||
|
| December 31, |
| December 31, |
| December 31, |
| December 31, | |||||||||
|
| 2008 |
| 2007^ |
| 2008 |
| 2007 | |||||||||
|
| (000) |
| (000) |
| (000) |
| (000) | |||||||||
Increase (Decrease) in Net Assets |
|
|
|
|
|
|
|
|
| ||||||||
Net Investment Income (Loss) |
| $ | 138 |
|
| $ | (23 | ) |
| $ | 1,851 |
|
| $ | 74 |
|
|
Net Realized Gain (Loss) |
| (1,763 | ) |
| (79 | ) |
| (9,934 | ) |
| 537 |
|
| ||||
Net Change in Unrealized Appreciation (Depreciation) |
| (4,545 | ) |
| 761 |
|
| (32,537 | ) |
| 484 |
|
| ||||
Net Increase (Decrease) in Net Assets Resulting from Operations |
| (6,170 | ) |
| 659 |
|
| (40,620 | ) |
| 1,095 |
|
| ||||
Distributions from and/or in Excess of: |
|
|
|
|
|
|
|
|
|
|
|
|
| ||||
Class I: |
|
|
|
|
|
|
|
|
|
|
|
|
| ||||
Net Investment Income |
| (143 | ) |
| — |
|
| (1,877 | ) |
| (63 | ) |
| ||||
Net Realized Gain |
| — |
|
| — |
|
| (270 | ) |
| (301 | ) |
| ||||
Class P: |
|
|
|
|
|
|
|
|
|
|
|
|
| ||||
Net Investment Income |
| (1 | ) |
| — |
|
| (10 | ) |
| (3 | ) |
| ||||
Net Realized Gain |
| — |
|
| — |
|
| (1 | ) |
| (20 | ) |
| ||||
Class H: |
|
|
|
|
|
|
|
|
|
|
|
|
| ||||
Net Investment Income |
| (6 | ) |
| — |
|
| — |
|
| — |
|
| ||||
Class L: |
|
|
|
|
|
|
|
|
|
|
|
|
| ||||
Net Investment Income |
| (1 | ) |
| — |
|
| — |
|
| — |
|
| ||||
Total Distributions |
| (151 | ) |
| — |
|
| (2,158 | ) |
| (387 | ) |
| ||||
Capital Share Transactions:(1) |
|
|
|
|
|
|
|
|
|
|
|
|
| ||||
Class I: |
|
|
|
|
|
|
|
|
|
|
|
|
| ||||
Subscribed |
| — |
|
| — |
|
| 84,193 |
|
| 15,122 |
|
| ||||
Distributions Reinvested |
| — |
|
| — |
|
| 1,750 |
|
| 36 |
|
| ||||
Redeemed |
| — |
|
| — |
|
| (25,148 | ) |
| (60 | ) |
| ||||
Class P: |
|
|
|
|
|
|
|
|
|
|
|
|
| ||||
Subscribed |
| — |
|
| — |
|
| 61 |
|
| 153 |
|
| ||||
Distributions Reinvested |
| — |
|
| — |
|
| 8 |
|
| 17 |
|
| ||||
Redeemed |
| — |
|
| — |
|
| (147 | ) |
| — |
|
| ||||
Class H: |
|
|
|
|
|
|
|
|
|
|
|
|
| ||||
Subscribed |
| 925 |
|
| — |
|
| — |
|
| — |
|
| ||||
Distributions Reinvested |
| 5 |
|
| — |
|
| — |
|
| — |
|
| ||||
Redeemed |
| (274 | ) |
| — |
|
| — |
|
| — |
|
| ||||
Class L: |
|
|
|
|
|
|
|
|
|
|
|
|
| ||||
Subscribed |
| 35 |
|
| — |
|
| — |
|
| — |
|
| ||||
Distributions Reinvested |
| — | @ |
| — |
|
| — |
|
| — |
|
| ||||
Redeemed |
| — |
|
| — |
|
| — |
|
| — |
|
| ||||
Net Increase in Net Assets Resulting from Capital Share Transactions |
| 691 |
|
| — |
|
| 60,717 |
|
| 15,268 |
|
| ||||
Redemption Fees |
| — |
|
| — |
|
| — |
|
| — |
|
| ||||
Total Increase (Decrease) in Net Assets |
| (5,630 | ) |
| 659 |
|
| 17,939 |
|
| 15,976 |
|
| ||||
Net Assets: |
|
|
|
|
|
|
|
|
|
|
|
|
| ||||
Beginning of Period |
| 10,659 |
|
| 10,000 |
|
| 23,054 |
|
| 7,078 |
|
| ||||
End of Period |
| $ | 5,029 |
|
| $ | 10,659 |
|
| $ | 40,993 |
|
| $ | 23,054 |
|
|
Distributions in Excess of Net Investment Income Included in End of Period Net Assets |
| $ | — |
|
| $ | (3 | ) |
| $ | (13 | ) |
| $ | — |
|
|
108 | The accompanying notes are an integral part of the financial statements. |
|
| 2008 Annual Report |
|
|
| December 31, 2008 |
Statements of Changes in Net Assets
|
| International Growth Active |
| International Growth Equity |
| ||||||||
|
| Extension Portfolio |
| Portfolio |
| ||||||||
|
| Year Ended |
| Year Ended |
| Year Ended |
| Year Ended |
| ||||
|
| December 31, |
| December 31, |
| December 31, |
| December 31, |
| ||||
|
| 2008 |
| 2007^ |
| 2008 |
| 2007 |
| ||||
|
| (000) |
| (000) |
| (000) |
| (000) |
| ||||
(1) Capital Share Transactions: |
|
|
|
|
|
|
|
|
|
|
|
|
|
Class I: |
|
|
|
|
|
|
|
|
|
|
|
|
|
Shares Subscribed |
| — |
|
| 990 |
|
| 6,530 |
|
| 1,100 |
|
|
Shares Issued on Distributions Reinvested |
| — |
|
| — |
|
| 253 |
|
| 3 |
|
|
Shares Redeemed |
| — |
|
| — |
|
| (2,357 | ) |
| (4 | ) |
|
Net Increase in Class I Shares Outstanding |
| — |
|
| 990 |
|
| 4,426 |
|
| 1,099 |
|
|
Class P: |
|
|
|
|
|
|
|
|
|
|
|
|
|
Shares Subscribed |
| — |
|
| 10 |
|
| 8 |
|
| 12 |
|
|
Shares Issued on Distributions Reinvested |
| — |
|
| — |
|
| 1 |
|
| 1 |
|
|
Shares Redeemed |
| — |
|
| — |
|
| (12 | ) |
| — |
|
|
Net Increase (Decrease) in Class P Shares Outstanding |
| — |
|
| 10 |
|
| (3 | ) |
| 13 |
|
|
Class H: |
|
|
|
|
|
|
|
|
|
|
|
|
|
Shares Subscribed |
| 93 |
|
| — |
|
| — |
|
| — |
|
|
Shares Issued on Distributions Reinvested |
| 1 |
|
| — |
|
| — |
|
| — |
|
|
Shares Redeemed |
| (38 | ) |
| — |
|
| — |
|
| — |
|
|
Net Increase in Class H Shares Outstanding |
| 56 |
|
| — |
|
| — |
|
| — |
|
|
Class L: |
|
|
|
|
|
|
|
|
|
|
|
|
|
Shares Subscribed |
| 4 |
|
| — |
|
| — |
|
| — |
|
|
Shares Issued on Distributions Reinvested |
| — | # |
| — |
|
| — |
|
| — |
|
|
Shares Redeemed |
| — |
|
| — |
|
| — |
|
| — |
|
|
Net Increase in Class L Shares Outstanding |
| 4 |
|
| — |
|
| — |
|
| — |
|
|
^ | International Growth Active Extension commenced operations on July 31, 2007. |
@ | Amount is less than $500. |
# | Shares are less than 500. |
| The accompanying notes are an integral part of the financial statements. | 109 |
2008 Annual Report | |
|
|
December 31, 2008 | |
Statements of Changes in Net Assets
|
| International Real Estate |
| International Small Cap |
| ||||||||||||
|
| Portfolio |
| Portfolio |
| ||||||||||||
|
| Year Ended |
| Year Ended |
| Year Ended |
| Year Ended |
| ||||||||
|
| December 31, |
| December 31, |
| December 31, |
| December 31, |
| ||||||||
|
| 2008 |
| 2007 |
| 2008 |
| 2007 |
| ||||||||
|
| (000) |
| (000) |
| (000) |
| (000) |
| ||||||||
Increase (Decrease) in Net Assets |
|
|
|
|
|
|
|
|
| ||||||||
Operations: |
|
|
|
|
|
|
|
|
| ||||||||
Net Investment Income |
| $ | 24,923 |
|
| $ | 32,360 |
|
| $ | 13,355 |
|
| $ | 13,493 |
|
|
Net Realized Gain (Loss) |
| (145,066 | ) |
| 90,725 |
|
| (88,295 | ) |
| 226,235 |
|
| ||||
Net Change in Unrealized Appreciation (Depreciation) |
| (426,411 | ) |
| (433,923 | ) |
| (169,481 | ) |
| (254,273 | ) |
| ||||
Net Decrease in Net Assets Resulting from Operations |
| (546,554 | ) |
| (310,838 | ) |
| (244,421 | ) |
| (14,545 | ) |
| ||||
Distributions from and/or in Excess of: |
|
|
|
|
|
|
|
|
|
|
|
|
| ||||
Class I: |
|
|
|
|
|
|
|
|
|
|
|
|
| ||||
Net Investment Income |
| — |
|
| (75,854 | ) |
| (13,260 | ) |
| (10,502 | ) |
| ||||
Net Realized Gain |
| (5,239 | ) |
| (67,563 | ) |
| (30,495 | ) |
| (223,789 | ) |
| ||||
Class P: |
|
|
|
|
|
|
|
|
|
|
|
|
| ||||
Net Investment Income |
| — |
|
| (5,828 | ) |
| (1 | ) |
| — |
|
| ||||
Net Realized Gain |
| (172 | ) |
| (5,753 | ) |
| — |
|
| — |
|
| ||||
Total Distributions |
| (5,411 | ) |
| (154,998 | ) |
| (43,756 | ) |
| (234,291 | ) |
| ||||
Capital Share Transactions:(1) |
|
|
|
|
|
|
|
|
|
|
|
|
| ||||
Class I: |
|
|
|
|
|
|
|
|
|
|
|
|
| ||||
Subscribed |
| 330,959 |
|
| 936,214 |
|
| 69,427 |
|
| 93,078 |
|
| ||||
Distributions Reinvested |
| 3,596 |
|
| 97,520 |
|
| 39,520 |
|
| 208,756 |
|
| ||||
Redeemed |
| (424,987 | ) |
| (675,327 | ) |
| (300,305 | ) |
| (569,019 | ) |
| ||||
Class P: |
|
|
|
|
|
|
|
|
|
|
|
|
| ||||
Subscribed |
| 34,330 |
|
| 107,694 |
|
| 119 |
|
| — |
|
| ||||
Distributions Reinvested |
| 168 |
|
| 11,447 |
|
| 1 |
|
| — |
|
| ||||
Redeemed |
| (106,691 | ) |
| (84,467 | ) |
| (1 | ) |
| — |
|
| ||||
Net Increase (Decrease) in Net Assets Resulting from Capital Share Transactions |
| (162,625 | ) |
| 393,081 |
|
| (191,239 | ) |
| (267,185 | ) |
| ||||
Redemption Fees |
| 61 |
|
| 53 |
|
| 11 |
|
| 7 |
|
| ||||
Total Decrease in Net Assets |
| (714,529 | ) |
| (72,702 | ) |
| (479,405 | ) |
| (516,014 | ) |
| ||||
Net Assets: |
|
|
|
|
|
|
|
|
|
|
|
|
| ||||
Beginning of Period |
| 1,150,818 |
|
| 1,223,520 |
|
| 796,050 |
|
| 1,312,064 |
|
| ||||
End of Period |
| $ | 436,289 |
|
| $ | 1,150,818 |
|
| $ | 316,645 |
|
| $ | 796,050 |
|
|
Undistributed (Distributions in Excess of) Net Investment Income Included in End of Period Net Assets |
| $ | (2,134 | ) |
| $ | (34,483 | ) |
| $ | 713 |
|
| $ | (144 | ) |
|
(1) Capital Share Transactions: |
|
|
|
|
|
|
|
|
|
|
|
|
| ||||
Class I: |
|
|
|
|
|
|
|
|
|
|
|
|
| ||||
Shares Subscribed |
| 16,150 |
|
| 27,636 |
|
| 5,203 |
|
| 3,786 |
|
| ||||
Shares Issued on Distributions Reinvested |
| 174 |
|
| 3,730 |
|
| 3,232 |
|
| 12,028 |
|
| ||||
Shares Redeemed |
| (24,020 | ) |
| (22,070 | ) |
| (21,823 | ) |
| (24,536 | ) |
| ||||
Net Increase (Decrease) in Class I Shares Outstanding |
| (7,696 | ) |
| 9,296 |
|
| (13,388 | ) |
| (8,722 | ) |
| ||||
Class P: |
|
|
|
|
|
|
|
|
|
|
|
|
| ||||
Shares Subscribed |
| 1,401 |
|
| 3,292 |
|
| 13 |
|
| — |
|
| ||||
Shares Issued on Distributions Reinvested |
| 8 |
|
| 441 |
|
| — | # |
| — |
|
| ||||
Shares Redeemed |
| (4,544 | ) |
| (2,683 | ) |
| — | # |
| — |
|
| ||||
Net Increase (Decrease) in Class P Shares Outstanding |
| (3,135 | ) |
| 1,050 |
|
| 13 |
|
| — |
|
| ||||
# Shares are less than 500 |
|
|
|
|
|
|
|
|
|
|
|
|
| ||||
110 | The accompanying notes are an integral part of the financial statements. |
|
| 2008 Annual Report |
|
|
| December 31, 2008 |
Statements of Changes in Net Assets
|
| Capital Growth |
| Focus Growth |
| ||||||||||||
|
| Portfolio |
| Portfolio |
| ||||||||||||
|
| Year Ended |
| Year Ended |
| Year Ended |
| Year Ended |
| ||||||||
|
| December 31, |
| December 31, |
| December 31, |
| December 31, |
| ||||||||
|
| 2008 |
| 2007 |
| 2008 |
| 2007 |
| ||||||||
|
| (000) |
| (000) |
| (000) |
| (000) |
| ||||||||
Increase (Decrease) in Net Assets |
|
|
|
|
|
|
|
|
| ||||||||
Operations: |
|
|
|
|
|
|
|
|
| ||||||||
Net Investment Income (Loss) |
| $ | 2,560 |
|
| $ | 5,480 |
|
| $ | (2 | ) |
| $ | 18 |
|
|
Net Realized Gain (Loss) |
| (110,485 | ) |
| 72,047 |
|
| (363 | ) |
| 1,077 |
|
| ||||
Net Change in Unrealized Appreciation (Depreciation) |
| (615,295 | ) |
| 166,291 |
|
| (7,132 | ) |
| 2,043 |
|
| ||||
Net Increase (Decrease) in Net Assets Resulting from Operations |
| (723,220 | ) |
| 243,818 |
|
| (7,497 | ) |
| 3,138 |
|
| ||||
Distributions from and/or in Excess of: |
|
|
|
|
|
|
|
|
|
|
|
|
| ||||
Class I: |
|
|
|
|
|
|
|
|
|
|
|
|
| ||||
Net Investment Income |
| (4,568 | ) |
| (4,987 | ) |
| (24 | ) |
| (22 | ) |
| ||||
Net Realized Gain |
| (1,281 | ) |
| — |
|
| — |
|
| — |
|
| ||||
Class P: |
|
|
|
|
|
|
|
|
|
|
|
|
| ||||
Net Investment Income |
| (196 | ) |
| (436 | ) |
| — | @ |
| — |
|
| ||||
Net Realized Gain |
| (151 | ) |
| — |
|
| — |
|
| — |
|
| ||||
Total Distributions |
| (6,196 | ) |
| (5,423 | ) |
| (24 | ) |
| (22 | ) |
| ||||
Capital Share Transactions:(1) |
|
|
|
|
|
|
|
|
|
|
|
|
| ||||
Class I: |
|
|
|
|
|
|
|
|
|
|
|
|
| ||||
Subscribed |
| 153,379 |
|
| 365,245 |
|
| 1,060 |
|
| 2,269 |
|
| ||||
Distributions Reinvested |
| 5,844 |
|
| 4,984 |
|
| 24 |
|
| 21 |
|
| ||||
Redeemed |
| (369,316 | ) |
| (196,520 | ) |
| (3,807 | ) |
| (3,443 | ) |
| ||||
Class P: |
|
|
|
|
|
|
|
|
|
|
|
|
| ||||
Subscribed |
| 35,237 |
|
| 113,572 |
|
| 84 |
|
| 776 |
|
| ||||
Distributions Reinvested |
| 346 |
|
| 435 |
|
| — | @ |
| — |
|
| ||||
Redeemed |
| (65,945 | ) |
| (22,637 | ) |
| (658 | ) |
| (707 | ) |
| ||||
Net Increase (Decrease) in Net Assets Resulting from Capital Share Transactions |
| (240,455 | ) |
| 265,079 |
|
| (3,297 | ) |
| (1,084 | ) |
| ||||
Redemption Fees |
| 12 |
|
| 3 |
|
| 1 |
|
| — | @ |
| ||||
Total Increase (Decrease) in Net Assets |
| (969,859 | ) |
| 503,477 |
|
| (10,817 | ) |
| 2,032 |
|
| ||||
Net Assets: |
|
|
|
|
|
|
|
|
|
|
|
|
| ||||
Beginning of Period |
| 1,573,583 |
|
| 1,070,106 |
|
| 16,765 |
|
| 14,733 |
|
| ||||
End of Period |
| $ | 603,724 |
|
| $ | 1,573,583 |
|
| $ | 5,948 |
|
| $ | 16,765 |
|
|
Distributions in Excess of Net Investment Income Included in End of Period Net Assets |
| $ | (39 | ) |
| $ | (23 | ) |
| $ | (5 | ) |
| $ | (9 | ) |
|
(1) Capital Share Transactions: |
|
|
|
|
|
|
|
|
|
|
|
|
| ||||
Class I: |
|
|
|
|
|
|
|
|
|
|
|
|
| ||||
Shares Subscribed |
| 8,076 |
|
| 15,536 |
|
| 61 |
|
| 123 |
|
| ||||
Shares Issued on Distributions Reinvested |
| 432 |
|
| 205 |
|
| 3 |
|
| 1 |
|
| ||||
Shares Redeemed |
| (20,618 | ) |
| (8,673 | ) |
| (255 | ) |
| (205 | ) |
| ||||
Net Increase (Decrease) in Class I Shares Outstanding |
| (12,110 | ) |
| 7,068 |
|
| (191 | ) |
| (81 | ) |
| ||||
Class P: |
|
|
|
|
|
|
|
|
|
|
|
|
| ||||
Shares Subscribed |
| 1,754 |
|
| 4,978 |
|
| 5 |
|
| 44 |
|
| ||||
Shares Issued on Distributions Reinvested |
| 23 |
|
| 18 |
|
| — | # |
| — |
|
| ||||
Shares Redeemed |
| (3,633 | ) |
| (1,018 | ) |
| (42 | ) |
| (42 | ) |
| ||||
Net Increase (Decrease) in Class P Shares Outstanding |
| (1,856 | ) |
| 3,978 |
|
| (37 | ) |
| 2 |
|
| ||||
# Shares are less than 500.
| The accompanying notes are an integral part of the financial statements. | 111 |
2008 Annual Report |
|
December 31, 2008 |
Statements of Changes in Net Assets
|
| Large Cap Relative Value |
| Small Company Growth |
| ||||||||||||
|
| Portfolio |
| Portfolio |
| ||||||||||||
|
| Year Ended |
| Year Ended |
| Year Ended |
| Year Ended |
| ||||||||
|
| December 31, |
| December 31, |
| December 31, |
| December 31, |
| ||||||||
|
| 2008 |
| 2007 |
| 2008 |
| 2007 |
| ||||||||
|
| (000) |
| (000) |
| (000) |
| (000) |
| ||||||||
Increase (Decrease) in Net Assets |
|
|
|
|
|
|
|
|
| ||||||||
Operations: |
|
|
|
|
|
|
|
|
| ||||||||
Net Investment Income (Loss) |
| $ | 4,842 |
|
| $ | 5,052 |
|
| $ | (2,517 | ) |
| $ | (8,851 | ) |
|
Net Realized Gain (Loss) |
| (13,816 | ) |
| 11,824 |
|
| (7,469 | ) |
| 67,104 |
|
| ||||
Net Change in Unrealized Appreciation (Depreciation) |
| (81,222 | ) |
| (9,583 | ) |
| (736,061 | ) |
| (504 | ) |
| ||||
Net Increase (Decrease) in Net Assets Resulting from Operations |
| (90,196 | ) |
| 7,293 |
|
| (746,047 | ) |
| 57,749 |
|
| ||||
Distributions from and/or in Excess of: |
|
|
|
|
|
|
|
|
|
|
|
|
| ||||
Class I: |
|
|
|
|
|
|
|
|
|
|
|
|
| ||||
Net Investment Income |
| (4,046 | ) |
| (4,158 | ) |
| — |
|
| — |
|
| ||||
Net Realized Gain |
| (1,014 | ) |
| (9,556 | ) |
| — |
|
| (48,432 | ) |
| ||||
Class P: |
|
|
|
|
|
|
|
|
|
|
|
|
| ||||
Net Investment Income |
| (752 | ) |
| (891 | ) |
| — |
|
| — |
|
| ||||
Net Realized Gain |
| (206 | ) |
| (2,283 | ) |
| — |
|
| (34,374 | ) |
| ||||
Total Distributions |
| (6,018 | ) |
| (16,888 | ) |
| — |
|
| (82,806 | ) |
| ||||
Capital Share Transactions:(1) |
|
|
|
|
|
|
|
|
|
|
|
|
| ||||
Class I: |
|
|
|
|
|
|
|
|
|
|
|
|
| ||||
Subscribed |
| 32,039 |
|
| 67,425 |
|
| 187,129 |
|
| 316,184 |
|
| ||||
Distributions Reinvested |
| 5,042 |
|
| 13,663 |
|
| — |
|
| 46,288 |
|
| ||||
Redeemed |
| (44,054 | ) |
| (47,813 | ) |
| (220,193 | ) |
| (234,892 | ) |
| ||||
Class P: |
|
|
|
|
|
|
|
|
|
|
|
|
| ||||
Subscribed |
| 7,908 |
|
| 8,087 |
|
| 86,946 |
|
| 122,392 |
|
| ||||
Distributions Reinvested |
| 953 |
|
| 3,161 |
|
| — |
|
| 34,371 |
|
| ||||
Redeemed |
| (7,866 | ) |
| (23,076 | ) |
| (160,035 | ) |
| (308,689 | ) |
| ||||
Net Increase (Decrease) in Net Assets Resulting from Capital Share Transactions |
| (5,978 | ) |
| 21,447 |
|
| (106,153 | ) |
| (24,346 | ) |
| ||||
Redemption Fees |
| 2 |
|
| 15 |
|
| 39 |
|
| 120 |
|
| ||||
Total Increase (Decrease) in Net Assets |
| (102,190 | ) |
| 11,867 |
|
| (852,161 | ) |
| (49,283 | ) |
| ||||
Net Assets: |
|
|
|
|
|
|
|
|
|
|
|
|
| ||||
Beginning of Period |
| 287,071 |
|
| 275,204 |
|
| 1,836,022 |
|
| 1,885,305 |
|
| ||||
End of Period |
| $ | 184,881 |
|
| $ | 287,071 |
|
| $ | 983,861 |
|
| $ | 1,836,022 |
|
|
Undistributed (Distributions in Excess of) Net Investment Income Included in End of Period Net Assets |
| $ | 22 |
|
| $ | (21 | ) |
| $ | (24 | ) |
| $ | — |
|
|
Accumulated Net Investment Loss Included in End of Period Net Assets |
| $ | — |
|
| $ | — |
|
| $ | — |
|
| $ | (22 | ) |
|
(1) Capital Share Transactions: |
|
|
|
|
|
|
|
|
|
|
|
|
| ||||
Class I: |
|
|
|
|
|
|
|
|
|
|
|
|
| ||||
Shares Subscribed |
| 3,121 |
|
| 5,313 |
|
| 19,052 |
|
| 22,899 |
|
| ||||
Shares Issued on Distributions Reinvested |
| 529 |
|
| 1,112 |
|
| — |
|
| 3,507 |
|
| ||||
Shares Redeemed |
| (4,503 | ) |
| (3,838 | ) |
| (22,138 | ) |
| (16,936 | ) |
| ||||
Net Increase (Decrease) in Class I Shares Outstanding |
| (853 | ) |
| 2,587 |
|
| (3,086 | ) |
| 9,470 |
|
| ||||
Class P: |
|
|
|
|
|
|
|
|
|
|
|
|
| ||||
Shares Subscribed |
| 842 |
|
| 648 |
|
| 8,753 |
|
| 9,315 |
|
| ||||
Shares Issued on Distributions Reinvested |
| 101 |
|
| 256 |
|
| — |
|
| 2,751 |
|
| ||||
Shares Redeemed |
| (743 | ) |
| (1,857 | ) |
| (17,079 | ) |
| (23,606 | ) |
| ||||
Net Increase (Decrease) in Class P Shares Outstanding |
| 200 |
|
| (953 | ) |
| (8,326 | ) |
| (11,540 | ) |
| ||||
112 | The accompanying notes are an integral part of the financial statements. |
|
| 2008 Annual Report |
|
|
| December 31, 2008 |
Statements of Changes in Net Assets
|
| U.S. Real Estate |
| U.S. Small/Mid Cap Value |
| ||||||||||||
|
| Portfolio |
| Portfolio |
| ||||||||||||
|
| Year Ended |
| Year Ended |
| Year Ended |
| Period Ended | |||||||||
|
| December 31, |
| December 31, |
| December 31, |
| December 31, | |||||||||
|
| 2008 |
| 2007 |
| 2008 |
| 2007^ | |||||||||
|
| (000) |
| (000) |
| (000) |
| (000) | |||||||||
Increase (Decrease) in Net Assets |
|
|
|
|
|
|
|
|
| ||||||||
Operations: |
|
|
|
|
|
|
|
|
| ||||||||
Net Investment Income |
| $ | 20,360 |
|
| $ | 20,283 |
|
| $ | 5 |
|
| $ | 5 |
|
|
Net Realized Gain (Loss) |
| (84,624 | ) |
| 420,629 |
|
| (4,586 | ) |
| (17 | ) |
| ||||
Net Change in Unrealized Appreciation (Depreciation) |
| (315,805 | ) |
| (693,156 | ) |
| (4,738 | ) |
| (1,072 | ) |
| ||||
Net Decrease in Net Assets Resulting from Operations |
| (380,069 | ) |
| (252,244 | ) |
| (9,319 | ) |
| (1,084 | ) |
| ||||
Distributions from and/or in Excess of: |
|
|
|
|
|
|
|
|
|
|
|
|
| ||||
Class I: |
|
|
|
|
|
|
|
|
|
|
|
|
| ||||
Net Investment Income |
| (17,355 | ) |
| (24,407 | ) |
| (11 | ) |
| — |
|
| ||||
Net Realized Gain |
| (59,526 | ) |
| (322,942 | ) |
| (20 | ) |
| (18 | ) |
| ||||
Class P: |
|
|
|
|
|
|
|
|
|
|
|
|
| ||||
Net Investment Income |
| (2,855 | ) |
| (3,761 | ) |
| — |
|
| — |
|
| ||||
Net Realized Gain |
| (10,774 | ) |
| (58,276 | ) |
| — | @ |
| — | @ |
| ||||
Total Distributions |
| (90,510 | ) |
| (409,386 | ) |
| (31 | ) |
| (18 | ) |
| ||||
Capital Share Transactions:(1) |
|
|
|
|
|
|
|
|
|
|
|
|
| ||||
Class I: |
|
|
|
|
|
|
|
|
|
|
|
|
| ||||
Subscribed |
| 252,586 |
|
| 358,040 |
|
| 7,041 |
|
| 1,326 |
|
| ||||
Distributions Reinvested |
| 74,979 |
|
| 340,743 |
|
| 9 |
|
| 1 |
|
| ||||
Redeemed |
| (394,990 | ) |
| (863,055 | ) |
| (1,357 | ) |
| (18 | ) |
| ||||
Class P: |
|
|
|
|
|
|
|
|
|
|
|
|
| ||||
Subscribed |
| 53,564 |
|
| 111,307 |
|
| — |
|
| — |
|
| ||||
Distributions Reinvested |
| 13,625 |
|
| 62,036 |
|
| — |
|
| — |
|
| ||||
Redeemed |
| (67,890 | ) |
| (168,578 | ) |
| — |
|
| — |
|
| ||||
Net Increase (Decrease) in Net Assets Resulting from Capital Share Transactions |
| (68,126 | ) |
| (159,507 | ) |
| 5,693 |
|
| 1,309 |
|
| ||||
Redemption Fees |
| 33 |
|
| 71 |
|
| — |
|
| — |
|
| ||||
Total Increase (Decrease) in Net Assets |
| (538,672 | ) |
| (821,066 | ) |
| (3,657 | ) |
| 207 |
|
| ||||
Net Assets: |
|
|
|
|
|
|
|
|
|
|
|
|
| ||||
Beginning of Period |
| 1,083,397 |
|
| 1,904,463 |
|
| 20,207 |
|
| 20,000 |
|
| ||||
End of Period |
| $ | 544,725 |
|
| $ | 1,083,397 |
|
| $ | 16,550 |
|
| $ | 20,207 |
|
|
Undistributed Net Investment Income Included in End of Period Net Assets |
| $ | 258 |
|
| $ | 1,114 |
|
| $ | 1 |
|
| $ | 6 |
|
|
(1) Capital Share Transactions: |
|
|
|
|
|
|
|
|
|
|
|
|
| ||||
Class I: |
|
|
|
|
|
|
|
|
|
|
|
|
| ||||
Shares Subscribed |
| 18,700 |
|
| 12,926 |
|
| 864 |
|
| 2,125 |
|
| ||||
Shares Issued on Distributions Reinvested |
| 5,475 |
|
| 20,310 |
|
| 1 |
|
| — |
|
| ||||
Shares Redeemed |
| (31,461 | ) |
| (33,292 | ) |
| (175 | ) |
| (2 | ) |
| ||||
Net Increase (Decrease) in Class I Shares Outstanding |
| (7,286 | ) |
| (56 | ) |
| 690 |
|
| 2,123 |
|
| ||||
Class P: |
|
|
|
|
|
|
|
|
|
|
|
|
| ||||
Shares Subscribed |
| 4,111 |
|
| 3,955 |
|
| — |
|
| 10 |
|
| ||||
Shares Issued on Distributions Reinvested |
| 1,009 |
|
| 3,756 |
|
| — |
|
| — |
|
| ||||
Shares Redeemed |
| (5,194 | ) |
| (6,266 | ) |
| — |
|
| — |
|
| ||||
Net Increase (Decrease) in Class P Shares Outstanding |
| (74 | ) |
| 1,445 |
|
| — |
|
| 10 |
|
| ||||
^ U.S. Small/Mid Cap Value commenced operations on September 27, 2007.
@ Amount is less than $500.
| The accompanying notes are an integral part of the financial statements. | 113 |
2008 Annual Report |
|
December 31, 2008 |
Statements of Changes in Net Assets
|
| Emerging Markets Debt |
| ||||||
|
| Portfolio |
| ||||||
|
| Year Ended |
| Year Ended |
| ||||
|
| December 31, |
| December 31, |
| ||||
|
| 2008 |
| 2007 |
| ||||
|
| (000) |
| (000) |
| ||||
Increase (Decrease) in Net Assets |
|
|
|
|
| ||||
Operations: |
|
|
|
|
| ||||
Net Investment Income |
| $ | 3,226 |
|
| $ | 3,188 |
|
|
Net Realized Gain |
| (3,312 | ) |
| 4,437 |
|
| ||
Net Change in Unrealized Appreciation (Depreciation) |
| (2,442 | ) |
| (5,719 | ) |
| ||
Net Increase (Decrease) in Net Assets Resulting from Operations |
| (2,528 | ) |
| 1,906 |
|
| ||
Distributions from and/or in Excess of: |
|
|
|
|
|
|
| ||
Class I: |
|
|
|
|
|
|
| ||
Net Investment Income |
| (756 | ) |
| (4,215 | ) |
| ||
Class P: |
|
|
|
|
|
|
| ||
Net Investment Income |
| (76 | ) |
| (68 | ) |
| ||
Class H: |
|
|
|
|
|
|
| ||
Net Investment Income |
| (149 | ) |
| — |
|
| ||
Class L: |
|
|
|
|
|
|
| ||
Net Investment Income |
| (8 | ) |
| — |
|
| ||
Total Distributions |
| (989 | ) |
| (4,283 | ) |
| ||
Capital Share Transactions:(1) |
|
|
|
|
|
|
| ||
Class I: |
|
|
|
|
|
|
| ||
Subscribed |
| 29,549 |
|
| 17,784 |
|
| ||
Distributions Reinvested |
| 211 |
|
| 4,205 |
|
| ||
Redeemed |
| (58,315 | ) |
| (48,197 | ) |
| ||
Class P: |
|
|
|
|
|
|
| ||
Subscribed |
| 4,082 |
|
| 423 |
|
| ||
Distributions Reinvested |
| 76 |
|
| 68 |
|
| ||
Redeemed |
| (885 | ) |
| (141 | ) |
| ||
Class H: |
|
|
|
|
|
|
| ||
Subscribed |
| 5,169 |
|
| — |
|
| ||
Distributions Reinvested |
| 146 |
|
| — |
|
| ||
Redeemed |
| (2,848 | ) |
| — |
|
| ||
Class L: |
|
|
|
|
|
|
| ||
Subscribed |
| 396 |
|
| — |
|
| ||
Distributions Reinvested |
| 8 |
|
| — |
|
| ||
Redeemed |
| (1 | ) |
| — |
|
| ||
Net Decrease in Net Assets Resulting from Capital Share Transactions |
| (22,412 | ) |
| (25,858 | ) |
| ||
Redemption Fees |
| — |
|
| 14 |
|
| ||
Total Decrease in Net Assets |
| (25,929 | ) |
| (28,221 | ) |
| ||
Net Assets: |
|
|
|
|
|
|
| ||
Beginning of Period |
| 53,556 |
|
| 81,777 |
|
| ||
End of Period |
| $ | 27,627 |
|
| $ | 53,556 |
|
|
Undistributed (Distributions in Excess of) Net Investment Income Included in End of Period Net Assets |
| $ | 6,113 |
|
| $ | (270 | ) |
|
114 | The accompanying notes are an integral part of the financial statements. |
|
| 2008 Annual Report |
|
|
| December 31, 2008 |
Statements of Changes in Net Assets
|
| Emerging Markets Debt |
| ||||
|
| Portfolio |
| ||||
|
| Year Ended |
| Year Ended |
| ||
|
| December 31, |
| December 31, |
| ||
|
| 2008 |
| 2007 |
| ||
|
| (000) |
| (000) |
| ||
(1) Capital Share Transactions: |
|
|
|
|
| ||
Class I: |
|
|
|
|
| ||
Shares Subscribed |
| 2,569 |
|
| 1,441 |
|
|
Shares Issued on Distributions Reinvested |
| 20 |
|
| 371 |
|
|
Shares Redeemed |
| (4,979 | ) |
| (3,993 | ) |
|
Net Decrease in Class I Shares Outstanding |
| (2,390 | ) |
| (2,181 | ) |
|
Class P: |
|
|
|
|
|
|
|
Shares Subscribed |
| 371 |
|
| 33 |
|
|
Shares Issued on Distributions Reinvested |
| 7 |
|
| 6 |
|
|
Shares Redeemed |
| (94 | ) |
| (11 | ) |
|
Net Increase in Class P Shares Outstanding |
| 284 |
|
| 28 |
|
|
Class H: |
|
|
|
|
|
|
|
Shares Subscribed |
| 431 |
|
| — |
|
|
Shares Issued on Distributions Reinvested |
| 13 |
|
| — |
|
|
Shares Redeemed |
| (271 | ) |
| — |
|
|
Net Increase in Class H Shares Outstanding |
| 173 |
|
| — |
|
|
Class L: |
|
|
|
|
|
|
|
Shares Subscribed |
| 33 |
|
| — |
|
|
Shares Issued on Distributions Reinvested |
| 1 |
|
| — |
|
|
Shares Redeemed |
| — | # |
| — |
|
|
Net Increase in Class L Shares Outstanding |
| 34 |
|
| — |
|
|
# Shares are less than 500.
| The accompanying notes are an integral part of the financial statements. | 115 |
2008 Annual Report |
|
|
|
|
|
December 31, 2008 |
|
|
Statement of Cash Flows
|
| International |
| ||
|
| Growth |
| ||
|
| Active |
| ||
|
| Extension |
| ||
|
| Portfolio |
| ||
|
| (000) |
| ||
Cash Flows From Operating Activities: |
|
|
| ||
Proceeds from Sales and Maturities of Investments |
| $ | 5,823 |
|
|
Purchases of Investments |
| (5,996 | ) |
| |
Proceeds from Securities Sold Short |
| 4,370 |
|
| |
Covers of Securities Sold Short |
| (4,944 | ) |
| |
Net (Increase) Decrease in Short-Term Investments |
| 31 |
|
| |
Net (Increase) Decrease in Foreign Currency Holdings |
| 15 |
|
| |
Net (Increase) Decrease in Cash Overdrafts |
| 42 |
|
| |
Net Realized Gain (Loss) for Foreign Currency Transactions |
| 1 |
|
| |
Net Realized Gain (Loss) on Futures Contracts |
| (20 | ) |
| |
Net Investment Income |
| 138 |
|
| |
Adjustments to Reconcile Net Investment Income to Net Cash Provided by Operating Activities: |
|
|
|
| |
Net (Increase) Decrease in Receivables Related to Operations |
| 1 |
|
| |
Net Increase (Decrease) in Payables Related to Operations |
| 6 |
|
| |
Net Cash Provided (Used) by Operating Activities |
| (533 | ) |
| |
Cash Flows from Financing Activities: |
|
|
|
| |
Proceeds from Portfolio Shares Sold |
| 960 |
|
| |
Payment on Portfolio Shares Redeemed |
| (273 | ) |
| |
Cash Dividends and Distributions Paid |
| (154 | ) |
| |
Net Cash Received (Paid) from Financing Activities |
| 533 |
|
| |
Net Increase (Decrease) in Cash |
| — |
|
| |
Cash at Beginning of Period |
| — |
|
| |
Cash at End of Period |
| $ | — |
|
|
|
|
|
|
| |
Supplemental Disclosure of Cash Flow Information: |
|
|
|
| |
Interest Paid on Short Positions during the Period |
| 128 |
|
| |
116 | The accompanying notes are an integral part of the financial statements. |
|
| 2008 Annual Report |
|
|
| December 31, 2008 |
Financial Highlights
Active International Allocation Portfolio
|
| Class I | |||||||||
|
| Year Ended December 31, | |||||||||
Selected Per Share Data and Ratios |
| 2008 |
| 2007 |
| 2006 |
| 2005 |
| 2004 |
|
Net Asset Value, Beginning of Period |
| $ 15.92 |
| $ 15.10 |
| $ 12.43 |
| $ 10.96 |
| $ 9.58 |
|
Income (Loss) from Investment Operations |
|
|
|
|
|
|
|
|
|
|
|
Net Investment Income† |
| 0.35 |
| 0.30 |
| 0.27 |
| 0.21 |
| 0.13 |
|
Net Realized and Unrealized Gain (Loss) on Investments |
| (6.41 | ) | 1.96 |
| 2.75 |
| 1.40 |
| 1.46 |
|
Total from Investment Operations |
| (6.06 | ) | 2.26 |
| 3.02 |
| 1.61 |
| 1.59 |
|
Distributions from and/or in Excess of: |
|
|
|
|
|
|
|
|
|
|
|
Net Investment Income |
| (0.14 | ) | (0.54 | ) | (0.35 | ) | (0.14 | ) | (0.21 | ) |
Net Realized Gain |
| (0.61 | ) | (0.90 | ) | — |
| — |
| — |
|
Total Distributions |
| (0.75 | ) | (1.44 | ) | (0.35 | ) | (0.14 | ) | (0.21 | ) |
Redemption Fees |
| 0.00 | ‡ | 0.00 | ‡ | 0.00 | ‡ | 0.00 | ‡ | — |
|
Net Asset Value, End of Period |
| $ 9.11 |
| $ 15.92 |
| $ 15.10 |
| $ 12.43 |
| $ 10.96 |
|
Total Return++ |
| (39.25 | )% | 15.30 | % | 24.34 | % | 14.85 | % | 16.64 | % |
Ratios and Supplemental Data: |
|
|
|
|
|
|
|
|
|
|
|
Net Assets, End of Period (Thousands) |
| $565,313 |
| $1,093,735 |
| $967,361 |
| $792,329 |
| $580,851 |
|
Ratio of Expenses to Average Net Assets (1) |
| 0.79 | %+ | 0.80 | %+ | 0.80 | % | 0.80 | % | 0.80 | % |
Ratio of Expenses to Average Net Assets Excluding Non Operating Expenses |
| 0.79 | %+ | 0.80 | %+ | 0.80 | % | 0.80 | % | 0.80 | % |
Ratio of Net Investment Income to Average Net Assets (1) |
| 2.70 | %+ | 1.93 | %+ | 1.99 | % | 1.84 | % | 1.28 | % |
Portfolio Turnover Rate |
| 34 | % | 28 | % | 16 | % | 24 | % | 24 | % |
(1) Supplemental Information on the Ratios to Average Net Assets: |
|
|
|
|
|
|
|
|
|
|
|
Ratios before expense limitation: |
|
|
|
|
|
|
|
|
|
|
|
Expenses to Average Net Assets |
| 0.82 | %+ | 0.81 | %+ | 0.82 | % | 0.83 | % | 0.91 | % |
Net Investment Income to Average Net Assets |
| 2.67 | %+ | 1.92 | %+ | 1.97 | % | 1.81 | % | 1.18 | % |
|
|
|
|
|
|
|
|
|
|
|
|
|
| Class P | |||||||||
|
| Year Ended December 31, | |||||||||
Selected Per Share Data and Ratios |
| 2008 |
| 2007 |
| 2006 |
| 2005 |
| 2004 |
|
Net Asset Value, Beginning of Period |
| $ 16.20 |
| $ 15.36 |
| $ 12.64 |
| $ 11.13 |
| $ 9.72 |
|
Income (Loss) from Investment Operations |
|
|
|
|
|
|
|
|
|
|
|
Net Investment Income† |
| 0.29 |
| 0.24 |
| 0.22 |
| 0.19 |
| 0.10 |
|
Net Realized and Unrealized Gain (Loss) on Investments |
| (6.48 | ) | 2.01 |
| 2.81 |
| 1.43 |
| 1.35 |
|
Total from Investment Operations |
| (6.19 | ) | 2.25 |
| 3.03 |
| 1.62 |
| 1.45 |
|
Distributions from and/or in Excess of: |
|
|
|
|
|
|
|
|
|
|
|
Net Investment Income |
| (0.13 | ) | (0.51 | ) | (0.31 | ) | (0.11 | ) | (0.17 | ) |
Net Realized Gain |
| (0.61 | ) | (0.90 | ) | — |
| — |
| — |
|
Total Distributions |
| (0.74 | ) | (1.41 | ) | (0.31 | ) | (0.11 | ) | (0.17 | ) |
Redemption Fees |
| 0.00 | ‡ | 0.00 | ‡ | 0.00 | ‡ | 0.00 | ‡ | 0.13 |
|
Net Asset Value, End of Period |
| $ 9.27 |
| $ 16.20 |
| $ 15.36 |
| $ 12.64 |
| $ 11.13 |
|
Total Return++ |
| (39.41 | )% | 14.95 | % | 23.95 | % | 14.67 | % | 16.29 | % |
Ratios and Supplemental Data: |
|
|
|
|
|
|
|
|
|
|
|
Net Assets, End of Period (Thousands) |
| $ 7,614 |
| $ 5,285 |
| $ 3,573 |
| $ 2,215 |
| $ 2,623 |
|
Ratio of Expenses to Average Net Assets (1) |
| 1.04 | %+ | 1.05 | %+ | 1.05 | % | 1.05 | % | 1.05 | % |
Ratio of Expenses to Average Net Assets Excluding Non Operating Expenses |
| 1.04 | %+ | 1.05 | %+ | 1.05 | % | 1.05 | % | 1.05 | % |
Ratio of Net Investment Income to Average Net Assets (1) |
| 2.32 | %+ | 1.52 | %+ | 1.61 | % | 1.69 | % | 1.03 | % |
Portfolio Turnover Rate |
| 34 | % | 28 | % | 16 | % | 24 | % | 24 | % |
(1) Supplemental Information on the Ratios to Average Net Assets: |
|
|
|
|
|
|
|
|
|
|
|
Ratios before expense limitation: |
|
|
|
|
|
|
|
|
|
|
|
Expenses to Average Net Assets |
| 1.07 | %+ | 1.06 | %+ | 1.07 | % | 1.08 | % | 1.16 | % |
Net Investment Income to Average Net Assets |
| 2.29 | %+ | 1.51 | %+ | 1.59 | % | 1.66 | % | 0.92 | % |
† | Per share amount is based on average shares outstanding. |
‡ | Amount is less than $0.005 per share. |
++ | Calculated based on the net asset value as of the last business day of the period. |
+ | Reflects rebate of certain Portfolio expenses in connection with the investments in Morgan Stanley Institutional Liquidity Money Market Portfolio — Institutional Class during the period. As a result of such rebate, the expenses as a percentage of its net assets were effected by approximately 0.01% and less than 0.005% for the years ended December 31, 2008 and December 31, 2007, respectively. |
| The accompanying notes are an integral part of the financial statements. | 117 |
2008 Annual Report |
|
|
|
December 31, 2008 |
|
Financial Highlights
Emerging Markets Portfolio
|
| Class I | |||||||||
|
| Year Ended December 31, | |||||||||
Selected Per Share Data and Ratios |
| 2008 |
| 2007 |
| 2006 |
| 2005 |
| 2004 |
|
Net Asset Value, Beginning of Period |
| $ 34.02 |
| $ 29.29 |
| $ 25.36 |
| $ 19.10 |
| $ 15.52 |
|
Income (Loss) from Investment Operations |
|
|
|
|
|
|
|
|
|
|
|
Net Investment Income† |
| 0.19 |
| 0.10 |
| 0.18 |
| 0.25 |
| 0.19 |
|
Net Realized and Unrealized Gain (Loss) on Investments |
| (18.78 | ) | 11.76 |
| 9.22 |
| 6.36 |
| 3.54 |
|
Total from Investment Operations |
| (18.59 | ) | 11.86 |
| 9.40 |
| 6.61 |
| 3.73 |
|
Distributions from and/or in Excess of: |
|
|
|
|
|
|
|
|
|
|
|
Net Investment Income |
| — |
| (0.13 | ) | (0.29 | ) | (0.35 | ) | (0.15 | ) |
Net Realized Gain |
| (1.64 | ) | (7.01 | ) | (5.18 | ) | — |
| — |
|
Total Distributions |
| (1.64 | ) | (7.14 | ) | (5.47 | ) | (0.35 | ) | (0.15 | ) |
Redemption Fees |
| 0.00 | ‡ | 0.01 |
| 0.00 | ‡ | 0.00 | ‡ | 0.00 | ‡ |
Net Asset Value, End of Period |
| $ 13.79 |
| $ 34.02 |
| $ 29.29 |
| $ 25.36 |
| $ 19.10 |
|
Total Return++ |
| (56.39 | )% | 41.56 | % | 38.00 | % | 34.54 | % | 24.09 | % |
Ratios and Supplemental Data: |
|
|
|
|
|
|
|
|
|
|
|
Net Assets, End of Period (Thousands) |
| $1,191,199 |
| $3,323,130 |
| $2,283,535 |
| $1,749,671 |
| $1,249,299 |
|
Ratio of Expenses to Average Net Assets |
| 1.43 | %+ | 1.35 | %+ | 1.40 | % | 1.41 | % | 1.52 | %^^ |
Ratio of Expenses to Average Net Assets Excluding Non Operating Expenses |
| 1.43 | %+ | 1.35 | %+ | 1.40 | % | 1.41 | % | 1.52 | % |
Ratio of Net Investment Income to Average Net Assets |
| 0.78 | %+ | 0.28 | %+ | 0.62 | % | 1.17 | % | 1.09 | % |
Portfolio Turnover Rate |
| 96 | % | 101 | % | 82 | % | 59 | % | 73 | % |
† | Per share amount is based on average shares outstanding. |
‡ | Amount is less than $0.005 per share. |
++ | Calculated based on the net asset value as of the last business day of the period. |
+ | Reflects rebate of certain Portfolio expenses in connection with the investments in Morgan Stanley Institutional Liquidity Money Market Portfolio — Institutional Class during the period. As a result of such rebate, the expenses as a percentage of its net assets were effected by less than 0.005%. |
^^ | Effective November 1, 2004, the Adviser has voluntarily agreed to limit the ratio of expenses to average net assets to the maximum ratio of 1.65% for Class I shares. Prior to November 1, 2004, the maximum ratio was 1.75% for Class I shares. |
118 | The accompanying notes are an integral part of the financial statements. |
|
| 2008 Annual Report |
|
|
| December 31, 2008 |
Financial Highlights
Emerging Markets Portfolio
|
| Class P | |||||||||
|
| Year Ended December 31, | |||||||||
Selected Per Share Data and Ratios |
| 2008 |
| 2007 |
| 2006 |
| 2005 |
| 2004 |
|
Net Asset Value, Beginning of Period |
| $ 33.46 |
| $ 28.91 |
| $ 25.07 |
| $ 18.90 |
| $ 15.36 |
|
Income (Loss) from Investment Operations |
|
|
|
|
|
|
|
|
|
|
|
Net Investment Income† |
| 0.13 |
| 0.01 |
| 0.13 |
| 0.19 |
| 0.15 |
|
Net Realized and Unrealized Gain (Loss) on Investments |
| (18.44 | ) | 11.60 |
| 9.09 |
| 6.26 |
| 3.49 |
|
Total from Investment Operations |
| (18.31 | ) | 11.61 |
| 9.22 |
| 6.45 |
| 3.64 |
|
Distributions from and/or in Excess of: |
|
|
|
|
|
|
|
|
|
|
|
Net Investment Income |
| — |
| (0.05 | ) | (0.20 | ) | (0.29 | ) | (0.11 | ) |
Net Realized Gain |
| (1.64 | ) | (7.01 | ) | (5.18 | ) | — |
| — |
|
Total Distributions |
| (1.64 | ) | (7.06 | ) | (5.38 | ) | (0.29 | ) | (0.11 | ) |
Redemption Fees |
| 0.00 | ‡ | 0.00 | ‡ | 0.00 | ‡ | 0.01 |
| 0.01 |
|
Net Asset Value, End of Period |
| $ 13.51 |
| $ 33.46 |
| $ 28.91 |
| $ 25.07 |
| $ 18.90 |
|
Total Return++ |
| (56.50 | )% | 41.20 | % | 37.65 | % | 34.17 | % | 23.84 | % |
Ratios and Supplemental Data: |
|
|
|
|
|
|
|
|
|
|
|
Net Assets, End of Period (Thousands) |
| $67,559 |
| $179,834 |
| $126,450 |
| $103,482 |
| $71,254 |
|
Ratio of Expenses to Average Net Assets |
| 1.68 | %+ | 1.60 | %+ | 1.65 | % | 1.66 | % | 1.77 | %^^ |
Ratio of Expenses to Average Net Assets Excluding Non Operating Expenses |
| 1.68 | %+ | 1.60 | %+ | 1.65 | % | 1.66 | % | 1.77 | % |
Ratio of Net Investment Income to Average Net Assets |
| 0.52 | %+ | 0.02 | %+ | 0.47 | % | 0.90 | % | 0.89 | % |
Portfolio Turnover Rate |
| 96 | % | 101 | % | 82 | % | 59 | % | 73 | % |
† | Per share amount is based on average shares outstanding. |
‡ | Amount is less than $0.005 per share. |
++ | Calculated based on the net asset value as of the last business day of the period. |
+ | Reflects rebate of certain Portfolio expenses in connection with the investments in Morgan Stanley Institutional Liquidity Money Market Portfolio — Institutional Class during the period. As a result of such rebate, the expenses as a percentage of its net assets were effected by less than 0.005%. |
^^ | Effective November 1, 2004, the Adviser has voluntarily agreed to limit the ratio of expenses to average net assets to the maximum ratio of 1.90% for Class P shares. Prior to November 1, 2004, the maximum ratio was 2.00% for Class P shares. |
| The accompanying notes are an integral part of the financial statements. | 119 |
2008 Annual Report |
|
|
|
December 31, 2008 |
|
Financial Highlights
Global Franchise Portfolio
|
| Class I | |||||||||
|
| Year Ended December 31, | |||||||||
Selected Per Share Data and Ratios |
| 2008 |
| 2007 |
| 2006 |
| 2005 |
| 2004 |
|
Net Asset Value, Beginning of Period |
| $ 16.62 |
| $ 17.98 |
| $ 15.69 |
| $ 15.12 |
| $ 14.29 |
|
Income (Loss) from Investment Operations |
|
|
|
|
|
|
|
|
|
|
|
Net Investment Income† |
| 0.35 |
| 0.40 |
| 0.30 |
| 0.26 |
| 0.27 |
|
Net Realized and Unrealized Gain (Loss) on Investments |
| (5.11 | ) | 1.30 |
| 3.07 |
| 1.52 |
| 1.66 |
|
Total from Investment Operations |
| (4.76 | ) | 1.70 |
| 3.37 |
| 1.78 |
| 1.93 |
|
Distributions from and/or in Excess of: |
|
|
|
|
|
|
|
|
|
|
|
Net Investment Income |
| (0.84 | ) | (0.15 | ) | (0.13 | ) | (0.31 | ) | — |
|
Net Realized Gain |
| (0.20 | ) | (2.91 | ) | (0.95 | ) | (0.90 | ) | (1.13 | ) |
Total Distributions |
| (1.04 | ) | (3.06 | ) | (1.08 | ) | (1.21 | ) | (1.13 | ) |
Redemption Fees |
| — |
| — |
| 0.00 | ‡ | 0.00 | ‡ | 0.03 |
|
Net Asset Value, End of Period |
| $ 10.82 |
| $ 16.62 |
| $ 17.98 |
| $ 15.69 |
| $ 15.12 |
|
Total Return++ |
| (28.88 | )% | 9.58 | % | 21.60 | % | 11.91 | % | 13.77 | % |
Ratios and Supplemental Data: |
|
|
|
|
|
|
|
|
|
|
|
Net Assets, End of Period (Thousands) |
| $78,029 |
| $110,135 |
| $128,434 |
| $85,018 |
| $58,223 |
|
Ratio of Expenses to Average Net Assets (1) |
| 1.00 | %+ | 0.99 | %+ | 1.00 | % | 1.00 | % | 1.00 | % |
Ratio of Expenses to Average Net Assets Excluding Non Operating Expenses |
| 1.00 | %+ | 0.98 | %+ | 1.00 | % | 1.00 | % | N/A |
|
Ratio of Net Investment Income to Average Net Assets (1) |
| 2.49 | %+ | 2.10 | %+ | 1.74 | % | 1.67 | % | 1.82 | % |
Portfolio Turnover Rate |
| 31 | % | 22 | % | 35 | % | 19 | % | 21 | % |
(1) Supplemental Information on the Ratios to Average Net Assets: |
|
|
|
|
|
|
|
|
|
|
|
Ratios before expense limitation: |
|
|
|
|
|
|
|
|
|
|
|
Expenses to Average Net Assets |
| 1.01 | %+ | N/A |
| 1.01 | % | 1.07 | % | 1.16 | % |
Net Investment Income to Average Net Assets |
| 2.48 | %+ | N/A |
| 1.73 | % | 1.60 | % | 1.66 | % |
|
|
|
|
|
|
|
|
|
|
|
|
|
| Class P | |||||||||
|
| Year Ended December 31, | |||||||||
Selected Per Share Data and Ratios |
| 2008 |
| 2007 |
| 2006 |
| 2005 |
| 2004 |
|
Net Asset Value, Beginning of Period |
| $ 16.44 |
| $ 17.82 |
| $ 15.56 |
| $ 15.01 |
| $ 14.22 |
|
Income (Loss) from Investment Operations |
|
|
|
|
|
|
|
|
|
|
|
Net Investment Income† |
| 0.34 |
| 0.30 |
| 0.24 |
| 0.24 |
| 0.22 |
|
Net Realized and Unrealized Gain (Loss) on Investments |
| (5.07 | ) | 1.34 |
| 3.04 |
| 1.48 |
| 1.69 |
|
Total from Investment Operations |
| (4.73 | ) | 1.64 |
| 3.28 |
| 1.72 |
| 1.91 |
|
Distributions from and/or in Excess of: |
|
|
|
|
|
|
|
|
|
|
|
Net Investment Income |
| (0.80 | ) | (0.11 | ) | (0.07 | ) | (0.27 | ) | — |
|
Net Realized Gain |
| (0.20 | ) | (2.91 | ) | (0.95 | ) | (0.90 | ) | (1.13 | ) |
Total Distributions |
| (1.00 | ) | (3.02 | ) | (1.02 | ) | (1.17 | ) | (1.13 | ) |
Redemption Fees |
| — |
| — |
| 0.00 | ‡ | — |
| 0.01 |
|
Net Asset Value, End of Period |
| $ 10.71 |
| $ 16.44 |
| $ 17.82 |
| $ 15.56 |
| $ 15.01 |
|
Total Return++ |
| (29.00 | )% | 9.26 | % | 21.31 | % | 11.53 | % | 13.56 | % |
Ratios and Supplemental Data: |
|
|
|
|
|
|
|
|
|
|
|
Net Assets, End of Period (Thousands) |
| $ 2,892 |
| $ 6,327 |
| $ 4,135 |
| $ 4,401 |
| $ 3,941 |
|
Ratio of Expenses to Average Net Assets (1) |
| 1.25 | %+ | 1.24 | %+ | 1.25 | % | 1.25 | % | 1.25 | % |
Ratio of Expenses to Average Net Assets Excluding Non Operating Expenses |
| 1.25 | %+ | 1.23 | %+ | 1.25 | % | 1.25 | % | N/A |
|
Ratio of Net Investment Income to Average Net Assets (1) |
| 2.43 | %+ | 1.62 | %+ | 1.43 | % | 1.52 | % | 1.47 | % |
Portfolio Turnover Rate |
| 31 | % | 22 | % | 35 | % | 19 | % | 21 | % |
(1) Supplemental Information on the Ratios to Average Net Assets: |
|
|
|
|
|
|
|
|
|
|
|
Ratios before expense limitation: |
|
|
|
|
|
|
|
|
|
|
|
Expenses to Average Net Assets |
| 1.26 | %+ | N/A |
| 1.26 | % | 1.32 | % | 1.41 | % |
Net Investment Income to Average Net Assets |
| 2.42 | %+ | N/A |
| 1.42 | % | 1.45 | % | 1.31 | % |
† | Per share amount is based on average shares outstanding. |
‡ | Amount is less than $0.005 per share. |
++ | Calculated based on the net asset value as of the last business day of the period. |
+ | Reflects rebate of certain Portfolio expenses in connection with the investments in Morgan Stanley Institutional Liquidity Money Market Portfolio — Institutional Class during the period. As a result of such rebate, the expenses as a percentage of its net assets were effected by approximately 0.01% and less than 0.005% for the years ended December 31, 2008 and December 31, 2007, respectively. |
120 | The accompanying notes are an integral part of the financial statements. |
|
| 2008 Annual Report |
|
|
| December 31, 2008 |
Financial Highlights
Global Real Estate Portfolio
|
| Class I | |||||
|
| Year Ended December 31, |
| Period from | |||
Selected Per Share Data and Ratios |
| 2008 |
| 2007 |
| December 31, 2006 | |
Net Asset Value, Beginning of Period |
| $ 10.04 |
| $ 11.56 |
| $ 10.00 |
|
Income (Loss) from Investment Operations |
|
|
|
|
|
|
|
Net Investment Income† |
| 0.16 |
| 0.18 |
| 0.06 |
|
Net Realized and Unrealized Gain (Loss) on Investments |
| (4.67 | ) | (1.09 | ) | 1.66 |
|
Total from Investment Operations |
| (4.51 | ) | (0.91 | ) | 1.72 |
|
Distributions from and/or in Excess of: |
|
|
|
|
|
|
|
Net Investment Income |
| (0.02 | ) | (0.40 | ) | (0.13 | ) |
Net Realized Gain |
| (0.02 | ) | (0.21 | ) | (0.03 | ) |
Total Distributions |
| (0.04 | ) | (0.61 | ) | (0.16 | ) |
Redemption Fees |
| 0.00 | ‡ | 0.00 | ‡ | 0.00 | ‡ |
Net Asset Value, End of Period |
| $5.49 |
| $10.04 |
| $11.56 |
|
Total Return++ |
| (45.00 | )% | 7.87 | % | 17.20 | %# |
Ratios and Supplemental Data: |
|
|
|
|
|
|
|
Net Assets, End of Period (Thousands) |
| $473,459 |
| $632,737 |
| $238,647 |
|
Ratio of Expenses to Average Net Assets (1) |
| 1.05 | %+ | 1.02 | %+ | 1.05 | %* |
Ratio of Expenses to Average Net Assets Excluding Non Operating Expenses |
| 1.04 | %+ | 1.02 | %+ | N/A |
|
Ratio of Net Investment Income to Average Net Assets (1) |
| 1.92 | %+ | 1.55 | %+ | 1.53 | %* |
Portfolio Turnover Rate |
| 40 | % | 39 | % | 4 | %# |
(1) Supplemental Information on the Ratios to Average Net Assets: |
|
|
|
|
|
|
|
Ratios before expense limitation: |
|
|
|
|
|
|
|
Expenses to Average Net Assets |
| N/A |
| N/A |
| 1.15 | %* |
Net Investment Income to Average Net Assets |
| N/A |
| N/A |
| 1.43 | %* |
|
|
|
|
|
|
|
|
|
| Class P | |||||
|
| Year Ended December 31, |
| Period from | |||
Selected Per Share Data and Ratios |
| 2008 |
| 2007 |
| December 31, 2006 | |
Net Asset Value, Beginning of Period |
| $ 10.02 |
| $ 11.56 |
| $ 10.00 |
|
Income (Loss) from Investment Operations |
|
|
|
|
|
|
|
Net Investment Income† |
| 0.16 |
| 0.16 |
| 0.04 |
|
Net Realized and Unrealized Gain (Loss) on Investments |
| (4.68 | ) | (1.11 | ) | 1.67 |
|
Total from Investment Operations |
| (4.52 | ) | (0.95 | ) | 1.71 |
|
Distributions from and/or in Excess of: |
|
|
|
|
|
|
|
Net Investment Income |
| (0.01 | ) | (0.38 | ) | (0.12 | ) |
Net Realized Gain |
| (0.02 | ) | (0.21 | ) | (0.03 | ) |
Total Distributions |
| (0.03 | ) | (0.59 | ) | (0.15 | ) |
Redemption Fees |
| 0.00 | ‡ | 0.00 | ‡ | 0.00 | ‡ |
Net Asset Value, End of Period |
| $ 5.47 |
| $ 10.02 |
| $ 11.56 |
|
Total Return++ |
| (45.15 | )% | (8.15 | )% | 17.11 | %# |
Ratios and Supplemental Data: |
|
|
|
|
|
|
|
Net Assets, End of Period (Thousands) |
| $ 44,555 |
| $ 13,187 |
| $ 116 |
|
Ratio of Expenses to Average Net Assets (1) |
| 1.30 | %+ | 1.27 | %+ | 1.30 | %* |
Ratio of Expenses to Average Net Assets Excluding Non Operating Expenses |
| 1.29 | %+ | 1.27 | %+ | N/A |
|
Ratio of Net Investment Income to Average Net Assets (1) |
| 2.32 | %+ | 1.39 | %+ | 1.07 | %* |
Portfolio Turnover Rate |
| 40 | % | 39 | % | 4 | %# |
(1) Supplemental Information on the Ratios to Average Net Assets: |
|
|
|
|
|
|
|
Ratios before expense limitation: |
|
|
|
|
|
|
|
Expenses to Average Net Assets |
| 1.32 | %+ | N/A |
| 1.41 | %* |
Net Investment Income to Average Net Assets |
| 2.30 | %+ | N/A |
| 0.96 | %* |
^ | Commencement of Operations |
† | Per share amount is based on average shares outstanding. |
‡ | Amount is less than $0.005 per share. |
++ | Calculated based on the net asset value as of the last business day of the period. |
# | Not Annualized |
+ | Reflects rebate of certain Portfolio expenses in connection with the investments in Morgan Stanley Institutional Liquidity Money Market Portfolio — Institutional Class during the period. As a result of such rebate, the expenses as a percentage of its net assets were effected by less than 0.005%. |
* | Annualized |
| The accompanying notes are an integral part of the financial statements. | 121 |
2008 Annual Report |
|
|
|
December 31, 2008 |
|
Financial Highlights
Global Real Estate Portfolio
|
| Class H | |
|
| Period from | |
|
| January 2, 2008^ | |
Selected Per Share Data and Ratios |
| to December 31, 2008 | |
Net Asset Value, Beginning of Period |
| $ 9.95 |
|
Income (Loss) from Investment Operations |
|
|
|
Net Investment Income† |
| 0.11 |
|
Net Realized and Unrealized Loss on Investments |
| (4.57 | ) |
Total from Investment Operations |
| (4.46 | ) |
Distributions from and/or in Excess of: |
|
|
|
Net Realized Gain |
| (0.02 | ) |
Net Asset Value, End of Period |
| $ 5.47 |
|
Total Return++ |
| (44.88 | )%# |
Ratios and Supplemental Data: |
|
|
|
Net Assets, End of Period (Thousands) |
| $ 391 |
|
Ratio of Expenses to Average Net Assets (1) |
| 1.70 | %*+ |
Ratio of Expenses to Average Net Assets Excluding Non Operating Expenses (1) |
| 1.29 | %*+ |
Ratio of Net Investment Income to Average Net Assets (1) |
| 1.42 | %*+ |
Portfolio Turnover Rate |
| 40 | % |
(1) Supplemental Information on the Ratios to Average Net Assets: |
|
|
|
Ratios before expense limitation: |
|
|
|
Expenses to Average Net Assets |
| 1.70 | %*+ |
Net Investment Income to Average Net Assets |
| 1.42 | %*+ |
^ | Commencement of Operations |
† | Per share amount is based on average shares outstanding. |
++ | Calculated based on the net asset value which does not reflect sales charges, if applicable, as of the last business day of the period. |
# | Not Annualized |
* | Annualized |
+ | Reflects rebate of certain Portfolio expenses in connection with the investments in Morgan Stanley Institutional Liquidity Money Market Portfolio — Institutional Class during the period. As a result of such rebate, the expenses as a percentage of its net assets were effected by less than 0.005%. |
122 | The accompanying notes are an integral part of the financial statements. |
|
| 2008 Annual Report |
|
|
| December 31, 2008 |
Financial Highlights
Global Real Estate Portfolio
|
| Class L | |
|
| Period from | |
|
| June 16, 2008^ | |
Selected Per Share Data and Ratios |
| to December 31, 2008 | |
Net Asset Value, Beginning of Period |
| $ 9.46 |
|
Income (Loss) from Investment Operations |
|
|
|
Net Investment Income† |
| 0.04 |
|
Net Realized and Unrealized Loss on Investments |
| (4.05 | ) |
Total from Investment Operations |
| (4.01 | ) |
Distributions from and/or in Excess of: |
|
|
|
Net Realized Gain |
| (0.02 | ) |
Net Asset Value, End of Period |
| $ 5.43 |
|
Total Return++ |
| (42.45 | )%# |
Ratios and Supplemental Data: |
|
|
|
Net Assets, End of Period (Thousands) |
| $ 261 |
|
Ratio of Expenses to Average Net Assets (1) |
| 1.81 | %*+ |
Ratio of Expenses to Average Net Assets Excluding Non Operating Expenses |
| 1.80 | %*+ |
Ratio of Net Investment Income to Average Net Assets (1) |
| 1.20 | %*+ |
Portfolio Turnover Rate |
| 40 | % |
(1) Supplemental Information on the Ratios to Average Net Assets: |
|
|
|
Ratios before expense limitation: |
|
|
|
Expenses to Average Net Assets |
| 1.84 | %*+ |
Net Investment Income to Average Net Assets |
| 1.17 | %*+ |
^ | Commencement of Operations |
† | Per share amount is based on average shares outstanding. |
++ | Calculated based on the net asset value as of the last business day of the period. |
# | Not Annualized |
* | Annualized |
+ | Reflects rebate of certain Portfolio expenses in connection with the investments in Morgan Stanley Institutional Liquidity Money Market Portfolio — Institutional Class during the period. As a result of such rebate, the expenses as a percentage of its net assets were effected by less than 0.005%. |
| The accompanying notes are an integral part of the financial statements. | 123 |
2008 Annual Report |
|
|
|
December 31, 2008 |
|
Financial Highlights
Global Value Equity Portfolio
|
| Class I | |||||||||
|
| Year Ended December 31, | |||||||||
Selected Per Share Data and Ratios |
| 2008 |
| 2007 |
| 2006 |
| 2005 |
| 2004 |
|
Net Asset Value, Beginning of Period |
| $ 17.70 |
| $ 20.24 |
| $ 17.85 |
| $ 17.81 |
| $ 15.84 |
|
Income (Loss) from Investment Operations |
|
|
|
|
|
|
|
|
|
|
|
Net Investment Income† |
| 0.40 |
| 0.33 |
| 0.33 |
| 0.31 |
| 0.22 |
|
Net Realized and Unrealized Gain (Loss) on Investments |
| (7.74 | ) | 0.96 |
| 3.44 |
| 0.72 |
| 2.02 |
|
Total from Investment Operations |
| (7.34 | ) | 1.29 |
| 3.77 |
| 1.03 |
| 2.24 |
|
Distributions from and/or in Excess of: |
|
|
|
|
|
|
|
|
|
|
|
Net Investment Income |
| (0.66 | ) | (0.34 | ) | (0.34 | ) | (0.31 | ) | (0.22 | ) |
Net Realized Gain |
| (0.21 | ) | (3.49 | ) | (1.05 | ) | (0.68 | ) | (0.05 | ) |
Total Distributions |
| (0.87 | ) | (3.83 | ) | (1.39 | ) | (0.99 | ) | (0.27 | ) |
Redemption Fees |
| 0.00 | ‡ | 0.00 | ‡ | 0.01 |
| 0.00 | ‡ | 0.00 | ‡ |
Net Asset Value, End of Period |
| $ 9.49 |
| $ 17.70 |
| $ 20.24 |
| $ 17.85 |
| $ 17.81 |
|
Total Return++ |
| (41.82 | )% | 6.65 | % | 21.40 | % | 5.81 | % | 14.13 | % |
Ratios and Supplemental Data: |
|
|
|
|
|
|
|
|
|
|
|
Net Assets, End of Period (Thousands) |
| $24,110 |
| $66,035 |
| $101,163 |
| $86,000 |
| $68,505 |
|
Ratio of Expenses to Average Net Assets (1) |
| 1.00 | %+ | 0.90 | %+ | 0.91 | % | 0.90 | % | 1.00 | % |
Ratio of Expenses to Average Net Assets Excluding Non Operating Expenses |
| 1.00 | %+ | 0.90 | %+ | N/A |
| N/A |
| 1.00 | % |
Ratio of Net Investment Income to Average Net Assets (1) |
| 2.82 | %+ | 1.58 | %+ | 1.71 | % | 1.74 | % | 1.31 | % |
Portfolio Turnover Rate |
| 86 | % | 31 | % | 29 | % | 29 | % | 30 | % |
(1) Supplemental Information on the Ratios to Average Net Assets: |
|
|
|
|
|
|
|
|
|
|
|
Ratios before expense limitation: |
|
|
|
|
|
|
|
|
|
|
|
Expenses to Average Net Assets |
| 1.02 | %+ | N/A |
| N/A |
| N/A |
| 1.07 | % |
Net Investment Income to Average Net Assets |
| 2.80 | %+ | N/A |
| N/A |
| N/A |
| 1.24 | % |
|
|
|
|
|
|
|
|
|
|
|
|
|
| Class P |
| ||||||||
|
| Year Ended December 31, |
| ||||||||
Selected Per Share Data and Ratios |
| 2008 |
| 2007 |
| 2006 |
| 2005 |
| 2004 |
|
Net Asset Value, Beginning of Period |
| $ 17.48 |
| $ 20.03 |
| $ 17.69 |
| $ 17.64 |
| $ 15.70 |
|
Income (Loss) from Investment Operations |
|
|
|
|
|
|
|
|
|
|
|
Net Investment Income† |
| 0.38 |
| 0.29 |
| 0.28 |
| 0.27 |
| 0.17 |
|
Net Realized and Unrealized Gain (Loss) on Investments |
| (7.66 | ) | 0.93 |
| 3.40 |
| 0.71 |
| 2.00 |
|
Total from Investment Operations |
| (7.28 | ) | 1.22 |
| 3.68 |
| 0.98 |
| 2.17 |
|
Distributions from and/or in Excess of: |
|
|
|
|
|
|
|
|
|
|
|
Net Investment Income |
| (0.62 | ) | (0.28 | ) | (0.29 | ) | (0.25 | ) | (0.18 | ) |
Net Realized Gain |
| (0.21 | ) | (3.49 | ) | (1.05 | ) | (0.68 | ) | (0.05 | ) |
Total Distributions |
| (0.83 | ) | (3.77 | ) | (1.34 | ) | (0.93 | ) | (0.23 | ) |
Redemption Fees |
| 0.00 | ‡ | 0.00 | ‡ | 0.00 | ‡ | 0.00 | ‡ | 0.00 | ‡ |
Net Asset Value, End of Period |
| $ 9.37 |
| $ 17.48 |
| $ 20.03 |
| $ 17.69 |
| $ 17.64 |
|
Total Return++ |
| (41.98 | )% | 6.37 | % | 21.05 | % | 5.59 | % | 13.78 | % |
Ratios and Supplemental Data: |
|
|
|
|
|
|
|
|
|
|
|
Net Assets, End of Period (Thousands) |
| $11,888 |
| $24,199 |
| $27,773 |
| $21,938 |
| $30,598 |
|
Ratio of Expenses to Average Net Assets (1) |
| 1.25 | %+ | 1.15 | %+ | 1.16 | % | 1.15 | % | 1.25 | % |
Ratio of Expenses to Average Net Assets Excluding Non Operating Expenses |
| 1.25 | %+ | 1.15 | %+ | N/A |
| N/A |
| 1.25 | % |
Ratio of Net Investment Income to Average Net Assets (1) |
| 2.65 | %+ | 1.36 | %+ | 1.47 | % | 1.53 | % | 1.07 | % |
Portfolio Turnover Rate |
| 86 | % | 31 | % | 29 | % | 29 | % | 30 | % |
(1) Supplemental Information on the Ratios to Average Net Assets: |
|
|
|
|
|
|
|
|
|
|
|
Ratios before expense limitation: |
|
|
|
|
|
|
|
|
|
|
|
Expenses to Average Net Assets |
| 1.27 | %+ | N/A |
| N/A |
| N/A |
| 1.32 | % |
Net Investment Income to Average Net Assets |
| 2.63 | %+ | N/A |
| N/A |
| N/A |
| 0.99 | % |
† | Per share amount is based on average shares outstanding. |
‡ | Amount is less than $0.005 per share. |
++ | Calculated based on the net asset value as of the last business day of the period. |
+ | Reflects rebate of certain Portfolio expenses in connection with the investments in Morgan Stanley Institutional Liquidity Money Market Portfolio — Institutional Class during the period. As a result of such rebate, the expenses as a percentage of its net assets were effected by less than 0.005%. |
124 | The accompanying notes are an integral part of the financial statements. |
|
| 2008 Annual Report |
|
|
| December 31, 2008 |
Financial Highlights
International Equity Portfolio
|
| Class I | |||||||||
|
| Year Ended December 31, | |||||||||
Selected Per Share Data and Ratios |
| 2008 |
| 2007 |
| 2006 |
| 2005 |
| 2004 |
|
Net Asset Value, Beginning of Period |
| $ 18.92 |
| $ 20.58 |
| $ 20.34 |
| $ 20.99 |
| $ 19.06 |
|
Income (Loss) from Investment Operations |
|
|
|
|
|
|
|
|
|
|
|
Net Investment Income† |
| 0.44 |
| 0.43 |
| 0.64 |
| 0.43 |
| 0.30 |
|
Net Realized and Unrealized Gain (Loss) on Investments |
| (6.76 | ) | 1.53 |
| 3.93 |
| 0.93 |
| 3.50 |
|
Total from Investment Operations |
| (6.32 | ) | 1.96 |
| 4.57 |
| 1.36 |
| 3.80 |
|
Distributions from and/or in Excess of: |
|
|
|
|
|
|
|
|
|
|
|
Net Investment Income |
| (0.41 | ) | (0.46 | ) | (0.59 | ) | (0.35 | ) | (0.37 | ) |
Net Realized Gain |
| (1.18 | ) | (3.16 | ) | (3.74 | ) | (1.66 | ) | (1.50 | ) |
Total Distributions |
| (1.59 | ) | (3.62 | ) | (4.33 | ) | (2.01 | ) | (1.87 | ) |
Redemption Fees |
| 0.00 | ‡ | 0.00 | ‡ | 0.00 | ‡ | 0.00 | ‡ | 0.00 | ‡ |
Net Asset Value, End of Period |
| $ 11.01 |
| $ 18.92 |
| $ 20.58 |
| $ 20.34 |
| $ 20.99 |
|
Total Return++ |
| (33.12 | )% | 9.84 | % | 22.50 | % | 6.45 | % | 19.96 | % |
Ratios and Supplemental Data: |
|
|
|
|
|
|
|
|
|
|
|
Net Assets, End of Period (Thousands) |
| $2,606,704 |
| $5,105,807 |
| $5,900,906 |
| $6,704,732 |
| $7,200,606 |
|
Ratio of Expenses to Average Net Assets |
| 0.95 | %+ | 0.93 | %+ | 0.94 | % | 0.93 | % | 0.98 | % |
Ratio of Expenses to Average Net Assets Excluding Non Operating Expenses |
| 0.95 | %+ | 0.93 | %+ | 0.94 | % | 0.93 | % | N/A |
|
Ratio of Net Investment Income to Average Net Assets |
| 2.73 | %+ | 1.97 | %+ | 2.88 | % | 2.04 | % | 1.48 | % |
Portfolio Turnover Rate |
| 34 | % | 31 | % | 38 | % | 28 | % | 41 | % |
|
|
|
|
|
|
|
|
|
|
|
|
|
| Class P | |||||||||
|
| Year Ended December 31, | |||||||||
Selected Per Share Data and Ratios |
| 2008 |
| 2007 |
| 2006 |
| 2005 |
| 2004 |
|
Net Asset Value, Beginning of Period |
| $ 18.73 |
| $ 20.40 |
| $ 20.19 |
| $ 20.85 |
| $ 18.96 |
|
Income (Loss) from Investment Operations |
|
|
|
|
|
|
|
|
|
|
|
Net Investment Income† |
| 0.38 |
| 0.37 |
| 0.60 |
| 0.37 |
| 0.24 |
|
Net Realized and Unrealized Gain (Loss) on Investments |
| (6.66 | ) | 1.52 |
| 3.87 |
| 0.93 |
| 3.47 |
|
Total from Investment Operations |
| (6.28 | ) | 1.89 |
| 4.47 |
| 1.30 |
| 3.71 |
|
Distributions from and/or in Excess of: |
|
|
|
|
|
|
|
|
|
|
|
Net Investment Income |
| (0.37 | ) | (0.40 | ) | (0.52 | ) | (0.30 | ) | (0.32 | ) |
Net Realized Gain |
| (1.18 | ) | (3.16 | ) | (3.74 | ) | (1.66 | ) | (1.50 | ) |
Total Distributions |
| (1.55 | ) | (3.56 | ) | (4.26 | ) | (1.96 | ) | (1.82 | ) |
Redemption Fees |
| 0.00 | ‡ | 0.00 | ‡ | 0.00 | ‡ | 0.00 | ‡ | 0.00 | ‡ |
Net Asset Value, End of Period |
| $ 10.90 |
| $ 18.73 |
| $ 20.40 |
| $ 20.19 |
| $ 20.85 |
|
Total Return++ |
| (33.21 | )% | 9.52 | % | 22.21 | % | 6.20 | % | 19.67 | % |
Ratios and Supplemental Data: |
|
|
|
|
|
|
|
|
|
|
|
Net Assets, End of Period (Thousands) |
| $ 687,196 |
| $1,019,595 |
| $1,152,822 |
| $1,206,125 |
| $1,073,278 |
|
Ratio of Expenses to Average Net Assets |
| 1.20 | %+ | 1.18 | %+ | 1.19 | % | 1.18 | % | 1.23 | % |
Ratio of Expenses to Average Net Assets Excluding Non Operating Expenses |
| 1.20 | %+ | 1.18 | %+ | 1.19 | % | 1.18 | % | N/A |
|
Ratio of Net Investment Income to Average Net Assets |
| 2.43 | %+ | 1.71 | %+ | 2.71 | % | 1.77 | % | 1.21 | % |
Portfolio Turnover Rate |
| 34 | % | 31 | % | 38 | % | 28 | % | 41 | % |
† | Per share amount is based on average shares outstanding. |
‡ | Amount is less than $0.005 per share. |
++ | Calculated based on the net asset value as of the last business day of the period. |
+ | Reflects rebate of certain Portfolio expenses in connection with the investments in Morgan Stanley Institutional Liquidity Money Market Portfolio — Institutional Class during the period. As a result of such rebate, the expenses as a percentage of its net assets were effected by less than 0.005%. |
| The accompanying notes are an integral part of the financial statements. | 125 |
2008 Annual Report |
|
|
|
December 31, 2008 |
|
Financial Highlights
International Growth Active Extension Portfolio
|
| Class I | ||||
|
| Year Ended |
| Period from | ||
|
| December 31, |
| July 31, 2007^ to | ||
Selected Per Share Data and Ratios |
| 2008 |
| December 31, 2007 | ||
Net Asset Value, Beginning of Period |
| $ 10.66 |
| $ 10.00 |
| |
Income (Loss) from Investment Operations |
|
|
|
|
| |
Net Investment Income (Loss)† |
| 0.14 |
| (0.02 | ) | |
Net Realized and Unrealized Gain (Loss) on Investments |
| (5.92 | ) | 0.68 |
| |
Total from Investment Operations |
| (5.78 | ) | 0.66 |
| |
Distributions from and/or in Excess of: |
|
|
|
|
| |
Net Investment Income |
| (0.14 | ) | — |
| |
Total Distributions |
| (0.14 | ) | — |
| |
Net Asset Value, End of Period |
| $ 4.74 |
| $ 10.66 |
| |
Total Return++ |
| (54.13 | )% | 6.60 | %# | |
Ratios and Supplemental Data: |
|
|
|
|
| |
Net Assets, End of Period (Thousands) |
| $ 4,697 |
| $10,553 |
| |
Ratio of Expenses to Average Net Assets (1) |
| 2.89 | %+ | 2.17 | %*+ | |
Ratio of Expenses to Average Net Assets Excluding Non Operating Expenses |
| 1.25 | %+ | 1.25 | %*+ | |
Ratio of Net Investment Income (Loss) to Average Net Assets (1) |
| 1.69 | %+ | (0.52 | )%*+ | |
Portfolio Turnover Rate |
| 51 | % | 20 | %# | |
(1) Supplemental Information on the Ratios to Average Net Assets: |
|
|
|
|
| |
Ratios before expense limitation: |
|
|
|
|
| |
Expenses to Average Net Assets |
| 4.77 | %+ | 3.84 | %*+ | |
Net Investment Loss to Average Net Assets |
| (0.19 | )%+ | (2.19 | )%*+ | |
|
|
|
|
|
| |
|
| Class P | ||||
|
| Year Ended |
| Period from | ||
|
| December 31, |
| July 31, 2007^ to | ||
Selected Per Share Data and Ratios |
| 2008 |
| December 31, 2007 | ||
Net Asset Value, Beginning of Period |
| $ 10.65 |
| $ 10.00 |
| |
Income (Loss) from Investment Operations |
|
|
|
|
| |
Net Investment Income (Loss)† |
| 0.12 |
| (0.03 | ) | |
Net Realized and Unrealized Gain (Loss) on Investments |
| (5.92 | ) | 0.68 |
| |
Total from Investment Operations |
| (5.80 | ) | 0.65 |
| |
Distributions from and/or in Excess of: |
|
|
|
|
| |
Net Investment Income |
| (0.12 | ) | — |
| |
Total Distributions |
| (0.12 | ) | — |
| |
Net Asset Value, End of Period |
| $ 4.73 |
| $ 10.65 |
| |
Total Return++ |
| (54.48 | )% | 6.50 | %# | |
Ratios and Supplemental Data: |
|
|
|
|
| |
Net Assets, End of Period (Thousands) |
| $ 47 |
| $ 106 |
| |
Ratio of Expenses to Average Net Assets (1) |
| 3.15 | %+ | 2.42 | %*+ | |
Ratio of Expenses to Average Net Assets Excluding Non Operating Expenses |
| 1.50 | %+ | 1.50 | %*+ | |
Ratio of Net Investment Income (Loss) to Average Net Assets (1) |
| 1.43 | %+ | (0.77 | )%*+ | |
Portfolio Turnover Rate |
| 51 | % | 20 | %# | |
(1) Supplemental Information on the Ratios to Average Net Assets: |
|
|
|
|
| |
Ratios before expense limitation: |
|
|
|
|
| |
Expenses to Average Net Assets |
| 5.01 | %+ | 4.09 | %*+ | |
Net Investment Loss to Average Net Assets |
| (0.40 | )%+ | (2.44 | )%*+ | |
^ | Commencement of Operations |
† | Per share amount is based on average shares outstanding. |
++ | Calculated based on the net asset value as of the last business day of the period. |
# | Not Annualized |
+ | Reflects rebate of certain Portfolio expenses in connection with the investments in Morgan Stanley Institutional Liquidity Money Market Portfolio — Institutional Class during the period. As a result of such rebate, the expenses as a percentage of its net assets were effected by less than 0.005%. |
* | Annualized |
126 | The accompanying notes are an integral part of the financial statements. |
|
| 2008 Annual Report |
|
|
| December 31, 2008 |
Financial Highlights
International Growth Active Extension Portfolio
|
| Class H | |
|
| Period from | |
|
| January 2, 2008^ | |
Selected Per Share Data and Ratios |
| to December 31, 2008 | |
Net Asset Value, Beginning of Period |
| $ 10.60 |
|
Income (Loss) from Investment Operations |
|
|
|
Net Investment Loss† |
| (0.01 | ) |
Net Realized and Unrealized Loss on Investments |
| (5.76 | ) |
Total from Investment Operations |
| (5.77 | ) |
Distributions from and/or in Excess of: |
|
|
|
Net Investment Income |
| (0.10 | ) |
Total Distributions |
| (0.10 | ) |
Net Asset Value, End of Period |
| $ 4.73 |
|
Total Return++ |
| (54.42 | )%# |
Ratios and Supplemental Data: |
|
|
|
Net Assets, End of Period (Thousands) |
| $ 266 |
|
Ratio of Expenses to Average Net Assets (1) |
| 3.40 | %*+ |
Ratio of Expenses to Average Net Assets Excluding Non Operating Expenses |
| 1.50 | %*+ |
Ratio of Net Investment Loss to Average Net Assets (1) |
| (0.12 | )%*+ |
Portfolio Turnover Rate |
| 51 | %# |
(1) Supplemental Information on the Ratios to Average Net Assets: |
|
|
|
Ratios before expense limitation: |
|
|
|
Expenses to Average Net Assets |
| 5.21 | %*+ |
Net Investment Loss to Average Net Assets |
| (1.93 | )%*+ |
^ | Commencement of Operations |
† | Per share amount is based on average shares outstanding. |
++ | Calculated based on the net asset value which does not reflect sales charges, if applicable, as of the last business day of the period. |
# | Not Annualized |
* | Annualized |
+ | Reflects rebate of certain Portfolio expenses in connection with the investments in Morgan Stanley Institutional Liquidity Money Market Portfolio — Institutional Class during the period. As a result of such rebate, the expenses as a percentage of its net assets were effected by less than 0.005%. |
| The accompanying notes are an integral part of the financial statements. | 127 |
2008 Annual Report |
|
|
|
December 31, 2008 |
|
Financial Highlights
International Growth Active Extension Portfolio
|
| Class L | |
|
| Period from | |
|
| June 16, 2008^ | |
Selected Per Share Data and Ratios |
| to December 31, 2008 | |
Net Asset Value, Beginning of Period |
| $ 9.84 |
|
Income (Loss) from Investment Operations |
|
|
|
Net Investment Loss† |
| (0.06 | ) |
Net Realized and Unrealized Loss on Investments |
| (4.96 | ) |
Total from Investment Operations |
| (5.02 | ) |
Distributions from and/or in Excess of: |
|
|
|
Net Investment Income |
| (0.12 | ) |
Total Distributions |
| (0.12 | ) |
Net Asset Value, End of Period |
| $ 4.70 |
|
Total Return++ |
| (50.96 | )%# |
Ratios and Supplemental Data: |
|
|
|
Net Assets, End of Period (Thousands) |
| $ 19 |
|
Ratio of Expenses to Average Net Assets (1) |
| 3.19 | %*+ |
Ratio of Expenses to Average Net Assets Excluding Non Operating Expenses |
| 2.00 | %*+ |
Ratio of Net Investment Loss to Average Net Assets (1) |
| (1.70 | )%*+ |
Portfolio Turnover Rate |
| 51 | %# |
(1) Supplemental Information on the Ratios to Average Net Assets: |
|
|
|
Ratios before expense limitation: |
|
|
|
Expenses to Average Net Assets |
| 4.99 | %*+ |
Net Investment Loss to Average Net Assets |
| (3.51 | )%*+ |
^ | Commencement of Operations |
† | Per share amount is based on average shares outstanding. |
++ | Calculated based on the net asset value as of the last business day of the period. |
# | Not Annualized |
* | Annualized |
+ | Reflects rebate of certain Portfolio expenses in connection with the investments in Morgan Stanley Institutional Liquidity Money Market Portfolio — Institutional Class during the period. As a result of such rebate, the expenses as a percentage of its net assets were effected by less than 0.005%. |
128 | The accompanying notes are an integral part of the financial statements. |
|
| 2008 Annual Report |
|
|
| December 31, 2008 |
Financial Highlights
International Growth Equity Portfolio
|
| Class I | |||||||||||||||||
|
|
|
|
|
|
|
| Period from | |||||||||||
|
| Year Ended December 31, |
| December 27, 2005^ to | |||||||||||||||
Selected Per Share Data and Ratios |
| 2008 |
| 2007 |
| 2006 |
| December 31, 2005 | |||||||||||
Net Asset Value, Beginning of Period |
| $ | 13.76 |
| $ | 12.55 |
| $ | 9.93 |
| $ | 10.00 |
| ||||||
Income (Loss) from Investment Operations |
|
|
|
|
|
|
|
|
| ||||||||||
Net Investment Income† |
| 0.31 |
| 0.13 |
| 0.10 |
| 0.00 | ‡ | ||||||||||
Net Realized and Unrealized Gain (Loss) on Investments |
| (6.98 | ) | 1.75 |
| 2.67 |
| (0.07 | ) | ||||||||||
Total from Investment Operations |
| (6.67 | ) | 1.88 |
| 2.77 |
| (0.07 | ) | ||||||||||
Distributions from and/or in Excess of: |
|
|
|
|
|
|
|
|
| ||||||||||
Net Investment Income |
| (0.32 | ) | (0.12 | ) | (0.09 | ) | — |
| ||||||||||
Net Realized Gain |
| (0.05 | ) | (0.55 | ) | (0.06 | ) | — |
| ||||||||||
Total Distributions |
| (0.37 | ) | (0.67 | ) | (0.15 | ) | — |
| ||||||||||
Net Asset Value, End of Period |
| $ | 6.72 |
| $ | 13.76 |
| $ | 12.55 |
| $ | 9.93 |
| ||||||
Total Return++ |
| (48.70 | )% | 15.22 | % | 27.92 | % | (0.70 | )%# | ||||||||||
Ratios and Supplemental Data: |
|
|
|
|
|
|
|
|
| ||||||||||
Net Assets, End of Period (Thousands) |
| $ | 40,756 |
| $ | 22,523 |
| $ | 6,753 |
| $ | 4,864 |
| ||||||
Ratio of Expenses to Average Net Assets (1) |
| 1.00 | %+ | 1.00 | %+ | 1.01 | % | 1.00 | %* | ||||||||||
Ratio of Expenses to Average Net Assets Excluding Non Operating Expenses |
| 1.00 | %+ | 1.00 | %+ | 1.00 | % | N/A |
| ||||||||||
Ratio of Net Investment Income (Loss) to Average Net Assets (1) |
| 2.86 | %+ | 0.94 | %+ | 0.89 | % | (0.86 | )%* | ||||||||||
Portfolio Turnover Rate |
| 49 | % | 32 | % | 24 | % | 4 | %# | ||||||||||
(1) Supplemental Information on the Ratios to Average Net Assets: |
|
|
|
|
|
|
|
|
| ||||||||||
Ratios before expense limitation: |
|
|
|
|
|
|
|
|
| ||||||||||
Expenses to Average Net Assets |
| 1.11 | %+ | 2.42 | %+ | 2.74 | % | 31.60 | %* | ||||||||||
Net Investment Income (Loss) to Average Net Assets |
| 2.75 | %+ | (0.48 | )%+ | (0.84 | )% | (31.46 | )%* | ||||||||||
|
|
|
|
|
|
|
|
|
| ||||||||||
|
| Class P | |||||||||||||||||
|
|
|
| Period from | |||||||||||||||
|
| Year Ended December 31, |
| December 27, 2005^ to | |||||||||||||||
Selected Per Share Data and Ratios |
| 2008 |
| 2007 |
| 2006 |
| December 31, 2005 | |||||||||||
Net Asset Value, Beginning of Period |
| $ | 13.78 |
| $ | 12.56 |
| $ | 9.93 |
| $ | 10.00 |
| ||||||
Income (Loss) from Investment Operations |
|
|
|
|
|
|
|
|
| ||||||||||
Net Investment Income† |
| 0.30 |
| 0.10 |
| 0.09 |
| 0.00 | ‡ | ||||||||||
Net Realized and Unrealized Gain (Loss) on Investments |
| (7.00 | ) | 1.76 |
| 2.64 |
| (0.07 | ) | ||||||||||
Total from Investment Operations |
| (6.70 | ) | 1.86 |
| 2.73 |
| (0.07 | ) | ||||||||||
Distributions from and/or in Excess of: |
|
|
|
|
|
|
|
|
| ||||||||||
Net Investment Income |
| (0.29 | ) | (0.09 | ) | (0.04 | ) | — |
| ||||||||||
Net Realized Gain |
| (0.05 | ) | (0.55 | ) | (0.06 | ) | — |
| ||||||||||
Total Distributions |
| (0.34 | ) | (0.64 | ) | (0.10 | ) | — |
| ||||||||||
Net Asset Value, End of Period |
| $ | 6.74 |
| $ | 13.78 |
| $ | 12.56 |
| $ | 9.93 |
| ||||||
Total Return++ |
| (48.82 | )% | 15.03 | % | 27.49 | % | (0.70 | )%# | ||||||||||
Ratios and Supplemental Data: |
|
|
|
|
|
|
|
|
| ||||||||||
Net Assets, End of Period (Thousands) |
| $ | 237 |
| $ | 531 |
| $ | 325 |
| $ | 99 |
| ||||||
Ratio of Expenses to Average Net Assets (1) |
| 1.25 | %+ | 1.25 | +% | 1.27 | % | 1.25 | %* | ||||||||||
Ratio of Expenses to Average Net Assets Excluding Non Operating Expenses |
| 1.25 | %+ | 1.25 | %+ | 1.25 | % | N/A |
| ||||||||||
Ratio of Net Investment Income (Loss) to Average Net Assets (1) |
| 2.72 | %+ | 0.70 | %+ | 0.78 | % | (1.16 | )%* | ||||||||||
Portfolio Turnover Rate |
| 49 | % | 32 | % | 24 | % | 4 | %# | ||||||||||
(1) Supplemental Information on the Ratios to Average Net Assets: |
|
|
|
|
|
|
|
|
| ||||||||||
Ratios before expense limitation: |
|
|
|
|
|
|
|
|
| ||||||||||
Expenses to Average Net Assets |
| 1.36 | %+ | 2.67 | %+ | 3.07 | % | 31.85 | %* | ||||||||||
Net Investment Income (Loss) to Average Net Assets |
| 2.61 | %+ | (0.72 | )%+ | (1.02 | )% | (31.76 | )%* | ||||||||||
^ | Commencement of Operations |
† | Per share amount is based on average shares outstanding. |
‡ | Amount is less than $0.005 per share. |
++ | Calculated based on the net asset value as of the last business day of the period. |
# | Not Annualized |
+ | Reflects rebate of certain Portfolio expenses in connection with the investments in Morgan Stanley Institutional Liquidity Money Market Portfolio — Institutional Class during the period. As a result of such rebate, the expenses as a percentage of its net assets were effected by less than 0.005%. |
* | Annualized |
| The accompanying notes are an integral part of the financial statements. | 129 |
2008 Annual Report |
|
|
|
December 31, 2008 |
|
Financial Highlights
International Real Estate Portfolio
|
| Class I | ||||||||||||||
|
| Year Ended December 31, | ||||||||||||||
Selected Per Share Data and Ratios |
| 2008 |
| 2007 |
| 2006 |
| 2005 |
| 2004 |
| |||||
Net Asset Value, Beginning of Period |
| $ | 25.30 |
| $ | 34.82 |
| $ | 23.63 |
| $ | 21.95 |
| $ | 15.13 |
|
Income (Loss) from Investment Operations |
|
|
|
|
|
|
|
|
|
|
| |||||
Net Investment Income† |
| 0.56 |
| 0.69 |
| 0.35 |
| 0.43 |
| 0.36 |
| |||||
Net Realized and Unrealized Gain (Loss) on Investments |
| (13.15 | ) | (6.79 | ) | 12.78 |
| 2.96 |
| 6.82 |
| |||||
Total from Investment Operations |
| (12.59 | ) | (6.10 | ) | 13.13 |
| 3.39 |
| 7.18 |
| |||||
Distributions from and/or in Excess of: |
|
|
|
|
|
|
|
|
|
|
| |||||
Net Investment Income |
| — |
| (1.77 | ) | (0.85 | ) | (0.35 | ) | (0.36 | ) | |||||
Net Realized Gain |
| (0.12 | ) | (1.65 | ) | (1.09 | ) | (1.36 | ) | — |
| |||||
Total Distributions |
| (0.12 | ) | (3.42 | ) | (1.94 | ) | (1.71 | ) | (0.36 | ) | |||||
Redemption Fees |
| 0.00 | ‡ | 0.00 | ‡ | 0.00 | ‡ | 0.00 | ‡ | 0.00 | ‡ | |||||
Net Asset Value, End of Period |
| $ | 12.59 |
| $ | 25.30 |
| $ | 34.82 |
| $ | 23.63 |
| $ | 21.95 |
|
Total Return++ |
| (49.95 | )% | (17.59 | )% | 56.06 | % | 15.52 | % | 47.49 | % | |||||
Ratios and Supplemental Data: |
|
|
|
|
|
|
|
|
|
|
| |||||
Net Assets, End of Period (Thousands) |
| $ | 427,148 |
| $ | 1,053,018 |
| $ | 1,125,569 |
| $ | 250,511 |
| $ | 50,620 |
|
Ratio of Expenses to Average Net Assets (1) |
| 0.95 | %+ | 0.94 | %+ | 0.95 | % | 1.00 | % | 1.00 | % | |||||
Ratio of Expenses to Average Net Assets Excluding Non Operating Expenses |
| 0.94 | %+ | 0.94 | %+ | 0.95 | % | 1.00 | % | 1.00 | % | |||||
Ratio of Net Investment Income to Average Net Assets (1) |
| 2.68 | %+ | 2.10 | %+ | 1.19 | % | 1.88 | % | 2.05 | % | |||||
Portfolio Turnover Rate |
| 54 | % | 55 | % | 36 | % | 57 | % | 42 | % | |||||
(1) Supplemental Information on the Ratios to Average Net Assets: |
|
|
|
|
|
|
|
|
|
|
| |||||
Ratios before expense limitation: |
|
|
|
|
|
|
|
|
|
|
| |||||
Expenses to Average Net Assets |
| 0.97 | %+ | N/A |
| N/A |
| 1.11 | % | 1.38 | % | |||||
Net Investment Income to Average Net Assets |
| 2.66 | %+ | N/A |
| N/A |
| 1.77 | % | 1.67 | % | |||||
|
|
|
|
|
|
|
|
|
|
|
| |||||
|
| Class P | ||||||||||||||
|
| Year Ended December 31, | ||||||||||||||
Selected Per Share Data and Ratios |
| 2008 |
| 2007 |
| 2006 |
| 2005 |
| 2004 |
| |||||
Net Asset Value, Beginning of Period |
| $ | 25.33 |
| $ | 34.83 |
| $ | 23.68 |
| $ | 22.04 |
| $ | 15.17 |
|
Income (Loss) from Investment Operations |
|
|
|
|
|
|
|
|
|
|
| |||||
Net Investment Income† |
| 0.63 |
| 0.58 |
| 0.29 |
| 0.32 |
| 0.35 |
| |||||
Net Realized and Unrealized Gain (Loss) on Investments |
| (13.26 | ) | (6.74 | ) | 12.77 |
| 3.01 |
| 6.81 |
| |||||
Total from Investment Operations |
| (12.63 | ) | (6.16 | ) | 13.06 |
| 3.33 |
| 7.16 |
| |||||
Distributions from and/or in Excess of: |
|
|
|
|
|
|
|
|
|
|
| |||||
Net Investment Income |
| — |
| (1.69 | ) | (0.82 | ) | (0.33 | ) | (0.29 | ) | |||||
Net Realized Gain |
| (0.12 | ) | (1.65 | ) | (1.09 | ) | (1.36 | ) | — |
| |||||
Total Distributions |
| (0.12 | ) | (3.34 | ) | (1.91 | ) | (1.69 | ) | (0.29 | ) | |||||
Redemption Fees |
| 0.00 | ‡ | 0.00 | ‡ | 0.00 | ‡ | — |
| — |
| |||||
Net Asset Value, End of Period |
| $ | 12.58 |
| $ | 25.33 |
| $ | 34.83 |
| $ | 23.68 |
| $ | 22.04 |
|
Total Return++ |
| (50.05 | )% | (17.76 | )% | 55.69 | % | 15.22 | % | 47.15 | % | |||||
Ratios and Supplemental Data: |
|
|
|
|
|
|
|
|
|
|
| |||||
Net Assets, End of Period (Thousands) |
| $ | 9,141 |
| $ | 97,800 |
| $ | 97,951 |
| $ | 8,674 |
| $ | 827 |
|
Ratio of Expenses to Average Net Assets (1) |
| 1.19+ | % | 1.19 | %+ | 1.20 | % | 1.25 | % | 1.25 | % | |||||
Ratio of Expenses to Average Net Assets Excluding Non Operating Expenses |
| 1.19 | %+ | 1.19 | %+ | 1.20 | % | 1.25 | % | 1.25 | % | |||||
Ratio of Net Investment Income to Average Net Assets (1) |
| 2.66 | %+ | 1.76 | %+ | 0.94 | % | 1.34 | % | 2.03 | % | |||||
Portfolio Turnover Rate |
| 54 | % | 55 | % | 36 | % | 57 | % | 42 | % | |||||
(1) Supplemental Information on the Ratios to Average Net Assets: |
|
|
|
|
|
|
|
|
|
|
| |||||
Ratios before expense limitation: |
|
|
|
|
|
|
|
|
|
|
| |||||
Expenses to Average Net Assets |
| 1.22 | %+ | N/A |
| N/A |
| 1.45 | % | 1.66 | % | |||||
Net Investment Income to Average Net Assets |
| 2.64 | %+ | N/A |
| N/A |
| 1.14 | % | 1.62 | % | |||||
† | Per share amount is based on average shares outstanding. |
‡ | Amount is less than $0.005 per share. |
++ | Calculated based on the net asset value as of the last business day of the period. |
+ | Reflects rebate of certain Portfolio expenses in connection with the investments in Morgan Stanley Institutional Liquidity Money Market Portfolio — Institutional Class during the period. As a result of such rebate, the expenses as a percentage of its net assets were effected by less than 0.005%. |
130 | The accompanying notes are an integral part of the financial statements. |
|
| 2008 Annual Report |
|
|
| December 31, 2008 |
Financial Highlights
International Small Cap Portfolio
|
| Class I | ||||||||||||||
|
| Year Ended December 31, | ||||||||||||||
Selected Per Share Data and Ratios |
| 2008 |
| 2007 |
| 2006 |
| 2005 |
| 2004 |
| |||||
Net Asset Value, Beginning of Period |
| $ | 17.08 |
| $ | 23.72 |
| $ | 24.14 |
| $ | 25.11 |
| $ | 20.52 |
|
Income (Loss) from Investment Operations |
|
|
|
|
|
|
|
|
|
|
| |||||
Net Investment Income† |
| 0.34 |
| 0.27 |
| 0.32 |
| 0.32 |
| 0.24 |
| |||||
Net Realized and Unrealized Gain (Loss) on Investments |
| (6.66 | ) | (1.11 | ) | 4.27 |
| 2.89 |
| 6.59 |
| |||||
Total from Investment Operations |
| (6.32 | ) | (0.84 | ) | 4.59 |
| 3.21 |
| 6.83 |
| |||||
Distributions from and/or in Excess of: |
|
|
|
|
|
|
|
|
|
|
| |||||
Net Investment Income |
| (0.41 | ) | (0.27 | ) | (0.41 | ) | (0.47 | ) | (0.35 | ) | |||||
Net Realized Gain |
| (0.82 | ) | (5.53 | ) | (4.60 | ) | (3.71 | ) | (1.89 | ) | |||||
Total Distributions |
| (1.23 | ) | (5.80 | ) | (5.01 | ) | (4.18 | ) | (2.24 | ) | |||||
Redemption Fees |
| 0.00 | ‡ | 0.00 | ‡ | 0.00 | ‡ | 0.00 | ‡ | 0.00 | ‡ | |||||
Net Asset Value, End of Period |
| $ | 9.53 |
| $ | 17.08 |
| $ | 23.72 |
| $ | 24.14 |
| $ | 25.11 |
|
Total Return++ |
| (38.33 | )% | (3.22 | )% | 19.61 | % | 13.07 | % | 33.53 | % | |||||
Ratios and Supplemental Data: |
|
|
|
|
|
|
|
|
|
|
| |||||
Net Assets, End of Period (Thousands) |
| $ | 316,526 |
| $ | 796,050 |
| $ | 1,312,064 |
| $ | 1,389,078 |
| $ | 1,276,083 |
|
Ratio of Expenses to Average Net Assets (1) |
| 1.13 | %+ | 1.09 | %+ | 1.10 | % | 1.10 | % | 1.15 | % | |||||
Ratio of Expenses to Average Net Assets Excluding Non Operating Expenses |
| 1.12 | %+ | 1.09 | %+ | 1.10 | % | 1.10 | % | 1.15 | % | |||||
Ratio of Net Investment Income to Average Net Assets (1) |
| 2.47 | %+ | 1.10 | %+ | 1.25 | % | 1.22 | % | 1.04 | % | |||||
Portfolio Turnover Rate |
| 49 | % | 53 | % | 40 | % | 47 | % | 38 | % | |||||
(1) Supplemental Information on the Ratios to Average Net Assets: |
|
|
|
|
|
|
|
|
|
|
| |||||
Ratios before expense limitation: |
|
|
|
|
|
|
|
|
|
|
| |||||
Expenses to Average Net Assets |
| 1.15 | %+ | N/A |
| N/A |
| N/A |
| 1.16 | % | |||||
Net Investment Income to Average Net Assets |
| 2.44 | %+ | N/A |
| N/A |
| N/A |
| 1.03 | % | |||||
† | Per share amount is based on average shares outstanding. |
‡ | Amount is less than $0.005 per share. |
++ | Calculated based on the net asset value as of the last business day of the period. |
+ | Reflects rebate of certain Portfolio expenses in connection with the investments in Morgan Stanley Institutional Liquidity Money Market Portfolio — Institutional Class during the period. As a result of such rebate, the expenses as a percentage of its net assets were effected by less than 0.005%. |
| The accompanying notes are an integral part of the financial statements. | 131 |
2008 Annual Report |
|
|
|
December 31, 2008 |
|
Financial Highlights
International Small Cap Portfolio
|
| Class P | ||
|
| Period from | ||
|
| October 21, 2008^ | ||
Selected Per Share Data and Ratios |
| to December 31, 2008 | ||
Net Asset Value, Beginning of Period |
| $ 9.80 |
|
|
Income (Loss) from Investment Operations |
|
|
|
|
Net Investment Income† |
| 0.00 | ‡ |
|
Net Realized and Unrealized Gain on Investments |
| 0.14 |
|
|
Total from Investment Operations |
| 0.14 |
|
|
Distributions from and/or in Excess of: |
|
|
|
|
Net Investment Income |
| (0.41 | ) |
|
Total Distributions |
| (0.41 | ) |
|
Net Asset Value, End of Period |
| $ 9.53 |
|
|
Total Return++ |
| 1.56 | %# |
|
Ratios and Supplemental Data: |
|
|
|
|
Net Assets, End of Period (Thousands) |
| $ 119 |
|
|
Ratio of Expenses to Average Net Assets (1) |
| 1.39 | %*+ |
|
Ratio of Expenses to Average Net Assets Excluding Non Operating Expenses (1) |
| 1.39 | %*+ |
|
Ratio of Net Investment Income to Average Net Assets (1) |
| 0.09 | %*+ |
|
Portfolio Turnover Rate |
| 49 | %# |
|
(1) Supplemental Information on the Ratios to Average Net Assets: |
|
|
|
|
Ratios before expense limitation: |
|
|
|
|
Expenses to Average Net Assets |
| 1.86 | %*+ |
|
Net Investment Income to Average Net Assets |
| (0.38 | )%*+ |
|
^ | Commencement of Operations |
† | Per share amount is based on average shares outstanding. |
++ | Calculated based on the net asset value as of the last business day of the period. |
# | Not Annualized |
* | Annualized |
+ | Reflects rebate of certain Portfolio expenses in connection with the investments in Morgan Stanley Institutional Liquidity Money Market Portfolio — Institutional Class during the period. As a result of such rebate, the expenses as a percentage of its net assets were effected by less than 0.005%. |
132 | The accompanying notes are an integral part of the financial statements. |
|
| 2008 Annual Report |
|
|
| December 31, 2008 |
Financial Highlights
Capital Growth Portfolio
|
| Class I | ||||||||||||||
|
| Year Ended December 31, | ||||||||||||||
Selected Per Share Data and Ratios |
| 2008 |
| 2007 |
| 2006 |
| 2005 |
| 2004 |
| |||||
Net Asset Value, Beginning of Period |
| $ | 24.69 |
| $ | 20.28 |
| $ | 19.49 |
| $ | 16.88 |
| $ | 15.74 |
|
Income (Loss) from Investment Operations |
|
|
|
|
|
|
|
|
|
|
| |||||
Net Investment Income† |
| 0.05 |
| 0.10 |
| 0.01 |
| 0.02 |
| 0.09 |
| |||||
Net Realized and Unrealized Gain (Loss) on Investments |
| (12.50 | ) | 4.41 |
| 0.78 |
| 2.63 |
| 1.13 |
| |||||
Total from Investment Operations |
| (12.45 | ) | 4.51 |
| 0.79 |
| 2.65 |
| 1.22 |
| |||||
Distributions from and/or in Excess of: |
|
|
|
|
|
|
|
|
|
|
| |||||
Net Investment Income |
| (0.10 | ) | (0.10 | ) | (0.00 | )‡ | (0.04 | ) | (0.08 | ) | |||||
Net Realized Gain |
| (0.02 | ) | — |
| — |
| — |
| — |
| |||||
Total Distributions |
| (0.12 | ) | (0.10 | ) | — |
| (0.04 | ) | (0.08 | ) | |||||
Redemption Fees |
| 0.00 | ‡ | 0.00 | ‡ | 0.00 | ‡ | — |
| — |
| |||||
Net Asset Value, End of Period |
| $ | 12.12 |
| $ | 24.69 |
| $ | 20.28 |
| $ | 19.49 |
| $ | 16.88 |
|
Total Return++ |
| (50.47 | )% | 22.29 | % | 4.07 | % | 15.72 | % | 7.75 | % | |||||
Ratios and Supplemental Data: |
|
|
|
|
|
|
|
|
|
|
| |||||
Net Assets, End of Period (Thousands) |
| $ | 543,841 |
| $ | 1,406,866 |
| $ | 1,012,417 |
| $ | 871,905 |
| $ | 554,097 |
|
Ratio of Expenses to Average Net Assets |
| 0.62 | %+ | 0.62 | %+ | 0.63 | % | 0.65 | % | 0.77 | % | |||||
Ratio of Expenses to Average Net Assets Excluding Non Operating Expenses |
| 0.62 | %+ | 0.62 | %+ | 0.63 | % | 0.65 | % | N/A |
| |||||
Ratio of Net Investment Income to Average Net Assets |
| 0.24 | %+ | 0.46 | %+ | 0.03 | % | 0.13 | % | 0.58 | % | |||||
Portfolio Turnover Rate |
| 42 | % | 50 | % | 59 | % | 106 | % | 179 | % | |||||
|
| Class P | |||||||||||||
|
| Year Ended December 31, | |||||||||||||
Selected Per Share Data and Ratios |
| 2008 |
| 2007 |
| 2006 |
| 2005 |
| 2004 |
| ||||
Net Asset Value, Beginning of Period |
| $ | 24.27 |
| $ | 19.95 |
| $ 19.21 |
| $ | 16.67 |
| $ | 15.55 |
|
Income (Loss) from Investment Operations |
|
|
|
|
|
|
|
|
|
|
| ||||
Net Investment Income (Loss)† |
| 0.00 | ‡ | 0.05 |
| (0.04 | ) | (0.03 | ) | 0.05 |
| ||||
Net Realized and Unrealized Gain (Loss) on Investments |
| (12.27 | ) | 4.33 |
| 0.78 |
| 2.60 |
| 1.11 |
| ||||
Total from Investment Operations |
| (12.27 | ) | 4.38 |
| 0.74 |
| 2.57 |
| 1.16 |
| ||||
Distributions from and/or in Excess of: |
|
|
|
|
|
|
|
|
|
|
| ||||
Net Investment Income |
| (0.04 | ) | (0.06 | ) | — |
| (0.03 | ) | (0.04 | ) | ||||
Net Realized Gain |
| (0.02 | ) | — |
| — |
| — |
| — |
| ||||
Total Distributions |
| (0.06 | ) | (0.06 | ) | — |
| (0.03 | ) | (0.04 | ) | ||||
Redemption Fees |
| 0.00 | ‡ | 0.00 | ‡ | 0.00 | ‡ | — |
| — |
| ||||
Net Asset Value, End of Period |
| $ | 11.94 |
| $ | 24.27 |
| $ 19.95 |
| $ 19.21 |
| $ | 16.67 |
| |
Total Return++ |
| (50.57 | )% | 21.93 | % | 3.85 | % | 15.41 | % | 7.45 | % | ||||
Ratios and Supplemental Data: |
|
|
|
|
|
|
|
|
|
|
| ||||
Net Assets, End of Period (Thousands) |
| $ | 59,883 |
| $ | 166,717 |
| $ 57,689 |
| $ 35,678 |
| $ | 202,893 |
| |
Ratio of Expenses to Average Net Assets |
| 0.87 | %+ | 0.87 | %+ | 0.88 | % | 0.90 | % | 1.02 | % | ||||
Ratio of Expenses to Average Net Assets Excluding Non Operating Expenses |
| 0.87 | %+ | 0.87 | %+ | 0.88 | % | 0.90 | % | N/A |
| ||||
Ratio of Net Investment Income (Loss) to Average Net Assets |
| (0.01 | )%+ | 0.24 | +% | (0.23 | )% | (0.17 | )% | 0.33 | % | ||||
Portfolio Turnover Rate |
| 42 | % | 50 | % | 59 | % | 106 | % | 179 | % | ||||
† | Per share amount is based on average shares outstanding. |
‡ | Amount is less than $0.005 per share. |
++ | Calculated based on the net asset value as of the last business day of the period. |
+ | Reflects rebate of certain Portfolio expenses in connection with the investments in Morgan Stanley Institutional Liquidity Money Market Portfolio — Institutional Class during the period. As a result of such rebate, the expenses as a percentage of its net assets were effected by less than 0.005%. |
| The accompanying notes are an integral part of the financial statements. | 133 |
2008 Annual Report |
|
|
|
December 31, 2008 |
|
Financial Highlights
Focus Growth Portfolio
|
| Class I | ||||||||||||||
|
| Year Ended December 31, | ||||||||||||||
Selected Per Share Data and Ratios |
| 2008 |
| 2007 |
| 2006 |
| 2005 |
| 2004 |
| |||||
Net Asset Value, Beginning of Period |
| $ | 18.81 |
| $ | 15.19 |
| $ | 14.78 |
| $ | 12.59 |
| $ | 11.79 |
|
Income (Loss) from Investment Operations |
|
|
|
|
|
|
|
|
|
|
| |||||
Net Investment Income (Loss)† |
| 0.00 | ‡ | 0.03 |
| (0.03 | ) | (0.03 | ) | 0.04 |
| |||||
Net Realized and Unrealized Gain (Loss) on Investments |
| (9.82 | ) | 3.62 |
| 0.44 |
| 2.24 |
| 0.78 |
| |||||
Total from Investment Operations |
| (9.82 | ) | 3.65 |
| 0.41 |
| 2.21 |
| 0.82 |
| |||||
Distributions from and/or in Excess of: |
|
|
|
|
|
|
|
|
|
|
| |||||
Net Investment Income |
| (0.04 | ) | (0.03 | ) | — |
| (0.02 | ) | (0.02 | ) | |||||
Total Distributions |
| (0.04 | ) | (0.03 | ) | — |
| (0.02 | ) | (0.02 | ) | |||||
Redemption Fees |
| 0.00 | ‡ | 0.00 | ‡ | 0.00 | ‡ | — |
| — |
| |||||
Net Asset Value, End of Period |
| $ | 8.95 |
| $ | 18.81 |
| $ | 15.19 |
| $ | 14.78 |
| $ | 12.59 |
|
Total Return++ |
| (52.19 | )% | 24.02 | % | 2.77 | % | 17.60 | % | 7.00 | % | |||||
Ratios and Supplemental Data: |
|
|
|
|
|
|
|
|
|
|
| |||||
Net Assets, End of Period (Thousands) |
| $ | 4,879 |
| $ | 13,852 |
| $ | 12,416 |
| $ | 54,321 |
| $ | 52,757 |
|
Ratio of Expenses to Average Net Assets (1) |
| 1.00 | %+ | 1.00 | %+ | 0.79 | % | 0.91 | % | 1.00 | % | |||||
Ratio of Expenses to Average Net Assets Excluding Non Operating Expenses |
| 1.00 | %+ | 1.00 | %+ | 0.79 | % | 0.91 | % | 1.00 | % | |||||
Ratio of Net Investment Income (Loss) to Average Net Assets (1) |
| 0.02 | %+ | 0.16 | %+ | (0.23 | )% | (0.27 | )% | 0.35 | % | |||||
Portfolio Turnover Rate |
| 36 | % | 57 | % | 76 | % | 78 | % | 163 | % | |||||
(1) Supplemental Information on the Ratios to Average Net Assets: |
|
|
|
|
|
|
|
|
|
|
| |||||
Ratios before expense limitation: |
|
|
|
|
|
|
|
|
|
|
| |||||
Expenses to Average Net Assets |
| 1.29 | %+ | 1.13 | %+ | N/A |
| N/A |
| 1.11 | % | |||||
Net Investment Income (Loss) to Average Net Assets |
| (0.27 | )%+ | 0.03 | %+ | N/A |
| N/A |
| 0.24 | % | |||||
|
| Class P | ||||||||||||||
|
| Year Ended December 31, | ||||||||||||||
Selected Per Share Data and Ratios |
| 2008 |
| 2007 |
| 2006 |
| 2005 |
| 2004 |
| |||||
Net Asset Value, Beginning of Period |
| $ | 18.32 |
| $ | 14.81 |
| $ | 14.45 |
| $ | 12.34 |
| $ | 11.57 |
|
Income (Loss) from Investment Operations |
|
|
|
|
|
|
|
|
|
|
| |||||
Net Investment Income (Loss)† |
| (0.04 | ) | (0.01 | ) | (0.06 | ) | (0.06 | ) | 0.02 |
| |||||
Net Realized and Unrealized Gain (Loss) on Investments |
| (9.55 | ) | 3.52 |
| 0.42 |
| 2.19 |
| 0.75 |
| |||||
Total from Investment Operations |
| (9.59 | ) | 3.51 |
| 0.36 |
| 2.13 |
| 0.77 |
| |||||
Distributions from and/or in Excess of: |
|
|
|
|
|
|
|
|
|
|
| |||||
Net Investment Income |
| 0.00 | ‡ | — |
| — |
| (0.02 | ) | — |
| |||||
Total Distributions |
| 0.00 | ‡ | — |
| — |
| (0.02 | ) | — |
| |||||
Redemption Fees |
| 0.00 | ‡ | 0.00 | ‡ | 0.00 | ‡ | — |
| — |
| |||||
Net Asset Value, End of Period |
| $ | 8.73 |
| $ | 18.32 |
| $ | 14.81 |
| $ | 14.45 |
| $ | 12.34 |
|
Total Return++ |
| (52.27 | )% | 23.70 | % | 2.49 | % | 17.30 | % | 6.75 | % | |||||
Ratios and Supplemental Data: |
|
|
|
|
|
|
|
|
|
|
| |||||
Net Assets, End of Period (Thousands) |
| $ | 1,069 |
| $ | 2,913 |
| $ | 2,317 |
| $ | 12,442 |
| $ | 8,559 |
|
Ratio of Expenses to Average Net Assets (1) |
| 1.25 | %+ | 1.25 | %+ | 1.04 | % | 1.16 | % | 1.25 | % | |||||
Ratio of Expenses to Average Net Assets Excluding Non Operating Expenses |
| 1.25 | %+ | 1.25 | %+ | 1.04 | % | 1.16 | % | 1.25 | % | |||||
Ratio of Net Investment Income (Loss) to Average Net Assets (1) |
| (0.24 | )%+ | (0.07 | )%+ | (0.45 | )% | (0.49 | )% | 0.18 | % | |||||
Portfolio Turnover Rate |
| 36 | % | 57 | % | 76 | % | 78 | % | 163 | % | |||||
(1) Supplemental Information on the Ratios to Average Net Assets: |
|
|
|
|
|
|
|
|
|
|
| |||||
Ratios before expense limitation: |
|
|
|
|
|
|
|
|
|
|
| |||||
Expenses to Average Net Assets |
| 1.54 | %+ | 1.38 | %+ | N/A |
| N/A |
| 1.36 | % | |||||
Net Investment Income (Loss) to Average Net Assets |
| (0.53 | )%+ | (0.20 | )%+ | N/A |
| N/A |
| 0.07 | % | |||||
† | Per share amount is based on average shares outstanding. |
‡ | Amount is less than $0.005 per share. |
++ | Calculated based on the net asset value as of the last business day of the period. |
+ | Reflects rebate of certain Portfolio expenses in connection with the investments in Morgan Stanley Institutional Liquidity Money Market Portfolio — Institutional Class during the period. As a result of such rebate, the expenses as a percentage of its net assets were effected by less than 0.005%. |
134 | The accompanying notes are an integral part of the financial statements. |
|
| 2008 Annual Report |
|
|
| December 31, 2008 |
Financial Highlights
Large Cap Relative Value Portfolio
|
| Class I |
| |||||||||
|
| Year Ended December 31, |
| |||||||||
Selected Per Share Data and Ratios |
| 2008 |
| 2007 |
| 2006 |
| 2005 |
| 2004 |
| |
Net Asset Value, Beginning of Period |
| $ 11.86 |
| $ 12.20 |
| $ 11.10 |
| $ 10.52 |
| $ 9.30 |
| |
Income (Loss) from Investment Operations |
|
|
|
|
|
|
|
|
|
|
| |
Net Investment Income† |
| 0.21 |
| 0.21 |
| 0.20 |
| 0.15 |
| 0.12 |
| |
Net Realized and Unrealized Gain (Loss) on Investments |
| (3.96 | ) | 0.16 |
| 1.62 |
| 0.90 |
| 1.23 |
| |
Total from Investment Operations |
| (3.75 | ) | 0.37 |
| 1.82 |
| 1.05 |
| 1.35 |
| |
Distributions from and/or in Excess of: |
|
|
|
|
|
|
|
|
|
|
| |
Net Investment Income |
| (0.21 | ) | (0.22 | ) | (0.20 | ) | (0.14 | ) | (0.13 | ) | |
Net Realized Gain |
| (0.05 | ) | (0.49 | ) | (0.52 | ) | (0.33 | ) | — |
| |
Total Distributions |
| (0.26 | ) | (0.71 | ) | (0.72 | ) | (0.47 | ) | (0.13 | ) | |
Redemption Fees |
| 0.00 | ‡ | 0.00 | ‡ | 0.00 | ‡ | — |
| — |
| |
Net Asset Value, End of Period |
| $ 7.85 |
| $ 11.86 |
| $ 12.20 |
| $ 11.10 |
| $ 10.52 |
| |
Total Return++ |
| (32.01 | )% | 2.90 | % | 16.47 | % | 10.07 | % | 14.56 | % | |
Ratios and Supplemental Data: |
|
|
|
|
|
|
|
|
|
|
| |
Net Assets, End of Period (Thousands) |
| $150,025 |
| $236,784 |
| $211,904 |
| $102,973 |
| $90,938 |
| |
Ratio of Expenses to Average Net Assets |
| 0.67 | %+ | 0.67 | %+ | 0.68 | % | 0.68 | % | 0.70 | % | |
Ratio of Expenses to Average Net Assets Excluding Non Operating Expenses |
| 0.67 | %+ | 0.67 | %+ | 0.68 |
| 0.68 | % | N/A |
| |
Ratio of Net Investment Income to Average Net Assets |
| 2.06 | %+ | 1.71 | %+ | 1.71 | % | 1.36 | % | 1.28 | % | |
Portfolio Turnover Rate |
| 50 | % | 31 | % | 33 | % | 46 | % | 84 | % | |
(1) Supplemental Information on the Ratios to Average Net Assets: |
|
|
|
|
|
|
|
|
|
|
| |
Ratios before expense limitation: |
|
|
|
|
|
|
|
|
|
|
| |
Expenses to Average Net Assets |
| N/A |
| N/A |
| N/A |
| N/A |
| 0.74 | % | |
Net Investment Income to Average Net Assets |
| N/A |
| N/A |
| N/A |
| N/A |
| 1.24 | % | |
|
|
|
|
|
|
|
|
|
|
|
| |
|
| Class P |
| |||||||||
|
| Year Ended December 31, |
| |||||||||
Selected Per Share Data and Ratios |
| 2008 |
| 2007 |
| 2006 |
| 2005 |
| 2004 |
| |
Net Asset Value, Beginning of Period |
| $ 11.85 |
| $ 12.18 |
| $ 11.09 |
| $ 10.51 |
| $ 9.31 |
| |
Income (Loss) from Investment Operations |
|
|
|
|
|
|
|
|
|
|
| |
Net Investment Income† |
| 0.18 |
| 0.19 |
| 0.17 |
| 0.12 |
| 0.10 |
| |
Net Realized and Unrealized Gain (Loss) on Investments |
| (3.96 | ) | 0.15 |
| 1.61 |
| 0.91 |
| 1.20 |
| |
Total from Investment Operations |
| (3.78 | ) | 0.34 |
| 1.78 |
| 1.03 |
| 1.30 |
| |
Distributions from and/or in Excess of: |
|
|
|
|
|
|
|
|
|
|
| |
Net Investment Income |
| (0.18 | ) | (0.18 | ) | (0.17 | ) | (0.12 | ) | (0.10 | ) | |
Net Realized Gain |
| (0.05 | ) | (0.49 | ) | (0.52 | ) | (0.33 | ) | — |
| |
Total Distributions |
| (0.23 | ) | (0.67 | ) | (0.69 | ) | (0.45 | ) | (0.10 | ) | |
Redemption Fees |
| 0.00 | ‡ | 0.00 | ‡ | 0.00 | ‡ | — |
| — |
| |
Net Asset Value, End of Period |
| $ 7.84 |
| $ 11.85 |
| $ 12.18 |
| $ 11.09 |
| $ 10.51 |
| |
Total Return++ |
| (32.21 | )% | 2.72 | % | 16.38 | % | 9.81 | % | 14.07 | % | |
Ratios and Supplemental Data: |
|
|
|
|
|
|
|
|
|
|
| |
Net Assets, End of Period (Thousands) |
| $ 34,856 |
| $ 50,287 |
| $ 63,300 |
| $101,499 |
| $75,189 |
| |
Ratio of Expenses to Average Net Assets |
| 0.92 | %+ | 0.92 | %+ | 0.93 | % | 0.93 | % | 0.95 | % | |
Ratio of Expenses to Average Net Assets Excluding Non Operating Expenses |
| 0.92 | %+ | 0.92 | %+ | 0.93 | % | 0.93 | % | N/A |
| |
Ratio of Net Investment Income to Average Net Assets |
| 1.81 | %+ | 1.48 | %+ | 1.44 | % | 1.10 | % | 1.05 | % | |
Portfolio Turnover Rate |
| 50 | % | 31 | % | 33 | % | 46 | % | 84 | % | |
(1) Supplemental Information on the Ratios to Average Net Assets: |
|
|
|
|
|
|
|
|
|
|
| |
Ratios before expense limitation: |
|
|
|
|
|
|
|
|
|
|
| |
Expenses to Average Net Assets |
| N/A |
| N/A |
| N/A |
| N/A |
| 0.99 | % | |
Net Investment Income to Average Net Assets |
| N/A |
| N/A |
| N/A |
| N/A |
| 1.01 | % | |
† | Per share amount is based on average shares outstanding. | |||||||||||
‡ | Amount is less than $0.005 per share. | |||||||||||
++ | Calculated based on the net asset value as of the last business day of the period. | |||||||||||
+ | Reflects rebate of certain Portfolio expenses in connection with the investments in Morgan Stanley Institutional Liquidity Money Market Portfolio — Institutional Class during the period. As a result of such rebate, the expenses as a percentage of its net assets were effected by approximately 0.01% and less than 0.005% for the years ended December 31, 2008 and December 31, 2007, respectively. | |||||||||||
| The accompanying notes are an integral part of the financial statements. | 135 |
2008 Annual Report |
|
|
|
December 31, 2008 |
|
Financial Highlights
Small Company Growth Portfolio
|
| Class I |
| ||||||||
|
| Year Ended December 31, |
| ||||||||
Selected Per Share Data and Ratios |
| 2008 |
| 2007 |
| 2006 |
| 2005 |
| 2004 |
|
Net Asset Value, Beginning of Period |
| $ 13.12 |
| $ 13.31 |
| $ 12.89 |
| $ 12.50 |
| $ 10.81 |
|
Income (Loss) from Investment Operations |
|
|
|
|
|
|
|
|
|
|
|
Net Investment Loss† |
| (0.01 | ) | (0.05 | ) | (0.08 | ) | 0.00 | ‡ | (0.09 | ) |
Net Realized and Unrealized Gain (Loss) on Investments |
| (5.47 | ) | 0.45 |
| 1.59 |
| 1.72 |
| 2.16 |
|
Total from Investment Operations |
| (5.48 | ) | 0.40 |
| 1.51 |
| 1.72 |
| 2.07 |
|
Distributions from and/or in Excess of: |
|
|
|
|
|
|
|
|
|
|
|
Net Realized Gain |
| — |
| (0.59 | ) | (1.09 | ) | (1.33 | ) | (0.38 | ) |
Total Distributions |
| — |
| (0.59 | ) | (1.09 | ) | (1.33 | ) | (0.38 | ) |
Redemption Fees |
| 0.00 | ‡ | 0.00 | ‡ | 0.00 | ‡ | 0.00 | ‡ | — |
|
Net Asset Value, End of Period |
| $ 7.64 |
| $ 13.12 |
| $ 13.31 |
| $ 12.89 |
| $ 12.50 |
|
Total Return++ |
| (41.84 | )% | 3.04 | % | 11.90 | % | 13.55 | % | 19.17 | % |
Ratios and Supplemental Data: |
|
|
|
|
|
|
|
|
|
|
|
Net Assets, End of Period (Thousands) |
| $638,559 |
| $1,137,839 |
| $1,028,030 |
| $896,204 |
| $651,276 |
|
Ratio of Expenses to Average Net Assets (1) |
| 1.02 | %+ | 1.01 | %+ | 1.01 | % | 1.04 | % | 1.10 | % |
Ratio of Expenses to Average Net Assets Excluding Non Operating Expenses |
| 1.02 | %+ | 1.01 | %+ | 1.01 | % | 1.04 | % | N/A |
|
Ratio of Net Investment Loss to Average Net Assets (1) |
| (0.08 | )%+ | (0.35 | )%+ | (0.56 | )% | (0.04 | )% | (0.79 | )% |
Portfolio Turnover Rate |
| 34 | % | 50 | % | 76 | % | 73 | % | 111 | % |
(1) Supplemental Information on the Ratios to Average Net Assets: |
|
|
|
|
|
|
|
|
|
|
|
Ratios before expense limitation: |
|
|
|
|
|
|
|
|
|
|
|
Expenses to Average Net Assets |
| 1.05 | %+ | N/A |
| N/A |
| N/A |
| 1.16 | % |
Net Investment Loss to Average Net Assets |
| (0.11 | )%+ | N/A |
| N/A |
| N/A |
| (0.85 | )% |
|
|
| Class P |
| |||||||||
|
|
| Year Ended December 31, |
| |||||||||
| Selected Per Share Data and Ratios |
| 2008 |
| 2007 |
| 2006 |
| 2005 |
| 2004 |
| |
| Net Asset Value, Beginning of Period |
| $ 12.39 |
| $ 12.63 |
| $ 12.31 |
| $ 12.02 |
| $ 10.43 |
| |
| Income (Loss) from Investment Operations |
|
|
|
|
|
|
|
|
|
|
| |
| Net Investment Loss† |
| (0.03 | ) | (0.08 | ) | (0.10 | ) | (0.03 | ) | (0.11 | ) | |
| Net Realized and Unrealized Gain (Loss) on Investments |
| (5.17 | ) | 0.43 |
| 1.51 |
| 1.65 |
| 2.08 |
| |
| Total from Investment Operations |
| (5.20 | ) | 0.35 |
| 1.41 |
| 1.62 |
| 1.97 |
| |
| Distributions from and/or in Excess of: |
|
|
|
|
|
|
|
|
|
|
| |
| Net Realized Gain |
| — |
| (0.59 | ) | (1.09 | ) | (1.33 | ) | (0.38 | ) | |
| Total Distributions |
| — |
| (0.59 | ) | (1.09 | ) | (1.33 | ) | (0.38 | ) | |
| Redemption Fees |
| 0.00 | ‡ | 0.00 | ‡ | 0.00 | ‡ | — |
| — |
| |
| Net Asset Value, End of Period |
| $ 7.19 |
| $ 12.39 |
| $ 12.63 |
| $ 12.31 |
| $ 12.02 |
| |
| Total Return++ |
| (41.97 | )% | 2.81 | % | 11.55 | % | 13.35 | % | 18.79 | % | |
| Ratios and Supplemental Data: |
|
|
|
|
|
|
|
|
|
|
| |
| Net Assets, End of Period (Thousands) |
| $345,302 |
| $ 698,183 |
| $ 857,275 |
| $ 808,493 |
| $ 713,733 |
| |
| Ratio of Expenses to Average Net Assets (1) |
| 1.27 | %+ | 1.26 | %+ | 1.26 | % | 1.29 | % | 1.35 | % | |
| Ratio of Expenses to Average Net Assets Excluding Non Operating Expenses |
| 1.27 | %+ | 1.26 | %+ | 1.26 | % | 1.29 | % | N/A |
| |
| Ratio of Net Investment Loss to Average Net Assets (1) |
| (0.34 | )%+ | (0.61 | )%+ | (0.81 | )% | (0.24 | )% | (1.02 | )% | |
| Portfolio Turnover Rate |
| 34 | % | 50 | % | 76 | % | 73 | % | 111 | % | |
| (1) Supplemental Information on the Ratios to Average Net Assets: |
|
|
|
|
|
|
|
|
|
|
| |
| Ratios before expense limitation: |
|
|
|
|
|
|
|
|
|
|
| |
| Expenses to Average Net Assets |
| 1.30 | %+ | N/A |
| N/A |
| N/A |
| 1.41 | % | |
| Net Investment Loss to Average Net Assets |
| (0.37 | )%+ | N/A |
| N/A |
| N/A |
| (1.09 | )% | |
† | Per share amount is based on average shares outstanding. | ||||||||||||
‡ | Amount is less than $0.005 per share. | ||||||||||||
++ | Calculated based on the net asset value as of the last business day of the period. | ||||||||||||
+ | Reflects rebate of certain Portfolio expenses in connection with the investments in Morgan Stanley Institutional Liquidity Money Market Portfolio — Institutional Class during the period. As a result of such rebate, the expenses as a percentage of its net assets were effected by less than 0.005%. | ||||||||||||
136 |
| The accompanying notes are an integral part of the financial statements. |
| 2008 Annual Report |
|
|
| December 31, 2008 |
Financial Highlights
U.S. Real Estate Portfolio
|
| Class I |
| ||||||||
|
| Year Ended December 31, |
| ||||||||
Selected Per Share Data and Ratios |
| 2008 |
| 2007 |
| 2006 |
| 2005 |
| 2004 |
|
Net Asset Value, Beginning of Period |
| $ 15.75 |
| $ 28.24 |
| $ 23.41 |
| $ 23.21 |
| $ 17.92 |
|
Income (Loss) from Investment Operations |
|
|
|
|
|
|
|
|
|
|
|
Net Investment Income† |
| 0.31 |
| 0.33 |
| 0.42 |
| 0.45 |
| 0.40 |
|
Net Realized and Unrealized Gain (Loss) on Investments |
| (5.84 | ) | (4.87 | ) | 8.44 |
| 3.58 |
| 6.17 |
|
Total from Investment Operations |
| (5.53 | ) | (4.54 | ) | 8.86 |
| 4.03 |
| 6.57 |
|
Distributions from and/or in Excess of: |
|
|
|
|
|
|
|
|
|
|
|
Net Investment Income |
| (0.31 | ) | (0.50 | ) | (0.49 | ) | (0.44 | ) | (0.42 | ) |
Net Realized Gain |
| (1.04 | ) | (7.45 | ) | (3.54 | ) | (3.39 | ) | (0.86 | ) |
Total Distributions |
| (1.35 | ) | (7.95 | ) | (4.03 | ) | (3.83 | ) | (1.28 | ) |
Redemption Fees |
| 0.00 | ‡ | 0.00 | ‡ | 0.00 | ‡ | — |
| — |
|
Net Asset Value, End of Period |
| $ 8.87 |
| $ 15.75 |
| $ 28.24 |
| $ 23.41 |
| $ 23.21 |
|
Total Return++ |
| (38.07 | )% | (16.63 | )% | 38.85 | % | 17.66 | % | 37.28 | % |
Ratios and Supplemental Data: |
|
|
|
|
|
|
|
|
|
|
|
Net Assets, End of Period (Thousands) |
| $448,897 |
| $911,819 |
| $1,635,926 |
| $1,209,668 |
| $1,097,718 |
|
Ratio of Expenses to Average Net Assets (1) |
| 0.95 | %+ | 0.90 | %+ | 0.87 | % | 0.89 | % | 0.97 | % |
Ratio of Expenses to Average Net Assets Excluding Non Operating Expenses |
| 0.91 | %+ | 0.88 | %+ | 0.87 | % | 0.89 | % | N/A |
|
Ratio of Net Investment Income to Average Net Assets (1) |
| 2.19 | %+ | 1.23 | %+ | 1.55 | % | 1.87 | % | 2.02 | % |
Portfolio Turnover Rate |
| 38 | % | 38 | % | 36 | % | 33 | % | 21 | % |
(1) Supplemental Information on the Ratios to Average Net Assets: |
|
|
|
|
|
|
|
|
|
|
|
Ratios before expense limitation: |
|
|
|
|
|
|
|
|
|
|
|
Expenses to Average Net Assets |
| 0.96 | %+ | N/A |
| N/A |
| N/A |
| N/A |
|
Net Investment Income to Average Net Assets |
| 2.18 | %+ | N/A |
| N/A |
| N/A |
| N/A |
|
|
|
| Class P |
|
| |||||||||
|
|
| Year Ended December 31, |
|
| |||||||||
| Selected Per Share Data and Ratios |
| 2008 |
| 2007 |
| 2006 |
| 2005 |
| 2004 |
|
| |
| Net Asset Value, Beginning of Period |
| $ 15.53 |
| $ 27.96 |
| $ 23.21 |
| $ 23.04 |
| $ 17.80 |
|
| |
| Income (Loss) from Investment Operations |
|
|
|
|
|
|
|
|
|
|
|
| |
| Net Investment Income† |
| 0.28 |
| 0.27 |
| 0.37 |
| 0.38 |
| 0.35 |
|
| |
| Net Realized and Unrealized Gain (Loss) on Investments |
| (5.77 | ) | (4.82 | ) | 8.34 |
| 3.56 |
| 6.13 |
|
| |
| Total from Investment Operations |
| (5.49 | ) | (4.55 | ) | 8.71 |
| 3.94 |
| 6.48 |
|
| |
| Distributions from and/or in Excess of: |
|
|
|
|
|
|
|
|
|
|
|
| |
| Net Investment Income |
| (0.27 | ) | (0.43 | ) | (0.42 | ) | (0.38 | ) | (0.38 | ) |
| |
| Net Realized Gain |
| (1.04 | ) | (7.45 | ) | (3.54 | ) | (3.39 | ) | (0.86 | ) |
| |
| Total Distributions |
| (1.31 | ) | (7.88 | ) | (3.96 | ) | (3.77 | ) | (1.24 | ) |
| |
| Redemption Fees |
| 0.00 | ‡ | 0.00 | ‡ | 0.00 | ‡ | — |
| — |
|
| |
| Net Asset Value, End of Period |
| $ 8.73 |
| $ 15.53 |
| $ 27.96 |
| $ 23.21 |
| $ 23.04 |
|
| |
| Total Return++ |
| (38.26 | )% | (16.80 | )% | 38.52 | % | 17.37 | % | 36.95 | % |
| |
| Ratios and Supplemental Data: |
|
|
|
|
|
|
|
|
|
|
|
| |
| Net Assets, End of Period (Thousands) |
| $ 95,828 |
| $171,578 |
| $ 268,537 |
| $157,650 |
| $149,180 |
|
| |
| Ratio of Expenses to Average Net Assets (1) |
| 1.20 | %+ | 1.15 | %+ | 1.12 | % | 1.14 | % | 1.22 | % |
| |
| Ratio of Expenses to Average Net Assets Excluding Non Operating Expenses |
| 1.16 | %+ | 1.13 | %+ | 1.12 | % | 1.14 | % | N/A |
|
| |
| Ratio of Net Investment Income to Average Net Assets (1) |
| 2.05 | %+ | 1.02 | %+ | 1.37 | % | 1.60 | % | 1.76 | % |
| |
| Portfolio Turnover Rate |
| 38 | % | 38 | % | 36 | % | 33 | % | 21 | % |
| |
| (1) Supplemental Information on the Ratios to Average Net Assets: |
|
|
|
|
|
|
|
|
|
|
|
| |
| Ratios before expense limitation: |
|
|
|
|
|
|
|
|
|
|
|
| |
| Expenses to Average Net Assets |
| 1.21 | %+ | N/A |
| N/A |
| N/A |
| N/A |
|
| |
| Net Investment Income to Average Net Assets |
| 2.04 | %+ | N/A |
| N/A |
| N/A |
| N/A |
|
| |
† | Per share amount is based on average shares outstanding. | |||||||||||||
‡ | Amount is less than $0.005 per share. | |||||||||||||
++ | Calculated based on the net asset value as of the last business day of the period. | |||||||||||||
+ | Reflects rebate of certain Portfolio expenses in connection with the investments in Morgan Stanley Institutional Liquidity Money Market Portfolio — Institutional Class during the period. As a result of such rebate, the expenses as a percentage of its net assets were effected by less than 0.005%. | |||||||||||||
The accompanying notes are an integral part of the financial statements. |
| 137 |
2008 Annual Report |
|
|
|
December 31, 2008 |
|
Financial Highlights
U.S. Small/Mid Cap Value Portfolio
|
| Class I |
| |||||
|
| Year Ended |
| Period from | ||||
|
| December 31, |
| September 27, 2007^ to | ||||
Selected Per Share Data and Ratios |
| 2008 |
| December 31, 2007 | ||||
Net Asset Value, Beginning of Period |
| $ 9.47 |
|
| $ 10.00 |
|
| |
Income (Loss) from Investment Operations |
|
|
|
|
|
|
| |
Net Investment Income† |
| 0.00 | ‡ |
| 0.00 | ‡ |
| |
Net Realized and Unrealized Loss on Investments |
| (3.60 | ) |
| (0.52 | ) |
| |
Total from Investment Operations |
| (3.60 | ) |
| (0.52 | ) |
| |
Distributions from and/or in Excess of: |
|
|
|
|
|
|
| |
Net Investment Income |
| (0.00 | )‡ |
| — |
|
| |
Net Realized Gain |
| (0.01 | ) |
| (0.01 | ) |
| |
Total Distributions |
| (0.01 | ) |
| (0.01 | ) |
| |
Net Asset Value, End of Period |
| $ 5.86 |
|
| $ 9.47 |
|
| |
Total Return++ |
| (38.03 | )% |
| (5.21 | )%# |
| |
Ratios and Supplemental Data: |
|
|
|
|
|
|
| |
Net Assets, End of Period (Thousands) |
| $16,492 |
|
| $20,112 |
|
| |
Ratio of Expenses to Average Net Assets |
| 1.17 | %+ |
| 1.30 | %*+ |
| |
Ratio of Expenses to Average Net Assets Excluding Non Operating Expenses |
| 1.17 | %+ |
| N/A |
|
| |
Ratio of Net Investment Income to Average Net Assets |
| 0.02 | %+ |
| 0.09 | %*+ |
| |
Portfolio Turnover Rate |
| 69 | % |
| 38 | %# |
| |
|
|
| Class P |
| ||||||
|
|
| Year Ended |
| Period from |
| ||||
|
|
| December 31, |
| September 27, 2007^ to |
| ||||
| Selected Per Share Data and Ratios |
| 2008 |
| December 31, 2007 |
| ||||
| Net Asset Value, Beginning of Period |
| $ 9.47 |
|
| $ 10.00 |
|
|
| |
| Income (Loss) from Investment Operations |
|
|
|
|
|
|
|
| |
| Net Investment Loss† |
| (0.02 | ) |
| 0.00 | ‡ |
|
| |
| Net Realized and Unrealized Loss on Investments |
| (3.60 | ) |
| (0.52 | ) |
|
| |
| Total from Investment Operations |
| (3.62 | ) |
| (0.52 | ) |
|
| |
| Distributions from and/or in Excess of: |
|
|
|
|
|
|
|
| |
| Net Realized Gain |
| (0.01 | ) |
| (0.01 | ) |
|
| |
| Total Distributions |
| (0.01 | ) |
| (0.01 | ) |
|
| |
| Net Asset Value, End of Period |
| $ 5.84 |
|
| $ 9.47 |
|
|
| |
| Total Return++ |
| (38.21 | )% |
| (5.31 | )%# |
|
| |
| Ratios and Supplemental Data: |
|
|
|
|
|
|
|
| |
| Net Assets, End of Period (Thousands) |
| $ 58 |
|
| $ 95 |
|
|
| |
| Ratio of Expenses to Average Net Assets |
| 1.42 | %+ |
| 1.55 | %*+ |
|
| |
| Ratio of Expenses to Average Net Assets Excluding Non Operating Expenses |
| 1.42 | %+ |
| N/A |
|
|
| |
| Ratio of Net Investment Loss to Average Net Assets |
| (0.24 | )%+ |
| (0.16 | )%*+ |
|
| |
| Portfolio Turnover Rate |
| 69 | % |
| 38 | %# |
|
| |
^ | Commencement of Operations | |||||||||
† | Per share amount is based on average shares outstanding. | |||||||||
‡ | Amount is less than $0.005 per share. | |||||||||
++ | Calculated based on the net asset value as of the last business day of the period. | |||||||||
# | Not Annualized | |||||||||
+ | Reflects rebate of certain Portfolio expenses in connection with the investments in Morgan Stanley Institutional Liquidity Money Market Portfolio — Institutional Class during the period. As a result of such rebate, the expenses as a percentage of its net assets were effected by approximately 0.01% and less than 0.005% for the years ended December 31, 2008 and December 31, 2007, respectively. | |||||||||
* | Annualized | |||||||||
138 |
| The accompanying notes are an integral part of the financial statements. |
| 2008 Annual Report |
|
|
| December 31, 2008 |
Financial Highlights
Emerging Markets Debt Portfolio
|
| Class I†† |
| |||||||||
|
| Year Ended December 31, |
| |||||||||
Selected Per Share Data and Ratios |
| 2008 |
| 2007 |
| 2006 |
| 2005 |
| 2004 |
| |
Net Asset Value, Beginning of Period |
| $ 11.47 |
| $ 11.99 |
| $ 11.61 |
| $ 10.92 |
| $ 10.59 |
| |
Income (Loss) from Investment Operations |
|
|
|
|
|
|
|
|
|
|
| |
Net Investment Income† |
| 1.03 |
| 0.71 |
| 0.49 |
| 0.81 |
| 0.78 |
| |
Net Realized and Unrealized Gain (Loss) on Investments |
| (2.15 | ) | (0.23 | ) | 0.80 |
| 0.57 |
| 0.30 |
| |
Total from Investment Operations |
| (1.12 | ) | 0.48 |
| 1.29 |
| 1.38 |
| 1.08 |
| |
Distributions from and/or in Excess of: |
|
|
|
|
|
|
|
|
|
|
| |
Net Investment Income |
| (0.41 | ) | (1.00 | ) | (0.91 | ) | (0.69 | ) | (0.75 | ) | |
Total Distributions |
| (0.41 | ) | (1.00 | ) | (0.91 | ) | (0.69 | ) | (0.75 | ) | |
Redemption Fees |
| — |
| 0.00 | ‡ | 0.00 | ‡ | 0.00 | ‡ | 0.00 | ‡ | |
Net Asset Value, End of Period |
| $ 9.94 |
| $ 11.47 |
| $ 11.99 |
| $ 11.61 |
| $ 10.92 |
| |
Total Return++ |
| (10.07 | )% | 4.68 | % | 11.08 | % | 12.78 | % | 10.07 | % | |
Ratios and Supplemental Data: |
|
|
|
|
|
|
|
|
|
|
| |
Net Assets, End of Period (Thousands) |
| $21,887 |
| $52,686 |
| $81,212 |
| $92,294 |
| $81,109 |
| |
Ratio of Expenses to Average Net Assets (1) |
| 0.83 | %+ | 0.93 | %+^ | 0.93 | %^ | 1.01 | % | 1.04 | %^ | |
Ratio of Expenses to Average Net Assets Excluding Non Operating Expenses |
| 0.81 | %+ | 0.85 | %+ | 0.92 | % | 1.00 | % | 1.04 | % | |
Ratio of Net Investment Income to Average Net Assets (1) |
| 9.16 | %+ | 6.28 | %+ | 6.11 | % | 7.02 | % | 7.33 | % | |
Portfolio Turnover Rate |
| 248 | % | 155 | % | 55 | % | 84 | % | 151 | % | |
(1) Supplemental Information on the Ratios to Average Net Assets: |
|
|
|
|
|
|
|
|
|
|
| |
Ratios before expense limitation: |
|
|
|
|
|
|
|
|
|
|
| |
Expenses to Average Net Assets |
| 1.61 | %+ | 1.21 | %+ | 1.04 | % | N/A |
| 1.07 | % | |
Net Investment Income to Average Net Assets |
| 8.38 | %+ | 6.00 | %+ | 6.00 | % | N/A |
| 7.30 | % | |
†† | On March 17, 2006, the Portfolio effected a reverse stock split as described in the Notes to Financial Statements. Per share data prior to this date has been restated to give effect to the reverse stock split. | |||||||||||
† | Per share amount is based on average shares outstanding. | |||||||||||
‡ | Amount is less than $0.005 per share. | |||||||||||
++ | Calculated based on the net asset value as of the last business day of the period. | |||||||||||
+ | Reflects rebate of certain Portfolio expenses in connection with the investments in Morgan Stanley Institutional Liquidity Money Market Portfolio — Institutional Class during the period. As a result of such rebate, the expenses as a percentage of its net assets were effected by approximately 0.01% and less than 0.005% for the years ended December 31, 2008 and December 31, 2007, respectively. | |||||||||||
^ | Effective June 1, 2006, the Adviser has voluntarily agreed to limit the ratio of expenses to average net assets to the maximum ratio of 0.85% for Class I shares. Prior to June 1, 2006, the maximum ratio was 1.00% for Class I shares. Prior to May 1, 2004, the maximum ratio was 1.75% for Class I shares. | |||||||||||
| The accompanying notes are an integral part of the financial statements. | 139 |
2008 Annual Report |
|
December 31, 2008 |
Financial Highlights
Emerging Markets Debt Portfolio
|
| Class P†† | |||||||||||||||
|
| Year Ended December 31, | |||||||||||||||
Selected Per Share Data and Ratios |
| 2008 |
| 2007 |
| 2006 |
| 2005 |
| 2004 |
| ||||||
Net Asset Value, Beginning of Period |
| $ | 11.77 |
| $ | 12.29 |
| $ | 11.85 |
| $ | 11.16 |
| $ | 10.80 |
| |
Income (Loss) from Investment Operations |
|
|
|
|
|
|
|
|
|
|
| ||||||
Net Investment Income† |
| 0.94 |
| 0.69 |
| 0.50 |
| 0.78 |
| 0.78 |
| ||||||
Net Realized and Unrealized Gain (Loss) on Investments |
| (2.13 | ) | (0.23 | ) | 0.81 |
| 0.60 |
| 0.30 |
| ||||||
Total from Investment Operations |
| (1.19 | ) | 0.46 |
| 1.31 |
| 1.38 |
| 1.08 |
| ||||||
Distributions from and/or in Excess of: |
|
|
|
|
|
|
|
|
|
|
| ||||||
Net Investment Income |
| (0.40 | ) | (0.98 | ) | (0.87 | ) | (0.69 | ) | (0.72 | ) | ||||||
Total Distributions |
| (0.40 | ) | (0.98 | ) | (0.87 | ) | (0.69 | ) | (0.72 | ) | ||||||
Redemption Fees |
| — |
| 0.00 | ‡ | 0.00 | ‡ | — |
| — |
| ||||||
Net Asset Value, End of Period |
| $ | 10.18 |
| $ | 11.77 |
| $ | 12.29 |
| $ | 11.85 |
| $ | 11.16 |
| |
Total Return++ |
| (10.34 | )% | 4.29 | % | 10.79 | % | 12.54 | % | 9.90 | % | ||||||
Ratios and Supplemental Data: |
|
|
|
|
|
|
|
|
|
|
| ||||||
Net Assets, End of Period (Thousands) |
| $ | 3,640 |
| $ | 870 |
| $ | 565 |
| $ | 596 |
| $ | 437 |
| |
Ratio of Expenses to Average Net Assets (1) |
| 1.12 | %+ | 1.20 | %+^ | 1.17 | %^ | 1.26 | % | 1.29 | %^ | ||||||
Ratio of Expenses to Average Net Assets Excluding Non Operating Expenses |
| 1.10 | %+ | 1.10 | %+ | 1.16 | % | 1.25 | % | 1.29 | % | ||||||
Ratio of Net Investment Income to Average Net Assets (1) |
| 8.56 | %+ | 5.99 | %+ | 5.94 | % | 6.70 | % | 7.07 | % | ||||||
Portfolio Turnover Rate |
| 248 | % | 155 | % | 55 | % | 84 | % | 151 | % | ||||||
(1) Supplemental Information on the Ratios to Average Net Assets: |
|
|
|
|
|
|
|
|
|
|
| ||||||
Ratios before expense limitation: |
|
|
|
|
|
|
|
|
|
|
| ||||||
Expenses to Average Net Assets |
| 2.31 | %+ | 1.49 | %+ | 1.29 | % | N/A |
| 1.32 | % | ||||||
Net Investment Income to Average Net Assets |
| 7.37 | %+ | 5.71 | %+ | 5.82 | % | N/A |
| 7.04 | % | ||||||
†† | On March 17, 2006, the Portfolio effected a reverse stock split as described in the Notes to Financial Statements. Per share data prior to this date has been restated to give effect to the reverse stock split. | ||||||||||||||||
† | Per share amount is based on average shares outstanding. | ||||||||||||||||
‡ | Amount is less than $0.005 per share. | ||||||||||||||||
++ | Calculated based on the net asset value as of the last business day of the period. | ||||||||||||||||
+ | Reflects rebate of certain Portfolio expenses in connection with the investments in Morgan Stanley Institutional Liquidity Money Market Portfolio — Institutional Class during the period. As a result of such rebate, the expenses as a percentage of its net assets were effected by approximately 0.01% and less than 0.005% for the years ended December 31, 2008 and December 31, 2007, respectively. | ||||||||||||||||
^ | Effective June 1, 2006, the Adviser has voluntarily agreed to limit the ratio of expenses to average net assets to the maximum ratio of 1.10% for Class P shares. Prior to June 1, 2006, the maximum ratio was 1.25% for Class P shares. Prior to May 1, 2004, the maximum ratio was 2.00% for Class P shares. | ||||||||||||||||
140 | The accompanying notes are an integral part of the financial statements. |
|
| 2008 Annual Report |
|
|
| December 31, 2008 |
Financial Highlights
Emerging Markets Debt Portfolio
|
| Class H |
| ||
|
| Period from |
| ||
|
| January 2, 2008^ |
| ||
Selected Per Share Data and Ratios |
| to December 31, 2008 |
| ||
Net Asset Value, Beginning of Period |
| $ 11.86 |
|
| |
Income (Loss) from Investment Operations |
|
|
|
| |
Net Investment Income† |
| 0.88 |
|
| |
Net Realized and Unrealized Loss on Investments |
| (2.17 | ) |
| |
Total from Investment Operations |
| (1.29 | ) |
| |
Distributions from and/or in Excess of: |
|
|
|
| |
Net Investment Income |
| (0.39 | ) |
| |
Total Distributions |
| (0.39 | ) |
| |
Net Asset Value, End of Period |
| $ 10.18 |
|
| |
Total Return++ |
| (10.70 | )%# |
| |
Ratios and Supplemental Data: |
|
|
|
| |
Net Assets, End of Period (Thousands) |
| $ 1,758 |
|
| |
Ratio of Expenses to Average Net Assets (1) |
| 1.18 | %*+ |
| |
Ratio of Expenses to Average Net Assets Excluding Non Operating Expenses |
| 1.10 | %*+ |
| |
Ratio of Net Investment Income to Average Net Assets (1) |
| 7.66 | %*+ |
| |
Portfolio Turnover Rate |
| 248 | %# |
| |
(1) Supplemental Information on the Ratios to Average Net Assets: |
|
|
|
| |
Ratios before expense limitation: |
|
|
|
| |
Expenses to Average Net Assets |
| 2.11 | %*+ |
| |
Net Investment Income to Average Net Assets |
| 6.73 | %*+ |
| |
^ | Commencement of Operations | ||||
† | Per share amount is based on average shares outstanding. | ||||
++ | Calculated based on the net asset value which does not reflect sales charges, if applicable, as of the last business day of the period. | ||||
# | Not Annualized | ||||
* | Annualized | ||||
+ | Reflects rebate of certain Portfolio expenses in connection with the investments in Morgan Stanley Institutional Liquidity Money Market Portfolio — Institutional Class during the period. As a result of such rebate, the expenses as a percentage of its net assets were effected by approximately 0.01% and less than 0.005% for the years ended December 31, 2008 and December 31, 2007, respectively. | ||||
| The accompanying notes are an integral part of the financial statements. | 141 |
2008 Annual Report |
|
December 31, 2008 |
Financial Highlights
Emerging Markets Debt Portfolio
|
| Class L |
| ||
|
| Period from |
| ||
|
| June 16, 2008^ |
| ||
Selected Per Share Data and Ratios |
| to December 31, 2008 |
| ||
Net Asset Value, Beginning of Period |
| $ 11.84 |
|
| |
Income (Loss) from Investment Operations |
|
|
|
| |
Net Investment Income† |
| 0.50 |
|
| |
Net Realized and Unrealized Loss on Investments |
| (1.87 | ) |
| |
Total from Investment Operations |
| (1.37 | ) |
| |
Distributions from and/or in Excess of: |
|
|
|
| |
Net Investment Income |
| (0.38 | ) |
| |
Total Distributions |
| (0.38 | ) |
| |
Net Asset Value, End of Period |
| $ 10.09 |
|
| |
Total Return++ |
| (11.85 | )%# |
| |
Ratios and Supplemental Data: |
|
|
|
| |
Net Assets, End of Period (Thousands) |
| $ 342 |
|
| |
Ratio of Expenses to Average Net Assets (1) |
| 1.72 | %*+ |
| |
Ratio of Expenses to Average Net Assets Excluding Non Operating Expenses |
| 1.60 | %*+ |
| |
Ratio of Net Investment Income to Average Net Assets (1) |
| 8.78 | %*+ |
| |
Portfolio Turnover Rate |
| 248 | %# |
| |
(1) Supplemental Information on the Ratios to Average Net Assets: |
|
|
|
| |
Ratios before expense limitation: |
|
|
|
| |
Expenses to Average Net Assets |
| 3.03 | %*+ |
| |
Net Investment Income to Average Net Assets |
| 7.47 | %*+ |
| |
^ | Commencement of Operations | ||||
† | Per share amount is based on average shares outstanding. | ||||
++ | Calculated based on the net asset value as of the last business day of the period. | ||||
# | Not Annualized | ||||
* | Annualized | ||||
+ | Reflects rebate of certain Portfolio expenses in connection with the investments in Morgan Stanley Institutional Liquidity Money Market Portfolio — Institutional Class during the period. As a result of such rebate, the expenses as a percentage of its net assets were effected by approximately 0.01% and less than 0.005% for the years ended December 31, 2008 and December 31, 2007, respectively. | ||||
142 | The accompanying notes are an integral part of the financial statements. |
|
| 2008 Annual Report |
|
|
| December 31, 2008 |
Notes to Financial Statements
Morgan Stanley Institutional Fund, Inc. (the “Fund”) is registered under the Investment Company Act of 1940, as amended (the “1940 Act”), as an open-end management investment company. The Fund is comprised of seventeen separate, active, diversified and non-diversified portfolios (individually referred to as a “Portfolio”, collectively as the “Portfolios”). The Fund offers up to four different classes of shares for certain Portfolios — Class I shares, Class P shares, Class H shares and Class L shares. Effective January 2, 2008, Class A shares and Class B shares of the Portfolios were renamed Class I shares and Class P shares, respectively. Each Portfolio (with the exception of the Global Real Estate, International Growth Active Extension, and Emerging Markets Debt Portfolios), offers two classes of shares — Class I and Class P. Global Real Estate, International Growth Active Extension and Emerging Markets Debt Portfolios offer Class I shares, Class P shares, Class H shares and Class L shares. Each class of shares has identical voting rights (except shareholders of each Class have exclusive voting rights regarding any matter relating solely to that particular Class of shares), dividend, liquidation and other rights. Effective January 2, 2008, the Class H shares commenced operations for the Global Real Estate, International Growth Active Extension and Emerging Markets Debt Portfolios. Effective May 1, 2008, Focus Equity and U.S. Large Cap Growth Portfolios were renamed Focus Growth and Capital Growth Portfolios, respectively. Effective June 16, 2008, the Class L shares commenced operations for the Global Real Estate, International Growth Active Extension and Emerging Markets Debt Portfolios. Effective October 21, 2008, the Class P shares commenced operations for the International Small Cap Portfolio.
For detailed descriptions of the investment objectives of each of the Portfolios and other related information, please refer to the Prospectuses of the Fund. Generally, the investment objective of the domestic and international equity portfolios is to seek capital appreciation by investing in equity and equity-related securities. The investment objective of the international fixed income portfolio is primarily to seek a high total return consistent with preservation of capital.
The Global Franchise, International Real Estate, and U.S. Real Estate Portfolios are currently closed to new investors. However, these Portfolios will continue to offer shares as follows: (1) through certain retirement plan accounts, (2) to clients of registered investment advisors who currently offer shares of the Portfolios in their discretionary asset allocation programs, (3) through certain endowments and foundations, (4) to clients of family office practices where shares of the Portfolios are held by family members of such clients, (5) to directors and trustees of the Morgan Stanley Funds, (6) to Morgan Stanley and its affiliates and their employees, (7) to benefit plans sponsored by Morgan Stanley and its affiliates, and (8) through certain mutual fund wrap programs sponsored by affiliates of the Adviser. The Portfolios will continue to offer shares of the Portfolios to existing shareholders and may recommence offering shares of the Portfolios to other new investors in the future.
The Fund has suspended offering shares of the Small Company Growth Portfolio to new investors. The Fund will continue to offer shares of the Portfolio to existing shareholders. The Fund may recommence offering shares of the Portfolio to new investors in the future.
A. Accounting Policies: The following significant accounting policies are in conformity with U.S. generally accepted accounting principles. Such policies are consistently followed by the Fund in the preparation of the financial statements. U.S. generally accepted accounting principles may require management to make estimates and assumptions that affect the reported amounts and disclosures in the financial statements. Actual results may differ from those estimates.
1. Security Valuation: Securities listed on a foreign exchange are valued at their closing price. Unlisted securities and listed securities not traded on the valuation date for which market quotations are readily available are valued at the mean between the current bid and asked prices obtained from reputable brokers. Equity securities listed on a U.S. exchange are valued at the latest quoted sales price on the valuation date. Equity securities listed or traded on NASDAQ, for which market quotations are available, are valued at the NASDAQ Official Closing Price. Bonds and other fixed income securities may be valued according to the broadest and most representative market. In addition, bonds and other fixed income securities may be valued on the basis of prices provided by a pricing service. The prices provided by a pricing service take into account broker dealer market price quotations for institutional size trading in similar groups of securities, security quality, maturity, coupon and other security characteristics as well as any developments related to the specific securities. Debt securities purchased with remaining maturities of 60 days or less are valued at amortized cost, if it approximates value.
All other securities and investments for which market values are not readily available, including restricted securities, and those securities for which it is inappropriate to determine prices in accordance with the aforementioned procedures, are valued at fair value as determined in good faith under procedures adopted by the Board of Directors (the “Directors”), although the actual calculations may be done by others. Factors considered in making this determination may include, but are not limited to, information obtained by
143
2008 Annual Report |
|
December 31, 2008 |
Notes to Financial Statements (cont’d)
contacting the issuer, analysts, or the appropriate stock exchange (for exchange-traded securities), analysis of the issuer’s financial statements or other available documents and, if necessary, available information concerning other securities in similar circumstances.
Most foreign markets close before the New York Stock Exchange (NYSE). Occasionally, developments that could affect the closing prices of securities and other assets may occur between the times at which valuations of such securities are determined (that is, close of the foreign market on which the securities trade) and the close of business on the NYSE. If these developments are expected to materially affect the value of the securities, the valuations may be adjusted to reflect the estimated fair value as of the close of the NYSE, as determined in good faith under procedures established by the Directors.
2. Foreign Currency Translation and Foreign Investments: The books and records of the Fund are maintained in U.S. dollars. Foreign currency amounts are translated into U.S. dollars at the mean of the bid and asked prices of such currencies against U.S. dollars last quoted by a major bank, prior to the close of the NYSE, as follows:
· | investments, other assets and liabilities-at the prevailing rates of exchange on the valuation date; |
|
|
· | investment transactions, investment income and expenses-at the prevailing rates of exchange on the dates of such transactions. |
Although the net assets of the Fund are presented at the foreign exchange rates and market values at the close of the period, the Fund does not isolate that portion of the results of operations arising as a result of changes in the foreign exchange rates from the fluctuations arising from changes in the market prices of securities held at period end. Similarly, the Fund does not isolate the effect of changes in foreign exchange rates from the fluctuations arising from changes in the market prices of securities sold during the period. Accordingly, realized and unrealized foreign currency gains (losses) on investments in securities are included in the reported net realized and unrealized gains (losses) on investment transactions and balances. However, pursuant to U.S. Federal income tax regulations, gains and losses from certain foreign currency transactions and the foreign currency portion of gains and losses realized on sales and maturities of foreign denominated debt securities are treated as ordinary income for U.S. Federal income tax purposes.
Net realized gains (losses) on foreign currency transactions represent net foreign exchange gains (losses) from foreign currency exchange contracts, disposition of foreign currencies, currency gains or losses realized between the trade and settlement dates on securities transactions, and the difference between the amount of investment income and foreign taxes recorded on the Fund’s books and the U.S. dollar equivalent amounts actually received or paid. Net unrealized currency gains (losses) from valuing foreign currency denominated assets and liabilities at period end exchange rates are reflected as a component of unrealized appreciation (depreciation) on the Statements of Assets and Liabilities. The change in net unrealized currency gains (losses) for the period is reflected on the Statements of Operations.
Foreign security and currency transactions may involve certain considerations and risks not typically associated with those of U.S. dollar denominated transactions as a result of, among other factors, fluctuations of exchange rates in relation to the U.S. dollar, the possibility of lower levels of government supervision and regulation of foreign securities markets and the possibility of political or economic instability.
Governmental approval for foreign investments may be required in advance of making an investment under certain circumstances in some countries, and the extent of foreign investments in domestic companies may be subject to limitation in other countries. Foreign ownership limitations also may be imposed by the charters of individual companies to prevent, among other concerns, violations of foreign investment limitations. As a result, an additional class of shares (identified as “Foreign” in the Portfolio of Investments) may be created and offered for investment. The “local” and “foreign shares” market values may differ. In the absence of trading of the foreign shares in such markets, the Fund values the foreign shares at the closing exchange price of the local shares. Such securities, if any, are identified as fair valued on the Portfolio of Investments.
3. Foreign Currency Exchange Contracts: Certain Portfolios may enter into foreign currency exchange contracts generally to attempt to protect securities and related receivables and payables against changes in future foreign currency exchange rates and, in certain situations, to gain exposure to foreign currencies. Certain Portfolios may also enter into cross currency hedges which involve the sale of one currency against the positive exposure to a different currency. Cross currency hedges may be used for hedging purposes or to establish an active exposure to the exchange rate between any two currencies. A foreign currency ex-change contract is an agreement between two parties to buy or sell currency at a set price on a future date. The market value of the contract will fluctuate with changes in currency exchange rates. The contract is marked-to-market
144
| 2008 Annual Report |
|
|
| December 31, 2008 |
Notes to Financial Statements (cont’d)
daily and the change in market value is recorded by the Portfolios as unrealized gain or loss. The Portfolios record realized gains or losses when the contract is closed equal to the difference between the value of the contract at the time it was opened and the value at the time it was closed. Credit risk may arise upon entering into these contracts from the potential inability of counterparts to meet the terms of their contracts and is generally limited to the amount of the unrealized gains on the contracts, if any, at the date of default. Risks may also arise from unanticipated movements in the value of a foreign currency relative to the U.S. dollar.
4. Loan Agreements: Certain Portfolios may invest in fixed and floating rate loans (“Loans”) arranged through private negotiations between an issuer of sovereign debt obligations and one or more financial institutions (“Lenders”) deemed to be creditworthy by the investment adviser. A Portfolio’s investments in Loans may be in the form of participation in Loans (“Participation”) or assignments of all or a portion of Loans (“Assignments”) from third parties. A Portfolio’s investment in a Participation typically results in the Portfolio having a contractual relationship with only the Lender and not with the borrower. The Portfolios have the right to receive payments of principal, interest and any fees to which it is entitled only upon receipt by the Lender of the payments from the borrower. The Portfolios generally have no right to enforce compliance by the borrower under the terms of the loan agreement. As a result, the Portfolio may be subject to the credit risk of both the borrower and the Lender that is selling the Participation and any intermediaries between the Lender and the Portfolio. When a Portfolio purchases Assignments from Lenders, it typically acquires direct rights against the borrower on the Loan. Because Assignments are arranged through private negotiations between potential assignees and potential assignors, the rights and obligations acquired by the Portfolio as the purchaser of an Assignment may differ from, and be more limited than, those held by the assigning Lender.
5. Short Sales: Certain Portfolios may sell securities short. A short sale is a transaction in which a Portfolio sells securities it may or may not own, but has borrowed, in anticipation of a decline in the market price of the securities. The Portfolio is obligated to replace the borrowed securities at the market price at the time of replacement. The Portfolio may have to pay a premium to borrow the securities as well as pay any dividends or interest payable on the securities until they are replaced. Dividends and interest payable on such securities sold short are included in dividend expense and interest expense, respectively, in the Statements of Operations. A Portfolio’s obligation to replace the securities borrowed in connection with a short sale will generally be secured by collateral deposited with the broker that consists of cash, U.S. government securities or other liquid, high grade debt obligations. In addition, the Portfolio will either designate on the Portfolio’s records or place in a segregated account with its Custodian an amount of cash, U.S. government securities or other liquid high grade debt obligations equal to the difference, if any, between (1) the market value of the securities sold at the time they were sold short and (2) cash, U.S. government securities or other liquid high grade debt obligations deposited as collateral with the broker in connection with the short sale. Short sales by the Portfolios involve certain risks and special considerations. Possible losses from short sales differ from losses that could be incurred from the purchase of a security, because losses from short sales may be unlimited, whereas losses from purchases cannot exceed the total amount invested.
6. Securities Lending: Certain Portfolios may lend securities to qualified financial institutions, such as broker-dealers, to earn additional income. Any increase or decrease in the fair value of the securities loaned that might occur and any interest earned or dividends declared on those securities during the term of the loan would remain in the Portfolio. Portfolios that lend securities receive cash or securities as collateral in an amount equal to or exceeding 100% of the current fair value of the loaned securities. The collateral is marked to market daily, by the securities lending agent, to ensure that a minimum of 100% collateral coverage is maintained.
Based on pre-established guidelines, the securities lending agent invests any cash collateral that is received in an affiliated money market portfolio and repurchase agreements backed by U.S. Treasury and Agency securities. Securities lending income is generated from the earnings on the invested collateral and borrowing fees, less any rebates owed to the borrowers and compensation to the lending agent, and is included in the Portfolios’ Statements of Operations in interest income. Risks in securities lending transactions are that a borrower may not provide additional collateral when required or return the securities when due, and that the value of the short-term investments will be less than the amount of cash collateral plus any rebate that is required to be returned to the borrower.
145
2008 Annual Report |
|
December 31, 2008 |
Notes to Financial Statements (cont’d)
The value of loaned securities and related collateral outstanding at December 31, 2008 are as follows:
| Value of |
|
|
| Loaned |
| Value of |
| Securities |
| Collateral |
Portfolio | (000) |
| (000) |
Active International Allocation | $115,931 |
| $121,861 |
Emerging Markets | 142,125 |
| 151,208 |
Global Real Estate | 48,070 |
| 50,999 |
Global Value Equity | 3,217 |
| 3,356 |
International Equity | 261,509 |
| 274,728 |
International Growth Equity | 8,480 |
| 8,841 |
International Real Estate | 46,081 |
| 48,749 |
U.S. Real Estate | 128,396 |
| 131,746 |
The following Portfolios had income from securities lending (after rebates to borrowers and fees paid to securities lending agent):
| Net Interest |
| Earned by |
| Portfolio |
Portfolio | (000) |
Active International Allocation | $1,491 |
Emerging Markets | 2,121 |
Global Real Estate | 144 |
Global Value Equity | 72 |
International Equity | 7,369 |
International Growth Equity | 116 |
International Real Estate | 429 |
U.S. Real Estate | 1,229 |
Emerging Markets Debt | 8 |
7. Repurchase Agreements: The Portfolios may enter into repurchase agreements under which a Portfolio lends excess cash and takes possession of securities with an agreement that the counterparty will repurchase such securities. In connection with transactions in repurchase agreements, a bank as custodian for the Fund takes possession of the underlying securities which are held as collateral, with a market value at least equal to the amount of the repurchase transaction, including principal and accrued interest. To the extent that any repurchase transaction exceeds one business day, the value of the collateral is marked-to-market on a daily basis to determine the adequacy of the collateral. In the event of default on the obligation to repurchase, the Fund has the right to liquidate the collateral and apply the proceeds in satisfaction of the obligation. In the event of default or bankruptcy by the counterparty to the agreement, realization and/or retention of the collateral or proceeds may be subject to legal proceedings. The Fund, along with other affiliated investment companies, may utilize a joint trading account for the purpose of entering into repurchase agreements.
8. Structured Securities: The Emerging Markets Debt Portfolio may invest in interests in entities organized and operated solely for the purpose of restructuring the investment characteristics of sovereign debt obligations. This type of restructuring involves the deposit with or purchase by an entity of specified instruments and the issuance by that entity of one or more classes of securities (“Structured Securities”) backed by, or representing interests in, the underlying instruments. Structured Securities generally will expose the Portfolio to credit risks of the underlying instruments as well as of the issuer of the structured security. Structured securities are typically sold in private placement transactions with no active trading market. Investments in Structured Securities may be more volatile than their underlying instruments; however, any loss is limited to the amount of the original investment.
9. Futures: Certain Portfolios may purchase and sell futures contracts. Futures contracts provide for the sale by one party and purchase by another party of a specified amount of a specified security, index, instrument or basket of instruments. Futures contracts (secured by cash, government securities or other high grade liquid investments deposited with brokers or custodians as “initial margin”) are valued based upon their quoted daily settlement prices; changes in initial settlement value (represented by cash paid to or received from brokers as “variation margin”) are accounted for as unrealized appreciation (depreciation). When futures contracts are closed, the difference between the opening value at the date the contract was entered into and the value at closing is recorded as a realized gain or loss in the Statements of Operations. Due from (to) broker includes both initial margin and variation margin, as stated in the Statements of Assets and Liabilities.
Certain Portfolios may use futures contracts in order to manage their exposure to the stock and bond markets, to hedge against unfavorable changes in the value of securities or to remain fully invested and to reduce transaction costs. Futures contracts involve market risk in excess of the amounts recognized in the Statements of Assets and Liabilities. Risks arise from the possible movements in security values underlying these instruments. The change in value of futures contracts primarily corresponds with the value of their underlying instruments, which may not correlate with the change in value of hedged investments.
10. Purchased and Written Options: Certain Portfolios may write covered call and put options on portfolio securities and other financial instruments. Premiums are received and are recorded as liabilities. The liabilities are subsequently adjusted to reflect the current value of the options written. Premiums received from writing options which expire are treated as realized gains. Premiums received from writing options which are exercised or are closed are added to or offset against the proceeds or amount paid on the transaction to determine the net realized gain or loss. By writing a covered call option, a Portfolio, in exchange for the premium, foregoes the
146
| 2008 Annual Report |
|
|
| December 31, 2008 |
Notes to Financial Statements (cont’d)
opportunity for capital appreciation above the exercise price should the market price of the underlying security increase. By writing a put option, a Portfolio, in exchange for the premium, accepts the risk of having to purchase a security at an exercise price that is above the current market price.
Certain Portfolios may purchase call and put options on their portfolio securities or other financial instruments. Each Portfolio may purchase call options to protect against an increase in the price of the security or financial instrument it anticipates purchasing. Each Portfolio may purchase put options on securities which it holds or other financial instruments to protect against a decline in the value of the security or financial instrument or to close out covered written put positions. Risks may arise from an imperfect correlation between the change in market value of the securities held by the Portfolio and the prices of options relating to the securities purchased or sold by the Portfolio and from the possible lack of a liquid secondary market for an option. The maximum exposure to loss for any purchased option is limited to the premium initially paid for the option.
At December 31, 2008, the Portfolios did not have any outstanding options written.
11. Swap Agreements: Each Portfolio may enter into swap agreements to exchange one return or cash flow for another return or cash flow in order to hedge against unfavorable changes in the value of securities or to remain fully invested and to reduce transaction costs. Securities designated as collateral for swap agreements, if any, are designated as such in the Portfolio of Investments. Cash collateral for swap agreements, if applicable, is deposited with the broker serving as counterparty to the agreement, and is included in “Due from (to) Broker” on the Statement of Assets and Liabilities. The following summarizes swaps which may be entered into by the Portfolio.
Credit Default Swaps: Credit default swaps involve commitments to pay a fixed rate in exchange for payment if a credit event affecting a third party (the referenced company) occurs. Credit events may include a failure to pay interest, bankruptcy, or restructuring. The Portfolio accrues for interim payments on swap contracts on a daily basis, with the net amount recorded within unrealized appreciation (depreciation) of swap contracts on the Statement of Assets and Liabilities. Once interim payments are settled in cash, the net amount is recorded within realized gain (loss) on swaps on the Statement of Operations. Credit default swaps are marked-to-market daily based upon quotations from market makers and the change, if any, is recorded as unrealized appreciation or depreciation in the Statements of Operations.
Interest Rate Swaps: Interest rate swaps involve the exchange of commitments to pay and receive interest based on a notional principal amount. The Portfolio accrues for interim payments on swap contracts on a daily basis, with the net amount recorded within unrealized appreciation (depreciation) of swap contracts on the Statement of Assets and Liabilities. Once interim payments are settled in cash, the net amount is recorded within realized gain (loss) on swaps on the Statement of Operations. In a zero-coupon interest rate swap, payments only occur at maturity, at which time one counterparty pays the total compounded fixed rate over the life of the swap and the other pays the total compounded floating rate that would have been earned had a series of LIBOR investments been rolled over through the life of the swap. The Portfolio amortizes its interest payment obligation over the life of the swap. The amortized portion of this payment is recorded within realized gain (loss) on the Statement of Operations. The unamortized portion of this payment is included in “Due from (to) Broker” on the Statement of Assets and Liabilities. Interest rate swaps are marked-to-market daily based upon quotations from market makers and the change, if any, is recorded as unrealized appreciation or depreciation in the Statement of Operations.
Total Return Swaps: Total return swaps involve commitments to pay interest in exchange for a market-linked return based on a notional amount. To the extent the total return of the security or index underlying the transaction exceeds or falls short of the offsetting interest rate obligation, the Portfolio will receive a payment from or make a payment to the counterparty, respectively. Total return swaps are marked-to-market daily based upon quotations from market makers and the change, if any, is recorded as unrealized appreciation or depreciation in the Statement of Operations. Periodic payments received or made at the end of each measurement period are recorded as realized gains (losses) in the Statement of Operations.
Realized gains (losses) on maturity or termination of swap agreements are presented in the Statement of Operations. Because there is no organized market for these swap agreements, the unrealized gain (loss) reported in the Statement of Assets and Liabilities may differ from that which would be realized in the event the Portfolio terminated its position in the agreement.
Risks may arise upon entering into these agreements from the potential inability of the counterparties to meet the terms of the agreements and are generally limited to the amount of net interest payments to be received, if any, at the date of default. Risks also arise from potential losses from adverse market movements, and such losses could exceed the related amounts shown in the Statement of Assets and Liabilities.
147
2008 Annual Report |
|
|
|
December 31, 2008 |
|
Notes to Financial Statements (cont’d)
12. Contract for Differences (CFDs): CFDs are contracts entered into between a broker and the Portfolio under which the parties agree to make payments to each other so as to replicate the economic consequences that would apply had a purchase or short sale of the underlying security taken place. Upon entering into CFDs, the Portfolio is required to pledge to the broker an amount of cash and/or other assets equal to a certain percentage of the contract amount (margin account). Periodically, payments are made to recognize changes in value of the contract resulting from interest on the notional value of the contract, market value changes in the underlying security, and/or dividends paid by the issuer of the underlying security. The Portfolio recognizes a realized gain or loss when cash is received from, or paid to, the broker. CFDs are valued daily by the Portfolio and the unrealized gains or losses on the contracts (as measured by the difference between the contract amount plus or minus cash received or paid and the market value of the underlying securities) are recorded in the Statement of Operations. The margin account and any net unrealized gains or losses on open CFDs are included in the Statement of Assets and Liabilities. The risks of entering into CFDs include unfavorable price movements in the underlying securities or the inability of the counterparties to fulfill their obligations under the contract.
13. Unfunded Commitments: Subject to the terms of a Subscription Agreement between the U.S. Real Estate Portfolio and BRCP REIT I, LLC the Portfolio has made a subscription commitment of $7,000,000 for which it will receive 7,000,000 shares of common stock. As of December 31, 2008, BRCP REIT I, LLC has drawn down approximately $2,287,000 which represents 32.7% of the commitment.
Subject to the terms of a Subscription Agreement between the U.S. Real Estate Portfolio and BRCP REIT II, LLC the Portfolio has made a subscription commitment of $9,000,000 for which it will receive 9,000,000 shares of common stock. As of December 31, 2008, BRCP REIT II, LLC has drawn down approximately $5,586,000 which represents 49.7% of the commitment.
Subject to the terms of a Subscription Agreement between the Global Real Estate Portfolio and Exeter Industrial Value Fund LP the Portfolio has made a subscription commitment of $2,000,000 for which it will receive 2,000,000 shares of common stock. As of December 31, 2008, Exeter Industrial Value Fund LP has drawn down approximately $800,000 which represents 0.40% of the commitment.
Subject to the terms of a Subscription Agreement between the U.S. Real Estate Portfolio and Exeter Industrial Value Fund LP the Portfolio has made a subscription commitment of $8,500,000 for which it will receive 8,500,000 shares of common stock. As of December 31, 2008, Exeter Industrial Value Fund LP has drawn down approximately $3,400,000 which represents 40.0% of the commitment.
Subject to the terms of a Subscription Agreement between the U.S. Real Estate Portfolio and Keystone Industrial Fund, LP, the Portfolio has made a subscription commitment of $7,500,000 for which it will receive 7,500,000 shares of common stock. As of December 31, 2008, Keystone Industrial Fund, LP has drawn down approximately $5,401,000 which represents 72.0% of the commitment.
Subject to the terms of a Subscription Agreement between the U.S. Real Estate Portfolio and Cabot Industrial Value Fund II, LP, the Portfolio has made a subscription commitment of $7,500,000 for which it will receive 7,500,000 shares of common stock. As of December 31, 2008, Cabot Industrial Value Fund, LP has drawn down approximately $6,334,000 which represents 84.4% of the commitment.
Subject to the terms of a Subscription Agreement between the U.S. Real Estate Portfolio and Cabot Industrial Value Fund III, LP, the Portfolio has made a subscription commitment of $7,500,000 for which it will receive 7,500,000 shares of common stock. As of December 31, 2008, Cabot Industrial Value Fund III, LP has drawn down approximately $111,000 which represents 1.5% of the commitment.
Subject to the terms of a Subscription Agreement between the U.S. Global Real Estate Portfolio and Cabot Industrial Value Fund III, LP, the Portfolio has made a subscription commitment of $7,500,000 for which it will receive 7,500,000 shares of common stock. As of December 31, 2008, Cabot Industrial Value Fund III, LP has drawn down approximately $111,000 which represents 1.5% of the commitment.
14. Redemption Fees: The following redemption fees are designed to protect each Portfolio and its shareholders from the effects of short-term trading. Shares of the Active International Allocation, Emerging Markets, Global Franchise, Global Real Estate, Global Value Equity, International Equity, International Growth Active Extension, International Growth Equity, International Real Estate, International Small Cap, Large Cap Relative Value, Small Company Growth, U.S. Real Estate and Emerging Markets Debt Portfolios redeemed within 30 days of purchase may be subject to a 2% redemption fee. Shares of the Capital Growth, Focus Growth, and U.S. Small/Mid Cap Value Portfolios redeemed within 7 days of purchase may be subject to a 2% redemption fee. These fees, if any, are included on the Statements of Changes in Net Assets.
15. Restricted Securities: Certain Portfolios may invest in unregistered or otherwise restricted securities. The term restricted securities refers to securities that are unregistered
148
| 2008 Annual Report |
|
|
| December 31, 2008 |
Notes to Financial Statements (cont’d)
or are held by control persons of the issuer and securities that are subject to contractual restrictions on their resale. As a result, restricted securities may be more difficult to value and the Portfolio may have difficulty disposing of such assets either in a timely manner or for a reasonable price. In order to dispose of an unregistered security, the Portfolio, where it has contractual rights to do so, may have to cause such security to be registered. A considerable period may elapse between the time the decision is made to sell the security and the time the security is registered so that the Portfolio could sell it. Contractual restrictions on the resale of securities vary in length and scope and are generally the result of a negotiation between the issuer and acquirer of the securities. The Portfolio would, in either case, bear market risks during that period.
16. New Accounting Pronouncement: On March 19, 2008, Financial Accounting Standards Board released Statement of Financial Accounting Standards No. 161, “Disclosures about Derivative Instruments and Hedging Activities” (“SFAS 161”). SFAS 161 requires qualitative disclosures about objectives and strategies for using derivatives, quantitative disclosures about fair value amounts of and gains and losses on derivative instruments, and disclosures about credit-risk-related contingent features in derivative agreements. The application of SFAS 161 is required for fiscal years and interim periods beginning after November 15, 2008. At this time, management is evaluating the implications of SFAS 161 and its impact on the financial statements has not yet been determined.
17. Fair Value Measurement: The Portfolios adopted Financial Accounting Standards Board Statement of Financial Accounting Standards No. 157, “Fair Value Measurements” (“SFAS 157”), effective January 1, 2008. In accordance SFAS 157, fair value is defined as the price that the Portfolios would receive to sell an investment or pay to transfer a liability in a timely transaction with an independent buyer in the principal market, or in the absence of a principal market the most advantageous market for the investment or liability. SFAS 157 establishes a three-tier hierarchy to distinguish between (1) inputs that reflect the assumptions market participants would use in valuing an asset or liability developed based on market data obtained from sources independent of the reporting entity (observable inputs) and (2) inputs that reflect the reporting entity’s own assumptions about the assumptions market participants would use in valuing an asset or liability developed based on the best information available in the circumstances (unobservable inputs) and to establish classification of fair value measurements for disclosure purposes. Various inputs are used in determining the value the Portfolios’ investments. The inputs are summarized in the three board levels listed below:
· Level 1 — | quoted prices in active markets for identical securities |
|
|
· Level 2 — | other significant observable inputs (including quoted prices for similar securities, interest rates, prepayment speeds, credit risk, etc.) |
|
|
· Level 3 — | significant unobservable inputs (including each Portfolio’s own assumptions in determining the fair value of investments) |
The inputs or methodology used for valuing securities, are not necessarily an indication of the risk associated with investing in those securities.
149
2008 Annual Report |
|
|
|
December 31, 2008 |
|
Notes to Financial Statements (cont’d)
The following is a summary of the inputs used as of December 31, 2008 in valuing the Portfolios’ investments carried at value:
|
| Investments in |
| Investments |
| Investments |
| Total for |
| Other |
| Other |
| Other Financial Instrument* |
| Total for Other |
|
|
| (000) |
| (000) |
| (000) |
| (000) |
| (000) |
| (000) |
| (000) |
| (000) |
|
Active International Allocation |
| $ 98,729 |
| $ 578,882 |
| $ 22 |
| $ 677,633 |
| $228 |
| $ 171 |
| $— |
| $ 399 |
|
Emerging Markets |
| 372,629 |
| 1,043,131 |
| — | ** | 1,415,760 |
| — |
| 561 |
| — |
| 561 |
|
Global Franchise |
| 29,723 |
| 51,338 |
| — |
| 81,061 |
| — |
| 369 |
| — |
| 369 |
|
Global Real Estate |
| 237,004 |
| 324,386 |
| 911 |
| 562,301 |
| — |
| (8 | ) | — |
| (8 | ) |
Global Value Equity |
| 15,570 |
| 23,686 |
| — |
| 39,256 |
| — |
| 131 |
| — |
| 131 |
|
International Equity |
| 434,572 |
| 3,070,500 |
| 18,265 |
| 3,523,337 |
| — |
| 31,598 |
| — |
| 31,598 |
|
International Growth Active Extension |
| 408 |
| 4,428 |
| — |
| 4,836 |
| 76 |
| — |
| — |
| 76 |
|
International Growth Equity |
| 10,843 |
| 39,417 |
| — |
| 50,260 |
| — |
| — |
| — |
| — |
|
International Real Estate |
| 44,418 |
| 439,180 |
| — |
| 483,598 |
| — |
| — |
| — |
| — |
|
International Small Cap |
| 12,029 |
| 305,591 |
| — | ** | 317,620 |
| — |
| (7 | ) | — |
| (7 | ) |
Capital Growth |
| 555,908 |
| 49,435 |
| — | ** | 605,343 |
| — |
| — |
| — |
| — |
|
Focus Growth |
| 5,493 |
| 531 |
| — |
| 6,024 |
| — |
| — |
| — |
| — |
|
Large Cap Relative Value |
| 177,005 |
| 8,379 |
| — |
| 185,384 |
| — |
| — |
| — |
| — |
|
Small Company Growth |
| 932,473 |
| 35,493 |
| 26,085 |
| 994,051 |
| — |
| — |
| — |
| — |
|
U.S. Real Estate |
| 622,558 |
| 25,982 |
| 22,001 |
| 670,541 |
| — |
| — |
| — |
| — |
|
U.S. Small/Mid Cap Value |
| 16,270 |
| 233 |
| — |
| 16,503 |
| — |
| — |
| — |
| — |
|
Emerging Markets Debt |
| 3,665 |
| 25,684 |
| — |
| 29,349 |
| — |
| 15 |
| — |
| 15 |
|
Following is a reconciliation of investments in which significant unobservable inputs (Level 3) were used in determining value for Investment in Securities:
|
| Beginning |
| Accrued |
|
|
| Change in |
|
|
| Net transfers in |
|
|
|
|
| Balance as of |
| discounts/ |
| Realized |
| appreciation |
| Net purchases |
| and/or out of |
| Balance as of |
|
|
| 12/31/07 |
| Premiums |
| gain (loss) |
| (depreciation) |
| (sales) |
| Level 3 |
| 12/31/08 |
|
|
| (000) |
| (000) |
| (000) |
| (000) |
| (000) |
| (000) |
| (000) |
|
Active International Allocation |
| $ — |
| $— |
| $ — |
| $ — |
| $ — |
| $ 22 |
| $ 22 |
|
Emerging Markets |
| — | ** | — |
| — |
| — |
| — |
| — |
| — | ** |
Global Franchise |
| — |
| — |
| — |
| — |
| — |
| — |
| — |
|
Global Real Estate |
| 200 |
| — |
| — |
| — |
| 711 |
| — |
| 911 |
|
Global Value Equity |
| — |
| — |
| — |
| — |
| — |
| — |
| — |
|
International Equity |
| — |
| — |
| — |
| — |
| — |
| 18,265 |
| 18,265 |
|
International Growth Active Extension |
| — |
| — |
| — |
| — |
| — |
| — |
| — |
|
International Growth Equity |
| — |
| — |
| — |
| — |
| — |
| — |
| — |
|
International Real Estate |
| — |
| — |
| — |
| — |
| — |
| — |
| — |
|
International Small Cap |
| — | ** | — |
| — |
| — |
| — |
| — |
| — | ** |
Capital Growth |
| — | ** | — |
| — |
| — |
| — |
| — |
| — | ** |
Focus Growth |
| — |
| — |
| — |
| — |
| — |
| — |
| — |
|
Large Cap Relative Value |
| — |
| — |
| — |
| — |
| — |
| — |
| — |
|
Small Company Growth |
| 7,581 |
| — |
| — |
| 5,510 |
| 7,325 |
| 5,669 |
| 26,085 |
|
U.S. Real Estate |
| 18,833 |
| — |
| (1,056 | ) | (40 | ) | 4,264 |
| — |
| 22,001 |
|
U.S. Small/Mid Cap Value |
| — |
| — |
| — |
| — |
| — |
| — |
| — |
|
Emerging Markets Debt |
| 114 |
| — | @ | — |
| (15 | ) | (99 | ) | — |
| — |
|
@ |
| Amount is less than $500. |
* |
| Other financial instruments include futures, forwards, swaps and CFDs. |
** |
| Includes a security which is valued at zero. |
150
| 2008 Annual Report |
|
|
| December 31, 2008 |
Notes to Financial Statements (cont’d)
Following is the amounts of total gains (losses) for the period included in earnings attributable to the change in un-realized gains (losses) relating to assets and liabilities still held at December 31, 2008:
| Investments | Other Financial |
| in Securities | Instruments |
Portfolio | (000) | (000) |
Active International Allocation | $ (14) | $— |
Emerging Markets | — | — |
Global Franchise | — | — |
Global Real Estate | — | — |
Global Value Equity | — | — |
International Equity | (1,438) | — |
International Growth Active Extension | — | — |
International Growth Equity | — | — |
International Real Estate | — | — |
International Small Cap | — | — |
Capital Growth | — | — |
Focus Growth | — | — |
Large Cap Relative Value | — | — |
Small Company Growth | (3,895) | — |
U.S. Real Estate | (1,301) | — |
U.S. Small/Mid Cap Value | — | — |
Emerging Markets Debt | — | — |
18. Other: Security transactions are accounted for on the date the securities are purchased or sold. Realized gains (losses) on the sale of investment securities are determined on the specific identified cost basis. Dividend income and distributions are recorded on the ex-dividend date (except for certain foreign dividends which may be recorded as soon as the Fund is informed of such dividends) net of applicable withholding taxes. Interest income is recognized on the accrual basis except where collection is in doubt. Discounts and premiums on securities purchased are amortized according to the effective yield method over their respective lives. Most expenses of the Fund can be directly attributed to a particular Portfolio. Expenses which cannot be directly attributed are apportioned among the Portfolios based upon relative net assets or other appropriate measures. Income, expenses (other than class specific expenses) and realized and unrealized gains or losses are allocated to each class of shares based upon their relative net assets.
Certain Portfolios may own shares of real estate investment trusts (“REITs”) which report information on the source of their distributions annually. A portion of distributions received from REITs during the year is estimated to be a return of capital and is recorded as a reduction of their cost.
B. Investment Advisory Fees: Morgan Stanley Investment Management Inc. (the “Adviser” or “MS Investment Management”), a wholly-owned subsidiary of Morgan Stanley, provides the Fund with investment advisory services under the terms of an Investment Advisory Agreement (the “Agreement”) at the annual rates of the average daily net assets indicated below.
|
| Average Daily |
| Advisory |
|
Portfolio |
| Net Assets |
| Fee |
|
Active International Allocation |
| first $1.0 billion |
| 0.65 | % |
|
| over $1.0 billion |
| 0.60 |
|
Emerging Markets |
| first $500 million |
| 1.25 |
|
|
| next $500 million |
| 1.20 |
|
|
| next $1.5 billion |
| 1.15 |
|
|
| over $2.5 billion |
| 1.00 |
|
Global Franchise |
| first $500 million |
| 0.80 |
|
|
| next $500 million |
| 0.75 |
|
|
| over $1.0 billion |
| 0.70 |
|
Global Real Estate |
|
|
| 0.85 |
|
Global Value Equity |
| first $1.0 billion |
| 0.67 |
|
|
| next $500 million |
| 0.645 |
|
|
| next $1.0 billion |
| 0.62 |
|
|
| next $1.0 billion |
| 0.595 |
|
|
| next $1.0 billion |
| 0.57 |
|
|
| over $4.5 billion |
| 0.545 |
|
International Equity |
| first $10 billion |
| 0.80 |
|
|
| over $10 billion |
| 0.75 |
|
International Growth Active Extension |
| first $1.0 billion |
| 1.15 |
|
|
| next $500 million |
| 1.05 |
|
|
| over $1.5 billion |
| 0.95 |
|
International Growth Equity |
| first $1.0 billion |
| 0.75 |
|
|
| over $1.0 billion |
| 0.70 |
|
International Real Estate |
|
|
| 0.80 |
|
International Small Cap |
| first $1.5 billion |
| 0.95 |
|
|
| over $1.5 billion |
| 0.90 |
|
Capital Growth |
| first $1.0 billion |
| 0.50 |
|
|
| next $1.0 billion |
| 0.45 |
|
|
| next $1.0 billion |
| 0.40 |
|
|
| over $3.0 billion |
| 0.35 |
|
Focus Growth |
| first $1.0 billion |
| 0.50 |
|
|
| next $1.0 billion |
| 0.45 |
|
|
| next $1.0 billion |
| 0.40 |
|
|
| over $3.0 billion |
| 0.35 |
|
Large Cap Relative Value |
| first $150 million |
| 0.50 |
|
|
| next $100 million |
| 0.45 |
|
|
| next $100 million |
| 0.40 |
|
|
| over $350 million |
| 0.35 |
|
Small Company Growth |
| first $1.0 billion |
| 0.92 |
|
|
| next $500 million |
| 0.85 |
|
|
| over $1.5 billion |
| 0.80 |
|
U.S. Real Estate |
| first $500 million |
| 0.80 |
|
|
| next $500 million |
| 0.75 |
|
|
| over $1.0 billion |
| 0.70 |
|
U.S. Small/Mid Cap Value |
|
|
| 0.67 |
|
Emerging Markets Debt |
| first $500 million |
| 0.75 |
|
|
| next $500 million |
| 0.70 |
|
|
| over $1.0 billion |
| 0.65 |
|
MS Investment Management has voluntarily agreed to waive fees payable to it and to reimburse the Portfolios for certain expenses, after giving effect to custody fee offsets, if necessary, if the total annual operating expenses, excluding bank overdraft, certain foreign taxes, transfer agent fees for Class H and Class L Shares and extraordinary expenses as defined,
151
2008 Annual Report |
|
|
|
December 31, 2008 |
|
Notes to Financial Statements (cont’d)
expressed as a percentage of average daily net assets, exceed the maximum ratios indicated as follows:
|
| Maximum Expense Ratio |
| |||||
| Class I | Class P | Class H | Class L | ||||
Active International Allocation | 0.80 | % | 1.05 | % | N/A |
| N/A |
|
Emerging Markets | 1.65 |
| 1.90 |
| N/A |
| N/A |
|
Global Franchise | 1.00 |
| 1.25 |
| N/A |
| N/A |
|
Global Real Estate | 1.05 |
| 1.30 |
| 1.30 | % | 1.80 | % |
Global Value Equity | 1.00 |
| 1.25 |
| N/A |
| N/A |
|
International Equity | 1.00 |
| 1.25 |
| N/A |
| N/A |
|
International Growth Active Extension | 1.25 |
| 1.50 |
| 1.50 |
| 2.00 |
|
International Growth Equity | 1.00 |
| 1.25 |
| N/A |
| N/A |
|
International Real Estate | 1.00 |
| 1.25 |
| N/A |
| N/A |
|
International Small Cap | 1.15 |
| 1.40 |
| N/A |
| N/A |
|
Capital Growth | 0.80 |
| 1.05 |
| N/A |
| N/A |
|
Focus Growth | 1.00 |
| 1.25 |
| N/A |
| N/A |
|
Large Cap Relative Value | 0.70 |
| 0.95 |
| N/A |
| N/A |
|
Small Company Growth | 1.10 |
| 1.35 |
| N/A |
| N/A |
|
U.S. Real Estate | 1.00 |
| 1.25 |
| N/A |
| N/A |
|
U.S. Small/Mid Cap Value | N/A |
| N/A |
| N/A |
| N/A |
|
Emerging Markets Debt | 0.85 |
| 1.10 |
| 1.10 |
| 1.60 |
|
Fee waivers and/or expense reimbursements are voluntary and may be commenced or terminated at any time. For the year ended December 31, 2008, the Portfolios had advisory fees waived and/or certain expenses reimbursed as follows:
| Advisory Fees |
| Waived and/or |
| Reimbursed |
Portfolio | (000) |
Active International Allocation | $202 |
Global Franchise | 15 |
Global Real Estate | 4 |
Global Value Equity | 13 |
International Growth Active Extension | 162 |
International Growth Equity | 69 |
Focus Growth | 37 |
Emerging Markets Debt | 289 |
@ Amount is less than $500.
The Adviser has entered into Sub-Advisory Agreements with Morgan Stanley Investment Management Limited, Morgan Stanley Asset & Investment Trust Management Co., Limited and Morgan Stanley Investment Management Company (each a “Sub- Adviser”), all wholly-owned subsidiaries of Morgan Stanley. The Sub-Advisers, subject to the control and supervision of the Fund, its officers, Directors and the Adviser, and in accordance with the investment objectives, policies and restrictions of the Portfolios, make certain day-to-day investment decisions for certain Portfolios and place certain of the Portfolios’ purchase and sales orders. The Adviser pays the Sub-Advisers on a monthly basis a portion of the net advisory fees the Adviser receives from the Portfolios which receive these services.
C. Administration Fees: MS Investment Management (the “Administrator”) also provides the Fund with administrative services pursuant to an administration agreement for a monthly fee, which on an annual basis equals 0.08% of the average daily net assets of each Portfolio. Under an agreement between the Administrator and JPMorgan Investor Services Co. (“JPMIS”), a corporate affiliate of JPMorgan Chase Bank, N.A., JPMIS provides certain administrative services to the Fund. For such services, the Administrator pays JPMIS a portion of the fee the Administrator receives from the Fund. Administration costs (including out-of-pocket expenses) incurred in the ordinary course of providing services under the administration agreement, except pricing services and extraordinary expenses, are covered under the administration fee. In addition, the Fund incurs local administration fees in connection with doing business in certain emerging market countries.
D. Distribution and Shareholder Servicing Fees: Morgan Stanley Distribution, Inc. (“MSDI” or the “Distributor”), a wholly-owned subsidiary of the Adviser, and an indirect subsidiary of Morgan Stanley, serves as the Fund’s Distributor of Portfolio shares pursuant to a Distribution agreement. The Fund had adopted Shareholder Service Plans with respect to Class P and Class H shares pursuant to Rule 12b-1 under the 1940 Act. Under the Shareholder Service Plans, each applicable Portfolio pays the Distributor a shareholder servicing fee, accrued daily and paid monthly, at an annual rate of 0.25% of the Portfolio’s average daily net assets attributable to Class P and Class H shares.
In addition, the Fund has adopted a Distribution and Shareholder Service Plan with respect to Class L shares pursuant to Rule 12b-1 under the 1940 Act. Under the Distribution and Shareholder Service Plan, each applicable Portfolio pays the Distributor a distribution fee, accrued daily and paid monthly, at an annual rate of 0.50% and a shareholder servicing fee, accrued daily and paid monthly, at an annual rate of 0.25% of the Portfolio’s average daily net assets attributable to Class L shares.
The distribution and shareholder servicing fees are used to support the expenses associated with servicing and maintaining accounts. The Distributor may compensate other parties for providing shareholder support services to investors who purchase Class P, Class H and Class L shares.
E. Dividend Disbursing and Transfer Agent: Effective June 9, 2008, the Fund dividend disbursing and transfer agent is Morgan Stanley Services Company, Inc. (“Morgan Stanley Services”). Pursuant to a Transfer Agency Agreement, the Fund pays Morgan Stanley Services a fee generally based on the number of classes, accounts and transactions relating to the Portfolios of the Fund. Prior to June 9, 2008, JPMorgan Investor Services Company provided dividend disbursing and transfer agency services for the Fund.
152
| 2008 Annual Report |
|
|
| December 31, 2008 |
Notes to Financial Statements (cont’d)
F. Custodian Fees: JPMorgan Chase Bank, N.A. (the “Custodian”) serves as Custodian for the Fund in accordance with a custodian agreement. The Custodian holds cash, securities, and other assets of the Fund as required by the 1940Act. The Fund has entered into an arrangement with its Custodian whereby credits realized on uninvested cash balances were used to offset a portion of each applicable Portfolio’s expenses. These custodian credits are shown as “Expense Offset” on the Statements of Operations.
G. Portfolio Investment Activity:
1. Security Transactions: During the year ended December 31, 2008, purchases and sales of investment securities, other than long-term U.S. Government securities and short-term investments, were:
|
| Purchases |
| Sales |
| ||
Portfolio |
| (000) |
| (000) |
| ||
Active International Allocation |
| $ | 259,782 |
| $ | 326,844 |
|
Emerging Markets |
| 2,343,997 |
| 2,740,278 |
| ||
Global Franchise |
| 36,208 |
| 30,565 |
| ||
Global Real Estate |
| 651,622 |
| 279,419 |
| ||
Global Value Equity |
| 47,010 |
| 69,515 |
| ||
International Equity |
| 1,579,382 |
| 2,590,254 |
| ||
International Growth Active Extension |
| 5,923 |
| 5,752 |
| ||
International Growth Equity |
|
| 90,646 |
|
| 29,720 |
|
International Real Estate |
| 490,776 |
| 658,103 |
| ||
International Small Cap |
| 263,953 |
| 482,645 |
| ||
Capital Growth |
| 495,113 |
| 684,778 |
| ||
Focus Growth |
| 4,388 |
| 6,610 |
| ||
Large Cap Relative Value |
| 117,131 |
| 131,151 |
| ||
Small Company Growth |
| 494,398 |
| 603,655 |
| ||
U.S. Real Estate |
| 341,251 |
| 464,858 |
| ||
U.S. Small/Mid Cap Value |
| 19,659 |
| 13,780 |
| ||
Emerging Markets Debt |
| 86,171 |
| 106,659 |
| ||
There were no purchases and sales of long-term U.S. Government securities for the year ended December 31, 2008.
2. Transactions with Affiliates: The Portfolios invest in the Institutional Class of portfolios within the Morgan Stanley Institutional Liquidity Funds (the “Liquidity Funds”), an open-end management investment company managed by the Adviser, both directly, and as a portion of the securities held as collateral on loaned securities. A summary of the Portfolio’s transactions in the shares of the Liquidity Funds during the year ended December 31, 2008 is set forth below:
|
| Market Value |
| Purchases |
| Sales |
| Dividend |
| Market Value |
| ||||
|
| December 31, 2007 |
| at Cost |
| Proceeds |
| Income |
| December 31, 2008 |
| ||||
Portfolio |
| (000) |
| (000) |
| (000) |
| (000) |
| (000) |
| ||||
Active International Allocation |
| $ | 71,488 |
| $ | 602,581 |
| $ | 576,309 |
| $3,097 |
| $ | 97,760 |
|
Emerging Markets |
| 35,567 |
| 1,117,135 |
| 980,528 |
| 2,320 |
| 172,174 |
| ||||
Global Franchise |
| 2,268 |
| 52,797 |
| 52,168 |
| 89 |
| 2,897 |
| ||||
Global Real Estate |
| — |
| 559,235 |
| 510,769 |
| 762 |
| 48,466 |
| ||||
Global Value Equity |
| 783 |
| 27,751 |
| 25,035 |
| 56 |
| 3,499 |
| ||||
International Equity |
| 108,256 |
| 2,260,205 |
| 1,992,338 |
| 8,215 |
| 376,123 |
| ||||
International Growth Active Extension |
| 43 |
| 5,131 |
| 5,162 |
| 4 |
| 12 |
| ||||
International Growth Equity |
| 13,311 |
| 98,130 |
| 103,631 |
| 129 |
| 7,810 |
| ||||
International Real Estate |
| — |
| 483,863 |
| 439,445 |
| 938 |
| 44,418 |
| ||||
International Small Cap |
| — |
| 244,465 |
| 232,436 |
| 267 |
| 12,029 |
| ||||
Capital Growth |
| 24,808 |
| 461,999 |
| 474,835 |
| 564 |
| 11,972 |
| ||||
Focus Growth |
| 1,147 |
| 4,215 |
| 5,311 |
| 14 |
| 51 |
| ||||
Large Cap Relative Value |
| 4,943 |
| 98,894 |
| 93,834 |
| 302 |
| 10,003 |
| ||||
Small Company Growth |
| 13,933 |
| 378,942 |
| 375,640 |
| 578 |
| 17,235 |
| ||||
U.S. Real Estate |
| — |
| 574,043 |
| 463,200 |
| 1,557 |
| 110,843 |
| ||||
U.S. Small/Mid Cap Value |
| 1,278 |
| 14,422 |
| 14,839 |
| 36 |
| 861 |
| ||||
Emerging Markets Debt |
| 1,887 |
| 70,253 |
| 68,475 |
| 74 |
| 3,665 |
| ||||
Investment Advisory fees paid by the Portfolios are reduced by an amount equal to their pro-rata share of the advisory and administration fees paid by the Liquidity Funds (“Rebate”). For the year ended December31, 2008, advisory fees paid were reduced as follows:
|
| Rebate |
|
Portfolio |
| (000) |
|
Active International Allocation |
| $ 83 |
|
Emerging Markets |
| 54 |
|
Global Franchise |
| 5 |
|
Global Real Estate |
| 27 |
|
Global Value Equity |
| 1 |
|
International Equity |
| 187 |
|
International Growth Active Extension |
| — | @ |
International Growth Equity |
| 2 |
|
International Real Estate |
| 24 |
|
International Small Cap |
| 11 |
|
Capital Growth |
| 21 |
|
Focus Growth |
| — | @ |
Large Cap Relative Value |
| 12 |
|
Small Company Growth |
| 20 |
|
U.S. Real Estate |
| 37 |
|
U.S. Small/Mid Cap Value |
| 1 |
|
Emerging Markets Debt |
| 3 |
|
@ Amount is less than $500.
153
2008 Annual Report |
|
|
|
December 31, 2008 |
|
Notes to Financial Statements (cont’d)
The Emerging Markets Equity Portfolio invests in Morgan Stanley Growth Fund., a closed-end management investment company advised by an affiliate of the Adviser. The Morgan Stanley Growth Fund was acquired at a cost of $3,415,000.
A summary of the Portfolio’s transactions in shares of the affiliated issuer during the the year ended December 31, 2008 is as follows.
Market Value |
|
|
| Market Value |
December 31, | Purchases | Sales | Dividend | December 31, |
2007 | at Cost | Proceeds | Income | 2008 |
(000) | (000) | (000) | (000) | (000) |
$28,374 | — | — | — | $11,192 |
The Active International Allocation Portfolio invests in Mitsubishi UFJ Financial Group, Inc and Mitsubishi UFL Lease & Finance Co., Ltd.., affiliates of the Adviser. The Mitsubishi UFJ Financial Group, Inc. and Mitsubishi UFL Lease & Finance Co., Ltd., were acquired at a cost of $8,810,000 and $28,000, respectively.
A summary of the Portfolio’s transactions in shares of The Mitsubishi UFJ Financial Group, Inc. and Mitsubishi UFL Lease & Finance Co., Ltd. during the the year ended December 31, 2008 is as follows.
Market Value |
|
|
| Market Value | |
December 31, | Purchases | Sales | Dividend | December 31, | |
2007 | at Cost | Proceeds | Income | 2008 | |
(000) | (000) | (000) | (000) | (000) | |
$7,897 | $133 | $2,105 | $117 | $5,087 | |
— | 28 | — | — | @ | 15 |
The Large Cap Relative Value Portfolio invests in Mitsubishi UFJ Financial Group, Inc. ADR, an affiliate of the Adviser. The Mitsubishi UFJ Financial Group, Inc. ADR, was acquired at a cost of $550,000.
A summary of the Portfolio’s transactions in shares of the affiliated issuer during the the year ended December 31, 2008 is as follows.
Market Value |
|
|
| Market Value |
December 31, | Purchases | Sales | Dividend | December 31, |
2007 | at Cost | Proceeds | Income | 2008 |
(000) | (000) | (000) | (000) | (000) |
$— | $550 | — | $4 | $368 |
During the year ended December 31, 2008, the following Portfolios incurred brokerage commissions with Morgan Stanley & Co. Incorporated, an affiliated broker/dealer:
|
| Broker |
|
|
| Commissions |
|
Portfolio |
| (000) |
|
Emerging Markets |
| $68 |
|
Global Franchise |
| — | @ |
Global Real Estate |
| 91 |
|
Global Value Equity |
| 2 |
|
International Growth Active Extension |
| — | @ |
International Real Estate |
| 77 |
|
Capital Growth |
| 6 |
|
Large Cap Relative Value |
| 2 |
|
Small Company Growth |
| 2 |
|
U.S. Small/Mid Cap Value |
| 3 |
|
U.S. Real Estate |
| 24 |
|
@ Amount is less than $500.
Additionally, during the year ended December 31, 2008, Emerging Markets Portfolio incurred approximately $44,000 in brokerage commissions with China International Capital Corporation (Hong Kong) Limited (CICC), an affiliated broker/dealer.
H. Federal Income Taxes: It is each Portfolio’s intention to qualify as a regulated investment company and distribute all of its taxable and tax-exempt income. Accordingly, no provision for Federal income taxes is required in the financial statements. Dividend income and distributions to shareholders are recorded on the ex-dividend date.
A Portfolio may be subject to taxes imposed by countries in which it invests. Such taxes are generally based on income and/or capital gains earned or repatriated. Taxes are accrued based on net investment income, net realized gains and net unrealized appreciation as income and/or capital gains are earned. Taxes may also be based on the movement of foreign currency and are accrued based on the value of investments denominated in such currency.
Financial Accounting Standards Board Interpretation No. 48 Accounting for Uncertainty in Income Taxes (FIN 48) sets forth a minimum threshold for financial statement recognition of the benefit of a tax position taken or expected to be taken in a tax return. Management has concluded there are no significant un-certain tax positions that would require recognition in the financial statements. If applicable, the Portfolios recognize interest accrued related to unrecognized tax benefits in “Interest Expense” and penalties in “Other” expenses on the Statement of Operations. The Portfolios file tax returns with the U.S. Internal Revenue Service, New York and various states. Generally, each of the tax years in the four year period ended December 31, 2008, remains subject to examination by taxing authorities.
The tax character of distributions paid may differ from the character of distributions shown on the Statements of Changes in Net Assets due to short-term capital gains being treated as
154
| 2008 Annual Report |
|
|
| December 31, 2008 |
Notes to Financial Statements (cont’d)
ordinary income for tax purposes. The tax character of distributions paid during fiscal 2008 and 2007 were as follows:
| �� | 2008 |
| 2007 |
| ||||
|
| Distributions |
| Distributions |
| ||||
|
| Paid From: |
| Paid From: |
| ||||
|
| Ordinary |
| Long-term |
| Ordinary |
| Long-term |
|
|
| Income |
| Capital Gain |
| Income |
| Capital Gain |
|
Portfolio |
| (000) |
| (000) |
| (000) |
| (000) |
|
Active International Allocation |
| $ 9,170 |
| $ 40,185 |
| $ 43,168 |
| $ 50,249 |
|
Emerging Markets |
| 46,243 |
| 110,850 |
| 111,228 |
| 501,698 |
|
Global Franchise |
| 6,027 |
| 1,482 |
| 1,348 |
| 17,751 |
|
Global Real Estate |
| 1,678 |
| 2,130 |
| 31,622 |
| 3,308 |
|
Global Value Equity |
| 2,472 |
| 712 |
| 2,759 |
| 13,384 |
|
International Equity* |
| 105,453 |
| 309,605 |
| 205,097 |
| 800,160 |
|
International Growth Active Extension |
| 151 |
| — |
| — |
| — |
|
International Growth Equity |
| 1,891 |
| 267 |
| 127 |
| 260 |
|
International Real Estate |
| 152 |
| 5,259 |
| 91,243 |
| 63,755 |
|
International Small Cap |
| 13,263 |
| 30,493 |
| 21,636 |
| 212,655 |
|
Capital Growth |
| 4,769 |
| 1,427 |
| 5,423 |
| — |
|
Focus Growth |
| 24 |
| — |
| 22 |
| — |
|
Large Cap Relative Value |
| 4,799 |
| 1,219 |
| 5,050 |
| 11,838 |
|
Small Company Growth |
| — |
| — |
| — |
| 82,806 |
|
U.S. Real Estate |
| 20,213 |
| 70,297 |
| 69,511 |
| 339,875 |
|
U.S. Small/Mid Cap Value |
| 31 |
| — |
| 18 |
| — |
|
Emerging Markets Debt |
| 989 |
| — |
| 4,283 |
| — |
|
*Amounts based on October 31 tax year end.
The amount and character of income and gains to be distributed are determined in accordance with income tax regulations which may differ from U.S. generally accepted accounting principles. These book/tax differences are either considered temporary or permanent in nature.
Temporary differences are generally due to differing book and tax treatments for the timing of the recognition of gains (losses) on certain investment transactions and the timing and the deductibility of certain expenses.
Permanent differences, primarily due to differing treatments of gains (losses) related to REIT adjustments, foreign currency transactions, foreign futures and options transactions, short sales, defaulted bonds, paydown adjustments, return of capital from certain securities, expiring capital losses, distribution redesignations, foreign taxes paid on capital gains, net operating losses, nondeductible expenses, certain equity securities designated as issued by “passive foreign investment companies” and excess distributions resulted in the following reclassifications among the Portfolios’ components of net assets at December 31, 2008:
|
| Accumulated |
|
|
|
|
|
|
| Undistributed |
|
|
|
|
|
|
| (Distributions in |
|
|
|
|
|
|
| Excess of) Net |
| Accumulated |
|
|
|
|
| Investment |
| Net Realized |
| Paid-in |
|
|
| Income (Loss) |
| Gain (Loss) |
| Capital |
|
Portfolio |
| (000) |
| (000) |
| (000) |
|
Active International Allocation |
| $(10,538 | ) | $10,538 |
| $ — | @ |
Emerging Markets |
| (2,191 | ) | 5,759 |
| (3,568 | ) |
Global Franchise |
| 3,607 |
| (3,607 | ) | — |
|
Global Real Estate |
| 476 |
| (267 | ) | (209 | ) |
Global Value Equity |
| 957 |
| (955 | ) | (2 | ) |
International Equity |
| (12,811 | ) | 6,509 |
| 6,302 |
|
International Growth Active Extension |
| 16 |
| (1 | ) | (15 | ) |
International Growth Equity |
| 23 |
| (23 | ) | — |
|
International Real Estate |
| 7,426 |
| (6,001 | ) | (1,425 | ) |
International Small Cap |
| 763 |
| (763 | ) | — |
|
Capital Growth |
| 2,188 |
| (51 | ) | (2,137 | ) |
Focus Growth |
| 30 |
| (3 | ) | (27 | ) |
Large Cap Relative Value |
| (1 | ) | 1 |
| — |
|
Small Company Growth |
| 2,515 |
| 98 |
| (2,613 | ) |
U.S. Real Estate |
| (1,006 | ) | 3,810 |
| (2,804 | ) |
U.S. Small/Mid Cap Value |
| 1 |
| — | @ | (1 | ) |
Emerging Markets Debt |
| (1,963 | ) | 2,411 |
| (448 | ) |
@ Amount is less than $500.
At December 31, 2008, the components of distributable earnings on a tax basis were as follows:
|
| Undistributed |
| Undistributed |
|
|
| Ordinary |
| Long-term |
|
|
| Income |
| Capital Gain |
|
Portfolio |
| (000) |
| (000) |
|
Active International Allocation |
| $ 1,349 |
| $ — |
|
Global Franchise |
| 1,058 |
| — |
|
Global Real Estate |
| 210 |
| — |
|
Global Value Equity |
| 312 |
| 5 |
|
International Growth Equity |
| 11 |
| — |
|
International Small Cap |
| 768 |
| — |
|
Large Cap Relative Value |
| 30 |
| — |
|
U.S. Real Estate |
| 283 |
| — |
|
Emerging Markets Debt |
| 353 |
| — |
|
Any Portfolios not shown above had no distributable earnings on a tax basis at December 31, 2008.
At December 31, 2008, cost, unrealized appreciation, unrealized depreciation, and net unrealized appreciation (depreciation) for U.S. Federal income tax purposes of the investments of each of the Portfolios were:
|
|
|
|
|
|
|
| Net |
| |||
|
|
|
|
|
|
|
| Appreciation |
| |||
|
| Cost |
| Appreciation |
| Depreciation |
| (Depreciation) |
| |||
Portfolio |
| (000) |
| (000) |
| (000) |
| (000) |
| |||
Active International Allocation |
| $ | 827,982 |
| $ | 26,940 |
| $ | (177,289 | ) | $ (150,349 | ) |
Emerging Markets |
| 2,029,918 |
| 34,955 |
| (649,113 | ) | (614,158 | ) | |||
Global Franchise |
| 95,100 |
| 3,847 |
| (17,886 | ) | (14,039 | ) | |||
Global Real Estate |
| 1,023,759 |
| 1,442 |
| (462,900 | ) | (461,458 | ) | |||
Global Value Equity |
| 37,023 |
| 2,628 |
| (395 | ) | 2,233 |
| |||
International Equity |
| 4,304,732 |
| 198,286 |
| (979,681 | ) | (781,395 | ) | |||
International Growth Active Extension |
| 11,053 |
| 76 |
| (4,564 | ) | (4,488 | ) | |||
International Growth Equity |
| 81,353 |
| 359 |
| (31,452 | ) | (31,093 | ) | |||
International Real Estate |
| 1,093,832 |
| 6 |
| (610,240 | ) | (610,234 | ) | |||
International Small Cap |
| 462,496 |
| 15,315 |
| (160,191 | ) | (144,876 | ) | |||
155
2008 Annual Report |
|
|
|
December 31, 2008 |
|
Notes to Financial Statements (cont’d)
|
|
|
|
|
|
|
| Net |
| |
|
|
|
|
|
|
|
| Appreciation |
| |
|
| Cost |
| Appreciation |
| Depreciation |
| (Depreciation) |
| |
Portfolio |
| (000) |
| (000) |
| (000) |
| (000) |
| |
Capital Growth |
| $ | 905,650 |
| $ 23,264 |
| $(323,571 | ) | $(300,307 | ) |
Focus Growth |
| 9,833 |
| 157 |
| (3,966 | ) | (3,809 | ) | |
Large Cap Relative Value |
| 234,089 |
| 5,879 |
| (54,584 | ) | (48,705 | ) | |
Small Company Growth |
| 1,467,403 |
| 90,653 |
| (564,005 | ) | (473,352 | ) | |
U.S. Real Estate |
| 957,567 |
| 4,499 |
| (291,525 | ) | (287,026 | ) | |
U.S. Small/Mid Cap Value |
| 22,982 |
| 194 |
| (6,673 | ) | (6,479 | ) | |
Emerging Markets Debt |
| 33,525 |
| 113 |
| (4,289 | ) | (4,176 | ) | |
At December 31, 2008, the following Portfolios had available capital loss carryforwards to offset future net capital gains, to the extent provided by regulations, through the indicated expiration dates:
Portfolio |
| 2009 |
| 2010 |
| 2011 |
| 2012 |
| 2015 |
| 2016 |
| Total |
| |||||||
Active International Allocation |
| $ | — |
| $ | — |
| $ | — |
| $ | — |
| $ | — |
| $ | 1,241 |
| $ | 1,241 |
|
Global Franchise |
| — |
| — |
| — |
| — |
| — |
| 275 |
| 275 |
| |||||||
Global Real Estate |
| — |
| — |
| — |
| — |
| — |
| 54,045 |
| 54,045 |
| |||||||
International Growth Active Extension |
| — |
| — |
| — |
| — |
| 52 |
| 1,194 |
| 1,246 |
| |||||||
International Growth Equity |
| — |
| — |
| — |
| — |
| — |
| 5,211 |
| 5,211 |
| |||||||
International Real Estate |
| — |
| — |
| — |
| — |
| — |
| 98,798 |
| 98,798 |
| |||||||
International Small Cap |
| — |
| — |
| — |
| — |
| — |
| 31,842 |
| 31,842 |
| |||||||
Capital Growth |
| — |
| — |
| — |
| — |
| — |
| 61,044 |
| 61,044 |
| |||||||
Focus Growth |
| — |
| 15,905 |
| — |
| 296 |
| — |
| 334 |
| 16,535 |
| |||||||
Large Cap Relative Value* |
| 16,090 |
| 32,107 |
| — |
| — |
| — |
| 2,911 |
| 51,108 |
| |||||||
Small Company Growth* |
| — |
| 14,422 |
| — |
| — |
| — |
| 5,069 |
| 19,491 |
| |||||||
U.S. Real Estate |
| — |
| — |
| — |
| — |
| — |
| 10,379 |
| 10,379 |
| |||||||
U.S. Small Mid Cap Value |
| — |
| — |
| — |
| — |
| — |
| 1,751 |
| 1,751 |
| |||||||
* Capital loss carryover from target fund.
The amounts reflected in the capital loss carryforward table for Large Cap Relative Value Portfolio represent capital loss carryforward brought forward as a result of the Portfolio’s merger with the MSIFT Equity Portfolio. Based on certain provisions in the Internal Revenue Code, various limitations regarding the future utilization of these carryforwards may apply. This acquired capital loss carryforward is expected to expire between 2009-2010.
In addition, the amounts reflected in the capital loss carryforward table above for the Small Company Growth Portfolio represent capital loss carryforward acquired from MSIFT Small Cap Growth Portfolio after limitations pursuant to Internal Revenue Code, Section 383. This aquired capital loss carryforward is expected to expire in 2010.
During the year ended December 31, 2008, the following Portfolios utilized capital loss carryforwards for U.S. Federal income tax purposes of approximately:
| Capital Loss |
| Carryforward |
| Utilized |
Portfolio | (000) |
Emerging Markets Debt | 778 |
To the extent that capital loss carryovers are used to offset any future capital gains realized during the carryover period as provided by U.S. Federal income tax regulations, no capital gains tax liability will be incurred by a Portfolio for gains realized and not distributed. To the extent that capital gains are offset, such gains will not be distributed to the shareholders.
Net capital, passive investment company (PFIC), and currency losses incurred after October 31, and within the taxable year are deemed to arise on the first day of the Portfolio’s next taxable year. For the year ended December 31, 2008, the Portfolio deferred to January 2, 2009 for U.S. Federal income tax purposes, post-October capital, PFIC and currency losses as indicated:
|
| Capital |
| Currency |
| PFIC |
|
|
| Losses |
| Losses |
| Losses |
|
Portfolio |
| (000) |
| (000) |
| (000) |
|
Active International Allocation |
| $ 10,760 |
| $ — |
| $ — |
|
Emerging Markets |
| 196,824 |
| — |
| — |
|
Global Real Estate |
| 44,620 |
| — |
| — |
|
Global Value Equity |
| 14,730 |
| — |
| 25 |
|
International Growth Active Extension |
| 584 |
| — |
| — |
|
International Growth Equity |
| 4,363 |
| 24 |
| — |
|
International Real Estate |
| 42,341 |
| 135 |
| — |
|
International Small Cap |
| 32,177 |
| — |
| — |
|
Capital Growth |
| 46,658 |
| — |
| — |
|
Focus Growth |
| 308 |
| — | @ | — |
|
Large Cap Relative Value |
| 11,498 |
| — |
| — |
|
U.S. Real Estate |
| 64,021 |
| — | @ | — |
|
U.S. Small/Mid Cap Value |
| 2,220 |
| — |
| — |
|
Emerging Markets Debt |
| 442 |
| 221 |
| — |
|
@ Amount is less than $500.
For the year ended December 31, 2008, the Emerging Markets Debt Portfolio realized losses from in-kind redemptions of approximately $669,000. The losses are not taxable income to the Portfolio.
I. Contractual Obligations: The Fund enters into contracts that contain a variety of indemnifications. The Fund’s maximum exposure under these arrangements is unknown. However, the Fund has not had prior claims or losses pursuant to these contracts and expects the risk of loss to be remote.
J. Other: The net assets of certain Portfolios include foreign denominated securities and currency. Changes in currency exchange rates will affect the U.S. dollar value of and investment income from such securities. Further, at times certain of the Portfolios’ investments are concentrated in a
156
| 2008 Annual Report |
|
|
| December 31, 2008 |
Notes to Financial Statements (cont’d)
limited number of countries and regions. This concentration may further increase the risk of the Portfolio.
Global Real Estate, International Real Estate and U.S. Real Estate Portfolios invest a significant portion of their assets in securities of real estate investment trusts (REIT). The market’s perception of prospective declines in private real estate values and other financial assets may result in increased volatility of market prices that can negatively impact the valuation of certain issuers held by the Portfolios.
The Emerging Markets Debt Portfolio holds a significant portion of its investments in securities which are traded by a small number of market makers who may also be utilized by the Portfolio to provide pricing information used to value such investments. The amounts realized upon disposition of these securities may differ from the value reflected on the Statements of Assets and Liabilities.
Settlement and registration of foreign securities transactions may be subject to significant risks not normally associated with investments in the United States. In certain markets, including Russia, ownership of shares is defined according to entries in the issuer’s share register. In Russia, currently no central registration system exists and the share registrars may not be subject to effective state supervision. It is possible that a Portfolio could lose its share registration through fraud, negligence or even mere oversight. In addition, shares being delivered for sales and cash being paid for purchases may be delivered before the exchange is complete. This may subject the Portfolio to further risk of loss in the event of counterparty’s failure to complete the transaction.
At December 31, 2008, certain Portfolios had otherwise unaffiliated record owners of 10% or greater. Investment activities of these shareholders could have a material impact on these Portfolios.
These Portfolios and the aggregate percentage of such owners were as follows:
|
| Percentage of Ownership |
| ||||||
Portfolio |
| Class I |
| Class P |
| Class H |
| Class L |
|
Active International Allocation |
| — | % | 17.1 | % | — | % | — | % |
Emerging Markets |
| 50.1 |
| 86.0 |
| — |
| — |
|
Global Franchise |
| 80.0 |
| — |
| — |
| — |
|
Global Real Estate |
| 34.7 |
| 86.4 |
| — |
| — |
|
Global Value Equity |
| 66.0 |
| 93.2 |
| — |
| — |
|
International Equity |
| 11.0 |
| 73.7 |
| — |
| — |
|
International Growth Active Extension |
| — |
| — |
| — |
| — |
|
International Growth Equity |
| 98.9 |
| 27.8 |
| — |
| — |
|
International Real Estate |
| 48.5 |
| 15.1 |
| — |
| — |
|
International Small Cap |
| 24.9 |
| — |
| — |
| — |
|
Capital Growth |
| 32.4 |
| 80.7 |
| — |
| — |
|
Focus Growth |
| — |
| 22.3 |
| — |
| — |
|
Large Cap Relative Value |
| 80.7 |
| 97.8 |
| — |
| — |
|
Small Company Growth |
| 35.2 |
| 63.2 |
| — |
| — |
|
U.S. Real Estate |
| 36.9 |
| 74.7 |
| — |
| — |
|
U.S. Small/Mid Cap Value |
| 22.6 |
| — |
| — |
| — |
|
Emerging Markets Debt |
| 15.6 |
| 59.2 |
| — |
| — |
|
K. Subsequent Event: On November 19, 2008, the Board of Directors of the Fund approved, subject to shareholder approval, the merger of Global Value Equity Portfolio into Global Franchise Portfolio. Completion of the merger is subject to a number of conditions, including approval by the shareholders of the Fund.
157
2008 Annual Report |
|
|
|
December 31, 2008 |
|
Report of Independent Registered Public Accounting Firm
To the Shareholders and Board of Directors of
Morgan Stanley Institutional Fund, Inc.
We have audited the accompanying statements of assets and liabilities of Active International Allocation Portfolio, Emerging Markets Portfolio, Global Franchise Portfolio, Global Real Estate Portfolio, Global Value Equity Portfolio, International Equity Portfolio, International Growth Active Extension Portfolio, International Growth Equity Portfolio, International Real Estate Portfolio, International Small Cap Portfolio, Capital Growth Portfolio, Focus Growth Portfolio, Large Cap Relative Value Portfolio, Small Company Growth Portfolio, U.S. Real Estate Portfolio, Emerging Markets Debt Portfolio, and U.S. Small/Mid Cap Value Portfolio (the “Portfolios”) (seventeen of the Portfolios comprising Morgan Stanley Institutional Fund, Inc.), including the portfolios of investments, as of December 31, 2008, and the related statements of operations for the year then ended, the statement of cash flows for the International Growth Active Extension Portfolio for the year then ended and the statements of changes in net assets and financial highlights for each of the periods indicated therein. These financial statements and financial highlights are the responsibility of the Portfolios’ management. Our responsibility is to express an opinion on these financial statements and financial highlights based on our audits.
We conducted our audits in accordance with the standards of the Public Company Accounting Oversight Board (United States). Those standards require that we plan and perform the audit to obtain reasonable assurance about whether the financial statements and financial highlights are free of material misstatement. We were not engaged to perform an audit of the Portfolios’ internal control over financial reporting. Our audits included consideration of internal control over financial reporting as a basis for designing audit procedures that are appropriate in the circumstances, but not for the purpose of expressing an opinion on the effectiveness of the Portfolios’ internal control over financial reporting. Accordingly, we express no such opinion. An audit also includes examining, on a test basis, evidence supporting the amounts and disclosures in the financial statements and financial highlights, assessing the accounting principles used and significant estimates made by management, and evaluating the overall financial statement presentation. Our procedures included confirmation of securities owned as of December 31, 2008, by correspondence with the custodian and brokers, or by other appropriate auditing procedures where replies from brokers were not received. We believe that our audits provide a reasonable basis for our opinion.
In our opinion, the financial statements and financial highlights referred to above present fairly, in all material respects, the financial position of each of the aforementioned portfolios comprising Morgan Stanley Institutional Fund, Inc. at December 31, 2008, the results of their operations for the year then ended, the cash flows for the aforementioned portfolio for the year then ended and the statements of changes in net assets and financial highlights for each of the periods indicated therein, in conformity with U.S. generally accepted accounting principles.

Boston, Massachusetts
February 20, 2009
158
| 2008 Annual Report |
|
|
| December 31, 2008 |
Federal Income Tax Information: (unaudited)
For Federal income tax purposes, the following information is furnished with respect to the distributions paid by each applicable Portfolio during the taxable year ended December 31, 2008.
For corporate shareholders, the following percentages of dividends paid by each Portfolio qualified for the dividends received deduction. Additionally, the following percentages of each Portfolio’s dividends was attributable to qualifying U.S. Government obligations. (Please consult your tax advisor to determine if any portion of the dividends you received is exempt from state income tax.):
|
| Div. Received |
| Qualifying U.S. |
|
Portfolio |
| Deduction % |
| Govt. Income % |
|
Active International Allocation |
| 19.6 | % | — | % |
Global Franchise |
| 20.0 |
| — |
|
Global Real Estate |
| 34.0 |
| — |
|
Global Value Equity |
| 20.2 |
| — |
|
International Growth Active Extension |
| 1.7 |
| — |
|
Capital Growth |
| 96.4 |
| — |
|
Focus Growth |
| 100.0 |
| — |
|
Large Cap Relative Value |
| 100.0 |
| — |
|
U.S. Real Estate |
| 9.9 |
| — |
|
U.S. Small/Mid Cap Value |
| 80.8 |
| — |
|
Each of the applicable Portfolios designated and paid the following amounts as a long-term capital gain distribution:
|
| Amount |
| |
Portfolio |
| (000) |
| |
Active International Allocation |
| $ | 40,186 |
|
Emerging Markets |
| 110,850 |
| |
Global Franchise |
| 1,482 |
| |
Global Real Estate |
| 2,130 |
| |
Global Value Equity |
| 712 |
| |
International Equity |
| 309,605 |
| |
International Growth Equity |
| 267 |
| |
International Real Estate |
| 5,259 |
| |
International Small Cap |
| 30,493 |
| |
Capital Growth |
| 1,427 |
| |
Large Cap Relative Value |
| 1,219 |
| |
U.S. Real Estate |
| 70,297 |
| |
159
2008 Annual Report |
|
|
|
December 31, 2008 |
|
Federal Income Tax Information: (cont’d)
For Federal income tax purposes, the following information is furnished with respect to the earnings of each applicable Portfolio for the taxable year ended December 31, 2008.
When distributed, certain earnings may be subject to a maximum tax rate of 15% as provided for the Jobs and Growth Tax Relief Reconciliation Act of 2004. Each of the applicable Portfolios designated up to the following maximum amounts as taxable at this lower rate:
|
| Amount |
| |
Portfolio |
| (000) |
| |
Active International Allocation |
| $ | 9,351 |
|
Emerging Markets |
| 3,210 |
| |
Global Franchise |
| 4,669 |
| |
Global Real Estate |
| 1,929 |
| |
Global Value Equity |
| 1,572 |
| |
International Growth Equity |
| 1,585 |
| |
International Small Cap |
| 14,539 |
| |
Capital Growth |
| 4,764 |
| |
Focus Growth |
| 24 |
| |
Large Cap Relative Value |
| 4,798 |
| |
U.S. Small/Mid Cap Value |
| 21 |
| |
The following Portfolios intend to pass through foreign tax credits and have derived net income from sources within foreign countries amounting to:
|
| Foreign Tax |
| Net Foreign |
| ||
|
| Credits |
| Source Income |
| ||
Portfolio |
| (000) |
| (000) |
| ||
Active International Allocation |
| $ | 1,046 |
| $ | 28,882 |
|
Emerging Markets |
| 3,204 |
| 55,334 |
| ||
Global Franchise |
| 229 |
| 3,019 |
| ||
Global Real Estate |
| 345 |
| 13,977 |
| ||
Global Value Equity |
| 47 |
| 1,412 |
| ||
International Equity |
| 435 |
| 181,732 |
| ||
International Growth Active Extension |
| 28 |
| 426 |
| ||
International Growth Equity |
| 52 |
| 2,504 |
| ||
International Small Cap |
| 1,277 |
| 19,203 |
| ||
In January, each applicable Portfolio provides tax information to shareholders for the preceding calendar year.
160
| 2008 Annual Report |
|
|
| December 31, 2008 |
U.S. Privacy Policy (unaudited)
AN IMPORTANT NOTICE CONCERNING OUR U.S. PRIVACY POLICY
Morgan Stanley Institutional Fund, Inc. (collectively, the “Fund”) is required by federal law to provide you with a copy of their Privacy Policy (“the Policy”) annually.
This Policy applies to individual clients who are current and former advisory clients of certain Morgan Stanley Investment Management’s U.S. investment advisers and to current and former individual investors in the Fund. This Policy is not applicable to partnerships, corporations, trusts or other non-individual clients or account holders, nor is this Policy applicable to individuals who are either beneficiaries of a trust for which we serve as trustee or participants in an employee benefit plan administered or advised by us. This Policy is, however, applicable to individuals who select us to be a custodian of securities or assets in individual retirement accounts, 401(k) accounts, or accounts subject to the Uniform Gifts to Minors Act.
Please note that we may amend this Policy at any time, and will inform you of any changes to this Policy as required by law.
WE RESPECT YOUR PRIVACY
We appreciate that you have provided us with your personal financial information and understand your concerns about safeguarding such information. We strive to maintain the privacy of such information while we help you achieve your financial objectives.
This Policy describes what nonpublic personal information we collect about you, how we collect it, when we may share it with others, and how others may use it. It discusses the steps you may take to limit our sharing of information about you with affiliated Morgan Stanley companies (“other Morgan Stanley companies”), including but not limited to our global financial services affiliates that are part of our integrated securities and investment management business, and our credit services affiliates. It also discloses how you may limit our affiliates’ use of shared information for marketing purposes.
Throughout this Policy, we refer to the nonpublic information that personally identifies you or your accounts as “personal information.”
1. WHAT PERSONAL INFORMATION DO WE COLLECT ABOUT YOU?
To better serve you and manage our business, it is important that we collect and maintain accurate information about you. We obtain this information from applications and other forms you submit to us, from your dealings with us, from consumer reporting agencies and from third parties and other sources. For example:
· We collect information such as your name, address, e-mail address, phone number and account title.
· We may obtain information about account balances, your use of account(s) and the types of products and services you prefer to receive from us through your dealings and transactions with us and other sources.
· We may obtain information about your creditworthiness and credit history from consumer reporting agencies.
· We may collect background information from and through third-party vendors to verify representations you have made and to comply with various regulatory requirements.
2. WHEN DO WE DISCLOSE PERSONAL INFORMATION WE COLLECT ABOUT YOU?
To provide you with the products and services you request, to better serve you, to manage our business and as otherwise required or permitted by law, we may disclose personal information we collect about you to other Morgan Stanley companies and to nonaffiliated third parties.
a. Information we disclose to other Morgan Stanley companies:
In order to manage your account(s) effectively, including servicing and processing your transactions, to let you know about products and services offered by us and other Morgan Stanley companies, to manage our business, and as otherwise required or permitted by law, we may disclose personal information to other Morgan Stanley companies. Offers for products and services from other Morgan Stanley companies are developed under conditions designed to safeguard your personal information.
161
2008 Annual Report |
|
|
|
December 31, 2008 |
|
U.S. Privacy Policy (cont’d)
b. Information we discloses to third parties:
We do not disclose personal information that we collect about you to nonaffiliated third parties except to enable them to provide marketing services on our behalf, to perform joint marketing agreements with other financial institutions, and as otherwise required or permitted by law. For example, some instances where we may disclose information about you to third parties include: for servicing and processing transactions, to offer our own products and services, to protect against fraud, for institutional risk control, to respond to judicial process or to perform services on our behalf.
Morgan Stanley recognizes that your relationship with your Financial Advisor is important. If your Financial Advisor’s affiliation with Morgan Stanley ends and he/she joins a nonaffiliated securities broker-dealer with which Morgan Stanley has entered into an agreement limiting the use of information, Morgan Stanley will permit your Financial Advisor to retain certain of your contact information, limited to your name, address, e-mail address, phone number and account title.
When we share personal information with a nonaffiliated third party, they are required to limit their use of personal information to the particular purpose for which it was shared and they are not allowed to share personal information with others except to fulfill that limited purpose.
3. HOW DO WE PROTECT THE SECURITY AND CONFIDENTIALITY OF PERSONAL INFORMATION WE COLLECT ABOUT YOU?
We maintain physical, electronic and procedural security measures to help safeguard the personal information we collect about you. We have internal policies governing the proper handling of client information. Third parties that provide support or marketing services on our behalf may also receive personal information, and we require them to adhere to confidentiality standards with respect to such information.
4. HOW CAN YOU LIMIT THE SHARING OF CERTAIN TYPES OF PERSONAL INFORMATION WITH OTHER MORGAN STANLEY COMPANIES?
We respect your privacy and offer you choices as to whether we share with other Morgan Stanley companies personal information that was collected to determine your eligibility for products and services you request (“eligibility information”). Please note that, even if you direct us not to share eligibility information with other Morgan Stanley companies (“opt-out”), we may still share personal information, including eligibility information, with those companies in circumstances excluded from the opt-out under applicable law, such as to process transactions or to service your account. We may also share certain other types of personal information with other Morgan Stanley companies—such as your name, address, telephone number, e-mail address and account number(s), and information about your transactions and experiences with us.
5. HOW CAN YOU LIMIT THE USE OF CERTAIN TYPES OF PERSONAL INFORMATION BY OTHER MORGAN STANLEY COMPANIES FOR MARKETING?
You may limit other Morgan Stanley companies from marketing their products or services to you based on your personal information that they receive from other Morgan Stanley companies. This information includes your income, assets and account history. Your choice to limit marketing offers from other Morgan Stanley companies will apply until you tell us to change your choice.
162
| 2008 Annual Report |
|
|
| December 31, 2008 |
U.S. Privacy Policy (cont’d)
If you wish to opt-out of sharing and to limit marketing offers, you may do so by:
· Calling us at (800) 548-7786
Monday—Friday between 8 a.m. and 5 p.m. (ET)
· Writing to us at the following address:
Morgan Stanley Institutional Fund, Inc.
c/o Morgan Stanley Services Company, Inc.
PO Box 219804
Kansas City, MO 64121-9804
If you choose to write to us, your written request should include your name, address, telephone number and account number(s) to which the opt-out applies and should not be sent with any other correspondence. In order to process your request, we require that the request be provided by you directly and not through a third party.
If you have previously notified us about your privacy preferences, it is not necessary to do so again unless you decide to change your preferences. Your opt-out preference will remain in effect with respect to this Policy (as it may be amended) until you notify us otherwise in writing. If you have a joint account, your direction for us not to share this information with other Morgan Stanley companies and for those Morgan Stanley companies not to use your personal information for marketing will be applied to all account holders on that account.
Please understand that if you opt-out, you and any joint account holders may not receive information about Morgan Stanley products and services that could help you manage your financial resources and achieve your investment objectives.
If you hold more than one account with Morgan Stanley, you may receive multiple privacy policies from us, and would need to follow the directions stated in each particular policy for each account you have with us.
SPECIAL NOTICE TO RESIDENTS OF VERMONT
This section supplements our Policy with respect to our individual clients who have a Vermont address and supersedes anything to the contrary in the above Policy with respect to those clients only.
The State of Vermont requires financial institutions to obtain your consent prior to sharing personal information that they
collect about you with affiliated companies and nonaffiliated third parties other than in certain limited circumstances. Except as permitted by law, we will not share personal information we collect about you with nonaffiliated third parties or other Morgan Stanley companies unless you provide us with your written consent to share such information (“opt-in”).
If you wish to receive offers for investment products and services offered by or through other Morgan Stanley companies, please notify us in writing at the following address:
Morgan Stanley Institutional Fund, Inc.
c/o Morgan Stanley Services Company, Inc.
PO Box 219804
Kansas City, MO 64121-9804
Your authorization should include your name, address, telephone number and account number(s) to which the opt-in applies and should not be sent with any other correspondence. In order to process your authorization, we require that the authorization be provided by you directly and not through a third-party.
© 2009 Morgan Stanley Institutional Fund, Inc.
163
2008 Annual Report |
|
|
|
December 31, 2008 |
|
Director and Officer Information (unaudited)
Independent Directors:
Name, Age and Address of |
| Position(s) Held |
| Length of |
| Principal Occupation(s) During Past 5 Years |
| Number of |
| Other Directorships Held by |
Frank L. Bowman (64) |
| Director |
| Since August 2006 |
| President, Strategic Decisions, LLC (consulting) (since February 2009); Director or Trustee of various Retail Funds and Institutional Funds (since August 2006); Chairperson of the Insurance Sub-Committee of the Insurance, Valuation and Compliance Committee (since February 2007); served as President and Chief Executive Officer of the Nuclear Institute (policy organization) through November 2008; retired as Admiral in the U.S. Navy in January 2005 after serving over 8 years as Director of the Naval Nuclear Propulsion Program and Deputy Administrator—Naval Reactors in the National Nuclear Security Administration at the U.S. Department of Energy (1996-2004). Knighted as Honary Knight Commander of the Most Excellent Order of the British Empire; awarded the Officer de l’Orde National du Mérite by the French Government. |
| 161 |
| Director of Armed Services YMCA of the USA; member, BP America External Advisory Council (energy); member, National Academy of Engineers. |
|
|
|
|
|
|
|
|
|
|
|
Michael Bozic (68 |
| Director |
| Since April 1994 |
| Private investor; Chairperson of the Insurance, Valuation and Compliance Committee (since October 2006); Director or Trustee of the Retail Funds (since April 1994) and Institutional Funds (since July 2003); formerly, Chairperson of the Insurance Committee (July 2006-September 2006), Vice Chairman of Kmart Corporation (December 1998-October 2000), Chairman and Chief Executive Officer of Levitz Furniture Corporation (November 1995-November 1998) and President and Chief Executive Officer of Hills Department Stores (May 1991-July 1995); variously Chairman, Chief Executive Officer, President and Chief Operating Officer (1987-1991) of the Sears Merchandise Group of Sears Roebuck & Co. |
| 163 |
| Director of various business organizations. |
|
|
|
|
|
|
|
|
|
|
|
Kathleen A. Dennis (55) |
| Director |
| Since August 2006 |
| President, Cedarwood Associates (mutual fund and investment management) (since July 2006); Chairperson of the Money Market and Alternatives Sub-Committee of the Investment Committee (since October 2006) and Director or Trustee of various Retail Funds and Institutional Funds (since August 2006); formerly, Senior Managing Director of Victory Capital Management (1993-2006). |
| 161 |
| Director of various non-profit organizations. |
|
|
|
|
|
|
|
|
|
|
|
Dr. Manuel H. Johnson (60 |
| Director |
| Since July 1991 |
| Senior Partner, Johnson Smick International, Inc. (consulting firm); Chairperson of the Investment Committee (since October 2006) and Director or Trustee of the Retail Funds (since July 1991) and Institutional Funds (since July 2003); Co-Chairman and a founder of the Group of Seven Council (G7C) (international economic commission); formerly, Chairperson of the Audit Committee (July 1991- September 2006); Vice Chairman of the Board of Governors of the Federal Reserve System and Assistant Secretary of the U.S. Treasury. |
| 163 |
| Director of NVR, Inc. (home construction); Director of Evergreen Energy. |
|
|
|
|
|
|
|
|
|
|
|
Joseph J. Kearns (66) |
| Director |
| Since August 1994 |
| President, Kearns & Associates LLC (investment consulting); Chairperson of the Audit Committee (since October 2006) and Director or Trustee of the Retail Funds (since July 2003) and the Institutional Funds (since August 1994); formerly Deputy Chairperson of the Audit Committee (July 2003-September 2006) and Chairperson of the Audit Committee of the Institutional Funds (October 2001- July 2003); CFO of the J. Paul Getty Trust. |
| 164 |
| Director of Electro Rent Corporation (equipment leasing) and The Ford Family Foundation. |
164
| 2008 Annual Report |
|
|
| December 31, 2008 |
Director and Officer Information (cont’d)
Independent Directors: (cont’d)
Name, Age and Address of Independent Director |
| Position(s) Held |
| Length of |
| Principal Occupation(s) During Past 5 Years |
| Number of Portfolios in Fund Complex Overseen by Independent Director** |
| Other Directorships Held by |
Michael F. Klein (50) |
| Director |
| Since August 2006 |
| Chief Operating Officer and Managing Director, Aetos Capital, LLC (since March 2000) and Co-President, Aetos Alternatives Management, LLC (since January 2004); Chairperson of the Fixed Income Sub-Committee of the Investment Committee (since October 2006) and Director or Trustee of various Retail Funds and Institutional Funds (since August 2006); formerly, Managing Director, Morgan Stanley & Co. Inc. and Morgan Stanley Dean Witter Investment Management, President, Morgan Stanley Institutional Funds (June 1998-March 2000) and Principal, Morgan Stanley & Co. Inc. and Morgan Stanley Dean Witter Investment Management (August 1997-December 1999). |
| 161 |
| Director of certain investment funds managed or sponsored by Aetos Capital LLC; Director of Sanitized AG and Sanitized Marketing AG (specialty chemicals). |
|
|
|
|
|
|
|
|
|
|
|
Michael E. Nugent (72) |
| Chairperson of the Board and Director |
| Chairperson of the Boards since July 2006 and Director since July 1991 |
| General Partner, Triumph Capital, L.P. (private investment partnership); Chairman of the Boards of the Retail Funds and Institutional Funds (since July 2006); Director or Trustee of the Retail Funds (since July 1991) and Institutional Funds (since July 2001); formerly, Chairperson of the Insurance Committee (until July 2006). |
| 163 |
| None. |
|
|
|
|
|
|
|
|
|
|
|
W. Allen Reed (61)† |
| Director |
| Since August 2006 |
| Chairperson of the Equity Sub-Committee of the Investment Committee (since October 2006) and Director or Trustee of various Retail and Institutional Funds (since August 2006); formerly, President and CEO of General Motors Asset Management; Chairman and Chief Executive Officer of the GM Trust Bank and Corporate Vice President of General Motors Corporation (July 1994-December 2005). |
| 161 |
| Director of Temple-Inland Industries (packaging and forest products); Director of Legg Mason, Inc. and Director of the Auburn University Foundation. |
|
|
|
|
|
|
|
|
|
|
|
Fergus Reid (76) |
| Director |
| Since June 1992 |
| Chairman of Lumelite Plastics Corporation; Chairperson of the Governance Committee and Director or Trustee of the Retail Funds (since July 2003) and Institutional Funds (since June 1992). |
| 164 |
| Trustee and Director of certain investment companies in the JPMorgan Funds complex managed by JP Morgan Investment Management Inc. |
165
2008 Annual Report |
|
|
|
December 31, 2008 |
|
Director and Officer Information (cont’d)
Interested Directors:
Name, Age and Address of Interested Director |
| Position(s) Held with |
| Term of Office |
| Principal Occupation(s) During Past 5 Years |
| Number of Portfolios in Fund Complex Overseen by Interested Director** |
| Other Directorships Held by |
James F. Higgins (61) c/o Morgan Stanley Trust Harborside Financial Center Plaza Two Jersey City, NJ 07311 |
| Director |
| Since June 2000 |
| Director or Trustee of the Retail Funds (since June 2000) and Institutional Funds (since July 2003); Senior Advisor of Morgan Stanley (since August 2000). |
| 162 |
| Director of AXA Financial, Inc. and The Equitable Life Assurance Society of the United States (financial services). |
* This is the earliest date the Director began serving the Retail Funds or Institutional Funds. Each Director serves an indefinite term, until his or her successor is elected.
** The Fund Complex includes all funds advised by Morgan Stanley Investment Management Inc. (“MSIM”) that have an investment advisor that is an affiliated entity of MSIM (including but not limited to, Morgan Stanley Investment Advisors Inc. (“MSIA”) and Morgan Stanley AIP GP LP). The Retail Funds are those funds advised by MSIA. The Institutional Funds are certain U.S. registered funds advised by MSIM and Morgan Stanley AIP GP LP.
† For the period September 26, 2008 through February 5, 2009 W. Allen Reed was an Interested Director. At all other times covered by this report, Mr. Reed was an Independent Director.
166
| 2008 Annual Report |
|
|
| December 31, 2008 |
Director and Officer Information (cont’d)
Officers:
Name, Age and Address of Executive Officer |
| Position(s) |
| Term of Office |
| Principal Occupation(s) During Past 5 Years |
Randy Takian (34) |
| President and Principal Executive Officer |
| Since September 2008 |
| President and Principal Executive Officer (since September 2008) of funds in the Fund Complex; President and Chief Executive Officer of Morgan Stanley Services Company Inc. (since September 2008). President of Morgan Stanley Investment Advisors Inc. (since July 2008). Head of the Retail and Intermediary business within Morgan Stanley Investment Management (since July 2008). Head of Liquidity and Bank Trust business (since July 2008) and the Latin American franchise (since July 2008) at Morgan Stanley Investment Management. Managing Director, Director and/or Officer of the Adviser and various entities affiliated with the Adviser. Formerly, Head of Strategy and Product Development for the Alternatives Group and Senior Loan Investment Management. Formerly with Bank of America (July 1996 - March 2006), most recently as Head of the Strategy, Mergers and Acquisitions team for Global Wealth and Investment Management. |
|
|
|
|
|
|
|
Kevin Klingert (46) |
| Vice President |
| Since June 2008 |
| Global Head, Chief Operating Officer and acting Chief Investment Officer of the Global Fixed Income Group of the Adviser and Morgan Stanley Investment Advisors Inc. (since April 2008). Head of Global Liquidity Portfolio Management and co-Head of Liquidity Credit Research of Morgan Stanley Investment Management (since December 2007). Managing Director of the Adviser and Morgan Stanley Investment Advisors Inc. (since December 2007). Previously, Managing Director on the Management Committee and head of Municipal Portfolio Management and Liquidity at BlackRock (October 1991 to January 2007). |
|
|
|
|
|
|
|
Amy R. Doberman (46) |
| Vice President |
| Since July 2004 |
| Managing Director of Morgan Stanley Investment Management (since July 2004); Vice President of the Retail Funds and Institutional Funds (since July 2004); Vice President of the Van Kampen Funds (since August 2004); Secretary (since February 2006) and Managing Director (since July 2004) of the Adviser and various entities affiliated with the Adviser. Formerly, Managing Director and General Counsel—Americas, UBS Global Asset Management (July 2000 - July 2004). |
|
|
|
|
|
|
|
Carsten Otto (45) |
| Chief Compliance Officer |
| Since October 2004 |
| Managing Director and Global Head of Compliance for Morgan Stanley Investment Management (since April 2007) and Chief Compliance Officer of the Retail Funds and Institutional Funds (since October 2004). Formerly, U.S. Director of Compliance (October 2004 - April 2007) and Assistant Secretary and Assistant General Counsel of the Retail Funds. |
|
|
|
|
|
|
|
Stefanie V. Chang Yu (42) |
| Vice President |
| Since December 1997 |
| Managing Director of the Adviser and various entities affiliated with the Adviser; Vice President of the Retail Funds (since July 2002) and Institutional Funds (since December 1997). Formerly, Secretary of various entities affiliated with the Adviser. |
|
|
|
|
|
|
|
Mary E. Mullin (41) |
| Secretary |
| Since June 1999 |
| Executive Director of the Adviser and various entities affiliated with the Adviser; Secretary of the Retail Funds (since July 2003) and Institutional Funds (since June 1999). |
|
|
|
|
|
|
|
James W. Garrett (40) |
| Treasurer and Chief Financial Officer |
| Treasurer since February 2002 and Chief Financial Officer since July 2003 |
| Head of Global Fund Administration; Managing Director of the Adviser and various entities affiliated with the Adviser; Treasurer and Chief Financial Officer of the Institutional Funds. |
* | This is the earliest date the Officer began serving the Retail Funds or Institutional Funds. Each Officer serves an indefinite term, until his or her successor is elected. |
167
2008 Annual Report |
|
December 31, 2008 |
Investment Adviser and Administrator
Morgan Stanley Investment Management Inc.
522 Fifth Avenue
New York, NY 10036
Distributor
Morgan Stanley Distribution, Inc.
One Tower Bridge Road
100 Front Street, Suite 1100
West Conshohocken, PA 19428-2899
Dividend Disbursing and Transfer Agent
Morgan Stanley Services Company Inc.
P.O. Box 219804
Kansas City, MO 64121-9804
Custodian
JPMorgan Chase Bank, N.A.
270 Park Avenue
New York, NY 10017
Legal Counsel
Clifford Chance US LLP
31 West 52nd Street
New York, NY 10019-6131
Independent Registered Public Accounting Firm
Ernst & Young LLP
200 Clarendon Street
Boston, MA 02116-5072
Reporting to Shareholders
Each Morgan Stanley Fund provides a complete schedule of portfolio holdings in its semi-annual and annual reports within 60 days of the end of the Fund’s second and fourth fiscal quarters. The semi-annual reports and the annual reports are filed electronically with the Securities and Exchange Commission (SEC) on Form N-CSRS and Form N-CSR, respectively. Morgan Stanley also delivers the semi-annual and annual reports to Fund shareholders and makes these reports available on its public website, www.morganstanley.com/msim. Each Morgan Stanley Fund also files a complete schedule of portfolio holdings with the SEC for the Fund’s first and third fiscal quarters on Form N-Q. Morgan Stanley does not deliver the reports for the first and third fiscal quarters to shareholders, nor are the reports posted to the Morgan Stanley public website. You may, however, obtain the Form N-Q filings (as well as the Form N-CSR and N-CSRS filings) by accessing the SEC’s website, www.sec.gov. You may also review and copy them at the SEC’s public reference room in Washington, DC. Information on the operation of the SEC’s Public Reference Room may be obtained by calling the SEC at 1(800) SEC-0330. You can also request copies of these materials, upon payment of a duplicating fee, by electronic request at the SEC’s email address (publicinfo@sec.gov) or by writing the Public Reference section of the SEC, Washington, DC 20549-0102.
The Fund’s Statement of Additional Information contains additional information about the Fund, including its Directors. It is available, without charge, by calling 1-800-281-2715
Proxy Voting Policies and Procedures and Proxy Voting Record
You may obtain a copy of the Fund’s Proxy Voting Policy and Procedures and information regarding how the Fund voted proxies relating to portfolio securities during the most recent twelve-month period ended June 30, without charge, upon request, by calling 1(800) 548-7786 or by visiting our website at www.morganstanley.com/msim. This information is also available on the SEC’s website at www.sec.gov.
This report is authorized for distribution only when preceded or accompanied by a prospectus of the Morgan Stanley Institutional Fund, Inc. which describes in detail each Investment Portfolio’s investment policies, risks, fees and expenses. Please read the prospectus carefully before you invest or send money. For additional information, including information regarding the investments comprising the Portfolio, please visit our website at www.morganstanley.com/msim or call 1(800) 548-7786.
168
Printed in U.S.A.
This Report has been prepared for shareholders and may be distributed
to others only if preceded or accompanied by a current prospectus.
Morgan Stanley Investment Management Inc.
522 Fifth Avenue
New York, NY 10036
MSIF: (800) 548-7786
© 2009 Morgan Stanley
| MSIFTANN |
EVERY STOCKHOLDER’S VOTE IS IMPORTANT
|
| Your Proxy Vote is important!
And now you can Vote your Proxy on the PHONE or the INTERNET.
It saves Money! Telephone and Internet voting saves postage costs. Savings which can help minimize fund expenses.
It saves Time! Telephone and Internet voting is instantaneous – 24 hours a day.
It’s Easy! Just follow these simple steps:
1. Read your proxy statement and have it on hand.
2. Call toll-free 1-866-241-6192 or go to website: www.proxy-direct.com
3. Enter the 14-digit number located in the shaded box from your Proxy Card.
4. Follow the recorded or on-screen directions.
5. Do not mail your Proxy Card when you vote by phone or Internet. |
Please detach at perforation before mailing.
PROXY |
| MORGAN STANLEY INSTITUTIONAL FUND, INC. |
| PROXY |
GLOBAL VALUE EQUITY PORTFOLIO
NOTICE OF SPECIAL MEETING OF STOCKHOLDERS
TO BE HELD ON AUGIST 27, 2009
This proxy is solicited on behalf of the Board of Directors.
The undersigned hereby constitutes and appoints Mary E. Mullin and Stefanie V. Chang Yu, and each of them, as proxies for the undersigned, with full power of substitution and resubstitution, and hereby authorizes said proxies, and each of them, to represent and vote, as designated on the reverse side, all shares of common stock of the GLOBAL VALUE EQUITY PORTFOLIO (“Global Value Equity”), a series of Morgan Stanley Institutional Fund, Inc. (the “Fund”), held of record by the undersigned on June 11, 2009 at the Special Meeting of Stockholders to be held at 522 Fifth Avenue, 3rd Floor, New York, New York 10036 in Conference Room 3R, on Thursday, August 27, 2009, at 9:00 a.m., New York time, and at any adjournment thereof. The undersigned hereby revokes any and all proxies with respect to such shares heretofore given by the undersigned.
THIS PROXY CARD, WHEN PROPERLY EXECUTED, WILL BE VOTED IN THE MANNER DIRECTED HEREIN BY THE UNDERSIGNED STOCKHOLDER, AND, IN THE DISCRETION OF SUCH PROXIES, UPON ANY AND ALL OTHER MATTERS AS MAY PROPERLY COME BEFORE THE MEETING OR ANY ADJOURNMENT THEREOF. IF NO DIRECTION IS MADE, THIS PROXY WILL BE VOTED “FOR” THE PROPOSAL.
VOTE VIA THE INTERNET: www.proxy-direct.com | |||||||
VOTE VIA THE TELEPHONE: 1-866-241-6192 | |||||||
999 9999 9999 999 | |||||||
Note: Please sign exactly as your name appears on this proxy card. All joint owners should sign. When signing as executor, administrator, attorney, trustee or guardian or as custodian for a minor, please give full title as such. If a corporation, please sign in full corporate name and indicate the signer’s office. If a partner, sign in the partnership name. | |||||||
| |||||||
Signature | |||||||
| |||||||
Signature (if held jointly) | |||||||
| |||||||
Date |
| MSI_ 19945_051509 | |||||
EVERY STOCKHOLDER’S VOTE IS IMPORTANT
PLEASE SIGN, DATE AND RETURN YOUR
PROXY TODAY
Please detach at perforation before mailing.
The Board of Directors of the Fund recommends that you cast your vote for approval of the Agreement and Plan of Reorganization.
TO VOTE BY MAIL, PLEASE COMPLETE AND RETURN THIS CARD.
YOU ALSO MAY VOTE A PROXY BY TOUCH-TONE PHONE OR BY INTERNET (See enclosed Voting Information Card for further instructions).
PLEASE MARK VOTES AS IN THIS EXAMPLE: ![]()
|
| FOR |
| AGAINST |
| ABSTAIN | |
1. | Approval of an Agreement and Plan of Reorganization, dated November 20, 2008, between the Fund, on behalf of Global Value Equity and the Fund, on behalf of the Global Franchise Portfolio (“Global Franchise”), a series of the Fund, pursuant to which substantially all of the assets of Global Value Equity would be combined with those of Global Franchise and stockholders of Global Value Equity would become stockholders of Global Franchise receiving shares of common stock of Global Franchise with a value equal to the value of their holdings in Global Value Equity. |
| o |
| o |
| o |
WE URGE YOU TO SIGN, DATE AND MAIL THE ENCLOSED PROXY PROMPTLY
MSI_ 19945_051509
MORGAN STANLEY INSTITUTIONAL FUND, INC.
GLOBAL FRANCHISE PORTFOLIO
PART B
STATEMENT OF ADDITIONAL INFORMATION
This Statement of Additional Information (the "SAI") relates to the shares of common stock ("shares") of the Global Franchise Portfolio ("Global Franchise"), a series of Morgan Stanley Institutional Fund, Inc. (the "Company"), to be issued pursuant to an Agreement and Plan of Reorganization, dated November 20, 2008, between the Company, on behalf of the Global Value Equity Portfolio ("Global Value Equity"), and the Company, on behalf of Global Franchise, pursuant to which substantially all the assets of Global Value Equity will be combined with those of Global Franchise in exchange for shares of Global Franchise.
This SAI does not constitute a prospectus. This SAI does not include all information that a shareholder should consider before voting on the proposals contained in the Proxy Statement and Prospectus, and, therefore, should be read in conjunction with the related Proxy Statement and Prospectus, dated June 19, 2009. A copy of the Proxy Statement and Prospectus may be obtained upon request and without charge by calling (800) 548-7786 (toll-free). Please retain this document for future reference.
Global Franchise and Global Value Equity are each referred to herein as a "Portfolio" and, together, the "Portfolios."
The date of this SAI is June 19, 2009.
| Table of Contents | Page | ||||||
| Introduction | B-2 | ||||||
| Additional Information About Global Franchise and Global Value Equity | B-2 | ||||||
| Financial Statements | B-3 | ||||||
INTRODUCTION
This SAI is intended to supplement the information provided in the Proxy Statement and Prospectus dated June 19, 2009 (the "Proxy Statement and Prospectus"). The Proxy Statement and Prospectus has been sent to the stockholders of Global Value Equity in connection with the solicitation of proxies by the Board of Directors of the Company (the "Board") on behalf of Global Value Equity to be voted at the Special Meeting of Stockholders of Global Value Equity to be held on August 27, 2009. The Company's Statement of Additional Information, dated May 1, 2009, as may be supplemented (the "Company's Statement of Additional Information"), accompanies, and is incorporated by referenced in this SAI.
ADDITIONAL INFORMATION ABOUT GLOBAL FRANCHISE AND GLOBAL VALUE EQUITY
Fund History
For additional information about Global Franchise's and Global Value Equity's history, see "General Information—Fund History" in the Company's Statement of Additional Information relating to both Portfolios.
Investment Objectives and Policies
For additional information about Global Franchise's and Global Value Equity's investment objectives and policies, see "Investment Policies and Strategies" in the Company's Statement of Additional Information relating to both Portfolios.
Portfolio Holdings
For additional information about Global Franchise's and Global Value Equity's policies and procedures with respect to the disclosure of their portfolio securities to any person, see "Disclosure of Portfolio Holdings" in the Company's Statement of Additional Information relating to both Portfolios.
Management
For additional information about the Board of Directors, officers and management personnel of Global Franchise and Global Value Equity, see "Management of the Fund" and "Investment Advisory and Other Services" in the Company's Statement of Additional Information relating to both Portfolios.
Investment Advisory and Other Services
For additional information about Global Franchise's and Global Value Equity's investment adviser, Global Franchise's and Global Value Equity's independent registered public accounting firm and other services provided to Global Franchise and Global Value Equity, see "Investment Advisory and Other Services" in the Company's Statement of Additional Information relating to both Portfolios.
Codes of Ethics
For additional information about the Codes of Ethics adopted by Global Franchise and Global Value Equity, Global Franchise's and Global Value Equity's investment adviser and Global Franchise's and Global Value Equity's distributor, see "Management of the Fund—Codes of Ethics" in the Company's Statement of Additional Information relating to both Portfolios.
Proxy Voting Policies
For additional information about the voting of proxies held by Global Franchise and Global Value Equity, see "Investment Advisory and Other Services—Proxy Voting Policies and Procedures and Proxy Voting Record" in the Company's Statement of Additional Information relating to both Portfolios.
Portfolio Managers
For additional information about the portfolio managers primarily responsible for the day-to-day management of Global Franchise and Global Value Equity, their compensation structure and their holdings in Global Franchise and Global Value Equity, see "Investment Advisory and Other Services—Portfolio Managers" in the Company's Statement of Additional Information relating to both Portfolios.
B-2
Effective June 15, 2009, the responsibility for the day-to-day management of each Portfolio was assumed by the International Equity team comprised of William D. Lock and Walter B. Riddell, each a Managing Director of Morgan Stanley Investment Management Limited, Peter J. Wright, a Managing Director of Morgan Stanley Investment Management Company, and John S. Goodacre and Christian Derold, each an Executive Director of Morgan Stanley Investment Management Limited.
Other accounts managed by the portfolio managers as of December 31, 2008:
| Registered Investment Companies | Other Pooled Investment Vehicles | Other Accounts | |||||||||||||||||||||||||
| Portfolio Managers | Number of Accounts | Total Assets in the Accounts | Number of Accounts | Total Assets in the Accounts | Number of Accounts | Total Assets in the Accounts | |||||||||||||||||||||
| Christian Derold | 2 | $3.6 billion | — | — | — | — | |||||||||||||||||||||
| John S. Goodacre | 2 | $3.6 billion | 2 | $4.2 billion | — | — | |||||||||||||||||||||
| William D. Lock | 3 | $4.4 billion | 3 | $4.3 billion | 10 | (1) | $3.8 billion(1) | ||||||||||||||||||||
| Walter B. Riddell | 3 | $4.4 billion | 3 | $4.3 billion | 2 | $568.1 million | |||||||||||||||||||||
| Peter J. Wright | 3 | $4.4 billion | 3 | $4.3 billion | 16 | $5.0 billion | |||||||||||||||||||||
(1) Of these other accounts, one account with a total of approximately $280.1 million in assets, had performance-based fees.
As of the date of this SAI, the portfolio managers did not beneficially own any securities in the Portfolios.
Portfolio Transactions and Brokerage
For additional information about brokerage allocation practices, see "Brokerage Practices" in the Company's Statement of Additional Information relating to both Portfolios.
Description of Fund Shares
For additional information about the voting rights and other characteristics of the shares of Global Franchise and Global Value Equity, see "General Information—Description of Shares and Voting Rights" in the Company's Statement of Additional Information relating to both Portfolios.
Purchase, Redemption and Pricing of Shares
For additional information about the purchase and redemption of Global Franchise's and Global Value Equity's shares and the determination of net asset value, see "Purchase of Shares" and "Redemption of Shares" in the Company's Statement of Additional Information relating to both Portfolios.
Dividends, Distributions and Tax Status
For additional information about Global Franchise's and Global Value Equity's policies regarding dividends and distributions and tax matters affecting Global Franchise and Global Value Equity and their shareholders, see "General Information—Dividends and Capital Gains Distributions" and "Taxes" in the Company's Statement of Additional Information relating to both Portfolios.
Distribution of Shares
For additional information about Global Franchise's and Global Value Equity's distributor and the distribution agreement between Global Franchise and Global Value Equity and their distributor, see "Investment Advisory and Other Services" in the Company's Statement of Additional Information relating to both Portfolios.
Performance Data
For additional information about Global Franchise's and Global Value Equity's performance, see "Performance Information" in the Company's Statement of Additional Information relating to both Portfolios.
FINANCIAL STATEMENTS
1. Global Franchise's and Global Value Equity's most recent audited financial statements are set forth in the Company's Annual Report for the fiscal year ended December 31, 2008. A copy of the Annual Report accompanies, and is incorporated by reference in, the Proxy Statement and Prospectus.
2. Shown below are Financial Statements for Global Franchise and Global Value Equity and Pro Forma Financial Statements for the Combined Fund as of December 31, 2008, as though the reorganization occurred as of that date. The first table presents Portfolio of Investments (unaudited) for Global Franchise and Global Value Equity and pro forma figures for the Combined Fund. The second table presents Statements of Assets and Liabilities (unaudited) for Global Franchise and Global Value Equity and pro forma figures for the Combined Fund. The third table presents Statements of Operations (unaudited) for Global Franchise and Global Value Equity and pro forma figures for the Combined Fund. The tables are followed by the Notes to the Pro Forma Financial Statements (unaudited).
B-3
Portfolio of Investments
As of December 31, 2008 (Unaudited)
| Security Description | Global Value Equity Shares | Global Franchise Shares | Pro Forma Shares | Global Value Equity Value (000) | Global Franchise Value (000) | Adjustments | Pro Forma Value (000) | ||||||||||||||||||||||||
| Common Stocks (96.9%) | |||||||||||||||||||||||||||||||
| Finland (2.2%) | |||||||||||||||||||||||||||||||
| Kone Oyj, Class B (c) | 36,816 | 82,062 | 118,878 | $ | 807 | $ | 1,799 | $ | 2,606 | ||||||||||||||||||||||
| France (5.7%) | |||||||||||||||||||||||||||||||
| Groupe Danone (c) | 18,659 | 41,591 | 60,250 | 1,126 | 2,510 | 3,636 | |||||||||||||||||||||||||
| Pernod-Ricard S.A. (c) | 12,781 | 28,490 | 41,271 | 948 | 2,113 | 3,061 | |||||||||||||||||||||||||
| 31,440 | 70,081 | 101,521 | 2,074 | 4,623 | 6,697 | ||||||||||||||||||||||||||
| Ireland (5.0%) | |||||||||||||||||||||||||||||||
| C&C Group plc | 158,443 | 354,111 | 512,554 | 321 | 717 | 1,038 | |||||||||||||||||||||||||
| Experian plc | 235,352 | 524,593 | 759,945 | 1,474 | 3,285 | 4,759 | |||||||||||||||||||||||||
| 393,795 | 878,704 | 1,272,499 | 1,795 | 4,002 | 5,797 | ||||||||||||||||||||||||||
| Japan (3.2%) | |||||||||||||||||||||||||||||||
| Kao Corp. | 39,000 | 86,000 | 125,000 | 1,181 | 2,605 | 3,786 | |||||||||||||||||||||||||
| Netherlands (7.7%) | |||||||||||||||||||||||||||||||
| Reed Elsevier N.V. | 108,398 | 241,615 | 350,013 | 1,277 | 2,847 | 4,124 | |||||||||||||||||||||||||
| Wolters Klumer N.V. (c) | 80,017 | 178,356 | 258,373 | 1,511 | 3,368 | 4,879 | |||||||||||||||||||||||||
| 188,415 | 419,971 | 608,386 | 2,788 | 6,215 | 9,003 | ||||||||||||||||||||||||||
| Sweden (4.2%) | |||||||||||||||||||||||||||||||
| Swedish Match AB | 106,533 | 237,458 | 343,991 | 1,525 | 3,399 | 4,924 | |||||||||||||||||||||||||
| Switzerland (6.8%) | |||||||||||||||||||||||||||||||
| Nestle S.A. (Registered) | 34,713 | 77,376 | 112,089 | 1,368 | 3,050 | 4,418 | |||||||||||||||||||||||||
| Novartis AG (Registered) | 21,455 | 47,823 | 69,278 | 1,075 | 2,396 | 3,471 | |||||||||||||||||||||||||
| 56,168 | 125,199 | 181,367 | 2,443 | 5,446 | 7,889 | ||||||||||||||||||||||||||
| United Kingdom (28.8%) | |||||||||||||||||||||||||||||||
| British American Tobacco plc | 111,571 | 253,849 | 365,420 | 2,899 | 6,596 | 9,495 | |||||||||||||||||||||||||
| Cadbury plc | 155,050 | 345,602 | 500,652 | 1,357 | 3,025 | 4,382 | |||||||||||||||||||||||||
| Diageo plc | 68,023 | 145,106 | 213,129 | 946 | 2,019 | 2,965 | |||||||||||||||||||||||||
| Imperial Tobacco Group plc | 86,361 | 192,498 | 278,859 | 2,307 | 5,142 | 7,449 | |||||||||||||||||||||||||
| Reckitt Benckiser Group plc | 36,102 | 80,472 | 116,574 | 1,345 | 2,998 | 4,343 | |||||||||||||||||||||||||
| Rolls-Royce Group plc, C Shares (a) | 4,500,610 | — | 4,500,610 | 7 | — | 7 | |||||||||||||||||||||||||
| Unilever plc | 68,488 | 152,658 | 221,146 | 1,556 | 3,469 | 5,025 | |||||||||||||||||||||||||
| 5,026,205 | 1,170,185 | 6,196,390 | 10,417 | 23,249 | 33,666 | ||||||||||||||||||||||||||
| United States (33.3%) | |||||||||||||||||||||||||||||||
| Brown-Forman Corp., Class B | 17,493 | 40,096 | 57,589 | 901 | 2,064 | 2,965 | |||||||||||||||||||||||||
| Career Education Corp. (a) | 37,179 | 82,871 | 120,050 | 667 | 1,487 | 2,154 | |||||||||||||||||||||||||
| eBay, Inc. (a) | 50,272 | 111,309 | 161,581 | 702 | 1,554 | 2,256 | |||||||||||||||||||||||||
| Estee Lauder Cos., Inc. (The) (c) | 28,990 | 63,823 | 92,813 | 897 | 1,976 | 2,873 | |||||||||||||||||||||||||
| Fortune Brands, Inc. (c) | 21,676 | 47,889 | 69,565 | 895 | 1,977 | 2,872 | |||||||||||||||||||||||||
| Harley Davidson, Inc. (c) | 35,872 | 78,919 | 114,791 | 609 | 1,339 | 1,948 | |||||||||||||||||||||||||
| Kellogg Co. | 19,817 | 44,171 | 63,988 | 869 | 1,937 | 2,806 | |||||||||||||||||||||||||
| McGraw-Hill Cos., Inc. (The) | 24,592 | 54,101 | 78,693 | 570 | 1,255 | 1,825 | |||||||||||||||||||||||||
| Moody's Corp. | 31,587 | 69,437 | 101,024 | 635 | 1,395 | 2,030 | |||||||||||||||||||||||||
| Philip Morris International, Inc. | 41,821 | 93,218 | 135,039 | 1,820 | 4,056 | 5,876 | |||||||||||||||||||||||||
| Procter & Gamble Co. (c) | 18,913 | 42,157 | 61,070 | 1,169 | 2,606 | 3,775 | |||||||||||||||||||||||||
| Scotts Miracle-Gro, Co. (The) Class A | 27,718 | 61,783 | 89,501 | 824 | 1,836 | 2,660 | |||||||||||||||||||||||||
| Starbucks Corp. (a) | 68,293 | 150,522 | 218,815 | 646 | 1,424 | 2,070 | |||||||||||||||||||||||||
| Weight Watchers International Inc. (c) | 29,279 | 65,263 | 94,542 | 861 | 1,920 | 2,781 | |||||||||||||||||||||||||
| 453,502 | 1,005,559 | 1,459,061 | 12,065 | 26,826 | 38,891 | ||||||||||||||||||||||||||
| Total Common Stocks (Cost $124,483) | 6,331,874 | 4,075,219 | 10,407,093 | 35,095 | 78,164 | 113,259 | |||||||||||||||||||||||||
B-4
Portfolio of Investments
As of December 31, 2008 (Unaudited) (continued)
| Global Value Equity Shares | Global Franchise Shares | Pro Forma Shares | Global Value Equity Value (000) | Global Franchise Value (000) | Adjustments | Pro Forma Value (000) | |||||||||||||||||||||||||
| Short-Term Investments (6.0%) | |||||||||||||||||||||||||||||||
| Securities held as Collateral on Loaned Securities (2.9%) | |||||||||||||||||||||||||||||||
| Investment Company (2.3%) | |||||||||||||||||||||||||||||||
| Morgan Stanley Institutional Liquidity Funds - Money Market Portfolio - Institutional Class (o) | 2,694,327 | — | 2,694,327 | $ | 2,694 | $ | — | $ | 2,694 | ||||||||||||||||||||||
| Face Amount (000) | Face Amount (000) | Face Amount (000) | Global Value Equity Value (000) | Global Franchise Value (000) | Adjustments | Pro Forma Value (000) | |||||||||||||||||||||||||
| Repurchase Agreement (0.6%) | |||||||||||||||||||||||||||||||
| Goldman Sachs & Co., 0.06%, dated 12/31/08, due 1/2/09, repurchase price $662; fully collateralized by U.S. government agency securities at the date of this Portfolio of Investments as follows: Federal Home Loan Mortgage Corp., Gold Pools: rates ranging from 4.50% to 6.00%, due 11/1/19 -12/1/38; Federal National Mortgage Association, Fixed Rate Mortgages: rates ranging from 4.00% to 7.00%, due 9/1/18 - 1/1/39; Government National Mortgage Association, Fixed Rate Mortgages: rates ranging from 4.50% to 11.50%, due 6/15/16 - 12/20/38, valued at $675 | 662 | — | 662 | 662 | — | 662 | |||||||||||||||||||||||||
| Total Securities held as Collateral on Loaned Securities (Cost $3,356) | 3,356 | — | 3,356 | ||||||||||||||||||||||||||||
| Global Value Equity Shares | Global Franchise Shares | Pro Forma Shares | Global Value Equity Value (000) | Global Franchise Value (000) | Adjustments | Pro Forma Value (000) | |||||||||||||||||||||||||
| Investment Company (3.1%) | |||||||||||||||||||||||||||||||
| Morgan Stanley Institutional Liquidity Funds - Money Market Portfolio - Institutional Class (o) | 804,637 | — | 804,637 | $ | 805 | — | $ | 805 | |||||||||||||||||||||||
| Morgan Stanley Institutional Liquidity Funds - Government Portfolio - Institutional Class (o) | — | 2,896,582 | 2,896,582 | — | 2,897 | 2,897 | |||||||||||||||||||||||||
| Total Investment Company (Cost $3,702) | 3,701,219 | 805 | 2,897 | 3,702 | |||||||||||||||||||||||||||
| Total Short-Term Investments (Cost $7,058) | 4,161 | 2,897 | 7,058 | ||||||||||||||||||||||||||||
| Total Investments (102.9%) (Cost $131,541) - Including $3,217 of Securities Loaned (v) | 39,256 | 81,061 | 120,317 | ||||||||||||||||||||||||||||
| Liabilites in Excess of Other Assets (-2.9%) | (3,258 | ) | (140 | ) | (3,398 | ) | |||||||||||||||||||||||||
| Net Assets (100%) | $ | 35,998 | $ | 80,921 | $ | — | 116,919 | ||||||||||||||||||||||||
Percentages indicated are based on net assets.
See notes to pro-forma financial statements.
B-5
NOTES TO SCHEDULE OF PORTFOLIO INVESTMENTS:
(a) Non-income producing security.
(c) All or a portion of security on loan at December 31, 2008.
(o) The Portfolio invests in the Morgan Stanley Institutional Liquidity Funds - Money Market and Government Portfolios - Institutional Class (the "Liquidity Funds"), an open-end management investment company managed by the Adviser. The investment advisory fees paid by the Portfolio are reduced by an amount equal to its pro-rata share of the advisory and administration fees paid by the Liquidity Funds. For the year ended December 31, 2008, advisory fees paid were reduced by approximately $6,000 relating to the Portfolio's investment in the Liquidity Funds. For the same period, income distributions earned by the Portfolio are recorded as dividends from affiliates and totaled approximately $145,000. For the year ended December 31, 2008, the approximate cost of purchase and sales in the Liquidity Funds were approximately $80,548,000 and $77,203,000, respectively.
(v) The approximate market value and percentage of total investments, $74,362,000 and 61.8%, respectively, represent the securities that have been fair valued under the fair valuation policy for international investments.
As of December 31, 2008, the gross unrealized appreciation (depreciation) of investments based on the aggregate cost of investments for federal income tax purposes was as follows:
| Global Value Equity Portfolio | Global Franchise Portfolio | Combined Pro Forma | |||||||||||||
| Aggregate gross unrealized appreciation | $ | 2,628,000 | $ | 3,847,000 | $ | 6,475,000 | |||||||||
| Aggregate gross unrealized depreciation | (395,000 | ) | (17,886,000 | ) | (18,281,000 | ) | |||||||||
| Net unrealized appreciation (depreciation) | $ | 2,233,000 | $ | (14,039,000 | ) | $ | (11,806,000 | ) | |||||||
| Federal income tax cost of investments | $ | 37,023,000 | $ | 95,100,000 | $ | 132,123,000 | |||||||||
Foreign Currency Exchange Contract Information
The Portfolio had the following foreign currency exchange contract(s) open at period end:
| Global Value Equity Currency to Deliver (000) | Global Franchise Currency to Deliver (000) | Combined Pro Forma Currency to Deliver (000) | Global Value Equity Value (000) | Global Franchise Value (000) | Combined Pro Forma Value (000) | ||||||||||||||||||||||
| GBP | 700 | GBP | 1,950 | GBP | 2,650 | $ | 1,006 | $ | 2,802 | $ | 3,808 | ||||||||||||||||
| GBP | 650 | GBP | 1,950 | GBP | 2,600 | 934 | 2,802 | 3,736 | |||||||||||||||||||
| GBP | 700 | GBP | 445 | GBP | 1,145 | 1,006 | 639 | 1,645 | |||||||||||||||||||
| GBP | 700 | GBP | 1,960 | GBP | 2,660 | 1,006 | 2,816 | 3,822 | |||||||||||||||||||
| $ | 3,952 | $ | 9,059 | $ | 13,011 | ||||||||||||||||||||||
| Settlement Date | Global Value Equity In Exchange For (000) | Global Franchise In Exchange For (000) | Combined Pro Forma In Exchange For (000) | ||||||||||||
| 1/26/09 | USD | 1,039 | USD | 2,913 | USD | 3,952 | |||||||||
| 1/26/09 | USD | 965 | USD | 2,916 | USD | 3,881 | |||||||||
| 1/26/09 | USD | 1,039 | USD | 665 | USD | 1,704 | |||||||||
| 1/26/09 | USD | 1,040 | USD | 2,934 | USD | 3,974 | |||||||||
| Global Value Equity Value (000) | Global Franchise Value (000) | Combined Pro Forma Value (000) | Global Value Equity Unrealized Appreciation (Depreciation) | Global Franchise Unrealized Appreciation (Depreciation) | Combined Pro Forma Unrealized Appreciation (Depreciation) | ||||||||||||||||||
| $ | 1,039 | $ | 2,913 | $ | 3,952 | $ | 33 | $ | 111 | $ | 144 | ||||||||||||
| 965 | 2,916 | 3,881 | 31 | 114 | 145 | ||||||||||||||||||
| 1,039 | 665 | 1,704 | 33 | 26 | 59 | ||||||||||||||||||
| 1,040 | 2,934 | 3,974 | 34 | 118 | 152 | ||||||||||||||||||
| $ | 4,083 | $ | 9,428 | $ | 13,511 | $ | 131 | $ | 369 | $ | 500 | ||||||||||||
GBP - British Pound
USD - United States Dollar
B-6
The Portfolios adopted Financial Accounting Standards Board Statement of Financial Accounting Standards No. 157, "Fair Value Measurements" ("SFAS 157"), effective January 1, 2008. In accordance SFAS 157, fair value is defined as the price that the Portfolios would receive to sell an investment or pay to transfer a liability in a timely transaction with an independent buyer in the principal market, or in the absence of a principal market the most advantageous market for the investment or liability. SFAS 157 establishes a three-tier hierarchy to distinguish between (1) inputs that reflect the assumptions market participants would use in valuing an asset or liability developed based on market data obtained from sources independent of the reporting entity (observable inputs) and (2) inputs that reflect the reporting entity's own assumptions about the assumptions market participants would use in valuing an asset or liability developed based on the best information available in the circumstances (unobservable inputs) and to establish classification of fair value measurements for disclosure purposes. Various inputs are used in determining the value the Portfolios' investments. The inputs are summarized in the three broad levels listed below:
• Level 1 — quoted prices in active markets for identical securities
• Level 2 — other significant observable inputs (including quoted prices for similar securities, interest rates, prepayment speeds, credit risk, etc.)
• Level 3 — significant unobservable inputs (including each Portfolio's own assumptions in determining the fair value of investments)
The inputs or methodology used for valuing securities are not necessarily an indication of the risk associated with investing in those securities.
The following is a summary of the inputs used as of December 31, 2008 in valuing the Portfolios' investments carried at value:
| Portfolios | Global Franchise | Global Value Equity | Combined Pro Forma | ||||||||||||
| Investments in Securities (Level 1) (000) | $ | 29,723 | $ | 15,570 | $ | 45,293 | |||||||||
| Investments in Securities (Level 2) (000) | 51,338 | 23,686 | 75,024 | ||||||||||||
| Investments in Securities (Level 3) (000) | — | — | — | ||||||||||||
| Total for Investments in Securities (000) | 81,061 | 39,256 | 120,317 | ||||||||||||
| Other Financial Instruments* (Level 1) (000) | — | — | — | ||||||||||||
| Other Financial Instruments* (Level 2) (000) | 369 | 131 | 500 | ||||||||||||
| Other Financial Instruments* (Level 3) (000) | — | — | — | ||||||||||||
| Total for Other Financial Instruments (000) | $ | 369 | $ | 131 | $ | 500 | |||||||||
* Other financial instruments include forwards.
At December 31, 2008, there were no Level 3 investments for which significant unobservable inputs were used to determine fair value.
Security Valuation: Securities listed on a foreign exchange are valued at their closing price. Unlisted and listed equity securities not traded on the valuation date, for which market quotations are readily available, are valued at the mean between the current bid and asked prices obtained from reputable brokers. Equity securities listed on a U.S. exchange are valued at the latest quoted sales price on the valuation date. Equity securities listed or traded on NASDAQ, for which market quotations are available, are valued at the NASDAQ Official Closing Price. Bonds and other fixed income securities may be valued according to the broadest and most representative market. In addition, bonds and other fixed income securities may be valued on the basis of prices provided by a pricing service. The prices provided by a pricing service take into account broker dealer market price quotations for institutional size trading in similar groups of securities, security quality, maturity, coupon and other security characteristics as well as any developments related to the specific securities. Debt securities purchased with remaining maturities of 60 days or less are valued at amortized cost, if it approximates market value.
All other securities and investments for which market values are not readily available, including restricted securities, and those securities for which it is inappropriate to determine prices in accordance with the aforementioned procedures, are valued at fair value as determined in good faith under procedures adopted by the Board, although the actual calculations may be done by others. Factors considered in making this determination may include, but are not limited to, information obtained by contacting the issuer, analysts, or the appropriate stock exchange (for exchange-traded securities), analysis of the issuer's financial statements or other available documents and, if necessary, available information concerning other securities in similar circumstances.
Most foreign markets close before the New York Stock Exchange ("NYSE"). Occasionally, developments that could affect the closing prices of securities and other assets may occur between the times at which valuations of such securities are determined (that is, close of the foreign market on which the securities trade) and the close of business on the NYSE. If these developments are expected to materially affect the value of the securities, the valuations may be adjusted to reflect the estimated fair value as of the close of the NYSE, as determined in good faith under procedures established by the Board.
B-7
Pro Forma Combined Condensed Statement of Assets and Liabilities
As of December 31, 2008 (Unaudited)
| Morgan Stanley Institutional Fund, Inc. Global Value Equity Portfolio (000) | Morgan Stanley Institutional Fund, Inc. Global Franchise Portfolio (000) | Adjustments (000) | Pro Forma Combined Portfolio (000) | ||||||||||||||||
| Assets | |||||||||||||||||||
| Investments in Securities of Unaffiliated Issuers, at Cost | $ | 33,504 | $ | 91,641 | $ | — | $ | 125,145 | |||||||||||
| Investment in Securities of Affiliated Issuers, at Cost | 3,499 | 2,897 | 6,396 | ||||||||||||||||
| Total Investments in Securities, at Cost | 37,003 | 94,538 | $ | 131,541 | |||||||||||||||
| Foreign Currency, at Cost | 19 | 109 | $ | 128 | |||||||||||||||
| Investments in Securities of Unaffiliated Issuers, at Value | $ | 35,757 | $ | 78,164 | $ | — | $ | 113,921 | |||||||||||
| Investments in Securities of Affiliated Issuers, at Value | 3,499 | 2,897 | 6,396 | ||||||||||||||||
| Total Investments in Securities, at Value | 39,256 | 81,061 | 120,317 | ||||||||||||||||
| Cash | 15 | 31 | 46 | ||||||||||||||||
| Foreign currency, at Value | 19 | 111 | 130 | ||||||||||||||||
| Receivable for Portfolio Shares Sold | 5 | — | 5 | ||||||||||||||||
| Unrealized Appreciation on Foreign Currency Exchange Contracts | 131 | 369 | 500 | ||||||||||||||||
| Tax Reclaim Receivable | 2 | 90 | 92 | ||||||||||||||||
| Receivable from Affiliates | 3 | 4 | 7 | ||||||||||||||||
| Dividend Receivable | 60 | 108 | 168 | ||||||||||||||||
| Other Assets | 1 | 1 | 2 | ||||||||||||||||
| Total Assets | $ | 39,492 | $ | 81,775 | $ | — | $ | 121,267 | |||||||||||
| Liabilities | |||||||||||||||||||
| Collateral on Securities Loaned, at Value | $ | 3,356 | $ | — | $ | — | $ | 3,356 | |||||||||||
| Payable for Investment Purchased | 18 | 35 | 53 | ||||||||||||||||
| Payable for Portfolio Shares Redeemed | — | 603 | 603 | ||||||||||||||||
| Payable for Investment Advisory Fees | 49 | 149 | 198 | ||||||||||||||||
| Payable for Administration Fees | 3 | 5 | 8 | ||||||||||||||||
| Payable for Custodian Fees | 4 | 5 | 9 | ||||||||||||||||
| Payable for Directors Fees and Expenses | 4 | 1 | 5 | ||||||||||||||||
| Payable for Transfer Agent Fees | 4 | 4 | 8 | ||||||||||||||||
| Payable for Shareholder Servicing Fees - Class P | 2 | 1 | 3 | ||||||||||||||||
| Payable for Sub Transfer Agent Fees - Class I | 21 | 22 | 43 | ||||||||||||||||
| Payable for Sub Transfer Agent Fees - Class P | 8 | 2 | 10 | ||||||||||||||||
| Other Liabilities | 25 | 27 | 52 | ||||||||||||||||
| Total Liabilities | $ | 3,494 | $ | 854 | $ | — | $ | 4,348 | |||||||||||
| Net Assets | $ | 35,998 | $ | 80,921 | $ | 116,919 | |||||||||||||
| Net Assets: | |||||||||||||||||||
| Paid in Capital | $ | 48,209 | $ | 94,167 | 142,376 | ||||||||||||||
| Undistributed Net Investment Income | 150 | 689 | 839 | ||||||||||||||||
| Accumulated Net Realized Loss | (14,745 | ) | (837 | ) | (15,582 | ) | |||||||||||||
| Net unrealized appreciation (depreciation) of Investments | 2,253 | (13,477 | ) | (11,224 | ) | ||||||||||||||
| Foreign Currency Exchange Contracts and Translations | 131 | 379 | 510 | ||||||||||||||||
| Net Assets | $ | 35,998 | $ | 80,921 | $ | — | $ | 116,919 | |||||||||||
| Net Assets | |||||||||||||||||||
| Class I | $ | 24,110 | $ | 78,029 | $ | 102,139 | |||||||||||||
| Class P | $ | 11,888 | $ | 2,892 | $ | — | $ | 14,780 | |||||||||||
| $ | 35,998 | $ | 80,921 | $ | — | $ | 116,919 | ||||||||||||
| Shares Outstanding (not in thousands) | |||||||||||||||||||
| Class I | 2,541,790 | 7,211,644 | (313,509 | )(a) | 9,439,925.00 | ||||||||||||||
| Class P | 1,268,600 | 270,080 | (158,694 | )(a) | 1,379,986.00 | ||||||||||||||
| Net Asset Value Per Share | |||||||||||||||||||
| Class I | $ | 9.49 | $ | 10.82 | $ | 10.82 | |||||||||||||
| Class P | $ | 9.37 | $ | 10.71 | $ | 10.71 | |||||||||||||
| Securities on Loan , at Value | $ | 3,217 | — | $ | 3,217 | ||||||||||||||
(a) — Reflects the adjustment to the number of shares outstanding due to the merger.
B-8
Pro Forma Combining Condensed Statement of Operations (1)
For the Twelve Month Period Ended December 31, 2008 (Unaudited)
| Morgan Stanley Institutional Fund, Inc. Global Value Equity Portfolio (000) | Morgan Stanley Institutional Fund, Inc. Global Franchise Portfolio (000) | Adjustments (000) | Pro Forma Combined Portfolio (000) | ||||||||||||||||
| Investment Income: | |||||||||||||||||||
| Dividends from Securities of Unaffiliated Issuers | $ | 2,142 | $ | 3,803 | $ | — | $ | 5,945 | |||||||||||
| Dividends from Securities of Affiliated Issuers | 56 | 89 | 145 | ||||||||||||||||
| Interest from Securities of Unaffiliated Issuers | 41 | 3 | 44 | ||||||||||||||||
| Less: Foreign Taxes Withheld | (109 | ) | (265 | ) | — | (374 | ) | ||||||||||||
| Total Investment Income | 2,130 | 3,630 | — | 5,760 | |||||||||||||||
| Expenses | |||||||||||||||||||
| Investment Advisory Fees | 372 | 832 | 72 | (a) | 1,276 | ||||||||||||||
| Administration Fees | 44 | 83 | — | 127 | |||||||||||||||
| Custodian Fees | 23 | 26 | (19 | )(b) | 30 | ||||||||||||||
| Directors' Fees and Expenses | — | 3 | — | 3 | |||||||||||||||
| Professional Fees | 31 | 30 | (31 | )(c) | 30 | ||||||||||||||
| Shareholder Reporting Fees | 24 | 18 | (5 | )(d) | 37 | ||||||||||||||
| Shareholder Servicing Fees - Class P | 43 | 11 | — | 54 | |||||||||||||||
| Sub Transfer Agent Fees - Class I | 16 | 16 | — | 32 | |||||||||||||||
| Sub Transfer Agent Fees - Class P | 7 | 1 | — | 8 | |||||||||||||||
| Transfer Agent Fees | 9 | 8 | (8 | )(e) | 9 | ||||||||||||||
| Registration Fees | 28 | 26 | (28 | )(f) | 26 | ||||||||||||||
| Other Expenses | 12 | 12 | (6 | )(g) | 18 | ||||||||||||||
| Expenses Before Non Operating Expenses | 609 | 1,066 | (25 | ) | 1,650 | ||||||||||||||
| Bank Overdraft Expense | 2 | — | @ | — | 2 | ||||||||||||||
| Total Expenses | 611 | 1,066 | (25 | ) | 1,652 | ||||||||||||||
| Voluntary Waiver of Investment Advisory Fees | (13 | ) | (15 | ) | (28 | ) | |||||||||||||
| Rebate from Morgan Stanley Affiliated Cash Sweep | (1 | ) | (5 | ) | (6 | ) | |||||||||||||
| Expense Offset | — | @ | — | @ | — | — | @ | ||||||||||||
| Net Expenses | 597 | 1,046 | (25 | ) | 1,618 | ||||||||||||||
| Net Investment Income | $ | 1,533 | $ | 2,584 | $ | 25 | $ | 4,142 | |||||||||||
| Realized Gain (Loss): | |||||||||||||||||||
| Investment Sold | (13,757 | ) | (751 | ) | — | (14,508 | ) | ||||||||||||
| Foreign Currency Transactions | 962 | 3,607 | — | 4,569 | |||||||||||||||
| Net Realized Gain (Loss) | (12,795 | ) | 2,856 | — | (9,939 | ) | |||||||||||||
| Change in Unrealized Appreciation (Depreciation): | |||||||||||||||||||
| Investments | (17,955 | ) | (40,540 | ) | — | (58,495 | ) | ||||||||||||
| Foreign Currency Exchange Contracts and Translations | 30 | (19 | ) | 11 | |||||||||||||||
| Net Change in Unrealized Appreciation (Depreciation): | (17,925 | ) | (40,559 | ) | — | (58,484 | ) | ||||||||||||
| Total Net Realized Gain (Loss) and Change in Unrealized Appreciation (Depreciation) | (30,720 | ) | (37,703 | ) | — | (68,423 | ) | ||||||||||||
| Net Increase (Decrease) in Net Assets Resulting from Operations | $ | (29,187 | ) | $ | (35,119 | ) | $ | 25 | $ | (64,281 | ) | ||||||||
@ — Amount is less than $500.
(a) — Reflects gross up management fee of approximately $72,000 to reflect management fee of the Global Franchise Portfolio.
(b) — Reflects elimination of transaction fees of approximately $19,000 for Global Value Equity Portfolio. Safekeeping charge would be picked up by Global Franchise Portfolio.
(c) — Reflects elimination of audit fee for Global Value Equity.
(d) — Reflects elimination of annual fixed charges for Global Value Equity ($4,750 of which $4,000 for shareholder reporting and $750 for NQs).
(e) — Reflects elimination of fixed fees for Global Value Equity for manual and automatic transactions. Open account charges remain for Global Value Equity.
(f) — Reflects elimination of blue sky fees for Global Value Equity Portfolio.
(g) — Reflects elimination of approximately $6,000 for miscellaneous invoices for ITG and Lipper for Global Value Equity.
B-9
Notes to Pro Forma Combining Financial Statements
As of December 31, 2008 (Unaudited)
1. These financial statements set forth the unaudited pro forma condensed Statement of Assets and Liabilities as of December 31, 2008 and the unaudited pro forma condensed Statement of Operations for the twelve month period ended December 31, 2008 for the Morgan Stanley Institutional Fund, Inc. Global Franchise Portfolio and Morgan Stanley Institutional Fund, Inc. Global Value Equity Portfolio, as adjusted giving effect to the Reorganization as if had occurred as of December 31, 2008. These statements have been derived from the books and records utilized in calculating daily net asset value for each Portfolio.
2. There is no guarantee that the Portfolio of Investments of the Combined Portfolio on the closing date of the Reorganization will match the Pro Forma Portfolio of Investments presented herein. Certain securities acquired in the Reorganization could be sold by the surviving entity; however, no securities are required to be sold in connection with the Reorganization.
B-10
[Statement of Additional Information for the Company
dated May 1, 2009, as supplemented]
MORGAN STANLEY INSTITUTIONAL FUND, INC.
P.O. Box 2798
Boston, Massachusetts 02208-2798
STATEMENT OF ADDITIONAL INFORMATION
May 1, 2009
Morgan Stanley Institutional Fund, Inc. (the "Fund") is a mutual fund consisting of 16 portfolios (each a "Portfolio" and collectively the "Portfolios") offering a variety of investment alternatives. Each Portfolio offers both Class I and Class P shares. The Emerging Markets Debt Portfolio and Global Real Estate Portfolio also offer Class H and Class L shares. Following is a list of the Portfolios included in this Statement of Additional Information ("SAI"):
| GLOBAL AND INTERNATIONAL EQUITY PORTFOLIOS: | U.S. EQUITY PORTFOLIOS: | ||||||
| Active International Allocation Portfolio | Capital Growth Portfolio | ||||||
| Emerging Markets Portfolio | Focus Growth Portfolio | ||||||
| Global Franchise Portfolio** | Large Cap Relative Value Portfolio | ||||||
| Global Real Estate Portfolio | Small Company Growth Portfolio* | ||||||
| Global Value Equity Portfolio* | U.S. Real Estate Portfolio | ||||||
| International Equity Portfolio | U.S. Small/Mid Cap Value Portfolio | ||||||
| International Growth Equity Portfolio | |||||||
| International Real Estate Portfolio | FIXED INCOME PORTFOLIO: | ||||||
| International Small Cap Portfolio | Emerging Markets Debt Portfolio | ||||||
* Portfolio is currently closed to new investors.
** Portfolio is currently closed to new investors with certain exceptions.
This SAI is not a prospectus, but should be read in conjunction with the Fund's prospectuses, each dated May 1, 2009, as may be supplemented from time to time. To obtain any of these prospectuses, please call the Fund toll-free at 1-800-548-7786.
The Fund's most recent Annual Report is a separate document supplied with this SAI and includes the Fund's audited financial statements, including notes thereto, and the report of Ernst & Young LLP, which are incorporated by reference into this SAI.
Certain Portfolios are "non-diversified" and, as such, such Portfolios' investments are not required to meet certain diversification requirements under federal securities law. Compared with "diversified'' funds or portfolios, each such Portfolio may invest a greater percentage of its assets in the securities of an individual corporation or governmental entity. Thus, the Portfolio's assets may be concentrated in fewer securities than other funds. A decline in the value of those investments would cause the Portfolio's overall value to decline to a greater degree. The Emerging Markets Debt, Focus Growth, Global Franchise, Global Real Estate, International Real Estate and U.S. Real Estate Portfolios are non-diversified portfolios.
1
| Table of Contents | Page | ||||||
| Investment Policies and Strategies | 2 | ||||||
| Investment Limitations | 32 | ||||||
| Disclosure of Portfolio Holdings | 34 | ||||||
| Purchase of Shares | 38 | ||||||
| Redemption of Shares | 40 | ||||||
| Account Policies and Features | 42 | ||||||
| Management of the Fund | 43 | ||||||
| Investment Advisory and Other Services | 52 | ||||||
| Distribution and Shareholder Services Plans | 60 | ||||||
| Brokerage Practices | 62 | ||||||
| General Information | 65 | ||||||
| Taxes | 66 | ||||||
| Control Persons and Principal Holders of Securities | 72 | ||||||
| Performance Information | 82 | ||||||
| Financial Statements | 85 | ||||||
| Appendix A Proxy Voting Policy and Procedures | A-1 | ||||||
| Appendix B Descripton of Ratings | B-1 | ||||||
INVESTMENT POLICIES AND STRATEGIES
This SAI provides additional information about the investment policies and operations of the Fund and its Portfolios. Morgan Stanley Investment Management Inc. (the "Adviser") acts as investment adviser to each Portfolio. Under the supervision of the Adviser, Morgan Stanley Investment Management Limited ("MSIM Limited") acts as investment sub-adviser to the Emerging Markets, Global Franchise, Global Real Estate, Global Value Equity, International Equity, International Real Estate and International Small Cap Portfolios; Morgan Stanley Investment Management Company ("MSIM Company") acts as investment sub-adviser to the Emerging Markets, Global Franchise, Global Real Estate, Global Value Equity, International Equity and International Real Estate Portfolios (MSIM Limited and MSIM Company are each referred to herein individually as the "Sub-Adviser" and together as the "Sub-Advisers"). References to the Adviser, when used in connection with its activities as investment adviser, include any Sub-Adviser acting under its supervision.
The following tables summarize the permissible strategies and investments for each Portfolio. These tables should be used in conjunction with the investment summaries for each Portfolio contained in the Prospectus in order to provide a more complete description of such Portfolio's investment policies. More details about each investment and related risks are provided in the discussion following the tables.
2
GLOBAL AND INTERNATIONAL EQUITY PORTFOLIOS
| Active International Allocation | Emerging Markets | Global Franchise | Global Real Estate | Global Value Equity | International Equity | International Growth Equity | International Real Estate | International Small Cap | |||||||||||||||||||||||||||||||
| Equity Securities: | |||||||||||||||||||||||||||||||||||||||
| Common Stocks | a | a | a | a | a | a | a | a | a | ||||||||||||||||||||||||||||||
| Depositary Receipts | a | a | a | a | a | a | a | a | a | ||||||||||||||||||||||||||||||
| Preferred Stocks | a | a | a | a | a | a | a | a | a | ||||||||||||||||||||||||||||||
| Rights | a | a | a | a | a | a | a | a | a | ||||||||||||||||||||||||||||||
| Warrants | a | a | a | a | a | a | a | a | a | ||||||||||||||||||||||||||||||
| IPOs | a | a | a | a | a | a | a | a | a | ||||||||||||||||||||||||||||||
| Convertible Securities | a | a | a | a | a | a | a | a | a | ||||||||||||||||||||||||||||||
| Limited Partnerships | a | a | a | a | a | a | a | a | a | ||||||||||||||||||||||||||||||
| Investment Company Securities | a | a | a | a | a | a | a | a | a | ||||||||||||||||||||||||||||||
| Real Estate Investing | a | a | a | a | a | a | a | a | a | ||||||||||||||||||||||||||||||
| —REITs | a | a | a | a | a | a | a | a | a | ||||||||||||||||||||||||||||||
| —Foreign Real Estate Companies | a | a | a | a | a | a | a | a | a | ||||||||||||||||||||||||||||||
| —Specialized Ownership Vehicles | a | a | a | a | a | a | a | a | a | ||||||||||||||||||||||||||||||
| Fixed Income Securities: | |||||||||||||||||||||||||||||||||||||||
| Investment Grade Securities | a | a | a | a | a | a | a | a | a | ||||||||||||||||||||||||||||||
| High Yield Securities | a | ||||||||||||||||||||||||||||||||||||||
| U.S. Government Securities | a | a | * | a | * | * | a | a | * | ||||||||||||||||||||||||||||||
| Agencies | a | a | * | a | * | * | a | a | * | ||||||||||||||||||||||||||||||
| Corporates | a | a | * | a | * | * | a | a | * | ||||||||||||||||||||||||||||||
| Money Market Instruments | a | a | a | a | a | a | a | a | a | ||||||||||||||||||||||||||||||
| Cash Equivalents | a | a | a | a | a | a | a | a | a | ||||||||||||||||||||||||||||||
| Mortgage Related Securities | a | ||||||||||||||||||||||||||||||||||||||
| Repurchase Agreements | a | a | a | a | a | a | a | a | a | ||||||||||||||||||||||||||||||
| Municipals | |||||||||||||||||||||||||||||||||||||||
| Asset-Backed Securities | |||||||||||||||||||||||||||||||||||||||
| Loan Participations and Assignments | a | ||||||||||||||||||||||||||||||||||||||
| Temporary Investments | a | a | a | a | a | a | a | a | a | ||||||||||||||||||||||||||||||
| Zero Coupons, Pay-In-Kind Securities or Deferred Payment Securities | a | a | a | a | a | ||||||||||||||||||||||||||||||||||
| Eurodollar and Yankee Dollar Obligations | a | a | a | a | a | a | a | a | a | ||||||||||||||||||||||||||||||
| Foreign Investment: | |||||||||||||||||||||||||||||||||||||||
| Foreign Equity Securities | a | a | a | a | a | a | a | a | a | ||||||||||||||||||||||||||||||
| Foreign Government Fixed Income Securities | a | a | a | a | |||||||||||||||||||||||||||||||||||
| Foreign Corporate Fixed Income Securities | a | a | a | a | a | ||||||||||||||||||||||||||||||||||
| Emerging Market Securities | a | a | a | a | a | a | a | a | a | ||||||||||||||||||||||||||||||
| Foreign Currency Transactions | a | a | a | a | a | a | a | a | |||||||||||||||||||||||||||||||
| Brady Bonds | a | a | a | a | a | a | |||||||||||||||||||||||||||||||||
| Investment Funds | a | a | a | a | a | a | a | a | a | ||||||||||||||||||||||||||||||
| Other Securities and Investment Strategies: | |||||||||||||||||||||||||||||||||||||||
| Loans of Portfolio Securities | a | a | a | a | a | a | a | a | a | ||||||||||||||||||||||||||||||
| Non-Publicly Traded Securities, Private Placements and Restricted Securities | a | a | a | a | a | a | a | a | a | ||||||||||||||||||||||||||||||
| When-Issued and Delayed Delivery Securities | a | a | a | a | a | a | a | a | a | ||||||||||||||||||||||||||||||
3
| Active International Allocation | Emerging Markets | Global Franchise | Global Real Estate | Global Value Equity | International Equity | International Growth Equity | International Real Estate | International Small Cap | |||||||||||||||||||||||||||||||
| Borrowing for Investment Purposes | |||||||||||||||||||||||||||||||||||||||
| Temporary Borrowing | a | a | a | a | a | a | a | a | a | ||||||||||||||||||||||||||||||
| Reverse Repurchase Agreements | |||||||||||||||||||||||||||||||||||||||
| Short Sales | |||||||||||||||||||||||||||||||||||||||
| Structured Products | a | a | a | a | a | a | a | a | a | ||||||||||||||||||||||||||||||
| Derivatives: | |||||||||||||||||||||||||||||||||||||||
| Forward Foreign Currency Exchange Contracts | a | a | a | a | a | a | a | a | a | ||||||||||||||||||||||||||||||
| Futures Contracts | a | a | a | a | a | a | a | a | a | ||||||||||||||||||||||||||||||
| Forward Contracts | a | a | a | a | a | a | a | a | a | ||||||||||||||||||||||||||||||
| Options | a | a | a | a | a | a | a | a | a | ||||||||||||||||||||||||||||||
| Swaps, Caps, Collars and Floors | a | a | a | a | a | a | a | a | a | ||||||||||||||||||||||||||||||
| Contracts for Difference (CFDs) | a | a | a | a | a | ||||||||||||||||||||||||||||||||||
* See Money Market Instruments and Temporary Investments.
U.S. EQUITY PORTFOLIOS
| Capital Growth | Focus Growth | Large Cap Relative Value | Small Company Growth | U.S. Real Estate | U.S. Small/Mid Cap Value | ||||||||||||||||||||||||||
| Equity Securities: | |||||||||||||||||||||||||||||||
| Common Stocks | a | a | a | a | a | a | |||||||||||||||||||||||||
| Depositary Receipts | a | a | a | a | a | a | |||||||||||||||||||||||||
| Preferred Stocks | a | a | a | a | a | a | |||||||||||||||||||||||||
| Rights | a | a | a | a | a | a | |||||||||||||||||||||||||
| Warrants | a | a | a | a | a | a | |||||||||||||||||||||||||
| IPOs | a | a | a | a | a | ||||||||||||||||||||||||||
| Convertible Securities | a | a | a | a | a | a | |||||||||||||||||||||||||
| Limited Partnerships | a | a | a | a | a | a | |||||||||||||||||||||||||
| Investment Company Securities | a | a | a | a | a | a | |||||||||||||||||||||||||
| Real Estate Investing | a | a | a | a | a | a | |||||||||||||||||||||||||
| —REITs | a | a | a | a | a | a | |||||||||||||||||||||||||
| —Specialized Ownership Vehicles | a | a | a | a | a | a | |||||||||||||||||||||||||
| Fixed Income Securities: | |||||||||||||||||||||||||||||||
| Investment Grade Securities | a | a | a | a | a | a | |||||||||||||||||||||||||
| High Yield Securities | a | ||||||||||||||||||||||||||||||
| U.S. Government Securities | a | a | a | a | a | a | |||||||||||||||||||||||||
| Agencies | a | a | a | a | a | a | |||||||||||||||||||||||||
| Corporates | a | a | a | a | a | a | |||||||||||||||||||||||||
| Money Market Instruments | a | a | a | a | a | a | |||||||||||||||||||||||||
| Cash Equivalents | a | a | a | a | a | a | |||||||||||||||||||||||||
| Mortgage Related Securities | a | ||||||||||||||||||||||||||||||
| Repurchase Agreements | a | a | a | a | a | a | |||||||||||||||||||||||||
| Municipals | |||||||||||||||||||||||||||||||
| Asset-Backed Securities | |||||||||||||||||||||||||||||||
4
| Capital Growth | Focus Growth | Large Cap Relative Value | Small Company Growth | U.S. Real Estate | U.S. Small/Mid Cap Value | ||||||||||||||||||||||
| Loan Participations and Assignments | |||||||||||||||||||||||||||
| Temporary Investments | a | a | a | a | a | a | |||||||||||||||||||||
| Zero Coupons, Pay-In-Kind Securities or Deferred Payment Securities | a | a | a | a | a | a | |||||||||||||||||||||
| Eurodollar and Yankee Dollar Obligations | a | ||||||||||||||||||||||||||
| Foreign Investment: | |||||||||||||||||||||||||||
| Foreign Equity Securities | a | a | a | a | a | a | |||||||||||||||||||||
| Foreign Government Fixed Income Securities | a | a | |||||||||||||||||||||||||
| Foreign Corporate Fixed Income Securities | a | a | |||||||||||||||||||||||||
| Emerging Market Securities | a | a | a | a | a | ||||||||||||||||||||||
| Foreign Currency Transactions | a | a | a | a | a | a | |||||||||||||||||||||
| Brady Bonds | a | ||||||||||||||||||||||||||
| Investment Funds | a | a | a | a | a | a | |||||||||||||||||||||
| Other Securities and Investment Strategies: | |||||||||||||||||||||||||||
| Loans of Portfolio Securities | a | a | a | a | a | a | |||||||||||||||||||||
| Non-Publicly Traded Securities, Private Placements and Restricted Securities | a | a | a | a | a | a | |||||||||||||||||||||
| When-Issued and Delayed Delivery Securities | a | a | a | a | a | a | |||||||||||||||||||||
| Borrowing for Investment Purposes | |||||||||||||||||||||||||||
| Temporary Borrowing | a | a | a | a | a | a | |||||||||||||||||||||
| Reverse Repurchase Agreements | a | a | |||||||||||||||||||||||||
| Short Sales | |||||||||||||||||||||||||||
| Structured Products | a | a | a | a | a | a | |||||||||||||||||||||
| Derivatives: | |||||||||||||||||||||||||||
| Forward Foreign Currency Exchange Contracts | a | a | a | a | a | a | |||||||||||||||||||||
| Futures Contracts | a | a | a | a | a | a | |||||||||||||||||||||
| Forward Contracts | a | a | a | a | a | a | |||||||||||||||||||||
| Options | a | a | a | a | a | a | |||||||||||||||||||||
| Swaps, Caps, Collars and Floors | a | a | a | a | a | a | |||||||||||||||||||||
FIXED INCOME PORTFOLIO
| Emerging Markets Debt | |||||||
| Equity Securities: | |||||||
| Common Stocks | |||||||
| Depositary Receipts | a | ||||||
| Preferred Stocks | a | ||||||
| Rights | a | ||||||
| Warrants | a | ||||||
| Convertible Securities | a | ||||||
| Limited Partnerships | |||||||
| Investment Company Securities | a | ||||||
| Real Estate Investing | |||||||
| —REITs | |||||||
| —Specialized Ownership Vehicles | |||||||
5
| Emerging Markets Debt | |||||||
| Fixed Income Securities: | |||||||
| Investment Grade Securities | a | ||||||
| High Yield Securities | a | ||||||
| U.S. Government Securities | a | ||||||
| Agencies | a | ||||||
| Corporates | a | ||||||
| Money Market Instruments | a | ||||||
| Cash Equivalents | a | ||||||
| Mortgage Related Securities | a | ||||||
| —MBSs | a | ||||||
| —CMOs | a | ||||||
| —SMBSs | a | ||||||
| Repurchase Agreements | a | ||||||
| Municipals | a | ||||||
| Asset-Backed Securities | a | ||||||
| Loan Participations and Assignments | a | ||||||
| Temporary Investments | a | ||||||
| Zero Coupons, Pay-In-Kind Securities or Deferred Payment | a | ||||||
| Floaters | a | ||||||
| Inverse Floaters | a | ||||||
| Eurodollar and Yankee Dollar Obligations | a | ||||||
| Foreign Investment: | |||||||
| Foreign Equity Securities | a | ||||||
| Foreign Government Fixed Income Securities | a | ||||||
| Foreign Corporate Fixed Income Securities | a | ||||||
| Emerging Market Securities | a | ||||||
| Foreign Currency Transactions | a | ||||||
| Brady Bonds | a | ||||||
| Investment Funds | a | ||||||
| Other Securities and Investment Strategies: | |||||||
| Loans of Portfolio Securities | a | ||||||
| Non-Publicly Traded Securities, Private Placements and Restricted Securities | a | ||||||
| When-Issued and Delayed Delivery Securities | a | ||||||
| Borrowing for Investment Purposes | a | ||||||
| Temporary Borrowing | a | ||||||
| Reverse Repurchase Agreements | a | ||||||
| Short Sales | a | ||||||
| Structured Products | a | ||||||
| Derivatives: | |||||||
| Forward Foreign Currency Exchange Contracts | a | ||||||
| Futures Contracts | a | ||||||
| Forward Contracts | a | ||||||
| Options | a | ||||||
| Swaps, Caps, Collars and Floors | a | ||||||
6
EQUITY SECURITIES
Equity securities generally represent an ownership interest in an issuer, or may be convertible into or represent a right to acquire an ownership interest in an issuer. While there are many types of equity securities, prices of all equity securities will fluctuate. Economic, political and other events may affect the prices of broad equity markets. For example, changes in inflation or consumer demand may affect the prices of equity securities generally in the United States. Similar events also may affect the prices of particular equity securities. For example, news about the success or failure of a new product may affect the price of a particular issuer's equity securities.
Common Stocks. Common stocks are equity securities representing an ownership interest in a corporation, entitling the stockholder to voting rights and receipt of dividends paid based on proportionate ownership.
Depositary Receipts. Depositary Receipts represent an ownership interest in securities of foreign companies (an "underlying issuer") that are deposited with a depositary. Depositary Receipts are not necessarily denominated in the same currency as the underlying securities. Depositary Receipts include American Depositary Receipts ("ADRs"), Global Depositary Receipts ("GDRs") and other types of depositary receipts (which, together with ADRs and GDRs, are hereinafter collectively referred to as "Depositary Receipts"). ADRs are dollar-denominated Depositary Receipts typically issued by a U.S. financial institution which evidence an ownership interest in a security or pool of securities issued by a foreign issuer. ADRs are listed and traded in the United States. ADRs also include American depositary shares. GDRs and other types of Depositary Receipts are typically issued by foreign banks or trust companies, although they also may be issued by U.S. financial institutions, and evidence ownership interests in a security or pool of securities issued by either a foreign or a U.S. corporation. Generally, depositary receipts in registered form are designed for use in the U.S. securities market and depositary receipts in bearer form are designed for use in securities markets outside the United States.
Depositary Receipts may be "sponsored" or "unsponsored." Sponsored Depositary Receipts are established jointly by a depositary and the underlying issuer, whereas unsponsored Depositary Receipts may be established by a depositary without participation by the underlying issuer. Holders of unsponsored Depositary Receipts generally bear all the costs associated with establishing unsponsored Depositary Receipts. In addition, the issuers of the securities underlying unsponsored Depository Receipts are not obligated to disclose material information in the United States and, therefore, there may be less information available regarding such issuers and there may not be a correlation between such information and the market value of the Depositary Receipts. For purposes of a Portfolio's investment policies, a Portfolio's investments in Depositary Receipts will be deemed to be an investment in the underlying securities, except that ADRs may be deemed to be issued by a U.S. issuer.
Preferred Stocks. Preferred stocks are securities that evidence ownership in a corporation which pay a fixed or variable stream of dividends. Preferred stocks have a preference over common stocks in the event of the liquidation of an issuer and usually do not carry voting rights. Because preferred stocks pay a fixed or variable stream of dividends, they have many of the characteristics of a fixed income security and are, therefore, included in both the definition of equity security and fixed income security.
Rights. Rights represent the right, but not the obligation, for a fixed period of time to purchase additional shares of an issuer's common stock at the time of a new issuance, usually at a price below the initial offering price of the common stock and before the common stock is offered to the general public. Rights are usually freely transferable. The risk of investing in a right is that the right may expire prior to the market value of the common stock exceeding the price fixed by the right.
Warrants. Warrants give holders the right, but not the obligation, to buy common stock of an issuer at a given price, usually higher than the market price at the time of issuance, during a specified period. Warrants are usually freely transferable. The risk of investing in a warrant is that the warrant may expire prior to the market value of the common stock exceeding the price fixed by the warrant.
IPOs. The Portfolios may purchase equity securities issued as part of, or a short period after, a company's initial public offering ("IPOs"), and may at times dispose of those securities shortly after their acquisition. A Portfolio's purchase of securities issued in IPOs exposes it to the risks associated with companies that have little operating history as public companies, as well as to the risks inherent in those sectors of the market where these issuers operate. The market for IPO issuers has been volatile, and share prices of newly-public companies have fluctuated significantly over short periods of time.
Convertible Securities. Convertible securities are securities that may be exchanged under certain circumstances for a fixed number of shares of common stock or other equity securities. Convertible securities generally represent a feature of some other type of security, such as a fixed income security or preferred stock, so that, for example, a
7
convertible fixed income security would be a fixed income security that is convertible into common stock. Convertible securities may be viewed as an investment in the current security or the security into which the convertible securities may be exchanged and, therefore, are included in both the definitions of equity security and fixed income security. Each of the U.S., Global and International Equity Portfolios can invest up to 5% of its assets in convertible securities that have been rated below investment grade.
Limited Partnerships. A limited partnership interest entitles a Portfolio to participate in the investment return of the partnership's assets as defined by the agreement among the partners. As a limited partner, a Portfolio generally is not permitted to participate in the management of the partnership. However, unlike a general partner whose liability is not limited, a limited partner's liability generally is limited to the amount of its commitment to the partnership.
Investment Company Securities. Investment company securities are securities of other open-end, closed-end and unregistered investment companies, including foreign investment companies, hedge funds and exchange-traded funds. A Portfolio may invest in investment company securities as may be permitted by (i) the Investment Company Act of 1940, as amended from time to time (the "1940 Act"); (ii) the rules and regulations promulgated by the United States Securities and Exchange Commission (the "SEC") under the 1940 Act, as amended from time to time; or (iii) an exemption or other relief applicable to the Portfolio from provisions of the 1940 Act, as amended from time to time. The 1940 Act generally prohibits an investment company from acquiring more than 3% of the outstanding voting shares of an investment company and limits such investments to no more than 5% of a portfolio's total assets in any one investment company, and no more than 10% in any combination of investment companies. A Portfolio may invest in investment company securities of investment companies managed by the Adviser or its affiliates to the extent permitted under the 1940 Act or as otherwise authorized by the SEC. To the extent a Portfolio invests a portion of its assets in investment company securities, those assets will be subject to the risks of the purchased investment company's portfolio securities, and a shareholder in any such Portfolio will bear not only his proportionate share of the expenses of the Portfolio, but also, indirectly the expenses of the purchased investment company.
To the extent permitted by applicable law, each Portfolio may invest all or some of its short term cash investments in any money market fund advised or managed by the Adviser or its affiliates. In connection with any such investments, each Portfolio, to the extent permitted by the 1940 Act, will pay its share of all expenses (other than advisory and administrative fees) of a money market fund in which it invests which may result in the Portfolio bearing some additional expenses.
Exchange-Traded Funds ("ETFs"). The Portfolios may invest in shares of various ETFs, including exchange-traded index and bond funds. Exchange-traded index funds seek to track the performance of various securities indices. Shares of ETFs have many of the same risks as direct investments in common stocks or bonds. In addition, their market value is expected to rise and fall as the value of the underlying index or bond rises and falls. The market value of their shares may differ from the net asset value of the particular fund. As a shareholder in an ETF (as with other investment companies), the Portfolio would bear its ratable share of that entity's expenses. At the same time, the Portfolio would continue to pay its own investment management fees and other expenses. As a result, the Portfolio and its shareholders, in effect, will be absorbing duplicate levels of fees with respect to investments in ETFs.
Real Estate Investing. Investments in securities of issuers engaged in the real estate industry entail special risks and considerations. In particular, securities of such issuers may be subject to risks associated with the direct ownership of real estate. These risks include the cyclical nature of real estate values, risks related to general and local economic conditions, overbuilding and increased competition, increases in property taxes and operating expenses, demographic trends and variations in rental income, changes in zoning laws, casualty or condemnation losses, environmental risks, regulatory limitations on rents, changes in neighborhood values, changes in the appeal of properties to tenants, increases in interest rates and other real estate capital market influences. Generally, increases in interest rates will increase the costs of obtaining financing, which could directly and indirectly decrease the value of a Portfolio's investments.
Real Estate Investment Trusts ("REITs") and foreign real estate companies. Certain Portfolios may invest in REITs and/or foreign real estate companies, which are similar to entities organized and operated as REITs in the United States. REITs and foreign real estate companies pool investors' funds for investment primarily in real estate properties or real estate-related loans. REITs and foreign real estate companies generally derive their income from rents on the underlying properties or interest on the underlying loans, and their value is impacted by changes in the value of the underlying property or changes in interest rates affecting the underlying loans owned by the REITs
8
and/or foreign real estate companies. REITs and foreign real estate companies are more susceptible to risks associated with the ownership of real estate and the real estate industry in general. These risks can include fluctuations in the value of underlying properties; defaults by borrowers or tenants; market saturation; changes in general and local economic conditions; decreases in market rates for rents; increases in competition, property taxes, capital expenditures or operating expenses; and other economic, political or regulatory occurrences affecting the real estate industry. In addition, REITs and foreign real estate companies depend upon specialized management skills, may not be diversified (which may increase the volatility of a REIT's and/or foreign real estate company's value), may have less trading volume and may be subject to more abrupt or erratic price movements than the overall securities market. Foreign real estate companies may be subject to laws, rules and regulations governing those entities and their failure to comply with those laws, rules and regulations could negatively impact the performance of those entities. Furthermore, investments in REITs and foreign real estate companies may involve duplication of management fees and certain other expenses, as the Portfolio indirectly bears its proportionate share of any expenses paid by REITs and foreign real estate companies in which it invests. U.S. REITs are not taxed on income distributed to shareholders provided they comply with several requirements of the Internal Revenue Code of 1986, as amended (the "Code"). U.S. REITs are subject to the risk of failing to qualify for tax-free pass-through of income under the Code.
Specialized Ownership Vehicles. Specialized ownership vehicles pool investors' funds for investment primarily in income-producing real estate or real estate-related loans or interests. Such specialized ownership vehicles in which the Portfolios may invest include property unit trusts, foreign real estate companies, REITs and other similar specialized investment vehicles. Investments in such specialized ownership vehicles may have favorable or unfavorable legal, regulatory or tax implications for a Portfolio and, to the extent such vehicles are structured similarly to investment funds, a shareholder in the Portfolio will bear not only his proportionate share of the expenses of the Portfolio, but also, indirectly the expenses of the specialized ownership vehicle.
FIXED INCOME SECURITIES
Fixed income securities generally represent an issuer's obligation to repay to the investor (or lender) the amount borrowed plus interest over a specified time period. A typical fixed income security specifies a fixed date when the amount borrowed (principal) is due in full, known as the maturity date, and specifies dates when periodic interest (coupon) payments will be made over the life of the security.
Fixed income securities come in many varieties and may differ in the way that interest is calculated, the amount and frequency of payments, the type of collateral, if any, and the presence of special features (e.g., conversion rights). Prices of fixed income securities fluctuate and, in particular, are subject to several key risks including, but not limited to, interest rate risk, credit risk, prepayment risk and spread risk.
Interest rate risk arises due to general changes in the level of market rates after the purchase of a fixed income security. Generally, the values of fixed income securities vary inversely with changes in interest rates. During periods of falling interest rates, the values of most outstanding fixed income securities generally rise and during periods of rising interest rates, the values of most fixed income securities generally decline. While fixed income securities with longer final maturities often have higher yields than those with shorter maturities, they usually possess greater price sensitivity to changes in interest rates and other factors. Traditionally, the remaining term to maturity has been used as a barometer of a fixed income security's sensitivity to interest rate changes. This measure, however, considers only the time until the final principal payment and takes no account of the pattern or amount of principal or interest payments prior to maturity. Duration combines consideration of yield, coupon, interest and principal payments, final maturity and call (prepayment) features. Duration measures the likely percentage change in a fixed income security's price for a small parallel shift in the general level of interest rates; it is also an estimate of the weighted average life of the remaining cash flows of a fixed income security. In almost all cases, the duration of a fixed income security is shorter than its term to maturity.
Credit risk, also known as default risk, represents the possibility that an issuer may be unable to meet scheduled interest and principal payment obligations. It is most often associated with corporate bonds, although it can be present in other fixed income securities as well (note that the market generally assumes that obligations of the U.S. Treasury are free from credit risk). Credit ratings and quantitative models attempt to measure the degree of credit risk in fixed income securities, and provide insight as to whether prevailing yield spreads afford sufficient compensation for such risk. Other things being equal, fixed income securities with high degrees of credit risk should trade in the market at lower prices (and higher yields) than fixed income securities with low degrees of credit risk.
Prepayment risk, also known as call risk, arises due to the issuer's ability to prepay all or most of the fixed income security prior to the stated final maturity date. Prepayments generally rise in response to a decline in
9
interest rates as debtors take advantage of the opportunity to refinance their obligations. This risk is often associated with mortgage securities where the underlying mortgage loans can be refinanced, although it can also be present in corporate or other types of bonds with call provisions. When a prepayment occurs, a Portfolio may be forced to reinvest in lower yielding fixed income securities. Quantitative models are designed to help assess the degree of prepayment risk, and provide insight as to whether prevailing yield spreads afford sufficient compensation for such risk.
Spread risk is the potential for the value of a Portfolio's assets to fall due to the widening of spreads. Fixed income securities generally compensate for greater credit risk by paying interest at a higher rate. The difference (or "spread") between the yield of a security and the yield of a benchmark, such as a U.S. Treasury security with a comparable maturity, measures the additional interest paid for credit risk. As the spread on a security widens (or increases), the price (or value) of the security falls. Spread widening may occur, among other reasons, as a result of market concerns over the stability of the market, excess supply, general credit concerns in other markets, security- or market-specific credit concerns or general reductions in risk tolerance.
Economic, political and other events also may affect the prices of broad fixed income markets, although the risks associated with such events are transmitted to the market via changes in the prevailing levels of interest rates, credit risk, prepayment risk or spread risk.
Fixed Income Value Investing. The Adviser employs a value investing philosophy in the management of certain Portfolios. Bond prices and yields reflect implicit market forecasts regarding a variety of factors, such as inflation, economic growth, credit risk and prepayment risk, to name a few. The Adviser uses a series of quantitative models and tools to assess and help identify situations where implicit market forecasts appear to be extremely optimistic or pessimistic. The Adviser then analyzes these findings and establishes the Portfolio's interest rate, sector and security selection positions so as to take advantage of the most attractive of these value opportunities.
Investment Grade Securities. Investment grade securities are fixed income securities rated by one or more of the rating agencies in one of the four highest rating categories at the time of purchase (e.g., AAA, AA, A or BBB by Standard & Poor's Rating Group, a division of The McGraw-Hill Companies, Inc. ("S&P"), or Fitch Ratings ("Fitch"), or Aaa, Aa, A or Baa by Moody's Investors Service, Inc. ("Moody's")) or determined to be of equivalent quality by the Adviser. Securities rated BBB or Baa represent the lowest of four levels of investment grade securities and are regarded as borderline between definitely sound obligations and those in which the speculative element begins to predominate. Ratings assigned to fixed income securities represent only the opinion of the rating agency assigning the rating and are not dispositive of the credit risk associated with the purchase of a particular fixed income security. Moreover, market risk also will affect the prices of even the highest rated fixed income securities so that their prices may rise or fall even if the issuer's capacity to repay its obligations remains unchanged.
High Yield Securities. High yield securities are generally considered to include fixed income securities rated below the four highest rating categories at the time of purchase (e.g., Ba through C by Moody's, or BB through D by S&P or Fitch) and unrated fixed income securities considered by the Adviser to be of equivalent quality. High yield securities are not considered investment grade and are commonly referred to as "junk bonds" or high yield, high risk securities. Investment grade securities that a Portfolio holds may be downgraded to below investment grade by the rating agencies. If a Portfolio holds a security that is downgraded, the Portfolio may choose to retain the security.
While high yield securities offer higher yields, they also normally carry a high degree of credit risk and are considered speculative by the major credit rating agencies. High yield securities may be issued as a consequence of corporate restructuring or similar events. High yield securities are often issued by smaller, less creditworthy issuers, or by highly leveraged (indebted) issuers, that are generally less able than more established or less leveraged issuers to make scheduled payments of interest and principal. In comparison to investment grade securities, the price movement of these securities is influenced less by changes in interest rates and more by the financial and business position of the issuer. The values of high yield securities are more volatile and may react with greater sensitivity to market changes.
U.S. Government Securities. U.S. government securities refers to a variety of fixed income securities issued or guaranteed by the U.S. Government and various instrumentalities and agencies. The U.S. government securities that certain Portfolios may purchase include U.S. Treasury bills, notes and bonds, all of which are direct obligations of the U.S. Government. In addition, certain Portfolios may purchase securities issued by agencies and instrumentalities of the U.S. Government which are backed by the full faith and credit of the United States. Among the agencies and instrumentalities issuing these obligations are the Government National Mortgage Association ("Ginnie Mae") and the Federal Housing Administration ("FHA"). Certain of the Portfolios may also purchase
10
securities issued by agencies and instrumentalities which are not backed by the full faith and credit of the United States, but whose issuing agency or instrumentality has the right to borrow, to meet its obligations, from the U.S. Treasury. Among these agencies and instrumentalities are the Federal National Mortgage Association ("Fannie Mae"), the Federal Home Loan Mortgage Corporation ("Freddie Mac") and the Federal Home Loan Banks. Further, certain Portfolios may purchase securities issued by agencies and instrumentalities which are backed solely by the credit of the issuing agency or instrumentality. Among these agencies and instrumentalities is the Federal Farm Credit System.
Adjustable Rate Government Securities. Adjustable rate government securities are variable rate securities where the variable rate of interest is readjusted no less frequently than every 397 days and deemed to have a maturity equal to the period remaining until the next readjustment of the interest rate.
Agencies. Agencies refer to fixed income securities issued or guaranteed by federal agencies and U.S. government sponsored instrumentalities. They may or may not be backed by the full faith and credit of the U.S. Government. If they are not backed by the full faith and credit of the United States, the investor must look principally to the agency or instrumentality issuing or guaranteeing the obligation for ultimate repayment, and may not be able to assert a claim against the United States itself in the event the agency or instrumentality does not meet its commitment. Agencies which are backed by the full faith and credit of the United States include the Export-Import Bank, Farmers Home Administration, Federal Financing Bank and others. Certain debt issued by Resolution Funding Corporation has both its principal and interest backed by the full faith and credit of the U.S. Treasury in that its principal is backed by U.S. Treasury zero coupon issues, while the U.S. Treasury is explicitly required to advance funds sufficient to pay interest on it, if needed. Certain agencies and instrumentalities, such as Ginnie Mae, are, in effect, backed by the full faith and credit of the United States through provisions in their charters that they may make "indefinite and unlimited" drawings on the Treasury, if needed to service its debt. Debt from certain other agencies and instrumentalities, including the Federal Home Loan Bank and Fannie Mae, are not guaranteed by the United States, but those institutions are protected by the discretionary authority of the U.S. Treasury to purchase certain amounts of their securities to assist them in meeting their debt obligations. Finally, other agencies and instrumentalities, such as the Farm Credit System, are federally chartered institutions under U.S. government supervision, but their debt securities are backed only by the credit worthiness of those institutions, not the U.S. Government. Some of the U.S. government agencies that issue or guarantee securities include the Export-Import Bank of the United States, Farmers Home Administration, FHA, Maritime Administration, Small Business Administration and The Tennessee Valley Authority ("TVA"). An instrumentality of the U.S. Government is a government agency organized under federal charter with government supervision. Instrumentalities issuing or guaranteeing securities include, among others, Federal Home Loan Banks, the Federal Land Banks, Central Bank for Cooperatives, Federal Intermediate Credit Banks and Fannie Mae.
Maturity and Duration Management. A component of the Adviser's fixed income investment strategy is maturity and duration management. The maturity and duration structure of a Portfolio investing in fixed income securities is actively managed, based upon the Adviser's assessment of the market's implied forecasts for inflation and economic growth. Adjustments to shorten portfolio maturity and duration are made to limit capital losses during periods when interest rates are expected to rise. Conversely, adjustments made to lengthen maturity are intended to produce capital appreciation in periods when interest rates are expected to fall.
Duration is a measure of the expected life of a fixed income security on a present value basis. Duration takes the length of the time intervals between the present time and the time that the interest and principal payments are scheduled or, in the case of a callable bond, expected to be received, and weights them by the present values of the cash to be received at each future point in time. For any fixed income security with interest payments occurring prior to the payment of principal, duration is always less than maturity. In general, all other factors being the same, the lower the stated or coupon rate of interest of a fixed income security, the longer the duration of the security; conversely, the higher the stated or coupon rate of interest of a fixed income security, the shorter the duration of the security.
There are some situations where even the standard duration calculation does not properly reflect the interest rate exposure of a security. For example, floating and variable rate securities often have final maturities of ten or more years; however, their interest rate exposure corresponds to the frequency of the coupon reset. Another example where the interest rate exposure is not properly captured by duration is the case of mortgage pass-through securities. The stated final maturity of such securities generally is 30 years, but current prepayment rates are more critical in determining the securities' interest rate exposure. In these and other similar situations, the Adviser will use sophisticated analytical techniques that incorporate the economic life of a security into the determination of its interest rate exposure.
11
Corporates. Corporates are fixed income securities issued by private businesses. Holders, as creditors, have a prior legal claim over holders of equity securities of the issuer as to both income and assets for the principal and interest due the holder.
Money Market Instruments. Money market instruments are high quality short-term fixed income securities. Money market instruments may include obligations of governments, government agencies, banks, corporations and special purpose entities and repurchase agreements relating to these obligations. Certain money market instruments may be denominated in a foreign currency.
Cash Equivalents. Cash equivalents are short-term fixed income securities comprising:
(1) Time deposits, certificates of deposit (including marketable variable rate certificates of deposit) and bankers' acceptances issued by a commercial bank or savings and loan association. Time deposits are non-negotiable deposits maintained in a banking institution for a specified period of time at a stated interest rate. Certificates of deposit are negotiable short-term obligations issued by commercial banks or savings and loan associations against funds deposited in the issuing institution. Variable rate certificates of deposit are certificates of deposit on which the interest rate is periodically adjusted prior to their stated maturity based upon a specified market rate. A bankers' acceptance is a time draft drawn on a commercial bank by a borrower, usually in connection with an international commercial transaction (to finance the import, export, transfer or storage of goods).
Each Portfolio may invest in obligations of U.S. banks, foreign branches of U.S. banks (Eurodollars) and U.S. branches of foreign banks (Yankee dollars). Eurodollar and Yankee dollar investments will involve some of the same risks of investing in international securities that are discussed in various foreign investing sections of this SAI.
A Portfolio will not invest in any security issued by a commercial bank unless (i) the bank has total assets of at least $1 billion, or the equivalent in other currencies or, in the case of domestic banks which do not have total assets of at least $1 billion, the aggregate investment made in any one such bank is limited to $250,000 (a temporary increase from $100,000, which is due to expire on December 31, 2009) and the principal amount of such investment is insured in full by the Federal Deposit Insurance Corporation, (ii) in the case of U.S. banks, it is a member of the Federal Deposit Insurance Corporation and (iii) in the case of foreign branches of U.S. banks, the security is deemed by the Adviser to be of an investment quality comparable with other debt securities which the Portfolio may purchase;
(2) Each Portfolio may invest in commercial paper (see below) rated at time of purchase by one or more nationally recognized statistical rating organizations ("NRSROs") in one of their two highest categories (e.g., A-l or A-2 by S&P or Prime 1 or Prime 2 by Moody's) or, if not rated, issued by a corporation having an outstanding unsecured debt issue rated high-grade by an NRSRO (e.g., A or better by Moody's, S&P or Fitch);
(3) Short-term corporate obligations rated high-grade at the time of purchase by an NRSRO (e.g., A or better by Moody's, S&P or Fitch);
(4) U.S. government obligations, including bills, notes, bonds and other debt securities issued by the U.S. Treasury. These are direct obligations of the U.S. Government and differ mainly in interest rates, maturities and dates of issue;
(5) Government agency securities issued or guaranteed by U.S. government sponsored instrumentalities and Federal agencies. These include securities issued by the Federal Home Loan Banks, Federal Land Bank, Farmers Home Administration, Farm Credit Banks, Federal Intermediate Credit Bank, Fannie Mae, Federal Financing Bank, TVA and others; and
(6) Repurchase agreements collateralized by the securities listed above.
Commercial Paper. Commercial paper refers to short-term fixed income securities with maturities ranging from 1 to 270 days. They are primarily issued by corporations needing to finance large amounts of receivables, but may be issued by banks and other borrowers. Commercial paper is issued either directly or through broker-dealers, and may be discounted or interest bearing. Commercial paper is unsecured, but is almost always backed by bank lines of credit. Virtually all commercial paper is rated by Moody's or S&P.
Commercial paper rated A-1 by S&P has the following characteristics: (1) liquidity ratios are adequate to meet cash requirements; (2) long-term senior debt is rated "A" or better; (3) the issuer has access to at least two additional channels of borrowing; (4) basic earnings and cash flow have an upward trend with allowance made for unusual circumstances; (5) typically, the issuer's industry is well established and the issuer has a strong position within the industry; and (6) the reliability and quality of management are unquestioned. Relative strength or weakness of the above factors determine whether the issuer's commercial paper is A-1, A-2 or A-3.
12
The rating Prime-1 is the highest commercial paper rating assigned by Moody's. Among the factors considered by Moody's in assigning ratings are the following: (1) evaluation of the management of the issuer; (2) economic evaluation of the issuer's industry or industries and the appraisal of speculative-type risks which may be inherent in certain areas; (3) evaluation of the issuer's products in relation to competition and customer acceptance; (4) liquidity; (5) amount and quality of long-term debt; (6) trend of earnings over a period of ten years; (7) financial strength of a parent company and the relationships that exist with the issuer; and (8) recognition by the management of obligations which may be present or may arise as a result of public interest questions and preparations to meet such obligations.
Mortgage Related Securities. Mortgage related securities are securities that, directly or indirectly, represent a participation in, or are secured by and payable from, mortgage loans on real property. Mortgage related securities include collateralized mortgage obligations and mortgage-backed securities issued or guaranteed by agencies or instrumentalities of the U.S. Government or by private sector entities.
Mortgage-Backed Securities. With mortgage-backed securities ("MBSs"), many mortgagees' obligations to make monthly payments to their lending institution are pooled together and passed through to investors. The pools are assembled by various governmental, Government-related and private organizations. A Portfolio may invest in securities issued or guaranteed by Ginnie Mae, FHLMC or Fannie Mae, private issuers and other government agencies. MBSs issued by non-agency issuers, whether or not such securities are subject to guarantees, may entail greater risk, since private issuers may not be able to meet their obligations under the policies. If there is no guarantee provided by the issuer, a Portfolio will purchase only MBSs that, at the time of purchase, are rated investment grade by one or more NRSROs or, if unrated, are deemed by the Adviser to be of comparable quality.
MBSs are issued or guaranteed by private sector originators of or investors in mortgage loans and structured similarly to governmental pass-through securities. Because private pass-throughs typically lack a guarantee by an entity having the credit status of a governmental agency or instrumentality, however, they are generally structured with one or more of the types of credit enhancement described below. Fannie Mae and FHLMC obligations are not backed by the full faith and credit of the U.S. Government as GNMA certificates are. FHLMC securities are supported by the FHLMC's right to borrow from the U.S. Treasury. Each of GNMA, Fannie Mae and FHLMC guarantees timely distributions of interest to certificate holders. Each of GNMA and Fannie Mae also guarantees timely distributions of scheduled principal. Although FHLMC has in the past guaranteed only the ultimate collection of principal of the underlying mortgage loan, FHLMC now issues MBSs (FHLMC Gold PCS) that also guarantee timely payment of monthly principal reductions. Resolution Funding Corporation ("REFCORP") obligations are backed, as to principal payments, by zero coupon U.S. Treasury bonds and, as to interest payments, ultimately by the U.S. Treasury.
There are two methods of trading MBSs. A specified pool transaction is a trade in which the pool number of the security to be delivered on the settlement date is known at the time the trade is made. This is in contrast with the typical MBS transaction, called a TBA (To Be Announced) transaction, in which the type of MBS to be delivered is specified at the time of trade but the actual pool numbers of the securities that will be delivered are not known at the time of the trade. The pool numbers of the pools to be delivered at settlement are announced shortly before settlement takes place. The terms of the TBA trade may be made more specific if desired. Generally, agency pass-through MBSs are traded on a TBA basis. See also "Leverage Risk."
Like fixed income securities in general, MBSs will generally decline in price when interest rates rise. Rising interest rates also tend to discourage refinancings of home mortgages, with the result that the average life of MBSs held by a Portfolio may be lengthened. As average life extends, price volatility generally increases. This extension of average life causes the market price of the MBSs to decrease further when interest rates rise than if their average lives were fixed. However, when interest rates fall, mortgages may not enjoy as large a gain in market value due to prepayment risk because additional mortgage prepayments must be reinvested at lower interest rates. Faster prepayment will shorten the average life and slower prepayments will lengthen it. However, it is possible to determine what the range of the average life movement could be and to calculate the effect that it will have on the price of the MBS. In selecting MBSs, the Adviser looks for those that offer a higher yield to compensate for any variation in average maturity. If the underlying mortgage assets experience greater than anticipated prepayments of principal, a Portfolio may fail to fully recoup its initial investment in these securities, even if the security is in one of the highest rating categories. A Portfolio may invest, without limit, in MBSs issued by private issuers when the Adviser deems that the quality of the investment, the quality of the issuer, and market conditions warrant such investments. The Portfolios will purchase securities issued by private issuers that are rated investment grade at the time of purchase by Moody's, Fitch or S&P or are deemed by the Adviser to be of comparable investment quality.
13
Fannie Mae Certificates. Fannie Mae is a federally chartered and privately owned corporation organized and existing under the Federal National Mortgage Association Charter Act of 1938. Each Fannie Mae certificate represents a pro rata interest in one or more pools of mortgage loans insured by the FHA under the Housing Act, or Title V of the Housing Act of 1949 ("FHA Loans"), or guaranteed by the Department of Veteran Affairs under the Servicemen's Readjustment Act of 1944, as amended ("VA Loans") or conventional mortgage loans (i.e., mortgage loans that are not insured or guaranteed by any governmental agency) of the following types: (i) fixed rate level payment mortgage loans; (ii) fixed rate growing equity mortgage loans; (iii) fixed rate graduated payment mortgage loans; (iv) variable rate California mortgage loans; (v) other adjustable rate mortgage loans; and (vi) fixed rate and adjustable mortgage loans secured by multi-family projects.
Freddie Mac Certificates. Freddie Mac is a corporate instrumentality of the United States created pursuant to the Emergency Home Finance Act of 1970, as amended (the "FHLMC Act"). Freddie Mac certificates represent a pro rata interest in a group of mortgage loans (a "Freddie Mac Certificate group") purchased by Freddie Mac. The mortgage loans underlying the Freddie Mac Certificates consist of fixed rate or adjustable rate mortgage loans with original terms to maturity of between ten and thirty years, substantially all of which are secured by first liens on one-to-four-family residential properties or multi-family projects. Each mortgage loan must meet the applicable standards set forth in the FHLMC Act. A Freddie Mac Certificate group may include whole loans, participation interests in whole loans and undivided interests in whole loans and participations comprising another Freddie Mac Certificate group.
In September 2008, the U.S. Treasury Department announced that the government would be taking over Fannie Mae and Freddie Mac and placing the companies into a conservatorship. It is unclear what effect this conservatorship will have on the securities issued or guaranteed by Fannie Mae or Freddie Mac.
Ginnie Mae Certificates. Ginnie Mae is a wholly-owned corporate instrumentality of the United States within the Department of Housing and Urban Development. The National Housing Act of 1934, as amended (the "Housing Act"), authorizes Ginnie Mae to guarantee the timely payment of the principal and interest on certificates that are based on and backed by a pool of FHA Loans, VA Loans or by pools of other eligible mortgage loans. The Housing Act provides that the full faith and credit of the U.S. Government is pledged to the payment of all amounts that may be required to be paid under any guaranty. In order to meet its obligations under such guaranty, Ginnie Mae is authorized to borrow from the U.S. Treasury with no limitations as to amount.
Each Ginnie Mae certificate represents a pro rata interest in one or more of the following types of mortgage loans: (i) fixed rate level payment mortgage loans; (ii) fixed rate graduated payment mortgage loans; (iii) fixed rate growing equity mortgage loans; (iv) fixed rate mortgage loans secured by manufactured (mobile) homes; (v) mortgage loans on multi-family residential properties under construction; (vi) mortgage loans on completed multi-family projects; (vii) fixed rate mortgage loans as to which escrowed funds are used to reduce the borrower's monthly payments during the early years of the mortgage loans ("buydown" mortgage loans); (viii) mortgage loans that provide for adjustments in payments based on periodic changes in interest rates or in other payment terms of the mortgage loans; and (ix) mortgage-backed serial notes. All of these mortgage loans will be FHA Loans or VA loans and, except as otherwise specified above, will be fully-amortizing loans secured by first liens on one to four-family housing units.
Collateralized Mortgage Obligations. Collateralized mortgage obligations ("CMOs") are debt obligations or multiclass pass-through certificates issued by agencies or instrumentalities of the U.S. Government or by private originators or investors in mortgage loans. They are backed by mortgage-backed securities or whole loans (all such assets, the "Mortgage Assets") and are evidenced by a series of bonds or certificates issued in multiple classes. Each class of a CMO, often referred to as a "tranche," may be issued with a specific fixed or floating coupon rate and has a stated maturity or final scheduled distribution date. The principal and interest on the underlying Mortgage Assets may be allocated among the several classes of a series of CMOs in many ways. Interest is paid or accrues on CMOs on a monthly, quarterly or semi-annual basis.
CMOs may be issued by agencies or instrumentalities of the U.S. Government, or by private originators of, or investors in, mortgage loans, including savings and loan associations, mortgage bankers, commercial banks, investment banks and special purpose subsidiaries of the foregoing. CMOs that are issued by private sector entities and are backed by assets lacking a guarantee of an entity having the credit status of a governmental agency or instrumentality are generally structured with one or more types of credit enhancement as described below. An issuer of CMOs may elect to be treated for federal income tax purposes as a Real Estate Mortgage Investment Conduit (a "REMIC"). An issuer of CMOs issued after 1991 must elect to be treated as a REMIC or it will be taxable as a corporation under rules regarding taxable mortgage pools.
14
The principal and interest on the Mortgage Assets may be allocated among the several classes of a CMO in many ways. The general goal in allocating cash flows on Mortgage Assets to the various classes of a CMO is to create certain tranches on which the expected cash flows have a higher degree of predictability than do the underlying Mortgage Assets. As a general matter, the more predictable the cash flow is on a particular CMO tranche, the lower the anticipated yield on that tranche at the time of issue will be relative to prevailing market yields on Mortgage Assets. As part of the process of creating more predictable cash flows on certain tranches of a CMO, one or more tranches generally must be created that absorb most of the changes in the cash flows on the underlying Mortgage Assets. The yields on these tranches are generally higher than prevailing market yields on other mortgage related securities with similar average lives. Principal prepayments on the underlying Mortgage Assets may cause the CMOs to be retired substantially earlier than their stated maturities or final scheduled distribution dates. Because of the uncertainty of the cash flows on these tranches, the market prices and yields of these tranches are more volatile. In addition, some inverse floating rate obligation CMOs exhibit extreme sensitivity to changes in prepayments. As a result, the yield to maturity of these CMOs is sensitive not only to changes in interest rates, but also to changes in prepayment rates on the related underlying Mortgage Assets.
Included within the category of CMOs are PAC Bonds. PAC Bonds are a type of CMO tranche or series designed to provide relatively predictable payments, provided that, among other things, the actual prepayment experience on the underlying Mortgage Assets falls within a predefined range. If the actual prepayment experience on the underlying Mortgage Assets is faster or slower than the predefined range or if deviations from other assumptions occur, payments on the PAC Bond may be earlier or later than predicted and the yield may rise or fall. The magnitude of the predefined range varies from one PAC Bond to another; a narrower range increases the risk that prepayments on the PAC Bond will be greater or smaller than predicted. Because of these features, PAC Bonds generally are less subject to the risk of prepayment than are other types of mortgage related securities.
Stripped Mortgage-Backed Securities. Stripped mortgage-backed securities ("SMBSs") are multi-class mortgage securities issued by agencies or instrumentalities of the U.S. Government and private originators of, or investors in, mortgage loans. SMBSs are usually structured with two classes that receive different proportions of the interest and principal distributions on a pool of Mortgage Assets. In some cases, one class will receive all of the interest ("interest-only" or "IO class"), while the other class will receive all of the principal ("principal-only" or "PO class"). IOs tend to decrease in value substantially if interest rates decline and prepayment rates become more rapid. POs tend to decrease in value substantially if interest rates increase and the rate of repayment decreases. The yield to maturity on IO classes and PO classes is extremely sensitive to the rate of principal payments (including prepayments) on the related underlying Mortgage Assets, and significant changes in the rate of principal repayments will have a corresponding effect on the SMBSs' yield to maturity.
Credit Enhancement. Mortgage related securities are often backed by a pool of assets representing the obligations of a number of parties. To lessen the effect of failure by obligors on underlying assets to make payments, these securities may have various types of credit support. Credit support falls into two primary categories: (i) liquidity protection, and (ii) protection against losses resulting from ultimate default by an obligor on the underlying assets. Liquidity protection generally refers to the provision of advances, typically by the entity administering the pool of assets, to ensure that the pass-through of payments due on the underlying pool occurs in a timely fashion. Protection against losses resulting from ultimate default enhances the likelihood of ultimate payment of the obligations on at least a portion of the assets in the pool. Such protection may be provided through guarantees, insurance policies or letters of credit obtained by the issuer or sponsor from third parties (referred to herein as "third party credit support"), through various means of structuring the transaction or through a combination of such approaches.
The ratings of mortgage related securities for which third party credit enhancement provides liquidity protection or protection against losses from default are generally dependent upon the continued creditworthiness of the provider of the credit enhancement. The ratings of such securities could decline in the event of deterioration in the creditworthiness of the credit enhancement provider even in cases where the delinquency and loss experience on the underlying pool of assets is better than expected.
Examples of credit support arising out of the structure of the transaction include "senior-subordinated securities" (multiple class securities with one or more classes subordinate to other classes as to the payment of principal and interest thereon, with defaults on the underlying assets being borne first by the holders of the most subordinated class), creation of "reserve funds" (where cash or investments, sometimes funded from a portion of the payments on the underlying assets, are held in reserve against future losses) and "over-collateralization" (where the scheduled payments on, or the principal amount of, the underlying assets exceed those required to make payment of the securities and pay any servicing or other fees). The degree of credit support provided for each
15
security is generally based on historical information with respect to the level of credit risk associated with the underlying assets. Delinquency or loss in excess of that which is anticipated could adversely affect the return on an investment in such a security.
Repurchase Agreements. Repurchase agreements are transactions in which a Portfolio purchases a security or basket of securities and simultaneously commits to resell that security or basket to the seller (a bank, broker or dealer) at a mutually agreed upon date and price. The resale price reflects the purchase price plus an agreed upon market rate of interest which is unrelated to the coupon rate or date of maturity of the purchased security. Repurchase agreements may be viewed as a fully collateralized loan of money by the Portfolio to the seller at a mutually agreed upon rate and price. The term of these agreements is usually from overnight to one week, and never exceeds one year. Repurchase agreements with a term of over seven days are considered illiquid.
In these transactions, the Portfolio receives as collateral securities that have a market value at least equal to the purchase price (including accrued interest) of the repurchase agreement, and this value is maintained during the term of the agreement. These securities are held by the Fund's custodian or an approved third party for the benefit of the Portfolio until repurchased. Repurchase agreements permit a Portfolio to remain fully invested while retaining overnight flexibility to pursue investments of a longer-term nature. If the seller defaults and the collateral value declines, the Portfolio might incur a loss. If bankruptcy proceedings are commenced with respect to the seller, the Portfolio's realization upon the collateral may be delayed or limited.
While repurchase agreements involve certain risks not associated with direct investments in debt securities, the Portfolios follow procedures approved by the Directors that are designed to minimize such risks. These procedures include effecting repurchase transactions only with large, well-capitalized and well-established financial institutions whose financial condition will be continually monitored by the Adviser. In addition, as described above, the value of the collateral underlying the repurchase agreement will be at least equal to the repurchase price, including any accrued interest earned on the repurchase agreement. In the event of a default or bankruptcy by a selling financial institution, the Portfolios will seek to liquidate such collateral. However, the exercising of the Portfolio's right to liquidate such collateral could involve certain costs or delays and, to the extent that proceeds from any sale upon a default of the obligation to repurchase were less than the repurchase price, the Portfolio could suffer a loss. In addition, certain Portfolios may invest in repurchase agreements backed by non-governmental collateral; certain Portfolios may invest in repurchase agreements that are backed by money market instruments or high grade corporate bonds entered into only on an overnight basis and only with approved broker-dealers. Such repurchase agreements may be subject to the automatic stay provision of the Bankruptcy Code, and may result in the inability of a Portfolio to immediately liquidate the collateral in the event of default or bankruptcy by the seller.
Pursuant to an order issued by the SEC, the Portfolios may pool their daily uninvested cash balances in order to invest in repurchase agreements on a joint basis with other investment companies advised by the Adviser. By entering into repurchase agreements on a joint basis, the Portfolios expect to incur lower transaction costs and potentially obtain higher rates of interest on such repurchase agreements. Each Portfolio's participation in the income from jointly purchased repurchase agreements will be based on that Portfolio's percentage share in the total repurchase agreement. See also "Leverage Risk."
Municipals. Municipal securities are fixed income securities issued by local, state and regional governments that provide interest income which is exempt from federal income taxes. Municipals include both municipal bonds (those securities with maturities of five years or more) and municipal notes (those with maturities of less than five years). Municipal bonds are issued for a wide variety of reasons: to construct public facilities, such as airports, highways, bridges, schools, hospitals, mass transportation, streets, water and sewer works; to obtain funds for operating expenses; to refund outstanding municipal obligations; and to loan funds to various public institutions and facilities. Certain industrial development bonds are also considered municipal bonds if their interest is exempt from federal income tax. Industrial development bonds are issued by, or on behalf of, public authorities to obtain funds for various privately-operated manufacturing facilities, housing, sports arenas, convention centers, airports, mass transportation systems and water, gas or sewage works. Industrial development bonds are ordinarily dependent on the credit quality of a private user, not the public issuer.
The two principal classifications of municipal bonds are "general obligation" and "revenue" or "special tax" bonds. General obligation bonds are secured by the issuer's pledge of its full faith, credit and taxing power for the payment of principal and interest. Revenue or special tax bonds are payable only from the revenues derived from a particular facility or class of facilities or, in some cases, from the proceeds of a special excise or other tax, but not from general tax revenues.
16
Industrial revenue bonds in most cases are revenue bonds and generally do not have the pledge of the credit of the issuer. The payment of the principal and interest on such industrial revenue bonds is dependent solely on the ability of the user of the facilities financed by the bonds to meet its financial obligations and the pledge, if any, of real and personal property so financed as security for such payment. Short-term municipal obligations issued by states, cities, municipalities or municipal agencies, include tax anticipation notes, revenue anticipation notes, bond anticipation notes, construction loan notes and short-term discount notes.
Municipal notes are issued to meet the short-term funding requirements of local, regional and state governments. Municipal notes include bond anticipation notes, revenue anticipation notes and tax and revenue anticipation notes. These are short-term debt obligations issued by state and local governments to aid cash flows while waiting for taxes or revenue to be collected, at which time the debt is retired. Other types of municipal notes in which the Portfolio may invest are construction loan notes, short-term discount notes, tax-exempt commercial paper, demand notes and similar instruments.
Municipal bonds generally include debt obligations issued by states and their political subdivisions, and duly constituted authorities and corporations, to obtain funds to construct, repair or improve various public facilities such as airports, bridges, highways, hospitals, housing, schools, streets and water and sewer works. Municipal bonds may also be issued to refinance outstanding obligations as well as to obtain funds for general operating expenses and for loans to other public institutions and facilities.
Note obligations with demand or put options may have a stated maturity in excess of one year, but permit any holder to demand payment of principal plus accrued interest upon a specified number of days' notice. Frequently, such obligations are secured by letters of credit or other credit support arrangements provided by banks. The issuer of such notes normally has a corresponding right, after a given period, to repay at its discretion the outstanding principal of the note plus accrued interest upon a specific number of days' notice to the bondholders. The interest rate on a demand note may be based upon a known lending rate, such as the prime lending rate, and be adjusted when such rate changes, or the interest rate on a demand note may be a market rate that is adjusted at specified intervals. Each note purchased by the Portfolios will meet the quality criteria set out in the Prospectus for the Portfolios.
The yields of municipal bonds depend on, among other things, general money market conditions, conditions in the municipal bond market, the size of a particular offering, the maturity of the obligation, and the rating of the issue. The ratings of Moody's and S&P represent their opinions of the quality of the municipal bonds rated by them. It should be emphasized that such ratings are general and are not absolute standards of quality. Consequently, municipal bonds with the same maturity, coupon and rating may have different yields, while municipal bonds of the same maturity and coupon, but with different ratings, may have the same yield. It will be the responsibility of the Adviser to appraise independently the fundamental quality of the bonds held by the Portfolios.
Municipal bonds are sometimes purchased on a "when-issued" or "delayed-delivery" basis, which means the Portfolio has committed to purchase certain specified securities at an agreed upon price when they are issued. The period between commitment date and issuance date can be a month or more. It is possible that the securities will never be issued and the commitment canceled.
From time to time proposals have been introduced before Congress to restrict or eliminate the federal income tax exemption for interest on municipal bonds. Similar proposals may be introduced in the future. If any such proposal were enacted, it might restrict or eliminate the ability of the Portfolios to achieve their investment objectives. In that event, the Fund's Directors and officers would reevaluate investment objectives and policies and consider recommending to shareholders changes in such objectives and policies.
Similarly, from time to time proposals have been introduced before state and local legislatures to restrict or eliminate the state and local income tax exemption for interest on municipal bonds. Similar proposals may be introduced in the future. If any such proposal were enacted, it might restrict or eliminate the ability of a Portfolio to achieve its investment objective. In that event, the Fund's Directors and officers would reevaluate investment objectives and policies and consider recommending to shareholders changes in such investment objectives and policies.
The Portfolios eligible to purchase municipal bonds may also purchase bonds the income on which is subject to the alternative minimum tax ("AMT bonds"). AMT bonds are tax-exempt private activity bonds issued after August 7, 1986, the proceeds of which are directed, at least in part, to private, for-profit organizations. While the income from AMT bonds is exempt from regular federal income tax, it is a tax preference item in the calculation of the alternative minimum tax. The alternative minimum tax is a special separate tax that applies to some taxpayers who have certain adjustments to income or tax preference items.
17
Lease Obligations. Included within the revenue bonds category, as noted above, are participations in lease obligations or installment purchase contracts (hereinafter collectively called "lease obligations") of municipalities. State and local governments, agencies or authorities issue lease obligations to acquire equipment and facilities. Lease obligations may have risks not normally associated with general obligation or other revenue bonds. Leases, and installment purchase or conditional sale contracts (which may provide for title to the leased asset to pass eventually to the issuer), have developed as a means for governmental issuers to acquire property and equipment without the necessity of complying with the constitutional and statutory requirements generally applicable for the issuance of debt. Certain lease obligations contain "non-appropriation" clauses that provide that the governmental issuer has no obligation to make future payments under the lease or contract unless money is appropriated for such purpose by the appropriate legislative body on an annual or other periodic basis. Consequently, continued lease payments on those lease obligations containing "non-appropriation" clauses are dependent on future legislative actions. If such legislative actions do not occur, the holders of the lease obligation may experience difficulty in exercising their rights, including disposition of the property.
In addition, lease obligations represent a relatively new type of financing that has not yet developed the depth of marketability associated with more conventional municipal obligations, and, as a result, certain of such lease obligations may be considered illiquid securities. To determine whether or not a Portfolio will consider such securities to be illiquid (and subject to each Portfolio's limitation on investing in illiquid securities), the Fund's Board of Directors has established guidelines to be utilized by the Portfolios in determining the liquidity of a lease obligation. The factors to be considered in making the determination include 1) the frequency of trades and quoted prices for the obligation; 2) the number of dealers willing to purchase or sell the security and the number of other potential purchasers; 3) the willingness of dealers to undertake to make a market in the security; and 4) the nature of the marketplace trades, including the time needed to dispose of the security, the method of soliciting offers, and the mechanics of the transfer.
Asset-Backed Securities. Asset-backed securities are securities secured by non-mortgage assets such as company receivables, truck and auto loans, leases and credit card receivables. Such securities are generally issued as pass-through certificates, which represent undivided fractional ownership interests in the underlying pools of assets. Such securities also may be debt instruments, which are also known as collateralized obligations and are generally issued as the debt of a special purpose entity, such as a trust, organized solely for the purpose of owning such assets and issuing such debt. Credit support for asset-backed securities may be based on the underlying assets and/or provided by a third party through credit enhancements. Credit enhancement techniques include letters of credit, insurance bonds, limited guarantees (which are generally provided by the issuer), senior-subordinated structures and over-collateralization.
Asset-backed securities are not issued or guaranteed by the U.S. Government or its agencies or instrumentalities; however, the payment of principal and interest on such obligations may be guaranteed up to certain amounts for a certain period by a letter of credit issued by a financial institution (such as a bank or insurance company) unaffiliated with the issuers of such securities. The purchase of asset-backed securities raises risk considerations peculiar to the financing of the instruments underlying such securities. For example, there is a risk that another party could acquire an interest in the obligations superior to that of the holders of the asset-backed securities. There also is the possibility that recoveries on repossessed collateral may not, in some cases, be available to support payments on those securities. Asset-backed securities entail prepayment risk, which may vary depending on the type of asset. Securities subject to prepayment risk generally offer less potential for gains when interest rates decline, and may offer a greater potential for loss when interest rates rise. In addition, rising interest rates may cause prepayments to occur at a slower than expected rate, thereby effectively lengthening the maturity of the security and making the security more sensitive to interest rate changes. In selecting these securities, the Adviser will look for those securities that offer a higher yield to compensate for any variation in average maturity.
There may be a limited secondary market for certain of the asset-backed securities in which the Portfolios invest. Asset-backed securities also involve the risk that various federal and state consumer laws and other legal, regulatory and economic factors may result in the collateral backing the securities being insufficient to support payment on the securities.
Loan Participations and Assignments. Loan participations are interests in loans or other direct debt instruments ("Loans") relating to amounts owed by a corporate, governmental or other borrower to another party. Loans may represent amounts owed to lenders or lending syndicates, to suppliers of goods or services (trade claims or other receivables), or to other parties ("Lenders") and may be fixed rate or floating rate. Loans also may be arranged through private negotiations between an issuer of sovereign debt obligations and Lenders.
18
A Portfolio's investments in Loans may be in the form of a participation in Loans ("Participations") and assignments of all or a portion of Loans ("Assignments") from third parties. In the case of a Participation, a Portfolio will have the right to receive payments of principal, interest and any fees to which it is entitled only from the Lender selling the Participation and only upon receipt by the Lender of the payments from the borrower. In the event of an insolvency of the Lender selling a Participation, a Portfolio may be treated as a general creditor of the Lender and may not benefit from any set-off between the Lender and the borrower. Certain Participations may be structured in a manner designed to avoid purchasers of Participations being subject to the credit risk of the Lender with respect to the Participation. Even under such a structure, in the event of a Lender's insolvency, the Lender's servicing of the Participation may be delayed and the assignability of the Participation may be impaired. A Portfolio will acquire Participations only if the Lender interpositioned between a Portfolio and the borrower is determined by the Adviser to be creditworthy.
When a Portfolio purchases Assignments from Lenders it will acquire direct rights against the borrower on the Loan. However, because Assignments are arranged through private negotiations between potential assignees and potential assignors, the rights and obligations acquired by a Portfolio as the purchaser of an Assignment may differ from, and be more limited than, those held by the assigning Lender. Because there is no liquid market for Loan Participations and Assignments, it is likely that such securities could be sold only to a limited number of institutional investors. The lack of a liquid secondary market may have an adverse impact on the value of such securities and a Portfolio's ability to dispose of particular Assignments or Participations when necessary to meet a Portfolio's liquidity needs or in response to a specific economic event, such as a deterioration in the creditworthiness of the borrower. The lack of a liquid secondary market for Loan Participations and Assignments also may make it more difficult for a Portfolio to assign a value to these securities for purposes of valuing a Portfolio's securities and calculating its net asset value.
Loan Participations and Assignments involve a risk of loss in case of default or insolvency of the borrower. In addition, they may offer less legal protection to a Portfolio in the event of fraud or misrepresentation and may involve a risk of insolvency of the Lender. Certain Loan Participations and Assignments may also include standby financing commitments that obligate the investing Portfolio to supply additional cash to the borrower on demand. Participations involving emerging market country issuers may relate to Loans as to which there has been or currently exists an event of default or other failure to make payment when due, and may represent amounts owed to Lenders that are themselves subject to political and economic risks, including the risk of currency devaluation, expropriation, or failure. Such Loan Participations and Assignments present additional risk of default or loss.
Temporary Investments. When the Adviser believes that changes in economic, financial or political conditions make it advisable, each Portfolio may invest up to 100% of its assets in cash and certain short- and medium-term fixed income securities for temporary defensive purposes. These temporary investments may consist of obligations of the U.S. or foreign governments, their agencies or instrumentalities; money market instruments; and instruments issued by international development agencies.
Zero Coupons, Pay-In-Kind Securities or Deferred Payment Securities. Zero coupon, pay-in-kind and deferred payment securities are all types of fixed income securities on which the holder does not receive periodic cash payments of interest or principal. Generally, these securities are subject to greater price volatility and lesser liquidity in the event of adverse market conditions than comparably rated securities paying cash interest at regular intervals. Although a Portfolio will not receive cash periodic coupon payments on these securities, the Portfolio may be deemed to have received interest income, or "phantom income" during the life of the obligation. The Portfolio may have to pay taxes on this phantom income, although it has not received any cash payment.
Zero Coupons. Zero coupons are fixed income securities that do not make regular interest payments. Instead, zero coupons are sold at a discount from their face value. The difference between a zero coupon's issue or purchase price and its face value represents the imputed interest an investor will earn if the obligation is held until maturity. For tax purposes, a portion of this imputed interest is deemed as income received by zero coupon bondholders each year. Each Portfolio intends to pass along such interest as a component of the Portfolio's distributions of net investment income.
Zero coupons may offer investors the opportunity to earn a higher yield than that available on ordinary interest-paying obligations of similar credit quality and maturity. However, zero coupon prices may also exhibit greater price volatility than ordinary fixed income securities because of the manner in which their principal and interest are returned to the investor. Zero coupon treasury bonds are sold under a variety of different names, including Certificate of Accrual on Treasury Securities ("CATS"), Treasury Receipts ("TRS"), Separate Trading of Registered Interest and Principal of Securities ("STRIPS") and Treasury Investment Growth Receipts ("TIGERS").
19
Pay-In-Kind Securities. Pay-in-kind securities are securities that have interest payable by delivery of additional securities. Upon maturity, the holder is entitled to receive the aggregate par value of the securities.
Deferred Payment Securities. Deferred payment securities are securities that remain zero coupons until a predetermined date, at which time the stated coupon rate becomes effective and interest becomes payable at regular intervals.
Floaters. Floaters are fixed income securities with a rate of interest that varies with changes in specified market rates or indices, such as the prime rate, or at specified intervals. Certain floating or variable rate obligations may carry a demand feature that permits the holder to tender them back to the issuer of the underlying instrument, or to a third party, at par value prior to maturity. When the demand feature of certain floating or variable rate obligations represents an obligation of a foreign entity, the demand feature will be subject to certain risks discussed under "Foreign Investment."
Inverse Floaters. Inverse floating rate obligations ("inverse floaters") are fixed income securities that have coupon rates that vary inversely at a multiple of a designated floating rate, such as LIBOR (London Inter-Bank Offered Rate). Any rise in the reference rate of an inverse floater (as a consequence of an increase in interest rates) causes a drop in the coupon rate while any drop in the reference rate of an inverse floater causes an increase in the coupon rate. Inverse floaters may exhibit substantially greater price volatility than fixed rate obligations having similar credit quality, redemption provisions and maturity, and inverse floater CMOs exhibit greater price volatility than the majority of other mortgage-related securities. Some inverse floater CMOs are extremely sensitive to changes in prepayments. As a result, the yield to maturity of an inverse floater CMO is sensitive not only to changes in interest rates, but also to changes in prepayment rates on the related underlying mortgage assets.
Eurodollar and Yankee Dollar Obligations. Eurodollar and Yankee dollar obligations are fixed income securities that include time deposits, which are non-negotiable deposits maintained in a bank for a specified period of time at a stated interest rate. The Eurodollar obligations may include bonds issued and denominated in euros (the new currency implemented on January 1, 1999 by the countries participating in the EMU). Eurodollar obligations may be issued by government and corporate issuers in Europe. Yankee bank obligations, which include time deposits and certificates of deposit, are U.S. dollar-denominated obligations issued in the U.S. capital markets by foreign banks. Eurodollar bank obligations, which include time deposits and certificates of deposit, are U.S. dollar-denominated obligations issued outside the U.S. capital markets by foreign branches of U.S. banks and by foreign banks. The Portfolios may consider Yankee dollar obligations to be domestic securities for purposes of their investment policies.
Eurodollar and Yankee dollar obligations are subject to the same risks as domestic issues, notably credit risk, market risk and liquidity risk. However, Eurodollar (and to a limited extent, Yankee dollar) obligations are also subject to certain sovereign risks. One such risk is the possibility that a sovereign country might prevent capital from flowing across its borders. Other risks include adverse political and economic developments; the extent and quality of government regulations of financial markets and institutions; the imposition of foreign withholding taxes; and the expropriation or nationalization of foreign issuers.
FOREIGN INVESTMENT
Investing in foreign securities involves certain special considerations which are not typically associated with investments in the securities of U.S. issuers. Foreign issuers are not generally subject to uniform accounting, auditing and financial reporting standards and may have policies that are not comparable to those of domestic issuers. As a result, there may be less information available about foreign issuers than about domestic issuers. Securities of some foreign issuers may be less liquid and more volatile than securities of comparable domestic issuers. There is generally less government supervision and regulation of stock exchanges, brokers and listed issuers than in the United States. In addition, with respect to certain foreign countries, there is a possibility of expropriation or confiscatory taxation, political and social instability, or diplomatic developments which could affect U.S. investments in those countries. The costs of investing in foreign countries frequently are higher than the costs of investing in the United States. Although the Adviser endeavors to achieve the most favorable execution costs in portfolio transactions, fixed commissions on many foreign stock exchanges are generally higher than negotiated commissions on U.S. exchanges.
Investments in securities of foreign issuers may be denominated in foreign currencies. Accordingly, the value of a Portfolio's assets, as measured in U.S. dollars, may be affected favorably or unfavorably by changes in currency
20
exchange rates and in exchange control regulations. A Portfolio may incur costs in connection with conversions between various currencies.
Certain foreign governments may levy withholding or other taxes on dividend and interest income. Although in some countries a portion of these taxes may be recoverable, the non-recovered portion of foreign withholding taxes will reduce the income received from investments in such countries. The Portfolios may be able to claim a credit for U.S. tax purposes with respect to any such foreign taxes.
The Adviser may consider an issuer to be from a particular country (including the United States) or geographic region if (i) its principal securities trading market is in that country or geographic region; (ii) alone or on a consolidated basis it derives 50% or more of its annual revenue from goods produced, sales made or services performed in that country or geographic region; or (iii) it is organized under the laws of, or has a principal office in, that country or geographic region. By applying these tests, it is possible that a particular issuer could be deemed to be from more than one country or geographic region.
Foreign Equity Securities. Foreign equity securities are equity securities of a non-U.S. issuer.
Foreign Government Fixed Income Securities. Foreign government fixed income securities are fixed income securities issued by a government other than the U.S. government or government-related issuer in a country other than the United States.
Foreign Corporate Fixed Income Securities. Foreign corporate fixed income securities are fixed income securities issued by a private issuer in a country other than the United States.
Emerging Market Securities. An emerging market security is one issued by a foreign government or private issuer that has one or more of the following characteristics: (i) its principal securities trading market is in an emerging market or developing country, (ii) alone or on a consolidated basis it derives 50% or more of its annual revenue from goods produced, sales made or services performed in emerging markets or (iii) it is organized under the laws of, or has a principal office in, an emerging market or developing country. Based on these criteria it is possible for a security to be considered issued by an issuer in more than one country. Therefore, it is possible for the securities of any issuer that has one or more of these characteristics in connection with any emerging market or developing country not to be considered an emerging market security if it has one or more of these characteristics in connection with a developed country.
Emerging market describes any country which is generally considered to be an emerging or developing country by major organizations in the international financial community, such as the International Bank for Reconstruction and Development (more commonly known as the World Bank) and the International Finance Corporation. Emerging markets can include every nation in the world except the United States, Canada, Japan, Australia, New Zealand and most nations located in Western Europe.
The economies of individual emerging market or developing countries may differ favorably or unfavorably from the U.S. economy in such respects as growth of gross domestic product, rate of inflation, currency depreciation, capital reinvestment, resource self-sufficiency and balance of payments position. Further, the economies of developing countries generally are heavily dependent upon international trade and, accordingly, have been, and may continue to be, adversely affected by trade barriers, exchange controls, managed adjustments in relative currency values and other protectionist measures. These economies also have been, and may continue to be, adversely affected by economic conditions in the countries with which they trade.
Prior governmental approval for foreign investments may be required under certain circumstances in some emerging market or developing countries, and the extent of foreign investment in certain fixed income securities and domestic companies may be subject to limitation in other emerging market or developing countries. Foreign ownership limitations also may be imposed by the charters of individual companies in emerging market or developing countries to prevent, among other concerns, violation of foreign investment limitations. Repatriation of investment income, capital and the proceeds of sales by foreign investors may require governmental registration and/or approval in some emerging countries. A Portfolio could be adversely affected by delays in, or a refusal to grant, any required governmental registration or approval for such repatriation. Any investment subject to such repatriation controls will be considered illiquid if it appears reasonably likely that this process will take more than seven days.
21
Investment in emerging market or developing countries may entail purchasing securities issued by or on behalf of entities that are insolvent, bankrupt, in default or otherwise engaged in an attempt to reorganize or reschedule their obligations and in entities that have little or no proven credit rating or credit history. In any such case, the issuer's poor or deteriorating financial condition may increase the likelihood that the Portfolio will experience losses or diminution in available gains due to bankruptcy, insolvency or fraud. Emerging market or developing countries also pose the risk of nationalization, expropriation or confiscatory taxation, political changes, government regulation, social instability or diplomatic developments (including war) that could adversely affect the economies of such countries or the value of a Portfolio's investments in those countries. In addition, it may be difficult to obtain and enforce a judgment in a court outside the United States.
The Portfolios that invest in emerging markets may also be exposed to an extra degree of custodial and/or market risk, especially where the securities purchased are not traded on an official exchange or where ownership records regarding the securities are maintained by an unregulated entity (or even the issuer itself).
Foreign Currency Transactions. The U.S. dollar value of the assets of the Portfolios, to the extent they invest in securities denominated in foreign currencies, may be affected favorably or unfavorably by changes in foreign currency exchange rates and exchange control regulations, and the Portfolios may incur costs in connection with conversions between various currencies. The Portfolios may conduct their foreign currency exchange transactions on a spot (i.e., cash) basis at the spot rate prevailing in the foreign currency exchange market. The Portfolios also may manage their foreign currency transactions by entering into forward foreign currency exchange contracts to purchase or sell foreign currencies or by using other instruments and techniques described under "Derivatives" below.
Under normal circumstances, consideration of the prospect for changes in the values of currency will be incorporated into the long-term investment decisions made with regard to overall diversification strategies. However, the Adviser believes that it is important to have the flexibility to use such derivative products when it determines that it is in the best interests of a Portfolio. It may not be practicable to hedge foreign currency risk in all markets, particularly emerging markets.
Foreign Currency Warrants. Portfolios may invest in foreign currency warrants, which entitle the holder to receive from the issuer an amount of cash (generally, for warrants issued in the United States, in U.S. dollars) which is calculated pursuant to a predetermined formula and based on the exchange rate between a specified foreign currency and the U.S. dollar as of the exercise date of the warrant. Foreign currency warrants generally are exercisable upon their issuance and expire as of a specified date and time.
Foreign currency warrants have been issued in connection with U.S. dollar-denominated debt offerings by major corporate issuers in an attempt to reduce the foreign currency exchange risk which, from the point of view of prospective purchasers of the securities, is inherent in the international fixed income marketplace. Foreign currency warrants may attempt to reduce the foreign exchange risk assumed by purchasers of a security by, for example, providing for a supplemental payment in the event that the U.S. dollar depreciates against the value of a major foreign currency such as the Japanese Yen. The formula used to determine the amount payable upon exercise of a foreign currency warrant may make the warrant worthless unless the applicable foreign currency exchange rate moves in a particular direction (e.g., unless the U.S. dollar appreciates or depreciates against the particular foreign currency to which the warrant is linked or indexed). Foreign currency warrants are severable from the debt obligations with which they may be offered, and may be listed on exchanges.
Foreign currency warrants may be exercisable only in certain minimum amounts, and an investor wishing to exercise warrants who possesses less than the minimum number required for exercise may be required either to sell the warrants or to purchase additional warrants, thereby incurring additional transaction costs. In the case of any exercise of warrants, there may be a delay between the time a holder of warrants gives instructions to exercise and the time the exchange rate relating to exercise is determined, during which time the exchange rate could change significantly, thereby affecting both the market and cash settlement values of the warrants being exercised. The expiration date of the warrants may be accelerated if the warrants should be delisted from an exchange or if their trading should be suspended permanently, which would result in the loss of any remaining "time value" of the warrants (i.e., the difference between the current market value and the exercise value of the warrants), and, in the case where the warrants were "out-of-the-money," in a total loss of the purchase price of the warrants.
Foreign currency warrants are generally unsecured obligations of their issuers and are not standardized foreign currency options issued by the Options Clearing Corporation ("OCC"). Unlike foreign currency options issued by the OCC, the terms of foreign exchange warrants generally will not be amended in the event of governmental or regulatory actions affecting exchange rates or in the event of the imposition of other regulatory
22
controls affecting the international currency markets. The initial public offering price of foreign currency warrants is generally considerably in excess of the price that a commercial user of foreign currencies might pay in the interbank market for a comparable option involving significantly larger amounts of foreign currencies. Foreign currency warrants are subject to complex political or economic factors.
Principal Exchange Rate Linked Securities. Principal exchange rate linked securities are debt obligations the principal on which is payable at maturity in an amount that may vary based on the exchange rate between the U.S. dollar and a particular foreign currency at or about that time. The return on "standard" principal exchange rate linked securities is enhanced if the foreign currency to which the security is linked appreciates against the U.S. dollar, and is adversely affected by increases in the foreign exchange value of the U.S. dollar; "reverse" principal exchange rate linked securities are like the "standard" securities, except that their return is enhanced by increases in the value of the U.S. dollar and adversely impacted by increases in the value of foreign currency. Interest payments on the securities are generally made in U.S. dollars at rates that reflect the degree of foreign currency risk assumed or given up by the purchaser of the notes (i.e., at relatively higher interest rates if the purchaser has assumed some foreign currency risk).
Brady Bonds. Brady Bonds are fixed income securities that are created through the exchange of existing commercial bank loans to foreign entities for new obligations in connection with debt restructuring under a plan introduced by Nicholas F. Brady when he was the U.S. Secretary of the Treasury. They may be collateralized or uncollateralized and issued in various currencies (although most are U.S. dollar-denominated) and they are actively traded in the over-the-counter secondary market. A Portfolio will invest in Brady Bonds only if they are consistent with the Portfolio's quality specifications. Dollar-denominated, collateralized Brady Bonds may be fixed rate par bonds or floating rate discount bonds. Interest payments on Brady Bonds generally are collateralized by cash or securities in an amount that, in the case of fixed rate bonds, is equal to at least one year of rolling interest payments or, in the case of floating rate bonds, initially is equal to at least one year's rolling interest payments based on the applicable interest rate at that time and is adjusted at regular intervals thereafter. Certain Brady Bonds are entitled to "value recovery payments" in certain circumstances, which in effect constitute supplemental interest payments but generally are not collateralized.
Brady Bonds are often viewed as having three or four valuation components: (i) the collateralized repayment of principal at final maturity; (ii) the collateralized interest payments; (iii) the uncollateralized interest payments; and (iv) any uncollateralized repayment of principal at maturity (these uncollateralized amounts constitute the "residual risk"). In the event of a default with respect to collateralized Brady Bonds as a result of which the payment obligations of the issuer are accelerated, the U.S. Treasury zero coupon obligations held as collateral for the payment of principal will not be distributed to investors, nor will such obligations be sold and the proceeds distributed. The collateral will be held by the collateral agent to the scheduled maturity of the defaulted Brady Bonds, which will continue to be outstanding, at which time the face amount of the collateral will equal the principal payments due on the Brady Bonds in the normal course. However, Brady Bonds should be viewed as speculative in light of the history of defaults with respect to commercial bank loans by public and private entities of countries issuing Brady Bonds.
Investment Funds. Some emerging market countries have laws and regulations that currently preclude direct investment or make it undesirable to invest directly in the securities of their companies. However, indirect investment in the securities of companies listed and traded on the stock exchanges in these countries is permitted by certain emerging market countries through investment funds that have been specifically authorized. A Portfolio may invest in these investment funds subject to the provisions of the 1940 Act, as applicable, and other applicable laws.
OTHER SECURITIES AND INVESTMENT STRATEGIES
Loans of Portfolio Securities. Each Portfolio may lend its portfolio securities to brokers, dealers, banks and other institutional investors. By lending its portfolio securities, a Portfolio attempts to increase its net investment income through the receipt of interest on the cash collateral with respect to the loan or fees received from the borrower in connection with the loan. Any gain or loss in the market price of the securities loaned that might occur during the term of the loan would be for the account of the Portfolio. The Portfolios employ an agent to implement the securities lending program and the agent receives a fee from the Portfolios for its services. A Portfolio will not lend more than 331/3% of the value of its total assets.
Each Portfolio may lend its portfolio securities so long as the terms, structure and the aggregate amount of such loans are not inconsistent with the 1940 Act or the rules and regulations or interpretations of the SEC thereunder, which currently require that (i) the borrower pledge and maintain with the Portfolio collateral
23
consisting of liquid, unencumbered assets having a value at all times not less than 100% of the value of the securities loaned; (ii) the borrower add to such collateral whenever the price of the securities loaned rises (i.e., the borrower "marks to market" on a daily basis); (iii) the loan be made subject to termination by the Portfolio at any time; and (iv) the Portfolio receives a reasonable return on the loan (which may include the Portfolio investing any cash collateral in interest bearing short-term investments), any distributions on the loaned securities and any increase in their market value. In addition, voting rights may pass with the loaned securities, but the Portfolio will retain the right to call any security in anticipation of a vote that the Adviser deems material to the security on loan.
There may be risks of delay and costs involved in recovery of securities or even loss of rights in the collateral should the borrower of the securities fail financially. These delays and costs could be greater for foreign securities. However, loans will be made only to borrowers deemed by the Adviser to be creditworthy and when, in the judgment of the Adviser, the income which can be earned from such securities loans justifies the attendant risk. All relevant facts and circumstances, including the creditworthiness of the broker, dealer, bank or institution, will be considered in making decisions with respect to the lending of securities, subject to review by the Fund's Board of Directors. Each Portfolio loaning securities also bears the risk that the reinvestment of collateral will result in a principal loss. Finally, there is the risk that the price of the securities will increase while they are on loan and the collateral will not be adequate to cover their value.
Non-Publicly Traded Securities, Private Placements and Restricted Securities. The Portfolios may invest in securities that are neither listed on a stock exchange nor traded over-the-counter, including privately placed and restricted securities. Such unlisted securities may involve a higher degree of business and financial risk that can result in substantial losses. As a result of the absence of a public trading market for these securities, they may be less liquid than publicly traded securities. Although these securities may be resold in privately negotiated transactions, the prices realized from these sales could be less than those originally paid by the Portfolio or less than what may be considered the fair value of such securities. Furthermore, companies whose securities are not publicly traded may not be subject to the disclosure and other investor protection requirements which might be applicable if their securities were publicly traded. If such securities are required to be registered under the securities laws of one or more jurisdictions before being sold, a Portfolio may be required to bear the expenses of registration.
As a general matter, a Portfolio may not invest more than 15% of its net assets in illiquid securities, such as securities for which there is not a readily available secondary market or securities that are restricted from sale to the public without registration. However, certain Restricted Securities can be offered and sold to qualified institutional buyers under Rule 144A under the Securities Act of 1933, as amended (the "1933 Act") ("Rule 144A Securities"), and may be deemed to be liquid under guidelines adopted by the Fund's Board of Directors. The Portfolios may invest without limit in liquid Rule 144A Securities. Rule 144A Securities may become illiquid if qualified institutional buyers are not interested in acquiring the securities.
The Portfolios may purchase equity securities in a private placement that are issued by issuers who have outstanding, publicly-traded equity securities of the same class ("private investments in public equity" or "PIPES"). Shares in PIPES generally are not registered with the SEC until after a certain time period from the date the private sale is completed. This restricted period can last many months. Until the public registration process is completed, PIPES are restricted as to resale and the Portfolios cannot freely trade the securities. Generally, such restrictions cause the PIPES to be illiquid during this time. PIPES may contain provisions that the issuer will pay specified financial penalties to the holder if the issuer does not publicly register the restricted equity securities within a specified period of time, but there is no assurance that the restricted equity securities will be publicly registered, or that the registration will remain in effect.
When-Issued and Delayed Delivery Securities. From time to time, the Portfolios may purchase securities on a when-issued or delayed delivery basis or may purchase or sell securities on a forward commitment basis. When these transactions are negotiated, the price is fixed at the time of the commitment, but delivery and payment can take place a month or more after the date of commitment. The Portfolios may sell the securities before the settlement date, if it is deemed advisable. The securities so purchased or sold are subject to market fluctuation and no interest or dividends accrue to the purchaser prior to the settlement date.
At the time a Portfolio makes the commitment to purchase or sell securities on a when-issued, delayed delivery or forward commitment basis, it will record the transaction and thereafter reflect the value, each day, of such security purchased, or if a sale, the proceeds to be received, in determining its net asset value. At the time of delivery of the securities, their value may be more or less than the purchase or sale price. An increase in the percentage of a Portfolio's assets committed to the purchase of securities on a when-issued, delayed delivery or forward commitment
24
basis may increase the volatility of its net asset value. Each Portfolio will also earmark cash or liquid assets or establish a segregated account on the Portfolio's books in which it will continually maintain cash or cash equivalents or other liquid portfolio securities equal in value to commitments to purchase securities on a when-issued, delayed delivery or forward commitment basis. See "Leverage Risk" for a description of leverage risk.
Borrowing for Investment Purposes. Borrowing for investment purposes creates leverage which is a speculative characteristic. Portfolios authorized to borrow will do so only when the Adviser believes that borrowing will benefit the Portfolio after taking into account considerations such as the costs of borrowing and the likely investment returns on securities purchased with borrowed funds. Borrowing by a Portfolio will create the opportunity for increased net income but, at the same time, will involve special risk considerations. Leverage that results from borrowing will magnify declines as well as increases in a Portfolio's net asset value per share and net yield. Each Portfolio that engages in borrowing expects that all of its borrowing will be made on a secured basis. The Portfolio will either segregate the assets securing the borrowing for the benefit of the lenders or arrangements will be made with a suitable sub-custodian. If assets used to secure the borrowing decrease in value, a Portfolio may be required to pledge additional collateral to the lender in the form of cash or securities to avoid liquidation of those assets.
Temporary Borrowing. Each Portfolio is permitted to borrow from banks in an amount up to 10% of its total assets for extraordinary or emergency purposes, except that the Emerging Markets Debt Portfolio may borrow in accordance with fundamental investment limitation number (5) below. For example, the Portfolios may borrow for temporary defensive purposes or to meet shareholder redemptions when the Adviser believes that it would not be in the best interests of a Portfolio to liquidate portfolio holdings. Each Portfolio (other than the Emerging Markets Debt Portfolio) will not purchase additional securities while temporary borrowings exceed 5% of its total assets.
The Board of Directors of the Fund has approved procedures whereby the Portfolios together with other investment companies advised by the Adviser or its affiliates may enter into a joint line of credit arrangement with a bank. Each Portfolio would be liable only for its own temporary borrowings under the joint line of credit arrangements.
Leverage Risk. Certain transactions may give rise to a form of leverage. To mitigate leveraging risk, the Portfolios will earmark liquid assets or establish a segregated account or otherwise cover the transactions that may give rise to such risk. The use of leverage may cause a Portfolio to liquidate portfolio positions when it may not be advantageous to do so to satisfy its obligations or to meet earmarking requirements. Leverage, including borrowing, may cause a Portfolio to be more volatile than if the Portfolio had not been leveraged. This is because leverage tends to exaggerate the effect of any increase or decrease in the value of the Portfolio's portfolio securities.
Reverse Repurchase Agreements. Under a reverse repurchase agreement, a Portfolio sells a security and promises to repurchase that security at an agreed upon future date and price. The price paid to repurchase the security reflects interest accrued during the term of the agreement. The Portfolio will earmark cash or liquid assets or establish a segregated account holding cash and other liquid assets in an amount not less than the purchase obligations of the agreement. Reverse repurchase agreements may be viewed as a speculative form of borrowing called leveraging. A Portfolio may invest in reverse repurchase agreements if (i) interest earned from leveraging exceeds the interest expense of the original reverse repurchase transaction and (ii) proceeds from the transaction are not invested for longer than the term of the reverse repurchase agreement.
Short Sales. A short sale is a transaction in which a Portfolio sells securities that it owns or has the right to acquire at no added cost (i.e., "against the box") or does not own (but has borrowed) in anticipation of a decline in the market price of the securities. To deliver the securities to the buyer, the Portfolio arranges through a broker to borrow the securities and, in so doing, the Portfolio becomes obligated to replace the securities borrowed at their market price at the time of replacement. When selling short, the Portfolio intends to replace the securities at a lower price and therefore, profit from the difference between the cost to replace the securities and the proceeds received from the sale of the securities. When the Portfolio makes a short sale, the proceeds it receives from the sale will be held on behalf of a broker until the Portfolio replaces the borrowed securities. The Portfolio may have to pay a premium to borrow the securities and must pay any dividends or interest payable on the securities until they are replaced.
The Portfolio's obligation to replace the securities borrowed in connection with a short sale will be secured by collateral deposited with the broker that consists of cash or other liquid securities. In addition, the Portfolio will earmark cash or liquid assets or place in a segregated account an amount of cash or other liquid assets equal to the difference, if any, between (i) the current market value of the securities sold at the time they were sold short, and (ii) any cash or other liquid securities deposited as collateral with the broker in connection with the short sale. This
25
amount will be adjusted daily to reflect changes in the value of the securities sold short. A Portfolio also can cover its obligations by owning another security (such as a call option) giving it the right to obtain the same kind and amount of the security it sold short. Short sales by the Portfolio involve certain risks and special considerations. If the Adviser incorrectly predicts that the price of the borrowed security will decline, the Portfolio will have to replace the securities with securities with a greater value than the amount received from the sale. As a result, losses from short sales differ from losses that could be incurred from a purchase of a security, because losses from short sales may be unlimited, whereas losses from purchases can equal only the total amount invested.
Structured Products. Each Portfolio may invest a portion of its assets in structured investments, structured notes and other types of similarly structured products consistent with each Portfolio's investment objectives and policies. Structured investments are securities that are convertible into, or the value of which is based upon the value of, other fixed income or equity securities or indices upon certain terms and conditions. The amount a Portfolio receives when it sells a structured investment or at maturity of a structured investment is not fixed, but is based on the price of the underlying security or index. Particular structured investments may be designed so that they move in conjunction with or differently from their underlying security or index in terms of price and volatility. It is impossible to predict whether the underlying index or price of the underlying security will rise or fall, but prices of the underlying indices and securities (and, therefore, the prices of structured investments) will be influenced by the same types of political and economic events that affect particular issuers of fixed income and equity securities and capital markets generally. Structured investments also may trade differently from their underlying securities. Structured investments generally trade on the secondary market, which is fairly developed and liquid. However, the market for such securities may be shallow compared to the market for the underlying securities or the underlying index. Accordingly, periods of high market volatility may affect the liquidity of structured investments, making high volume trades possible only with discounting.
Structured investments are a relatively new innovation and may be designed to have various combinations of equity and fixed income characteristics. The following sections describe four of the more common types of structured investments that each Portfolio may invest in. The Portfolios may invest in other structured investments, including those that may be developed in the future, to the extent that the structured investments are otherwise consistent with a Portfolio's investment objective and policies.
PERCS. Preferred Equity Redemption Cumulative Stock ("PERCS") technically is preferred stock with some characteristics of common stock. PERCS are mandatorily convertible into common stock after a period of time, usually three years, during which the investors' capital gains are capped, usually at 30%. Commonly, PERCS may be redeemed by the issuer at any time or if the issuer's common stock is trading at a specified price level or better. The redemption price starts at the beginning of the PERCS duration period at a price that is above the cap by the amount of the extra dividends the PERCS holder is entitled to receive relative to the common stock over the duration of the PERCS and declines to the cap price shortly before maturity of the PERCS. In exchange for having the cap on capital gains and giving the issuer the option to redeem the PERCS at any time or at the specified common stock price level, a Portfolio may be compensated with a substantially higher dividend yield than that on the underlying common stock. Investors that seek current income find PERCS attractive because PERCS provide a high dividend income than that paid with respect to a company's common stock.
ELKS. Equity-Linked Securities ("ELKS") differ from ordinary debt securities, in that the principal amount received at maturity is not fixed but is based on the price of the issuer's common stock. ELKS are debt securities commonly issued in fully registered form for a term of three years under an indenture trust. At maturity, the holder of ELKS will be entitled to receive a principal amount equal to the lesser of a cap amount, commonly in the range of 30% to 55% greater than the current price of the issuer's common stock, or the average closing price per share of the issuer's common stock, subject to adjustment as a result of certain dilution events, for the 10 trading days immediately prior to maturity. Unlike PERCS, ELKS are commonly not subject to redemption prior to maturity. ELKS usually bear interest during the three-year term at a substantially higher rate than the dividend yield on the underlying common stock. In exchange for having the cap on the return that might have been received as capital gains on the underlying common stock, a Portfolio may be compensated with the higher yield, contingent on how well the underlying common stock does. Investors that seek current income, find ELKS attractive because ELKS provide a higher dividend income than that paid with respect to a company's common stock. The return on ELKS depends on the creditworthiness of the issuer of the securities, which may be the issuer of the underlying securities or a third party investment banker or other lender. The creditworthiness of such third party issuer of ELKS may, and often does, exceed the creditworthiness of the issuer of the underlying securities. The advantage of using ELKS over traditional equity and debt securities is that the former are income producing vehicles that may provide a higher income than the dividend income on the underlying equity securities while allowing some participation in
26
the capital appreciation of the underlying equity securities. Another advantage of using ELKS is that they may be used for hedging to reduce the risk of investing in the generally more volatile underlying equity securities.
LYONs. Liquid Yield Option Notes ("LYONs") differ from ordinary debt securities, in that the amount received prior to maturity is not fixed but is based on the price of the issuer's common stock. LYONs are zero-coupon notes that sell at a large discount from face value. For an investment in LYONs, the Portfolio will not receive any interest payments until the notes mature, typically in 15 to 20 years, when the notes are redeemed at face, or par, value. The yield on LYONs, typically, is lower-than-market rate for debt securities of the same maturity, due in part to the fact that the LYONs are convertible into common stock of the issuer at any time at the option of the holder of the LYONs. Commonly, the LYONs are redeemable by the issuer at any time after an initial period or if the issuer's common stock is trading at a specified price level or better or, at the option of the holder, upon certain fixed dates. The redemption price typically is the purchase price of the LYONs plus accrued original issue discount to the date of redemption, which amounts to the lower-than-market yield. A Portfolio will receive only the lower-than-market yield unless the underlying common stock increases in value at a substantial rate. LYONs are attractive to investors when it appears that they will increase in value due to the rise in value of the underlying common stock.
Structured Notes. Structured notes are derivative securities for which the amount of principal repayment and/or interest payments is based upon the movement of one or more "factors." These factors include, but are not limited to, currency exchange rates, interest rates (such as the prime lending rate and LIBOR), referenced bonds and stock indices, such as the S&P 500. In some cases, the impact of the movements of these factors may increase or decrease through the use of multipliers or deflators. Structured notes may be designed to have particular quality and maturity characteristics and may vary from money market quality to below investment grade. Depending on the factor used and the use of multipliers or deflators, however, changes in interest rates and movement of the factor may cause significant price fluctuations or may cause particular structured notes to become illiquid. The Portfolios will use structured notes to tailor their investments to the specific risks and returns the Adviser wishes to accept while avoiding or reducing certain other risks.
DERIVATIVES
Certain Portfolios are permitted to utilize various exchange-traded and over-the-counter derivative instruments and derivative securities, both for hedging and non-hedging purposes. Permitted derivative products include, but are not limited to futures contracts ("futures"); forward contracts ("forwards"); options; swaps, caps, collars and floors; contracts for difference ("CFDs"); structured notes; and other derivative products yet to be developed, so long as these new products are used in a manner consistent with the objectives of the Portfolios. These derivative products may be based on a wide variety of underlying rates, indices, instruments, securities and other products, such as interest rates, foreign currencies, foreign and domestic fixed income and equity securities, groups or "baskets" of securities and securities indices (for each derivative product, the "underlying").
Each Portfolio may use derivative instruments for hedging or non-hedging purposes. The term hedging, generally, means that a Portfolio is using a derivative product as a way to reduce or limit risk. For example, a Portfolio may hedge in order to limit the effects of a change in the value of a particular foreign currency versus the U.S. dollar or a Portfolio could use a portion of its cash to buy securities futures in order to hedge the risk of not being fully invested. The Portfolios also may use certain complex hedging techniques. For example, a Portfolio may use a type of hedge known as a cross hedge or a proxy hedge, where the Portfolio hedges the risk associated with one underlying by purchasing or selling a derivative product with an underlying that is different. There is no limit on the use of forward foreign currency exchange contracts or other derivative products for hedging purposes.
The Portfolios may use derivative products under a number of different circumstances to further their investment objectives. For example, a Portfolio may purchase derivatives to gain exposure to a market or currency quickly in response to changes in the Portfolio's investment strategy, upon the inflow of investable cash or when the derivative provides greater liquidity than the underlying market. A Portfolio may also use derivatives when it is restricted from directly owning the "underlying" or when derivatives provide a pricing advantage or lower transaction costs. The Portfolios also may purchase combinations of derivatives in order to gain exposure to an investment in lieu of actually purchasing such investment. Derivatives may also be used by a Portfolio for hedging or risk management purposes and in other circumstances when the Adviser believes it advantageous to do so consistent with the Portfolio's investment objectives and policies. Except under circumstances where a segregated account is not required under the 1940 Act or the rules adopted thereunder, the Portfolio will earmark cash or liquid assets or place them in a segregated account in an amount necessary to cover the Portfolio's obligations under such derivative transactions.
27
The use of derivative products is a highly specialized activity which involves investment techniques and risks different from those associated with ordinary portfolio securities transactions. If the Adviser is incorrect in forecasts of market values, interest rates, and currency exchange rates, the investment performance of the Portfolios will be less favorable than it would have been if these investment techniques had not been used.
Some of the derivative products in which the Portfolios may invest and some of the risks related thereto are described in further detail below.
Forward Foreign Currency Exchange Contracts. Forward foreign currency exchange contracts are derivatives which may be used to protect against uncertainty in the level of future foreign exchange rates. A forward contract involves an obligation to purchase or sell a specific currency at a future date, which may be any fixed number of days from the date of the contract agreed upon by the parties, at a price set at the time of the contract. Such contracts do not eliminate fluctuations caused by changes in the local currency prices of the securities, but rather, they establish an exchange rate at a future date. Also, although such contracts can minimize the risk of loss due to a decline in the value of the hedged currency, at the same time they limit any potential gain that might be realized.
A Portfolio may use currency exchange contracts in the normal course of business to lock in an exchange rate in connection with purchases and sales of securities denominated in foreign currencies (transaction hedge) or to lock in the U.S. dollar value of portfolio positions (position hedge). In addition, the Portfolios may cross hedge currencies by entering into a transaction to purchase or sell one or more currencies that are expected to decline in value relative to other currencies to which a Portfolio has or expects to have portfolio exposure. The Portfolios may also engage in proxy hedging which is defined as entering into positions in one currency to hedge investments denominated in another currency, where the two currencies are economically linked. A Portfolio's entry into forward foreign currency exchange contract, as well as any use of cross or proxy hedging techniques will generally require the Portfolio to earmark or hold liquid securities or cash equal to the Portfolio's obligations in a segregated account throughout the duration of the contract.
A Portfolio may also combine forward foreign currency exchange contracts with investments in securities denominated in other currencies in order to achieve desired equity, credit and currency exposures. Such combinations are generally referred to as synthetic securities. For example, in lieu of purchasing foreign equity or bond, a Portfolio may purchase a U.S. dollar-denominated security and at the same time enter into a forward foreign currency exchange contract to exchange U.S. dollars for the contract's underlying currency at a future date. By matching the amount of U.S. dollars to be exchanged with the anticipated value of the U.S. dollar-denominated security, a Portfolio may be able to lock in the foreign currency value of the security and adopt a synthetic investment position reflecting the equity return or credit quality of the U.S. dollar-denominated security.
Forward foreign currency exchange contracts are not traded on contract markets regulated by the SEC or the Commodity Futures Trading Commission (the "CFTC"). They are traded through financial institutions acting as market-makers. Portfolios that trade forward foreign currency exchange contracts could lose amounts substantially in excess of their initial investments, due to the margin and collateral requirements associated with them.
Forward foreign currency exchange contracts may be traded on foreign exchanges. These transactions are subject to the risk of governmental actions affecting trading in or the prices of foreign currencies or securities. The value of such positions also could be adversely affected by (i) other complex foreign political and economic factors, (ii) lesser availability than in the United States of data on which to make trading decisions, (iii) delays in a Portfolio's ability to act upon economic events occurring in foreign markets during non business hours in the United States, (iv) the imposition of different exercise and settlement terms and procedures and margin requirements than in the United States and (v) lesser trading volume.
Currency hedging strategies involve certain other risks as well. There is a risk in adopting a transaction hedge or position hedge to the extent that the value of a security denominated in foreign currency is not exactly matched with a Portfolio's obligation under the forward foreign currency exchange contract. On the date of maturity, a Portfolio may be exposed to some risk of loss from fluctuations in that currency. Although the Adviser will attempt to hold such mismatching to a minimum, there can be no assurance that the Adviser will be able to do so. For proxy hedges, cross hedges or a synthetic position, there is an additional risk in that these transactions create residual foreign currency exposure. When a Portfolio enters into a forward foreign currency exchange contract for purposes of creating a position hedge, transaction hedge, cross hedge or a synthetic security, it will generally be required to hold liquid securities or cash in a segregated account with a daily value at least equal to its obligation under the forward foreign currency exchange contract. See also "Leverage Risk."
28
The Portfolios generally will not enter into a forward contract with a term of greater than one year. At the maturity of a forward contract, a Portfolio may either sell the portfolio security and make delivery of the foreign currency, or it may retain the security and terminate its contractual obligation to deliver the foreign currency by purchasing an "offsetting" contract with the same currency trader obligating it to purchase, on the same maturity date, the same amount of the foreign currency.
It is impossible to forecast with absolute precision the market value of a particular portfolio security at the expiration of the contract. Accordingly, it may be necessary for a Portfolio to purchase additional foreign currency on the spot market (and bear the expense of such purchase) if the market value of the security is less than the amount of foreign currency that such Portfolio is obligated to deliver and if a decision is made to sell the security and make delivery of the foreign currency.
If a Portfolio retains the portfolio security and engages in an offsetting transaction, such Portfolio will incur a gain or a loss (as described below) to the extent that there has been movement in forward contract prices. Should forward prices decline during the period between a Portfolio entering into a forward contract for the sale of a foreign currency and the date it enters into an offsetting contract for the purchase of the foreign currency, such Portfolio will realize a gain to the extent that the price of the currency it has agreed to sell exceeds the price of the currency it has agreed to purchase. Should forward prices increase, such Portfolio would suffer a loss to the extent that the price of the currency it has agreed to purchase exceeds the price of the currency it has agreed to sell. The Portfolios are not required to enter into such transactions with regard to their foreign currency-denominated securities. It also should be realized that this method of protecting the value of portfolio securities against a decline in the value of a currency does not eliminate fluctuations in the underlying prices of the securities. It simply establishes a rate of, exchange which one can achieve at some future point in time. Additionally, although such contracts tend to minimize the risk of loss due to a decline in the value of the hedged currency, at the same time, they tend to limit any potential gain which might result should the value of such currency increase.
Futures Contracts (Futures) and Forward Contracts (Forwards). The Portfolios may purchase and sell futures contracts, including futures on securities indices, baskets of securities, foreign currencies and interest rates of the type generally known as financial futures. These are standardized contracts that are bought and sold on organized exchanges. A futures contract obligates a party to buy or sell a specific amount of the "underlying," such as a particular foreign currency, on a specified future date at a specified price or to settle the value in cash.
The Portfolios may also purchase and sell forward contracts, such as forward rate agreements and other financial forward contracts. The Portfolios may also use forward foreign currency exchange contracts, which are separately discussed above under "Forward Foreign Currency Exchange Contracts." These forward contracts are privately negotiated and are bought and sold in the over-the-counter market. Like a future, a forward contract obligates a party to buy or sell a specific amount of the underlying on a specified future date at a specified price. The terms of the forward contract are customized. Forward contracts, like other over-the-counter contracts that are negotiated directly with an individual counterparty, subject the Portfolio to the risk of counterparty default. Forward foreign currency exchange contracts may be used to protect against uncertainty in the level of future foreign currency exchange rates or to gain or modify exposure to a particular currency.
In some cases, the Portfolios may be able to use either futures contracts, forward contracts or exchange-traded or over-the-counter options to accomplish similar purposes. In all cases, the Portfolios will uses these products only as permitted by applicable laws and regulations. Some of the ways in which the Portfolios may use futures contracts, forward contracts and related options follow.
The Portfolios may sell securities index futures contracts and/or options thereon in anticipation of or during a market decline to attempt to offset the decrease in market value of investments in its portfolio, or may purchase securities index futures or options in order to gain market exposure. There currently are limited securities index futures and options on such futures in many countries, particularly emerging markets. The nature of the strategies adopted by the Adviser, and the extent to which those strategies are used, may depend on the development of such markets. The Portfolios may also purchase and sell foreign currency futures to lock in rates or to adjust their exposure to a particular currency.
The Portfolio may engage in transactions in interest rate futures and related products. The value of these contracts rises and falls inversely with changes in interest rates. The Portfolios may engage in such transactions to hedge their holdings of debt instruments against future changes in interest rates or for other purposes. The
29
Portfolios may also use futures contracts to gain exposure to an entire market (e.g., stock index futures) or to control their exposure to changing foreign currency exchange rates.
Gains and losses on futures contracts, forward contracts and related options depend on the Adviser's ability to predict correctly the direction of movement of securities prices, interest rates and other economic factors. Other risks associated with the use of these instruments include (i) imperfect correlation between the changes in market value of investments held by a Portfolio and the prices of derivative products relating to investments purchased or sold by the Portfolio, and (ii) possible lack of a liquid secondary market for a derivative product and the resulting inability to close out a position. A Portfolio will seek to minimize the risk by only entering into transactions for which there appears to be a liquid exchange or secondary market. In some strategies, the risk of loss in trading on futures and related transactions can be substantial, due both to the low margin deposits required and the extremely high degree of leverage involved in pricing. Except under circumstances where a segregated account is not required under the 1940 Act or the rules adopted thereunder, the Portfolio will earmark cash or liquid assets or place them in a segregated account in an amount necessary to cover the Portfolio's obligations under such contracts. See also "Leverage Risk."
Limitations on Futures Contracts. The CFTC eliminated limitations on futures trading by certain regulated entities, including registered investment companies, and consequently registered investment companies may engage in unlimited futures transactions and options thereon provided that the investment adviser to the company claims an exclusion from regulation as a commodity pool operator. In connection with its management of the Fund, the Adviser has claimed such an exclusion from registration as a commodity pool operator under the Commodity Exchange Act ("CEA"). Therefore, it is not subject to the registration and regulatory requirements of the CEA. Therefore, there are no limitations on the extent to which a Portfolio may engage in non-hedging transactions involving futures and options thereon, except as set forth in a Portfolio's Prospectus or this SAI. There is no overall limitation on the percentage of a Portfolio's net assets which may be subject to a hedging position.
Options. The Portfolios may seek to increase their returns or may hedge their portfolio investments through options transactions with respect to individual securities, indices or baskets in which such Portfolios may invest; other financial instruments; and foreign currency. Various options may be purchased and sold on exchanges or over-the-counter markets.
Each Portfolio may purchase put and call options. Purchasing a put option gives a Portfolio the right, but not the obligation, to sell the underlying (such as a securities index or a particular foreign currency) at the exercise price either on a specific date or during a specified exercise period. The purchaser pays a premium to the seller (also known as the writer) of the option.
Each Portfolio also may write put and call options on investments held in its portfolio, as well as foreign currency options. A Portfolio that has written an option receives a premium that increases the Portfolio's return on the underlying in the event the option expires unexercised or is closed out at a profit. However, by writing a call option, a Portfolio will limit its opportunity to profit from an increase in the market value of the underlying above the exercise price of the option. By writing a put option, a Portfolio will be exposed to the amount by which the price of the underlying is less than the strike price.
By writing an option, a Portfolio incurs an obligation either to buy (in the case of a put option) or sell (in the case of a call option) the underlying from the purchaser of the option at the option's exercise price, upon exercise by the purchaser. Pursuant to guidelines established by the Board of Directors, the Portfolios may only write options that are "covered." A covered call option means that until the expiration of the option, the Portfolio will either earmark or segregate sufficient liquid assets to cover its obligations under the option or will continue to own (i) the underlying; (ii) securities or instruments convertible or exchangeable without the payment of any consideration into the underlying; or (iii) a call option on the same underlying with a strike price no higher than the price at which the underlying was sold pursuant to a short option position. In the case of a put option, the Portfolio will either earmark or segregate sufficient liquid assets to cover its obligations under the option or will own another put option on the same underlying with an equal or higher strike price.
There may be limited options markets in many countries, particularly emerging market countries, and the nature of the strategies adopted by the Adviser and the extent to which those strategies are used will depend on the development of these options markets. The primary risks associated with the Portfolios' use of options as described include (i) imperfect correlation between the change in market value of investments held, purchased or sold by a Portfolio and the prices of options relating to such investments, and (ii) possible lack of a liquid secondary market for an option.
30
Swaps, Caps, Collars, Floors and CFDs. Swaps are privately negotiated over-the-counter derivative products in which two parties agree to exchange payment streams calculated in relation to a rate, index, instrument or certain securities and a particular "notional amount." As with many of the other derivative products available to the Portfolios, the underlying may include an interest rate (fixed or floating), a currency exchange rate, a commodity price index, and a security, securities index or a combination thereof. A great deal of flexibility is possible in the way the products may be structured, with the effect being that the parties may have exchanged amounts equal to the return on one rate, index or group of securities for another. For example, in a simple fixed-to-floating interest rate swap, one party makes payments equivalent to a fixed interest rate, and the other makes payments equivalent to a specified interest rate index. A Portfolio may engage in simple or more complex swap transactions involving a wide variety of underlyings. The currency swaps that the Portfolios may enter will generally involve an agreement to pay interest streams in one currency based on a specified index in exchange for receiving interest streams denominated in another currency. Such swaps may involve initial and final exchanges that correspond to the agreed upon notional amount.
Caps, collars and floors are privately-negotiated option-based derivative products. A Portfolio may use one or more of these products in addition to or in lieu of a swap involving a similar rate or index. As in the case of a put or call option, the buyer of a cap or floor pays a premium to the writer. In exchange for that premium, the buyer receives the right to a payment equal to the differential if the specified index or rate rises above (in the case of a cap) or falls below (in the case of a floor) a pre-determined strike level. As in the case of swaps, obligations under caps and floors are calculated based upon an agreed notional amount, and like most swaps (other than foreign currency swaps), the entire notional amount is not exchanged and thus is not at risk. A collar is a combination product in which the same party, such as the Portfolio, buys a cap from and sells a floor to the other party. As with put and call options, the amount at risk is limited for the buyer, but, if the cap or floor in not hedged or covered, may be unlimited for the seller. Under current market practice, caps, collars and floors between the same two parties are generally documented under the same "master agreement." In some cases, options and forward agreements may also be governed by the same master agreement. In the event of a default, amounts owed under all transactions entered into under, or covered by, the same master agreement would be netted and only a single payment would be made.
Swaps, caps, collars and floors are credit-intensive products. A Portfolio that enters into a swap transaction bears the risk of default, i.e., nonpayment, by the other party. The guidelines under which each Portfolio enters derivative transactions, along with some features of the transactions themselves, are intended to reduce these risks to the extent reasonably practicable, although they cannot eliminate the risks entirely. Under guidelines established by the Board of Directors, a Portfolio may enter into swaps only with parties that meet certain credit rating guidelines. Consistent with current market practices, a Portfolio will generally enter into swap transactions on a net basis, and all swap transactions with the same party will be documented under a single master agreement to provide for net payment upon default. In addition, a Portfolio's obligations under an agreement will be accrued daily (offset against any amounts owing to the Portfolio) and any accrued, but unpaid, net amounts owed to the other party to a master agreement will be covered by the maintenance of a segregated account consisting of cash or liquid securities.
Interest rate and total rate of return (fixed income or equity) swaps generally do not involve the delivery of securities, other underlying assets, or principal. In such case, if the other party to an interest rate or total rate of return swap defaults, a Portfolio's risk of loss will consist of the payments that a Portfolio is contractually entitled to receive from the other party. This may not be true for currency swaps that require the delivery of the entire notional amount of one designated currency in exchange for the other. If there is a default by the other party, a Portfolio may have contractual remedies under the agreements related to the transaction.
Credit Default Swaps. The Emerging Markets Debt Portfolio may enter into credit default swap contracts for hedging purposes or to add leverage to the Portfolio. As the seller in a credit default swap contract, the Portfolio would be required to pay the par (or other agreed-upon) value of a referenced debt obligation to the counterparty in the event of a default by a third party, such as a U.S. or foreign corporate issuer, on the debt obligation. In return, the Portfolio would receive from the counterparty a periodic stream of payments over the term of the contract provided that no event of default has occurred. If no default occurs, the Portfolio would keep the stream of payments and would have no payment obligations. As the seller, the Portfolio would effectively add leverage to its portfolio because, in addition to its total net assets, the Portfolio would be subject to investment exposure on the notional amount of the swap.
31
The Portfolio may also purchase credit default swap contracts in order to hedge against the risk of default of debt securities held in its Portfolio, in which case the Portfolio would function as the counterparty referenced in the preceding paragraph. This would involve the risk that the investment may expire worthless and would generate income only in the event of an actual default by the issuer of the underlying obligation (as opposed to a credit downgrade or other indication of financial instability). It would also involve credit risk that the seller may fail to satisfy its payment obligations to the Portfolio in the event of a default.
The Portfolio will earmark or segregate assets in the form of cash and cash equivalents in an amount equal to the aggregate market value of the credit default swaps of which it is the seller, marked to market on a daily basis.
Certain Portfolios may purchase and sell CFDs. A CFD is a privately negotiated contract between two parties, buyer and seller, stipulating that the seller will pay to or receive from the buyer the difference between the nominal value of the underlying instrument at the opening of the contract and that instrument's value at the end of the contract. The underlying instrument may be a single security, stock basket or index. The buyer and seller are both required to post margin, which is adjusted daily. The buyer will also pay to the seller a financing rate on the notional amount of the capital employed by the seller less the margin deposit. The buyer of a short CFD receives interest, which is usually LIBOR less the stock borrow costs. A CFD is usually terminated at the buyer's initiative. The seller of the CFD will simply match the exposure of the underlying instrument in the open market and the parties will exchange whatever payment is due.
As is the case with owning any financial instrument, there is the risk of loss associated with buying a CFD. For example, if a Portfolio buys a long CFD and the underlying security is worth less at the end of the contract, the Portfolio would be required to make a payment to the seller and would suffer a loss. Also, there may be liquidity risk if the underlying instrument is illiquid because, as explained above, the liquidity of a CFD is based on the liquidity of the underlying instrument. A further risk is that adverse movements in the underlying security will require the buyer to post additional margin. CFDs also carry counterparty risk, i.e., the risk that the counterparty to the CFD transaction may be unable or unwilling to make payments or to otherwise honor its financial obligations under the terms of the contract. If the counterparty were to do so, the value of the contract, and of the Portfolio's shares, may be reduced.
Entry into a CFD transaction may, in certain circumstances, require the payment of an initial margin and adverse market movements against the underlying stock may require the buyer to make additional margin payments. CFDs may be considered illiquid by the SEC staff and subject to the limitations on illiquid investments. To the extent that there is an imperfect correlation between the return on a Portfolio's obligation to its counterparty under the CFDs and the return on related assets in its portfolio, the CFD transaction may increase the Portfolio's financial risk. A Portfolio will not enter into a CFD transaction that is inconsistent with its investment objective, policies and strategies.
INVESTMENT LIMITATIONS
Fundamental Limitations
Each current Portfolio has adopted the following restrictions, which are fundamental policies and may not be changed without the approval of the lesser of: (i) at least 67% of the voting securities of the Portfolio present at a meeting if the holders of more than 50% of the outstanding voting securities of the Portfolio are present or represented by proxy; or (ii) more than 50% of the outstanding voting securities of the Portfolio. Each Portfolio of the Fund (except for the Global Franchise, Global Value Equity, International Real Estate, Large Cap Relative Value and Small Company Growth Portfolios) will not:
(1) purchase or sell physical commodities unless acquired as a result of ownership of securities or other instruments; provided that this restriction shall not prohibit the Portfolio from purchasing or selling options, futures contracts and related options thereon, forward contracts, swaps, caps, floors, collars and any other financial instruments or from investing in securities or other instruments backed by physical commodities or as otherwise permitted by (i) the 1940 Act, as amended from time to time, (ii) the rules and regulations promulgated by the SEC under the 1940 Act, as amended from time to time, or (iii) an exemption or other relief applicable to the Portfolio from the provisions of the 1940 Act, as amended from time to time;
(2) purchase or sell real estate, although it may purchase and sell securities of companies that deal in real estate and may purchase and sell securities that are secured by interests in real estate;
32
(3) make loans of money or property to any person, except (a) to the extent that securities or interests in which the Portfolio may invest are considered to be loans, (b) through the loan of portfolio securities, (c) by engaging in repurchase agreements or (d) as may otherwise be permitted by (i) the 1940 Act, as amended from time to time, (ii) the rules and regulations promulgated by the SEC under the 1940 Act, as amended from time to time, or (iii) an exemption or other relief applicable to the Fund from the provisions of the 1940 Act, as amended from time to time;
(4) except with respect to the Emerging Markets Debt, Focus Growth, Global Real Estate and U.S. Real Estate Portfolios, invest in a manner inconsistent with its classification as a "diversified company" as provided by (i) the 1940 Act, as amended from time to time, (ii) the rules and regulations promulgated by the SEC under the 1940 Act, as amended from time to time, or (iii) an exemption or other relief applicable to the Portfolio from the provisions of the 1940 Act, as amended from time to time;
(5) borrow money, except the Portfolio may borrow money to the extent permitted by (i) the 1940 Act, as amended from time to time, (ii) the rules and regulations promulgated by the SEC under the 1940 Act, as amended from time to time, or (iii) an exemption or other relief applicable to the Portfolio from the provisions of the 1940 Act, as amended from time to time;
(6) issue senior securities, except the Portfolio may issue senior securities to the extent permitted by (i) the 1940 Act, as amended from time to time, (ii) the rules and regulations promulgated by the SEC under the 1940 Act, as amended from time to time, or (iii) an exemption or other relief applicable to the Portfolio from the provisions of the 1940 Act, as amended from time to time;
(7) underwrite securities issued by others, except to the extent that the Portfolio may be considered an underwriter within the meaning of the 1933 Act in the disposition of restricted securities;
(8) acquire any securities of companies within one industry if, as a result of such acquisition, more than 25% of the value of the Portfolio's total assets would be invested in securities of companies within such industry; provided, however, that there shall be no limitation on the purchase of obligations issued or guaranteed by the U.S. Government, its agencies or instrumentalities, except that the U.S. Real Estate Portfolio will invest more than 25% of its total assets in the U.S. real estate industry, as described in its Prospectus, and that the Global Real Estate Portfolio will invest more than 25% of its total assets in the real estate industry, as described in its Prospectus; and
(9) except with respect to the Global Real Estate and U.S. Small/Mid Cap Value Portfolios, write or acquire options or interests in oil, gas or other mineral exploration or development programs.
Each of the Global Franchise, Global Value Equity, International Real Estate, Large Cap Relative Value and Small Company Growth Portfolios will not:
(1) purchase or sell physical commodities unless acquired as a result of ownership of securities or other instruments (except this shall not prevent the Portfolio from purchasing or selling options or futures contracts or from investing in securities or other instruments backed by physical commodities);
(2) purchase or sell real estate, although it may purchase and sell securities of companies that deal in real estate and may purchase and sell securities that are secured by interests in real estate;
(3) lend any security or make any other loan if, as a result, more than 33 1/3% of its total assets would be lent to other parties, but this limitation does not apply to purchases of debt securities or repurchase agreements;
(4) except with respect to the Global Franchise Portfolio and the International Real Estate Portfolio, with respect to 75% of its total assets (i) purchase more than 10% of any class of the outstanding voting securities of any issuer and (ii) purchase securities of an issuer (except obligations of the U.S. Government and its agencies and instrumentalities) if as a result more than 5% of the Portfolio's total assets, at market value, would be invested in the securities of such issuer;
(5) issue senior securities and will not borrow, except from banks and as a temporary measure for extraordinary or emergency purposes and then, in no event, in excess of 33 1/3% of its total assets (including the amount borrowed) less liabilities (other than borrowings);
33
(6) underwrite securities issued by others, except to the extent that the Portfolio may be considered an underwriter within the meaning of the 1933 Act in the disposition of restricted securities;
(7) acquire any securities of companies within one industry if, as a result of such acquisition, more than 25% of the value of the Portfolio's total assets would be invested in securities of companies within such industry; provided, however, that there shall be no limitation on the purchase of obligations issued or guaranteed by the U.S. Government, its agencies or instrumentalities, except that the International Real Estate Portfolio will invest more than 25% of its total assets in the European real estate industry, as described in its Prospectus; and
(8) write or acquire options or interests in oil, gas or other mineral exploration or development programs.
Non-Fundamental Limitations
In addition, each current Portfolio of the Fund has adopted the following non-fundamental investment limitations, which may be changed by the Board without shareholder approval. Each current Portfolio of the Fund will not:
(1) purchase on margin or sell short except (i) that the Emerging Markets Debt Portfolio may sell securities short without limitation but consistent with applicable legal requirements as stated in its Prospectus; (ii) that each Portfolio may enter into option transactions and futures contracts as described in its Prospectus; and (iii) as specified above in fundamental investment limitation number (1) above;
(2) except with respect to the Global Real Estate Portfolio, make loans except (i) by purchasing bonds, debentures or similar obligations (including repurchase agreements, subject to the limitations as described in the respective Prospectuses) that are publicly distributed; and (ii) by lending its portfolio securities to banks, brokers, dealers and other financial institutions so long as such loans are not inconsistent with the 1940 Act or the rules and regulations or interpretations of the SEC thereunder;
(3) borrow money, except from banks for extraordinary or emergency purposes, and then only in amounts up to 10% of the value of the Portfolio's total assets (including, in each case, the amount borrowed less liabilities (other than borrowings)), or purchase securities while borrowings exceed 5% of its total assets, except that (i) the Emerging Markets Debt Portfolio may borrow in accordance with fundamental investment limitation number (5) above and (ii) the Emerging Markets Debt Portfolio may purchase securities while borrowings exceed 5% of its total assets, provided that the sole purpose of such borrowings is to honor redemption requests; and
(4) invest in other investment companies in reliance on Sections 12(d)(1)(F), 12(d)(1)(G) or 12(d)(1)(J) of the 1940 Act.
Whether diversified or non-diversified, each Portfolio will diversify its holdings so that, at the close of each quarter of its taxable year or within 30 days thereafter, (i) at least 50% of the market value of the Portfolio's total assets is represented by cash (including cash items and receivables), U.S. government securities, and other securities, with such other securities limited, in respect of any one issuer, for purposes of this calculation to an amount not greater than 5% of the value of the Portfolio's total assets and 10% of the outstanding voting securities of such issuer; and (ii) not more than 25% of the value of its total assets is invested in the securities of any one issuer (other than U.S. government securities). Prior to the close of each quarter (or within 30 days thereafter), the Portfolio's holdings may be less diversified and are not required to satisfy any diversification test.
The percentage limitations contained in these restrictions apply at the time of purchase of securities. A later change in percentage resulting from changes in the value of the Portfolio's assets or in total or net assets of the Portfolio will not be considered a violation of the restriction and the sale of securities will not be required. The foregoing does not apply to borrowings or investments in illiquid securities. Future Portfolios of the Fund may adopt different limitations.
For the fiscal years ended December 31, 2007 and December 31, 2008, the Fund's turnover rates were 155% and 248%, respectively. The variation in turnover rates is due to heightened volatility in financial markets generally and specifically in emerging markets during the fiscal year ended December 31, 2008.
DISCLOSURE OF PORTFOLIO HOLDINGS
The Fund's Board of Directors and the Adviser have adopted policies and procedures regarding disclosure of portfolio holdings (the "Policy"). Pursuant to the Policy, the Adviser may disclose information concerning Fund portfolio holdings only if such disclosure is consistent with the antifraud provisions of the federal securities laws and the Fund's and the Adviser's fiduciary duties to Fund shareholders. The Adviser may not receive compensation
34
or any other consideration in connection with the disclosure of information about the portfolio securities of the Fund. Consideration includes any agreement to maintain assets in the Fund or in other investment companies or accounts managed by the Adviser or by any affiliated person of the Adviser. Non-public information concerning portfolio holdings may be divulged to third parties only when the Fund has a legitimate business purpose for doing so and the recipients of the information are subject to a duty of confidentiality. Under no circumstances shall current or prospective Fund shareholders receive non-public portfolio holdings information, except as described below.
The Fund makes available on its public website the following portfolio holdings information:
• complete portfolio holdings information monthly, at least 15 calendar days after the end of each month; and
• top 10 (or top 15) holdings monthly, at least 15 calendar days after the end of each month.
The Fund provides a complete schedule of portfolio holdings for the second and fourth fiscal quarters in its semiannual and annual reports, and for the first and third fiscal quarters in its filings with the SEC on Form N-Q.
All other portfolio holdings information that has not been disseminated in a manner making it available to investors generally as described above is non-public information for purposes of the Policy.
The Fund may make selective disclosure of non-public portfolio holdings. Third parties eligible to receive such disclosures currently include fund rating agencies, information exchange subscribers, consultants and analysts, portfolio analytics providers and service providers, provided that the third party expressly agrees to maintain the disclosed information in confidence and not to trade portfolio securities based on the non-public information. Non-public portfolio holdings information may not be disclosed to a third party unless and until the arrangement has been reviewed and approved pursuant to the requirements set forth in the Policy. Subject to the terms and conditions of any agreement between the Adviser, a Sub-Adviser or the Fund and the third party recipient, if these conditions for disclosure are satisfied, there shall be no restriction on the frequency with which Fund non-public portfolio holdings information is released, and no lag period shall apply (unless otherwise indicated below).
The Adviser and/or Sub-Adviser may provide interest lists to broker-dealers who execute securities transactions for the Fund without entering into a non-disclosure agreement with the broker-dealers, provided that the interest list satisfies all of the following criteria: (1) the interest list must contain only the CUSIP numbers and/or ticker symbols of securities held in all registered management investment companies advised by the Adviser or any affiliate of the Adviser (the "MSIM Funds") on an aggregate, rather than a fund-by-fund basis; (2) the interest list must not contain information about the number or value of shares owned by a specified MSIM Fund; (3) the interest list may identify the investment strategy, but not the particular MSIM Funds, to which the list relates; and (4) the interest list may not identify the portfolio manager or team members responsible for managing the MSIM Funds.
Fund shareholders may elect in some circumstances to redeem their shares of the Fund in exchange for their pro rata share of the securities held by the Fund. Under such circumstances, Fund shareholders may receive a complete listing of the holdings of the Fund up to seven calendar days prior to making the redemption request provided that they represent orally or in writing that they agree not to disclose or trade on the basis of the portfolio holdings information.
The Fund may discuss or otherwise disclose performance attribution analyses (i.e., mention the effects of having a particular security in the portfolio(s)) where such discussion is not contemporaneously made public, provided that the particular holding has been disclosed publicly. Additionally, any discussion of the analyses may not be more current than the date the holding was disclosed publicly.
The Fund may disclose portfolio holdings to transition managers, provided that the Fund has entered into a non-disclosure or confidentiality agreement with the party requesting that the information be provided to the transition manager and the party to the non-disclosure agreement has, in turn, entered into a non-disclosure or confidentiality agreement with the transition manager.
The Adviser and/or the Fund have entered into ongoing arrangements to make available public and/or non-public information about the Fund's portfolio securities. Provided that the recipient of the information falls into one or more of the categories listed below, and the recipient has entered into a non-disclosure agreement with the Fund, or owes a duty of trust or confidence to the Adviser or the Fund, the recipient may receive portfolio holdings information pursuant to such agreement without obtaining pre-approval from either the Portfolio Holdings Review Committee ("PHRC") or the Fund's Board of Directors. In all such instances, however, the PHRC will be responsible for reporting to the Fund's Board of Directors, or designated committee thereof, material information concerning the ongoing arrangements at each Board's next regularly scheduled Board meeting. Categories of parties eligible to
35
receive information pursuant to such ongoing arrangements include fund rating agencies, information exchange subscribers, consultants and analysts, portfolio analytics providers and service providers.
The Adviser, the Fund and/or certain Portfolios currently have entered into ongoing arrangements with the following parties:
| Name | Information Disclosed | Frequency(1) | Lag Time | ||||||||||||
| Service Providers | |||||||||||||||
| RiskMetrics Group (proxy voting agent)(*) | Complete portfolio holdings | Daily basis | (2) | ||||||||||||
| FT Interactive Data Pricing Service Provider(*) | Complete portfolio holdings | As needed | (2) | ||||||||||||
| Morgan Stanley Trust(*) | Complete portfolio holdings | As needed | (2) | ||||||||||||
| State Street Bank and Trust Company(*) | Complete portfolio holdings | As needed | (2) | ||||||||||||
| Fund Rating Agencies | |||||||||||||||
| Lipper(*) | Top ten and complete portfolio holdings | Monthly basis | Approximately 15 days after quarter end and approximately 30 days after quarter end | ||||||||||||
| Morningstar(**) | Top ten and complete portfolio holdings | Quarterly basis | Approximately 15 days after quarter end and approximately 30 days after quarter end | ||||||||||||
| Standard & Poor's(*) | Complete portfolio holdings | Quarterly basis | Approximately 15 day lag | ||||||||||||
| Investment Company Institute(**) | Top ten portfolio holdings | Quarterly basis | Approximately 15 days after quarter end | ||||||||||||
| Consultants and Analysts | |||||||||||||||
| Americh Massena & Associates, Inc.(*) | Top ten and complete portfolio holdings | Quarterly basis(5) | Approximately 10-12 days after quarter end | ||||||||||||
| Bloomberg(**) | Complete portfolio holdings | Quarterly basis | Approximately 30 days after quarter end | ||||||||||||
| Callan Associates(*) | Top ten and complete portfolio holdings | Monthly and quarterly basis, respectively(5) | Approximately 10-12 days after month/quarter end | ||||||||||||
| Cambridge Associates(*) | Top ten and complete portfolio holdings | Quarterly basis(5) | Approximately 10-12 days after quarter end | ||||||||||||
| Citigroup(*) | Complete portfolio holdings | Quarterly basis(5) | At least one day after quarter end | ||||||||||||
| Credit Suisse First Boston(*) | Top ten and complete portfolio holdings | Monthly and quarterly basis, respectively | Approximately 10-12 days after month/quarter end | ||||||||||||
| CTC Consulting, Incorporated(**) | Top ten and complete | Quarterly basis portfolio holdings | Approximately 15 days after quarter end and approximately 30 days after quarter end, respectively | ||||||||||||
| Evaluation Associates(*) | Top ten and complete portfolio holdings | Monthly and quarterly basis, respectively(5) | Approximately 10-12 days after month/quarter end | ||||||||||||
| Fund Evaluation Group(**) | Top ten portfolio holdings(3) | Quarterly basis | At least 15 days after quarter end | ||||||||||||
36
| Name | Information Disclosed | Frequency(1) | Lag Time | ||||||||||||
| Jeffrey Slocum & Associates(*) | Complete portfolio holdings(4) | Quarterly basis(5) | Approximately 10-12 days after quarter end | ||||||||||||
| Hammond Associates(**) | Complete portfolio holdings(4) | Quarterly basis | At least 30 days after quarter end | ||||||||||||
| Hartland & Co.(**) | Complete portfolio holdings(4) | Quarterly basis | At least 30 days after quarter end | ||||||||||||
| Hewitt Associates(*) | Top ten and complete portfolio holdings | Monthly and quarterly basis, respectively(5) | Approximately 10-12 days after month/quarter end | ||||||||||||
| Mercer Investment Consulting(*) | Complete portfolio | As needed holdings | (2) | ||||||||||||
| Merrill Lynch(*) | Top ten and complete portfolio holdings | Monthly and quarterly basis, respectively(5) | Approximately 10-12 days after month/quarter end | ||||||||||||
| Mobius(**) | Top ten portfolio holdings(3) | Monthly basis | At least 15 days after month end | ||||||||||||
| Nelsons(**) | Top ten portfolio holdings(3) | Quarterly basis | At least 15 days after quarter end | ||||||||||||
| Prime, Buchholz & Associates, Inc.(**) | Complete portfolio holdings(4) | Quarterly basis | At least 30 days after quarter end | ||||||||||||
| PSN(**) | Top ten portfolio holdings(3) | Quarterly basis | At least 15 days after quarter end | ||||||||||||
| PFM Asset Management LLC(*) | Top ten and complete portfolio holdings | Quarterly basis(5) | Approximately 10-12 days after quarter end | ||||||||||||
| Russell Investment Group/ Russell/Mellon Analytical Services, Inc.(**) | Top ten and complete portfolio holdings | Monthly and quarterly basis | At least 15 days after month end and at least 30 days after quarter end, respectively | ||||||||||||
| Stratford Advisory Group, Inc.(*) | Top ten portfolio holdings(6) | Quarterly basis(5) | Approximately 10-12 days after quarter end | ||||||||||||
| Thomson Financial(**) | Complete portfolio holdings(4) | Quarterly basis | At least 30 days after quarter end | ||||||||||||
| Watershed Investment Consultants, Inc.(*) | Top ten and complete portfolio holdings | Quarterly basis(5) | Approximately 10-12 days after quarter end | ||||||||||||
| Yanni Partners(**) | Top ten portfolio holdings(3) | Quarterly basis | At least 15 days after quarter end | ||||||||||||
| Portfolio Analytics Providers | |||||||||||||||
| FactSet Research Systems, Inc.(*) | Complete portfolio holdings | Daily basis | One day | ||||||||||||
| Investor | |||||||||||||||
| Gavi Alliance(**) | Top ten and complete portfolio holdings | Monthly and quarterly basis | At least 15 days after month end and quarter end, respectively | ||||||||||||
(*) This entity has agreed to maintain Fund non-public portfolio holdings information in confidence and not to trade portfolio securities based on the non-public portfolio holdings information.
(**) The Fund does not currently have a non-disclosure agreement in place with this entity and therefore the entity can only receive publicly available information.
(1) Dissemination of portfolio holdings information to entities listed above may occur less frequently than indicated (or not at all).
(2) Information will typically be provided on a real time basis or as soon thereafter as possible.
(3) Complete portfolio holdings will also be provided upon request from time to time on a quarterly basis, with at least a 30 day lag.
(4) Top ten portfolio holdings will also be provided upon request from time to time, with at least a 15 day lag.
(5) This information will also be provided upon request from time to time.
(6) Complete portfolio holdings will also be provided upon request from time to time.
37
In addition, persons who owe a duty of trust or confidence to the Adviser or the Fund may receive non-public portfolio holdings information without entering into a non-disclosure agreement. Currently, these persons include (i) the Fund's independent registered public accounting firm (as of the Fund's fiscal year end and on an as needed basis), (ii) counsel to the Fund (on an as needed basis), (iii) counsel to the independent directors (on an as needed basis) and (iv) members of the Board of Directors (on an as needed basis).
All selective disclosures of non-public portfolio holdings information made to third parties pursuant to the exemptions set forth in the Policy must be pre-approved by both the PHRC and the Fund's Board of Directors (or designated committee thereof), except for (i) disclosures made to third parties pursuant to ongoing arrangements (discussed above); (ii) disclosures made to third parties pursuant to Special Meetings of the PHRC; (iii) broker-dealer interest lists; (iv) shareholder in-kind distributions; (v) attribution analyses; or (vi) in connection with transition managers. The Adviser shall report quarterly to the Board of Directors (or a designated committee thereof) information concerning all parties receiving non-public portfolio holdings information pursuant to an exemption. Procedures to monitor the use of such non-public portfolio holdings information may include requiring annual certifications that the recipients have utilized such information only pursuant to the terms of the agreement between the recipient and the Adviser and, for those recipients receiving information electronically, acceptance of the information will constitute reaffirmation that the third party expressly agrees to maintain the disclosed information in confidence and not to trade portfolio securities based on the non-public information.
In no instance may the Adviser, the Sub-Advisers or the Fund receive any compensation or consideration in exchange for the portfolio holdings information.
The PHRC is responsible for creating and implementing the Policy and, in this regard, has expressly adopted it. The following are some of the functions and responsibilities of the PHRC:
(a) The PHRC, which will consist of executive officers of the Fund and the Adviser or their designees, is responsible for establishing portfolio holdings disclosure policies and guidelines and determining how portfolio holdings information will be disclosed on an ongoing basis.
(b) The PHRC will periodically review and have the authority to amend as necessary the Fund's portfolio holdings disclosure policies and guidelines (as expressed by the Policy).
(c) The PHRC will meet at least quarterly to (among other matters): (1) address any outstanding issues relating to the Policy, including matters relating to (i) disclosures made to third parties pursuant to ongoing arrangements (described above); (ii) broker-dealer interest lists; (iii) shareholder in-kind distributions; (iv) attribution analyses; or (v) in connection with transition managers; (2) review non-disclosure agreements that have been executed with third parties and determine whether the third parties will receive portfolio holdings information; and (3) generally review the procedures that the Adviser employs to ensure that disclosure of information about portfolio securities is in the best interests of Fund shareholders, including procedures to address conflicts between the interests of Fund shareholders, on the one hand, and those of the Adviser; Morgan Stanley Distribution, Inc., as distributor of the Fund (the "Distributor"); or any affiliated person of the Fund, the Adviser, or the Distributor, on the other.
(d) Any member of the PHRC may call a Special Meeting of the PHRC to consider whether a third party that is not listed in (c) above may receive non-public portfolio holdings information pursuant to a validly executed non-disclosure agreement. At least three members of the PHRC, or their designees, and one member of the Fund's Audit Committee, or his or her designee, shall be present at the Special Meeting in order to constitute a quorum. At any Special Meeting at which a quorum is present, the decision of a majority of the PHRC members present and voting shall be determinative as to any matter submitted to a vote; provided, however, that the Audit Committee member, or his or her designee, must concur in the determination in order for it to become effective.
(e) The PHRC, or its designee(s), will document in writing all of their decisions and actions, which documentation will be maintained by the PHRC, or its designee(s) for a period of at least six years. The PHRC, or its designee(s), will report their decisions to the Board of Directors at each Board's next regularly scheduled Board meeting. The report will contain information concerning decisions made by the PHRC during the most recently ended calendar quarter immediately preceding the Board meeting.
PURCHASE OF SHARES
You may purchase shares of each Portfolio on any day the New York Stock Exchange ("NYSE") is open. Each Portfolio reserves the right in its sole discretion (i) to suspend the offering of its shares; (ii) to reject purchase orders when in the judgment of management such rejection is in the best interest of the Fund; and (iii) to reduce or waive the minimum for initial and subsequent investments for certain accounts such as employee benefit plans or under circumstances where certain economies can be achieved in sales of a Portfolio's shares.
Shares of each Portfolio may be purchased at the net asset value per share next determined after receipt by the Fund or its designee of a purchase order as described under "Methods of Purchase" and "Investment through Financial Intermediaries." Shares may, in the Fund's discretion, be purchased with investment securities (in lieu
38
of or, in conjunction with cash) acceptable to the Fund. The securities would be accepted by the Fund at their market value in return for Portfolio shares of equal value. The net asset value per share of each Portfolio is calculated on days that the NYSE is open for business. Net asset value per share is determined as of the close of trading of the NYSE (normally 4:00 p.m. Eastern Time) (for each Portfolio, the "Pricing Time").
Minimum Investment
The minimum initial investment generally is $5,000,000 for Class I shares, $1,000,000 for Class P shares and $25,000 for Class L shares of the applicable Portfolios. The minimum initial or additional investment will be waived for certain investments, including sales through banks, broker-dealers and other financial institutions (including registered investment advisers and financial planners) purchasing shares on behalf of their clients in (i) discretionary and non-discretionary advisory programs, (ii) fund supermarkets, (iii) asset allocation programs or (iv) other programs in which the client pays an asset-based fee for advice or for executing transactions in Portfolio shares or for otherwise participating in the program; certain retirement plans with plan assets (of at least $5 million for Class I and Class P shares) investing directly with the Fund; retirement plans investing through certain retirement plan platforms; certain endowments, foundations and other not for profit entities (with at least $5 million of investable assets for Class I and Class P shares) investing directly with the Fund; certain unit investment trusts sponsored by Morgan Stanley or any of its affiliates; other registered investment companies advised by Morgan Stanley Investment Management or any of its affiliates; Morgan Stanley Investment Management and its affiliates with respect to shares held in connection with certain retirement and deferred compensation programs established for their employees; the independent Directors of the Fund; and, with respect to Class I and Class P shares only, clients who owned Portfolio shares as of December 31, 2007.
The minimum initial investment is $25,000 for Class H shares of the applicable Portfolios.
Methods of Purchase for Class I, Class P and Class L Shares
You may purchase shares directly from the Fund by Federal Funds wire, by bank wire or by check; however, on days that the NYSE is open but the custodian bank is closed, you may only purchase shares by check. Investors may also invest in the Portfolios by purchasing shares through Financial Intermediaries that have made arrangements with the Fund. Some Financial Intermediaries may charge an additional service or transaction fee (see also "Investment Through Financial Intermediaries"). If a purchase is canceled due to nonpayment or because your check does not clear, you will be responsible for any loss the Fund or its agents incur. If you are already a shareholder, the Fund may redeem shares from your account(s) to reimburse the Fund or its agents for any loss. In addition, you may be prohibited or restricted from making future investments in the Fund.
Federal Funds Wire. Purchases may be made by having your bank wire Federal Funds to the Fund's bank account. Federal Funds purchase orders will be accepted only on a day on which the Fund and JPMorgan Chase Bank, N.A. ("JPMorgan Chase") are open for business. Your bank may charge a service fee for wiring Federal Funds. In order to ensure proper handling of your purchase by Federal Funds wire, please follow these steps.
1. Complete and sign an Account Registration Form and mail it to the address shown thereon.
2. Instruct your bank to wire the specified amount to the Fund's Wire Concentration Bank Account as follows:
JPMorgan Chase Bank, N.A.
270 Park Avenue
New York, New York 10017
ABA# 021000021
DDA# 910-2-733293
Attn: Morgan Stanley Institutional Fund, Inc.
Subscription Account
Ref: (Portfolio name, your account number, your account name, your confirmation number)
When a purchase order is received prior to the Pricing Time and Federal Funds are received prior to the regular close of the Federal Funds Wire Control Center ("FFWCC") (normally 6:00 p.m. Eastern Time), the purchase will be executed at the net asset value computed on the date of receipt. Purchases for which an order is received after the Pricing Time or for which Federal Funds are received after the regular close of the FFWCC will be executed at the net asset value next determined. Certain institutional investors and financial institutions have entered into agreements with the Fund pursuant to which they may place orders prior to the Pricing Time, but make payment in Federal Funds for those shares the following business day.
Bank Wire. A purchase of shares by bank wire must follow the same procedure as for a Federal Funds wire, described above. However, depending on the time the bank wire is sent and the bank handling the wire, money
39
transferred by bank wire may or may not be converted into Federal Funds prior to the close of the FFWCC. Prior to conversion to Federal Funds and receipt by the Fund, an investor's money will not be invested.
Check. An account may be opened by completing and signing an Account Registration Form and mailing it, together with a check payable to "Morgan Stanley Institutional Fund, Inc. — [Portfolio name]" to:
Morgan Stanley Institutional Fund, Inc.
c/o Morgan Stanley Services Company Inc.
P.O. Box 219804
Kansas City, Missouri 64121-9804
A purchase of shares by check ordinarily will be credited to your account at the net asset value per share of each of the Portfolios determined on the day of receipt.
Additional Investments. You may purchase additional shares for your account at any time by purchasing shares at net asset value by any of the methods described above. For additional purchases directly from the Fund, your account name, the Portfolio name and the class selected must be specified in the letter to assure proper crediting to your account. In addition, you may purchase additional shares by wire by following instructions 1 and 2 under "Federal Funds Wire" above.
Investment Through Financial Intermediaries
Certain Financial Intermediaries have made arrangements with the Fund so that an investor may purchase or redeem shares at the net asset value per share next determined after the Financial Intermediary receives the share order. In other instances, the Fund has also authorized such Financial Intermediaries to designate other intermediaries to receive purchase and redemption orders on the Fund's behalf at the share price next determined after such designees receive the share order. Under these arrangements, the Fund will be deemed to have received a purchase or redemption order when the Financial Intermediary or, if applicable, a Financial Intermediary's authorized designee, receives the share order from an investor.
Conversion to a New Share Class
If the value of an account containing shares of a Portfolio falls below the investment minimum for the class of shares held by the account because of shareholder redemption(s) or the failure to meet one of the waiver criteria set forth in the "Purchase of Shares—Minimum Investment" section and, if the account value remains below such investment minimum, the shares in such account may, at the Adviser's discretion, convert to another class of shares offered by the Portfolio, if an account meets the minimum investment amount for such class, and will be subject to the shareholder services fee and other features applicable to such shares. Conversion to another class of shares will result in holding a share class with higher fees. The Fund will not convert to another class of shares based solely upon changes in the market that reduce the net asset value of shares. Under current tax law, conversion between share classes is not a taxable event to the shareholder. Shareholders will be notified prior to any such conversion.
Involuntary Redemption of Shares
If the value of an account falls below the investment minimum for (i) Class L shares or (ii) Class P shares (where the applicable Portfolio does not offer Class H shares or Class L shares) because of shareholder redemption(s) or you no longer meet one of the waiver criteria set forth in the "Purchase of Shares—Minimum Investment" section and if the account value remains below such investment minimum, the shares in such account may be subject to redemption by the Fund. The Fund will not redeem shares based solely upon changes in the market that reduce the net asset value of shares. If redeemed, redemption proceeds will be promptly paid to the shareholder. Shareholders will be notified prior to any such redemption.
REDEMPTION OF SHARES
The Fund normally makes payment for all shares redeemed within one business day of receipt of the request, and in no event more than seven days after receipt of a redemption request in good order. However, payments to investors redeeming shares which were purchased by check will not be made until payment for the purchase has been collected, which may take up to eight days after the date of purchase. The Fund may suspend the right of redemption or postpone the date of payment (i) during any period that the NYSE is closed, or trading on the NYSE is restricted as determined by the SEC; (ii) during any period when an emergency exists as determined by the SEC as a result of which it is not practicable for a Portfolio to dispose of securities it owns, or fairly to determine the value of its assets; and (iii) for such other periods as the SEC may permit.
Class I, Class P and Class L shares of each Portfolio, if offered, may be redeemed at any time at the net asset value per share next determined after receipt by the Fund or its designee of a redemption order as described under "Methods of Redemption" and "Investment through Financial Intermediaries," which may be more or less than the
40
purchase price of your shares. Shares of the Active International Allocation, Emerging Markets, Emerging Markets Debt, International Equity, International Growth Equity, International Real Estate, International Small Cap and Small Company Growth Portfolios redeemed within 30 days of purchase will be subject to a 2% redemption fee, payable to the relevant Portfolio. The redemption fee is designed to protect the Portfolio and its remaining shareholders from the effects of short-term trading. The redemption fee is calculated based on, and deducted from, the redemption proceeds. Each time you redeem or exchange shares, the shares held the longest will be redeemed or exchanged first. See each Prospectus for additional information about redeeming shares of a Portfolio.
Methods of Redemption for Class I, Class P and Class L Shares
You may redeem shares directly from the Fund or through the Distributor by mail or by telephone. However, shares purchased through a Financial Intermediary must be redeemed through a Financial Intermediary. Certain Financial Intermediaries may charge an additional service or transaction fee.
By Mail. Each Portfolio will redeem shares upon receipt of a redemption request in "good order." Redemption requests may be sent by regular mail to Morgan Stanley Institutional Fund, Inc., c/o Morgan Stanley Services Company Inc., P.O. Box 219804, Kansas City, Missouri 64121-9804 or, by overnight courier, to Morgan Stanley Institutional Fund, Inc., c/o Morgan Stanley Services Company Inc., 430 West 7th Street, Kansas City, Missouri 64105.
"Good order" means that the request to redeem shares must include the following:
1. A letter of instruction, if required, or a stock assignment specifying the class and number of shares or dollar amount to be redeemed, signed by all registered owners of the shares in the exact names in which they are registered;
2. Share certificates, if issued;
3. Any required signature guarantees; and
4. Other supporting legal documents, if required, in the case of estates, trusts, guardianships, custodianships, corporations, pension and profit-sharing plans and other organizations.
Redemption requests received in "good order" prior to the Pricing Time will be executed at the net asset value computed on the date of receipt. Redemption requests received after the Pricing Time will be executed at the next determined net asset value. Shareholders who are uncertain of requirements for redemption by mail should consult a Fund representative.
By Telephone. You can redeem Portfolio shares by calling the Fund and requesting that the redemption proceeds be mailed to you or wired to your bank. Please contact one of the Fund's representatives for further details. To change the commercial bank or account designated to receive redemption proceeds, send a written request to the Fund at the address above. Requests to change the bank or account must be signed by each shareholder and each signature must be guaranteed. The telephone redemption option may be difficult to implement at times, particularly during volatile market conditions. If you experience difficulty in making a telephone redemption, you may redeem shares by mail as described above.
The Fund and the Transfer Agent will employ reasonable procedures to confirm that instructions communicated by telephone are genuine. These procedures include requiring the investor to provide certain personal identification information at the time an account is opened and prior to effecting each telephone transaction. In addition, all telephone transaction requests will be recorded and investors may be required to provide additional telecopied written instructions regarding transactions requests. Neither the Fund nor the Transfer Agent will be responsible for any loss, liability, cost or expense for following instructions received by telephone that either of them reasonably believes to be genuine.
Redemption Through Financial Intermediaries
Certain Financial Intermediaries have made arrangements with the Fund to accept redemption requests. These redemptions may be processed in the same way as purchases made through Financial Intermediaries, as described above.
Further Redemption Information
To protect your account and the Fund from fraud, signature guarantees are required for certain redemptions. Signature guarantees enable the Fund to verify the identity of the person who has authorized a redemption from your account. Signature guarantees are required in connection with: (i) all redemptions, regardless of the amount involved, when the proceeds are to be paid to someone other than the registered owner(s) and/or registered address; and (ii) share transfer requests. An "eligible guarantor institution" may include a bank, a trust company, a credit union or savings and loan association, a member firm of a domestic stock exchange, or a foreign branch of any of the foregoing. Notaries public are not acceptable guarantors. The signature guarantees must appear either: (i) on
41
the written request for redemption; (ii) on a separate instrument for assignment ("stock power") which should specify the total number of shares to be redeemed; or (iii) on all stock certificates tendered for redemption and, if shares held by the Fund are also being redeemed, on the letter or stock power.
ACCOUNT POLICIES AND FEATURES
Transfer of Shares
Shareholders may transfer Portfolio shares to another person by making a written request to the Fund. The request should clearly identify the account and number of shares to be transferred, and include the signature of all registered owners and all stock certificates, if any, which are subject to the transfer. It may not be possible to transfer shares purchased through a Financial Intermediary. The signature on the letter of request, the stock certificate or any stock power must be guaranteed in the same manner as described under "Redemption of Shares." As in the case of redemptions, the written request must be received in good order before any transfer can be made. Transferring shares may affect the eligibility of an account for a given class of a Portfolio's shares and may result in involuntary conversion or redemption of such shares. Under certain circumstances, the person who receives the transfer may be required to complete a new Account Registration Form.
Valuation of Shares
The net asset value per share of a class of shares of each Portfolio is determined by dividing the total market value of the Portfolio's investments and other assets attributable to such class, less all liabilities attributable to such class, by the total number of outstanding shares of such class of the Portfolio. Net asset value is calculated separately for each class of a Portfolio and may differ due to class specific expenses paid by each class. Net asset value per share of the Portfolios is determined as of the close of the NYSE (normally 4:00 p.m. Eastern Time) on each day that the NYSE is open for business. Price information on listed securities is taken from the exchange where the security is primarily traded. Portfolio securities are generally valued at their market value.
In the calculation of a Portfolio's net asset value: (1) an equity portfolio security listed or traded on the NYSE or other exchange is valued at its latest sale price, prior to the time when assets are valued; if there were no sales that day, the security is valued at the mean between the last reported bid and asked price; (2) an equity portfolio security listed or traded on the Nasdaq is valued at the NASDAQ Official Closing Price; if there were no sales that day, the security is valued at the mean between the last reported bid and asked price; and (3) all other portfolio securities for which over-the-counter market quotations are readily available are valued at the mean between the last reported bid and asked price. In cases where a security is traded on more than one exchange, the security is valued on the exchange designated as the primary market. For equity securities traded on foreign exchanges, the closing price or the latest bid price may be used if there were no sales on a particular day. When market quotations are not readily available, including circumstances under which it is determined by the Adviser or Sub-Advisers that the sale price, the bid price or the mean between the last reported bid and asked price are not reflective of a security's market value, portfolio securities are valued at their fair value as determined in good faith under procedures established by and under the general supervision of the Board. For valuation purposes, quotations of foreign portfolio securities, other assets and liabilities and forward contracts stated in foreign currency are translated into U.S. dollar equivalents at the prevailing market rates prior to the close of the NYSE.
Short-term debt securities with remaining maturities of 60 days or less at the time of purchase are valued at amortized cost, unless the Board determines such valuation does not reflect the securities' market value, in which case these securities will be valued at their fair market value as determined by the Board.
Certain of a Portfolio's securities may be valued by an outside pricing service approved by the Board. The pricing service may utilize a matrix system incorporating security quality, maturity and coupon as the evaluation model parameters, and/or research evaluations by its staff, including review of broker-dealer market price quotations in determining what it believes is the fair valuation of the portfolio securities valued by such pricing service.
Listed options on debt securities are valued at the latest sale price on the exchange on which they are listed unless no sales of such options have taken place that day, in which case they will be valued at the mean between their latest bid and asked prices. Unlisted options on debt securities and all options on equity securities are valued at the mean between their latest bid and asked prices. Futures are valued at the latest price published by the commodities exchange on which they trade unless it is determined that such price does not reflect their market value, in which case they will be valued at their fair value as determined in good faith under procedures established by and under the supervision of the Directors.
Generally, trading in foreign securities, as well as corporate bonds, U.S. government securities and money market instruments, is substantially completed each day at various times prior to the close of the NYSE. The values of such securities used in computing the net asset value of the Portfolio's shares are determined as of such times. Foreign
42
currency exchange rates are also generally determined prior to the close of the NYSE. Occasionally, events which may affect the values of such securities and such exchange rates may occur between the times at which they are determined and the close of the NYSE and will therefore not be reflected in the computation of a Portfolio's net asset value. If events that may affect the value of such securities occur during such period, then these securities may be valued at their fair value as determined in good faith under procedures established by and under the supervision of the Directors.
Although the legal rights of Class I, Class P, Class H and Class L shares will be identical, the different expenses borne by each class will result in different net asset values and dividends for the class. Dividends will differ by approximately the amount of the distribution expense accrual differential among the classes. The net asset value of Class P, Class H and Class L shares will generally be lower than the net asset value of Class I shares as a result of the shareholder services fees charged to Class P and Class H shares and the distribution and shareholder services fees charged to Class L shares and certain other class-specific expenses of Class H and Class L shares.
MANAGEMENT OF THE FUND
Officers and Directors
The Board of the Fund consists of 10 Directors. These same individuals also serve as directors or trustees for certain of the funds advised by the Adviser and Morgan Stanley AIP GP LP (the "Institutional Funds") and Morgan Stanley Investment Advisors Inc. ("MSIA") (the "Retail Funds"). Nine Directors have no affiliation or business connection with the Adviser or any of its affiliated persons and do not own any stock or other securities issued by the Adviser's parent company, Morgan Stanley. These Directors are the "non-interested" or "Independent" Directors of the Fund. The other Director (the "Interested Director") is affiliated with the Adviser.
Independent Directors
The Independent Directors of the Fund, their age, address, term of office and length of time served, their principal business occupations during the past five years, the number of portfolios in the Fund Complex (defined below) overseen by each Independent Director (as of December 31, 2008) and other directorships, if any, held by the Directors, are shown below. The Fund Complex includes all open-end and closed-end funds (including all of their portfolios) advised by the Adviser and any funds that have an investment adviser that is an affiliated person of the Adviser (including, but not limited to, MSIA).
Independent Directors:
| Name, Age and Address of Independent Director | Position(s) Held with Registrant | Length of Time Served* | Principal Occupation(s) During Past 5 Years | Number of Portfolios in Fund Complex Overseen by Independent Director | Other Directorships Held by Independent Director | ||||||||||||||||||
| Frank L. Bowman (64) c/o Kramer Levin Naftalis & Frankel LLP Counsel to the Independent Directors 1177 Avenue of the Americas New York, NY 10036 | Director | Since August 2006 | President, Strategic Decisions, LLC (consulting) (since February 2009); Director or Trustee of various Retail Funds and Institutional Funds (since August 2006); Chairperson of the Insurance Sub-Committee of the Compliance and Insurance Committee (since February 2007); Served as President and Chief Executive Officer of the Nuclear Energy Institute (policy organization) through November 2008; retired as Admiral, U.S. Navy in January 2005 after serving over 8 years as Director of the Naval Nuclear Propulsion Program and Deputy Administrator—Naval Reactors in the National Nuclear Security Administration at the U.S. Department of Energy (1996-2004). Knighted as Honorary Knight Commander of the Most Excellent Order of the British Empire; Awarded the Officer de l'Orde National du Mérite by the French Government. | 168 | Director of the Armed Services YMCA of the USA; member, BP America External Advisory Council (energy); member, National Academy of Engineers. | ||||||||||||||||||
* This is the earliest date the Director began serving the Retail Funds or Institutional Funds. Each Director serves an indefinite term, until his or her successor is elected.
43
| Name, Age and Address of Independent Director | Position(s) Held with Registrant | Length of Time Served* | Principal Occupation(s) During Past 5 Years | Number of Portfolios in Fund Complex Overseen by Independent Director | Other Directorships Held by Independent Director | ||||||||||||||||||
| Michael Bozic (68) c/o Kramer Levin Naftalis & Frankel LLP Counsel to the Independent Directors 1177 Avenue of the Americas New York, NY 10036 | Director | Since April 1994 | Private investor; Chairperson of the Compliance and Insurance Committee (since October 2006); Director or Trustee of the Retail Funds (since April 1994) and Institutional Funds (since July 2003); formerly, Chairperson of the Insurance Committee (July 2006-September 2006), Vice Chairman of Kmart Corporation (December 1998-October 2000), Chairman and Chief Executive Officer of Levitz Furniture Corporation (November 1995-November 1998) and President and Chief Executive Officer of Hills Department Stores (May 1991-July 1995); variously Chairman, Chief Executive Officer, President and Chief Operating Officer (1987-1991) of the Sears Merchandise Group of Sears, Roebuck & Co. | 170 | Director of various business organizations. | ||||||||||||||||||
| Kathleen A. Dennis (55) c/o Kramer Levin Naftalis & Frankel LLP Counsel to the Independent Directors 1177 Avenue of the Americas New York, NY 10036 | Director | Since August 2006 | President, Cedarwood Associates (mutual fund and investment management consulting) (since July 2006); Chairperson of the Money Market and Alternatives Sub-Committee of the Investment Committee (since October 2006) and Director or Trustee of various Retail Funds and Institutional Funds (since August 2006); formerly, Senior Managing Director of Victory Capital Management (1993-2006). | 168 | Director of various non-profit organizations. | ||||||||||||||||||
| Dr. Manuel H. Johnson (60) c/o Johnson Smick Group, Inc. 888 16th Street, N.W. Suite 740 Washington, D.C. 20006 | Director | Since July 1991 | Senior Partner, Johnson Smick International, Inc. (consulting firm); Chairperson of the Investment Committee (since October 2006) and Director or Trustee of the Retail Funds (since July 1991) and Institutional Funds (since July 2003); Co-Chairman and a founder of the Group of Seven Council (G7C) (international economic commission); formerly, Chairperson of the Audit Committee (July 1991-September 2006), Vice Chairman of the Board of Governors of the Federal Reserve System and Assistant Secretary of the U.S. Treasury. | 170 | Director of NVR, Inc. (home construction); Director of Evergreen Energy. | ||||||||||||||||||
* This is the earliest date the Director began serving the Retail Funds or Institutional Funds. Each Director serves an indefinite term, until his or her successor is elected.
44
| Name, Age and Address of Independent Director | Position(s) Held with Registrant | Length of Time Served* | Principal Occupation(s) During Past 5 Years | Number of Portfolios in Fund Complex Overseen by Independent Director | Other Directorships Held by Independent Director | ||||||||||||||||||
| Joseph J. Kearns (66) c/o Kearns & Associates LLC PMB754 23852 Pacific Coast Highway Malibu, CA 90265 | Director | Since August 1994 | President, Kearns & Associates LLC (investment consulting); Chairperson of the Audit Committee (since October 2006) and Director or Trustee of the Retail Funds (since July 2003) and Institutional Funds (since August 1994); formerly, Deputy Chairperson of the Audit Committee (July 2003-September 2006) and Chairperson of the Audit Committee of the Institutional Funds (October 2001-July 2003); CFO of the J. Paul Getty Trust. | 171 | Director of Electro Rent Corporation (equipment leasing) and The Ford Family Foundation. | ||||||||||||||||||
| Michael F. Klein (50) c/o Kramer Levin Naftalis & Frankel LLP Counsel to the Independent Directors 1177 Avenue of the Americas New York, NY 10036 | Director | Since August 2006 | Managing Director, Aetos Capital, LLC (since March 2000) and Co-President, Aetos Alternatives Management, LLC (since January 2004); Chairperson of the Fixed Income Sub-Committee of the Investment Committee (since October 2006) and Director or Trustee of various Retail Funds and Institutional Funds (since August 2006); formerly, Managing Director, Morgan Stanley & Co. Inc. and Morgan Stanley Dean Witter Investment Management, President, Morgan Stanley Institutional Funds (June 1998-March 2000) and Principal, Morgan Stanley & Co. Inc. and Morgan Stanley Dean Witter Investment Management (August 1997-December 1999). | 168 | Director of certain investment funds managed or sponsored by Aetos Capital, LLC. Director of Sanitized AG and Sanitized Marketing AG (specialty chemicals). | ||||||||||||||||||
| Michael E. Nugent (72) c/o Triumph Capital, L.P. 445 Park Avenue New York, NY 10022 | Chairperson of the Board and Director | Chairperson of the Boards since July 2006 and Trustee since July 1991 | General Partner, Triumph Capital, L.P. (private investment partnership); Chairperson of the Boards of the Retail Funds and Institutional Funds (since July 2006); Director or Trustee of the Retail Funds (since July 1991) and Institutional Funds (since July 2001); formerly, Chairperson of the Insurance Committee (until July 2006). | 170 | None. | ||||||||||||||||||
* This is the earliest date the Director began serving the Retail Funds or Institutional Funds. Each Director serves an indefinite term, until his or her successor is elected.
45
| Name, Age and Address of Independent Director | Position(s) Held with Registrant | Length of Time Served* | Principal Occupation(s) During Past 5 Years | Number of Portfolios in Fund Complex Overseen by Independent Director | Other Directorships Held by Independent Director | ||||||||||||||||||
| W. Allen Reed (62) c/o Kramer Levin Naftalis & Frankel LLP Counsel to the Independent Directors 1177 Avenue of the Americas New York, NY 10036 | Director | Since August 2006 | Chairperson of the Equity Sub-Committee of the Investment Committee (since October 2006) and Director or Trustee of various Retail Funds and Institutional Funds (since August 2006); formerly, President and CEO of General Motors Asset Management; Chairman and Chief Executive Officer of the GM Trust Bank and Corporate Vice President of General Motors Corporation (August 1994-December 2005). | 168 | Director of Temple-Inland Industries (packaging and forest products); Director of Legg Mason, Inc. and Director of the Auburn University Foundation. | ||||||||||||||||||
| Fergus Reid (76) c/o Lumelite Plastics Corporation 85 Charles Colman Blvd. Pawling, NY 12564 | Director | Since June 1992 | Chairman, Lumelite Plastics Corporation; Chairperson of the Governance Committee and Director or Trustee of the Retail Funds (since July 2003) and Institutional Funds (since June 1992). | 171 | Trustee and Director of certain investment companies in the JPMorgan Funds complex managed by JP Morgan Investment Management Inc. | ||||||||||||||||||
* This is the earliest date the Director began serving the Retail Funds or Institutional Funds. Each Director serves an indefinite term, until his or her successor is elected.
The Director who is affiliated with the Adviser or affiliates of the Adviser (as set forth below) and executive officers of the Fund, their age, address, term of office and length of time served, their principal business occupations during the past five years, the number of portfolios in the Fund Complex overseen by the Interested Director (as of December 31, 2008) and the other directorships, if any, held by the Interested Director, are shown below.
Interested Director:
| Name, Age and Address of Interested Director | Position(s) Held with Registrant | Length of Time Served* | Principal Occupation(s) During Past 5 Years | Number of Portfolios in Fund Complex Overseen by Interested Director | Other Directorships Held by Interested Director | ||||||||||||||||||
| James F. Higgins (61) c/o Morgan Stanley Trust Harborside Financial Center Plaza Two Jersey City, NJ 07311 | Director | Since June 2000 | Director or Trustee of the Retail Funds (since June 2000) and Institutional Funds (since July 2003); Senior Advisor of Morgan Stanley (since August 2000). | 169 | Director of AXA Financial, Inc. and The Equitable Life Assurance Society of the United States (financial services). | ||||||||||||||||||
* This is the earliest date the Director began serving the Retail Funds or Institutional Funds. Each Director serves an indefinite term, until his or her successor is elected.
46
Executive Officers:
| Name, Age and Address of Executive Officer | Position(s) Held with Registrant | Length of Time Served** | Principal Occupation(s) During Past 5 Years | ||||||||||||
| Randy Takian (34) 522 Fifth Avenue New York, NY 10036 | President and Principal Executive Officer | Since September 2008 | President and Principal Executive Officer (since September 2008) of funds in the Fund Complex; President and Chief Executive Officer of Morgan Stanley Services Company Inc. (since September 2008). President of the Adviser (since July 2008). Head of the Retail and Intermediary business within Morgan Stanley Investment Management (since July 2008). Head of Liquidity and Bank Trust business (since July 2008) and the Latin American franchise (since July 2008) at Morgan Stanley Investment Management. Managing Director, Director and/or Officer of the Adviser and various entities affiliated with the Adviser. Formerly Head of Strategy and Product Development for the Alternatives Group and Senior Loan Investment Management. Formerly with Bank of America (July 1996-March 2006), most recently as Head of the Strategy, Mergers and Acquisitions team for Global Wealth and Investment Management. | ||||||||||||
| Kevin Klingert (46) 522 Fifth Avenue New York, NY 10036 | Vice President | Since June 2008 | Global Head, Chief Operating Officer and acting Chief Investment Officer of the Global Fixed Income Group of Morgan Stanley Investment Management Inc. and the Investment Adviser (since April 2008). Head of Global Liquidity Portfolio Management and co-Head of Liquidity Credit Research of Morgan Stanley Investment Management (since December 2007). Managing Director of Morgan Stanley Investment Management Inc. and the Investment Adviser (since December 2007). Previously, Managing Director on the Management Committee and head of Municipal Portfolio Management and Liquidity at BlackRock (October 1991 to January 2007). | ||||||||||||
| Carsten Otto (45) 522 Fifth Avenue New York, NY 10036 | Chief Compliance Officer | Since October 2004 | Managing Director and Global Head of Compliance for Morgan Stanley Investment Management (since April 2007) and Chief Compliance Officer of the Retail Funds and Institutional Funds (since October 2004). Formerly, U.S. Director of Compliance (October 2004-April 2007) and Assistant Secretary and Assistant General Counsel of the Retail Funds. | ||||||||||||
| Stefanie V. Chang Yu (42) 522 Fifth Avenue New York, NY 10036 | Vice President | Since December 1997 | Managing Director of the Adviser and various entities affiliated with the Adviser; Vice President of the Retail Funds (since July 2002) and Institutional Funds (since December 1997); Secretary of various entities affiliated with the Adviser. | ||||||||||||
| Mary E. Mullin (42) 522 Fifth Avenue New York, NY 10036 | Secretary | Since June 1999 | Executive Director of the Adviser and various entities affiliated with the Adviser; Secretary of the Retail Funds (since July 2003) and Institutional Funds (since June 1999). | ||||||||||||
** This is the earliest date the Officer began serving the Retail Funds or Institutional Funds. Each Officer serves an indefinite term, until his or her successor is elected.
47
| Name, Age and Address of Executive Officer | Position(s) Held with Registrant | Length of Time Served** | Principal Occupation(s) During Past 5 Years | ||||||||||||
| James Garrett (40) 522 Fifth Avenue New York, NY 10036 | Treasurer and Chief Financial Officer | Treasurer since February 2002 and Chief Financial Officer since July 2003 | Head of Global Fund Administration; Managing Director of the Adviser and various entities affiliated with the Adviser; Treasurer and Chief Financial Officer of the Institutional Funds. | ||||||||||||
** This is the earliest date the Officer began serving the Retail Funds or Institutional Funds. Each Officer serves an indefinite term, until his or her successor is elected.
For each Director, the dollar range of equity securities beneficially owned by the Director in the Fund and in the Family of Investment Companies (Family of Investment Companies includes all of the registered investment companies advised by the Adviser, MSIA and Morgan Stanley AIP GP LP) for the calendar year ended December 31, 2008 is set forth in the table below.
| Name of Director | Dollar Range of Equity Securities in the Fund (As of December 31, 2008) | Aggregate Dollar Range of Equity Securities in All Registered Investment Companies Overseen by Director in Family of Investment Companies (As of December 31, 2008) | |||||||||
| Independent: | |||||||||||
| Frank L. Bowman(1) | (2) | over $100,000 | |||||||||
| Michael Bozic | none | over $100,000 | |||||||||
| Kathleen A. Dennis | none | over $100,000 | |||||||||
| Manuel H. Johnson | none | over $100,000 | |||||||||
| Joseph J. Kearns(1) | (3) | over $100,000 | |||||||||
| Michael F. Klein | (4) | over $100,000 | |||||||||
| Michael E. Nugent | (5) | over $100,000 | |||||||||
| W. Allen Reed(1) | (6) | over $100,000 | |||||||||
| Fergus Reid(1) | (7) | over $100,000 | |||||||||
| Interested: | |||||||||||
| James F. Higgins | none | over $100,000 | |||||||||
1 Includes the total amount of compensation deferred by the Director at his election pursuant to a deferred compensation plan. Such deferred compensation is placed in a deferral account and deemed to be invested in one or more of the Retail Funds or Institutional Funds (or portfolio thereof) that are offered as investment options under the plan.
2 Mr. Bowman: $10,001-$50,000 (Large Cap Relative Value Portfolio); $50,001-$100,000 (U.S. Real Estate Portfolio).
3 Mr. Kearns: Over $100,000 (in each of Large Cap Relative Value Portfolio and U.S. Real Estate Portfolio); $50,001-$100,000 (Small Company Growth Portfolio); $10,001-$50,000 (Balanced Portfolio).
4 Mr. Klein: $1-$10,000 (Small Company Growth Portfolio); $10,001-$50,000 (in each of Capital Growth Portfolio, Emerging Markets Portfolio, Emerging Markets Debt Portfolio, International Equity Portfolio and U.S. Real Estate Portfolio).
5 Mr. Nugent: $10,001-$50,000 (Global Franchise Portfolio).
6 Mr. Reed: $10,001-$50,000 (International Equity Portfolio).
7 Mr. Reid: Over $100,000 (in each of Active International Allocation Portfolio, Capital Growth Portfolio and Large Cap Relative Value Portfolio).
As to each Independent Director and his immediate family members, no person owned beneficially or of record securities in an investment adviser or principal underwriter of the Fund, or a person (other than a registered investment company) directly or indirectly controlling, controlled by or under common control with an investment adviser or principal underwriter of the Fund.
As of December 31, 2008, the Directors and Officers of the Fund, as a group, owned less than 1% of the outstanding common stock of each Portfolio of the Fund.
48
Independent Directors and the Committees
Law and regulation establish both general guidelines and specific duties for the Independent Directors. The Institutional Funds seek as Independent Directors individuals of distinction and experience in business and finance, government service or academia; these are people whose advice and counsel are in demand by others and for whom there is often competition. To accept a position on the Institutional Funds' Boards, such individuals may reject other attractive assignments because the Institutional Funds make substantial demands on their time. The Board has four committees: (1) Audit Committee, (2) Governance Committee, (3) Compliance and Insurance Committee and (4) Investment Committee. Three of the Independent Directors serve as members of the Audit Committee, three Independent Directors serve as members of the Governance Committee, four Directors, including three Independent Directors, serve as members of the Compliance and Insurance Committee and all of the Directors serve as members of the Investment Committee.
The Independent Directors are charged with recommending to the full Board approval of management, advisory and administration contracts, Rule 12b-1 plans and distribution and underwriting agreements; continually reviewing fund performance; checking on the pricing of portfolio securities, brokerage commissions, transfer agent costs and performance and trading among funds in the same complex; and approving fidelity bond and related insurance coverage and allocations, as well as other matters that arise from time to time. The Independent Directors are required to select and nominate individuals to fill any Independent Director vacancy on the board of any fund that has a Rule 12b-1 plan of distribution.
The Board of Directors has a separately-designated standing Audit Committee established in accordance with Section 3(a)(58)(A) of the Securities Exchange Act of 1934, as amended. The Audit Committee is charged with recommending to the full Board the engagement or discharge of the Fund's independent registered public accounting firm; directing investigations into matters within the scope of the independent registered public accounting firm's duties, including the power to retain outside specialists; reviewing with the independent registered public accounting firm the audit plan and results of the auditing engagement; approving professional services provided by the independent registered public accounting firm and other accounting firms prior to the performance of the services; reviewing the independence of the independent registered public account firm; considering the range of audit and non-audit fees; reviewing the adequacy of the Fund's system of internal controls; reviewing the valuation process; and preparing and submitting committee meeting minutes to the full Board. The Fund has adopted a formal, written Audit Committee Charter.
The members of the Audit Committee of the Fund are Joseph J. Kearns, Michael E. Nugent and W. Allen Reed. None of the members of the Fund's Audit Committee is an "interested person," as defined under the 1940 Act, of the Fund (with such disinterested Directors being "Independent Directors" or individually, "Independent Director"). Each Independent Director is also "independent" from the Fund under the listing standards of the NYSE. The Chairperson of the Audit Committee of the Fund is Joseph J. Kearns.
The Board of Directors of the Fund also has a Governance Committee. The Governance Committee identifies individuals qualified to serve as Independent Directors on the Fund's Board and on committees of the Board and recommends such qualified individuals for nomination by the Fund's Independent Directors as candidates for election as Independent Directors, advises the Fund's Board with respect to Board composition, procedures and committees, develops and recommends to the Fund's Board a set of corporate governance principles applicable to the Fund, monitors and makes recommendations on corporate governance matters and policies and procedures of the Fund's Board of Directors and any Board committees and oversees periodic evaluations of the Fund's Board and its committees. The members of the Governance Committee of the Fund are Kathleen A. Dennis, Michael F. Klein and Fergus Reid, each of whom is an Independent Director. The Chairperson of the Governance Committee is Fergus Reid.
The Fund does not have a separate nominating committee. While the Fund's Governance Committee recommends qualified candidates for nominations as Independent Directors, the Board of Directors of the Fund believes that the task of nominating prospective Independent Directors is important enough to require the participation of all current Independent Directors, rather than a separate committee consisting of only certain Independent Directors. Accordingly, each Independent Director (Frank L. Bowman, Michael Bozic, Kathleen A. Dennis, Manuel H. Johnson, Joseph J. Kearns, Michael F. Klein, Michael E. Nugent, W. Allen Reed and Fergus Reid) participates in the election and nomination of candidates for election as Independent Directors for the Fund. Persons recommended by the Fund's Governance Committee as candidates for nomination as Independent Directors shall possess such knowledge, experience, skills, expertise and diversity so as to enhance the Board's ability to manage and direct the affairs and business of the Fund, including, when applicable, to enhance the ability of committees of the Board to fulfill their duties and/or to satisfy any independence requirements imposed by law, regulation or any listing requirements of the NYSE. While the Independent Directors of the Fund expect to be able to continue to identify from their own resources an ample number of qualified candidates for the Fund's Board as they deem
49
appropriate, they will consider nominations from shareholders to the Board. Nominations from shareholders should be in writing and sent to the Independent Directors as described below under the caption "Shareholder Communications."
The Board formed the Compliance and Insurance Committee to address insurance coverage and oversee the compliance function for the Fund and the Board. The Compliance and Insurance Committee consists of Frank L. Bowman, Michael Bozic, James F. Higgins and Manuel H. Johnson. Frank L. Bowman, Michael Bozic and Manuel H. Johnson are Independent Directors. The Chairperson of the Compliance and Insurance Committee is Michael Bozic. The Compliance and Insurance Committee has an Insurance Sub-Committee to review and monitor the insurance coverage maintained by the Fund. The Chairperson of the Insurance Sub-Committee is Frank L. Bowman.
The Investment Committee oversees the portfolio investment process for and reviews the performance of the Fund. The Investment Committee also recommends to the Board to approve or renew the Fund's Investment Advisory, Sub-Advisory and Administration Agreements. The members of the Investment Committee are Frank L. Bowman, Michael Bozic, Kathleen A. Dennis, James F. Higgins, Manuel H. Johnson, Joseph J. Kearns, Michael F. Klein, Michael E. Nugent, W. Allen Reed and Fergus Reid. The Chairperson of the Investment Committee is Manuel H. Johnson.
The Investment Committee has three Sub-Committees, each with its own Chairperson. Each Sub-Committee focuses on the funds' primary areas of investment, namely equities, fixed income and alternatives. The Sub-Committees and their members are as follows:
(1) Equity—W. Allen Reed (Chairperson), Frank L. Bowman and Michael E. Nugent.
(2) Fixed Income—Michael F. Klein (Chairperson), Michael Bozic and Fergus Reid.
(3) Money Market and Alternatives—Kathleen A. Dennis (Chairperson), James F. Higgins and Joseph J. Kearns.
During the Fund's fiscal year ended December 31, 2008, the Board of Directors held the following meetings:
| Board of Directors | 8 | ||||||
| Committee/Sub-Committee: | Number of meetings: | ||||||
| Audit Committee | 4 | ||||||
| Governance Committee | 4 | ||||||
| Compliance and Insurance Committee | 4 | ||||||
| Insurance Sub-Committee | 2 | ||||||
| Investment Committee | 5 | ||||||
| Equity Sub-Committee | 6 | ||||||
| Fixed Income Sub-Committee | 7 | ||||||
| Money Market and Alternatives Sub-Committee | 5 | ||||||
Advantages of Having the Same Individuals as Directors for the Retail Funds and Institutional Funds
The Independent Directors and the Fund's management believe that having the same Independent Directors for each of the Retail Funds and Institutional Funds avoids the duplication of effort that would arise from having different groups of individuals serving as Independent Directors for each of the funds or even of sub-groups of funds. They believe that having the same individuals serve as Independent Directors of all the Retail Funds and Institutional Funds tends to increase their knowledge and expertise regarding matters which affect the Fund Complex generally and enhances their ability to negotiate on behalf of each fund with the fund's service providers. This arrangement also precludes the possibility of separate groups of Independent Directors arriving at conflicting decisions regarding operations and management of the funds and avoids the cost and confusion that would likely ensue. Finally, having the same Independent Directors serve on all fund boards enhances the ability of each fund to obtain, at modest cost to each separate fund, the services of Independent Directors of the caliber, experience and business acumen of the individuals who serve as Independent Directors of the Retail Funds and Institutional Funds.
Shareholder Communications
Shareholders may send communications to the Fund's Board of Directors. Shareholders should send communications intended for the Fund's Board by addressing the communications directly to that Board (or
50
individual Board members) and/or otherwise clearly indicating in the salutation that the communication is for the Board (or individual Board members) and by sending the communication to either the Fund's office or directly to such Board member(s) at the address specified for each Director previously noted. Other shareholder communications received by the Fund not directly addressed and sent to the Board will be reviewed and generally responded to by management, and will be forwarded to the Board only at management's discretion based on the matters contained therein.
Compensation
Each Director (except for the Chairperson of the Boards) receives an annual retainer fee of $200,000 for serving the Retail Funds and the Institutional Funds. The Chairperson of the Audit Committee receives an additional annual retainer fee of $75,000 and the Investment Committee Chairperson receives an additional annual retainer fee of $60,000. Other Committee Chairpersons receive an additional annual retainer fee of $30,000 and the Sub-Committee Chairpersons receive an additional annual retainer fee of $15,000. The aggregate compensation paid to each Director is paid by the Retail Funds and the Institutional Funds, and is allocated on a pro rata basis among each of the operational funds/portfolios of the Retail Funds and the Institutional Funds based on the relative net assets of each of the funds/portfolios. Michael E. Nugent receives a total annual retainer fee of $400,000 for his services as Chairperson of the Boards of the Retail Funds and the Institutional Funds and for administrative services provided to each Board.
The Fund also reimburses such Directors for travel and other out-of-pocket expenses incurred by them in connection with attending such meetings. Directors of the Fund who are employed by the Adviser receive no compensation or expense reimbursement from the Fund for their services as a Director.
Effective April 1, 2004, the Fund began a Deferred Compensation Plan (the "DC Plan"), which allows each Director to defer payment of all, or a portion, of the fees he or she receives for serving on the Board of Directors throughout the year. Each eligible Director generally may elect to have the deferred amounts credited with a return equal to the total return on one or more of the Retail Funds or Institutional Funds (or portfolios thereof) that are offered as investment options under the DC Plan. At the Director's election, distributions are either in one lump sum payment, or in the form of equal annual installments over a period of five years. The rights of an eligible Director and the beneficiaries to the amounts held under the DC Plan are unsecured and such amounts are subject to the claims of the creditors of the Fund.
Prior to April 1, 2004, the Fund maintained a similar Deferred Compensation Plan (the "Prior DC Plan"), which also allowed each Independent Director to defer payment of all, or a portion, of the fees he or she received for serving on the Board of Directors throughout the year. The DC Plan amends and supersedes the Prior DC Plan and all amounts payable under the Prior DC Plan are now subject to the terms of the DC Plan (except for amounts paid during the calendar year 2004, which remain subject to the terms of the Prior DC Plan).
The following table shows aggregate compensation payable to each of the Fund's Directors from the Fund for the fiscal year ended December 31, 2008 and the aggregate compensation payable to each of the Fund's Directors by the Fund Complex (which includes all of the Retail Funds and Institutional Funds) for the calendar year ended December 31, 2008.
| Compensation(1) | |||||||||||
| Name of Independent Director: | Aggregate Compensation From the Fund(2) | Total Compensation from Fund and Fund Complex Paid to Directors(3) | |||||||||
| Frank L. Bowman(2) | $ | 22,121 | $ | 215,000 | |||||||
| Michael Bozic | 23,384 | 230,000 | |||||||||
| Kathleen A. Dennis | 22,141 | 215,000 | |||||||||
| Manuel H. Johnson | 26,434 | 260,000 | |||||||||
| Joseph J. Kearns(2) | 27,934 | 286,250 | |||||||||
| Michael F. Klein | 22,141 | 215,000 | |||||||||
| Michael E. Nugent | 40,708 | 400,000 | |||||||||
| W. Allen Reed(2) | 22,121 | 215,000 | |||||||||
| Fergus Reid | 23,384 | 241,250 | |||||||||
| Name of Interested Director: | |||||||||||
| James F. Higgins | 20,321 | 200,000 | |||||||||
(1) Includes all amounts paid for serving as director/trustee of the funds, as well as serving as Chairperson of the Boards or a Chairperson of a Committee or Sub-Committee.
51
(2) The amounts shown in this column represent the aggregate compensation before deferral with respect to the Fund's fiscal year. The following Directors deferred compensation from the Fund during the fiscal year ended December 31, 2008: Mr. Bowman, $22,121; Mr. Kearns, $13,967; Mr. Reed, $22,121.
(3) The amounts shown in this column represent the aggregate compensation paid by all of the funds in the Fund Complex as of December 31, 2008 before deferral by the Directors under the DC Plan. As of December 31, 2008, the value (including interest) of the deferral accounts across the Fund Complex for Messrs. Bowman, Kearns, Reed and Reid pursuant to the deferred compensation plan was $397,110, $761,543, $332,876 and $474,242, respectively. Because the funds in the Fund Complex have different fiscal year ends, the amounts shown in this column are presented on a calendar year basis.
Prior to December 31, 2003, 49 of the Retail Funds (the "Adopting Funds") had adopted a retirement program under which an Independent Director who retired after serving for at least five years as an Independent Director of any such fund (an "Eligible Director") would have been entitled to retirement payments, based on factors such as length of service, upon reaching the eligible retirement age. On December 31, 2003, the amount of accrued retirement benefits for each Eligible Director was frozen, and will be payable, together with a return of 8% per annum, at or following each such Eligible Director's retirement as shown in the table below.
The following table illustrates the retirement benefits accrued to the Fund's Independent Directors by the Adopting Funds for the calendar year ended December 31, 2008, and the estimated retirement benefits for the Independent Directors from the Adopting Funds for each calendar year following retirement. Only the Directors noted below participated in the retirement program.
| Name of Independent Director: | Retirement Benefits Accrued as Fund Expenses By All Adopting Funds | Estimated Annual Benefits Upon Retirement(1) From All Adopting Funds | |||||||||
| Michael Bozic | $ | 17,198 | $ | 45,874 | |||||||
| Manuel H. Johnson | $ | 18,179 | $ | 67,179 | |||||||
| Michael E. Nugent | $ | 3,512 | $ | 60,077 | |||||||
(1) Total compensation accrued under the retirement plan, together with a return of 8% per annum, will be paid annually commencing upon retirement and continuing for the remainder of the Director's life.
Code of Ethics
Pursuant to Rule 17j-1 under the 1940 Act, the Board of Directors has adopted a Code of Ethics for the Fund and approved a Code of Ethics adopted by the Adviser, each Sub-Adviser and the Distributor (collectively the "Codes"). The Codes are intended to ensure that the interests of shareholders and other clients are placed ahead of any personal interest, that no undue personal benefit is obtained from the person's employment activities and that actual and potential conflicts of interest are avoided.
The Codes are designed to detect and prevent improper personal trading. The Codes permit personnel subject to the Codes to invest in securities, including securities that may be purchased, sold or held by the Fund, subject to a number of restrictions and controls, including prohibitions against purchases of securities in an initial public offering and a pre-clearance requirement with respect to personal securities transactions.
INVESTMENT ADVISORY AND OTHER SERVICES
Investment Adviser
The Adviser is a whollyowned subsidiary of Morgan Stanley, a preeminent global financial services firm engaged in securities trading and brokerage activities, as well as providing investment banking, research and analysis, financing and financial advisory services. The principal offices of Morgan Stanley are located at 1585 Broadway, New York, New York 10036, and the principal offices of the Adviser are located at 522 Fifth Avenue, New York, New York 10036. As of March 31, 2009, the Adviser, together with its affiliated asset management companies, had approximately $351 billion in assets under management or supervision.
The Adviser provides investment advice and portfolio management services pursuant to an Investment Advisory Agreement and, subject to the supervision of the Fund's Board of Directors, makes each of the Portfolio's day-to-day investment decisions, arranges for the execution of portfolio transactions and generally manages each of the Portfolio's investments. Pursuant to the Investment Advisory Agreement, the Adviser is entitled to receive from each class of shares of each Portfolio an annual management fee, payable quarterly, equal to the percentage of average daily net assets set forth in the table below. The Adviser has voluntarily agreed to a reduction in the fees payable to it and to reimburse the Portfolios, if necessary, if such fees would cause the total annual operating expenses of each Portfolio to exceed the percentage of average daily net assets set forth in the table below. In determining the actual amount of
52
voluntary fee waiver and/or expense reimbursement for a Portfolio, if any, the Adviser excludes from annual operating expenses certain investment related expenses, such as foreign country tax expense and interest expense on borrowing and, with respect to Class H and Class L only, transfer agency fees. The Adviser reserves the right to terminate any of its fee waivers and/or expense reimbursements at any time in its sole discretion.
The following table shows for each of the Class I, Class P, Class H and Class L shares (as applicable) of each Portfolio (i) the advisory fee paid for each of the past three fiscal years ended December 31, 2006, 2007 and 2008; and (ii) the maximum expense ratios for each of the Class I, Class P, Class H and Class L shares (as applicable).
| Advisory Fee Paid (After Voluntary Fee Waivers And/Or Expense Reimbursements) | |||||||||||||||||||||||||||||||
| Portfolio | Year Ended December 31, 2008 (000) | Year Ended December 31, 2007 (000) | Year Ended December 31, 2006 (000) | Expense Cap Class I | Expense Cap Class P | Expense Cap Class H | Expense Cap Class L | ||||||||||||||||||||||||
| Active International Allocation | $ | 5,271 | $ | 6,826 | $ | 5,603 | 0.80 | % | 1.05 | % | N/A | N/A | |||||||||||||||||||
| Capital Growth | $ | 5,760 | $ | 6,049 | $ | 4,894 | 0.80 | % | 1.05 | % | N/A | N/A | |||||||||||||||||||
| Emerging Markets | $ | 28,428 | $ | 33,408 | $ | 25,072 | 1.65 | % | 1.90 | % | N/A | N/A | |||||||||||||||||||
| Emerging Markets Debt | $ | 0 | $ | 264 | $ | 548 | 0.85 | % | 1.10 | % | 1.10 | % | 1.60 | % | |||||||||||||||||
| Focus Growth | $ | 26 | $ | 54 | $ | 300 | 1.00 | % | 1.25 | % | N/A | N/A | |||||||||||||||||||
| Global Franchise | $ | 812 | $ | 1,054 | $ | 999 | 1.00 | % | 1.25 | % | N/A | N/A | |||||||||||||||||||
| Global Real Estate | $ | 6,207 | $ | 3,820 | $ | 429 | 1.05 | % | 1.30 | % | 1.30 | % | 1.80 | % | |||||||||||||||||
| Global Value Equity | $ | 358 | $ | 682 | $ | 773 | 1.00 | % | 1.25 | % | N/A | N/A | |||||||||||||||||||
| International Equity | $ | 37,549 | $ | 55,655 | $ | 59,516 | 1.00 | % | 1.25 | % | N/A | N/A | |||||||||||||||||||
| International Growth Equity | $ | 415 | $ | 0 | $ | 0 | 1.00 | % | 1.25 | % | N/A | N/A | |||||||||||||||||||
| International Real Estate | $ | 7,422 | $ | 12,487 | $ | 4,897 | 1.00 | % | 1.25 | % | N/A | N/A | |||||||||||||||||||
| International Small Cap | $ | 5,120 | $ | 11,681 | $ | 13,312 | 1.15 | % | 1.40 | % | N/A | N/A | |||||||||||||||||||
| Large Cap Relative Value | $ | 1,141 | $ | 1,406 | $ | 1,141 | 0.70 | % | 0.95 | % | N/A | N/A | |||||||||||||||||||
| Small Company Growth | $ | 12,703 | $ | 16,796 | $ | 16,580 | 1.10 | % | 1.35 | % | N/A | N/A | |||||||||||||||||||
| U.S. Real Estate | $ | 7,210 | $ | 12,623 | $ | 12,233 | 1.00 | % | 1.25 | % | N/A | N/A | |||||||||||||||||||
| U.S. Small/Mid Cap Value | $ | 140 | $ | 34 | * | N/A | N/A | N/A | N/A | ||||||||||||||||||||||
* Not operational for the period.
The following table shows the contractual advisory fee for each Portfolio.
| Portfolio | Contractual Rate of Advisory Fees | ||||||
| Active International Allocation Portfolio | 0.65% of the portion of the daily net assets not exceeding $1 billion; 0.60% of the portion of the daily net assets exceeding $1 billion. | ||||||
| Capital Growth Portfolio | 0.50% of the portion of the daily net assets not exceeding $1 billion; 0.45% of the portion of the daily net assets exceeding $1 billion but not exceeding $2 billion; 0.40% of the portion of the daily net assets exceeding $2 billion but not exceeding $3 billion; 0.35% of the portion of the daily net assets exceeding $3 billion. | ||||||
| Emerging Markets Portfolio | 1.25% of the portion of the daily net assets not exceeding $500 million; 1.20% of the portion of the daily net assets exceeding $500 million but not exceeding $1 billion; 1.15% of the portion of the daily net assets exceeding $1 billion but not exceeding $2.5 billion; 1.00% of the daily net assets exceeding $2.5 billion. | ||||||
| Emerging Markets Debt Portfolio | 0.75% of the portion of the daily net assets not exceeding $500 million; 0.70% of the portion of the daily net assets exceeding $500 million but not exceeding $1 billion; 0.65% of the portion of the daily net assets exceeding $1 billion. | ||||||
| Focus Growth Portfolio | 0.50% of the portion of the daily net assets not exceeding $1 billion; 0.45% of the portion of the daily net assets exceeding $1 billion but not exceeding $2 billion; 0.40% of the portion of the daily net assets exceeding $2 billion but not exceeding $3 billion; 0.35% of the portion of the daily net assets exceeding $3 billion. | ||||||
53
| Portfolio | Contractual Rate of Advisory Fees | ||||||
| Global Franchise Portfolio | 0.80% of the portion of the daily net assets not exceeding $500 million; 0.75% of the portion of the daily net assets exceeding $500 million but not exceeding $1 billion; 0.70% of the portion of the daily net assets exceeding $1 billion. | ||||||
| Global Real Estate Portfolio | 0.85% of daily net assets. | ||||||
| Global Value Equity Portfolio | 0.67% of the portion of the daily net assets not exceeding $1 billion; 0.645% of the portion of the daily net assets exceeding $1 billion but not exceeding $1.5 billion; 0.62% of the portion of the daily net assets exceeding $1.5 billion but not exceeding $2.5 billion; 0.595% of the portion of the daily net assets exceeding $2.5 billion but not exceeding $3.5 billion; 0.57% of the portion of the daily net assets exceeding $3.5 billion but not exceeding $4.5 billion; 0.545% of the portion of the daily net assets exceeding $4.5 billion. | ||||||
| International Equity Portfolio | 0.80% of the portion of the daily net assets not exceeding $10 billion; 0.75% of the portion of the daily net assets exceeding $10 billion. | ||||||
| International Growth Equity Portfolio | 0.75% of the portion of the daily net assets not exceeding $1 billion; and 0.70% of the portion of the daily net assets exceeding $1 billion. | ||||||
| International Real Estate Portfolio | 0.80% of daily net assets. | ||||||
| International Small Cap Portfolio | 0.95% of the portion of the daily net assets not exceeding $1.5 billion; 0.90% of the portion of the daily net assets exceeding $1.5 billion. | ||||||
| Large Cap Relative Value Portfolio | 0.50% of the portion of the daily net assets not exceeding $150 million; 0.45% of the portion of the daily net assets exceeding $150 million but not exceeding $250 million; 0.40% of the portion of the daily net assets exceeding $250 million but not exceeding $350 million; 0.35% of the portion of the daily net assets exceeding $350 million. | ||||||
| Small Company Growth Portfolio | 0.92% of the portion of the daily net assets not exceeding $1 billion; 0.85% of the portion of the daily net assets exceeding $1 billion but not exceeding $1.5 billion; 0.80% of the portion of the daily net assets exceeding $1.5 billion. | ||||||
| U.S. Real Estate Portfolio | 0.80% of the portion of the daily net assets not exceeding $500 million; 0.75% of the portion of the daily net assets exceeding $500 million but not exceeding $1 billion; 0.70% of the portion of the daily net assets exceeding $1 billion. | ||||||
| U.S. Small/Mid Cap Value Portfolio | 0.67% of daily net assets | ||||||
Investment Sub-Advisers
The Adviser has entered into Sub-Advisory Agreements with Morgan Stanley Investment Management Limited, located at 25 Cabot Square, Canary Wharf, London, England E14 4QA (with respect to the Emerging Markets, Global Franchise, Global Real Estate, Global Value Equity, International Equity, International Real Estate and International Small Cap Portfolios) and Morgan Staley Investment Management Company, located at 23 Church Street, 16-01 Capital Square, Singapore 04948 (with respect to the Emerging Markets, Global Franchise, Global Real Estate, Global Value Equity, International Equity and International Real Estate Portfolios). The Sub-Advisers are wholly owned subsidiaries of Morgan Stanley. The Sub-Advisers provide the relevant Portfolios with investment advisory services subject to the overall supervision of the Adviser and the Fund's Officers and Directors. The Adviser pays the Sub-Advisers on a monthly basis a portion of the net advisory fees the Adviser receives from the relevant Portfolios.
Proxy Voting Policy and Proxy Voting Record
The Board of Directors believes that the voting of proxies on securities held by the Fund is an important element of the overall investment process. As such, the Directors have delegated the responsibility to vote such proxies to Morgan Stanley Investment Management and its advisory affiliates ("MSIM").
54
A copy of MSIM's Proxy Voting Policy ("Proxy Policy") is attached hereto as Appendix B. In addition, a copy of the Proxy Policy, as well as the Fund's most recent proxy voting record for the 12-month period ended June 30, filed with the SEC are available without charge on our web site at www.morganstanley.com/im. The Fund's proxy voting record is also available without charge on the SEC's web site at http://www.sec.gov.
Principal Underwriter
Morgan Stanley Distribution, Inc., with principal offices at 100 Front Street, Suite 400, West Conshohocken, Pennsylvania 19428-2899, serves as principal underwriter to the Fund. For information relating to the services provided by Morgan Stanley Distribution, Inc., see "Distribution of Shares."
Fund Administration
The Adviser also provides administrative services to the Fund pursuant to an Administration Agreement. The services provided under the Administration Agreement are subject to the supervision of the officers and the Board of Directors of the Fund and include day-to-day administration of matters related to the corporate existence of the Fund, maintenance of records, preparation of reports, supervision of the Fund's arrangements with its custodian, and assistance in the preparation of the Fund's registration statement under federal laws. For its services under the Administration Agreement, the Fund pays the Adviser a monthly fee which on an annual basis equals 0.08% of the average daily net assets of each Portfolio. The Adviser may compensate other service providers for performing shareholder servicing and administrative services.
For the fiscal years ended December 31, 2006, 2007 and 2008, the Fund paid the following administrative fees (no administrative fees were waived):
| Administrative Fees Paid | |||||||||||||||
| Portfolio | 2006 ($000) | 2007 ($000) | 2008 ($000) | ||||||||||||
| Active International Allocation | $ | 705 | $ | 854 | $ | 685 | |||||||||
| Capital Growth | $ | 784 | $ | 988 | $ | 946 | |||||||||
| Emerging Markets | $ | 1,691 | $ | 2,317 | $ | 1,962 | |||||||||
| Emerging Markets Debt | $ | 68 | $ | 44 | $ | 29 | |||||||||
| Focus Growth | $ | 48 | $ | 12 | $ | 10 | |||||||||
| Global Franchise | $ | 100 | $ | 106 | $ | 83 | |||||||||
| Global Real Estate | $ | 46 | $ | 361 | $ | 588 | |||||||||
| Global Value Equity | $ | 92 | $ | 82 | $ | 44 | |||||||||
| International Equity | $ | 5,951 | $ | 5,576 | $ | 3,777 | |||||||||
| International Growth Equity | $ | 5 | $ | 7 | $ | 52 | |||||||||
| International Real Estate | $ | 490 | $ | 1,251 | $ | 746 | |||||||||
| International Small Cap | $ | 1,121 | $ | 985 | $ | 433 | |||||||||
| Large Cap Relative Value | $ | 189 | $ | 243 | $ | 192 | |||||||||
| Small Company Growth | $ | 1,513 | $ | 1,538 | $ | 1,137 | |||||||||
| U.S. Real Estate | $ | 1,312 | $ | 1,359 | $ | 751 | |||||||||
| U.S. Small/Mid Cap Value | * | $ | 4 | $ | 17 | ||||||||||
* Not operational for the period.
Sub-Administrator. Under an agreement between the Adviser and J.P. Morgan Investor Services Co. ("JPMorgan"), JPMorgan, a corporate affiliate of JPMorgan Chase, provides certain administrative and accounting services to the Fund. For such services, the Adviser pays JPMorgan a portion of the administrative fee the Adviser receives from the Fund. For the fiscal year ended December 31, 2008, the Adviser paid fees in the amount of $3,261,726 to JPMorgan for services provided to the Fund. The Adviser supervises and monitors the administrative and accounting services provided by JPMorgan. Their services are also subject to the supervision of the officers and Board of Directors of the Fund. JPMorgan's business address is 1 Beacon Street, Boston, Massachusetts 02108-3913.
Custodian
JPMorgan Chase, located at 270 Park Avenue, New York, New York 10017, acts as the Fund's custodian. JPMorgan Chase is not an affiliate of the Adviser or the Distributor. In maintaining custody of foreign assets held outside the United States, JPMorgan Chase employs sub-custodians approved by the Board of Directors of the Fund in accordance with regulations of the SEC for the purpose of providing custodial services for such assets.
55
In the selection of foreign sub-custodians, the Directors or their delegates consider a number of factors, including, but not limited to, the reliability and financial stability of the institution, the ability of the institution to provide efficiently the custodial services required for the Fund, and the reputation of the institution in the particular country or region.
Dividend Disbursing and Transfer Agent
Morgan Stanley Services Company Inc., P.O. Box 219804, Kansas City, Missouri 64121-9804, provides dividend disbursing and transfer agency services for the Fund. Pursuant to a Transfer Agency Agreement, the Fund pays Morgan Stanley Services Company Inc. a fee, which has been approved by the Fund's Board of Directors, generally based on the number of classes, accounts and transactions relating to the Portfolios of the Fund. The Fund and Morgan Stanley Services Company Inc. may enter into agreements with third party intermediaries, pursuant to which such intermediaries agree to provide recordkeeping and other administrative services for their clients who invest in the Portfolios. In such instances, the Fund will pay certain fees to the intermediaries for the services they provide that otherwise would have been performed by Morgan Stanley Services Company Inc.
Portfolio Managers
Other Accounts Managed by the Portfolio Managers
Because the portfolio managers may manage assets for other investment companies, pooled investment vehicles and/or other accounts (including institutional clients, pension plans and certain high net worth individuals), there may be an incentive to favor one client over another resulting in conflicts of interest. For instance, the Adviser and/or Sub-Advisers may receive fees from certain accounts that are higher than the fee it receives from the Fund, or it may receive a performance-based fee on certain accounts. In those instances, the portfolio managers may have an incentive to favor the higher and/or performance-based fee accounts over the Fund. In addition, a conflict of interest could exist to the extent the Adviser and/or Sub-Advisers have proprietary investments in certain accounts, where portfolio managers have personal investments in certain accounts or when certain accounts are investment options in the Adviser's and/or Sub-Advisers' employee benefits and/or deferred compensation plans. The portfolio manager may have an incentive to favor these accounts over others. If the Investment Adviser and/or Sub-Advisers manage accounts that engage in short sales of securities of the type in which the Fund invests, the Investment Adviser and/or Sub-Advisers could be seen as harming the performance of the Fund for the benefit of the accounts engaging in short sales if the short sales cause the market value of the securities to fall. The Adviser and/or Sub-Advisers have adopted trade allocation and other policies and procedures that they believe are reasonably designed to address these and other conflicts of interest.
Portfolio Manager Compensation Structure
Portfolio managers receive a combination of base compensation and discretionary compensation, comprising a cash bonus and several deferred compensation programs described below. The methodology used to determine portfolio manager compensation is applied across all funds/accounts managed by the portfolio managers.
Base Salary Compensation. Generally, the portfolio managers receive base salary compensation based on the level of their position with the Adviser and/or Sub-Advisers.
Discretionary Compensation. In addition to base compensation, the portfolio managers may receive discretionary compensation.
Discretionary compensation can include:
• Cash Bonus.
• Morgan Stanley's Long Term Incentive Compensation awards—a mandatory program that defers a portion of discretionary year-end compensation into restricted stock units or other awards based on Morgan Stanley common stock or other investments that are subject to vesting and other conditions.
• Investment Management Alignment Plan (IMAP) awards—a mandatory program that defers a portion of discretionary year-end compensation and notionally invests it in designated funds advised by the Adviser and/or Sub-Advisers or their affiliates. The award is subject to vesting and other conditions. Portfolio managers must notionally invest a minimum of 25% to a maximum of 100% of their IMAP deferral account into a combination of the designated funds they manage that are included in the IMAP fund menu, which may or may not include one of the Portfolios. For 2008 awards, a clawback provision was implemented that could be triggered if the individual engages in conduct detrimental to the Adviser and/or Sub-Advisers.
56
• Voluntary Deferred Compensation Plans—voluntary programs that permit certain employees to elect to defer a portion of their discretionary year-end compensation and notionally invest the deferred amount across a range of designated investment funds, including funds advised by the Adviser and/or Sub-Advisers or their affiliates.
Several factors determine discretionary compensation, which can vary by portfolio management team and circumstances. In order of relative importance, these factors include:
• Investment performance. A portfolio manager's compensation is linked to the pre-tax investment performance of the funds/accounts managed by the portfolio manager. Investment performance is calculated for one-, three- and five-year periods measured against a fund's/account's primary benchmark (as set forth in the fund's prospectus), indices and/or peer groups where applicable. Generally, the greatest weight is placed on the three- and five-year periods.
• Revenues generated by the investment companies, pooled investment vehicles and other accounts managed by the portfolio manager.
• Contribution to the business objectives of the Adviser and/or Sub-Advisers.
• The dollar amount of assets managed by the portfolio manager.
• Market compensation survey research by independent third parties.
• Other qualitative factors, such as contributions to client objectives.
• Performance of Morgan Stanley and Morgan Stanley Investment Management, and the overall performance of the investment team(s) of which the portfolio manager is a member.
Other Accounts Managed by Portfolio Managers as of December 31, 2008 (unless otherwise indicated):
| Registered Investment Companies | Other Pooled Investment Vehicles | Other Accounts | |||||||||||||||||||||||||
| Portfolio and Portfolio Managers | Number of Accounts | Total Assets in the Accounts | Number of Accounts | Total Assets in the Accounts | Number of Accounts | Total Assets in the Accounts | |||||||||||||||||||||
| Active International Allocation | |||||||||||||||||||||||||||
| Ann D. Thivierge | 3 | $934.6 million | 1 | $361.6 million | 68 | $4.6 billion | |||||||||||||||||||||
| Capital Growth, Focus Growth, Small Company Growth | |||||||||||||||||||||||||||
| Sam G. Chainani | 26 | $10.6 billion | 4 | $739.6 million | 4,376 | $3.0 billion | |||||||||||||||||||||
| David S. Cohen | 26 | $10.6 billion | 4 | $739.6 million | 4,376 | $3.0 billion | |||||||||||||||||||||
| Dennis P. Lynch | 26 | $10.6 billion | 4 | $739.6 million | 4,376 | $3.0 billion | |||||||||||||||||||||
| Armistead B. Nash | 26 | $10.6 billion | 4 | $739.6 million | 4,376 | $3.0 billion | |||||||||||||||||||||
| Alexander T. Norton | 26 | $10.6 billion | 4 | $739.6 million | 4,376 | $3.0 billion | |||||||||||||||||||||
| Jason C. Yeung | 26 | $10.6 billion | 4 | $739.6 million | 4,376 | $3.0 billion | |||||||||||||||||||||
| Emerging Markets | |||||||||||||||||||||||||||
| Eric Carlson | 5 | $2.2 billion | — | — | — | — | |||||||||||||||||||||
| James Cheng | 11 | $3.3 billion | — | — | 5 | (1) | $3.9 billion(1) | ||||||||||||||||||||
| Ana Cristina Piedrahita | 4 | $2.1 billion | — | — | 5 | (2) | $1.1 billion(2) | ||||||||||||||||||||
| William Scott Piper | 4 | $2.1 billion | — | — | 5 | (2) | $1.1 billion(2) | ||||||||||||||||||||
| Paul C. Psaila | 7 | $2.3 billion | 1 | $255.5 million | 10 | $565.4 million | |||||||||||||||||||||
| Ruchir Sharma | 13 | $2.9 billion | 9 | $3.1 billion | 23 | (3) | $7.3 billion(3) | ||||||||||||||||||||
| Emerging Markets Debt | |||||||||||||||||||||||||||
| Eric Baurmeister | 8 | $1.3 billion | 9 | $791.4 million | 8 | $1.9 billion | |||||||||||||||||||||
| Federico Kaune | 8 | $1.3 billion | 9 | $791.4 million | 8 | $1.9 billion | |||||||||||||||||||||
| Abigail McKenna | 8 | $1.3 billion | 9 | $791.4 million | 8 | $1.9 billion | |||||||||||||||||||||
| Global Franchise | |||||||||||||||||||||||||||
| Michael Allison | 7 | $1.9 billion | 4 | $1.9 billion | 27 | $5.5 billion | |||||||||||||||||||||
| Paras Dodhia | 7 | $1.9 billion | 4 | $1.9 billion | 27 | $5.5 billion | |||||||||||||||||||||
| Hassan Elmasry | 7 | $1.9 billion | 4 | $1.9 billion | 27 | $5.5 billion | |||||||||||||||||||||
| John Kelly-Jones | 4 | $1.6 billion | — | — | 2 | $208.3 million | |||||||||||||||||||||
| Jayson Vowles | 7 | $1.9 billion | 4 | $1.9 billion | 27 | $5.5 billion | |||||||||||||||||||||
57
| Registered Investment Companies | Other Pooled Investment Vehicles | Other Accounts | |||||||||||||||||||||||||
| Portfolio and Portfolio Managers | Number of Accounts | Total Assets in the Accounts | Number of Accounts | Total Assets in the Accounts | Number of Accounts | Total Assets in the Accounts | |||||||||||||||||||||
| Global Real Estate, International Real Estate, U.S.Real Estate | |||||||||||||||||||||||||||
| Theodore R. Bigman | 10 | $3.0 billion | 9 | $2.1 billion | 607 | (4) | $6.6 billion(4) | ||||||||||||||||||||
| Angeline Ho | 10 | $3.0 billion | 9 | $2.1 billion | 607 | (4) | $6.6 billion(4) | ||||||||||||||||||||
| Michiel te Paske | 4 | $1.3 billion | 8 | $1.6 billion | 55 | (5) | $3.7 billion(5) | ||||||||||||||||||||
| Sven van Kemenade | 4 | $1.3 billion | 8 | $1.6 billion | 54 | (4) | $3.8 billion(5) | ||||||||||||||||||||
| Global Value Equity | |||||||||||||||||||||||||||
| Michael Allison | 7 | $1.9 billion | 4 | $1.9 billion | 27 | $5.5 billion | |||||||||||||||||||||
| Paras Dodhia | 7 | $1.9 billion | 4 | $1.9 billion | 27 | $5.5 billion | |||||||||||||||||||||
| Hassan Elmasry | 7 | $1.9 billion | 4 | $1.9 billion | 27 | $5.5 billion | |||||||||||||||||||||
| Jayson Vowles | 7 | $1.9 billion | 4 | $1.9 billion | 27 | $5.5 billion | |||||||||||||||||||||
| International Equity | |||||||||||||||||||||||||||
| Christian Derold | 2 | $3.6 billion | — | — | — | — | |||||||||||||||||||||
| John S. Goodacre | 2 | $3.6 billion | 2 | $4.2 billion | — | — | |||||||||||||||||||||
| William D. Lock | 3 | $4.4 billion | 3 | $4.3 billion | 10 | (6) | $3.8 billion(6) | ||||||||||||||||||||
| Walter B. Riddell | 3 | $4.4 billion | 3 | $4.3 billion | 2 | $568.1 million | |||||||||||||||||||||
| Peter J. Wright | 3 | $4.4 billion | 3 | $4.3 billion | 16 | $5.0 billion | |||||||||||||||||||||
| International Growth Equity | |||||||||||||||||||||||||||
| Brian W. Arcese | 5 | $985.8 million | 2 | $280.1 million | 1,082 | $1.0 billion | |||||||||||||||||||||
| David H. Sugimoto | 5 | $985.8 million | 2 | $280.1 million | 1,082 | $1.0 billion | |||||||||||||||||||||
| Johannes B. van den Berg | 5 | $985.8 million | 2 | $280.1 million | 1,082 | $1.0 billion | |||||||||||||||||||||
| International Small Cap | |||||||||||||||||||||||||||
| Jean Beaubois | 5 | $950.1 million | 15 | $823.6 million | 11 | $718.2 million | |||||||||||||||||||||
| Alistair Corden-Lloyd | 5 | $950.1 million | 15 | $823.6 million | 11 | $718.2 million | |||||||||||||||||||||
| Nathalie Degans | 5 | $950.1 million | 15 | $823.6 million | 11 | $718.2 million | |||||||||||||||||||||
| Margaret Naylor | 5 | $950.1 million | 15 | $823.6 million | 11 | $718.2 million | |||||||||||||||||||||
| Arthur Pollock | 5 | $950.1 million | 15 | $823.6 million | 11 | $718.2 million | |||||||||||||||||||||
| Alexander Vislykh | 5 | $950.1 million | 15 | $823.6 million | 11 | $718.2 million | |||||||||||||||||||||
| Large Cap Relative Value | |||||||||||||||||||||||||||
| Thomas B. Bastian | 13 | $21.2 billion | — | — | 11 | $2.3 billion | |||||||||||||||||||||
| Mark J. Laskin | 13 | $21.2 billion | — | — | 11 | $2.3 billion | |||||||||||||||||||||
| Mary Jayne Maly | 13 | $21.2 billion | — | — | 11 | $2.3 billion | |||||||||||||||||||||
| Sergio Marcheli | 13 | $21.2 billion | — | — | 11 | $2.3 billion | |||||||||||||||||||||
| James O. Roeder | 13 | $21.2 billion | — | — | 11 | $2.3 billion | |||||||||||||||||||||
| U.S. Small/Mid Cap Value | |||||||||||||||||||||||||||
| Richard Glass | 5 | $1.3 billion | 1 | $83.2 million | 1,057 | $170.4 million | |||||||||||||||||||||
| Alexander Yaggy | 5 | $1.3 billion | 1 | $83.2 million | 1,057 | $170.4 million | |||||||||||||||||||||
(1) Of these other accounts, one account with a total of approximately $302.8 million in assets, had performance-based fees.
(2) Of these other accounts, two accounts with a total of approximately $701.3 million in assets, had performance-based fees.
(3) Of these other accounts, four accounts with a total of approximately $1.1 billion in assets, had performance-based fees.
(4) Of these other accounts, 10 accounts with a total of approximately $485.9 million in assets, had performance-based fees.
(5) Of these other accounts, five accounts with a total of approximately $196 million in assets, had performance-based fees.
(6) Of these other accounts, one account with a total of approximately $280.1 million in assets, had performance-based fees.
Securities Ownership of Portfolio Managers (as of December 31, 2008, unless otherwise noted)
| Portfolio and Portfolio Managers | Portfolio Holdings | ||||||
| Active International Allocation | |||||||
| Ann D. Thivierge | over $1 million | ||||||
58
| Portfolio and Portfolio Managers | Portfolio Holdings | ||||||
| Capital Growth | |||||||
| Sam G. Chainani | $ | 10,001-$50,000 | * | ||||
| David S. Cohen | $ | 50,001-$100,000 | |||||
| Dennis P. Lynch | $ | 100,001-$500,000 | * | ||||
| Armistead B. Nash | $ | 1-$10,000 | ** | ||||
| Alexander T. Norton | $ | 1-$10,000 | * | ||||
| Jason C. Yeung | $ | 10,001-$50,000 | |||||
| Emerging Markets | |||||||
| Eric Carlson | $ | 100,001-$500,000 | |||||
| James Cheng | $ | 100,001-$500,000 | |||||
| Ana Cristina Piedrahita | $ | 100,001-$500,000 | |||||
| William Scott Piper | $ | 50,001-$100,000 | |||||
| Paul C. Psaila | $ | 100,001-$500,000 | |||||
| Ruchir Sharma | over $1 million | ||||||
| Emerging Markets Debt | |||||||
| Eric Baurmeister | $ | 10,001-$50,000 | |||||
| Federico Kaune | $ | 50,001-$100,000 | |||||
| Abigail McKenna | $ | 100,001-$500,000 | |||||
| Focus Growth | |||||||
| Sam G. Chainani | None | ||||||
| David S. Cohen | None | ||||||
| Dennis P. Lynch | None | ||||||
| Armistead B. Nash | None | ||||||
| Alexander T. Norton | None | ||||||
| Jason C. Yeung | None | ||||||
| Global Franchise | |||||||
| Michael Allison | $ | 100,001-$500,000 | |||||
| Paras Dodhia | $500,001-$1 million* | ||||||
| Hassan Elmasry | over $1 million | ||||||
| John Kelly-Jones | $ | 100,001-$500,000 | |||||
| Jayson Vowles | $ | 100,001-$500,000 | ** | ||||
| Global Real Estate | |||||||
| Theodore R. Bigman | None | ||||||
| Angeline Ho | $ | 1-$10,000 | |||||
| Michiel te Paske | $ | 1-$10,000 | |||||
| Sven van Kemenade | None | ||||||
| Global Value Equity | |||||||
| Michael Allison | None | ||||||
| Paras Dodhia | None* | ||||||
| Jayson Vowles | None** | ||||||
| International Equity | |||||||
| Christian Derold | $ | 100,001-$500,000 | |||||
| John S. Goodacre | $500,001-$1 million | ||||||
| William D. Lock | over $1 million* | ||||||
| Walter B. Riddell | over $1 million | ||||||
| Peter J. Wright | over $1 million | ||||||
| International Growth Equity | |||||||
| Brian W. Arcese | $ | 1-$10,000 | * | ||||
| David H. Sugimoto | $ | 10,001-$50,000 | * | ||||
| Johannes B. van den Berg | $ | 50,001-$100,000 | * | ||||
| International Real Estate | |||||||
| Theodore R. Bigman | $ | 100,001-$500,000 | |||||
| Angeline Ho | None | ||||||
| Michiel te Paske | $ | 1-$10,000 | |||||
| Sven van Kemenade | None | ||||||
59
| Portfolio and Portfolio Managers | Portfolio Holdings | ||||||
| International Small Cap | |||||||
| Jean Beaubois | $ | 1-$10,000 | |||||
| Alistair Corden-Lloyd | $ | 10,001-$50,000 | |||||
| Nathalie Degans | $ | 100,001-$500,000 | |||||
| Margaret Naylor | $ | 100,001-$500,000 | |||||
| Arthur Pollock | $ | 50,001-$100,000 | |||||
| Alexander Vislykh | None | ||||||
| Large Cap Relative Value | |||||||
| Thomas B. Bastian | $500,001-$1 million | ||||||
| Mark J. Laskin | $ | 10,001-$50,000 | |||||
| Mary Jayne Maly | None* | ||||||
| Sergio Marcheli | $ | 10,001-$50,000 | * | ||||
| James O. Roeder | $ | 100,001-$500,000 | * | ||||
| Small Company Growth | |||||||
| Sam G. Chainani | $ | 50,001-$100,000 | |||||
| David S. Cohen | $ | 100,001-$500,000 | * | ||||
| Dennis P. Lynch | $500,001-$1 million | ||||||
| Armistead B. Nash | $ | 1-$10,000 | |||||
| Alexander T. Norton | $ | 10,001-$50,000 | |||||
| Jason C. Yeung | $ | 10,001-$50,000 | |||||
| U.S. Real Estate | |||||||
| Theodore R. Bigman | $500,001-$1 million | ||||||
| Angeline Ho | None | ||||||
| Michiel te Paske | $ | 1-$10,000 | |||||
| Sven van Kemenade | $ | 1-$10,000 | |||||
| U.S. Small/Mid Cap Value | |||||||
| Richard Glass | $ | 100,001-$500,000 | |||||
| Alexander Yaggy | $ | 10,001-$50,000 | * | ||||
* The portfolio manager has made investments in one or more registered investment companies managed by the same portfolio management team pursuant to a similar strategy.
** Not included in the table above, the portfolio manager has made investments in one or more other pooled investment vehicles (i.e., funds not formed or registered in the United States).
Independent Registered Public Accounting Firm
Ernst & Young LLP, located at 200 Clarendon Street, Boston, Massachusetts 02116, serves as the Fund's independent registered public accounting firm and audits the annual financial statements of each Portfolio.
Fund Counsel
Clifford Chance US LLP, located at 31 West 52nd Street, New York, New York 10019, acts as the Fund's legal counsel.
DISTRIBUTION AND SHAREHOLDER SERVICES PLANS
Morgan Stanley Distribution, Inc., an indirect wholly owned subsidiary of Morgan Stanley, serves as the Fund's exclusive distributor of Portfolio shares pursuant to a Distribution Agreement. In addition, to promote the sale of Fund shares, the Fund has adopted a Shareholder Services Plan with respect to the Class P shares of each Portfolio, a Shareholder Services Plan with respect to the Class H shares of the Emerging Markets Debt Portfolio and Global Real Estate Portfolio and a Distribution and Shareholder Services Plan with respect to Class L shares of the Emerging Markets Debt Portfolio and Global Real Estate Portfolio under Rule 12b-1 of the 1940 Act (each, a "Plan"). Under the Plans, each Portfolio pays the Distributor a shareholder services fee of up to 0.25% of the Class P shares' average daily net assets on an annualized basis, and each of the Emerging Markets Debt Portfolio and Global Real Estate Portfolio pays the Distributor a shareholder services fee of up to 0.25% of each of the Class H shares' and Class L shares' average daily net assets on an annualized basis and a distribution fee of 0.50% of the Class L shares' average daily net assets on an annualized basis. Morgan Stanley Distribution, Inc. may retain any portion of the fees it does not expend in meeting its obligations to the Fund. The Distributor may compensate financial intermediaries, plan fiduciaries and administrators, which may or may not be affiliated with Morgan Stanley, for providing distribution-related or shareholder support services, including account maintenance services,
60
to shareholders (including, where applicable, underlying beneficial owners) of the Fund. The Distributor and the Adviser also may compensate third parties out of their own assets.
The Plans for the Class P, Class H and Class L shares were approved by the Fund's Board of Directors, including the Independent Directors, none of whom has a direct or indirect financial interest in the operation of a Plan or in any agreements related thereto.
The following table describes the shareholder servicing fees paid by each Portfolio with respect to its Class P, Class H and Class L shares pursuant to the Plans and the distribution-related expenses for each Portfolio with respect to its Class P, Class H and Class L shares for the fiscal year ended December 31, 2008. To the extent that expenditures on distribution-related activities exceed the fees paid by a Portfolio, the excess amounts were paid by the Adviser or the Distributor out of its own resources.
| Portfolio | Total Shareholder Servicing Fees Paid by Portfolio | Shareholder Servicing Expenses | Shareholder Servicing Fees Retained by Morgan Stanley & Co. (Expenditures in Excess of Shareholder Servicing Fees) | ||||||||||||
| Class P | |||||||||||||||
| Active International Allocation | $ | 11,680 | $ | 11,599 | $ | 81 | |||||||||
| Capital Growth | 308,567 | 305,497 | 3,069 | ||||||||||||
| Emerging Markets | 312,986 | 307,195 | 5,791 | ||||||||||||
| Emerging Markets Debt | 4,345 | 3,544 | 801 | ||||||||||||
| Focus Growth | 5,021 | 3,659 | 1,362 | ||||||||||||
| Global Franchise | 11,451 | 11,146 | 305 | ||||||||||||
| Global Real Estate | 50,819 | 48,591 | 2,228 | ||||||||||||
| Global Value Equity | 42,560 | 40,812 | 1,748 | ||||||||||||
| International Equity | 2,184,942 | 2,138,934 | 46,009 | ||||||||||||
| International Growth Equity | 893 | 409 | 485 | ||||||||||||
| International Real Estate | 144,582 | 139,755 | 4,827 | ||||||||||||
| International Small Cap | 8 | 5 | 3 | ||||||||||||
| Large Cap Relative Value | 103,186 | 102,17 | 1,007 | ||||||||||||
| Small Company Growth | 1,316,664 | 1,297,979 | 18,685 | ||||||||||||
| U.S. Real Estate | 363,184 | 350,126 | 13,058 | ||||||||||||
| U.S. Small/Mid Cap Value | 198 | — | 198 | ||||||||||||
| $ | 4,861,086 | $ | 4,659,251 | $ | 99,657 | ||||||||||
| Class H | |||||||||||||||
| Emerging Markets Debt | 7,973 | 7,767 | 207 | ||||||||||||
| Global Real Estate | 1,061 | 830 | 231 | ||||||||||||
| $ | 9,034 | $ | 8,597 | $ | 438 | ||||||||||
| Class L | |||||||||||||||
| Emerging Markets Debt | 1,127 | 1,109 | 18 | ||||||||||||
| Global Real Estate | 884 | 873 | 11 | ||||||||||||
| $ | 2,011 | $ | 1,982 | $ | 29 | ||||||||||
| Total | $ | 4,873,438 | $ | 4,669,830 | $ | 101,430 | |||||||||
Revenue Sharing
The Adviser and/or the Distributor may pay compensation, out of their own funds and not as an expense of the Portfolios, to certain affiliated entities of the Adviser or the Distributor ("Affiliated Entities"), certain insurance companies and/or other unaffiliated financial intermediaries, including recordkeepers and administrators of various deferred compensation plans ("Intermediaries"), in connection with the sale, distribution, marketing and/or retention of shares of the Portfolios and/or shareholder servicing. For example, the Adviser or the Distributor may pay additional compensation to an Intermediary for, among other things, promoting the sale and distribution of Portfolio shares, providing access to various programs, mutual fund platforms or preferred or recommended mutual fund lists offered by the Intermediary, granting the Distributor access to the Intermediary's financial advisors and consultants, providing assistance in the ongoing education and training of the Intermediary's financial personnel, furnishing marketing support, maintaining share balances and/or for sub-accounting, recordkeeping, administrative, shareholder, or transaction processing services. Such payments are in addition to any shareholder servicing fees and/or transfer agency fees that may be payable by the Portfolios. The additional payments are generally based on current assets, but may also be based on other measures as determined from time to time by the
61
Adviser and/or the Distributor (e.g., gross sales or number of accounts). The amount of these payments may be different for different Intermediaries.
With respect to Affiliated Entities, these payments currently include the following amounts, which are paid in accordance with the applicable compensation structure:
(1) on Class I shares of certain Portfolios held directly in an Affiliated Entity's traditional brokerage accounts, an ongoing annual fee in an amount (i) up to 35% of each Portfolio's advisory fees accrued from the average daily net asset value of such shares or (ii) up to 0.25% of the total average monthly net asset value of such shares;
(2) on Class P, Class H and Class L shares held directly in an Affiliated Entity's traditional brokerage accounts or held in non-Affiliated Entity accounts where the Affiliated Entity is designated by purchasers as broker-dealer of record, an ongoing annual fee in an amount up to 0.03% of the total average monthly net asset value of such shares; and
(3) On Class I, Class P, Class H and Class L shares held in taxable accounts through any fee-based advisory program offered by an Affiliated Entity, an ongoing annual fee in an amount up to 0.03% of the total average monthly net asset value of such shares.
With respect to other Intermediaries, these payments, which are made in accordance with the applicable compensation structure for each Intermediary, are currently equal to an ongoing annual fee in an amount up to 0.10% of the total average daily net asset value of Class I, Class P, Class H and Class L shares held in the applicable accounts.
The prospect of receiving, or the receipt of, additional compensation as described above by Affiliated Entities or other Intermediaries may provide Affiliated Entities and such other Intermediaries and their financial advisors and other salespersons with an incentive to favor sales of shares of the Portfolios over other investment options with respect to which the Affiliated Entity or other Intermediary does not receive additional compensation (or receives lower levels of additional compensation). These payment arrangements, however, will not change the price that an investor pays for shares of a Portfolio or the amount that a Portfolio receives to invest on behalf of an investor. Investors may wish to take such payment arrangements into account when considering and evaluating any recommendations relating to Portfolio shares and should review carefully any disclosure provided by an Affiliated Entity or other Intermediary as to its compensation.
BROKERAGE PRACTICES
Portfolio Transactions
Morgan Stanley Investment Management Inc., as each Portfolio's investment adviser, is responsible for decisions to buy and sell securities for each Portfolio, for broker-dealer selection and for negotiation of commission rates. The Adviser and/or Sub-Advisers are prohibited from directing brokerage transactions on the basis of the referral of clients or the sale of shares of advised investment companies. Purchases and sales of securities on a stock exchange are effected through brokers who charge a commission for their services. In the over-the-counter market, securities may be traded as agency transactions through broker dealers or traded on a "net" basis with dealers acting as principal for their own accounts without a stated commission, although the price of the security usually includes profit to the dealer. In underwritten offerings, securities are purchased at a fixed price which includes an amount of compensation to the underwriter, generally referred to as the underwriter's concession or discount. When securities are purchased or sold directly from or to an issuer, no commissions or discounts are paid.
On occasion, a Portfolio may purchase certain money market instruments directly from an issuer without payment of a commission or concession. Money market instruments are generally traded on a "net" basis with dealers acting as principal for their own accounts without a stated commission, although the price of the security usually includes a profit to the dealer.
The Fund anticipates that certain of its transactions involving foreign securities will be effected on securities exchanges. Fixed commissions on such transactions are generally higher than negotiated commissions on domestic transactions. There is also generally less government supervision and regulation of foreign securities exchanges and brokers than in the United States.
The Adviser and/or Sub-Advisers serve as investment adviser to a number of clients, including other investment companies. The Adviser and/or Sub-Advisers attempt to equitably allocate purchase and sale transactions among the Portfolios of the Fund and other client accounts. To that end, the Adviser and/or Sub-Advisers consider various factors, including respective investment objectives, relative size of portfolio holdings of
62
the same or comparable securities, availability of cash for investment, size of investment commitments generally held and the opinions of the persons responsible for managing the Portfolios of the Fund and other client accounts.
The Adviser and/or Sub-Advisers select the brokers or dealers that will execute the purchases and sales of investment securities for each Portfolio. The Adviser and/or Sub-Advisers effect transactions with those broker-dealers that they believe provide prompt execution of orders in an effective manner at the most favorable prices. The Adviser and/or Sub-Advisers may place portfolio transactions with those brokers and dealers who also furnish research and other services to the Fund, the Adviser and/or the Sub-Advisers. Services provided may include (a) furnishing advice as to the value of securities, the advisability of investing in, purchasing or selling securities, and the availability of securities or purchasers or sellers of securities; (b) furnishing analyses and reports concerning issuers, industries, securities, economic factors and trends, portfolio strategy, and the performance of accounts; and (c) effecting securities transactions and performing functions incidental thereto (such as clearance, settlement and custody). When a particular item (such as proxy services) has both research and non-research related uses, the Adviser will make a reasonable allocation of the cost of the item between research and non-research uses and may pay for the portion of the cost allocated to research uses with commissions. In certain instances, the Adviser and/or Sub-Advisers may instruct certain brokers to pay for research provided by executing brokers or third-party research providers, which are selected independently by the Adviser and/or Sub-Advisers. In seeking to determine the reasonableness of brokerage commissions paid in any transaction, the Adviser and/or Sub-Advisers rely upon their experience and knowledge regarding commissions generally charged by various brokers and on their judgment in evaluating the brokerage and research services received from the broker effecting the transaction. The Adviser and/or Sub-Advisers are unable to ascertain the exact dollar value of these services due to the subjective and imprecise nature of their determinations. The information and services received by the Adviser and/or Sub-Advisers from brokers and dealers may be utilized by the Adviser and/or Sub-Advisers and any of their asset management affiliates in the management of accounts of some of their other clients and may not in all cases benefit the Fund directly. To the extent that the Adviser and/or Sub-Advisers receive these services from brokers and dealers, they will not have to pay for these services themselves.
Affiliated Brokers
Subject to the overriding objective of obtaining the best execution of orders, the Fund may use broker-dealer affiliates of the Adviser to effect Portfolio brokerage transactions, including transactions in futures contracts and options on futures contracts, under procedures adopted by the Fund's Board of Directors. In order to use such affiliates, the commission rates and other remuneration paid to the affiliates must be fair and reasonable in comparison to those of other broker-dealers for comparable transactions involving similar securities being purchased or sold during a comparable time period. This standard would allow the affiliated broker or dealer to receive no more than the remuneration which would be expected to be received by an unaffiliated broker.
Pursuant to an order issued by the SEC, the Fund is permitted to engage in principal transactions involving money market instruments, subject to certain conditions, with Morgan Stanley & Co., a broker-dealer affiliated with the Fund's Adviser.
During the fiscal years ended December 31, 2006, 2007 and 2008, the Fund did not effect any principal transactions with Morgan Stanley & Co.
Brokerage Commissions Paid
During the fiscal years ended December 31, 2006, 2007 and 2008, the Fund paid brokerage commissions of approximately $25,692,090, $30,373,848 and $25,000,314, respectively. During the fiscal years ended December 31, 2006, 2007 and 2008, the Fund paid in the aggregate $45,191, $189,115 and $275,203, respectively, in brokerage commissions to Morgan Stanley & Co. Incorporated (the Fund's distributor until April 28, 2005). During the fiscal year ended December 31, 2008, the brokerage commissions paid to Morgan Stanley & Co. Incorporated represented approximately 1.10% of the total brokerage commissions paid by the Fund during the year 2008 and were paid on account of transactions having an aggregate dollar value equal to approximately 1.39% of the aggregate dollar value of all portfolio transactions of the Fund during the year 2008 for which commissions were paid.
63
For the fiscal year ended December 31, 2008, each Portfolio of the Fund paid brokerage commissions, including brokerage commissions paid to affiliated broker-dealers as follows:
| Brokerage Commissions Paid During Fiscal Year Ended December 31, 2008 | |||||||||||||||||||
| Commissions Paid to Morgan Stanley & Co. Incorporated | |||||||||||||||||||
| Portfolio | Total Commissions Paid | Total Commissions | Percent of Total Commissions | Percent of Total Brokered Transactions | |||||||||||||||
| Active International Allocation | $ | 408,695 | $ | — | — | % | — | % | |||||||||||
| Capital Growth | $ | 979,057 | $ | 5,840 | 0.60 | % | 0.40 | % | |||||||||||
| Emerging Markets | $ | 10,763,950 | $ | 68,379 | 0.64 | % | 0.60 | % | |||||||||||
| Emerging Markets Debt | $ | — | $ | — | — | % | — | % | |||||||||||
| Focus Growth | $ | 9,175 | $ | — | — | % | — | % | |||||||||||
| Global Franchise | $ | 72,835 | $ | 137 | 0.19 | % | 0.21 | % | |||||||||||
| Global Real Estate | $ | 1,600,508 | $ | 91,053 | 5.69 | % | 5.81 | % | |||||||||||
| Global Value Equity | $ | 114,406 | $ | 1,756 | 1.53 | % | 1.66 | % | |||||||||||
| International Equity | $ | 5,798,214 | $ | — | — | % | — | % | |||||||||||
| International Growth Equity | $ | 107,479 | $ | — | — | % | — | % | |||||||||||
| International Real Estate | $ | 1,777,676 | $ | 77,060 | 4.33 | % | 3.03 | % | |||||||||||
| International Small Cap | $ | 993,724 | $ | — | — | % | — | % | |||||||||||
| Large Cap Relative Value | $ | 250,079 | $ | 1,942 | 0.78 | % | 0.53 | % | |||||||||||
| Small Company Growth | $ | 1,020,325 | $ | 1,921 | 0.19 | % | 0.11 | % | |||||||||||
| U.S. Real Estate | $ | 1,036,892 | $ | 24,325 | 2.35 | % | 2.28 | % | |||||||||||
| U.S. Small/Mid Cap Value | $ | 40,939 | $ | 2,757 | 6.73 | % | 6.13 | % | |||||||||||
For the fiscal years ended December 31, 2007 and 2006, each Portfolio of the Fund paid brokerage commissions, including brokerage commissions paid to affiliated broker-dealers as follows:
| Brokerage Commission Paid During Fiscal Years Ended December 31, 2007 and 2006 | |||||||||||||||||||
| Fiscal Year Ended December 31, 2007 | Fiscal Year Ended December 31, 2006 | ||||||||||||||||||
| Portfolio | Total | Morgan Stanley & Co. Incorporated | Total | Morgan Stanley & Co. Incorporated | |||||||||||||||
| Active International Allocation | $ | 410,887 | $ | 0 | $ | 289,626 | $ | 0 | |||||||||||
| Capital Growth | $ | 1,041,511 | $ | 48,381 | $ | 974,414 | $ | 4,705 | |||||||||||
| Emerging Markets | $ | 12,211,878 | $ | 39,417 | $ | 6,782,234 | $ | 0 | |||||||||||
| Emerging Markets Debt | $ | 3 | $ | 0 | $ | 2,797 | $ | 35,609 | |||||||||||
| Focus Growth | $ | 11,831 | $ | 956 | $ | 60,519 | $ | 0 | |||||||||||
| Global Franchise | $ | 55,327 | $ | 0 | $ | 55,194 | $ | 1,845 | |||||||||||
| Global Real Estate | $ | 1,020,306 | $ | 11,074 | $ | 139,753 | $ | 0 | |||||||||||
| Global Value Equity | $ | 67,375 | $ | 734 | $ | 77,961 | $ | 0 | |||||||||||
| International Equity | $ | 6,295,931 | $ | 0 | $ | 8,543,908 | $ | 0 | |||||||||||
| International Growth Equity | $ | 11,355 | $ | 0 | $ | 4,197 | $ | 0 | |||||||||||
| International Real Estate | $ | 3,061,289 | $ | 5,301 | $ | 1,301,644 | $ | 0 | |||||||||||
| International Small Cap | $ | 2,311,725 | $ | 0 | $ | 2,029,306 | $ | 0 | |||||||||||
| Large Cap Relative Value | $ | 143,886 | $ | 2,231 | $ | 124,522 | $ | 0 | |||||||||||
| Small Company Growth | $ | 2,207,649 | $ | 20,019 | $ | 3,958,952 | $ | 3,031 | |||||||||||
| U.S. Real Estate | $ | 1,361,705 | $ | 60,266 | $ | 1,216,110 | $ | 0 | |||||||||||
| U.S. Small/Mid Cap Value | $ | 14,196 | $ | 50 | * | * | |||||||||||||
* Not operational for the period.
64
Directed Brokerage. During the fiscal year ended December 31, 2008, the Portfolios paid brokerage commissions to brokers because of research services provided as follows:
| Portfolio | Brokerage Commissions Directed in Connection with Research Services Provided for Fiscal Year Ended December 31, 2008 | Aggregate Dollar Amount of Transactions for Which Such Commissions were Paid for Fiscal Year Ended December 31, 2008 | |||||||||
| Active International Allocation | $ | — | $ | — | |||||||
| Capital Growth | $ | — | $ | — | |||||||
| Emerging Markets | $ | 401,830 | $ | 172,274,160 | |||||||
| Emerging Markets Debt | $ | — | $ | — | |||||||
| Focus Growth | $ | — | $ | — | |||||||
| Global Franchise | $ | — | $ | — | |||||||
| Global Real Estate | $ | 170,917 | $ | 70,916,216 | |||||||
| Global Value Equity | $ | — | $ | — | |||||||
| International Equity | $ | — | $ | — | |||||||
| International Growth Equity | $ | 2,193 | $ | 1,057,086 | |||||||
| International Real Estate | $ | 124,561 | $ | 50,920,474 | |||||||
| International Small Cap | $ | — | $ | — | |||||||
| Large Cap Relative Value | $ | — | $ | — | |||||||
| Small Company Growth | $ | — | $ | — | |||||||
| U.S. Real Estate | $ | — | $ | — | |||||||
| U.S. Small/Mid Cap Value | $ | 242 | $ | 105,488 | |||||||
Regular Broker-Dealers
The Fund's regular broker-dealers are (i) the ten broker-dealers that received the greatest dollar amount of brokerage commissions from the Fund; (ii) the ten broker-dealers that engaged as principal in the largest dollar amount of portfolio transactions; and (iii) the ten broker-dealers that sold the largest dollar amount of Portfolio shares. During the fiscal year ended December 31, 2008, the following Portfolios purchased securities issued by the Fund's regular broker-dealers:
| Portfolio | Regular Broker-Dealer | Value of Portfolio Holding as of December 31, 2008 | |||||||||
| Active International Allocation | Banco Santander | $ | 2,322,000 | ||||||||
| Credit Suisse Group | 2,130,000 | ||||||||||
| UBS AG | 1,014,000 | ||||||||||
| Deutsche Bank AG | 582,000 | ||||||||||
| Emerging Markets Debt | J.P. Morgan Chase & Co. | 966,000 | |||||||||
| UBS AG | 545,000 | ||||||||||
| International Equity | UBS AG | 12,047,000 | |||||||||
| International Growth Equity | Banco Santander | 551,000 | |||||||||
| Large Cap Relative Value | J.P. Morgan Chase & Co. | 8,974,000 | |||||||||
Portfolio Turnover
The Portfolios generally do not invest for short-term trading purposes; however, when circumstances warrant, each Portfolio may sell investment securities without regard to the length of time they have been held. Market conditions in a given year could result in a higher or lower portfolio turnover rate than expected and the Portfolios will not consider portfolio turnover rate a limiting factor in making investment decisions consistent with their investment objectives and policies. Higher portfolio turnover (e.g., over 100%) necessarily will cause the Portfolios to pay correspondingly increased brokerage and trading costs. In addition to transaction costs, higher portfolio turnover may result in the realization of capital gains. As discussed under "Taxes," to the extent net short-term capital gains are realized, any distributions resulting from such gains are considered ordinary income for federal income tax purposes.
GENERAL INFORMATION
Fund History
The Fund was incorporated pursuant to the laws of the State of Maryland on June 16, 1988 under the name Morgan Stanley Institutional Fund, Inc. The Fund filed a registration statement with the SEC registering itself as
65
an open-end management investment company offering diversified and non-diversified series under the 1940 Act and its shares under the 1933 Act, as amended, and commenced operations on November 15, 1988. On December 1, 1998, the Fund changed its name to Morgan Stanley Dean Witter Institutional Fund, Inc. Effective May 1, 2001, the Fund changed its name to Morgan Stanley Institutional Fund, Inc. No Portfolio is subject to the liabilities of any other Portfolio.
Description of Shares and Voting Rights
The Fund's Amended and Restated Articles of Incorporation permit the Directors to issue 21.5 billion shares of common stock, par value $.001 per share ($.003 with respect to the Emerging Markets Debt Portfolio—Class I, Class P, Class H and Class L shares), from an unlimited number of classes or series of shares. The shares of each Portfolio of the Fund, when issued, are fully paid and nonassessable, and have no preference as to conversion, exchange, dividends, retirement or other features. Portfolio shares have no pre-emptive rights. The shares of the Fund have non-cumulative voting rights, which means that the holders of more than 50% of the shares voting for the election of Directors can elect 100% of the Directors if they choose to do so. Shareholders are entitled to one vote for each full share held (and a fractional vote for each fractional share held), then standing in their name on the books of the Fund. No Portfolio is subject to the liabilities of any other Portfolio.
Dividends and Capital Gains Distributions
The Fund's policy is to distribute substantially all of each Portfolio's net investment income, if any. The Fund may also distribute any net realized capital gains in the amount and at the times that will avoid both income (including taxable gains) taxes on it and the imposition of the federal excise tax on income and capital gains (see "Taxes"). However, the Fund may also choose to retain net realized capital gains and pay taxes on such gains. The amounts of any income dividends or capital gains distributions cannot be predicted.
Any dividend or distribution paid shortly after the purchase of shares of a Portfolio by an investor may have the effect of reducing the per share net asset value of that Portfolio by the per share amount of the dividend or distribution. Furthermore, such dividends or distributions, although in effect a return of capital, are subject to income taxes for shareholders subject to tax as set forth herein and in the applicable Prospectus.
As set forth in the Prospectuses, unless the shareholder elects otherwise in writing, all dividends and capital gains distributions for a class of shares are automatically reinvested in additional shares of the same class of the Portfolio at net asset value (as of the business day following the record date). This automatic reinvestment of dividends and distributions will remain in effect until the shareholder notifies the Fund by telephone or in writing that either the Income Option (income dividends in cash and capital gain distributions reinvested in shares at net asset value) or the Cash Option (both income dividends and capital gains distributions in cash) has been elected. It may take up to three business days to effect this change. An account statement is sent to shareholders whenever a dividend or distribution is paid.
TAXES
The following is only a summary of certain additional federal income tax considerations generally affecting the Fund, Portfolios and their shareholders. No attempt is made to present a detailed explanation of the federal, state or local tax treatment of the Fund, Portfolios or shareholders, and the discussion here and in the Prospectuses is not intended to be a substitute for careful tax planning.
The following general discussion of certain federal income tax consequences is based on the Code and the regulations issued thereunder as in effect on the date of this SAI. New legislation, as well as administrative changes or court decisions, may significantly change the conclusions expressed herein, and may have a retroactive effect with respect to the transactions contemplated herein.
Each Portfolio within the Fund is generally treated as a separate corporation for federal income tax purposes. Thus, the provisions of the Code generally will be applied to each Portfolio separately, rather than to the Fund as a whole.
Regulated Investment Company Qualification
Each Portfolio intends to qualify and elect to be treated for each taxable year as a regulated investment company ("RIC") under Subchapter M of the Code. In order to so qualify, each Portfolio must, among other things, (i) derive at least 90% of its gross income each taxable year from dividends, interest, payments with respect to securities loans, gains from the sale or other disposition of stock, securities or foreign currencies, and other income derived with respect to its business of investing in such stock, securities or currencies, including, generally, certain
66
gains from options, futures and forward contracts; and (ii) diversify its holdings so that, at the end of each fiscal quarter of the Portfolio's taxable year, (a) at least 50% of the market value of the Portfolio's total assets is represented by cash and cash items, U.S. government securities, securities of other RICs, and other securities, with such other securities limited, in respect to any one issuer, to an amount not greater than 5% of the value of the Portfolio's total assets or 10% of the outstanding voting securities of such issuer, and (b) not more than 25% of the value of its total assets are invested in the securities (other than U.S. government securities or securities of other RICs) of any one issuer or two or more issuers which the Portfolio controls and which are engaged in the same, similar, or related trades or businesses. For purposes of the 90% gross income requirement described above, foreign currency gains will generally be treated as qualifying income under current federal income tax law. However, the Code expressly provides the U.S. Treasury with authority to issue regulations that would exclude foreign currency gains from qualifying income if such gains are not directly related to a RIC's business of investing in stock or securities (or options or futures with respect to stocks or securities). While to date the U.S. Treasury has not exercised this regulatory authority, there can be no assurance that it will not issue regulations in the future (possibly with retroactive application) that would treat some or all of a Portfolio's foreign currency gains as non-qualifying income.
For purposes of the 90% test described above, dividends received by a Portfolio will be treated as qualifying income to the extent they are attributable to the issuer's current and accumulated earnings and profits. Distributions in excess of the distributing issuer's current and accumulated earnings and profits will first reduce the Portfolio's basis in the stock as a return of capital and will not qualify as gross income. Distributions in excess of the Portfolio's basis in the stock will qualify for the 90% test discussed above as the distribution will be treated as gain from the sale of stock. This gain will be long-term capital gain if the Portfolio held the stock for more than a year.
For purposes of the diversification requirement described above, the Portfolio will not be treated as in violation of such requirement as a result of a discrepancy between the value of its various investments and the diversification percentages described above, unless such discrepancy exists immediately following the acquisition of any security or other property and is wholly or partly the result of such acquisition. Moreover, even in the event of noncompliance with the diversification requirement as of the end of any given quarter, the Portfolio is permitted to cure the violation by eliminating the discrepancy causing such noncompliance within a period of 30 days from the close of the relevant quarter other than its first quarter following its election to be taxed as a RIC.
Net income derived from an interest in a "qualified publicly traded partnership," as defined in the Code, will be treated as qualifying income for purposes of the income requirement in clause (i) above. In addition, for the purposes of the diversification requirements in clause (ii) above, the outstanding voting securities of any issuer includes the equity securities of a qualified publicly traded partnership, and no more than 25% of the value of a RIC's total assets may be invested in the securities of one or more qualified publicly traded partnerships. The separate treatment for publicly traded partnerships under the passive loss rules of the Code applies to a RIC holding an interest in a qualified publicly traded partnership, with respect to items attributable to such interest.
In addition to the requirements described above, in order to qualify as a RIC, a Portfolio must distribute at least 90% of its investment company taxable income (which generally includes dividends, taxable interest, and the excess of net short-term capital gains over net long-term capital losses less operating expenses) and at least 90% of its net tax-exempt interest income, for each tax year, if any, to its shareholders. If a Portfolio meets all of the RIC requirements, it will not be subject to federal income tax on any of its investment company taxable income or capital gains that it distributes to shareholders.
If a Portfolio fails to qualify as a RIC for any taxable year, all of its net income will be subject to tax at regular corporate rates (whether or not distributed to shareholders), and its distributions (including capital gains distributions) will be taxable as income dividends to its shareholders to the extent of the Portfolio's current and accumulated earnings and profits, and will be eligible for the dividends-received deduction for corporate shareholders.
General Tax Treatment of Qualifying RICs and Shareholders
Each Portfolio intends to distribute substantially all of its net investment income (including, for this purpose, net short-term capital gains) to shareholders. Dividends from a Portfolio's net investment income generally are taxable to shareholders as ordinary income, whether received in cash or in additional shares. Certain income distributions paid by each Portfolio to individual shareholders are taxed at rates equal to those applicable to net long-term capital gains (currently 15%). This tax treatment applies only if certain holding period requirements are satisfied by the shareholder and the dividends are attributable to qualified dividends received by the Portfolio itself. For this purpose, "qualified dividends" means dividends received by a Portfolio from certain U.S. corporations and qualifying foreign corporations, provided that the Portfolio satisfies certain holding period and other requirements
67
in respect of the stock of such corporations. Distributions received from REITs are generally comprised of ordinary income dividends and capital gains dividends, which are generally passed along to shareholders retaining the same character and are subject to tax accordingly, as described above. In the case of securities lending transactions, payments in lieu of dividends are not qualified dividends. Dividends received by a Portfolio from REITs are qualified dividends eligible for this lower tax rate only in limited circumstances. These special rules relating to the taxation of ordinary income dividends from regulated investment companies generally apply to taxable years beginning before January 1, 2011. Thereafter, each Portfolio's dividends, other than capital gain dividends, will be fully taxable at ordinary income tax rates unless further Congressional legislative action is taken.
A dividend paid by a Portfolio to a shareholder will not be treated as qualified dividend income of the shareholder if (1) the dividend is received with respect to any share held for fewer than 61 days during the 121-day period beginning on the date which is 60 days before the date on which such share becomes ex-dividend with respect to such dividend, (2) to the extent that the recipient is under an obligation (whether pursuant to a short sale or otherwise) to make related payments with respect to positions in substantially similar or related property or (3) if the recipient elects to have the dividend treated as investment income for purposes of the limitation on deductibility of investment interest.
You should also be aware that the benefits of the reduced tax rate applicable to long-term capital gains and qualified dividend income may be impacted by the application of the alternative minimum tax to individual shareholders.
Dividends paid to you out of each Portfolio's investment company taxable income that are not attributable to qualified dividends generally will be taxable to you as ordinary income (currently at a maximum federal income tax rate of 35%, except as noted above) to the extent of each Portfolio's earnings and profits. Distributions to you of net capital gain (the excess of net long-term capital gain over net short-term capital loss), if any, will be taxable to you as long-term capital gain, regardless of how long you have held your Fund shares.
Distributions of net long-term capital gains, if any, are taxable to shareholders as long-term capital gains regardless of how long a shareholder has held a Portfolio's shares and regardless of whether the distribution is received in additional shares or in cash. Under current law, the maximum tax rate on long-term capital gains available to non-corporate shareholders generally is 15%.
Each Portfolio will decide whether to distribute or to retain all or part of any net capital gains (the excess of net long-term capital gains over net short-term capital losses) in any year for reinvestment. Distributions of net capital gains are taxable to shareholders as a long-term capital gain regardless of how long shareholders have held their shares. Each Portfolio will send reports annually to shareholders regarding the federal income tax status of all distributions made for the preceding year. To the extent such amounts include distributions received from a REIT, they may be based on estimates and be subject to change as REITs do not always have the information available by the time these reports are due and can recharacterize certain amounts after the end of the tax year. As a result, the final character and amount of distributions may differ from that initially reported. If any such gains are retained, the Portfolio will pay federal income tax thereon, and, if the Portfolio makes an election, the shareholders will include such undistributed gains in their income, and will increase their tax basis in Portfolio shares by the difference between the amount of the includable gains and the tax deemed paid by the shareholder in respect of such shares. The shareholder will be able to claim their share of the tax paid by the Portfolio as a refundable credit.
Shareholders generally are taxed on any ordinary dividend or capital gain distributions from a Portfolio in the year they are actually distributed. However, if any such dividends or distributions are declared in October, November or December, to shareholders of record of such month and paid in January, then such amounts will be treated for tax purposes as received by the shareholders on December 31.
After the end of each calendar year, shareholders will be sent information on their dividends and capital gain distributions for tax purposes, including the portion taxable as ordinary income, the portion taxable as long-term capital gains, and the amount of any dividends eligible for the federal dividends received deduction for corporations.
Gains or losses on the sale of securities by a Portfolio held as a capital asset will generally be long-term capital gains or losses if the securities have a tax holding period of more than one year at the time of such sale. Gains or losses on the sale of securities with a tax holding period of one year or less will be short-term capital gains or losses. Special tax rules described below may change the normal treatment of gains and losses recognized by a Portfolio when it makes certain types of investments. Those special tax rules can, among other things, affect
68
the treatment of capital gain or loss as long-term or short-term and may result in ordinary income or loss rather than capital gain or loss. The application of these special rules would therefore also affect the character of distributions made by a Portfolio.
A gain or loss realized by a shareholder on the sale, exchange or redemption of shares of a Portfolio held as a capital asset will be capital gain or loss, and such gain or loss will be long-term if the holding period for the shares exceeds one year and otherwise will be short-term. Any loss realized on a sale, exchange or redemption of shares of a Portfolio will be disallowed to the extent the shares disposed of are replaced with substantially identical shares within the 61-day period beginning 30 days before and ending 30 days after the shares are disposed of. Any loss realized by a shareholder on the disposition of shares held six months or less is treated as a long-term capital loss to the extent of any distributions of net long-term capital gains received by the shareholder with respect to such shares or any inclusion of undistributed capital gain with respect to such shares. The ability to deduct capital losses may otherwise be limited under the Code.
Each Portfolio will generally be subject to a nondeductible 4% federal excise tax to the extent it fails to distribute by the end of any calendar year at least 98% of its ordinary income for that year and 98% of its capital gain net income (the excess of short- and long-term capital gains over short- and long-term capital losses, including any available capital loss carryforwards) for the one-year period ending on October 31 of that year, plus certain other amounts. Each Portfolio intends to make sufficient distributions or deemed distributions of its ordinary income and capital gain net income, prior to the end of each calendar year to avoid liability for federal excise tax, but can give no assurances that all such liability will be eliminated.
The Fund may be required to withhold and remit to the U.S. Treasury an amount equal (as of the date hereof) to 28% of any dividends, capital gains distributions and redemption proceeds paid to any individual or certain other non-corporate shareholder (i) who has failed to provide a correct taxpayer identification number (generally an individual's social security number or non-individual's employer identification number) on the Account Registration Form; (ii) who is subject to backup withholding as notified by the Internal Revenue Service ("IRS"); or (iii) who has not certified to the Fund that such shareholder is not subject to backup withholding. This backup withholding is not an additional tax, and any amounts withheld would be sent to the IRS as an advance payment of taxes due on a shareholder's income for such year.
The Fund may make investments in which it recognizes income or gain prior to receiving cash with respect to such investment. For example, under certain tax rules, the Fund may be required to accrue a portion of any discount at which certain securities are purchased as income each year even though the Fund receives no payments in cash on the security during the year. To the extent that the Fund makes such investments, it generally would be required to pay out such income or gain as a distribution in each year to avoid taxation at the Fund level. Such distributions will be made from the available cash of the Fund or by liquidation of portfolio securities if necessary. If a distribution of cash necessitates the liquidation of portfolio securities, the Adviser will select which securities to sell. The Fund may realize a gain or loss from such sales. In the event the Fund realizes net capital gains from such transactions, the Fund and consequently its shareholders may receive a larger capital gain distribution, if any, than they would in the absence of such transactions.
Special Rules for Certain Foreign Currency and Derivatives Transactions
In general, gains from foreign currencies and from foreign currency options, foreign currency futures and forward foreign exchange contracts relating to investments in stock, securities or foreign currencies are currently considered to be qualifying income for purposes of determining whether the Portfolio qualifies as a RIC.
Under Section 988 of the Code, special rules are provided for certain transactions in a foreign currency other than the taxpayer's functional currency (i.e., unless certain special rules apply, currencies other than the U.S. dollar). In general, foreign currency gains or losses from forward contracts, from futures contracts that are not "regulated futures contracts," and from unlisted options will be treated as ordinary income or loss under Section 988 of the Code. Also, certain foreign exchange gains or losses derived with respect to foreign fixed income securities are also subject to Section 988 treatment. In general, therefore, Section 988 gains or losses will increase or decrease the amount of the Portfolio's investment company taxable income available to be distributed to shareholders as ordinary income, rather than increasing or decreasing the amount of the Portfolio's net capital gain.
A Portfolio's investment in options, swaps and related transactions, futures contracts and forward contracts, options on futures contracts and stock indices and certain other securities, including transactions involving actual or deemed short sales or foreign exchange gains or losses are subject to many complex and special tax rules. For example, over-the-counter options on debt securities and equity options, including options on stock and on
69
narrow-based stock indexes, will be subject to tax under Section 1234 of the Code, generally producing a long-term or short-term capital gain or loss upon exercise, lapse or closing out of the option or sale of the underlying stock or security. By contrast, a Portfolio's treatment of certain other options, futures and forward contracts entered into by a Portfolio is generally governed by Section 1256 of the Code. These "Section 1256" positions generally include listed options on debt securities, options on broad-based stock indexes, options on securities indexes, options on futures contracts, regulated futures contracts and certain foreign currency contracts and options thereon.
When a Portfolio holds options or futures contracts which substantially diminish their risk of loss with respect to other positions (as might occur in some hedging transactions), this combination of positions could be treated as a "straddle" for tax purposes, resulting in possible deferral of losses, adjustments in the holding periods of Portfolio securities and conversion of short-term capital losses into long-term capital losses. Certain tax elections exist for mixed straddles (i.e., straddles comprised of at least one Section 1256 position and at least one non-Section 1256 position) which may reduce or eliminate the operation of these straddle rules.
A Section 1256 position held by a Portfolio will generally be marked-to-market (i.e., treated as if it were sold for fair market value) on the last business day of the Fund's fiscal year, and all gain or loss associated with fiscal year transactions and mark-to-market positions at fiscal year end (except certain currency gain or loss covered by Section 988 of the Code) will generally be treated as 60% long-term capital gain or loss and 40% short-term capital gain or loss. The effect of Section 1256 mark-to-market rules may be to accelerate income or to convert what otherwise would have been long-term capital gains into short-term capital gains or short-term capital losses into long-term capital losses within a Portfolio. The acceleration of income on Section 1256 positions may require a Portfolio to accrue taxable income without the corresponding receipt of cash. In order to generate cash to satisfy the distribution requirements of the Code, a Portfolio may be required to dispose of portfolio securities that it otherwise would have continued to hold or to use cash flows from other sources. Any or all of these rules may, therefore, affect the amount, character and timing of income earned and, in turn, distributed to shareholders by a Portfolio.
Special Tax Considerations Relating to Foreign Investments
Gains or losses attributable to foreign currency contracts, or to fluctuations in exchange rates that occur between the time a Portfolio accrues interest or other receivables or accrues expenses or other liabilities denominated in a foreign currency and the time the Portfolio actually collects such receivables or pays such liabilities are treated as ordinary income or ordinary loss to the Portfolio. Similarly, gains or losses on disposition of debt securities denominated in a foreign currency attributable to fluctuations in the value of the foreign currency between the date of acquisition of the security and the date of disposition also are treated as ordinary gain or loss to the Portfolio. These gains or losses increase or decrease the amount of a Portfolio's net investment income available to be distributed to its shareholders as ordinary income.
It is expected that each Portfolio will be subject to foreign withholding taxes with respect to its dividend and interest income from foreign countries, and a Portfolio may be subject to foreign income taxes with respect to other income. So long as more than 50% in value of a Portfolio's total assets at the close of the taxable year consists of stock or securities of foreign corporations, the Portfolio may elect to treat certain foreign income taxes imposed on it for federal income tax purposes as paid directly by its shareholders. A Portfolio will make such an election only if it deems it to be in the best interest of its shareholders and will notify shareholders in writing each year if it makes an election and of the amount of foreign income taxes, if any, to be treated as paid by the shareholders. If a Portfolio makes the election, shareholders will be required to include in income their proportionate share of the amount of foreign income taxes treated as imposed on the Portfolio and will be entitled to claim either a credit (subject to the limitations discussed below) or, if they itemize deductions, a deduction, for their shares of the foreign income taxes in computing their federal income tax liability.
Certain foreign governments levy withholding or other taxes on dividend and interest income. Although in some countries a portion of these taxes are recoverable, the non-recovered portion of foreign withholding taxes will reduce the income received from investments in such countries. Except in the case of the Active International Allocation, Emerging Markets Debt, Emerging Markets, Global Franchise, Global Real Estate, Global Value Equity, International Equity, International Real Estate and International Small Cap Portfolios, it is not expected that a Portfolio or its shareholders would be able to claim a credit for U.S. tax purposes with respect to any such foreign taxes. However, these foreign withholding taxes may not have a significant impact on such Portfolios, considering that each Portfolio's investment objective is to seek long-term capital appreciation and any dividend or interest income should be considered incidental.
70
Shareholders who choose to utilize a credit (rather than a deduction) for foreign taxes will be subject to a number of complex limitations regarding the availability and utilization of the credit. Because of these limitations, shareholders may be unable to claim a credit for the full amount of their proportionate shares of the foreign income taxes paid by a Portfolio. Shareholders are urged to consult their tax advisors regarding the application of these rules to their particular circumstances.
Investments in a foreign corporation that are considered to be a passive foreign investment company for federal income tax purposes may cause a Portfolio to accrue certain amounts as taxable income in advance of the receipt of cash.
Taxes and Foreign Shareholders
Taxation of a shareholder who, as to the United States, is a nonresident alien individual, a foreign trust or estate, a foreign corporation or a foreign partnership ("Foreign Shareholder") depends on whether the income from a Portfolio is "effectively connected" with a U.S. trade or business carried on by such shareholder.
If the income from a Portfolio is not effectively connected with a U.S. trade or business carried on by a Foreign Shareholder, distributions of investment company taxable income will generally be subject to U.S. withholding tax at the rate of 30% (or such lower treaty rate as may be applicable) upon the gross amount of the dividend. Furthermore, Foreign Shareholders will generally be exempt from U.S. federal income tax on gains realized on the sale of shares of a Portfolio, distributions of net long-term capital gains and amounts retained by the Fund that are designated as undistributed capital gains.
For distributions with respect to taxable years of regulated investment companies beginning before January 1, 2010, the Fund is not required to withhold any amounts with respect to distributions to Foreign Shareholders that are properly designated by the Fund as "interest-related dividends" or "short-term capital gains dividends," provided that the income is not subject to federal income tax if earned directly by the Foreign Shareholder. However, the Fund generally intends to withhold these amounts regardless of the fact that it was not required to do so. Any amounts withheld from payments made to a Foreign Shareholder are eligible to be refunded or credited against the shareholder's U.S. federal income tax liability, if any, provided that the required information is furnished to the IRS. Foreign Shareholders that own, either directly or indirectly, more than 5% of a class of Fund shares, are urged to consult their own tax advisors concerning special tax rules that may apply to their investment in Fund shares.
If the income from a Portfolio is effectively connected with a U.S. trade or business carried on by a Foreign Shareholder, then distributions from the Portfolio and any gains realized upon the sale of shares of the Portfolio will be subject to U.S. federal income tax at the rates applicable to U.S. citizens and residents or domestic corporations. In addition, Foreign Shareholders that are corporations may be subject to a branch profit tax.
A Portfolio may be required to withhold federal income tax on distributions that are otherwise exempt from withholding tax (or taxable at a reduced treaty rate) unless the Foreign Shareholder complies with IRS certification requirements.
The tax consequences to a Foreign Shareholder entitled to claim the benefits of an applicable tax treaty may differ from those described here. Furthermore, Foreign Shareholders are strongly urged to consult their own tax advisors with respect to the particular tax consequences to them of an investment in a Portfolio, including the potential application of the provisions of the Foreign Investment in Real Estate Property Tax Act of 1980, as amended.
State and Local Tax Considerations
Rules of state and local taxation of dividend and capital gains from regulated investment companies often differ from the rules for federal income taxation described above. Shareholders are urged to consult their tax advisors as to the consequences of these and other state and local tax rules regarding an investment in the Fund.
71
CONTROL PERSONS AND PRINCIPAL HOLDERS OF SECURITIES
As of March 31, 2009, the following persons or entities own, of record or beneficially, more than 5% of the shares of any Class of the following Portfolios' outstanding shares.
| Class I | |||||||||||
| Portfolio | Name and Address | % of Class | |||||||||
| Active International Allocation Portfolio | Morgan Stanley & Co. Harborside Financial Center Plaza II, 3rd Floor Jersey City, NJ 07311 | 76.42 | % | ||||||||
| Wallace Global Fund 1990 M St. Suite 250 Washington, DC 20036 | 5.49 | % | |||||||||
| Capital Growth Portfolio | Morgan Stanley & Co. Harborside Financial Center Plaza II, 3rd Floor Jersey City, NJ 07311 | 47.42 | % | ||||||||
| Mac & Co. P.O. Box 3198 Pittsburgh, PA 15230 | 35.85 | % | |||||||||
| Emerging Markets Portfolio | The Bank of New York Trustee for New York State Deferred Compensation Plan 1 Wall St., 12th Floor New York, NY 10286 | 16.74 | % | ||||||||
| Mac & Co. P.O. Box 3198 Pittsburgh, PA 15230 | 11.89 | % | |||||||||
| Fidelity Investments Institutional Operations Co. 100 Magellan Way, KW1C Covington, KY 41015 | 11.55 | % | |||||||||
| The Vanguard Fiduciary Trust Co. P.O. Box 2600 VM613 Outside Funds Valley Forge, PA 19482 | 11.03 | % | |||||||||
| Northern Trust Co. P.O. Box 92994 Chicago, Il 60675 | 5.74 | % | |||||||||
| Mac & Co. P.O. Box 3198 Pittsburgh, PA 15230 | 5.10 | % | |||||||||
| Emerging Markets Debt Portfolio | Morgan Stanley Investment Management One Tower Bridge 100 Front St. West Conshohocken, PA 19428 | 58.07 | % | ||||||||
72
| Portfolio | Name and Address | % of Class | |||||||||
| Charles Schwab & Co., Inc. 101 Montgomery St. San Francisco, CA 94104 | 11.40 | % | |||||||||
| Morgan Stanley & Co. FBO X-Entity 0111 C 1595 Broadway New York, NY 10036 | 7.51 | % | |||||||||
| MS Alternative Opportunity Fund Harborside Financial Center Jersey City, NJ 07311 | 7.22 | % | |||||||||
| National Financial Services 200 Liberty St. New York, NY 10281 | 5.65 | % | |||||||||
| Focus Growth Portfolio | Morgan Stanley & Co. FBO The Fannie Cox Foundation P.O. Box 690 Southborough, MA 01772 | 20.02 | % | ||||||||
| Morgan Stanley & Co. FBO Hampshire Orthopedics and Sports Medicine Money Purchase 6 Hatfield St. North Hampton, MA 01060 | 10.33 | % | |||||||||
| Victor E. Schwartz C/O Shook, Hardy & Bacon LLP 600 14th St. NW, Suite 800 Washington, DC 20005 | 8.91 | % | |||||||||
| Morgan Stanley & Co. Harborside Financial Center Plaza II, 3rd Floor Jersey City, NJ 07311 | 7.06 | % | |||||||||
| Morgan Stanley & Co. FBO Peter C Madeja 825 Mount Moro Rd. Villanova, PA 19085 | 6.93 | % | |||||||||
| Morgan Stanley & Co. FBO Michael E Hora Revocable Trust 2970 North Lake Shore Dr. Chicago, Il 60657 | 6.81 | % | |||||||||
| National Financial Services 200 Liberty St. New York, NY 10281 | 6.73 | % | |||||||||
| Morgan Stanley & Co. FBO David Steven Lederman 424 West End Ave. 22-K New York, NY 10024 | 5.60 | % | |||||||||
73
| Portfolio | Name and Address | % of Class | |||||||||
| Morgan Stanley & Co. FBO Leigh Ann Abraham-Weinbren 4417 West Culbreath Ave. Tampa, Fl 33609 | 5.03 | % | |||||||||
| Global Franchise Portfolio | L-3 Communications Canada 649 North Service Rd. West Burlington, Ontario Canada, 231 L7P5B9 | 56.57 | % | ||||||||
| Kruger Inc. Master trust 200 Bay St. 21st Floor Toronto, Ontario Canada 033 M5J2J5 | 12.18 | % | |||||||||
| Northern Trust Co. Custodian for Salk Institute for Biological Studies P.O. Box 92956 Chicago, IL 60675 | 12.03 | % | |||||||||
| Bireley's Orange Japan SA P.O. Box 1134 Panama, Republic of Panama | 8.93 | % | |||||||||
| Global Real Estate Portfolio | National Financial Services 200 Liberty St. New York, NY 10281 | 25.45 | % | ||||||||
| State St. Bank & Trust Co. FBO Lockheed Martin Corp. Savings Plans 105 Rosemont Ave. Westwood, MA 02090 | 11.73 | % | |||||||||
| Mac & Co. P.O. Box 3198 Pittsburgh, PA 15230 | 6.77 | % | |||||||||
| Mac & Co. P.O. Box 3198 Pittsburgh, PA 15230 | 5.57 | % | |||||||||
| Global Value Equity Portfolio | AIG Life of Bermuda, Ltd. Segregated Account Bermuda Alta Advisors Investment Subaccount P.O. Box HM152 American International Building Hamilton, Bermuda | 92.08 | % | ||||||||
| Fidelity Investments Institutional Operations Co. 100 Magellan Way, KW1C Covington, KY 41015 | 22.15 | % | |||||||||
74
| Portfolio | Name and Address | % of Class | |||||||||
| AIG Life of Bermuda, Ltd. Segregated Account Bermuda Alta Advisors Investment Subaccount P.O. Box HM152 American International Building Hamilton, Bermuda | 11.24 | % | |||||||||
| AIG Life of Bermuda, Ltd. Segregated Account Bermuda Alta Advisors Investment Subaccount P.O. Box HM152 American International Building Hamilton, Bermuda | 8.97 | % | |||||||||
| Joelson Foundation 194 Whitehall Blvd. Garden City, NY 11530 | 6.51 | % | |||||||||
| International Equity Portfolio | Charles Schwab & Co., Inc. 101 Montgomery St. San Francisco, CA 94104 | 11.51 | % | ||||||||
| Fidelity Investments Institutional Operations Co. 100 Magellan Way, KW1C Covington, KY 41015 | 9.01 | % | |||||||||
| National Financial Services 200 Liberty St. New York, NY 10281 | 8.18 | % | |||||||||
| Mac & Co. P.O. Box 3198 Pittsburgh, PA 15230 | 8.00 | % | |||||||||
| International Growth Equity Portfolio | State St. Bank and Trust Co. Trustee for GMAC LLC Retirement Savings Plan 105 Rosemont Ave. Westwood, MA 02090 | 45.43 | % | ||||||||
| Mac & Co. P.O. Box 3198 Pittsburgh, PA 15230 | 24.81 | % | |||||||||
| Modern Woodmen of America 1701 1st Ave. Rock Island, IL 61201 | 18.85 | % | |||||||||
| The Andrew W Mellon foundation 140 East 62 St. New York, NY 10065 | 9.67 | % | |||||||||
| International Real Estate Portfolio | Patterson & Co. FBO Mutual Funds 1525 West W.T. Harris Blvd. Charlotte, NC 28288 | 38.86 | % | ||||||||
75
| Portfolio | Name and Address | % of Class | |||||||||
| Charles Schwab & Co., Inc. 101 Montgomery St. San Francisco, CA 94104 | 12.10 | % | |||||||||
| Anthem Health Plus of Kentucky, Inc. 120 Monument Circle Indianapolis, IN 46204 | 9.91 | % | |||||||||
| National Financial Services 200 Liberty St. New York, NY 10281 | 9.41 | % | |||||||||
| The Anne E Casey Foundation 701 Saint Paul St. Baltimore, MD 21202 | 5.69 | % | |||||||||
| International Small Cap Portfolio | Charles Schwab & Co., Inc. 101 Montgomery St. San Francisco, CA 94104 | 25.95 | % | ||||||||
| Morgan Stanley & Co. Harborside Financial Center Plaza II, 3rd Floor Jersey City, NJ 07311 | 14.21 | % | |||||||||
| National Financial Services 200 Liberty St. New York, NY 10281 | 8.72 | % | |||||||||
| Factory Mutual Insurance Co. P.O. Box 9198 225 Wyman St. Waltham, MA 02451 | 8.15 | % | |||||||||
| Novant Health, Inc. 2085 Frontis Plaza Blvd. Winston Salem, NC 27103 | 7.15 | % | |||||||||
| Mac & Co. P.O. Box 3198 Pittsburgh, PA 15230 | 5.49 | % | |||||||||
| Large Cap Relative Value Portfolio | JPMorgan Chase & Co. FBO Cisco Systems, Inc. 401k Plan 9300 Ward Pkwy. Kansas City, MO 64114 | 56.75 | % | ||||||||
| Fidelity Investments Institutional Operations Co. 100 Magellan Way, KW1C Covington, KY 41015 | 26.83 | % | |||||||||
| Morgan Stanley Asset Management for the Account of Hubbell, Inc. 1221 Ave. of the Americas New York, NY 10020 | 5.49 | % | |||||||||
76
| Portfolio | Name and Address | % of Class | |||||||||
| Small Company Growth Portfolio | Fidelity Investments Institutional Operations Co. 100 Magellan Way, KW1C Covington, KY 41015 | 51.75 | % | ||||||||
| TRowe Price Trust Co. FBO Retirement Plan Clients P.O. Box 17215 Baltimore, MD 21297 | 10.94 | % | |||||||||
| JPMorgan Chase & Co. FBO Best Buy Savings Plan 9300 Ward Parkway Kansas City, MO 64114 | 5.25 | % | |||||||||
| U.S. Real Estate Portfolio | Morgan Stanley & Co. Harborside Financial Center Plaza II, 3rd Floor Jersey City, NJ 07311 | 15.74 | % | ||||||||
| Charles Schwab & Co., Inc. 101 Montgomery St. San Francisco, CA 94104 | 14.62 | % | |||||||||
| National Financial Services 200 Liberty St. New York, NY 10281 | 13.13 | % | |||||||||
| Mac & Co. P.O. Box 3198 Pittsburgh, PA 15230 | 10.61 | % | |||||||||
| LPL P.O. Box 509406 San Diego, CA 92150 | 6.49 | % | |||||||||
| Mac & Co. P.O. Box 3198 Pittsburgh, PA 15230 | 5.15 | % | |||||||||
| U.S. Small/Mid Cap Value Portfolio | Morgan Stanley Investment Management One Tower Bridge 100 Front St. West Conshohocken, PA 19428 | 70.78 | % | ||||||||
| Mercer Trust Co. FBO Cenveo 401k Retirement Plan 1 Investors Way Norwood, MA 02062 | 22.14 | % | |||||||||
| DCGT FBO Trade Desk 711 High St. Des Moines, IA 50392 | 5.78 | % | |||||||||
77
| Class P | |||||||||||
| Portfolio | Name and Address | % of Class | |||||||||
| Active International Allocation Portfolio | Morgan Stanley & Co. Harborside Financial Center Plaza II, 3rd Floor Jersey City, NJ 07311 | 70.31 | % | ||||||||
| Fidelity Investments Institutional Operations Co. 100 Magellan Way, KW1C Covington, KY 41015 | 17.32 | % | |||||||||
| Capital Growth Portfolio | State of Florida Employees Deferred Compensation Plan P.O. Box 182029 Columbus, OH 43218 | 53.36 | % | ||||||||
| Fidelity Investments Institutional Operations Co. 100 Magellan Way, KW1C Covington, KY 41015 | 24.57 | % | |||||||||
| National Financial Services 200 Liberty St. New York, NY 10281 | 5.17 | % | |||||||||
| Emerging Markets Portfolio | Fidelity Investments Institutional Operations Co. 100 Magellan Way, KW1C Covington, KY 41015 | 87.29 | % | ||||||||
| Emerging Markets Debt Portfolio | National Financial Services 200 Liberty St. New York, NY 10281 | 58.32 | % | ||||||||
| Morgan Stanley & Co. Harborside Financial Center Plaza II, 3rd Floor Jersey City, NJ 07311 | 26.37 | % | |||||||||
| Brenton D. Anderson P.O. Box 56 Etna, NH 03750 | 8.69 | % | |||||||||
| FFP Investments, Ltd. 1920 Nacogdoches, Suite 101 San Antonio, TX 78209 | 5.34 | % | |||||||||
| Focus Growth Portfolio | Norwest Bank Colorado NA FBO Bayonne Hospital 403B Tax Sheltered Plan 8515 E Orchard Rd. Englewood, Co 80111 | 23.82 | % | ||||||||
| Morgan Stanley & Co. FBO Stephanie T Schley 320 East 72nd St. New York, NY 10021 | 18.57 | % | |||||||||
78
| Portfolio | Name and Address | % of Class | |||||||||
| Morgan Stanley & Co. FBO Bruce R. York 8210 SE 33rd Place Mercer Island, WA 98040 | 11.00 | % | |||||||||
| Brian T. Marshall 87 Monroe St. Pelham, NY 10803 | 8.22 | % | |||||||||
| Hermine Hilton 26666 Seagull Dr. Malibu, CA 90265 | 9.62 | % | |||||||||
| Morgan Stanley & Co. FBO Betty Rollin Edwards 67 Park Ave. New York, NY 10016 | 7.53 | % | |||||||||
| Morgan Stanley & Co. FBO Stacey Elizabeth Nicholas 15 Enterprise Suite 550 Aliso Viejo, CA 92656 | 5.92 | % | |||||||||
| Morgan Stanley & Co. Harborside Financial Center Plaza II, 3rd Floor Jersey City, NJ 07311 | 5.41 | % | |||||||||
| Global Franchise Portfolio | Morgan Stanley & Co. Harborside Financial Center Plaza II, 3rd Floor Jersey City, NJ 07311 | 21.48 | % | ||||||||
| Morgan Stanley & Co. FBO Stephan J. Lurito 15 Stony Wylde Lane Greenwich, CT 06830 | 11.79 | % | |||||||||
| Morgan Stanley & Co. FBO Henry Gross 444 Madison Ave. 11 Floor New York, NY 10022 | 10.75 | % | |||||||||
| Morgan Stanley & Co. FBO Theodore P. Desloge Jr. 39 Picardy Lane St. Louis, MO 63124 | 9.75 | % | |||||||||
| Morgan Stanley & Co. FBO Theodore Petroulas 722 Broadway No. 9 New York, NY 10022 | 7.25 | % | |||||||||
| Morgan Stanley & Co. FBO John P Gandolfo 36 Country Ln. Basking Ridge, NJ 07920 | 5.64 | % | |||||||||
79
| Portfolio | Name and Address | % of Class | |||||||||
| Morgan Stanley & Co. FBO Barry Sharer 10 North Presidential Dr. Bala Cynwyd, PA 19004 | 5.19 | % | |||||||||
| Global Real Estate Portfolio | National Financial Services 200 Liberty St. New York, NY 10281 | 66.84 | % | ||||||||
| DCGT FBO Trade Desk 711 High St. Des Moines, IA 50392 | 18.46 | % | |||||||||
| Morgan Stanley & Co. Harborside Financial Center Plaza II, 3rd Floor Jersey City, NJ 07311 | 7.86 | % | |||||||||
| Global Value Equity Portfolio | Fidelity Investments Institutional Operations Co. 100 Magellan Way, KW1C Covington, KY 41015 | 92.08 | % | ||||||||
| International Equity Portfolio | National Financial Services 200 Liberty St. New York, NY 10281 | 77.78 | % | ||||||||
| Fidelity Investments Institutional Operations Co. 100 Magellan Way, KW1C Covington, KY 41015 | 7.35 | % | |||||||||
| State St. Bank & Trust Co. Trustee for The Sodexho 401K Retirement Savings & Trust 105 Rosemont Ave. Westwood, MA 02090 | 6.19 | % | |||||||||
| International Growth Equity Portfolio | Morgan Stanley Investment Management One Tower Bridge 100 Front St. West Conshohocken, PA 19428 | 39.05 | % | ||||||||
| Morgan Stanley & Co. FBO John D. O'Brien P.O. Box 2764 Edwards, CO 81632 | 38.62 | % | |||||||||
| Kalson & Associates, Inc. 401k Plan P.O. Box 1300 Newtown, PA 18940 | 22.32 | % | |||||||||
| International Real Estate Portfolio | Morgan Stanley & Co. Harborside Financial Center Plaza II, 3rd Floor Jersey City, NJ 07311 | 65.28 | % | ||||||||
80
| Portfolio | Name and Address | % of Class | |||||||||
| National Financial Services 200 Liberty St. New York, NY 10281 | 17.41 | % | |||||||||
| Large Cap Relative Value Portfolio | Fidelity Investments Institutional Operations Co. 100 Magellan Way, KW1C Covington, KY 41015 | 97.87 | % | ||||||||
| Small Company Growth Portfolio | Fidelity Investments Institutional Operations Co. 100 Magellan Way, KW1C Covington, KY 41015 | 35.51 | % | ||||||||
| MG Trust Co. 700 17th St. Suite 300 Denver, CO 80202 | 5.99 | % | |||||||||
| Morgan Stanley & Co. Harborside Financial Center Plaza II, 3rd Floor Jersey City, NJ 07311 | 5.55 | % | |||||||||
| National Financial Services 200 Liberty St. New York, NY 10281 | 5.36 | % | |||||||||
| Merrill Lynch Pierce Fenner & Smith 4800 Deerlake Dr. East Jacksonville, FL 32246 | 5.32 | % | |||||||||
| Mac & Co. P.O. Box 3198 Pittsburgh, PA 15230 | 5.08 | % | |||||||||
| U.S. Real Estate Portfolio | Merrill Lynch Pierce Fenner & Smith 4800 Deer Lake Dr. East Jacksonville, FL 32246 | 48.18 | % | ||||||||
| The Union Central Life Insurance Co. 1876 Waycross Rd. Cincinnati, OH 45240 | 24.37 | % | |||||||||
| TRowe Price Trust Co. FBO Retirement Plan Clients P.O. Box 17215 Baltimore, MD 21297 | 6.85 | % | |||||||||
| Morgan Stanley & Co. Harborside Financial Center Plaza II, 3rd Floor Jersey City, NJ 07311 | 5.10 | % | |||||||||
| U.S. Small/Mid Cap Value Portfolio | Morgan Stanley Investment Management One Tower Bridge 100 Front St. West Conshohocken, PA 19428 | 100.00 | % | ||||||||
81
| Class H | |||||||||||
| Portfolio | Name and Address | % of Class | |||||||||
| Emerging Markets Debt Portfolio | Morgan Stanley & Co. Harborside Financial Center Plaza II, 3rd Floor Jersey City, NJ 07311 | 95.56 | % | ||||||||
| Global Real Estate Portfolio | Morgan Stanley & Co. Harborside Financial Center Plaza II, 3rd Floor Jersey City, NJ 07311 | 55.38 | % | ||||||||
| Morgan Stanley Investment Management FBO Helen Jaffe 30 Dunnigan Dr. Suffern, NY 10901 | 28.69 | % | |||||||||
| Morgan Stanley Investment Management One Tower Bridge 100 Front St. West Conshohocken, PA 19428 | 15.93 | % | |||||||||
| Class L | |||||||||||
| Emerging Markets Debt Portfolio | Morgan Stanley & Co. Harborside Financial Center Plaza II, 3rd Floor Jersey City, NJ 07311 | 98.72 | % | ||||||||
| Global Real Estate Portfolio | Morgan Stanley & Co. Harborside Financial Center Plaza II, 3rd Floor Jersey City, NJ 07311 | 98.03 | % | ||||||||
The persons listed above as owning 25% or more of the outstanding shares of a Portfolio may be presumed to "control" (as that term is defined in the 1940 Act) such Portfolio. As a result, those persons would have the ability to vote a majority of the shares of the respective Portfolio on any matter requiring the approval of shareholders of such Portfolio.
PERFORMANCE INFORMATION
The average annual compounded rates of return (unless otherwise noted) for the Portfolios for the 1-, 5- and 10-year periods ended December 31, 2008 and for the period from inception through December 31, 2008 are as follows:
| Name of Portfolio | Inception Date | One Year | Average Annual Five Years | Average Annual Ten Years | Average Annual Since Inception | ||||||||||||||||||
| Active International Allocation Class I | 01/17/92 | -39.25 | % | 3.13 | % | 1.94 | % | 5.28 | % | ||||||||||||||
| Class P | 01/02/96 | -39.41 | % | 2.86 | % | 1.63 | % | 4.07 | % | ||||||||||||||
| Capital Growth Class I | 04/02/91 | -50.47 | % | -4.70 | % | -2.78 | % | 6.22 | % | ||||||||||||||
| Class P | 01/02/96 | -50.57 | % | -4.94 | % | -3.02 | % | 3.11 | % | ||||||||||||||
| Emerging Markets Class I | 09/25/92 | -56.39 | % | 7.30 | % | 9.40 | % | 7.09 | % | ||||||||||||||
| Class P | 01/02/96 | -56.50 | % | 7.03 | % | 9.12 | % | 5.27 | % | ||||||||||||||
| Emerging Markets Debt Class I | 02/01/94 | -10.07 | % | 5.26 | % | 11.48 | % | 9.27 | % | ||||||||||||||
| Class P | 01/02/96 | -10.34 | % | 4.98 | % | 11.17 | % | 9.54 | % | ||||||||||||||
82
| Name of Portfolio | Inception Date | One Year | Average Annual Five Years | Average Annual Ten Years | Average Annual Since Inception | ||||||||||||||||||
| Focus Growth Class I | 03/08/95 | -52.19 | % | -5.17 | % | -2.40 | % | 6.54 | % | ||||||||||||||
| Class P | 01/02/96 | -52.27 | % | -5.40 | % | -2.63 | % | 3.87 | % | ||||||||||||||
| Global Franchise Class I | 11/28/01 | -28.88 | % | 3.83 | % | N/A | 8.20 | % | |||||||||||||||
| Class P | 11/28/01 | -29.00 | % | 3.57 | % | N/A | 7.91 | % | |||||||||||||||
| Global Real Estate Class I | 08/30/06 | -45.00 | % | N/A | N/A | -19.99 | % | ||||||||||||||||
| Class P | 08/30/06 | -45.15 | % | N/A | N/A | -20.22 | % | ||||||||||||||||
| Global Value Equity Class I | 07/15/92 | -41.82 | % | -1.88 | % | 0.34 | % | 7.36 | % | ||||||||||||||
| Class P | 01/02/96 | -41.98 | % | -2.14 | % | 0.08 | % | 4.32 | % | ||||||||||||||
| International Equity Class I | 08/04/89 | -33.12 | % | 2.82 | % | 5.38 | % | 8.93 | % | ||||||||||||||
| Class P | 01/02/96 | -33.21 | % | 2.58 | % | 5.14 | % | 7.72 | % | ||||||||||||||
| International Growth Equity Class I | 12/27/05 | -48.70 | % | N/A | N/A | -9.08 | % | ||||||||||||||||
| Class P | 12/27/05 | -48.82 | % | N/A | N/A | -9.30 | % | ||||||||||||||||
| International Real Estate Class I | 10/01/97 | -49.95 | % | 1.86 | % | 7.23 | % | 6.39 | % | ||||||||||||||
| Class P | 10/01/97 | -50.05 | % | 1.63 | % | 6.96 | % | 6.13 | % | ||||||||||||||
| International Small Cap Class I | 12/15/92 | -38.33 | % | 1.51 | % | 7.03 | % | 8.65 | % | ||||||||||||||
| Large Cap Relative Value Class I | 01/31/90 | -32.01 | % | 0.59 | % | 2.87 | % | 8.06 | % | ||||||||||||||
| Class P | 01/02/96 | -32.21 | % | 0.30 | % | 2.62 | % | 6.04 | % | ||||||||||||||
| Small Company Growth Class I | 11/01/89 | -41.84 | % | -1.93 | % | 5.06 | % | 9.01 | % | ||||||||||||||
| Class P | 01/02/96 | -41.97 | % | -2.17 | % | 4.81 | % | 6.75 | % | ||||||||||||||
| U.S. Real Estate Class I | 02/24/95 | -38.07 | % | 2.97 | % | 8.34 | % | 10.94 | % | ||||||||||||||
| Class P | 01/02/96 | -38.26 | % | 2.72 | % | 8.05 | % | 9.71 | % | ||||||||||||||
| U.S. Small/Mid Cap Value Class I | 09/27/07 | -38.03 | % | N/A | N/A | -34.44 | % | ||||||||||||||||
| Class P | 09/27/07 | -38.21 | % | N/A | N/A | -34.65 | % | ||||||||||||||||
The average annual compounded rates of return (after taxes on distributions) (unless otherwise noted) for the Class I Shares of the Portfolios for the 1-, 5- and 10- year periods ended December 31, 2008 and for the period from inception through December 31, 2008 are as follows:
| Name of Portfolio | Inception Date | One Year | Average Annual Five Years | Average Annual Ten Years | Average Annual Since Inception | ||||||||||||||||||
| Active International Allocation Class I | 01/17/92 | -39.97 | % | 2.24 | % | 0.75 | % | 3.61 | % | ||||||||||||||
| Capital Growth Class I | 04/02/91 | -50.62 | % | -4.79 | % | -3.21 | % | 4.49 | % | ||||||||||||||
| Emerging Markets Class I | 09/25/92 | -57.01 | % | 5.76 | % | 8.56 | % | 6.03 | % | ||||||||||||||
| Emerging Markets Debt Class I | 02/01/94 | -11.22 | % | 2.98 | % | 8.10 | % | 3.18 | % | ||||||||||||||
| Focus Growth Class I | 03/08/95 | -52.27 | % | -5.23 | % | -3.73 | % | 3.88 | % | ||||||||||||||
83
| Name of Portfolio | Inception Date | One Year | Average Annual Five Years | Average Annual Ten Years | Average Annual Since Inception | ||||||||||||||||||
| Global Franchise Class I | 11/28/01 | -30.81 | % | 2.19 | % | N/A | 6.97 | % | |||||||||||||||
| Global Real Estate Class I | 08/30/06 | -45.08 | % | N/A | N/A | -20.81 | % | ||||||||||||||||
| Global Value Equity Class I | 07/15/92 | -43.28 | % | -3.30 | % | -1.32 | % | 5.47 | % | ||||||||||||||
| International Equity Class I | 08/04/89 | -34.87 | % | 0.57 | % | 3.41 | % | 7.11 | % | ||||||||||||||
| International Growth Equity Class I | 12/27/05 | -49.57 | % | N/A | N/A | -9.82 | % | ||||||||||||||||
| International Real Estate Class I | 10/01/97 | -50.00 | % | 0.71 | % | 6.22 | % | 5.36 | % | ||||||||||||||
| International Small Cap Class I | 12/15/92 | -39.75 | % | -1.05 | % | 4.89 | % | 6.88 | % | ||||||||||||||
| Large Cap Relative Value Class I | 01/31/90 | -32.58 | % | -0.09 | % | 1.24 | % | 5.49 | % | ||||||||||||||
| Small Company Growth Class I | 11/01/89 | -41.84 | % | -2.72 | % | 3.61 | % | 6.34 | % | ||||||||||||||
| U.S. Real Estate Class I | 02/24/95 | -39.18 | % | -0.07 | % | 5.64 | % | 7.79 | % | ||||||||||||||
| U.S. Small/Mid Cap Value Class I | 09/27/07 | -38.06 | % | N/A | N/A | -34.47 | % | ||||||||||||||||
The average annual compounded rates of return (after taxes on distributions and redemptions) (unless otherwise noted) for the Class I shares of the Portfolios for the 1-, 5- and 10-year periods ended December 31, 2008 and for the period from inception through December 31, 2008 are as follows:
| Name of Portfolio† | Inception Date | One Year | Average Annual Five Years | Average Annual Ten Years | Average Annual Since Inception | ||||||||||||||||||
| Active International Allocation Class I | 01/17/92 | -24.35 | % | 2.77 | % | 1.30 | % | 3.83 | % | ||||||||||||||
| Capital Growth Class I | 04/02/91 | -32.70 | % | -3.91 | % | -2.36 | % | 4.56 | % | ||||||||||||||
| Emerging Markets Class I | 09/25/92 | -35.65 | % | 7.30 | % | 8.91 | % | 6.29 | % | ||||||||||||||
| Emerging Markets Debt Class I | 02/01/94 | -6.48 | % | 3.23 | % | 7.91 | % | 3.85 | % | ||||||||||||||
| Focus Growth Class I | 03/08/95 | -33.88 | % | -4.32 | % | -2.43 | % | 4.36 | % | ||||||||||||||
| Global Franchise Class I | 11/28/01 | -17.59 | % | 3.54 | % | N/A | 7.38 | % | |||||||||||||||
| Global Real Estate Class I | 08/30/06 | -29.13 | % | N/A | N/A | -16.73 | % | ||||||||||||||||
| Global Value Equity Class I | 07/15/92 | -26.33 | % | -1.16 | % | 0.16 | % | 5.98 | % | ||||||||||||||
| International Equity Class I | 08/04/89 | -19.84 | % | 2.67 | % | 4.41 | % | 7.45 | % | ||||||||||||||
| International Growth Equity Class I | 12/27/05 | -31.16 | % | N/A | N/A | -7.38 | % | ||||||||||||||||
| International Real Estate Class I | 10/01/97 | -32.36 | % | 1.83 | % | 6.28 | % | 5.45 | % | ||||||||||||||
84
| Name of Portfolio† | Inception Date | One Year | Average Annual Five Years | Average Annual Ten Years | Average Annual Since Inception | ||||||||||||||||||
| International Small Cap Class I | 12/15/92 | -23.10 | % | 2.30 | % | 6.31 | % | 7.62 | % | ||||||||||||||
| Large Cap Relative Value Class I | 01/31/90 | -20.34 | % | 0.68 | % | 1.82 | % | 5.84 | % | ||||||||||||||
| Small Company Growth Class I | 11/01/89 | -27.20 | % | -1.38 | % | 3.99 | % | 6.66 | % | ||||||||||||||
| U.S. Real Estate Class I | 02/24/95 | -23.05 | % | 3.11 | % | 6.92 | % | 8.65 | % | ||||||||||||||
| U.S. Small/Mid Cap Value Class I | 09/27/07 | -24.70 | % | N/A | N/A | -29.01 | % | ||||||||||||||||
† Class H of the Emerging Markets Debt Portfolio and Global Real Estate Portfolio commenced operations on January 2, 2008. Class L of these Portfolios commenced operations on June 16, 2008. Class P of the International Small Cap Portfolio commenced operations on October 21, 2008. Performance information for these Portfolios will be provided once the Portfolio has completed a full calendar year of operations.
Calculation of Yield For Emerging Markets Debt Portfolio
The current yields for the Emerging Markets Debt Portfolio for the 30-day period ended December 31, 2008 were as follows:
| Portfolio Name | Class I Shares | Class P Shares | |||||||||
| Emerging Markets Debt | 8.29 | % | 8.10 | % | |||||||
FINANCIAL STATEMENTS
The Fund's audited financial statements for the fiscal year ended December 31, 2008, including notes thereto, and the report of Ernst & Young LLP, an independent registered public accounting firm, are herein incorporated by reference from the Fund's Annual Report. A copy of the Fund's Annual Report to Shareholders must accompany the delivery of this SAI.
85
MORGAN STANLEY INVESTMENT MANAGEMENT
PROXY VOTING POLICY AND PROCEDURES
I. POLICY STATEMENT
Morgan Stanley Investment Management's ("MSIM") policy and procedures for voting proxies ("Policy") with respect to securities held in the accounts of clients applies to those MSIM entities that provide discretionary investment management services and for which an MSIM entity has authority to vote proxies. This Policy is reviewed and updated as necessary to address new and evolving proxy voting issues and standards.
The MSIM entities covered by this Policy currently include the following: Morgan Stanley Investment Advisors Inc., Morgan Stanley AIP GP LP, Morgan Stanley Investment Management Inc., Morgan Stanley Investment Management Limited, Morgan Stanley Investment Management Company, Morgan Stanley Asset & Investment Trust Management Co., Limited, Morgan Stanley Investment Management Private Limited, Van Kampen Asset Management, and Van Kampen Advisors Inc. (each an "MSIM Affiliate" and collectively referred to as the "MSIM Affiliates" or as "we" below).
Each MSIM Affiliate will use its best efforts to vote proxies as part of its authority to manage, acquire and dispose of account assets. With respect to the MSIM registered management investment companies (Van Kampen, Institutional and Advisor Funds—collectively referred to herein as the "MSIM Funds"), each MSIM Affiliate will vote proxies under this Policy pursuant to authority granted under its applicable investment advisory agreement or, in the absence of such authority, as authorized by the Board of Directors/Trustees of the MSIM Funds. An MSIM Affiliate will not vote proxies if the "named fiduciary" for an ERISA account has reserved the authority for itself, or in the case of an account not governed by ERISA, the investment management or investment advisory agreement does not authorize the MSIM Affiliate to vote proxies. MSIM Affiliates will vote proxies in a prudent and diligent manner and in the best interests of clients, including beneficiaries of and participants in a client's benefit plan(s) for which the MSIM Affiliates manage assets, consistent with the objective of maximizing long-term investment returns ("Client Proxy Standard"). In certain situations, a client or its fiduciary may provide an MSIM Affiliate with a proxy voting policy. In these situations, the MSIM Affiliate will comply with the client's policy.
Proxy Research Services — RiskMetrics Group ISS Governance Services ("ISS") and Glass Lewis (together with other proxy research providers as we may retain from time to time, the "Research Providers") are independent advisers that specialize in providing a variety of fiduciary-level proxy-related services to institutional investment managers, plan sponsors, custodians, consultants, and other institutional investors. The services provided include in-depth research, global issuer analysis, and voting recommendations. While we may review and utilize the recommendations of the Research Providers in making proxy voting decisions, we are in no way obligated to follow such recommendations. In addition to research, ISS provides vote execution, reporting, and recordkeeping services.
Voting Proxies for Certain Non-U.S. Companies — Voting proxies of companies located in some jurisdictions, particularly emerging markets, may involve several problems that can restrict or prevent the ability to vote such proxies or entail significant costs. These problems include, but are not limited to: (i) proxy statements and ballots being written in a language other than English; (ii) untimely and/or inadequate notice of shareholder meetings; (iii) restrictions on the ability of holders outside the issuer's jurisdiction of organization to exercise votes; (iv) requirements to vote proxies in person; (v) the imposition of restrictions on the sale of the securities for a period of time in proximity to the shareholder meeting; and (vi) requirements to provide local agents with power of attorney to facilitate our voting instructions. As a result, we vote clients' non-U.S. proxies on a best efforts basis only, after weighing the costs and benefits of voting such proxies, consistent with the Client Proxy Standard. ISS has been retained to provide assistance in connection with voting non-U.S. proxies.
II. GENERAL PROXY VOTING GUIDELINES
To promote consistency in voting proxies on behalf of its clients, we follow this Policy (subject to any exception set forth herein). The Policy addresses a broad range of issues, and provides general voting
A-1
parameters on proposals that arise most frequently. However, details of specific proposals vary, and those details affect particular voting decisions, as do factors specific to a given company. Pursuant to the procedures set forth herein, we may vote in a manner that is not in accordance with the following general guidelines, provided the vote is approved by the Proxy Review Committee (see Section III for description) and is consistent with the Client Proxy Standard. Morgan Stanley AIP GP LP will follow the procedures as described in Appendix A.
We endeavor to integrate governance and proxy voting policy with investment goals, using the vote to encourage portfolio companies to enhance long-term shareholder value and to provide a high standard of transparency such that equity markets can value corporate assets appropriately.
We seek to follow the Client Proxy Standard for each client. At times, this may result in split votes, for example when different clients have varying economic interests in the outcome of a particular voting matter (such as a case in which varied ownership interests in two companies involved in a merger result in different stakes in the outcome). We also may split votes at times based on differing views of portfolio managers.
We may abstain on matters for which disclosure is inadequate.
A. Routine Matters.
We generally support routine management proposals. The following are examples of routine management proposals:
• Approval of financial statements and auditor reports if delivered with an unqualified auditor's opinion.
• General updating/corrective amendments to the charter, articles of association or bylaws, unless we believe that such amendments would diminish shareholder rights.
• Most proposals related to the conduct of the annual meeting, with the following exceptions. We generally oppose proposals that relate to "the transaction of such other business which may come before the meeting," and open-ended requests for adjournment. However, where management specifically states the reason for requesting an adjournment and the requested adjournment would facilitate passage of a proposal that would otherwise be supported under this Policy (i.e. an uncontested corporate transaction), the adjournment request will be supported.
We generally support shareholder proposals advocating confidential voting procedures and independent tabulation of voting results.
B. Board of Directors.
1. Election of directors: Votes on board nominees can involve balancing a variety of considerations. In balancing various factors in uncontested elections, we may take into consideration whether the company has a majority voting policy in place that we believe makes the director vote more meaningful. In the absence of a proxy contest, we generally support the board's nominees for director except as follows:
a. We consider withholding support from or voting against interested directors if the company's board does not meet market standards for director independence, or if otherwise we believe board independence is insufficient. We refer to prevalent market standards as promulgated by a stock exchange or other authority within a given market (e.g., New York Stock Exchange or Nasdaq rules for most U.S. companies, and The Combined Code on Corporate Governance in the United Kingdom). Thus, for an NYSE company with no controlling shareholder, we would expect that at a minimum a majority of directors should be independent as defined by NYSE. Where we view market standards as inadequate, we may withhold votes based on stronger independence standards. Market standards notwithstanding, we generally do not view long board tenure alone as a basis to classify a director as non-independent, although lack of board turnover and fresh perspective can be a negative factor in voting on directors.
i. At a company with a shareholder or group that controls the company by virtue of a majority economic interest in the company, we have a reduced expectation for board independence,
A-2
although we believe the presence of independent directors can be helpful, particularly in staffing the audit committee, and at times we may withhold support from or vote against a nominee on the view the board or its committees are not sufficiently independent.
ii. We consider withholding support from or voting against a nominee if he or she is affiliated with a major shareholder that has representation on a board disproportionate to its economic interest.
b. Depending on market standards, we consider withholding support from or voting against a nominee who is interested and who is standing for election as a member of the company's compensation, nominating or audit committee.
c. We consider withholding support from or voting against a nominee if we believe a direct conflict exists between the interests of the nominee and the public shareholders, including failure to meet fiduciary standards of care and/or loyalty. We may oppose directors where we conclude that actions of directors are unlawful, unethical or negligent. We consider opposing individual board members or an entire slate if we believe the board is entrenched and/or dealing inadequately with performance problems, and/or acting with insufficient independence between the board and management.
d. We consider withholding support from or voting against a nominee standing for election if the board has not taken action to implement generally accepted governance practices for which there is a "bright line" test. For example, in the context of the U.S. market, failure to eliminate a dead hand or slow hand poison pill would be seen as a basis for opposing one or more incumbent nominees.
e. In markets that encourage designated audit committee financial experts, we consider voting against members of an audit committee if no members are designated as such. We also may not support the audit committee members if the company has faced financial reporting issues and/or does not put the auditor up for ratification by shareholders.
f. We believe investors should have the ability to vote on individual nominees, and may abstain or vote against a slate of nominees where we are not given the opportunity to vote on individual nominees.
g. We consider withholding support from or voting against a nominee who has failed to attend at least 75% of the nominee's board and board committee meetings within a given year without a reasonable excuse. We also consider opposing nominees if the company does not meet market standards for disclosure on attendance.
h. We consider withholding support from or voting against a nominee who appears overcommitted, particularly through service on an excessive number of boards. Market expectations are incorporated into this analysis; for U.S. boards, we generally oppose election of a nominee who serves on more than six public company boards (excluding investment companies).
2. Discharge of directors' duties: In markets where an annual discharge of directors' responsibility is a routine agenda item, we generally support such discharge. However, we may vote against discharge or abstain from voting where there are serious findings of fraud or other unethical behavior for which the individual bears responsibility. The annual discharge of responsibility represents shareholder approval of actions taken by the board during the year and may make future shareholder action against the board difficult to pursue.
3. Board independence: We generally support U.S. shareholder proposals requiring that a certain percentage (up to 66 2/3%) of the company's board members be independent directors, and promoting all-independent audit, compensation and nominating/governance committees.
4. Board diversity: We consider on a case-by-case basis shareholder proposals urging diversity of board membership with respect to social, religious or ethnic group.
A-3
5. Majority voting: We generally support proposals requesting or requiring majority voting policies in election of directors, so long as there is a carve-out for plurality voting in the case of contested elections.
6. Proxy access: We consider on a case-by-case basis shareholder proposals to provide procedures for inclusion of shareholder nominees in company proxy statements.
7. Proposals to elect all directors annually: We generally support proposals to elect all directors annually at public companies (to "declassify" the Board of Directors) where such action is supported by the board, and otherwise consider the issue on a case-by-case basis based in part on overall takeover defenses at a company.
8. Cumulative voting: We generally support proposals to eliminate cumulative voting in the U.S. market context. (Cumulative voting provides that shareholders may concentrate their votes for one or a handful of candidates, a system that can enable a minority bloc to place representation on a board.) U.S. proposals to establish cumulative voting in the election of directors generally will not be supported.
9. Separation of Chairman and CEO positions: We vote on shareholder proposals to separate the Chairman and CEO positions and/or to appoint a non-executive Chairman based in part on prevailing practice in particular markets, since the context for such a practice varies. In many non-U.S. markets, we view separation of the roles as a market standard practice, and support division of the roles in that context.
10. Director retirement age and term limits: Proposals recommending set director retirement ages or director term limits are voted on a case-by-case basis.
11. Proposals to limit directors' liability and/or broaden indemnification of officers and directors. Generally, we will support such proposals provided that an individual is eligible only if he or she has not acted in bad faith, gross negligence or reckless disregard of their duties.
C. Statutory Auditor Boards.
The statutory auditor board, which is separate from the main board of directors, plays a role in corporate governance in several markets. These boards are elected by shareholders to provide assurance on compliance with legal and accounting standards and the company's articles of association. We generally vote for statutory auditor nominees if they meet independence standards. In markets that require disclosure on attendance by internal statutory auditors, however, we consider voting against nominees for these positions who failed to attend at least 75% of meetings in the previous year. We also consider opposing nominees if the company does not meet market standards for disclosure on attendance.
D. Corporate Transactions and Proxy Fights.
We examine proposals relating to mergers, acquisitions and other special corporate transactions (i.e., takeovers, spin-offs, sales of assets, reorganizations, restructurings and recapitalizations) on a case-by-case basis in the interests of each fund or other account. Proposals for mergers or other significant transactions that are friendly and approved by the Research Providers usually are supported if there is no portfolio manager objection. We also analyze proxy contests on a case-by-case basis.
E. Changes in Capital Structure.
1. We generally support the following:
• Management and shareholder proposals aimed at eliminating unequal voting rights, assuming fair economic treatment of classes of shares we hold.
• Management proposals to increase the authorization of existing classes of common stock (or securities convertible into common stock) if: (i) a clear business purpose is stated that we can support and the number of shares requested is reasonable in relation to the purpose for which authorization is requested; and/or (ii) the authorization does not exceed 100% of shares currently authorized and at least 30% of the total new authorization will be outstanding. (We consider proposals that do not meet these criteria on a case-by-case basis.)
A-4
• Management proposals to create a new class of preferred stock or for issuances of preferred stock up to 50% of issued capital, unless we have concerns about use of the authority for anti-takeover purposes.
• Management proposals to authorize share repurchase plans, except in some cases in which we believe there are insufficient protections against use of an authorization for anti-takeover purposes.
• Management proposals to reduce the number of authorized shares of common or preferred stock, or to eliminate classes of preferred stock.
• Management proposals to effect stock splits.
• Management proposals to effect reverse stock splits if management proportionately reduces the authorized share amount set forth in the corporate charter. Reverse stock splits that do not adjust proportionately to the authorized share amount generally will be approved if the resulting increase in authorized shares coincides with the proxy guidelines set forth above for common stock increases.
• Management dividend payout proposals, except where we perceive company payouts to shareholders as inadequate.
2. We generally oppose the following (notwithstanding management support):
• Proposals to add classes of stock that would substantially dilute the voting interests of existing shareholders.
• Proposals to increase the authorized or issued number of shares of existing classes of stock that are unreasonably dilutive, particularly if there are no preemptive rights for existing shareholders. However, depending on market practices, we consider voting for proposals giving general authorization for issuance of shares not subject to pre-emptive rights if the authority is limited.
• Proposals that authorize share issuance at a discount to market rates, except where authority for such issuance is de minimis, or if there is a special situation that we believe justifies such authorization (as may be the case, for example, at a company under severe stress and risk of bankruptcy).
• Proposals relating to changes in capitalization by 100% or more.
We consider on a case-by-case basis shareholder proposals to increase dividend payout ratios, in light of market practice and perceived market weaknesses, as well as individual company payout history and current circumstances. For example, currently we perceive low payouts to shareholders as a concern at some Japanese companies, but may deem a low payout ratio as appropriate for a growth company making good use of its cash, notwithstanding the broader market concern.
F. Takeover Defenses and Shareholder Rights.
1. Shareholder rights plans: We generally support proposals to require shareholder approval or ratification of shareholder rights plans (poison pills). In voting on rights plans or similar takeover defenses, we consider on a case-by-case basis whether the company has demonstrated a need for the defense in the context of promoting long-term share value; whether provisions of the defense are in line with generally accepted governance principles in the market (and specifically the presence of an adequate qualified offer provision that would exempt offers meeting certain conditions from the pill); and the specific context if the proposal is made in the midst of a takeover bid or contest for control.
2. Supermajority voting requirements: We generally oppose requirements for supermajority votes to amend the charter or bylaws, unless the provisions protect minority shareholders where there is a large shareholder. In line with this view, in the absence of a large shareholder we support reasonable shareholder proposals to limit such supermajority voting requirements.
A-5
3. Shareholder rights to call meetings: We consider proposals to enhance shareholder rights to call meetings on a case-by-case basis.
4. Reincorporation: We consider management and shareholder proposals to reincorporate to a different jurisdiction on a case-by-case basis. We oppose such proposals if we believe the main purpose is to take advantage of laws or judicial precedents that reduce shareholder rights.
5. Anti-greenmail provisions: Proposals relating to the adoption of anti-greenmail provisions will be supported, provided that the proposal: (i) defines greenmail; (ii) prohibits buyback offers to large block holders (holders of at least 1% of the outstanding shares and in certain cases, a greater amount, as determined by the Proxy Review Committee) not made to all shareholders or not approved by disinterested shareholders; and (iii) contains no anti-takeover measures or other provisions restricting the rights of shareholders.
6. Bundled proposals: We may consider opposing or abstaining on proposals if disparate issues are "bundled" and presented for a single vote.
G. Auditors.
We generally support management proposals for selection or ratification of independent auditors. However, we may consider opposing such proposals with reference to incumbent audit firms if the company has suffered from serious accounting irregularities and we believe rotation of the audit firm is appropriate, or if fees paid to the auditor for non-audit-related services are excessive. Generally, to determine if non-audit fees are excessive, a 50% test will be applied (i.e., non-audit-related fees should be less than 50% of the total fees paid to the auditor). We generally vote against proposals to indemnify auditors.
H. Executive and Director Remuneration.
1. We generally support the following:
• Proposals for employee equity compensation plans and other employee ownership plans, provided that our research does not indicate that approval of the plan would be against shareholder interest. Such approval may be against shareholder interest if it authorizes excessive dilution and shareholder cost, particularly in the context of high usage ("run rate") of equity compensation in the recent past; or if there are objectionable plan design and provisions.
• Proposals relating to fees to outside directors, provided the amounts are not excessive relative to other companies in the country or industry, and provided that the structure is appropriate within the market context. While stock-based compensation to outside directors is positive if moderate and appropriately structured, we are wary of significant stock option awards or other performance-based awards for outside directors, as well as provisions that could result in significant forfeiture of value on a director's decision to resign from a board (such forfeiture can undercut director independence).
• Proposals for employee stock purchase plans that permit discounts up to 15%, but only for grants that are part of a broad-based employee plan, including all non-executive employees.
• Proposals for the establishment of employee retirement and severance plans, provided that our research does not indicate that approval of the plan would be against shareholder interest.
2. We generally oppose retirement plans and bonuses for non-executive directors and independent statutory auditors.
3. Shareholder proposals requiring shareholder approval of all severance agreements will not be supported, but proposals that require shareholder approval for agreements in excess of three times the annual compensation (salary and bonus) generally will be supported. We generally oppose shareholder proposals that would establish arbitrary caps on pay. We consider on a case-by-case basis shareholder proposals that seek to limit Supplemental Executive Retirement Plans (SERPs), but support such proposals where we consider SERPs to be excessive.
4. Shareholder proposals advocating stronger and/or particular pay-for-performance models will be evaluated on a case-by-case basis, with consideration of the merits of the individual proposal
A-6
within the context of the particular company and its labor markets, and the company's current and past practices. While we generally support emphasis on long-term components of senior executive pay and strong linkage of pay to performance, we consider whether a proposal may be overly prescriptive, and the impact of the proposal, if implemented as written, on recruitment and retention.
5. We consider shareholder proposals for U.K.-style advisory votes on pay on a case-by-case basis.
6. We generally support proposals advocating reasonable senior executive and director stock ownership guidelines and holding requirements for shares gained in executive equity compensation programs.
7. We generally support shareholder proposals for reasonable "claw-back" provisions that provide for company recovery of senior executive bonuses to the extent they were based on achieving financial benchmarks that were not actually met in light of subsequent restatements.
8. Management proposals effectively to re-price stock options are considered on a case-by-case basis. Considerations include the company's reasons and justifications for a re-pricing, the company's competitive position, whether senior executives and outside directors are excluded, potential cost to shareholders, whether the re-pricing or share exchange is on a value-for-value basis, and whether vesting requirements are extended.
I. Social, Political and Environmental Issues.
We consider proposals relating to social, political and environmental issues on a case-by-case basis to determine likely financial impacts on shareholder value, balancing concerns on reputational and other risks that may be raised in a proposal against costs of implementation. We may abstain from voting on proposals that do not have a readily determinable financial impact on shareholder value. While we support proposals that we believe will enhance useful disclosure, we generally vote against proposals requesting reports that we believe are duplicative, related to matters not material to the business, or that would impose unnecessary or excessive costs. We believe that certain social and environmental shareholder proposals may intrude excessively on management prerogatives, which can lead us to oppose them.
J. Fund of Funds.
Certain Funds advised by an MSIM Affiliate invest only in other MSIM Funds. If an underlying fund has a shareholder meeting, in order to avoid any potential conflict of interest, such proposals will be voted in the same proportion as the votes of the other shareholders of the underlying fund, unless otherwise determined by the Proxy Review Committee.
III. ADMINISTRATION OF POLICY
The MSIM Proxy Review Committee (the "Committee") has overall responsibility for the Policy. The Committee, which is appointed by MSIM's Chief Investment Officer of Global Equities ("CIO") or senior officer, consists of senior investment professionals who represent the different investment disciplines and geographic locations of the firm, and is chaired by the director of the Corporate Governance Team ("CGT"). Because proxy voting is an investment responsibility and impacts shareholder value, and because of their knowledge of companies and markets, portfolio managers and other members of investment staff play a key role in proxy voting, although the Committee has final authority over proxy votes.
The CGT Director is responsible for identifying issues that require Committee deliberation or ratification. The CGT, working with advice of investment teams and the Committee, is responsible for voting on routine items and on matters that can be addressed in line with these Policy guidelines. The CGT has responsibility for voting case-by-case where guidelines and precedent provide adequate guidance.
The Committee will periodically review and have the authority to amend, as necessary, the Policy and establish and direct voting positions consistent with the Client Proxy Standard.
CGT and members of the Committee may take into account Research Providers' recommendations and research as well as any other relevant information they may request or receive, including portfolio manager and/or analyst comments and research, as applicable. Generally, proxies related to securities held in accounts that are managed pursuant to quantitative, index or index-like strategies ("Index Strategies") will be voted in the same manner as those held in actively managed accounts, unless
A-7
economic interests of the accounts differ. Because accounts managed using Index Strategies are passively managed accounts, research from portfolio managers and/or analysts related to securities held in these accounts may not be available. If the affected securities are held only in accounts that are managed pursuant to Index Strategies, and the proxy relates to a matter that is not described in this Policy, the CGT will consider all available information from the Research Providers, and to the extent that the holdings are significant, from the portfolio managers and/or analysts.
A. Committee Procedures
The Committee meets at least annually to review and consider changes to the Policy. The Committee will appoint a subcommittee (the "Subcommittee") to meet as needed between Committee meetings to address any outstanding issues relating to the Policy or its implementation.
The Subcommittee will meet on an ad hoc basis to (among other functions): (1) monitor and ratify "split voting" (i.e., allowing certain shares of the same issuer that are the subject of the same proxy solicitation and held by one or more MSIM portfolios to be voted differently than other shares) and/or "override voting" (i.e., voting all MSIM portfolio shares in a manner contrary to the Policy); (2) review and approve upcoming votes, as appropriate, for matters as requested by CGT.
The Committee reserves the right to review voting decisions at any time and to make voting decisions as necessary to ensure the independence and integrity of the votes. The Committee or the Subcommittee are provided with reports on at least a monthly basis detailing specific key votes cast by CGT.
B. Material Conflicts of Interest
In addition to the procedures discussed above, if the CGT Director determines that an issue raises a material conflict of interest, the CGT Director will request a special committee to review, and recommend a course of action with respect to, the conflict(s) in question ("Special Committee").
A potential material conflict of interest could exist in the following situations, among others:
1. The issuer soliciting the vote is a client of MSIM or an affiliate of MSIM and the vote is on a matter that materially affects the issuer.
2. The proxy relates to Morgan Stanley common stock or any other security issued by Morgan Stanley or its affiliates except if echo voting is used, as with MSIM Funds, as described herein.
3. Morgan Stanley has a material pecuniary interest in the matter submitted for a vote (e.g., acting as a financial advisor to a party to a merger or acquisition for which Morgan Stanley will be paid a success fee if completed).
If the CGT Director determines that an issue raises a potential material conflict of interest, depending on the facts and circumstances, the issue will be addressed as follows:
1. If the matter relates to a topic that is discussed in this Policy, the proposal will be voted as per the Policy.
2. If the matter is not discussed in this Policy or the Policy indicates that the issue is to be decided case-by-case, the proposal will be voted in a manner consistent with the Research Providers, provided that all the Research Providers have the same recommendation, no portfolio manager objects to that vote, and the vote is consistent with MSIM's Client Proxy Standard.
3. If the Research Providers' recommendations differ, the CGT Director will refer the matter to the Subcommittee or a Special Committee to vote on the proposal, as appropriate.
The Special Committee shall be comprised of the CGT Director, the Chief Compliance Officer or his/her designee, a senior portfolio manager (if practicable, one who is a member of the Proxy Review Committee) designated by the Proxy Review Committee, and MSIM's relevant Chief Investment Officer or his/her designee, and any other persons deemed necessary by the CGT Director. The CGT Director may request non-voting participation by MSIM's General Counsel or his/her designee. In addition to the research provided by Research Providers, the Special Committee may request analysis from MSIM Affiliate investment professionals and outside sources to the extent it deems appropriate.
A-8
C. Proxy Voting Reporting
The CGT will document in writing all Committee, Subcommittee and Special Committee decisions and actions, which documentation will be maintained by the CGT for a period of at least six years. To the extent these decisions relate to a security held by an MSIM Fund, the CGT will report the decisions to each applicable Board of Trustees/Directors of those Funds at each Board's next regularly scheduled Board meeting. The report will contain information concerning decisions made during the most recently ended calendar quarter immediately preceding the Board meeting.
MSIM will promptly provide a copy of this Policy to any client requesting it. MSIM will also, upon client request, promptly provide a report indicating how each proxy was voted with respect to securities held in that client's account.
MSIM's Legal Department is responsible for filing an annual Form N-PX on behalf of each MSIM Fund for which such filing is required, indicating how all proxies were voted with respect to such Fund's holdings.
[Appendix A and Appendix B of the Proxy Voting Policy intentionally omitted]
Revised February 25, 2009
A-9
APPENDIX B
DESCRIPTION OF RATINGS
Description of Commercial Paper and Bond Ratings
I. Excerpts From Moody's Description of Bond Ratings:
Aaa: Obligations rated Aaa are judged to be of the highest quality, with minimal credit risk. Bonds which are rated Aaa are judged to be of the best quality. Aa—Obligations rated Aa are judged to be of high quality and are subject to very low credit risk. A—Obligations rated A are considered upper-medium grade and are subject to low credit risk.
Baa: Obligations rated Baa are subject to moderate credit risk. They are considered medium-grade and as such may possess certain speculative characteristics. Ba—Obligations rated Ba are judged to have speculative elements and are subject to high credit risk. B—Obligations rated B are considered speculative and subject to high credit risk.
Caa: Obligations rated Caa are judged to be of poor standing and are subject to very high credit risk. Ca—Obligations rated Ca are highly speculative and are likely in, or very near, default, with some prospect of recovery of principal and interest. C—Obligations rated C are the lowest rated class of bonds and are typically in default, with little prospect for recovery of principal or interest.
II. Excerpts From S&P's Description of Bond Ratings:
AAA: Bonds rated AAA have the highest rating assigned by Standard & Poor's to a debt obligation and indicate an extremely strong capacity to meet its financial commitment. AA—Bonds rated AA have a very strong capacity to meet its financial commitment and differ from the highest rated obligations only to a small degree. A—Bonds rated A have a strong capacity to pay interest and repay principal although they are somewhat more susceptible to the adverse effects of changes in circumstances and economic conditions than bonds in higher rated categories.
BBB: Bonds rated BBB are regarded as having an adequate protection parameters. However, adverse economic conditions or changing circumstances are more likely to lead to a weakened capacity to meet financial commitments on the bond.
BB, B, CCC, CC and C: Debt rated BB, B, CCC, CC and C is regarded as having significant speculative characteristics. BB indicates the least degree of speculation and C the highest degree of speculation. While such obligations will likely have some quality and protective characteristics, these may be outweighed by large uncertainties or major exposures to adverse conditions. C—This rating is assigned to bonds currently highly vulnerable to nonpayment, that have payment arrearages allowed by the terms of the documents or for which a bankruptcy petition has been filed but have not experienced a payment default. It may extend to subordinated debt, preferred stock or other obligations on which cash payments have been suspended in accordance with the instrument's terms or when preferred stock is the subject of a distressed exchange offer. D—Debt rated D is in default, and payments are not made on the date due even if the applicable grace period has not expired, unless S&P believes that such payments will be made during such grace period. The D rating will be taken upon filing bankruptcy action if payments on the bond are jeopardized, or upon completion of a distressed exchange offer in which some or all of the issues is repurchased or replaced with a total value that is less than par.
III. Description of Moody's Ratings of State and Municipal Notes: Moody's ratings for state and municipal notes and other short-term obligations are designated as Municipal Investment Grade ("MIG") and are divided into the following levels: MIG-1—superior credit quality, enjoying excellent protection from established cash flows, highly reliable liquidity support or demonstrated broad-based access to the market for refinancing; MIG-2—strong credit quality with margins of protection that are ample although not so large as in the preceding group; MIG-3—acceptable credit quality, with liquidity and cash-flow protection which may be narrow and market access for re-financing that is likely to be less well-established; SG—denotes speculative-grade credit quality and debt instruments that may lack sufficient margins of protection.
IV. Description of Moody's Highest Commercial Paper Rating: Prime-1 ("P-1") -Issuers (or supporting institutions) rated Prime-1 have a superior ability to repay short-term debt obligations.
V. Excerpt From S&P's Rating of Municipal Note Issues: An S&P municipal note rating reflects the liquidity factors and market access risks unique to notes. Notes due in three years or less will likely receive a note rating. Notes maturing beyond three years will most likely receive a long-term debt rating. Notes are more
B-1
likely to receive note ratings the larger their final maturity is relative to other maturities and the more dependent the issue is on the market for refinancing. Note rating symbols are as follows: SP-l—strong capacity to pay principal and interest, with a designation of SP-1+ indicating a very strong capacity to pay debt service; SP-2—satisfactory capacity to pay principal and interest with some vulnerability to adverse financial and economic changes over the term of the notes; SP-3—speculative capacity to pay principal and interest.
VI. Description of S&P's Highest Commercial Paper Ratings: A-l—The obligor's capacity to meet its financial commitment on the obligation is strong. Within this category, obligations designated with a plus sign indicate that the obligor's capacity to meet its financial commitment on these obligations is extremely strong.
VII. Excerpts from Fitch's Bond Ratings:
AAA: Bonds considered to be investment grade and of the highest credit quality. This rating denotes the lowest expectation of credit risk. They are assigned only in cases of exceptionally strong capacity for payment of financial commitments that is highly unlikely to be adversely affected by foreseeable events.
AA: Bonds considered to be investment grade and of very high credit quality. This rating denotes expectations of very low credit risk. They indicate very strong capacity for payment of financial commitments that is not significantly vulnerable to foreseeable events.
A: Bonds considered to be investment grade and of high credit quality. This rating denotes expectations of low credit risk. The capacity for payment of financial conditions is considered strong but may, nevertheless, be more vulnerable to adverse business or economic conditions than is the case for higher ratings.
BBB: Bonds considered to be investment grade and of good credit quality. This rating indicates that expectations of credit risk are currently low. The capacity for payment of financial commitments is considered adequate, but adverse business or economic conditions are more likely to impair this capacity.
BB: Bonds are considered speculative. This rating indicates an elevated vulnerability to credit risk, particularly in the event of adverse changes in business or economic conditions over time; however, business or financial alternatives may be available to allow financial commitments to be met. Bonds rated in this category and below are not investment grade.
B: Bonds are considered highly speculative. This rating indicates that material credit risk is present.
CCC: Bonds are considered a substantial credit risk.
CC: Bonds are considered a very high level of credit risk.
C: Bonds are at exceptionally high levels of credit risk.
Defaulted obligations typically are not assigned 'D' ratings, but are instead rated in the 'B' to 'C' rating categories, depending upon their recovery prospects and other relevant characteristics. This approach better aligns obligations that have comparable overall expected loss but varying vulnerability to default and loss.
Plus (+) Minus(-) Plus and minus signs are used with a rating symbol to indicate the relative status of a credit within the rating category. Such suffixes are not added to the 'AAA' obligation rating category, or to corporate or public finance obligation ratings below 'B.'
B-2
This page intentionally left blank
MORGAN STANLEY INSTITUTIONAL FUND, INC.
PART C. OTHER INFORMATION
ITEM 15. INDEMNIFICATION
The response to this item is incorporated herein by reference to Exhibits 1 and 2 under Item 16 below and by reference to Item 25 of the Company’s Post-Effective Amendment No. 79 to its Registration Statement on Form N-1A dated May 1, 2009 (File Nos. 033-23166; 811-05624).
ITEM 16. EXHIBITS
(1) (a) |
| Articles of Amendment and Restatement is incorporated herein by reference to Exhibit 1(a) to Post-Effective Amendment No. 26 to the Registration Statement on Form N-1A filed on October 13, 1995. |
|
|
|
(b) |
| Articles Supplementary to Registrant’s Articles of Amendment and Restatement (reclassifying shares) is incorporated herein by reference to Exhibit 1(b) to Post-Effective Amendment No. 30 to the Registration Statement on Form N-1A filed on May 24, 1996. |
|
|
|
(c) |
| Articles Supplementary to Registrant’s Articles of Amendment and Restatement (adding new Technology Portfolio) is incorporated herein by reference to Exhibit 1(c) to Post-Effective Amendment No. 30 to the Registration Statement on Form N-1A filed on May 24, 1996. |
|
|
|
(d) |
| Articles Supplementary to Registrant’s Articles of Amendment and Restatement (adding U.S. Equity Plus Portfolio) is incorporated herein by reference to Exhibit 1(d) to Post-Effective Amendment No. 38 to the Registration Statement on Form N-1A filed on February 27, 1998. |
|
|
|
(e) |
| Articles Supplementary to Registrant’s Articles of Amendment and Restatement (adding European Real Estate and Asian Real Estate Portfolios) is incorporated herein by reference to Exhibit 1(e) to Post-Effective Amendment No. 38 to the Registration Statement on Form N-1A filed on February 27, 1998. |
|
|
|
(f) |
| Articles Supplementary to Registrant’s Articles of Amendment and Restatement (adding Class B shares to the Money Market Portfolio) is incorporated herein by reference to Exhibit 1(f) to Post-Effective Amendment No. 38 to the Registration Statement on Form N-1A filed on February 27, 1998. |
|
|
|
(g) |
| Articles of Amendment to Registrant’s Articles of Amendment and Restatement (Active Country Allocation Portfolio name changed to Active International Portfolio) is incorporated herein by reference to Exhibit (a)(7) to Post-Effective Amendment No. 40 to the Registration Statement on Form N-1A filed on January 27, 1999. |
|
|
|
(h) |
| Articles of Amendment to Registrant’s Articles of Amendment and Restatement (Active International Portfolio name changed to Active International Allocation Portfolio) is incorporated herein by reference to Exhibit (a)(8) to Post-Effective Amendment No. 40 to the Registration Statement on Form N-1A filed |
| on January 27, 1999. | |
|
|
|
(i) |
| Articles of Amendment to Registrant’s Articles of Amendment and Restatement (changing corporate name to Morgan Stanley Dean Witter Institutional Fund, Inc.) is incorporated herein by reference to Exhibit (a)(9) to Post-Effective Amendment No. 40 to the Registration Statement on Form N-1A filed on January 27, 1999. |
|
|
|
(j) |
| Articles of Amendment to Registrant’s Articles of Amendment and Restatement (Aggressive Equity Portfolio name changed to Focus Equity Portfolio and Emerging Growth Portfolio name changed to Small Company Growth Portfolio) is incorporated herein by reference to Exhibit (a)(10) to Post-Effective Amendment No. 43 to the Registration Statement on Form N-1A filed on May 1, 2000. |
|
|
|
(k) |
| Articles of Amendment to Registrant’s Articles of Amendment and Restatement (changing corporate name to Morgan Stanley Institutional Fund, Inc., Global Equity Portfolio name changed to Global Value Equity Portfolio, European Equity Portfolio named changed to European Value Equity Portfolio and Japanese Equity Portfolio name changed to Japanese Value Equity Portfolio) is incorporated herein by reference to Exhibit (a)(11) to Post-Effective Amendment No. 45 to the Registration Statement on Form N-1A filed on April 30, 2001. |
|
|
|
(l) |
| Articles of Amendment to the Amended and Restated Articles of Incorporation (Fixed Income Portfolio name changed to Fixed Income III Portfolio, High Yield Portfolio name changed to High Yield II Portfolio and Global Fixed Income Portfolio name changed to Global Fixed Income II Portfolio) dated July 23, 2001 is incorporated herein by reference to Exhibit (a)(12) of Post-Effective Amendment No. 59 to the Registration Statement on Form N-1A filed on April 28, 2006. |
|
|
|
(m) |
| Articles Supplementary to Registrant’s Articles of Amendment and Restatement (adding new Global Franchise Portfolio) is incorporated herein by reference to Exhibit (a)(7) to Post-Effective Amendment No. 48 to the Registration Statement on Form N-1A filed on November 26, 2001. |
|
|
|
(n) |
| Articles Supplementary to Registrant’s Articles of Amendment and Restatement (adding Large Cap Relative Value Portfolio) is incorporated herein by reference to Exhibit (a)(13) to Post-Effective Amendment No. 50 to the Registration Statement on Form N-1A filed on June 6, 2003. |
|
|
|
(o) |
| Certificate of Correction to the Articles Supplementary dated as of March 21, 2005, is incorporated herein by reference to Exhibit (a)(15) of Post-Effective Amendment No. 70 to the Registration Statement on Form N-1A filed on July 18, 2007. |
|
|
|
(p) |
| Certificate of Correction to the Articles Supplementary is incorporated herein by reference to Exhibit (a)(14) to Post-Effective Amendment No. 53 to the Registration Statement on Form N-1A filed on April 29, 2005. |
|
|
|
(q) |
| Certificate of Correction to the Articles Supplementary is incorporated herein by reference to Exhibit (a)(15) to Post-Effective Amendment No. 53 to the Registration Statement on Form N-1A filed on April 29, 2005. |
|
|
|
(r) |
| Articles Supplementary to Registrant’s Articles of Amendment and Restatement (liquidating the Asian Equity, Asian Real Estate, European Value Equity, Japanese Value Equity, Latin American and Technology Portfolios) are incorporated herein by reference to Exhibit (a)(16) to Post-Effective Amendment No. 53 to the Registration Statement on Form N-1A filed on April 29, 2005. |
|
|
|
(s) |
| Articles of Amendment to the Articles of Amendment and Restatement (Large Cap Relative Value Portfolio name changed to Large Cap Value Portfolio and Value Equity Portfolio name changed to Large Cap Relative Value Portfolio) is incorporated by reference to Exhibit (a)(17) to Post-Effective Amendment No. 55 to the Registration Statement on Form N-1A filed on October 7, 2005. |
|
|
|
(t) |
| Articles of Amendment to the Articles of Amendment and Restatement (European Real Estate Portfolio name changed to International Real Estate |
|
|
|
2
| Portfolio) is incorporated herein by reference to Exhibit (a)(18) to Post-Effective Amendment No. 55 to the Registration Statement on Form N-1A filed on October 7, 2005. | |
|
|
|
(u) |
| Certificate of Correction to the Articles Supplementary is incorporated herein by reference to Exhibit (a)(19) to Post-Effective Amendment No. 55 to the Registration Statement on Form N-1A filed on October 7, 2005. |
|
|
|
(v) |
| Certificate of Correction to the Articles Supplementary is incorporated herein by reference to Exhibit (a)(20) to Post-Effective Amendment No. 55 to the Registration Statement on Form N-1A filed on October 7, 2005. |
|
|
|
(w) |
| Articles of Amendment to Registrant’s Articles of Amendment and Restatement (changing the name of the Value Equity Portfolio to the Large Cap Relative Value Portfolio and the Equity Growth Portfolio to the U.S. Large Cap Growth Portfolio) is incorporated herein by reference to Exhibit (a)(21) to Post-Effective Amendment No. 55 to the Registration Statement on Form N-1A filed on October 7, 2005. |
|
|
|
(x) |
| Articles Supplementary to Registrant’s Articles of Amendment and Restatement (adding International Growth Equity Portfolio), is incorporated herein by reference to Exhibit (a)(22) to Post-Effective Amendment No. 56 to the Registration Statement on Form N-1A filed on December 20, 2005. |
|
|
|
(y) |
| Articles of Amendment to Registrant’s Articles of Amendment and Restatement (effecting a reverse stock split of the Emerging Markets Debt Portfolio), is incorporated herein by reference to Exhibit (a) (24) of Post-Effective Amendment No. 59 to the Registration Statement on Form N-1A filed on April 28, 2006. |
|
|
|
(z) |
| Articles Supplementary to Registrant’s Articles of Amendment and Restatement (adding Systematic Active Large Cap Core Portfolio, Systematic Active Small Cap Core Portfolio, Systematic Active Small Cap Value Portfolio and Systematic Active Small Cap Growth Portfolio), are incorporated herein by reference to Exhibit (a) (25) of Post-Effective Amendment No. 59 to the Registration Statement on Form N-1A filed on April 28, 2006. |
|
|
|
(aa) |
| Articles Supplementary to Registrant’s Articles of Amendment and Restatement (adding Global Real Estate Portfolio), is incorporated herein by reference to Exhibit (a) (26) of Post-Effective Amendment No. 60 to the Registration Statement on Form N-1A filed on May 3, 2006. |
(bb) |
| Articles Supplementary to Registrant’s Articles of Amendment and Restatement (liquidating the assets of Municipal Money Market Portfolio and Money Market Portfolio), is incorporated herein by reference to Exhibit (a)(28) of Post-Effective Amendment No. 70 to the Registration Statement on Form N-1A filed on July 18, 2007. |
(cc) |
| Certificate of Correction to the Registrant’s Articles of Amendment dated February 6, 2007, is incorporated herein by reference to Exhibit (a)(27) of Post-Effective Amendment No. 65 to the Registration Statement on Form N-1A filed on April 27, 2007. |
|
|
|
(dd) |
| Certificate of Correction to the Registrant’s Articles of Amendment dated February 6, 2007, is incorporated herein by reference to Exhibit (a)(28) of Post-Effective Amendment No. 65 to the Registration Statement on Form N-1A filed on April 27, 2007. |
|
|
|
(ee) |
| Articles of Restatement, dated February 20, 2007, is incorporated herein by reference to Exhibit (a)(29) of Post-Effective Amendment No. 65 to the Registration Statement on Form N-1A filed on April 27, 2007. |
|
|
|
(ff) |
| Articles Supplementary to Registrant’s Articles of Amendment and Restatement (adding Disciplined Large Cap Value Active Extension Portfolio and Systematic Large Cap Core Active Extension Portfolio), dated February 21, 2007, is incorporated herein by reference to Exhibit (a)(30) of Post-Effective Amendment No. 68 to the Registration Statement on Form N-1A filed on May 29, 2007. |
|
|
|
(gg) |
| Articles Supplementary to Registrant’s Articles of Amendment and Restatement (adding International Growth Active Extension Portfolio), dated April 25, 2007 is incorporated herein by reference to Exhibit (a)(31) of Post-Effective Amendment No. 69 to the Registration Statement on Form N-1A filed on July 10, 2007. |
|
|
|
(hh) |
| Articles Supplementary to Registrant’s Articles of Amendment and Restatement (adding U.S. Small/Mid Cap Value Portfolio), dated September 26, 2007, is incorporated herein by reference to Exhibit (a)(34) to Post-Effective Amendment No. 71 to the Registration Statement on Form N-1A filed on September 26, 2007. |
|
|
|
(ii) |
| Articles Supplementary to Registrant’s Articles of Amendment and Restatement (adding Class H shares to certain Portfolios), dated December 18, 2007, is incorporated herein by reference to Exhibit (a)(35) to Post-Effective Amendment No. 73 to the Registration Statement on Form N-1A filed on December 20, 2007. |
|
|
|
(jj) |
| Articles of Amendment to Registrant’s Articles of Amendment and Restatement, (redesignating all Portfolios’ Class A and Class B shares as Class I and Class P shares, respectively), dated December 18, 2007, is incorporated herein by reference to Exhibit (a)(36) to Post-Effective Amendment No. 73 to the Registration Statement on Form N-1A filed on December 20, 2007. |
(kk) |
| Articles of Amendment to Registrant’s Articles of Amendment and Restatement (changing the name of the Focus Equity Portfolio to the Focus Growth Portfolio and the U.S. Large Cap Growth Portfolio to the Capital Growth Portfolio), dated April 22, 2008, is incorporated herein by reference to Exhibit (a)(37) to Post-Effective Amendment No. 75 to the Registration Statement on Form N-1A filed on April 28, 2008. |
(ll) |
| Articles Supplementary to Registrant’s Articles of Amendment and Restatement (adding Class L shares to certain Portfolios), is incorporated herein by reference to Exhibit (a)(37) to Post-Effective Amendment No. 76 to the Registration Statement on Form N-1A filed on June 3, 2008. |
|
|
|
(mm) |
| Articles Supplementary to Registrant’s Articles of Amendment and Restatement (liquidating the assets of Systematic Active Large Cap Core, Systematic Active Small Cap Core, Systematic Active Small Cap Growth and Systematic Active Small Cap Value Portfolios), dated June 27, 2008, are incorporated herein by reference to Exhibit (a)(38) to Post-Effective Amendment No. 78 to the Registration Statement on Form N-1A filed on October 17, 2008. |
|
|
|
(nn) |
| Articles Supplementary to Registrant’s Articles of Amendment and Restatement (liquidating the assets of Disciplined Large Cap Value Active Extension and Systematic Large Cap Core Active Extension Portfolios), dated October 13, 2008, are incorporated herein by reference to Exhibit (a)(39) to Post-Effective Amendment No. 78 to the Registration Statement on Form N-1A filed on October 17, 2008. |
|
|
|
(oo) |
| Articles Supplementary to Registrant’s Articles of Amendment and Restatement (with respect to Class P shares of International Small Cap Portfolio), are incorporated herein by reference to Exhibit (a)(40) to Post-Effective Amendment No. 78 to the Registration Statement on Form N-1A filed on October 17, 2008. |
|
|
|
(pp) |
| Articles Supplementary to Registrant’s Articles of Amendment and Restatement (liquidating the assets of International Magnum Portfolio) dated April 16, 2009, are incorporated herein by reference to Exhibit (a)(42) to Post-Effective Amendment No. 79 to the Registration Statement on Form N-1A filed on April 28, 2009. |
(2) |
| Amended and Restated By-Laws, dated June 20, 2007, are incorporated herein by reference to Exhibit (b) to Post-Effective Amendment No. 71 to the Registration Statement on Form N-1A filed on September 26, 2007. |
|
|
|
(3) |
| Not applicable. |
|
|
|
(4) |
| Copy of Agreement and Plan of Reorganization (filed herewith as Exhibit A to the Proxy Statement and Prospectus). |
|
|
|
(5) (a) |
| Specimen Security with respect to Morgan Stanley Institutional Fund, Inc. Class A shares is incorporated herein by reference to Exhibit 1(a) (Amended and Restated Articles of Incorporation), as amended to date to Post-Effective Amendment No. 26 to the Registration Statement filed on October 13, 1995 and is incorporated by reference to Exhibit 2 (Amended and Restated By-Laws), as amended to date to Post-Effective Amendment No. 33 to the Registration Statement filed on February 28, 1997. |
3
(b) |
| Specimen Security with respect to Morgan Stanley Institutional Fund, Inc. Class B shares is incorporated herein by reference to Exhibit 1(a) (Amended and Restated Articles of Incorporation), as amended to date to Post-Effective Amendment No. 26 to the Registration Statement filed on October 13, 1995 and is incorporated by reference to Exhibit 2 (Amended and Restated By-Laws), as amended to date to Post-Effective Amendment No. 33 to the Registration Statement filed on February 28, 1997. |
|
|
|
(6) (a) |
| Amended and Restated Investment Advisory Agreement between the Registrant and Morgan Stanley Investment Management Inc., is incorporated herein by reference to Exhibit (d)(1) to Post-Effective Amendment No. 54 to the Registration Statement on Form N-1A filed on June 27, 2005. |
|
|
|
(b) |
| Supplement to Amended and Restated Investment Advisory Agreement (with respect to the International Growth Equity Portfolio), is incorporated herein by reference to Exhibit (d)(6) to Post-Effective Amendment No. 56 to the Registration Statement on Form N-1A filed on December 20, 2005. |
|
|
|
(c) |
| Supplement to Amended and Restated Investment Advisory Agreement (with respect to the Systematic Active Large Cap Core Portfolio, Systematic Active Small Cap Core Portfolio, Systematic Active Small Cap Value Portfolio and Systematic Active Small Cap Growth Portfolio), is incorporated by reference to Exhibit (d)(7) of Post-Effective Amendment No. 59 to the Registration Statement on Form N-1A filed on April 28, 2006. |
|
|
|
(d) |
| Supplement to the Amended and Restated Investment Advisory Agreement (with respect to the Global Real Estate Portfolio), is incorporated herein by reference to Exhibit (d)(8) of Post-Effective Amendment No. 60 to the Registration Statement on Form N-1A filed on May 3, 2006. |
|
|
|
(e) |
| Supplement to Amended and Restated Investment Advisory Agreement (with respect to the Disciplined Large Cap Value Active Extension Portfolio and Systematic Large Cap Core Active Extension Portfolio), dated February 21, 2007, is incorporated herein by reference to Exhibit (d)(5) of Post-Effective Amendment No. 68 to the Registration Statement on Form N-1A filed on May 29, 2007. |
|
|
|
(f) |
| Supplement to Amended and Restated Investment Advisory Agreement (with respect to the International Growth Active Extension Portfolio), is incorporated herein by reference to Exhibit (d)(6) of Post-Effective Amendment No. 69 to the Registration Statement on Form N-1A filed on July 10, 2007. |
|
|
|
(g) |
| Supplement to Amended and Restated Investment Advisory Agreement (with respect to U.S. Small/Mid Cap Value Portfolio), is incorporated herein by reference to Exhibit (d)(7) to Post-Effective Amendment No. 71 to the Registration Statement on Form N-1A filed on September 26, 2007. |
|
|
|
(h) |
| Sub-Advisory Agreement between Morgan Stanley Investment Management Inc. and Morgan Stanley Investment Advisors Inc. (formerly Morgan Stanley Dean Witter Investment Advisors Inc.) (with respect to the Money Market and Municipal Money Market Portfolios) is incorporated herein by reference to Exhibit (d)(6) to Post-Effective Amendment No. 43 to the Registration Statement on Form N-1A filed on May 1, 2000. |
|
|
|
(i) |
| Sub-Advisory Agreement between Morgan Stanley Investment Management Inc. and Morgan Stanley Asset & Investment Trust Management Co., Limited (relating to the Japanese Value Equity Portfolio and International Magnum Portfolio), is incorporated herein by reference to Exhibit (d)(10) to Post-Effective Amendment No. 52 to the Registration Statement on Form N-1A filed on April 30, 2004. |
(j) |
| Amended and Restated Sub-Advisory Agreement between Morgan Stanley Investment Management Inc. and Morgan Stanley Investment Management Limited (relating to the Emerging Markets Portfolio, Global Franchise Portfolio, Global Real Estate Portfolio, Global Value Equity Portfolio, International Equity Portfolio, International Real Estate Portfolio and International Small Cap Portfolio), is incorporated herein by reference to Exhibit (d)(10) of Post-Effective Amendment No. 79 to the Registration Statement on Form N-1A filed on, April 28, 2009. |
|
|
|
(k) |
| Amended and Restated Sub-Advisory Agreement between Morgan Stanley Investment Management Inc. and Morgan Stanley Investment Management Company (relating to the Emerging Markets Portfolio, Global Franchise Portfolio, Global Real Estate Portfolio, Global Value Equity Portfolio, International Equity Portfolio and International Real Estate Portfolio), is incorporated herein by reference to Exhibit (d)(11) of Post-Effective Amendment No. 79 to the Registration Statement on Form N-1A filed on April 28, 2009. |
(7) |
| Distribution Agreement, between Registrant and Morgan Stanley Distribution, Inc., is incorporated herein by reference to Exhibit (e)(2) to Post-Effective Amendment No. 53 to the Registration Statement on Form N-1A filed on April 29, 2005. |
(8) |
| Not applicable. |
4
(9) (a) |
| Global Custody Agreement between Registrant and J.P. Morgan Chase Bank, N.A., is incorporated herein by reference to Exhibit (g)(1) of Post-Effective Amendment No. 68 to the Registration Statement on Form N-1A filed on May 29, 2007. |
|
|
|
(b) |
| Amendment to Global Custody Agreement, is incorporated herein by reference to Exhibit (g)(2) of Post-Effective Amendment No. 68 to the Registration Statement on Form N-1A filed on May 29, 2007. |
(c) |
| Amendment to Global Custody Agreement (adding the U.S. Small/Mid Cap Value Portfolio) is incorporated herein by reference to Exhibit (g)(3) to Post-Effective Amendment No. 71 to the Registration Statement on Form N-1A filed on September 26, 2007. |
(10) (a) |
| Amended and Restated Shareholder Servicing Plan under Rule 12b-1 for Class P shares, is incorporated herein by reference to Exhibit (m)(1) to Post-Effective Amendment No. 78 to the Registration Statement on Form N-1A filed on October 17, 2008. |
(b) |
| Shareholder Services Plan under Rule 12b-1 for Class H Shares, is incorporated by reference to Exhibit (m)(2) of Post-Effective Amendment No. 75 to the Registration Statement on Form N-1A filed on April 28, 2008. |
(c) |
| Distribution and Shareholder Services Plan under Rule 12b-1 for Class L Shares, is incorporated herein by reference to Exhibit (m)(3) to Post-Effective Amendment No. 78 to the Registration Statement on Form N-1A filed on October 17, 2008. |
|
|
|
(d) |
| Amended and Restated Multi-Class 18f-3 Plan, is incorporated herein by reference to Exhibit (o) to Post-Effective Amendment No. 78 to the Registration Statement on Form N-1A filed on October 17, 2008. |
(11) (a) |
| Opinion and Consent of Clifford Chance US LLP, is filed herewith. |
|
|
|
(b) |
| Opinion of Ballard Spahr Andrews & Ingersoll, LLP, is filed herewith. |
|
|
|
(c) |
| Opinion of Clifford Chance US LLP (as to tax matters), is filed herewith. |
(13) (a) |
| Amended and Restated Administration Agreement between the Registrant and Morgan Stanley Investment Management Inc., dated as of November 1, 2004, is incorporated herein by reference to Exhibit (h)(1) to Post-Effective Amendment No. 52 to the Registration Statement on Form N-1A filed on February 11, 2005. |
|
|
|
(b) |
| Amended and Restated Sub-Administration Agreement between Morgan Stanley Investment Management Inc. and J.P. Morgan Investor Services Co., dated as of November 1, 2004, is incorporated herein by reference to Exhibit (h)(2) to Post-Effective Amendment No. 52 to the Registration Statement on Form N-1A filed on February 11, 2005. |
(c) |
| Amendment to the Amended and Restated Sub-Administration Agreement between Morgan Stanley Investment Management Inc. and J.P. Morgan Investor Services Co., dated as of March 7, 2007, is incorporated herein by reference to Exhibit (h)(3) to Post-Effective Amendment No. 78 to the Registration Statement on Form N-1A filed on October 17, 2008. |
(d) |
| Transfer Agency and Service Agreement between the Registrant and Morgan Stanley Services Company Inc., dated June 9, 2008, is incorporated herein by reference to Exhibit (h)(4) to Post-Effective Amendment No. 78 to the Registration Statement on Form N-1A filed on October 17, 2008. |
(14) (a) |
| Consent of Independent Registered Public Accounting Firm, is incorporated by reference to Exhibit (j)(1) to Post-Effective Amendment No. 79 to the Registration Statement on Form N-1A filed on April 28, 2009. |
|
|
|
(b) |
| Consent of Independent Registered Public Accounting Firm (with respect to Form N-14), is filed herewith. |
(15) |
| Not applicable. |
5
(16) |
| Powers of Attorney of Directors dated April 23, 2009, are filed herein. |
(17) |
| Not Applicable. |
6
ITEM 17. UNDERTAKINGS
(1) The undersigned registrant agrees that prior to any public reoffering of the securities registered through the use of a prospectus which is a part of this registration statement on Form N-14 by any person or party who is deemed to be an underwriter within the meaning of Rule 145(c) of the Securities Act, the reoffering prospectus will contain the information called for by the applicable registration form for the reofferings by persons who may be deemed underwriters, in addition to the information called for by the other items of the applicable form.
(2) The undersigned registrant agrees that every prospectus that is filed under paragraph (1) above will be filed as a part of an amendment to this registration statement on Form N-14 and will not be used until the amendment is effective, and that, in determining any liability under the Securities Act, each post-effective amendment shall be deemed to be a new registration statement for the securities offered therein, and the offering of the securities at that time shall be deemed to be the initial bona fide offering of them.
7
SIGNATURES
As required by the Securities Act of 1933, this registration statement has been signed on behalf of the registrant, in the City of New York and State of New York on the 19th day of May 2009.
| MORGAN STANLEY INSTITUTIONAL FUND, INC. |
| By: | /s/ Randy Takian |
|
| Randy Takian |
|
| President and Principal Executive Officer |
As required by the Securities Act of 1933, this registration statement has been signed below by the following persons in the capacities and on the dates indicated.
Signatures |
| Title |
| Date | |
(1) Principal Executive Officer |
| President and Principal Executive Officer |
|
| |
|
|
|
|
| |
By: | /s/ Randy Takian |
|
|
| May 19, 2009 |
| Randy Takian |
|
|
|
|
|
|
|
|
| |
(2) Principal Financial Officer |
| Treasurer and Chief Financial Officer |
|
| |
|
|
|
|
| |
By: | /s/ James Garrett |
|
|
| May 19, 2009 |
| James Garrett |
|
|
|
|
|
|
|
|
| |
(3) Majority of the Directors |
|
|
|
| |
|
|
|
|
| |
INDEPENDENT DIRECTORS |
|
|
|
| |
Frank L. Bowman |
| Michael F. Klein |
|
| |
Michael Bozic |
| Michael E. Nugent |
|
| |
Kathleen A. Dennis |
| W. Allen Reed |
|
| |
Dr. Manuel H. Johnson |
| Fergus Reid |
|
| |
Joseph J. Kearns |
|
|
|
| |
|
|
|
| May 19, 2009 | |
By: | /s/ Carl Frischling |
|
|
|
|
| Carl Frischling |
|
|
|
|
| Attorney-in-Fact for the |
|
|
|
|
| Independent Directors |
|
|
|
|
|
|
|
|
| |
INTERESTED DIRECTOR |
|
|
|
| |
James F. Higgins |
|
|
|
| |
|
|
|
|
| |
By: | /s/ Stefanie V. Chang Yu |
|
|
| May 19, 2009 |
| Stefanie V. Chang Yu |
|
|
|
|
| Attorney-in-Fact for the |
|
|
|
|
| Interested Director |
|
|
|
|
EXHIBIT INDEX
(11)(a) | Opinion and Consent of Clifford Chance US LLP. |
(11)(b) | Opinion and Consent of Ballard Spahr Andrews & Ingersoll, LLP. |
(11)(c) | Opinion and Consent of Clifford Chance US LLP (as to tax matters). |
(14)(b) | Consent of Independent Registered Public Accounting Firm. |
(16) | Powers of Attorney dated April 23, 2009. |