UNITED STATES
SECURITIES AND EXCHANGE COMMISSION
Washington, D.C. 20549
FORM N-CSR
CERTIFIED SHAREHOLDER REPORT OF REGISTERED
MANAGEMENT INVESTMENT COMPANIES
Investment Company Act file number | 811-05624 |
|
Morgan Stanley Institutional Fund, Inc. |
(Exact name of registrant as specified in charter) |
|
522 Fifth Avenue, New York, New York | | 10036 |
(Address of principal executive offices) | | (Zip code) |
|
Arthur Lev
522 Fifth Avenue, New York, New York 10036 |
(Name and address of agent for service) |
|
Registrant’s telephone number, including area code: | 212-296-6990 | |
|
Date of fiscal year end: | December 31, 2011 | |
|
Date of reporting period: | December 31, 2011 | |
| | | | | | | | |
Item 1 - Report to Shareholders
INVESTMENT MANAGEMENT

Morgan Stanley
Institutional Fund, Inc.

Global and International
Equity Portfolios
Active International Allocation
Portfolio
Asian Equity Portfolio
Emerging Markets Portfolio
Global Advantage Portfolio
Global Discovery Portfolio
Global Franchise Portfolio
Global Insight Portfolio
Global Opportunity Portfolio
Global Real Estate Portfolio
International Advantage Portfolio
International Equity Portfolio
International Opportunity Portfolio
International Real Estate Portfolio
International Small Cap Portfolio
Select Global Infrastructure Portfolio
U.S. Equity Portfolios
Advantage Portfolio
Focus Growth Portfolio
Growth Portfolio
(formerly Capital Growth Portfolio)
Insight Portfolio
Opportunity Portfolio
Small Company Growth Portfolio
U.S. Real Estate Portfolio
Fixed Income Portfolio
Emerging Markets Debt Portfolio
Annual
Report
December 31, 2011
2011 Annual Report
December 31, 2011
Table of Contents
| Shareholders' Letter | | | 2 | | |
|
| Investment Advisory Agreement Approval | | | 3 | | |
|
| Performance Summary | | | 6 | | |
|
| Expense Examples | | | 8 | | |
|
| Investment Overview and Portfolios of Investments | |
|
| Global and International Equity Portfolios: | |
|
| Active International Allocation Portfolio | | | 11 | | |
|
| Asian Equity Portfolio | | | 25 | | |
|
| Emerging Markets Portfolio | | | 30 | | |
|
| Global Advantage Portfolio | | | 37 | | |
|
| Global Discovery Portfolio | | | 41 | | |
|
| Global Franchise Portfolio | | | 45 | | |
|
| Global Insight Portfolio | | | 48 | | |
|
| Global Opportunity Portfolio | | | 52 | | |
|
| Global Real Estate Portfolio | | | 56 | | |
|
| International Advantage Portfolio | | | 62 | | |
|
| International Equity Portfolio | | | 66 | | |
|
| International Opportunity Portfolio | | | 70 | | |
|
| International Real Estate Portfolio | | | 74 | | |
|
| International Small Cap Portfolio | | | 79 | | |
|
| Select Global Infrastructure Portfolio | | | 85 | | |
|
| U.S. Equity Portfolios: | |
|
| Advantage Portfolio | | | 90 | | |
|
| Focus Growth Portfolio | | | 94 | | |
|
| Growth Portfolio (formerly Capital Growth Portfolio) | | | 98 | | |
|
| Insight Portfolio | | | 102 | | |
|
| Opportunity Portfolio | | | 106 | | |
|
| Small Company Growth Portfolio | | | 111 | | |
|
| U.S. Real Estate Portfolio | | | 116 | | |
|
| Fixed Income Portfolio: | |
|
| Emerging Markets Debt Portfolio | | | 120 | | |
|
| Statements of Assets and Liabilities | | | 126 | | |
|
| Statements of Operations | | | 138 | | |
|
| Statements of Changes in Net Assets | | | 143 | | |
|
| Financial Highlights | | | 167 | | |
|
| Notes to Financial Statements | | | 241 | | |
|
Report of Independent Registered
Public Accounting Firm | | | 256 | | |
|
| Federal Income Tax Information | | | 257 | | |
|
| U.S. Privacy Policy | | | 259 | | |
|
| Director and Officer Information | | | 262 | | |
|
This report is authorized for distribution only when preceded or accompanied by prospectuses of the Morgan Stanley Institutional Fund, Inc. To receive a prospectus and/or SAI, which contains more complete information such as investment objectives, charges, expenses, policies for voting proxies, risk considerations, and describes in detail each of the Portfolio's investment policies to the prospective investor, please call toll free 1-(800) 548-7786. Please read the prospectuses carefully before you invest or send money.
Additionally, you can access portfolio information including performance, characteristics, and investment team commentary through Morgan Stanley Investment Management's website: www.morganstanley.com/im.
Market forecasts provided in this report may not necessarily come to pass. There is no guarantee that any sectors mentioned will continue to perform as discussed herein or that securities in such sectors will be held by the Portfolio in the future. There is no assurance that a Portfolio will achieve its investment objective. Portfolios are subject to market risk, which is the possibility that market values of securities owned by the Portfolio will decline and, therefore, the value of the Portfolio's shares may be less than what you paid for them. Accordingly, you can lose money investing in Portfolios. Please see the prospectus for more complete information on investment risks.
1
2011 Annual Report
December 31, 2011
Shareholders' Letter (unaudited)
Dear Shareholders:
We are pleased to present to you the Fund's Annual Report for the year ended December 31, 2011. Our Fund currently offers 23 portfolios providing investors with a full array of global and domestic equity and fixed-income products. The Fund's portfolios, together with the portfolios of the Morgan Stanley Institutional Fund Trust, provide investors with a means to help them meet specific investment needs and to allocate their investments among equities and fixed income.
Sincerely,

Arthur Lev
President and Principal Executive Officer
January 2012
2
2011 Annual Report
December 31, 2011
Investment Advisory Agreement Approval (unaudited)
Global Insight and Insight Portfolios ("Portfolios")
At the organizational meeting of the Portfolios, the Board of Directors, including the independent Directors, considered the following factors in approving the Investment Advisory Agreement with respect to the Portfolios:
Nature, Extent and Quality of Services
The Board reviewed and considered the nature and extent of the investment advisory services to be provided by the Adviser (as defined herein) under the advisory agreement, including portfolio management, investment research and equity and fixed income securities trading. The Board also reviewed and considered the nature and extent of the non-advisory, administrative services to be provided by the Adviser under the administration agreement, including accounting, clerical, bookkeeping, compliance, business management and planning, and the provision of supplies, office space and utilities at the Adviser's expense. (The advisory and administration agreements together are referred to as the "Management Agreement.")
The Board reviewed and considered the qualifications of the portfolio managers, the senior administrative managers and other key personnel of the Adviser who will provide the administrative and advisory services to the Portfolios. The Board determined that the Adviser's portfolio managers and key personnel are well qualified by education and/or training and experience to perform the services in an efficient and professional manner. The Board concluded that the nature and extent of the advisory and administrative services to be provided were necessary and appropriate for the conduct of the business and investment activities of the Portfolios and supported its decision to approve the Management Agreement.
Performance, Fees and Expenses of the Portfolios
The Board considered that the Adviser plans to arrange for a public offering of shares of the Portfolios to raise assets for investment and that the offering had not yet begun and concluded that, since the Portfolios currently had no assets to invest (other than seed capital required under the Investment Company Act) and had no track record of performance, this was not a factor it needed to address at the present time.
The Board reviewed the advisory and administrative fee rates (the "management fee rates") proposed to be paid by the Portfolios under the Management Agreement relative to comparable funds advised by the Adviser, when applicable, and compared to their peers as determined by Lipper, Inc., and reviewed the anticipated total expense ratios of the Portfolios. The Board considered that the Portfolios require the Adviser to develop processes, invest in additional resources and incur additional risks to successfully manage the Portfolios and concluded that the proposed management fee rates and anticipated total expense ratios would be competitive with their peer group averages.
Economies of Scale
The Board considered the growth prospects of the Portfolios and the structure of the proposed management fee schedules, which include breakpoints for each of the Portfolios. The Board considered that the Portfolios' potential growth was uncertain and concluded that it would be premature to consider economies of scale as a factor in approving the Management Agreement at the present time.
Profitability of the Adviser and Affiliates
Since the Portfolios have not begun operations and have not paid any fees to the Adviser, the Board concluded that this was not a factor that needed to be considered at the present time.
Other Benefits of the Relationship
The Board considered other benefits to the Adviser and its affiliates derived from their relationship with the Portfolios and other funds advised by the Adviser. These benefits may include, among other things, "float" benefits derived from handling of checks for purchases and sales, research received by the Adviser generated from commission dollars spent on funds' portfolio trading and fees for distribution and/or shareholder servicing. Since the Portfolios have not begun operations and have not paid any fees to the Adviser, the Board concluded that these benefits were not a factor that needed to be considered at the present time.
3
2011 Annual Report
December 31, 2011
Investment Advisory Agreement Approval (unaudited) (cont'd)
Resources of the Adviser and Historical Relationship Between the Portfolios and the Adviser
The Board considered whether the Adviser is financially sound and has the resources necessary to perform its obligations under the Management Agreement. The Board also reviewed and considered the historical relationship between the Fund and the Adviser, including the organizational structure of the Adviser, the policies and procedures formulated and adopted by the Adviser for managing the Portfolios' operations and the Board's confidence in the competence and integrity of the senior managers and key personnel of the Adviser. The Board concluded that the Adviser has the financial resources necessary to fulfill its obligations under the Management Agreement and that it is beneficial for the Portfolios to enter into this relationship with the Adviser.
Other Factors and Current Trends
The Board considered the controls and procedures adopted and implemented by the Adviser and monitored by the Fund's Chief Compliance Officer and concluded that the conduct of business by the Adviser indicates a good faith effort on its part to adhere to high ethical standards in the conduct of the Fund's business.
General Conclusion
After considering and weighing all of the above factors, the Board concluded that it would be in the best interest of the Portfolios' and their future shareholders to approve the Management Agreement, which will remain in effect for two years and thereafter must be approved annually by the Board of the Fund if it is to continue in effect. In reaching this conclusion the Board did not give particular weight to any single factor referenced above. It is possible that individual Board members may have weighed these factors differently in reaching their individual decisions to approve the Management Agreement.
4
(This Page has been left blank intentionally.)
2011 Annual Report
December 31, 2011
Performance Summary (unaudited)
| | | Inception Dates | | One Year Total Return | | Five Years
Average Annual Total Return | |
| | | Class I | | Class P | | Class H | | Class L | | Class I | | Class P | | Class H | | Class L | | Index | | | | Class I | | Class P | | Class H | | Class L | | Index | | | |
| Global and International Equity Portfolios: | |
| Active International Allocation | | 1/17/92 | | 1/2/96 | | | — | | | | — | | | | –14.56 | % | | | –14.75 | % | | | — | % | | | — | % | | | –12.14 | % | | | (1 | ) | | | –3.66 | % | | | –3.90 | % | | | — | % | | | — | % | | | –4.72 | % | | | (1 | ) | |
| Asian Equity | | 12/28/10 | | 12/28/10 | | 12/28/10 | | 12/28/10 | | | –16.88 | | | | –17.08 | | | | –17.08 | | | | –17.57 | | | | –17.31 | | | | (2 | ) | | | — | | | | — | | | | — | | | | — | | | | — | | | | (2 | ) | |
| Emerging Markets | | 9/25/92 | | 1/2/96 | | | — | | | | — | | | | –18.41 | | | | –18.63 | | | | — | | | | — | | | | –18.42 | | | | (3 | ) | | | 0.23 | | | | –0.02 | | | | — | | | | — | | | | 2.40 | | | | (3 | ) | |
| Global Advantage | | 12/28/10 | | 12/28/10 | | 12/28/10 | | 12/28/10 | | | 0.34 | | | | 0.07 | | | | 0.08 | | | | –0.44 | | | | –7.35 | | | | (4 | ) | | | — | | | | — | | | | — | | | | — | | | | — | | | | (4 | ) | |
| Global Discovery | | 12/28/10 | | 12/28/10 | | 12/28/10 | | 12/28/10 | | | –7.72 | | | | –7.98 | | | | –7.96 | | | | –8.41 | | | | –7.35 | | | | (4 | ) | | | — | | | | — | | | | — | | | | — | | | | — | | | | (4 | ) | |
| Global Franchise | | 11/28/01 | | 11/28/01 | | | — | | | | — | | | | 9.38 | | | | 8.98 | | | | — | | | | — | | | | –5.54 | | | | (5 | ) | | | 4.74 | | | | 4.46 | | | | — | | | | — | | | | –2.37 | | | | (5 | ) | |
| Global Insight | | 12/28/11 | | | — | | | 12/28/11 | | 12/28/11 | | | — | | | | — | | | | — | | | | — | | | | — | | | | (4 | ) | | | — | | | | — | | | | — | | | | — | | | | — | | | | (4 | ) | |
| Global Opportunity | | 5/30/08 | | 5/21/10 | | 5/30/08 | | 5/30/08 | | | –4.90 | | | | –5.16 | | | | –5.18 | | | | –5.19 | | | | –7.35 | | | | (4 | ) | | | — | | | | — | | | | — | | | | — | | | | — | | | | (4 | ) | |
| Global Real Estate | | 8/30/06 | | 8/30/06 | | 1/2/08 | | 6/16/08 | | | –9.67 | | | | –9.91 | | | | –9.90 | | | | –10.33 | | | | –6.00 | | | | (6 | ) | | | –4.94 | | | | –5.21 | | | | — | | | | — | | | | –5.46 | | | | (6 | ) | |
| International Advantage | | 12/28/10 | | 12/28/10 | | 12/28/10 | | 12/28/10 | | | –1.31 | | | | –1.57 | | | | –1.57 | | | | –2.09 | | | | –13.71 | | | | (7 | ) | | | — | | | | — | | | | — | | | | — | | | | — | | | | (7 | ) | |
| International Equity | | 8/4/89 | | 1/2/96 | | | — | | | | — | | | | –7.63 | | | | –7.83 | | | | — | | | | — | | | | –12.14 | | | | (1 | ) | | | –2.63 | | | | –2.88 | | | | — | | | | — | | | | –4.72 | | | | (1 | ) | |
| International Opportunity | | 3/31/10 | | 3/31/10 | | 3/31/10 | | 3/31/10 | | | –10.16 | | | | –10.33 | | | | –10.30 | | | | –10.81 | | | | –13.71 | | | | (7 | ) | | | — | | | | — | | | | — | | | | — | | | | — | | | | (7 | ) | |
| International Real Estate | | 10/1/97 | | 10/1/97 | | | — | | | | — | | | | –19.92 | | | | –20.16 | | | | — | | | | — | | | | –17.81 | | | | (8 | ) | | | –11.92 | | | | –12.14 | | | | — | | | | — | | | | –8.75 | | | | (8 | ) | |
| International Small Cap | | 12/15/92 | | 10/21/08 | | | — | | | | — | | | | –18.33 | | | | –18.56 | | | | — | | | | — | | | | –15.94 | | | | (9 | ) | | | –6.39 | | | | — | | | | — | | | | — | | | | –4.14 | | | | (9 | ) | |
| Select Global Infrastructure | | 9/20/10 | | 9/20/10 | | 9/20/10 | | 9/20/10 | | | 15.95 | | | | 15.67 | | | | 15.67 | | | | 15.12 | | | | 13.75 | | | | (10 | ) | | | — | | | | — | | | | — | | | | — | | | | — | | | | (10 | ) | |
| U.S. Equity Portfolios: | |
| Advantage | | 6/30/08 | | 5/21/10 | | 6/30/08 | | 6/30/08 | | | 5.33 | | | | 5.07 | | | | 5.06 | | | | 5.19 | | | | 2.64 | | | | (11 | ) | | | — | | | | — | | | | — | | | | — | | | | — | | | | (11 | ) | |
| Focus Growth | | 3/8/95 | | 1/2/96 | | | — | | | | — | | | | –7.30 | | | | –7.53 | | | | — | | | | — | | | | 2.64 | | | | (11 | ) | | | 3.76 | | | | 3.49 | | | | — | | | | — | | | | 2.50 | | | | (11 | ) | |
| Growth | | 4/2/91 | | 1/2/96 | | | — | | | | — | | | | –3.01 | | | | –3.27 | | | | — | | | | — | | | | 2.64 | | | | (11 | ) | | | 3.34 | | | | 3.09 | | | | — | | | | — | | | | 2.50 | | | | (11 | ) | |
| Insight | | 12/28/11 | | | — | | | 12/28/11 | | 12/28/11 | | | — | | | | — | | | | — | | | | — | | | | — | | | | (12 | ) | | | — | | | | — | | | | — | | | | — | | | | — | | | | (12 | ) | |
| Opportunity | | 8/12/05 | | 5/21/10 | | 5/28/98 | | 5/28/98 | | | –0.46 | | | | –0.72 | | | | –0.73 | | | | –1.17 | | | | 2.64 | | | | (11 | ) | | | 5.16 | | | | — | | | | 4.86 | | | | 4.18 | | | | 2.50 | | | | (11 | ) | |
| Small Company Growth | | 11/1/89 | | 1/2/96 | | 11/11/11 | | 11/11/11 | | | –9.12 | | | | –9.28 | | | | — | | | | — | | | | –2.91 | | | | (13 | ) | | | 0.49 | | | | 0.24 | | | | — | | | | — | | | | 2.09 | | | | (13 | ) | |
| U.S. Real Estate | | 2/24/95 | | 1/2/96 | | 11/11/11 | | 11/11/11 | | | 5.57 | | | | 5.26 | | | | — | | | | — | | | | 8.29 | | | | (14 | ) | | | –1.70 | | | | –1.97 | | | | — | | | | — | | | | –1.42 | | | | (14 | ) | |
| Fixed Income Portfolio: | |
| Emerging Markets Debt | | 2/1/94 | | 1/2/96 | | 1/2/08 | | 6/16/08 | | | –3.66 | | | | –3.90 | | | | –3.88 | | | | –4.34 | | | | –1.75 | | | | (15 | ) | | | 5.15 | | | | 4.86 | | | | — | | | | — | | | | 7.02 | | | | (15 | ) | |
6
2011 Annual Report
December 31, 2011
Performance Summary (unaudited) (cont'd)
| | | Ten Years
Average Annual Total Return | | Since Inception
Average Annual Total Return* | |
| | | Class I | | Class P | | Class H | | Class L | | Index | | | | Class I | | Index | | Class P | | Index | | Class H | | Index | | Class L | | Index | | | |
| Global and International Equity Portfolios: | |
| Active International Allocation | | | 4.84 | % | | | 4.57 | % | | | — | % | | | — | % | | | 4.67 | % | | | (1 | ) | | | 5.36 | % | | | 4.82 | % | | | 4.35 | % | | | 3.55 | % | | | — | % | | | — | % | | —% | | —%(1) | |
| Asian Equity | | | — | | | | — | | | | — | | | | — | | | | — | | | | (2 | ) | | | –15.19 | | | | –15.45 | | | | –15.38 | | | | –15.45 | | | | –15.38 | | | | –15.45 | | | | –15.88 | | | | –15.45 | | | | (2 | ) | |
| Emerging Markets | | | 12.98 | | | | 12.69 | | | | — | | | | — | | | | 13.86 | | | | (3 | ) | | | 8.70 | | | | 8.46 | | | | 7.48 | | | | 6.79 | | | | — | | | | — | | | | — | | | | — | | | | (3 | ) | |
| Global Advantage | | | — | | | | — | | | | — | | | | — | | | | — | | | | (4 | ) | | | 0.43 | | | | –6.71 | | | | 0.17 | | | | –6.71 | | | | 0.18 | | | | –6.71 | | | | –0.34 | | | | –6.71 | | | | (4 | ) | |
| Global Discovery | | | — | | | | — | | | | — | | | | — | | | | — | | | | (4 | ) | | | –7.93 | | | | –6.71 | | | | –8.19 | | | | –6.71 | | | | –8.17 | | | | –6.71 | | | | –8.62 | | | | –6.71 | | | | (4 | ) | |
| Global Franchise | | | 10.44 | | | | 10.15 | | | | — | | | | — | | | | 3.62 | | | | (5 | ) | | | 10.85 | | | | 3.76 | | | | 10.55 | | | | 3.76 | | | | — | | | | — | | | | — | | | | — | | | | (5 | ) | |
| Global Insight | | | — | | | | — | | | | — | | | | — | | | | — | | | | (4 | ) | | | 0.70 | | | | 1.15 | | | | — | | | | — | | | | 0.70 | | | | 1.15 | | | | 0.70 | | | | 1.15 | | | | (4 | ) | |
| Global Opportunity | | | — | | | | — | | | | — | | | | — | | | | — | | | | (4 | ) | | | 2.83 | | | | –4.90 | | | | 16.07 | | | | 7.82 | | | | 2.60 | | | | –4.90 | | | | 2.51 | | | | –4.90 | | | | (4 | ) | |
| Global Real Estate | | | — | | | | — | | | | — | | | | — | | | | — | | | | (6 | ) | | | –1.76 | | | | –2.29 | | | | –2.03 | | | | –2.29 | | | | –4.34 | | | | –4.99 | | | | –4.13 | | | | –3.76 | | | | (6 | ) | |
| International Advantage | | | — | | | | — | | | | — | | | | — | | | | — | | | | (7 | ) | | | –1.40 | | | | –12.66 | | | | –1.66 | | | | –12.66 | | | | –1.65 | | | | –12.66 | | | | –2.17 | | | | –12.66 | | | | (7 | ) | |
| International Equity | | | 5.72 | | | | 5.47 | | | | — | | | | — | | | | 4.67 | | | | (1 | ) | | | 8.53 | | | | 3.63 | | | | 7.34 | | | | 3.55 | | | | — | | | | — | | | | — | | | | — | | | | (1 | ) | |
| International Opportunity | | | — | | | | — | | | | — | | | | — | | | | — | | | | (7 | ) | | | 4.73 | | | | –3.22 | | | | 4.47 | | | | –3.22 | | | | 4.49 | | | | –3.22 | | | | 3.95 | | | | –3.22 | | | | (7 | ) | |
| International Real Estate | | | 9.59 | | | | 9.31 | | | | — | | | | — | | | | 9.02 | | | | (8 | ) | | | 6.87 | | | | 4.45 | | | | 6.61 | | | | 4.45 | | | | — | | | | — | | | | — | | | | — | | | | (8 | ) | |
| International Small Cap | | | 6.45 | | | | — | | | | — | | | | — | | | | 9.01 | | | | (9 | ) | | | 8.29 | | | | 4.93 | | | | 6.25 | | | | 12.11 | | | | — | | | | — | | | | — | | | | — | | | | (9 | ) | |
| Select Global Infrastructure | | | — | | | | — | | | | — | | | | — | | | | — | | | | (10 | ) | | | 16.57 | | | | 15.80 | | | | 16.29 | | | | 15.80 | | | | 16.29 | | | | 15.80 | | | | 15.73 | | | | 15.80 | | | | (10 | ) | |
| U.S. Equity Portfolios: | |
| Advantage | | | — | | | | — | | | | — | | | | — | | | | — | | | | (11 | ) | | | 4.73 | | | | 3.09 | | | | 16.05 | | | | 13.66 | | | | 4.49 | | | | 3.09 | | | | 4.53 | | | | 3.09 | | | | (11 | ) | |
| Focus Growth | | | 3.79 | | | | 3.53 | | | | — | | | | — | | | | 2.60 | | | | (11 | ) | | | 9.87 | | | | 6.88 | | | | 7.73 | | | | 5.48 | | | | — | | | | — | | | | — | | | | — | | | | (11 | ) | |
| Growth | | | 3.42 | | | | 3.17 | | | | — | | | | — | | | | 2.60 | | | | (11 | ) | | | 8.73 | | | | 7.20 | | | | 6.83 | | | | 5.48 | | | | — | | | | — | | | | — | | | | — | | | | (11 | ) | |
| Insight | | | — | | | | — | | | | — | | | | — | | | | — | | | | (12 | ) | | | 0.60 | | | | 0.72 | | | | — | | | | — | | | | 0.60 | | | | 0.72 | | | | 0.60 | | | | 0.72 | | | | (12 | ) | |
| Opportunity | | | — | | | | — | | | | 3.85 | | | | 3.17 | | | | 2.60 | | | | (11 | ) | | | 6.58 | | | | 3.79 | | | | 14.44 | | | | 13.66 | | | | 3.68 | | | | 1.89 | | | | 2.97 | | | | 1.89 | | | | (11 | ) | |
| Small Company Growth | | | 5.68 | | | | 5.42 | | | | — | | | | — | | | | 4.48 | | | | (13 | ) | | | 10.39 | | | | 6.40 | | | | 8.99 | | | | 4.38 | | | | –3.46 | | | | –1.26 | | | | –3.54 | | | | –1.26 | | | | (13 | ) | |
| U.S. Real Estate | | | 10.99 | | | | 10.70 | | | | — | | | | — | | | | 10.20 | | | | (14 | ) | | | 12.69 | | | | 10.77 | | | | 11.71 | | | | 10.40 | | | | 1.24 | | | | 2.25 | | | | 1.17 | | | | 2.25 | | | | (14 | ) | |
| Fixed Income Portfolio: | |
| Emerging Markets Debt | | | 9.74 | | | | 9.46 | | | | — | | | | — | | | | 10.49 | | | | (15 | ) | | | 9.58 | | | | 9.82 | | | | 9.78 | | | | 10.81 | | | | 5.03 | | | | 6.96 | | | | 4.84 | | | | 7.67 | | | | (15 | ) | |
Performance data quoted assumes that all dividends and distributions, if any, were reinvested and represents past performance, which is no guarantee of future results. Returns do not reflect the deduction of any applicable sales charges for Class H shares. Such costs would lower performance. Current performance may be lower or higher than the figures shown. For the most recent month-end performance figures, please visit www.morganstanley.com/im or call 1-800-548-7786. Investment returns and principal value will fluctuate and fund shares, when redeemed, may be worth more or less than their original cost.
* Returns for periods less than one year are not annualized.
Indices:
(1) MSCI EAFE (Europe, Australasia, Far East) Index
(2) MSCI All Country Asia Ex-Japan Index
(3) MSCI Emerging Markets Net Index
(4) MSCI All Country World Index
(5) MSCI World Index
(6) FTSE EPRA/NAREIT Developed Real Estate (Net) Index
(7) MSCI All Country World Index Ex-U.S. Index
(8) FTSE EPRA/NAREIT Developed ex-North America Real Estate Index
(9) MSCI EAFE Small Cap Total Return Index
(10) Dow Jones Brookfield Global Infrastructure IndexSM
(11) Russell 1000® Growth Index
(12) Russell 3000® Value Index
(13) Russell 2000® Growth Index
(14) FTSE NAREIT Equity REITs Index
(15) JP Morgan EMBI Global Bond Index/JP Morgan GBI-EM Global Diversified Bond Index
7
2011 Annual Report
December 31, 2011
Expense Examples (unaudited)
As a shareholder of a Portfolio, you may incur two types of costs: (1) transactional costs, including redemptions fees, and (2) ongoing costs, including management fees, shareholder servicing and distribution fees (in the case of Class P, Class H and Class L) and other Portfolio expenses. These examples are intended to help you understand your ongoing costs (in dollars) of investing in a Portfolio and to compare these costs with the ongoing costs of investing in other mutual funds.
These examples are based on an investment of $1,000 invested at the beginning of the six-month period ended December 31, 2011 and held for the entire six-month period.
Actual Expenses
The table below provides information about actual account values and actual expenses. You may use the information in this table, together with the amount you invested, to estimate the expenses that you paid over the period. Simply divide your account value by $1,000 (for example, an $8,600 account value divided by $1,000 = 8.6), then multiply the result by the number in the table under the heading entitled "Actual Expenses Paid During Period" to estimate the expenses you paid on your account during this period.
Please note that "Actual Expenses Paid During Period" are grossed up to reflect Portfolio expenses prior to the effect of Expense Offset (See Note F in the Notes to Financial Statements). Therefore, the annualized net expense ratios may differ from the ratio of expenses to average net assets shown in the Financial Highlights.
Hypothetical Example for Comparison Purposes
The table below provides information about hypothetical account values and hypothetical expenses based on the Portfolio's actual expense ratio and an assumed rate of return of 5% per year before expenses, which is not the Portfolio's actual return. The hypothetical account values and expenses may not be used to estimate the actual ending account balance or expenses you paid for the period. You may use this information to compare the ongoing costs of investing in the Portfolio and other funds. To do so, compare this 5% hypothetical example with the 5% hypothetical examples that appear in the shareholder reports of the other funds.
Please note that the expenses shown in the table are meant to highlight your ongoing costs only and do not reflect any transactional costs, such as redemption fees. Therefore, the second line of the table is useful in comparing ongoing costs only, and will not help you determine the relative total costs of owning different funds. In addition, if these transactional costs were included, your costs would have been higher.
8
2011 Annual Report
December 31, 2011
Expense Examples (unaudited) (cont'd)
| Portfolio | | Beginning
Account
Value
7/1/11 | | Actual Ending
Account
Value
12/31/11 | | Hypothetical
Ending Account
Value | | Actual
Expenses
Paid
During
Period* | | Hypothetical
Expenses Paid
During Period* | | Net
Expense
Ratio
During
Period** | |
| Active International Allocation Portfolio Class I | | $ | 1,000.00 | | | $ | 815.80 | | | $ | 1,020.72 | | | $ | 4.07 | | | $ | 4.53 | | | | 0.89 | % | |
| Active International Allocation Portfolio Class P | | | 1,000.00 | | | | 814.70 | | | | 1,019.46 | | | | 5.21 | | | | 5.80 | | | | 1.14 | | |
| Asian Equity Portfolio Class I | | | 1,000.00 | | | | 819.10 | | | | 1,017.95 | | | | 6.60 | | | | 7.32 | | | | 1.44 | | |
| Asian Equity Portfolio Class P | | | 1,000.00 | | | | 818.00 | | | | 1,016.69 | | | | 7.74 | | | | 8.59 | | | | 1.69 | | |
| Asian Equity Portfolio Class H | | | 1,000.00 | | | | 818.00 | | | | 1,016.69 | | | | 7.74 | | | | 8.59 | | | | 1.69 | | |
| Asian Equity Portfolio Class L | | | 1,000.00 | | | | 815.50 | | | | 1,014.17 | | | | 10.02 | | | | 11.12 | | | | 2.19 | | |
| Emerging Markets Portfolio Class I | | | 1,000.00 | | | | 823.40 | | | | 1,017.69 | | | | 6.85 | | | | 7.58 | | | | 1.49 | | |
| Emerging Markets Portfolio Class P | | | 1,000.00 | | | | 822.40 | | | | 1,016.43 | | | | 7.99 | | | | 8.84 | | | | 1.74 | | |
| Global Advantage Portfolio Class I | | | 1,000.00 | | | | 930.80 | | | | 1,018.65 | | | | 6.33 | | | | 6.61 | | | | 1.30 | | |
| Global Advantage Portfolio Class P | | | 1,000.00 | | | | 930.10 | | | | 1,017.39 | | | | 7.54 | | | | 7.88 | | | | 1.55 | | |
| Global Advantage Portfolio Class H | | | 1,000.00 | | | | 930.20 | | | | 1,017.39 | | | | 7.54 | | | | 7.88 | | | | 1.55 | | |
| Global Advantage Portfolio Class L | | | 1,000.00 | | | | 927.90 | | | | 1,014.87 | | | | 9.96 | | | | 10.41 | | | | 2.05 | | |
| Global Discovery Portfolio Class I | | | 1,000.00 | | | | 828.10 | | | | 1,018.40 | | | | 6.22 | | | | 6.87 | | | | 1.35 | | |
| Global Discovery Portfolio Class P | | | 1,000.00 | | | | 827.20 | | | | 1,017.14 | | | | 7.37 | | | | 8.13 | | | | 1.60 | | |
| Global Discovery Portfolio Class H | | | 1,000.00 | | | | 826.70 | | | | 1,017.14 | | | | 7.37 | | | | 8.13 | | | | 1.60 | | |
| Global Discovery Portfolio Class L | | | 1,000.00 | | | | 824.90 | | | | 1,014.62 | | | | 9.66 | | | | 10.66 | | | | 2.10 | | |
| Global Franchise Portfolio Class I | | | 1,000.00 | | | | 974.60 | | | | 1,020.16 | | | | 4.98 | | | | 5.09 | | | | 1.00 | | |
| Global Franchise Portfolio Class P | | | 1,000.00 | | | | 972.60 | | | | 1,018.90 | | | | 6.22 | | | | 6.36 | | | | 1.25 | | |
| Global Insight Portfolio Class I | | | 1,000.00 | | | | 1,007.00 | | | | 1,000.30 | | | | 0.11 | + | | | 0.11 | | | | 1.35 | | |
| Global Insight Portfolio Class H | | | 1,000.00 | | | | 1,007.00 | | | | 1,000.28 | | | | 0.13 | + | | | 0.13 | | | | 1.60 | | |
| Global Insight Portfolio Class L | | | 1,000.00 | | | | 1,007.00 | | | | 1,000.24 | | | | 0.17 | + | | | 0.17 | | | | 2.10 | | |
| Global Opportunity Portfolio Class I | | | 1,000.00 | | | | 869.20 | | | | 1,018.95 | | | | 5.84 | | | | 6.31 | | | | 1.24 | | |
| Global Opportunity Portfolio Class P | | | 1,000.00 | | | | 868.00 | | | | 1,017.69 | | | | 7.02 | | | | 7.58 | | | | 1.49 | | |
| Global Opportunity Portfolio Class H | | | 1,000.00 | | | | 868.40 | | | | 1,017.69 | | | | 7.02 | | | | 7.58 | | | | 1.49 | | |
| Global Opportunity Portfolio Class L | | | 1,000.00 | | | | 868.10 | | | | 1,017.44 | | | | 7.25 | | | | 7.83 | | | | 1.54 | | |
| Global Real Estate Portfolio Class I | | | 1,000.00 | | | | 857.40 | | | | 1,019.81 | | | | 5.01 | | | | 5.45 | | | | 1.07 | | |
| Global Real Estate Portfolio Class P | | | 1,000.00 | | | | 855.90 | | | | 1,018.55 | | | | 6.17 | | | | 6.72 | | | | 1.32 | | |
| Global Real Estate Portfolio Class H | | | 1,000.00 | | | | 856.80 | | | | 1,018.55 | | | | 6.18 | | | | 6.72 | | | | 1.32 | | |
| Global Real Estate Portfolio Class L | | | 1,000.00 | | | | 854.10 | | | | 1,016.03 | | | | 8.51 | | | | 9.25 | | | | 1.82 | | |
| International Advantage Portfolio Class I | | | 1,000.00 | | | | 915.40 | | | | 1,018.90 | | | | 6.03 | | | | 6.36 | | | | 1.25 | | |
| International Advantage Portfolio Class P | | | 1,000.00 | | | | 913.80 | | | | 1,017.64 | | | | 7.24 | | | | 7.63 | | | | 1.50 | | |
| International Advantage Portfolio Class H | | | 1,000.00 | | | | 913.90 | | | | 1,017.64 | | | | 7.24 | | | | 7.63 | | | | 1.50 | | |
| International Advantage Portfolio Class L | | | 1,000.00 | | | | 911.50 | | | | 1,015.12 | | | | 9.64 | | | | 10.16 | | | | 2.00 | | |
| International Equity Portfolio Class I | | | 1,000.00 | | | | 871.20 | | | | 1,020.42 | | | | 4.48 | | | | 4.84 | | | | 0.95 | | |
| International Equity Portfolio Class P | | | 1,000.00 | | | | 870.00 | | | | 1,019.16 | | | | 5.66 | | | | 6.11 | | | | 1.20 | | |
| International Opportunity Portfolio Class I | | | 1,000.00 | | | | 836.00 | | | | 1,019.46 | | | | 5.28 | | | | 5.80 | | | | 1.14 | | |
| International Opportunity Portfolio Class P | | | 1,000.00 | | | | 835.00 | | | | 1,018.20 | | | | 6.43 | | | | 7.07 | | | | 1.39 | | |
| International Opportunity Portfolio Class H | | | 1,000.00 | | | | 835.30 | | | | 1,018.20 | | | | 6.43 | | | | 7.07 | | | | 1.39 | | |
| International Opportunity Portfolio Class L | | | 1,000.00 | | | | 832.90 | | | | 1,015.68 | | | | 8.73 | | | | 9.60 | | | | 1.89 | | |
| International Real Estate Portfolio Class I | | | 1,000.00 | | | | 780.90 | | | | 1,020.16 | | | | 4.49 | | | | 5.09 | | | | 1.00 | | |
| International Real Estate Portfolio Class P | | | 1,000.00 | | | | 779.30 | | | | 1,018.90 | | | | 5.61 | | | | 6.36 | | | | 1.25 | | |
| International Small Cap Portfolio Class I | | | 1,000.00 | | | | 788.10 | | | | 1,019.41 | | | | 5.18 | | | | 5.85 | | | | 1.15 | | |
| International Small Cap Portfolio Class P | | | 1,000.00 | | | | 786.40 | | | | 1,018.15 | | | | 6.30 | | | | 7.12 | | | | 1.40 | | |
| Select Global Infrastructure Portfolio Class I | | | 1,000.00 | | | | 1,038.80 | | | | 1,019.41 | | | | 5.91 | | | | 5.85 | | | | 1.15 | | |
| Select Global Infrastructure Portfolio Class P | | | 1,000.00 | | | | 1,037.20 | | | | 1,018.15 | | | | 7.19 | | | | 7.12 | | | | 1.40 | | |
| Select Global Infrastructure Portfolio Class H | | | 1,000.00 | | | | 1,037.20 | | | | 1,018.15 | | | | 7.19 | | | | 7.12 | | | | 1.40 | | |
| Select Global Infrastructure Portfolio Class L | | | 1,000.00 | | | | 1,034.90 | | | | 1,015.63 | | | | 9.75 | | | | 9.65 | | | | 1.90 | | |
| Advantage Portfolio Class I | | | 1,000.00 | | | | 974.40 | | | | 1,019.91 | | | | 5.23 | | | | 5.35 | | | | 1.05 | | |
| Advantage Portfolio Class P | | | 1,000.00 | | | | 973.60 | | | | 1,018.65 | | | | 6.47 | | | | 6.61 | | | | 1.30 | | |
| Advantage Portfolio Class H | | | 1,000.00 | | | | 973.50 | | | | 1,018.65 | | | | 6.47 | | | | 6.61 | | | | 1.30 | | |
| Advantage Portfolio Class L | | | 1,000.00 | | | | 974.10 | | | | 1,019.71 | | | | 5.42 | | | | 5.55 | | | | 1.09 | | |
| Focus Growth Portfolio Class I | | | 1,000.00 | | | | 860.20 | | | | 1,020.21 | | | | 4.64 | | | | 5.04 | | | | 0.99 | | |
| Focus Growth Portfolio Class P | | | 1,000.00 | | | | 859.20 | | | | 1,018.95 | | | | 5.81 | | | | 6.31 | | | | 1.24 | | |
| Growth Portfolio Class I | | | 1,000.00 | | | | 886.50 | | | | 1,021.53 | | | | 3.47 | | | | 3.72 | | | | 0.73 | | |
9
2011 Annual Report
December 31, 2011
Expense Examples (unaudited) (cont'd)
| Portfolio | | Beginning
Account
Value
7/1/11 | | Actual Ending
Account
Value
12/31/11 | | Hypothetical
Ending Account
Value | | Actual
Expenses
Paid
During
Period* | | Hypothetical
Expenses Paid
During Period* | | Net
Expense
Ratio
During
Period** | |
| Growth Portfolio Class P | | $ | 1,000.00 | | | $ | 885.50 | | | $ | 1,020.27 | | | $ | 4.66 | | | $ | 4.99 | | | | 0.98 | % | |
| Insight Portfolio Class I | | | 1,000.00 | | | | 1,006.00 | | | | 1,000.32 | | | | 0.09 | + | | | 0.09 | | | | 1.05 | | |
| Insight Portfolio Class H | | | 1,000.00 | | | | 1,006.00 | | | | 1,000.30 | | | | 0.11 | + | | | 0.11 | | | | 1.30 | | |
| Insight Portfolio Class L | | | 1,000.00 | | | | 1,006.00 | | | | 1,000.26 | | | | 0.15 | + | | | 0.15 | | | | 1.80 | | |
| Opportunity Portfolio Class I | | | 1,000.00 | | | | 926.70 | | | | 1,020.77 | | | | 4.27 | | | | 4.48 | | | | 0.88 | | |
| Opportunity Portfolio Class P | | | 1,000.00 | | | | 925.20 | | | | 1,019.51 | | | | 5.48 | | | | 5.75 | | | | 1.13 | | |
| Opportunity Portfolio Class H | | | 1,000.00 | | | | 924.90 | | | | 1,019.51 | | | | 5.48 | | | | 5.75 | | | | 1.13 | | |
| Opportunity Portfolio Class L | | | 1,000.00 | | | | 923.10 | | | | 1,016.99 | | | | 7.90 | | | | 8.29 | | | | 1.63 | | |
| Small Company Growth Portfolio Class I | | | 1,000.00 | | | | 889.40 | | | | 1,019.91 | | | | 5.00 | | | | 5.35 | | | | 1.05 | | |
| Small Company Growth Portfolio Class P | | | 1,000.00 | | | | 888.40 | | | | 1,018.65 | | | | 6.19 | | | | 6.61 | | | | 1.30 | | |
| Small Company Growth Portfolio Class H | | | 1,000.00 | | | | 965.40 | | | | 1,004.87 | | | | 1.68 | ++ | | | 1.71 | | | | 1.30 | | |
| Small Company Growth Portfolio Class L | | | 1,000.00 | | | | 964.60 | | | | 1,004.21 | | | | 2.33 | ++ | | | 2.37 | | | | 1.80 | | |
| U.S. Real Estate Portfolio Class I | | | 1,000.00 | | | | 964.40 | | | | 1,020.06 | | | | 5.05 | | | | 5.19 | | | | 1.02 | | |
| U.S. Real Estate Portfolio Class P | | | 1,000.00 | | | | 962.50 | | | | 1,018.80 | | | | 6.28 | | | | 6.46 | | | | 1.27 | | |
| U.S. Real Estate Portfolio Class H | | | 1,000.00 | | | | 1,012.40 | | | | 1,004.93 | | | | 1.65 | ++ | | | 1.65 | | | | 1.25 | | |
| U.S. Real Estate Portfolio Class L | | | 1,000.00 | | | | 1,011.70 | | | | 1,004.27 | | | | 2.31 | ++ | | | 2.31 | | | | 1.75 | | |
| Emerging Markets Debt Portfolio Class I | | | 1,000.00 | | | | 914.50 | | | | 1,021.02 | | | | 4.01 | | | | 4.23 | | | | 0.83 | | |
| Emerging Markets Debt Portfolio Class P | | | 1,000.00 | | | | 913.20 | | | | 1,019.76 | | | | 5.21 | | | | 5.50 | | | | 1.08 | | |
| Emerging Markets Debt Portfolio Class H | | | 1,000.00 | | | | 913.50 | | | | 1,019.76 | | | | 5.21 | | | | 5.50 | | | | 1.08 | | |
| Emerging Markets Debt Portfolio Class L | | | 1,000.00 | | | | 911.50 | | | | 1,017.24 | | | | 7.61 | | | | 8.03 | | | | 1.58 | | |
* Expenses are calculated using each Portfolio Class' annualized net expense ratio (as disclosed), multiplied by the average account value over the period, and multiplied by 184/365 (to reflect the most recent one-half year period).
** Annualized.
+ Expenses are calculated using each Portfolio Class' annualized net expense ratio (as disclosed), multiplied by the average account value over the period, and multiplied by 3/365 (to reflect the actual days in the period).
++Expenses are calculated using each Portfolio Class' annualized net expense ratio (as disclosed), multiplied by the average account value over the period, and multiplied by 48/365 (to reflect the actual days in the period).
10
2011 Annual Report
December 31, 2011
Investment Overview (unaudited)
Active International Allocation Portfolio
The Active International Allocation Portfolio (the "Portfolio") seeks long-term capital appreciation by investing primarily, in accordance with country and sector weightings determined by the Adviser, in equity securities of non-U.S. issuers which, in the aggregate, replicate broad market indices.
Performance
For the year ended December 31, 2011, the Portfolio had a total return based on net asset value and reinvestment of distributions per share of -14.56%, net of fees, for Class I shares. The Portfolio's Class I shares underperformed against its benchmark, the MSCI EAFE Index (the "Index"), which returned -12.14%.
Factors Affecting Performance
• For 2011, international equities, as represented by the MSCI EAFE Index (the Index), lost 12%. On a regional basis, U.S. equities (+1%) led the developed markets, followed by the equity markets of Europe (-11%), Asia Ex-Japan (-13%), and Japan (-14%). Emerging markets (-18%) lagged developed markets. Within the Index, health care (+6%), consumer staples (+4%), energy (+1%) were the best-performing sectors, while utilities (-19%), financials (-22%), and materials (-23%) lagged the most. (The country and regional returns shown are based on their respective MSCI indexes and are quoted in U.S. dollars.) Versus the U.S. dollar, the Japanese yen was up 5%, the Swiss franc was flat, the British pound declined 1%, and the euro fell 3%.
• The overweight to the materials and industrials sectors and underweights to Europe and the U.K. were the main detractors from relative performance. Conversely, the most significant contributors were the above-benchmark weight in energy and the underweight positions in Asia Ex-Japan, financials, and utilities.
Management Strategies
• 2011 was an agonizing year. After beginning the year with decent positive momentum, the global markets and economy battled the after-effects of Japan's tragic March earthquake and tsunami, a jarring increase in European bond yields and tightening of bank funding, the U.S. Treasury downgrade and political dysfunction over the debt ceiling, and a sharp fall in Chinese property transactions and in the purchasing managers index (PMI). Rolling Arab revolutions, Libya's civil war, and the growing anti-business-as-usual overtones of the global Occupy Wall Street movements further dampened confidence. Market volatility shot up sharply in August and remained elevated through year-end. Under a fragile world economy and an extremely heated and highly fractioned political backdrop, investors were whipsawed on the global equity market roller coaster, with violent movements to the upside and downside on the back of political indecision and rapid shifts in sentiment.
• We believe that the Great Financial Crisis of 2008-2009 marked the end of both the debt super cycle and the extra-long, central bank-managed economic cycles. Many feared both in the summer of 2010 and the summer of 2011 that the U.S. and Europe were on the verge of double-dip recessions. While positive credit and labor market data in the fourth quarter suggests that the U.S. has skirted a recession, "peripheral" European and Chinese growth indicators have lagged. Developments in both regions present significant hurdles to global growth. Europe has just begun a recession that is likely to intensify in coming quarters, as banks de-leverage and sovereigns implement significant fiscal tightening (estimated at 2% of GDP growth). In China, declining residential real estate demand and falling property prices as a result of restrictive property sector regulations may have a serious impact on growth. If the recent weakness in the property demand and prices of major cities spreads to the smaller, but more numerous, lower tier cities, China could have difficulty managing a soft landing. As optimists, we highlight the U.S. economic resilience, the continued growth potential of China, and the tendency of policymakers to do the right thing when all else has failed. However, there is a non-trivial chance of an economic and financial unwinding, apocalyptic scenario.
• We imagine that the apocalyptic scenario would entail the following events. In the months ahead, the Europeans still do not implement a plausible game plan to resolve their sovereign crisis, potentially resulting in Greece having a disorderly default, French debt being downgraded (Standard & Poor's did cut France's credit rating by one notch after the close of the reporting period), Italy and Spain being unable to rollover their maturing debt, and the euro as we know it
11
2011 Annual Report
December 31, 2011
Investment Overview (unaudited) (cont'd)
Active International Allocation Portfolio
disappearing. The resulting disruption and bank freeze would severely deepen the recession already underway in Europe and would drag the U.S. and Chinese economies into sharp double-dip recessions. In a quasi-depressed and highly charged political environment, global capital would retreat within national borders, trade and corporate spending would dry up, and equity markets would once again test the lows of early 2009. While we do not put high odds on such a disorderly scenario (below 25%), other highly regarded investors, whose opinions we take into consideration, think the chances of such a scenario are more like 50-50.
• As we begin 2012, U.S. equities are as cheap versus Treasuries as they have been since the 1930s. Global equity valuations appear to be relatively inexpensive for a stable economic environment, in our view, but not discounted enough to withstand disappointment in global growth or policy. As this letter went to print, the fourth quarter 2011 earnings season was underway. Investors are listening to corporate expectations for 2012 very carefully and subsequently readjusting market multiples.
• On balance, we are wary, but not immediately bearish. The "gloom-and-doom" scenario we outlined above is well known and equity allocations in portfolios ranging from giant pension and sovereign wealth funds to hedge funds are relatively low. Progress in Europe, an easing of the tax/entitlement stalemate in the U.S., signs of a renewal in emerging markets, and improving data points suggest a moderate economic recovery could cause a major shift from current risk adverse sentiment.
• The current cash position in the Portfolio is roughly 4%, which seems prudent to us as political and economic event risk in Europe remains heightened during the first quarter. While we do not neglect the potential for market rallies on the back of reasonable valuations and marginally better economic news, we do note that under the current environment of high levels of debt, skittish investors, limited policy options, as well as a very political year ahead, poor economic and financial market outcomes are quite possible.
* Minimum Investment
In accordance with SEC regulations, Portfolio's performance shown assumes that all recurring fees (including management fees) were deducted and all dividends and distributions were reinvested. The performance of Class P shares will vary from the Class I shares based upon its different inception date and will be negatively impacted by additional fees assessed to that class.
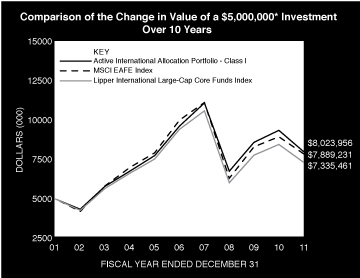
Performance Compared to the Morgan Stanley Capital International (MSCI) EAFE Index(1) and the Lipper International Large-Cap Core Funds Index(2)
| | | Period Ended December 31, 2011 | |
| | | Total Returns(3) | |
| | | | | Average Annual | |
| | | One
Year | | Five
Years | | Ten
Years | | Since
Inception(6) | |
Portfolio — Class I Shares
w/o sales charges(4) | | | –14.56 | % | | | –3.66 | % | | | 4.84 | % | | | 5.36 | % | |
| MSCI EAFE Index | | | –12.14 | | | | –4.72 | | | | 4.67 | | | | 4.82 | | |
Lipper International Large-Cap
Core Funds Index | | | –13.56 | | | | –4.96 | | | | 3.91 | | | | 5.92 | | |
Portfolio — Class P Shares
w/o sales charges(5) | | | –14.75 | | | | –3.90 | | | | 4.57 | | | | 4.35 | | |
| MSCI EAFE Index | | | –12.14 | | | | –4.72 | | | | 4.67 | | | | 3.55 | | |
Lipper International Large-Cap
Core Funds Index | | | –13.56 | | | | –4.96 | | | | 3.91 | | | | 4.65 | | |
Performance data quoted represents past performance, which is no guarantee of future results, and current performance may be lower or higher than the figures shown. Performance assumes that all dividends and distributions, if any, were reinvested. For the most recent month-end performance figures, please visit www.morganstanley.com/im. Investment return and principal value will fluctuate so that Portfolio shares, when redeemed, may be worth more or less than their original cost. Total returns do not reflect the deduction of taxes that a shareholder would pay on Portfolio distributions or the redemption of Portfolio shares. Performance of share classes will vary due to difference in expenses.
12
2011 Annual Report
December 31, 2011
Investment Overview (unaudited) (cont'd)
Active International Allocation Portfolio
(1) The Morgan Stanley Capital International (MSCI) EAFE Index (Europe, Australasia, Far East) is a free float-adjusted market capitalization index that is designed to measure the international equity market performance of developed markets, excluding the US & Canada. The term "free float" represents the portion of shares outstanding that are deemed to be available for purchase in the public equity markets by investors. The MSCI EAFE Index currently consists of 22 developed market country indices. The performance of the Index is listed in U.S. dollars and assumes reinvestment of net dividends. The Index is unmanaged and its returns do not include any sales charges or fees. Such costs would lower performance. It is not possible to invest directly in an index.
(2) The Lipper International Large-Cap Core Funds Index is an equally weighted performance index of the largest qualifying funds (based on net assets) in the Lipper International Large-Cap Core Funds classification. The Index, which is adjusted for capital gains distributions and income dividends, is unmanaged and should not be considered an investment. There are currently 30 funds represented in this Index. As of the date of this report, the Portfolio was in the Lipper International Large-Cap Core Funds classification.
(3) Total returns for the Portfolio reflect fees waived and expenses reimbursed, if applicable, by the Adviser. Without such waivers and reimbursements, total returns would have been lower. The fee waivers and/or expense reimbursements will continue for one year or until such time as the Fund's Board of Directors acts to discontinue all or a portion of such waivers and/or expense reimbursements when it deems that such action is appropriate.
(4) Commenced operations on January 17, 1992.
(5) Commenced offering on January 2, 1996.
(6) For comparative purposes, average annual since inception returns listed for the Indexes refer to the inception date or initial offering of the respective share class of the Portfolio, not the inception of the Index.
Portfolio Composition*
| Classification | | Percentage of
Total Investments | |
| Other** | | | 61.5 | % | |
| Investment Company | | | 9.7 | | |
| Pharmaceuticals | | | 8.5 | | |
| Metals & Mining | | | 7.3 | | |
| Oil, Gas & Consumable Fuels | | | 7.1 | | |
| Commercial Banks | | | 5.9 | | |
| Total Investments | | | 100.0 | %*** | |
* Percentages indicated are based upon total investments (excluding Securities held as Collateral on Loaned Securities) as of December 31, 2011.
** Industries representing less than 5% of total investments.
*** Does not include open long/short futures contracts with an underlying face amount of approximately $26,968,000 and net unrealized depreciation of approximately $144,000. Also does not include open foreign currency exchange contracts with net unrealized depreciation of approximately $265,000.
13
2011 Annual Report
December 31, 2011
Portfolio of Investments
Active International Allocation Portfolio
| | | Shares | | Value
(000) | |
| Common Stocks (88.6%) | |
| Australia (3.9%) | |
| AGL Energy Ltd. | | | 4,864 | | | $ | 71 | | |
| Alumina Ltd. | | | 61,436 | | | | 70 | | |
| Amcor Ltd. | | | 32,344 | | | | 239 | | |
| AMP Ltd. | | | 20,428 | | | | 85 | | |
| ASX Ltd. | | | 896 | | | | 28 | | |
| Australia & New Zealand Banking Group Ltd. | | | 24,702 | | | | 519 | | |
| BHP Billiton Ltd. (a) | | | 128,952 | | | | 4,540 | | |
| Boral Ltd. (a) | | | 23,491 | | | | 86 | | |
| Brambles Ltd. | | | 12,583 | | | | 92 | | |
| Caltex Australia Ltd. | | | 3,825 | | | | 46 | | |
| Coca-Cola Amatil Ltd. | | | 5,977 | | | | 70 | | |
| Cochlear Ltd. (a) | | | 319 | | | | 20 | | |
| Commonwealth Bank of Australia (a) | | | 3,975 | | | | 200 | | |
| Computershare Ltd. | | | 2,767 | | | | 23 | | |
| CSL Ltd. | | | 4,636 | | | | 152 | | |
| CSR Ltd. (a) | | | 5,902 | | | | 12 | | |
| DuluxGroup Ltd. (a) | | | 14,641 | | | | 43 | | |
| Echo Entertainment Group Ltd. (b) | | | 4,938 | | | | 18 | | |
| Fortescue Metals Group Ltd. | | | 52,090 | | | | 227 | | |
| GPT Group REIT (Stapled Securities) (c) | | | 4,988 | | | | 16 | | |
| Incitec Pivot Ltd. | | | 65,003 | | | | 207 | | |
| Insurance Australia Group Ltd. | | | 16,506 | | | | 50 | | |
| James Hardie Industries SE CDI | | | 16,816 | | | | 117 | | |
| Leighton Holdings Ltd. (a) | | | 1,886 | | | | 37 | | |
| Macquarie Group Ltd. (a) | | | 2,367 | | | | 58 | | |
| Mirvac Group REIT (Stapled Securities) (a)(c)(d) | | | 8,147 | | | | 10 | | |
| National Australia Bank Ltd. (a) | | | 5,099 | | | | 122 | | |
| Newcrest Mining Ltd. | | | 61,509 | | | | 1,862 | | |
| OneSteel Ltd. | | | 32,592 | | | | 23 | | |
| Orica Ltd. | | | 14,276 | | | | 354 | | |
| Origin Energy Ltd. | �� | | 10,576 | | | | 144 | | |
| OZ Minerals Ltd. | | | 11,364 | | | | 116 | | |
| Perpetual Ltd. (a) | | | 315 | | | | 7 | | |
| Qantas Airways Ltd. (b) | | | 5,339 | | | | 8 | | |
| QBE Insurance Group Ltd. | | | 7,459 | | | | 99 | | |
| Rio Tinto Ltd. (a) | | | 10,857 | | | | 670 | | |
| Santos Ltd. | | | 6,289 | | | | 79 | | |
| Sims Metal Management Ltd. (a) | | | 6,190 | | | | 80 | | |
| Sonic Healthcare Ltd. | | | 2,599 | | | | 30 | | |
| Stockland REIT (Stapled Securities) (c)(d) | | | 8,391 | | | | 27 | | |
| Suncorp Group Ltd. (a) | | | 8,001 | | | | 69 | | |
| TABCORP Holdings Ltd. | | | 4,933 | | | | 14 | | |
| Telstra Corp, Ltd. | | | 34,266 | | | | 117 | | |
| Toll Holdings Ltd. (a) | | | 5,604 | | | | 24 | | |
| Transurban Group (Stapled Securities) (c) | | | 10,994 | | | | 63 | | |
| Treasury Wine Estates Ltd. | | | 6,561 | | | | 25 | | |
| Wesfarmers Ltd. | | | 8,383 | | | | 253 | | |
| Westfield Group REIT (Stapled Securities) (c)(d) | | | 10,520 | | | | 84 | | |
| Westfield Retail Trust REIT | | | 10,501 | | | | 27 | | |
| Westpac Banking Corp. (a) | | | 7,742 | | | | 158 | | |
| | | Shares | | Value
(000) | |
| Woodside Petroleum Ltd. | | | 6,199 | | | $ | 194 | | |
| Woolworths Ltd. | | | 11,881 | | | | 305 | | |
| WorleyParsons Ltd. | | | 926 | | | | 24 | | |
| | | | 12,014 | | |
| Austria (0.5%) | |
| Erste Group Bank AG | | | 11,823 | | | | 208 | | |
| OMV AG | | | 6,528 | | | | 198 | | |
| Raiffeisen Bank International AG (a) | | | 3,341 | | | | 87 | | |
| Telekom Austria AG | | | 32,532 | | | | 390 | | |
| Verbund AG (a) | | | 4,525 | | | | 122 | | |
Vienna Insurance Group AG Wiener
Versicherung Gruppe | | | 2,934 | | | | 116 | | |
| Voestalpine AG | | | 9,872 | | | | 278 | | |
| | | | 1,399 | | |
| Belgium (0.9%) | |
| Ageas | | | 12,628 | | | | 20 | | |
| Anheuser-Busch InBev N.V. | | | 26,825 | | | | 1,642 | | |
| Anheuser-Busch InBev N.V. VVPR (b) | | | 17,784 | | | | — | @ | |
| Belgacom SA | | | 6,959 | | | | 218 | | |
| Delhaize Group SA | | | 164 | | | | 9 | | |
| Groupe Bruxelles Lambert SA | | | 3,704 | | | | 247 | | |
| Mobistar SA | | | 96 | | | | 5 | | |
| Solvay SA, Class A | | | 2,263 | | | | 186 | | |
| UCB SA | | | 4,789 | | | | 202 | | |
| Umicore SA | | | 4,728 | | | | 195 | | |
| | | | 2,724 | | |
| Brazil (0.1%) | |
| All America Latina Logistica SA (Units) (d) | | | 10,200 | | | | 51 | | |
| Banco do Brasil SA | | | 8,100 | | | | 103 | | |
| BRF - Brasil Foods SA | | | 14,848 | | | | 290 | | |
| Cia Energetica de Minas Gerais (Preference) | | | 1 | | | | — | @ | |
| | | | 444 | | |
| Canada (1.3%) | |
| Agnico-Eagle Mines Ltd. (a) | | | 4,900 | | | | 178 | | |
| Barrick Gold Corp. | | | 28,100 | | | | 1,273 | | |
| Centerra Gold, Inc. | | | 5,000 | | | | 88 | | |
| Eldorado Gold Corp. | | | 15,700 | | | | 216 | | |
| Franco-Nevada Corp. | | | 3,800 | | | | 145 | | |
| Goldcorp, Inc. | | | 22,400 | | | | 994 | | |
| IAMGOLD Corp. | | | 10,600 | | | | 169 | | |
| Kinross Gold Corp. | | | 32,000 | | | | 365 | | |
| New Gold, Inc. (b) | | | 12,700 | | | | 128 | | |
| Osisko Mining Corp. (b) | | | 9,900 | | | | 96 | | |
| Yamana Gold, Inc. (a) | | | 21,700 | | | | 320 | | |
| | | | 3,972 | | |
| China (0.0%) | |
| China Merchants Holdings International Co., Ltd. (e) | | | 29 | | | | — | @ | |
| Skyworth Digital Holdings Ltd. (a)(e) | | | 114 | | | | — | @ | |
| | | | — | @ | |
The accompanying notes are an integral part of the financial statements.
14
2011 Annual Report
December 31, 2011
Portfolio of Investments (cont'd)
Active International Allocation Portfolio
| | | Shares | | Value
(000) | |
| Denmark (1.2%) | |
| AP Moller - Maersk A/S Series B | | | 80 | | | $ | 528 | | |
| DSV A/S | | | 13,027 | | | | 234 | | |
| Novo Nordisk A/S Series B | | | 21,308 | | | | 2,449 | | |
| Novozymes A/S Series B | | | 13,415 | | | | 414 | | |
| TDC A/S | | | 1,320 | | | | 11 | | |
| Vestas Wind Systems A/S (b) | | | 9,396 | | | | 101 | | |
| | | | 3,737 | | |
| Finland (0.8%) | |
| Elisa Oyj (a) | | | 268 | | | | 6 | | |
| Fortum Oyj | | | 18,201 | | | | 388 | | |
| Kesko Oyj, Class B | | | 10,179 | | | | 342 | | |
| Kone Oyj, Class B | | | 5,707 | | | | 296 | | |
| Metso Oyj | | | 6,139 | | | | 228 | | |
| Neste Oil Oyj | | | 3,925 | | | | 40 | | |
| Nokia Oyj | | | 72,648 | | | | 355 | | |
| Sampo Oyj, Class A | | | 10,536 | | | | 261 | | |
| Stora Enso Oyj, Class R | | | 27,433 | | | | 164 | | |
| UPM-Kymmene Oyj | | | 23,485 | | | | 259 | | |
| Wartsila Oyj | | | 5,505 | | | | 159 | | |
| | | | 2,498 | | |
| France (4.3%) | |
| Accor SA | | | 3,759 | | | | 95 | | |
| Air Liquide SA | | | 4,261 | | | | 527 | | |
| Alcatel-Lucent (a)(b) | | | 10,323 | | | | 16 | | |
| Alstom SA | | | 11,339 | | | | 344 | | |
| ArcelorMittal | | | 13,431 | | | | 246 | | |
| AtoS | | | 497 | | | | 22 | | |
| AXA SA | | | 19,570 | | | | 254 | | �� |
| BNP Paribas SA | | | 9,067 | | | | 356 | | |
| Bouygues SA (a) | | | 10,509 | | | | 331 | | |
| Cap Gemini SA | | | 3,035 | | | | 95 | | |
| Carrefour SA | | | 19,578 | | | | 446 | | |
| Casino Guichard Perrachon SA | | | 2,469 | | | | 208 | | |
| Cie de St-Gobain | | | 4,086 | | | | 157 | | |
| Cie Generale d'Optique Essilor International SA | | | 5,321 | | | | 376 | | |
| Cie Generale de Geophysique-Veritas (b) | | | 10,908 | | | | 256 | | |
| Cie Generale des Etablissements Michelin Series B | | | 995 | | | | 59 | | |
| CNP Assurances | | | 3,726 | | | | 46 | | |
| Credit Agricole SA | | | 5,762 | | | | 33 | | |
| Danone | | | 13,703 | | | | 861 | | |
| Dassault Systemes SA | | | 1,201 | | | | 96 | | |
| Edenred | | | 3,759 | | | | 93 | | |
| EDF SA | | | 109 | | | | 3 | | |
| Eurazeo | | | 539 | | | | 19 | | |
| European Aeronautic Defence and Space Co. N.V. | | | 2,580 | | | | 81 | | |
| Fonciere Des Regions REIT | | | 487 | | | | 31 | | |
| France Telecom SA | | | 29,891 | | | | 469 | | |
| GDF Suez | | | 6,735 | | | | 184 | | |
| Gecina SA REIT | | | 392 | | | | 33 | | |
| Hermes International (a) | | | 307 | | | | 92 | | |
| ICADE REIT (a) | | | 411 | | | | 32 | | |
| | | Shares | | Value
(000) | |
| Imerys SA | | | 465 | | | $ | 21 | | |
| Klepierre REIT | | | 1,814 | | | | 52 | | |
| L'Oreal SA | | | 1,106 | | | | 116 | | |
| Lafarge SA (a) | | | 7,873 | | | | 277 | | |
| Lagardere SCA | | | 3,184 | | | | 84 | | |
| Legrand SA | | | 424 | | | | 14 | | |
| LVMH Moet Hennessy Louis Vuitton SA | | | 1,187 | | | | 168 | | |
| Neopost SA (a) | | | 251 | | | | 17 | | |
| Pernod-Ricard SA | | | 671 | | | | 62 | | |
| Peugeot SA | | | 1,160 | | | | 18 | | |
| PPR | | | 907 | | | | 130 | | |
| Publicis Groupe SA | | | 1,545 | | | | 71 | | |
| Renault SA | | | 1,136 | | | | 39 | | |
| Safran SA | | | 1,108 | | | | 33 | | |
| Sanofi | | | 21,970 | | | | 1,614 | | |
| Schneider Electric SA | | | 8,728 | | | | 460 | | |
| SCOR SE | | | 2,725 | | | | 64 | | |
| Societe BIC SA | | | 586 | | | | 52 | | |
| Societe Generale SA | | | 5,183 | | | | 115 | | |
| Societe Television Francaise 1 | | | 3,828 | | | | 37 | | |
| Sodexo | | | 1,806 | | | | 130 | | |
| STMicroelectronics N.V. | | | 13,202 | | | | 78 | | |
| Suez Environnement Co. | | | 817 | | | | 9 | | |
| Technip SA | | | 4,733 | | | | 445 | | |
| Thales SA (a) | | | 1,159 | | | | 37 | | |
| Total SA | | | 45,255 | | | | 2,314 | | |
| Unibail-Rodamco SE REIT | | | 1,726 | | | | 310 | | |
| Vallourec SA | | | 1,220 | | | | 79 | | |
| Veolia Environnement SA | | | 6,388 | | | | 70 | | |
| Vinci SA | | | 7,207 | | | | 315 | | |
| Vivendi SA | | | 16,686 | | | | 365 | | |
| | | | 13,457 | | |
| Germany (6.5%) | |
| Adidas AG | | | 1,929 | | | | 125 | | |
| Allianz SE (Registered) | | | 9,957 | | | | 952 | | |
| Axel Springer AG (a) | | | 200 | | | | 9 | | |
| BASF SE | | | 25,309 | | | | 1,765 | | |
| Bayer AG (Registered) | | | 26,024 | | | | 1,664 | | |
| Bayerische Motoren Werke AG | | | 276 | | | | 19 | | |
| Beiersdorf AG | | | 2,162 | | | | 123 | | |
| Celesio AG | | | 3,968 | | | | 63 | | |
| Commerzbank AG (a)(b) | | | 10,234 | | | | 17 | | |
| Continental AG (b) | | | 731 | | | | 46 | | |
| Daimler AG (Registered) | | | 18,430 | | | | 809 | | |
| Deutsche Bank AG (Registered) | | | 16,744 | | | | 638 | | |
| Deutsche Boerse AG (b) | | | 1,776 | | | | 93 | | |
| Deutsche Lufthansa AG (Registered) | | | 9,297 | | | | 111 | | |
| Deutsche Post AG (Registered) | | | 31,565 | | | | 485 | | |
| Deutsche Telekom AG (Registered) | | | 110,382 | | | | 1,266 | | |
| E.ON AG | | | 74,947 | | | | 1,617 | | |
| Fresenius Medical Care AG & Co. KGaA | | | 9,132 | | | | 621 | | |
| GEA Group AG | | | 4,471 | | | | 126 | | |
The accompanying notes are an integral part of the financial statements.
15
2011 Annual Report
December 31, 2011
Portfolio of Investments (cont'd)
Active International Allocation Portfolio
| | | Shares | | Value
(000) | |
| Germany (cont'd) | |
| Hannover Rueckversicherung AG | | | 194 | | | $ | 10 | | |
| Henkel AG & Co. KGaA (Preference) | | | 3,203 | | | | 185 | | |
| Hochtief AG | | | 2,409 | | | | 139 | | |
| K&S AG (Registered) | | | 2,249 | | | | 102 | | |
| Lanxess AG | | | 1,805 | | | | 93 | | |
| Linde AG | | | 3,164 | | | | 471 | | |
| MAN SE | | | 236 | | | | 21 | | |
| Merck KGaA | | | 1,765 | | | | 176 | | |
| Metro AG | | | 12,088 | | | | 441 | | |
| Muenchener Rueckversicherungs AG (Registered) | | | 4,325 | | | | 531 | | |
| Porsche Automobil Holding SE (Preference) | | | 2,748 | | | | 147 | | |
| ProSiebenSat.1 Media AG | | | 355 | | | | 6 | | |
| Puma SE (a) | | | 90 | | | | 26 | | |
| RWE AG | | | 11,421 | | | | 401 | | |
| RWE AG (Preference) | | | 877 | | | | 29 | | |
| SAP AG | | | 40,422 | | | | 2,137 | | |
| Siemens AG (Registered) | | | 40,781 | | | | 3,903 | | |
| ThyssenKrupp AG | | | 7,875 | | | | 181 | | |
| Volkswagen AG | | | 2,553 | | | | 342 | | |
| Volkswagen AG (Preference) | | | 2,295 | | | | 344 | | |
| | | | 20,234 | | |
| Hong Kong (0.0%) | |
| Henderson Land Development Co., Ltd. (a) | | | 164 | | | | 1 | | |
| Hong Kong Exchanges and Clearing Ltd. (a) | | | 187 | | | | 3 | | |
| | | | 4 | | |
| Indonesia (0.3%) | |
| Adaro Energy Tbk PT | | | 98,000 | | | | 19 | | |
| Astra International Tbk PT | | | 18,500 | | | | 151 | | |
| Bank Central Asia Tbk PT | | | 112,500 | | | | 99 | | |
| Bank Danamon Indonesia Tbk PT | | | 28,500 | | | | 13 | | |
| Bank Mandiri Tbk PT | | | 86,000 | | | | 64 | | |
| Bank Negara Indonesia Persero Tbk PT | | | 73,500 | | | | 31 | | |
| Bank Rakyat Indonesia Persero Tbk PT | | | 103,500 | | | | 77 | | |
| Bumi Resources Tbk PT | | | 170,000 | | | | 41 | | |
| Charoen Pokphand Indonesia Tbk PT | | | 79,000 | | | | 19 | | |
| Golden Agri-Resources Ltd. | | | 184,315 | | | | 102 | | |
| Gudang Garam Tbk PT | | | 5,500 | | | | 38 | | |
| Indo Tambangraya Megah PT | | | 4,100 | | | | 18 | | |
| Indocement Tunggal Prakarsa Tbk PT | | | 13,500 | | | | 25 | | |
| Indofood Sukses Makmur Tbk PT | | | 42,500 | | | | 22 | | |
| Kalbe Farma Tbk PT | | | 48,500 | | | | 18 | | |
| Perusahaan Gas Negara PT | | | 100,500 | | | | 35 | | |
| Semen Gresik Persero Tbk PT | | | 33,500 | | | | 42 | | |
| Tambang Batubara Bukit Asam Tbk PT | | | 8,000 | | | | 15 | | |
| Telekomunikasi Indonesia Tbk PT | | | 90,500 | | | | 70 | | |
| Unilever Indonesia Tbk PT | | | 13,000 | | | | 27 | | |
| United Tractors Tbk PT | | | 15,984 | | | | 46 | | |
| | | | 972 | | |
| Ireland (0.0%) | |
| CRH PLC | | | 1,158 | | | | 23 | | |
| Italy (0.2%) | |
| Enel SpA | | | 15,011 | | | | 61 | | |
| | | Shares | | Value
(000) | |
| Eni SpA | | | 6,448 | | | $ | 134 | | |
| Exor SpA | | | 3,550 | | | | 71 | | |
| Saipem SpA | | | 9,857 | | | | 419 | | |
| | | | 685 | | |
| Japan (23.9%) | |
| Advantest Corp. | | | 8,290 | | | | 79 | | |
| Aeon Credit Service Co., Ltd. (a) | | | 2,300 | | | | 36 | | |
| Aeon Mall Co., Ltd. | | | 14,900 | | | | 316 | | |
| Aisin Seiki Co., Ltd. | | | 10,300 | | | | 294 | | |
| Amada Co., Ltd. | | | 9,000 | | | | 57 | | |
| Asahi Glass Co., Ltd. (a) | | | 37,800 | | | | 317 | | |
| Asahi Group Holdings Ltd. (a) | | | 17,200 | | | | 378 | | |
| Asahi Kasei Corp. | | | 50,000 | | | | 301 | | |
| Astellas Pharma, Inc. | | | 19,100 | | | | 777 | | |
| Bank of Kyoto Ltd. (The) (a) | | | 7,000 | | | | 60 | | |
| Bank of Yokohama Ltd. (The) | | | 46,000 | | | | 218 | | |
| Benesse Holdings, Inc. | | | 2,400 | | | | 116 | | |
| Bridgestone Corp. (a) | | | 56,700 | | | | 1,285 | | |
| Canon, Inc. (a) | | | 35,100 | | | | 1,555 | | |
| Casio Computer Co., Ltd. (a) | | | 14,600 | | | | 89 | | |
| Central Japan Railway Co. | | | 55 | | | | 464 | | |
| Chiba Bank Ltd. (The) (a) | | | 18,000 | | | | 116 | | |
| Chubu Electric Power Co., Inc. | | | 10,300 | | | | 192 | | |
| Chugai Pharmaceutical Co., Ltd. (a) | | | 9,500 | | | | 157 | | |
| Citizen Holdings Co., Ltd. | | | 16,800 | | | | 98 | | |
| Credit Saison Co., Ltd. | | | 3,100 | | | | 62 | | |
| Dai Nippon Printing Co., Ltd. (a) | | | 16,600 | | | | 160 | | |
| Daicel Corp | | | 8,000 | | | | 49 | | |
| Daiichi Sankyo Co., Ltd. | | | 51,100 | | | | 1,013 | | |
| Daikin Industries Ltd. | | | 13,300 | | | | 364 | | |
| Daito Trust Construction Co., Ltd. | | | 4,200 | | | | 360 | | |
| Daiwa House Industry Co., Ltd. | | | 26,600 | | | | 317 | | |
| Daiwa Securities Group, Inc. | | | 61,000 | | | | 190 | | |
| Denki Kagaku Kogyo KK | | | 21,000 | | | | 78 | | |
| Denso Corp. | | | 47,850 | | | | 1,322 | | |
| East Japan Railway Co. | | | 13,700 | | | | 872 | | |
| Eisai Co., Ltd. (a) | | | 9,100 | | | | 377 | | |
| FamilyMart Co., Ltd. | | | 7,096 | | | | 287 | | |
| Fanuc Corp. | | | 10,100 | | | | 1,546 | | |
| Fast Retailing Co., Ltd. | | | 6,400 | | | | 1,164 | | |
| Fuji Electric Co., Ltd. (a) | | | 8,000 | | | | 22 | | |
| FUJIFILM Holdings Corp. | | | 38,100 | | | | 902 | | |
| Fujitsu Ltd. | | | 147,200 | | | | 765 | | |
| Fukuoka Financial Group, Inc. | | | 26,000 | | | | 109 | | |
| Furukawa Electric Co., Ltd. | | | 18,800 | | | | 43 | | |
| GS Yuasa Corp. (a) | | | 28,000 | | | | 151 | | |
| Hirose Electric Co., Ltd. (a) | | | 1,200 | | | | 105 | | |
| Hisamitsu Pharmaceutical Co., Inc. (a) | | | 2,600 | | | | 110 | | |
| Hitachi Construction Machinery Co., Ltd. (a) | | | 13,600 | | | | 229 | | |
| Hitachi Ltd. | | | 142,000 | | | | 745 | | |
| Hokkaido Electric Power Co., Inc. | | | 2,200 | | | | 31 | | |
| Hokuhoku Financial Group, Inc. | | | 48,000 | | | | 94 | | |
The accompanying notes are an integral part of the financial statements.
16
2011 Annual Report
December 31, 2011
Portfolio of Investments (cont'd)
Active International Allocation Portfolio
| | | Shares | | Value
(000) | |
| Japan (cont'd) | |
| Honda Motor Co., Ltd. (a) | | | 76,104 | | | $ | 2,322 | | |
| Hoya Corp. | | | 17,500 | | | | 377 | | |
| Ibiden Co., Ltd. | | | 11,500 | | | | 227 | | |
| IHI Corp. (a) | | | 36,000 | | | | 87 | | |
| Inpex Corp. | | | 95 | | | | 599 | | |
| ITOCHU Corp. | | | 67,500 | | | | 686 | | |
| Itochu Techno-Solutions Corp. (a) | | | 1,800 | | | | 81 | | |
| Japan Real Estate Investment Corp. REIT | | | 26 | | | | 203 | | |
| Japan Retail Fund Investment Corp. REIT | | | 81 | | | | 120 | | |
| Japan Tobacco, Inc. | | | 171 | | | | 804 | | |
| JFE Holdings, Inc. | | | 24,300 | | | | 440 | | |
| JGC Corp. | | | 28,000 | | | | 672 | | |
| Joyo Bank Ltd. (The) (a) | | | 35,000 | | | | 155 | | |
| JS Group Corp. | | | 7,500 | | | | 144 | | |
| JSR Corp. | | | 6,200 | | | | 114 | | |
| JX Holdings, Inc. | | | 90,546 | | | | 547 | | |
| Kajima Corp. (a) | | | 39,400 | | | | 121 | | |
| Kaneka Corp. (a) | | | 10,000 | | | | 53 | | |
| Kansai Electric Power Co., Inc. (The) | | | 14,700 | | | | 226 | | |
| Kawasaki Heavy Industries Ltd. (a) | | | 34,000 | | | | 85 | | |
| Kawasaki Kisen Kaisha Ltd. (a) | | | 143,000 | | | | 258 | | |
| Keikyu Corp. (a) | | | 15,000 | | | | 135 | | |
| Keio Corp. (a) | | | 9,000 | | | | 63 | | |
| Keyence Corp. | | | 3,430 | | | | 827 | | |
| Kintetsu Corp. (a) | | | 64,200 | | | | 251 | | |
| Kirin Holdings Co., Ltd. (a) | | | 34,000 | | | | 413 | | |
| Kobe Steel Ltd. | | | 80,000 | | | | 124 | | |
| Komatsu Ltd. | | | 55,500 | | | | 1,297 | | |
| Konami Corp. (a) | | | 4,800 | | | | 144 | | |
| Konica Minolta Holdings, Inc. | | | 19,500 | | | | 145 | | |
| Kubota Corp. (a) | | | 77,000 | | | | 645 | | |
| Kuraray Co., Ltd. | | | 14,000 | | | | 199 | | |
| Kurita Water Industries Ltd. (a) | | | 2,200 | | | | 57 | | |
| Kyocera Corp. | | | 12,700 | | | | 1,021 | | |
| Kyushu Electric Power Co., Inc. | | | 6,400 | | | | 92 | | |
| Mabuchi Motor Co., Ltd. (a) | | | 5,100 | | | | 212 | | |
| Makita Corp. | | | 4,000 | | | | 129 | | |
| Marubeni Corp. | | | 63,000 | | | | 384 | | |
| Mitsubishi Chemical Holdings Corp. (a) | | | 54,000 | | | | 297 | | |
| Mitsubishi Corp. | | | 66,900 | | | | 1,352 | | |
| Mitsubishi Electric Corp. | | | 115,800 | | | | 1,110 | | |
| Mitsubishi Estate Co., Ltd. | | | 60,000 | | | | 896 | | |
| Mitsubishi Heavy Industries Ltd. | | | 109,000 | | | | 464 | | |
| Mitsubishi Logistics Corp. | | | 4,000 | | | | 44 | | |
| Mitsubishi Materials Corp. | | | 77,000 | | | | 209 | | |
| Mitsubishi Tanabe Pharma Corp. | | | 9,900 | | | | 157 | | |
| Mitsubishi UFJ Financial Group, Inc. (See Note G-2) | | | 239,546 | | | | 1,018 | | |
| Mitsui & Co., Ltd. | | | 54,500 | | | | 848 | | |
| Mitsui Chemicals, Inc. (a) | | | 21,000 | | | | 64 | | |
| Mitsui Fudosan Co., Ltd. | | | 42,400 | | | | 618 | | |
| Mitsui OSK Lines Ltd. | | | 55,000 | | | | 213 | | |
| Mizuho Financial Group, Inc. | | | 579,900 | | | | 784 | | |
| MS&AD Insurance Group Holdings | | | 12,160 | | | | 225 | | |
| Murata Manufacturing Co., Ltd. (a) | | | 8,500 | | | | 437 | | |
| | | Shares | | Value
(000) | |
| Nabtesco Corp. (a) | | | 7,500 | | | $ | 137 | | |
| NEC Corp. (b) | | | 100,400 | | | | 203 | | |
| NGK Insulators Ltd. | | | 22,600 | | | | 268 | | |
| NGK Spark Plug Co., Ltd. | | | 8,000 | | | | 99 | | |
| Nidec Corp. | | | 3,400 | | | | 296 | | |
| Nikon Corp. | | | 11,600 | | | | 258 | | |
| Nintendo Co., Ltd. | | | 5,200 | | | | 716 | | |
| Nippon Building Fund, Inc. REIT | | | 29 | | | | 237 | | |
| Nippon Electric Glass Co., Ltd. | | | 31,500 | | | | 312 | | |
| Nippon Express Co., Ltd. | | | 33,800 | | | | 132 | | |
| Nippon Paper Group, Inc. (a) | | | 3,700 | | | | 81 | | |
| Nippon Sheet Glass Co., Ltd. | | | 16,000 | | | | 30 | | |
| Nippon Steel Corp. (a) | | | 355,000 | | | | 886 | | |
| Nippon Telegraph & Telephone Corp. | | | 10,600 | | | | 542 | | |
| Nippon Yusen KK (a) | | | 43,000 | | | | 110 | | |
| Nishi-Nippon City Bank Ltd. (The) | | | 18,000 | | | | 52 | | |
| Nissan Motor Co., Ltd. (a) | | | 103,600 | | | | 931 | | |
| Nitto Denko Corp. (a) | | | 8,300 | | | | 297 | | |
| NKSJ Holdings, Inc. | | | 7,700 | | | | 151 | | |
| Nomura Holdings, Inc. | | | 86,400 | | | | 262 | | |
| Nomura Research Institute Ltd. | | | 5,900 | | | | 133 | | |
| NSK Ltd. | | | 22,000 | | | | 143 | | |
| NTN Corp. | | | 16,000 | | | | 64 | | |
| NTT Data Corp. | | | 64 | | | | 204 | | |
| NTT DoCoMo, Inc. | | | 144 | | | | 265 | | |
| Obayashi Corp. | | | 26,000 | | | | 116 | | |
| OJI Paper Co., Ltd. (a) | | | 102,400 | | | | 525 | | |
| Omron Corp. (a) | | | 19,000 | | | | 382 | | |
| Ono Pharmaceutical Co., Ltd. | | | 3,300 | | | | 185 | | |
| Oracle Corp. Japan | | | 1,900 | | | | 63 | | |
| Oriental Land Co., Ltd. (a) | | | 2,500 | | | | 264 | | |
| ORIX Corp. (a) | | | 470 | | | | 39 | | |
| Osaka Gas Co., Ltd. | | | 38,600 | | | | 152 | | |
| Otsuka Holdings Co. Ltd. | | | 10,000 | | | | 281 | | |
| Panasonic Corp. (a) | | | 118,800 | | | | 1,009 | | |
| Resona Holdings, Inc. | | | 12,400 | | | | 55 | | |
| Rohm Co., Ltd. | | | 6,000 | | | | 280 | | |
| Santen Pharmaceutical Co. Ltd. | | | 3,200 | | | | 132 | | |
| SBI Holdings, Inc. | | | 383 | | | | 28 | | |
| Secom Co., Ltd. | | | 6,400 | | | | 295 | | |
| Seiko Epson Corp. (a) | | | 19,400 | | | | 258 | | |
| Sekisui Chemical Co., Ltd. | | | 18,000 | | | | 148 | | |
| Sekisui House Ltd. | | | 38,600 | | | | 343 | | |
| Seven & I Holdings Co., Ltd. | | | 21,500 | | | | 599 | | |
| Sharp Corp. (a) | | | 31,200 | | | | 273 | | |
| Shimamura Co., Ltd. | | | 900 | | | | 92 | | |
| Shimano, Inc. (a) | | | 7,800 | | | | 379 | | |
| Shimizu Corp. (a) | | | 27,600 | | | | 116 | | |
| Shin-Etsu Chemical Co., Ltd. | | | 25,496 | | | | 1,255 | | |
| Shinsei Bank Ltd. | | | 43,000 | | | | 45 | | |
| Shionogi & Co., Ltd. | | | 12,300 | | | | 158 | | |
| Shiseido Co., Ltd. (a) | | | 15,600 | | | | 287 | | |
| Shizuoka Bank Ltd. (The) (a) | | | 16,000 | | | | 169 | | |
| Showa Denko KK (a) | | | 31,000 | | | | 63 | | |
The accompanying notes are an integral part of the financial statements.
17
2011 Annual Report
December 31, 2011
Portfolio of Investments (cont'd)
Active International Allocation Portfolio
| | | Shares | | Value
(000) | |
| Japan (cont'd) | |
| Showa Shell Sekiyu KK (a) | | | 7,500 | | | $ | 51 | | |
| SMC Corp. | | | 3,800 | | | | 613 | | |
| Softbank Corp. | | | 51,800 | | | | 1,526 | | |
| Sony Corp. | | | 40,497 | | | | 727 | | |
| Stanley Electric Co., Ltd. | | | 17,900 | | | | 263 | | |
| Sumitomo Chemical Co., Ltd. (a) | | | 55,600 | | | | 203 | | |
| Sumitomo Corp. | | | 32,700 | | | | 443 | | |
| Sumitomo Electric Industries Ltd. | | | 20,500 | | | | 223 | | |
| Sumitomo Heavy Industries Ltd. | | | 16,000 | | | | 93 | | |
| Sumitomo Metal Industries Ltd. | | | 284,000 | | | | 517 | | |
| Sumitomo Metal Mining Co., Ltd. | | | 62,800 | | | | 807 | | |
| Sumitomo Mitsui Financial Group, Inc. | | | 27,100 | | | | 755 | | |
| Sumitomo Mitsui Trust Holdings, Inc. | | | 148,544 | | | | 436 | | |
| Sumitomo Realty & Development Co., Ltd. | | | 18,000 | | | | 315 | | |
| Suzuki Motor Corp. | | | 17,500 | | | | 362 | | |
| Sysmex Corp. | | | 7,400 | | | | 241 | | |
| T&D Holdings, Inc. | | | 14,100 | | | | 131 | | |
| Taisei Corp. | | | 39,000 | | | | 99 | | |
| Takeda Pharmaceutical Co., Ltd. | | | 40,300 | | | | 1,770 | | |
| TDK Corp. | | | 5,200 | | | | 230 | | |
| Teijin Ltd. | | | 36,400 | | | | 112 | | |
| Terumo Corp. | | | 13,200 | | | | 622 | | |
| THK Co., Ltd. (a) | | | 1,600 | | | | 32 | | |
| Tobu Railway Co., Ltd. (a) | | | 33,400 | | | | 171 | | |
| Tohoku Electric Power Co., Inc. (a) | | | 8,700 | | | | 84 | | |
| Tokio Marine Holdings, Inc. | | | 32,252 | | | | 714 | | |
| Tokyo Electron Ltd. | | | 13,400 | | | | 682 | | |
| Tokyo Gas Co., Ltd. | | | 44,600 | | | | 205 | | |
| Tokyu Corp. (a) | | | 40,400 | | | | 199 | | |
| Tokyu Land Corp. | | | 31,000 | | | | 117 | | |
| TonenGeneral Sekiyu KK (a) | | | 14,000 | | | | 153 | | |
| Toppan Printing Co., Ltd. (a) | | | 16,600 | | | | 122 | | |
| Toray Industries, Inc. (a) | | | 49,100 | | | | 351 | | |
| Toshiba Corp. (a) | | | 170,000 | | | | 696 | | |
| Tosoh Corp. | | | 23,000 | | | | 62 | | |
| TOTO Ltd. | | | 15,600 | | | | 120 | | |
| Toyo Seikan Kaisha Ltd. | | | 8,000 | | | | 109 | | |
| Toyota Boshoku Corp. (a) | | | 9,700 | | | | 101 | | |
| Toyota Industries Corp. | | | 3,250 | | | | 88 | | |
| Toyota Motor Corp. | | | 52,800 | | | | 1,760 | | |
| Trend Micro, Inc. (a) | | | 4,800 | | | | 143 | | |
| Unicharm Corp. | | | 10,100 | | | | 498 | | |
| Ushio, Inc. | | | 1,600 | | | | 23 | | |
| USS Co., Ltd. | | | 1,250 | | | | 113 | | |
| West Japan Railway Co. | | | 1,900 | | | | 83 | | |
| Yahoo! Japan Corp. (a) | | | 763 | | | | 246 | | |
| Yakult Honsha Co., Ltd. (a) | | | 9,199 | | | | 290 | | |
| Yamada Denki Co., Ltd. (a) | | | 4,190 | | | | 285 | | |
| Yamaha Corp. | | | 5,100 | | | | 47 | | |
| Yamaha Motor Co., Ltd. | | | 1,800 | | | | 23 | | |
| Yamato Holdings Co., Ltd. | | | 10,600 | | | | 179 | | |
| Yokogawa Electric Corp. (a)(b) | | | 11,000 | | | | 99 | | |
| | | | 74,701 | | |
| | | Shares | | Value
(000) | |
| Korea, Republic of (1.2%) | |
| Amorepacific Corp. | | | 22 | | | $ | 20 | | |
| Cheil Industries, Inc. | | | 481 | | | | 42 | | |
| Daewoo Securities Co., Ltd. | | | 1,230 | | | | 11 | | |
Doosan Heavy Industries and
Construction Co., Ltd. | | | 646 | | | | 37 | | |
| E-Mart Co., Ltd. | | | 159 | | | | 38 | | |
| GS Engineering & Construction Corp. | | | 417 | | | | 34 | | |
| Hana Financial Group, Inc. | | | 1,290 | | | | 40 | | |
| Hynix Semiconductor, Inc. (b) | | | 3,060 | | | | 59 | | |
| Hyundai Engineering & Construction Co., Ltd. (b) | | | 500 | | | | 31 | | |
| Hyundai Heavy Industries Co., Ltd. | | | 284 | | | | 64 | | |
| Hyundai Mobis (b) | | | 397 | | | | 101 | | |
| Hyundai Motor Co. | | | 949 | | | | 176 | | |
| Hyundai Steel Co. (b) | | | 507 | | | | 42 | | |
| Industrial Bank of Korea (b) | | | 2,060 | | | | 22 | | |
| KB Financial Group, Inc. | | | 2,410 | | | | 76 | | |
| Kia Motors Corp. | | | 1,430 | | | | 83 | | |
| Korea Electric Power Corp. (b) | | | 1,710 | | | | 38 | | |
| Korea Exchange Bank | | | 3,450 | | | | 22 | | |
| Korean Air Lines Co., Ltd. (b) | | | 248 | | | | 9 | | |
| KT Corp. | | | 1,430 | | | | 44 | | |
| KT&G Corp. | | | 749 | | | | 53 | | |
| LG Chem Ltd. | | | 298 | | | | 83 | | |
| LG Corp. | | | 1,151 | | | | 62 | | |
| LG Display Co., Ltd. (b) | | | 1,520 | | | | 32 | | |
| LG Electronics, Inc. | | | 675 | | | | 44 | | |
| LG Household & Health Care Ltd. | | | 62 | | | | 26 | | |
| Lotte Shopping Co., Ltd. | | | 87 | | | | 26 | | |
| NCSoft Corp. | | | 104 | | | | 28 | | |
| NHN Corp. | | | 282 | | | | 52 | | |
| OCI Co., Ltd. (b) | | | 119 | | | | 23 | | |
| POSCO | | | 400 | | | | 132 | | |
| S-Oil Corp. | | | 490 | | | | 43 | | |
| Samsung C&T Corp. | | | 985 | | | | 59 | | |
| Samsung Electro-Mechanics Co., Ltd. | | | 391 | | | | 27 | | |
| Samsung Electronics Co., Ltd. | | | 1,696 | | | | 1,561 | | |
| Samsung Electronics Co., Ltd. (Preference) | | | 124 | | | | 72 | | |
| Samsung Engineering Co., Ltd. | | | 238 | | | | 42 | | |
| Samsung Fire & Marine Insurance Co., Ltd. | | | 256 | | | | 47 | | |
| Samsung Heavy Industries Co., Ltd. | | | 1,520 | | | | 37 | | |
| Samsung SDI Co., Ltd. | | | 244 | | | | 29 | | |
| Samsung Securities Co., Ltd. | | | 482 | | | | 21 | | |
| Samsung Techwin Co., Ltd. | | | 263 | | | | 12 | | |
| Shinhan Financial Group Co., Ltd. | | | 2,670 | | | | 93 | | |
| Shinsegae Co., Ltd. | | | 56 | | | | 12 | | |
| SK Innovation Co., Ltd. | | | 427 | | | | 53 | | |
| SK Telecom Co., Ltd. | | | 333 | | | | 41 | | |
| Woori Finance Holdings Co., Ltd. (b) | | | 1,590 | | | | 13 | | |
| | | | 3,712 | | |
| Malta (0.0%) | |
| BGP Holdings PLC (b)(f) | | | 72,261 | | | | — | | |
The accompanying notes are an integral part of the financial statements.
18
2011 Annual Report
December 31, 2011
Portfolio of Investments (cont'd)
Active International Allocation Portfolio
| | | Shares | | Value
(000) | |
| Mexico (0.6%) | |
| Alfa SAB de CV | | | 3,900 | | | $ | 42 | | |
| America Movil SAB de CV | | | 511,400 | | | | 578 | | |
| Cemex SAB de CV (Units) (b)(d) | | | 125,300 | | | | 66 | | |
| Fomento Economico Mexicano SAB de CV (Units) (d) | | | 28,700 | | | | 201 | | |
| Fresnillo PLC | | | 1,167 | | | | 28 | | |
| Grupo Bimbo SAB de CV | | | 24,000 | | | | 49 | | |
| Grupo Elektra SA de CV | | | 995 | | | | 100 | | |
| Grupo Financiero Banorte SAB de CV Series O | | | 21,300 | | | | 64 | | |
| Grupo Financiero Inbursa SA | | | 23,200 | | | | 43 | | |
| Grupo Mexico SAB de CV Series B | | | 49,928 | | | | 131 | | |
| Grupo Modelo SAB de CV | | | 8,900 | | | | 56 | | |
| Grupo Televisa SAB | | | 34,100 | | | | 144 | | |
| Industrias Penoles SAB de CV | | | 1,405 | | | | 62 | | |
| Kimberly-Clark de Mexico SAB de CV, Class A | | | 8,000 | | | | 43 | | |
| Mexichem SAB de CV | | | 11,100 | | | | 35 | | |
| Minera Frisco SAB de CV (b) | | | 8,500 | | | | 31 | | |
| Wal-Mart de Mexico SAB de CV Series V | | | 92,802 | | | | 255 | | |
| | | | 1,928 | | |
| Netherlands (3.5%) | |
| Aegon N.V. (b) | | | 56,151 | | | | 225 | | |
| Akzo Nobel N.V. (a) | | | 15,704 | | | | 759 | | |
| ASML Holding N.V. | | | 22,764 | | | | 957 | | |
| Corio N.V. REIT | | | 2,333 | | | | 102 | | |
| Fugro N.V. CVA | | | 2,618 | | | | 152 | | |
| Heineken N.V. | | | 13,278 | | | | 615 | | |
| ING Groep N.V. CVA (b) | | | 119,831 | | | | 862 | | |
| Koninklijke Ahold N.V. | | | 1,806 | | | | 24 | | |
| Koninklijke Boskalis Westminster N.V. | | | 166 | | | | 6 | | |
| Koninklijke DSM N.V. | | | 6,104 | | | | 283 | | |
| Koninklijke KPN N.V. | | | 111,174 | | | | 1,330 | | |
| Koninklijke Philips Electronics N.V. | | | 46,957 | | | | 990 | | |
| Randstad Holding N.V. | | | 275 | | | | 8 | | |
| Reed Elsevier N.V. | | | 41,257 | | | | 481 | | |
| SBM Offshore N.V. | | | 6,287 | | | | 130 | | |
| TNT Express N.V. | | | 35,304 | | | | 264 | | |
| Unilever N.V. CVA | | | 94,647 | | | | 3,255 | | |
| Wolters Kluwer N.V. | | | 27,716 | | | | 479 | | |
| | | | 10,922 | | |
| Norway (1.4%) | |
| Aker Solutions ASA | | | 3,994 | | | | 42 | | |
| DnB NOR ASA | | | 25,134 | | | | 246 | | |
| Gjensidige Forsikring ASA | | | 798 | | | | 9 | | |
| Norsk Hydro ASA | | | 39,166 | | | | 182 | | |
| Orkla ASA | | | 31,161 | | | | 233 | | |
| Statoil ASA | | | 37,537 | | | | 963 | | |
| Subsea 7 SA (a)(b) | | | 6,763 | | | | 126 | | |
| Telenor ASA | | | 93,562 | | | | 1,535 | | |
| Yara International ASA | | | 26,152 | | | | 1,049 | | |
| | | | 4,385 | | |
| | | Shares | | Value
(000) | |
| Philippines (0.7%) | |
| Aboitiz Equity Ventures, Inc. | | | 231,000 | | | $ | 212 | | |
| Aboitiz Power Corp. | | | 198,700 | | | | 136 | | |
| Alliance Global Group, Inc. | | | 438,900 | | | | 104 | | |
| Ayala Corp. | | | 24,096 | | | | 171 | | |
| Ayala Land, Inc. | | | 578,500 | | | | 201 | | |
| Bank of the Philippine Islands | | | 195,500 | | | | 247 | | |
| Energy Development Corp. | | | 840,000 | | | | 121 | | |
| Manila Electric Co. | | | 31,000 | | | | 175 | | |
| Metropolitan Bank & Trust | | | 115,200 | | | | 179 | | |
| Philippine Long Distance Telephone Co. | | | 5,120 | | | | 298 | | |
| SM Investments Corp. | | | 20,140 | | | | 269 | | |
| SM Prime Holdings, Inc. | | | 581,000 | | | | 177 | | |
| | | | 2,290 | | |
| Poland (0.9%) | |
| Asseco Poland SA | | | 5,048 | | | | 71 | | |
| Bank Pekao SA | | | 8,927 | | | | 365 | | |
| BRE Bank SA (b) | | | 1,130 | | | | 81 | | |
| Getin Holding SA (b) | | | 28,702 | | | | 59 | | |
| KGHM Polska Miedz SA | | | 10,362 | | | | 332 | | |
| PGE SA | | | 51,351 | | | | 308 | | |
| Polski Koncern Naftowy Orlen SA (b) | | | 25,504 | | | | 251 | | |
| Polskie Gornictwo Naftowe i Gazownictwo SA | | | 138,995 | | | | 164 | | |
| Powszechna Kasa Oszczednosci Bank Polski SA | | | 50,802 | | | | 473 | | |
| Powszechny Zaklad Ubezpieczen SA | | | 3,700 | | | | 331 | | |
| Synthos SA | | | 1,374 | | | | 2 | | |
| Tauron Polska Energia SA | | | 80,800 | | | | 125 | | |
| Telekomunikacja Polska SA | | | 53,058 | | | | 265 | | |
| | | | 2,827 | | |
| Portugal (0.0%) | |
| Cimpor Cimentos de Portugal SGPS SA | | | 1,085 | | | | 8 | | |
| Russia (0.4%) | |
| Gazprom OAO ADR | | | 48,606 | | | | 518 | | |
| Lukoil OAO ADR | | | 4,934 | | | | 261 | | |
| MMC Norilsk Nickel OJSC ADR | | | 7,892 | | | | 121 | | |
| Mobile Telesystems OJSC ADR (a) | | | 5,100 | | | | 75 | | |
| NovaTek OAO (Registered GDR) | | | 585 | | | | 73 | | |
| Rosneft Oil Co. (Registered GDR) | | | 16,411 | | | | 108 | | |
| Surgutneftegas OJSC ADR | | | 8,300 | | | | 66 | | |
| Tatneft ADR | | | 2,878 | | | | 85 | | |
| VTB Bank OJSC (Registered GDR) | | | 15,972 | | | | 58 | | |
| | | | 1,365 | | |
| Singapore (1.9%) | |
| Ascendas Real Estate Investment Trust REIT (a) | | | 60,000 | | | | 85 | | |
| CapitaLand Ltd. | | | 100,000 | | | | 170 | | |
| CapitaMall Trust REIT | | | 85,514 | | | | 112 | | |
| City Developments Ltd. | | | 22,741 | | | | 156 | | |
| ComfortDelGro Corp. Ltd. | | | 64,538 | | | | 70 | | |
| DBS Group Holdings Ltd. | | | 85,678 | | | | 761 | | |
| Fraser and Neave Ltd. | | | 42,000 | | | | 201 | | |
| Genting Singapore PLC (a)(b) | | | 284,000 | | | | 331 | | |
| Jardine Cycle & Carriage Ltd. | | | 3,034 | | | | 113 | | |
The accompanying notes are an integral part of the financial statements.
19
2011 Annual Report
December 31, 2011
Portfolio of Investments (cont'd)
Active International Allocation Portfolio
| | | Shares | | Value
(000) | |
| Singapore (cont'd) | |
| Keppel Corp., Ltd. | | | 60,500 | | | $ | 434 | | |
| Noble Group Ltd. | | | 100,090 | | | | 87 | | |
| Olam International Ltd. (a) | | | 15,000 | | | | 25 | | |
| Oversea-Chinese Banking Corp., Ltd. | | | 157,758 | | | | 952 | | |
| SembCorp Industries Ltd. | | | 44,183 | | | | 138 | | |
| SembCorp Marine Ltd. (a) | | | 40,000 | | | | 118 | | |
| Singapore Airlines Ltd. | | | 29,010 | | | | 227 | | |
| Singapore Exchange Ltd. | | | 24,581 | | | | 116 | | |
| Singapore Press Holdings Ltd. (a) | | | 34,083 | | | | 97 | | |
| Singapore Technologies Engineering Ltd. | | | 52,000 | | | | 108 | | |
| Singapore Telecommunications Ltd. | | | 309,115 | | | | 736 | | |
| United Overseas Bank Ltd. | | | 72,448 | | | | 853 | | |
| Wilmar International Ltd. (a) | | | 45,000 | | | | 173 | | |
| | | | 6,063 | | |
| South Africa (0.5%) | |
| SABMiller PLC | | | 44,312 | | | | 1,560 | | |
| Spain (0.2%) | |
| Abertis Infraestructuras SA | | | 1,245 | | | | 20 | | |
| Amadeus IT Holding SA, Class A | | | 700 | | | | 11 | | |
| Distribuidora Internacional de Alimentacion SA (a)(b) | | | 33,138 | | | | 150 | | |
| Iberdrola SA | | | 9,459 | | | | 59 | | |
| Repsol YPF SA | | | 1,968 | | | | 61 | | |
| Telefonica SA | | | 17,154 | | | | 297 | | |
| | | | 598 | | |
| Sweden (2.5%) | |
| Alfa Laval AB | | | 8,833 | | | | 167 | | |
| Assa Abloy AB, Series B | | | 8,838 | | | | 222 | | |
| Atlas Copco AB, Class A | | | 20,848 | | | | 448 | | |
| Atlas Copco AB, Class B | | | 11,467 | | | | 218 | | |
| Electrolux AB Series B | | | 2,711 | | | | 43 | | |
| Getinge AB, Class B | | | 11,829 | | | | 300 | | |
| Hennes & Mauritz AB, Class B | | | 31,727 | | | | 1,020 | | |
| Holmen AB, Class B | | | 1,793 | | | | 52 | | |
| Husqvarna AB, Class B | | | 2,711 | | | | 12 | | |
| Investor AB, Class B | | | 19,540 | | | | 365 | | |
| Lundin Petroleum AB (b) | | | 5,580 | | | | 137 | | |
| Nordea Bank AB | | | 71,635 | | | | 554 | | |
| Oriflame Cosmetics SA SDR (a) | | | 9,373 | | | | 296 | | |
| Sandvik AB | | | 33,130 | | | | 407 | | |
| Scania AB, Class B | | | 1,295 | | | | 19 | | |
| Securitas AB, Class B | | | 800 | | | | 7 | | |
| Skanska AB, Class B | | | 19,316 | | | | 320 | | |
| SKF AB, Class B | | | 10,403 | | | | 220 | | |
| SSAB AB, Class A | | | 7,094 | | | | 63 | | |
| Svenska Cellulosa AB, Class B | | | 20,989 | | | | 311 | | |
| Svenska Handelsbanken AB, Class A | | | 15,836 | | | | 416 | | |
| Swedish Match AB | | | 11,240 | | | | 399 | | |
| Tele2 AB, Class B | | | 8,263 | | | | 161 | | |
| Telefonaktiebolaget LM Ericsson, Class B | | | 55,403 | | | | 567 | | |
| TeliaSonera AB | | | 83,532 | | | | 568 | | |
| Volvo AB, Class A | | | 12,907 | | | | 142 | | |
| Volvo AB, Class B | | | 34,479 | | | | 377 | | |
| | | | 7,811 | | |
| | | Shares | | Value
(000) | |
| Switzerland (8.6%) | |
| ABB Ltd. (Registered) (b) | | | 106,353 | | | $ | 2,002 | | |
| Baloise-Holding AG (Registered) | | | 1,454 | | | | 100 | | |
| Cie Financiere Richemont SA | | | 6,054 | | | | 306 | | |
| Credit Suisse Group AG (Registered) (b) | | | 19,066 | | | | 448 | | |
| GAM Holding AG (b) | | | 11,678 | | | | 127 | | |
| Geberit AG (Registered) (b) | | | 989 | | | | 190 | | |
| Givaudan SA (Registered) (b) | | | 198 | | | | 189 | | |
| Holcim Ltd. (Registered) (b) | | | 6,542 | | | | 350 | | |
| Julius Baer Group Ltd. (b) | | | 5,987 | | | | 234 | | |
| Logitech International SA (Registered) (a)(b) | | | 2,992 | | | | 23 | | |
| Lonza Group AG (Registered) (b) | | | 1,199 | | | | 71 | | |
| Nestle SA (Registered) | | | 152,403 | | | | 8,762 | | |
| Novartis AG (Registered) | | | 81,315 | | | | 4,649 | | |
| Pargesa Holding SA | | | 377 | | | | 25 | | |
| Roche Holding AG (Genusschein) | | | 23,918 | | | | 4,054 | | |
| Schindler Holding AG | | | 1,720 | | | | 200 | | |
| Straumann Holding AG (Registered) | | | 484 | | | | 83 | | |
| Swatch Group AG (The) | | | 359 | | | | 134 | | |
| Swatch Group AG (The) (Registered) | | | 689 | | | | 46 | | |
| Swiss Life Holding AG (Registered) (b) | | | 609 | | | | 56 | | |
| Swiss Re AG (b) | | | 10,178 | | | | 519 | | |
| Swisscom AG (Registered) | | | 1,038 | | | | 393 | | |
| Syngenta AG (Registered) (b) | | | 6,458 | | | | 1,891 | | |
| Synthes, Inc. (Registered) (g) | | | 3,733 | | | | 626 | | |
| Transocean Ltd. | | | 1,443 | | | | 56 | | |
| UBS AG (Registered) (b) | | | 63,558 | | | | 756 | | |
| Zurich Financial Services AG (b) | | | 3,178 | | | | 719 | | |
| | | | 27,009 | | |
| Thailand (0.3%) | |
| Bangkok Bank PCL | | | 17,800 | | | | 87 | | |
| Bangkok Bank PCL (Foreign Registered) | | | 32,100 | | | | 167 | | |
| Bank of Ayudhya PCL (Foreign) | | | 71,500 | | | | 50 | | |
| Kasikornbank PCL | | | 22,600 | | | | 87 | | |
| Kasikornbank PCL (Foreign) | | | 44,100 | | | | 174 | | |
| Krung Thai Bank PCL | | | 99,100 | | | | 47 | | |
| Siam Commercial Bank PCL (Foreign) | | | 57,700 | | | | 210 | | |
| | | | 822 | | |
| United Kingdom (21.8%) | |
| 3i Group PLC | | | 16,093 | | | | 45 | | |
| Admiral Group PLC | | | 3,982 | | | | 53 | | |
| Aggreko PLC | | | 35,863 | | | | 1,123 | | |
| AMEC PLC | | | 12,459 | | | | 176 | | |
| Anglo American PLC | | | 38,159 | | | | 1,410 | | |
| ARM Holdings PLC | | | 85,867 | | | | 789 | | |
| AstraZeneca PLC | | | 46,432 | | | | 2,145 | | |
| Aviva PLC | | | 61,572 | | | | 288 | | |
| BAE Systems PLC | | | 91,329 | | | | 404 | | |
| Balfour Beatty PLC | | | 28,670 | | | | 118 | | |
| Barclays PLC | | | 158,650 | | | | 434 | | |
| BG Group PLC | | | 117,962 | | | | 2,522 | | |
| BHP Billiton PLC | | | 31,582 | | | | 921 | | |
The accompanying notes are an integral part of the financial statements.
20
2011 Annual Report
December 31, 2011
Portfolio of Investments (cont'd)
Active International Allocation Portfolio
| | | Shares | | Value
(000) | |
| United Kingdom (cont'd) | |
| BP PLC | | | 425,737 | | | $ | 3,045 | | |
| British American Tobacco PLC | | | 65,519 | | | | 3,109 | | |
| British Land Co., PLC REIT | | | 30,701 | | | | 220 | | |
| British Sky Broadcasting Group PLC | | | 80,070 | | | | 911 | | |
| BT Group PLC | | | 393,519 | | | | 1,167 | | |
| Bunzl PLC | | | 11,071 | | | | 152 | | |
| Burberry Group PLC | | | 4,860 | | | | 89 | | |
| Capita Group PLC (The) | | | 6,717 | | | | 66 | | |
| Capital Shopping Centres Group PLC REIT | | | 17,037 | | | | 83 | | |
| Carnival PLC | | | 8,133 | | | | 268 | | |
| Centrica PLC | | | 100,817 | | | | 453 | | |
| Charter International PLC (a) | | | 20,687 | | | | 304 | | |
| Cobham PLC | | | 31,176 | | | | 89 | | |
| Compass Group PLC | | | 83,308 | | | | 790 | | |
| Diageo PLC | | | 91,133 | | | | 1,991 | | |
| Experian PLC | | | 26,369 | | | | 358 | | |
| Firstgroup PLC | | | 22,411 | | | | 118 | | |
| G4S PLC | | | 14,295 | | | | 60 | | |
| GlaxoSmithKline PLC | | | 175,121 | | | | 4,002 | | |
| Hammerson PLC REIT | | �� | 25,762 | | | | 144 | | |
| Home Retail Group PLC | | | 25,617 | | | | 33 | | |
| HSBC Holdings PLC | | | 447,113 | | | | 3,410 | | |
| ICAP PLC | | | 1,056 | | | | 6 | | |
| Imperial Tobacco Group PLC | | | 26,399 | | | | 998 | | |
| Intercontinental Hotels Group PLC | | | 13,994 | | | | 251 | | |
| International Power PLC | | | 13,555 | | | | 71 | | |
| Invensys PLC | | | 18,025 | | | | 59 | | |
| Investec PLC | | | 5,696 | | | | 30 | | |
| J Sainsbury PLC | | | 44,001 | | | | 207 | | |
| Johnson Matthey PLC | | | 5,343 | | | | 152 | | |
| Kingfisher PLC | | | 35,198 | | | | 137 | | |
| Land Securities Group PLC REIT | | | 28,746 | | | | 284 | | |
| Legal & General Group PLC | | | 162,231 | | | | 259 | | |
| Lloyds Banking Group PLC (b) | | | 234,312 | | | | 94 | | |
| Man Group PLC | | | 61,874 | | | | 121 | | |
| Marks & Spencer Group PLC | | | 48,963 | | | | 236 | | |
| National Grid PLC | | | 104,557 | | | | 1,015 | | |
| Next PLC | | | 7,151 | | | | 304 | | |
| Old Mutual PLC | | | 139,096 | | | | 293 | | |
| Pearson PLC | | | 36,307 | | | | 682 | | |
| Petrofac Ltd. | | | 10,323 | | | | 231 | | |
| Prudential PLC | | | 52,385 | | | | 519 | | |
| Randgold Resources Ltd. | | | 9,535 | | | | 975 | | |
| Reckitt Benckiser Group PLC | | | 22,412 | | | | 1,107 | | |
| Reed Elsevier PLC | | | 51,569 | | | | 416 | | |
| Resolution Ltd. | | | 2,240 | | | | 9 | | |
| Rexam PLC | | | 18,628 | | | | 102 | | |
| Rio Tinto PLC | | | 42,279 | | | | 2,052 | | |
| Rolls-Royce Holdings PLC (b) | | | 46,906 | | | | 544 | | |
| Royal Bank of Scotland Group PLC (b) | | | 404,465 | | | | 127 | | |
| Royal Dutch Shell PLC, Class A | | | 136,182 | | | | 5,014 | | |
| Royal Dutch Shell PLC, Class B | | | 96,049 | | | | 3,660 | | |
| | | Shares | | Value
(000) | |
| RSA Insurance Group PLC | | | 88,836 | | | $ | 145 | | |
| Sage Group PLC (The) | | | 60,492 | | | | 276 | | |
| Schroders PLC | | | 2,457 | | | | 50 | | |
| Segro PLC REIT | | | 25,562 | | | | 83 | | |
| Serco Group PLC | | | 5,810 | | | | 43 | | |
| Severn Trent PLC | | | 15,300 | | | | 355 | | |
| Smith & Nephew PLC | | | 102,037 | | | | 991 | | |
| Smiths Group PLC | | | 10,326 | | | | 147 | | |
| SSE PLC | | | 46,176 | | | | 926 | | |
| Standard Chartered PLC | | | 64,310 | | | | 1,407 | | |
| Standard Life PLC | | | 44,995 | | | | 144 | | |
| Tesco PLC | | | 260,101 | | | | 1,630 | | |
| Unilever PLC | | | 36,785 | | | | 1,236 | | |
| United Utilities Group PLC | | | 6,703 | | | | 63 | | |
| Vodafone Group PLC | | | 2,444,465 | | | | 6,791 | | |
| Whitbread PLC | | | 8,223 | | | | 200 | | |
| Wolseley PLC | | | 1,711 | | | | 57 | | |
| WPP PLC | | | 159,268 | | | | 1,671 | | |
| Xstrata PLC | | | 40,712 | | | | 618 | | |
| | | | 68,078 | | |
| United States (0.2%) | |
| Lend Lease Group REIT (Stapled Securities) (c)(d) | | | 5,983 | | | | 44 | | |
| Tenaris SA (a) | | | 27,737 | | | | 512 | | |
| | | | 556 | | |
| Total Common Stocks (Cost $309,062) | | | 276,798 | | |
| Short-Term Investments (18.8%) | |
| Securities held as Collateral on Loaned Securities (9.3%) | |
| Investment Company (6.8%) | |
Morgan Stanley Institutional Liquidity
Funds — Money Market Portfolio —
Institutional Class (See Note G-2) | | | 21,266,995 | | | | 21,267 | | |
| | | Face
Amount
(000) | | | |
| Repurchase Agreements (2.5%) | |
Barclays Capital, Inc., (0.02%, dated 12/30/11,
due 1/3/12; proceeds $913; fully
collateralized by a U.S. Government Obligation;
U.S. Treasury Bond 4.50% due 5/15/38;
valued at $932) | | $ | 913 | | | | 913 | | |
Merrill Lynch & Co., Inc., (0.07%,
dated 12/30/11, due 1/3/12; proceeds
$6,784; fully collateralized by a
U.S. Government Agency; Government National
Mortgage Association 3.50% due 11/20/41;
valued at $6,920) | | | 6,784 | | | | 6,784 | | |
| | | | 7,697 | | |
Total Securities held as Collateral on Loaned
Securities (Cost $28,964) | | | 28,964 | | |
The accompanying notes are an integral part of the financial statements.
21
2011 Annual Report
December 31, 2011
Portfolio of Investments (cont'd)
Active International Allocation Portfolio
| | Shares | | Value
(000) | |
| Investment Company (9.5%) | |
Morgan Stanley Institutional Liquidity
Funds — Money Market Portfolio —
Institutional Class (See Note G-2)
(Cost $29,780) | | | 29,780,274 | | | $ | 29,780 | | |
| Total Short-Term Investments (Cost $58,744) | | | 58,744 | | |
Total Investments (107.4%) (Cost $367,806)
including $28,149 of Securities Loaned (h) | | | 335,542 | | |
| Liabilities in Excess of Other Assets (-7.4%) | | | (23,107 | ) | |
| Net Assets (100.0%) | | $ | 312,435 | | |
(a) All or a portion of this security was on loan at December 31, 2011.
(b) Non-income producing security.
(c) Comprised of securities in separate entities that are traded as a single stapled security.
(d) Consists of one or more classes of securities traded together as a unit; stocks with attached warrants.
(e) Security trades on the Hong Kong exchange.
(f) At December 31, 2011, the Portfolio held a fair valued security valued at $0, representing 0.0% of net assets. This security has been fair valued as determined in good faith under procedures established by and under the general supervision of the Fund's Directors.
(g) 144A security — Certain conditions for public sale may exist. Unless otherwise noted, these securities are deemed to be liquid.
(h) Securities are available for collateral in connection with open foreign currency exchange and futures contracts.
@ Value is less than $500.
ADR American Depositary Receipt.
CDI CHESS Depositary Interest.
CVA Certificaten Van Aandelen.
GDR Global Depositary Receipt.
REIT Real Estate Investment Trust.
SDR Swedish Depositary Receipt.
VVPR Verminderde Voorheffing Précompte Réduit.
Foreign Currency Exchange Contracts Information:
The Portfolio had the following foreign currency exchange contracts open at period end:
| Counterparty | | Currency
to
Deliver
(000) | | Value
(000) | | Settlement
Date | | In
Exchange
For
(000) | | Value
(000) | | Unrealized
Appreciation
(Depreciation)
(000) | |
| Credit Suisse London Branch (GFX) | | | |
| | | USD | 1,689 | | | $ | 1,689 | | | 1/19/12 | | CHF | 1,571 | | | $ | 1,674 | | | $ | (15 | ) | |
| | | USD | 2,694 | | | | 2,694 | | | 1/19/12 | | EUR | 2,056 | | | | 2,662 | | | | (32 | ) | |
| Deutsche Bank AG London | |
| | | EUR | 2,637 | | | | 3,413 | | | 1/19/12 | | USD | 3,423 | | | | 3,423 | | | | 10 | | |
| | | GBP | 1,231 | | | | 1,911 | | | 1/19/12 | | USD | 1,912 | | | | 1,912 | | | | 1 | | |
| | | USD | 2,652 | | | | 2,652 | | | 1/19/12 | | EUR | 2,024 | | | | 2,621 | | | | (31 | ) | |
| | | USD | 2,831 | | | | 2,831 | | | 1/19/12 | | EUR | 2,164 | | | | 2,801 | | | | (30 | ) | |
| Goldman Sachs International | |
| | | USD | 1,767 | | | | 1,767 | | | 1/19/12 | | EUR | 1,350 | | | | 1,746 | | | | (21 | ) | |
| JPMorgan Chase Bank | |
| | | USD | 5,509 | | | | 5,509 | | | 1/19/12 | | EUR | 4,206 | | | | 5,445 | | | | (64 | ) | |
| Counterparty | | Currency
to
Deliver
(000) | | Value
(000) | | Settlement
Date | | In
Exchange
For
(000) | | Value
(000) | | Unrealized
Appreciation
(Depreciation)
(000) | |
| Mellon Bank | |
| | | AUD | 5,638 | | | $ | 5,756 | | | 1/19/12 | | USD | 5,601 | | | $ | 5,601 | | | $ | (155 | ) | |
| | | USD | 14,721 | | | | 14,721 | | | 1/19/12 | | AUD | 14,657 | | | | 14,966 | | | | 245 | | |
| | | USD | 4,529 | | | | 4,529 | | | 1/19/12 | | EUR | 3,458 | | | | 4,475 | | | | (54 | ) | |
| Royal Bank of Scotland | |
| | | JPY | 737,774 | | | | 9,587 | | | 1/19/12 | | USD | 9,459 | | | | 9,459 | | | | (128 | ) | |
| | | USD | 6,717 | | | | 6,717 | | | 1/19/12 | | JPY | 522,342 | | | | 6,788 | | | | 71 | | |
| State Street Bank and Trust Co. | |
| | | USD | 6,601 | | | | 6,601 | | | 1/19/12 | | GBP | 4,250 | | | | 6,599 | | | | (2 | ) | |
| UBS AG | |
| | | CHF | 1,450 | | | | 1,544 | | | 1/19/12 | | USD | 1,541 | | | | 1,541 | | | | (3 | ) | |
| | | CHF | 725 | | | | 772 | | | 1/19/12 | | USD | 775 | | | | 775 | | | | 3 | | |
| | | GBP | 6,932 | | | | 10,765 | | | 1/19/12 | | USD | 10,768 | | | | 10,768 | | | | 3 | | |
| | | USD | 5,335 | | | | 5,335 | | | 1/19/12 | | EUR | 4,073 | | | | 5,272 | | | | (63 | ) | |
| | | | | $ | 88,793 | | | | | | | $ | 88,528 | | | $ | (265 | ) | |
AUD — Australian Dollar
CHF — Swiss Franc
EUR — Euro
GBP — British Pound
JPY — Japanese Yen
USD — United States Dollar
Futures Contracts:
The Portfolio had the following futures contracts open at period end:
| | | Number
of
Contracts | | Value
(000) | | Expiration
Date | | Unrealized
Appreciation
(Depreciation)
(000) | |
| Long: | |
ASX Spi 200 Index
(Australia) | | | 19 | | | $ | 1,958 | | | Mar-12 | | $ | (86 | ) | |
DAX Index
(Germany) | | | 7 | | | | 1,338 | | | Mar-12 | | | 2 | | |
FTSE 100 Index
(United Kingdom) | | | 78 | | | | 6,697 | | | Mar-12 | | | 149 | | |
Hang Seng China
ENT Index
(Hong Kong) | | | 57 | | | | 6,772 | | | Jan-12 | | | (62 | ) | |
IBEX 35 Index
(Spain) | | | 27 | | | | 2,966 | | | Jan-12 | | | 29 | | |
TOPIX Index
(Japan) | | | 74 | | | | 6,998 | | | Mar-12 | | | (166 | ) | |
| Short: | |
Euro STOXX 50 Index
(Germany) | | | 8 | | | | (239 | ) | | Mar-12 | | | (10 | ) | |
| | | $ | (144 | ) | |
The accompanying notes are an integral part of the financial statements.
22
2011 Annual Report
December 31, 2011
Portfolio of Investments (cont'd)
Active International Allocation Portfolio
Fair Value Measurement Information:
The following is a summary of the inputs used to value the Portfolio's investments as of December 31, 2011. (See Note A-9 to the financial statements for further information regarding fair value measurement.)
| Investment Type | | Level 1
Unadjusted
quoted
prices
(000) | | Level 2
Other
significant
observable
inputs
(000) | | Level 3
Significant
unobservable
inputs
(000) | | Total
(000) | |
| Assets: | | | | | | | | | |
| Common Stocks | | | | | | | | | |
| Aerospace & Defense | | $ | 1,296 | | | $ | — | | | $ | — | | | $ | 1,296 | | |
| Air Freight & Logistics | | | 952 | | | | — | | | | — | | | | 952 | | |
| Airlines | | | 355 | | | | — | | | | — | | | | 355 | | |
| Auto Components | | | 3,658 | | | | — | | | | — | | | | 3,658 | | |
| Automobiles | | | 7,526 | | | | — | | | | — | | | | 7,526 | | |
| Beverages | | | 7,013 | | | | — | | | | — | | | | 7,013 | | |
| Biotechnology | | | 152 | | | | — | | | | — | | | | 152 | | |
| Building Products | | | 1,544 | | | | — | | | | — | | | | 1,544 | | |
| Capital Markets | | | 3,032 | | | | — | | | | — | | | | 3,032 | | |
| Chemicals | | | 12,363 | | | | — | | | | — | | | | 12,363 | | |
| Commercial Banks | | | 18,179 | | | | — | | | | — | | | | 18,179 | | |
Commercial Services &
Supplies | | | 2,047 | | | | — | | | | — | | | | 2,047 | | |
Communications
Equipment | | | 938 | | | | — | | | | — | | | | 938 | | |
| Computers & Peripherals | | | 1,945 | | | | — | | | | — | | | | 1,945 | | |
Construction &
Engineering | | | 2,534 | | | | — | | | | — | | | | 2,534 | | |
| Construction Materials | | | 1,015 | | | | — | | | | — | | | | 1,015 | | |
| Consumer Finance | | | 98 | | | | — | | | | — | | | | 98 | | |
| Containers & Packaging | | | 450 | | | | — | | | | — | | | | 450 | | |
| Distributors | | | 113 | | | | — | | | | — | | | | 113 | | |
Diversified Consumer
Services | | | 116 | | | | — | | | | — | | | | 116 | | |
Diversified Financial
Services | | | 2,039 | | | | — | | | | — | † | | | 2,039 | | |
Diversified
Telecommunication
Services | | | 9,950 | | | | — | | | | — | | | | 9,950 | | |
| Electric Utilities | | | 4,447 | | | | — | | | | — | | | | 4,447 | | |
| Electrical Equipment | | | 5,001 | | | | — | | | | — | | | | 5,001 | | |
Electronic Equipment,
Instruments &
Components | | | 5,850 | | | | — | | | | — | | | | 5,850 | | |
Energy Equipment &
Services | | | 2,569 | | | | — | | | | — | | | | 2,569 | | |
| Food & Staples Retailing | | | 5,219 | | | | — | | | | — | | | | 5,219 | | |
| Food Products | | | 15,059 | | | | — | | | | — | | | | 15,059 | | |
| Gas Utilities | | | 392 | | | | — | | | | — | | | | 392 | | |
Health Care Equipment &
Supplies | | | 3,259 | | | | — | | | | — | | | | 3,259 | | |
Health Care Providers &
Services | | | 714 | | | | — | | | | — | | | | 714 | | |
Hotels, Restaurants &
Leisure | | | 2,361 | | | | — | | | | — | | | | 2,361 | | |
| Household Durables | | | 2,688 | | | | — | | | | — | | | | 2,688 | | |
| Investment Type | | Level 1
Unadjusted
quoted
prices
(000) | | Level 2
Other
significant
observable
inputs
(000) | | Level 3
Significant
unobservable
inputs
(000) | | Total
(000) | |
| Household Products | | $ | 1,886 | | | $ | — | | | $ | — | | | $ | 1,886 | | |
Independent Power
Producers & Energy
Traders | | | 328 | | | | — | | | | — | | | | 328 | | |
| Industrial Conglomerates | | | 6,759 | | | | — | | | | — | | | | 6,759 | | |
Information Technology
Services | | | 569 | | | | — | | | | — | | | | 569 | | |
| Insurance | | | 7,494 | | | | — | | | | — | | | | 7,494 | | |
| Internet & Catalog Retail | | | 33 | | | | — | | | | — | | | | 33 | | |
Internet Software &
Services | | | 298 | | | | — | | | | — | | | | 298 | | |
Leisure Equipment &
Products | | | 684 | | | | — | | | | — | | | | 684 | | |
Life Sciences Tools &
Services | | | 71 | | | | — | | | | — | | | | 71 | | |
| Machinery | | | 9,681 | | | | — | | | | — | | | | 9,681 | | |
| Marine | | | 1,109 | | | | — | | | | — | | | | 1,109 | | |
| Media | | | 5,088 | | | | — | | | | — | | | | 5,088 | | |
| Metals & Mining | | | 22,348 | | | | — | | | | — | | | | 22,348 | | |
| Multi-Utilities | | | 2,232 | | | | — | | | | — | | | | 2,232 | | |
| Multiline Retail | | | 708 | | | | — | | | | — | | | | 708 | | |
| Office Electronics | | | 1,717 | | | | — | | | | — | | | | 1,717 | | |
Oil, Gas & Consumable
Fuels | | | 21,616 | | | | — | | | | — | | | | 21,616 | | |
| Paper & Forest Products | | | 1,392 | | | | — | | | | — | | | | 1,392 | | |
| Personal Products | | | 842 | | | | — | | | | — | | | | 842 | | |
| Pharmaceuticals | | | 26,090 | | | | — | | | | — | | | | 26,090 | | |
| Professional Services | | | 432 | | | | — | | | | — | | | | 432 | | |
Real Estate Investment
Trusts (REITs) | | | 2,295 | | | | — | | | | — | | | | 2,295 | | |
Real Estate Management &
Development | | | 3,688 | | | | — | | | | — | | | | 3,688 | | |
| Road & Rail | | | 2,843 | | | | — | | | | — | | | | 2,843 | | |
Semiconductors &
Semiconductor
Equipment | | | 4,557 | | | | — | | | | — | | | | 4,557 | | |
| Software | | | 3,674 | | | | — | | | | — | | | | 3,674 | | |
| Specialty Retail | | | 2,911 | | | | — | | | | — | | | | 2,911 | | |
Textiles, Apparel &
Luxury Goods | | | 986 | | | | — | | | | — | | | | 986 | | |
| Tobacco | | | 5,401 | | | | — | | | | — | | | | 5,401 | | |
Trading Companies &
Distributors | | | 4,068 | | | | — | | | | — | | | | 4,068 | | |
Transportation
Infrastructure | | | 127 | | | | — | | | | — | | | | 127 | | |
| Water Utilities | | | 418 | | | | — | | | | — | | | | 418 | | |
Wireless
Telecommunication
Services | | | 9,579 | | | | — | | | | — | | | | 9,579 | | |
| Total Common Stocks | | | 276,798 | | | | — | | | | — | † | | | 276,798 | | |
The accompanying notes are an integral part of the financial statements.
23
2011 Annual Report
December 31, 2011
Portfolio of Investments (cont'd)
Active International Allocation Portfolio
Fair Value Measurement Information: (cont'd)
| Investment Type | | Level 1
Unadjusted
quoted
prices
(000) | | Level 2
Other
significant
observable
inputs
(000) | | Level 3
Significant
unobservable
inputs
(000) | | Total
(000) | |
| Short-Term Investments | |
| Investment Company | | $ | 51,047 | | | $ | — | | | $ | — | | | $ | 51,047 | | |
| Repurchase Agreements | | | — | | | | 7,697 | | | | — | | | | 7,697 | | |
Total Short-Term
Investments | | | 51,047 | | | | 7,697 | | | | — | | | | 58,744 | | |
Foreign Currency
Exchange Contracts | | | — | | | | 333 | | | | — | | | | 333 | | |
| Futures Contracts | | | 180 | | | | — | | | | — | | | | 180 | | |
| Total Assets | | | 328,025 | | | | 8,030 | | | | — | † | | | 336,055 | | |
| Liabilities: | |
Foreign Currency
Exchange Contracts | | | — | | | | (598 | ) | | | — | | | | (598 | ) | |
| Futures Contracts | | | (324 | ) | | | — | | | | — | | | | (324 | ) | |
| Total Liabilities | | | (324 | ) | | | (598 | ) | | | — | | | | (922 | ) | |
| Total | | $ | 327,701 | | | $ | 7,432 | | | $ | — | † | | $ | 335,133 | | |
Transfers between investment levels may occur as the markets fluctuate and/or the availability of data used in an investment's valuation changes. The Portfolio recognizes transfers between the levels as of the end of the period. As of December 31, 2011, the Portfolio did not have any significant investments transfer between investment levels.
Following is a reconciliation of investments in which significant unobservable inputs (Level 3) were used in determining fair value.
| | | Common
Stocks
(000) | |
| Beginning Balance | | $ | — | † | |
| Purchases | | | — | | |
| Sales | | | — | ‡ | |
| Amortization of discount | | | — | | |
| Transfers in | | | — | | |
| Transfers out | | | — | | |
| Change in unrealized appreciation (depreciation) | | | — | | |
| Realized gains (losses) | | | — | | |
| Ending Balance | | $ | — | † | |
Net change in unrealized appreciation/depreciation
from investments still held as of December 31, 2011 | | $ | — | | |
† Includes one or more securities which are valued at zero.
‡ Includes one or more securities with proceeds from sales of zero.
The accompanying notes are an integral part of the financial statements.
24
2011 Annual Report
December 31, 2011
Investment Overview (unaudited)
Asian Equity Portfolio
The Asian Equity Portfolio (the "Portfolio") seeks long-term capital appreciation by investing primarily in equity securities of companies in the Asia-Pacific region, excluding Japan.
Performance
For the year ended December 31, 2011, the Portfolio had a total return based on net asset value and reinvestment of distributions per share of -16.88%, net of fees, for Class I shares. The Portfolio's Class I shares outperformed against its benchmark, the MSCI All Country Asia Ex-Japan Index (the "Index"), which returned -17.31%.
Factors Affecting Performance
• Markets within the Asia ex-Japan region posted mixed returns over the 12-month reporting period, with significant variation in performance. Markets in the emerging ASEAN (Association of Southeast Asian Nations) region (Indonesia, Malaysia, the Philippines, and Thailand) all outperformed the Index with Indonesia leading the region, rising 6% over the course of the year. Most markets, however, ended the year in the red. India's market saw a sharp correction in the fourth quarter of 2011 and ended the year down 37%. Other markets such as Taiwan, China, Singapore, and Hong Kong had each fallen between 16% and 21% over this period. The MSCI All Country Asia Ex-Japan Index underperformed developed markets (represented by the MSCI EAFE Index), which fell 12.1%, but outperformed global emerging markets (represented by MSCI Emerging Markets Index), which fell 18.4%.
• During the first quarter, the earthquake and tsunami in Japan led to an initial knee-jerk sell-off across the region, but the discounts were readjusted quickly. The increased political uncertainty in the Middle East and North Africa also had a limited impact on regional markets as the contagion effect waned. In the second quarter of 2011, concerns over slowing global growth, high levels of inflation, the expiration of the U.S. Federal Reserve's second round of quantitative easing (QE2), continued debt problems in the euro zone, and Chinese local government debt continued to weigh on investor sentiment. Inflation was a threat given that demand stayed strong in Asian economies through the crisis and the slowdown in capacity expansion during the crisis has kept capacity utilization high.
• In the latter part of third quarter, global markets experienced a sharp correction and increased volatility as concerns over G7 sovereign debt and banking sector crisis intensified compounding existing fears of a global economic slowdown. Although macro data in the U.S. was marginally better towards the end of the fourth quarter, it was not sufficient to reverse negative sentiment generated from news flow in October and November, when political concerns in Europe and the failure of the U.S. congressional "super committee" to agree on deficit cuts combined with concerns over slowing global growth, hurt investor confidence.
• Inflation is no longer a threat in most Asian economies, in our view. We believe that in the absence of concern over unemployment, China's policy makers will remain extremely vigilant on inflation, which seems to have peaked in the fourth quarter of 2011. We expect inflation to move to the lower end of the 3% to 5% range which is higher than pre-crisis levels but still acceptable. On a more positive note, one of our biggest concerns is margin pressure. Recent data suggest that margin pressure has peaked in China with raw material prices no longer increasing. Additionally, valuation remains at an extreme in China. It is currently trading near 2008 crisis levels in price-to-book value and price-to-earnings ratio terms.
• Overall, asset allocation contributed to relative performance, while stock selection was a detractor.
• At the country level, the Portfolio's overweight exposure to Korea and the Philippines contributed to relative returns, as did our underweight to India and Taiwan. Cash in the Portfolio was also a contributor, as the Index fell 17.3% during the period.
• At the stock level, active positions in Korea (overweight consumer discretionary and underweight information technology) and India (underweight financials and industrials) contributed to relative performance. On the other hand, stock selection in Hong Kong (overweight real estate and underweight utilities), China (overweight consumer staples and information technology, underweight energy and telecommunications) and Singapore (overweight consumer staples) hurt performance over this period.
25
2011 Annual Report
December 31, 2011
Investment Overview (unaudited) (cont'd)
Asian Equity Portfolio
Management Strategies
• The Portfolio seeks long-term capital appreciation and integrates top-down country allocation and bottom-up stock selection. The Portfolio will invest primarily in equity securities of companies in the Asia-Pacific region, excluding Japan.
• On a relative basis, we have an overweight exposure to specialty retail, internet software services, and insurers; underweight exposure to energy, commercial banks, and metals and mining. We have maintained our overweight exposure to Korea, the Philippines, and Indonesia, and kept our relative underweight exposure to Taiwan, Malaysia, Singapore, and India.
• In terms of the long-term position of the Portfolio, we do not envisage any change to the long-term positioning with the exception of potentially moving China to an overweight position. We believe that our long-term investment themes focusing on Asian consumers, Asian global competitiveness, and alternative energy continue to be themes that could potentially outperform in the long run.
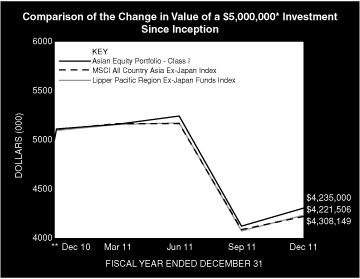
* Minimum Investment
** Commenced Operations on December 28, 2010.
In accordance with SEC regulations, Portfolio's performance shown assumes that all recurring fees (including management fees) were deducted and all dividends and distributions were reinvested. The performance of Class P, Class H, and Class L shares will vary from the Class I shares based upon it will be negatively impacted by additional fees assessed to these classes.
Performance Compared to the Morgan Stanley Capital International (MSCI) All Country Asia Ex-Japan Index(1) and the Lipper Pacific Region Ex-Japan Funds Index(2)
| | | Period Ended December 31, 2011 | |
| | | Total Returns(3) | |
| | | | | Average Annual | |
| | | One
Year | | Five
Years | | Ten
Years | | Since
Inception(5) | |
Portfolio — Class I Shares
w/o sales charges(4) | | | –16.88 | % | | | — | | | | — | | | | –15.19 | % | |
MSCI All Country
Asia Ex-Japan Index | | | –17.31 | | | | — | | | | — | | | | –15.45 | | |
Lipper Pacific Region Ex-Japan
Funds Index | | | –15.66 | | | | — | | | | — | | | | –13.73 | | |
Portfolio — Class H Shares
w/o sales charges(4) | | | –17.08 | | | | — | | | | — | | | | –15.38 | | |
Portfolio — Class H Shares
with maximum 4.75%
sales charges(4) | | | –21.03 | | | | — | | | | — | | | | –19.38 | | |
MSCI All Country
Asia Ex-Japan Index | | | –17.31 | | | | — | | | | — | | | | –15.45 | | |
Lipper Pacific Region Ex-Japan
Funds Index | | | –15.66 | | | | — | | | | — | | | | –13.73 | | |
Portfolio — Class L Shares
w/o sales charges(4) | | | –17.57 | | | | — | | | | — | | | | –15.88 | | |
MSCI All Country
Asia Ex-Japan Index | | | –17.31 | | | | — | | | | — | | | | –15.45 | | |
Lipper Pacific Region Ex-Japan
Funds Index | | | –15.66 | | | | — | | | | — | | | | –13.73 | | |
Portfolio — Class P Shares
w/o sales charges(4) | | | –17.08 | | | | — | | | | — | | | | –15.38 | | |
MSCI All Country
Asia Ex-Japan Index | | | –17.31 | | | | — | | | | — | | | | –15.45 | | |
Lipper Pacific Region Ex-Japan
Funds Index | | | –15.66 | | | | — | | | | — | | | | –13.73 | | |
Performance data quoted represents past performance, which is no guarantee of future results, and current performance may be lower or higher than the figures shown. Performance assumes that all dividends and distributions, if any, were reinvested. For the most recent month-end performance figures, please visit www.morganstanley.com/im. Investment return and principal value will fluctuate so that Portfolio shares, when redeemed, may be worth more or less than their original cost. Total returns do not reflect the deduction of taxes that a shareholder would pay on Portfolio distributions or the redemption of Portfolio shares. Performance of share classes will vary due to difference in expenses.
(1) The Morgan Stanley Capital International (MSCI) All Country Asia Ex-Japan Index is a free float-adjusted market capitalization weighted index that is designed to measure the equity market performance of Asia, excluding Japan. The performance of the Index is listed in U.S. dollars and assumes reinvestment of net dividends. The Index is unmanaged and its returns do not include any sales charges or fees. Such costs would lower performance. It is not possible to invest directly in an index.
(2) The Lipper Pacific Region Ex-Japan Funds Index is an equally weighted performance index of the largest qualifying funds (based on net assets) in the Lipper Pacific Region Ex-Japan Funds classification. The Index, which is adjusted for capital gains distributions and income dividends, is unmanaged and should not be considered an investment. There are currently 10 funds represented in
26
2011 Annual Report
December 31, 2011
Investment Overview (unaudited) (cont'd)
Asian Equity Portfolio
this Index. As of the date of this report, the Portfolio was in the Lipper Pacific Region Ex-Japan Funds classification.
(3) Total returns for the Portfolio reflect fees waived and expenses reimbursed, if applicable, by the Adviser. Without such waivers and reimbursements, total returns would have been lower. The fee waivers and/or expense reimbursements will continue for one year or until such time as the Board of Directors acts to discontinue all or a portion of such waivers and/or expense reimbursements when it deems that such action is appropriate.
(4) Commenced operations on December 28, 2010.
(5) For comparative purposes, average annual since inception returns listed for the Indexes refer to the inception date or initial offering of the respective share class of the Portfolio, not the inception of the Index.
Portfolio Composition
| Classification | | Percentage of
Total Investments | |
| Other* | | | 34.0 | % | |
| Short-Term Investments | | | 11.5 | | |
| Commercial Banks | | | 9.2 | | |
| Semiconductors & Semiconductor Equipment | | | 7.8 | | |
| Insurance | | | 7.2 | | |
| Real Estate Management & Development | | | 6.5 | | |
| Specialty Retail | | | 6.2 | | |
| Automobiles | | | 6.1 | | |
| Food Products | | | 6.0 | | |
| Internet Software & Services | | | 5.5 | | |
| Total Investments | | | 100.0 | % | |
* Industries representing less than 5% of total investments.
27
2011 Annual Report
December 31, 2011
Portfolio of Investments
Asian Equity Portfolio
| | | Shares | | Value
(000) | |
| Common Stocks (92.7%) | |
| China (28.3%) | |
| AIA Group Ltd. (a) | | | 5,400 | | | $ | 17 | | |
| Baidu, Inc. ADR (b) | | | 100 | | | | 12 | | |
| Belle International Holdings Ltd. (a) | | | 31,000 | | | | 54 | | |
| China Construction Bank Corp. H Shares (a) | | | 47,000 | | | | 33 | | |
| China Life Insurance Co., Ltd. H Shares (a) | | | 6,000 | | | | 15 | | |
| China Mengniu Dairy Co., Ltd. (a) | | | 11,000 | | | | 26 | | |
| China Pacific Insurance Group Co., Ltd. H Shares (a) | | | 11,800 | | | | 33 | | |
| China Resources Enterprise Ltd. (a) | | | 2,000 | | | | 7 | | |
| China Telecom Corp., Ltd. H Shares (a) | | | 14,000 | | | | 8 | | |
| Chow Tai Fook Jewellery Group Ltd. (a)(b)(c) | | | 23,000 | | | | 41 | | |
| GCL Poly Energy Holdings Ltd. (a) | | | 24,000 | | | | 7 | | |
| Hengan International Group Co., Ltd. (a) | | | 500 | | | | 5 | | |
| Ping An Insurance Group Co. H Shares (a) | | | 4,000 | | | | 26 | | |
Shanghai Pharmaceuticals Holding Co., Ltd.
H Shares (a)(b) | | | 4,000 | | | | 6 | | |
| Tencent Holdings Ltd. (a) | | | 3,600 | | | | 72 | | |
| Trinity Ltd. (a) | | | 26,000 | | | | 19 | | |
| Want Want China Holdings Ltd. (a) | | | 30,000 | | | | 30 | | |
| | | | 411 | | |
| Hong Kong (4.6%) | |
| BOC Hong Kong Holdings Ltd. | | | 5,000 | | | | 12 | | |
| Cathay Pacific Airways Ltd. | | | 4,000 | | | | 7 | | |
| Kerry Properties Ltd. | | | 5,500 | | | | 18 | | |
| Samsonite International SA (b) | | | 3,900 | | | | 6 | | |
| Wharf Holdings Ltd. | | | 5,400 | | | | 25 | | |
| | | | 68 | | |
| India (5.4%) | |
| HDFC Bank Ltd. ADR | | | 1,000 | | | | 26 | | |
| ITC Ltd. GDR | | | 7,383 | | | | 28 | | |
| Mahindra & Mahindra Ltd. GDR | | | 1,890 | | | | 25 | | |
| | | | 79 | | |
| Indonesia (6.5%) | |
| Delta Dunia Makmur Tbk PT (b) | | | 54,000 | | | | 4 | | |
| Kalbe Farma Tbk PT | | | 126,000 | | | | 47 | | |
| Lippo Karawaci Tbk PT | | | 588,000 | | | | 43 | | |
| | | | 94 | | |
| Korea, Republic of (25.7%) | |
| GS Retail Co., Ltd. | | | 130 | | | | 3 | | |
| Hynix Semiconductor, Inc. (b) | | | 550 | | | | 10 | | |
| Hyundai Engineering & Construction Co., Ltd. (b) | | | 320 | | | | 20 | | |
| Hyundai Heavy Industries Co., Ltd. | | | 73 | | | | 16 | | |
| Hyundai Mobis (b) | | | 7 | | | | 2 | | |
| Hyundai Motor Co. | | | 366 | | | | 68 | | |
| KB Financial Group, Inc. | | | 708 | | | | 22 | | |
| Korea Aerospace Industries Ltd. | | | 110 | | | | 4 | | |
| Korea Kumho Petrochemical (b) | | | 55 | | | | 8 | | |
| Korean Air Lines Co., Ltd. (b) | | | 105 | | | | 4 | | |
| LG Chem Ltd. | | | 97 | | | | 27 | | |
| Mando Corp. | | | 21 | | | | 4 | | |
| | | Shares | | Value
(000) | |
| NCSoft Corp. | | | 33 | | | $ | 9 | | |
| Nexon Co., Ltd. (b) | | | 900 | | | | 13 | | |
| Samsung Electronics Co., Ltd. | | | 104 | | | | 96 | | |
| Samsung Fire & Marine Insurance Co., Ltd. | | | 101 | | | | 19 | | |
| Shinhan Financial Group Co., Ltd. | | | 909 | | | | 31 | | |
| Woongjin Coway Co., Ltd. | | | 500 | | | | 16 | | |
| YG Entertainment, Inc. (b) | | | 21 | | | | 1 | | |
| | | | 373 | | |
| Malaysia (4.9%) | |
| Axiata Group Bhd | | | 11,500 | | | | 19 | | |
| CIMB Group Holdings Bhd | | | 6,700 | | | | 16 | | |
| IJM Corp. Bhd | | | 4,300 | | | | 8 | | |
| Sime Darby Bhd | | | 2,800 | | | | 8 | | |
| Top Glove Corp. Bhd | | | 4,800 | | | | 7 | | |
| UEM Land Holdings Bhd (b) | | | 17,700 | | | | 13 | | |
| | | | 71 | | |
| Philippines (3.8%) | |
| Cebu Air, Inc. | | | 7,240 | | | | 11 | | |
| Puregold Price Club, Inc. (b) | | | 14,400 | | | | 6 | | |
| SM Investments Corp. | | | 2,920 | | | | 39 | | |
| | | | 56 | | |
| Singapore (1.6%) | |
| Olam International Ltd. | | | 14,636 | | | | 24 | | |
| Taiwan (9.6%) | |
| Asustek Computer, Inc. | | | 4,880 | | | | 35 | | |
| Catcher Technology Co., Ltd. | | | 1,000 | | | | 5 | | |
| Foxconn Technology Co. Ltd. | | | 1,000 | | | | 3 | | |
| Hon Hai Precision Industry Co., Ltd. | | | 11,000 | | | | 30 | | |
| Lung Yen Life Service Corp. | | | 2,000 | | | | 6 | | |
| MStar Semiconductor, Inc. | | | 1,000 | | | | 5 | | |
| Uni-President Enterprises Corp. | | | 24,380 | | | | 36 | | |
| Yuanta Financial Holding Co., Ltd. (b) | | | 38,302 | | | | 19 | | |
| | | | 139 | | |
| Thailand (2.3%) | |
| PTT PCL (Foreign) | | | 3,300 | | | | 33 | | |
| Total Common Stocks (Cost $1,507) | | | 1,348 | | |
| Short-Term Investment (12.1%) | |
| Investment Company (12.1%) | |
Morgan Stanley Institutional Liquidity
Funds — Money Market Portfolio —
Institutional Class (See Note G-2) (Cost $175) | | | 175,281 | | | | 175 | | |
| Total Investments (104.8%) (Cost $1,682) | | | 1,523 | | |
| Liabilities in Excess of Other Assets (-4.8%) | | | (70 | ) | |
| Net Assets (100.0%) | | $ | 1,453 | | |
(a) Security trades on the Hong Kong exchange.
(b) Non-income producing security.
(c) 144A security — Certain conditions for public sale may exist. Unless otherwise noted, these securities are deemed to be liquid.
ADR American Depositary Receipt.
GDR Global Depositary Receipt.
The accompanying notes are an integral part of the financial statements.
28
2011 Annual Report
December 31, 2011
Portfolio of Investments (cont'd)
Asian Equity Portfolio
Fair Value Measurement Information:
The following is a summary of the inputs used to value the Portfolio's investments as of December 31, 2011. (See Note A-9 to the financial statements for further information regarding fair value measurement.)
| Investment Type | | Level 1
Unadjusted
quoted
prices
(000) | | Level 2
Other
significant
observable
inputs
(000) | | Level 3
Significant
unobservable
inputs
(000) | | Total
(000) | |
| Assets: | | | | | | | | | |
| Common Stocks | | | | | | | | | |
| Aerospace & Defense | | $ | 4 | | | $ | — | | | $ | — | | | $ | 4 | | |
| Airlines | | | 22 | | | | — | | | | — | | | | 22 | | |
| Auto Components | | | 6 | | | | — | | | | — | | | | 6 | | |
| Automobiles | | | 93 | | | | — | | | | — | | | | 93 | | |
| Capital Markets | | | 19 | | | | — | | | | — | | | | 19 | | |
| Chemicals | | | 35 | | | | — | | | | — | | | | 35 | | |
| Commercial Banks | | | 140 | | | | — | | | | — | | | | 140 | | |
| Computers & Peripherals | | | 43 | | | | — | | | | — | | | | 43 | | |
| Construction & Engineering | | | 34 | | | | — | | | | — | | | | 34 | | |
| Distributors | | | 3 | | | | — | | | | — | | | | 3 | | |
Diversified
Telecommunication
Services | | | 8 | | | | — | | | | — | | | | 8 | | |
Electronic Equipment,
Instruments &
Components | | | 30 | | | | — | | | | — | | | | 30 | | |
| Food & Staples Retailing | | | 37 | | | | — | | | | — | | | | 37 | | |
| Food Products | | | 92 | | | | — | | | | — | | | | 92 | | |
Health Care Equipment &
Supplies | | | 7 | | | | — | | | | — | | | | 7 | | |
Health Care Providers &
Services | | | 6 | | | | — | | | | — | | | | 6 | | |
| Household Durables | | | 16 | | | | — | | | | — | | | | 16 | | |
| Industrial Conglomerates | | | 47 | | | | — | | | | — | | | | 47 | | |
| Insurance | | | 110 | | | | — | | | | — | | | | 110 | | |
Internet Software &
Services | | | 84 | | | | — | | | | — | | | | 84 | | |
| Machinery | | | 16 | | | | — | | | | — | | | | 16 | | |
| Media | | | 1 | | | | — | | | | — | | | | 1 | | |
Oil, Gas & Consumable
Fuels | | | 37 | | | | — | | | | — | | | | 37 | | |
| Personal Products | | | 5 | | | | — | | | | — | | | | 5 | | |
| Pharmaceuticals | | | 47 | | | | — | | | | — | | | | 47 | | |
Real Estate Management &
Development | | | 99 | | | | — | | | | — | | | | 99 | | |
Semiconductors &
Semiconductor
Equipment | | | 118 | | | | — | | | | — | | | | 118 | | |
| Software | | | 22 | | | | — | | | | — | | | | 22 | | |
| Specialty Retail | | | 95 | | | | — | | | | — | | | | 95 | | |
Textiles, Apparel &
Luxury Goods | | | 25 | | | | — | | | | — | | | | 25 | | |
| Tobacco | | | 28 | | | | — | | | | — | | | | 28 | | |
| Investment Type | | Level 1
Unadjusted
quoted
prices
(000) | | Level 2
Other
significant
observable
inputs
(000) | | Level 3
Significant
unobservable
inputs
(000) | | Total
(000) | |
Wireless
Telecommunication
Services | | $ | 19 | | | $ | — | | | $ | — | | | $ | 19 | | |
| Total Common Stocks | | | 1,348 | | | | — | | | | — | | | | 1,348 | | |
| Short-Term Investment — | |
| Investment Company | | | 175 | | | | — | | | | — | | | | 175 | | |
| Total Assets | | $ | 1,523 | | | $ | — | | | $ | — | | | $ | 1,523 | | |
Transfers between investment levels may occur as the markets fluctuate and/or the availability of data used in an investment's valuation changes. The Portfolio recognizes transfers between the levels as of the end of the period. As of December 31, 2011, the Portfolio did not have any significant investments transfer between investment levels.
The accompanying notes are an integral part of the financial statements.
29
2011 Annual Report
December 31, 2011
Investment Overview (unaudited)
Emerging Markets Portfolio
The Emerging Markets Portfolio (the "Portfolio") seeks long-term capital appreciation by investing primarily in growth-oriented equity securities of issuers in emerging market countries.
Performance
For the year ended December 31, 2011, the Portfolio had a total return based on net asset value and reinvestment of distributions per share of -18.41%, net of fees, for Class I shares. The Portfolio's Class I shares performed in line with its benchmark, the MSCI Emerging Markets Net Index (the "Index"), which returned -18.42%.
Factors Affecting Performance
• Emerging market equities (as measured by the Index) declined 18.4% in 2011 owing to a combination of factors, including downward revisions to growth in both the developed and emerging economies, as well as acknowledgement of the large structural problems in the developed economies. Emerging market equities' poor performance was also consistent with the historic pattern of equities underperforming during the third year of secular bear markets.
• Emerging markets underperformed developed markets, as measured by the MSCI World Index, during the period. In Asia (-17.4%), Indonesia was the only largely positive performing market (6.0%) with Malaysia (+0.1%) and the Philippines (-0.9%) relatively flat. Indonesia and Philippines were some of our largest overweights this year. The worst-performing Asian market by far was India (-37.2%). Taiwan (-20.9%) and China (-18.4%) were also laggards, and both were underweights in the Portfolio. In Latin America (-19.4%), Colombia (-5.0%) was the relative best performer, followed by Mexico (-12.1%). Brazil (-21.9%) was the region's worst-performing market, and was an underweight position for us. In Emerging Europe, Middle East and Africa (EMEA) (-20.4%), the Czech Republic was the region's best performer by far, with a single-digit negative return (-6.0%), and it was one of our overweights for the year. Egypt (-46.9%) and Turkey (-14.4%), both of which were slight overweights during the year, were the worst-performing EMEA markets.
• The Portfolio's relative gains were driven by stock selection in Brazil, Korea, and Turkey, and overweight allocations to the Philippines and Indonesia.
• Positive contributions were primarily offset by stock selection in China, an overweight allocation to Egypt, and stock selection in and an allocation to Mexico, all of which detracted from relative returns.
Management Strategies
• With accommodative fiscal and monetary policies reaching their limits in the developed world, we believe that economic cycles — in developed and emerging economies alike — are likely to gradually become shorter and remain volatile. In addition, the high prices of energy and other commodities have continued to negatively impact demand. Until commodities prices correct — or at least remain sideways — equity markets will have difficulty recovering in a sustained manner.
• In addition, China's unique role as a driver of commodities prices remains vulnerable. The country has reached a mature level in its development and the rest of the world — both emerging and developed — is not capable of compensating for China's astounding share of commodities demand.
• In December, as throughout most of 2011, we remained focused on seeking sources of stable, somewhat defensive growth in the Portfolio. Emerging markets have not decoupled from the U.S. and are increasingly integrated with it and other developed countries due to globalization, trade and capital flows. We have been overweight the countries and companies in those sectors we assessed to be relatively most stable and least cyclical, as well as those countries with fairly resilient domestic demand and whose current account balances should benefit from an eventually declining cost of their energy import bills. We were overweight Indonesia, the Philippines, the Czech Republic, Turkey and Thailand.
• Among the criteria contributing to our overweight allocations is an assessment of which countries have undervalued currencies. The run-up in commodities over the last decade has led many emerging market currencies (primarily the heavy commodities exporters) to become less competitive. In recent months, there has been a notable change since the
30
2011 Annual Report
December 31, 2011
Investment Overview (unaudited) (cont'd)
Emerging Markets Portfolio
global financial crisis began in 2008: dispersion between different emerging markets — that is, differentials among equity market performance — has begun to show signs of rising off its all-time lows. We continue to believe dispersion should gradually continue to rise as investors begin to distinguish the wide range of fundamentals among individual countries.
• In addition to these country allocations, the Portfolio overall was overweight companies that we believe are capable of delivering relatively stable earnings despite domestic inflation and sluggish import demand in developed markets. We favored select stocks in the telecommunications sector and had an underweight to financial companies — we took both positions beginning in late 2010. We maintained our underweight to materials as additional disappointing macro data from China will likely put margin pressure on many materials producers globally. The Portfolio remains overweight consumer-related companies that, in our view, have quality management, strong balance sheets, and the ability to continue generating significant free cash flow.
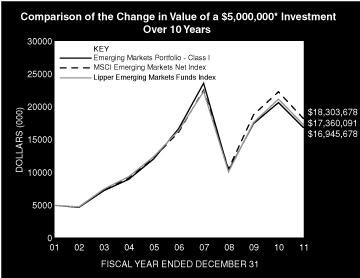
* Minimum Investment
In accordance with SEC regulations, Portfolio's performance shown assumes that all recurring fees (including management fees) were deducted and all dividends and distributions were reinvested. The performance of Class P shares will vary from the Class I shares based upon its different inception date and will be negatively impacted by additional fees assessed to that class.
Performance Compared to the Morgan Stanley Capital International (MSCI) Emerging Markets Net Index(1) and the Lipper Emerging Markets Funds Index(2)
| | | Period Ended December 31, 2011 | |
| | | Total Returns(3) | |
| | | | | Average Annual | |
| | | One
Year | | Five
Years | | Ten
Years | | Since
Inception(6) | |
Portfolio — Class I Shares
w/o sales charges(4) | | | –18.41 | % | | | 0.23 | % | | | 12.98 | % | | | 8.70 | % | |
MSCI Emerging Markets
Net Index | | | –18.42 | | | | 2.40 | | | | 13.86 | | | | 8.46 | | |
Lipper Emerging Markets
Funds Index | | | –18.37 | | | | 1.04 | | | | 13.26 | | | | N/A | | |
Portfolio — Class P Shares
w/o sales charges(5) | | | –18.63 | | | | –0.02 | | | | 12.69 | | | | 7.48 | | |
MSCI Emerging Markets
Net Index | | | –18.42 | | | | 2.40 | | | | 13.86 | | | | 6.79 | | |
Lipper Emerging Markets
Funds Index | | | –18.37 | | | | 1.04 | | | | 13.26 | | | | 6.29 | | |
Performance data quoted represents past performance, which is no guarantee of future results, and current performance may be lower or higher than the figures shown. Performance assumes that all dividends and distributions, if any, were reinvested. For the most recent month-end performance figures, please visit www.morganstanley.com/im. Investment return and principal value will fluctuate so that Portfolio shares, when redeemed, may be worth more or less than their original cost. Total returns do not reflect the deduction of taxes that a shareholder would pay on Portfolio distributions or the redemption of Portfolio shares. Performance of share classes will vary due to difference in expenses.
31
2011 Annual Report
December 31, 2011
Investment Overview (unaudited) (cont'd)
Emerging Markets Portfolio
(1) The Morgan Stanley Capital International (MSCI) Emerging Markets Net Index is a free float-adjusted market capitalization weighted index that is designed to measure equity market performance of emerging markets. The term "free float" represents the portion of shares outstanding that are deemed to be available for purchase in the public equity markets by investors. The MSCI Emerging Markets Net Index currently consists of 21 emerging market country indices. The performance of the Index is listed in U.S. dollars and assumes reinvestment of net dividends. The Index is unmanaged and its returns do not include any sales charges or fees. Such costs would lower performance. It is not possible to invest directly in an index.
(2) The Lipper Emerging Markets Funds Index is an equally weighted performance index of the largest qualifying funds (based on net assets) in the Lipper Emerging Markets Funds classification. The Index, which is adjusted for capital gains distributions and income dividends, is unmanaged and should not be considered an investment. There are currently 30 funds represented in this Index. As of the date of this report, the Portfolio is in the Lipper Emerging Markets Funds classification.
(3) Total returns for the Portfolio reflect fees waived and expenses reimbursed, if applicable, by the Adviser. Without such waivers and reimbursements, total returns would have been lower. The fee waivers and/or expense reimbursements will continue for one year or until such time as the Fund's Board of Directors acts to discontinue all or a portion of such waivers and/or expense reimbursements when it deems that such action is appropriate.
(4) Commenced operations on September 25, 1992.
(5) Commenced offering on January 2, 1996.
(6) For comparative purposes, average annual since inception returns listed for the Indexes refer to the inception date or initial offering of the respective share class of the Portfolio, not the inception of the Index.
Portfolio Composition*
| Classification | | Percentage of
Total Investments | |
| Other** | | | 57.2 | % | |
| Commercial Banks | | | 12.9 | | |
| Oil, Gas & Consumable Fuels | | | 8.0 | | |
| Beverages | | | 5.8 | | |
| Short-Term Investments | | | 5.4 | | |
| Food Products | | | 5.4 | | |
| Semiconductors & Semiconductor Equipment | | | 5.3 | | |
| Total Investments | | | 100.0 | % | |
* Percentages indicated are based upon total investments (excluding Securities held as Collateral on Loaned Securities) as of December 31, 2011.
** Industries representing less than 5% of total investments.
32
2011 Annual Report
December 31, 2011
Portfolio of Investments
Emerging Markets Portfolio
| | | Shares | | Value
(000) | |
| Common Stocks (97.9%) | |
| Argentina (0.2%) | |
| Banco Macro SA ADR120,750 | | $ | 2,355 | | |
| Brazil (10.3%) | |
| Banco do Brasil SA | | | 195,600 | | | | 2,485 | | |
| BRF - Brasil Foods SA | | | 899,652 | | | | 17,566 | | |
Cia de Bebidas das Americas
(Preference) ADR (a) | | | 524,400 | | | | 18,926 | | |
| Cielo SA | | | 285,300 | | | | 7,372 | | |
| Itau Unibanco Holding SA (Preference) | | | 222,500 | | | | 4,055 | | |
| Itau Unibanco Holding SA (Preference) ADR (a) | | | 775,974 | | | | 14,402 | | |
| MRV Engenharia e Participacoes SA | | | 556,800 | | | | 3,194 | | |
PDG Realty SA Empreendimentos e
Participacoes | | | 1,657,800 | | | | 5,244 | | |
| Petroleo Brasileiro SA (Preference) | | | 780,972 | | | | 8,998 | | |
| Petroleo Brasileiro SA ADR | | | 401,600 | | | | 9,980 | | |
| Petroleo Brasileiro SA Sponsored ADR (a) | | | 112,924 | | | | 2,653 | | |
| Telefonica Brasil SA ADR (a) | | | 339,300 | | | | 9,273 | | |
| Ultrapar Participacoes SA | | | 410,400 | | | | 7,043 | | |
| Vale SA (Preference) | | | 150,084 | | | | 3,043 | | |
| Vale SA (Preference) ADR (a) | | | 495,675 | | | | 10,211 | | |
| Vale SA ADR (a) | | | 162,400 | | | | 3,483 | | |
| | | | 127,928 | | |
| Chile (2.6%) | |
| Banco Santander Chile ADR | | | 83,400 | | | | 6,313 | | |
| Cencosud SA | | | 1,157,802 | | | | 6,664 | | |
| Empresa Nacional de Electricidad SA | | | 3,413,959 | | | | 5,027 | | |
| Empresa Nacional de Electricidad SA ADR | | | 6,600 | | | | 293 | | |
| Enersis SA | | | 383,166 | | | | 135 | | |
| Enersis SA ADR | | | 404,800 | | | | 7,137 | | |
| SACI Falabella | | | 898,925 | | | | 6,991 | | |
| | | | 32,560 | | |
| China (11.5%) | |
| Baidu, Inc. ADR (a)(b) | | | 69,300 | | | | 8,071 | | |
| Belle International Holdings Ltd. (c) | | | 5,088,000 | | | | 8,870 | | |
| China Construction Bank Corp. H Shares (a)(c) | | | 21,387,250 | | | | 14,925 | | |
| China Life Insurance Co., Ltd. H Shares (c) | | | 1,897,000 | | | | 4,690 | | |
| China Mengniu Dairy Co., Ltd. (c) | | | 2,956,000 | | | | 6,912 | | |
China Minsheng Banking Corp., Ltd.
H Shares (a)(c) | | | 3,532,500 | | | | 3,061 | | |
China Pacific Insurance Group Co., Ltd.
H Shares (a)(c) | | | 3,527,600 | | | | 10,038 | | |
| China Resources Enterprise Ltd. (c) | | | 514,000 | | | | 1,764 | | |
| China Resources Power Holdings Co., Ltd. (c) | | | 6,025,900 | | | | 11,623 | | |
| China Telecom Corp., Ltd. H Shares (c) | | | 16,670,000 | | | | 9,487 | | |
China ZhengTong Auto Services
Holdings Ltd. (a)(b)(c) | | | 4,147,000 | | | | 4,069 | | |
| Chow Tai Fook Jewellery Group Ltd. (b)(c)(d) | | | 3,246,800 | | | | 5,819 | | |
| GCL Poly Energy Holdings Ltd. (a)(c) | | | 14,199,000 | | | | 3,967 | | |
| Hengan International Group Co., Ltd. (a)(c) | | | 984,500 | | | | 9,209 | | |
| Ping An Insurance Group Co. H Shares (c) | | | 1,109,500 | | | | 7,314 | | |
Shanghai Pharmaceuticals
Holding Co., Ltd. H Shares (b)(c) | | | 2,175,700 | | | | 3,524 | | |
| | | Shares | | Value
(000) | |
| Tencent Holdings Ltd. (a)(c) | | | 754,000 | | | $ | 15,155 | | |
| Want Want China Holdings Ltd. (a)(c) | | | 7,383,000 | | | | 7,367 | | |
| Yanzhou Coal Mining Co., Ltd. H Shares (a)(c) | | | 3,350,000 | | | | 7,151 | | |
| | | | 143,016 | | |
| Czech Republic (1.3%) | |
| CEZ AS | | | 291,200 | | | | 11,585 | | |
| Telefonica Czech Republic AS | | | 260,500 | | | | 5,052 | | |
| | | | 16,637 | | |
| Egypt (1.1%) | |
| Commercial International Bank Egypt SAE | | | 1,732,351 | | | | 5,371 | | |
| Juhayna Food Industries (b) | | | 4,060,197 | | | | 2,626 | | |
| Telecom Egypt Co. | | | 2,471,552 | | | | 5,414 | | |
| | | | 13,411 | | |
| Hong Kong (0.6%) | |
| Samsonite International SA (b) | | | 4,844,100 | | | | 7,597 | | |
| Hungary (0.8%) | |
| Richter Gedeon Nyrt | | | 66,220 | | | | 9,301 | | |
| India (6.1%) | |
| Asian Paints Ltd. | | | 87,322 | | | | 4,263 | | |
| Dr. Reddy's Laboratories Ltd. | | | 239,072 | | | | 7,104 | | |
| GAIL India Ltd. | | | 436,670 | | | | 3,155 | | |
| Glenmark Pharmaceuticals Ltd. | | | 948,960 | | | | 5,245 | | |
| HDFC Bank Ltd. | | | 1,272,817 | | | | 10,231 | | |
| IndusInd Bank Ltd. | | | 1,028,214 | | | | 4,517 | | |
| ITC Ltd. | | | 2,334,109 | | | | 8,848 | | |
| Jindal Steel & Power Ltd. | | | 434,610 | | | | 3,708 | | |
| Larsen & Toubro Ltd. | | | 194,282 | | | | 3,639 | | |
| Mahindra & Mahindra Ltd. | | | 435,493 | | | | 5,591 | | |
| Reliance Industries Ltd. | | | 244,461 | | | | 3,190 | | |
| Tata Consultancy Services Ltd. | | | 508,763 | | | | 11,119 | | |
| Tata Steel Ltd. | | | 835,970 | | | | 5,279 | | |
| | | | 75,889 | | |
| Indonesia (5.9%) | |
| Astra International Tbk PT | | | 1,632,000 | | | | 13,319 | | |
| Bank Central Asia Tbk PT | | | 11,410,000 | | | | 10,067 | | |
| Bank Mandiri Tbk PT | | | 12,348,000 | | | | 9,192 | | |
| Indofood Sukses Makmur Tbk PT | | | 12,733,500 | | | | 6,460 | | |
| Indosat Tbk PT | | | 13,329,500 | | | | 8,306 | | |
| Kalbe Farma Tbk PT | | | 12,479,000 | | | | 4,679 | | |
| Lippo Karawaci Tbk PT | | | 136,938,000 | | | | 9,967 | | |
| Telekomunikasi Indonesia Tbk PT | | | 15,075,500 | | | | 11,721 | | |
| | | | 73,711 | | |
| Korea, Republic of (16.7%) | |
| Cheil Industries, Inc. | | | 72,278 | | | | 6,373 | | |
| Cheil Worldwide, Inc. | | | 192,495 | | | | 3,179 | | |
Doosan Heavy Industries and
Construction Co., Ltd. | | | 88,600 | | | | 5,034 | | |
| Hyundai Engineering & Construction Co., Ltd. (b) | | | 130,031 | | | | 8,000 | | |
| Hyundai Heavy Industries Co., Ltd. | | | 21,423 | | | | 4,825 | | |
| Hyundai Mobis (b) | | | 36,183 | | | | 9,219 | | |
| Hyundai Motor Co. | | | 104,166 | | | | 19,359 | | |
| Hyundai Steel Co. (b) | | | 79,791 | | | | 6,678 | | |
The accompanying notes are an integral part of the financial statements.
33
2011 Annual Report
December 31, 2011
Portfolio of Investments (cont'd)
Emerging Markets Portfolio
| | | Shares | | Value
(000) | |
| Korea, Republic of (cont'd) | |
| KB Financial Group, Inc. | | | 211,337 | | | $ | 6,708 | | |
| Korea Aerospace Industries Ltd. | | | 212,200 | | | | 7,314 | | |
| Korea Kumho Petrochemical (b) | | | 31,254 | | | | 4,582 | | |
| Korean Air Lines Co., Ltd. (b) | | | 152,009 | | | | 5,776 | | |
| LG Chem Ltd. | | | 40,386 | | | | 11,215 | | |
| LG Household & Health Care Ltd. | | | 8,228 | | | | 3,482 | | |
| Mando Corp. | | | 35,189 | | | | 6,323 | | |
| NCSoft Corp. | | | 24,488 | | | | 6,557 | | |
| Nexon Co., Ltd. (a)(b) | | | 427,800 | | | | 6,153 | | |
| NHN Corp. | | | 31,021 | | | | 5,691 | | |
| Samsung Electronics Co., Ltd. | | | 42,236 | | | | 38,870 | | |
| Samsung Electronics Co., Ltd. (Preference) | | | 14,554 | | | | 8,456 | | |
| Samsung Fire & Marine Insurance Co., Ltd. | | | 37,204 | | | | 6,835 | | |
| Samsung Heavy Industries Co., Ltd. | | | 124,710 | | | | 3,051 | | |
| Shinhan Financial Group Co., Ltd. | | | 278,952 | | | | 9,684 | | |
| SK C&C Co., Ltd. | | | 31,928 | | | | 3,249 | | |
| SK Innovation Co., Ltd. | | | 32,520 | | | | 4,037 | | |
| SSCP Co., Ltd. (b) | | | 254,760 | | | | 976 | | |
| Woongjin Coway Co., Ltd. | | | 214,792 | | | | 6,840 | | |
| | | | 208,466 | | |
| Lebanon (0.7%) | |
| Banque Audi sal-Audi Saradar Group GDR | | | 728,865 | | | | 4,519 | | |
| BLOM Bank SAL GDR | | | 588,210 | | | | 4,300 | | |
| | | | 8,819 | | |
| Malaysia (3.2%) | |
| AirAsia Bhd | | | 5,405,300 | | | | 6,428 | | |
| Axiata Group Bhd | | | 10,727,600 | | | | 17,394 | | |
| CIMB Group Holdings Bhd | | | 3,382,900 | | | | 7,940 | | |
| Sime Darby Bhd | | | 2,645,200 | | | | 7,677 | | |
| | | | 39,439 | | |
| Mexico (3.5%) | |
| America Movil SAB de CV, Class L ADR | | | 445,588 | | | | 10,070 | | |
Fomento Economico Mexicano SAB de CV
(Units) ADR (e) | | | 252,700 | | | | 17,616 | | |
| Grupo Televisa SAB ADR (a) | | | 314,600 | | | | 6,625 | | |
| Mexichem SAB de CV | | | 1,163,700 | | | | 3,644 | | |
| Wal-Mart de Mexico SAB de CV Series V | | | 1,985,200 | | | | 5,449 | | |
| | | | 43,404 | | |
| Peru (1.6%) | |
| Cia de Minas Buenaventura SA ADR | | | 237,490 | | | | 9,105 | | |
| Credicorp Ltd. | | | 95,815 | | | | 10,489 | | |
| | | | 19,594 | | |
| Philippines (4.3%) | |
| Ayala Corp. | | | 1,103,772 | | | | 7,846 | | |
| Metro Pacific Investments Corp. | | | 135,962,000 | | | | 11,378 | | |
| Metropolitan Bank & Trust | | | 8,065,121 | | | | 12,558 | | |
| Philippine Long Distance Telephone Co. | | | 194,580 | | | | 11,325 | | |
| SM Investments Corp. | | | 792,220 | | | | 10,576 | | |
| | | | 53,683 | | |
| | | Shares | | Value
(000) | |
| Poland (2.5%) | |
| Central European Distribution Corp. (a)(b) | | | 444,485 | | | $ | 1,944 | | |
| Jeronimo Martins SGPS SA (b) | | | 958,030 | | | | 15,859 | | |
| Telekomunikacja Polska SA | | | 2,631,633 | | | | 13,140 | | |
| | | | 30,943 | | |
| Qatar (0.5%) | |
| Industries Qatar QSC | | | 185,600 | | | | 6,779 | | |
| Russia (3.6%) | |
| Eurasia Drilling Co., Ltd. GDR | | | 181,591 | | | | 4,267 | | |
| Lukoil OAO ADR | | | 421,756 | | | | 22,332 | | |
| Protek (b) | | | 1,573,558 | | | | 884 | | |
| Rosneft Oil Co. (Registered GDR) | | | 1,776,275 | | | | 11,723 | | |
| Tatneft ADR | | | 179,500 | | | | 5,313 | | |
| | | | 44,519 | | |
| South Africa (5.3%) | |
| AVI Ltd. | | | 1,795,870 | | | | 8,837 | | |
| Clicks Group Ltd. | | | 1,532,103 | | | | 8,774 | | |
| Naspers Ltd., Class N (a) | | | 411,517 | | | | 18,005 | | |
| Pick n Pay Stores Ltd. (a) | | | 1,390,518 | | | | 8,027 | | |
| SABMiller PLC (a) | | | 461,282 | | | | 16,176 | | |
| Sasol Ltd. | | | 135,300 | | | | 6,461 | | |
| | | | 66,280 | | |
| Switzerland (0.5%) | |
| Swatch Group AG (The) | | | 15,933 | | | | 5,962 | | |
| Taiwan (6.1%) | |
| Asustek Computer, Inc. | | | 916,536 | | | | 6,523 | | |
| Catcher Technology Co., Ltd. | | | 666,000 | | | | 3,090 | | |
| China Steel Corp. | | | 99,921 | | | | 95 | | |
| Formosa Plastics Corp. | | | 1,801,000 | | | | 4,806 | | |
| Foxconn Technology Co. Ltd. | | | 8,000 | | | | 26 | | |
| Fubon Financial Holding Co., Ltd. | | | 4,360,795 | | | | 4,616 | | |
| Hon Hai Precision Industry Co., Ltd. | | | 4,472,911 | | | | 12,246 | | |
| HTC Corp. | | | 307,954 | | | | 5,055 | | |
| Largan Precision Co., Ltd. | | | 145,000 | | | | 2,710 | | |
| Lung Yen Life Service Corp. | | | 882,000 | | | | 2,590 | | |
| MStar Semiconductor, Inc. | | | 631,000 | | | | 3,293 | | |
| Taiwan Cement Corp. | | | 3,953,000 | | | | 4,569 | | |
| Taiwan Semiconductor Manufacturing Co., Ltd. | | | 5,632,205 | | | | 14,099 | | |
| Uni-President Enterprises Corp. | | | 5,877,730 | | | | 8,590 | | |
| Yuanta Financial Holding Co., Ltd. (b) | | | 6,278,000 | | | | 3,203 | | |
| | | | 75,511 | | |
| Thailand (3.8%) | |
| Banpu PCL NVDR | | | 451,000 | | | | 7,805 | | |
| Kasikornbank PCL (Foreign) | | | 423,500 | | | | 1,671 | | |
| Kasikornbank PCL NVDR | | | 2,409,900 | | | | 9,319 | | |
| Land and Houses PCL NVDR | | | 45,619,000 | | | | 8,892 | | |
| PTT PCL (Foreign) | | | 767,900 | | | | 7,740 | | |
| Siam Cement PCL NVDR | | | 795,900 | | | | 7,896 | | |
| Thai Airways International PCL | | | 6,977,600 | | | | 4,423 | | |
| | | | 47,746 | | |
The accompanying notes are an integral part of the financial statements.
34
2011 Annual Report
December 31, 2011
Portfolio of Investments (cont'd)
Emerging Markets Portfolio
| | | Shares | | Value
(000) | |
| Turkey (3.3%) | |
| Anadolu Efes Biracilik Ve Malt Sanayii AS | | | 1,275,909 | | | $ | 15,361 | | |
| Coca-Cola Icecek AS (Units) (e) | | | 444,025 | | | | 5,299 | | |
| Turk Telekomunikasyon AS | | | 1,933,589 | | | | 7,168 | | |
| Turkiye Garanti Bankasi AS (Units) (e) | | | 4,137,963 | | | | 12,892 | | |
| | | | 40,720 | | |
| United States (1.9%) | |
| Mead Johnson Nutrition Co. | | | 167,670 | | | | 11,524 | | |
| Yum! Brands, Inc. | | | 215,271 | | | | 12,703 | | |
| | | | 24,227 | | |
| Total Common Stocks (Cost $1,170,080) | | | 1,218,497 | | |
| Investment Company (0.6%) | |
| India (0.6%) | |
Morgan Stanley Growth Fund (See Note G-2) (b)
(Cost $1,667) | | | 8,475,378 | | | | 7,822 | | |
| Short-Term Investments (13.0%) | |
| Securities held as Collateral on Loaned Securities (7.4%) | |
| Investment Company (5.4%) | |
Morgan Stanley Institutional Liquidity
Funds — Money Market Portfolio —
Institutional Class (See Note G-2) | | | 67,559,646 | | | | 67,560 | | |
| | | Face
Amount
(000) | | | |
| Repurchase Agreements (2.0%) | |
Barclays Capital, Inc., (0.02%, dated
12/30/11, due 1/3/12; proceeds $2,901;
fully collateralized by a U.S. Government
Obligation; U.S. Treasury Bond 4.50%
due 5/15/38; valued at $2,959) | | $ | 2,901 | | | | 2,901 | | |
Merrill Lynch & Co., Inc., (0.07%, dated
12/30/11, due 1/3/12; proceeds $21,552;
fully collateralized by a U.S. Government
Agency; Government National Mortgage
Association 3.50% due 11/20/41; valued
at $21,983) | | | 21,552 | | | | 21,552 | | |
| | | | 24,453 | | |
Total Securities held as Collateral on Loaned
Securities (Cost $92,013) | | | 92,013 | | |
| | | Shares | | | |
| Investment Company (5.6%) | |
Morgan Stanley Institutional Liquidity
Funds — Money Market Portfolio —
Institutional Class (See Note G-2)
(Cost $70,052) | | | 70,052,113 | | | | 70,052 | | |
| Total Short-Term Investments (Cost $162,065) | | | 162,065 | | |
Total Investments (111.5%) (Cost $1,333,812)
including $89,322 of Securities Loaned | | | 1,388,384 | | |
| Liabilities in Excess of Other Assets (-11.5%) | | | (143,006 | ) | |
| Net Assets (100.0%) | | $ | 1,245,378 | | |
(a) All or a portion of this security was on loan at December 31, 2011.
(b) Non-income producing security.
(c) Security trades on the Hong Kong exchange.
(d) 144A security — Certain conditions for public sale may exist. Unless otherwise noted, these securities are deemed to be liquid.
(e) Consists of one or more classes of securities traded together as a unit; stocks with attached warrants.
ADR American Depositary Receipt.
GDR Global Depositary Receipt.
NVDR Non-Voting Depositary Receipt.
Fair Value Measurement Information:
The following is a summary of the inputs used to value the Portfolio's investments as of December 31, 2011. (See Note A-9 to the financial statements for further information regarding fair value measurement.)
| Investment Type | | Level 1
Unadjusted
quoted
prices
(000) | | Level 2
Other
significant
observable
inputs
(000) | | Level 3
Significant
unobservable
inputs
(000) | | Total
(000) | |
| Assets: | | | | | | | | | |
| Common Stocks | | | | | | | | | |
Aerospace &
Defense | | $ | 7,314 | | | $ | — | | | $ | — | | | $ | 7,314 | | |
| Airlines | | | 16,627 | | | | — | | | | — | | | | 16,627 | | |
| Auto Components | | | 15,542 | | | | — | | | | — | | | | 15,542 | | |
| Automobiles | | | 38,269 | | | | — | | | | — | | | | 38,269 | | |
| Beverages | | | 75,322 | | | | — | | | | — | | | | 75,322 | | |
| Capital Markets | | | 3,203 | | | | — | | | | — | | | | 3,203 | | |
| Chemicals | | | 35,859 | | | | — | | | | — | | | | 35,859 | | |
| Commercial Banks | | | 162,537 | | | | 4,517 | | | | — | | | | 167,054 | | |
Communications
Equipment | | | 5,055 | | | | — | | | | — | | | | 5,055 | | |
Computers &
Peripherals | | | 9,639 | | | | — | | | | — | | | | 9,639 | | |
Construction &
Engineering | | | 19,263 | | | | — | | | | — | | | | 19,263 | | |
Construction
Materials | | | 12,465 | | | | — | | | | — | | | | 12,465 | | |
Diversified Financial
Services | | | 23,840 | | | | — | | | | — | | | | 23,840 | | |
Diversified
Telecommunication
Services | | | 61,255 | | | | — | | | | — | | | | 61,255 | | |
| Electric Utilities | | | 18,857 | | | | — | | | | — | | | | 18,857 | | |
Electronic Equipment,
Instruments &
Components | | | 14,956 | | | | — | | | | — | | | | 14,956 | | |
Energy Equipment &
Services | | | 4,267 | | | | — | | | | — | | | | 4,267 | | |
Food & Staples
Retailing | | | 37,763 | | | | — | | | | — | | | | 37,763 | | |
| Food Products | | | 69,882 | | | | — | | | | — | | | | 69,882 | | |
| Gas Utilities | | | 3,155 | | | | — | | | | — | | | | 3,155 | | |
Health Care
Providers &
Services | | | 4,408 | | | | — | | | | — | | | | 4,408 | | |
The accompanying notes are an integral part of the financial statements.
35
2011 Annual Report
December 31, 2011
Portfolio of Investments (cont'd)
Emerging Markets Portfolio
Fair Value Measurement Information: (cont'd)
| Investment Type | | Level 1
Unadjusted
quoted
prices
(000) | | Level 2
Other
significant
observable
inputs
(000) | | Level 3
Significant
unobservable
inputs
(000) | | Total
(000) | |
| Common Stocks (cont'd) | | | | | | | | | |
Hotels, Restaurants &
Leisure | | $ | 12,703 | | | $ | — | | | $ | — | | | $ | 12,703 | | |
| Household Durables | | | 15,278 | | | | — | | | | — | | | | 15,278 | | |
| Household Products | | | 3,482 | | | | — | | | | — | | | | 3,482 | | |
Independent Power
Producers &
Energy Traders | | | 16,943 | | | | — | | | | — | | | | 16,943 | | |
Industrial
Conglomerates | | | 25,032 | | | | — | | | | — | | | | 25,032 | | |
Information
Technology
Services | | | 21,740 | | | | — | | | | — | | | | 21,740 | | |
| Insurance | | | 28,877 | | | | — | | | | — | | | | 28,877 | | |
Internet Software &
Services | | | 28,917 | | | | — | | | | — | | | | 28,917 | | |
| Machinery | | | 7,876 | | | | — | | | | — | | | | 7,876 | | |
| Media | | | 27,809 | | | | — | | | | — | | | | 27,809 | | |
| Metals & Mining | | | 41,602 | | | | — | | | | — | | | | 41,602 | | |
| Multiline Retail | | | 15,765 | | | | — | | | | — | | | | 15,765 | | |
Oil, Gas &
Consumable Fuels | | | 104,426 | | | | — | | | | — | | | | 104,426 | | |
| Personal Products | | | 9,209 | | | | — | | | | — | | | | 9,209 | | |
| Pharmaceuticals | | | 26,329 | | | | — | | | | — | | | | 26,329 | | |
Real Estate
Management &
Development | | | 18,859 | | | | — | | | | — | | | | 18,859 | | |
Semiconductors &
Semiconductor
Equipment | | | 68,685 | | | | — | | | | — | | | | 68,685 | | |
| Software | | | 12,710 | | | | — | | | | — | | | | 12,710 | | |
| Specialty Retail | | | 18,758 | | | | — | | | | — | | | | 18,758 | | |
Textiles, Apparel &
Luxury Goods | | | 13,559 | | | | — | | | | — | | | | 13,559 | | |
| Tobacco | | | 8,848 | | | | — | | | | — | | | | 8,848 | | |
Wireless
Telecommunication
Services | | | 47,095 | | | | — | | | | — | | | | 47,095 | | |
Total Common
Stocks | | | 1,213,980 | | | | 4,517 | | | | — | | | | 1,218,497 | | |
| Investment Company | | | 7,822 | | | | — | | | | — | | | | 7,822 | | |
Short-Term
Investments | |
| Investment Company | | | 137,612 | | | | — | | | | — | | | | 137,612 | | |
Repurchase
Agreements | | | — | | | | 24,453 | | | | — | | | | 24,453 | | |
Total Short-Term
Investments | | | 137,612 | | | | 24,453 | | | | — | | | | 162,065 | | |
| Total Assets | | $ | 1,359,414 | | | $ | 28,970 | | | $ | — | | | $ | 1,388,384 | | |
Transfers between investment levels may occur as the markets fluctuate and/or the availability of data used in an investment's valuation changes. The Portfolio recognizes transfers between the levels as of the end of the period. As of December 31, 2011, securities with a total value of approximately $884,000 transferred from Level 2 to Level 1. At December 31, 2010, the fair market value of certain securities were adjusted due to developments which occurred between the time of the close of the foreign markets on which they trade and the close of business on the NYSE which resulted in their Level 2 classification.
Following is a reconciliation of investments in which significant unobservable inputs (Level 3) were used in determining fair value.
| | | Common
Stocks
(000) | |
| Beginning Balance | | $ | — | † | |
| Purchases | | | — | | |
| Sales | | | — | ‡ | |
| Amortization of discount | | | — | | |
| Transfers in | | | — | | |
| Transfers out | | | — | | |
| Change in unrealized appreciation (depreciation) | | | 12,045 | | |
| Realized gains (losses) | | | (12,045 | ) | |
| Ending Balance | | $ | — | | |
Net change in unrealized appreciation/depreciation
from investments still held as of December 31, 2011 | | $ | — | | |
† Includes one or more securities which are valued at zero.
‡ Includes one or more securities with proceeds from sales of zero.
The accompanying notes are an integral part of the financial statements.
36
2011 Annual Report
December 31, 2011
Investment Overview (unaudited)
Global Advantage Portfolio
The Global Advantage Portfolio (the "Portfolio") seeks long-term capital appreciation by investing primarily in established companies located throughout the world, with capitalizations within the range of companies included in the MSCI All Country World Index.
Performance
For the year ended December 31, 2011, the Portfolio had a total return based on net asset value and reinvestment of distributions per share of 0.34%, net of fees, for Class I shares. The Portfolio's Class I shares outperformed against its benchmark, the MSCI All Country World Index (the "Index"), which returned -7.35%.
Factors Affecting Performance
• Global equity markets began 2011 on a relatively optimistic note but suffered a stream of disappointments as the year progressed, falling 7.35% for the year overall (as measured by the Index). Headwinds to the markets' progress included lackluster economic growth in the developed world, fears about a "hard landing" in China's economy, the worsening European debt crisis, political dysfunction in the U.S. and Europe, a tragic earthquake and tsunami in Japan, and social and political upheaval across the Middle East. Although corporate balance sheets and earnings in the U.S. and Europe remained strong throughout the year, waning investor confidence kept markets volatile. The U.S. market outperformed those of Europe, Japan, and Asia ex-Japan, and developed market equities bested emerging market equities. (The performance of regional markets and developed and emerging markets is measured by their respective MSCI indexes.)
• The consumer staples sector contributed most to outperformance versus the Index, although it was mainly driven by the Portfolio's overweight exposure to the sector. Stock selection also benefited relative results, primarily because of strong performance from holdings within the food, beverage, and tobacco industry.
• Stock selection in the industrials sector also aided returns. A position in a U.K. company that provides testing, inspection, and certification of goods was the top contributor.
• The financials sector also benefited relative performance, primarily because of the Portfolio's underweight exposure to the sector overall and especially its lack of exposure to bank stocks. Stock selection helped as well, with good performance from holdings in the insurance industry.
• The Portfolio's underweight exposure to health care, a sector which performed well during the period, and the negative performance of its sole holding in the sector, a supplier of scientific instruments and equipment used in diagnostics and analysis, were detractors from relative gains.
• An underweight and stock selection in energy hurt performance as well, largely due to a position in an oil and gas exploration and production company that lagged.
• Stock selection in the consumer discretionary sector was disadvantageous. A holding in a Hong Kong-based global consumer goods exporter was the largest detractor.
Management Strategies
• We look for high-quality growth companies that have these attributes: sustainable competitive advantages, business visibility, rising return on invested capital, free cash flow and a favorable risk/reward profile. In seeking these companies, we use intense fundamental research. Our emphasis is on secular growth, and as a result, short-term market events are not as meaningful in the stock selection process.
37
2011 Annual Report
December 31, 2011
Investment Overview (unaudited) (cont'd)
Global Advantage Portfolio
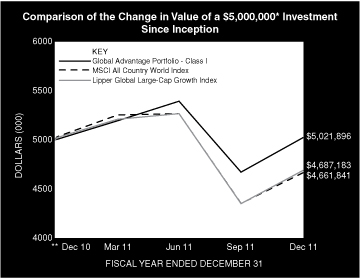
* Minimum Investment
** Commenced Operations on December 28, 2010.
In accordance with SEC regulations, Portfolio's performance shown assumes that all recurring fees (including management fees) were deducted and all dividends and distributions were reinvested. The performance of Class P, Class H, and Class L shares will vary from the Class I shares based upon it will be negatively impacted by additional fees assessed to these classes.
Performance Compared to the Morgan Stanley Capital International (MSCI) All Country World Index(1) and the Lipper Global Large-Cap Growth Funds Index(2)
| | | Period Ended December 31, 2011 | |
| | | Total Returns(3) | |
| | | | | Average Annual | |
| | | One
Year | | Five
Years | | Ten
Years | | Since
Inception(5) | |
Portfolio — Class I Shares
w/o sales charges(4) | | | 0.34 | % | | | — | | | | — | | | | 0.43 | % | |
| MSCI All Country World Index | | | –7.35 | | | | — | | | | — | | | | –6.71 | | |
Lipper Global Large-Cap
Growth Index | | | –6.68 | | | | — | | | | — | | | | –6.21 | | |
Portfolio — Class H Shares
w/o sales charges(4) | | | 0.08 | | | | — | | | | — | | | | 0.18 | | |
Portfolio — Class H Shares with
maximum 4.75% sales charges(4) | | | –4.68 | | | | — | | | | — | | | | –4.55 | | |
| MSCI All Country World Index | | | –7.35 | | | | — | | | | — | | | | –6.71 | | |
Lipper Global Large-Cap
Growth Index | | | –6.68 | | | | — | | | | — | | | | –6.21 | | |
Portfolio — Class L Shares
w/o sales charges(4) | | | –0.44 | | | | — | | | | — | | | | –0.34 | | |
| MSCI All Country World Index | | | –7.35 | | | | — | | | | — | | | | –6.71 | | |
Lipper Global Large-Cap
Growth Index | | | –6.68 | | | | — | | | | — | | | | –6.21 | | |
Portfolio — Class P Shares
w/o sales charges(4) | | | 0.07 | | | | — | | | | — | | | | 0.17 | | |
| MSCI All Country World Index | | | –7.35 | | | | — | | | | — | | | | –6.71 | | |
Lipper Global Large-Cap
Growth Index | | | –6.68 | | | | — | | | | — | | | | –6.21 | | |
Performance data quoted represents past performance, which is no guarantee of future results, and current performance may be lower or higher than the figures shown. Performance assumes that all dividends and distributions, if any, were reinvested. For the most recent month-end performance figures, please visit www.morganstanley.com/im. Investment return and principal value will fluctuate so that Portfolio shares, when redeemed, may be worth more or less than their original cost. Total returns do not reflect the deduction of taxes that a shareholder would pay on Portfolio distributions or the redemption of Portfolio shares. Performance of share classes will vary due to difference in expenses.
(1) The Morgan Stanley Capital International (MSCI) All Country World Index (ACWI) is a free float-adjusted market capitalization weighted index designed to measure the equity market performance of developed and emerging markets. The term "free float" represents the portion of shares outstanding that are deemed to be available for purchase in the public equity markets by investors. The performance of the Index is listed in U.S. dollars and assumes reinvestment of net dividends. The Index is unmanaged and its returns do not include any sales charges or fees. Such costs would lower performance. It is not possible to invest directly in an index.
(2) The Lipper Global Large-Cap Growth Funds Index is an equally weighted performance index of the largest qualifying funds (based on net assets) in the Lipper Global Large-Cap Growth Funds classification. The Index, which is adjusted for capital gains distributions and income dividends, is unmanaged and should not be considered an investment. There are currently 10 funds represented in this Index. As of the date of this Prospectus, the Portfolio is in the Lipper Global Large-Cap Growth Funds classification.
(3) Total returns for the Portfolio reflect fees waived and expenses reimbursed, if applicable, by the Adviser. Without such waivers and reimbursements, total returns would have been lower. The fee waivers and/or expense reimbursements will continue for one year or until such time as the Fund's Board of Directors acts to discontinue all or a portion of such waivers and/or expense reimbursements when it deems that such action is appropriate.
(4) Commenced operations on December 28, 2010.
(5) For comparative purposes, average annual since inception returns listed for the Indexes refer to the inception date or initial offering of the respective share class of the Portfolio, not the inception of the Index.
Portfolio Composition
| Classification | | Percentage of
Total Investments | |
| Other* | | | 51.6 | % | |
| Internet Software & Services | | | 9.7 | | |
| Beverages | | | 8.4 | | |
| Food Products | | | 8.0 | | |
| Commercial Services & Supplies | | | 6.1 | | |
| Hotels, Restaurants & Leisure | | | 5.8 | | |
| Computers & Peripherals | | | 5.3 | | |
| Professional Services | | | 5.1 | | |
| Total Investments | | | 100.0 | % | |
* Industries representing less than 5% of total investments.
38
2011 Annual Report
December 31, 2011
Portfolio of Investments
Global Advantage Portfolio
| | | Shares | | Value
(000) | |
| Common Stocks (95.0%) | |
| Australia (1.8%) | |
| QR National Ltd. | | | 13,942 | | | $ | 49 | | |
| Brazil (5.8%) | |
| LLX Logistica SA (a) | | | 18,753 | | | | 34 | | |
| Natura Cosmeticos SA | | | 3,991 | | | | 77 | | |
| OGX Petroleo e Gas Participacoes SA (a) | | | 6,138 | | | | 45 | | |
| | | | 156 | | |
| Canada (7.9%) | |
| Brookfield Asset Management, Inc., Class A | | | 3,568 | | | | 98 | | |
| Fairfax Financial Holdings Ltd. | | | 177 | | | | 76 | | |
| Groupe Aeroplan, Inc. | | | 3,230 | | | | 38 | | |
| | | | 212 | | |
| China (3.7%) | |
| China Merchants Holdings International Co., Ltd. (b) | | | 14,482 | | | | 42 | | |
| Tencent Holdings Ltd. (b) | | | 2,800 | | | | 56 | | |
| | | | 98 | | |
| Denmark (0.5%) | |
| Pandora A/S | | | 1,518 | | | | 14 | | |
| France (8.4%) | |
| Christian Dior SA | | | 435 | | | | 51 | | |
| Edenred | | | 4,987 | | | | 123 | | |
| Remy Cointreau SA | | | 656 | | | | 53 | | |
| | | | 227 | | |
| Greece (1.4%) | |
| Jumbo SA | | | 7,500 | | | | 37 | | |
| Hong Kong (3.8%) | |
| L'Occitane International SA | | | 31,500 | | | | 64 | | |
| Sun Art Retail Group Ltd. (a) | | | 30,500 | | | | 38 | | |
| | | | 102 | | |
| Singapore (2.8%) | |
| Jardine Matheson Holdings Ltd. | | | 1,621 | | | | 76 | | |
| Switzerland (8.7%) | |
| Nestle SA ADR | | | 2,012 | | | | 116 | | |
| Schindler Holding AG | | | 1,019 | | | | 119 | | |
| | | | 235 | | |
| United Kingdom (8.1%) | |
| Diageo PLC ADR | | | 938 | | | | 82 | | |
| Intertek Group PLC | | | 4,345 | | | | 137 | | |
| | | | 219 | | |
| United States (42.1%) | |
| Amazon.com, Inc. (a) | | | 504 | | | | 87 | | |
| Anheuser-Busch InBev N.V. ADR | | | 1,458 | | | | 89 | | |
| Apple, Inc. (a) | | | 348 | | | | 141 | | |
| Covanta Holding Corp. | | | 2,775 | | | | 38 | | |
| eBay, Inc. (a) | | | 2,968 | | | | 90 | | |
| Google, Inc., Class A (a) | | | 174 | | | | 112 | | |
| Li & Fung Ltd. (b) | | | 36,000 | | | | 67 | | |
| Mead Johnson Nutrition Co. | | | 1,393 | | | | 96 | | |
| Motorola Solutions, Inc. | | | 2,244 | | | | 104 | | |
| Philip Morris International, Inc. | | | 1,195 | | | | 94 | | |
| | | Shares | | Value
(000) | |
| Starbucks Corp. | | | 1,734 | | | $ | 80 | | |
| Weight Watchers International, Inc. | | | 1,155 | | | | 63 | | |
| Yum! Brands, Inc. | | | 1,279 | | | | 75 | | |
| | | | 1,136 | | |
| Total Common Stocks (Cost $2,543) | | | 2,561 | | |
| Short-Term Investment (3.7%) | |
| Investment Company (3.7%) | |
Morgan Stanley Institutional Liquidity
Funds — Money Market Portfolio —
Institutional Class (See Note G-2) (Cost $101) | | | 100,818 | | | | 101 | | |
| Total Investments (98.7%) (Cost $2,644) | | | 2,662 | | |
| Other Assets in Excess of Liabilities (1.3%) | | | 36 | | |
| Net Assets (100.0%) | | $ | 2,698 | | |
(a) Non-income producing security.
(b) Security trades on the Hong Kong exchange.
ADR American Depositary Receipt.
Fair Value Measurement Information:
The following is a summary of the inputs used to value the Portfolio's investments as of December 31, 2011. (See Note A-9 to the financial statements for further information regarding fair value measurement.)
| Investment Type | | Level 1
Unadjusted
quoted
prices
(000) | | Level 2
Other
significant
observable
inputs
(000) | | Level 3
Significant
unobservable
inputs
(000) | | Total
(000) | |
| Assets: | | | | | | | | | |
| Common Stocks | | | | | | | | | |
| Beverages | | $ | 224 | | | $ | — | | | $ | — | | | $ | 224 | | |
Commercial Services &
Supplies | | | 161 | | | | — | | | | — | | | | 161 | | |
| Communications Equipment | | | 104 | | | | — | | | | — | | | | 104 | | |
| Computers & Peripherals | | | 141 | | | | — | | | | — | | | | 141 | | |
| Distributors | | | 67 | | | | — | | | | — | | | | 67 | | |
Diversified Consumer
Services | | | 63 | | | | — | | | | — | | | | 63 | | |
| Food & Staples Retailing | | | 38 | | | | — | | | | — | | | | 38 | | |
| Food Products | | | 212 | | | | — | | | | — | | | | 212 | | |
Hotels, Restaurants &
Leisure | | | 155 | | | | — | | | | — | | | | 155 | | |
| Industrial Conglomerates | | | 76 | | | | — | | | | — | | | | 76 | | |
| Insurance | | | 76 | | | | — | | | | — | | | | 76 | | |
| Internet & Catalog Retail | | | 87 | | | | — | | | | — | | | | 87 | | |
| Internet Software & Services | | | 258 | | | | — | | | | — | | | | 258 | | |
| Machinery | | | 119 | | | | — | | | | — | | | | 119 | | |
| Media | | | 38 | | | | — | | | | — | | | | 38 | | |
| Oil, Gas & Consumable Fuels | | | 45 | | | | — | | | | — | | | | 45 | | |
| Personal Products | | | 77 | | | | — | | | | — | | | | 77 | | |
| Professional Services | | | 137 | | | | — | | | | — | | | | 137 | | |
Real Estate Management &
Development | | | 98 | | | | — | | | | — | | | | 98 | | |
| Road & Rail | | | 49 | | | | — | | | | — | | | | 49 | | |
| Specialty Retail | | | 101 | | | | — | | | | — | | | | 101 | | |
The accompanying notes are an integral part of the financial statements.
39
2011 Annual Report
December 31, 2011
Portfolio of Investments (cont'd)
Global Advantage Portfolio
Fair Value Measurement Information: (cont'd)
| Investment Type | | Level 1
Unadjusted
quoted
prices
(000) | | Level 2
Other
significant
observable
inputs
(000) | | Level 3
Significant
unobservable
inputs
(000) | | Total
(000) | |
| Common Stocks (cont'd) | | | | | | | | | |
Textiles, Apparel & Luxury
Goods | | $ | 65 | | | $ | — | | | $ | — | | | $ | 65 | | |
| Tobacco | | | 94 | | | | — | | | | — | | | | 94 | | |
| Transportation Infrastructure | | | 76 | | | | — | | | | — | | | | 76 | | |
| Total Common Stocks | | | 2,561 | | | | — | | | | — | | | | 2,561 | | |
Short-Term Investment —
Investment Company | | | 101 | | | | — | | | | — | | | | 101 | | |
| Total Assets | | $ | 2,662 | | | $ | — | | | $ | — | | | $ | 2,662 | | |
Transfers between investment levels may occur as the markets fluctuate and/or the availability of data used in an investment's valuation changes. The Portfolio recognizes transfers between the levels as of the end of the period. As of December 31, 2011, the Portfolio did not have any significant investments transfer between investment levels.
The accompanying notes are an integral part of the financial statements.
40
2011 Annual Report
December 31, 2011
Investment Overview (unaudited)
Global Discovery Portfolio
The Global Discovery Portfolio (the "Portfolio") seeks long-term capital appreciation by investing primarily in established and emerging franchise companies located throughout the world, with capitalizations within the range of companies included in the MSCI All Country World Index.
Performance
For the year ended December 31, 2011, the Portfolio had a total return based on net asset value and reinvestment of distributions per share of -7.72%, net of fees, for Class I shares. The Portfolio's Class I shares underperformed against its benchmark, the MSCI All Country World Index (the "Index"), which returned -7.35%.
Factors Affecting Performance
• Global equity markets began 2011 on a relatively optimistic note but suffered a stream of disappointments as the year progressed, falling 7.35% for the year overall (as measured by the Index). Headwinds to the markets' progress included lackluster economic growth in the developed world, fears about a "hard landing" in China's economy, the worsening European debt crisis, political dysfunction in the U.S. and Europe, a tragic earthquake and tsunami in Japan, and social and political upheaval across the Middle East. Although corporate balance sheets and earnings in the U.S. and Europe remained strong throughout the year, waning investor confidence kept markets volatile. The U.S. market outperformed those of Europe, Japan, and Asia ex-Japan, and developed market equities bested emerging market equities. (The performance of regional markets and developed and emerging markets is measured by their respective MSCI indexes.)
• The primary detractor from relative performance during the period was stock selection in the consumer discretionary sector. Holdings in a Danish jewelry designer and a Greek toy and baby product retailer were the largest drags on performance.
• The energy sector also dampened performance because of weak stock selection (largely due to the negative return of a position in a Brazilian oil and gas exploration and production company) and an underweight in the sector.
• An underweight allocation to the telecommunication services sector, in which the Portfolio had no exposure during the period, was disadvantageous to relative performance.
• Conversely, positive contributions came from stock selection and an overweight in the information technology sector. A position in a U.S. communications equipment maker was the most additive to returns.
• Stock selection in health care also bolstered relative performance, due to the strong performance of the Portfolio's two holdings in the sector.
• Stock selection in the industrials sector also aided returns. A position in a U.K. company that provides testing, inspection, and certification of goods was the top contributor.
Management Strategies
• We look for high-quality growth companies that have these attributes: sustainable competitive advantages, business visibility, rising return on invested capital, free cash flow and a favorable risk/reward profile. In seeking these companies, we use intense fundamental research. Our emphasis is on secular growth, and as a result, short-term market events are not as meaningful in the stock selection process.
41
2011 Annual Report
December 31, 2011
Investment Overview (unaudited) (cont'd)
Global Discovery Portfolio
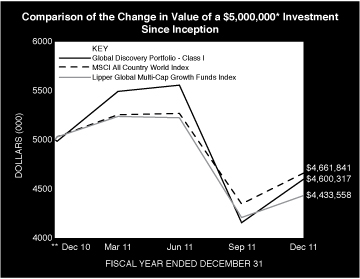
* Minimum Investment
** Commenced Operations on December 28, 2010.
In accordance with SEC regulations, Portfolio's performance shown assumes that all recurring fees (including management fees) were deducted and all dividends and distributions were reinvested. The performance of Class P, Class H, and Class L shares will vary from the Class I shares based upon it will be negatively impacted by additional fees assessed to these classes.
Performance Compared to the Morgan Stanley Capital International (MSCI) All Country World Index(1) and the Lipper Global Multi-Cap Growth Funds Index(2)
| | | Period Ended December 31, 2011 | |
| | | Total Returns(3) | |
| | | | | Average Annual | |
| | | One
Year | | Five
Years | | Ten
Years | | Since
Inception(5) | |
Portfolio — Class I Shares
w/o sales charges(4) | | | –7.72 | % | | | — | | | | — | | | | –7.93 | % | |
| MSCI All Country World Index | | | –7.35 | | | | — | | | | — | | | | –6.71 | | |
Lipper Global Multi-Cap Growth
Index | | | –11.85 | | | | — | | | | — | | | | –11.25 | | |
Portfolio — Class H Shares
w/o sales charges(4) | | | –7.96 | | | | — | | | | — | | | | –8.17 | | |
Portfolio — Class H Shares
with maximum 4.75%
sales charges(4) | | | –12.36 | | | | — | | | | — | | | | –12.51 | | |
| MSCI All Country World Index | | | –7.35 | | | | — | | | | — | | | | –6.71 | | |
Lipper Global Multi-Cap Growth
Index | | | –11.85 | | | | — | | | | — | | | | –11.25 | | |
Portfolio — Class L Shares
w/o sales charges(4) | | | –8.41 | | | | — | | | | — | | | | –8.62 | | |
| MSCI All Country World Index | | | –7.35 | | | | — | | | | — | | | | –6.71 | | |
Lipper Global Multi-Cap Growth
Index | | | –11.85 | | | | — | | | | — | | | | –11.25 | | |
Portfolio — Class P Shares
w/o sales charges(4) | | | –7.98 | | | | — | | | | — | | | | –8.19 | | |
| MSCI All Country World Index | | | –7.35 | | | | — | | | | — | | | | –6.71 | | |
Lipper Global Multi-Cap Growth
Index | | | –11.85 | | | | — | | | | — | | | | –11.25 | | |
Performance data quoted represents past performance, which is no guarantee of future results, and current performance may be lower or higher than the figures shown. Performance assumes that all dividends and distributions, if any, were reinvested. For the most recent month-end performance figures, please visit www.morganstanley.com/im. Investment return and principal value will fluctuate so that Portfolio shares, when redeemed, may be worth more or less than their original cost. Total returns do not reflect the deduction of taxes that a shareholder would pay on Portfolio distributions or the redemption of Portfolio shares. Performance of share classes will vary due to difference in expenses.
(1) The Morgan Stanley Capital International (MSCI) All Country World Index (ACWI) is a free float-adjusted market capitalization weighted index designed to measure the equity market performance of developed and emerging markets. The term "free float" represents the portion of shares outstanding that are deemed to be available for purchase in the public equity markets by investors. The performance of the Index is listed in U.S. dollars and assumes reinvestment of net dividends. The Index is unmanaged and its returns do not include any sales charges or fees. Such costs would lower performance. It is not possible to invest directly in an index.
(2) The Lipper Global Multi-Cap Growth Funds Index is an equally weighted performance index of the largest qualifying funds (based on net assets) in the Lipper Global Multi-Cap Growth Funds classification. The Index, which is adjusted for capital gains distributions and income dividends, is unmanaged and should not be considered an investment. There are currently 30 funds represented in this Index. As of the date of this Prospectus, the Portfolio is in the Lipper Global Multi-Cap Growth Funds classification.
(3) Total returns for the Portfolio reflect fees waived and expenses reimbursed, if applicable, by the Adviser. Without such waivers and reimbursements, total returns would have been lower. The fee waivers and/or expense reimbursements will continue for one year or until such time as the Fund's Board of Directors acts to discontinue all or a portion of such waivers and/or expense reimbursements when it deems that such action is appropriate.
(4) Commenced operations on December 28, 2010.
(5) For comparative purposes, average annual since inception returns listed for the Indexes refer to the inception date or initial offering of the respective share class of the Portfolio, not the inception of the Index.
Portfolio Composition
| Classification | | Percentage of
Total Investments | |
| Other* | | | 39.7 | % | |
| Communications Equipment | | | 14.4 | | |
| Food Products | | | 11.6 | | |
| Specialty Retail | | | 10.0 | | |
| Commercial Services & Supplies | | | 7.0 | | |
| Internet Software & Services | | | 6.9 | | |
| Diversified Financial Services | | | 5.3 | | |
| Textiles, Apparel & Luxury Goods | | | 5.1 | | |
| Total Investments | | | 100.0 | % | |
* Industries representing less than 5% of total investments.
42
2011 Annual Report
December 31, 2011
Portfolio of Investments
Global Discovery Portfolio
| | | Shares | | Value
(000) | |
| Common Stocks (94.6%) | |
| Australia (5.0%) | |
| DuluxGroup Ltd. | | | 49,500 | | | $ | 146 | | |
| Lynas Corp. Ltd. (a) | | | 40,064 | | | | 43 | | |
| | | | 189 | | |
| Brazil (9.1%) | |
| LLX Logistica SA (a) | | | 36,299 | | | | 66 | | |
| Natura Cosmeticos SA | | | 3,847 | | | | 75 | | |
| OGX Petroleo e Gas Participacoes SA (a) | | | 17,140 | | | | 125 | | |
| Raia Drogasil SA | | | 11,229 | | | | 78 | | |
| | | | 344 | | |
| Canada (2.0%) | |
| Valeant Pharmaceuticals International, Inc. (a) | | | 1,639 | | | | 76 | | |
| China (0.8%) | |
Country Style Cooking Restaurant
Chain Co., Ltd. ADR (a) | | | 4,387 | | | | 32 | | |
| Denmark (3.4%) | |
| Pandora A/S | | | 13,462 | | | | 127 | | |
| France (14.2%) | |
| Christian Dior SA | | | 558 | | | | 66 | | |
| Edenred | | | 10,683 | | | | 263 | | |
| Eurazeo | | | 3,647 | | | | 130 | | |
| Remy Cointreau SA | | | 966 | | | | 78 | | |
| | | | 537 | | |
| Greece (6.2%) | |
Hellenic Exchanges SA Holding Clearing
Settlement and Registry | | | 17,844 | | | | 67 | | |
| Jumbo SA (a) | | | 33,920 | | | | 167 | | |
| | | | 234 | | |
| Hong Kong (5.4%) | |
| L'Occitane International SA | | | 102,500 | | | | 206 | | |
| Marshall Islands (3.6%) | |
| Diana Containerships, Inc. | | | 25,293 | | | | 136 | | |
| Switzerland (8.1%) | |
| Nestle SA (Registered) | | | 5,345 | | | | 307 | | |
| United Kingdom (4.0%) | |
| Intertek Group PLC | | | 4,836 | | | | 153 | | |
| United States (32.8%) | |
| Akamai Technologies, Inc. (a) | | | 5,455 | | | | 176 | | |
| Dunkin' Brands Group, Inc. (a) | | | 46 | | | | 1 | | |
| First Solar, Inc. (a) | | | 2,186 | | | | 74 | | |
| Intuitive Surgical, Inc. (a) | | | 178 | | | | 82 | | |
| Motorola Solutions, Inc. | | | 11,675 | | | | 541 | | |
| OpenTable, Inc. (a) | | | 2,057 | | | | 81 | | |
| PF Chang's China Bistro, Inc. | | | 3,403 | | | | 105 | | |
| Sara Lee Corp. | | | 6,787 | | | | 128 | | |
| Zynga, Inc., Class A (a) | | | 5,626 | | | | 53 | | |
| | | | 1,241 | | |
| Total Common Stocks (Cost $3,840) | | | 3,582 | | |
| | | Shares | | Value
(000) | |
| Convertible Preferred Stocks (0.8%) | |
| United States (0.8%) | |
| Better Place, Inc. Series C (a)(b)(c) (Cost $29) | | | 6,429 | | | $ | 29 | | |
| Short-Term Investment (3.5%) | |
| Investment Company (3.5%) | |
Morgan Stanley Institutional Liquidity
Funds — Money Market Portfolio —
Institutional Class (See Note G-2) (Cost $134) | | | 134,177 | | | | 134 | | |
| Total Investments (98.9%) (Cost $4,003) | | | 3,745 | | |
| Other Assets in Excess of Liabilities (1.1%) | | | 40 | | |
| Net Assets (100.0%) | | $ | 3,785 | | |
(a) Non-income producing security.
(b) At December 31, 2011, the Portfolio held a fair valued security valued at approximately $29,000, representing 0.8% of net assets. This security has been fair valued as determined in good faith under procedures established by and under the general supervision of the Fund's Directors.
(c) Security has been deemed illiquid at December 31, 2011.
ADR American Depositary Receipt.
Fair Value Measurement Information:
The following is a summary of the inputs used to value the Portfolio's investments as of December 31, 2011. (See Note A-9 to the financial statements for further information regarding fair value measurement.)
| Investment Type | | Level 1
Unadjusted
quoted
prices
(000) | | Level 2
Other
significant
observable
inputs
(000) | | Level 3
Significant
unobservable
inputs
(000) | | Total
(000) | |
| Assets: | | | | | | | | | |
| Common Stocks | | | | | | | | | |
| Beverages | | $ | 78 | | | $ | — | | | $ | — | | | $ | 78 | | |
| Chemicals | | | 146 | | | | — | | | | — | | | | 146 | | |
Commercial Services &
Supplies | | | 263 | | | | — | | | | — | | | | 263 | | |
| Communications Equipment | | | 541 | | | | — | | | | — | | | | 541 | | |
Diversified Financial
Services | | | 197 | | | | — | | | | — | | | | 197 | | |
| Food & Staples Retailing | | | 78 | | | | — | | | | — | | | | 78 | | |
| Food Products | | | 435 | | | | — | | | | — | | | | 435 | | |
Health Care Equipment &
Supplies | | | 82 | | | | — | | | | — | | | | 82 | | |
Hotels, Restaurants &
Leisure | | | 138 | | | | — | | | | — | | | | 138 | | |
| Internet Software & Services | | | 257 | | | | — | | | | — | | | | 257 | | |
| Marine | | | 136 | | | | — | | | | — | | | | 136 | | |
| Metals & Mining | | | 43 | | | | — | | | | — | | | | 43 | | |
| Oil, Gas & Consumable Fuels | | | 125 | | | | — | | | | — | | | | 125 | | |
| Personal Products | | | 75 | | | | — | | | | — | | | | 75 | | |
| Pharmaceuticals | | | 76 | | | | — | | | | — | | | | 76 | | |
| Professional Services | | | 153 | | | | — | | | | — | | | | 153 | | |
Semiconductors &
Semiconductor Equipment | | | 74 | | | | — | | | | — | | | | 74 | | |
| Software | | | 53 | | | | — | | | | — | | | | 53 | | |
| Specialty Retail | | | 373 | | | | — | | | | — | | | | 373 | | |
The accompanying notes are an integral part of the financial statements.
43
2011 Annual Report
December 31, 2011
Portfolio of Investments (cont'd)
Global Discovery Portfolio
Fair Value Measurement Information: (cont'd)
| Investment Type | | Level 1
Unadjusted
quoted
prices
(000) | | Level 2
Other
significant
observable
inputs
(000) | | Level 3
Significant
unobservable
inputs
(000) | | Total
(000) | |
| Common Stocks (cont'd) | | | | | | | | | |
Textiles, Apparel & Luxury
Goods | | $ | 193 | | | $ | — | | | $ | — | | | $ | 193 | | |
| Transportation Infrastructure | | | 66 | | | | — | | | | — | | | | 66 | | |
| Total Common Stocks | | | 3,582 | | | | — | | | | — | | | | 3,582 | | |
Convertible Preferred
Stocks | | | — | | | | — | | | | 29 | | | | 29 | | |
Short-Term Investment —
Investment Company | | | 134 | | | | — | | | | — | | | | 134 | | |
| Total Assets | | $ | 3,716 | | | $ | — | | | $ | 29 | | | $ | 3,745 | | |
Transfers between investment levels may occur as the markets fluctuate and/or the availability of data used in an investment's valuation changes. The Portfolio recognizes transfers between the levels as of the end of the period. As of December 31, 2011, the Portfolio did not have any significant investments transfer between investment levels.
Following is a reconciliation of investments in which significant unobservable inputs (Level 3) were used in determining fair value.
| | | Convertible
Preferred
Stocks
(000) | |
| Beginning Balance | | $ | — | | |
| Purchases | | | 29 | | |
| Sales | | | — | | |
| Amortization of discount | | | — | | |
| Transfers in | | | — | | |
| Transfers out | | | — | | |
| Change in unrealized appreciation (depreciation) | | | — | | |
| Realized gains (losses) | | | — | | |
| Ending Balance | | $ | 29 | | |
Net change in unrealized appreciation/depreciation
from investments still held as of December 31, 2011 | | $ | — | | |
The accompanying notes are an integral part of the financial statements.
44
2011 Annual Report
December 31, 2011
Investment Overview (unaudited)
Global Franchise Portfolio
The Global Franchise Portfolio (the "Portfolio") seeks long-term capital appreciation by investing primarily in equity securities of issuers located throughout the world, that it believes have, among other things, resilient business franchises and growth potential.
Performance
For the year ended December 31, 2011, the Portfolio had a total return based on net asset value and reinvestment of distributions per share of 9.38%, net of fees, for Class I shares. The Portfolio's Class I shares outperformed against its benchmark, the MSCI World Index (the "Index"), which returned -5.54%.
Factors Affecting Performance
• Despite all the market volatility, 2011 ended with a whimper, with the Index essentially flat in December on low trading volumes. This resulted in a 7.6% return in the Index for the fourth quarter, and brought the return for the year to -5.5%.
• For the most part, it was a classic "cyclicals versus defensives" (or more economically sensitive versus less economically sensitive) year, with nearly all cyclical sectors faring poorly over 2011: materials fell 20%, the punch-drunk financial sector was down 19%, industrials declined 8% and consumer discretionary fell 5%. In terms of defensive sectors, both health care (up 9.5%) and consumer staples (up 8.6%) solidly outperformed for the year as their fortunes are less sensitive to macro-economics, which deteriorated as the eurozone crisis escalated from bank balance sheets to European government balance sheets, to affect credit creation worldwide.
• One rather surprising exception to the broad story of cyclical weakness was the oil price, partly due to continued political uncertainty in the Middle East, with the result that free cash flows and share prices have remained resilient in the energy sector.
• The Portfolio posted strong absolute and relative performance over the full year.
• Although underweight allocations to the health care, energy, and telecommunications sectors detracted from performance for the year, this was more than offset by strong stock selection in and the overweight allocation to consumer staples, and the underweight allocation to financials, one of the weakest performing sectors. The Portfolio's stock selection in information technology also added to performance for the year.
• Derivatives did not materially impact Portfolio's performance.
Management Strategies
• Even if there is no cataclysm in Europe this year, the world remains a dangerous place to invest. Much of the West is in the grip of massive balance sheet deleveraging; shedding assets, postponing spending decisions and hoarding cash in low-return investments. We know from the Japanese experience just how long a balance sheet recession can persist; the question for governments is how should or can they respond. Do they take the quasi-Keynesian approach adopted by the U.S. and U.K. and hope that foreigners remain holders or buyers of the rapidly expanding supply of government bonds? Or do they take the medicine the Austrian school (and a fragile bond market) demands and enforce fiscal discipline and austerity? The former risks sudden bond market or currency collapse, the latter ensures prolonged economic weakness.
• Clients know us for our disciplined focus on seeking what we consider high-quality companies — companies with resilient sources of profit, that can generate high returns on their capital, with managements that invest for the long term — and to seek the shares of these companies that are trading below our assessment of fair value. These sorts of companies are in short supply, and just as the highest-quality corporate debt has rerated upwards, we remain convinced that equity markets will continue to put very high-quality companies on a pedestal.
• We remain focused on the Global Franchise philosophy of investing. We look for what we believe are high-quality franchises, built on dominant and durable intangible assets, which possess pricing power and low capital intensity. This involves investing in well-run companies that capitalize on their intangible assets in an effort to compound shareholder wealth at a superior rate over the long-term. We follow a disciplined investment process based on fundamental analysis and bottom-up stock selection with sector, industry and stock weights driven by an assessment of each stock's quality and value characteristics. The end result is a portfolio aimed at earning attractive absolute returns with less volatility than the broader markets.
45
2011 Annual Report
December 31, 2011
Investment Overview (unaudited) (cont'd)
Global Franchise Portfolio
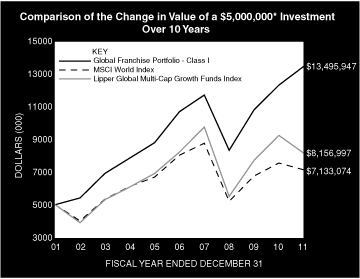
* Minimum Investment
In accordance with SEC regulations, Portfolio's performance shown assumes that all recurring fees (including management fees) were deducted and all dividends and distributions were reinvested. The performance of Class P shares will vary from the Class I shares based upon it will be negatively impacted by additional fees assessed to that class.
Performance Compared to the Morgan Stanley Capital International (MSCI) World Index(1) and the Lipper Global Multi-Cap Growth Funds Index(2)
| | | Period Ended December 31, 2011 | |
| | | Total Returns(3) | |
| | | | | Average Annual | |
| | | One
Year | | Five
Years | | Ten
Years | | Since
Inception(5) | |
Portfolio — Class I Shares
w/o sales charges(4) | | | 9.38 | % | | | 4.74 | % | | | 10.44 | % | | | 10.85 | % | |
| MSCI World Index | | | –5.54 | | | | –2.37 | | | | 3.62 | | | | 3.76 | | |
Lipper Global Multi-Cap Growth
Funds Index | | | –11.85 | | | | –0.18 | | | | 5.02 | | | | 5.19 | | |
Portfolio — Class P Shares
w/o sales charges(4) | | | 8.98 | | | | 4.46 | | | | 10.15 | | | | 10.55 | | |
| MSCI World Index | | | –5.54 | | | | –2.37 | | | | 3.62 | | | | 3.76 | | |
Lipper Global Multi-Cap Growth
Funds Index | | | –11.85 | | | | –0.18 | | | | 5.02 | | | | 5.19 | | |
Performance data quoted represents past performance, which is no guarantee of future results, and current performance may be lower or higher than the figures shown. Performance assumes that all dividends and distributions, if any, were reinvested. For the most recent month-end performance figures, please visit www.morganstanley.com/im. Investment return and principal value will fluctuate so that Portfolio shares, when redeemed, may be worth more or less than their original cost. Total returns do not reflect the deduction of taxes that a shareholder would pay on Portfolio distributions or the redemption of Portfolio shares. Performance of share classes will vary due to difference in expenses.
(1) The Morgan Stanley Capital International (MSCI) World Index is a free float-adjusted market capitalization weighted index that is designed to measure the global equity market performance of developed markets. The term "free float" represents the portion of shares outstanding that are deemed to be available for purchase in the public equity markets by investors. The MSCI World Index currently consists of 24 developed market country indices. The performance of the Index is listed in U.S. dollars and assumes reinvestment of net dividends. The Index is unmanaged and its returns do not include any sales charges or fees. Such costs would lower performance. It is not possible to invest directly in an index.
(2) The Lipper Global Multi-Cap Growth Funds Index is an equally weighted performance index of the largest qualifying funds (based on net assets) in the Lipper Global Multi-Cap Growth Funds classification. The Index, which is adjusted for capital gains distributions and income dividends, is unmanaged and should not be considered an investment. There are currently 30 funds represented in this Index. As of the date of this report, the Portfolio is in the Lipper Global Multi-Cap Growth Funds classification.
(3) Total returns for the Portfolio reflect fees waived and expenses reimbursed, if applicable, by the Adviser. Without such waivers and reimbursements, total returns would have been lower. The fee waivers and/or expense reimbursements will continue for one year or until such time as the Fund's Board of Directors acts to discontinue all or a portion of such waivers and/or expense reimbursements when it deems that such action is appropriate.
(4) Commenced operations on November 28, 2001.
(5) For comparative purposes, average annual since inception returns listed for the Indexes refer to the inception date or initial offering of the respective share class of the Portfolio, not the inception of the Index.
Portfolio Composition
| Classification | | Percentage of
Total Investments | |
| Tobacco | | | 24.8 | % | |
| Food Products | | | 24.7 | | |
| Other* | | | 19.1 | | |
| Household Products | | | 10.9 | | |
| Information Technology Services | | | 8.7 | | |
| Beverages | | | 6.5 | | |
| Software | | | 5.3 | | |
| Total Investments | | | 100.0 | % | |
* Industries representing less than 5% of total investments.
46
2011 Annual Report
December 31, 2011
Portfolio of Investments
Global Franchise Portfolio
| | | Shares | | Value
(000) | |
| Common Stocks (96.5%) | |
| Finland (2.4%) | |
| Kone Oyj, Class B | | | 104,508 | | | $ | 5,424 | | |
| France (3.6%) | |
| Legrand SA | | | 253,504 | | | | 8,153 | | |
| Germany (0.7%) | |
| SAP AG | | | 31,944 | | | | 1,689 | | |
| Italy (1.7%) | |
| Davide Campari-Milano SpA | | | 577,925 | | | | 3,848 | | |
| Sweden (3.6%) | |
| Swedish Match AB | | | 233,072 | | | | 8,274 | | |
| Switzerland (9.5%) | |
| Nestle SA (Registered) | | | 363,877 | | | | 20,919 | | |
| Novartis AG (Registered) | | | 11,989 | | | | 686 | | |
| | | | 21,605 | | |
| United Kingdom (29.5%) | |
| Admiral Group PLC | | | 349,628 | | | | 4,626 | | |
| British American Tobacco PLC | | | 446,083 | | | | 21,167 | | |
| Experian PLC | | | 208,131 | | | | 2,830 | | |
| Imperial Tobacco Group PLC | | | 360,451 | | | | 13,631 | | |
| Reckitt Benckiser Group PLC | | | 274,980 | | | | 13,580 | | |
| Unilever PLC | | | 329,411 | | | | 11,065 | | |
| | | | 66,899 | | |
| United States (45.5%) | |
| Accenture PLC, Class A | | | 186,022 | | | | 9,902 | | |
| Dr. Pepper Snapple Group, Inc. | | | 275,461 | | | | 10,875 | | |
| Herbalife Ltd. | | | 131,350 | | | | 6,787 | | |
| Kellogg Co. | | | 187,275 | | | | 9,471 | | |
| Kraft Foods, Inc., Class A | | | 88,113 | | | | 3,292 | | |
| Mead Johnson Nutrition Co. | | | 69,850 | | | | 4,801 | | |
| Microsoft Corp. | | | 395,935 | | | | 10,278 | | |
| Moody's Corp. | | | 93,530 | | | | 3,150 | | |
| Philip Morris International, Inc. | | | 167,528 | | | | 13,148 | | |
| Procter & Gamble Co. (The) | | | 166,904 | | | | 11,134 | | |
| Sara Lee Corp. | | | 343,424 | | | | 6,498 | | |
| Scotts Miracle-Gro Co. (The), Class A | | | 84,796 | | | | 3,959 | | |
| Visa, Inc., Class A | | | 97,365 | | | | 9,885 | | |
| | | | 103,180 | | |
| Total Common Stocks (Cost $199,287) | | | 219,072 | | |
| Short-Term Investment (3.4%) | |
| Investment Company (3.4%) | |
Morgan Stanley Institutional Liquidity
Funds — Government Portfolio —
Institutional Class (See Note G-2) (Cost $7,812) | | | 7,811,785 | | | | 7,812 | | |
| Total Investments (99.9%) (Cost $207,099) | | | 226,884 | | |
| Other Assets in Excess of Liabilities (0.1%) | | | 120 | | |
| Net Assets (100.0%) | | $ | 227,004 | | |
Fair Value Measurement Information:
The following is a summary of the inputs used to value the Portfolio's investments as of December 31, 2011. (See Note A-9 to the financial statements for further information regarding fair value measurement.)
| Investment Type | | Level 1
Unadjusted
quoted
prices
(000) | | Level 2
Other
significant
observable
inputs
(000) | | Level 3
Significant
unobservable
inputs
(000) | | Total
(000) | |
| Assets: | | | | | | | | | |
| Common Stocks | | | | | | | | | |
| Beverages | | $ | 14,723 | | | $ | — | | | $ | — | | | $ | 14,723 | | |
| Chemicals | | | 3,959 | | | | — | | | | — | | | | 3,959 | | |
Diversified Financial
Services | | | 3,150 | | | | — | | | | — | | | | 3,150 | | |
| Electrical Equipment | | | 8,153 | | | | — | | | | — | | | | 8,153 | | |
| Food Products | | | 56,046 | | | | — | | | | — | | | | 56,046 | | |
| Household Products | | | 24,714 | | | | — | | | | — | | | | 24,714 | | |
Information Technology
Services | | | 19,787 | | | | — | | | | — | | | | 19,787 | | |
| Insurance | | | 4,626 | | | | — | | | | — | | | | 4,626 | | |
| Machinery | | | 5,424 | | | | — | | | | — | | | | 5,424 | | |
| Personal Products | | | 6,787 | | | | — | | | | — | | | | 6,787 | | |
| Pharmaceuticals | | | 686 | | | | — | | | | — | | | | 686 | | |
| Professional Services | | | 2,830 | | | | — | | | | — | | | | 2,830 | | |
| Software | | | 11,967 | | | | — | | | | — | | | | 11,967 | | |
| Tobacco | | | 56,220 | | | | — | | | | — | | | | 56,220 | | |
| Total Common Stocks | | | 219,072 | | | | — | | | | — | | | | 219,072 | | |
Short-Term Investment —
Investment Company | | | 7,812 | | | | — | | | | — | | | | 7,812 | | |
| Total Assets | | $ | 226,884 | | | $ | — | | | $ | — | | | $ | 226,884 | | |
Transfers between investment levels may occur as the markets fluctuate and/or the availability of data used in an investment's valuation changes. The Portfolio recognizes transfers between the levels as of the end of the period. As of December 31, 2011, the Portfolio did not have any significant investments transfer between investment levels.
The accompanying notes are an integral part of the financial statements.
47
2011 Annual Report
December 31, 2011
Investment Overview (unaudited)
Global Insight Portfolio
The Global Insight Portfolio (the "Portfolio") seeks long-term capital appreciation.
Performance
For the period from inception on December 28, 2011 through December 31, 2011, the Portfolio had a total return based on net asset value per share of 0.70%, net of fees, for Class I shares. The Portfolio's Class I shares underperformed against its benchmark, the MSCI All Country World Index (the "Index"), which returned 1.15% for the same period.
Factors Affecting Performance
• The Portfolio launched a few days prior to the close of the reporting period. Such a short time frame would not provide a meaningful performance analysis as short-term returns may not be indicative of the Portfolio's long-term performance potential.
Management Strategies
• We seek to invest primarily in established and cyclical franchise companies located throughout the world that we believe have strong name recognition, sustainable competitive advantages, and ample growth prospects, and are trading at an attractive discount to future cash flow generation capacity or asset value. We typically favor companies with the ability to generate attractive free cash flow yields. We utilize a bottom-up stock selection process, seeking attractive investments on an individual company basis. The companies we consider have market capitalizations within the range of companies included in the MSCI All Country World Index.
• We continue to focus on assessing company prospects over a three- to five-year time horizon and on owning a portfolio of high-quality companies with diverse business drivers not tied to a particular market environment.
Performance Compared to the Morgan Stanley Capital International (MSCI) All Country World Index(1) and the Lipper Global Multi-Cap Value Funds Index(2)
| | | Period Ended December 31, 2011 | |
| | | Total Returns(3) | |
| | | One
Year | | Five
Years | | Ten
Years | | Cumulative
Since
Inception(5) | |
Portfolio — Class I Shares
w/o sales charges(4) | | | — | | | | — | | | | — | | | | 0.70 | % | |
| MSCI All Country World Index | | | — | | | | — | | | | — | | | | 1.15 | | |
Lipper Global Multi-Cap Value
Funds Index | | | — | | | | — | | | | — | | | | 1.16 | | |
Portfolio — Class H Shares
w/o sales charges(4) | | | — | | | | — | | | | — | | | | 0.70 | | |
Portfolio — Class H Shares with
maximum 4.75% sales charges(4) | | | — | | | | — | | | | — | | | | –4.10 | | |
| MSCI All Country World Index | | | — | | | | — | | | | — | | | | 1.15 | | |
Lipper Global Multi-Cap Value
Funds Index | | | — | | | | — | | | | — | | | | 1.16 | | |
Portfolio — Class L Shares
w/o sales charges(4) | | | — | | | | — | | | | — | | | | 0.70 | | |
| MSCI All Country World Index | | | — | | | | — | | | | — | | | | 1.15 | | |
Lipper Global Multi-Cap Value
Funds Index | | | — | | | | — | | | | — | | | | 1.16 | | |
Performance data quoted represents past performance, which is no guarantee of future results, and current performance may be lower or higher than the figures shown. Performance assumes that all dividends and distributions, if any, were reinvested. For the most recent month-end performance figures, please visit www.morganstanley.com/im. Investment return and principal value will fluctuate so that Portfolio shares, when redeemed, may be worth more or less than their original cost. Total returns do not reflect the deduction of taxes that a shareholder would pay on Portfolio distributions or the redemption of Portfolio shares. Performance of share classes will vary due to difference in expenses.
(1) The Morgan Stanley Capital International (MSCI) All Country World Index (ACWI) is a free float-adjusted market capitalization weighted index designed to measure the equity market performance of developed and emerging markets. The term "free float" represents the portion of shares outstanding that are deemed to be available for purchase in the public equity markets by investors. The performance of the Index is listed in U.S. dollars and assumes reinvestment of net dividends. The Index is unmanaged and its returns do not include any sales charges or fees. Such costs would lower performance. It is not possible to invest directly in an index.
(2) The Lipper Global Multi-Cap Value Funds Index is an equally weighted performance index of the largest qualifying funds (based on net assets) in the Lipper Global Multi-Cap Value Funds classification. The Index, which is adjusted for capital gains distributions and income dividends, is unmanaged and should not be considered an investment. There are currently 10 funds represented in this Index. As of the date of this report, the Portfolio is in the Lipper Global Multi-Cap Value Funds classification.
(3) Total returns for the Portfolio reflect fees waived and expenses reimbursed, if applicable, by the Adviser. Without such waivers and reimbursements, total returns would have been lower. The fee waivers and/or expense reimbursements will continue for one year or until such time as the Fund's Board of Directors acts to discontinue all or a portion of such waivers and/or expense reimbursements when it deems that such action is appropriate.
(4) Commenced operations on December 28, 2011.
(5) For comparative purposes, average annual since inception returns listed for the Indexes refer to the inception date or initial offering of the respective share class of the Portfolio, not the inception of the Index. Returns for periods less than one year are not annualized.
48
2011 Annual Report
December 31, 2011
Investment Overview (unaudited) (cont'd)
Global Insight Portfolio
Portfolio Composition
| Classification | | Percentage of
Total Investments | |
| Short-Term Investments | | | 41.8 | % | |
| Other* | | | 38.7 | | |
| Industrial Conglomerates | | | 7.2 | | |
| Food Products | | | 7.0 | | |
| Chemicals | | | 5.3 | | |
| Total Investments | | | 100.0 | % | |
* Industries representing less than 5% of total investments.
49
2011 Annual Report
December 31, 2011
Portfolio of Investments
Global Insight Portfolio
| | | Shares | | Value
(000) | |
| Common Stocks (83.7%) | |
| Australia (3.9%) | |
| DuluxGroup Ltd. | | | 5,556 | | | $ | 16 | | |
| Treasury Wine Estates Ltd. | | | 4,403 | | | | 17 | | |
| | | | 33 | | |
| Belgium (2.0%) | |
| Anheuser-Busch InBev N.V. | | | 273 | | | | 17 | | |
| Brazil (3.8%) | |
| Vale SA (Preference) | | | 1,588 | | | | 32 | | |
| Canada (12.0%) | |
| Brookfield Asset Management, Inc., Class A | | | 1,213 | | | | 33 | | |
| Fairfax Financial Holdings Ltd. | | | 39 | | | | 17 | | |
| Potash Corp. of Saskatchewan, Inc. | | | 789 | | | | 32 | | |
| Whistler Blackcomb Holdings, Inc. | | | 1,673 | | | | 18 | | |
| | | | 100 | | |
| France (12.0%) | |
| Christian Dior SA | | | 418 | | | | 49 | | |
| Etablissements Maurel et Prom | | | 1,093 | | | | 17 | | |
| Eurazeo | | | 945 | | | | 34 | | |
| | | | 100 | | |
| Germany (1.9%) | |
| Beiersdorf AG | | | 291 | | | | 16 | | |
| Greece (2.0%) | |
Hellenic Exchanges SA Holding Clearing
Settlement and Registry | | | 4,413 | | | | 16 | | |
| Hong Kong (6.3%) | |
| Shangri-La Asia Ltd. | | | 20,000 | | | | 35 | | |
| Swire Pacific Ltd. | | | 1,500 | | | | 18 | | |
| | | | 53 | | |
| Japan (2.3%) | |
| Universal Entertainment Corp. | | | 700 | | | | 19 | | |
| Marshall Islands (2.0%) | |
| Diana Containerships, Inc. | | | 3,150 | | | | 17 | | |
| Netherlands (6.1%) | |
| Koninklijke Philips Electronics N.V. | | | 2,405 | | | | 51 | | |
| Norway (2.0%) | |
| Orkla ASA | | | 2,228 | | | | 17 | | |
| Singapore (2.3%) | |
| Jardine Matheson Holdings Ltd. | | | 400 | | | | 19 | | |
| Spain (1.4%) | |
| Baron de Ley (a) | | | 207 | | | | 12 | | |
| Sweden (2.0%) | |
| Byggmax Group AB | | | 4,324 | | | | 17 | | |
| Switzerland (6.0%) | |
| Nestle SA (Registered) | | | 876 | | | | 50 | | |
| Turkey (4.0%) | |
| Is Gayrimenkul Yatirim Ortakligi REIT | | | 30,790 | | | | 16 | | |
| Ulker Biskuvi Sanayi | | | 6,016 | | | | 17 | | |
| | | | 33 | | |
| | | Shares | | Value
(000) | |
| United States (11.7%) | |
| CF Industries Holdings, Inc. | | | 114 | | | $ | 16 | | |
| Diana Shipping, Inc. (a) | | | 2,139 | | | | 16 | | |
| Motorola Solutions, Inc. | | | 1,053 | | | | 49 | | |
| Sara Lee Corp. | | | 878 | | | | 17 | | |
| | | | 98 | | |
| Total Common Stocks (Cost $694) | | | 700 | | |
| Short-Term Investment (60.2%) | |
| Investment Company (60.2%) | |
Morgan Stanley Institutional Liquidity
Funds — Money Market Portfolio —
Institutional Class (See Note G-2) (Cost $503) | | | 503,271 | | | | 503 | | |
| Total Investments (143.9%) (Cost $1,197) | | | 1,203 | | |
| Liabilities in Excess of Other Assets (-43.9%) | | | (367 | ) | |
| Net Assets (100.0%) | | $ | 836 | | |
(a) Non-income producing security.
REIT Real Estate Investment Trust.
Fair Value Measurement Information:
The following is a summary of the inputs used to value the Portfolio's investments as of December 31, 2011. (See Note A-9 to the financial statements for further information regarding fair value measurement.)
| Investment Type | | Level 1
Unadjusted
quoted
prices
(000) | | Level 2
Other
significant
observable
inputs
(000) | | Level 3
Significant
unobservable
inputs
(000) | | Total
(000) | |
| Assets: | | | | | | | | | |
| Common Stocks | | | | | | | | | |
| Beverages | | $ | 46 | | | $ | — | | | $ | — | | | $ | 46 | | |
| Chemicals | | | 64 | | | | — | | | | — | | | | 64 | | |
Communications
Equipment | | | 49 | | | | — | | | | — | | | | 49 | | |
Diversified Financial
Services | | | 50 | | | | — | | | | — | | | | 50 | | |
| Food Products | | | 84 | | | | — | | | | — | | | | 84 | | |
Hotels, Restaurants &
Leisure | | | 53 | | | | — | | | | — | | | | 53 | | |
| Industrial Conglomerates | | | 87 | | | | — | | | | — | | | | 87 | | |
| Insurance | | | 17 | | | | — | | | | — | | | | 17 | | |
Leisure Equipment &
Products | | | 19 | | | | — | | | | — | | | | 19 | | |
| Marine | | | 33 | | | | — | | | | — | | | | 33 | | |
| Metals & Mining | | | 32 | | | | — | | | | — | | | | 32 | | |
Oil, Gas &
Consumable Fuels | | | 17 | | | | — | | | | — | | | | 17 | | |
| Personal Products | | | 16 | | | | — | | | | — | | | | 16 | | |
Real Estate
Investment Trusts
(REITs) | | | 16 | | | | — | | | | — | | | | 16 | | |
The accompanying notes are an integral part of the financial statements.
50
2011 Annual Report
December 31, 2011
Portfolio of Investments (cont'd)
Global Insight Portfolio
Fair Value Measurement Information: (cont'd)
| Investment Type | | Level 1
Unadjusted
quoted
prices
(000) | | Level 2
Other
significant
observable
inputs
(000) | | Level 3
Significant
unobservable
inputs
(000) | | Total
(000) | |
| Common Stocks (cont'd) | | | | | | | | | |
Real Estate
Management &
Development | | $ | 51 | | | $ | — | | | $ | — | | | $ | 51 | | |
| Specialty Retail | | | 17 | | | | — | | | | — | | | | 17 | | |
Textiles, Apparel &
Luxury Goods | | | 49 | | | | — | | | | — | | | | 49 | | |
| Total Common Stocks | | | 700 | | | | — | | | | — | | | | 700 | | |
Short-Term Investment —
Investment Company | | | 503 | | | | — | | | | — | | | | 503 | | |
| Total Assets | | $ | 1,203 | | | $ | — | | | $ | — | | | $ | 1,203 | | |
Transfers between investment levels may occur as the markets fluctuate and/or the availability of data used in an investment's valuation changes. The Porfolio recognizes transfers between the levels as of the end of the period. As of December 31, 2011, the Portfolio did not have any significant investments transfer between investment levels.
The accompanying notes are an integral part of the financial statements.
51
2011 Annual Report
December 31, 2011
Investment Overview (unaudited)
Global Opportunity Portfolio
The Global Opportunity Portfolio (the "Portfolio") seeks long-term capital appreciation by investing primarily in established and emerging franchise companies located throughout the world, with capitalizations within the range of companies included in the MSCI All Country World Index.
Performance
For the year ended December 31, 2011, the Portfolio had a total return based on net asset value and reinvestment of distributions per share of -4.90%, net of fees, for Class I shares. The Portfolio's Class I shares outperformed against its benchmark, the MSCI All Country World Index (the "Index"), which returned -7.35%.
Factors Affecting Performance
• Global equity markets began 2011 on a relatively optimistic note but suffered a stream of disappointments as the year progressed, falling 7.35% for the year overall (as measured by the Index). Headwinds to the markets' progress included lackluster economic growth in the developed world, fears about a "hard landing" in China's economy, the worsening European debt crisis, political dysfunction in the U.S. and Europe, a tragic earthquake and tsunami in Japan, and social and political upheaval across the Middle East. Although corporate balance sheets and earnings in the U.S. and Europe remained strong throughout the year, waning investor confidence kept markets volatile. The U.S. market outperformed those of Europe, Japan, and Asia ex-Japan, and developed market equities bested emerging market equities. (The performance of regional markets and developed and emerging markets is measured by their respective MSCI indexes.)
• The information technology sector was the largest contributor to relative outperformance during the period, as both stock selection and an overweight in the sector were additive. A position in a global credit card company led performance.
• Stock selection and an underweight in the financials sector also aided relative performance due to strong performance from a holding in a clearinghouse for over-the-counter (OTC) securities in Brazil and the lack of exposure to bank stocks, a group which performed poorly over the period.
• Stock selection and an overweight in the consumer staples sector were advantageous, with a number of holdings in the food, beverage, and tobacco segment performing well.
• Conversely, stock selection in the consumer discretionary sector hampered relative returns. The largest detractors were holdings in a real estate developer in Brazil and a tutoring services provider in China.
• Stock selection in industrials diminished relative gains as well, mostly due to weak performance from holdings in the transportation industry.
• The Portfolio's underweight exposure to health care, a sector which performed well during the period, and the negative performance of its sole holding in the sector, a generic drug maker, were detractors from relative gains.
Management Strategies
• We look for high-quality growth companies that have these attributes: sustainable competitive advantages, business visibility, rising return on invested capital, free cash flow and a favorable risk/reward profile. In seeking these companies, we use intense fundamental research. Our emphasis is on secular growth, and as a result, short-term market events are not as meaningful in the stock selection process.
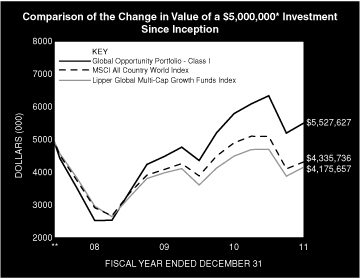
* Minimum Investment
** Commenced Operations on May 30, 2008.
In accordance with SEC regulations, Portfolio's performance shown assumes that all recurring fees (including management fees) were deducted and all dividends and distributions were reinvested. The performance of Class P, Class H, and Class L shares will vary from the Class I shares based upon different inception dates and will be negatively impacted by additional fees assessed to these classes.
52
2011 Annual Report
December 31, 2011
Investment Overview (unaudited) (cont'd)
Global Opportunity Portfolio
Performance Compared to the Morgan Stanley Capital International (MSCI) All Country World Index(1) and the Lipper Global Multi-Cap Growth Index(2)
| | | Period Ended December 31, 2011 | |
| | | Total Returns(3) | |
| | | | | Average Annual | |
| | | One
Year | | Five
Years | | Ten
Years | | Since
Inception(5) | |
Portfolio — Class I Shares
w/o sales charges(4) | | | –4.90 | % | | | — | | | | — | | | | 2.83 | % | |
| MSCI All Country World Index | | | –7.35 | | | | — | | | | — | | | | –4.90 | | |
Lipper Global Multi-Cap Growth
Funds Index | | | –11.85 | | | | — | | | | — | | | | –3.90 | | |
Portfolio — Class H Shares
w/o sales charges(4) | | | –5.18 | | | | — | | | | — | | | | 2.60 | | |
Portfolio — Class H Shares
with maximum 4.75%
sales charges(4) | | | –9.64 | | | | — | | | | — | | | | 1.22 | | |
| MSCI All Country World Index | | | –7.35 | | | | — | | | | — | | | | –4.90 | | |
Lipper Global Multi-Cap Growth
Funds Index | | | –11.85 | | | | — | | | | — | | | | –3.90 | | |
Portfolio — Class L Shares
w/o sales charges(4) | | | –5.19 | | | | — | | | | — | | | | 2.51 | | |
| MSCI All Country World Index | | | –7.35 | | | | — | | | | — | | | | –4.90 | | |
Lipper Global Multi-Cap Growth
Funds Index | | | –11.85 | | | | — | | | | — | | | | –3.90 | | |
Portfolio — Class P Shares
w/o sales charges(4) | | | –5.16 | | | | — | | | | — | | | | 16.07 | | |
| MSCI All Country World Index | | | –7.35 | | | | — | | | | — | | | | 7.82 | | |
Lipper Global Multi-Cap Growth
Funds Index | | | –11.85 | | | | — | | | | — | | | | 6.69 | | |
Performance data quoted represents past performance, which is no guarantee of future results, and current performance may be lower or higher than the figures shown. Performance assumes that all dividends and distributions, if any, were reinvested. For the most recent month-end performance figures, please visit www.morganstanley.com/im. Investment return and principal value will fluctuate so that Portfolio shares, when redeemed, may be worth more or less than their original cost. Total returns do not reflect the deduction of taxes that a shareholder would pay on Portfolio distributions or the redemption of Portfolio shares. Performance of share classes will vary due to difference in sales charges and expenses.
(1) The Morgan Stanley Capital International (MSCI) All Country World Index (ACWI) is a free float-adjusted market capitalization weighted index designed to measure the equity market performance of developed and emerging markets. The term "free float" represents the portion of shares outstanding that are deemed to be available for purchase in the public equity markets by investors. The performance of the Index is listed in U.S. dollars and assumes reinvestment of net dividends. The Index is unmanaged and its returns do not include any sales charges or fees. Such costs would lower performance. It is not possible to invest directly in an index.
(2) The Lipper Global Multi-Cap Growth Funds Index is an equally weighted performance index of the largest qualifying funds (based on net assets) in the Lipper Global Multi-Cap Growth Funds classification. The Index, which is adjusted for capital gains distributions and income dividends, is unmanaged and should not be considered an investment. There are currently 30 funds represented in this Index. As of the date of this report, the Portfolio is in the Lipper Global Multi-Cap Growth Funds classification.
(3) Total returns for the Portfolio reflect fees waived and expenses reimbursed, if applicable, by the Adviser. Without such waivers and reimbursements, total returns would have been lower. The fee waivers and/or expense reimbursements will continue for one year or until such time as the Board of Directors acts to discontinue all or a portion of such waivers and/or expense reimbursements when it deems that such action is appropriate. The Distributor has agreed to waive for at least one year the 12b-1 fee on Class L shares of the Portfolio to the extent it exceeds 0.30% of the average daily net assets of such shares on an annualized basis.
(4) On May 21, 2010 Class A, Class B, Class C, and Class I shares of Van Kampen Global Growth Fund ("the Predecessor Fund") were reorganized into Class H, Class H, Class L, and Class I shares of Morgan Stanley Global Growth Portfolio ("the Portfolio"), respectively. Class H, Class L, and Class I shares' returns of the Portfolio will differ from the Predecessor Fund as they have different expenses. Performance shown for the Portfolio's Class I, Class H, and Class L shares reflects the performance of the shares of the Predecessor Fund for periods prior to May 21, 2010. The Class A, C, and I shares of the Predecessor Fund commenced operations on May 30, 2008. Class P shares commenced offering on May 21, 2010. Performance for Class H shares has been restated to reflect the Portfolio's applicable sales charge. In October 2010, the Morgan Stanley Global Growth Portfolio changed its name to the Morgan Stanley Global Opportunity Portfolio.
(5) For comparative purposes, average annual since inception returns listed for the Indexes refer to the inception date or initial offering of the respective share class of the Portfolio, not the inception of the Index.
Portfolio Composition
| Classification | | Percentage of
Total Investments | |
| Other* | | | 55.3 | % | |
| Internet Software & Services | | | 14.0 | | |
| Beverages | | | 10.4 | | |
| Diversified Consumer Services | | | 7.8 | | |
| Internet & Catalog Retail | | | 7.5 | | |
| Computers & Peripherals | | | 5.0 | | |
| Total Investments | | | 100.0 | % | |
* Industries representing less than 5% of total investments.
53
2011 Annual Report
December 31, 2011
Portfolio of Investments
Global Opportunity Portfolio
| | | Shares | | Value
(000) | |
| Common Stocks (91.6%) | |
| Australia (1.1%) | |
| AET&D Holdings No 1 Ltd. (a)(b)(c) | | | 36,846 | | | $ | — | | |
| Lynas Corp. Ltd. (a) | | | 142,229 | | | | 152 | | |
| | | | 152 | | |
| Belgium (2.1%) | |
| Anheuser-Busch InBev N.V. | | | 4,771 | | | | 292 | | |
| Brazil (6.3%) | |
| BM&F Bovespa SA | | | 28,285 | | | | 149 | | |
| Brookfield Incorporacoes SA | | | 87,844 | | | | 233 | | |
CETIP SA - Balcao Organizado de Ativos e
Derivativos | | | 32,953 | | | | 476 | | |
| | | | 858 | | |
| Canada (4.5%) | |
| Brookfield Asset Management, Inc., Class A | | | 13,094 | | | | 360 | | |
| Brookfield Infrastructure Partners LP | | | 9,153 | | | | 253 | | |
| | | | 613 | | |
| China (23.3%) | |
| Baidu, Inc. ADR (a) | | | 5,617 | | | | 654 | | |
| China Merchants Holdings International Co., Ltd. (d) | | | 115,084 | | | | 334 | | |
| Golden Eagle Retail Group Ltd. (d) | | | 206,000 | | | | 436 | | |
New Oriental Education & Technology Group,
Inc. ADR (a) | | | 26,141 | | | | 629 | | |
| Tencent Holdings Ltd. (d) | | | 10,000 | | | | 201 | | |
| Wynn Macau Ltd. (d) | | | 146,800 | | | | 369 | | |
| Xueda Education Group ADR (a) | | | 122,434 | | | | 427 | | |
| Youku.com, Inc. ADR (a) | | | 7,677 | | | | 120 | | |
| | | | 3,170 | | |
| Denmark (3.8%) | |
| DSV A/S | | | 28,709 | | | | 515 | | |
| France (1.5%) | |
| Pernod-Ricard SA | | | 2,133 | | | | 198 | | |
| Germany (1.0%) | |
| BASF SE | | | 2,027 | | | | 141 | | |
| Hong Kong (4.5%) | |
| Minth Group Ltd. | | | 141,800 | | | | 133 | | |
| Sun Art Retail Group Ltd. (a) | | | 378,500 | | | | 473 | | |
| | | | 606 | | |
| India (3.1%) | |
| MakeMyTrip Ltd. (a) | | | 7,711 | | | | 186 | | |
| Mundra Port and Special Economic Zone Ltd. | | | 103,215 | | | | 233 | | |
| | | | 419 | | |
| Israel (1.0%) | |
| Teva Pharmaceutical Industries Ltd. ADR | | | 3,377 | | | | 136 | | |
| Italy (2.3%) | |
| Prada SpA (a)(d) | | | 70,000 | | | | 317 | | |
| Japan (3.9%) | |
| Universal Entertainment Corp. | | | 19,300 | | | | 534 | | |
| Russia (0.6%) | |
| Yandex N.V., Class A (a) | | | 4,051 | | | | 80 | | |
| | | Shares | | Value
(000) | |
| Switzerland (2.5%) | |
| Kuehne & Nagel International AG (Registered) | | | 1,520 | | | $ | 171 | | |
| Panalpina Welttransport Holding AG (Registered) (a) | | | 1,632 | | | | 167 | | |
| | | | 338 | | |
| United Kingdom (1.6%) | |
| Diageo PLC ADR | | | 2,511 | | | | 219 | | |
| United States (28.5%) | |
| Amazon.com, Inc. (a) | | | 3,666 | | | | 635 | | |
| Apple, Inc. (a) | | | 1,684 | | | | 682 | | |
| CME Group, Inc. | | | 748 | | | | 182 | | |
| Google, Inc., Class A (a) | | | 1,274 | | | | 823 | | |
| Greenlight Capital Re Ltd., Class A (a) | | | 15,334 | | | | 363 | | |
| LinkedIn Corp., Class A (a) | | | 383 | | | | 24 | | |
| Mastercard, Inc., Class A | | | 930 | | | | 347 | | |
| Monsanto Co. | | | 2,934 | | | | 206 | | |
| Priceline.com, Inc. (a) | | | 432 | | | | 202 | | |
| Ultra Petroleum Corp. (a) | | | 4,630 | | | | 137 | | |
| Visa, Inc., Class A | | | 2,712 | | | | 275 | | |
| | | | 3,876 | | |
| Total Common Stocks (Cost $10,603) | | | 12,464 | | |
| Convertible Preferred Stocks (1.1%) | |
| China (0.0%) | |
| Youku.com, Inc., Class A (a)(b)(c) | | | 9 | | | | — | @ | |
| United States (1.1%) | |
| Better Place, Inc. (a)(b)(c) | | | 31,331 | | | | 142 | | |
| Total Convertible Preferred Stocks (Cost $78) | | | 142 | | |
| Participation Notes (5.2%) | |
| China (5.2%) | |
Deutsche Bank AG, Kweichow Moutai Co.,
Ltd., Class A, Equity Linked Notes,
Zero Coupon, 3/4/21 | | | 9,050 | | | | 278 | | |
UBS AG, Kweichow Moutai Co., Ltd., Class A,
Equity Linked Notes, Zero Coupon, 2/25/13 | | | 14,080 | | | | 433 | | |
| Total Participation Notes (Cost $564) | | | 711 | | |
| Short-Term Investment (2.1%) | |
| Investment Company (2.1%) | |
Morgan Stanley Institutional Liquidity
Funds — Money Market Portfolio —
Institutional Class (See Note G-2) (Cost $288) | | | 287,959 | | | | 288 | | |
| Total Investments (100.0%) (Cost $11,533) | | | 13,605 | | |
| Other Assets in Excess of Liabilities (-@@%) | | | 6 | | |
| Net Assets (100.0%) | | $ | 13,611 | | |
(a) Non-income producing security.
(b) At December 31, 2011, the Portfolio held fair valued securities valued at approximately $142,000, representing 1.0% of net assets. These securities have been fair valued as determined in good faith under procedures established by and under the general supervision of the Fund's Directors.
(c) Security has been deemed illiquid at December 31, 2011.
(d) Security trades on the Hong Kong exchange.
ADR American Depositary Receipt.
@ Value is less than $500.
@@ Amount is less than 0.05%.
The accompanying notes are an integral part of the financial statements.
54
2011 Annual Report
December 31, 2011
Portfolio of Investments (cont'd)
Global Opportunity Portfolio
Fair Value Measurement Information:
The following is a summary of the inputs used to value the Portfolio's investments as of December 31, 2011. (See Note A-9 to the financial statements for further information regarding fair value measurement.)
| Investment Type | | Level 1
Unadjusted
quoted
prices
(000) | | Level 2
Other
significant
observable
inputs
(000) | | Level 3
Significant
unobservable
inputs
(000) | | Total
(000) | |
| Assets: | | | | | | | | | |
| Common Stocks | | | | | | | | | |
Air Freight &
Logistics | | $ | 167 | | | $ | — | | | $ | — | | | $ | 167 | | |
| Auto Components | | | 133 | | | | — | | | | — | | | | 133 | | |
| Beverages | | | 709 | | | | — | | | | — | | | | 709 | | |
| Capital Markets | | | 476 | | | | — | | | | — | | | | 476 | | |
| Chemicals | | | 347 | | | | — | | | | — | | | | 347 | | |
Computers &
Peripherals | | | 682 | | | | — | | | | — | | | | 682 | | |
Diversified Consumer
Services | | | 1,056 | | | | — | | | | — | | | | 1,056 | | |
Diversified Financial
Services | | | 331 | | | | — | | | | — | | | | 331 | | |
| Electric Utilities | | | 253 | | | | — | | | | — | † | | | 253 | | |
Food & Staples
Retailing | | | 473 | | | | — | | | | — | | | | 473 | | |
Hotels, Restaurants &
Leisure | | | 369 | | | | — | | | | — | | | | 369 | | |
| Household Durables | | | 233 | | | | — | | | | — | | | | 233 | | |
Information
Technology
Services | | | 622 | | | | — | | | | — | | | | 622 | | |
| Insurance | | | 363 | | | | — | | | | — | | | | 363 | | |
Internet & Catalog
Retail | | | 1,023 | | | | — | | | | — | | | | 1,023 | | |
Internet Software &
Services | | | 1,902 | | | | — | | | | — | | | | 1,902 | | |
Leisure Equipment &
Products | | | 534 | | | | — | | | | — | | | | 534 | | |
| Marine | | | 171 | | | | — | | | | — | | | | 171 | | |
| Metals & Mining | | | 152 | | | | — | | | | — | | | | 152 | | |
| Multiline Retail | | | 436 | | | | — | | | | — | | | | 436 | | |
Oil, Gas &
Consumable Fuels | | | 137 | | | | — | | | | — | | | | 137 | | |
| Pharmaceuticals | | | 136 | | | | — | | | | — | | | | 136 | | |
Real Estate
Management &
Development | | | 360 | | | | — | | | | — | | | | 360 | | |
| Road & Rail | | | 515 | | | | — | | | | — | | | | 515 | | |
Textiles, Apparel &
Luxury Goods | | | 317 | | | | — | | | | — | | | | 317 | | |
Transportation
Infrastructure | | | 567 | | | | — | | | | — | | | | 567 | | |
| Total Common Stocks | | | 12,464 | | | | — | | | | — | † | | | 12,464 | | |
| Investment Type | | Level 1
Unadjusted
quoted
prices
(000) | | Level 2
Other
significant
observable
inputs
(000) | | Level 3
Significant
unobservable
inputs
(000) | | Total
(000) | |
Convertible
Preferred Stocks | | $ | — | | | $ | — | | | $ | 142 | | | $ | 142 | | |
| Participation Notes | | | — | | | | 711 | | | | — | | | | 711 | | |
Short-Term
Investment —
Investment Company | | | 288 | | | | — | | | | — | | | | 288 | | |
| Total Assets | | $ | 12,752 | | | $ | 711 | | | $ | 142 | | | $ | 13,605 | | |
Transfers between investment levels may occur as the markets fluctuate and/or the availability of data used in an investment's valuation changes. The Portfolio recognizes transfers between the levels as of the end of the period. As of December 31, 2011, securities with a total value of approximately $432,000 transferred from Level 1 to Level 2. At December 31, 2011, the fair market value of certain securities were adjusted due to developments which occurred between the time of the close of the foreign markets on which they trade and the close of business on the NYSE which resulted in their Level 2 classification.
Following is a reconciliation of investments in which significant unobservable inputs (Level 3) were used in determining fair value.
| | | Common
Stocks
(000) | | Convertible
Preferred
Stocks
(000) | |
| Beginning Balance | | $ | — | † | | $ | 278 | | |
| Purchases | | | — | | | | — | | |
| Sales | | | — | | | | (57 | ) | |
| Amortization of discount | | | — | | | | — | | |
| Transfers in | | | — | | | | — | | |
| Transfers out | | | — | | | | — | | |
| Change in unrealized appreciation (depreciation) | | | — | | | | (79 | ) | |
| Realized gains (losses) | | | — | | | | — | | |
| Ending Balance | | $ | — | † | | $ | 142 | | |
Net change in unrealized appreciation/depreciation
from investments still held as of December 31, 2011 | | $ | — | | | $ | (79 | ) | |
† Includes one or more securities which are valued at zero.
The accompanying notes are an integral part of the financial statements.
55
2011 Annual Report
December 31, 2011
Investment Overview (unaudited)
Global Real Estate Portfolio
The Global Real Estate Portfolio (the "Portfolio") seeks to provide current income and capital appreciation by investing primarily in equity securities of companies in the real estate industry located throughout the world, including real estate operating companies, real estate investment trusts and similar entities established outside the U.S. (foreign real estate companies).
Performance
For the year ended December 31, 2011, the Portfolio had a total return based on net asset value and reinvestment of distributions per share of -9.67%, net of fees, for Class I shares. The Portfolio's Class I shares underperformed against its benchmark, the FTSE EPRA/NAREIT Developed Real Estate Index — Net Total Return to U.S. Investors (the "Index"), which returned -6.00%, and underperformed the Morgan Stanley Capital International (MSCI) World Index, which returned -5.54%.
Factors Affecting Performance
• The global real estate securities market declined 6.00% during the 12-month period ending December 31, 2011, as measured by the Index. Global real estate securities posted gains in the first half of the year, but significantly declined in the third quarter on investor concerns about the prospects for a double-dip recession in the U.S., the European sovereign debt crisis and the risk of a hard landing scenario in China. Subsequently, real estate securities rallied in the fourth quarter, particularly in October as concerns about these factors eased.
• Performance within the European regional portfolio contributed to performance, while the Asian and U.S. portfolios detracted. Top-down global allocation detracted due to the underweight to the U.S. and overweight to Asia. In Asia, the Portfolio benefited from the underweight to Singapore; this was offset by the negative impact of the underweight to Australia, the overweight to Hong Kong, and stock selection in Singapore. In Europe, the Portfolio benefited from the overweight to the U.K. and stock selection within and the underweight to Germany; this was partially offset by relative losses from stock selection in the U.K. In the U.S., the Portfolio benefited from the underweight to the industrial sector and the overweight to the mall sector; this was offset by negative performance from stock selection in the diversified and health care sectors and the overweight to the hotel sector.
Management Strategies
• The global portfolio is comprised of three regional portfolios with a global allocation, which weights each of the three major regions (U.S., Europe, and Asia) based on our view of the relative attractiveness of each region in terms of underlying real estate fundamentals and public market valuations. Moreover, each of the regional portfolios reflects our core investment philosophy as a real estate value investor, which results in the ownership of stocks that we believe provide the best valuation relative to their underlying real estate values, while maintaining portfolio diversification. Our company-specific research leads us to specific preferences for sub-segments within each of the property sectors and countries. For the period ending December 31, 2011, the Portfolio was overweight the Asian listed property sector, modestly underweight the European listed property sector, and underweight the U.S. listed property sector.
• The overweight to the Asian region was predominated by the real estate operating companies (REOCs) in Hong Kong and Japan, as we believe these markets represent attractive valuation opportunities. The Hong Kong REOCs continued to trade at wide discounts to their net asset value (NAV), even after NAVs were modestly revised downward to reflect weakness in residential values and declines in rents/capital values for investment assets. The Japanese REOCs also continued to trade at wide discounts to NAV on continued uncertainty over prospects for underlying property fundamentals. We continue to maintain a preference for the major REOCs with predominant exposure to prime assets given relatively more stable property fundamentals, the ability to engage in value-added opportunities such as development and redevelopment, well-positioned balance sheets, and continued access to financing. This contrasts widely to the Asian REITs, which are passive, externally managed vehicles limited to property ownership, many of which maintain predominant exposure to secondary assets, which have weaker underlying property fundamentals. The Portfolio was underweight the Australian REIT sector on relative valuation.
• In Europe, the Portfolio was overweight the U.K. and underweight the Continent. Valuations on the
56
2011 Annual Report
December 31, 2011
Investment Overview (unaudited) (cont'd)
Global Real Estate Portfolio
Continent ended the period trading at a meaningful discount to NAV based on reported NAVs, which only reflect marginal capital value declines since the start of the credit crisis. Valuations in the U.K. ended the period trading at a significant discount to reported NAVs, which have partially recovered after experiencing significant declines in the two years to June 2009.
• The Portfolio was underweight the U.S., which traded at a premium to NAVs, assuming asset values for high-quality assets are approximately 10% below their all-time peak levels achieved in mid-2007. Some observers noted that the current premium to NAV is comparable to the historical average premium for the U.S. REIT market. Within the U.S., the Portfolio was overweight to a group of companies that are focused in the ownership of upscale urban hotels and a number of out-of-favor companies and underweight to companies concentrated in the ownership of suburban office, health care, and industrial assets.
• Key Asian markets (in particular Hong Kong and Singapore) had witnessed improvements in rents due to strong economies and tenant demand as well as low vacancy levels and limited new supply, but rents experienced some pullback in the second half of 2011 primarily due to uncertainty over global economic conditions. However, the lack of new supply (particularly in Hong Kong) is a key differentiating factor as compared to prior economic slowdowns in this region. Most Western markets (and Japan) have been slowly recovering (or bottoming) from significant declines in rents and occupancies but there are concerns regarding the pace of recovery due to economic weakness and risk of recession (particularly in Europe). Unlike previous real estate cycles, the key risk in these markets is not oversupply. Rather, the key issue is that many markets are close to cyclically high vacancy rates and prospects for a meaningful recovery of tenant demand remain lackluster, particularly as prospects for the global economy have become more uncertain. The expectation for an absence of material job growth also remains a significant concern, although this has been somewhat mitigated by limited new supply.
• We continue to maintain strong conviction in our value-oriented, bottom-up driven investment strategy, which is focused on investing in stocks that offer exposure to the direct property markets at the best relative valuations. In certain market segments, there is a very wide discrepancy between private and public valuations, and relative to other public listed property markets, largely driven by negative sentiment. With regard to current portfolio positioning, we recognize that negative investor sentiment may persist and may impact portfolio performance in the short term, but our strong conviction is based on our fundamental analysis, and we remain committed to our long-term, value-oriented, bottom-up driven investment strategy.
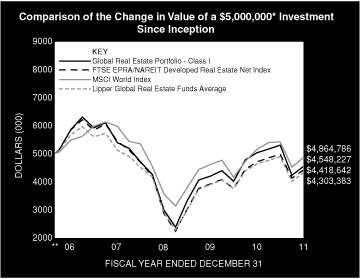
* Minimum Investment
** Commenced Operations on August 30, 2006.
In accordance with SEC regulations, Portfolio's performance shown assumes that all recurring fees (including management fees) were deducted and all dividends and distributions were reinvested. The performance of Class P, Class H, and Class L shares will vary from the Class I shares based upon different inception dates and will be negatively impacted by additional fees assessed to these classes.
57
2011 Annual Report
December 31, 2011
Investment Overview (unaudited) (cont'd)
Global Real Estate Portfolio
Performance Compared to the FTSE EPRA/NAREIT Developed Real Estate Index — Net Total Return to US Investors(1), the Morgan Stanley Capital International (MSCI) World Index(2) and the Lipper Global Real Estate Funds Average(3)
| | | Period Ended December 31, 2011 | |
| | | Total Returns(4) | |
| | | | | Average Annual | |
| | | One
Year | | Five
Years | | Ten
Years | | Since
Inception(8) | |
Portfolio — Class I Shares
w/o sales charges(5) | | | –9.67 | % | | | –4.94 | % | | | — | | | | –1.76 | % | |
FTSE EPRA/NAREIT Developed
Real Estate Index — Net Total
Return to US Investors | | | –6.00 | | | | –5.46 | | | | — | | | | –2.29 | | |
| MSCI World Index | | | –5.54 | | | | –2.37 | | | | — | | | | –0.51 | | |
Lipper Global Real Estate
Funds Average | | | –6.90 | | | | –6.13 | | | | — | | | | –3.46 | | |
Portfolio — Class P Shares
w/o sales charges(5) | | | –9.91 | | | | –5.21 | | | | — | | | | –2.03 | | |
FTSE EPRA/NAREIT Developed
Real Estate Index — Net Total
Return to US Investors | | | –6.00 | | | | –5.46 | | | | — | | | | –2.29 | | |
| MSCI World Index | | | –5.54 | | | | –2.37 | | | | — | | | | –0.51 | | |
Lipper Global Real Estate
Funds Average | | | –6.90 | | | | –6.13 | | | | — | | | | –3.46 | | |
Portfolio — Class H Shares
w/o sales charges(6) | | | –9.90 | | | | — | | | | — | | | | –4.34 | | |
Portfolio — Class H Shares
with maximum | | | –14.13 | | | | — | | | | — | | | | –5.50 | | |
| 4.75% sales charges | | | | | | | | | |
FTSE EPRA/NAREIT Developed
Real Estate Index — Net Total
Return to US Investors | | | –6.00 | | | | — | | | | — | | | | –4.99 | | |
| MSCI World Index | | | –5.54 | | | | — | | | | — | | | | –4.88 | | |
Lipper Global Real Estate
Funds Average | | | –6.90 | | | | — | | | | — | | | | –4.04 | | |
Portfolio — Class L Shares
w/o sales charges(7) | | | –10.33 | | | | — | | | | — | | | | –4.13 | | |
FTSE EPRA/NAREIT Developed
Real Estate Index — Net Total
Return to US Investors | | | –6.00 | | | | — | | | | — | | | | –3.76 | | |
| MSCI World Index | | | –5.54 | | | | — | | | | — | | | | –3.87 | | |
Lipper Global Real Estate
Funds Average | | | –6.90 | | | | — | | | | — | | | | –1.60 | | |
Performance data quoted represents past performance, which is no guarantee of future results, and current performance may be lower or higher than the figures shown. Performance assumes that all dividends and distributions, if any, were reinvested. For the most recent month-end performance figures, please visit www.morganstanley.com/im. Investment return and principal value will fluctuate so that Portfolio shares, when redeemed, may be worth more or less than their original cost. Total returns do not reflect the deduction of taxes that a shareholder would pay on Portfolio distributions or the redemption of Portfolio shares. Performance of share classes will vary due to difference in expenses.
(1) The FTSE EPRA/NAREIT Developed Real Estate Index — Net Total Return to US Investors is a market capitalization weighted index designed to reflect the stock performance of companies engaged in the North American, European and Asian real estate markets. The performance of the Index is listed in U.S. dollars and assumes reinvestment of dividends. "Net Total Return to US investors" reflects a reduction in total returns after taking into account the withholding tax on dividends by certain foreign countries represented in the Index for periods after 1/31/05 (gross returns used prior to 1/31/05). The Index is unmanaged and its returns do not include any sales charges or fees. Such costs would lower performance. It is not possible to invest directly in an index.
(1) The Morgan Stanley Capital International (MSCI) World Index is a free float-adjusted market capitalization weighted index that is designed to measure the global equity market performance of developed markets. The term "free float" represents the portion of shares outstanding that are deemed to be available for purchase in the public equity markets by investors. The MSCI World Index currently consists of 24 developed market country indices. The performance of the Index is listed in U.S. dollars and assumes reinvestment of net dividends. The Index is unmanaged and its returns do not include any sales charges or fees. Such costs would lower performance. It is not possible to invest directly in an index.
(3) The Lipper Global Real Estate Funds Average tracks the performance of all funds in the Lipper Global Real Estate Funds classification. The Average, which is adjusted for capital gains distributions and income dividends, is unmanaged and should not be considered an investment. As of the date of this report, the Portfolio was in the Lipper Global Real Estate Funds classification.
(4) Total returns for the Portfolio reflect fees waived and expenses reimbursed, if applicable, by the Adviser. Without such waivers and reimbursements, total returns would have been lower. The fee waivers and/or expense reimbursements will continue for one year or until such time as the Fund's Board of Directors acts to discontinue all or a portion of such waivers and/or expense reimbursements when it deems that such action is appropriate.
(5) Commenced operations on August 30, 2006.
(6) Commenced offering on January 2. 2008.
(7) Commenced offering on June 16, 2008.
(8) For comparative purposes, average annual since inception returns listed for the Indexes refer to the inception date or initial offering of the respective share class of the Portfolio, not the inception of the Index.
Portfolio Composition
| Classification | | Percentage of
Total Investments | |
| Diversified | | | 35.5 | % | |
| Retail | | | 20.8 | | |
| Residential | | | 12.6 | | |
| Office | | | 11.0 | | |
| Other* | | | 9.4 | | |
| Lodging/Resorts | | | 5.4 | | |
| Health Care | | | 5.3 | | |
| Total Investments | | | 100.0 | % | |
* Industries representing less than 5% of total investments.
58
2011 Annual Report
December 31, 2011
Portfolio of Investments
Global Real Estate Portfolio
| | | Shares | | Value
(000) | |
| Common Stocks (96.4%) | |
| Australia (7.9%) | |
| CFS Retail Property Trust REIT | | | 4,621,900 | | | $ | 7,966 | | |
| Commonwealth Property Office Fund REIT | | | 789,340 | | | | 771 | | |
Dexus Property Group REIT (Stapled
Securities) (a) | | | 9,041,036 | | | | 7,675 | | |
| Goodman Group REIT (Stapled Securities) (a) | | | 14,290,566 | | | | 8,331 | | |
| GPT Group REIT (Stapled Securities) (a) | | | 5,065,383 | | | | 15,905 | | |
| Mirvac Group REIT (Stapled Securities) (a)(b) | | | 4,713,829 | | | | 5,689 | | |
| Stockland REIT (Stapled Securities) (a)(b) | | | 3,643,722 | | | | 11,889 | | |
| Westfield Group REIT (Stapled Securities) (a)(b) | | | 5,144,967 | | | | 41,098 | | |
| Westfield Retail Trust REIT | | | 7,208,707 | | | | 18,359 | | |
| | | | 117,683 | | |
| Austria (0.1%) | |
| Atrium European Real Estate Ltd. | | | 306,973 | | | | 1,396 | | |
| Conwert Immobilien Invest SE | | | 34,318 | | | | 381 | | |
| | | | 1,777 | | |
| Belgium (0.1%) | |
| Befimmo SCA Sicafi REIT | | | 10,056 | | | | 654 | | |
| Cofinimmo REIT | | | 1,702 | | | | 200 | | |
| | | | 854 | | |
| Brazil (0.3%) | |
| BR Malls Participacoes SA | | | 10,680 | | | | 104 | | |
| BR Properties SA | | | 184,900 | | | | 1,834 | | |
| Iguatemi Empresa de Shopping Centers SA | | | 114,000 | | | | 2,118 | | |
| | | | 4,056 | | |
| Canada (1.6%) | |
| Boardwalk REIT | | | 135,390 | | | | 6,704 | | |
| Brookfield Office Properties Canada REIT | | | 39,451 | | | | 942 | | |
| Calloway REIT | | | 42,287 | | | | 1,111 | | |
| Extendicare REIT | | | 193,240 | | | | 1,612 | | |
| RioCan REIT | | | 526,565 | | | | 13,661 | | |
| | | | 24,030 | | |
| China (4.3%) | |
| China Overseas Land & Investment Ltd. (c) | | | 17,073,240 | | | | 28,534 | | |
| China Resources Land Ltd. (c) | | | 15,709,000 | | | | 25,242 | | |
Guangzhou R&F Properties Co., Ltd.,
H Shares (c) | | | 13,002,300 | | | | 10,279 | | |
| | | | 64,055 | | |
| Finland (0.3%) | |
| Citycon Oyj | | | 476,353 | | | | 1,424 | | |
| Sponda Oyj | | | 683,379 | | | | 2,760 | | |
| | | | 4,184 | | |
| France (3.6%) | |
| Fonciere Des Regions REIT | | | 60,184 | | | | 3,864 | | |
| Gecina SA REIT | | | 39,071 | | | | 3,287 | | |
| ICADE REIT | | | 52,143 | | | | 4,103 | | |
| Klepierre REIT | | | 318,073 | | | | 9,073 | | |
| Mercialys SA REIT | | | 38,108 | | | | 1,228 | | |
| Societe de la Tour Eiffel REIT | | | 14,182 | | | | 705 | | |
| | | Shares | | Value
(000) | |
Societe Immobiliere de Location pour
l'Industrie et le Commerce REIT | | | 20,297 | | | $ | 1,968 | | |
| Unibail-Rodamco SE REIT | | | 166,318 | | | | 29,899 | | |
| | | | 54,127 | | |
| Germany (0.5%) | |
| Alstria Office AG REIT | | | 366,575 | | | | 4,363 | | |
| Deutsche Euroshop AG | | | 28,053 | | | | 901 | | |
| Prime Office AG REIT (d) | | | 367,999 | | | | 2,070 | | |
| | | | 7,334 | | |
| Hong Kong (14.9%) | |
| Hang Lung Properties Ltd. | | | 4,515,000 | | | | 12,848 | | |
| Henderson Land Development Co., Ltd. | | | 2,201,440 | | | | 10,941 | | |
| Hongkong Land Holdings Ltd. | | | 8,896,000 | | | | 40,388 | | |
| Hysan Development Co., Ltd. | | | 4,466,231 | | | | 14,664 | | |
| Kerry Properties Ltd. | | | 5,744,720 | | | | 19,010 | | |
| Link REIT (The) | | | 897,000 | | | | 3,303 | | |
| New World Development , Ltd. | | | 5,307,825 | | | | 4,278 | | |
| Sino Land Co., Ltd. | | | 2,790,202 | | | | 3,973 | | |
| Sun Hung Kai Properties Ltd. | | | 7,294,712 | | | | 91,435 | | |
| Swire Pacific Ltd. | | | 145,000 | | | | 1,750 | | |
| Wharf Holdings Ltd. | | | 4,080,763 | | | | 18,443 | | |
| | | | 221,033 | | |
| Italy (0.2%) | |
| Beni Stabili SpA | | | 8,202,184 | | | | 3,671 | | |
| Japan (8.3%) | |
| Japan Real Estate Investment Corp. REIT | | | 738 | | | | 5,753 | | |
| Mitsubishi Estate Co., Ltd. | | | 2,954,000 | | | | 44,135 | | |
| Mitsui Fudosan Co., Ltd. | | | 2,642,000 | | | | 38,513 | | |
| Nippon Building Fund, Inc. REIT | | | 623 | | | | 5,099 | | |
| NTT Urban Development Corp. | | | 1,171 | | | | 799 | | |
| Sumitomo Realty & Development Co., Ltd. | | | 1,632,000 | | | | 28,582 | | |
| | | | 122,881 | | |
| Malta (0.0%) | |
| BGP Holdings PLC (d)(e) | | | 12,867,024 | | | | — | | |
| Netherlands (1.1%) | |
| Corio N.V. REIT | | | 183,603 | | | | 7,986 | | |
| Eurocommercial Properties N.V. CVA REIT | | | 191,929 | | | | 6,093 | | |
| Vastned Retail N.V. REIT | | | 3,303 | | | | 148 | | |
| Wereldhave N.V. REIT | | | 34,175 | | | | 2,269 | | |
| | | | 16,496 | | |
| Norway (0.0%) | |
| Norwegian Property ASA | | | 595,231 | | | | 732 | | |
| Singapore (1.7%) | |
| CapitaCommercial Trust REIT | | | 1,714,000 | | | | 1,394 | | |
| CapitaLand Ltd. | | | 8,120,000 | | | | 13,835 | | |
| CapitaMall Trust REIT | | | 416,000 | | | | 545 | | |
| CapitaMalls Asia Ltd. | | | 1,028,000 | | | | 896 | | |
| City Developments Ltd. | | | 723,000 | | | | 4,961 | | |
| Keppel Land Ltd. | | | 938,705 | | | | 1,607 | | |
| Suntec REIT | | | 1,612,000 | | | | 1,336 | | |
| | | | 24,574 | | |
The accompanying notes are an integral part of the financial statements.
59
2011 Annual Report
December 31, 2011
Portfolio of Investments (cont'd)
Global Real Estate Portfolio
| | | Shares | | Value
(000) | |
| Sweden (0.6%) | |
| Atrium Ljungberg AB, Class B | | | 164,980 | | | $ | 1,756 | | |
| Castellum AB | | | 46,751 | | | | 579 | | |
| Fabege AB | | | 101,669 | | | | 796 | | |
| Hufvudstaden AB, Class A | | | 521,843 | | | | 5,312 | | |
| | | | 8,443 | | |
| Switzerland (0.8%) | |
| PSP Swiss Property AG (Registered) (d) | | | 118,666 | | | | 9,930 | | |
| Swiss Prime Site AG (Registered) (d) | | | 27,173 | | | | 2,041 | | |
| | | | 11,971 | | |
| United Kingdom (6.2%) | |
| Big Yellow Group PLC REIT | | | 1,160,813 | | | | 4,422 | | |
| British Land Co., PLC REIT | | | 1,623,298 | | | | 11,660 | | |
| Capital & Counties Properties PLC | | | 529,552 | | | | 1,518 | | |
| Capital & Regional PLC (d) | | | 3,736,945 | | | | 1,843 | | |
| Capital Shopping Centres Group PLC REIT | | | 978,019 | | | | 4,744 | | |
| Derwent London PLC REIT | | | 156,247 | | | | 3,785 | | |
| Development Securities PLC | | | 338,808 | | | | 789 | | |
| Grainger PLC | | | 1,915,024 | | | | 3,182 | | |
| Great Portland Estates PLC REIT | | | 468,516 | | | | 2,350 | | |
| Hammerson PLC REIT | | | 2,264,836 | | | | 12,662 | | |
| Land Securities Group PLC REIT | | | 1,807,175 | | | | 17,836 | | |
| London & Stamford Property PLC | | | 367,200 | | | | 616 | | |
| LXB Retail Properties PLC (d) | | | 2,895,819 | | | | 4,688 | | |
| Metric Property Investments PLC REIT | | | 1,343,883 | | | | 1,774 | | |
| Quintain Estates & Development PLC (d) | | | 3,282,302 | | | | 1,924 | | |
| Safestore Holdings PLC | | | 2,590,902 | | | | 4,024 | | |
| Segro PLC REIT | | | 1,365,886 | | | | 4,423 | | |
| Shaftesbury PLC REIT | | | 178,399 | | | | 1,294 | | |
| ST Modwen Properties PLC | | | 2,027,392 | | | | 3,558 | | |
| Unite Group PLC | | | 1,924,373 | | | | 5,021 | | |
| | | | 92,113 | | |
| United States (43.9%) | |
| Acadia Realty Trust REIT | | | 264,481 | | | | 5,327 | | |
Apartment Investment & Management Co.,
Class A REIT | | | 941,068 | | | | 21,560 | | |
| Ashford Hospitality Trust, Inc. REIT | | | 327,820 | | | | 2,623 | | |
| Assisted Living Concepts, Inc., Class A | | | 238,038 | | | | 3,544 | | |
| AvalonBay Communities, Inc. REIT | | | 145,670 | | | | 19,025 | | |
| BioMed Realty Trust, Inc. REIT | | | 67,400 | | | | 1,219 | | |
| Boston Properties, Inc. REIT | | | 290,735 | | | | 28,957 | | |
| BRE Properties, Inc. REIT | | | 119,020 | | | | 6,008 | | |
| Brookfield Office Properties, Inc. | | | 1,327,226 | | | | 20,758 | | |
| Cabot Industrial Value Fund III, LP REIT (d)(e)(f)(g) | | | 6,512 | | | | 3,377 | | |
| Camden Property Trust REIT | | | 148,850 | | | | 9,264 | | |
| Capital Senior Living Corp. (d) | | | 70,600 | | | | 561 | | |
| CommonWealth REIT | | | 148,560 | | | | 2,472 | | |
| Coresite Realty Corp. REIT | | | 87,330 | | | | 1,556 | | |
| Cousins Properties, Inc. REIT | | | 1,100,345 | | | | 7,053 | | |
| CreXus Investment Corp. REIT | | | 65,150 | | | | 676 | | |
| DCT Industrial Trust, Inc. REIT | | | 1,020,670 | | | | 5,226 | | |
| Digital Realty Trust, Inc. REIT | | | 38,980 | | | | 2,599 | | |
| | | Shares | | Value
(000) | |
| Douglas Emmett, Inc. REIT | | | 61,590 | | | $ | 1,123 | | |
| Equity Lifestyle Properties, Inc. REIT | | | 179,821 | | | | 11,992 | | |
| Equity Residential REIT | | | 958,941 | | | | 54,688 | | |
| Exeter Industrial Value Fund, LP REIT (d)(e)(f)(g) | | | 1,860,000 | | | | 1,644 | | |
| Federal Realty Investment Trust REIT | | | 84,364 | | | | 7,656 | | |
| Forest City Enterprises, Inc., Class A (d) | | | 1,806,042 | | | | 21,347 | | |
| General Growth Properties, Inc. REIT | | | 2,294,918 | | | | 34,470 | | |
| HCP, Inc. REIT | | | 697,406 | | | | 28,894 | | |
| Health Care, Inc. REIT | | | 108,790 | | | | 5,932 | | |
| Healthcare Realty Trust, Inc. REIT | | | 963,177 | | | | 17,905 | | |
| Host Hotels & Resorts, Inc. REIT | | | 2,775,662 | | | | 40,997 | | |
| Hudson Pacific Properties, Inc. REIT | | | 219,970 | | | | 3,115 | | |
| KTR Industrial Fund II LP REIT (d)(e)(f)(g) | | | 4,268,750 | | | | 4,986 | | |
| Kite Realty Group Trust REIT | | | 66,590 | | | | 300 | | |
| Lexington Realty Trust REIT | | | 27,020 | | | | 202 | | |
| Liberty Property Trust REIT | | | 50,859 | | | | 1,571 | | |
| Mack-Cali Realty Corp. REIT | | | 419,418 | | | | 11,194 | | |
| Omega Healthcare Investors, Inc. REIT | | | 169,750 | | | | 3,285 | | |
| Parkway Properties, Inc. REIT | | | 57,798 | | | | 570 | | |
| ProLogis, Inc. REIT | | | 577,581 | | | | 16,513 | | |
| PS Business Parks, Inc. REIT | | | 49,153 | | | | 2,724 | | |
| Public Storage REIT | | | 186,765 | | | | 25,112 | | |
| Regency Centers Corp. REIT | | | 855,711 | | | | 32,192 | | |
| Retail Opportunity Investments Corp. REIT | | | 336,883 | | | | 3,989 | | |
| Senior Housing Properties Trust REIT | | | 705,762 | | | | 15,837 | | |
| Simon Property Group, Inc. REIT | | | 602,884 | | | | 77,736 | | |
| SL Green Realty Corp. REIT | | | 10,670 | | | | 711 | | |
| Sovran Self Storage, Inc. REIT | | | 22,459 | | | | 958 | | |
| STAG Industrial, Inc. REIT | | | 93,080 | | | | 1,068 | | |
| Starwood Hotels & Resorts Worldwide, Inc. | | | 754,175 | | | | 36,178 | | |
| Starwood Property Trust, Inc. REIT | | | 343,820 | | | | 6,364 | | |
| Vornado Realty Trust REIT | | | 463,101 | | | | 35,594 | | |
| Winthrop Realty Trust REIT | | | 205,450 | | | | 2,089 | | |
| | | | 650,741 | | |
| Total Common Stocks (Cost $1,609,865) | | | 1,430,755 | | |
| Short-Term Investment (3.1%) | |
| Investment Company (3.1%) | |
Morgan Stanley Institutional Liquidity
Funds — Money Market Portfolio —
Institutional Class (See Note G-2)
(Cost $45,225) | | | 45,224,627 | | | | 45,225 | | |
| Total Investments (99.5%) (Cost $1,655,090) | | | 1,475,980 | | |
| Other Assets in Excess of Liabilities (0.5%) | | | 7,790 | | |
| Net Assets (100.0%) | | $ | 1,483,770 | | |
(a) Comprised of securities in separate entities that are traded as a single stapled security.
(b) Consists of one or more classes of securities traded together as a unit; stocks with attached warrants.
(c) Security trades on the Hong Kong exchange.
(d) Non-income producing security.
The accompanying notes are an integral part of the financial statements.
60
2011 Annual Report
December 31, 2011
Portfolio of Investments (cont'd)
Global Real Estate Portfolio
(e) At December 31, 2011, the Portfolio held fair valued securities valued at approximately $10,007,000, representing 0.7% of net assets. These securities have been fair valued as determined in good faith under procedures established by and under the general supervision of the Fund's Directors.
(f) Security has been deemed illiquid at December 31, 2011.
(g) Restricted security valued at fair value and not registered under the Securities Act of 1933, Cabot Industrial Value Fund III, LP was acquired between 12/08 - 12/11 and has a current cost basis of approximately $3,256,000. Exeter Industrial Value Fund, LP was acquired between 11/07 - 4/11 and has a current cost basis of approximately $1,860,000. KTR Industrial Fund II LP was acquired between 1/09 - 11/11 and has a current cost basis of $4,269,000. At December 31, 2011, these securities had an aggregate market value of approximately $10,007,000 representing 0.7% of net assets.
CVA Certificaten Van Aandelen.
REIT Real Estate Investment Trust.
Fair Value Measurement Information:
The following is a summary of the inputs used to value the Portfolio's investments as of December 31, 2011. (See Note A-9 to the financial statements for further information regarding fair value measurement.)
| Investment Type | | Level 1
Unadjusted
quoted
prices
(000) | | Level 2
Other
significant
observable
inputs
(000) | | Level 3
Significant
unobservable
inputs
(000) | | Total
(000) | |
| Assets: | | | | | | | | | |
| Common Stocks | | | | | | | | | |
Commercial
Financing | | $ | 7,040 | | | $ | — | | | $ | — | | | $ | 7,040 | | |
| Diversified | | | 523,519 | | | | — | | | | — | † | | | 523,519 | | |
| Health Care | | | 77,570 | | | | — | | | | — | | | | 77,570 | | |
| Industrial | | | 35,561 | | | | — | | | | 10,007 | | | | 45,568 | | |
| Lodging/Resorts | | | 79,798 | | | | — | | | | — | | | | 79,798 | | |
Mixed Industrial/
Office | | | 6,129 | | | | — | | | | — | | | | 6,129 | | |
| Office | | | 162,937 | | | | — | | | | — | | | | 162,937 | | |
| Residential | | | 186,580 | | | | — | | | | — | | | | 186,580 | | |
| Retail | | | 307,098 | | | | — | | | | — | | | | 307,098 | | |
| Self Storage | | | 34,516 | | | | — | | | | — | | | | 34,516 | | |
| Total Common Stocks | | | 1,420,748 | | | | — | | | | 10,007 | | | | 1,430,755 | | |
Short-Term
Investment —
Investment Company | | | 45,225 | | | | — | | | | — | | | | 45,225 | | |
| Total Assets | | $ | 1,465,973 | | | $ | — | | | $ | 10,007 | | | $ | 1,475,980 | | |
Transfers between investment levels may occur as the markets fluctuate and/or the availability of data used in an investment's valuation changes. The Portfolio recognizes transfers between the levels as of the end of the period. As of December 31, 2011, the Portfolio did not have any significant investments transfer between investment levels.
Following is a reconciliation of investments in which significant unobservable inputs (Level 3) were used in determining fair value.
| | | Common
Stocks
(000) | |
| Beginning Balance | | $ | 4,343 | † | |
| Purchases | | | 4,876 | | |
| Sales | | | — | | |
| Amortization of discount | | | — | | |
| Transfers in | | | — | | |
| Transfers out | | | — | | |
| Change in unrealized appreciation (depreciation) | | | 788 | | |
| Realized gains (losses) | | | — | | |
| Ending Balance | | $ | 10,007 | † | |
Net change in unrealized appreciation/depreciation
from investments still held as of December 31, 2011 | | $ | 788 | | |
† Includes one or more securities which are valued at zero.
The accompanying notes are an integral part of the financial statements.
61
2011 Annual Report
December 31, 2011
Investment Overview (unaudited)
International Advantage Portfolio
The International Advantage Portfolio (the "Portfolio") seeks long-term capital appreciation by investing primarily in established companies on an international basis, with capitalizations within the range of companies included in the MSCI All Country World Ex-U.S. Index.
Performance
For the year ended December 31, 2011, the Portfolio had a total return based on net asset value and reinvestment of distributions per share of -1.31%, net of fees, for Class I shares. The Portfolio's Class I shares outperformed against its benchmark, the MSCI All Country World Ex-U.S. Index (the "Index"), which returned -13.71%.
Factors Affecting Performance
• International equities declined 13.71% for the year (as measured by the Index). Headwinds to the markets' progress included lackluster economic growth in the developed world, fears about a "hard landing" in China's economy, the worsening European debt crisis, political dysfunction in the U.S. and Europe, a tragic earthquake and tsunami in Japan, and social and political upheaval across the Middle East. Although corporate balance sheets and earnings in the U.S. and Europe remained strong throughout the year, waning investor confidence kept markets volatile. The U.S. market (which is not represented in the Index) outperformed those of Europe, Japan, and Asia ex-Japan, and developed market equities bested emerging market equities. (The performance of regional markets and developed and emerging markets is measured by their respective MSCI indexes.)
• The largest contributor to relative performance by far was exposure to the consumer staples sector, where the Portfolio had a significant overweight. Stock selection was also beneficial primarily because of strong performance from holdings within the food, beverage, and tobacco industry.
• Stock selection in the utilities sector added value. The Portfolio's sole holding in the sector performed well.
• A lack of exposure to the materials sector, which was the weakest-performing sector in the Index during the period, helped the Portfolio sidestep losses in the sector.
• However, relative gains were somewhat offset by the health care sector, where stock selection and an underweight were negative influences. The Portfolio held only one stock, a generic drug maker based in Israel, and its performance was disappointing during the period.
• The Portfolio's zero exposure to the energy sector and underweight in the telecommunication services sector also dampened relative results.
Management Strategies
• We look for high-quality growth companies that have these attributes: sustainable competitive advantages, business visibility, rising return on invested capital, free cash flow and a favorable risk/reward profile. In seeking these companies, we use intense fundamental research. Our emphasis is on secular growth, and as a result short-term market events are not as meaningful in the stock selection process.
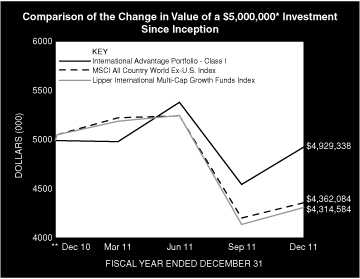
* Minimum Investment
** Commenced Operations on December 28, 2010.
In accordance with SEC regulations, Portfolio's performance shown assumes that all recurring fees (including management fees) were deducted and all dividends and distributions were reinvested. The performance of Class P, Class H, and Class L shares will vary from the Class I shares based upon it will be negatively impacted by additional fees assessed to these classes.
62
2011 Annual Report
December 31, 2011
Investment Overview (unaudited) (cont'd)
International Advantage Portfolio
Performance Compared to the Morgan Stanley Capital International (MSCI) All Country World Ex-U.S. Index(1) and the Lipper International Multi-Cap Growth Funds Index(2)
| | | Period Ended December 31, 2011 | |
| | | Total Returns(3) | |
| | | | | Average Annual | |
| | | One
Year | | Five
Years | | Ten
Years | | Since
Inception(5) | |
Portfolio — Class I Shares
w/o sales charges(4) | | | –1.31 | % | | | — | | | | — | | | | –1.40 | % | |
MSCI All Country World
Ex-U.S. Index | | | –13.71 | | | | — | | | | — | | | | –12.66 | | |
Lipper International Multi-Cap
Growth Funds Index | | | –14.65 | | | | — | | | | — | | | | –13.61 | | |
Portfolio — Class H Shares
w/o sales charges(4) | | | –1.57 | | | | — | | | | — | | | | –1.65 | | |
Portfolio — Class H Shares
with maximum 4.75%
sales charges(4) | | | –6.26 | | | | — | | | | — | | | | –6.30 | | |
MSCI All Country World
Ex-U.S. Index | | | –13.71 | | | | — | | | | — | | | | –12.66 | | |
Lipper International Multi-Cap
Growth Funds Index | | | –14.65 | | | | — | | | | — | | | | –13.61 | | |
Portfolio — Class L Shares
w/o sales charges(4) | | | –2.09 | | | | — | | | | — | | | | –2.17 | | |
MSCI All Country World
Ex-U.S. Index | | | –13.71 | | | | — | | | | — | | | | –12.66 | | |
Lipper International Multi-Cap
Growth Funds Index | | | –14.65 | | | | — | | | | — | | | | –13.61 | | |
Portfolio — Class P Shares
w/o sales charges(4) | | | –1.57 | | | | — | | | | — | | | | –1.66 | | |
MSCI All Country World
Ex-U.S. Index | | | –13.71 | | | | — | | | | — | | | | –12.66 | | |
Lipper International Multi-Cap
Growth Funds Index | | | –14.65 | | | | — | | | | — | | | | –13.61 | | |
Performance data quoted represents past performance, which is no guarantee of future results, and current performance may be lower or higher than the figures shown. Performance assumes that all dividends and distributions, if any, were reinvested. For the most recent month-end performance figures, please visit www.morganstanley.com/im. Investment return and principal value will fluctuate so that Portfolio shares, when redeemed, may be worth more or less than their original cost. Total returns do not reflect the deduction of taxes that a shareholder would pay on Portfolio distributions or the redemption of Portfolio shares. Performance of share classes will vary due to difference in expenses.
(1) The Morgan Stanley Capital International (MSCI) All Country World Ex-U.S. Index is a free float-adjusted market capitalization weighted index designed to measure the equity market performance of developed and emerging markets, excluding the U.S. The term "free float" represents the portion of shares outstanding that are deemed to be available for purchase in the public equity markets by investors. The performance of the Index is listed in U.S. dollars and assumes reinvestment of net dividends.The Index is unmanaged and its returns do not include any sales charges or fees. Such costs would lower performance. It is not possible to invest directly in an index.
(2) The Lipper International Multi-Cap Growth Funds Index is an equally weighted performance index of the largest qualifying funds (based on net assets) in the Lipper International Multi-Cap Growth Funds classification. The Index, which is adjusted for capital gains distributions and income dividends, is unmanaged and should not be considered an investment. There are currently 30 funds represented in this Index. As of the date of this report, the Portfolio was in the Lipper International Multi-Cap Growth Funds classification.
(3) Total returns for the Portfolio reflect fees waived and expenses reimbursed, if applicable, by the Adviser. Without such waivers and reimbursements, total returns would have been lower. The fee waivers and/or expense reimbursements will continue for one year or until such time as the Fund's Board of Directors acts to discontinue all or a portion of such waivers and/or expense reimbursements when it deems that such action is appropriate.
(4) Commenced operations on December 28, 2010.
(5) For comparative purposes, average annual since inception returns listed for the Indexes refer to the inception date or initial offering of the respective share class of the Portfolio, not the inception of the Index.
Portfolio Composition
| Classification | | Percentage of
Total Investments | |
| Other* | | | 43.1 | % | |
| Beverages | | | 22.7 | | |
| Food Products | | | 13.0 | | |
| Textiles, Apparel & Luxury Goods | | | 7.8 | | |
| Food & Staples Retailing | | | 6.7 | | |
| Road & Rail | | | 6.7 | | |
| Total Investments | | | 100.0 | % | |
* Industries representing less than 5% of total investments.
63
2011 Annual Report
December 31, 2011
Portfolio of Investments
International Advantage Portfolio
| | | Shares | | Value
(000) | |
| Common Stocks (91.8%) | |
| Australia (2.8%) | |
| QR National Ltd. | | | 17,008 | | | $ | 59 | | |
| Belgium (6.0%) | |
| Anheuser-Busch InBev N.V. | | | 2,076 | | | | 127 | | |
| Brazil (3.6%) | |
| BM&F Bovespa SA | | | 9,494 | | | | 50 | | |
| Natura Cosmeticos SA | | | 1,418 | | | | 27 | | |
| | | | 77 | | |
| Canada (7.0%) | |
| Brookfield Asset Management, Inc., Class A | | | 2,548 | | | | 70 | | |
| Brookfield Infrastructure Partners LP | | | 2,887 | | | | 80 | | |
| | | | 150 | | |
| China (15.8%) | |
| China Merchants Holdings International Co., Ltd. (a) | | | 26,991 | | | | 78 | | |
| Golden Eagle Retail Group Ltd. (a) | | | 30,000 | | | | 63 | | |
| Hengan International Group Co., Ltd. (a) | | | 5,500 | | | | 52 | | |
New Oriental Education & Technology Group,
Inc. ADR (b) | | | 3,009 | | | | 72 | | |
| Tingyi Cayman Islands Holding Corp. (a) | | | 12,000 | | | | 37 | | |
| Want Want China Holdings Ltd. (a) | | | 35,000 | | | | 35 | | |
| | | | 337 | | |
| Denmark (3.8%) | |
| DSV A/S | | | 4,444 | | | | 80 | | |
| Finland (2.1%) | |
| Kone Oyj, Class B | | | 860 | | | | 45 | | |
| France (10.0%) | |
| Christian Dior SA | | | 442 | | | | 52 | | |
| Danone | | | 947 | | | | 60 | | |
| Pernod-Ricard SA | | | 1,104 | | | | 102 | | |
| | | | 214 | | |
| Germany (2.2%) | |
| Adidas AG | | | 732 | | | | 48 | | |
| Hong Kong (3.9%) | |
| Sun Art Retail Group Ltd. (b) | | | 66,500 | | | | 83 | | |
| Israel (2.5%) | |
| Teva Pharmaceutical Industries Ltd. ADR | | | 1,315 | | | | 53 | | |
| Italy (3.0%) | |
| Prada SpA (a)(b) | | | 13,900 | | | | 63 | | |
| Norway (2.3%) | |
| Telenor ASA | | | 2,995 | | | | 49 | | |
| Switzerland (9.3%) | |
| Kuehne & Nagel International AG (Registered) | | | 520 | | | | 58 | | |
| Nestle SA (Registered) | | | 2,425 | | | | 140 | | |
| | | | 198 | | |
| United Kingdom (14.9%) | |
| British American Tobacco PLC | | | 1,027 | | | | 49 | | |
| Diageo PLC | | | 5,306 | | | | 116 | | |
| Imperial Tobacco Group PLC | | | 1,128 | | | | 42 | | |
| Reckitt Benckiser Group PLC | | | 1,092 | | | | 54 | | |
| Tesco PLC | | | 8,971 | | | | 56 | | |
| | | | 317 | | |
| | | Shares | | Value
(000) | |
| United States (2.6%) | |
| Li & Fung Ltd. (a) | | | 30,000 | | | $ | 56 | | |
| Total Common Stocks (Cost $2,061) | | | 1,956 | | |
| Participation Notes (6.0%) | |
| China (6.0%) | |
Deutsche Bank AG, Kweichow Moutai Co.,
Ltd., Class A, Equity Linked Notes,
Zero Coupon, 3/4/21 (Cost $103) | | | 4,180 | | | | 129 | | |
| Total Investments (97.8%) (Cost $2,164) | | | 2,085 | | |
| Other Assets in Excess of Liabilities (2.2%) | | | 47 | | |
| Net Assets (100.0%) | | $ | 2,132 | | |
(a) Security trades on the Hong Kong exchange.
(b) Non-income producing security.
ADR American Depositary Receipt.
Fair Value Measurement Information:
The following is a summary of the inputs used to value the Portfolio's investments as of December 31, 2011. (See Note A-9 to the financial statements for further information regarding fair value measurement.)
| Investment Type | | Level 1
Unadjusted
quoted
prices
(000) | | Level 2
Other
significant
observable
inputs
(000) | | Level 3
Significant
unobservable
inputs
(000) | | Total
(000) | |
| Assets: | | | | | | | | | |
| Common Stocks | | | | | | | | | |
| Beverages | | $ | 345 | | | $ | — | | | $ | — | | | $ | 345 | | |
| Distributors | | | 56 | | | | — | | | | — | | | | 56 | | |
Diversified Consumer
Services | | | 72 | | | | — | | | | — | | | | 72 | | |
Diversified Financial
Services | | | 50 | | | | — | | | | — | | | | 50 | | |
Diversified
Telecommunication
Services | | | 49 | | | | — | | | | — | | | | 49 | | |
| Electric Utilities | | | 80 | | | | — | | | | — | | | | 80 | | |
| Food & Staples Retailing | | | 139 | | | | — | | | | — | | | | 139 | | |
| Food Products | | | 272 | | | | — | | | | — | | | | 272 | | |
| Household Products | | | 54 | | | | — | | | | — | | | | 54 | | |
| Machinery | | | 45 | | | | — | | | | — | | | | 45 | | |
| Marine | | | 58 | | | | — | | | | — | | | | 58 | | |
| Multiline Retail | | | 63 | | | | — | | | | — | | | | 63 | | |
| Personal Products | | | 79 | | | | — | | | | — | | | | 79 | | |
| Pharmaceuticals | | | 53 | | | | — | | | | — | | | | 53 | | |
Real Estate
Management &
Development | | | 70 | | | | — | | | | — | | | | 70 | | |
| Road & Rail | | | 139 | | | | — | | | | — | | | | 139 | | |
Textiles, Apparel &
Luxury Goods | | | 163 | | | | — | | | | — | | | | 163 | | |
| Tobacco | | | 91 | | | | — | | | | — | | | | 91 | | |
The accompanying notes are an integral part of the financial statements.
64
2011 Annual Report
December 31, 2011
Portfolio of Investments (cont'd)
International Advantage Portfolio
Fair Value Measurement Information: (cont'd)
| Investment Type | | Level 1
Unadjusted
quoted
prices
(000) | | Level 2
Other
significant
observable
inputs
(000) | | Level 3
Significant
unobservable
inputs
(000) | | Total
(000) | |
| Common Stocks (cont'd) | |
Transportation
Infrastructure | | $ | 78 | | | $ | — | | | $ | — | | | $ | 78 | | |
| Total Common Stocks | | | 1,956 | | | | — | | | | — | | | | 1,956 | | |
| Participation Notes | | | — | | | | 129 | | | | — | | | | 129 | | |
| Total Assets | | $ | 1,956 | | | $ | 129 | | | $ | — | | | $ | 2,085 | | |
Transfers between investment levels may occur as the markets fluctuate and/or the availability of data used in an investment's valuation changes. The Portfolio recognizes transfers between the levels as of the end of the period. As of December 31, 2011, the Portfolio did not have any significant investments transfer between investment levels.
The accompanying notes are an integral part of the financial statements.
65
2011 Annual Report
December 31, 2011
Investment Overview (unaudited)
International Equity Portfolio
The International Equity Portfolio (the "Portfolio") seeks long-term capital appreciation by investing primarily in equity securities of non-U.S. issuers.
Performance
For the year ended December 31, 2011, the Portfolio had a total return based on net asset value and reinvestment of distributions per share of -7.63%, net of fees, for Class I shares. The Portfolio's Class I shares outperformed against its benchmark, the MSCI EAFE Index (the "Index"), which returned -12.14%.
Factors Affecting Performance
• 2011 ended with a whimper, with the Index falling 1.0% in December on low trading volumes, mainly due to local currency weakness against the dollar. This resulted in a +3.3% return in the Index for the quarter and brought the return for the year to -12.1%.
• For the year, all cyclical sectors fared poorly: materials fell 23%, information technology declined 18%, industrials dropped 15% and consumer discretionary lost 14%. Both the health care (+5.7%) and consumer staples (+4.1%) sectors scraped out marginal gains for the year as their fortunes are less sensitive to macro-economics, which deteriorated as the euro zone crisis escalated from bank balance sheets to European government balance sheets, to affect credit creation worldwide. One rather surprising exception to the broad story of cyclical weakness was the oil price, partly due to continued political uncertainty in the Middle East, with the result that free cash flows and share prices have remained resilient in the energy sector.
• For the year as a whole, the Portfolio solidly outperformed the Index, mainly due to strong performance from stock selection in consumer staples as well as from the Portfolio's bias to higher-quality, more resilient companies overall. Stock selection in utilities and materials also added value. In contrast, stock selection in industrials was the largest detractor from relative performance over the period.
Management Strategies
• Even if there is no cataclysm in Europe, this year the world remains a dangerous place to invest. Much of the West is in the grip of massive balance sheet deleveraging, and is shedding assets, postponing spending decisions and hoarding cash in low-return investments. We know from the Japanese experience just how long a balance sheet recession can persist. The question for governments is how should or can they respond. Do they take the quasi-Keynesian approach adopted by the U.S. and U.K. and hope that foreigners remain holders or buyers of the rapidly expanding supply of government bonds? Or do they take the medicine the Austrian school demands and enforce fiscal discipline and austerity? The former risks sudden bond market or currency collapse, the latter ensures prolonged economic weakness. For now, the better route certainly seems the former as the U.S. and British bond markets show no sign of fragility.
• The problem is that in a globalized world European financial retrenchment is impacting credit everywhere, not just in Europe. Global growth is already suffering and will continue to do so, including in China. At the same time Basel III regulations demand larger capital buffers for banks, stimulating deleveraging further. Ultimately, we worry that politicians will just find it preferable to agree that free-market finance does not work, and that they can do it better.
• Finally, with all these uncertainties, we continue to believe that it is essential to focus on finding what we consider to be high-quality companies — companies with resilient sources of profit, that can generate high returns on their capital, with managements that invest for the long term — and to find the shares of these companies that are trading well below our assessment of fair value. These sorts of companies are in short supply, and just as the highest-quality corporate debt has rerated upwards we remain convinced that equity markets will put these sorts of companies on a pedestal. That the Portfolio remains at a very similar valuation to the broader Index despite the Portfolio's much superior quality suggests to us that there is much to look forward to, at least in terms of relative performance, even if the broader macroeconomic outlook is stormy.
66
2011 Annual Report
December 31, 2011
Investment Overview (unaudited) (cont'd)
International Equity Portfolio
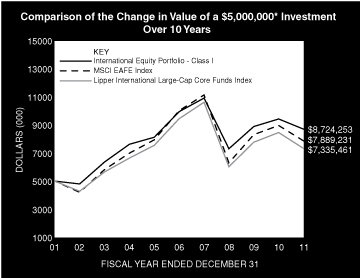
* Minimum Investment
In accordance with SEC regulations, Portfolio's performance shown assumes that all recurring fees (including management fees) were deducted and all dividends and distributions were reinvested. The performance of Class P shares will vary from the Class I shares based upon its different inception date and will be negatively impacted by additional fees assessed to that class.
Performance Compared to the Morgan Stanley Capital International (MSCI) EAFE Index(1) and the Lipper International Large-Cap Core Funds Index(2)
| | | Period Ended December 31, 2011 | |
| | | Total Returns(3) | |
| | | | | Average Annual | |
| | | One
Year | | Five
Years | | Ten
Years | | Since
Inception(6) | |
Portfolio — Class I Shares
w/o sales charges(4) | | | –7.63 | % | | | –2.63 | % | | | 5.72 | % | | | 8.53 | % | |
| MSCI EAFE Index | | | –12.14 | | | | –4.72 | | | | 4.67 | | | | 3.63 | | |
Lipper International Large-Cap
Core Funds Index | | | –13.56 | | | | –4.96 | | | | 3.91 | | | | 5.76 | | |
Portfolio — Class P Shares
w/o sales charges(5) | | | –7.83 | | | | –2.88 | | | | 5.47 | | | | 7.34 | | |
| MSCI EAFE Index | | | –12.14 | | | | –4.72 | | | | 4.67 | | | | 3.55 | | |
Lipper International Large-Cap
Core Funds Index | | | –13.56 | | | | –4.96 | | | | 3.91 | | | | 4.65 | | |
Performance data quoted represents past performance, which is no guarantee of future results, and current performance may be lower or higher than the figures shown. Performance assumes that all dividends and distributions, if any, were reinvested. For the most recent month-end performance figures, please visit www.morganstanley.com/im. Investment return and principal value will fluctuate so that Portfolio shares, when redeemed, may be worth more or less than their original cost. Total returns do not reflect the deduction of taxes that a shareholder would pay on Portfolio distributions or the redemption of Portfolio shares. Performance of share classes will vary due to difference in expenses.
(1) The Morgan Stanley Capital International (MSCI) EAFE Index (Europe, Australasia, Far East) is a free float-adjusted market capitalization index that is designed to measure the international equity market performance of developed markets, excluding the US & Canada. The term "free float" represents the portion of shares outstanding that are deemed to be available for purchase in the public equity markets by investors. The MSCI EAFE Index curently consists of 22 developed market country indices. The performance of the Index is listed in U.S. dollars and assumes reinvestment of net dividends. The Index is unmanaged and its returns do not include any sales charges or fees. Such costs would lower performance. It is not possible to invest directly in an index.
(2) The Lipper International Large-Cap Core Funds Index is an equally weighted performance index of the largest qualifying funds (based on net assets) in the Lipper International Large-Cap Core Funds classification. The Index, which is adjusted for capital gains distributions and income dividends, is unmanaged and should not be considered an investment. There are currently 30 funds represented in this Index. As of the date of this report, the Portfolio is in the Lipper International Large-Cap Core Funds classification.
(3) Total returns for the Portfolio reflect fees waived and expenses reimbursed, if applicable, by the Adviser. Without such waivers and reimbursements, total returns would have been lower. The fee waivers and/or expense reimbursements will continue for one year or until such time as the Fund's Board of Directors acts to discontinue all or a portion of such waivers and/or expense reimbursements when it deems that such action is appropriate.
(4) Commenced operations on August 4, 1989.
(5) Commenced offering on January 2, 1996.
(6) For comparative purposes, average annual since inception returns listed for the Indexes refer to the inception date or initial offering of the respective share class of the Portfolio, not the inception of the Index.
Portfolio Composition*
| Classification | | Percentage of
Total Investments | |
| Other** | | | 44.7 | % | |
| Pharmaceuticals | | | 10.5 | | |
| Tobacco | | | 8.8 | | |
| Food Products | | | 8.6 | | |
| Insurance | | | 7.9 | | |
| Oil, Gas & Consumable Fuels | | | 7.3 | | |
| Commercial Banks | | | 7.0 | | |
| Electronic Equipment, Instruments & Components | | | 5.2 | | |
| Total Investments | | | 100.0 | % | |
* Percentages indicated are based upon total investments (excluding Securities held as Collateral on Loaned Securities) as of December 31, 2011.
** Industries representing less than 5% of total investments.
67
2011 Annual Report
December 31, 2011
Portfolio of Investments
International Equity Portfolio
| | | Shares | | Value
(000) | |
| Common Stocks (97.8%) | |
| Australia (3.3%) | |
| AMP Ltd. | | | 8,865,258 | | | $ | 36,904 | | |
| Orica Ltd. | | | 283,556 | | | | 7,030 | | |
| Santos Ltd. | | | 4,570,816 | | | | 57,223 | | |
| WorleyParsons Ltd. | | | 1,044,786 | | | | 27,431 | | |
| | | | 128,588 | | |
| Canada (0.2%) | |
| Encana Corp. (a) | | | 463,338 | | | | 8,591 | | |
| China (0.2%) | |
| AIA Group Ltd. (b) | | | 2,748,100 | | | | 8,580 | | |
| France (8.1%) | |
| ArcelorMittal | | | 955,514 | | | | 17,474 | | |
| BNP Paribas SA | | | 767,994 | | | | 30,167 | | |
| France Telecom SA | | | 2,023,116 | | | | 31,775 | | |
| Legrand SA (a) | | | 2,399,510 | | | | 77,173 | | |
| Sanofi | | | 1,258,656 | | | | 92,447 | | |
| Societe Generale SA | | | 683,722 | | | | 15,225 | | |
| Vallourec SA | | | 784,957 | | | | 50,959 | | |
| | | | 315,220 | | |
| Germany (5.7%) | |
| BASF SE | | | 545,385 | | | | 38,039 | | |
| Bayer AG (Registered) | | | 1,625,408 | | | | 103,922 | | |
| Continental AG (c) | | | 331,320 | | | | 20,624 | | |
| SAP AG | | | 367,774 | | | | 19,444 | | |
| Volkswagen AG (Preference) | | | 253,383 | | | | 37,959 | | |
| | | | 219,988 | | |
| Ireland (1.6%) | |
| CRH PLC | | | 3,133,299 | | | | 62,289 | | |
| Italy (1.3%) | |
| Eni SpA | | | 2,414,222 | | | | 50,025 | | |
| Japan (23.5%) | |
| Asatsu-DK, Inc. (a) | | | 587,185 | | | | 15,433 | | |
| Astellas Pharma, Inc. | | | 1,200,200 | | | | 48,806 | | |
| Hitachi Ltd. (a) | | | 10,668,000 | | | | 55,994 | | |
| Hoya Corp. | | | 3,314,100 | | | | 71,389 | | |
| Inpex Corp. | | | 8,585 | | | | 54,095 | | |
| Keyence Corp. | | | 167,010 | | | | 40,272 | | |
| Kyocera Corp. | | | 442,500 | | | | 35,586 | | |
| Lawson, Inc. (a) | | | 436,200 | | | | 27,231 | | |
| Mitsubishi Corp. | | | 3,146,000 | | | | 63,558 | | |
| Mitsubishi Electric Corp. | | | 5,093,000 | | | | 48,832 | | |
| Mitsubishi Estate Co., Ltd. | | | 4,223,000 | | | | 63,095 | | |
| Mitsui OSK Lines Ltd. | | | 2,015,391 | | | | 7,803 | | |
| MS&AD Insurance Group Holdings | | | 1,148,800 | | | | 21,284 | | |
| NGK Spark Plug Co., Ltd. | | | 4,147,000 | | | | 51,454 | | |
| Nitto Denko Corp. | | | 398,900 | | | | 14,273 | | |
| NTT DoCoMo, Inc. | | | 26,704 | | | | 49,092 | | |
| Sekisui House Ltd. | | | 5,551,000 | | | | 49,257 | | |
| Sumitomo Mitsui Financial Group, Inc. | | | 1,016,132 | | | | 28,304 | | |
| Sumitomo Mitsui Trust Holdings, Inc. | | | 9,593,999 | | | | 28,170 | | |
| | | Shares | | Value
(000) | |
| Taiyo Nippon Sanso Corp. | | | 1,279,000 | | | $ | 8,923 | | |
| Tokyo Electron Ltd. | | | 1,162,100 | | | | 59,109 | | |
| Toyota Motor Corp. | | | 2,112,300 | | | | 70,392 | | |
| | | | 912,352 | | |
| Netherlands (5.8%) | |
| Akzo Nobel N.V. (a) | | | 1,195,031 | | | | 57,783 | | |
| Unilever N.V. CVA (a) | | | 4,809,579 | | | | 165,393 | | |
| | | | 223,176 | | |
| Singapore (0.3%) | |
| Singapore Telecommunications Ltd. | | | 3,971,000 | | | | 9,460 | | |
| Switzerland (11.8%) | |
| Holcim Ltd. (Registered) (c) | | | 633,523 | | | | 33,892 | | |
| Nestle SA (Registered) | | | 2,941,560 | | | | 169,109 | | |
| Novartis AG (Registered) | | | 1,584,343 | | | | 90,577 | | |
| Roche Holding AG (Genusschein) | | | 419,515 | | | | 71,103 | | |
| UBS AG (Registered) (c) | | | 3,742,646 | | | | 44,547 | | |
| Zurich Financial Services AG (c) | | | 207,082 | | | | 46,848 | | |
| | | | 456,076 | | |
| United Kingdom (34.4%) | |
| Admiral Group PLC | | | 2,927,419 | | | | 38,734 | | |
| Barclays PLC | | | 12,006,832 | | | | 32,827 | | |
| BG Group PLC | | | 2,152,513 | | | | 46,014 | | |
| BHP Billiton PLC | | | 1,340,627 | | | | 39,090 | | |
| BP PLC | | | 9,202,210 | | | | 65,810 | | |
| British American Tobacco PLC | | | 3,693,699 | | | | 175,273 | | |
| Bunzl PLC | | | 3,046,636 | | | | 41,826 | | |
| HSBC Holdings PLC | | | 11,861,132 | | | | 90,453 | | |
| Imperial Tobacco Group PLC | | | 4,376,251 | | | | 165,490 | | |
| Legal & General Group PLC | | | 22,831,495 | | | | 36,450 | | |
| Lloyds Banking Group PLC (c) | | | 115,225,790 | | | | 46,356 | | |
| Prudential PLC | | | 8,504,785 | | | | 84,333 | | |
| Reckitt Benckiser Group PLC | | | 2,777,257 | | | | 137,156 | | |
| Resolution Ltd. | | | 9,042,212 | | | | 35,303 | | |
| Smiths Group PLC | | | 3,290,048 | | | | 46,752 | | |
| SSE PLC | | | 2,941,317 | | | | 58,971 | | |
| Travis Perkins PLC | | | 2,761,904 | | | | 34,121 | | |
| Vodafone Group PLC | | | 32,830,284 | | | | 91,213 | | |
| WM Morrison Supermarkets PLC | | | 3,208,960 | | | | 16,256 | | |
| Xstrata PLC | | | 3,398,366 | | | | 51,616 | | |
| | | | 1,334,044 | | |
| United States (1.6%) | |
| Dr. Pepper Snapple Group, Inc. (a) | | | 1,538,371 | | | | 60,735 | | |
| Total Common Stocks (Cost $3,818,622) | | | 3,789,124 | | |
| Short-Term Investments (5.0%) | |
| Securities held as Collateral on Loaned Securities (2.6%) | |
| Investment Company (1.9%) | |
Morgan Stanley Institutional Liquidity
Funds — Money Market Portfolio —
Institutional Class (See Note G-2) | | | 75,901,428 | | | | 75,901 | | |
The accompanying notes are an integral part of the financial statements.
68
2011 Annual Report
December 31, 2011
Portfolio of Investments (cont'd)
International Equity Portfolio
| | | Face
Amount
(000) | | Value
(000) | |
| Repurchase Agreements (0.7%) | |
Barclays Capital, Inc., (0.02%,
dated 12/30/11, due 1/3/12; proceeds
$3,260; fully collateralized by a
U.S. Government Obligation; U.S. Treasury
Bond 4.50% due 5/15/38;
valued at $3,325) | | $ | 3,260 | | | $ | 3,260 | | |
Merrill Lynch & Co., Inc., (0.07%,
dated 12/30/11, due 1/3/12; proceeds
$24,213; fully collateralized by a
U.S. Government Agency; Government
National Mortgage Association 3.50%
due 11/20/41; valued at $24,697) | | | 24,213 | | | | 24,213 | | |
| | | | 27,473 | | |
Total Securities held as Collateral on
Loaned Securities (Cost $103,374) | | | 103,374 | | |
| | | Shares | | | |
| Investment Company (2.4%) | |
Morgan Stanley Institutional Liquidity
Funds — Money Market Portfolio —
Institutional Class (See Note G-2)
(Cost $93,090) | | | 93,089,502 | | | | 93,090 | | |
| Total Short-Term Investments (Cost $196,464) | | | 196,464 | | |
Total Investments (102.8%) (Cost $4,015,086)
Including $100,073 of Securities Loaned | | | 3,985,588 | | |
| Liabilities in Excess of Other Assets (-2.8%) | | | (110,183 | ) | |
| Net Assets (100.0%) | | $ | 3,875,405 | | |
(a) All or a portion of this security was on loan at December 31, 2011.
(b) Security trades on the Hong Kong exchange.
(c) Non-income producing security.
CVA Certificaten Van Aandelen.
Fair Value Measurement Information:
The following is a summary of the inputs used to value the Portfolio's investments as of December 31, 2011. (See Note A-9 to the financial statements for further information regarding fair value measurement.)
| Investment Type | | Level 1
Unadjusted
quoted
prices
(000) | | Level 2
Other
significant
observable
inputs
(000) | | Level 3
Significant
unobservable
inputs
(000) | | Total
(000) | |
| Assets: | | | | | | | | | |
| Common Stocks | | | | | | | | | |
| Auto Components | | $ | 72,078 | | | $ | — | | | $ | — | | | $ | 72,078 | | |
| Automobiles | | | 108,351 | | | | — | | | | — | | | | 108,351 | | |
| Beverages | | | 60,735 | | | | — | | | | — | | | | 60,735 | | |
| Capital Markets | | | 44,547 | | | | — | | | | — | | | | 44,547 | | |
| Chemicals | | | 126,048 | | | | — | | | | — | | | | 126,048 | | |
| Commercial Banks | | | 271,502 | | | | — | | | | — | | | | 271,502 | | |
| Construction Materials | | | 96,181 | | | | — | | | | — | | | | 96,181 | | |
Diversified
Telecommunication
Services | | | 41,235 | | | | — | | | | — | | | | 41,235 | | |
| Electric Utilities | | | 58,971 | | | | — | | | | — | | | | 58,971 | | |
| Electrical Equipment | | | 126,005 | | | | — | | | | — | | | | 126,005 | | |
| Investment Type | | Level 1
Unadjusted
quoted
prices
(000) | | Level 2
Other
significant
observable
inputs
(000) | | Level 3
Significant
unobservable
inputs
(000) | | Total
(000) | |
Electronic Equipment,
Instruments &
Components | | $ | 203,241 | | | $ | — | | | $ | — | | | $ | 203,241 | | |
Energy Equipment &
Services | | | 27,431 | | | | — | | | | — | | | | 27,431 | | |
Food & Staples
Retailing | | | 43,487 | | | | — | | | | — | | | | 43,487 | | |
| Food Products | | | 334,502 | | | | — | | | | — | | | | 334,502 | | |
| Household Durables | | | 49,257 | | | | — | | | | — | | | | 49,257 | | |
| Household Products | | | 137,156 | | | | — | | | | — | | | | 137,156 | | |
Industrial
Conglomerates | | | 46,752 | | | | — | | | | — | | | | 46,752 | | |
| Insurance | | | 308,436 | | | | — | | | | — | | | | 308,436 | | |
| Machinery | | | 50,959 | | | | — | | | | — | | | | 50,959 | | |
| Marine | | | 7,803 | | | | — | | | | — | | | | 7,803 | | |
| Media | | | 15,433 | | | | — | | | | — | | | | 15,433 | | |
| Metals & Mining | | | 108,180 | | | | — | | | | — | | | | 108,180 | | |
Oil, Gas &
Consumable Fuels | | | 281,758 | | | | — | | | | — | | | | 281,758 | | |
| Pharmaceuticals | | | 406,855 | | | | — | | | | — | | | | 406,855 | | |
Real Estate
Management &
Development | | | 63,095 | | | | — | | | | — | | | | 63,095 | | |
Semiconductors &
Semiconductor
Equipment | | | 59,109 | | | | — | | | | — | | | | 59,109 | | |
| Software | | | 19,444 | | | | — | | | | — | | | | 19,444 | | |
| Tobacco | | | 340,763 | | | | — | | | | — | | | | 340,763 | | |
Trading Companies &
Distributors | | | 139,505 | | | | — | | | | — | | | | 139,505 | | |
Wireless
Telecommunication
Services | | | 140,305 | | | | — | | | | — | | | | 140,305 | | |
| Total Common Stocks | | | 3,789,124 | | | | — | | | | — | | | | 3,789,124 | | |
Short-Term
Investments | |
| Investment Company | | | 168,991 | | | | — | | | | — | | | | 168,991 | | |
Repurchase
Agreements | | | — | | | | 27,473 | | | | — | | | | 27,473 | | |
Total Short-Term
Investments | | | 168,991 | | | | 27,473 | | | | — | | | | 196,464 | | |
| Total Assets | | $ | 3,958,115 | | | $ | 27,473 | | | $ | — | | | $ | 3,985,588 | | |
Transfers between investment levels may occur as the markets fluctuate and/or the availability of data used in an investment's valuation changes. The Portfolio recognizes transfers between the levels as of the end of the period. As of December 31, 2011, the Portfolio did not have any significant investments transfer between investment levels.
The accompanying notes are an integral part of the financial statements.
69
2011 Annual Report
December 31, 2011
Investment Overview (unaudited)
International Opportunity Portfolio
The International Opportunity Portfolio (the "Portfolio") seeks long-term capital appreciation by investing primarily in established and emerging franchise companies on an international basis with capitalization within the range of companies included in the MSCI All Country World Ex-U.S. Index.
Performance
For the year ended December 31, 2011, the Portfolio had a total return based on net asset value and reinvestment of distributions per share of -10.16%, net of fees, for Class I shares. The Portfolio's Class I shares outperformed against its benchmark, the MSCI All Country World Ex-U.S. Index (the "Index"), which returned -13.71%.
Factors Affecting Performance
• International equities declined 13.71% for the year (as measured by the Index). Headwinds to the markets' progress included lackluster economic growth in the developed world, fears about a "hard landing" in China's economy, the worsening European debt crisis, political dysfunction in the U.S. and Europe, a tragic earthquake and tsunami in Japan, and social and political upheaval across the Middle East. Although corporate balance sheets and earnings in the U.S. and Europe remained strong throughout the year, waning investor confidence kept markets volatile. The U.S. market (which is not represented in the Index) outperformed those of Europe, Japan, and Asia ex-Japan, and developed market equities bested emerging market equities. (The performance of regional markets and developed and emerging markets is measured by their respective MSCI indexes.)
• The largest contributor to relative performance was the consumer staples sector, as both an overweight and stock selection in the sector were favorable during the period. Holdings within the food, beverage, and tobacco industry contributed most to relative gains.
• Stock selection and an underweight in the financials sector also aided relative performance. The Portfolio benefited from strong performance from a holding in a clearinghouse for over-the-counter (OTC) securities in Brazil and the lack of exposure to bank stocks, a group which performed poorly over the period.
• Stock selection and an underweight in the utilities sector added value. The Portfolio's sole holding in the sector performed well.
• Conversely, stock selection and an overweight in the consumer discretionary sector hampered relative returns. The largest detractors were holdings in a real estate developer in Brazil and a tutoring services provider in China.
• Further dampening relative performance were stock selection and an underweight in the health care sector. The Portfolio held only one stock in this sector, a generic drug maker based in Israel, and its performance was disappointing during the period.
• The Portfolio's underweight exposure to the energy sector also detracted from relative performance.
Management Strategies
• We look for high-quality growth companies that have these attributes: sustainable competitive advantages, business visibility, rising return on invested capital, free cash flow and a favorable risk/reward profile. In seeking these companies, we use intense fundamental research. Our emphasis is on secular growth, and as a result, short-term market events are not as meaningful in the stock selection process.
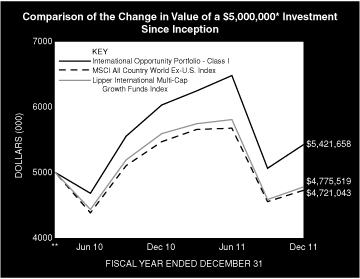
* Minimum Investment
** Commenced Operations on March 31, 2010.
In accordance with SEC regulations, Portfolio's performance shown assumes that all recurring fees (including management fees) were deducted and all dividends and distributions were reinvested. The performance of Class P, Class H, and Class L shares will vary from the Class I shares based upon it will be negatively impacted by additional fees assessed to these classes.
70
2011 Annual Report
December 31, 2011
Investment Overview (unaudited) (cont'd)
International Opportunity Portfolio
Performance Compared to the Morgan Stanley Capital International (MSCI) All Country World Ex-U.S. Index(1) and the Lipper International Multi-Cap Growth Funds Index(2)
| | | Period Ended December 31, 2011 | |
| | | Total Returns(3) | |
| | | | | Average Annual | |
| | | One
Year | | Five
Years | | Ten
Years | | Since
Inception(5) | |
Portfolio — Class I Shares
w/o sales charges(4) | | | –10.16 | % | | | — | | | | — | | | | 4.73 | % | |
MSCI All Country World
Ex-U.S. Index | | | –13.71 | | | | — | | | | — | | | | –3.22 | | |
Lipper International Multi-Cap
Growth Index | | | –14.65 | | | | — | | | | — | | | | –2.59 | | |
Portfolio — Class H Shares
w/o sales charges(4) | | | –10.30 | | | | — | | | | — | | | | 4.49 | | |
Portfolio — Class H Shares
with maximum 4.75%
sales charges(4) | | | –14.56 | | | | — | | | | — | | | | 1.62 | | |
MSCI All Country World
Ex-U.S. Index | | | –13.71 | | | | — | | | | — | | | | –3.22 | | |
Lipper International Multi-Cap
Growth Index | | | –14.65 | | | | — | | | | — | | | | –2.59 | | |
Portfolio — Class L Shares
w/o sales charges(4) | | | –10.81 | | | | — | | | | — | | | | 3.95 | | |
MSCI All Country World
Ex-U.S. Index | | | –13.71 | | | | — | | | | — | | | | –3.22 | | |
Lipper International Multi-Cap
Growth Index | | | –14.65 | | | | — | | | | — | | | | –2.59 | | |
Portfolio — Class P Shares
w/o sales charges(4) | | | –10.33 | | | | — | | | | — | | | | 4.47 | | |
MSCI All Country World
Ex-U.S. Index | | | –13.71 | | | | — | | | | — | | | | –3.22 | | |
Lipper International Multi-Cap
Growth Index | | | –14.65 | | | | — | | | | — | | | | –2.59 | | |
Performance data quoted represents past performance, which is no guarantee of future results, and current performance may be lower or higher than the figures shown. Performance assumes that all dividends and distributions, if any, were reinvested. For the most recent month-end performance figures, please visit www.morganstanley.com/im. Investment return and principal value will fluctuate so that Portfolio shares, when redeemed, may be worth more or less than their original cost. Total returns do not reflect the deduction of taxes that a shareholder would pay on Portfolio distributions or the redemption of Portfolio shares. Performance of share classes will vary due to difference in sales charges and expenses.
(1) The Morgan Stanley Capital International (MSCI) All Country World Ex-U.S. Index is a free float-adjusted market capitalization weighted index designed to measure the equity market performance of developed and emerging markets, excluding the U.S. The term "free float" represents the portion of shares outstanding that are deemed to be available for purchase in the public equity markets by investors. The performance of the Index is listed in U.S. dollars and assumes reinvestment of net dividends. The Index is unmanaged and its returns do not include any sales charges or fees. Such costs would lower performance. It is not possible to invest directly in an index.
(2) The Lipper International Multi-Cap Growth Funds Index is an equally weighted performance index of the largest qualifying funds (based on net assets) in the Lipper International Multi-Cap Growth Funds classification. The Index, which is adjusted for capital gains distributions and income dividends, is unmanaged and should not be considered an investment. There are currently 30 funds represented in this Index. As of the date of this report, the Portfolio was in the Lipper International Multi-Cap Growth Funds classification.
(3) Total returns for the Portfolio reflect fees waived and expenses reimbursed, if applicable, by the Adviser. Without such waivers and reimbursements, total returns would have been lower. The fee waivers and/or expense reimbursements will continue for one year or until such time as the Fund's Board of Directors acts to discontinue all or a portion of such waivers and/or expense reimbursements when it deems that such action is appropriate.
(4) Commenced operations on March 31, 2010.
(5) For comparative purposes, average annual since inception returns listed for the Indexes refer to the inception date or initial offering of the respective share class of the Portfolio, not the inception of the Index.
Portfolio Composition
| Classification | | Percentage of
Total Investments | |
| Other* | | | 45.4 | % | |
| Beverages | | | 14.6 | | |
| Internet Software & Services | | | 8.9 | | |
| Diversified Consumer Services | | | 8.7 | | |
| Road & Rail | | | 6.0 | | |
| Textiles, Apparel & Luxury Goods | | | 5.7 | | |
| Food & Staples Retailing | | | 5.4 | | |
| Leisure Equipment & Products | | | 5.3 | | |
| Total Investments | | | 100.0 | % | |
* Industries representing less than 5% of total investments.
71
2011 Annual Report
December 31, 2011
Portfolio of Investments
International Opportunity Portfolio
| | | Shares | | Value
(000) | |
| Common Stocks (91.8%) | |
| Australia (3.3%) | |
| AET&D Holdings No. 1 Ltd. (a)(b)(c) | | | 16,699 | | | $ | — | | |
| Lynas Corp. Ltd. (a) | | | 85,730 | | | | 92 | | |
| QR National Ltd. | | | 29,226 | | | | 102 | | |
| | | | 194 | | |
| Belgium (3.4%) | |
| Anheuser-Busch InBev N.V. | | | 3,232 | | | | 198 | | |
| Brazil (7.1%) | |
| BM&FBovespa SA | | | 16,528 | | | | 87 | | |
| Brookfield Incorporacoes SA | | | 42,967 | | | | 114 | | |
| CETIP SA - Balcao Organizado de Ativos e Derivativos | | | 14,478 | | | | 209 | | |
| | | | 410 | | |
| Canada (6.3%) | |
| Brookfield Asset Management, Inc., Class A | | | 7,482 | | | | 206 | | |
| Brookfield Infrastructure Partners LP | | | 5,635 | | | | 156 | | |
| | | | 362 | | |
| China (25.6%) | |
| Baidu, Inc. ADR (a) | | | 2,414 | | | | 281 | | |
| China Merchants Holdings International Co., Ltd. (d) | | | 51,649 | | | | 150 | | |
| Golden Eagle Retail Group Ltd. (d) | | | 97,000 | | | | 205 | | |
| Hengan International Group Co., Ltd. (d) | | | 9,500 | | | | 89 | | |
New Oriental Education & Technology
Group, Inc. ADR (a) | | | 11,240 | | | | 270 | | |
| Tencent Holdings Ltd. (d) | | | 4,700 | | | | 95 | | |
| Wynn Macau Ltd. (d) | | | 63,200 | | | | 159 | | |
| Xueda Education Group ADR (a) | | | 51,295 | | | | 179 | | |
| Youku.com, Inc. ADR (a) | | | 3,639 | | | | 57 | | |
| | | | 1,485 | | |
| Denmark (4.2%) | |
| DSV A/S | | | 13,619 | | | | 244 | | |
| France (4.0%) | |
| Christian Dior SA | | | 735 | | | | 87 | | |
| Pernod-Ricard SA | | | 1,577 | | | | 146 | | |
| | | | 233 | | |
| Germany (3.7%) | |
| Adidas AG | | | 1,402 | | | | 91 | | |
| BASF SE | | | 1,764 | | | | 123 | | |
| | | | 214 | | |
| Hong Kong (4.9%) | |
| Minth Group Ltd. | | | 68,000 | | | | 64 | | |
| Sun Art Retail Group Ltd. (a) | | | 175,500 | | | | 219 | | |
| | | | 283 | | |
| India (1.6%) | |
| MakeMyTrip Ltd. (a) | | | 3,781 | | | | 91 | | |
| Israel (1.8%) | |
| Teva Pharmaceutical Industries Ltd. ADR | | | 2,564 | | | | 104 | | |
| Italy (2.6%) | |
| Prada SpA (a)(d) | | | 33,300 | | | | 151 | | |
| Japan (5.3%) | |
| Universal Entertainment Corp. | | | 11,100 | | | | 307 | | |
| | | Shares | | Value
(000) | |
| Korea, Republic of (0.9%) | |
| MegaStudy Co., Ltd. | | | 543 | | | $ | 52 | | |
| Russia (1.4%) | |
| Yandex N.V., Class A (a) | | | 4,032 | | | | 79 | | |
| Switzerland (6.8%) | |
| Kuehne & Nagel International AG (Registered) | | | 1,228 | | | | 138 | | |
| Nestle SA (Registered) | | | 2,139 | | | | 123 | | |
| Panalpina Welttransport Holding AG (Registered) (a) | | | 1,320 | | | | 135 | | |
| | | | 396 | | |
| United Kingdom (4.5%) | |
| Diageo PLC ADR | | | 1,855 | | | | 162 | | |
| Tesco PLC | | | 15,355 | | | | 96 | | |
| | | | 258 | | |
| United States (4.4%) | |
| Greenlight Capital Re Ltd., Class A (a) | | | 7,555 | | | | 179 | | |
| Li & Fung Ltd. (d) | | | 42,000 | | | | 78 | | |
| | | | 257 | | |
| Total Common Stocks (Cost $5,181) | | | 5,318 | | |
| Convertible Preferred Stocks (0.8%) | |
| China (0.0%) | |
| Youku.com, Inc., Class A (a)(b)(c) | | | 6 | | | | — | @ | |
| United States (0.8%) | |
| Better Place, Inc. Series C (a)(b)(c) | | | 10,721 | | | | 49 | | |
| Total Convertible Preferred Stocks (Cost $49) | | | 49 | | |
| Participation Notes (5.8%) | |
| China (5.8%) | |
Deutsche Bank AG, Kweichow Moutai Co.,
Ltd., Class A, Equity Linked Notes,
Zero Coupon, 3/4/21 | | | 3,060 | | | | 94 | | |
UBS AG, Kweichow Moutai Co., Ltd., Class A,
Equity Linked Notes, Zero Coupon, 2/25/13 | | | 7,810 | | | | 240 | | |
| Total Participation Notes (Cost $242) | | | 334 | | |
| Short-Term Investment (1.3%) | |
| Investment Company (1.3%) | |
Morgan Stanley Institutional Liquidity
Funds — Money Market Portfolio —
Institutional Class (See Note G-2) (Cost $72) | | | 72,468 | | | | 72 | | |
| Total Investments (99.7%) (Cost $5,544) | | | 5,773 | | |
| Other Assets in Excess of Liabilities (0.3%) | | | 19 | | |
| Net Assets (100.0%) | | $ | 5,792 | | |
(a) Non-income producing security.
(b) At December 31, 2011, the Portfolio held fair valued securities valued at approximately $49,000, representing 0.8% of net assets. These securities have been fair valued as determined in good faith under procedures established by and under the general supervision of the Fund's Directors.
(c) Security has been deemed illiquid at December 31, 2011.
(d) Security trades on the Hong Kong exchange.
@ Value is less than $500.
ADR American Depositary Receipt.
The accompanying notes are an integral part of the financial statements.
72
2011 Annual Report
December 31, 2011
Portfolio of Investments (cont'd)
International Opportunity Portfolio
Fair Value Measurement Information:
The following is a summary of the inputs used to value the Portfolio's investments as of December 31, 2011. (See Note A-9 to the financial statements for further information regarding fair value measurement.)
| Investment Type | | Level 1
Unadjusted
quoted
prices
(000) | | Level 2
Other
significant
observable
inputs
(000) | | Level 3
Significant
unobservable
inputs
(000) | | Total
(000) | |
| Assets: | | | | | | | | | |
| Common Stocks | | | | | | | | | |
| Air Freight & Logistics | | $ | 135 | | | $ | — | | | $ | — | | | $ | 135 | | |
| Auto Components | | | 64 | | | | — | | | | — | | | | 64 | | |
| Beverages | | | 506 | | | | — | | | | — | | | | 506 | | |
| Capital Markets | | | 209 | | | | — | | | | — | | | | 209 | | |
| Chemicals | | | 123 | | | | — | | | | — | | | | 123 | | |
| Distributors | | | 78 | | | | — | | | | — | | | | 78 | | |
Diversified Consumer
Services | | | 501 | | | | — | | | | — | | | | 501 | | |
Diversified Financial
Services | | | 87 | | | | — | | | | — | | | | 87 | | |
| Electric Utilities | | | 156 | | | | — | | | | — | † | | | 156 | | |
Food & Staples
Retailing | | | 315 | | | | — | | | | — | | | | 315 | | |
| Food Products | | | 123 | | | | — | | | | — | | | | 123 | | |
Hotels, Restaurants &
Leisure | | | 159 | | | | — | | | | — | | | | 159 | | |
| Household Durables | | | 114 | | | | — | | | | — | | | | 114 | | |
| Insurance | | | 179 | | | | — | | | | — | | | | 179 | | |
| Internet & Catalog Retail | | | 91 | | | | — | | | | — | | | | 91 | | |
Internet Software &
Services | | | 512 | | | | — | | | | — | | | | 512 | | |
Leisure Equipment &
Products | | | 307 | | | | — | | | | — | | | | 307 | | |
| Marine | | | 138 | | | | — | | | | — | | | | 138 | | |
| Metals & Mining | | | 92 | | | | — | | | | — | | | | 92 | | |
| Multiline Retail | | | 205 | | | | — | | | | — | | | | 205 | | |
| Personal Products | | | 89 | | | | — | | | | — | | | | 89 | | |
| Pharmaceuticals | | | 104 | | | | — | | | | — | | | | 104 | | |
Real Estate
Management &
Development | | | 206 | | | | — | | | | — | | | | 206 | | |
| Road & Rail | | | 346 | | | | — | | | | — | | | | 346 | | |
Textiles, Apparel &
Luxury Goods | | | 329 | | | | — | | | | — | | | | 329 | | |
Transportation
Infrastructure | | | 150 | | | | — | | | | — | | | | 150 | | |
| Total Common Stocks | | | 5,318 | | | | — | | | | — | † | | | 5,318 | | |
Convertible
Preferred Stocks | | | — | | | | — | | | | 49 | | | | 49 | | |
| Participation Notes | | | — | | | | 334 | | | | — | | | | 334 | | |
| Short-Term Investment — | |
| Investment Company | | | 72 | | | | — | | | | — | | | | 72 | | |
| Total Assets | | $ | 5,390 | | | $ | 334 | | | $ | 49 | † | | $ | 5,773 | | |
Transfers between investment levels may occur as the markets fluctuate and/or the availability of data used in an investment's valuation changes. The Portfolio recognizes transfers between the levels as of the end of the period. As of December 31, 2011, securities with a total value of approximately $240,000 transferred from Level 1 to Level 2. At December 31, 2011, the fair market value of certain securities were adjusted due to developments which occurred between the time of the close of the foreign markets on which they trade and the close of business on the NYSE which resulted in their Level 2 classification.
Following is a reconciliation of investments in which significant unobservable inputs (Level 3) were used in determining fair value.
| | | Common
Stock
(000) | | Convertible
Preferred
Stock
(000) | |
| Beginning Balance | | $ | — | † | | $ | 106 | | |
| Purchases | | | — | | | | 49 | | |
| Sales | | | — | | | | (30 | ) | |
| Amortization of discount | | | — | | | | — | | |
| Transfers in | | | — | | | | — | | |
| Transfers out | | | — | | | | — | | |
| Change in unrealized appreciation (depreciation) | | | — | | | | (76 | ) | |
| Realized gains (losses) | | | — | | | | — | | |
| Ending Balance | | $ | — | † | | $ | 49 | | |
Net change in unrealized appreciation/depreciation
from investments still held as of
December 31, 2011 | | $ | — | | | $ | (76 | ) | |
† Includes one or more securities which are valued at zero.
The accompanying notes are an integral part of the financial statements.
73
2011 Annual Report
December 31, 2011
Investment Overview (unaudited)
International Real Estate Portfolio
The International Real Estate Portfolio (the "Portfolio") seeks to provide current income and long-term capital appreciation by investing primarily in equity securities of companies in the real estate industry located throughout the world (excluding the United States and Canada).
Performance
For the year ended December 31, 2011, the Portfolio had a total return based on net asset value and reinvestment of distributions per share of -19.92%, net of fees, for Class I shares. The Portfolio's Class I shares underperformed against its benchmark, the FTSE EPRA/NAREIT Developed Ex-North America Real Estate — Net Total Return Index (the "Index"), which returned -17.81%, and underperformed the MSCI EAFE Index, which returned -12.14%.
Factors Affecting Performance
• The international real estate securities market declined 17.81% during the 12-month period ending December 31, 2011, as measured by the Index. International real estate securities posted modest gains in the first half of the year, but significantly declined in the third quarter on investor concerns about the European sovereign debt crisis and the risk of a hard landing scenario in China. Subsequently, real estate securities rallied significantly in October as concerns about these factors eased, but posted further declines in November and December.
• Stock selection within the European regional portfolio contributed to performance, while the Asian portfolio detracted. Top-down global allocation was neutral. In Asia, the Portfolio benefited from the underweight to Singapore; this was offset by the negative impact of the underweight to Australia, the overweight to Hong Kong, and stock selection in Singapore. In Europe, the Portfolio benefited from the overweight to the U.K., stock selection within and the underweight to Germany, and the underweight to Austria; this was partially offset by relative losses from stock selection in the U.K.
Management Strategies
• The MSIF International Real Estate Portfolio is comprised of two regional portfolios with a global allocation which weights the European and Asian regions based on our view of the relative attractiveness of each region in terms of underlying real estate fundamentals and public market valuations. Moreover, both of the regional portfolios reflect our core investment philosophy as a real estate value investor, which results in the ownership of stocks that we believe provide the best valuation relative to their underlying real estate values, while maintaining portfolio diversification. Our company specific research leads us to specific preferences for sub-segments within each of the property sectors and countries. For the period ended December 31, 2011, the Portfolio was overweight the Asian listed property sector and underweight the European listed property sector.
• The overweight to the Asian region was predominated by the real estate operating companies (REOCs) in Hong Kong and Japan, as we believe these markets represent attractive valuation opportunities. The Hong Kong REOCs continued to trade at wide discounts to their net asset value (NAV), even after NAVs were modestly revised downward to reflect weakness in residential values and declines in rents/capital values for investment assets. The Japanese REOCs also continued to trade at wide discounts to NAV on continued uncertainty over prospects for underlying property fundamentals. We continue to maintain a preference for the major REOCs with predominant exposure to prime assets given relatively more stable property fundamentals, the ability to engage in value-added opportunities such as development and redevelopment, well-positioned balance sheets, and continued access to financing. This contrasts widely to the Asian REITs, which are passive, externally managed vehicles limited to property ownership, many of which maintain predominant exposure to secondary assets, which have weaker underlying property fundamentals. The Portfolio was underweight the Australian REIT sector on relative valuation.
• In Europe, the Portfolio was overweight the U.K. and underweight the Continent. Valuations on the Continent ended the period trading at a meaningful discount to NAV based on reported NAVs, which only reflect marginal capital value declines since the start of the credit crisis. Valuations in the U.K. ended the period trading at a significant discount to
74
2011 Annual Report
December 31, 2011
Investment Overview (unaudited) (cont'd)
International Real Estate Portfolio
reported NAVs, which have partially recovered after experiencing significant declines in the two years to June 2009.
• Key Asian markets (in particular Hong Kong and Singapore) had witnessed improvements in rents due to strong economies and tenant demand as well as low vacancy levels and limited new supply, but rents experienced some pullback in the second half of 2011 primarily due to uncertainty over global economic conditions. However, the lack of new supply (particularly in Hong Kong) is a key differentiating factor as compared to prior economic slowdowns in this region. Most Western markets (and Japan) have been slowly recovering (or bottoming) from significant declines in rents and occupancies but there are concerns regarding the pace of recovery due to economic weakness and risk of recession (particularly in Europe). Unlike previous real estate cycles, the key risk in these markets is not oversupply. Rather, the key issue is that many markets are close to cyclically high vacancy rates and prospects for a meaningful recovery of tenant demand remain lackluster, particularly as prospects for the global economy have become more uncertain. The expectation for an absence of material job growth also remains a significant concern, although this has been somewhat mitigated by limited new supply.
• We continue to maintain strong conviction in our value-oriented, bottom-up driven investment strategy, which is focused on investing in stocks that offer exposure to the direct property markets at the best relative valuations. In certain market segments, there is a very wide discrepancy between private and public valuations, and relative to other public listed property markets, largely driven by negative sentiment. With regard to current portfolio positioning, we recognize that negative investor sentiment may persist and may impact portfolio performance in the short term, but our strong conviction is based on our fundamental analysis, and we remain committed to our long-term, value-oriented, bottom-up driven investment strategy.
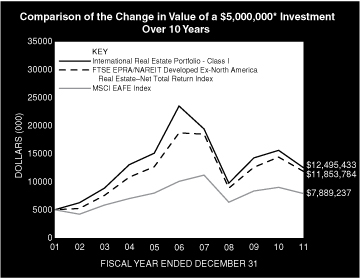
* Minimum Investment
In accordance with SEC regulations, Portfolio's performance shown assumes that all recurring fees (including management fees) were deducted and all dividends and distributions were reinvested. The performance of Class P shares will vary from the Class I shares based upon it will be negatively impacted by additional fees assessed to that class.
Performance Compared to the FTSE EPRA/NAREIT Developed Ex-North America Real Estate — Net Total Return Index(1) and the MSCI EAFE Index(2)
| | | Period Ended December 31, 2011 | |
| | | Total Returns(4) | |
| | | | | Average Annual | |
| | | One
Year | | Five
Years | | Ten
Years | | Since
Inception(5) | |
Portfolio — Class I Shares
w/o sales charges(5) | | | –19.92 | % | | | –11.92 | % | | | 9.59 | % | | | 6.87 | % | |
FTSE EPRA/NAREIT Developed
Ex-North America Real Estate —
Net Total Return Index | | | –17.81 | | | | –8.75 | | | | 9.02 | | | | 4.45 | | |
| MSCI EAFE Index | | | –12.14 | | | | –4.72 | | | | 4.67 | | | | 2.83 | | |
Portfolio — Class P Shares
w/o sales charges(5) | | | –20.16 | | | | –12.14 | | | | 9.31 | | | | 6.61 | | |
FTSE EPRA/NAREIT Developed
Ex-North America Real Estate —
Net Total Return Index | | | –17.81 | | | | –8.75 | | | | 9.02 | | | | 4.45 | | |
| MSCI EAFE Index | | | –12.14 | | | | –4.72 | | | | 4.67 | | | | 2.83 | | |
Performance data quoted represents past performance, which is no guarantee of future results, and current performance may be lower or higher than the figures shown. Performance assumes that all dividends and distributions, if any, were reinvested. For the most recent month-end performance figures, please visit www.morganstanley.com/im. Investment return and principal value will fluctuate so that Portfolio shares, when redeemed, may be worth more or less than their original cost. Total returns do not reflect the deduction of taxes that a shareholder would pay on Portfolio distributions or the redemption of Portfolio shares. Performance of share classes will vary due to difference in expenses.
75
2011 Annual Report
December 31, 2011
Investment Overview (unaudited) (cont'd)
International Real Estate Portfolio
(1) The FTSE EPRA/NAREIT Developed Ex-North America Real Estate — Net Total Return Index The FTSE EPRA/NAREIT Developed Ex-North America Real Estate — Net Total Return Index is a free float-adjusted market capitalization weighted index designed to reflect the stock performance of companies engaged in the European and Asian real estate markets. The performance of the Index is listed in U.S. dollars and assumes reinvestment of dividends. "Net Total Return to U.S. investors" reflects a reduction in total returns after taking into account the withholding tax on dividends by certain foreign countries represented in the Index for periods after 1/31/05 (gross returns used prior to 1/31/05). The Index is unmanaged and its returns do not include any sales charges or fees. Such costs would lower performance. It is not possible to invest directly in an index.
(2) The Morgan Stanley Capital International (MSCI) EAFE Index (Europe, Australasia, Far East) is a free float-adjusted market capitalization index that is designed to measure the international equity market performance of developed markets, excluding the US & Canada. The term "free float" represents the portion of shares outstanding that are deemed to be available for purchase in the public equity markets by investors. The MSCI EAFE Index currently consists of 22 developed market country indices. The performance of the Index is listed in U.S. dollars and assumes reinvestment of net dividends. The Index is unmanaged and its returns do not include any sales charges or fees. Such costs would lower performance. It is not possible to invest directly in an index.
(3) Total returns for the Portfolio reflect fees waived and expenses reimbursed, if applicable, by the Adviser. Without such waivers and reimbursements, total returns would have been lower. The fee waivers and/or expense reimbursements will continue for one year or until such time as the Fund's Board of Directors acts to discontinue all or a portion of such waivers and/or expense reimbursements when it deems that such action is appropriate.
(4) Commenced operations on October 1, 1997.
(5) For comparative purposes, average annual since inception returns listed for the Indexes refer to the inception date or initial offering of the respective share class of the Portfolio, not the inception of the Index.
Portfolio Composition
| Classification | | Percentage of
Total Investments | |
| Diversified | | | 60.6 | % | |
| Retail | | | 17.2 | | |
| Office | | | 12.9 | | |
| Residential | | | 6.6 | | |
| Other* | | | 2.7 | | |
| Total Investments | | | 100.0 | % | |
* Industries representing less than 5% of total investments.
76
2011 Annual Report
December 31, 2011
Portfolio of Investments
International Real Estate Portfolio
| | | Shares | | Value
(000) | |
| Common Stocks (99.8%) | |
| Australia (15.0%) | |
| CFS Retail Property Trust REIT | | | 1,266,914 | | | $ | 2,184 | | |
| Commonwealth Property Office Fund REIT | | | 475,540 | | | | 465 | | |
| Dexus Property Group REIT (Stapled Securities) (a) | | | 1,998,155 | | | | 1,696 | | |
| Goodman Group REIT (Stapled Securities) (a) | | | 3,221,987 | | | | 1,878 | | |
| GPT Group REIT (Stapled Securities) (a) | | | 1,284,804 | | | | 4,034 | | |
| Mirvac Group REIT (Stapled Securities) (a)(b) | | | 1,376,493 | | | | 1,661 | | |
| Stockland REIT (Stapled Securities) (a)(b) | | | 1,053,578 | | | | 3,438 | | |
| Westfield Group REIT (Stapled Securities) (a)(b) | | | 1,412,379 | | | | 11,282 | | |
| Westfield Retail Trust REIT | | | 1,951,743 | | | | 4,971 | | |
| | | | 31,609 | | |
| Austria (0.2%) | |
| Atrium European Real Estate Ltd. | | | 84,777 | | | | 386 | | |
| Conwert Immobilien Invest SE | | | 10,483 | | | | 116 | | |
| | | | 502 | | |
| Belgium (0.1%) | |
| Befimmo SCA Sicafi REIT | | | 3,727 | | | | 243 | | |
| China (7.3%) | |
| China Overseas Land & Investment Ltd. (c) | | | 3,936,240 | | | | 6,579 | | |
| China Resources Land Ltd. (c) | | | 3,907,000 | | | | 6,278 | | |
| Guangzhou R&F Properties Co., Ltd., H Shares (c) | | | 3,192,800 | | | | 2,524 | | |
| | | | 15,381 | | |
| Finland (0.6%) | |
| Citycon Oyj | | | 145,384 | | | | 435 | | |
| Sponda Oyj | | | 207,133 | | | | 836 | | |
| | | | 1,271 | | |
| France (7.6%) | |
| Fonciere Des Regions REIT | | | 17,503 | | | | 1,124 | | |
| Gecina SA REIT | | | 10,903 | | | | 917 | | |
| ICADE REIT | | | 15,956 | | | | 1,255 | | |
| Klepierre REIT | | | 91,589 | | | | 2,613 | | |
| Mercialys SA REIT | | | 11,546 | | | | 372 | | |
| Societe de la Tour Eiffel REIT | | | 5,952 | | | | 296 | | |
Societe Immobiliere de Location pour l'Industrie
et le Commerce REIT | | | 5,777 | | | | 560 | | |
| Unibail-Rodamco SE REIT | | | 49,538 | | | | 8,906 | | |
| | | | 16,043 | | |
| Germany (1.0%) | |
| Alstria Office AG REIT | | | 108,697 | | | | 1,294 | | |
| Deutsche Euroshop AG | | | 9,093 | | | | 292 | | |
| Prime Office AG REIT (d) | | | 100,504 | | | | 565 | | |
| | | | 2,151 | | |
| Hong Kong (27.6%) | |
| Hang Lung Properties Ltd. | | | 1,235,000 | | | | 3,514 | | |
| Henderson Land Development Co., Ltd. | | | 739,882 | | | | 3,677 | | |
| Hongkong Land Holdings Ltd. | | | 2,398,000 | | | | 10,887 | | |
| Hysan Development Co., Ltd. | | | 1,126,432 | | | | 3,698 | | |
| Kerry Properties Ltd. | | | 1,315,271 | | | | 4,352 | | |
| Link REIT (The) | | | 184,000 | | | | 678 | | |
| New World Development , Ltd. | | | 1,373,715 | | | | 1,107 | | |
| Sino Land Co., Ltd. | | | 581,866 | | | | 829 | | |
| Sun Hung Kai Properties Ltd. | | | 1,960,174 | | | | 24,570 | | |
| | | Shares | | Value
(000) | |
| Swire Pacific Ltd. | | | 27,500 | | | $ | 332 | | |
| Wharf Holdings Ltd. | | | 1,008,117 | | | | 4,556 | | |
| | | | 58,200 | | |
| Italy (0.6%) | |
| Beni Stabili SpA | | | 2,566,643 | | | | 1,149 | | |
| Japan (18.1%) | |
| Japan Real Estate Investment Corp. REIT | | | 248 | | | | 1,933 | | |
| Mitsubishi Estate Co., Ltd. | | | 944,000 | | | | 14,104 | | |
| Mitsui Fudosan Co., Ltd. | | | 852,000 | | | | 12,420 | | |
| Nippon Building Fund, Inc. REIT | | | 235 | | | | 1,923 | | |
| NTT Urban Development Corp. | | | 187 | | | | 128 | | |
| Sumitomo Realty & Development Co., Ltd. | | | 435,000 | | | | 7,618 | | |
| | | | 38,126 | | |
| Malta (0.0%) | |
| BGP Holdings PLC (d)(e) | | | 4,769,371 | | | | — | | |
| Netherlands (2.2%) | |
| Corio N.V. REIT | | | 52,286 | | | | 2,274 | | |
| Eurocommercial Properties N.V. CVA REIT | | | 54,564 | | | | 1,732 | | |
| Wereldhave N.V. REIT | | | 10,692 | | | | 710 | | |
| | | | 4,716 | | |
| Norway (0.1%) | |
| Norwegian Property ASA | | | 154,397 | | | | 190 | | |
| Singapore (3.3%) | |
| CapitaCommercial Trust REIT | | | 462,000 | | | | 376 | | |
| CapitaLand Ltd. | | | 2,198,000 | | | | 3,745 | | |
| CapitaMall Trust REIT | | | 143,000 | | | | 187 | | |
| CapitaMalls Asia Ltd. | | | 319,000 | | | | 278 | | |
| City Developments Ltd. | | | 227,000 | | | | 1,557 | | |
| Keppel Land Ltd. | | | 258,247 | | | | 442 | | |
| Suntec REIT | | | 516,000 | | | | 428 | | |
| | | | 7,013 | | |
| Sweden (1.2%) | |
| Atrium Ljungberg AB, Class B | | | 51,400 | | | | 547 | | |
| Castellum AB | | | 15,468 | | | | 192 | | |
| Fabege AB | | | 32,682 | | | | 256 | | |
| Hufvudstaden AB, Class A | | | 151,829 | | | | 1,545 | | |
| | | | 2,540 | | |
| Switzerland (1.8%) | |
| PSP Swiss Property AG (Registered) (d) | | | 36,914 | | | | 3,089 | | |
| Swiss Prime Site AG (Registered) (d) | | | 9,449 | | | | 710 | | |
| | | | 3,799 | | |
| United Kingdom (13.1%) | |
| Big Yellow Group PLC REIT | | | 354,374 | | | | 1,350 | | |
| British Land Co., PLC REIT | | | 482,107 | | | | 3,463 | | |
| Capital & Counties Properties PLC | | | 127,018 | | | | 364 | | |
| Capital & Regional PLC (d) | | | 1,183,866 | | | | 584 | | |
| Capital Shopping Centres Group PLC REIT | | | 287,906 | | | | 1,396 | | |
| Derwent London PLC REIT | | | 47,090 | | | | 1,141 | | |
| Development Securities PLC | | | 100,763 | | | | 235 | | |
| Grainger PLC | | | 535,056 | | | | 889 | | |
| Great Portland Estates PLC REIT | | | 149,269 | | | | 749 | | |
| Hammerson PLC REIT | | | 667,748 | | | | 3,733 | | |
| Land Securities Group PLC REIT | | | 541,273 | | | | 5,342 | | |
The accompanying notes are an integral part of the financial statements.
77
2011 Annual Report
December 31, 2011
Portfolio of Investments (cont'd)
International Real Estate Portfolio
| | | Shares | | Value
(000) | |
| United Kingdom (cont'd) | |
| London & Stamford Property PLC | | | 111,300 | | | $ | 187 | | |
| LXB Retail Properties PLC (d) | | | 980,638 | | | | 1,587 | | |
| Metric Property Investments PLC REIT | | | 413,082 | | | | 545 | | |
| Quintain Estates & Development PLC (d) | | | 1,011,041 | | | | 593 | | |
| Safestore Holdings PLC | | | 799,703 | | | | 1,242 | | |
| Segro PLC REIT | | | 417,400 | | | | 1,351 | | |
| Shaftesbury PLC REIT | | | 52,858 | | | | 383 | | |
| ST Modwen Properties PLC | | | 614,687 | | | | 1,079 | | |
| Unite Group PLC | | | 543,765 | | | | 1,419 | | |
| | | | 27,632 | | |
| Total Common Stocks (Cost $404,077) | | | 210,565 | | |
| Short-Term Investment (0.0%) | |
| Investment Company (0.0%) | |
Morgan Stanley Institutional Liquidity
Funds — Money Market Portfolio —
Institutional Class (See Note G-2) (Cost $83) | | | 82,920 | | | | 83 | | |
| Total Investments (99.8%) (Cost $404,160) | | | 210,648 | | |
| Other Assets in Excess of Liabilities (0.2%) | | | 447 | | |
| Net Assets (100.0%) | | $ | 211,095 | | |
(a) Comprised of securities in separate entities that are traded as a single stapled security.
(b) Consists of one or more classes of securities traded together as a unit; stocks with attached warrants.
(c) Security trades on the Hong Kong exchange.
(d) Non-income producing security.
(e) At December 31, 2011, the Portfolio held a fair valued security valued at $0, representing 0.0% of net assets. This security has been fair valued as determined in good faith under procedures established by and under the general supervision of the Fund's Directors.
CVA Certificaten Van Aandelen.
REIT Real Estate Investment Trust.
Fair Value Measurement Information:
The following is a summary of the inputs used to value the Portfolio's investments as of December 31, 2011. (See Note A-9 to the financial statements for further information regarding fair value measurement.)
| Investment Type | | Level 1
Unadjusted
quoted
prices
(000) | | Level 2
Other
significant
observable
inputs
(000) | | Level 3
Significant
unobservable
inputs
(000) | | Total
(000) | |
| Assets: | | | | | | | | | |
| Common Stocks | | | | | | | | | |
| Diversified | | $ | 127,551 | | | $ | — | | | $ | — | † | | $ | 127,551 | | |
| Industrial | | | 3,229 | | | | — | | | | — | | | | 3,229 | | |
| Office | | | 27,203 | | | | — | | | | — | | | | 27,203 | | |
| Residential | | | 13,862 | | | | — | | | | — | | | | 13,862 | | |
| Retail | | | 36,128 | | | | — | | | | — | | | | 36,128 | | |
| Self Storage | | | 2,592 | | | | — | | | | — | | | | 2,592 | | |
| Total Common Stocks | | | 210,565 | | | | — | | | | — | † | | | 210,565 | | |
| Investment Type | | Level 1
Unadjusted
quoted
prices
(000) | | Level 2
Other
significant
observable
inputs
(000) | | Level 3
Significant
unobservable
inputs
(000) | | Total
(000) | |
Short-Term Investment —
Investment Company | | $ | 83 | | | $ | — | | | $ | — | | | $ | 83 | | |
| Total Assets | | $ | 210,648 | | | $ | — | | | $ | — | † | | $ | 210,648 | | |
Transfers between investment levels may occur as the markets fluctuate and/or the availability of data used in an investment's valuation changes. The Portfolio recognizes transfers between the levels as of the end of the period. As of December 31, 2011, the Portfolio did not have any significant investments transfer between investment levels.
Following is a reconciliation of investments in which significant unobservable inputs (Level 3) were used in determining fair value.
| | | Common
Stocks
(000) | |
| Beginning Balance | | $ | — | † | |
| Purchases | | | — | | |
| Sales | | | — | | |
| Amortization of discount | | | — | | |
| Transfers in | | | — | | |
| Transfers out | | | — | | |
| Change in unrealized appreciation (depreciation) | | | — | | |
| Realized gains (losses) | | | — | | |
| Ending Balance | | $ | — | † | |
Net change in unrealized appreciation/depreciation from
investment still held as of December 31, 2011 | | $ | — | | |
† Includes one or more securities which are valued at zero.
The accompanying notes are an integral part of the financial statements.
78
2011 Annual Report
December 31, 2011
Investment Overview (unaudited)
International Small Cap Portfolio
The International Small Cap Portfolio (the "Portfolio") seeks long-term capital appreciation by investing primarily in equity securities of small non-U.S. companies.
Performance
For the year ended December 31, 2011, the Portfolio had a total return based on net asset value and reinvestment of distributions per share of -18.33%, net of fees, for Class I shares. The Portfolio's Class I shares underperformed against its benchmark, the MSCI EAFE Small Cap Total Return Index (the "Index"), which returned -15.94%.
Factors Affecting Performance
• 2011 was an extraordinary year, punctuated by uprisings in the Middle East and North Africa, a tsunami in Japan and floods in Australia and Thailand. Besides the tragic human cost, these events added to the volatility of the macro data and uncertainty for investors. Most equity markets peaked in April or May and thereafter lost ground, as the focus on the euro zone debt crisis intensified and investors were whipsawed by concerns about European politics, together with increasing uncertainty over the Chinese economy and falling commodity prices. A brief respite in October saw markets rebounding on the back of better economic data in the U.S. and some tentative progress on the European debt crisis. A surprise proposal by the Greek prime minister to call a referendum, however, and political crisis in Italy duly sent the markets back into sharply negative territory. The year ended on a modestly more positive note but, despite some solidly good corporate earnings, 2011 was characterized by political dysfunction and uncertainty.
• For the year as a whole, international small cap equities underperformed their large cap counterparts, with the MSCI EAFE Small Cap Index declining 15.9% compared with a 12.1% fall in the MSCI EAFE Index. Currencies continued to influence returns. The U.S. dollar rose against the euro over the year (+3.4%) whilst concerns about China's economy and commodity prices drove a 5.2% decline in the Australian dollar over the quarter but left it flat for the year. The reverse was true for the Japanese yen, which was flat on the quarter but appreciated 5.1% against the U.S. dollar over the year. In local currency terms, the MSCI EAFE Small Cap Index fell 16.5% compared with a 15.9% decline in U.S. dollars terms.
• The Asia Pacific region closed the year strongly but this did not stop Hong Kong and Australia underperforming for the full year (-26.2% and -17.3%, respectively). In contrast, Japan, the best-performing country over the full year (-3.9%), lagged in the final quarter (-4.8%) as it failed to fully participate in the October rally. Europe saw a huge dispersion of returns in both the fourth quarter and over the year. The Nordic countries led the way in the final quarter (+7.8%), driven by Sweden (+13.0%), but declined 22.7% for the full year, dragged down by Finland (-33.9%) and Norway (-28.0%). The U.K. proved to be one of the more resilient markets for the full year (-12.4%). Of the "core" euro zone markets, all underperformed sharply for the full year, outdone only by the "peripheral" euro zone markets. Greece and Portugal, the main laggards, fell 57.8% and 39.1%, for the year, respectively.
• At a sector level, defensives outperformed (utilities +2.3%, consumer staples -4.0%, and health care -11.0%). Energy and materials fell hardest (-24.9% and -20.2%, respectively), followed by information technology (-19.8%) and financials (-16.9%).
• The Portfolio's performance fluctuated with the market's sharp moves during the year. For the year as a whole, the Portfolio's country and sector positioning worked well — namely its overweight to Japan and underweight to Europe, as well as its defensive sector bias, with an overweight to consumer staples and underweights to materials, energy, and IT. Strong stock selection from energy, materials, and financials, however, was offset by the sharp sell-off in the Portfolio's holding in a U.K. food manufacturer, together with weak stock selection in the industrials, IT and consumer discretionary sectors.
Management Strategies
• We have opportunistically been using the market weakness to gingerly start to build positions in a number of high-quality cyclicals. We believe these stocks are typically discounting recessionary conditions. A number of the new stocks are back at
79
2011 Annual Report
December 31, 2011
Investment Overview (unaudited) (cont'd)
International Small Cap Portfolio
or below the prices that we were last able to purchase them in 2009. A lot is discounted in our view. We are still, on balance, slightly overweight defensives in the Portfolio but this is likely to slowly reverse over coming weeks and months, subject to market conditions and, of course, valuations. To fund these new purchases, we have continued to take profits on some of the Japanese financials and consumer discretionary names that have performed strongly, and on some of our U.K., Italian and Spanish consumer staples and health care names.
• What is priced into international small caps? Simply put, a lot of bad news. Risk aversion is high, as evident by the speed and sharpness of the response to any modicum of positive news. Our investment universe has swelled to unprecedented levels and many high-quality, large-cap names that typically only appear in our screens in extreme conditions are back. They last visited us in the first quarter of 2009. It was right to buy them then. It feels right to buy them now, especially when we believe some of these companies are demonstrably stronger than in 2009.
• It has been disappointing that we have not preserved capital in the Portfolio in 2011. This is at odds with our long-term performance history but does not reflect any change in our value philosophy or process. What was different in 2011 was that stocks did not get expensive before they got cheap and value did not prove a support. This differs from 2000 and 2008. Then our value discipline took us out of the expensive stocks/sectors into the cheapest/least in favor names and these preserved capital. In 2011, we took significant profits from stronger-performing cyclicals during the first quarter but we believed there was still a solid amount of value left in other quality cyclicals. In most instances, these companies went on to deliver or exceed our expectations for profit growth. Market anxiety, however, driven primarily by uncertainty over the European political environment, simply de-rated these stocks. Defensives were starting to nudge into attractive territory in March and April last year and we went modestly overweight. The Portfolio mainly owned attractively valued, high-quality consumer staples and health care companies in Europe, as the Japanese equivalents were expensive. Yet it was the Japanese that helped preserve capital relative to the market and the European 'defensive' sectors barely lived up to their label.
• There is a lot for the market to contend with in the coming months and there will be no quick fixes. With expectations and valuations so low, however, only a modicum of a plan and a sticking plaster of cohesion are required to allow equities to rise. With international small cap valuations at such depressed levels, some 52% below their average price-to-book, we believe any sustained rally will see small caps take the lead. Their strong cyclical bias should see to that. The Portfolio is currently valued at just 0.9 times price-to-book for companies that have historically delivered an average return on equity of 17%. If history is our guide, valuations do not stay here for long. The Chinese Year of the Dragon is considered a year of prosperity. We will do our best to seek that outcome.
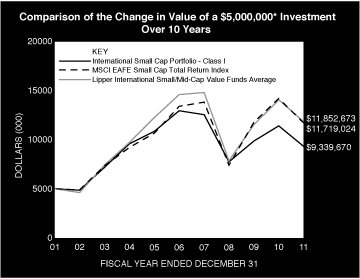
* Minimum Investment
In accordance with SEC regulations, Portfolio's performance shown assumes that all recurring fees (including management fees) were deducted and all dividends and distributions were reinvested. The performance of Class P shares will vary from the Class I shares based upon its different inception date and will be negatively impacted by additional fees assessed to that class.
80
2011 Annual Report
December 31, 2011
Investment Overview (unaudited) (cont'd)
International Small Cap Portfolio
Performance Compared to the Morgan Stanley Capital International (MSCI) EAFE Small Cap Total Return Index(1) and the Lipper International Small/Mid-Cap Value Funds Average(2)
| | | Period Ended December 31, 2011 | |
| | | Total Returns(3) | |
| | | | | Average Annual | |
| | | One
Year | | Five
Years | | Ten
Years | | Since
Inception(6) | |
Portfolio — Class I Shares
w/o sales charges(4) | | | –18.33 | % | | | –6.39 | % | | | 6.45 | % | | | 8.29 | % | |
MSCI EAFE Small Cap Total
Return Index | | | –15.94 | | | | –4.14 | | | | 9.01 | | | | 4.93 | | |
Lipper International Small/Mid-Cap
Value Funds Average | | | –17.73 | | | | –3.11 | | | | 8.43 | | | | 7.95 | | |
Portfolio — Class P Shares
w/o sales charges(5) | | | –18.56 | | | | — | | | | — | | | | 6.25 | | |
MSCI EAFE Small Cap Total
Return Index | | | –15.94 | | | | — | | | | — | | | | 12.11 | | |
Lipper International Small/Mid-Cap
Value Funds Average | | | –17.73 | | | | — | | | | — | | | | 15.48 | | |
Performance data quoted represents past performance, which is no guarantee of future results, and current performance may be lower or higher than the figures shown. Performance assumes that all dividends and distributions, if any, were reinvested. For the most recent month-end performance figures, please visit www.morganstanley.com/im. Investment return and principal value will fluctuate so that Portfolio shares, when redeemed, may be worth more or less than their original cost. Total returns do not reflect the deduction of taxes that a shareholder would pay on Portfolio distributions or the redemption of Portfolio shares. Performance of share classes will vary due to difference in expenses.
(1) The Morgan Stanley Capital International (MSCI) EAFE Small Cap Total Return Index is an unmanaged, market value weighted average of the performance of over 900 securities of companies listed on the stock exchanges of countries in Europe, Australasia and the Far East, including price performance and income from dividend payments. The MSCI EAFE Small Cap Total Return Index commenced as of January 31, 2002. Returns, including periods prior to January 31, 2002, are calculated using the return data of the MSCI EAFE Small Cap Index through January 30, 2002 and the return data of the MSCI EAFE Small Cap Total Return Index since January 31, 2002. The Index is unmanaged and its returns do not include any sales charges or fees. Such costs would lower performance. It is not possible to invest directly in an index.
(2) The Lipper International Small/Mid-Cap Value Funds Average tracks the performance of all funds in the Lipper International Small/Mid-Cap Value Funds classification. The Average, which is adjusted for capital gains distributions and income dividends, is unmanaged and should not be considered an investment. As of the date of this report, the Portfolio was in the Lipper International Small/Mid-Cap Value Funds classification.
(3) Total returns for the Portfolio reflect fees waived and expenses reimbursed, if applicable, by the Adviser. Without such waivers and reimbursements, total returns would have been lower. The fee waivers and/or expense reimbursements will continue for one year or until such time as the Fund's Board of Directors acts to discontinue all or a portion of such waivers and/or expense reimbursements when it deems that such action is appropriate.
(4) Commenced operations on December 15, 1992.
(5) Commenced offering on October 21, 2008.
(6) For comparative purposes, average annual since inception returns listed for the Indexes refer to the inception date or initial offering of the respective share class of the Portfolio, not the inception of the Index.
Portfolio Composition
| Classification | | Percentage of
Total Investments | |
| Other* | | | 74.1 | % | |
| Machinery | | | 11.1 | | |
| Commercial Banks | | | 7.8 | | |
| Media | | | 7.0 | | |
| Total Investments | | | 100.0 | %** | |
* Industries representing less than 5% of total investments.
** Does not include open foreign currency exchange contracts with net unrealized depreciation of approximately $38,000.
81
2011 Annual Report
December 31, 2011
Portfolio of Investments
International Small Cap Portfolio
| | | Shares | | Value
(000) | |
| Common Stocks (97.8%) | |
| Australia (5.2%) | |
| Alesco Corp. Ltd. | | | 918,224 | | | $ | 1,085 | | |
| Boart Longyear Ltd. | | | 942,066 | | | | 2,679 | | |
| Dart Energy Ltd. (a) | | | 848,074 | | | | 312 | | |
| Infomedia Ltd. | | | 5,151,856 | | | | 1,133 | | |
| Myer Holdings Ltd. | | | 1,435,161 | | | | 2,840 | | |
| Navitas Ltd. | | | 600,347 | | | | 2,149 | | |
| SAI Global Ltd. | | | 668,321 | | | | 3,076 | | |
| WHK Group Ltd. | | | 2,698,597 | | | | 2,277 | | |
| | | | 15,551 | | |
| Austria (1.2%) | |
| Atrium European Real Estate Ltd. | | | 788,077 | | | | 3,584 | | |
| China (1.2%) | |
| EVA Precision Industrial Holdings Ltd. (b) | | | 15,342,000 | | | | 3,714 | | |
| Denmark (4.1%) | |
| ALK-Abello A/S | | | 30,352 | | | | 1,696 | | |
| Jyske Bank A/S (Registered) (a) | | | 98,179 | | | | 2,410 | | |
| Royal Unibrew A/S | | | 31,990 | | | | 1,791 | | |
| SimCorp A/S | | | 15,105 | | | | 2,307 | | |
| Sydbank A/S | | | 249,485 | | | | 3,914 | | |
| | | | 12,118 | | |
| Finland (2.3%) | |
| Konecranes Oyj | | | 144,621 | | | | 2,721 | | |
| Ramirent Oyj | | | 106,505 | | | | 758 | | |
| Rautaruukki Oyj | | | 270,464 | | | | 2,491 | | |
| Stora Enso Oyj, Class R | | | 125,228 | | | | 750 | | |
| | | | 6,720 | | |
| France (3.7%) | |
| Alten Ltd. | | | 55,745 | | | | 1,312 | | |
| Euler Hermes SA | | | 74,210 | | | | 4,394 | | |
| Eurofins Scientific | | | 53,736 | | | | 3,918 | | |
| Sa des Ciments Vicat | | | 21,328 | | | | 1,220 | | |
| | | | 10,844 | | |
| Germany (4.7%) | |
| Draegerwerk AG & Co. KGaA (Preference) | | | 43,612 | | | | 3,539 | | |
| GEA Group AG | | | 68,755 | | | | 1,944 | | |
| Gerresheimer AG | | | 47,169 | | | | 1,966 | | |
| Kontron AG | | | 400,752 | | | | 2,626 | | |
| Rheinmetall AG | | | 86,324 | | | | 3,825 | | |
| | | | 13,900 | | |
| Hong Kong (5.3%) | |
| AMVIG Holdings Ltd. | | | 6,255,000 | | | | 3,318 | | |
| China High Precision Automation Group Ltd. | | | 7,461,000 | | | | 2,580 | | |
| Pacific Basin Shipping Ltd. | | | 7,050,000 | | | | 2,823 | | |
| Real Nutriceutical Group Ltd. | | | 5,333,000 | | | | 1,744 | | |
| Techtronic Industries Co. | | | 2,612,000 | | | | 2,687 | | |
| Xinyi Glass Holdings Ltd. | | | 4,228,000 | | | | 2,428 | | |
| | | | 15,580 | | |
| | | Shares | | Value
(000) | |
| Ireland (2.9%) | |
| FBD Holdings PLC | | | 206,940 | | | $ | 1,741 | | |
| Kerry Group PLC, Class A | | | 140,411 | | | | 5,140 | | |
| United Drug PLC | | | 629,634 | | | | 1,671 | | |
| | | | 8,552 | | |
| Italy (3.2%) | |
| Azimut Holding SpA | | | 300,791 | | | | 2,412 | | |
| Brembo SpA | | | 221,207 | | | | 1,895 | | |
| Prysmian SpA | | | 259,398 | | | | 3,221 | | |
| Recordati SpA | | | 253,772 | | | | 1,835 | | |
| | | | 9,363 | | |
| Japan (32.9%) | |
| Asahi Diamond Industrial Co., Ltd. | | | 263,800 | | | | 3,187 | | |
| Daibiru Corp. | | | 768,900 | | | | 4,835 | | |
| Disco Corp. | | | 42,700 | | | | 2,227 | | |
| Fuji Machine Manufacturing Co., Ltd. | | | 256,000 | | | | 4,570 | | |
| Fuji Media Holdings, Inc. | | | 3,088 | | | | 4,682 | | |
| Fuyo General Lease Co., Ltd. | | | 130,200 | | | | 4,476 | | |
| Jaccs Co., Ltd. | | | 1,455,000 | | | | 4,348 | | |
| Japan Securities Finance Co., Ltd. | | | 709,592 | | | | 3,208 | | |
| K's Holdings Corp. | | | 185,900 | | | | 7,366 | | |
| Maeda Corp. | | | 219,000 | | | | 802 | | |
| Miraial Co., Ltd. | | | 165,300 | | | | 2,208 | | |
| Mitsui Mining & Smelting Co., Ltd. | | | 889,000 | | | | 2,298 | | |
| Mitsui OSK Lines Ltd. | | | 671,000 | | | | 2,598 | | |
| Ohara, Inc. | | | 322,600 | | | | 3,328 | | |
| Sawada Holdings Co., Ltd. (a) | | | 424,100 | | | | 3,774 | | |
| Sumitomo Mitsui Trust Holdings, Inc. | | | 1,285,000 | | | | 3,773 | | |
| THK Co., Ltd. | | | 115,400 | | | | 2,274 | | |
| TOC Co., Ltd. | | | 911,500 | | | | 4,145 | | |
| Toei Animation Co., Ltd. | | | 207,800 | | | | 4,698 | | |
| Tokyo Tomin Bank Ltd. (The) | | | 583,881 | | | | 7,108 | | |
| Toyota Industries Corp. | | | 130,100 | | | | 3,541 | | |
| Tsutsumi Jewelry Co., Ltd. | | | 124,400 | | | | 2,942 | | |
| TV Asahi Corp. | | | 2,574 | | | | 4,244 | | |
| Yachiyo Bank Ltd. (The) | | | 256,100 | | | | 6,082 | | |
| Yamaha Motor Co., Ltd. | | | 362,300 | | | | 4,585 | | |
| | | | 97,299 | | |
| Netherlands (1.7%) | |
| Nutreco N.V. | | | 78,711 | | | | 5,179 | | |
| New Zealand (0.8%) | |
| Fisher & Paykel Healthcare Corp., Ltd. | | | 1,244,700 | | | | 2,441 | | |
| Norway (3.6%) | |
| Pronova BioPharma A/S (a) | | | 1,276,722 | | | | 1,673 | | |
| Schibsted ASA | | | 30,488 | | | | 759 | | |
| Storebrand ASA | | | 924,791 | | | | 4,809 | | |
| TGS Nopec Geophysical Co. ASA | | | 156,887 | | | | 3,476 | | |
| | | | 10,717 | | |
| Spain (1.9%) | |
| Antena 3 de Television SA | | | 364,751 | | | | 2,195 | | |
| Grifols SA (a) | | | 132,678 | | | | 2,232 | | |
The accompanying notes are an integral part of the financial statements.
82
2011 Annual Report
December 31, 2011
Portfolio of Investments (cont'd)
International Small Cap Portfolio
| | | Shares | | Value
(000) | |
| Spain (cont'd) | |
| Grifols SA, Class B (a) | | | 13,121 | | | $ | 143 | | |
| Miquel y Costas & Miquel SA | | | 43,696 | | | | 1,046 | | |
| | | | 5,616 | | |
| Sweden (1.2%) | |
| Clas Ohlson AB, Class B | | | 159,545 | | | | 1,866 | | |
| Trelleborg AB, Class B | | | 189,435 | | | | 1,645 | | |
| | | | 3,511 | | |
| Switzerland (4.0%) | |
| Bucher Industries AG (Registered) | | | 22,732 | | | | 3,974 | | |
| Kuoni Reisen Holding AG (Registered) (a) | | | 18,844 | | | | 4,514 | | |
| Rieter Holding AG (Registered) (a) | | | 22,414 | | | | 3,367 | | |
| | | | 11,855 | | |
| Thailand (2.0%) | |
| Miclyn Express Offshore Ltd. | | | 2,942,411 | | | | 5,959 | | |
| United Kingdom (15.0%) | |
| Aegis Group PLC | | | 675,588 | | | | 1,515 | | |
| Bodycote PLC | | | 717,276 | | | | 2,927 | | |
| Britvic PLC | | | 1,008,099 | | | | 5,036 | | |
| Bunzl PLC | | | 247,012 | | | | 3,391 | | |
| Chemring Group PLC | | | 384,108 | | | | 2,385 | | |
| Cookson Group PLC | | | 532,638 | | | | 4,210 | | |
| CVS Group PLC | | | 1,021,311 | | | | 1,634 | | |
| Dairy Crest Group PLC | | | 414,890 | | | | 2,165 | | |
| Hammerson PLC REIT | | | 251,597 | | | | 1,407 | | |
| Hiscox Ltd. | | | 276,392 | | | | 1,603 | | |
| Invensys PLC | | | 869,097 | | | | 2,848 | | |
| Keller Group PLC | | | 280,471 | | | | 1,161 | | |
| Premier Foods PLC (a) | | | 11,684,930 | | | | 1,054 | | |
| Premier Oil PLC (a) | | | 277,617 | | | | 1,565 | | |
| Rexam PLC | | | 451,862 | | | | 2,476 | | |
| SIG PLC | | | 2,338,415 | | | | 3,051 | | |
| Smurfit Kappa Group PLC (a) | | | 793,384 | | | | 4,798 | | |
| Wincanton PLC (a) | | | 1,221,861 | | | | 1,186 | | |
| | | | 44,412 | | |
| United States (0.9%) | |
| Informa PLC | | | 484,767 | | | | 2,720 | | |
| Total Common Stocks (Cost $359,137) | | | 289,635 | | |
| Short-Term Investment (3.1%) | |
| Investment Company (3.1%) | |
Morgan Stanley Institutional Liquidity
Funds — Money Market Portfolio —
Institutional Class (See Note G-2) (Cost $9,221) | | | 9,220,550 | | | | 9,221 | | |
| Total Investments (100.9%) (Cost $368,358) (c) | | | 298,856 | | |
| Liabilities in Excess of Other Assets (-0.9%) | | | (2,703 | ) | |
| Net Assets (100.0%) | | $ | 296,153 | | |
(a) Non-income producing security.
(b) Security trades on the Hong Kong exchange.
(c) Securities are available for collateral in connection with open foreign currency exchange contracts.
REIT Real Estate Investment Trust.
Foreign Currency Exchange Contracts Information:
The Portfolio had the following foreign currency exchange contracts open at period end:
| Counterparty | | Currency
to
Deliver
(000) | |
Value
(000) | |
Settlement
Date | | In
Exchange
For
(000) | |
Value
(000) | | Unrealized
Appreciation
(Depreciation)
(000) | |
| State Street Bank London | |
| | | JPY | 440,000 | | | $ | 5,716 | | | 1/4/12 | | USD | 5,685 | | | $ | 5,685 | | | $ | (31 | ) | |
| State Street Bank London | |
| | | JPY | 66,000 | | | | 858 | | | 2/3/12 | | USD | 851 | | | | 851 | | | | (7 | ) | |
| | | | | $ | 6,574 | | | | | | | | | | | $ | 6,536 | | | $ | (38 | ) | |
JPY — Japanese Yen
USD — United States Dollar
Fair Value Measurement Information:
The following is a summary of the inputs used to value the Portfolio's investments as of December 31, 2011. (See Note A-9 to the financial statements for further information regarding fair value measurement.)
| Investment Type | | Level 1
Unadjusted
quoted
prices
(000) | | Level 2
Other
significant
observable
inputs
(000) | | Level 3
Significant
unobservable
inputs
(000) | | Total
(000) | |
| Assets: | | | | | | | | | |
| Common Stocks | | | | | | | | | |
| Aerospace & Defense | | $ | 2,385 | | | $ | — | | | $ | — | | | $ | 2,385 | | |
| Air Freight & Logistics | | | 1,186 | | | | — | | | | — | | | | 1,186 | | |
| Auto Components | | | 7,864 | | | | — | | | | — | | | | 7,864 | | |
| Automobiles | | | 4,585 | | | | — | | | | — | | | | 4,585 | | |
| Beverages | | | 6,827 | | | | — | | | | — | | | | 6,827 | | |
| Biotechnology | | | 2,375 | | | | — | | | | — | | | | 2,375 | | |
| Capital Markets | | | 6,186 | | | | — | | | | — | | | | 6,186 | | |
| Chemicals | | | 3,328 | | | | — | | | | — | | | | 3,328 | | |
| Commercial Banks | | | 23,287 | | | | — | | | | — | | | | 23,287 | | |
Commercial Services &
Supplies | | | 2,277 | | | | — | | | | — | | | | 2,277 | | |
Construction &
Engineering | | | 4,642 | | | | — | | | | — | | | | 4,642 | | |
| Construction Materials | | | 1,220 | | | | — | | | | — | | | | 1,220 | | |
| Consumer Finance | | | 4,348 | | | | — | | | | — | | | | 4,348 | | |
| Containers & Packaging | | | 10,592 | | | | — | | | | — | | | | 10,592 | | |
Diversified Consumer
Services | | | 2,149 | | | | — | | | | — | | | | 2,149 | | |
Diversified Financial
Services | | | 7,684 | | | | — | | | | — | | | | 7,684 | | |
| Electrical Equipment | | | 3,221 | | | | — | | | | — | | | | 3,221 | | |
The accompanying notes are an integral part of the financial statements.
83
2011 Annual Report
December 31, 2011
Portfolio of Investments (cont'd)
International Small Cap Portfolio
Fair Value Measurement Information: (cont'd)
| Investment Type | | Level 1
Unadjusted
quoted
prices
(000) | | Level 2
Other
significant
observable
inputs
(000) | | Level 3
Significant
unobservable
inputs
(000) | | Total
(000) | |
| Common Stocks (cont'd) | | | | | | | | | |
Electronic Equipment,
Instruments &
Components | | $ | — | | | $ | 2,580 | | | $ | — | | | $ | 2,580 | | |
Energy Equipment &
Services | | | 9,435 | | | | — | | | | — | | | | 9,435 | | |
| Food Products | | | 13,538 | | | | — | | | | — | | | | 13,538 | | |
Health Care
Equipment &
Supplies | | | 5,980 | | | | — | | | | — | | | | 5,980 | | |
Health Care
Providers &
Services | | | 3,305 | | | | — | | | | — | | | | 3,305 | | |
Hotels, Restaurants &
Leisure | | | 4,514 | | | | — | | | | — | | | | 4,514 | | |
| Household Durables | | | 2,687 | | | | — | | | | — | | | | 2,687 | | |
Industrial
Conglomerates | | | 8,035 | | | | — | | | | — | | | | 8,035 | | |
Information Technology
Services | | | 1,312 | | | | — | | | | — | | | | 1,312 | | |
| Insurance | | | 12,547 | | | | — | | | | — | | | | 12,547 | | |
Life Sciences Tools &
Services | | | 5,884 | | | | — | | | | — | | | | 5,884 | | |
| Machinery | | | 33,171 | | | | — | | | | — | | | | 33,171 | | |
| Marine | | | 5,421 | | | | — | | | | — | | | | 5,421 | | |
| Media | | | 20,813 | | | | — | | | | — | | | | 20,813 | | |
| Metals & Mining | | | 4,789 | | | | — | | | | — | | | | 4,789 | | |
| Multiline Retail | | | 2,840 | | | | — | | | | — | | | | 2,840 | | |
Oil, Gas & Consumable
Fuels | | | 1,877 | | | | — | | | | — | | | | 1,877 | | |
Paper & Forest
Products | | | 1,796 | | | | — | | | | — | | | | 1,796 | | |
| Personal Products | | | 1,744 | | | | — | | | | — | | | | 1,744 | | |
| Pharmaceuticals | | | 5,204 | | | | — | | | | — | | | | 5,204 | | |
| Professional Services | | | 3,076 | | | | — | | | | — | | | | 3,076 | | |
Real Estate
Investment Trusts
(REITs) | | | 1,407 | | | | — | | | | — | | | | 1,407 | | |
Real Estate
Management &
Development | | | 12,564 | | | | — | | | | — | | | | 12,564 | | |
Semiconductors &
Semiconductor
Equipment | | | 7,061 | | | | — | | | | — | | | | 7,061 | | |
| Software | | | 3,440 | | | | — | | | | — | | | | 3,440 | | |
| Specialty Retail | | | 12,174 | | | | — | | | | — | | | | 12,174 | | |
Trading Companies &
Distributors | | | 8,285 | | | | — | | | | — | | | | 8,285 | | |
| Total Common Stocks | | | 287,055 | | | | 2,580 | | | | — | | | | 289,635 | | |
| Investment Type | | Level 1
Unadjusted
quoted
prices
(000) | | Level 2
Other
significant
observable
inputs
(000) | | Level 3
Significant
unobservable
inputs
(000) | | Total
(000) | |
Short-Term
Investment —
Investment
Company | | $ | 9,221 | | | $ | — | | | $ | — | | | $ | 9,221 | | |
| Total Assets | | | 296,276 | | | | 2,580 | | | | — | | | | 298,856 | | |
| Liabilities: | |
Foreign Currency
Exchange Contracts | | | — | | | | (38 | ) | | | — | | | | (38 | ) | |
| Total | | $ | 296,276 | | | $ | 2,542 | | | $ | — | | | $ | 298,818 | | |
Transfers between investment levels may occur as the markets fluctuate and/or the availability of data used in an investment's valuation changes. The Portfolio recognizes transfers between the levels as of the end of the period. As of December 31, 2011, a security with a total value of approximately $2,580,000 transferred from Level 1 to Level 2. This security was valued using other significant observable inputs at December 31, 2011 and was valued using an unadjusted quoted price at December 31, 2010.
Following is a reconciliation of investments in which significant unobservable inputs (Level 3) were used in determining fair value.
| | | Common
Stocks
(000) | |
| Beginning Balance | | $ | — | † | |
| Purchases | | | — | | |
| Sales | | | (12 | ) | |
| Amortization of discount | | | — | | |
| Transfers in | | | — | | |
| Transfers out | | | — | | |
| Change in unrealized appreciation (depreciation) | | | — | | |
| Realized gains (losses) | | | 12 | | |
| Ending Balance | | $ | — | | |
Net change in unrealized appreciation/depreciation
from investments still held as of December 31, 2011 | | $ | — | | |
† Includes one or more securities which are valued at zero.
The accompanying notes are an integral part of the financial statements.
84
2011 Annual Report
December 31, 2011
Investment Overview (unaudited)
Select Global Infrastructure Portfolio
The Select Global Infrastructure Portfolio (the "Portfolio") seeks to provide both capital appreciation and income by investing primarily in equity securities issued by companies located throughout the world that are engaged in the infrastructure business.
Performance
For the year ended December 31, 2011, the Portfolio had a total return based on net asset value and reinvestment of distributions per share of 15.95%, net of fees, for Class I shares. The Portfolio's Class I shares outperformed against its benchmark, the Dow Jones Brookfield Global Infrastructure IndexSM (the "Index"), which returned 13.75%, and outperformed the S&P Global BMI Index, which returned -7.72%.
Factors Affecting Performance
• Infrastructure shares appreciated 13.75% during the period, as measured by the Index. Among the major infrastructure sectors, the gas midstream, pipeline companies, and transmission and distribution sectors exhibited relative outperformance, while the toll road, European regulated utilities, and communications sectors underperformed the Index. Gas distribution utilities performed in line with the Index for the year. Among the smaller sectors, the water sector exhibited modest relative underperformance, and the ports and airport sectors exhibited meaningful relative underperformance.
• For full-year 2011, the Portfolio realized favorable performance from both bottom-up stock selection and top-down allocation, with bottom-up stock selection being the more significant driver of outperformance. From a bottom-up perspective, stock selection was particularly favorable in the toll roads, European regulated utilities and gas distribution utilities sectors, and indeed stock selection in all sectors was favorable or neutral aside from slight underperformance in the communications sector. From a top-down perspective, our positioning was favorable in all sectors except for underweights to the gas midstream and transmission and distribution sectors.
• Concerning the broader equity markets, 2011 was characterized by significant equity market (and credit market outside North America) volatility brought on by investor uncertainty over the health of credit/lending markets, national banking systems, and government fiscal balance sheets across the globe, and the potential for credit market and balance sheet weakness to put significant pressure on various national economies. While no region was spared entirely, the U.S. equity markets outperformed their regional counterparts, with meaningful declines in European and the Asia Pacific stock markets.
• Despite broader macroeconomic uncertainty, operating trends within infrastructure remained quite resilient in 2011 and were the primary cause for infrastructure stock outperformance relative to the broader global equity markets, as measured by the MSCI World Index. Favorable operating fundamentals spanned most infrastructure sectors in 2011 but were most readily apparent in the energy infrastructure category in North America, where the buildout of new long-haul pipelines for crude oil transportation and gathering and processing networks associated with natural gas and natural gas liquids (NGLs) continues to be robust. Backlog for projects associated with this area of infrastructure extends out for the next several years, and the medium- to longer-term attractiveness of this sector was underscored by a number of merger and acquisition (M&A) transactions that occurred within the sector in 2011. Another area of robust growth in 2011 was communications, where wireless phone providers struggled to keep up with the ever-increasing demand brought on by incremental smartphone usage. While this increased demand did not translate into stock outperformance for our wireless tower companies in the past year, this incremental demand has only reinforced what is already a multi-year backlog of equipment enhancements and new tower builds needed to meet wireless carrier needs. It is worth pointing out that despite significant share price underperformance in 2011 of companies in the ports and airport infrastructure sectors, operating trends even for these companies were favorable, with most companies reporting year over year volume growth and price/tariff increases.
Management Strategies
• We remain committed to our core investment philosophy as an infrastructure value investor. As value-oriented, bottom-up driven investors, our investment perspective is that over the medium and
85
2011 Annual Report
December 31, 2011
Investment Overview (unaudited) (cont'd)
Select Global Infrastructure Portfolio
long-term, the key factor in determining the performance of infrastructure securities will be underlying infrastructure asset values. Given the large and growing private infrastructure market, we believe that there are limits as to the level of premium or discount at which the public sector should trade relative to its underlying private infrastructure value. These limits can be viewed as the point at which the arbitrage opportunity between owning infrastructure in the private versus public markets becomes compelling. In aiming to achieve core infrastructure exposure in a cost effective manner, we invest in equity securities of publicly listed infrastructure companies we believe offer the best value relative to their underlying infrastructure value and Net Asset Value growth prospects. Our research currently leads us to an overweighting in the Portfolio (amongst the largest sectors) to a group of companies in the communications, gas distribution, toll roads, and pipeline companies sectors, and an underweighting to companies in the transmission and distribution, gas midstream, and European regulated utilities sectors.
• Looking toward 2012, we are most positive regarding our positions in Asia in the utility (particularly gas distribution) and toll road sectors, which we believe have the most favorable risk-return characteristics in our investment universe and possess a compelling combination of meaningful discounts to intrinsic value and strong growth outlooks. We believe operating results for companies in these two sectors should remain favorable despite the potential for a more moderate growth trajectory in China. We are also favorable on companies within the communications sector, which while trading at more modest discounts than our overweight positions in Asia, in our view, continue to possess very resilient secular fundamental trends and may produce sustainable cash flow growth that is not currently fully reflected in share prices. For energy infrastructure, while we believe fundamental trends will remain strong in the coming year, we are more cautious on valuations, in particular in the midstream sector, where we believe near-term valuation levels are stretched relative to historical levels. Due to these stretched near-term valuation levels and operating fundamentals that are more sensitive to volume and end-product pricing relative to the pipeline sector, our preference is to favor pipelines. For electricity transmission and distribution and gas distribution utilities in North America, we find current valuations less favorable, but acknowledge the appeal of these companies among certain investors looking for safety in an uncertain macroeconomic environment. Finally, we expect to remain selective in the European regulated utility sector due to ongoing regulatory risk, in particular for those utilities in continental Europe.
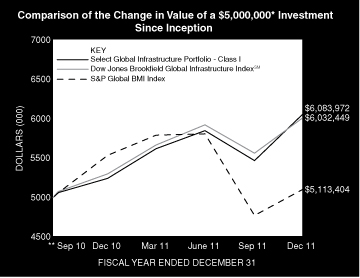
* Minimum Investment
** Commenced Operations on September 20, 2010.
In accordance with SEC regulations, Portfolio's performance shown assumes that all recurring fees (including management fees) were deducted and all dividends and distributions were reinvested. The performance of Class P, Class H, and Class L shares will vary from the Class I shares based upon it will be negatively impacted by additional fees assessed to these classes.
Performance Compared to the Dow Jones Brookfield Global Infrastructure IndexSM(1) and the S&P Global BMI Index(2)
| | | Period Ended December 31, 2011 | |
| | | Total Returns(3) | |
| | | | | Average Annual | |
| | | One
Year | | Five
Years | | Ten
Years | | Since
Inception(5) | |
Portfolio — Class I Shares
w/o sales charges(4) | | | 15.95 | % | | | — | | | | — | | | | 16.57 | % | |
Dow Jones Brookfield Global
Infrastructure IndexSM | | | 13.75 | | | | — | | | | — | | | | 15.80 | | |
| S&P Global BMI Index | | | –7.72 | | | | — | | | | — | | | | 1.77 | | |
86
2011 Annual Report
December 31, 2011
Investment Overview (unaudited) (cont'd)
Select Global Infrastructure Portfolio
| | | Period Ended December 31, 2011 | |
| | | Total Returns(3) | |
| | | | | Average Annual | |
| | | One
Year | | Five
Years | | Ten
Years | | Since
Inception(5) | |
Portfolio — Class H Shares
w/o sales charges(4) | | | 15.67 | % | | | — | | | | — | | | | 16.29 | % | |
Portfolio — Class H Shares
with maximum 4.75%
sales charges(4) | | | 10.17 | | | | — | | | | — | | | | 11.94 | | |
Dow Jones Brookfield Global
Infrastructure IndexSM | | | 13.75 | | | | — | | | | — | | | | 15.80 | | |
| S&P Global BMI Index | | | –7.72 | | | | — | | | | — | | | | 1.77 | | |
Portfolio — Class L Shares
w/o sales charges(4) | | | 15.12 | | | | — | | | | — | | | | 15.73 | | |
Dow Jones Brookfield Global
Infrastructure IndexSM | | | 13.75 | | | | — | | | | — | | | | 15.80 | | |
| S&P Global BMI Index | | | –7.72 | | | | — | | | | — | | | | 1.77 | | |
Portfolio — Class P Shares
w/o sales charges(4) | | | 15.67 | | | | — | | | | — | | | | 16.29 | | |
Dow Jones Brookfield
Global Infrastructure IndexSM | | | 13.75 | | | | — | | | | — | | | | 15.80 | | |
| S&P Global BMI Index | | | –7.72 | | | | — | | | | — | | | | 1.77 | | |
Performance data quoted represents past performance, which is no guarantee of future results, and current performance may be lower or higher than the figures shown. Performance assumes that all dividends and distributions, if any, were reinvested. For the most recent month-end performance figures, please visit www.morganstanley.com/im. Investment return and principal value will fluctuate so that Portfolio shares, when redeemed, may be worth more or less than their original cost. Total returns do not reflect the deduction of taxes that a shareholder would pay on Portfolio distributions or the redemption of Portfolio shares. Performance of share classes will vary due to difference in sales charges and expenses.
(1) The Dow Jones Brookfield Global Infrastructure IndexSM is a float-adjusted market capitalization weighted index that measures the stock performance of companies that exhibit strong infrastructure characteristics. The Index intends to measure all sectors of the infrastructure market. The Index is unmanaged and its returns do not include any sales charges or fees. Such costs would lower performance. It is not possible to invest directly in an index.
(2) The Standard & Poor's Global BMI Index (S&P Global BMI Index) is a broad market index designed to capture exposure to equities in all countries in the world that meet minimum size and liquidity requirements. As of the date of this Report, there are approximately 11,000 index members representing 26 developed and 20 emerging market countries. The Index is unmanaged and its returns do not include any sales charges or fees. Such costs would lower performance. It is not possible to invest directly in an index.
(3) Total returns for the Portfolio reflect fees waived and expenses reimbursed, if applicable, by the Adviser. Without such waivers and reimbursements, total returns would have been lower. The fee waivers and/or expense reimbursements will continue for one year or until such time as the Fund's Board of Directors acts to discontinue all or a portion of such waivers and/or expense reimbursements when it deems that such action is appropriate.
(4) Commenced operations on September 20, 2010.
(5) For comparative purposes, average annual since inception returns listed for the Indexes refer to the inception date or initial offering of the respective share class of the Portfolio, not the inception of the Index.
Portfolio Composition
| Classification | | Percentage of
Total Investments | |
| Oil & Gas Storage & Transportation | | | 49.0 | % | |
| Transmission & Distribution | | | 16.1 | | |
| Communications | | | 14.7 | | |
| Other* | | | 13.6 | | |
| Toll Roads | | | 6.6 | | |
| Total Investments | | | 100.0 | % | |
* Industries representing less than 5% of total investments.
87
2011 Annual Report
December 31, 2011
Portfolio of Investments
Select Global Infrastructure Portfolio
| | | Shares | | Value
(000) | |
| Common Stocks (96.6%) | |
| Australia (4.6%) | |
| APA Group (Stapled Securities) (a)(b) | | | 17,400 | | | $ | 80 | | |
Australian Infrastructure Fund
(Stapled Securities) (a)(b) | | | 6,500 | | | | 13 | | |
| DUET Group (Stapled Securities) (a)(b) | | | 38,860 | | | | 70 | | |
Macquarie Atlas Roads Group
(Stapled Securities) (a)(c) | | | 13,400 | | | | 18 | | |
| Spark Infrastructure Group | | | 44,914 | | | | 63 | | |
| Sydney Airport (Stapled Securities) (a) | | | 50,700 | | | | 138 | | |
| Transurban Group (Stapled Securities) (a) | | | 37,200 | | | | 214 | | |
| | | | 596 | | |
| Brazil (0.7%) | |
Cia de Saneamento Basico do
Estado de Sao Paulo ADR (c) | | | 1,600 | | | | 89 | | |
| Canada (13.5%) | |
| Enbridge, Inc. | | | 19,569 | | | | 731 | | |
| TransCanada Corp. | | | 23,100 | | | | 1,010 | | |
| | | | 1,741 | | |
| China (13.5%) | |
| Beijing Enterprises Holdings Ltd. (d) | | | 126,000 | | | | 756 | | |
| China Gas Holdings Ltd. (d) | | | 1,030,000 | | | | 474 | | |
| China Merchants Holdings International Co., Ltd. (d) | | | 28,601 | | | | 83 | | |
| ENN Energy Holdings Ltd. (d) | | | 44,000 | | | | 141 | | |
| Jiangsu Expressway Co., Ltd. H Shares (d) | | | 188,000 | | | | 173 | | |
| Sichuan Expressway Co. Ltd. H Shares (d) | | | 281,000 | | | | 113 | | |
| | | | 1,740 | | |
| France (3.5%) | |
| Eutelsat Communications SA | | | 735 | | | | 29 | | |
| SES SA | | | 17,815 | | | | 427 | | |
| | | | 456 | | |
| Hong Kong (2.4%) | |
| Hong Kong & China Gas Co., Ltd. | | | 133,100 | | | | 309 | | |
| Italy (3.8%) | |
| Atlantia SpA | | | 4,888 | | | | 78 | | |
| Snam Rete Gas SpA | | | 50,099 | | | | 221 | | |
| Societa Iniziative Autostradali e Servizi SpA | | | 25,890 | | | | 195 | | |
| | | | 494 | | |
| Japan (0.4%) | |
| Tokyo Gas Co., Ltd. | | | 12,000 | | | | 55 | | |
| Netherlands (1.1%) | |
| Koninklijke Vopak N.V. | | | 2,595 | | | | 137 | | |
| Spain (3.5%) | |
| Abertis Infraestructuras SA | | | 11,022 | | | | 176 | | |
| Enagas SA | | | 4,647 | | | | 86 | | |
| Ferrovial SA | | | 9,160 | | | | 111 | | |
| Red Electrica Corp. SA | | | 1,726 | | | | 74 | | |
| | | | 447 | | |
| Switzerland (0.4%) | |
| Flughafen Zuerich AG (Registered) | | | 168 | | | | 58 | | |
| | | Shares | | Value
(000) | |
| United Kingdom (11.5%) | |
| National Grid PLC | | | 121,294 | | | $ | 1,177 | | |
| Pennon Group PLC | | | 5,300 | | | | 59 | | |
| Severn Trent PLC | | | 5,900 | | | | 137 | | |
| United Utilities Group PLC | | | 12,700 | | | | 120 | | |
| | | | 1,493 | | |
| United States (37.7%) | |
| AGL Resources, Inc. | | | 1,680 | | | | 71 | | |
| American Tower Corp., Class A | | | 12,640 | | | | 758 | | |
| American Water Works Co., Inc. | | | 6,300 | | | | 201 | | |
| CenterPoint Energy, Inc. | | | 15,620 | | | | 314 | | |
| Crown Castle International Corp. (c) | | | 9,690 | | | | 434 | | |
| Enbridge Energy Management LLC (c) | | | 7,155 | | | | 249 | | |
| ITC Holdings Corp. | | | 4,280 | | | | 325 | | |
| Kinder Morgan Management LLC (c) | | | 2,608 | | | | 205 | | |
| NiSource, Inc. | | | 8,680 | | | | 207 | | |
| Northeast Utilities | | | 7,600 | | | | 274 | | |
| Northwest Natural Gas Co. | | | 570 | | | | 27 | | |
| NSTAR | | | 1,780 | | | | 84 | | |
| Oneok, Inc. | | | 2,330 | | | | 202 | | |
| Pepco Holdings, Inc. | | | 3,280 | | | | 67 | | |
| PG&E Corp. | | | 3,310 | | | | 136 | | |
| SBA Communications Corp., Class A (c) | | | 5,540 | | | | 238 | | |
| Sempra Energy | | | 8,180 | | | | 450 | | |
| Southwest Gas Corp. | | | 1,660 | | | | 70 | | |
| Spectra Energy Corp. | | | 18,390 | | | | 565 | | |
| | | | 4,877 | | |
| Total Common Stocks (Cost $11,025) | | | 12,492 | | |
| Short-Term Investment (2.8%) | |
| Investment Company (2.8%) | |
Morgan Stanley Institutional Liquidity
Funds — Money Market Portfolio —
Institutional Class (See Note G-2) (Cost $361) | | | 361,322 | | | | 361 | | |
| Total Investments (99.4%) (Cost $11,386) | | | 12,853 | | |
| Other Assets in Excess of Liabilities (0.6%) | | | 81 | | |
| Net Assets (100.0%) | | $ | 12,934 | | |
(a) Comprised of securities in separate entities that are traded as a single stapled security.
(b) Consists of one or more classes of securities traded together as a unit; stocks with attached warrants.
(c) Non-income producing security.
(d) Security trades on the Hong Kong exchange.
ADR American Depositary Receipt.
The accompanying notes are an integral part of the financial statements.
88
2011 Annual Report
December 31, 2011
Portfolio of Investments (cont'd)
Select Global Infrastructure Portfolio
Fair Value Measurement Information:
The following is a summary of the inputs used to value the Portfolio's investments as of December 31, 2011. (See Note A-9 to the financial statements for further information regarding fair value measurement.)
| Investment Type | | Level 1
Unadjusted
quoted
prices
(000) | | Level 2
Other
significant
observable
inputs
(000) | | Level 3
Significant
unobservable
inputs
(000) | | Total
(000) | |
| Assets: | | | | | | | | | |
| Common Stocks | | | | | | | | | |
| Airports | | $ | 209 | | | $ | — | | | $ | — | | | $ | 209 | | |
| Communications | | | 1,886 | | | | — | | | | — | | | | 1,886 | | |
| Diversified | | | 495 | | | | — | | | | — | | | | 495 | | |
Oil & Gas Storage &
Transportation | | | 6,295 | | | | — | | | | — | | | | 6,295 | | |
| Ports | | | 83 | | | | — | | | | — | | | | 83 | | |
| Toll Roads | | | 854 | | | | — | | | | — | | | | 854 | | |
Transmission &
Distribution | | | 2,064 | | | | — | | | | — | | | | 2,064 | | |
| Water | | | 606 | | | | — | | | | — | | | | 606 | | |
| Total Common Stocks | | | 12,492 | | | | — | | | | — | | | | 12,492 | | |
Short-Term
Investment —
Investment Company | | | 361 | | | | — | | | | — | | | | 361 | | |
| Total Assets | | $ | 12,853 | | | $ | — | | | $ | — | | | $ | 12,853 | | |
Transfers between investment levels may occur as the markets fluctuate and/or the availability of data used in an investment's valuation changes. The Portfolio recognizes transfers between the levels as of the end of the period. As of December 31, 2011, the Portfolio did not have any significant investments transfer between investment levels.
The accompanying notes are an integral part of the financial statements.
89
2011 Annual Report
December 31, 2011
Investment Overview (unaudited)
Advantage Portfolio
The Advantage Portfolio (the "Portfolio") seeks long-term capital appreciation by investing primarily in established companies with capitalizations within the range of companies included in the Russell 1000® Growth Index.
Performance
For the year ended December 31, 2011, the Portfolio had a total return based on net asset value and reinvestment of distributions per share of 5.33%, net of fees, for Class I shares. The Portfolio's Class I shares outperformed against its benchmark, the Russell 1000® Growth Index (the "Index"), which returned 2.64%.
Factors Affecting Performance
• Equity markets began 2011 on a relatively optimistic note but suffered a stream of disappointments as the year progressed. The broad market's relatively flat return (as measured by the S&P 500® Index) for the year overall masked its more significant gyrations, as investors reacted to the worsening debt crisis in Europe, political strife in the Middle East, the natural disasters and nuclear crisis in Japan, political infighting in the U.S. and the downgrade of the U.S.'s credit rating by Standard & Poor's. Developed world economies also looked weaker than expected — the U.S. economy was nearing its stall speed in the first half of 2011, while European economies were expected to fall into recession in 2012. Despite the barrage of negative news, the strength of U.S. corporate earnings remained a bright spot for investors during the year.
• Against this backdrop, investors' appetite for risk was diminished. This helped large-cap stocks outperform mid- and small-cap stocks (as measured by their respective Russell indexes) for the year ended December 31, 2011.
• Stock selection and an overweight in the consumer discretionary sector were the most additive to relative returns. Leading contributors in the sector were a coffee retailer, a cosmetics company, and a restaurant company that owns several global fast food brands.
• Stock selection and an underweight technology were beneficial to performance. Holdings in a personal computer, mobile communications, and media devices manufacturer, a communications equipment maker, and an Internet search and online services provider bolstered relative performance.
• An overweight in the consumer staples sector also aided relative performance, although stock selection in the sector slightly detracted.
• Stock selection in the financial services sector diminished relative gains. Holdings in a global property, power, and infrastructure asset management company based in Canada (not represented in the Index) and a holding company with subsidiaries in a variety of industries including financial services were among the largest detractors in the sector.
• Stock selection in the producer durables sector was also unfavorable, due to lagging returns from a Hong Kong-based global consumer goods exporter and an energy and waste services company.
• Additionally, stock selection in the health care sector detracted from relative performance. The Portfolio held only two stocks in the sector and both declined during the period.
Management Strategies
• We look for high-quality growth companies that have these attributes: sustainable competitive advantages, business visibility, rising return on invested capital, free cash flow and a favorable risk/reward profile. In seeking these companies, we use intense fundamental research. Our emphasis is on secular growth, and as a result, short-term market events are not as meaningful in the stock selection process.
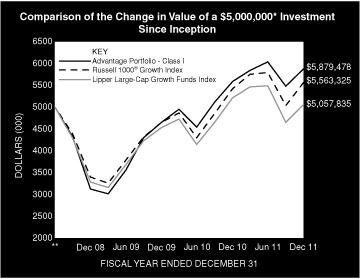
* Minimum Investment
** Commenced Operations on June 30, 2008.
In accordance with SEC regulations, Portfolio's performance shown assumes that all recurring fees (including management fees) were deducted and all dividends and distributions were reinvested. The performance of Class P, Class H, and Class L shares will vary from the Class I shares based upon different inception dates and will be negatively impacted by additional fees assessed to these classes.
90
2011 Annual Report
December 31, 2011
Investment Overview (unaudited) (cont'd)
Advantage Portfolio
Performance Compared to the Russell 1000® Growth Index(1) and the Lipper Large-Cap Growth Funds Index(2)
| | | Period Ended December 31, 2011 | |
| | | Total Returns(3) | |
| | | | | Average Annual | |
| | | One
Year | | Five
Years | | Ten
Years | | Since
Inception(5) | |
Portfolio — Class I Shares
w/o sales charges(4) | | | 5.33 | % | | | — | | | | — | | | | 4.73 | % | |
| Russell 1000® Growth Index | | | 2.64 | | | | — | | | | — | | | | 3.09 | | |
Lipper Large-Cap Growth
Funds Index | | | –2.90 | | | | — | | | | — | | | | 0.33 | | |
Portfolio — Class H Shares
w/o sales charges(4) | | | 5.06 | | | | — | | | | — | | | | 4.49 | | |
Portfolio — Class H Shares
with maximum 4.75%
sales charges(4) | | | 0.08 | | | | — | | | | — | | | | 3.04 | | |
| Russell 1000® Growth Index | | | 2.64 | | | | — | | | | — | | | | 3.09 | | |
Lipper Large-Cap Growth
Funds Index | | | –2.90 | | | | — | | | | — | | | | 0.33 | | |
Portfolio — Class L Shares
w/o sales charges(4) | | | 5.19 | | | | — | | | | — | | | | 4.53 | | |
| Russell 1000® Growth Index | | | 2.64 | | | | — | | | | — | | | | 3.09 | | |
Lipper Large-Cap Growth
Funds Index | | | –2.90 | | | | — | | | | — | | | | 0.33 | | |
Portfolio — Class P Shares
w/o sales charges(4) | | | 5.07 | | | | — | | | | — | | | | 16.05 | | |
| Russell 1000® Growth Index | | | 2.64 | | | | — | | | | — | | | | 13.66 | | |
Lipper Large-Cap Growth
Funds Index | | | –2.90 | | | | — | | | | — | | | | 9.90 | | |
Performance data quoted represents past performance, which is no guarantee of future results, and current performance may be lower or higher than the figures shown. Performance assumes that all dividends and distributions, if any, were reinvested. For the most recent month-end performance figures, please visit www.morganstanley.com/im. Investment return and principal value will fluctuate so that Portfolio shares, when redeemed, may be worth more or less than their original cost. Total returns do not reflect the deduction of taxes that a shareholder would pay on Portfolio distributions or the redemption of Portfolio shares. Performance of share classes will vary due to difference in sales charges and expenses.
(1) The Russell 1000® Growth Index measures the performance of the large-cap growth segment of the U.S. equity universe. It includes those Russell 1000® Index companies with higher price-to-book ratios and higher forecasted growth values. The Russell 1000® Index is an index of approximately 1,000 of the largest U.S. companies based on a combination of market capitalization and current index membership. The Index is unmanaged and its returns do not include any sales charges or fees. Such costs would lower performance. It is not possible to invest directly in an index.
(2) The Lipper Large-Cap Growth Funds Index is an equally weighted performance index of the largest qualifying funds (based on net assets) in the Lipper Large-Cap Growth Funds Funds classification. The Index, which is adjusted for capital gains distributions and income dividends, is unmanaged and should not be considered an investment. There are currently 30 funds represented in this Index. As of the date of this report, the Portfolio was in the Lipper Large-Cap Growth Funds classification.
(3) Total returns for the Portfolio reflect fees waived and expenses reimbursed, if applicable, by the Adviser. Without such waivers and reimbursements, total returns would have been lower. The fee waivers and/or expense reimbursements will continue for one year or until such time as the Fund's Board of Directors acts to discontinue all or a portion of such waivers and/or expense reimbursements when it deems that such action is appropriate. The Distributor has agreed to waive for at least one year the 12b-1 fee on Class L shares of the Portfolio to the extent it exceeds 0.04% of the average daily net assets of such shares on an annualized basis.
(4) On May 21, 2010 Class A, Class B, Class C, and Class I shares of Van Kampen Core Growth Fund ("the Predecessor Fund") were reorganized into Class H, Class H, Class L, and Class I shares of Morgan Stanley Advantage Portfolio ("the Portfolio"), respectively. Class H, Class L, and Class I shares' returns of the Portfolio will differ from the Predecessor Fund as they have different expenses. Performance shown for the Portfolio's Class I, Class H, and Class L shares reflects the performance of the shares of the Predecessor Fund for periods prior to May 21, 2010. The Class A, C, and I shares of the Predecessor Fund commenced operations on June 30, 2008. Class P shares commenced offering on May 21, 2010. Performance for Class H shares has been restated to reflect the Portfolio's applicable sales charge.
(5) For comparative purposes, average annual since inception returns listed for the Indexes refer to the inception date or initial offering of the respective share class of the Portfolio, not the inception of the Index.
Portfolio Composition
| Classification | | Percentage of
Total Investments | |
| Other* | | | 53.1 | % | |
| Commercial Services | | | 11.2 | | |
| Diversified Retail | | | 9.5 | | |
| Restaurants | | | 8.8 | | |
| Computer Technology | | | 6.2 | | |
| Beverage: Soft Drinks | | | 6.0 | | |
| Foods | | | 5.2 | | |
| Total Investments | | | 100.0 | % | |
* Industries representing less than 5% of total investments.
91
2011 Annual Report
December 31, 2011
Portfolio of Investments
Advantage Portfolio
| | | Shares | | Value
(000) | |
| Common Stocks (94.4%) | |
| Alternative Energy (1.6%) | |
| OGX Petroleo e Gas Participacoes SA (Brazil) (a) | | | 18,506 | | | $ | 135 | | |
| Beverage: Brewers & Distillers (2.5%) | |
| Anheuser-Busch InBev N.V. ADR | | | 3,539 | | | | 216 | | |
| Beverage: Soft Drinks (5.9%) | |
| Coca-Cola Co. (The) | | | 1,776 | | | | 124 | | |
| Dr. Pepper Snapple Group, Inc. | | | 4,759 | | | | 188 | | |
| PepsiCo, Inc. | | | 2,863 | | | | 190 | | |
| | | | 502 | | |
| Commercial Services (11.2%) | |
| eBay, Inc. (a) | | | 10,873 | | | | 330 | | |
| Intertek Group PLC (United Kingdom) | | | 7,283 | | | | 230 | | |
| Leucadia National Corp. | | | 4,761 | | | | 108 | | |
| Weight Watchers International, Inc. | | | 5,044 | | | | 278 | | |
| | | | 946 | | |
| Communications Technology (4.6%) | |
| Motorola Solutions, Inc. | | | 8,335 | | | | 386 | | |
| Computer Services, Software & Systems (4.9%) | |
| Google, Inc., Class A (a) | | | 644 | | | | 416 | | |
| Computer Technology (6.2%) | |
| Apple, Inc. (a) | | | 1,291 | | | | 523 | | |
| Consumer Lending (3.8%) | |
| Berkshire Hathaway, Inc., Class B (a) | | | 2,720 | | | | 207 | | |
| CME Group, Inc. | | | 484 | | | | 118 | | |
| | | | 325 | | |
| Cosmetics (1.8%) | |
| Natura Cosmeticos SA (Brazil) | | | 8,022 | | | | 156 | | |
| Diversified Manufacturing Operations (1.4%) | |
| Danaher Corp. | | | 2,547 | | | | 120 | | |
| Diversified Materials & Processing (2.7%) | |
| Schindler Holding AG (Switzerland) | | | 1,969 | | | | 229 | | |
| Diversified Media (1.5%) | |
| McGraw-Hill Cos., Inc. (The) | | | 2,750 | | | | 124 | | |
| Diversified Retail (9.5%) | |
| Amazon.com, Inc. (a) | | | 1,870 | | | | 324 | | |
| Costco Wholesale Corp. | | | 2,443 | | | | 203 | | |
| Fastenal Co. | | | 3,247 | | | | 142 | | |
| McDonald's Corp. | | | 1,307 | | | | 131 | | |
| | | | 800 | | |
| Financial Data & Systems (1.4%) | |
| MSCI, Inc., Class A (a) | | | 3,595 | | | | 118 | | |
| Foods (5.2%) | |
| Nestle SA ADR (Switzerland) | | | 3,924 | | | | 226 | | |
| Sara Lee Corp. | | | 11,262 | | | | 213 | | |
| | | | 439 | | |
| Pharmaceuticals (4.4%) | |
| Mead Johnson Nutrition Co. | | | 5,356 | | | | 368 | | |
| Real Estate Investment Trusts (REIT) (3.5%) | |
| Brookfield Asset Management, Inc., Class A (Canada) | | | 10,668 | | | | 293 | | |
| | | Shares | | Value
(000) | |
| Recreational Vehicles & Boats (3.0%) | |
| Edenred (France) | | | 10,448 | | | $ | 257 | | |
| Restaurants (8.8%) | |
| Dunkin' Brands Group, Inc. (a) | | | 4,683 | | | | 117 | | |
| Starbucks Corp. | | | 7,043 | | | | 324 | | |
| Yum! Brands, Inc. | | | 5,097 | | | | 301 | | |
| | | | 742 | | |
| Scientific Instruments: Gauges & Meters (1.2%) | |
| Thermo Fisher Scientific, Inc. (a) | | | 2,258 | | | | 102 | | |
| Scientific Instruments: Pollution Control (1.3%) | |
| Covanta Holding Corp. | | | 7,794 | | | | 107 | | |
| Textiles Apparel & Shoes (3.0%) | |
| Coach, Inc. | | | 2,252 | | | | 138 | | |
| NIKE, Inc., Class B | | | 1,236 | | | | 119 | | |
| | | | 257 | | |
| Tobacco (3.2%) | |
| Philip Morris International, Inc. | | | 3,402 | | | | 267 | | |
| Wholesale & International Trade (1.8%) | |
| Li & Fung Ltd. (b) | | | 84,000 | | | | 155 | | |
| Total Common Stocks (Cost $6,856) | | | 7,983 | | |
| Convertible Preferred Stocks (0.7%) | |
| Alternative Energy (0.7%) | |
| Better Place, Inc. (a)(c)(d) (Cost $32) | | | 12,982 | | | | 59 | | |
| Short-Term Investment (4.6%) | |
| Investment Company (4.6%) | |
Morgan Stanley Institutional Liquidity
Funds — Money Market Portfolio —
Institutional Class (See Note G-2) (Cost $386) | | | 386,241 | | | | 386 | | |
| Total Investments (99.7%) (Cost $7,274) | | | 8,428 | | |
| Other Assets in Excess of Liabilities (0.3%) | | | 26 | | |
| Net Assets (100.0%) | | $ | 8,454 | | |
(a) Non-income producing security.
(b) Security trades on the Hong Kong exchange.
(c) Security has been deemed illiquid at December 31, 2011.
(d) At December 31, 2011, the Portfolio held a fair valued security valued at approximately $59,000, representing 0.7% of net assets. This security has been fair valued as determined in good faith under procedures established by and under the general supervision of the Fund's Directors.
ADR American Depositary Receipt.
The accompanying notes are an integral part of the financial statements.
92
2011 Annual Report
December 31, 2011
Portfolio of Investments (cont'd)
Advantage Portfolio
Fair Value Measurement Information:
The following is a summary of the inputs used to value the Portfolio's investments as of December 31, 2011. (See Note A-9 to the financial statements for further information regarding fair value measurement.)
| Investment Type | | Level 1
Unadjusted
quoted
prices
(000) | | Level 2
Other
significant
observable
inputs
(000) | | Level 3
Significant
unobservable
inputs
(000) | | Total
(000) | |
| Assets: | | | | | | | | | |
| Common Stocks | | | | | | | | | |
| Alternative Energy | | $ | 135 | | | $ | — | | | $ | — | | | $ | 135 | | |
Beverage: Brewers &
Distillers | | | 216 | | | | — | | | | — | | | | 216 | | |
| Beverage: Soft Drinks | | | 502 | | | | — | | | | — | | | | 502 | | |
| Commercial Services | | | 946 | | | | — | | | | — | | | | 946 | | |
Communications
Technology | | | 386 | | | | — | | | | — | | | | 386 | | |
Computer Services,
Software & Systems | | | 416 | | | | — | | | | — | | | | 416 | | |
| Computer Technology | | | 523 | | | | — | | | | — | | | | 523 | | |
| Consumer Lending | | | 325 | | | | — | | | | — | | | | 325 | | |
| Cosmetics | | | 156 | | | | — | | | | — | | | | 156 | | |
Diversified Manufacturing
Operations | | | 120 | | | | — | | | | — | | | | 120 | | |
Diversified Materials &
Processing | | | 229 | | | | — | | | | — | | | | 229 | | |
| Diversified Media | | | 124 | | | | — | | | | — | | | | 124 | | |
| Diversified Retail | | | 800 | | | | — | | | | — | | | | 800 | | |
| Financial Data & Systems | | | 118 | | | | — | | | | — | | | | 118 | | |
| Foods | | | 439 | | | | — | | | | — | | | | 439 | | |
| Pharmaceuticals | | | 368 | | | | — | | | | — | | | | 368 | | |
Real Estate Investment
Trusts (REIT) | | | 293 | | | | — | | | | — | | | | 293 | | |
Recreational Vehicles &
Boats | | | 257 | | | | — | | | | — | | | | 257 | | |
| Restaurants | | | 742 | | | | — | | | | — | | | | 742 | | |
Scientific Instruments:
Gauges & Meters | | | 102 | | | | — | | | | — | | | | 102 | | |
Scientific Instruments:
Pollution Control | | | 107 | | | | — | | | | — | | | | 107 | | |
| Textiles Apparel & Shoes | | | 257 | | | | — | | | | — | | | | 257 | | |
| Tobacco | | | 267 | | | | — | | | | — | | | | 267 | | |
Wholesale & International
Trade | | | 155 | | | | — | | | | — | | | | 155 | | |
| Total Common Stocks | | | 7,983 | | | | — | | | | — | | | | 7,983 | | |
Convertible Preferred
Stocks | | | — | | | | — | | | | 59 | | | | 59 | | |
Short-Term Investment —
Investment Company | | | 386 | | | | — | | | | — | | | | 386 | | |
| Total Assets | | $ | 8,369 | | | $ | — | | | $ | 59 | | | $ | 8,428 | | |
Transfers between investment levels may occur as the markets fluctuate and/or the availability of data used in an investment's valuation changes. The Portfolio recognizes transfers between the levels as of the end of the period. As of December 31, 2011, the Portfolio did not have any significant investments transfer between investment levels.
Following is a reconciliation of investments in which significant unobservable inputs (Level 3) were used in determining fair value.
| | | Convertible
Preferred
Stocks
(000) | |
| Beginning Balance | | $ | 32 | | |
| Purchases | | | — | | |
| Sales | | | — | | |
| Amortization of discount | | | — | | |
| Transfers in | | | — | | |
| Transfers out | | | — | | |
| Change in unrealized appreciation (depreciation) | | | 27 | | |
| Realized gains (losses) | | | — | | |
| Ending Balance | | $ | 59 | | |
Net change in unrealized appreciation/depreciation from
investments still held as of December 31, 2011 | | $ | 27 | | |
The accompanying notes are an integral part of the financial statements.
93
2011 Annual Report
December 31, 2011
Investment Overview (unaudited)
Focus Growth Portfolio
The Focus Growth Portfolio (the "Portfolio") seeks capital appreciation by investing primarily in growth-oriented equity securities of large capitalization companies.
Performance
For the year ended December 31, 2011, the Portfolio had a total return based on net asset value and reinvestment of distributions per share of -7.30%, net of fees, for Class I shares. The Portfolio's Class I shares underperformed against its benchmark, the Russell 1000® Growth Index (the "Index"), which returned 2.64%.
Factors Affecting Performance
• Equity markets began 2011 on a relatively optimistic note but suffered a stream of disappointments as the year progressed. The broad market's relatively flat return (as measured by the S&P 500® Index) for the year overall masked its more significant gyrations, as investors reacted to the worsening debt crisis in Europe, political strife in the Middle East, the natural disasters and nuclear crisis in Japan, political infighting in the U.S. and the downgrade of the U.S.'s credit rating by Standard & Poor's. Developed world economies also looked weaker than expected — the U.S. economy was nearing its stall speed in the first half of 2011, while European economies were expected to fall into recession in 2012. Despite the barrage of negative news, the strength of U.S. corporate earnings remained a bright spot for investors during the year.
• Against this backdrop, investors' appetite for risk was diminished. This helped large-cap stocks outperform mid- and small-cap stocks (as measured by their respective Russell indexes) for the year ended December 31, 2011.
• Stock selection in the consumer discretionary sector detracted the most from relative performance, led lower by a video streaming service, an online retailer, and a South African diversified media company (not represented in the Index).
• Stock selection in the energy sector further dampened performance, with weakness from positions in an oil and gas production company and a solar power systems manufacturer. The Portfolio's lack of exposure to integrated oil companies, a group which performed well during the period, also hurt performance on a relative basis.
• Underperformance was also driven by stock selection in the financial services sector. Within the sector, out-of-benchmark exposures to a Brazilian securities exchange operator and a global property, power, and infrastructure asset management company based in Canada, were among the weakest-performing holdings, as was a holding company engaged in a variety of businesses.
• The technology sector was the main positive contributor to performance, due to favorable stock selection. The sector was led by a personal computer, mobile communications, and media devices manufacturer, a Chinese internet search provider (which is not represented in the Index), and a communications equipment maker.
Management Strategies
• We look for high-quality growth companies that have these attributes: sustainable competitive advantages, business visibility, rising return on invested capital, free cash flow and a favorable risk/reward profile. In seeking these companies, we use intense fundamental research. Our emphasis is on secular growth, and as a result, short-term market events are not as meaningful in the stock selection process.
94
2011 Annual Report
December 31, 2011
Investment Overview (unaudited) (cont'd)
Focus Growth Portfolio
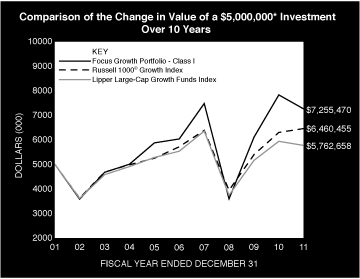
* Minimum Investment
In accordance with SEC regulations, Portfolio's performance shown assumes that all recurring fees (including management fees) were deducted and all dividends and distributions were reinvested. The performance of Class P shares will vary from the Class I shares based upon its different inception date and will be negatively impacted by additional fees assessed to that class.
Performance Compared to the Russell 1000® Growth Index(1) and the Lipper Large-Cap Growth Funds Index(2)
| | | Period Ended December 31, 2011 | |
| | | Total Returns(3) | |
| | | | | Average Annual | |
| | | One
Year | | Five
Years | | Ten
Years | | Since
Inception(6) | |
Portfolio — Class I Shares
w/o sales charges(4) | | | –7.30 | % | | | 3.76 | % | | | 3.79 | % | | | 9.87 | % | |
| Russell 1000® Growth Index | | | 2.64 | | | | 2.50 | | | | 2.60 | | | | 6.88 | | |
Lipper Large-Cap Growth
Funds Index | | | –2.90 | | | | 0.85 | | | | 1.43 | | | | 5.83 | | |
Portfolio — Class P Shares
w/o sales charges(5) | | | –7.53 | | | | 3.49 | | | | 3.53 | | | | 7.73 | | |
| Russell 1000® Growth Index | | | 2.64 | | | | 2.50 | | | | 2.60 | | | | 5.48 | | |
Lipper Large-Cap Growth
Funds Index | | | –2.90 | | | | 0.85 | | | | 1.43 | | | | 4.40 | | |
Performance data quoted represents past performance, which is no guarantee of future results, and current performance may be lower or higher than the figures shown. Performance assumes that all dividends and distributions, if any, were reinvested. For the most recent month-end performance figures, please visit www.morganstanley.com/im. Investment return and principal value will fluctuate so that Portfolio shares, when redeemed, may be worth more or less than their original cost. Total returns do not reflect the deduction of taxes that a shareholder would pay on Portfolio distributions or the redemption of Portfolio shares. Performance of share classes will vary due to difference in expenses.
(1) The Russell 1000® Growth Index measures the performance of the large-cap growth segment of the U.S. equity universe. It includes those Russell 1000® Index companies with higher price-to-book ratios and higher forecasted growth values. The Russell 1000® Index is an index of approximately 1,000 of the largest U.S. companies based on a combination of market capitalization and current index membership. The Index is unmanaged and its returns do not include any sales charges or fees. Such costs would lower performance. It is not possible to invest directly in an index.
(2) The Lipper Large-Cap Growth Funds Index is an equally weighted performance index of the largest qualifying funds (based on net assets) in the Lipper Large-Cap Growth Funds classification. The Index, which is adjusted for capital gains distributions and income dividends, is unmanaged and should not be considered an investment. There are currently 30 funds represented in this Index. As of the date of this report, the Portfolio is in the Lipper Large-Cap Growth Funds classification.
(3) Total returns for the Portfolio reflect fees waived and expenses reimbursed, if applicable, by the Adviser. Without such waivers and reimbursements, total returns would have been lower. The fee waivers and/or expense reimbursements will continue for one year or until such time as the Fund's Board of Directors acts to discontinue all or a portion of such waivers and/or expense reimbursements when it deems that such action is appropriate.
(4) Commenced operations on March 8, 1995.
(5) Commenced offering on January 2, 1996.
(6) For comparative purposes, average annual since inception returns listed for the Indexes refer to the inception date or initial offering of the respective share class of the Portfolio, not the inception of the Index.
Portfolio Composition
| Classification | | Percentage of
Total Investments | |
| Other* | | | 40.6 | % | |
| Computer Services, Software & Systems | | | 19.4 | | |
| Diversified Retail | | | 15.3 | | |
| Computer Technology | | | 12.5 | | |
| Short-Term Investments | | | 7.2 | | |
| Communications Technology | | | 5.0 | | |
| Total Investments | | | 100.0 | % | |
* Industries representing less than 5% of total investments.
95
2011 Annual Report
December 31, 2011
Portfolio of Investments
Focus Growth Portfolio
| | | Shares | | Value
(000) | |
| Common Stocks (92.2%) | |
| Air Transport (2.3%) | |
| Expeditors International of Washington, Inc. | | | 13,386 | | | $ | 548 | | |
| Alternative Energy (2.8%) | |
| Ultra Petroleum Corp. (a) | | | 22,396 | | | | 663 | | |
| Biotechnology (1.6%) | |
| Illumina, Inc. (a) | | | 12,883 | | | | 393 | | |
| Chemicals: Diversified (3.7%) | |
| Monsanto Co. | | | 12,743 | | | | 893 | | |
| Commercial Finance & Mortgage Companies (2.0%) | |
| BM&F Bovespa SA (Brazil) | | | 90,750 | | | | 477 | | |
| Commercial Services (1.9%) | |
| Leucadia National Corp. | | | 19,647 | | | | 447 | | |
| Communications Technology (5.1%) | |
| Motorola Solutions, Inc. | | | 26,207 | | | | 1,213 | | |
| Computer Services, Software & Systems (19.4%) | |
| Baidu, Inc. ADR (China) (a) | | | 7,539 | | | | 878 | | |
| Facebook, Inc., Class B (a)(b)(c) | | | 23,263 | | | | 628 | | |
| Google, Inc., Class A (a) | | | 3,219 | | | | 2,079 | | |
| LinkedIn Corp., Class A (a) | | | 4,374 | | | | 276 | | |
| Salesforce.com, Inc. (a) | | | 5,772 | | | | 586 | | |
| Zynga, Inc., Class A (a) | | | 21,372 | | | | 201 | | |
| | | | 4,648 | | |
| Computer Technology (12.5%) | |
| Apple, Inc. (a) | | | 6,602 | | | | 2,674 | | |
| Yandex N.V., Class A (Russia) (a) | | | 16,398 | | | | 323 | | |
| | | | 2,997 | | |
| Diversified Media (1.7%) | |
| Naspers Ltd., Class N (South Africa) | | | 9,489 | | | | 415 | | |
| Diversified Retail (15.4%) | |
| Amazon.com, Inc. (a) | | | 12,048 | | | | 2,085 | | |
| Fastenal Co. | | | 11,870 | | | | 518 | | |
| Groupon, Inc. (a) | | | 19,513 | | | | 403 | | |
| NetFlix, Inc. (a) | | | 3,389 | | | | 235 | | |
| Priceline.com, Inc. (a) | | | 931 | | | | 435 | | |
| | | | 3,676 | | |
| Financial Data & Systems (1.8%) | |
| MSCI, Inc., Class A (a) | | | 13,159 | | | | 433 | | |
| Medical Equipment (4.3%) | |
| Intuitive Surgical, Inc. (a) | | | 2,240 | | | | 1,037 | | |
| Metals & Minerals: Diversified (1.3%) | |
| Molycorp, Inc. (a) | | | 13,114 | | | | 314 | | |
| Pharmaceuticals (3.5%) | |
| Mead Johnson Nutrition Co. | | | 12,106 | | | | 832 | | |
| Real Estate Investment Trusts (REIT) (3.9%) | |
Brookfield Asset Management, Inc.,
Class A (Canada) | | | 34,011 | | | | 935 | | |
| Recreational Vehicles & Boats (4.0%) | |
| Edenred (France) | | | 39,301 | | | | 967 | | |
| | | Shares | | Value
(000) | |
| Semiconductors & Components (2.7%) | |
| ARM Holdings PLC ADR (United Kingdom) | | | 17,719 | | | $ | 490 | | |
| First Solar, Inc. (a) | | | 4,898 | | | | 166 | | |
| | | | 656 | | |
| Wholesale & International Trade (2.3%) | |
| Li & Fung Ltd. (d) | | | 292,200 | | | | 541 | | |
| Total Common Stocks (Cost $22,193) | | | 22,085 | | |
| Convertible Preferred Stocks (0.8%) | |
| Alternative Energy (0.8%) | |
| Better Place, Inc. Series B (a)(b)(c) | | | 21,064 | | | | 96 | | |
| Better Place, Inc. Series C (a)(b)(c) | | | 23,437 | | | | 106 | | |
| Total Convertible Preferred Stocks (Cost $159) | | | 202 | | |
| Short-Term Investment (7.2%) | |
| Investment Company (7.2%) | |
Morgan Stanley Institutional Liquidity
Funds — Money Market Portfolio —
Institutional Class (See Note G-2)
(Cost $1,727) | | | 1,726,533 | | | | 1,727 | | |
| Total Investments (100.2%) (Cost $24,079) | | | 24,014 | | |
| Liabilities in Excess of Other Assets (-0.2%) | | | (49 | ) | |
| Net Assets (100.0%) | | $ | 23,965 | | |
(a) Non-income producing security.
(b) At December 31, 2011, the Portfolio held fair valued securities valued at approximately $830,000, representing 3.5% of net assets. These securities have been fair valued as determined in good faith under procedures established by and under the general supervision of the Fund's Directors.
(c) Security has been deemed illiquid at December 31, 2011.
(d) Security trades on the Hong Kong exchange.
ADR American Depositary Receipt.
The accompanying notes are an integral part of the financial statements.
96
2011 Annual Report
December 31, 2011
Portfolio of Investments (cont'd)
Focus Growth Portfolio
Fair Value Measurement Information:
The following is a summary of the inputs used to value the Portfolio's investments as of December 31, 2011. (See Note A-9 to the financial statements for further information regarding fair value measurement.)
| Investment Type | | Level 1
Unadjusted
quoted
prices
(000) | | Level 2
Other
significant
observable
inputs
(000) | | Level 3
Significant
unobservable
inputs
(000) | | Total
(000) | |
| Assets: | | | | | | | | | |
| Common Stocks | | | | | | | | | |
| Air Transport | | $ | 548 | | | $ | — | | | $ | — | | | $ | 548 | | |
| Alternative Energy | | | 663 | | | | — | | | | — | | | | 663 | | |
| Biotechnology | | | 393 | | | | — | | | | — | | | | 393 | | |
| Chemicals: Diversified | | | 893 | | | | — | | | | — | | | | 893 | | |
Commercial Finance &
Mortgage Companies | | | 477 | | | | — | | | | — | | | | 477 | | |
| Commercial Services | | | 447 | | | | — | | | | — | | | | 447 | | |
Communications
Technology | | | 1,213 | | | | — | | | | — | | | | 1,213 | | |
Computer Services,
Software & Systems | | | 4,020 | | | | — | | | | 628 | | | | 4,648 | | |
| Computer Technology | | | 2,997 | | | | — | | | | — | | | | 2,997 | | |
| Diversified Media | | | 415 | | | | — | | | | — | | | | 415 | | |
| Diversified Retail | | | 3,676 | | | | — | | | | — | | | | 3,676 | | |
| Financial Data & Systems | | | 433 | | | | — | | | | — | | | | 433 | | |
| Medical Equipment | | | 1,037 | | | | — | | | | — | | | | 1,037 | | |
Metals & Minerals:
Diversified | | | 314 | | | | — | | | | — | | | | 314 | | |
| Pharmaceuticals | | | 832 | | | | — | | | | — | | | | 832 | | |
Real Estate Investment
Trusts (REIT) | | | 935 | | | | — | | | | — | | | | 935 | | |
Recreational Vehicles &
Boats | | | 967 | | | | — | | | | — | | | | 967 | | |
Semiconductors &
Components | | | 656 | | | | — | | | | — | | | | 656 | | |
Wholesale & International
Trade | | | 541 | | | | — | | | | — | | | | 541 | | |
| Total Common Stocks | | | 21,457 | | | | — | | | | 628 | | | | 22,085 | | |
Convertible Preferred
Stocks | | | — | | | | — | | | | 202 | | | | 202 | | |
| Short-Term Investment — | |
| Investment Company | | | 1,727 | | | | — | | | | — | | | | 1,727 | | |
| Total Assets | | $ | 23,184 | | | $ | — | | | $ | 830 | | | $ | 24,014 | | |
Transfers between investment levels may occur as the markets fluctuate and/or the availability of data used in an investment's valuation changes. The Portfolio recognizes transfers between the levels as of the end of the period. As of December 31, 2011, the Portfolio did not have any significant investments transfer between investment levels.
Following is a reconciliation of investments in which significant unobservable inputs (Level 3) were used in determining fair value.
| | | Common
Stocks
(000) | | Convertible
Preferred
Stocks
(000) | |
| Beginning Balance | | $ | — | | | $ | 53 | | |
| Purchases | | | 512 | | | | 106 | | |
| Sales | | | — | | | | — | | |
| Amortization of discount | | | — | | | | — | | |
| Transfers in | | | — | | | | — | | |
| Transfers out | | | — | | | | — | | |
| Change in unrealized appreciation (depreciation) | | | 116 | | | | 43 | | |
| Realized gains (losses) | | | — | | | | — | | |
| Ending Balance | | $ | 628 | | | $ | 202 | | |
Net change in unrealized appreciation/
depreciation from investments still held
as of December 31, 2011 | | $ | 116 | | | $ | 43 | | |
The accompanying notes are an integral part of the financial statements.
97
2011 Annual Report
December 31, 2011
Investment Overview (unaudited)
Growth Portfolio
The Growth Portfolio (the "Portfolio") seeks long-term capital appreciation by investing primarily in growth-oriented equity securities of large capitalization companies.
Performance
For the year ended December 31, 2011, the Portfolio had a total return based on net asset value and reinvestment of distributions per share of -3.01%, net of fees, for Class I shares. The Portfolio's Class I shares underperformed against its benchmark, the Russell 1000® Growth Index (the "Index"), which returned 2.64%.
Factors Affecting Performance
• Equity markets began 2011 on a relatively optimistic note but suffered a stream of disappointments as the year progressed. The broad market's relatively flat return (as measured by the S&P 500® Index) for the year overall masked its more significant gyrations, as investors reacted to the worsening debt crisis in Europe, political strife in the Middle East, the natural disasters and nuclear crisis in Japan, political infighting in the U.S. and the downgrade of the U.S.'s credit rating by Standard & Poor's. Developed world economies also looked weaker than expected — the U.S. economy was nearing its stall speed in the first half of 2011, while European economies were expected to fall into recession in 2012. Despite the barrage of negative news, the strength of U.S. corporate earnings remained a bright spot for investors during the year.
• Against this backdrop, investors' appetite for risk was diminished. This helped large-cap stocks outperform mid- and small-cap stocks (as measured by their respective Russell indexes) for the year ended December 31, 2011.
• The Portfolio's relative underperformance was led by stock selection in the financial services sector. Within the sector, out-of-benchmark exposures to a Brazilian securities exchange operator and a global property, power, and infrastructure asset management company based in Canada, were among the weakest-performing holdings, as was a discount securities brokerage firm.
• Stock selection in the energy sector further dampened performance, with weakness from positions in an oil and gas production company and a solar power systems manufacturer. The Portfolio's lack of exposure to integrated oil companies, a group which performed well during the period, also hurt performance on a relative basis.
• Despite the relative gains of an overweight in the sector, stock selection in consumer discretionary detracted from relative performance, led lower by a video streaming service, an online retailer, and a South African diversified media company (not represented in the Index).
• The technology sector was the main positive contributor to performance. The sector was led by a personal computer, mobile communications, and media devices manufacturer and a Chinese internet search provider (which is not represented in the Index).
• The health care sector also added to relative gains, mostly due to favorable stock selection. Within the sector, holdings in a surgical systems manufacturer and specialty pharmaceuticals stock were the top contributors to performance.
Management Strategies
• We look for high-quality growth companies that have these attributes: sustainable competitive advantages, business visibility, rising return on invested capital, free cash flow and a favorable risk/reward profile. In seeking these companies, we use intense fundamental research. Our emphasis is on secular growth, and as a result, short-term market events are not as meaningful in the stock selection process.
98
2011 Annual Report
December 31, 2011
Investment Overview (unaudited) (cont'd)
Growth Portfolio
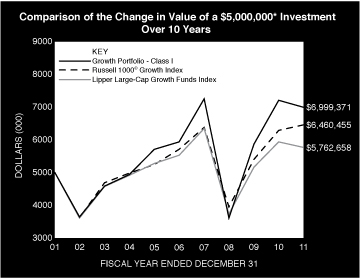
* Minimum Investment
In accordance with SEC regulations, Portfolio's performance shown assumes that all recurring fees (including management fees) were deducted and all dividends and distributions were reinvested. The performance of Class P shares will vary from the Class I shares based upon its different inception date and will be negatively impacted by additional fees assessed to that class.
Performance Compared to the Russell 1000® Growth Index(1) and the Lipper Large-Cap Growth Funds Index(2)
| | | Period Ended December 31, 2011 | |
| | | Total Returns(3) | |
| | | | | Average Annual | |
| | | One
Year | | Five
Years | | Ten
Years | | Since
Inception(6) | |
Portfolio — Class I Shares
w/o sales charges(4) | | | –3.01 | % | | | 3.34 | % | | | 3.42 | % | | | 8.73 | % | |
| Russell 1000® Growth Index | | | 2.64 | | | | 2.50 | | | | 2.60 | | | | 7.20 | | |
Lipper Large-Cap Growth
Funds Index | | | –2.90 | | | | 0.85 | | | | 1.43 | | | | 6.49 | | |
Portfolio — Class P Shares
w/o sales charges(5) | | | –3.27 | | | | 3.09 | | | | 3.17 | | | | 6.83 | | |
| Russell 1000® Growth Index | | | 2.64 | | | | 2.50 | | | | 2.60 | | | | 5.48 | | |
Lipper Large-Cap Growth
Funds Index | | | –2.90 | | | | 0.85 | | | | 1.43 | | | | 4.40 | | |
Performance data quoted represents past performance, which is no guarantee of future results, and current performance may be lower or higher than the figures shown. Performance assumes that all dividends and distributions, if any, were reinvested. For the most recent month-end performance figures, please visit www.morganstanley.com/im. Investment return and principal value will fluctuate so that Portfolio shares, when redeemed, may be worth more or less than their original cost. Total returns do not reflect the deduction of taxes that a shareholder would pay on Portfolio distributions or the redemption of Portfolio shares. Performance of share classes will vary due to difference in expenses.
(1) The Russell 1000® Growth Index measures the performance of the large-cap growth segment of the U.S. equity universe. It includes those Russell 1000® Index companies with higher price-to-book ratios and higher forecasted growth values. The Russell 1000® Index is an index of approximately 1,000 of the largest U.S. companies based on a combination of market capitalization and current index membership. The Index is unmanaged and its returns do not include any sales charges or fees. Such costs would lower performance. It is not possible to invest directly in an index.
(2) The Lipper Large-Cap Growth Funds Index is an equally weighted performance index of the largest qualifying funds (based on net assets) in the Lipper Large-Cap Growth Funds classification. The Index, which is adjusted for capital gains distributions and income dividends, is unmanaged and should not be considered an investment. There are currently 30 funds represented in this Index. As of the date of this report, the Portfolio is in the Lipper Large-Cap Growth Funds classification.
(3) Total returns for the Portfolio reflect fees waived and expenses reimbursed, if applicable, by the Adviser. Without such waivers and reimbursements, total returns would have been lower. The fee waivers and/or expense reimbursements will continue for one year or until such time as the Fund's Board of Directors acts to discontinue all or a portion of such waivers and/or expense reimbursements when it deems that such action is appropriate.
(4) Commenced operations on April 2, 1991.
(5) Commenced offering on January 2, 1996.
(6) For comparative purposes, average annual since inception returns listed for the Indexes refer to the inception date or initial offering of the respective share class of the Portfolio, not the inception of the Index.
Portfolio Composition
| Classification | | Percentage of
Total Investments | |
| Other* | | | 56.7 | % | |
| Computer Services, Software & Systems | | | 18.6 | | |
| Diversified Retail | | | 13.6 | | |
| Computer Technology | | | 11.1 | | |
| Total Investments | | | 100.0 | % | |
* Industries representing less than 5% of total investments.
99
2011 Annual Report
December 31, 2011
Portfolio of Investments
Growth Portfolio
| | | Shares | | Value
(000) | |
| Common Stocks (100.0%) | |
| Air Transport (2.0%) | |
| Expeditors International of Washington, Inc. | | | 363,588 | | | $ | 14,893 | | |
| Alternative Energy (3.3%) | |
| Range Resources Corp. | | | 168,834 | | | | 10,457 | | |
| Ultra Petroleum Corp. (a) | | | 498,344 | | | | 14,766 | | |
| | | | 25,223 | | |
| Asset Management & Custodian (0.5%) | |
| Citigroup, Inc. (See Note G-2) | | | 79,854 | | | | 2,101 | | |
| Goldman Sachs Group, Inc. (The) | | | 20,958 | | | | 1,895 | | |
| | | | 3,996 | | |
| Biotechnology (1.5%) | |
| Illumina, Inc. (a) | | | 372,445 | | | | 11,352 | | |
| Casinos & Gambling (1.5%) | |
| Las Vegas Sands Corp. (a) | | | 270,651 | | | | 11,565 | | |
| Chemicals: Diversified (3.1%) | |
| Monsanto Co. | | | 335,875 | | | | 23,535 | | |
| Commercial Finance & Mortgage Companies (1.8%) | |
| BM&F Bovespa SA (Brazil) | | | 2,575,066 | | | | 13,529 | | |
| Commercial Services (4.0%) | |
| eBay, Inc. (a) | | | 564,709 | | | | 17,128 | | |
| Leucadia National Corp. | | | 567,507 | | | | 12,905 | | |
| | | | 30,033 | | |
| Communications Technology (4.3%) | |
| Motorola Solutions, Inc. | | | 707,841 | | | | 32,766 | | |
| Computer Services, Software & Systems (19.1%) | |
| Baidu, Inc. ADR (China) (a) | | | 217,824 | | | | 25,370 | | |
| Facebook, Inc., Class B (a)(b)(c) | | | 1,000,782 | | | | 27,021 | | |
| Google, Inc., Class A (a) | | | 84,598 | | | | 54,642 | | |
| LinkedIn Corp., Class A (a) | | | 122,719 | | | | 7,732 | | |
| Salesforce.com, Inc. (a) | | | 163,511 | | | | 16,590 | | |
| VMware, Inc., Class A (a) | | | 87,422 | | | | 7,273 | | |
| Zynga, Inc., Class A (a) | | | 630,208 | | | | 5,930 | | |
| | | | 144,558 | | |
| Computer Technology (11.4%) | |
| Apple, Inc. (a) | | | 186,880 | | | | 75,687 | | |
| NVIDIA Corp. (a) | | | 175,975 | | | | 2,439 | | |
| Yandex N.V., Class A (Russia) (a) | | | 438,686 | | | | 8,642 | | |
| | | | 86,768 | | |
| Consumer Lending (1.5%) | |
| CME Group, Inc. | | | 47,714 | | | | 11,626 | | |
| Diversified Financial Services (0.2%) | |
| Bank of America Corp. | | | 316,126 | | | | 1,758 | | |
| Diversified Media (3.4%) | |
| McGraw-Hill Cos., Inc. (The) | | | 298,533 | | | | 13,425 | | |
| Naspers Ltd., Class N (South Africa) | | | 282,001 | | | | 12,338 | | |
| | | | 25,763 | | |
| Diversified Retail (14.0%) | |
| Amazon.com, Inc. (a) | | | 346,609 | | | | 59,998 | | |
| Fastenal Co. | | | 354,805 | | | | 15,473 | | |
| | | Shares | | Value
(000) | |
| Groupon, Inc. (a) | | | 530,764 | | | $ | 10,950 | | |
| NetFlix, Inc. (a) | | | 96,496 | | | | 6,686 | | |
| Priceline.com, Inc. (a) | | | 27,896 | | | | 13,047 | | |
| | | | 106,154 | | |
| Financial Data & Systems (1.7%) | |
| MSCI, Inc., Class A (a) | | | 393,296 | | | | 12,951 | | |
| Insurance: Multi-Line (0.3%) | |
| American International Group, Inc. (a) | | | 89,894 | | | | 2,086 | | |
| Medical Equipment (3.9%) | |
| Intuitive Surgical, Inc. (a) | | | 64,434 | | | | 29,834 | | |
| Metals & Minerals: Diversified (1.2%) | |
| Molycorp, Inc. (a) | | | 365,766 | | | | 8,771 | | |
| Pharmaceuticals (5.1%) | |
| Mead Johnson Nutrition Co. | | | 348,587 | | | | 23,959 | | |
Valeant Pharmaceuticals International, Inc.
(Canada) (a) | | | 311,072 | | | | 14,524 | | |
| | | | 38,483 | | |
| Real Estate Investment Trusts (REIT) (3.6%) | |
Brookfield Asset Management, Inc.,
Class A (Canada) | | | 1,001,623 | | | | 27,525 | | |
| Recreational Vehicles & Boats (3.5%) | |
| Edenred (France) | | | 1,071,672 | | | | 26,381 | | |
| Restaurants (3.4%) | |
| Starbucks Corp. | | | 277,791 | | | | 12,781 | | |
| Yum! Brands, Inc. | | | 215,070 | | | | 12,691 | | |
| | | | 25,472 | | |
| Securities Brokerage & Services (1.2%) | |
| Charles Schwab Corp. (The) | | | 777,943 | | | | 8,760 | | |
| Semiconductors & Components (2.5%) | |
| ARM Holdings PLC ADR (United Kingdom) | | | 499,397 | | | | 13,818 | | |
| First Solar, Inc. (a) | | | 147,250 | | | | 4,971 | | |
| | | | 18,789 | | |
| Wholesale & International Trade (2.0%) | |
| Li & Fung Ltd. (d) | | | 8,339,202 | | | | 15,440 | | |
| Total Common Stocks (Cost $623,496) | | | 758,011 | | |
| Convertible Preferred Stocks (1.1%) | |
| Alternative Energy (1.1%) | |
| Better Place, Inc. (a)(b)(c) (Cost $4,355) | | | 1,741,925 | | | | 7,908 | | |
| Short-Term Investment (1.7%) | |
| Investment Company (1.7%) | |
Morgan Stanley Institutional Liquidity
Funds — Money Market Portfolio —
Institutional Class (See Note G-2)
(Cost $12,909) | | | 12,909,028 | | | | 12,909 | | |
| Total Investments (102.8%) (Cost $640,760) | | | 778,828 | | |
| Liabilities in Excess of Other Assets (-2.8%) | | | (20,858 | ) | |
| Net Assets (100.0%) | | $ | 757,970 | | |
The accompanying notes are an integral part of the financial statements.
100
2011 Annual Report
December 31, 2011
Portfolio of Investments (cont'd)
Growth Portfolio
(a) Non-income producing security.
(b) At December 31, 2011, the Portfolio held fair valued securities valued at approximately $34,929,000, representing 4.6% of net assets. These securities have been fair valued as determined in good faith under procedures established by and under the general supervision of the Fund's Directors.
(c) Security has been deemed illiquid at December 31, 2011.
(d) Security trades on the Hong Kong exchange.
ADR American Depositary Receipt.
Fair Value Measurement Information:
The following is a summary of the inputs used to value the Portfolio's investments as of December 31, 2011. (See Note A-9 to the financial statements for further information regarding fair value measurement.)
| Investment Type | | Level 1
Unadjusted
quoted
prices
(000) | | Level 2
Other
significant
observable
inputs
(000) | | Level 3
Significant
unobservable
inputs
(000) | | Total
(000) | |
| Assets: | | | | | | | | | |
| Common Stocks | | | | | | | | | |
| Air Transport | | $ | 14,893 | | | $ | — | | | $ | — | | | $ | 14,893 | | |
| Alternative Energy | | | 25,223 | | | | — | | | | — | | | | 25,223 | | |
Asset Management &
Custodian | | | 3,996 | | | | — | | | | — | | | | 3,996 | | |
| Biotechnology | | | 11,352 | | | | — | | | | — | | | | 11,352 | | |
| Casinos & Gambling | | | 11,565 | | | | — | | | | — | | | | 11,565 | | |
| Chemicals: Diversified | | | 23,535 | | | | — | | | | — | | | | 23,535 | | |
Commercial Finance &
Mortgage Companies | | | 13,529 | | | | — | | | | — | | | | 13,529 | | |
| Commercial Services | | | 30,033 | | | | — | | | | — | | | | 30,033 | | |
Communications
Technology | | | 32,766 | | | | — | | | | — | | | | 32,766 | | |
Computer Services,
Software & Systems | | | 117,537 | | | | — | | | | 27,021 | | | | 144,558 | | |
| Computer Technology | | | 86,768 | | | | — | | | | — | | | | 86,768 | | |
| Consumer Lending | | | 11,626 | | | | — | | | | — | | | | 11,626 | | |
Diversified Financial
Services | | | 1,758 | | | | — | | | | — | | | | 1,758 | | |
| Diversified Media | | | 25,763 | | | | — | | | | — | | | | 25,763 | | |
| Diversified Retail | | | 106,154 | | | | — | | | | — | | | | 106,154 | | |
| Financial Data & Systems | | | 12,951 | | | | — | | | | — | | | | 12,951 | | |
| Insurance: Multi-Line | | | 2,086 | | | | — | | | | — | | | | 2,086 | | |
| Medical Equipment | | | 29,834 | | | | — | | | | — | | | | 29,834 | | |
Metals & Minerals:
Diversified | | | 8,771 | | | | — | | | | — | | | | 8,771 | | |
| Pharmaceuticals | | | 38,483 | | | | — | | | | — | | | | 38,483 | | |
Real Estate Investment
Trusts (REIT) | | | 27,525 | | | | — | | | | — | | | | 27,525 | | |
Recreational Vehicles &
Boats | | | 26,381 | | | | — | | | | — | | | | 26,381 | | |
| Restaurants | | | 25,472 | | | | — | | | | — | | | | 25,472 | | |
Securities Brokerage &
Services | | | 8,760 | | | | — | | | | — | | | | 8,760 | | |
| Investment Type | | Level 1
Unadjusted
quoted
prices
(000) | | Level 2
Other
significant
observable
inputs
(000) | | Level 3
Significant
unobservable
inputs
(000) | | Total
(000) | |
Semiconductors &
Components | | $ | 18,789 | | | $ | — | | | $ | — | | | $ | 18,789 | | |
Wholesale & International
Trade | | | 15,440 | | | | — | | | | — | | | | 15,440 | | |
| Total Common Stocks | | | 730,990 | | | | — | | | | 27,021 | | | | 758,011 | | |
Convertible Preferred
Stocks | | | — | | | | — | | | | 7,908 | | | | 7,908 | | |
| Short-Term Investment — | |
| Investment Company | | | 12,909 | | | | — | | | | — | | | | 12,909 | | |
| Total Assets | | $ | 743,899 | | | $ | — | | | $ | 34,929 | | | $ | 778,828 | | |
Transfers between investment levels may occur as the markets fluctuate and/or the availability of data used in an investment's valuation changes. The Portfolio recognizes transfers between the levels as of the end of the period. As of December 31, 2011, the Portfolio did not have any significant investments transfer between investment levels.
Following is a reconciliation of investments in which significant unobservable inputs (Level 3) were used in determining fair value.
| | | Common
Stocks
(000) | | Convertible
Preferred
Stocks
(000) | |
| Beginning Balance | | $ | 15,096 | | | $ | 4,355 | | |
| Purchases | | | 5,052 | | | | — | | |
| Sales | | | — | | | | — | | |
| Amortization of discount | | | — | | | | — | | |
| Transfers in | | | — | | | | — | | |
| Transfers out | | | — | | | | — | | |
| Change in unrealized appreciation (depreciation) | | | 6,873 | | | | 3,553 | | |
| Realized gains (losses) | | | — | | | | — | | |
| Ending Balance | | $ | 27,021 | | | $ | 7,908 | | |
Net change in unrealized appreciation/
depreciation from investments still held
as of December 31, 2011 | | $ | 6,873 | | | $ | 3,553 | | |
The accompanying notes are an integral part of the financial statements.
101
2011 Annual Report
December 31, 2011
Investment Overview (unaudited)
Insight Portfolio
The Insight Portfolio (the "Portfolio") seeks long-term capital appreciation.
Performance
For the period from inception on December 28, 2011 through December 31, 2011, the Portfolio had a total return based on net asset value per share of 0.60%, net of fees, for Class I shares. The Portfolio's Class I shares underperformed against its benchmark, the Russell 3000® Value Index (the "Index"), which returned 0.72% for the same period.
Factors Affecting Performance
• The Portfolio launched a few days prior to the close of the reporting period. Such a short time frame would not provide a meaningful performance analysis as short-term returns may not be indicative of the Portfolio's long-term performance potential.
Management Strategies
• We seek to invest primarily in established and cyclical franchise companies that we believe have strong name recognition, sustainable competitive advantages, and ample growth prospects, and are trading at an attractive discount to future cash flow generation capacity or asset value. We typically favor companies with the ability to generate attractive free cash flow yields. We utilize a bottom-up stock selection process, seeking attractive investments on an individual company basis. The companies we consider have market capitalizations within the range of companies included in the Russell 3000® Value Index (approximately $37 million to $386 billion as of November 30, 2011).
• We continue to focus on assessing company prospects over a three- to five-year time horizon and on owning a portfolio of high-quality companies with diverse business drivers not tied to a particular market environment.
Performance Compared to the Russell 3000® Value Index(1) and the Lipper Multi-Cap Value Funds Index(2)
| | | Period Ended December 31, 2011 | |
| | | Total Returns(3) | |
| | | One
Year | | Five
Years | | Ten
Years | | Cumulative
Since
Inception(5) | |
Portfolio — Class I Shares
w/o sales charges(4) | | | — | | | | — | | | | — | | | | 0.60 | % | |
| Russell 3000® Value Index | | | — | | | | — | | | | — | | | | 0.72 | | |
Lipper Multi-Cap Value
Funds Index | | | — | | | | — | | | | — | | | | 0.78 | | |
Portfolio — Class H Shares
w/o sales charges(4) | | | — | | | | — | | | | — | | | | 0.60 | | |
Portfolio — Class H Shares with
maximum 4.75% sales charges(4) | | | — | | | | — | | | | — | | | | –4.19 | | |
| Russell 3000® Value Index | | | — | | | | — | | | | — | | | | | | |
Lipper Multi-Cap Value
Funds Index | | | — | | | | — | | | | — | | | | 0.78 | | |
Portfolio — Class L Shares
w/o sales charges(4) | | | — | | | | — | | | | — | | | | 0.60 | | |
| Russell 3000® Value Index | | | — | | | | — | | | | — | | | | 0.72 | | |
Lipper Multi-Cap Value
Funds Index | | | — | | | | — | | | | — | | | | 0.78 | | |
Performance data quoted represents past performance, which is no guarantee of future results, and current performance may be lower or higher than the figures shown. Performance assumes that all dividends and distributions, if any, were reinvested. For the most recent month-end performance figures, please visit www.morganstanley.com/im. Investment return and principal value will fluctuate so that Portfolio shares, when redeemed, may be worth more or less than their original cost. Total returns do not reflect the deduction of taxes that a shareholder would pay on Portfolio distributions or the redemption of Portfolio shares. Performance of share classes will vary due to difference in expenses.
(1) The Russell 3000® Value Index measures the performance of those companies in the Russell 3000® Index with lower price-to-book ratios and lower forecasted growth values. The Russell 3000® Index measures the performance of the largest 3000 U.S. companies representing approximately 98% of the investable U.S. equity market. The Index is unmanaged and its returns do not include any sales charges or fees. Such costs would lower performance. It is not possible to invest directly in an index.
(2) The Lipper Multi-Cap Value Funds Index is an equally weighted performance index of the largest qualifying funds (based on net assets) in the Lipper Multi-Cap Value Funds classification. The Index, which is adjusted for capital gains distributions and income dividends, is unmanaged and should not be considered an investment. There are currently 30 funds represented in this Index. As of the date of this report, the Portfolio is in the Lipper Multi-Cap Value Funds classification.
(3) Total returns for the Portfolio reflect fees waived and expenses reimbursed, if applicable, by the Adviser. Without such waivers and reimbursements, total returns would have been lower. The fee waivers and/or expense reimbursements will continue for one year or until such time as the Fund's Board of Directors acts to discontinue all or a portion of such waivers and/or expense reimbursements when it deems that such action is appropriate.
(4) Commenced operations on December 28, 2011.
(5) For comparative purposes, average annual since inception returns listed for the Indexes refer to the inception date or initial offering of the respective share class of the Portfolio, not the inception of the Index. Returns for periods less than one year are not annualized.
102
2011 Annual Report
December 31, 2011
Investment Overview (unaudited) (cont'd)
Insight Portfolio
Portfolio Composition
| Classification | | Percentage of
Total Investments | |
| Short-Term Investments | | | 55.6 | % | |
| Other* | | | 37.7 | | |
| Insurance: Property-Casualty | | | 6.7 | | |
| Total Investments | | | 100.0 | % | |
* Industries representing less than 5% of total investments.
103
2011 Annual Report
December 31, 2011
Portfolio of Investments
Insight Portfolio
| | | Shares | | Value
(000) | |
| Common Stocks (79.3%) | |
| Beverage: Brewers & Distillers (6.0%) | |
| Anheuser-Busch InBev N.V. ADR | | | 273 | | | $ | 17 | | |
| Molson Coors Brewing Co. | | | 754 | | | | 33 | | |
| | | | 50 | | |
| Beverage: Soft Drinks (2.0%) | |
| PepsiCo, Inc. | | | 250 | | | | 17 | | |
| Chemicals: Diversified (7.8%) | |
| CF Industries Holdings, Inc. | | | 228 | | | | 33 | | |
| Mosaic Co. (The) | | | 634 | | | | 32 | | |
| | | | 65 | | |
| Commercial Services (2.0%) | |
| Leucadia National Corp. | | | 724 | | | | 17 | | |
| Communications Technology (7.8%) | |
| Motorola Solutions, Inc. | | | 1,404 | | | | 65 | | |
| Consumer Lending (6.0%) | |
| Berkshire Hathaway, Inc., Class B (a) | | | 430 | | | | 33 | | |
| Brown & Brown, Inc. | | | 741 | | | | 17 | | |
| | | | 50 | | |
| Diversified Materials & Processing (4.1%) | |
| Diana Containerships, Inc. (Marshall Islands) | | | 3,150 | | | | 17 | | |
| Fortune Brands Home & Security, Inc. (a) | | | 997 | | | | 17 | | |
| | | | 34 | | |
| Foods (6.0%) | |
| Nestle SA ADR (Switzerland) | | | 581 | | | | 33 | | |
| Sara Lee Corp. | | | 878 | | | | 17 | | |
| | | | 50 | | |
| Home Building (4.1%) | |
| Brookfield Residential Properties, Inc. (Canada) (a) | | | 2,205 | | | | 17 | | |
| NVR, Inc. (a) | | | 25 | | | | 17 | | |
| | | | 34 | | |
| Insurance: Property-Casualty (11.9%) | |
| Arch Capital Group Ltd. (a) | | | 441 | | | | 16 | | |
| Markel Corp. (a) | | | 80 | | | | 33 | | |
| Progressive Corp. (The) | | | 2,556 | | | | 50 | | |
| | | | 99 | | |
| Real Estate (3.8%) | |
| Howard Hughes Corp. (The) (a) | | | 369 | | | | 16 | | |
| Tejon Ranch Co. (a) | | | 657 | | | | 16 | | |
| | | | 32 | | |
| Real Estate Investment Trusts (REIT) (3.9%) | |
Brookfield Asset Management, Inc.,
Class A (Canada) | | | 1,213 | | | | 33 | | |
| Restaurants (7.8%) | |
| Carrols Restaurant Group, Inc. (a) | | | 1,436 | | | | 16 | | |
| PF Chang's China Bistro, Inc. | | | 1,578 | | | | 49 | | |
| | | | 65 | | |
| | | Shares | | Value
(000) | |
| Semiconductors & Components (6.1%) | |
| First Solar, Inc. (a) | | | 1,008 | | | $ | 34 | | |
| Koninklijke Philips Electronics N.V. (Netherlands) | | | 801 | | | | 17 | | |
| | | | 51 | | |
| Total Common Stocks (Cost $657) | | | 662 | | |
| Short-Term Investment (99.4%) | |
| Investment Company (99.4%) | |
Morgan Stanley Institutional Liquidity
Funds — Money Market Portfolio —
Institutional Class (See Note G-2)
(Cost $830) | | | 830,000 | | | | 830 | | |
| Total Investments (178.7%) (Cost $1,487) | | | 1,492 | | |
| Liabilities in Excess of Other Assets (-78.7%) | | | (657 | ) | |
| Net Assets (100.0%) | | $ | 835 | | |
(a) Non-income producing security.
ADR American Depositary Receipt.
Fair Value Measurement Information:
The following is a summary of the inputs used to value the Portfolio's investments as of December 31, 2011. (See Note A-9 to the financial statements for further information regarding fair value measurement.)
| Investment Type | | Level 1
Unadjusted
quoted
prices
(000) | | Level 2
Other
significant
observable
inputs
(000) | | Level 3
Significant
unobservable
inputs
(000) | | Total
(000) | |
| Assets: | | | | | | | | | |
| Common Stocks | | | | | | | | | |
Beverage: Brewers &
Distillers | | $ | 50 | | | $ | — | | | $ | — | | | $ | 50 | | |
| Beverage: Soft Drinks | | | 17 | | | | — | | | | — | | | | 17 | | |
| Chemicals: Diversified | | | 65 | | | | — | | | | — | | | | 65 | | |
| Commercial Services | | | 17 | | | | — | | | | — | | | | 17 | | |
Communications
Technology | | | 65 | | | | — | | | | — | | | | 65 | | |
| Consumer Lending | | | 50 | | | | — | | | | — | | | | 50 | | |
Diversified Materials &
Processing | | | 34 | | | | — | | | | — | | | | 34 | | |
| Foods | | | 50 | | | | — | | | | — | | | | 50 | | |
| Home Building | | | 34 | | | | — | | | | — | | | | 34 | | |
Insurance:
Property-Casualty | | | 99 | | | | — | | | | — | | | | 99 | | |
| Real Estate | | | 32 | | | | — | | | | — | | | | 32 | | |
Real Estate Investment
Trusts (REIT) | | | 33 | | | | — | | | | — | | | | 33 | | |
| Restaurants | | | 65 | | | | — | | | | — | | | | 65 | | |
Semiconductors &
Components | | | 51 | | | | — | | | | — | | | | 51 | | |
| Total Common Stocks | | | 662 | | | | — | | | | — | | | | 662 | | |
The accompanying notes are an integral part of the financial statements.
104
2011 Annual Report
December 31, 2011
Portfolio of Investments (cont'd)
Insight Portfolio
Fair Value Measurement Information: (cont'd)
| Investment Type | | Level 1
Unadjusted
quoted
prices
(000) | | Level 2
Other
significant
observable
inputs
(000) | | Level 3
Significant
unobservable
inputs
(000) | | Total
(000) | |
| Short-Term Investment — | |
| Investment Company | | $ | 830 | | | $ | — | | | $ | — | | | $ | 830 | | |
| Total Assets | | $ | 1,492 | | | $ | — | | | $ | — | | | $ | 1,492 | | |
Transfers between investment levels may occur as the markets fluctuate and/or the availability of data used in an investment's valuation changes. The Portfolio recognizes transfers between the levels as of the end of the period. As of December 31, 2011, the Portfolio did not have any significant investments transfer between investment levels.
The accompanying notes are an integral part of the financial statements.
105
2011 Annual Report
December 31, 2011
Investment Overview (unaudited)
Opportunity Portfolio
The Opportunity Portfolio (the "Portfolio") seeks long-term capital appreciation by investing primarily in established and emerging franchise companies with capitalizations within the range of companies included in the Russell 1000® Growth Index.
Performance
For the year ended December 31, 2011, the Portfolio had a total return based on net asset value and reinvestment of distributions per share of -0.46%, net of fees, for Class I shares. The Portfolio's Class I shares underperformed against its benchmark, the Russell 1000® Growth Index (the "Index"), which returned 2.64%.
Factors Affecting Performance
• Equity markets began 2011 on a relatively optimistic note but suffered a stream of disappointments as the year progressed. The broad market's relatively flat return (as measured by the S&P 500® Index) for the year overall masked its more significant gyrations, as investors reacted to the worsening debt crisis in Europe, political strife in the Middle East, the natural disasters and nuclear crisis in Japan, political infighting in the U.S. and the downgrade of the U.S.'s credit rating by Standard & Poor's. Developed world economies also looked weaker than expected — the U.S. economy was nearing its stall speed in the first half of 2011, while European economies were expected to fall into recession in 2012. Despite the barrage of negative news, the strength of U.S. corporate earnings remained a bright spot for investors during the year.
• Against this backdrop, investors' appetite for risk was diminished. This helped large-cap stocks outperform mid- and small-cap stocks (as measured by their respective Russell indexes) for the year ended December 31, 2011.
• Stock selection in the consumer discretionary sector was the largest detractor from relative performance during the period, primarily due to holdings in a Brazilian real estate developer, an online retailer, and a Chinese department store operator. Stock selection in producer durables also hurt relative performance, with weakness from several holdings in the transport and logistics industry. Stock selection in energy was unfavorable as well. A holding in an oil and gas production company was the main cause of relative losses within the sector.
• Stock selection in technology was a source of relative gains. Performance was led by positions in a personal computer, mobile communications, and media devices maker and a Chinese internet search provider (not represented in the Index). Stock selection and an overweight in financial services also added to relative returns, as holdings in several credit card companies performed well.
Management Strategies
• We look for high-quality growth companies that have these attributes: sustainable competitive advantages, business visibility, rising return on invested capital, free cash flow and a favorable risk/reward profile. In seeking these companies, we use intense fundamental research. Our emphasis is on secular growth, and as a result short-term market events are not as meaningful in the stock selection process.
106
2011 Annual Report
December 31, 2011
Investment Overview (unaudited) (cont'd)
Opportunity Portfolio

* Minimum Investment = $25,000
** Performance shown for the Portfolio's Class H shares reflects the performance of the Class A shares of the Predecessor Fund for periods prior to May 21, 2010 and has been restated to reflect the Portfolio's applicable sales charge.
In accordance with SEC regulations, Portfolio's performance shown assumes that all recurring fees (including management fees) were deducted and all dividends and distributions were reinvested. The performance of Class H shares will vary from the Class I, Class P and Class L shares based upon its different inception date and will be impacted by fees assessed to that class.
Performance Compared to the Russell 1000® Growth Index(1) and the Lipper Multi-Cap Growth Funds Index(2)
| | | Period Ended December 31, 2011 | |
| | | Total Returns(3) | |
| | | | | Average Annual | |
| | | One
Year | | Five
Years | | Ten
Years | | Since
Inception(5) | |
Portfolio — Class I Shares
w/o sales charges(4) | | | –0.46 | % | | | 5.16 | % | | | — | | | | 6.58 | % | |
| Russell 1000® Growth Index | | | 2.64 | | | | 2.50 | | | | — | | | | 3.79 | | |
Lipper Multi-Cap Growth
Funds Index | | | –4.02 | | | | 0.87 | | | | — | | | | 2.93 | | |
Portfolio — Class H Shares
w/o sales charges(4) | | | –0.73 | | | | 4.86 | | | | 3.85 | | | | 3.68 | | |
Portfolio — Class H Shares with
maximum 4.75% sales charges(4) | | | –5.45 | | | | 3.84 | | | | 3.34 | | | | 3.30 | | |
| Russell 1000® Growth Index | | | 2.64 | | | | 2.50 | | | | 2.60 | | | | 1.89 | | |
Lipper Multi-Cap Growth
Funds Index | | | –4.02 | | | | 0.87 | | | | 2.78 | | | | 2.60 | | |
Portfolio — Class L Shares
w/o sales charges(4) | | | –1.17 | | | | 4.18 | | | | 3.17 | | | | 2.97 | | |
| Russell 1000® Growth Index | | | 2.64 | | | | 2.50 | | | | 2.60 | | | | 1.89 | | |
Lipper Multi-Cap Growth
Funds Index | | | –4.02 | | | | 0.87 | | | | 2.78 | | | | 2.60 | | |
| | | Period Ended December 31, 2011 | |
| | | Total Returns(3) | |
| | | | | Average Annual | |
| | | One
Year | | Five
Years | | Ten
Years | | Since
Inception(5) | |
Portfolio — Class P Shares
w/o sales charges(4) | | | –0.72 | % | | | — | | | | — | | | | 14.44 | % | |
| Russell 1000® Growth Index | | | 2.64 | | | | — | | | | — | | | | 13.66 | | |
Lipper Multi-Cap Growth
Funds Index | | | –4.02 | | | | — | | | | — | | | | 10.47 | | |
Performance data quoted represents past performance, which is no guarantee of future results, and current performance may be lower or higher than the figures shown. Performance assumes that all dividends and distributions, if any, were reinvested. For the most recent month-end performance figures, please visit www.morganstanley.com/im. Investment return and principal value will fluctuate so that Portfolio shares, when redeemed, may be worth more or less than their original cost. Total returns do not reflect the deduction of taxes that a shareholder would pay on Portfolio distributions or the redemption of Portfolio shares. Performance of share classes will vary due to difference in sales charges and expenses.
(1) The Russell 1000® Growth Index measures the performance of the large-cap growth segment of the U.S. equity universe. It includes those Russell 1000® Index companies with higher price-to-book ratios and higher forecasted growth values. The Russell 1000® Growth Index is an index of approximately 1,000 of the largest U.S. companies based on a combination of market capitalization and current index membership. The Index is unmanaged and its returns do not include any sales charges or fees. Such costs would lower performance. It is not possible to invest directly in an index.
(2) The Lipper Multi-Cap Growth Funds Index is an equally weighted performance index of the largest qualifying funds (based on net assets) in the Lipper Multi-Cap Growth Funds Funds classification. The Index, which is adjusted for capital gains distributions and income dividends, is unmanaged and should not be considered an investment. There are currently 30 funds represented in this Index. As of the date of this report, the Portfolio was in the Lipper Multi-Cap Growth Funds classification.
(3) Total returns for the Portfolio reflect fees waived and expenses reimbursed, if applicable, by the Adviser. Without such waivers and reimbursements, total returns would have been lower. The fee waivers and/or expense reimbursements will continue for one year or until such time as the Board of Directors acts to discontinue all or a portion of such waivers and/or expense reimbursements when it deems that such action is appropriate.
(4) On May 21, 2010 Class A, Class B, Class C, and Class I shares of Van Kampen Equity Growth Fund ("the Predecessor Fund") were reorganized into Class H, Class H, Class L, and Class I shares of Morgan Stanley Equity Growth Portfolio ("the Portfolio"), respectively. Class H, Class L, and Class I shares' returns of the Portfolio will differ from the Predecessor Fund as they have different expenses. Performance shown for the Portfolio's Class I, Class H, and Class L shares reflects the performance of the shares of the Predecessor Fund for periods prior to May 21, 2010. The Class I shares of the Predecessor Fund commenced offering on August 12, 2005. Each of the Class A and Class C shares of the Predecessor Fund commenced operations on May 28, 1998. Class P shares commenced offering on May 21, 2010. Performance for Class H shares has been restated to reflect the Fund's applicable sales charge. In October 2010, the Morgan Stanley Equity Growth Portfolio changed its name to the Morgan Stanley Opportunity Portfolio.
(5) For comparative purposes, average annual since inception returns listed for the Indexes refer to the inception date or initial offering of the respective share class of the Portfolio, not the inception of the Index.
107
2011 Annual Report
December 31, 2011
Investment Overview (unaudited) (cont'd)
Opportunity Portfolio
Portfolio Composition
| Classification | | Percentage of
Total Investments | |
| Other* | | | 45.2 | % | |
| Computer Services, Software & Systems | | | 17.3 | | |
| Diversified Retail | | | 15.7 | | |
| Consumer Lending | | | 11.1 | | |
| Computer Technology | | | 10.7 | | |
| Total Investments | | | 100.0 | % | |
* Industries representing less than 5% of total investments.
108
2011 Annual Report
December 31, 2011
Portfolio of Investments
Opportunity Portfolio
| | | Shares | | Value
(000) | |
| Common Stocks (95.2%) | |
| Advertising Agencies (2.6%) | |
| Omnicom Group, Inc. | | | 141,329 | | | $ | 6,300 | | |
| Air Transport (1.4%) | |
| Expeditors International of Washington, Inc. | | | 81,941 | | | | 3,356 | | |
| Alternative Energy (2.1%) | |
| Ultra Petroleum Corp. (a) | | | 176,297 | | | | 5,224 | | |
| Asset Management & Custodian (1.7%) | |
CETIP SA - Balcao Organizado de
Ativos e Derivativos (Brazil) | | | 290,627 | | | | 4,199 | | |
| Casinos & Gambling (4.7%) | |
| Universal Entertainment Corp. (Japan) | | | 246,500 | | | | 6,818 | | |
| Wynn Resorts Ltd. | | | 42,168 | | | | 4,659 | | |
| | | | 11,477 | | |
| Chemicals: Diversified (2.8%) | |
| Monsanto Co. | | | 98,380 | | | | 6,893 | | |
| Commercial Services (0.4%) | |
China Merchants Holdings International
Co., Ltd. (China) (b) | | | 357,030 | | | | 1,037 | | |
| Communications Technology (1.8%) | |
| Corning, Inc. | | | 333,272 | | | | 4,326 | | |
| Computer Services, Software & Systems (17.5%) | |
| Baidu, Inc. ADR (China) (a) | | | 91,253 | | | | 10,628 | | |
| Facebook, Inc., Class B (a)(c)(d) | | | 338,054 | | | | 9,128 | | |
| Google, Inc., Class A (a) | | | 34,591 | | | | 22,342 | | |
| LinkedIn Corp., Class A (a) | | | 9,352 | | | | 589 | | |
| | | | 42,687 | | |
| Computer Technology (10.8%) | |
| Apple, Inc. (a) | | | 64,853 | | | | 26,265 | | |
| Consumer Lending (11.2%) | |
| CME Group, Inc. | | | 27,960 | | | | 6,813 | | |
| Mastercard, Inc., Class A | | | 30,458 | | | | 11,355 | | |
| Visa, Inc., Class A | | | 90,378 | | | | 9,176 | | |
| | | | 27,344 | | |
| Consumer Services: Miscellaneous (1.6%) | |
| Sun Art Retail Group Ltd. (Hong Kong) (a) | | | 3,106,500 | | | | 3,884 | | |
| Diversified Retail (15.8%) | |
| Abercrombie & Fitch Co., Class A | | | 75,566 | | | | 3,691 | | |
| Amazon.com, Inc. (a) | | | 129,464 | | | | 22,410 | | |
| Golden Eagle Retail Group Ltd. (China) (b) | | | 2,495,000 | | | | 5,275 | | |
| Priceline.com, Inc. (a) | | | 15,375 | | | | 7,191 | | |
| | | | 38,567 | | |
| Education Services (4.2%) | |
New Oriental Education & Technology
Group, Inc. ADR (China) (a) | | | 424,725 | | | | 10,215 | | |
| Home Building (1.8%) | |
| Brookfield Incorporacoes SA (Brazil) | | | 1,627,787 | | | | 4,320 | | |
| Insurance: Multi-Line (4.4%) | |
| Greenlight Capital Re Ltd., Class A (a) | | | 452,957 | | | | 10,721 | | |
| Metals & Minerals: Diversified (1.1%) | |
| Molycorp, Inc. (a) | | | 113,991 | | | | 2,734 | | |
| | | Shares | | Value
(000) | |
| Personal Care (1.4%) | |
| Procter & Gamble Co. (The) | | | 52,953 | | | $ | 3,533 | | |
| Real Estate Investment Trusts (REIT) (2.6%) | |
Brookfield Asset Management, Inc.,
Class A (Canada) | | | 229,060 | | | | 6,295 | | |
| Semiconductors & Components (1.2%) | |
| Marvell Technology Group Ltd. (a) | | | 217,843 | | | | 3,017 | | |
| Textiles Apparel & Shoes (1.4%) | |
| Prada SpA (Italy) (a) | | | 751,700 | | | | 3,402 | | |
| Truckers (2.7%) | |
| DSV A/S (Denmark) | | | 367,778 | | | | 6,596 | | |
| Total Common Stocks (Cost $199,323) | | | 232,392 | | |
| Convertible Preferred Stocks (1.7%) | |
| Alternative Energy (1.7%) | |
| Better Place, Inc. (a)(c)(d) (Cost $2,339) | | | 935,447 | | | | 4,247 | | |
| Participation Notes (3.3%) | |
| Beverage: Brewers & Distillers (3.3%) | |
Deutsche Bank AG, Kweichow Moutai Co.,
Ltd., Class A, Equity Linked Notes,
Zero Coupon, 3/4/21 (Cost $6,514) | | | 258,170 | | | | 7,929 | | |
| Short-Term Investment (0.7%) | |
| Investment Company (0.7%) | |
Morgan Stanley Institutional Liquidity
Funds — Money Market Portfolio —
Institutional Class (See Note G-2)
(Cost $1,625) | | | 1,624,829 | | | | 1,625 | | |
| Total Investments (100.9%) (Cost $209,801) | | | 246,193 | | |
| Liabilities in Excess of Other Assets (-0.9%) | | | (2,143 | ) | |
| Net Assets (100.0%) | | $ | 244,050 | | |
(a) Non-income producing security.
(b) Security trades on the Hong Kong exchange.
(c) At December 31, 2011, the Portfolio held fair valued securities valued at approximately $13,375,000, representing 5.5% of net assets. These securities have been fair valued as determined in good faith under procedures established by and under the general supervision of the Fund's Directors.
(d) Security has been deemed illiquid at December 31, 2011.
ADR American Depositary Receipt.
The accompanying notes are an integral part of the financial statements.
109
2011 Annual Report
December 31, 2011
Portfolio of Investments (cont'd)
Opportunity Portfolio
Fair Value Measurement Information:
The following is a summary of the inputs used to value the Portfolio's investments as of December 31, 2011. (See Note A-9 to the financial statements for further information regarding fair value measurement.)
| Investment Type | | Level 1
Unadjusted
quoted
prices
(000) | | Level 2
Other
significant
observable
inputs
(000) | | Level 3
Significant
unobservable
inputs
(000) | | Total
(000) | |
| Assets: | | | | | | | | | |
| Common Stocks | | | | | | | | | |
| Advertising Agencies | | $ | 6,300 | | | $ | — | | | $ | — | | | $ | 6,300 | | |
| Air Transport | | | 3,356 | | | | — | | | | — | | | | 3,356 | | |
| Alternative Energy | | | 5,224 | | | | — | | | | — | | | | 5,224 | | |
Asset Management &
Custodian | | | 4,199 | | | | — | | | | — | | | | 4,199 | | |
| Casinos & Gambling | | | 11,477 | | | | — | | | | — | | | | 11,477 | | |
| Chemicals: Diversified | | | 6,893 | | | | — | | | | — | | | | 6,893 | | |
| Commercial Services | | | 1,037 | | | | — | | | | — | | | | 1,037 | | |
Communications
Technology | | | 4,326 | | | | — | | | | — | | | | 4,326 | | |
Computer Services,
Software & Systems | | | 33,559 | | | | — | | | | 9,128 | | | | 42,687 | | |
| Computer Technology | | | 26,265 | | | | — | | | | — | | | | 26,265 | | |
| Consumer Lending | | | 27,344 | | | | — | | | | — | | | | 27,344 | | |
Consumer Services:
Miscellaneous | | | 3,884 | | | | — | | | | — | | | | 3,884 | | |
| Diversified Retail | | | 38,567 | | | | — | | | | — | | | | 38,567 | | |
| Education Services | | | 10,215 | | | | — | | | | — | | | | 10,215 | | |
| Home Building | | | 4,320 | | | | — | | | | — | | | | 4,320 | | |
| Insurance: Multi-Line | | | 10,721 | | | | — | | | | — | | | | 10,721 | | |
Metals & Minerals:
Diversified | | | 2,734 | | | | — | | | | — | | | | 2,734 | | |
| Personal Care | | | 3,533 | | | | — | | | | — | | | | 3,533 | | |
Real Estate Investment
Trusts (REIT) | | | 6,295 | | | | — | | | | — | | | | 6,295 | | |
Semiconductors &
Components | | | 3,017 | | | | — | | | | — | | | | 3,017 | | |
| Textiles Apparel & Shoes | | | 3,402 | | | | — | | | | — | | | | 3,402 | | |
| Truckers | | | 6,596 | | | | — | | | | — | | | | 6,596 | | |
| Total Common Stocks | | | 223,264 | | | | — | | | | 9,128 | | | | 232,392 | | |
Convertible Preferred
Stocks | | | — | | | | — | | | | 4,247 | | | | 4,247 | | |
| Participation Notes | | | — | | | | 7,929 | | | | — | | | | 7,929 | | |
| Short-Term Investment — | |
| Investment Company | | | 1,625 | | | | — | | | | — | | | | 1,625 | | |
| Total Assets | | $ | 224,889 | | | $ | 7,929 | | | $ | 13,375 | | | $ | 246,193 | | |
Transfers between investment levels may occur as the markets fluctuate and/or the availability of data used in an investment's valuation changes. The Portfolio recognizes transfers between the levels as of the end of the period. As of December 31, 2011, the Portfolio did not have any significant investments transfer between investment levels.
Following is a reconciliation of investments in which significant unobservable inputs (Level 3) were used in determining fair value.
| | | Common
Stocks
(000) | | Convertible
Preferred
Stocks
(000) | |
| Beginning Balance | | $ | — | | | $ | 2,339 | | |
| Purchases | | | 7,438 | | | | — | | |
| Sales | | | — | | | | — | | |
| Amortization of discount | | | — | | | | — | | |
| Transfers in | | | — | | | | — | | |
| Transfers out | | | — | | | | — | | |
| Change in unrealized appreciation (depreciation) | | | 1,690 | | | | 1,908 | | |
| Realized gains (losses) | | | — | | | | — | | |
| Ending Balance | | $ | 9,128 | | | $ | 4,247 | | |
Net change in unrealized appreciation/
depreciation from investments still held
as of December 31, 2011 | | $ | 1,690 | | | $ | 1,908 | | |
The accompanying notes are an integral part of the financial statements.
110
2011 Annual Report
December 31, 2011
Investment Overview (unaudited)
Small Company Growth Portfolio
The Small Company Growth Portfolio (the "Portfolio") seeks long-term capital appreciation by investing primarily in growth-oriented equity securities of small capitalization companies.
Performance
For the year ended December 31, 2011, the Portfolio had a total return based on net asset value and reinvestment of distributions per share of -9.12%, net of fees, for Class I shares. The Portfolio's Class I shares underperformed against its benchmark, the Russell 2000® Growth Index (the "Index"), which returned -2.91%.
Factors Affecting Performance
• Equity markets began 2011 on a relatively optimistic note but suffered a stream of disappointments as the year progressed. The broad market's relatively flat return (as measured by the S&P 500® Index) for the year overall masked its more significant gyrations, as investors reacted to the worsening debt crisis in Europe, political strife in the Middle East, the natural disasters and nuclear crisis in Japan, political infighting in the U.S. and the downgrade of the U.S.'s credit rating by Standard & Poor's. Developed world economies also looked weaker than expected — the U.S. economy was nearing its stall speed in the first half of 2011, while European economies were expected to fall into recession in 2012. Despite the barrage of negative news, the strength of U.S. corporate earnings remained a bright spot for investors during the year.
• Against this backdrop, investors' appetite for risk was diminished. As such, mid- and small-cap stocks underperformed large-cap stocks (as measured by their respective Russell indexes) for the year ended December 31, 2011.
• Within the Portfolio, the consumer discretionary sector was the largest detractor from relative performance, due to the negative impact of stock selection and an overweight in the sector. Stocks in the sector faced a challenging environment during the period, given the erosion of investor confidence in the economy's prospects. Positions in diversified retail, specialty retail, home building, and restaurants were among the main detractors in the sector.
• Stock selection in the materials and processing sector was disadvantageous to relative performance, as was an overweight in the sector. A position in a rare earths producer was the largest drag on returns.
• The financial services sector was another area of weakness. Holdings in an independent investment bank, a financial data provider, and a portfolio management services provider diminished relative returns.
• In contrast, the utilities sector was a positive contributor to relative returns during the period. Within the sector, the Portfolio held only two stocks and both posted gains during the period.
• Positive relative performance also came from the energy sector, with good results from an oil and gas exploration and production company. An underweight in the sector was beneficial to relative results as well.
Management Strategies
• We look for high-quality growth companies that have these attributes: sustainable competitive advantages, business visibility, rising return on invested capital, free cash flow and a favorable risk/reward profile. In seeking these companies, we use intense fundamental research. Our emphasis is on secular growth, and as a result, short-term market events are not as meaningful in the stock selection process.
111
2011 Annual Report
December 31, 2011
Investment Overview (unaudited) (cont'd)
Small Company Growth Portfolio
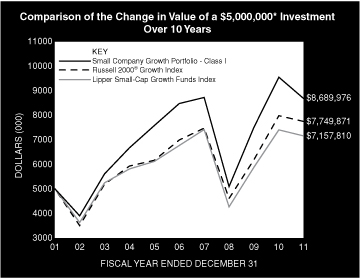
* Minimum Investment
In accordance with SEC regulations, Portfolio's performance shown assumes that all recurring fees (including management fees) were deducted and all dividends and distributions were reinvested. The performance of Class P, Class H, and Class L shares will vary from the Class I shares based upon different inception dates and will be negatively impacted by additional fees assessed to these classes.
Performance Compared to the Russell 2000® Growth Index(1) and the Lipper Small-Cap Growth Funds Index(2)
| | | Period Ended December 31, 2011 | |
| | | Total Returns(3) | |
| | | | | Average Annual | |
| | | One
Year | | Five
Years | | Ten
Years | | Since
Inception(7) | |
Portfolio — Class I Shares
w/o sales charges(4) | | | –9.12 | % | | | 0.49 | % | | | 5.68 | % | | | 10.39 | % | |
| Russell 2000® Growth Index | | | –2.91 | | | | 2.09 | | | | 4.48 | | | | 6.40 | | |
Lipper Small-Cap Growth
Funds Index | | | –3.40 | | | | 1.14 | | | | 3.65 | | | | 8.30 | | |
Portfolio — Class P Shares
w/o sales charges(5) | | | –9.28 | | | | 0.24 | | | | 5.42 | | | | 8.99 | | |
| Russell 2000® Growth Index | | | –2.91 | | | | 2.09 | | | | 4.48 | | | | 4.38 | | |
Lipper Small-Cap Growth
Funds Index | | | –3.40 | | | | 1.14 | | | | 3.65 | | | | 5.74 | | |
Portfolio — Class H Shares
w/o sales charges(6) | | | — | | | | — | | | | — | | | | –3.46 | | |
Portfolio — Class H Shares
with maximum 4.75%
sales charges(6) | | | — | | | | — | | | | — | | | | –8.04 | | |
| Russell 2000® Growth Index | | | — | | | | — | | | | — | | | | –1.26 | | |
Lipper Small-Cap Growth
Funds Index | | | — | | | | — | | | | — | | | | –1.71 | | |
Portfolio — Class L Shares
w/o sales charges(6) | | | — | | | | — | | | | — | | | | –3.54 | | |
| Russell 2000® Growth Index | | | — | | | | — | | | | — | | | | –1.26 | | |
Lipper Small-Cap Growth
Funds Index | | | — | | | | — | | | | — | | | | –1.71 | | |
Performance data quoted represents past performance, which is no guarantee of future results, and current performance may be lower or higher than the figures shown. Performance assumes that all dividends and distributions, if any, were reinvested. For the most recent month-end performance figures, please visit www.morganstanley.com/im. Investment return and principal value will fluctuate so that Portfolio shares, when redeemed, may be worth more or less than their original cost. Total returns do not reflect the deduction of taxes that a shareholder would pay on Portfolio distributions or the redemption of Portfolio shares. Performance of share classes will vary due to difference in expenses.
(1) The Russell 2000® Growth Index measures the performance of the small-cap growth segment of the U.S. equity universe. It includes those Russell 2000® Index companies with higher price-to-book ratios and higher forecasted growth values. The Russell 2000® Index is a subset of the Russell 3000® Index representing approximately 10% of the total market capitalization of that index. It includes approximately 2,000 of the smallest securities based on a combination of their market capitalization and current index membership. The Index is unmanaged and its returns do not include any sales charges or fees. Such costs would lower performance. It is not possible to invest directly in an index.
(2) The Lipper Small-Cap Growth Funds Index is an equally weighted performance index of the largest qualifying funds (based on net assets) in the Lipper Small-Cap Growth Funds classification. The Index, which is adjusted for capital gains distributions and income dividends, is unmanaged and should not be considered an investment. There are currently 30 funds represented in this Index. As of the date of this report, the Portfolio is in the Lipper Small-Cap Growth Funds classification.
(3) Total returns for the Portfolio reflect fees waived and expenses reimbursed, if applicable, by the Adviser. Without such waivers and reimbursements, total returns would have been lower. The fee waivers and/or expense reimbursements will continue for one year or until such time as the Fund's Board of Directors acts to discontinue all or a portion of such waivers and/or expense reimbursements when it deems that such action is appropriate.
(4) Commenced operations on November 1, 1989.
(5) Commenced offering on January 2, 1996.
(6) Commenced offering on November 11, 2011.
(7) For comparative purposes, average annual since inception returns listed for the Indexes refer to the inception date or initial offering of the respective share class of the Portfolio, not the inception of the Index. Returns for periods less than one year are not annualized.
Portfolio Composition
| Classification | | Percentage of
Total Investments | |
| Other* | | | 71.7 | % | |
| Commercial Services | | | 14.1 | | |
| Computer Services, Software & Systems | | | 8.9 | | |
| Utilities: Electrical | | | 5.3 | | |
| Total Investments | | | 100.0 | % | |
* Industries representing less than 5% of total investments.
112
2011 Annual Report
December 31, 2011
Portfolio of Investments
Small Company Growth Portfolio
| | | Shares | | Value
(000) | |
| Common Stocks (93.4%) | |
| Advertising Agencies (2.2%) | |
| Lamar Advertising Co., Class A (a) | | | 1,110,961 | | | $ | 30,551 | | |
| Asset Management & Custodian (2.5%) | |
CETIP SA - Balcao Organizado de
Ativos e Derivativos (Brazil) | | | 779,119 | | | | 11,257 | | |
| Greenhill & Co., Inc. | | | 630,516 | | | | 22,932 | | |
| | | | 34,189 | | |
| Banks: Diversified (1.6%) | |
| Financial Engines, Inc. (a) | | | 1,009,168 | | | | 22,535 | | |
| Biotechnology (1.0%) | |
| Abcam PLC (United Kingdom) | | | 2,366,278 | | | | 13,413 | | |
| Casinos & Gambling (1.5%) | |
| Lakes Entertainment, Inc. (a) | | | 628,322 | | | | 1,181 | | |
| Universal Entertainment Corp. (Japan) | | | 724,800 | | | | 20,048 | | |
| | | | 21,229 | | |
| Cement (1.6%) | |
| Eagle Materials, Inc. | | | 872,333 | | | | 22,384 | | |
| Chemicals: Diversified (3.7%) | |
| Intrepid Potash, Inc. (a) | | | 752,868 | | | | 17,038 | | |
| Rockwood Holdings, Inc. (a) | | | 883,059 | | | | 34,766 | | |
| | | | 51,804 | | |
| Commercial Services (14.2%) | |
| Advisory Board Co. (The) (a) | | | 909,986 | | | | 67,530 | | |
| Corporate Executive Board Co. (The) | | | 1,142,695 | | | | 43,537 | | |
| CoStar Group, Inc. (a) | | | 781,559 | | | | 52,153 | | |
| MercadoLibre, Inc. (Brazil) | | | 428,541 | | | | 34,086 | | |
| | | | 197,306 | | |
| Computer Services, Software & Systems (8.9%) | |
| MakeMyTrip Ltd. (India) (a) | | | 1,005,771 | | | | 24,179 | | |
| NetSuite, Inc. (a) | | | 1,104,253 | | | | 44,777 | | |
| OpenTable, Inc. (a) | | | 734,959 | | | | 28,759 | | |
| Solera Holdings, Inc. | | | 596,714 | | | | 26,578 | | |
| | | | 124,293 | | |
| Computer Technology (3.2%) | |
| Bankrate, Inc. (a) | | | 1,331,969 | | | | 28,637 | | |
| Youku.com, Inc. ADR (China) (a) | | | 706,488 | | | | 11,071 | | |
| Zillow, Inc. (a) | | | 217,045 | | | | 4,879 | | |
| | | | 44,587 | | |
| Consumer Electronics (1.0%) | |
| Sohu.com, Inc. (China) (a) | | | 273,100 | | | | 13,655 | | |
| Diversified Retail (4.8%) | |
| Blue Nile, Inc. (a) | | | 875,361 | | | | 35,785 | | |
| Citi Trends, Inc. (a) | | | 707,845 | | | | 6,215 | | |
| Pricesmart, Inc. | | | 200,817 | | | | 13,975 | | |
| Shutterfly, Inc. (a) | | | 447,014 | | | | 10,174 | | |
| | | | 66,149 | | |
| Electronic Components (1.1%) | |
| Cogent Communications Group, Inc. (a) | | | 877,368 | | | | 14,819 | | |
| | | Shares | | Value
(000) | |
| Entertainment (2.6%) | |
| Vail Resorts, Inc. | | | 844,051 | | | $ | 35,754 | | |
| Foods (0.9%) | |
Country Style Cooking Restaurant
Chain Co., Ltd. ADR (China) (a) | | | 765,590 | | | | 5,642 | | |
| Ocado Group PLC (United Kingdom) (a) | | | 8,345,355 | | | | 7,051 | | |
| | | | 12,693 | | |
| Health Care Facilities (0.1%) | |
| LCA-Vision, Inc. (a) | | | 698,269 | | | | 2,025 | | |
| Health Care Management Services (2.8%) | |
| HMS Holdings Corp. (a) | | | 1,208,455 | | | | 38,646 | | |
| Health Care Services (3.1%) | |
| athenahealth, Inc. (a) | | | 870,927 | | | | 42,780 | | |
| Home Building (0.8%) | |
| Brookfield Incorporacoes SA (Brazil) | | | 4,440,810 | | | | 11,785 | | |
| Insurance: Multi-Line (2.5%) | |
| Greenlight Capital Re Ltd., Class A (a) | | | 1,269,160 | | | | 30,041 | | |
| Pico Holdings, Inc. (a) | | | 257,534 | | | | 5,300 | | |
| | | | 35,341 | | |
| Medical & Dental Instruments & Supplies (3.7%) | |
| Techne Corp. | | | 764,633 | | | | 52,194 | | |
| Medical Services (1.8%) | |
| Accretive Health, Inc. (a) | | | 860,651 | | | | 19,778 | | |
| Zeltiq Aesthetics, Inc. (a) | | | 494,201 | | | | 5,614 | | |
| | | | 25,392 | | |
| Metals & Minerals: Diversified (2.9%) | |
| Lynas Corp. Ltd. (Australia) (a) | | | 37,612,956 | | | | 40,202 | | |
| Oil Well Equipment & Services (1.5%) | |
| Oasis Petroleum, Inc. (a) | | | 704,486 | | | | 20,494 | | |
| Pharmaceuticals (2.7%) | |
| Gen-Probe, Inc. (a) | | | 349,349 | | | | 20,654 | | |
| Ironwood Pharmaceuticals, Inc. (a) | | | 1,372,605 | | | | 16,430 | | |
| | | | 37,084 | | |
| Printing and Copying Services (1.1%) | |
| VistaPrint N.V. (a) | | | 479,589 | | | | 14,675 | | |
| Publishing (2.0%) | |
| Morningstar, Inc. | | | 473,458 | | | | 28,147 | | |
| Restaurants (4.4%) | |
| Dunkin' Brands Group, Inc. (a) | | | 735,951 | | | | 18,384 | | |
| PF Chang's China Bistro, Inc. | | | 1,396,466 | | | | 43,165 | | |
| | | | 61,549 | | |
| Scientific Instruments: Pollution Control (1.4%) | |
| Covanta Holding Corp. | | | 1,420,915 | | | | 19,452 | | |
| Semiconductors & Components (1.7%) | |
| Tessera Technologies, Inc. (a) | | | 1,380,539 | | | | 23,124 | | |
| Technology: Miscellaneous (1.2%) | |
| iRobot Corp. (a) | | | 572,862 | | | | 17,100 | | |
The accompanying notes are an integral part of the financial statements.
113
2011 Annual Report
December 31, 2011
Portfolio of Investments (cont'd)
Small Company Growth Portfolio
| | | Shares | | Value
(000) | |
| Telecommunications Equipment (2.3%) | |
| Angie's List, Inc. (a) | | | 1,357,431 | | | $ | 21,854 | | |
| Pandora Media, Inc. (a) | | | 1,027,246 | | | | 10,283 | | |
| | | | 32,137 | | |
| Truckers (1.3%) | |
| LLX Logistica SA (Brazil) (a) | | | 10,010,019 | | | | 18,085 | | |
| Utilities: Electrical (5.3%) | |
| AET&D Holdings No 1 Ltd. (Australia) (a)(b)(c) | | | 6,682,555 | | | | — | | |
| Brookfield Infrastructure Partners LP (Canada) | | | 2,662,170 | | | | 73,742 | | |
| | | | 73,742 | | |
| Total Common Stocks (Cost $1,135,958) | | | 1,299,315 | | |
| Preferred Stocks (0.6%) | |
| Health Care Services (0.5%) | |
| Castlight Health, Inc. (a)(b)(c) | | | 1,796,926 | | | | 7,387 | | |
| Technology: Miscellaneous (0.1%) | |
| Glam Media, Inc. Series M-1 (a)(b)(c) | | | 361,920 | | | | 1,875 | | |
| Glam Media, Inc. Escrow Series M-1 (a)(b)(c) | | | 51,703 | | | | 174 | | |
| | | | 2,049 | | |
| Total Preferred Stocks (Cost $13,342) | | | 9,436 | | |
| Convertible Preferred Stocks (4.3%) | |
| Alternative Energy (1.1%) | |
| Better Place, Inc. (a)(b)(c) | | | 3,465,201 | | | | 15,732 | | |
| Computer Services, Software & Systems (2.8%) | |
| Twitter, Inc. Series E (a)(b)(c) | | | 2,259,658 | | | | 36,358 | | |
| Workday, Inc. (a)(b)(c) | | | 159,335 | | | | 2,113 | | |
| | | | 38,471 | | |
| Computer Technology (0.0%) | |
| Youku.com, Inc., Class A (China) (a)(b)(c) | | | 1 | | | | — | @ | |
| Consumer Services: Miscellaneous (0.4%) | |
| Xoom Corp. Series F (a)(b)(c) | | | 2,610,922 | | | | 6,005 | | |
| Total Convertible Preferred Stocks (Cost $24,268) | | | 60,208 | | |
| | | Face
Amount
(000) | | | |
| Promissory Notes (0.1%) | |
| Technology: Miscellaneous (0.1%) | |
Glam Media, Inc.
9.00%, 12/3/13 (a)(b)(c) | | $ | 793 | | | | 792 | | |
Glam Media, Inc. Escrow
9.00%, 12/3/13 (a)(b)(c) | | | 113 | | | | 73 | | |
| Total Promissory Notes (Cost $2,515) | | | 865 | | |
| | | Shares | | | |
| Short-Term Investment (2.3%) | |
| Investment Company (2.3%) | |
Morgan Stanley Institutional Liquidity
Funds — Money Market Portfolio —
Institutional Class (See Note G-2)
(Cost $31,544) | | | 31,543,629 | | | | 31,544 | | |
| Total Investments (100.7%) (Cost $1,207,627) | | | 1,401,368 | | |
| Liabilities in Excess of Other Assets (-0.7%) | | | (10,325 | ) | |
| Net Assets (100.0%) | | $ | 1,391,043 | | |
(a) Non-income producing security.
(b) At December 31, 2011, the Portfolio held fair valued securities valued at approximately $70,509,000, representing 5.1% of net assets. These securities have been fair valued as determined in good faith under procedures established by and under the general supervision of the Fund's Directors.
(c) Security has been deemed illiquid at December 31, 2011.
@ Value is less than $500.
ADR American Depositary Receipt.
Fair Value Measurement Information:
The following is a summary of the inputs used to value the Portfolio's investments as of December 31, 2011. (See Note A-9 to the financial statements for further information regarding fair value measurement.)
| Investment Type | | Level 1
Unadjusted
quoted
prices
(000) | | Level 2
Other
significant
observable
inputs
(000) | | Level 3
Significant
unobservable
inputs
(000) | | Total
(000) | |
| Assets: | | | | | | | | | |
| Common Stocks | | | | | | | | | |
| Advertising Agencies | | $ | 30,551 | | | $ | — | | | $ | — | | | $ | 30,551 | | |
Asset Management &
Custodian | | | 34,189 | | | | — | | | | — | | | | 34,189 | | |
| Banks: Diversified | | | 22,535 | | | | — | | | | — | | | | 22,535 | | |
| Biotechnology | | | 13,413 | | | | — | | | | — | | | | 13,413 | | |
| Casinos & Gambling | | | 21,229 | | | | — | | | | — | | | | 21,229 | | |
| Cement | | | 22,384 | | | | — | | | | — | | | | 22,384 | | |
| Chemicals: Diversified | | | 51,804 | | | | — | | | | — | | | | 51,804 | | |
| Commercial Services | | | 197,306 | | | | — | | | | — | | | | 197,306 | | |
Computer Services,
Software & Systems | | | 124,293 | | | | — | | | | — | | | | 124,293 | | |
| Computer Technology | | | 44,587 | | | | — | | | | — | | | | 44,587 | | |
| Consumer Electronics | | | 13,655 | | | | — | | | | — | | | | 13,655 | | |
| Diversified Retail | | | 66,149 | | | | — | | | | — | | | | 66,149 | | |
| Electronic Components | | | 14,819 | | | | — | | | | — | | | | 14,819 | | |
| Entertainment | | | 35,754 | | | | — | | | | — | | | | 35,754 | | |
| Foods | | | 12,693 | | | | — | | | | — | | | | 12,693 | | |
| Health Care Facilities | | | 2,025 | | | | — | | | | — | | | | 2,025 | | |
Health Care Management
Services | | | 38,646 | | | | — | | | | — | | | | 38,646 | | |
| Health Care Services | | | 42,780 | | | | — | | | | — | | | | 42,780 | | |
| Home Building | | | 11,785 | | | | — | | | | — | | | | 11,785 | | |
| Insurance: Multi-Line | | | 35,341 | | | | — | | | | — | | | | 35,341 | | |
Medical & Dental
Instruments & Supplies | | | 52,194 | | | | — | | | | — | | | | 52,194 | | |
| Medical Services | | | 25,392 | | | | — | | | | — | | | | 25,392 | | |
Metals & Minerals:
Diversified | | | 40,202 | | | | — | | | | — | | | | 40,202 | | |
Oil Well Equipment &
Services | | | 20,494 | | | | — | | | | — | | | | 20,494 | | |
| Pharmaceuticals | | | 37,084 | | | | — | | | | — | | | | 37,084 | | |
Printing and Copying
Services | | | 14,675 | | | | — | | | | — | | | | 14,675 | | |
| Publishing | | | 28,147 | | | | — | | | | — | | | | 28,147 | | |
| Restaurants | | | 61,549 | | | | — | | | | — | | | | 61,549 | | |
The accompanying notes are an integral part of the financial statements.
114
2011 Annual Report
December 31, 2011
Portfolio of Investments (cont'd)
Small Company Growth Portfolio
Fair Value Measurement Information: (cont'd)
| Investment Type | | Level 1
Unadjusted
quoted
prices
(000) | | Level 2
Other
significant
observable
inputs
(000) | | Level 3
Significant
unobservable
inputs
(000) | | Total
(000) | |
| Common Stocks (cont'd) | | | | | | | | | |
Scientific Instruments:
Pollution Control | | $ | 19,452 | | | $ | — | | | $ | — | | | $ | 19,452 | | |
Semiconductors &
Components | | | 23,124 | | | | — | | | | — | | | | 23,124 | | |
Technology:
Miscellaneous | | | 17,100 | | | | — | | | | — | | | | 17,100 | | |
Telecommunications
Equipment | | | 32,137 | | | | — | | | | — | | | | 32,137 | | |
| Truckers | | | 18,085 | | | | — | | | | — | | | | 18,085 | | |
| Utilities: Electrical | | | 73,742 | | | | — | | | | — | † | | | 73,742 | | |
| Total Common Stocks | | | 1,299,315 | | | | — | | | | — | † | | | 1,299,315 | | |
| Preferred Stocks | | | — | | | | — | | | | 9,436 | | | | 9,436 | | |
Convertible Preferred
Stocks | | | — | | | | — | | | | 60,208 | | | | 60,208 | | |
| Promissory Notes | | | — | | | | — | | | | 865 | | | | 865 | | |
| Short-Term Investment — | |
| Investment Company | | | 31,544 | | | | — | | | | — | | | | 31,544 | | |
| Total Assets | | $ | 1,330,859 | | | $ | — | | | $ | 70,509 | † | | $ | 1,401,368 | | |
Transfers between investment levels may occur as the markets fluctuate and/or the availability of data used in an investment's valuation changes. The Portfolio recognizes transfers between the levels as of the end of the period. As of December 31, 2011, the Portfolio did not have any significant investments transfer between investment levels.
Following is a reconciliation of investments in which significant unobservable inputs (Level 3) were used in determining fair value.
| | | Common
Stocks
(000) | | Preferred
Stocks
(000) | | Convertible
Preferred
Stocks
(000) | | Promissory
Notes
(000) | |
| Beginning Balance | | $ | — | † | | $ | 21,745 | | | $ | 61,345 | | | $ | — | | |
| Purchases | | | — | | | | 6,325 | | | | 2,297 | | | | 2,515 | | |
| Sales | | | — | | | | (15,795 | ) | | | (16,234 | ) | | | — | | |
| Amortization of discount | | | — | | | | — | | | | — | | | | — | | |
| Transfers in | | | — | | | | — | | | | — | | | | — | | |
| Transfers out | | | — | | | | — | | | | — | | | | — | | |
Change in unrealized
appreciation
(depreciation) | | | — | | | | (2,839 | ) | | | 5,534 | | | | (1,650 | ) | |
| Realized gains (losses) | | | — | | | | — | | | | 7,266 | | | | — | | |
| Ending Balance | | $ | — | † | | $ | 9,436 | | | $ | 60,208 | | | $ | 865 | | |
Net change in unrealized
appreciation/depreciation
from investments still held
as of December 31, 2011 | | $ | — | | | $ | (3,906 | ) | | $ | 5,534 | | | $ | (1,650 | ) | |
† Includes one or more securities which are valued at zero.
The accompanying notes are an integral part of the financial statements.
115
2011 Annual Report
December 31, 2011
Investment Overview (unaudited)
U.S. Real Estate Portfolio
The U.S. Real Estate Portfolio (the "Portfolio") seeks to provide above average current income and long-term capital appreciation by investing primarily in equity securities of companies in the U.S. real estate industry, including real estate investment trusts ("REITs").
Performance
For the year ended December 31, 2011, the Portfolio had a total return based on net asset value and reinvestment of distributions per share of 5.57%, net of fees, for Class I shares. The Portfolio's Class I shares underperformed against its benchmark, the FTSE NAREIT Equity REITs Index (the "Index"), which returned 8.29%, and outperformed the S&P 500® Index, which returned 2.11%.
Factors Affecting Performance
• The real estate investment trust (REIT) market gained 8.29% in the 12-month period ending December 31, 2011, as measured by the Index. Movements in REIT share prices appeared to be most influenced by the equity market. REITs rallied in the first half of the year, but meaningfully declined in the third quarter on investor concerns with regard to prospects for a double-dip recession in the U.S. as well as a number of global concerns, particularly the European sovereign debt crisis and the risk of a hard landing scenario in China. Subsequently, REITs rallied in the fourth quarter, particularly in October as concerns about these factors eased.
• Among the major U.S. REIT sectors, the apartment and retail sectors outperformed and the office sector underperformed the Index. The office sector was the weakest performer in 2011 among the major sectors. The companies with exposure to suburban office assets were significant laggards. Apartment companies posted the best returns among the major sectors for the full year, as the companies provided a strong outlook for multifamily operating fundamentals even in the face of a slow U.S. economy and sluggish job growth. The retail sector outperformed, with the malls significantly outperforming the shopping centers, as a result of continued strong performance by owners of high-end malls. Among the smaller sectors, the storage sector posted the best performance for the full year. The health care sector also outperformed despite being traditionally viewed as a more defensive sector due to its long-term net lease structure. The weakest performer was the hotel sector, which was negatively impacted by concerns with regard to a weakening economy, despite the companies continuing to post attractive operating results. The industrial sector also underperformed due to concerns about weaker tenant demand.
• The Portfolio underperformed the Index for the period. Bottom-up stock selection detracted from the Portfolio's relative performance while top-down sector allocation performed in line with the Index. Stock selection was especially strong in the mall and office sectors; this was offset by the negative impact of stock selection in the diversified and health care sectors. From a top-down perspective, the Portfolio benefited from the underweight to the industrial sector, while the overweight to the hotel sector detracted.
Management Strategies
• We have maintained our core investment philosophy as a real estate value investor. This results in the ownership of stocks whose share prices we believe provide real estate exposure at the best valuation relative to their underlying asset values. We continue to focus on relative implied valuations as a key metric. Our company-specific research leads us to an overweighting in the Portfolio to a group of companies that are focused in the ownership of upscale urban hotels and to a number of out-of-favor companies, as well as an underweighting to companies concentrated in the ownership of suburban office, health care and industrial assets.
• Our outlook for the REIT market is based on two key factors: private market pricing for underlying real estate assets and public market pricing for the securities. Assuming asset values for high-quality assets are approximately 10% below their all-time peak levels achieved in early 2007, which represents a 50% improvement from trough levels, the REIT market ended the period at an approximate 10% premium to net asset value (NAV). This valuation is comparable to the historical average premium for the REIT market.
116
2011 Annual Report
December 31, 2011
Investment Overview (unaudited) (cont'd)
U.S. Real Estate Portfolio
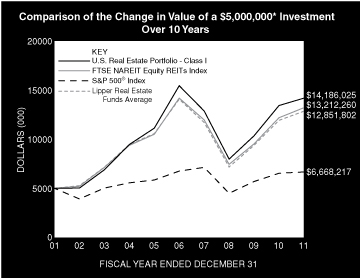
* Minimum Investment
In accordance with SEC regulations, Portfolio's performance shown assumes that all recurring fees (including management fees) were deducted and all dividends and distributions were reinvested. The performance of Class P, Class H, and Class L shares will vary from the Class I shares based upon different inception dates and will be negatively impacted by additional fees assessed to these classes.
Performance Compared to the FTSE NAREIT Equity REITs Index(1), the S&P 500® Index(2), and the Lipper Real Estate Funds Average(3)
| | | Period Ended December 31, 2011 | |
| | | Total Returns(4) | |
| | | | | Average Annual | |
| | | One
Year | | Five
Years | | Ten
Years | | Since
Inception(8) | |
Portfolio — Class I Shares
w/o sales charges(5) | | | 5.57 | % | | | –1.70 | % | | | 10.99 | % | | | 12.69 | % | |
| FTSE NAREIT Equity REITs Index | | | 8.29 | | | | –1.42 | | | | 10.20 | | | | 10.77 | | |
| S&P 500® Index | | | 2.11 | | | | –0.25 | | | | 2.92 | | | | 7.75 | | |
Lipper Real Estate
Funds Average | | | 7.64 | | | | –1.81 | | | | 9.69 | | | | 10.92 | | |
Portfolio — Class P Shares
w/o sales charges(6) | | | 5.26 | | | | –1.97 | | | | 10.70 | | | | 11.71 | | |
| FTSE NAREIT Equity REITs Index | | | 8.29 | | | | –1.42 | | | | 10.20 | | | | 10.40 | | |
| S&P 500® Index | | | 2.11 | | | | –0.25 | | | | 2.92 | | | | 6.42 | | |
Lipper Real Estate
Funds Average | | | 7.64 | | | | –1.81 | | | | 9.69 | | | | 10.36 | | |
Portfolio — Class H Shares
w/o sales charges(7) | | | — | | | | — | | | | — | | | | 1.24 | | |
Portfolio — Class H Shares
with maximum 4.75%
sales charges(7) | | | — | | | | — | | | | — | | | | –3.54 | | |
| FTSE NAREIT Equity REITs Index | | | — | | | | — | | | | — | | | | 2.25 | | |
| S&P 500® Index | | | — | | | | — | | | | — | | | | –0.16 | | |
| Lipper Real Estate Funds Average | | | — | | | | — | | | | — | | | | 1.99 | | |
Portfolio — Class L Shares
w/o sales charges(7) | | | — | | | | — | | | | — | | | | 1.17 | | |
| FTSE NAREIT Equity REITs Index | | | — | | | | — | | | | — | | | | 2.25 | | |
| S&P 500® Index | | | — | | | | — | | | | — | | | | –0.16 | | |
| Lipper Real Estate Funds Average | | | — | | | | — | | | | — | | | | 1.99 | | |
Performance data quoted represents past performance, which is no guarantee of future results, and current performance may be lower or higher than the figures shown. Performance assumes that all dividends and distributions, if any, were reinvested. For the most recent month-end performance figures, please visit www.morganstanley.com/im. Investment return and principal value will fluctuate so that Portfolio shares, when redeemed, may be worth more or less than their original cost. Total returns do not reflect the deduction of taxes that a shareholder would pay on Portfolio distributions or the redemption of Portfolio shares. Performance of share classes will vary due to difference in expenses.
(1) The FTSE NAREIT (National Association of Real Estate Investment Trusts) Equity REITs Index is free float-adjusted market capitalization weighted index of tax-qualified REITs listed on the New York Stock Exchange, NYSE Amex and the NASDAQ National Market Systems. Effective December 20, 2010, the FTSE NAREIT Equity REITs Index will not include "Timber REITs" The Index is unmanaged and its returns do not include any sales charges or fees. Such costs would lower performance. It is not possible to invest directly in an index.
(2) The Standard & Poor's 500® Index (S&P 500®) measures the performance of the large cap segment of the U.S. equities market, covering approximately 75% of the U.S. equities market. The Index includes 500 leading companies in leading industries of the U.S. economy. The Index is unmanaged and its returns do not include any sales charges or fees. Such costs would lower performance. It is not possible to invest directly in an index.
(3) The Lipper Real Estate Funds Average tracks the performance of all funds in the Lipper Real Estate Funds classification. The Average, which is adjusted for capital gains distributions and income dividends, is unmanaged and should not be considered an investment. As of the date of this report, the Portfolio is in the Lipper Real Estate Funds classification.
(4) Total returns for the Portfolio reflect fees waived and expenses reimbursed, if applicable, by the Adviser. Without such waivers and reimbursements, total returns would have been lower. The fee waivers and/or expense reimbursements will continue for one year or until such time as the Fund's Board of Directors acts to discontinue all or a portion of such waivers and/or expense reimbursements when it deems that such action is appropriate.
(5) Commenced operations on February 24, 1995.
(6) Commenced offering on January 2, 1996.
(7) Commenced offering on November 11, 2011.
(8) For comparative purposes, average annual since inception returns listed for the Indexes refer to the inception date or initial offering of the respective share class of the Portfolio, not the inception of the Index. Returns for periods less than one year are not annualized.
Portfolio Composition
| Classification | | Percentage of
Total Investments | |
| Regional Malls | | | 18.6 | % | |
| Apartments | | | 17.2 | | |
| Health Care | | | 12.1 | | |
| Lodging/Resorts | | | 10.6 | | |
| Diversified | | | 9.9 | | |
| Office | | | 9.5 | | |
| Other* | | | 8.2 | | |
| Shopping Centers | | | 7.3 | | |
| Industrial | | | 6.6 | | |
| Total Investments | | | 100.0 | % | |
* Industries representing less than 5% of total investments.
117
2011 Annual Report
December 31, 2011
Portfolio of Investments
U.S. Real Estate Portfolio
| | | Shares | | Value
(000) | |
| Common Stocks (99.6%) | |
| Apartments (17.3%) | |
Apartment Investment & Management Co.,
Class A REIT | | | 921,736 | | | $ | 21,117 | | |
| AvalonBay Communities, Inc. REIT | | | 227,526 | | | | 29,715 | | |
| BRE Properties, Inc. REIT | | | 162,280 | | | | 8,192 | | |
| Camden Property Trust REIT | | | 202,946 | | | | 12,631 | | |
| Equity Residential REIT | | | 1,461,429 | | | | 83,345 | | |
| | | | 155,000 | | |
| Commercial Financing (1.0%) | |
| CreXus Investment Corp. REIT | | | 138,210 | | | | 1,435 | | |
| Starwood Property Trust, Inc. REIT | | | 385,841 | | | | 7,142 | | |
| | | | 8,577 | | |
| Diversified (9.9%) | |
| Coresite Realty Corp. REIT | | | 108,564 | | | | 1,935 | | |
| Cousins Properties, Inc. REIT | | | 1,868,851 | | | | 11,979 | | |
| Digital Realty Trust, Inc. REIT | | | 1,210 | | | | 81 | | |
| Forest City Enterprises, Inc., Class A (a) | | | 1,773,612 | | | | 20,964 | | |
| Lexington Realty Trust REIT | | | 52,850 | | | | 396 | | |
| Vornado Realty Trust REIT | | | 654,104 | | | | 50,274 | | |
| Winthrop Realty Trust REIT | | | 362,320 | | | | 3,685 | | |
| | | | 89,314 | | |
| Health Care (12.1%) | |
| Assisted Living Concepts, Inc., Class A | | | 636,538 | | | | 9,478 | | |
| Capital Senior Living Corp. (a) | | | 160,890 | | | | 1,277 | | |
| HCP, Inc. REIT | | | 1,108,851 | | | | 45,940 | | |
| Health Care, Inc. REIT | | | 200,606 | | | | 10,939 | | |
| Healthcare Realty Trust, Inc. REIT | | | 1,146,905 | | | | 21,321 | | |
| Omega Healthcare Investors, Inc. REIT | | | 51,160 | | | | 990 | | |
| Senior Housing Properties Trust REIT | | | 822,897 | | | | 18,466 | | |
| | | | 108,411 | | |
| Industrial (6.6%) | |
| Cabot Industrial Value Fund II, LP REIT (a)(b)(c)(d) | | | 14,000 | | | | 4,920 | | |
| Cabot Industrial Value Fund III, LP REIT (a)(b)(c)(d) | | | 6,512 | | | | 3,377 | | |
| DCT Industrial Trust, Inc. REIT | | | 920,173 | | | | 4,711 | | |
| Exeter Industrial Value Fund, LP REIT (a)(b)(c)(d) | | | 7,905,000 | | | | 6,988 | | |
| KTR Industrial Fund II LP REIT (a)(b)(c)(d) | | | 8,537,500 | | | | 9,972 | | |
| Keystone Industrial Fund, LP REIT (a)(b)(c)(d) | | | 7,574,257 | | | | 7,036 | | |
| ProLogis, Inc. REIT | | | 711,416 | | | | 20,339 | | |
| STAG Industrial, Inc. REIT | | | 159,270 | | | | 1,827 | | |
| | | | 59,170 | | |
| Lodging/Resorts (10.6%) | |
| Ashford Hospitality Trust, Inc. REIT | | | 471,542 | | | | 3,772 | | |
| Host Hotels & Resorts, Inc. REIT | | | 3,953,249 | | | | 58,390 | | |
| Starwood Hotels & Resorts Worldwide, Inc. | | | 684,536 | | | | 32,837 | | |
| | | | 94,999 | | |
| Manufactured Homes (1.8%) | |
| Equity Lifestyle Properties, Inc. REIT | | | 237,372 | | | | 15,830 | | |
| Mixed Industrial/Office (0.4%) | |
| Liberty Property Trust REIT | | | 9,400 | | | | 290 | | |
| PS Business Parks, Inc. REIT | | | 67,235 | | | | 3,727 | | |
| | | | 4,017 | | |
| | | Shares | | Value
(000) | |
| Office (9.5%) | |
| BioMed Realty Trust, Inc. REIT | | | 139,765 | | | $ | 2,527 | | |
| Boston Properties, Inc. REIT | | | 401,489 | | | | 39,988 | | |
| BRCP REIT I, LP (a)(b)(c)(d) | | | 6,101,396 | | | | 1,690 | | |
| BRCP REIT II, LP (a)(b)(c)(d) | | | 8,363,574 | | | | 4,065 | | |
| Brookfield Office Properties, Inc. | | | 670,336 | | | | 10,484 | | |
| CommonWealth REIT | | | 205,613 | | | | 3,422 | | |
| Douglas Emmett, Inc. REIT | | | 101,930 | | | | 1,859 | | |
| Hudson Pacific Properties, Inc. REIT | | | 401,910 | | | | 5,691 | | |
| Mack-Cali Realty Corp. REIT | | | 546,277 | | | | 14,580 | | |
| Parkway Properties, Inc. REIT | | | 38,374 | | | | 378 | | |
| SL Green Realty Corp. REIT | | | 14,520 | | | | 968 | | |
| | | | 85,652 | | |
| Regional Malls (18.7%) | |
| General Growth Properties, Inc. REIT | | | 2,803,741 | | | | 42,112 | | |
| Simon Property Group, Inc. REIT | | | 971,983 | | | | 125,328 | | |
| | | | 167,440 | | |
| Self Storage (4.3%) | |
| Public Storage REIT | | | 264,462 | | | | 35,560 | | |
| Sovran Self Storage, Inc. REIT | | | 82,119 | | | | 3,504 | | |
| | | | 39,064 | | |
| Shopping Centers (7.3%) | |
| Acadia Realty Trust REIT | | | 338,665 | | | | 6,821 | | |
| Federal Realty Investment Trust REIT | | | 109,541 | | | | 9,941 | | |
| Kite Realty Group Trust REIT | | | 122,700 | | | | 553 | | |
| Regency Centers Corp. REIT | | | 1,019,750 | | | | 38,363 | | |
| Retail Opportunity Investments Corp. REIT | | | 841,941 | | | | 9,968 | | |
| | | | 65,646 | | |
| Timber (0.1%) | |
| Plum Creek Timber Co., Inc. REIT | | | 27,988 | | | | 1,023 | | |
| Total Common Stocks (Cost $815,928) | | | 894,143 | | |
| Short-Term Investment (0.5%) | |
| Investment Company (0.5%) | |
Morgan Stanley Institutional Liquidity
Funds — Money Market Portfolio —
Institutional Class (See Note G-2)
(Cost $4,679) | | | 4,678,958 | | | | 4,679 | | |
| Total Investments (100.1%) (Cost $820,607) | | | 898,822 | | |
| Liabilities in Excess of Other Assets (-0.1%) | | | (1,114 | ) | |
| Net Assets (100.0%) | | $ | 897,708 | | |
(a) Non-income producing security.
(b) Security has been deemed illiquid at December 31, 2011.
(c) At December 31, 2011, the Portfolio held fair valued securities valued at approximately $38,048,000, representing 4.2% of net assets. These securities have been fair valued as determined in good faith under procedures established by and under the general supervision of the Fund's Directors.
The accompanying notes are an integral part of the financial statements.
118
2011 Annual Report
December 31, 2011
Portfolio of Investments (cont'd)
U.S. Real Estate Portfolio
(d) Restricted security valued at fair value and not registered under the Securities Act of 1933. BRCP REIT I, LP was acquired between 5/03 - 5/08 and has a cost basis of approximately $1,774,000. BRCP REIT II, LP was acquired between 10/06 - 4/11 and has a current cost basis of approximately $8,364,000. Cabot Industrial Value Fund II, LP was acquired between 11/05 - 2/10 and has a current cost basis of approximately $7,000,000. Cabot Industrial Value Fund III, LP was acquired between 12/08 - 12/11 and has a current cost basis of approximately $3,256,000. Exeter Industrial Value Fund, LP was acquired between 11/07 - 4/11 and has a current cost basis of approximately $7,905,000. Keystone Industrial Fund, LP was acquired between 3/06 - 6/11 and has a current cost basis of approximately $6,097,000. KTR Industrial Fund II LP was acquired between 1/09 - 11/11 and has a current cost basis of approximately $8,538,000. At December 31, 2011, these securities had an aggregate market value of approximately $38,048,000 representing 4.2% of net assets.
REIT Real Estate Investment Trust.
Fair Value Measurement Information:
The following is a summary of the inputs used to value the Portfolio's investments as of December 31, 2011. (See Note A-9 to the financial statements for further information regarding fair value measurement.)
| Investment Type | | Level 1
Unadjusted
quoted
prices
(000) | | Level 2
Other
significant
observable
inputs
(000) | | Level 3
Significant
unobservable
inputs
(000) | | Total
(000) | |
| Assets: | | | | | | | | | |
| Common Stocks | | | | | | | | | |
| Apartments | | $ | 155,000 | | | $ | — | | | $ | — | | | $ | 155,000 | | |
| Commercial Financing | | | 8,577 | | | | — | | | | — | | | | 8,577 | | |
| Diversified | | | 89,314 | | | | — | | | | — | | | | 89,314 | | |
| Health Care | | | 108,411 | | | | — | | | | — | | | | 108,411 | | |
| Industrial | | | 26,877 | | | | — | | | | 32,293 | | | | 59,170 | | |
| Lodging/Resorts | | | 94,999 | | | | — | | | | — | | | | 94,999 | | |
| Manufactured Homes | | | 15,830 | | | | — | | | | — | | | | 15,830 | | |
| Mixed Industrial/Office | | | 4,017 | | | | — | | | | — | | | | 4,017 | | |
| Office | | | 79,897 | | | | — | | | | 5,755 | | | | 85,652 | | |
| Regional Malls | | | 167,440 | | | | — | | | | — | | | | 167,440 | | |
| Self Storage | | | 39,064 | | | | — | | | | — | | | | 39,064 | | |
| Shopping Centers | | | 65,646 | | | | — | | | | — | | | | 65,646 | | |
| Timber | | | 1,023 | | | | — | | | | — | | | | 1,023 | | |
| Total Common Stocks | | | 856,095 | | | | — | | | | 38,048 | | | | 894,143 | | |
| Short-Term Investment— | |
| Investment Company | | | 4,679 | | | | — | | | | — | | | | 4,679 | | |
| Total Assets | | $ | 860,774 | | | $ | — | | | $ | 38,048 | | | $ | 898,822 | | |
Transfers between investment levels may occur as the markets fluctuate and/or the availability of data used in an investment's valuation changes. The Portfolio recognizes transfers between the levels as of the end of the period. As of December 31, 2011, the Portfolio did not have any significant investments transfer between investment levels.
Following is a reconciliation of investments in which significant unobservable inputs (Level 3) were used in determining fair value.
| | | Common
Stocks
(000) | |
| Beginning Balance | | $ | 26,725 | | |
| Purchases | | | 9,315 | | |
| Sales | | | — | | |
| Amortization of discount | | | — | | |
| Transfers in | | | — | | |
| Transfers out | | | — | | |
| Change in unrealized appreciation (depreciation) | | | 2,008 | | |
| Realized gains (losses) | | | — | | |
| Ending Balance | | $ | 38,048 | | |
Net change in unrealized appreciation/depreciation
from investments still held as of December 31, 2011 | | $ | 2,008 | | |
The accompanying notes are an integral part of the financial statements.
119
2011 Annual Report
December 31, 2011
Investment Overview (unaudited)
Emerging Markets Debt Portfolio
The Emerging Markets Debt Portfolio (the "Portfolio") seeks high total return by investing primarily in fixed income securities of government and government-related issuers and, to a lesser extent, of corporate issuers in emerging market countries.
Performance
For the year ended December 31, 2011, the Portfolio had a total return based on net asset value and reinvestment of distributions per share of -3.66%, net of fees, for Class I shares. The Portfolio's Class I shares underperformed against its benchmark, the JP Morgan EMBI Global Bond Index/JP Morgan GBI-EM Diversified Bond Index (the "Index"), which returned -1.75%.
Factors Affecting Performance
• The first three months of 2011 were volatile, with a number of unexpected global events from political turmoil in the Middle East and Africa, to the Japan earthquake, to the precarious fiscal situation in Europe. During the period, emerging market central banks adopted divergent tightening strategies. The central banks of some countries, such as Chile and Israel, surprised the market by stepping up the pace of rate hikes; others such as Brazil and Turkey tightened regulations in lieu of rate hikes.
• In the second quarter of 2011, developed market worries began to take center stage as European officials lacked a clear resolution to Greece's sovereign-debt crisis and U.S. economic data disappointed. In addition to Greece, other peripheral Europe countries showed significant signs of stress, including Portugal, Italy and Spain. Despite this, emerging market (EM) asset classes performed well with EM external debt slightly outpacing EM local currency debt. Inflation continued to be an important concern in the emerging markets as rising food and energy prices prompted emerging market central banks to remain vigilant. Against this backdrop, many emerging market central banks resumed monetary tightening policies to combat inflationary pressures.
• Global risk sentiment further weakened in the third quarter due to increased concerns about significant economic slowing in the developed world and the European sovereign debt crisis despite signs of economic progress in the U.S. EM assets in general came under immense pressure in September as investors shed all risk assets in favor of traditional "safe havens," the U.S. dollar and U.S. Treasuries. Volatility in the emerging markets was high as the markets experienced bouts of disappointment, highlighting the need for stronger leadership and policies from the G-10 countries to lift investor confidence.
• Risk sentiment rebounded in October due to signs that U.S. recession risks were receding and improved sentiment towards steps taken by European policymakers to put Europe on the path to resolving its credit crisis. Emerging market currencies retraced some of the previous month's declines versus the U.S. dollar after September's currency sell-off had battered risky assets. November and December re-introduced market pessimism about the likelihood of a comprehensive European debt solution and the related rising downside risks to global growth. Emerging market currencies, notably those that move with the euro, fell against the U.S. dollar due to concerns about the impact of Europe's troubles on the rest of the world.
• Over the course of the year, the risk premium on the Index widened 137 basis points to 426 basis points above U.S. Treasuries. The JP Morgan EMBI Global Bond Index (which tracks the performance of U.S.-dollar denominated debt instruments issued by emerging markets) generated a total return of 8.46%. The JP Morgan GBI-EM Global Diversified Index (which tracks local currency government bonds issued by emerging markets) returned -1.75%. Index returns attributable to foreign currency exposure were -939 basis points. EM corporate debt, as measured by the JP Morgan CEMBI Broad Diversified Index, was up 2.32%.
• Underweight exposure to Indonesia detracted from relative returns. Indonesia's resilient economic growth, low government debt, and prudent fiscal management led to ratings upgrades by the big three credit rating agencies. Security selection in Brazil also hurt relative performance.
• The Portfolio benefited from overweight exposure to Chile, Colombia, Mexico, and Venezuela, as well as underweight exposure to Poland and Turkey. Chile, the world's top copper producer, benefited from supportive copper prices, while Colombia
120
2011 Annual Report
December 31, 2011
Investment Overview (unaudited) (cont'd)
Emerging Markets Debt Portfolio
benefited from economic resilience and progress fighting guerilla factions, which eased security concerns. Mexico benefited from dissipating inflationary concerns, while Venezuela benefited from supportive oil prices and a positive record of servicing debt. The Polish zloty and Turkish forint faced downward pressure from the euro-zone debt crisis as they continued to be punished for their economic ties to Western Europe.
Management Strategies
• We expect growth in the developed world to remain well below potential in 2012. Furthermore, the risk of a recession in the developed world has increased significantly, reflecting increased policy uncertainty in the U.S. and Europe. The unresolved fiscal troubles in the U.S. and in Europe, and the apparent lack of political consensus to resolve them, are likely to result in bouts of high volatility and risk aversion in the near future, while depressing growth in the next couple of quarters.
• We expect developed market central banks to continue to provide liquidity as needed, supporting commodity prices and capital inflows into EM countries, somewhat offsetting the negative impact of heightened risk aversion and sub-par growth in the developed world. We expect EM countries to show resilient, albeit lower growth in the next couple of quarters, aided by robust domestic policies and supportive terms of trade and capital inflows. Subsiding inflationary pressures and balanced growth will likely allow EM central banks to continue to adopt looser monetary policies in coming months.
• In general, sovereign risk premiums remain too high relative to the fundamental macroeconomic strength of most emerging economies. In addition, we believe there are pockets of undervaluation in certain Asian and commodity currencies.
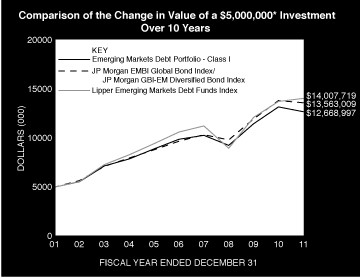
* Minimum Investment
In accordance with SEC regulations, Portfolio's performance shown assumes that all recurring fees (including management fees) were deducted and all dividends and distributions were reinvested. The performance of Class P, Class H and Class L shares will vary from the Class I shares based upon different inception dates and will be negatively impacted by additional fees assessed to that class.
Performance Compared to the JP Morgan EMBI Global Bond Index/JP Morgan GBI-EM Global Diversified Bond Index(1) and the Lipper Emerging Markets Debt Funds Index(2)
| | | Period Ended December 31, 2011 | |
| | | Total Returns(3) | |
| | | | | Average Annual | |
| | | One
Year | | Five
Years | | Ten
Years | | Since
Inception(8) | |
Portfolio — Class I Shares
w/o sales charges(4) | | | –3.66 | % | | | 5.15 | % | | | 9.74 | % | | | 9.58 | % | |
JP Morgan EMBI Global Bond
Index/JP Morgan GBI-EM
Global Diversified Bond Index | | | –1.75 | | | | 7.02 | | | | 10.49 | | | | 9.82 | | |
Lipper Emerging Markets Debt
Funds Index | | | 2.19 | | | | 5.76 | | | | 10.85 | | | | — | | |
Portfolio — Class P Shares
w/o sales charges(5) | | | –3.90 | | | | 4.86 | | | | 9.46 | | | | 9.78 | | |
JP Morgan EMBI Global
Bond Index/JP Morgan GBI-EM
Global Diversified Bond Index | | | –1.75 | | | | 7.02 | | | | 10.49 | | | | 10.81 | | |
Lipper Emerging Markets Debt
Funds Index | | | 2.19 | | | | 5.76 | | | | 10.85 | | | | 10.39 | | |
121
2011 Annual Report
December 31, 2011
Investment Overview (unaudited) (cont'd)
Emerging Markets Debt Portfolio
| | | Period Ended December 31, 2011 | |
| | | Total Returns(3) | |
| | | | | Average Annual | |
| | | One
Year | | Five
Years | | Ten
Years | | Since
Inception(8) | |
Portfolio — Class H Shares
w/o sales charges(6) | | | –3.88 | % | | | — | | | | — | | | | 5.03 | % | |
Portfolio — Class H Shares
with maximum 3.50% sales | | | –7.22 | | | | — | | | | — | | | | 4.09 | | |
| charges | | | 10.84 | | | | — | | | | — | | | | 6.89 | | |
JP Morgan EMBI Global Bond
Index/JP Morgan GBI-EM
Global Diversified Bond Index | | | –1.75 | | | | — | | | | — | | | | 6.96 | | |
Lipper Emerging Markets Debt
Funds Index | | | 2.19 | | | | — | | | | — | | | | 5.68 | | |
Portfolio — Class L Shares
w/o sales charges(7) | | | –4.34 | | | | — | | | | — | | | | 4.84 | | |
JP Morgan EMBI Global Bond
Index/JP Morgan GBI-EM
Global Diversified Bond Index | | | –1.75 | | | | — | | | | — | | | | 7.67 | | |
Lipper Emerging Markets Debt
Funds Index | | | 2.19 | | | | — | | | | — | | | | 6.69 | | |
Performance data quoted represents past performance, which is no guarantee of future results, and current performance may be lower or higher than the figures shown. Performance assumes that all dividends and distributions, if any, were reinvested. For the most recent month-end performance figures, please visit www.morganstanley.com/im. Investment return and principal value will fluctuate so that Portfolio shares, when redeemed, may be worth more or less than their original cost. Total returns do not reflect the deduction of taxes that a shareholder would pay on Portfolio distributions or the redemption of Portfolio shares. Performance of share classes will vary due to difference in expenses.
(1) JP Morgan EMBI Global Bond Index/JP Morgan GBI-EM Diversified Bond Index is a custom index represented by performance of the JP Morgan EMBI Global Bond Index (which tracks the performance U.S. dollar — denominated debt instruments issued by emerging markets) for periods from the Portfolio's inception to September 30, 2007 and the JP Morgan GBI-EM Global Diversified Bond Index (which tracks local currency government bonds issued by emerging markets) for periods thereafter. The Index is unmanaged and its returns do not include any sales charges or fees. Such costs would lower performance. It is not possible to invest directly in an index.
(2) The Lipper Emerging Markets Debt Funds Index is an equally weighted performance index of the largest qualifying funds (based on net assets) in the Lipper Emerging Markets Debt Funds classification. The Index, which is adjusted for capital gains distributions and income dividends, is unmanaged and should not be considered an investment. There are currently 10 funds represented in this Index. As of the date of this report, the Portfolio is in the Lipper Emerging Markets Debt Funds classification.
(3) Total returns for the Portfolio reflect fees waived and expenses reimbursed, if applicable, by the Adviser. Without such waivers and reimbursements, total returns would have been lower. The fee waivers and/or expense reimbursements will continue for one year or until such time as the Fund's Board of Directors acts to discontinue all or a portion of such waivers and/or expense reimbursements when it deems that such action is appropriate.
(4) Commenced operations on February 1, 1994
(5) Commenced offering on January 2, 1996
(6) Commenced offering on January 2, 2008
(7) Commenced offering on June 16, 2008
(8) For comparative purposes, average annual since inception returns listed for the Indexes refer to the inception date or initial offering of the respective share class of the Portfolio, not the inception of the Index.
Portfolio Composition*
| Classification | | Percentage of
Total Investments | |
| Sovereign | | | 85.0 | % | |
| Short-Term Investments | | | 14.7 | | |
| Other** | | | 0.3 | | |
| Total Investments | | | 100.0 | %*** | |
* Percentages indicated are based upon total investments (excluding Securities held as Collateral on Loaned Securities) as of December 31, 2011.
** Investments representing less than 5% of total investments.
*** Does not include open foreign currency exchange contracts with net unrealized depreciation of approximately $99,000.
122
2011 Annual Report
December 31, 2011
Portfolio of Investments
Emerging Markets Debt Portfolio
| | | Face
Amount
(000) | | Value
(000) | |
| Fixed Income Securities (82.4%) | |
| Brazil (11.8%) | |
| Sovereign (11.8%) | |
| Brazil Notas do Tesouro Nacional, Series F, | |
| 10.00%, 1/1/14 | | BRL | 8,141 | | | $ | 4,250 | | |
| Brazilian Government International Bond, | |
| 12.50%, 1/5/16 (a) | | | 8,925 | | | | 5,670 | | |
| | | | 9,920 | | |
| Chile (1.3%) | |
| Corporate Bond (0.3%) | |
| Banco Santander Chile, | |
| 6.50%, 9/22/20 | | CLP | 131,000 | | | | 249 | | |
| Sovereign (1.0%) | |
| Chile Government International Bond, | |
| 5.50%, 8/5/20 | | | 432,500 | | | | 872 | | |
| | | | 1,121 | | |
| Colombia (4.7%) | |
| Sovereign (4.7%) | |
| Colombia Government International Bond, | |
| 7.75%, 4/14/21 | | COP | 1,200,000 | | | | 743 | | |
| 12.00%, 10/22/15 | | | 2,051,000 | | | | 1,363 | | |
| Republic of Colombia, | |
| 9.85%, 6/28/27 | | | 2,612,000 | | | | 1,907 | | |
| | | | 4,013 | | |
| Hungary (3.6%) | |
| Sovereign (3.6%) | |
| Hungary Government Bond, | |
| 6.75%, 8/22/14 - 2/24/17 | | HUF | 805,270 | | | | 3,008 | | |
| Indonesia (6.9%) | |
| Sovereign (6.9%) | |
Barclays Bank PLC, Republic of Indonesia
Government Bond, Credit Linked Notes, | |
| 9.00%, 9/19/18 (b) | | IDR | 10,000,000 | | | | 1,294 | | |
Deutsche Bank AG, Republic of Indonesia
Government Bond, Credit Linked Notes, | |
| 11.00%, 12/15/20 (b)(c) | | | 12,000,000 | | | | 1,769 | | |
JPMorgan Chase & Co., Republic of Indonesia
Government Bond, Credit Linked Notes, | |
| 9.00%, 9/18/18 (b) | | | 1,000,000 | | | | 129 | | |
| 11.00%, 11/17/20 | | | 17,890,000 | | | | 2,638 | | |
| | | | 5,830 | | |
| Malaysia (8.2%) | |
| Sovereign (8.2%) | |
| Malaysia Government Bond, | |
| 2.51%, 8/27/12 | | MYR | 9,440 | | | $ | 2,970 | | |
| 3.21%, 5/31/13 | | | 12,425 | | | | 3,936 | | |
| | | | 6,906 | | |
| Mexico (12.6%) | |
| Sovereign (12.6%) | |
| Mexican Bonos, | |
| 7.50%, 6/3/27 | | MXN | 12,200 | | | | 906 | | |
| 8.00%, 6/11/20 | | | 101,164 | | | | 8,072 | | |
| | | Face
Amount
(000) | | Value
(000) | |
| Petroleos Mexicanos, | |
| 7.65%, 11/24/21 (b) | | | 23,000 | | | $ | 1,640 | | |
| | | | 10,618 | | |
| Peru (1.8%) | |
| Sovereign (1.8%) | |
| Peru Government Bond, | |
| 8.60%, 8/12/17 | | PEN | 1,390 | | | | 611 | | |
| Peruvian Government International Bond, | |
| 8.20%, 8/12/26 | | | 2,090 | | | | 927 | | |
| | | | 1,538 | | |
| Poland (7.7%) | |
| Sovereign (7.7%) | |
| Poland Government Bond, | |
| 5.50%, 10/25/19 | | PLN | 16,069 | | | | 4,610 | | |
| 6.25%, 10/24/15 | | | 6,200 | | | | 1,866 | | |
| | | | 6,476 | | |
| Russia (2.1%) | |
| Sovereign (2.1%) | |
| Russian Foreign Bond - Eurobond, | |
| 7.85%, 3/10/18 (b) | | RUB | 45,000 | | | | 1,425 | | |
| 7.85%, 3/10/18 | | | 10,000 | | | | 317 | | |
| | | | 1,742 | | |
| South Africa (9.9%) | |
| Sovereign (9.9%) | |
| South Africa Government Bond, | |
| 7.25%, 1/15/20 | | ZAR | 69,862 | | | | 8,333 | | |
| Thailand (2.2%) | |
| Sovereign (2.2%) | |
| Thailand Government Bond, | |
| 4.25%, 3/13/13 | | THB | 28,400 | | | | 912 | | |
| 5.25%, 7/13/13 - 5/12/14 | | | 29,403 | | | | 974 | | |
| | | | 1,886 | | |
| Turkey (7.5%) | |
| Sovereign (7.5%) | |
| Turkey Government Bond, | |
| Zero Coupon, 2/20/13 - 5/15/13 | | TRY | 6,884 | | | | 3,197 | | |
| 9.00%, 1/27/16 | | | 920 | | | | 468 | | |
| 10.00%, 6/17/15 | | | 2,640 | | | | 1,379 | | |
| 16.00%, 3/7/12 | | | 2,366 | | | | 1,262 | | |
| | | | 6,306 | | |
| Venezuela (2.1%) | |
| Sovereign (2.1%) | |
| Petroleos de Venezuela SA, | |
| 8.50%, 11/2/17 | | $ | 2,270 | | | | 1,717 | | |
| Venezuela Government International Bond, | |
| 9.25%, 9/15/27 (a) | | | 66 | | | | 48 | | |
| | | | 1,765 | | |
| Total Fixed Income Securities (Cost $74,393) | | | 69,462 | | |
The accompanying notes are an integral part of the financial statements.
123
2011 Annual Report
December 31, 2011
Portfolio of Investments (cont'd)
Emerging Markets Debt Portfolio
| | | No. of
Warrants | | Value
(000) | |
| Warrants (0.0%) | |
| Venezuela (0.0%) | |
Venezuela Government International Bond,
Oil-Linked Payment Obligation,
expires 4/15/20 (c)(d) (Cost $—) | | | 495 | | | $ | 14 | | |
| | | Shares | | | |
| Short-Term Investments (15.4%) | |
| Securities held as Collateral on Loaned Securities (1.2%) | |
| Investment Company (0.9%) | |
Morgan Stanley Institutional Liquidity
Funds — Money Market Portfolio —
Institutional Class (See Note G-2) | | | 723,603 | | | | 724 | | |
| | | Face
Amount
(000) | | | |
| Repurchase Agreements (0.3%) | |
Barclays Capital, Inc., (0.02%, dated
12/30/11, due 1/3/12; proceeds $31;
fully collateralized by a U.S. Government
Obligation; U.S. Treasury Bond 4.50%
due 5/15/38; valued at $32) | | $ | 31 | | | | 31 | | |
Merrill Lynch & Co., Inc., (0.07%, dated
12/30/11, due 1/3/12; proceeds $231;
fully collateralized by a U.S. Government
Agency; Government National Mortgage
Association 3.50% due 11/20/41; valued
at $235) | | | 231 | | | | 231 | | |
| | | | 262 | | |
Total Securities held as Collateral on Loaned
Securities (Cost $986) | | | 986 | | |
| | | Shares | | | |
| Investment Company (14.2%) | |
Morgan Stanley Institutional Liquidity
Funds — Money Market Portfolio —
Institutional Class (See Note G-2)
(Cost $11,946) | | | 11,946,233 | | | | 11,946 | | |
| Total Short-Term Investments (Cost $12,932) | | | 12,932 | | |
Total Investments (97.8%) (Cost $87,325)
Including $841 of Securities Loaned (e) | | | 82,408 | | |
| Other Assets in Excess of Liabilities (2.2%) | | | 1,853 | | |
| Net Assets (100.0%) | | $ | 84,261 | | |
(a) All or a portion of this security was on loan at December 31, 2011.
(b) 144A security — Certain conditions for public sale may exist. Unless otherwise noted, these securities are deemed to be liquid.
(c) Variable/Floating Rate Security — Interest rate changes on these instruments are based on changes in a designated base rate. The rates shown are those in effect on December 31, 2011.
(d) Security has been deemed illiquid at December 31, 2011.
(e) Securities are available for collateral in connection with open foreign currency exchange contracts.
Foreign Currency Exchange Contracts Information:
The Portfolio had the following foreign currency exchange contracts open at period end:
| Counterparty | | Currency
to
Deliver
(000) | | Value
(000) | | Settlement
Date | | In
Exchange
For
(000) | | Value
(000) | | Unrealized
Appreciation
(Depreciation)
(000) | |
| JPMorgan Chase Bank | |
| | | USD | 4,118 | | | $ | 4,118 | | | 1/17/12 | | RUB | 130,926 | | | $ | 4,062 | | | $ | (56 | ) | |
| JPMorgan Chase Bank | |
| | | USD | 144 | | | | 144 | | | 1/20/12 | | CLP | 74,761 | | | | 144 | | | | (— | @) | |
| JPMorgan Chase Bank | |
| | | USD | 1,296 | | | | 1,296 | | | 1/25/12 | | MYR | 4,120 | | | | 1,298 | | | | 2 | | |
| JPMorgan Chase Bank | |
| | | USD | 5,114 | | | | 5,114 | | | 1/27/12 | | THB | 160,200 | | | | 5,069 | | | | (45 | ) | |
| | | | | $ | 10,672 | | | | | | | | | | | $ | 10,573 | | | $ | (99 | ) | |
@ Value is less than $500.
BRL — Brazilian Real
CLP — Chilean Peso
COP — Colombian Peso
HUF — Hungarian Forint
IDR — Indonesian Rupiah
MXN — Mexican New Peso
MYR — Malaysian Ringgit
PEN — Peruvian Nuevo Sol
PLN — Polish Zloty
RUB — Russian Ruble
THB — Thai Baht
TRY — Turkish Lira
USD — United States Dollar
ZAR — South African Rand
The accompanying notes are an integral part of the financial statements.
124
2011 Annual Report
December 31, 2011
Portfolio of Investments (cont'd)
Emerging Markets Debt Portfolio
Fair Value Measurement Information:
The following is a summary of the inputs used to value the Portfolio's investments as of December 31, 2011. (See Note A-9 to the financial statements for further information regarding fair value measurement.)
| Investment Type | | Level 1
Unadjusted
quoted
prices
(000) | | Level 2
Other
significant
observable
inputs
(000) | | Level 3
Significant
unobservable
inputs
(000) | | Total
(000) | |
| Assets: | | | | | | | | | |
| Fixed Income Securities | | | | | | | | | |
| Corporate Bond | | $ | — | | | $ | 249 | | | $ | — | | | $ | 249 | | |
| Sovereign | | | — | | | | 69,213 | | | | — | | | | 69,213 | | |
Total Fixed
Income Securities | | | — | | | | 69,462 | | | | — | | | | 69,462 | | |
| Warrant | | | — | | | | 14 | | | | — | | | | 14 | | |
| Short-Term Investments | |
| Investment Company | | | 12,670 | | | | — | | | | — | | | | 12,670 | | |
| Repurchase Agreements | | | — | | | | 262 | | | | — | | | | 262 | | |
Total Short-Term
Investments | | | 12,670 | | | | 262 | | | | — | | | | 12,932 | | |
Foreign Currency Exchange
Contracts | | | — | | | | 2 | | | | — | | | | 2 | | |
| Total Assets | | | 12,670 | | | | 69,740 | | | | — | | | | 82,410 | | |
| Liabilities: | |
Foreign Currency Exchange
Contracts | | | — | | | | (101 | ) | | | — | | | | (101 | ) | |
| Total | | $ | 12,670 | | | $ | 69,639 | | | $ | — | | | $ | 82,309 | | |
Transfers between investment levels may occur as the markets fluctuate and/or the availability of data used in an investment's valuation changes. The Portfolio recognizes transfers between the levels as of the end of the period. As of December 31, 2011, the Portfolio did not have any significant investments transfer between investment levels.
The accompanying notes are an integral part of the financial statements.
125
2011 Annual Report
December 31, 2011
Statements of Assets and Liabilities
| | | Active
International
Allocation
Portfolio
(000) | | Asian Equity
Portfolio
(000) | | Emerging
Markets
Portfolio
(000) | | Global
Advantage
Portfolio
(000) | |
| Assets: | |
| Investments in Securities of Unaffiliated Issuers, at Cost | | $ | 314,111 | | | $ | 1,507 | | | $ | 1,194,533 | | | $ | 2,543 | | |
| Investments in Securities of Affiliated Issuers, at Cost | | | 53,695 | | | | 175 | | | | 139,279 | | | | 101 | | |
| Total Investments in Securities, at Cost | | | 367,806 | | | | 1,682 | | | | 1,333,812 | | | | 2,644 | | |
| Foreign Currency, at Cost | | | 5,008 | | | | — | @ | | | 9,776 | | | | — | @ | |
| Investments in Securities of Unaffiliated Issuers, at Value(1) | | | 283,477 | | | | 1,348 | | | | 1,242,950 | | | | 2,561 | | |
| Investments in Securities of Affiliated Issuers, at Value | | | 52,065 | | | | 175 | | | | 145,434 | | | | 101 | | |
| Total Investments in Securities, at Value(1) | | | 335,542 | | | | 1,523 | | | | 1,388,384 | | | | 2,662 | | |
| Cash | | | 210 | | | | — | | | | 667 | | | | — | | |
| Foreign Currency, at Value | | | 4,957 | | | | — | @ | | | 9,765 | | | | — | @ | |
| Receivable for Investments Sold | | | 5 | | | | — | @ | | | 50,656 | | | | — | | |
| Variation Margin | | | 2,151 | | | | — | | | | — | | | | — | | |
| Dividends Receivable | | | 548 | | | | — | @ | | | 675 | | | | 4 | | |
| Receivable for Portfolio Shares Sold | | | 12 | | | | — | | | | 620 | | | | — | | |
| Unrealized Appreciation on Foreign Currency Exchange Contracts | | | 333 | | | | — | | | | — | | | | — | | |
| Tax Reclaim Receivable | | | 203 | | | | — | | | | 13 | | | | 2 | | |
| Due from Adviser | | | — | | | | 46 | | | | — | | | | 43 | | |
| Receivable from Affiliate | | | 3 | | | | — | @ | | | 2 | | | | — | @ | |
| Other Assets | | | 1 | | | | 12 | | | | 24 | | | | 12 | | |
| Total Assets | | | 343,965 | | | | 1,581 | | | | 1,450,806 | | | | 2,723 | | |
| Liabilities: | |
| Collateral on Securities Loaned, at Value | | | 29,174 | | | | — | | | | 92,680 | | | | — | | |
| Payable for Portfolio Shares Redeemed | | | 811 | | | | — | | | | 105,358 | | | | — | | |
| Payable for Investment Advisory Fees | | | 499 | | | | — | | | | 4,299 | | | | — | | |
| Payable for Investments Purchased | | | — | | | | 103 | | | | 1,093 | | | | — | | |
| Payable for Sub Transfer Agency Fees | | | 286 | | | | — | | | | 751 | | | | — | | |
| Deferred Capital Gain Country Tax | | | 1 | | | | — | @ | | | 655 | | | | — | | |
| Unrealized Depreciation on Foreign Currency Exchange Contracts | | | 598 | | | | — | | | | — | | | | — | | |
| Payable for Custodian Fees | | | 45 | | | | 3 | | | | 246 | | | | 2 | | |
| Payable for Professional Fees | | | 21 | | | | 20 | | | | 63 | | | | 21 | | |
| Payable for Administration Fees | | | 22 | | | | — | @ | | | 94 | | | | — | @ | |
| Payable for Directors' Fees and Expenses | | | 20 | | | | — | | | | 84 | | | | — | | |
| Payable for Transfer Agent Fees | | | 2 | | | | 1 | | | | 3 | | | | 1 | | |
| Payable for Distribution and Shareholder Servicing Fees — Class P | | | 2 | | | | — | @ | | | 10 | | | | — | @ | |
| Payable for Distribution and Shareholder Servicing Fees — Class H | | | — | | | | — | @ | | | — | | | | — | @ | |
| Payable for Distribution and Shareholder Servicing Fees — Class L | | | — | | | | — | @ | | | — | | | | — | @ | |
| Other Liabilities | | | 49 | | | | 1 | | | | 92 | | | | 1 | | |
| Total Liabilities | | | 31,530 | | | | 128 | | | | 205,428 | | | | 25 | | |
| Net Assets | | $ | 312,435 | | | $ | 1,453 | | | $ | 1,245,378 | | | $ | 2,698 | | |
| Net Assets Consist Of: | |
| Paid-in-Capital | | $ | 414,180 | | | $ | 1,681 | | | $ | 1,215,106 | | | $ | 2,688 | | |
| Undistributed (Distributions in Excess of) Net Investment Income | | | (1,888 | ) | | | (— | @) | | | (9,486 | ) | | | (8 | ) | |
| Accumulated Net Realized Loss | | | (67,020 | ) | | | (69 | ) | | | (14,110 | ) | | | (— | @) | |
| Unrealized Appreciation (Depreciation) on: | |
| Investments | | | (30,635 | )* | | | (159 | )* | | | 47,764 | * | | | 18 | | |
| Investments in Affiliates | | | (1,630 | ) | | | — | | | | 6,155 | | | | — | | |
| Futures Contracts | | | (144 | ) | | | — | | | | — | | | | — | | |
| Foreign Currency Exchange Contracts | | | (265 | ) | | | — | | | | — | | | | — | | |
| Foreign Currency Translations | | | (163 | ) | | | (— | @) | | | (51 | ) | | | (— | @) | |
| Net Assets | | $ | 312,435 | | | $ | 1,453 | | | $ | 1,245,378 | | | $ | 2,698 | | |
The accompanying notes are an integral part of the financial statements.
126
2011 Annual Report
December 31, 2011
Statements of Assets and Liabilities (cont'd)
| | | Active
International
Allocation
Portfolio
(000) | | Asian Equity
Portfolio
(000) | | Emerging
Markets
Portfolio
(000) | | Global
Advantage
Portfolio
(000) | |
| CLASS I: | |
| Net Assets | | $ | 302,048 | | | $ | 1,201 | | | $ | 1,198,857 | | | $ | 1,603 | | |
Shares Outstanding $0.001 par value shares of beneficial interest
(500,000,000 shares authorized) (not in 000's) | | | 30,000,363 | | | | 141,781 | | | | 55,172,292 | | | | 160,769 | | |
| Net Asset Value, Offering and Redemption Price Per Share | | $ | 10.07 | | | $ | 8.47 | | | $ | 21.73 | | | $ | 9.97 | | |
| CLASS P: | |
| Net Assets | | $ | 10,387 | | | $ | 84 | | | $ | 46,521 | | | $ | 100 | | |
Shares Outstanding $0.001 par value shares of beneficial interest
(500,000,000 shares authorized) (not in 000's) | | | 1,011,858 | | | | 10,000 | | | | 2,194,560 | | | | 10,000 | | |
| Net Asset Value, Offering and Redemption Price Per Share | | $ | 10.27 | | | $ | 8.45 | | | $ | 21.20 | | | $ | 9.97 | | |
| CLASS H: | |
| Net Assets | | $ | — | | | $ | 84 | | | $ | — | | | $ | 895 | | |
Shares Outstanding $0.001 par value shares of beneficial interest
500,000,000 shares authorized) (not in 000's) | | | — | | | | 10,000 | | | | — | | | | 89,720 | | |
| Net Asset Value, Redemption Price Per Share | | $ | — | | | $ | 8.45 | | | $ | — | | | $ | 9.97 | | |
| Maximum Sales Load | | | — | | | | 4.75 | % | | | — | | | | 4.75 | % | |
| Maximum Sales Charge | | $ | — | | | $ | 0.42 | | | $ | — | | | $ | 0.50 | | |
| Maximum Offering Price Per Share | | $ | — | | | $ | 8.87 | | | $ | — | | | $ | 10.47 | | |
| CLASS L: | |
| Net Assets | | $ | — | | | $ | 84 | | | $ | — | | | $ | 100 | | |
Shares Outstanding $0.001 par value shares of beneficial interest
(500,000,000 shares authorized) (not in 000's) | | | — | | | | 10,000 | | | | — | | | | 10,000 | | |
| Net Asset Value, Offering and Redemption Price Per Share | | $ | — | | | $ | 8.40 | | | $ | — | | | $ | 9.96 | | |
(1) Including:
Securities on Loan, at Value: | | $ | 28,149 | | | $ | — | | | $ | 89,322 | | | $ | — | | |
@ Amount is less than $500.
* Net of approximately $1,000, $—@, and $655,000 Deferred Capital Gain Country Tax in Active International Allocation Portfolio, Asian Equity Portfolio, and Emerging Markets Portfolio, respectively.
The accompanying notes are an integral part of the financial statements.
127
2011 Annual Report
December 31, 2011
Statements of Assets and Liabilities
| | | Global
Discovery
Portfolio
(000) | | Global
Franchise
Portfolio
(000) | | Global Insight
Portfolio
(000) | | Global
Opportunity
Portfolio
(000) | |
| Assets: | |
| Investments in Securities of Unaffiliated Issuers, at Cost | | $ | 3,869 | | | $ | 199,287 | | | $ | 694 | | | $ | 11,245 | | |
| Investments in Securities of Affiliated Issuers, at Cost | | | 134 | | | | 7,812 | | | | 503 | | | | 288 | | |
| Total Investments in Securities, at Cost | | | 4,003 | | | | 207,099 | | | | 1,197 | | | | 11,533 | | |
| Foreign Currency, at Cost | | | — | | | | — | | | | 225 | | | | — | | |
| Investments in Securities of Unaffiliated Issuers, at Value | | | 3,611 | | | | 219,072 | | | | 700 | | | | 13,317 | | |
| Investments in Securities of Affiliated Issuers, at Value | | | 134 | | | | 7,812 | | | | 503 | | | | 288 | | |
| Total Investments in Securities, at Value | | | 3,745 | | | | 226,884 | | | | 1,203 | | | | 13,605 | | |
| Foreign Currency, at Value | | | — | | | | — | | | | 225 | | | | — | | |
| Receivable for Portfolio Shares Sold | | | — | | | | 556 | | | | — | | | | — | | |
| Dividends Receivable | | | 13 | | | | 316 | | | | — | | | | 4 | | |
| Tax Reclaim Receivable | | | 2 | | | | 196 | | | | — | | | | 1 | | |
| Due from Adviser | | | 29 | | | | — | | | | 26 | | | | 27 | | |
| Receivable for Investments Sold | | | — | | | | — | | | | 1 | | | | 7 | | |
| Receivable from Affiliate | | | — | @ | | | — | @ | | | — | @ | | | — | @ | |
| Other Assets | | | 24 | | | | 19 | | | | — | | | | 7 | | |
| Total Assets | | | 3,813 | | | | 227,971 | | | | 1,455 | | | | 13,651 | | |
| Liabilities: | |
| Payable for Investments Purchased | | | — | | | | — | | | | 593 | | | | — | @ | |
| Payable for Portfolio Shares Redeemed | | | — | | | | 457 | | | | — | | | | 3 | | |
| Payable for Investment Advisory Fees | | | — | | | | 419 | | | | — | | | | — | | |
| Payable for Professional Fees | | | 19 | | | | 17 | | | | 25 | | | | 19 | | |
| Payable for Administration Fees | | | — | @ | | | 15 | | | | — | @ | | | 1 | | |
| Payable for Custodian Fees | | | 1 | | | | 10 | | | | — | | | | 1 | | |
| Payable for Directors' Fees and Expenses | | | — | | | | 8 | | | | — | | | | 1 | | |
| Payable for Sub Transfer Agency Fees | | | — | | | | 8 | | | | — | | | | — | @ | |
| Payable for Transfer Agent Fees | | | 1 | | | | 1 | | | | 1 | | | | 4 | | |
| Payable for Distribution and Shareholder Servicing Fees — Class P | | | — | @ | | | 3 | | | | — | | | | — | @ | |
| Payable for Distribution and Shareholder Servicing Fees — Class H | | | — | @ | | | — | | | | — | @ | | | 1 | | |
| Payable for Distribution and Shareholder Servicing Fees — Class L | | | — | @ | | | — | | | | — | @ | | | — | @ | |
| Other Liabilities | | | 7 | | | | 29 | | | | — | @ | | | 10 | | |
| Total Liabilities | | | 28 | | | | 967 | | | | 619 | | | | 40 | | |
| Net Assets | | $ | 3,785 | | | $ | 227,004 | | | $ | 836 | | | $ | 13,611 | | |
| Net Assets Consist Of: | |
| Paid-in-Capital | | $ | 4,030 | | | $ | 211,872 | | | $ | 830 | | | $ | 11,686 | | |
| Distributions in Excess of Net Investment Income | | | (3 | ) | | | (— | @) | | | (— | @) | | | 1 | | |
| Accumulated Net Realized Gain (Loss) | | | 16 | | | | (4,658 | ) | | | — | | | | (148 | ) | |
| Unrealized Appreciation (Depreciation) on: | |
| Investments | | | (258 | ) | | | 19,785 | | | | 6 | | | | 2,072 | | |
| Foreign Currency Translations | | | (— | @) | | | 5 | | | | (— | @) | | | (— | @) | |
| Net Assets | | $ | 3,785 | | | $ | 227,004 | | | $ | 836 | | | $ | 13,611 | | |
The accompanying notes are an integral part of the financial statements.
128
2011 Annual Report
December 31, 2011
Statements of Assets and Liabilities (cont'd)
| | | Global
Discovery
Portfolio
(000) | | Global
Franchise
Portfolio
(000) | | Global Insight
Portfolio
(000) | | Global
Opportunity
Portfolio
(000) | |
| CLASS I: | |
| Net Assets | | $ | 2,446 | | | $ | 211,677 | | | $ | 10 | | | $ | 8,386 | | |
Shares Outstanding $0.001 par value shares of beneficial interest
(500,000,000 shares authorized) (not in 000's) | | | 269,977 | | | | 13,038,255 | | | | 1,000 | | | | 817,219 | | |
| Net Asset Value, Offering and Redemption Price Per Share | | $ | 9.06 | | | $ | 16.24 | | | $ | 10.07 | | | $ | 10.26 | | |
| CLASS P: | |
| Net Assets | | $ | 91 | | | $ | 15,327 | | | $ | — | | | $ | 10 | | |
Shares Outstanding $0.001 par value shares of beneficial interest
(500,000,000 shares authorized) (not in 000's) | | | 10,000 | | | | 957,303 | | | | — | | | | 937 | | |
| Net Asset Value, Offering and Redemption Price Per Share | | $ | 9.07 | | | $ | 16.01 | | | $ | — | | | $ | 10.21 | | |
| CLASS H: | |
| Net Assets | | $ | 1,157 | | | $ | — | | | $ | 816 | | | $ | 4,710 | | |
Shares Outstanding $0.001 par value shares of beneficial interest
500,000,000 shares authorized) (not in 000's) | | | 127,615 | | | | — | | | | 81,000 | | | | 462,623 | | |
| Net Asset Value, Redemption Price Per Share | | $ | 9.07 | | | $ | — | | | $ | 10.07 | | | $ | 10.18 | | |
| Maximum Sales Load | | | 4.75 | % | | | — | | | | 4.75 | % | | | 4.75 | % | |
| Maximum Sales Charge | | $ | 0.45 | | | $ | — | | | $ | 0.50 | | | $ | 0.51 | | |
| Maximum Offering Price Per Share | | $ | 9.52 | | | $ | — | | | $ | 10.57 | | | $ | 10.69 | | |
| CLASS L: | |
| Net Assets | | $ | 91 | | | $ | — | | | $ | 10 | | | $ | 505 | | |
Shares Outstanding $0.001 par value shares of beneficial interest
(500,000,000 shares authorized) (not in 000's) | | | 10,000 | | | | — | | | | 1,000 | | | | 49,780 | | |
| Net Asset Value, Offering and Redemption Price Per Share | | $ | 9.07 | | | $ | — | | | $ | 10.07 | | | $ | 10.15 | | |
@ Amount is less than $500.
The accompanying notes are an integral part of the financial statements.
129
2011 Annual Report
December 31, 2011
Statements of Assets and Liabilities
| | | Global Real
Estate
Portfolio
(000) | | International
Advantage
Portfolio
(000) | | International
Equity
Portfolio
(000) | | International
Opportunity
Portfolio
(000) | |
| Assets: | |
| Investments in Securities of Unaffiliated Issuers, at Cost | | $ | 1,609,865 | | | $ | 2,164 | | | $ | 3,846,095 | | | $ | 5,472 | | |
| Investments in Securities of Affiliated Issuers, at Cost | | | 45,225 | | | | — | | | | 168,991 | | | | 72 | | |
| Total Investments in Securities, at Cost | | | 1,655,090 | | | | 2,164 | | | | 4,015,086 | | | | 5,544 | | |
| Foreign Currency, at Cost | | | 7,166 | | | | — | @ | | | 1,179 | | | | — | | |
| Investments in Securities of Unaffiliated Issuers, at Value(1) | | | 1,430,755 | | | | 2,085 | | | | 3,816,597 | | | | 5,701 | | |
| Investments in Securities of Affiliated Issuers, at Value | | | 45,225 | | | | — | | | | 168,991 | | | | 72 | | |
| Total Investments in Securities, at Value(1) | | | 1,475,980 | | | | 2,085 | | | | 3,985,588 | | | | 5,773 | | |
| Foreign Currency, at Value | | | 7,059 | | | | — | @ | | | 1,184 | | | | — | | |
| Cash | | | 117 | | | | — | | | | 749 | | | | — | | |
| Dividends Receivable | | | 5,384 | | | | 1 | | | | 5,888 | | | | 3 | | |
| Receivable for Portfolio Shares Sold | | | 4,692 | | | | — | | | | 3,810 | | | | — | | |
| Tax Reclaim Receivable | | | 100 | | | | 2 | | | | 5,237 | | | | 5 | | |
| Receivable for Investments Sold | | | 1,763 | | | | 22 | | | | — | | | | — | | |
| Due from Adviser | | | — | | | | 38 | | | | — | | | | 51 | | |
| Receivable from Affiliate | | | 4 | | | | — | @ | | | 6 | | | | — | @ | |
| Other Assets | | | 11 | | | | 12 | | | | 46 | | | | 8 | | |
| Total Assets | | | 1,495,110 | | | | 2,160 | | | | 4,002,508 | | | | 5,840 | | |
| Liabilities: | |
| Collateral on Securities Loaned, at Value | | | — | | | | — | | | | 104,123 | | | | — | | |
| Payable for Portfolio Shares Redeemed | | | 6,012 | | | | — | | | | 12,800 | | | | — | | |
| Payable for Investment Advisory Fees | | | 3,059 | | | | — | | | | 7,845 | | | | — | | |
| Payable for Sub Transfer Agency Fees | | | 367 | | | | — | | | | 1,287 | | | | — | | |
| Payable for Investments Purchased | | | 1,619 | | | | — | @ | | | — | | | | — | | |
| Payable for Administration Fees | | | 98 | | | | — | @ | | | 261 | | | | — | @ | |
| Payable for Directors' Fees and Expenses | | | 13 | | | | — | | | | 216 | | | | — | @ | |
| Payable for Custodian Fees | | | 45 | | | | 1 | | | | 93 | | | | 2 | | |
| Payable for Professional Fees | | | 18 | | | | 18 | | | | 33 | | | | 23 | | |
| Payable for Transfer Agent Fees | | | 5 | | | | 1 | | | | 5 | | | | 1 | | |
| Bank Overdraft | | | — | | | | 7 | | | | — | | | | — | | |
| Payable for Distribution and Shareholder Servicing Fees — Class P | | | 28 | | | | — | @ | | | 194 | | | | — | @ | |
| Payable for Distribution and Shareholder Servicing Fees — Class L | | | 4 | | | | — | @ | | | — | | | | — | @ | |
| Payable for Distribution and Shareholder Servicing Fees — Class H | | | 2 | | | | — | @ | | | — | | | | — | @ | |
| Other Liabilities | | | 70 | | | | 1 | | | | 246 | | | | 22 | | |
| Total Liabilities | | | 11,340 | | | | 28 | | | | 127,103 | | | | 48 | | |
| Net Assets | | $ | 1,483,770 | | | $ | 2,132 | | | $ | 3,875,405 | | | $ | 5,792 | | |
| Net Assets Consist Of: | |
| Paid-in-Capital | | $ | 1,884,808 | | | $ | 2,218 | | | $ | 4,350,833 | | | $ | 5,632 | | |
| Undistributed (Distributions in Excess of) Net Investment Income | | | (5,172 | ) | | | — | | | | 667 | | | | (— | @) | |
| Accumulated Net Realized Loss | | | (216,659 | ) | | | (7 | ) | | | (446,698 | ) | | | (69 | ) | |
| Unrealized Appreciation (Depreciation) on: | |
| Investments | | | (179,110 | ) | | | (79 | ) | | | (29,498 | ) | | | 229 | | |
| Foreign Currency Translations | | | (97 | ) | | | (— | @) | | | 101 | | | | (— | @) | |
| Net Assets | | $ | 1,483,770 | | | $ | 2,132 | | | $ | 3,875,405 | | | $ | 5,792 | | |
The accompanying notes are an integral part of the financial statements.
130
2011 Annual Report
December 31, 2011
Statements of Assets and Liabilities (cont'd)
| | | Global Real
Estate
Portfolio
(000) | | International
Advantage
Portfolio
(000) | | International
Equity
Portfolio
(000) | | International
Opportunity
Portfolio
(000) | |
| CLASS I: | |
| Net Assets | | $ | 1,337,853 | | | $ | 1,255 | | | $ | 2,959,403 | | | $ | 4,822 | | |
Shares Outstanding $0.001 par value shares of beneficial interest
(500,000,000 shares authorized) (not in 000's) | | | 172,222,661 | | | | 130,120 | | | | 241,669,215 | | | | 470,000 | | |
| Net Asset Value, Offering and Redemption Price Per Share | | $ | 7.77 | | | $ | 9.65 | | | $ | 12.25 | | | $ | 10.26 | | |
| CLASS P: | |
| Net Assets | | $ | 130,244 | | | $ | 96 | | | $ | 916,002 | | | $ | 103 | | |
Shares Outstanding $0.001 par value shares of beneficial interest
(500,000,000 shares authorized) (not in 000's) | | | 16,842,829 | | | | 10,000 | | | | 75,652,051 | | | | 10,000 | | |
| Net Asset Value, Offering and Redemption Price Per Share | | $ | 7.73 | | | $ | 9.65 | | | $ | 12.11 | | | $ | 10.26 | | |
| CLASS H: | |
| Net Assets | | $ | 9,255 | | | $ | 684 | | | $ | — | | | $ | 765 | | |
Shares Outstanding $0.001 par value shares of beneficial interest
500,000,000 shares authorized) (not in 000's) | | | 1,199,459 | | | | 70,855 | | | | — | | | | 74,551 | | |
| Net Asset Value, Redemption Price Per Share | | $ | 7.72 | | | $ | 9.65 | | | $ | — | | | $ | 10.26 | | |
| Maximum Sales Load | | | 4.75 | % | | | 4.75 | % | | | — | | | | 4.75 | % | |
| Maximum Sales Charge | | $ | 0.39 | | | $ | 0.48 | | | $ | — | | | $ | 0.51 | | |
| Maximum Offering Price Per Share | | $ | 8.11 | | | $ | 10.13 | | | $ | — | | | $ | 10.77 | | |
| CLASS L: | |
| Net Assets | | $ | 6,418 | | | $ | 97 | | | $ | — | | | $ | 102 | | |
Shares Outstanding $0.001 par value shares of beneficial interest
(500,000,000 shares authorized) (not in 000's) | | | 841,173 | | | | 10,000 | | | | — | | | | 10,000 | | |
| Net Asset Value, Offering and Redemption Price Per Share | | $ | 7.63 | | | $ | 9.65 | | | $ | — | | | $ | 10.22 | | |
(1) Including:
Securities on Loan, at Value: | | $ | — | | | $ | — | | | $ | 100,073 | | | $ | — | | |
@ Amount is less than $500.
The accompanying notes are an integral part of the financial statements.
131
2011 Annual Report
December 31, 2011
Statements of Assets and Liabilities
| | | International
Real Estate
Portfolio
(000) | | International
Small Cap
Portfolio
(000) | | Select Global
Infrastructure
Portfolio
(000) | | Advantage
Portfolio
(000) | |
| Assets: | |
| Investments in Securities of Unaffiliated Issuers, at Cost | | $ | 404,077 | | | $ | 359,137 | | | $ | 11,025 | | | $ | 6,888 | | |
| Investments in Securities of Affiliated Issuers, at Cost | | | 83 | | | | 9,221 | | | | 361 | | | | 386 | | |
| Total Investments in Securities, at Cost | | | 404,160 | | | | 368,358 | | | | 11,386 | | | | 7,274 | | |
| Foreign Currency, at Cost | | | 10 | | | | 312 | | | | 4 | | | | — | | |
| Investments in Securities of Unaffiliated Issuers, at Value | | | 210,565 | | | | 289,635 | | | | 12,492 | | | | 8,042 | | |
| Investments in Securities of Affiliated Issuers, at Value | | | 83 | | | | 9,221 | | | | 361 | | | | 386 | | |
| Total Investments in Securities, at Value | | | 210,648 | | | | 298,856 | | | | 12,853 | | | | 8,428 | | |
| Foreign Currency, at Value | | | 6 | | | | 311 | | | | 4 | | | | — | | |
| Dividends Receivable | | | 967 | | | | 450 | | | | 57 | | | | 13 | | |
| Tax Reclaim Receivable | | | 67 | | | | 861 | | | | 1 | | | | 1 | | |
| Receivable for Investments Sold | | | 162 | | | | 174 | | | | — | | | | — | | |
| Receivable for Portfolio Shares Sold | | | 59 | | | | 169 | | | | — | | | | — | | |
| Due from Adviser | | | — | | | | — | | | | 44 | | | | 20 | | |
| Receivable from Affiliate | | | — | @ | | | 1 | | | | — | @ | | | — | @ | |
| Other Assets | | | 8 | | | | 6 | | | | 8 | | | | 14 | | |
| Total Assets | | | 211,917 | | | | 300,828 | | | | 12,967 | | | | 8,476 | | |
| Liabilities: | |
| Payable for Investments Purchased | | | 20 | | | | 2,751 | | | | — | | | | — | | |
| Payable for Investment Advisory Fees | | | 483 | | | | 685 | | | | — | | | | — | | |
| Payable for Portfolio Shares Redeemed | | | 206 | | | | 935 | | | | — | | | | — | | |
| Payable for Sub Transfer Agency Fees | | | 27 | | | | 130 | | | | — | | | | — | @ | |
| Payable for Professional Fees | | | 18 | | | | 20 | | | | 17 | | | | 16 | | |
| Payable for Custodian Fees | | | 23 | | | | 32 | | | | 7 | | | | 1 | | |
| Unrealized Depreciation on Foreign Currency Exchange Contracts | | | — | | | | 38 | | | | — | | | | — | | |
| Payable for Administration Fees | | | 15 | | | | 20 | | | | 1 | | | | 1 | | |
| Payable for Directors' Fees and Expenses | | | 7 | | | | 19 | | | | — | | | | 1 | | |
| Payable for Transfer Agent Fees | | | 2 | | | | 2 | | | | 1 | | | | 1 | | |
| Payable for Distribution and Shareholder Servicing Fees — Class P | | | 1 | | | | 17 | | | | — | @ | | | — | @ | |
| Payable for Distribution and Shareholder Servicing Fees — Class H | | | — | | | | — | | | | — | @ | | | — | @ | |
| Payable for Distribution and Shareholder Servicing Fees — Class L | | | — | | | | — | | | | — | @ | | | — | @ | |
| Other Liabilities | | | 20 | | | | 26 | | | | 7 | | | | 2 | | |
| Total Liabilities | | | 822 | | | | 4,675 | | | | 33 | | | | 22 | | |
| Net Assets | | $ | 211,095 | | | $ | 296,153 | | | $ | 12,934 | | | $ | 8,454 | | |
| Net Assets Consist Of: | |
| Paid-in-Capital | | $ | 881,830 | | | $ | 440,183 | | | $ | 11,442 | | | $ | 7,371 | | |
| Undistributed (Distributions in Excess of) Net Investment Income | | | 4,965 | | | | 2,489 | | | | (— | @) | | | (22 | ) | |
| Accumulated Net Realized Gain (Loss) | | | (482,188 | ) | | | (77,154 | ) | | | 25 | | | | (49 | ) | |
| Unrealized Appreciation (Depreciation) on: | |
| Investments | | | (193,512 | ) | | | (69,502 | ) | | | 1,467 | | | | 1,154 | | |
| Foreign Currency Exchange Contracts | | | — | | | | (38 | ) | | | — | | | | — | | |
| Foreign Currency Translations | | | (— | @) | | | 175 | | | | (— | @) | | | (— | @) | |
| Net Assets | | $ | 211,095 | | | $ | 296,153 | | | $ | 12,934 | | | $ | 8,454 | | |
The accompanying notes are an integral part of the financial statements.
132
2011 Annual Report
December 31, 2011
Statements of Assets and Liabilities (cont'd)
| | | International
Real Estate
Portfolio
(000) | | International
Small Cap
Portfolio
(000) | | Select Global
Infrastructure
Portfolio
(000) | | Advantage
Portfolio
(000) | |
| CLASS I: | |
| Net Assets | | $ | 207,695 | | | $ | 213,983 | | | $ | 12,589 | | | $ | 7,239 | | |
Shares Outstanding $0.001 par value shares of beneficial interest
(500,000,000 shares authorized) (not in 000's) | | | 14,168,840 | | | | 18,991,278 | | | | 1,094,867 | | | | 636,315 | | |
| Net Asset Value, Offering and Redemption Price Per Share | | $ | 14.66 | | | $ | 11.27 | | | $ | 11.50 | | | $ | 11.38 | | |
| CLASS P: | |
| Net Assets | | $ | 3,400 | | | $ | 82,170 | | | $ | 115 | | | $ | 11 | | |
Shares Outstanding $0.001 par value shares of beneficial interest
(500,000,000 shares authorized) (not in 000's) | | | 232,037 | | | | 7,340,375 | | | | 10,000 | | | | 967 | | |
| Net Asset Value, Offering and Redemption Price Per Share | | $ | 14.65 | | | $ | 11.19 | | | $ | 11.50 | | | $ | 11.37 | | |
| CLASS H: | |
| Net Assets | | $ | — | | | $ | — | | | $ | 115 | | | $ | 996 | | |
Shares Outstanding $0.001 par value shares of beneficial interest
500,000,000 shares authorized) (not in 000's) | | | — | | | | — | | | | 10,000 | | | | 87,674 | | |
| Net Asset Value, Redemption Price Per Share | | $ | — | | | $ | — | | | $ | 11.50 | | | $ | 11.37 | | |
| Maximum Sales Load | | | — | | | | — | | | | 4.75 | % | | | 4.75 | % | |
| Maximum Sales Charge | | $ | — | | | $ | — | | | $ | 0.57 | | | $ | 0.57 | | |
| Maximum Offering Price Per Share | | $ | — | | | $ | — | | | $ | 12.07 | | | $ | 11.94 | | |
| CLASS L: | |
| Net Assets | | $ | — | | | $ | — | | | $ | 115 | | | $ | 208 | | |
Shares Outstanding $0.001 par value shares of beneficial interest
(500,000,000 shares authorized) (not in 000's) | | | — | | | | — | | | | 10,000 | | | | 18,234 | | |
| Net Asset Value, Offering and Redemption Price Per Share | | $ | — | | | $ | — | | | $ | 11.50 | | | $ | 11.39 | | |
@ Amount is less than $500.
The accompanying notes are an integral part of the financial statements.
133
2011 Annual Report
December 31, 2011
Statements of Assets and Liabilities
| | | Focus Growth
Portfolio
(000) | | Growth
Portfolio
(000) | | Insight
Portfolio
(000) | | Opportunity
Portfolio
(000) | |
| Assets: | |
| Investments in Securities of Unaffiliated Issuers, at Cost | | $ | 22,352 | | | $ | 625,784 | | | $ | 657 | | | $ | 208,176 | | |
| Investments in Securities of Affiliated Issuers, at Cost | | | 1,727 | | | | 14,976 | | | | 830 | | | | 1,625 | | |
| Total Investments in Securities, at Cost | | | 24,079 | | | | 640,760 | | | | 1,487 | | | | 209,801 | | |
| Investments in Securities of Unaffiliated Issuers, at Value | | | 22,287 | | | | 763,818 | | | | 662 | | | | 244,568 | | |
| Investments in Securities of Affiliated Issuers, at Value | | | 1,727 | | | | 15,010 | | | | 830 | | | | 1,625 | | |
| Total Investments in Securities, at Value | | | 24,014 | | | | 778,828 | | | | 1,492 | | | | 246,193 | | |
| Receivable for Investments Sold | | | — | | | | — | | | | — | | | | 2,956 | | |
| Receivable for Portfolio Shares Sold | | | — | @ | | | 767 | | | | — | | | | 77 | | |
| Dividends Receivable | | | 15 | | | | 414 | | | | — | | | | 74 | | |
| Tax Reclaim Receivable | | | 1 | | | | 220 | | | | — | | | | — | | |
| Due from Adviser | | | — | | | | — | | | | 26 | | | | — | | |
| Receivable from Affiliate | | | — | @ | | | 1 | | | | — | @ | | | — | @ | |
| Other Assets | | | — | @ | | | 14 | | | | — | | | | 7 | | |
| Total Assets | | | 24,030 | | | | 780,244 | | | | 1,518 | | | | 249,307 | | |
| Liabilities: | |
| Payable for Portfolio Shares Redeemed | | | 4 | | | | 20,325 | | | | — | | | | 159 | | |
| Payable for Investments Purchased | | | 11 | | | | 259 | | | | 657 | | | | 4,589 | | |
| Payable for Investment Advisory Fees | | | 14 | | | | 1,008 | | | | — | | | | 189 | | |
| Payable for Sub Transfer Agency Fees | | | 2 | | | | 486 | | | | — | | | | 138 | | |
| Payable for Professional Fees | | | 19 | | | | 23 | | | | 25 | | | | 22 | | |
| Payable for Administration Fees | | | 2 | | | | 53 | | | | — | @ | | | 17 | | |
| Payable for Transfer Agent Fees | | | 1 | | | | 1 | | | | 1 | | | | 52 | | |
| Payable for Directors' Fees and Expenses | | | 6 | | | | 47 | | | | — | | | | 2 | | |
| Payable for Custodian Fees | | | 3 | | | | 9 | | | | — | @ | | | 8 | | |
| Payable for Distribution and Shareholder Servicing Fees — Class P | | | — | @ | | | 29 | | | | — | | | | — | @ | |
| Payable for Distribution and Shareholder Servicing Fees — Class H | | | — | | | | — | | | | — | @ | | | 39 | | |
| Payable for Distribution and Shareholder Servicing Fees — Class L | | | — | | | | — | | | | — | @ | | | 19 | | |
| Other Liabilities | | | 3 | | | | 34 | | | | — | @ | | | 23 | | |
| Total Liabilities | | | 65 | | | | 22,274 | | | | 683 | | | | 5,257 | | |
| Net Assets | | $ | 23,965 | | | $ | 757,970 | | | $ | 835 | | | $ | 244,050 | | |
| Net Assets Consist Of: | |
| Paid-in-Capital | | $ | 24,316 | | | $ | 712,038 | | | $ | 830 | | | $ | 218,709 | | |
| Undistributed (Distributions in Excess of) Net Investment Income | | | 2 | | | | 24 | | | | — | | | | (13 | ) | |
| Accumulated Net Realized Gain (Loss) | | | (288 | ) | | | (92,160 | ) | | | — | | | | (11,037 | ) | |
| Unrealized Appreciation (Depreciation) on: | |
| Investments | | | (65 | ) | | | 138,034 | | | | 5 | | | | 36,392 | | |
| Investments in Affiliates | | | — | | | | 34 | | | | — | | | | — | | |
| Foreign Currency Translations | | | (— | @) | | | — | @ | | | — | | | | (1 | ) | |
| Net Assets | | $ | 23,965 | | | $ | 757,970 | | | $ | 835 | | | $ | 244,050 | | |
The accompanying notes are an integral part of the financial statements.
134
2011 Annual Report
December 31, 2011
Statements of Assets and Liabilities (cont'd)
| | | Focus Growth
Portfolio
(000) | | Growth
Portfolio
(000) | | Insight
Portfolio
(000) | | Opportunity
Portfolio
(000) | |
| CLASS I: | |
| Net Assets | | $ | 22,377 | | | $ | 622,193 | | | $ | 10 | | | $ | 13,183 | | |
Shares Outstanding $0.001 par value shares of beneficial interest
(500,000,000 shares authorized) (not in 000's) | | | 1,232,994 | | | | 26,520,577 | | | | 1,000 | | | | 869,590 | | |
| Net Asset Value, Offering and Redemption Price Per Share | | $ | 18.15 | | | $ | 23.46 | | | $ | 10.06 | | | $ | 15.16 | | |
| CLASS P: | |
| Net Assets | | $ | 1,588 | | | $ | 135,777 | | | $ | — | | | $ | 2,098 | | |
Shares Outstanding $0.001 par value shares of beneficial interest
(500,000,000 shares authorized) (not in 000's) | | | 90,406 | | | | 5,895,774 | | | | — | | | | 139,109 | | |
| Net Asset Value, Offering and Redemption Price Per Share | | $ | 17.57 | | | $ | 23.03 | | | $ | — | | | $ | 15.08 | | |
| CLASS H: | |
| Net Assets | | $ | — | | | $ | — | | | $ | 815 | | | $ | 198,010 | | |
Shares Outstanding $0.001 par value shares of beneficial interest
500,000,000 shares authorized) (not in 000's) | | | — | | | | — | | | | 81,000 | | | | 13,277,867 | | |
| Net Asset Value, Redemption Price Per Share | | $ | — | | | $ | — | | | $ | 10.06 | | | $ | 14.91 | | |
| Maximum Sales Load | | | — | | | | — | | | | 4.75 | % | | | 4.75 | % | |
| Maximum Sales Charge | | $ | — | | | $ | — | | | $ | 0.50 | | | $ | 0.74 | | |
| Maximum Offering Price Per Share | | $ | — | | | $ | — | | | $ | 10.56 | | | $ | 15.65 | | |
| CLASS L: | |
| Net Assets | | $ | — | | | $ | — | | | $ | 10 | | | $ | 30,759 | | |
Shares Outstanding $0.001 par value shares of beneficial interest
(500,000,000 shares authorized) (not in 000's) | | | — | | | | — | | | | 1,000 | | | | 2,266,710 | | |
| Net Asset Value, Offering and Redemption Price Per Share | | $ | — | | | $ | — | | | $ | 10.06 | | | $ | 13.57 | | |
@ Amount is less than $500.
The accompanying notes are an integral part of the financial statements.
135
2011 Annual Report
December 31, 2011
Statements of Assets and Liabilities
| | | Small
Company
Growth
Portfolio
(000) | | U.S. Real
Estate
Portfolio
(000) | | Emerging
Markets Debt
Portfolio
(000) | |
| Assets: | |
| Investments in Securities of Unaffiliated Issuers, at Cost | | $ | 1,176,083 | | | $ | 815,928 | | | $ | 74,655 | | |
| Investments in Securities of Affiliated Issuers, at Cost | | | 31,544 | | | | 4,679 | | | | 12,670 | | |
| Total Investments in Securities, at Cost | | | 1,207,627 | | | | 820,607 | | | | 87,325 | | |
| Foreign Currency, at Cost | | | — | | | | — | | | | 628 | | |
| Investments in Securities of Unaffiliated Issuers, at Value(1) | | | 1,369,824 | | | | 894,143 | | | | 69,738 | | |
| Investments in Securities of Affiliated Issuers, at Value | | | 31,544 | | | | 4,679 | | | | 12,670 | | |
| Total Investments in Securities, at Value(1) | | | 1,401,368 | | | | 898,822 | | | | 82,408 | | |
| Foreign Currency, at Value | | | — | | | | — | | | | 595 | | |
| Cash | | | — | | | | 197 | | | | 7 | | |
| Receivable for Investments Sold | | | 6 | | | | 10,427 | | | | — | | |
| Dividends Receivable | | | 695 | | | | 2,594 | | | | — | | |
| Receivable for Portfolio Shares Sold | | | 854 | | | | 788 | | | | 1,226 | | |
| Interest Receivable | | | — | | | | — | | | | 1,625 | | |
| Receivable from Affiliate | | | 2 | | | | — | @ | | | 1 | | |
| Unrealized Appreciation on Foreign Currency Exchange Contracts | | | — | | | | — | | | | 2 | | |
| Other Assets | | | 23 | | | | 21 | | | | 8 | | |
| Total Assets | | | 1,402,948 | | | | 912,849 | | | | 85,872 | | |
| Liabilities: | |
| Collateral on Securities Loaned, at Value | | | — | | | | — | | | | 993 | | |
| Payable for Portfolio Shares Redeemed | | | 7,905 | | | | 11,470 | | | | 358 | | |
| Payable for Investment Advisory Fees | | | 2,936 | | | | 1,559 | | | | 86 | | |
| Payable for Sub Transfer Agency Fees | | | 668 | | | | 562 | | | | 9 | | |
| Payable for Investments Purchased | | | — | | | | 1,200 | | | | — | | |
| Payable for Administration Fees | | | 95 | | | | 60 | | | | 6 | | |
| Unrealized Depreciation on Foreign Currency Exchange Contracts | | | — | | | | — | | | | 101 | | |
| Payable for Professional Fees | | | 16 | | | | 28 | | | | 28 | | |
| Payable for Directors' Fees and Expenses | | | 32 | | | | 31 | | | | 6 | | |
| Payable for Custodian Fees | | | 16 | | | | 8 | | | | 10 | | |
| Payable for Transfer Agent Fees | | | — | @ | | | 23 | | | | 1 | | |
| Payable for Distribution and Shareholder Servicing Fees — Class P | | | 61 | | | | 19 | | | | 1 | | |
| Payable for Distribution and Shareholder Servicing Fees — Class H | | | 7 | | | | 6 | | | | 1 | | |
| Payable for Distribution and Shareholder Servicing Fees — Class L | | | 1 | | | | 4 | | | | 3 | | |
| Payable for Reorganization Expense | | | 71 | | | | 74 | | | | — | | |
| Other Liabilities | | | 97 | | | | 97 | | | | 8 | | |
| Total Liabilities | | | 11,905 | | | | 15,141 | | | | 1,611 | | |
| Net Assets | | $ | 1,391,043 | | | $ | 897,708 | | | $ | 84,261 | | |
| Net Assets Consist Of: | |
| Paid-in-Capital | | $ | 1,201,953 | | | $ | 825,730 | | | $ | 90,155 | | |
| Undistributed (Distributions in Excess of) Net Investment Income | | | (832 | ) | | | 1,239 | | | | (9 | ) | |
| Accumulated Net Realized Loss | | | (3,819 | ) | | | (7,476 | ) | | | (754 | ) | |
| Unrealized Appreciation (Depreciation) on: | |
| Investments | | | 193,741 | | | | 78,215 | | | | (4,917 | ) | |
| Foreign Currency Exchange Contracts | | | — | | | | — | | | | (99 | ) | |
| Foreign Currency Translations | | | (— | @) | | | — | | | | (115 | ) | |
| Net Assets | | $ | 1,391,043 | | | $ | 897,708 | | | $ | 84,261 | | |
The accompanying notes are an integral part of the financial statements.
136
2011 Annual Report
December 31, 2011
Statements of Assets and Liabilities (cont'd)
| | | Small
Company
Growth
Portfolio
(000) | | U.S. Real
Estate
Portfolio
(000) | | Emerging
Markets Debt
Portfolio
(000) | |
| CLASS I: | |
| Net Assets | | $ | 1,074,392 | | | $ | 773,138 | | | $ | 69,557 | | |
Shares Outstanding $0.001 par value shares of beneficial interest (500,000,000 shares authorized)
(not in 000's) | | | 84,996,018 | | | | 51,585,058 | | | | 6,191,763 | | |
| Net Asset Value, Offering and Redemption Price Per Share | | $ | 12.64 | | | $ | 14.99 | | | $ | 11.23 | | |
| CLASS P: | |
| Net Assets | | $ | 282,988 | | | $ | 92,047 | | | $ | 6,784 | | |
Shares Outstanding $0.001 par value shares of beneficial interest (500,000,000 shares authorized)
(not in 000's) | | | 23,989,389 | | | | 6,259,573 | | | | 587,893 | | |
| Net Asset Value, Offering and Redemption Price Per Share | | $ | 11.80 | | | $ | 14.70 | | | $ | 11.54 | | |
| CLASS H: | |
| Net Assets | | $ | 32,006 | | | $ | 26,644 | | | $ | 2,955 | | |
Shares Outstanding $0.001 par value shares of beneficial interest 500,000,000 shares authorized)
(not in 000's) | | | 2,712,708 | | | | 1,812,119 | | | | 256,052 | | |
| Net Asset Value, Redemption Price Per Share | | $ | 11.80 | | | $ | 14.70 | | | $ | 11.54 | | |
| Maximum Sales Load | | | 4.75 | % | | | 4.75 | % | | | 3.50 | % | |
| Maximum Sales Charge | | $ | 0.59 | | | $ | 0.73 | | | $ | 0.42 | | |
| Maximum Offering Price Per Share | | $ | 12.39 | | | $ | 15.43 | | | $ | 11.96 | | |
| CLASS L: | |
| Net Assets | | $ | 1,657 | | | $ | 5,879 | | | $ | 4,965 | | |
Shares Outstanding $0.001 par value shares of beneficial interest (500,000,000 shares authorized)
(not in 000's) | | | 140,550 | | | | 400,121 | | | | 438,257 | | |
| Net Asset Value, Offering and Redemption Price Per Share | | $ | 11.79 | | | $ | 14.69 | | | $ | 11.33 | | |
(1) Including:
Securities on Loan, at Value: | | $ | — | | | $ | — | | | $ | 841 | | |
@ Amount is less than $500.
The accompanying notes are an integral part of the financial statements.
137
2011 Annual Report
December 31, 2011
Statements of Operations
| | | Active
International
Allocation
Portfolio
(000) | | Asian Equity
Portfolio
(000) | | Emerging
Markets
Portfolio
(000) | | Global
Advantage
Portfolio
(000) | | Global
Discovery
Portfolio
(000) | |
| Investment Income: | |
| Dividends from Securities of Unaffiliated Issuers | | $ | 13,415 | | | $ | 24 | | | $ | 44,154 | | | $ | 43 | | | $ | 82 | | |
| Income from Securities Loaned — Net | | | 540 | | | | — | | | | 372 | | | | — | | | | — | | |
| Dividends from Securities of Affiliated Issuers | | | 60 | | | | — | @ | | | 48 | | | | — | @ | | | — | @ | |
| Interest from Securities of Unaffiliated Issuers | | | 10 | | | | — | @ | | | 3 | | | | — | | | | — | | |
| Less: Foreign Taxes Withheld | | | (1,164 | )* | | | (3 | ) | | | (4,376 | ) | | | (3 | ) | | | (7 | ) | |
| Total Investment Income | | | 12,861 | | | | 21 | | | | 40,201 | | | | 40 | | | | 75 | | |
| Expenses: | |
| Investment Advisory Fees (Note B) | | | 2,635 | | | | 14 | | | | 20,512 | | | | 19 | | | | 25 | | |
| Custodian Fees (Note F) | | | 283 | | | | 19 | | | | 1,522 | | | | 10 | | | | 11 | | |
| Sub Transfer Agency Fees | | | 271 | | | | — | | | | 1,522 | | | | — | | | | — | | |
| Administration Fees (Note C) | | | 324 | | | | 1 | | | | 1,375 | | | | 2 | | | | 2 | | |
| Professional Fees | | | 75 | | | | 66 | | | | 133 | | | | 62 | | | | 60 | | |
| Shareholder Reporting Fees | | | 82 | | | | 15 | | | | 191 | | | | 8 | | | | 10 | | |
| Registration Fees | | | 40 | | | | 28 | | | | 50 | | | | 27 | | | | 17 | | |
| Pricing Fees | | | 64 | | | | 7 | | | | 16 | | | | 6 | | | | 5 | | |
| Transfer Agency Fees (Note E) | | | 19 | | | | 12 | | | | 31 | | | | 13 | | | | 13 | | |
| Directors' Fees and Expenses | | | 14 | | | | — | @ | | | 55 | | | | — | @ | | | — | @ | |
| Distribution and Shareholder Servicing Fees — Class P (Note D) | | | 34 | | | | — | @ | | | 202 | | | | — | @ | | | — | @ | |
| Distribution and Shareholder Servicing Fees — Class H (Note D) | | | — | | | | — | @ | | | — | | | | 2 | | | | 3 | | |
| Distribution and Shareholder Servicing Fees — Class L (Note D) | | | — | | | | 1 | | | | — | | | | 1 | | | | 1 | | |
| Other Expenses | | | 24 | | | | 11 | | | | 130 | | | | 11 | | | | 8 | | |
| Total Expenses | | | 3,865 | | | | 174 | | | | 25,739 | | | | 161 | | | | 155 | | |
| Waiver of Investment Advisory Fees (Note B) | | | (407 | ) | | | (14 | ) | | | — | | | | (19 | ) | | | (25 | ) | |
| Expenses Reimbursed by Advisor (Note B) | | | — | | | | (138 | ) | | | — | | | | (111 | ) | | | (90 | ) | |
| Rebate from Morgan Stanley Affiliate (Note G-2) | | | (26 | ) | | | (— | @) | | | (225 | ) | | | (— | @) | | | (— | @) | |
| Net Expenses | | | 3,432 | | | | 22 | | | | 25,514 | | | | 31 | | | | 40 | | |
| Net Investment Income (Loss) | | | 9,429 | | | | (1 | ) | | | 14,687 | | | | 9 | | | | 35 | | |
| Realized Gain (Loss): | |
| Investments Sold | | | 30,565 | ** | | | (69 | ) | | | 105,110 | ** | | | — | @ | | | 18 | | |
| Investments in Affiliates | | | (81 | ) | | | — | | | | 5,322 | | | | — | | | | — | | |
| Foreign Currency Exchange Contracts | | | (2,377 | ) | | | — | | | | (4,951 | ) | | | — | | | | 12 | | |
| Foreign Currency Transactions | | | (814 | ) | | | (1 | ) | | | (3,286 | ) | | | (1 | ) | | | (4 | ) | |
| Futures Contracts | | | (6,806 | ) | | | — | | | | — | | | | — | | | | — | | |
| Net Realized Gain (Loss) | | | 20,487 | | | | (70 | ) | | | 102,195 | | | | (1 | ) | | | 26 | | |
| Change in Unrealized Appreciation (Depreciation): | |
| Investments | | | (88,128 | )*** | | | (190 | )*** | | | (443,008 | )*** | | | 16 | | | | (256 | ) | |
| Investments in Affiliates | | | (199 | ) | | | — | | | | (12,879 | ) | | | — | | | | — | | |
| Foreign Currency Exchange Contracts | | | (47 | ) | | | — | | | | — | | | | — | | | | — | | |
| Foreign Currency Translations | | | (316 | ) | | | — | @ | | | (63 | ) | | | 1 | | | | 1 | | |
| Futures Contracts | | | (232 | ) | | | — | | | | — | | | | — | | | | — | | |
| Net Change in Unrealized Appreciation (Depreciation) | | | (88,922 | ) | | | (190 | ) | | | (455,950 | ) | | | 17 | | | | (255 | ) | |
Total Net Realized Gain (Loss) and Change in Unrealized
Appreciation (Depreciation) | | | (68,435 | ) | | | (260 | ) | | | (353,755 | ) | | | 16 | | | | (229 | ) | |
| Net Increase (Decrease) in Net Assets Resulting from Operations | | $ | (59,006 | ) | | $ | (261 | ) | | $ | (339,068 | ) | | $ | 25 | | | $ | (194 | ) | |
* Including Foreign Taxes Withheld from Securities of Affiliated Issuers of approximately $3,000 for Active International Allocation Portfolio.
** Net of Capital Gain Country Tax of approximately $6,000 and $1,732,000 for Active International Allocation Portfolio and Emerging Markets Portfolio, respectively.
*** Net of Increase (Decrease) in Deferred Capital Gain Country Tax Accrual of approximately $1,000, $—@, and $(3,070,000) for Active International Allocation Portfolio, Asian Equity Portfolio, and Emerging Markets Portfolio, respectively.
@ Amount is less than $500.
The accompanying notes are an integral part of the financial statements.
138
2011 Annual Report
December 31, 2011
Statements of Operations
| | | Global
Franchise
Portfolio
(000) | | Global
Insight*
Portfolio
(000) | | Global
Opportunity
Portfolio
(000) | | Global Real
Estate
Portfolio
(000) | | International
Advantage
Portfolio
(000) | |
| Investment Income: | |
| Dividends from Securities of Unaffiliated Issuers | | $ | 5,216 | | | $ | — | | | $ | 174 | | | $ | 41,914 | | | $ | 55 | | |
| Dividends from Securities of Affiliated Issuers | | | 2 | | | | — | @ | | | — | @ | | | 63 | | | | — | @ | |
| Interest from Securities of Unaffiliated Issuers | | | — | | | | — | | | | 5 | | | | 10 | | | | — | | |
| Less: Foreign Taxes Withheld | | | (172 | ) | | | — | | | | (7 | ) | | | (2,001 | ) | | | (4 | ) | |
| Total Investment Income | | | 5,046 | | | | — | @ | | | 172 | | | | 39,986 | | | | 51 | | |
| Expenses: | |
| Investment Advisory Fees (Note B) | | | 1,408 | | | | — | @ | | | 112 | | | | 12,782 | | | | 19 | | |
| Administration Fees (Note C) | | | 141 | | | | — | @ | | | 10 | | | | 1,203 | | | | 2 | | |
| Sub Transfer Agency Fees | | | 9 | | | | — | | | | 2 | | | | 811 | | | | — | | |
| Custodian Fees (Note F) | | | 49 | | | | — | @ | | | 18 | | | | 275 | | | | 7 | | |
| Professional Fees | | | 63 | | | | 25 | | | | 55 | | | | 74 | | | | 58 | | |
| Shareholder Reporting Fees | | | 11 | | | | — | @ | | | 8 | | | | 205 | | | | 10 | | |
| Registration Fees | | | 51 | | | | — | | | | 47 | | | | 109 | | | | 27 | | |
| Transfer Agency Fees (Note E) | | | 21 | | | | 1 | | | | 34 | | | | 56 | | | | 12 | | |
| Offering Costs | | | — | | | | — | | | | 52 | | | | — | | | | — | | |
| Directors' Fees and Expenses | | | 5 | | | | — | | | | 1 | | | | 44 | | | | — | @ | |
| Pricing Fees | | | 5 | | | | — | @ | | | 4 | | | | 14 | | | | 6 | | |
| Distribution and Shareholder Servicing Fees — Class P (Note D) | | | 33 | | | | — | | | | — | @ | | | 277 | | | | — | @ | |
| Distribution and Shareholder Servicing Fees — Class H (Note D) | | | — | | | | — | @ | | | 14 | | | | 28 | | | | 2 | | |
| Distribution and Shareholder Servicing Fees — Class L (Note D) | | | — | | | | — | @ | | | 4 | | | | 54 | | | | 1 | | |
| Other Expenses | | | 13 | | | | — | | | | 20 | | | | 46 | | | | 10 | | |
| Total Expenses | | | 1,809 | | | | 26 | | | | 381 | | | | 15,978 | | | | 154 | | |
| Waiver of Investment Advisory Fees (Note B) | | | (16 | ) | | | (— | @) | | | (112 | ) | | | (2 | ) | | | (19 | ) | |
| Distribution Fees- Class L Shares Waived (Note D) | | | — | | | | — | | | | (3 | ) | | | — | | | | — | | |
| Expenses Reimbursed by Advisor (Note B) | | | — | | | | (26 | ) | | | (96 | ) | | | — | | | | (107 | ) | |
| Rebate from Morgan Stanley Affiliate (Note G-2) | | | (9 | ) | | | — | | | | (— | @) | | | (58 | ) | | | (— | @) | |
| Net Expenses | | | 1,784 | | | | — | @ | | | 170 | | | | 15,918 | | | | 28 | | |
| Net Investment Income (Loss) | | | 3,262 | | | | (— | @) | | | 2 | | | | 24,068 | | | | 23 | | |
| Realized Gain (Loss): | |
| Investments Sold | | | 5,691 | | | | — | | | | 855 | | | | 101,663 | | | | 12 | | |
| Foreign Currency Transactions | | | 24 | | | | (— | @) | | | (1 | ) | | | 123 | | | | 1 | | |
| Net Realized Gain (Loss) | | | 5,715 | | | | (— | @) | | | 854 | | | | 101,786 | | | | 13 | | |
| Change in Unrealized Appreciation (Depreciation): | |
| Investments | | | 4,046 | | | | 6 | | | | (1,351 | ) | | | (268,175 | ) | | | (77 | ) | |
| Foreign Currency Translations | | | (11 | ) | | | — | | | | — | | | | (176 | ) | | | (1 | ) | |
| Net Change in Unrealized Appreciation (Depreciation) | | | 4,035 | | | | 6 | | | | (1,351 | ) | | | (268,351 | ) | | | (78 | ) | |
Total Net Realized Gain (Loss) and Change in Unrealized
Appreciation (Depreciation) | | | 9,750 | | | | 6 | | | | (497 | ) | | | (166,565 | ) | | | (65 | ) | |
| Net Increase (Decrease) in Net Assets Resulting from Operations | | $ | 13,012 | | | $ | 6 | | | $ | (495 | ) | | $ | (142,497 | ) | | $ | (42 | ) | |
* Commencement of Operations December 28, 2011.
@ Amount is less than $500.
The accompanying notes are an integral part of the financial statements.
139
2011 Annual Report
December 31, 2011
Statements of Operations
| | | International
Equity
Portfolio
(000) | | International
Opportunity
Portfolio
(000) | | International
Real Estate
Portfolio
(000) | | International
Small Cap
Portfolio
(000) | | Select Global
Infrastructure
Portfolio
(000) | |
| Investment Income: | |
| Dividends from Securities of Unaffiliated Issuers | | $ | 145,945 | | | $ | 127 | | | $ | 11,001 | | | $ | 10,033 | | | $ | 409 | | |
| Income from Securities Loaned — Net | | | 2,781 | | | | — | | | | — | | | | — | | | | — | | |
| Dividends from Securities of Affiliated Issuers | | | 127 | | | | — | @ | | | 3 | | | | 7 | | | | — | @ | |
| Interest from Securities of Unaffiliated Issuers | | | 5 | | | | 3 | | | | — | @ | | | — | @ | | | — | | |
| Less: Foreign Taxes Withheld | | | (8,995 | ) | | | (7 | ) | | | (575 | ) | | | (637 | ) | | | (26 | ) | |
| Total Investment Income | | | 139,863 | | | | 123 | | | | 10,429 | | | | 9,403 | | | | 383 | | |
| Expenses: | |
| Investment Advisory Fees (Note B) | | | 33,841 | | | | 61 | | | | 2,629 | | | | 3,596 | | | | 100 | | |
| Administration Fees (Note C) | | | 3,384 | | | | 5 | | | | 263 | | | | 303 | | | | 9 | | |
| Sub Transfer Agency Fees | | | 2,852 | | | | — | | | | 64 | | | | 231 | | | | — | | |
| Custodian Fees (Note F) | | | 585 | | | | 12 | | | | 146 | | | | 163 | | | | 37 | | |
| Shareholder Reporting Fees | | | 315 | | | | 16 | | | | 26 | | | | 46 | | | | 7 | | |
| Professional Fees | | | 115 | | | | 66 | | | | 63 | | | | 71 | | | | 55 | | |
| Registration Fees | | | 110 | | | | 47 | | | | 34 | | | | 37 | | | | 49 | | |
| Directors' Fees and Expenses | | | 126 | | | | 1 | | | | 11 | | | | 12 | | | | 1 | | |
| Transfer Agency Fees (Note E) | | | 51 | | | | 12 | | | | 17 | | | | 13 | | | | 12 | | |
| Offering Costs | | | — | | | | 19 | | | | — | | | | — | | | | 59 | | |
| Pricing Fees | | | 9 | | | | 7 | | | | 10 | | | | 11 | | | | 7 | | |
| Distribution and Shareholder Servicing Fees — Class P (Note D) | | | 2,456 | | | | — | @ | | | 12 | | | | 243 | | | | — | @ | |
| Distribution and Shareholder Servicing Fees — Class H (Note D) | | | — | | | | 2 | | | | — | | | | — | | | | — | @ | |
| Distribution and Shareholder Servicing Fees — Class L (Note D) | | | — | | | | 1 | | | | — | | | | — | | | | 1 | | |
| Other Expenses | | | 154 | | | | 12 | | | | 22 | | | | 22 | | | | 10 | | |
| Total Expenses | | | 43,998 | | | | 261 | | | | 3,297 | | | | 4,748 | | | | 347 | | |
| Waiver of Investment Advisory Fees (Note B) | | | (1,356 | ) | | | (61 | ) | | | — | | | | (153 | ) | | | (100 | ) | |
| Expenses Reimbursed by Advisor (Note B) | | | — | | | | (119 | ) | | | — | | | | — | | | | (110 | ) | |
| Rebate from Morgan Stanley Affiliate (Note G-2) | | | (131 | ) | | | (— | @) | | | (3 | ) | | | (7 | ) | | | (— | @) | |
| Net Expenses | | | 42,511 | | | | 81 | | | | 3,294 | | | | 4,588 | | | | 137 | | |
| Net Investment Income | | | 97,352 | | | | 42 | | | | 7,135 | | | | 4,815 | | | | 246 | | |
| Realized Gain (Loss): | |
| Investments Sold | | | 135,813 | | | | 283 | | | | (44,620 | ) | | | 32,955 | | | | 375 | | |
| Foreign Currency Exchange Contracts | | | — | | | | — | | | | — | | | | (2,119 | ) | | | — | | |
| Foreign Currency Transactions | | | (3,139 | ) | | | (— | @) | | | 7 | | | | (78 | ) | | | (6 | ) | |
| Net Realized Gain (Loss) | | | 132,674 | | | | 283 | | | | (44,613 | ) | | | 30,758 | | | | 369 | | |
| Change in Unrealized Appreciation (Depreciation): | |
| Investments | | | (553,819 | ) | | | (1,012 | ) | | | (23,795 | ) | | | (106,116 | ) | | | 1,091 | | |
| Foreign Currency Exchange Contracts | | | — | | | | — | | | | — | | | | 1,108 | | | | — | | |
| Foreign Currency Translations | | | (159 | ) | | | — | @ | | | (20 | ) | | | 35 | | | | — | @ | |
| Net Change in Unrealized Appreciation (Depreciation) | | | (553,978 | ) | | | (1,012 | ) | | | (23,815 | ) | | | (104,973 | ) | | | 1,091 | | |
Total Net Realized Gain (Loss) and Change in Unrealized
Appreciation (Depreciation) | | | (421,304 | ) | | | (729 | ) | | | (68,428 | ) | | | (74,215 | ) | | | 1,460 | | |
| Net Increase (Decrease) in Net Assets Resulting from Operations | | $ | (323,952 | ) | | $ | (687 | ) | | $ | (61,293 | ) | | $ | (69,400 | ) | | $ | 1,706 | | |
@ Amount is less than $500.
The accompanying notes are an integral part of the financial statements.
140
2011 Annual Report
December 31, 2011
Statements of Operations
| | | Advantage
Portfolio
(000) | | Focus Growth
Portfolio
(000) | | Growth
Portfolio
(000) | | Insight*
Portfolio
(000) | | Opportunity
Portfolio
(000) | |
| Investment Income: | |
| Dividends from Securities of Unaffiliated Issuers | | $ | 105 | | | $ | 171 | | | $ | 6,820 | | | $ | — | | | $ | 2,532 | | |
| Dividends from Securities of Affiliated Issuers | | | — | @ | | | 2 | | | | 25 | | | | — | @ | | | 3 | | |
| Interest from Securities of Unaffiliated Issuers | | | — | | | | — | @ | | | 5 | | | | — | | | | — | | |
| Less: Foreign Taxes Withheld | | | (7 | ) | | | (8 | ) | | | (328 | ) | | | — | | | | (62 | ) | |
| Total Investment Income | | | 98 | | | | 165 | | | | 6,522 | | | | — | @ | | | 2,473 | | |
| Expenses: | |
| Investment Advisory Fees (Note B) | | | 51 | | | | 118 | | | | 4,304 | | | | — | @ | | | 1,384 | | |
| Sub Transfer Agency Fees | | | — | @ | | | 4 | | | | 787 | | | | — | | | | 311 | | |
| Administration Fees (Note C) | | | 5 | | | | 19 | | | | 689 | | | | — | @ | | | 222 | | |
| Transfer Agency Fees (Note E) | | | 11 | | | | 7 | | | | 16 | | | | 1 | | | | 350 | | |
| Professional Fees | | | 46 | | | | 56 | | | | 66 | | | | 25 | | | | 51 | | |
| Shareholder Reporting Fees | | | 9 | | | | 3 | | | | 92 | | | | — | @ | | | 119 | | |
| Registration Fees | | | 39 | | | | 33 | | | | 74 | | | | — | | | | 51 | | |
| Custodian Fees (Note F) | | | 5 | | | | 4 | | | | 57 | | | | — | @ | | | 49 | | |
| Offering Costs | | | 52 | | | | — | | | | — | | | | — | | | | 52 | | |
| Directors' Fees and Expenses | | | — | @ | | | 1 | | | | 25 | | | | — | | | | 8 | | |
| Pricing Fees | | | 3 | | | | 3 | | | | 6 | | | | — | @ | | | 3 | | |
| Distribution and Shareholder Servicing Fees — Class P (Note D) | | | — | @ | | | 4 | | | | 364 | | | | — | | | | 7 | | |
| Distribution and Shareholder Servicing Fees — Class H (Note D) | | | 3 | | | | — | | | | — | | | | — | @ | | | 564 | | |
| Distribution and Shareholder Servicing Fees — Class L (Note D) | | | 1 | | | | — | | | | — | | | | — | @ | | | 273 | | |
| Other Expenses | | | 12 | | | | 9 | | | | 38 | | | | — | | | | 20 | | |
| Total Expenses | | | 237 | | | | 261 | | | | 6,518 | | | | 26 | | | | 3,464 | | |
| Waiver of Investment Advisory Fees (Note B) | | | (51 | ) | | | (22 | ) | | | — | | | | (— | @) | | | (184 | ) | |
| Distribution Fees — Class L Shares Waived (Note D) | | | (1 | ) | | | — | | | | — | | | | — | | | | — | | |
| Expenses Reimbursed by Advisor (Note B) | | | (111 | ) | | | — | | | | — | | | | (26 | ) | | | — | | |
| Rebate from Morgan Stanley Affiliate (Note G-2) | | | (— | @) | | | (2 | ) | | | (26 | ) | | | — | | | | (3 | ) | |
| Net Expenses | | | 74 | | | | 237 | | | | 6,492 | | | | — | @ | | | 3,277 | | |
| Net Investment Income (Loss) | | | 24 | | | | (72 | ) | | | 30 | | | | (— | @) | | | (804 | ) | |
| Realized Gain (Loss): | |
| Investments Sold | | | 214 | | | | 1,222 | | | | 77,748 | | | | — | | | | 22,617 | | |
| Foreign Currency Transactions | | | (— | @) | | | 1 | | | | 1 | | | | — | | | | (47 | ) | |
| Net Realized Gain | | | 214 | | | | 1,223 | | | | 77,749 | | | | — | | | | 22,570 | | |
| Change in Unrealized Appreciation (Depreciation): | |
| Investments | | | 106 | | | | (3,087 | ) | | | (100,452 | ) | | | 5 | | | | (21,761 | ) | |
| Investments in Affiliates | | | — | | | | — | | | | 34 | | | | — | | | | — | | |
| Foreign Currency Translations | | | — | | | | — | @ | | | (14 | ) | | | — | | | | (1 | ) | |
| Net Change in Unrealized Appreciation (Depreciation) | | | 106 | | | | (3,087 | ) | | | (100,432 | ) | | | 5 | | | | (21,762 | ) | |
Total Net Realized Gain (Loss) and Change in Unrealized
Appreciation (Depreciation) | | | 320 | | | | (1,864 | ) | | | (22,683 | ) | | | 5 | | | | 808 | | |
| Net Increase (Decrease) in Net Assets Resulting from Operations | | $ | 344 | | | $ | (1,936 | ) | | $ | (22,653 | ) | | $ | 5 | | | $ | 4 | | |
* Commencement of Operations December 28, 2011.
@ Amount is less than $500.
The accompanying notes are an integral part of the financial statements.
141
2011 Annual Report
December 31, 2011
Statements of Operations
| | | Small
Company
Growth
Portfolio
(000) | | U.S. Real
Estate
Portfolio
(000) | | Emerging
Markets Debt
Portfolio
(000) | |
| Investment Income: | |
| Dividends from Securities of Unaffiliated Issuers | | $ | 12,379 | | | $ | 16,912 | | | $ | 3 | | |
| Interest from Securities of Unaffiliated Issuers | | | — | | | | — | | | | 4,196 | | |
| Dividends from Securities of Affiliated Issuers | | | 51 | | | | 30 | | | | 13 | | |
| Income from Securities Loaned — Net | | | — | | | | — | | | | 1 | | |
| Less: Foreign Taxes Withheld | | | (96 | ) | | | (58 | ) | | | (8 | ) | |
| Total Investment Income | | | 12,334 | | | | 16,884 | | | | 4,205 | | |
| Expenses: | |
| Investment Advisory Fees (Note B) | | | 14,377 | | | | 7,332 | | | | 522 | | |
| Sub Transfer Agency Fees | | | 1,466 | | | | 930 | | | | 15 | | |
| Administration Fees (Note C) | | | 1,295 | | | | 756 | | | | 56 | | |
| Shareholder Reporting Fees | | | 304 | | | | 220 | | | | 10 | | |
| Professional Fees | | | 70 | | | | 101 | | | | 76 | | |
| Custodian Fees (Note F) | | | 126 | | | | 39 | | | | 62 | | |
| Registration Fees | | | 85 | | | | 75 | | | | 56 | | |
| Directors' Fees and Expenses | | | 49 | | | | 29 | | | | 2 | | |
| Transfer Agency Fees (Note E) | | | 8 | | | | 32 | | | | 14 | | |
| Pricing Fees | | | 7 | | | | 4 | | | | 5 | | |
| Distribution and Shareholder Servicing Fees — Class P (Note D) | | | 1,008 | | | | 239 | | | | 21 | | |
| Distribution and Shareholder Servicing Fees — Class H (Note D) | | | 11 | | | | 8 | | | | 5 | | |
| Distribution and Shareholder Servicing Fees — Class L (Note D) | | | 2 | | | | 6 | | | | 37 | | |
| Other Expenses | | | 62 | | | | 71 | | | | 13 | | |
| Expenses Before Non Operating Expenses | | | 18,870 | | | | 9,842 | | | | 894 | | |
| Investment Related Expenses | | | — | | | | 109 | | | | — | | |
| Bank Overdraft Expense | | | 1 | | | | — | | | | — | | |
| Total Expenses | | | 18,871 | | | | 9,951 | | | | 894 | | |
| Waiver of Investment Advisory Fees (Note B) | | | (855 | ) | | | (140 | ) | | | (238 | ) | |
| Rebate from Morgan Stanley Affiliate (Note G-2) | | | (51 | ) | | | (27 | ) | | | (13 | ) | |
| Net Expenses | | | 17,965 | | | | 9,784 | | | | 643 | | |
| Net Investment Income (Loss) | | | (5,631 | ) | | | 7,100 | | | | 3,562 | | |
| Realized Gain (Loss): | |
| Investments Sold | | | 47,105 | | | | 93,333 | | | | 114 | | |
| Foreign Currency Exchange Contracts | | | — | | | | — | | | | (667 | ) | |
| Foreign Currency Transactions | | | (37 | ) | | | 4 | | | | (94 | ) | |
| Net Realized Gain (Loss) | | | 47,068 | | | | 93,337 | | | | (647 | ) | |
| Change in Unrealized Appreciation (Depreciation): | |
| Investments | | | (193,849 | ) | | | (49,796 | ) | | | (7,262 | ) | |
| Foreign Currency Exchange Contracts | | | — | | | | — | | | | (170 | ) | |
| Foreign Currency Translations | | | (1 | ) | | | (4 | ) | | | (120 | ) | |
| Net Change in Unrealized Appreciation (Depreciation) | | | (193,850 | ) | | | (49,800 | ) | | | (7,552 | ) | |
| Total Net Realized Gain (Loss) and Change in Unrealized Appreciation (Depreciation) | | | (146,782 | ) | | | 43,537 | | | | (8,199 | ) | |
| Net Increase (Decrease) in Net Assets Resulting from Operations | | $ | (152,413 | ) | | $ | 50,637 | | | $ | (4,637 | ) | |
The accompanying notes are an integral part of the financial statements.
142
2011 Annual Report
December 31, 2011
Statements of Changes in Net Assets
| | | Active International Allocation
Portfolio | | Asian Equity Portfolio | |
| | | Year Ended
December 31,
2011
(000) | | Year Ended
December 31,
2010
(000) | | Year Ended
December 31,
2011
(000) | | Period from
December 28,
2010^ to
December 31,
2010
(000) | |
| Increase (Decrease) in Net Assets: | |
| Operations: | |
| Net Investment Income (Loss) | | $ | 9,429 | | | $ | 8,719 | | | $ | (1 | ) | | $ | (— | @) | |
| Net Realized Gain (Loss) | | | 20,487 | | | | 12,002 | | | | (70 | ) | | | (2 | ) | |
| Net Change in Unrealized Appreciation (Depreciation) | | | (88,922 | ) | | | 13,445 | | | | (190 | ) | | | 31 | | |
| Net Increase (Decrease) in Net Assets Resulting from Operations | | | (59,006 | ) | | | 34,166 | | | | (261 | ) | | | 29 | | |
| Distributions from and/or in Excess of: | |
| Class I: | |
| Net Investment Income | | | (6,740 | ) | | | (8,900 | ) | | | — | | | | — | | |
| Class P: | |
| Net Investment Income | | | (195 | ) | | | (251 | ) | | | — | | | | — | | |
| Total Distributions | | | (6,935 | ) | | | (9,151 | ) | | | — | | | | — | | |
| Capital Share Transactions:(1) | |
| Class I: | |
| Subscribed | | | 16,620 | | | | 17,789 | | | | 185 | | | | 1,200 | | |
| Distributions Reinvested | | | 6,595 | | | | 8,573 | | | | — | | | | — | | |
| Redeemed | | | (98,789 | ) | | | (142,063 | ) | | | — | | | | — | | |
| Class P: | |
| Subscribed | | | 2,040 | | | | 2,703 | | | | — | | | | 100 | | |
| Distributions Reinvested | | | 193 | | | | 250 | | | | — | | | | — | | |
| Redeemed | | | (4,111 | ) | | | (5,510 | ) | | | — | | | | — | | |
| Class H: | |
| Subscribed | | | — | | | | — | | | | — | | | | 100 | | |
| Class L: | |
| Subscribed | | | — | | | | — | | | | — | | | | 100 | | |
| Net Increase (Decrease) in Net Assets Resulting from Capital Share Transactions | | | (77,452 | ) | | | (118,258 | ) | | | 185 | | | | 1,500 | | |
| Redemption Fees | | | 1 | | | | 7 | | | | — | | | | — | | |
| Total Increase (Decrease) in Net Assets | | | (143,392 | ) | | | (93,236 | ) | | | (76 | ) | | | 1,529 | | |
| Net Assets: | |
| Beginning of Period | | | 455,827 | | | | 549,063 | | | | 1,529 | | | | — | | |
| End of Period | | $ | 312,435 | | | $ | 455,827 | | | $ | 1,453 | | | $ | 1,529 | | |
Undistributed (Distributions in Excess of) Net Investment Income Included in
End of Period Net Assets | | $ | (1,888 | ) | | $ | (1,349 | ) | | $ | (— | @) | | $ | — | | |
| (1) Capital Share Transactions: | |
| Class I: | |
| Shares Subscribed | | | 1,394 | | | | 1,638 | | | | 22 | | | | 120 | | |
| Shares Issued on Distributions Reinvested | | | 673 | | | | 729 | | | | — | | | | — | | |
| Shares Redeemed | | | (8,669 | ) | | | (12,896 | ) | | | — | | | | — | | |
| Net Increase (Decrease) in Class I Shares Outstanding | | | (6,602 | ) | | | (10,529 | ) | | | 22 | | | | 120 | | |
| Class P: | |
| Shares Subscribed | | | 166 | | | | 239 | | | | — | | | | 10 | | |
| Shares Issued on Distributions Reinvested | | | 19 | | | | 21 | | | | — | | | | — | | |
| Shares Redeemed | | | (352 | ) | | | (514 | ) | | | — | | | | — | | |
| Net Increase (Decrease) in Class P Shares Outstanding | | | (167 | ) | | | (254 | ) | | | — | | | | 10 | | |
| Class H: | |
| Shares Subscribed | | | — | | | | — | | | | — | | | | 10 | | |
| Class L: | |
| Shares Subscribed | | | — | | | | — | | | | — | | | | 10 | | |
^ Commencement of Operations.
@ Amount is less than $500.
The accompanying notes are an integral part of the financial statements.
143
2011 Annual Report
December 31, 2011
Statements of Changes in Net Assets
| | | Emerging Markets Portfolio | | Global Advantage Portfolio | |
| | | Year Ended
December 31,
2011
(000) | | Year Ended
December 31,
2010
(000) | | Year Ended
December 31,
2011
(000) | | Period from
December 28,
2010^ to
December 31,
2010
(000) | |
| Increase (Decrease) in Net Assets: | |
| Operations: | |
| Net Investment Income (Loss) | | $ | 14,687 | | | $ | 8,341 | | | $ | 9 | | | $ | (— | @) | |
| Net Realized Gain (Loss) | | | 102,195 | | | | 354,824 | | | | (1 | ) | | | (— | @) | |
| Net Change in Unrealized Appreciation (Depreciation) | | | (455,950 | ) | | | (15,398 | ) | | | 17 | | | | 1 | | |
| Net Increase (Decrease) in Net Assets Resulting from Operations | | | (339,068 | ) | | | 347,767 | | | | 25 | | | | 1 | | |
| Distributions from and/or in Excess of: | |
| Class I: | |
| Net Investment Income | | | — | | | | (15,877 | ) | | | (11 | ) | | | — | | |
| Net Realized Gain | | | (24,410 | ) | | | — | | | | — | | | | — | | |
| Class P: | |
| Net Investment Income | | | — | | | | (637 | ) | | | (1 | ) | | | — | | |
| Net Realized Gain | | | (867 | ) | | | — | | | | — | | | | — | | |
| Class H: | |
| Net Investment Income | | | — | | | | — | | | | (4 | ) | | | — | | |
| Class L: | |
| Net Investment Income | | | — | | | | — | | | | (— | @) | | | — | | |
| Total Distributions | | | (25,277 | ) | | | (16,514 | ) | | | (16 | ) | | | — | | |
| Capital Share Transactions:(1) | |
| Class I: | |
| Subscribed | | | 150,629 | | | | 281,040 | | | | 940 | | | | 700 | | |
| Distributions Reinvested | | | 24,390 | | | | 15,473 | | | | 6 | | | | — | | |
| Redeemed | | | (659,627 | ) | | | (778,895 | ) | | | (61 | ) | | | — | | |
| Class P: | |
| Subscribed | | | 7,123 | | | | 18,354 | | | | — | | | | 100 | | |
| Distributions Reinvested | | | 857 | | | | 633 | | | | — | | | | — | | |
| Redeemed | | | (59,019 | ) | | | (48,150 | ) | | | — | | | | — | | |
| Class H: | |
| Subscribed | | | — | | | | — | | | | 700 | | | | 200 | | |
| Distributions Reinvested | | | — | | | | — | | | | 3 | | | | — | | |
| Class L: | |
| Subscribed | | | — | | | | — | | | | — | | | | 100 | | |
| Net Increase (Decrease) in Net Assets Resulting from Capital Share Transactions | | | (535,647 | ) | | | (511,545 | ) | | | 1,588 | | | | 1,100 | | |
| Redemption Fees | | | 158 | | | | 224 | | | | — | | | | — | | |
| Total Increase (Decrease) in Net Assets | | | (899,834 | ) | | | (180,068 | ) | | | 1,597 | | | | 1,101 | | |
| Net Assets: | |
| Beginning of Period | | | 2,145,212 | | | | 2,325,280 | | | | 1,101 | | | | — | | |
| End of Period | | $ | 1,245,378 | | | $ | 2,145,212 | | | $ | 2,698 | | | $ | 1,101 | | |
Distributions in Excess of Net Investment Income Included in End of Period
Net Assets | | $ | (9,486 | ) | | $ | (20,221 | ) | | $ | (8 | ) | | $ | (— | @) | |
The accompanying notes are an integral part of the financial statements.
144
2011 Annual Report
December 31, 2011
Statements of Changes in Net Assets (cont'd)
| | | Emerging Markets Portfolio | | Global Advantage Portfolio | |
| | | Year Ended
December 31,
2011
(000) | | Year Ended
December 31,
2010
(000) | | Year Ended
December 31,
2011
(000) | | Period from
December 28,
2010^ to
December 31,
2010
(000) | |
| (1) Capital Share Transactions: | |
| Class I: | |
| Shares Subscribed | | | 5,906 | | | | 11,677 | | | | 96 | | | | 70 | | |
| Shares Issued on Distributions Reinvested | | | 1,132 | | | | 588 | | | | 1 | | | | — | | |
| Shares Redeemed | | | (26,716 | ) | | | (32,609 | ) | | | (6 | ) | | | — | | |
| Net Increase (Decrease) in Class I Shares Outstanding | | | (19,678 | ) | | | (20,344 | ) | | | 91 | | | | 70 | | |
| Class P: | |
| Shares Subscribed | | | 295 | | | | 782 | | | | — | | | | 10 | | |
| Shares Issued on Distributions Reinvested | | | 41 | | | | 25 | | | | — | | | | — | | |
| Shares Redeemed | | | (2,412 | ) | | | (2,131 | ) | | | — | | | | — | | |
| Net Increase (Decrease) in Class P Shares Outstanding | | | (2,076 | ) | | | (1,324 | ) | | | — | | | | 10 | | |
| Class H: | |
| Shares Subscribed | | | — | | | | — | | | | 70 | | | | 20 | | |
| Shares Issued on Distributions Reinvested | | | — | | | | — | | | | — | @ | | | — | | |
| Net Increase in Class H Shares Outstanding | | | — | | | | — | | | | 70 | | | | 20 | | |
| Class L: | |
| Shares Subscribed | | | — | | | | — | | | | — | | | | 10 | | |
^ Commencement of Operations.
@ Amount is less than $500.
The accompanying notes are an integral part of the financial statements.
145
2011 Annual Report
December 31, 2011
Statements of Changes in Net Assets
| | | Global Discovery Portfolio | | Global Franchise Portfolio | |
| | | Year Ended
December 31,
2011
(000) | | Period from
December 28,
2010^ to
December 31,
2010
(000) | | Year Ended
December 31,
2011
(000) | | Year Ended
December 31,
2010
(000) | |
| Increase (Decrease) in Net Assets: | |
| Operations: | |
| Net Investment Income (Loss) | | $ | 35 | | | $ | (— | @) | | $ | 3,262 | | | $ | 1,980 | | |
| Net Realized Gain (Loss) | | | 26 | | | | (1 | ) | | | 5,715 | | | | 17,660 | | |
| Net Change in Unrealized Appreciation (Depreciation) | | | (255 | ) | | | (3 | ) | | | 4,035 | | | | (4,820 | ) | |
| Net Increase (Decrease) in Net Assets Resulting from Operations | | | (194 | ) | | | (4 | ) | | | 13,012 | | | | 14,820 | | |
| Distributions from and/or in Excess of: | |
| Class I: | |
| Net Investment Income | | | (31 | ) | | | — | | | | (3,602 | ) | | | (2,672 | ) | |
| Net Realized Gain | | | (1 | ) | | | — | | | | (2,015 | ) | | | — | | |
| Class P: | |
| Net Investment Income | | | (1 | ) | | | — | | | | (240 | ) | | | (264 | ) | |
| Net Realized Gain | | | (— | @) | | | — | | | | (154 | ) | | | — | | |
| Class H: | |
| Net Investment Income | | | (13 | ) | | | — | | | | — | | | | — | | |
| Net Realized Gain | | | (1 | ) | | | — | | | | — | | | | — | | |
| Class L: | |
| Net Investment Income | | | (— | @) | | | — | | | | — | | | | — | | |
| Net Realized Gain | | | (— | @) | | | — | | | | — | | | | — | | |
| Total Distributions | | | (47 | ) | | | — | | | | (6,011 | ) | | | (2,936 | ) | |
| Capital Share Transactions:(1) | |
| Class I: | |
| Subscribed | | | 1,897 | | | | 700 | | | | 140,007 | | | | 34,361 | | |
| Distributions Reinvested | | | 23 | | | | — | | | | 4,060 | | | | 2,566 | | |
| Redeemed | | | (87 | ) | | | — | | | | (28,592 | ) | | | (70,062 | ) | |
| Class P: | |
| Subscribed | | | — | | | | 100 | | | | 9,450 | | | | 857 | | |
| Distributions Reinvested | | | — | | | | — | | | | 368 | | | | 248 | | |
| Redeemed | | | — | | | | — | | | | (4,609 | ) | | | (1,719 | ) | |
| Class H: | |
| Subscribed | | | 937 | | | | 350 | | | | — | | | | — | | |
| Distributions Reinvested | | | 10 | | | | — | | | | — | | | | — | | |
| Class L: | |
| Subscribed | | | — | | | | 100 | | | | — | | | | — | | |
| Net Increase (Decrease) in Net Assets Resulting from Capital Share Transactions | | | 2,780 | | | | 1,250 | | | | 120,684 | | | | (33,749 | ) | |
| Total Increase (Decrease) in Net Assets | | | 2,539 | | | | 1,246 | | | | 127,685 | | | | (21,865 | ) | |
| Net Assets: | |
| Beginning of Period | | | 1,246 | | | | — | | | | 99,319 | | | | 121,184 | | |
| End of Period | | $ | 3,785 | | | $ | 1,246 | | | $ | 227,004 | | | $ | 99,319 | | |
Undistributed (Distributions in Excess of) Net Investment Income Included in
End of Period Net Assets | | $ | (3 | ) | | $ | (1 | ) | | $ | (— | @) | | $ | 328 | | |
The accompanying notes are an integral part of the financial statements.
146
2011 Annual Report
December 31, 2011
Statements of Changes in Net Assets (cont'd)
| | | Global Discovery Portfolio | | Global Franchise Portfolio | |
| | | Year Ended
December 31,
2011
(000) | | Period from
December 28,
2010^ to
December 31,
2010
(000) | | Year Ended
December 31,
2011
(000) | | Year Ended
December 31,
2010
(000) | |
| (1) Capital Share Transactions: | |
| Class I: | |
| Shares Subscribed | | | 207 | | | | 70 | | | | 8,718 | | | | 2,390 | | |
| Shares Issued on Distributions Reinvested | | | 3 | | | | — | | | | 254 | | | | 169 | | |
| Shares Redeemed | | | (10 | ) | | | — | | | | (1,797 | ) | | | (4,794 | ) | |
| Net Increase (Decrease) in Class I Shares Outstanding | | | 200 | | | | 70 | | | | 7,175 | | | | (2,235 | ) | |
| Class P: | |
| Shares Subscribed | | | — | | | | 10 | | | | 578 | | | | 59 | | |
| Shares Issued on Distributions Reinvested | | | — | | | | — | | | | 23 | | | | 17 | | |
| Shares Redeemed | | | — | | | | — | | | | (283 | ) | | | (121 | ) | |
| Net Increase (Decrease) in Class P Shares Outstanding | | | — | | | | 10 | | | | 318 | | | | (45 | ) | |
| Class H: | |
| Shares Subscribed | | | 92 | | | | 35 | | | | — | | | | — | | |
| Shares Issued on Distributions Reinvested | | | 1 | | | | — | | | | — | | | | — | | |
| Net Increase in Class H Shares Outstanding | | | 93 | | | | 35 | | | | — | | | | — | | |
| Class L: | |
| Shares Subscribed | | | — | | | | 10 | | | | — | | | | — | | |
^ Commencement of Operations.
@ Amount is less than $500.
The accompanying notes are an integral part of the financial statements.
147
2011 Annual Report
December 31, 2011
Statements of Changes in Net Assets
| | | Global Insight Portfolio | |
| | | Period from
December 28,
2011^ to
December 31,
2011
(000) | |
| Increase (Decrease) in Net Assets: | |
| Operations: | |
| Net Investment Loss | | $ | (— | @) | |
| Net Realized Loss | | | (— | @) | |
| Net Change in Unrealized Appreciation (Depreciation) | | | 6 | | |
| Net Increase in Net Assets Resulting from Operations | | | 6 | | |
| Capital Share Transactions:(1) | |
| Class I: | |
| Subscribed | | | 10 | | |
| Class H: | |
| Subscribed | | | 810 | | |
| Class L: | |
| Subscribed | | | 10 | | |
| Net Increase in Net Assets Resulting from Capital Share Transactions | | | 830 | | |
| Total Increase in Net Assets | | | 836 | | |
| Net Assets: | |
| Beginning of Period | | | — | | |
| End of Period | | $ | 836 | | |
| Distributions in Excess of Net Investment Income Included in End of Period Net Assets | | $ | (— | @) | |
| (1) Capital Share Transactions: | |
| Class I: | |
| Shares Subscribed | | | 1 | | |
| Class H: | |
| Shares Subscribed | | | 81 | | |
| Class L: | |
| Shares Subscribed | | | 1 | | |
^ Commencement of operations.
@ Amount is less than $500.
The accompanying notes are an integral part of the financial statements.
148
2011 Annual Report
December 31, 2011
Statements of Changes in Net Assets
| | | Global Opportunity Portfolio | |
| | | Year Ended
December 31,
2011
(000) | | Period from
April 1,
2010 to
December 31,
2010
(000) | | Year Ended
March 31,
2010
(000) | |
| Increase (Decrease) in Net Assets: | |
| Operations: | |
| Net Investment Income (Loss) | | $ | 2 | | | $ | (18 | ) | | $ | (24 | ) | |
| Net Realized Gain | | | 854 | | | | 309 | | | | 67 | | |
| Net Change in Unrealized Appreciation (Depreciation) | | | (1,351 | ) | | | 1,576 | | | | 4,041 | | |
| Net Increase (Decrease) in Net Assets Resulting from Operations | | | (495 | ) | | | 1,867 | | | | 4,084 | | |
| Distributions from and/or in Excess of: | |
| Class A: | |
| Net Realized Gain | | | — | | | | — | | | | (17 | ) | |
| Class C: | |
| Net Realized Gain | | | — | | | | — | | | | (3 | ) | |
| Class I: | |
| Net Realized Gain | | | (570 | ) | | | — | | | | (17 | ) | |
| Class P: | |
| Net Realized Gain | | | (1 | ) | | | — | | | | — | | |
| Class H: | |
| Net Realized Gain | | | (341 | ) | | | — | | | | — | | |
| Class L: | |
| Net Realized Gain | | | (37 | ) | | | — | | | | — | | |
| Class R:** | |
| Net Realized Gain | | | — | | | | — | | | | (— | @) | |
| Total Distributions | | | (949 | ) | | | — | | | | (37 | ) | |
| Capital Share Transactions:(1) | |
| Class A: | |
| Subscribed | | | — | | | | — | | | | 6,696 | | |
| Distributions Reinvested | | | — | | | | — | | | | 16 | | |
| Conversion to Class H in connection with Reorganization | | | — | | | | (5,407 | ) | | | — | | |
| Redeemed | | | — | | | | — | | | | (1,432 | ) | |
| Class B: | |
| Subscribed | | | — | | | | 115 | | | | 804 | | |
| Conversion to Class H in connection with Reorganization | | | — | | | | (892 | ) | | | — | | |
| Redeemed | | | — | | | | (68 | ) | | | (174 | ) | |
| Class C: | |
| Subscribed | | | — | | | | — | | | | 1,329 | | |
| Distributions Reinvested | | | — | | | | — | | | | 3 | | |
| Conversion to Class L in connection with Reorganization | | | — | | | | (682 | ) | | | — | | |
| Redeemed | | | — | | | | — | | | | (186 | ) | |
| Class I: | |
| Subscribed | | | 3,743 | | | | 12 | | | | 2,220 | | |
| Distributions Reinvested | | | 215 | | | | — | | | | 1 | | |
| Conversion to Class I in connection with Reorganization | | | — | | | | (4,786 | ) | | | — | | |
| Conversion from Class I in connection with Reorganization | | | — | | | | 4,786 | | | | — | | |
| Redeemed | | | (121 | ) | | | (1,087 | ) | | | (1,085 | ) | |
| Class P: | |
| Subscribed | | | — | | | | 10 | * | | | — | | |
| Class H: | |
| Subscribed | | | 251 | | | | 830 | | | | — | | |
| Distributions Reinvested | | | 333 | | | | — | | | | — | | |
| Conversion from Class A in connection with Reorganization | | | — | | | | 5,407 | | | | — | | |
| Conversion from Class B in connection with Reorganization | | | — | | | | 892 | | | | — | | |
| Redeemed | | | (1,114 | ) | | | (4,130 | ) | | | — | | |
| Class L: | |
| Subscribed | | | 120 | | | | 29 | | | | — | | |
| Distributions Reinvested | | | 29 | | | | — | | | | — | | |
| Conversion from Class C in connection with Reorganization | | | — | | | | 682 | | | | — | | |
| Redeemed | | | (255 | ) | | | (823 | ) | | | — | | |
| Class R:** | |
| Subscribed | | | — | | | | — | | | | 35 | | |
| Distributions Reinvested | | | — | | | | — | | | | — | @ | |
| Redeemed | | | — | | | | (96 | ) | | | (39 | ) | |
| Net Increase (Decrease) in Net Assets Resulting from Capital Share Transactions | | | 3,201 | | | | (5,208 | ) | | | 8,188 | | |
| Redemption Fees | | | 1 | | | | — | | | | — | | |
| Total Increase (Decrease) in Net Assets | | | 1,758 | | | | (3,341 | ) | | | 12,235 | | |
| Net Assets: | |
| Beginning of Period | | | 11,853 | | | | 15,194 | | | | 2,959 | | |
| End of Period | | $ | 13,611 | | | $ | 11,853 | | | $ | 15,194 | | |
| Distributions in Excess of Net Investment Income Included in End of Period Net Assets | | $ | 1 | | | $ | (38 | ) | | $ | (22 | ) | |
The accompanying notes are an integral part of the financial statements.
149
2011 Annual Report
December 31, 2011
Statements of Changes in Net Assets (cont'd)
| | | Global Opportunity Portfolio | |
| | | Year Ended
December 31,
2011
(000) | | Period from
April 1,
2010 to
December 31,
2010
(000) | | Year Ended
March 31,
2010
(000) | |
| (1) Capital Share Transactions: | |
| Class A: | |
| Shares Subscribed | | | — | | | | — | | | | 835 | | |
| Shares Issued on Distributions Reinvested | | | — | | | | — | | | | 2 | | |
| Conversion to Class H in connection with Reorganization | | | — | | | | (630 | ) | | | — | | |
| Shares Redeemed | | | — | | | | — | | | | (171 | ) | |
| Net Increase (Decrease) in Class A Shares Outstanding | | | — | | | | (630 | ) | | | 666 | | |
| Class B: | |
| Shares Subscribed | | | — | | | | 13 | | | | 105 | | |
| Conversion to Class H in connection with Reorganization | | | — | | | | (104 | ) | | | — | | |
| Shares Redeemed | | | — | | | | (9 | ) | | | (21 | ) | |
| Net Increase (Decrease) in Class B Shares Outstanding | | | — | | | | (100 | ) | | | 84 | | |
| Class C: | |
| Shares Subscribed | | | — | | | | — | | | | 160 | | |
| Shares Issued on Distributions Reinvested | | | — | | | | — | | | | — | @@ | |
| Conversion to Class L in connection with Reorganization | | | — | | | | (80 | ) | | | — | | |
| Shares Redeemed | | | — | | | | — | | | | (22 | ) | |
| Net Increase (Decrease) in Class A Shares Outstanding | | | — | | | | (80 | ) | | | 138 | | |
| Class I: | |
| Shares Subscribed | | | 345 | | | | 1 | | | | 256 | | |
| Shares Issued on Distributions Reinvested | | | 21 | | | | — | | | | — | @@ | |
| Conversion to Class I in connection with Reorganization | | | — | | | | 555 | | | | — | | |
| Conversion from Class I in connection with Reorganization | | | — | | | | (555 | ) | | | — | | |
| Shares Redeemed | | | (11 | ) | | | (127 | ) | | | (128 | ) | |
| Net Increase (Decrease) in Class I Shares Outstanding | | | 355 | | | | (126 | ) | | | 128 | | |
| Class P: | |
| Shares Subscribed | | | — | | | | 1 | * | | | — | | |
| Class H: | |
| Shares Subscribed | | | 22 | | | | 84 | | | | — | | |
| Shares Issued on Distributions Reinvested | | | 32 | | | | — | | | | — | | |
| Conversion from Class A in connection with Reorganization | | | — | | | | 630 | | | | — | | |
| Conversion from Class B in connection with Reorganization | | | — | | | | 104 | | | | — | | |
| Shares Redeemed | | | (95 | ) | | | (435 | ) | | | — | | |
| Net Increase (Decrease) in Class H Shares Outstanding | | | (41 | ) | | | 383 | | | | — | | |
| Class L: | |
| Shares Subscribed | | | 10 | | | | 2 | | | | — | | |
| Shares Issued on Distributions Reinvested | | | 3 | | | | — | | | | — | | |
| Conversion from Class C in connection with Reorganization | | | — | | | | 80 | | | | — | | |
| Shares Redeemed | | | (22 | ) | | | (93 | ) | | | — | | |
| Net Decrease in Class L Shares Outstanding | | | (9 | ) | | | (11 | ) | | | — | | |
| Class R:** | |
| Shares Subscribed | | | — | | | | — | | | | 4 | | |
| Shares Issued on Distributions Reinvested | | | — | | | | — | | | | — | @@ | |
| Shares Redeemed | | | — | | | | (10 | ) | | | (4 | ) | |
| Net Increase (Decrease) in Class R Shares Outstanding | | | — | | | | (10 | ) | | | — | @@ | |
* For the period May 21, 2010 (commencement of operations) through December 31, 2010.
** Class R Shares liquidated prior to the Reorganization on May 21, 2010.
@ Amount is less than $500.
@@ Shares are less than 500.
The accompanying notes are an integral part of the financial statements.
150
2011 Annual Report
December 31, 2011
Statements of Changes in Net Assets
| | | Global Real Estate
Portfolio | | International Advantage
Portfolio | |
| | | Year Ended
December 31,
2011
(000) | | Year Ended
December 31,
2010
(000) | | Year Ended
December 31,
2011
(000) | | Period from
December 28,
2010^ to
December 31,
2010
(000) | |
| Increase (Decrease) in Net Assets: | |
| Operations: | |
| Net Investment Income (Loss) | | $ | 24,068 | | | $ | 18,233 | | | $ | 23 | | | $ | (— | @) | |
| Net Realized Gain (Loss) | | | 101,786 | | | | (7,577 | ) | | | 13 | | | | (1 | ) | |
| Net Change in Unrealized Appreciation (Depreciation) | | | (268,351 | ) | | | 153,231 | | | | (78 | ) | | | (1 | ) | |
| Net Increase (Decrease) in Net Assets Resulting from Operations | | | (142,497 | ) | | | 163,887 | | | | (42 | ) | | | (2 | ) | |
| Distributions from and/or in Excess of: | |
| Class I: | |
| Net Investment Income | | | (26,117 | ) | | | (22,289 | ) | | | (15 | ) | | | — | | |
| Net Realized Gain | | | — | | | | — | | | | (12 | ) | | | — | | |
| Class P: | |
| Net Investment Income | | | (2,381 | ) | | | (1,296 | ) | | | (1 | ) | | | — | | |
| Net Realized Gain | | | — | | | | — | | | | (1 | ) | | | — | | |
| Class H: | |
| Net Investment Income | | | (167 | ) | | | (203 | ) | | | (6 | ) | | | — | | |
| Net Realized Gain | | | — | | | | — | | | | (6 | ) | | | — | | |
| Class L: | |
| Net Investment Income | | | (91 | ) | | | (74 | ) | | | (— | @) | | | — | | |
| Net Realized Gain | | | — | | | | — | | | | (1 | ) | | | — | | |
| Total Distributions | | | (28,756 | ) | | | (23,862 | ) | | | (42 | ) | | | — | | |
| Capital Share Transactions:(1) | |
| Class I: | |
| Subscribed | | | 733,537 | | | | 539,544 | | | | 113 | | | | 1,200 | | |
| Distributions Reinvested | | | 23,292 | | | | 19,144 | | | | 2 | | | | — | | |
| Redeemed | | | (484,561 | ) | | | (110,386 | ) | | | (8 | ) | | | — | | |
| Class P: | |
| Subscribed | | | 108,062 | | | | 17,980 | | | | — | | | | 100 | | |
| Distributions Reinvested | | | 2,379 | | | | 1,295 | | | | — | | | | — | | |
| Redeemed | | | (29,195 | ) | | | (13,883 | ) | | | — | | | | — | | |
| Class H: | |
| Subscribed | | | 3,323 | | | | 10,880 | | | | 600 | | | | 100 | | |
| Distributions Reinvested | | | 165 | | | | 199 | | | | 11 | | | | — | | |
| Redeemed | | | (4,559 | ) | | | (1,047 | ) | | | — | | | | — | | |
| Class L: | |
| Subscribed | | | 3,627 | | | | 2,979 | | | | — | | | | 100 | | |
| Distributions Reinvested | | | 83 | | | | 74 | | | | — | | | | — | | |
| Redeemed | | | (1,247 | ) | | | (304 | ) | | | — | | | | — | | |
| Net Increase in Net Assets Resulting from Capital Share Transactions | | | 354,906 | | | | 466,475 | | | | 718 | | | | 1,500 | | |
| Total Increase in Net Assets | | | 183,653 | | | | 606,500 | | | | 634 | | | | 1,498 | | |
| Net Assets: | |
| Beginning of Period | | | 1,300,117 | | | | 693,617 | | | | 1,498 | | | | — | | |
| End of Period | | $ | 1,483,770 | | | $ | 1,300,117 | | | $ | 2,132 | | | $ | 1,498 | | |
Distributions in Excess of Net Investment Income Included in
End of Period Net Assets | | $ | (5,172 | ) | | $ | (9,201 | ) | | $ | — | | | $ | (1 | ) | |
The accompanying notes are an integral part of the financial statements.
151
2011 Annual Report
December 31, 2011
Statements of Changes in Net Assets (cont'd)
| | | Global Real Estate
Portfolio | | International Advantage
Portfolio | |
| | | Year Ended
December 31,
2011
(000) | | Year Ended
December 31,
2010
(000) | | Year Ended
December 31,
2011
(000) | | Period from
December 28,
2010^ to
December 31,
2010
(000) | |
| (1) Capital Share Transactions: | |
| Class I: | |
| Shares Subscribed | | | 86,151 | | | | 64,397 | | | | 11 | | | | 120 | | |
| Shares Issued on Distributions Reinvested | | | 2,992 | | | | 2,295 | | | | — | @@ | | | — | | |
| Shares Redeemed | | | (55,407 | ) | | | (13,717 | ) | | | (1 | ) | | | — | | |
| Net Increase in Class I Shares Outstanding | | | 33,736 | | | | 52,975 | | | | 10 | | | | 120 | | |
| Class P: | |
| Shares Subscribed | | | 12,360 | | | | 2,273 | | | | — | | | | 10 | | |
| Shares Issued on Distributions Reinvested | | | 306 | | | | 157 | | | | — | | | | — | | |
| Shares Redeemed | | | (3,577 | ) | | | (1,750 | ) | | | — | | | | — | | |
| Net Increase in Class P Shares Outstanding | | | 9,089 | | | | 680 | | | | — | | | | 10 | | |
| Class H: | |
| Shares Subscribed | | | 385 | | | | 1,323 | | | | 60 | | | | 10 | | |
| Shares Issued on Distributions Reinvested | | | 21 | | | | 24 | | | | 1 | | | | — | | |
| Shares Redeemed | | | (512 | ) | | | (123 | ) | | | — | | | | — | | |
| Net Increase (Decrease) in Class H Shares Outstanding | | | (106 | ) | | | 1,224 | | | | 61 | | | | 10 | | |
| Class L: | |
| Shares Subscribed | | | 408 | | | | 398 | | | | — | | | | 10 | | |
| Shares Issued on Distributions Reinvested | | | 11 | | | | 9 | | | | — | | | | — | | |
| Shares Redeemed | | | (163 | ) | | | (40 | ) | | | — | | | | — | | |
| Net Increase in Class L Shares Outstanding | | | 256 | | | | 367 | | | | — | | | | 10 | | |
^ Commencement of operations.
@ Amount is less than $500.
@@ Shares are less than 500.
The accompanying notes are an integral part of the financial statements.
152
2011 Annual Report
December 31, 2011
Statements of Changes in Net Assets
| | | International Equity
Portfolio | | International Opportunity
Portfolio | |
| | | Year Ended
December 31,
2011
(000) | | Year Ended
December 31,
2010
(000) | | Year Ended
December 31,
2011
(000) | | Period from
March 31,
2010^ to
December 31,
2010
(000) | |
| Increase (Decrease) in Net Assets: | |
| Operations: | |
| Net Investment Income | | $ | 97,352 | | | $ | 83,394 | | | $ | 42 | | | $ | 13 | | |
| Net Realized Gain (Loss) | | | 132,674 | | | | (137,837 | ) | | | 283 | | | | (84 | ) | |
| Net Change in Unrealized Appreciation (Depreciation) | | | (553,978 | ) | | | 302,525 | | | | (1,012 | ) | | | 1,241 | | |
| Net Increase (Decrease) in Net Assets Resulting from Operations | | | (323,952 | ) | | | 248,082 | | | | (687 | ) | | | 1,170 | | |
| Distributions from and/or in Excess of: | |
| Class I: | |
| Net Investment Income | | | (73,415 | ) | | | (48,950 | ) | | | (49 | ) | | | — | | |
| Net Realized Gain | | | — | | | | — | | | | (226 | ) | | | — | | |
| Class P: | |
| Net Investment Income | | | (20,616 | ) | | | (11,050 | ) | | | (1 | ) | | | — | | |
| Net Realized Gain | | | — | | | | — | | | | (5 | ) | | | — | | |
| Class H: | |
| Net Investment Income | | | — | | | | — | | | | (4 | ) | | | — | | |
| Net Realized Gain | | | — | | | | — | | | | (34 | ) | | | — | | |
| Class L: | |
| Net Realized Gain | | | — | | | | — | | | | (5 | ) | | | — | | |
| Total Distributions | | | (94,031 | ) | | | (60,000 | ) | | | (324 | ) | | | — | | |
| Capital Share Transactions:(1) | |
| Class I: | |
| Subscribed | | | 496,856 | | | | 703,889 | | | | — | | | | 4,700 | | |
| Distributions Reinvested | | | 68,142 | | | | 44,431 | | | | — | | | | — | | |
| Redeemed | | | (664,126 | ) | | | (673,827 | ) | | | — | | | | — | | |
| Class P: | |
| Subscribed | | | 197,736 | | | | 458,705 | | | | — | | | | 100 | | |
| Distributions Reinvested | | | 20,608 | | | | 11,047 | | | | — | | | | — | | |
| Redeemed | | | (126,932 | ) | | | (712,539 | ) | | | — | | | | — | | |
| Class H: | |
| Subscribed | | | — | | | | — | | | | 50 | | | | 650 | | |
| Distributions Reinvested | | | — | | | | — | | | | 33 | | | | — | | |
| Class L: | |
| Subscribed | | | — | | | | — | | | | — | | | | 100 | | |
| Net Increase (Decrease) in Net Assets Resulting from Capital Share Transactions | | | (7,716 | ) | | | (168,294 | ) | | | 83 | | | | 5,550 | | |
| Redemption Fees | | | 109 | | | | 308 | | | | — | | | | — | | |
| Total Increase (Decrease) in Net Assets | | | (425,590 | ) | | | 20,096 | | | | (928 | ) | | | 6,720 | | |
| Net Assets: | |
| Beginning of Period | | | 4,300,995 | | | | 4,280,899 | | | | 6,720 | | | | — | | |
| End of Period | | $ | 3,875,405 | | | $ | 4,300,995 | | | $ | 5,792 | | | $ | 6,720 | | |
| Undistributed Net Investment Income Included in End of Period Net Assets | | $ | 667 | | | $ | 486 | | | $ | (— | @) | | $ | 13 | | |
The accompanying notes are an integral part of the financial statements.
153
2011 Annual Report
December 31, 2011
Statements of Changes in Net Assets (cont'd)
| | | International Equity
Portfolio | | International Opportunity
Portfolio | |
| | | Year Ended
December 31,
2011
(000) | | Year Ended
December 31,
2010
(000) | | Year Ended
December 31,
2011
(000) | | Period from
March 31,
2010^ to
December 31,
2010
(000) | |
| (1) Capital Share Transactions: | |
| Class I: | |
| Shares Subscribed | | | 36,905 | | | | 55,259 | | | | — | | | | 470 | | |
| Shares Issued on Distributions Reinvested | | | 5,740 | | | | 3,311 | | | | — | | | | — | | |
| Shares Redeemed | | | (48,810 | ) | | | (52,665 | ) | | | — | | | | — | | |
| Net Increase (Decrease) in Class I Shares Outstanding | | | (6,165 | ) | | | 5,905 | | | | — | | | | 470 | | |
| Class P: | |
| Shares Subscribed | | | 14,358 | | | | 36,653 | | | | — | | | | 10 | | |
| Shares Issued on Distributions Reinvested | | | 1,755 | | | | 833 | | | | — | | | | — | | |
| Shares Redeemed | | | (9,513 | ) | | | (56,399 | ) | | | — | | | | — | | |
| Net Increase (Decrease) in Class P Shares Outstanding | | | 6,600 | | | | (18,913 | ) | | | — | | | | 10 | | |
| Class H: | |
| Shares Subscribed | | | — | | | | — | | | | 5 | | | | 67 | | |
| Shares Issued on Distributions Reinvested | | | — | | | | — | | | | 3 | | | | — | | |
| Net Increase in Class H Shares Outstanding | | | — | | | | — | | | | 8 | | | | 67 | | |
| Class L: | |
| Shares Subscribed | | | — | | | | — | | | | — | | | | 10 | | |
^ Commencement of operations.
The accompanying notes are an integral part of the financial statements.
154
2011 Annual Report
December 31, 2011
Statements of Changes in Net Assets
| | | International Real Estate
Portfolio | | International Small Cap
Portfolio | |
| | | Year Ended
December 31,
2011
(000) | | Year Ended
December 31,
2010
(000) | | Year Ended
December 31,
2011
(000) | | Year Ended
December 31,
2010
(000) | |
| Increase (Decrease) in Net Assets: | |
| Operations: | |
| Net Investment Income | | $ | 7,135 | | | $ | 16,694 | | | $ | 4,815 | | | $ | 3,247 | | |
| Net Realized Gain (Loss) | | | (44,613 | ) | | | (102,047 | ) | | | 30,758 | | | | 21,594 | | |
| Net Change in Unrealized Appreciation (Depreciation) | | | (23,815 | ) | | | 119,410 | | | | (104,973 | ) | | | 34,562 | | |
| Net Increase (Decrease) in Net Assets Resulting from Operations | | | (61,293 | ) | | | 34,057 | | | | (69,400 | ) | | | 59,403 | | |
| Distributions from and/or in Excess of: | |
| Class I: | |
| Net Investment Income | | | (9,300 | ) | | | (12,992 | ) | | | — | | | | (1,110 | ) | |
| Class P: | |
| Net Investment Income | | | (125 | ) | | | (168 | ) | | | — | | | | (308 | ) | |
| Total Distributions | | | (9,425 | ) | | | (13,160 | ) | | | — | | | | (1,418 | ) | |
| Capital Share Transactions:(1) | |
| Class I: | |
| Subscribed | | | 25,214 | | | | 43,527 | | | | 29,291 | | | | 32,961 | | |
| Distributions Reinvested | | | 5,799 | | | | 7,210 | | | | — | | | | 918 | | |
| Redeemed | | | (151,178 | ) | | | (137,521 | ) | | | (84,991 | ) | | | (107,894 | ) | |
| Class P: | |
| Subscribed | | | 56 | | | | 26 | | | | 700 | | | | 26,252 | | |
| Distributions Reinvested | | | 112 | | | | 153 | | | | — | | | | 308 | | |
| Redeemed | | | (1,252 | ) | | | (3,315 | ) | | | (891 | ) | | | (2,011 | ) | |
| Net Decrease in Net Assets Resulting from Capital Share Transactions | | | (121,249 | ) | | | (89,920 | ) | | | (55,891 | ) | | | (49,466 | ) | |
| Redemption Fees | | | 1 | | | | 6 | | | | 8 | | | | 2 | | |
| Total Increase (Decrease) in Net Assets | | | (191,966 | ) | | | (69,017 | ) | | | (125,283 | ) | | | 8,521 | | |
| Net Assets: | |
| Beginning of Period | | | 403,061 | | | | 472,078 | | | | 421,436 | | | | 412,915 | | |
| End of Period | | $ | 211,095 | | | $ | 403,061 | | | $ | 296,153 | | | $ | 421,436 | | |
Undistributed (Distributions in Excess of) Net Investment Income Included in
End of Period Net Assets | | $ | 4,965 | | | $ | 5,613 | | | $ | 2,489 | | | $ | (203 | ) | |
| (1) Capital Share Transactions: | |
| Class I: | |
| Shares Subscribed | | | 1,453 | | | | 2,584 | | | | 2,153 | | | | 2,771 | | |
| Shares Issued on Distributions Reinvested | | | 317 | | | | 397 | | | | — | | | | 82 | | |
| Shares Redeemed | | | (8,685 | ) | | | (7,948 | ) | | | (6,381 | ) | | | (8,848 | ) | |
| Net Decrease in Class I Shares Outstanding | | | (6,915 | ) | | | (4,967 | ) | | | (4,228 | ) | | | (5,995 | ) | |
| Class P: | |
| Shares Subscribed | | | 3 | | | | 1 | | | | 53 | | | | 2,196 | | |
| Shares Issued on Distributions Reinvested | | | 6 | | | | 8 | | | | — | | | | 28 | | |
| Shares Redeemed | | | (71 | ) | | | (190 | ) | | | (68 | ) | | | (169 | ) | |
| Net Increase (Decrease) in Class P Shares Outstanding | | | (62 | ) | | | (181 | ) | | | (15 | ) | | | 2,055 | | |
The accompanying notes are an integral part of the financial statements.
155
2011 Annual Report
December 31, 2011
Statements of Changes in Net Assets
| | | Select Global Infrastructure
Portfolio | |
| | | Year Ended
December 31,
2011
(000) | | Period from
September 20,
2010^ to
December 31,
2010
(000) | |
| Increase (Decrease) in Net Assets: | |
| Operations: | |
| Net Investment Income | | $ | 246 | | | $ | 79 | | |
| Net Realized Gain | | | 369 | | | | 25 | | |
| Net Change in Unrealized Appreciation (Depreciation) | | | 1,091 | | | | 376 | | |
| Net Increase in Net Assets Resulting from Operations | | | 1,706 | | | | 480 | | |
| Distributions from and/or in Excess of: | |
| Class I: | |
| Net Investment Income | | | (240 | ) | | | (80 | ) | |
| Net Realized Gain | | | (358 | ) | | | — | | |
| Class P: | |
| Net Investment Income | | | (2 | ) | | | (1 | ) | |
| Net Realized Gain | | | (3 | ) | | | — | | |
| Class H: | |
| Net Investment Income | | | (2 | ) | | | (1 | ) | |
| Net Realized Gain | | | (3 | ) | | | — | | |
| Class L: | |
| Net Investment Income | | | (1 | ) | | | (— | @) | |
| Net Realized Gain | | | (3 | ) | | | — | | |
| Total Distributions | | | (612 | ) | | | (82 | ) | |
| Capital Share Transactions:(1) | |
| Class I: | |
| Subscribed | | | 1,469 | | | | 9,700 | | |
| Distributions Reinvested | | | 65 | | | | — | | |
| Redeemed | | | (92 | ) | | | — | | |
| Class P: | |
| Subscribed | | | — | | | | 100 | | |
| Class H: | |
| Subscribed | | | — | | | | 100 | | |
| Class L: | |
| Subscribed | | | — | | | | 100 | | |
| Net Increase in Net Assets Resulting from Capital Share Transactions | | | 1,442 | | | | 10,000 | | |
| Total Increase in Net Assets | | | 2,536 | | | | 10,398 | | |
| Net Assets: | |
| Beginning of Period | | | 10,398 | | | | — | | |
| End of Period | | $ | 12,934 | | | $ | 10,398 | | |
| Undistributed (Distributions in Excess of) Net Investment Income Included in End of Period Net Assets | | $ | (— | @) | | $ | (1 | ) | |
| (1) Capital Share Transactions: | |
| Class I: | |
| Shares Subscribed | | | 127 | | | | 970 | | |
| Shares Issued on Distributions Reinvested | | | 6 | | | | — | | |
| Shares Redeemed | | | (8 | ) | | | — | | |
| Net Increase in Class I Shares Outstanding | | | 125 | | | | 970 | | |
| Class P: | |
| Shares Subscribed | | | — | | | | 10 | | |
| Class H: | |
| Shares Subscribed | | | — | | | | 10 | | |
| Class L: | |
| Shares Subscribed | | | — | | | | 10 | | |
^ Commencement of operations.
@ Amount is less than $500.
The accompanying notes are an integral part of the financial statements.
156
2011 Annual Report
December 31, 2011
Statements of Changes in Net Assets
| | | Advantage Portfolio | |
| | | Year Ended
December 31,
2011
(000) | | Period from
September 1 to
December 31,
2010
(000) | | Year Ended
August 31,
2010
(000) | |
| Increase (Decrease) in Net Assets: | |
| Operations: | |
| Net Investment Income | | $ | 24 | | | $ | 7 | | | $ | 23 | | |
| Net Realized Gain (Loss) | | | 214 | | | | 175 | | | | (172 | ) | |
| Net Change in Unrealized Appreciation (Depreciation) | | | 106 | | | | 850 | | | | 889 | | |
| Net Increase in Net Assets Resulting from Operations | | | 344 | | | | 1,032 | | | | 740 | | |
| Distributions from and/or in Excess of: | |
| Class I: | |
| Net Investment Income | | | (43 | ) | | | (16 | ) | | | (23 | ) | |
| Class P: | |
| Net Investment Income | | | (— | @) | | | (— | @) | | | — | | |
| Class H: | |
| Net Investment Income | | | (3 | ) | | | (2 | ) | | | (4 | ) | |
| Class L: | |
| Net Investment Income | | | (1 | ) | | | (— | @) | | | (1 | ) | |
| Class R:*** | |
| Net Investment Income | | | — | | | | — | | | | (— | @) | |
| Total Distributions | | | (47 | ) | | | (18 | ) | | | (28 | ) | |
| Capital Share Transactions:(1) | |
| Class A: | |
| Subscribed | | | — | | | | — | | | | — | | |
| Distributions Reinvested | | | — | | | | — | | | | — | | |
| Conversion to Class H in connection with Reorganization | | | — | | | | — | | | | (1,088 | ) | |
| Redeemed | | | — | | | | — | | | | — | | |
| Class B: | |
| Subscribed | | | — | | | | — | | | | 4 | * | |
| Distributions Reinvested | | | — | | | | — | | | | — | | |
| Conversion to Class H in connection with Reorganization | | | — | | | | — | | | | (212 | ) | |
| Redeemed | | | — | | | | — | | | | (43 | )* | |
| Class C: | |
| Subscribed | | | — | | | | — | | | | — | | |
| Distributions Reinvested | | | — | | | | — | | | | — | | |
| Conversion to Class L in connection with Reorganization | | | — | | | | — | | | | (154 | ) | |
| Redeemed | | | — | | | | — | | | | — | | |
| Class I: | |
| Subscribed | | | 1,997 | | | | — | | | | 11 | | |
| Distributions Reinvested | | | 12 | | | | — | @ | | | — | | |
| Conversion to Class I in connection with Reorganization | | | — | | | | — | | | | (4,141 | ) | |
| Conversion from Class I in connection with Reorganization | | | — | | | | — | | | | 4,141 | | |
| Redeemed | | | (22 | ) | | | — | @ | | | — | | |
| Class P: | |
| Subscribed | | | — | | | | 9 | | | | 1 | ** | |
| Class H: | |
| Subscribed | | | 25 | | | | — | | | | 331 | | |
| Distributions Reinvested | | | 3 | | | | 2 | | | | 4 | | |
| Conversion from Class A in connection with Reorganization | | | — | | | | — | | | | 1,088 | | |
| Conversion from Class B in connection with Reorganization | | | — | | | | — | | | | 212 | | |
| Redeemed | | | (187 | ) | | | (139 | ) | | | (420 | ) | |
| Class L: | |
| Subscribed | | | 50 | | | | — | | | | 1 | | |
| Distributions Reinvested | | | — | @ | | | — | @ | | | — | @ | |
| Conversion to Class C in connection with Reorganization | | | — | | | | — | | | | 154 | | |
| Redeemed | | | (4 | ) | | | (31 | ) | | | (25 | ) | |
| Class R:*** | |
| Redeemed | | | — | | | | — | | | | (97 | ) | |
| Net Increase (Decrease) in Net Assets Resulting from Capital Share Transactions | | | 1,874 | | | | (159 | ) | | | (233 | ) | |
| Total Increase in Net Assets | | | 2,171 | | | | 855 | | | | 479 | | |
| Net Assets: | |
| Beginning of Period | | | 6,283 | | | | 5,428 | | | | 4,949 | | |
| End of Period | | $ | 8,454 | | | $ | 6,283 | | | $ | 5,428 | | |
Undistributed (Distributions in excess of) Net Investment Income Included in
End of Period Net Assets | | $ | (22 | ) | | $ | 1 | | | $ | 12 | | |
The accompanying notes are an integral part of the financial statements.
157
2011 Annual Report
December 31, 2011
Statements of Changes in Net Assets (cont'd)
| | | Advantage Portfolio | |
| | | Year Ended
December 31,
2011
(000) | | Period from
September 1 to
December 31,
2010
(000) | | Year Ended
August 31,
2010
(000) | |
| (1) Capital Share Transactions: | |
| Class A: | |
| Shares Subscribed | | | — | | | | — | | | | — | | |
| Shares Issued on Distributions Reinvested | | | — | | | | — | | | | — | | |
| Conversion to Class H in connection with Reorganization | | | — | | | | — | | | | (121 | ) | |
| Shares Redeemed | | | — | | | | — | | | | — | | |
| Net Decrease in Class A Shares Outstanding | | | — | | | | — | | | | (121 | ) | |
| Class B: | |
| Shares Subscribed | | | — | | | | — | | | | — | @@* | |
| Shares Issued on Distributions Reinvested | | | — | | | | — | | | | — | | |
| Conversion to Class H in connection with Reorganization | | | — | | | | — | | | | (24 | ) | |
| Shares Redeemed | | | — | | | | — | | | | (4 | )* | |
| Net Decrease in Class B Shares Outstanding | | | — | | | | — | | | | (28 | ) | |
| Class C: | |
| Shares Subscribed | | | — | | | | — | | | | — | | |
| Shares Issued on Distributions Reinvested | | | — | | | | — | | | | — | | |
| Conversion to Class L in connection with Reorganization | | | — | | | | — | | | | (17 | ) | |
| Shares Redeemed | | | — | | | | — | | | | — | | |
| Net Decrease in Class C Shares Outstanding | | | — | | | | — | | | | (17 | ) | |
| Class I: | |
| Shares Subscribed | | | 176 | | | | — | | | | 1 | | |
| Shares Issued on Distributions Reinvested | | | 1 | | | | — | @@ | | | — | | |
| Conversion to Class I in connection with Reorganization | | | — | | | | — | | | | (460 | ) | |
| Conversion from Class I in connection with Reorganization | | | — | | | | — | | | | 460 | | |
| Shares Redeemed | | | (2 | ) | | | (— | @@) | | | — | | |
| Net Increase in Class I Shares Outstanding | | | 175 | | | | — | @@ | | | 1 | | |
| Class P: | |
| Shares Subscribed | | | — | | | | 1 | | | | — | @@** | |
| Class H: | |
| Shares Subscribed | | | 2 | | | | — | | | | 35 | | |
| Shares Issued on Distributions Reinvested | | | — | @@ | | | — | @@ | | | — | @@ | |
| Conversion from Class A in connection with Reorganization | | | — | | | | — | | | | 121 | | |
| Conversion from Class B in connection with Reorganization | | | — | | | | — | | | | 24 | | |
| Shares Redeemed | | | (16 | ) | | | (13 | ) | | | (47 | ) | |
| Net Decrease in Class H Shares Outstanding | | | (14 | ) | | | (13 | ) | | | (133 | ) | |
| Class L: | |
| Shares Subscribed | | | 4 | | | | — | | | | — | @@ | |
| Shares Issued on Distributions Reinvested | | | — | @@ | | | — | @@ | | | — | @@ | |
| Conversion from Class C in connection with Reorganization | | | — | | | | — | | | | 17 | | |
| Shares Redeemed | | | (— | @@) | | | (3 | ) | | | (3 | ) | |
| Net Increase (Decrease) in Class L Shares Outstanding | | | 4 | | | | (3 | ) | | | 14 | | |
| Class R:*** | |
| Shares Redeemed | | | — | | | | — | | | | (10 | ) | |
* For the period September 1, 2009 through May 21, 2010.
** For the period May 21, 2010 through August 31, 2010.
*** Class R shares liquidated on April 30, 2010.
@ Amount is less than $500.
@@ Amount is less than 500 shares.
The accompanying notes are an integral part of the financial statements.
158
2011 Annual Report
December 31, 2011
Statements of Changes in Net Assets
| | | Focus Growth Portfolio | | Growth Portfolio | |
| | | Year Ended
December 31,
2011
(000) | | Year Ended
December 31,
2010
(000) | | Year Ended
December 31,
2011
(000) | | Year Ended
December 31,
2010
(000) | |
| Increase (Decrease) in Net Assets: | |
| Operations: | |
| Net Investment Income (Loss) | | $ | (72 | ) | | $ | (34 | ) | | $ | 30 | | | $ | 1,770 | | |
| Net Realized Gain | | | 1,223 | | | | 1,193 | | | | 77,749 | | | | 29,690 | | |
| Net Change in Unrealized Appreciation (Depreciation) | | | (3,087 | ) | | | 2,402 | | | | (100,432 | ) | | | 126,809 | | |
| Net Increase (Decrease) in Net Assets Resulting from Operations | | | (1,936 | ) | | | 3,561 | | | | (22,653 | ) | | | 158,269 | | |
| Distributions from and/or in Excess of: | |
| Class I: | |
| Net Investment Income | | | — | | | | — | | | | (1,649 | ) | | | (13 | ) | |
| Class P: | |
| Net Investment Income | | | — | | | | — | | | | (79 | ) | | | (2 | ) | |
| Total Distributions | | | — | | | | — | | | | (1,728 | ) | | | (15 | ) | |
| Capital Share Transactions:(1) | |
| Class I: | |
| Subscribed | | | 15,239 | | | | 11,367 | | | | 95,503 | | | | 60,077 | | |
| Distributions Reinvested | | | — | | | | — | | | | 1,646 | | | | 13 | | |
| Redeemed | | | (8,677 | ) | | | (4,851 | ) | | | (159,435 | ) | | | (165,796 | ) | |
| Class P: | |
| Subscribed | | | 126 | | | | 281 | | | | 33,841 | | | | 38,853 | | |
| Distributions Reinvested | | | — | | | | — | | | | 79 | | | | 2 | | |
| Redeemed | | | (109 | ) | | | (374 | ) | | | (30,278 | ) | | | (23,953 | ) | |
| Net Increase (Decrease) in Net Assets Resulting from Capital Share Transactions | | | 6,579 | | | | 6,423 | | | | (58,644 | ) | | | (90,804 | ) | |
| Total Increase (Decrease) in Net Assets | | | 4,643 | | | | 9,984 | | | | (83,025 | ) | | | 67,450 | | |
| Net Assets: | |
| Beginning of Period | | | 19,322 | | | | 9,338 | | | | 840,995 | | | | 773,545 | | |
| End of Period | | $ | 23,965 | | | $ | 19,322 | | | $ | 757,970 | | | $ | 840,995 | | |
Undistributed (Distributions in Excess of) Net Investment Income Included in
End of Period Net Assets | | $ | 2 | | | $ | — | | | $ | 24 | | | $ | 1,721 | | |
| (1) Capital Share Transactions: | |
| Class I: | |
| Shares Subscribed | | | 773 | | | | 673 | | | | 3,775 | | | | 2,868 | | |
| Shares Issued on Distributions Reinvested | | | — | | | | — | | | | 60 | | | | 1 | | |
| Shares Redeemed | | | (440 | ) | | | (289 | ) | | | (6,374 | ) | | | (8,037 | ) | |
| Net Increase (Decrease) in Class I Shares Outstanding | | | 333 | | | | 384 | | | | (2,539 | ) | | | (5,168 | ) | |
| Class P: | |
| Shares Subscribed | | | 6 | | | | 17 | | | | 1,380 | | | | 1,744 | | |
| Shares Issued on Distributions Reinvested | | | — | | | | — | | | | 3 | | | | — | @@ | |
| Shares Redeemed | | | (6 | ) | | | (25 | ) | | | (1,222 | ) | | | (1,137 | ) | |
| Net Increase (Decrease) in Class P Shares Outstanding | | | — | @@ | | | (8 | ) | | | 161 | | | | 607 | | |
@@ Amount is less than 500 shares.
The accompanying notes are an integral part of the financial statements.
159
2011 Annual Report
December 31, 2011
Statements of Changes in Net Assets
| | | Insight Portfolio | |
| | | Period from
December 28,
2011^ to
December 31,
2011
(000) | |
| Increase (Decrease) in Net Assets: | |
| Operations: | |
| Net Investment Loss | | $ | (— | @) | |
| Net Change in Unrealized Appreciation (Depreciation) | | | 5 | | |
| Net Increase in Net Assets Resulting from Operations | | | 5 | | |
| Capital Share Transactions:(1) | |
| Class I: | |
| Subscribed | | | 10 | | |
| Class H: | |
| Subscribed | | | 810 | | |
| Class L: | |
| Subscribed | | | 10 | | |
| Net Increase in Net Assets Resulting from Capital Share Transactions | | | 830 | | |
| Total Increase in Net Assets | | | 835 | | |
| Net Assets: | |
| Beginning of Period | | | — | | |
| End of Period | | $ | 835 | | |
| Distributions in Excess of Net Investment Income Included in End of Period Net Assets | | $ | — | | |
| (1) Capital Share Transactions: | |
| Class I: | |
| Shares Subscribed | | | 1 | | |
| Class H: | |
| Shares Subscribed | | | 81 | | |
| Class L: | |
| Shares Subscribed | | | 1 | | |
^ Commencement of operation.
@ Amount is less than $500.
The accompanying notes are an integral part of the financial statements.
160
2011 Annual Report
December 31, 2011
Statements of Changes in Net Assets
| | | Opportunity Portfolio | |
| | | Year Ended
December 31,
2011
(000) | | Period from
July 1 to
December 31,
2010
(000) | | Year Ended
June 30,
2010
(000) | |
| Increase (Decrease) in Net Assets: | |
| Operations: | |
| Net Investment Loss | | $ | (804 | ) | | $ | (69 | ) | | $ | (1,862 | ) | |
| Net Realized Gain | | | 22,570 | | | | 17,322 | | | | 36,391 | | |
| Net Change in Unrealized Appreciation (Depreciation) | | | (21,762 | ) | | | 51,253 | | | | 35,289 | | |
| Net Increase in Net Assets Resulting from Operations | | | 4 | | | | 68,506 | | | | 69,818 | | |
| Capital Share Transactions:(1) | |
| Class A: | |
| Subscribed | | | — | | | | — | | | | — | | |
| Conversion to Class H in connection with Reorganization | | | — | | | | — | | | | (228,193 | ) | |
| Redeemed | | | — | | | | — | | | | — | | |
| Class B: | |
| Subscribed | | | — | | | | — | | | | 7,121 | * | |
| Conversion to Class H in connection with Reorganization | | | — | | | | — | | | | (30,342 | ) | |
| Redeemed | | | — | | | | — | | | | (17,901 | )* | |
| Class C: | |
| Subscribed | | | — | | | | — | | | | — | | |
| Conversion to Class L in connection with Reorganization | | | — | | | | — | | | | (39,143 | ) | |
| Redeemed | | | — | | | | — | | | | — | | |
| Class I: | |
| Subscribed | | | 6,663 | | | | 1,356 | | | | 19,262 | | |
| Conversion to Class I in connection with Reorganization | | | — | | | | — | | | | (7,430 | ) | |
| Conversion from Class I in connection with Reorganization | | | — | | | | — | | | | 7,430 | | |
| Redeemed | | | (6,311 | ) | | | (2,412 | ) | | | (17,891 | ) | |
| Class P: | |
| Subscribed | | | 2,502 | | | | 2,009 | | | | 1 | ** | |
| Redeemed | | | (2,407 | ) | | | — | | | | — | | |
| Class H: | |
| Subscribed | | | 7,548 | | | | 1,877 | | | | 85,104 | | |
| Conversion from Class A in connection with Reorganization | | | — | | | | — | | | | 228,193 | | |
| Conversion from Class B in connection with Reorganization | | | — | | | | — | | | | 30,342 | | |
| Redeemed | | | (50,831 | ) | | | (37,580 | ) | | | (155,308 | ) | |
| Class L: | |
| Subscribed | | | 500 | | | | 362 | | | | 10,142 | | |
| Conversion from Class C in connection with Reorganization | | | — | | | | — | | | | 39,143 | | |
| Redeemed | | | (9,104 | ) | | | (4,780 | ) | | | (10,734 | ) | |
| Net Decrease in Net Assets Resulting from Capital Share Transactions | | | (51,440 | ) | | | (39,168 | ) | | | (80,204 | ) | |
| Total Increase (Decrease) in Net Assets | | | (51,436 | ) | | | 29,338 | | | | (10,386 | ) | |
| Net Assets: | |
| Beginning of Period | | | 295,486 | | | | 266,148 | | | | 276,534 | | |
| End of Period | | $ | 244,050 | | | $ | 295,486 | | | $ | 266,148 | | |
| Accumulated Net Investment Loss Included in End of Period Net Assets | | $ | (13 | ) | | $ | (112 | ) | | $ | (28 | ) | |
The accompanying notes are an integral part of the financial statements.
161
2011 Annual Report
December 31, 2011
Statements of Changes in Net Assets (cont'd)
| | | Opportunity Portfolio | |
| | | Year Ended
December 31,
2011
(000) | | Period from
July 1 to
December 31,
2010
(000) | | Year Ended
June 30,
2010
(000) | |
| (1) Capital Share Transactions: | |
| Class A: | |
| Shares Subscribed | | | — | | | | — | | | | — | | |
| Conversion to Class H in connection with Reorganization | | | — | | | | — | | | | (19,044 | ) | |
| Shares Redeemed | | | — | | | | — | | | | — | | |
| Net Decrease in Class A Shares Outstanding | | | — | | | | — | | | | (19,044 | ) | |
| Class B: | |
| Shares Subscribed | | | — | | | | — | | | | 649 | * | |
| Conversion to Class H in connection with Reorganization | | | — | | | | — | | | | (2,713 | ) | |
| Shares Redeemed | | | — | | | | — | | | | (1,595 | )* | |
| Net Decrease in Class B Shares Outstanding | | | — | | | | — | | | | (3,659 | ) | |
| Class C: | |
| Shares Subscribed | | | — | | | | — | | | | — | | |
| Conversion to Class L in connection with Reorganization | | | — | | | | — | | | | (3,562 | ) | |
| Shares Redeemed | | | — | | | | — | | | | — | | |
| Net Decrease in Class A Shares Outstanding | | | — | | | | — | | | | (3,562 | ) | |
| Class I: | |
| Shares Subscribed | | | 429 | | | | 97 | | | | 1,579 | | |
| Conversion to Class I in connection with Reorganization | | | — | | | | — | | | | (613 | ) | |
| Conversion from Class I in connection with Reorganization | | | — | | | | — | | | | 613 | | |
| Shares Redeemed | | | (399 | ) | | | (178 | ) | | | (1,443 | ) | |
| Net Increase (Decrease) in Class I Shares Outstanding | | | 30 | | | | (81 | ) | | | 136 | | |
| Class P: | |
| Shares Subscribed | | | 154 | | | | 139 | | | | — | @@** | |
| Shares Redeemed | | | (154 | ) | | | — | | | | — | | |
| Net Increase in Class I Shares Outstanding | | | — | @@ | | | 139 | | | | — | @@** | |
| Class H: | |
| Shares Subscribed | | | 486 | | | | 135 | | | | 7,209 | | |
| Conversion from Class A in connection with Reorganization | | | — | | | | — | | | | 19,044 | | |
| Conversion from Class B in connection with Reorganization | | | — | | | | — | | | | 2,532 | | |
| Shares Redeemed | | | (3,265 | ) | | | (2,815 | ) | | | (12,894 | ) | |
| Net Increase (Decrease) in Class H Shares Outstanding | | | (2,779 | ) | | | (2,680 | ) | | | 15,891 | | |
| Class L: | |
| Shares Subscribed | | | 36 | | | | 28 | | | | 931 | | |
| Conversion from Class C in connection with Reorganization | | | — | | | | — | | | | 3,562 | | |
| Shares Redeemed | | | (643 | ) | | | (383 | ) | | | (966 | ) | |
| Net Increase (Decrease) in Class L Shares Outstanding | | | (607 | ) | | | (355 | ) | | | 3,527 | | |
* For the period July 1, 2009 through May 21, 2010.
** For the period May 21, 2010 through June 30, 2010.
@@ Amount is less than 500 shares.
The accompanying notes are an integral part of the financial statements.
162
2011 Annual Report
December 31, 2011
Statements of Changes in Net Assets
| | | Small Company Growth
Portfolio | | U.S. Real Estate
Portfolio | |
| | | Year Ended
December 31,
2011
(000) | | Year Ended
December 31,
2010
(000) | | Year Ended
December 31,
2011
(000) | | Year Ended
December 31,
2010
(000) | |
| Increase (Decrease) in Net Assets: | |
| Operations: | |
| Net Investment Income (Loss) | | $ | (5,631 | ) | | $ | 237 | | | $ | 7,100 | | | $ | 12,536 | | |
| Net Realized Gain (Loss) | | | 47,068 | | | | (19,991 | ) | | | 93,337 | | | | 110,425 | | |
| Net Change in Unrealized Appreciation (Depreciation) | | | (193,850 | ) | | | 404,906 | | | | (49,800 | ) | | | 117,403 | | |
| Net Increase (Decrease) in Net Assets Resulting from Operations | | | (152,413 | ) | | | 385,152 | | | | 50,637 | | | | 240,364 | | |
| Distributions from and/or in Excess of: | |
| Class I: | |
| Net Investment Income | | | — | | | | — | | | | (7,696 | ) | | | (10,759 | ) | |
| Net Realized Gain | | | (19,649 | ) | | | — | | | | — | | | | — | | |
| Class P: | |
| Net Investment Income | | | — | | | | — | | | | (714 | ) | | | (1,535 | ) | |
| Net Realized Gain | | | (5,558 | ) | | | — | | | | — | | | | — | | |
| Class H: | |
| Net Realized Gain | | | (630 | ) | | | — | | | | — | | | | — | | |
| Class L: | |
| Net Realized Gain | | | (33 | ) | | | — | | | | — | | | | — | | |
| Total Distributions | | | (25,870 | ) | | | — | | | | (8,410 | ) | | | (12,294 | ) | |
| Capital Share Transactions:(1) | |
| Class I: | |
| Subscribed | | | 262,046 | | | | 200,631 | | | | 189,073 | | | | 509,963 | | |
| Issued due to a tax-free reorganization | | | 56 | | | | — | | | | 635 | | | | — | | |
| Distributions Reinvested | | | 17,686 | | | | — | | | | 6,787 | | | | 10,349 | | |
| Redeemed | | | (300,632 | ) | | | (215,682 | ) | | | (316,556 | ) | | | (449,135 | ) | |
| Class P: | |
| Subscribed | | | 61,496 | | | | 78,528 | | | | 31,619 | | | | 52,948 | | |
| Distributions Reinvested | | | 5,556 | | | | — | | | | 697 | | | | 875 | | |
| Redeemed | | | (270,497 | ) | | | (204,668 | ) | | | (33,714 | ) | | | (109,259 | ) | |
| Class H:* | |
| Subscribed | | | 29 | | | | — | | | | 156 | | | | — | | |
| Issued due to a tax-free reorganization | | | 34,449 | | | | — | | | | 27,271 | | | | — | | |
| Distributions Reinvested | | | 612 | | | | — | | | | — | | | | — | | |
| Redeemed | | | (1,272 | ) | | | — | | | | (1,095 | ) | | | — | | |
| Class L:* | |
| Subscribed | | | 1 | | | | — | | | | 15 | | | | — | | |
| Issued due to a tax-free reorganization | | | 1,783 | | | | — | | | | 6,074 | | | | — | | |
| Distributions Reinvested | | | 32 | | | | — | | | | — | | | | — | | |
| Redeemed | | | (63 | ) | | | — | | | | (276 | ) | | | — | | |
| Net Increase (Decrease) in Net Assets Resulting from Capital Share Transactions | | | (188,718 | ) | | | (141,191 | ) | | | (89,314 | ) | | | 15,741 | | |
| Redemption Fees | | | 139 | | | | 100 | | | | — | | | | — | | |
| Total Increase (Decrease) in Net Assets | | | (366,862 | ) | | | 244,061 | | | | (47,087 | ) | | | 243,811 | | |
| Net Assets: | |
| Beginning of Period | | | 1,757,905 | | | | 1,513,844 | | | | 944,795 | | | | 700,984 | | |
| End of Period | | $ | 1,391,043 | | | $ | 1,757,905 | | | $ | 897,708 | | | $ | 944,795 | | |
Undistributed (Distributions in Excess of) Net Investment Income Included in
End of Period Net Assets | | $ | (832 | ) | | $ | 147 | | | $ | 1,239 | | | $ | 340 | | |
The accompanying notes are an integral part of the financial statements.
163
2011 Annual Report
December 31, 2011
Statements of Changes in Net Assets (cont'd)
| | | Small Company Growth
Portfolio | | U.S. Real Estate
Portfolio | |
| | | Year Ended
December 31,
2011
(000) | | Year Ended
December 31,
2010
(000) | | Year Ended
December 31,
2011
(000) | | Year Ended
December 31,
2010
(000) | |
| (1) Capital Share Transactions: | |
| Class I: | |
| Shares Subscribed | | | 18,817 | | | | 17,409 | | | | 12,757 | | | | 40,569 | | |
| Shares Issued due to tax-free reorganization | | | 4 | | | | — | | | | 43 | | | | — | | |
| Shares Issued on Distributions Reinvested | | | 1,416 | | | | — | | | | 462 | | | | 821 | | |
| Shares Redeemed | | | (21,915 | ) | | | (18,495 | ) | | | (21,365 | ) | | | (34,016 | ) | |
| Net Increase (Decrease) in Class I Shares Outstanding | | | (1,678 | ) | | | (1,086 | ) | | | (8,103 | ) | | | 7,374 | | |
| Class P: | |
| Shares Subscribed | | | 4,662 | | | | 7,233 | | | | 2,176 | | | | 4,243 | | |
| Shares Issued on Distributions Reinvested | | | 477 | | | | — | | | | 48 | | | | 71 | | |
| Shares Redeemed | | | (21,097 | ) | | | (18,553 | ) | | | (2,312 | ) | | | (8,540 | ) | |
| Net Decrease in Class P Shares Outstanding | | | (15,958 | ) | | | (11,320 | ) | | | (88 | ) | | | (4,226 | ) | |
| Class H:* | |
| Shares Subscribed | | | 3 | | | | — | | | | 11 | | | | — | | |
| Shares Issued due to tax-free reorganization | | | 2,763 | | | | — | | | | 1,878 | | | | — | | |
| Shares Issued on Distributions Reinvested | | | 52 | | | | — | | | | — | | | | — | | |
| Shares Redeemed | | | (105 | ) | | | — | | | | (77 | ) | | | — | | |
| Net Increase in Class H Shares Outstanding | | | 2,713 | | | | — | | | | 1,812 | | | | — | | |
| Class L:* | |
| Shares Subscribed | | | — | @@ | | | — | | | | 1 | | | | — | | |
| Shares Issued due to tax-free reorganization | | | 143 | | | | — | | | | 418 | | | | — | | |
| Shares Issued on Distributions Reinvested | | | 3 | | | | — | | | | — | | | | — | | |
| Shares Redeemed | | | (5 | ) | | | — | | | | (19 | ) | | | — | | |
| Net Increase in Class L Shares Outstanding | | | 141 | | | | — | | | | 400 | | | | — | | |
* For the period November 11, 2011 (commencement of operations) through December 31, 2011.
@@ Amount is less than 500 shares.
The accompanying notes are an integral part of the financial statements.
164
2011 Annual Report
December 31, 2011
Statements of Changes in Net Assets
| | | Emerging Markets Debt
Portfolio | |
| | | Year Ended
December 31,
2011
(000) | | Year Ended
December 31,
2010
(000) | |
| Increase (Decrease) in Net Assets: | |
| Operations: | |
| Net Investment Income | | $ | 3,562 | | | $ | 3,316 | | |
| Net Realized Gain (Loss) | | | (647 | ) | | | 3,430 | | |
| Net Change in Unrealized Appreciation (Depreciation) | | | (7,552 | ) | | | 41 | | |
| Net Increase (Decrease) in Net Assets Resulting from Operations | | | (4,637 | ) | | | 6,787 | | |
| Distributions from and/or in Excess of: | |
| Class I: | |
| Net Investment Income | | | (3,114 | ) | | | (2,318 | ) | |
| Net Realized Gain | | | (764 | ) | | | (1,180 | ) | |
| Class P: | |
| Net Investment Income | | | (397 | ) | | | (438 | ) | |
| Net Realized Gain | | | (96 | ) | | | (279 | ) | |
| Class H: | |
| Net Investment Income | | | (114 | ) | | | (142 | ) | |
| Net Realized Gain | | | (26 | ) | | | (87 | ) | |
| Class L: | |
| Net Investment Income | | | (227 | ) | | | (251 | ) | |
| Net Realized Gain | | | (63 | ) | | | (197 | ) | |
| Total Distributions | | | (4,801 | ) | | | (4,892 | ) | |
| Capital Share Transactions:(1) | |
| Class I: | |
| Subscribed | | | 72,085 | | | | 22,346 | | |
| Distributions Reinvested | | | 1,766 | | | | 2,966 | | |
| Redeemed | | | (25,667 | ) | | | (36,261 | ) | |
| Class P: | |
| Subscribed | | | 3,753 | | | | 2,343 | | |
| Distributions Reinvested | | | 493 | | | | 717 | | |
| Redeemed | | | (3,289 | ) | | | (794 | ) | |
| Class H: | |
| Subscribed | | | 2,128 | | | | 491 | | |
| Distributions Reinvested | | | 140 | | | | 229 | | |
| Redeemed | | | (960 | ) | | | (1,095 | ) | |
| Class L: | |
| Subscribed | | | 1,819 | | | | 3,837 | | |
| Distributions Reinvested | | | 290 | | | | 448 | | |
| Redeemed | | | (1,205 | ) | | | (819 | ) | |
| Net Increase (Decrease) in Net Assets Resulting from Capital Share Transactions | | | 51,353 | | | | (5,592 | ) | |
| Redemption Fees | | | 1 | | | | 1 | | |
| Total Increase (Decrease) in Net Assets | | | 41,916 | | | | (3,696 | ) | |
| Net Assets: | |
| Beginning of Period | | | 42,345 | | | | 46,041 | | |
| End of Period | | $ | 84,261 | | | $ | 42,345 | | |
| Undistributed Net Investment Income Included in End of Period Net Assets | | $ | (9 | ) | | $ | 950 | | |
The accompanying notes are an integral part of the financial statements.
165
2011 Annual Report
December 31, 2011
Statements of Changes in Net Assets (cont'd)
| | | Emerging Markets Debt
Portfolio | |
| | | Year Ended
December 31,
2011
(000) | | Year Ended
December 31,
2010
(000) | |
| (1) Capital Share Transactions: | |
| Class I: | |
| Shares Subscribed | | | 5,856 | | | | 1,740 | | |
| Shares Issued on Distributions Reinvested | | | 149 | | | | 237 | | |
| Shares Redeemed | | | (2,133 | ) | | | (2,788 | ) | |
| Net Increase (Decrease) in Class I Shares Outstanding | | | 3,872 | | | | (811 | ) | |
| Class P: | |
| Shares Subscribed | | | 292 | | | | 183 | | |
| Shares Issued on Distributions Reinvested | | | 40 | | | | 56 | | |
| Shares Redeemed | | | (277 | ) | | | (60 | ) | |
| Net Increase in Class P Shares Outstanding | | | 55 | | | | 179 | | |
| Class H: | |
| Shares Subscribed | | | 163 | | | | 39 | | |
| Shares Issued on Distributions Reinvested | | | 12 | | | | 18 | | |
| Shares Redeemed | | | (77 | ) | | | (85 | ) | |
| Net Increase (Decrease) in Class H Shares Outstanding | | | 98 | | | | (28 | ) | |
| Class L: | |
| Shares Subscribed | | | 142 | | | | 293 | | |
| Shares Issued on Distributions Reinvested | | | 24 | | | | 36 | | |
| Shares Redeemed | | | (100 | ) | | | (63 | ) | |
| Net Increase in Class L Shares Outstanding | | | 66 | | | | 266 | | |
The accompanying notes are an integral part of the financial statements.
166
2011 Annual Report
December 31, 2011
Financial Highlights
Active International Allocation Portfolio
| | | Class I | |
| | | Year Ended December 31, | |
| Selected Per Share Data and Ratios | | 2011 | | 2010 | | 2009 | | 2008 | | 2007 | |
| Net Asset Value, Beginning of Period | | $ | 12.06 | | | $ | 11.30 | | | $ | 9.11 | | | $ | 15.92 | | | $ | 15.10 | | |
| Income (Loss) from Investment Operations: | |
| Net Investment Income† | | | 0.27 | | | | 0.20 | | | | 0.21 | | | | 0.35 | | | | 0.30 | | |
| Net Realized and Unrealized Gain (Loss) | | | (2.03 | ) | | | 0.81 | | | | 2.26 | | | | (6.41 | ) | | | 1.96 | | |
| Total from Investment Operations | | | (1.76 | ) | | | 1.01 | | | | 2.47 | | | | (6.06 | ) | | | 2.26 | | |
| Distributions from and/or in Excess of: | |
| Net Investment Income | | | (0.23 | ) | | | (0.25 | ) | | | (0.28 | ) | | | (0.14 | ) | | | (0.54 | ) | |
| Net Realized Gain | | | — | | | | — | | | | — | | | | (0.61 | ) | | | (0.90 | ) | |
| Total Distributions | | | (0.23 | ) | | | (0.25 | ) | | | (0.28 | ) | | | (0.75 | ) | | | (1.44 | ) | |
| Redemption Fees | | | 0.00 | ‡ | | | 0.00 | ‡ | | | 0.00 | ‡ | | | 0.00 | ‡ | | | 0.00 | ‡ | |
| Net Asset Value, End of Period | | $ | 10.07 | | | $ | 12.06 | | | $ | 11.30 | | | $ | 9.11 | | | $ | 15.92 | | |
| Total Return++ | | | (14.56 | )% | | | 8.95 | % | | | 27.26 | % | | | (39.25 | )% | | | 15.30 | % | |
| Ratios and Supplemental Data: | |
| Net Assets, End of Period (Thousands) | | $ | 302,048 | | | $ | 441,350 | | | $ | 532,584 | | | $ | 565,313 | | | $ | 1,093,735 | | |
| Ratio of Expenses to Average Net Assets (1) | | | 0.84 | %+††^ | | | 0.79 | %+†† | | | 0.79 | %+ | | | 0.79 | %+ | | | 0.80 | %+ | |
| Ratio of Expenses to Average Net Assets Excluding Non Operating Expenses | | | 0.84 | %+††^ | | | 0.79 | %+†† | | | 0.79 | %+ | | | 0.79 | %+ | | | 0.80 | %+ | |
| Ratio of Net Investment Income to Average Net Assets (1) | | | 2.33 | %+†† | | | 1.82 | %+†† | | | 2.23 | %+ | | | 2.70 | %+ | | | 1.93 | %+ | |
| Ratio of Rebate from Morgan Stanley Affiliates to Average Net Assets | | | 0.01 | %†† | | | 0.01 | %†† | | | 0.01 | % | | | 0.01 | % | | | 0.00 | %§ | |
| Portfolio Turnover Rate | | | 26 | % | | | 19 | % | | | 33 | % | | | 34 | % | | | 28 | % | |
| (1) Supplemental Information on the Ratios to Average Net Assets: | |
| Ratios Before Expense Limitation: | |
| Expenses to Average Net Assets | | | 0.95 | %†† | | | 0.92 | %+†† | | | 0.85 | %+ | | | 0.82 | %+ | | | 0.81 | %+ | |
| Net Investment Income to Average Net Assets | | | 2.22 | %†† | | | 1.69 | %+†† | | | 2.17 | %+ | | | 2.67 | %+ | | | 1.92 | %+ | |
† Per share amount is based on average shares outstanding.
‡ Amount is less than $0.005 per share.
++ Calculated based on the net asset value as of the last business day of the period.
+ The Ratios of Expenses and Net Investment Income reflect the rebate of certain Portfolio expenses in connection with the investments in Morgan Stanley affiliates during the period. The effect of the rebate on the ratios is disclosed in the above table as "Ratio of Rebate from Morgan Stanley Affiliates to Average Net Assets."
†† Reflects overall Portfolio ratios for investment income and non-class specific expenses.
§ Amount is less than 0.005%.
^ Effective July 1, 2011, the Adviser has agreed to limit the ratio of expenses to average net assets to the maximum ratio of 0.90% for Class I shares. Prior to July 1, 2011, the maximum ratio was 0.80% for Class I shares.
The accompanying notes are an integral part of the financial statements.
167
2011 Annual Report
December 31, 2011
Financial Highlights
Active International Allocation Portfolio
| | | Class P | |
| | | Year Ended December 31, | |
| Selected Per Share Data and Ratios | | 2011 | | 2010 | | 2009 | | 2008 | | 2007 | |
| Net Asset Value, Beginning of Period | | $ | 12.28 | | | $ | 11.50 | | | $ | 9.27 | | | $ | 16.20 | | | $ | 15.36 | | |
| Income (Loss) from Investment Operations: | |
| Net Investment Income† | | | 0.25 | | | | 0.18 | | | | 0.18 | | | | 0.29 | | | | 0.24 | | |
| Net Realized and Unrealized Gain (Loss) | | | (2.07 | ) | | | 0.81 | | | | 2.31 | | | | (6.48 | ) | | | 2.01 | | |
| Total from Investment Operations | | | (1.82 | ) | | | 0.99 | | | | 2.49 | | | | (6.19 | ) | | | 2.25 | | |
| Distributions from and/or in Excess of: | |
| Net Investment Income | | | (0.19 | ) | | | (0.21 | ) | | | (0.26 | ) | | | (0.13 | ) | | | (0.51 | ) | |
| Net Realized Gain | | | — | | | | — | | | | — | | | | (0.61 | ) | | | (0.90 | ) | |
| Total Distributions | | | (0.19 | ) | | | (0.21 | ) | | | (0.26 | ) | | | (0.74 | ) | | | (1.41 | ) | |
| Redemption Fees | | | 0.00 | ‡ | | | 0.00 | ‡ | | | 0.00 | ‡ | | | 0.00 | ‡ | | | 0.00 | ‡ | |
| Net Asset Value, End of Period | | $ | 10.27 | | | $ | 12.28 | | | $ | 11.50 | | | $ | 9.27 | | | $ | 16.20 | | |
| Total Return++ | | | (14.75 | )% | | | 8.69 | % | | | 26.99 | % | | | (39.41 | )% | | | 14.95 | % | |
| Ratios and Supplemental Data: | |
| Net Assets, End of Period (Thousands) | | $ | 10,387 | | | $ | 14,477 | | | $ | 16,479 | | | $ | 7,614 | | | $ | 5,285 | | |
| Ratio of Expenses to Average Net Assets (1) | | | 1.09 | %+††^ | | | 1.04 | %+†† | | | 1.04 | %+ | | | 1.04 | %+ | | | 1.05 | %+ | |
| Ratio of Expenses to Average Net Assets Excluding Non Operating Expenses | | | 1.09 | %+††^ | | | 1.04 | %+†† | | | 1.04 | %+ | | | 1.04 | %+ | | | 1.05 | %+ | |
| Ratio of Net Investment Income to Average Net Assets (1) | | | 2.08 | %+†† | | | 1.57 | %+†† | | | 1.80 | %+ | | | 2.32 | %+ | | | 1.52 | %+ | |
| Ratio of Rebate from Morgan Stanley Affiliates to Average Net Assets | | | 0.01 | %†† | | | 0.01 | %†† | | | 0.01 | % | | | 0.01 | % | | | 0.00 | %§ | |
| Portfolio Turnover Rate | | | 26 | % | | | 19 | % | | | 33 | % | | | 34 | % | | | 28 | % | |
| (1) Supplemental Information on the Ratios to Average Net Assets: | |
| Ratios Before Expense Limitation: | |
| Expenses to Average Net Assets | | | 1.20 | %†† | | | 1.17 | %+†† | | | 1.10 | %+ | | | 1.07 | %+ | | | 1.06 | %+ | |
| Net Investment Income to Average Net Assets | | | 1.97 | %†† | | | 1.44 | %+†† | | | 1.74 | %+ | | | 2.29 | %+ | | | 1.51 | %+ | |
† Per share amount is based on average shares outstanding.
‡ Amount is less than $0.005 per share.
++ Calculated based on the net asset value as of the last business day of the period.
+ The Ratios of Expenses and Net Investment Income reflect the rebate of certain Portfolio expenses in connection with the investments in Morgan Stanley affiliates during the period. The effect of the rebate on the ratios is disclosed in the above table as "Ratio of Rebate from Morgan Stanley Affiliates to Average Net Assets."
†† Reflects overall Portfolio ratios for investment income and non-class specific expenses.
§ Amount is less than 0.005%.
^ Effective July 1, 2011, the Adviser has agreed to limit the ratio of expenses to average net assets to the maximum ratio of 1.15% for Class P shares. Prior to July 1, 2011, the maximum ratio was 1.05% for Class P shares.
The accompanying notes are an integral part of the financial statements.
168
2011 Annual Report
December 31, 2011
Financial Highlights
Asian Equity Portfolio
| | | Class I | |
| Selected Per Share Data and Ratios | | Year Ended
December 31,
2011 | | Period from
December 28,
2010^ to
December 31,
2010 | |
| Net Asset Value, Beginning of Period | | $ | 10.19 | | | $ | 10.00 | | |
| Income (Loss) from Investment Operations: | |
| Net Investment Income (Loss)† | | | 0.00 | ‡ | | | (0.00 | )‡ | |
| Net Realized and Unrealized Gain (Loss) | | | (1.72 | ) | | | 0.19 | | |
| Total from Investment Operations | | | (1.72 | ) | | | 0.19 | | |
| Net Asset Value, End of Period | | $ | 8.47 | | | $ | 10.19 | | |
| Total Return++ | | | (16.88 | )% | | | 1.90 | %# | |
| Ratios and Supplemental Data:†† | |
| Net Assets, End of Period (Thousands) | | $ | 1,201 | | | $ | 1,223 | | |
| Ratio of Expenses to Average Net Assets (1) | | | 1.45 | %+ | | | 1.45 | %* | |
| Ratio of Net Investment Income (Loss) to Average Net Assets (1) | | | 0.01 | %+ | | | (1.34 | )%* | |
| Ratio of Rebate from Morgan Stanley Affiliates to Average Net Assets | | | 0.00 | %§ | | | N/A | | |
| Portfolio Turnover Rate | | | 38 | % | | | 0.00 | %# | |
| (1) Supplemental Information on the Ratios to Average Net Assets:†† | |
| Ratios Before Expense Limitation: | |
| Expenses to Average Net Assets | | | 11.86 | % | | | 176.73 | %* | |
| Net Investment Loss to Average Net Assets | | | (10.40 | )% | | | (176.62 | )%* | |
^ Commencement of Operations.
† Per share amount is based on average shares outstanding.
‡ Amount is less than $0.005 per share.
++ Calculated based on the net asset value as of the last business day of the period.
+ The Ratios of Expenses and Net Investment Income (Loss) reflect the rebate of certain Portfolio expenses in connection with the investments in Morgan Stanley affiliates during the period. The effect of the rebate on the ratios is disclosed in the above table as "Ratio of Rebate from Morgan Stanley Affiliates to Average Net Assets."
†† Reflects overall Portfolio ratios for investment income and non-class specific expenses.
§ Amount is less than 0.005%.
# Not Annualized.
* Annualized.
The accompanying notes are an integral part of the financial statements.
169
2011 Annual Report
December 31, 2011
Financial Highlights
Asian Equity Portfolio
| | | Class P | |
| Selected Per Share Data and Ratios | | Year Ended
December 31,
2011 | | Period from
December 28,
2010^ to
December 31,
2010 | |
| Net Asset Value, Beginning of Period | | $ | 10.19 | | | $ | 10.00 | | |
| Income (Loss) from Investment Operations: | |
| Net Investment Loss† | | | (0.02 | ) | | | (0.00 | )‡ | |
| Net Realized and Unrealized Gain (Loss) | | | (1.72 | ) | | | 0.19 | | |
| Total from Investment Operations | | | (1.74 | ) | | | 0.19 | | |
| Net Asset Value, End of Period | | $ | 8.45 | | | $ | 10.19 | | |
| Total Return++ | | | (17.08 | )% | | | 1.90 | %# | |
| Ratios and Supplemental Data:†† | |
| Net Assets, End of Period (Thousands) | | $ | 84 | | | $ | 102 | | |
| Ratio of Expenses to Average Net Assets (1) | | | 1.70 | %+ | | | 1.70 | %* | |
| Ratio of Net Investment Loss to Average Net Assets (1) | | | (0.24 | )%+ | | | (1.59 | )%* | |
| Ratio of Rebate from Morgan Stanley Affiliates to Average Net Assets | | | 0.00 | %§ | | | N/A | | |
| Portfolio Turnover Rate | | | 38 | % | | | 0.00 | %# | |
| (1) Supplemental Information on the Ratios to Average Net Assets:†† | |
| Ratios Before Expense Limitation: | |
| Expenses to Average Net Assets | | | 12.11 | % | | | 176.98 | %* | |
| Net Investment Loss to Average Net Assets | | | (10.65 | )% | | | (176.87 | )%* | |
^ Commencement of Operations.
† Per share amount is based on average shares outstanding.
‡ Amount is less than $0.005 per share.
++ Calculated based on the net asset value as of the last business day of the period.
+ The Ratios of Expenses and Net Investment Loss reflect the rebate of certain Portfolio expenses in connection with the investments in Morgan Stanley affiliates during the period. The effect of the rebate on the ratios is disclosed in the above table as "Ratio of Rebate from Morgan Stanley Affiliates to Average Net Assets."
†† Reflects overall Portfolio ratios for investment income and non-class specific expenses.
§ Amount is less than 0.005%.
# Not Annualized.
* Annualized.
The accompanying notes are an integral part of the financial statements.
170
2011 Annual Report
December 31, 2011
Financial Highlights
Asian Equity Portfolio
| | | Class H | |
| Selected Per Share Data and Ratios | | Year Ended
December 31,
2011 | | Period from
December 28,
2010^ to
December 31,
2010 | |
| Net Asset Value, Beginning of Period | | $ | 10.19 | | | $ | 10.00 | | |
| Income (Loss) from Investment Operations: | |
| Net Investment Loss† | | | (0.02 | ) | | | (0.00 | )‡ | |
| Net Realized and Unrealized Gain (Loss) | | | (1.72 | ) | | | 0.19 | | |
| Total from Investment Operations | | | (1.74 | ) | | | 0.19 | | |
| Net Asset Value, End of Period | | $ | 8.45 | | | $ | 10.19 | | |
| Total Return++ | | | (17.08 | )% | | | 1.90 | %# | |
| Ratios and Supplemental Data:†† | |
| Net Assets, End of Period (Thousands) | | $ | 84 | | | $ | 102 | | |
| Ratio of Expenses to Average Net Assets (1) | | | 1.70 | %+ | | | 1.70 | %* | |
| Ratio of Net Investment Loss to Average Net Assets (1) | | | (0.24 | )%+ | | | (1.59 | )%* | |
| Ratio of Rebate from Morgan Stanley Affiliates to Average Net Assets | | | 0.00 | %§ | | | N/A | | |
| Portfolio Turnover Rate | | | 38 | % | | | 0.00 | %# | |
| (1) Supplemental Information on the Ratios to Average Net Assets:†† | |
| Ratios Before Expense Limitation: | |
| Expense to Average Net Assets | | | 12.11 | % | | | 176.98 | %* | |
| Net Investment Loss to Average Net Assets | | | (10.65 | )% | | | (176.87 | )%* | |
^ Commencement of Operations.
† Per share amount is based on average shares outstanding.
‡ Amount is less than $0.005 per share.
++ Calculated based on the net asset value which does not reflect sales charges, if applicable, as of the last business day of the period.
+ The Ratios of Expenses and Net Investment Loss reflect the rebate of certain Portfolio expenses in connection with the investments in Morgan Stanley affiliates during the period. The effect of the rebate on the ratios is disclosed in the above table as "Ratio of Rebate from Morgan Stanley Affiliates to Average Net Assets."
†† Reflects overall Portfolio ratios for investment income and non-class specific expenses.
§ Amount is less than 0.005%.
# Not Annualized.
* Annualized.
The accompanying notes are an integral part of the financial statements.
171
2011 Annual Report
December 31, 2011
Financial Highlights
Asian Equity Portfolio
| | | Class L | |
| Selected Per Share Data and Ratios | | Year Ended
December 31,
2011 | | Period from
December 28,
2010^ to
December 31,
2010 | |
| Net Asset Value, Beginning of Period | | $ | 10.19 | | | $ | 10.00 | | |
| Income (Loss) from Investment Operations: | |
| Net Investment Loss† | | | (0.07 | ) | | | (0.00 | )‡ | |
| Net Realized and Unrealized Gain (Loss) | | | (1.72 | ) | | | 0.19 | | |
| Total from Investment Operations | | | (1.79 | ) | | | 0.19 | | |
| Net Asset Value, End of Period | | $ | 8.40 | | | $ | 10.19 | | |
| Total Return++ | | | (17.57 | )% | | | 1.90 | %# | |
| Ratios and Supplemental Data:†† | |
| Net Assets, End of Period (Thousands) | | $ | 84 | | | $ | 102 | | |
| Ratio of Expenses to Average Net Assets (1) | | | 2.20 | %+ | | | 2.20 | %* | |
| Ratio of Net Investment Loss to Average Net Assets (1) | | | (0.74 | )%+ | | | (2.09 | )%* | |
| Ratio of Rebate from Morgan Stanley Affiliates to Average Net Assets | | | 0.00 | %§ | | | N/A | | |
| Portfolio Turnover Rate | | | 38 | % | | | 0.00 | %# | |
| (1) Supplemental Information on the Ratios to Average Net Assets:†† | |
| Ratios Before Expense Limitation: | |
| Expenses to Average Net Assets | | | 12.61 | % | | | 177.48 | %* | |
| Net Investment Loss to Average Net Assets | | | (11.15 | )% | | | (177.37 | )%* | |
^�� Commencement of Operations.
† Per share amount is based on average shares outstanding.
‡ Amount is less than $0.005 per share.
++ Calculated based on the net asset value as of the last business day of the period.
+ The Ratios of Expenses and Net Investment Loss reflect the rebate of certain Portfolio expenses in connection with the investments in Morgan Stanley affiliates during the period. The effect of the rebate on the ratios is disclosed in the above table as "Ratio of Rebate from Morgan Stanley Affiliates to Average Net Assets."
†† Reflects overall Portfolio ratios for investment income and non-class specific expenses.
§ Amount is less than 0.005%.
# Not Annualized.
* Annualized.
The accompanying notes are an integral part of the financial statements.
172
2011 Annual Report
December 31, 2011
Financial Highlights
Emerging Markets Portfolio
| | | Class I | |
| | | Year Ended December 31, | |
| Selected Per Share Data and Ratios | | 2011 | | 2010 | | 2009 | | 2008 | | 2007 | |
| Net Asset Value, Beginning of Period | | $ | 27.14 | | | $ | 23.10 | | | $ | 13.79 | | | $ | 34.02 | | | $ | 29.29 | | |
| Income (Loss) from Investment Operations: | |
| Net Investment Income† | | | 0.22 | | | | 0.10 | | | | 0.10 | | | | 0.19 | | | | 0.10 | | |
| Net Realized and Unrealized Gain (Loss) | | | (5.22 | ) | | | 4.15 | | | | 9.49 | | | | (18.78 | ) | | | 11.76 | | |
| Total from Investment Operations | | | (5.00 | ) | | | 4.25 | | | | 9.59 | | | | (18.59 | ) | | | 11.86 | | |
| Distributions from and/or in Excess of: | |
| Net Investment Income | | | — | | | | (0.21 | ) | | | (0.28 | ) | | | — | | | | (0.13 | ) | |
| Net Realized Gain | | | (0.41 | ) | | | — | | | | — | | | | (1.64 | ) | | | (7.01 | ) | |
| Total Distributions | | | (0.41 | ) | | | (0.21 | ) | | | (0.28 | ) | | | (1.64 | ) | | | (7.14 | ) | |
| Redemption Fees | | | 0.00 | ‡ | | | 0.00 | ‡ | | | 0.00 | ‡ | | | 0.00 | ‡ | | | 0.01 | | |
| Net Asset Value, End of Period | | $ | 21.73 | | | $ | 27.14 | | | $ | 23.10 | | | $ | 13.79 | | | $ | 34.02 | | |
| Total Return++ | | | (18.41 | )% | | | 18.49 | % | | | 69.54 | % | | | (56.39 | )% | | | 41.56 | % | |
| Ratios and Supplemental Data: | |
| Net Assets, End of Period (Thousands) | | $ | 1,198,857 | | | $ | 2,031,778 | | | $ | 2,198,793 | | | $ | 1,191,199 | | | $ | 3,323,130 | | |
| Ratio of Expenses to Average Net Assets | | | 1.48 | %+†† | | | 1.47 | %+†† | | | 1.40 | %+ | | | 1.43 | %+ | | | 1.35 | %+ | |
| Ratio of Expenses to Average Net Assets Excluding Non Operating Expenses | | | N/A | | | | 1.47 | %+†† | | | 1.40 | %+ | | | 1.43 | %+ | | | 1.35 | %+ | |
| Ratio of Net Investment Income to Average Net Assets | | | 0.86 | %+†† | | | 0.40 | %+†† | | | 0.56 | %+ | | | 0.78 | %+ | | | 0.28 | %+ | |
| Ratio of Rebate from Morgan Stanley Affiliates to Average Net Assets | | | 0.01 | %†† | | | 0.01 | %†† | | | 0.01 | % | | | 0.00 | %§ | | | 0.00 | %§ | |
| Portfolio Turnover Rate | | | 60 | % | | | 59 | % | | | 64 | % | | | 96 | % | | | 101 | % | |
† Per share amount is based on average shares outstanding.
‡ Amount is less than $0.005 per share.
++ Calculated based on the net asset value as of the last business day of the period.
+ The Ratios of Expenses and Net Investment Income reflect the rebate of certain Portfolio expenses in connection with the investments in Morgan Stanley affiliates during the period. The effect of the rebate on the ratios is disclosed in the above table as "Ratio of Rebate from Morgan Stanley Affiliates to Average Net Assets."
†† Reflects overall Portfolio ratios for investment income and non-class specific expenses.
§ Amount is less than 0.005%.
The accompanying notes are an integral part of the financial statements.
173
2011 Annual Report
December 31, 2011
Financial Highlights
Emerging Markets Portfolio
| | | Class P | |
| | | Year Ended December 31, | |
| Selected Per Share Data and Ratios | | 2011 | | 2010 | | 2009 | | 2008 | | 2007 | |
| Net Asset Value, Beginning of Period | | $ | 26.56 | | | $ | 22.61 | | | $ | 13.51 | | | $ | 33.46 | | | $ | 28.91 | | |
| Income (Loss) from Investment Operations: | |
| Net Investment Income† | | | 0.15 | | | | 0.04 | | | | 0.06 | | | | 0.13 | | | | 0.01 | | |
| Net Realized and Unrealized Gain (Loss) | | | (5.10 | ) | | | 4.06 | | | | 9.28 | | | | (18.44 | ) | | | 11.60 | | |
| Total from Investment Operations | | | (4.95 | ) | | | 4.10 | | | | 9.34 | | | | (18.31 | ) | | | 11.61 | | |
| Distributions from and/or in Excess of: | |
| Net Investment Income | | | — | | | | (0.15 | ) | | | (0.24 | ) | | | — | | | | (0.05 | ) | |
| Net Realized Gain | | | (0.41 | ) | | | — | | | | — | | | | (1.64 | ) | | | (7.01 | ) | |
| Total Distributions | | | (0.41 | ) | | | (0.15 | ) | | | (0.24 | ) | | | (1.64 | ) | | | (7.06 | ) | |
| Redemption Fees | | | 0.00 | ‡ | | | 0.00 | ‡ | | | 0.00 | ‡ | | | 0.00 | ‡ | | | 0.00 | ‡ | |
| Net Asset Value, End of Period | | $ | 21.20 | | | $ | 26.56 | | | $ | 22.61 | | | $ | 13.51 | | | $ | 33.46 | | |
| Total Return++ | | | (18.63 | )% | | | 18.20 | % | | | 69.11 | % | | | (56.50 | )% | | | 41.20 | % | |
| Ratios and Supplemental Data: | |
| Net Assets, End of Period (Thousands) | | $ | 46,521 | | | $ | 113,434 | | | $ | 126,487 | | | $ | 67,559 | | | $ | 179,834 | | |
| Ratio of Expenses to Average Net Assets | | | 1.73 | %+†† | | | 1.72 | %+†† | | | 1.65 | %+ | | | 1.68 | %+ | | | 1.60 | %+ | |
| Ratio of Expenses to Average Net Assets Excluding Non Operating Expenses | | | N/A | | | | 1.72 | %+†† | | | 1.65 | %+ | | | 1.68 | %+ | | | 1.60 | %+ | |
| Ratio of Net Investment Income to Average Net Assets | | | 0.61 | %+†† | | | 0.15 | %+†† | | | 0.32 | %+ | | | 0.52 | %+ | | | 0.02 | %+ | |
| Ratio of Rebate from Morgan Stanley Affiliates to Average Net Assets | | | 0.01 | %†† | | | 0.01 | %†† | | | 0.01 | % | | | 0.00 | %§ | | | 0.00 | %§ | |
| Portfolio Turnover Rate | | | 60 | % | | | 59 | % | | | 64 | % | | | 96 | % | | | 101 | % | |
† Per share amount is based on average shares outstanding.
‡ Amount is less than $0.005 per share.
++ Calculated based on the net asset value as of the last business day of the period.
+ The Ratios of Expenses and Net Investment Income reflect the rebate of certain Portfolio expenses in connection with the investments in Morgan Stanley affiliates during the period. The effect of the rebate on the ratios is disclosed in the above table as "Ratio of Rebate from Morgan Stanley Affiliates to Average Net Assets."
†† Reflects overall Portfolio ratios for investment income and non-class specific expenses.
§ Amount is less than 0.005%.
The accompanying notes are an integral part of the financial statements.
174
2011 Annual Report
December 31, 2011
Financial Highlights
Global Advantage Portfolio
| | | Class I | |
| Selected Per Share Data and Ratios | | Year Ended
December 31,
2011 | | Period from
December 28,
2010^ to
December 31,
2010 | |
| Net Asset Value, Beginning of Period | | $ | 10.01 | | | $ | 10.00 | | |
| Income from Investment Operations: | |
| Net Investment Income (Loss)† | | | 0.06 | | | | (0.00 | )‡ | |
| Net Realized and Unrealized Gain (Loss) | | | (0.03 | ) | | | 0.01 | | |
| Total from Investment Operations | | | 0.03 | | | | 0.01 | | |
| Distributions from and/or in Excess of: | |
| Net Investment Income | | | (0.07 | ) | | | — | | |
| Net Asset Value, End of Period | | $ | 9.97 | | | $ | 10.01 | | |
| Total Return++ | | | 0.34 | % | | | 0.10 | %# | |
| Ratios and Supplemental Data:†† | |
| Net Assets, End of Period (Thousands) | | $ | 1,603 | | | $ | 701 | | |
| Ratio of Expenses to Average Net Assets (1) | | | 1.30 | %+ | | | 1.30 | %* | |
| Ratio of Net Investment Income to Average Net Assets (1) | | | 0.57 | %+ | | | (1.10 | )%* | |
| Ratio of Rebate from Morgan Stanley Affiliates to Average Net Assets | | | 0.00 | %§ | | | N/A | | |
| Portfolio Turnover Rate | | | 42 | % | | | 0.00 | %# | |
| (1) Supplemental Information on the Ratios to Average Net Assets:†† | |
| Ratios Before Expense Limitation: | |
| Expenses to Average Net Assets | | | 7.31 | % | | | 245.42 | %* | |
| Net Investment Loss to Average Net Assets | | | (5.44 | )% | | | (245.22 | )%* | |
^ Commencement of Operations.
† Per share amount is based on average shares outstanding.
‡ Amount is less than $0.005 per share.
++ Calculated based on the net asset value as of the last business day of the period.
†† Reflects overall Portfolio ratios for investment income and non-class specific expenses.
+ The Ratios of Expenses and Net Investment Income reflect the rebate of certain Portfolio expenses in connection with the investments in Morgan Stanley affiliates during the period. The effect of the rebate on the ratios is disclosed in the above table as "Ratio of Rebate from Morgan Stanley Affiliates to Average Net Assets."
§ Amount is less than 0.005%.
# Not Annualized.
* Annualized.
The accompanying notes are an integral part of the financial statements.
175
2011 Annual Report
December 31, 2011
Financial Highlights
Global Advantage Portfolio
| | | Class P | |
| Selected Per Share Data and Ratios | | Year Ended
December 31,
2011 | | Period from
December 28,
2010^ to
December 31,
2010 | |
| Net Asset Value, Beginning of Period | | $ | 10.01 | | | $ | 10.00 | | |
| Income from Investment Operations: | |
| Net Investment Income (Loss)† | | | 0.03 | | | | (0.00 | )‡ | |
| Net Realized and Unrealized Gain (Loss) | | | (0.02 | ) | | | 0.01 | | |
| Total from Investment Operations | | | 0.01 | | | | 0.01 | | |
| Distributions from and/or in Excess of: | |
| Net Investment Income | | | (0.05 | ) | | | — | | |
| Net Asset Value, End of Period | | $ | 9.97 | | | $ | 10.01 | | |
| Total Return++ | | | 0.07 | % | | | 0.10 | %# | |
| Ratios and Supplemental Data:†† | |
| Net Assets, End of Period (Thousands) | | $ | 100 | | | $ | 100 | | |
| Ratio of Expenses to Average Net Assets (1) | | | 1.55 | %+ | | | 1.55 | %* | |
| Ratio of Net Investment Income to Average Net Assets (1) | | | 0.32 | %+ | | | (1.35 | )%* | |
| Ratio of Rebate from Morgan Stanley Affiliates to Average Net Assets | | | 0.00 | %§ | | | N/A | | |
| Portfolio Turnover Rate | | | 42 | % | | | 0.00 | %# | |
| (1) Supplemental Information on the Ratios to Average Net Assets:†† | |
| Ratios Before Expense Limitation: | |
| Expenses to Average Net Assets | | | 7.56 | % | | | 245.67 | %* | |
| Net Investment Loss to Average Net Assets | | | (5.69 | )% | | | (245.47 | )%* | |
^ Commencement of Operations.
† Per share amount is based on average shares outstanding.
‡ Amount is less than $0.005 per share.
++ Calculated based on the net asset value as of the last business day of the period.
†† Reflects overall Portfolio ratios for investment income and non-class specific expenses.
+ The Ratios of Expenses and Net Investment Income reflect the rebate of certain Portfolio expenses in connection with the investments in Morgan Stanley affiliates during the period. The effect of the rebate on the ratios is disclosed in the above table as "Ratio of Rebate from Morgan Stanley Affiliates to Average Net Assets."
§ Amount is less than 0.005%.
# Not Annualized.
* Annualized.
The accompanying notes are an integral part of the financial statements.
176
2011 Annual Report
December 31, 2011
Financial Highlights
Global Advantage Portfolio
| | | Class H | |
| Selected Per Share Data and Ratios | | Year Ended
December 31,
2011 | | Period from
December 28,
2010^ to
December 31,
2010 | |
| Net Asset Value, Beginning of Period | | $ | 10.01 | | | $ | 10.00 | | |
| Income from Investment Operations: | |
| Net Investment Income (Loss)† | | | 0.03 | | | | (0.00 | )‡ | |
| Net Realized and Unrealized Gain (Loss) | | | (0.02 | ) | | | 0.01 | | |
| Total from Investment Operations | | | 0.01 | | | | 0.01 | | |
| Distributions from and/or in Excess of: | |
| Net Investment Income | | | (0.05 | ) | | | — | | |
| Net Asset Value, End of Period | | $ | 9.97 | | | $ | 10.01 | | |
| Total Return++ | | | 0.08 | % | | | 0.10 | %# | |
| Ratios and Supplemental Data:†† | |
| Net Assets, End of Period (Thousands) | | $ | 895 | | | $ | 200 | | |
| Ratio of Expenses to Average Net Assets (1) | | | 1.55 | %+ | | | 1.55 | %* | |
| Ratio of Net Investment Income (Loss) to Average Net Assets (1) | | | 0.32 | %+ | | | (1.35 | )%* | |
| Ratio of Rebate from Morgan Stanley Affiliates to Average Net Assets | | | 0.00 | %§ | | | N/A | | |
| Portfolio Turnover Rate | | | 42 | % | | | 0.00 | %# | |
| (1) Supplemental Information on the Ratios to Average Net Assets:†† | |
| Ratios Before Expense Limitation: | |
| Expense to Average Net Assets | | | 7.56 | % | | | 245.67 | %* | |
| Net Investment Loss to Average Net Assets | | | (5.69 | )% | | | (245.47 | )%* | |
^ Commencement of Operations.
† Per share amount is based on average shares outstanding.
‡ Amount is less than $0.005 per share.
++ Calculated based on the net asset value as of the last business day of the period.
†† Reflects overall Portfolio ratios for investment income and non-class specific expenses.
+ The Ratios of Expenses and Net Investment Income reflect the rebate of certain Portfolio expenses in connection with the investments in Morgan Stanley affiliates during the period. The effect of the rebate on the ratios is disclosed in the above table as "Ratio of Rebate from Morgan Stanley Affiliates to Average Net Assets."
§ Amount is less than 0.005%.
# Not Annualized.
* Annualized.
The accompanying notes are an integral part of the financial statements.
177
2011 Annual Report
December 31, 2011
Financial Highlights
Global Advantage Portfolio
| | | Class L | |
| Selected Per Share Data and Ratios | | Year Ended
December 31,
2011 | | Period from
December 28,
2010^ to
December 31,
2010 | |
| Net Asset Value, Beginning of Period | | $ | 10.01 | | | $ | 10.00 | | |
| Income (Loss) from Investment Operations: | |
| Net Investment Loss† | | | (0.02 | ) | | | (0.00 | )‡ | |
| Net Realized and Unrealized Gain (Loss) | | | (0.02 | ) | | | 0.01 | | |
| Total from Investment Operations | | | (0.04 | ) | | | 0.01 | | |
| Distributions from and/or in Excess of: | |
| Net Investment Income | | | (0.01 | ) | | | — | | |
| Net Asset Value, End of Period | | $ | 9.96 | | | $ | 10.01 | | |
| Total Return++ | | | (0.44 | )% | | | 0.10 | %# | |
| Ratios and Supplemental Data:†† | |
| Net Assets, End of Period (Thousands) | | $ | 100 | | | $ | 100 | | |
| Ratio of Expenses to Average Net Assets (1) | | | 2.05 | %+ | | | 2.05 | %* | |
| Ratio of Net Investment Loss to Average Net Assets (1) | | | (0.18 | )%+ | | | (1.85 | )%* | |
| Ratio of Rebate from Morgan Stanley Affiliates to Average Net Assets | | | 0.00 | %§ | | | N/A | | |
| Portfolio Turnover Rate | | | 42 | % | | | 0.00 | %# | |
| (1) Supplemental Information on the Ratios to Average Net Assets:†† | |
| Ratios Before Expense Limitation: | |
| Expenses to Average Net Assets | | | 8.06 | % | | | 246.17 | %* | |
| Net Investment Loss to Average Net Assets | | | (6.19 | )% | | | (245.97 | )%* | |
^ Commencement of Operations.
† Per share amount is based on average shares outstanding.
‡ Amount is less than $0.005 per share.
++ Calculated based on the net asset value as of the last business day of the period.
†† Reflects overall Portfolio ratios for investment income and non-class specific expenses.
+ The Ratios of Expenses and Net Investment Loss reflect the rebate of certain Portfolio expenses in connection with the investments in Morgan Stanley affiliates during the period. The effect of the rebate on the ratios is disclosed in the above table as "Ratio of Rebate from Morgan Stanley Affiliates to Average Net Assets."
§ Amount is less than 0.005%.
# Not Annualized.
* Annualized.
The accompanying notes are an integral part of the financial statements.
178
2011 Annual Report
December 31, 2011
Financial Highlights
Global Discovery Portfolio
| | | Class I | |
| Selected Per Share Data and Ratios | | Year Ended
December 31,
2011 | | Period from
December 28,
2010^ to
December 31,
2010 | |
| Net Asset Value, Beginning of Period | | $ | 9.97 | | | $ | 10.00 | | |
| Income (Loss) from Investment Operations: | |
| Net Investment Income (Loss)† | | | 0.13 | | | | (0.00 | )‡ | |
| Net Realized and Unrealized Loss | | | (0.92 | ) | | | (0.03 | ) | |
| Total from Investment Operations | | | (0.79 | ) | | | (0.03 | ) | |
| Distributions from and/or in Excess of: | |
| Net Investment Income | | | (0.12 | ) | | | — | | |
| Net Realized Gain | | | (0.00 | )‡ | | | — | | |
| Total Distributions | | | (0.12 | ) | | | — | | |
| Net Asset Value, End of Period | | $ | 9.06 | | | $ | 9.97 | | |
| Total Return++ | | | (7.72 | )% | | | (0.30 | )%# | |
| Ratios and Supplemental Data:†† | |
| Net Assets, End of Period (Thousands) | | $ | 2,446 | | | $ | 697 | | |
| Ratio of Expenses to Average Net Assets (1) | | | 1.35 | %+ | | | 1.35 | %* | |
| Ratio of Net Investment Income (Loss) to Average Net Assets (1) | | | 1.39 | %+ | | | (1.14 | )%* | |
| Ratio of Rebate from Morgan Stanley Affiliates to Average Net Assets | | | 0.00 | %§ | | | N/A | | |
| Portfolio Turnover Rate | | | 83 | % | | | 0.00 | %# | |
| (1) Supplemental Information on the Ratios to Average Net Assets:†† | |
| Ratios Before Expense Limitation: | |
| Expenses to Average Net Assets | | | 5.52 | % | | | 238.14 | %* | |
| Net Investment Loss to Average Net Assets | | | (2.78 | )% | | | (237.93 | )%* | |
^ Commencement of Operations.
† Per share amount is based on average shares outstanding.
‡ Amount is less than $0.005 per share.
++ Calculated based on the net asset value as of the last business day of the period.
†† Reflects overall Portfolio ratios for investment income and non-class specific expenses.
+ The Ratios of Expenses and Net Investment Income (Loss) reflect the rebate of certain Portfolio expenses in connection with the investments in Morgan Stanley affiliates during the period. The effect of the rebate on the ratios is disclosed in the above table as "Ratio of Rebate from Morgan Stanley Affiliates to Average Net Assets."
§ Amount is less than 0.005%.
# Not Annualized.
* Annualized.
The accompanying notes are an integral part of the financial statements.
179
2011 Annual Report
December 31, 2011
Financial Highlights
Global Discovery Portfolio
| | | Class P | |
| Selected Per Share Data and Ratios | | Year Ended
December 31,
2011 | | Period from
December 28,
2010^ to
December 31,
2010 | |
| Net Asset Value, Beginning of Period | | $ | 9.97 | | | $ | 10.00 | | |
| Income (Loss) from Investment Operations: | |
| Net Investment Income (Loss)† | | | 0.12 | | | | (0.00 | )‡ | |
| Net Realized and Unrealized Loss | | | (0.92 | ) | | | (0.03 | ) | |
| Total from Investment Operations | | | (0.80 | ) | | | (0.03 | ) | |
| Distributions from and/or in Excess of: | |
| Net Investment Income | | | (0.10 | ) | | | — | | |
| Net Realized Gain | | | (0.00 | )‡ | | | — | | |
| Total Distributions | | | (0.10 | ) | | | — | | |
| Net Asset Value, End of Period | | $ | 9.07 | | | $ | 9.97 | | |
| Total Return++ | | | (7.98 | )% | | | (0.30 | )%# | |
| Ratios and Supplemental Data:†† | |
| Net Assets, End of Period (Thousands) | | $ | 91 | | | $ | 100 | | |
| Ratio of Expenses to Average Net Assets (1) | | | 1.60 | %+ | | | 1.60 | %* | |
| Ratio of Net Investment Income (Loss) to Average Net Assets (1) | | | 1.14 | %+ | | | (1.39 | )%* | |
| Ratio of Rebate from Morgan Stanley Affiliates to Average Net Assets | | | 0.00 | %§ | | | N/A | | |
| Portfolio Turnover Rate | | | 83 | % | | | 0.00 | %# | |
| (1) Supplemental Information on the Ratios to Average Net Assets:†† | |
| Ratios Before Expense Limitation: | |
| Expenses to Average Net Assets | | | 5.77 | % | | | 238.39 | %* | |
| Net Investment Loss to Average Net Assets | | | (3.03 | )% | | | (238.18 | )%* | |
^ Commencement of Operations.
† Per share amount is based on average shares outstanding.
‡ Amount is less than $0.005 per share.
++ Calculated based on the net asset value as of the last business day of the period.
†† Reflects overall Portfolio ratios for investment income and non-class specific expenses.
+ The Ratios of Expenses and Net Investment Income (Loss) reflect the rebate of certain Portfolio expenses in connection with the investments in Morgan Stanley affiliates during the period. The effect of the rebate on the ratios is disclosed in the above table as "Ratio of Rebate from Morgan Stanley Affiliates to Average Net Assets."
§ Amount is less than 0.005%.
# Not Annualized.
* Annualized.
The accompanying notes are an integral part of the financial statements.
180
2011 Annual Report
December 31, 2011
Financial Highlights
Global Discovery Portfolio
| | | Class H | |
| Selected Per Share Data and Ratios | | Year Ended
December 31,
2011 | | Period from
December 28,
2010^ to
December 31,
2010 | |
| Net Asset Value, Beginning of Period | | $ | 9.97 | | | $ | 10.00 | | |
| Income (Loss) from Investment Operations: | |
| Net Investment Income (Loss)† | | | 0.11 | | | | (0.00 | )‡ | |
| Net Realized and Unrealized Loss | | | (0.91 | ) | | | (0.03 | ) | |
| Total from Investment Operations | | | (0.80 | ) | | | (0.03 | ) | |
| Distributions from and/or in Excess of: | |
| Net Investment Income | | | (0.10 | ) | | | — | | |
| Net Realized Gain | | | (0.00 | )‡ | | | — | | |
| Total Distributions | | | (0.10 | ) | | | — | | |
| Net Asset Value, End of Period | | $ | 9.07 | | | $ | 9.97 | | |
| Total Return++ | | | (7.96 | )% | | | (0.30 | )%# | |
| Ratios and Supplemental Data:†† | |
| Net Assets, End of Period (Thousands) | | $ | 1,157 | | | $ | 349 | | |
| Ratio of Expenses to Average Net Assets (1) | | | 1.60 | %+ | | | 1.60 | %* | |
| Ratio of Net Investment Income (Loss) to Average Net Assets (1) | | | 1.14 | %+ | | | (1.39 | )%* | |
| Rebate from Morgan Stanley Affiliates to Average Net Assets | | | 0.00 | %§ | | | N/A | | |
| Portfolio Turnover Rate | | | 83 | % | | | 0.00 | %# | |
| (1) Supplemental Information on the Ratios to Average Net Assets:†† | |
| Ratios Before Expense Limitation: | |
| Expense to Average Net Assets | | | 5.77 | % | | | 238.39 | %* | |
| Net Investment Loss to Average Net Assets | | | (3.03 | )% | | | (238.18 | )%* | |
^ Commencement of Operations.
† Per share amount is based on average shares outstanding.
‡ Amount is less than $0.005 per share.
++ Calculated based on the net asset value which does not reflect sales charges, if applicable, as of the last business day of the period.
†† Reflects overall Portfolio ratios for investment income and non-class specific expenses.
+ The Ratios of Expenses and Net Investment Income (Loss) reflect the rebate of certain Portfolio expenses in connection with the investments in Morgan Stanley affiliates during the period. The effect of the rebate on the ratios is disclosed in the above table as "Ratio of Rebate from Morgan Stanley Affiliates to Average Net Assets."
§ Amount is less than 0.005%.
# Not Annualized.
* Annualized.
The accompanying notes are an integral part of the financial statements.
181
2011 Annual Report
December 31, 2011
Financial Highlights
Global Discovery Portfolio
| | | Class L | |
| Selected Per Share Data and Ratios | | Year Ended
December 31,
2011 | | Period from
December 28,
2010^ to
December 31,
2010 | |
| Net Asset Value, Beginning of Period | | $ | 9.97 | | | $ | 10.00 | | |
| Income (Loss) from Investment Operations: | |
| Net Investment Income (Loss)† | | | 0.06 | | | | (0.00 | )‡ | |
| Net Realized and Unrealized Loss | | | (0.91 | ) | | | (0.03 | ) | |
| Total from Investment Operations | | | (0.85 | ) | | | (0.03 | ) | |
| Distributions from and/or in Excess of: | |
| Net Investment Income | | | (0.05 | ) | | | — | | |
| Net Realized Gain | | | (0.00 | )‡ | | | — | | |
| Total Distributions | | | (0.05 | ) | | | — | | |
| Net Asset Value, End of Period | | $ | 9.07 | | | $ | 9.97 | | |
| Total Return++ | | | (8.41 | )% | | | (0.30 | )%# | |
| Ratios and Supplemental Data:†† | |
| Net Assets, End of Period (Thousands) | | $ | 91 | | | $ | 100 | | |
| Ratio of Expenses to Average Net Assets (1) | | | 2.10 | %+ | | | 2.10 | %* | |
| Ratio of Net Investment Income (Loss) to Average Net Assets (1) | | | 0.64 | %+ | | | (1.89 | )%* | |
| Ratio of Rebate from Morgan Stanley Affiliates to Average Net Assets | | | 0.00 | %§ | | | N/A | | |
| Portfolio Turnover Rate | | | 83 | % | | | 0.00 | %# | |
| (1) Supplemental Information on the Ratios to Average Net Assets:†† | |
| Ratios Before Expense Limitation: | |
| Expenses to Average Net Assets | | | 6.27 | % | | | 238.89 | %* | |
| Net Investment Loss to Average Net Assets | | | (3.53 | )% | | | (238.68 | )%* | |
^ Commencement of Operations.
† Per share amount is based on average shares outstanding.
‡ Amount is less than $0.005 per share.
++ Calculated based on the net asset value as of the last business day of the period.
†† Reflects overall Portfolio ratios for investment income and non-class specific expenses.
+ The Ratios of Expenses and Net Investment Income (Loss) reflect the rebate of certain Portfolio expenses in connection with the investments in Morgan Stanley affiliates during the period. The effect of the rebate on the ratios is disclosed in the above table as "Ratio of Rebate from Morgan Stanley Affiliates to Average Net Assets."
§ Amount is less than 0.005%.
# Not Annualized.
* Annualized.
The accompanying notes are an integral part of the financial statements.
182
2011 Annual Report
December 31, 2011
Financial Highlights
Global Franchise Portfolio
| | | Class I | |
| | | Year Ended December 31, | |
| Selected Per Share Data and Ratios | | 2011 | | 2010 | | 2009 | | 2008 | | 2007 | |
| Net Asset Value, Beginning of Period | | $ | 15.29 | | | $ | 13.81 | | | $ | 10.82 | | | $ | 16.62 | | | $ | 17.98 | | |
| Income (Loss) from Investment Operations: | |
| Net Investment Income† | | | 0.31 | | | | 0.32 | | | | 0.19 | | | | 0.35 | | | | 0.40 | | |
| Net Realized and Unrealized Gain (Loss) | | | 1.11 | | | | 1.62 | | | | 2.98 | | | | (5.11 | ) | | | 1.30 | | |
| Total from Investment Operations | | | 1.42 | | | | 1.94 | | | | 3.17 | | | | (4.76 | ) | | | 1.70 | | |
| Distributions from and/or in Excess of: | |
| Net Investment Income | | | (0.30 | ) | | | (0.46 | ) | | | (0.18 | ) | | | (0.84 | ) | | | (0.15 | ) | |
| Net Realized Gain | | | (0.17 | ) | | | — | | | | — | | | | (0.20 | ) | | | (2.91 | ) | |
| Total Distributions | | | (0.47 | ) | | | (0.46 | ) | | | (0.18 | ) | | | (1.04 | ) | | | (3.06 | ) | |
| Net Asset Value, End of Period | | $ | 16.24 | | | $ | 15.29 | | | $ | 13.81 | | | $ | 10.82 | | | $ | 16.62 | | |
| Total Return++ | | | 9.38 | % | | | 14.07 | % | | | 29.65 | % | | | (28.88 | )% | | | 9.58 | % | |
| Ratios and Supplemental Data: | |
| Net Assets, End of Period (Thousands) | | $ | 211,677 | | | $ | 89,666 | | | $ | 111,852 | | | $ | 78,029 | | | $ | 110,135 | | |
| Ratio of Expenses to Average Net Assets (1) | | | 1.00 | %+†† | | | 1.00 | %+†† | | | 1.00 | %+ | | | 1.00 | %+ | | | 0.99 | %+ | |
| Ratio of Expenses to Average Net Assets Excluding Non Operating Expenses | | | N/A | | | | 1.00 | %+†† | | | 1.00 | %+ | | | 1.00 | %+ | | | 0.98 | %+ | |
| Ratio of Net Investment Income to Average Net Assets (1) | | | 1.87 | %+†† | | | 2.19 | %+†† | | | 1.62 | %+ | | | 2.49 | %+ | | | 2.10 | %+ | |
| Ratio of Rebate from Morgan Stanley Affiliates to Average Net Assets | | | 0.00 | %††§ | | | 0.00 | %††§ | | | 0.00 | %§ | | | 0.01 | % | | | 0.00 | %§ | |
| Portfolio Turnover Rate | | | 30 | % | | | 74 | % | | | 18 | % | | | 31 | % | | | 22 | % | |
| (1) Supplemental Information on the Ratios to Average Net Assets: | |
| Ratios Before Expense Limitation: | |
| Expenses to Average Net Assets | | | 1.01 | %†† | | | 1.08 | %+†† | | | 1.01 | %+ | | | 1.01 | %+ | | | N/A | | |
| Net Investment Income to Average Net Assets | | | 1.86 | %†† | | | 2.11 | %+†† | | | 1.61 | %+ | | | 2.48 | %+ | | | N/A | | |
† Per share amount is based on average shares outstanding.
++ Calculated based on the net asset value as of the last business day of the period.
+ The Ratios of Expenses and Net Investment Income reflect the rebate of certain Portfolio expenses in connection with the investments in Morgan Stanley affiliates during the period. The effect of the rebate on the ratios is disclosed in the above table as "Ratio of Rebate from Morgan Stanley Affiliates to Average Net Assets."
†† Reflects overall Portfolio ratios for investment income and non-class specific expenses.
§ Amount is less than 0.005%.
The accompanying notes are an integral part of the financial statements.
183
2011 Annual Report
December 31, 2011
Financial Highlights
Global Franchise Portfolio
| | | Class P | |
| | | Year Ended December 31, | |
| Selected Per Share Data and Ratios | | 2011 | | 2010 | | 2009 | | 2008 | | 2007 | |
| Net Asset Value, Beginning of Period | | $ | 15.10 | | | $ | 13.65 | | | $ | 10.71 | | | $ | 16.44 | | | $ | 17.82 | | |
| Income (Loss) from Investment Operations: | |
| Net Investment Income† | | | 0.26 | | | | 0.28 | | | | 0.11 | | | | 0.34 | | | | 0.30 | | |
| Net Realized and Unrealized Gain (Loss) | | | 1.09 | | | | 1.59 | | | | 2.99 | | | | (5.07 | ) | | | 1.34 | | |
| Total from Investment Operations | | | 1.35 | | | | 1.87 | | | | 3.10 | | | | (4.73 | ) | | | 1.64 | | |
| Distributions from and/or in Excess of: | |
| Net Investment Income | | | (0.27 | ) | | | (0.42 | ) | | | (0.16 | ) | | | (0.80 | ) | | | (0.11 | ) | |
| Net Realized Gain | | | (0.17 | ) | | | — | | | | — | | | | (0.20 | ) | | | (2.91 | ) | |
| Total Distributions | | | (0.44 | ) | | | (0.42 | ) | | | (0.16 | ) | | | (1.00 | ) | | | (3.02 | ) | |
| Net Asset Value, End of Period | | $ | 16.01 | | | $ | 15.10 | | | $ | 13.65 | | | $ | 10.71 | | | $ | 16.44 | | |
| Total Return++ | | | 8.98 | % | | | 13.83 | % | | | 29.24 | % | | | (29.00 | )% | | | 9.26 | % | |
| Ratios and Supplemental Data: | |
| Net Assets, End of Period (Thousands) | | $ | 15,327 | | | $ | 9,653 | | | $ | 9,332 | | | $ | 2,892 | | | $ | 6,327 | | |
| Ratio of Expenses to Average Net Assets (1) | | | 1.25 | %+†† | | | 1.25 | %+†† | | | 1.25 | %+ | | | 1.25 | %+ | | | 1.24 | %+ | |
| Ratio of Expenses to Average Net Assets Excluding Non Operating Expenses | | | N/A | | | | 1.25 | %+†† | | | 1.25 | %+ | | | 1.25 | %+ | | | 1.23 | %+ | |
| Ratio of Net Investment Income to Average Net Assets (1) | | | 1.62 | %+†† | | | 1.94 | %+†† | | | 0.92 | %+ | | | 2.43 | %+ | | | 1.62 | %+ | |
| Ratio of Rebate from Morgan Stanley Affiliates to Average Net Assets | | | 0.00 | %††§ | | | 0.00 | %††§ | | | 0.00 | %§ | | | 0.01 | % | | | 0.00 | %§ | |
| Portfolio Turnover Rate | | | 30 | % | | | 74 | % | | | 18 | % | | | 31 | % | | | 22 | % | |
| (1) Supplemental Information on the Ratios to Average Net Assets: | |
| Ratios Before Expense Limitation: | |
| Expenses to Average Net Assets | | | 1.26 | %†† | | | 1.33 | %+†† | | | 1.26 | %+ | | | 1.26 | %+ | | | N/A | | |
| Net Investment Income to Average Net Assets | | | 1.61 | %†† | | | 1.86 | %+†† | | | 0.91 | %+ | | | 2.42 | %+ | | | N/A | | |
† Per share amount is based on average shares outstanding.
++ Calculated based on the net asset value as of the last business day of the period.
+ The Ratios of Expenses and Net Investment Income reflect the rebate of certain Portfolio expenses in connection with the investments in Morgan Stanley affiliates during the period. The effect of the rebate on the ratios is disclosed in the above table as "Ratio of Rebate from Morgan Stanley Affiliates to Average Net Assets."
†† Reflects overall Portfolio ratios for investment income and non-class specific expenses.
§ Amount is less than 0.005%.
The accompanying notes are an integral part of the financial statements.
184
2011 Annual Report
December 31, 2011
Financial Highlights
Global Insight Portfolio
| | | Class I | |
| Selected Per Share Data and Ratios | | Period from
December 28,
2011^ to
December 31,
2011 | |
| Net Asset Value, Beginning of Period | | $ | 10.00 | | |
| Income from Investment Operations: | |
| Net Investment Loss† | | | (0.00 | )‡ | |
| Net Realized and Unrealized Gain | | | 0.07 | | |
| Total from Investment Operations | | | 0.07 | | |
| Net Asset Value, End of Period | | $ | 10.07 | | |
| Total Return++ | | | 0.70 | %# | |
| Ratios and Supplemental Data:†† | |
| Net Assets, End of Period (Thousands) | | $ | 10 | | |
| Ratio of Expenses to Average Net Assets (1) | | | 1.35 | %+* | |
| Ratio of Net Investment Loss to Average Net Assets (1) | | | (1.27 | )%+* | |
| Portfolio Turnover Rate | | | 0.00 | %# | |
| (1) Supplemental Information on the Ratios to Average Net Assets:†† | |
| Ratios Before Expense Limitation: | |
| Expenses to Average Net Assets | | | 381.10 | %* | |
| Net Investment Loss to Average Net Assets | | | (381.02 | )%* | |
^ Commencement of Operations.
† Per share amount is based on average shares outstanding.
‡ Amount is less than $0.005 per share.
++ Calculated based on the net asset value as of the last business day of the period.
†† Reflects overall Portfolio ratios for investment income and non-class specific expenses.
+ The Ratios of Expenses and Net Investment Loss reflect the rebate of certain Portfolio expenses in connection with the investments in Morgan Stanley affiliates during the period. The effect of the rebate on the ratios is disclosed in the above table as "Ratio of Rebate from Morgan Stanley Affiliates to Average Net Assets."
# Not Annualized.
* Annualized.
The accompanying notes are an integral part of the financial statements.
185
2011 Annual Report
December 31, 2011
Financial Highlights
Global Insight Portfolio
| | | Class H | |
| Selected Per Share Data and Ratios | | Period from
December 28,
2011^ to
December 31,
2011 | |
| Net Asset Value, Beginning of Period | | $ | 10.00 | | |
| Income from Investment Operations: | |
| Net Investment Loss† | | | (0.00 | )‡ | |
| Net Realized and Unrealized Gain | | | 0.07 | | |
| Total from Investment Operations | | | 0.07 | | |
| Net Asset Value, End of Period | | $ | 10.07 | | |
| Total Return++ | | | 0.70 | %# | |
| Ratios and Supplemental Data:†† | |
| Net Assets, End of Period (Thousands) | | $ | 816 | | |
| Ratio of Expenses to Average Net Assets (1) | | | 1.60 | %+* | |
| Ratio of Net Investment Loss to Average Net Assets (1) | | | (1.52 | )%+* | |
| Portfolio Turnover Rate | | | 0.00 | %# | |
| (1) Supplemental Information on the Ratios to Average Net Assets:†† | |
| Ratios Before Expense Limitation: | |
| Expenses to Average Net Assets | | | 381.35 | %* | |
| Net Investment Loss to Average Net Assets | | | (381.27 | )%* | |
^ Commencement of Operations.
† Per share amount is based on average shares outstanding.
‡ Amount is less than $0.005 per share.
++ Calculated based on the net asset value which does not reflect sales charges, if applicable, as of the last business day of the period.
†† Reflects overall Portfolio ratios for investment income and non-class specific expenses.
+ The Ratios of Expenses and Net Investment Loss reflect the rebate of certain Portfolio expenses in connection with the investments in Morgan Stanley affiliates during the period. The effect of the rebate on the ratios is disclosed in the above table as "Ratio of Rebate from Morgan Stanley Affiliates to Average Net Assets."
# Not Annualized.
* Annualized.
The accompanying notes are an integral part of the financial statements.
186
2011 Annual Report
December 31, 2011
Financial Highlights
Global Insight Portfolio
| | | Class L | |
| Selected Per Share Data and Ratios | | Period from
December 28,
2011^ to
December 31,
2011 | |
| Net Asset Value, Beginning of Period | | $ | 10.00 | | |
| Income from Investment Operations: | |
| Net Investment Loss† | | | (0.00 | )‡ | |
| Net Realized and Unrealized Gain | | | 0.07 | | |
| Total from Investment Operations | | | 0.07 | | |
| Net Asset Value, End of Period | | $ | 10.07 | | |
| Total Return++ | | | 0.70 | %# | |
| Ratios and Supplemental Data:†† | |
| Net Assets, End of Period (Thousands) | | $ | 10 | | |
| Ratio of Expenses to Average Net Assets (1) | | | 2.10 | %+* | |
| Ratio of Net Investment Loss to Average Net Assets (1) | | | (2.01 | )%+* | |
| Portfolio Turnover Rate | | | 0.00 | %# | |
| (1) Supplemental Information on the Ratios to Average Net Assets:†† | |
| Ratios Before Expense Limitation: | |
| Expenses to Average Net Assets | | | 381.85 | %* | |
| Net Investment Loss to Average Net Assets | | | (381.76 | )%* | |
^ Commencement of Operations.
† Per share amount is based on average shares outstanding.
‡ Amount is less than $0.005 per share.
++ Calculated based on the net asset value as of the last business day of the period.
†† Reflects overall Portfolio ratios for investment income and non-class specific expenses.
+ The Ratios of Expenses and Net Investment Loss reflect the rebate of certain Portfolio expenses in connection with the investments in Morgan Stanley affiliates during the period. The effect of the rebate on the ratios is disclosed in the above table as "Ratio of Rebate from Morgan Stanley Affiliates to Average Net Assets."
# Not Annualized.
* Annualized.
The accompanying notes are an integral part of the financial statements.
187
2011 Annual Report
December 31, 2011
Financial Highlights
Global Opportunity Portfolio
| | | Class I** | |
| Selected Per Share Data and Ratios | | Year Ended
December 31,
2011 | | Period from
April 1,
2010 to
December 31,
2010 | | Year Ended
March 31,
2010 | | Period from
May 30,
2008^ to
March 31,
2009 | |
| Net Asset Value, Beginning of Period | | $ | 11.58 | | | $ | 9.53 | | | $ | 5.08 | | | $ | 10.00 | | |
| Income (Loss) from Investment Operations: | |
| Net Investment Income (Loss)† | | | 0.02 | | | | (0.00 | )‡ | | | 0.01 | | | | (0.02 | ) | |
| Net Realized and Unrealized Gain (Loss) | | | (0.57 | ) | | | 2.05 | | | | 4.47 | | | | (4.90 | ) | |
| Total from Investment Operations | | | (0.55 | ) | | | 2.05 | | | | 4.48 | | | | (4.92 | ) | |
| Distributions from and/or in Excess of: | |
| Net Investment Income | | | — | | | | — | | | | (0.03 | ) | | | — | | |
| Net Realized Gain | | | (0.77 | ) | | | — | | | | — | | | | — | | |
| Total Distributions | | | (0.77 | ) | | | — | | | | (0.03 | ) | | | — | | |
| Redemption Fees | | | 0.00 | ‡ | | | — | | | | — | | | | — | | |
| Net Asset Value, End of Period | | $ | 10.26 | | | $ | 11.58 | | | $ | 9.53 | | | $ | 5.08 | | |
| Total Return++ | | | (4.90 | )% | | | 21.51 | %# | | | 88.32 | % | | | (49.20 | )%# | |
| Ratios and Supplemental Data: | |
| Net Assets, End of Period (Millions) | | $ | 8.4 | | | $ | 5.4 | | | $ | 5.6 | | | $ | 2.3 | | |
| Ratio of Expenses to Average Net Assets (1) | | | 1.25 | %+†† | | | 1.25 | %+††* | | | 1.25 | % | | | 1.25 | %* | |
| Ratio of Expenses to Average Net Assets Excluding Non Operating Expenses | | | N/A | | | | 1.07 | %+††* | | | N/A | | | | N/A | | |
| Ratio of Net Investment Income (Loss) to Average Net Assets (1) | | | 0.13 | %+†† | | | (0.01 | )%+††* | | | 0.09 | % | | | (0.34 | )%* | |
| Ratio of Rebate from Morgan Stanley Affiliates to Average Net Assets | | | 0.00 | %††§ | | | 0.01 | %††* | | | N/A | | | | N/A | | |
| Portfolio Turnover Rate | | | 39 | % | | | 19 | %# | | | 17 | % | | | 32 | %# | |
| (1) Supplemental Information on the Ratios to Average Net Assets: | |
| Ratios Before Expense Limitation: | |
| Expenses to Average Net Assets | | | 2.92 | %†† | | | 2.77 | %+††* | | | 4.51 | % | | | 12.66 | %* | |
| Net Investment Loss to Average Net Assets | | | (1.54 | )%†† | | | (1.53 | )%+††* | | | (3.17 | )% | | | (11.75 | )%* | |
** On May 21, 2010, the Portfolio acquired substantially all of the assets and liabilities of the Van Kampen Global Growth Fund ("the Predecessor Fund"). Therefore, the per share data and ratios of Class I shares for the period ended December 31, 2010 and prior years reflect the historical per share data of Class I shares of the Predecessor Fund.
^ Commencement of Operations.
† Per share amount is based on average shares outstanding.
‡ Amount is less than $0.005 per share.
++ Calculated based on the net asset value as of the last business day of the period.
+ The Ratios of Expenses and Net Investment Income (Loss) reflect the rebate of certain Portfolio expenses in connection with the investments in Morgan Stanley affiliates during the period. The effect of the rebate on the ratios is disclosed in the above table as "Ratio of Rebate from Morgan Stanley Affiliates to Average Net Assets."
†† Reflects overall Portfolio ratios for investment income and non-class specific expenses.
§ Amount is less than 0.005%.
# Not Annualized.
* Annualized.
The accompanying notes are an integral part of the financial statements.
188
2011 Annual Report
December 31, 2011
Financial Highlights
Global Opportunity Portfolio
| | | Class P | |
| Selected Per Share Data and Ratios | |
Year Ended
December 31,
2011 | | Period from
May 21,
2010^ to
December 31,
2010 | |
| Net Asset Value, Beginning of Period | | $ | 11.56 | | | $ | 8.62 | | |
| Income (Loss) from Investment Operations: | |
| Net Investment Loss† | | | (0.01 | ) | | | (0.06 | ) | |
| Net Realized and Unrealized Gain (Loss) | | | (0.57 | ) | | | 3.00 | | |
| Total from Investment Operations | | | (0.58 | ) | | | 2.94 | | |
| Distributions from and/or in Excess of: | |
| Net Realized Gain | | | (0.77 | ) | | | — | | |
| Redemption Fees | | | 0.00 | ‡ | | | — | | |
| Net Asset Value, End of Period | | $ | 10.21 | | | $ | 11.56 | | |
| Total Return++ | | | (5.16 | )% | | | 34.11 | %# | |
| Ratios and Supplemental Data: | |
| Net Assets, End of Period (Thousands) | | $ | 10 | | | $ | 11 | | |
| Ratio of Expenses to Average Net Assets (1) | | | 1.50 | %+†† | | | 1.53 | %+* | |
| Ratio of Expenses to Average Net Assets Excluding Non Operating Expenses | | | N/A | | | | 0.87 | %+* | |
| Ratio of Net Investment Loss to Average Net Assets (1) | | | (0.12 | )%+†† | | | (0.89 | )%+* | |
| Ratio of Rebate from Morgan Stanley Affiliates to Average Net Assets | | | 0.00 | %††§ | | | 0.01 | %* | |
| Portfolio Turnover Rate | | | 39 | % | | | 19 | %# | |
| (1) Supplemental Information on the Ratios to Average Net Assets: | |
| Ratios Before Expense Limitation: | |
| Expenses to Average Net Assets | | | 3.17 | %†† | | | 4.52 | %+* | |
| Net Investment Loss to Average Net Assets | | | (1.79 | )%†† | | | (3.88 | )%+* | |
^ Commencement of Operations.
† Per share amount is based on average shares outstanding.
‡ Amount is less than $0.005 per share.
++ Calculated based on the net asset value as of the last business day of the period.
+ The Ratios of Expenses and Net Investment Loss reflect the rebate of certain Portfolio expenses in connection with the investments in Morgan Stanley affiliates during the period. The effect of the rebate on the ratios is disclosed in the above table as "Ratio of Rebate from Morgan Stanley Affiliates to Average Net Assets."
†† Reflects overall Portfolio ratios for investment income and non-class specific expenses.
§ Amount is less than 0.005%.
# Not Annualized.
* Annualized.
The accompanying notes are an integral part of the financial statements.
189
2011 Annual Report
December 31, 2011
Financial Highlights
Global Opportunity Portfolio
| | | Class H** | |
| Selected Per Share Data and Ratios | | Year Ended
December 31,
2011 | | Period from
April 1,
2010 to
December 31,
2010 | | Year Ended
March 31,
2010 | | Period from
May 30,
2008^ to
March 31,
2009 | |
| Net Asset Value, Beginning of Period | | $ | 11.53 | | | $ | 9.50 | | | $ | 5.07 | | | $ | 10.00 | | |
| Income (Loss) from Investment Operations: | |
| Net Investment Loss† | | | (0.01 | ) | | | (0.01 | ) | | | (0.03 | ) | | | (0.03 | ) | |
| Net Realized and Unrealized Gain (Loss) | | | (0.57 | ) | | | 2.04 | | | | 4.49 | | | | (4.90 | ) | |
| Total from Investment Operations | | | (0.58 | ) | | | 2.03 | | | | 4.46 | | | | (4.93 | ) | |
| Distributions from and/or in Excess of: | |
| Net Investment Income | | | — | | | | — | | | | (0.03 | ) | | | — | | |
| Net Realized Gain | | | (0.77 | ) | | | — | | | | — | | | | — | | |
| Total Distributions | | | (0.77 | ) | | | — | | | | (0.03 | ) | | | — | | |
| Redemption Fees | | | 0.00 | ‡ | | | — | | | | — | | | | — | | |
| Net Asset Value, End of Period | | $ | 10.18 | | | $ | 11.53 | | | $ | 9.50 | | | $ | 5.07 | | |
| Total Return++ | | | (5.18 | )% | | | 21.37 | %# | | | 87.93 | % | | | (49.30 | )%# | |
| Ratios and Supplemental Data: | |
| Net Assets, End of Period (Millions) | | $ | 4.7 | | | $ | 5.8 | | | $ | 7.1 | | | $ | 0.4 | | |
| Ratio of Expenses to Average Net Assets (1) | | | 1.50 | %+†† | | | 1.51 | %+††* | | | 1.50 | % | | | 1.50 | %* | |
| Ratio of Expenses to Average Net Assets Excluding Non Operating Expenses | | | N/A | | | | 1.33 | %+††* | | | N/A | | | | N/A | | |
| Ratio of Net Investment Loss to Average Net Assets (1) | | | (0.12 | )%+†† | | | (0.21 | )%+††* | | | (0.36 | )% | | | (0.57 | )%* | |
| Rebate from Morgan Stanley Affiliates to Average Net Assets | | | 0.00 | %††§ | | | 0.01 | %††* | | | N/A | | | | N/A | | |
| Portfolio Turnover Rate | | | 39 | % | | | 19 | %# | | | 17 | % | | | 32 | %# | |
| (1) Supplemental Information on the Ratios to Average Net Assets: | |
| Ratios Before Expense Limitation: | |
| Expense to Average Net Assets | | | 3.17 | %†† | | | 3.03 | %+††* | | | 4.76 | % | | | 13.43 | %* | |
| Net Investment Loss to Average Net Assets | | | (1.79 | )%†† | | | (1.79 | )%+††* | | | (3.62 | )% | | | (12.50 | )%* | |
** On May 21, 2010, the Portfolio acquired substantially all of the assets and liabilities of the Van Kampen Global Growth Fund ("the Predecessor Fund"). Therefore, the per share data and ratios of Class H shares for the period ended December 31, 2010 and prior years reflect the historical per share data of Class A shares of the Predecessor Fund.
^ Commencement of Operations.
† Per share amount is based on average shares outstanding.
‡ Amount is less than $0.005 per share.
++ Calculated based on the net asset value which does not reflect sales charges, if applicable, as of the last business day of the period.
+ The Ratios of Expenses and Net Investment Loss reflect the rebate of certain Portfolio expenses in connection with the investments in Morgan Stanley affiliates during the period. The effect of the rebate on the ratios is disclosed in the above table as "Ratio of Rebate from Morgan Stanley Affiliates to Average Net Assets."
†† Reflects overall Portfolio ratios for investment income and non-class specific expenses.
§ Amount is less than 0.005%.
# Not Annualized.
* Annualized
The accompanying notes are an integral part of the financial statements.
190
2011 Annual Report
December 31, 2011
Financial Highlights
Global Opportunity Portfolio
| | | Class L** | |
| Selected Per Share Data and Ratios | | Year Ended
December 31,
2011 | | Period from
April 1,
2010 to
December 31,
2010 | | Year Ended
March 31,
2010 | | Period from
May 30,
2008^ to
March 31,
2009 | |
| Net Asset Value, Beginning of Period | | $ | 11.50 | | | $ | 9.48 | | | $ | 5.08 | | | $ | 10.00 | | |
| Income (Loss) from Investment Operations: | |
| Net Investment Loss† | | | (0.02 | ) | | | (0.04 | ) | | | (0.09 | ) | | | (0.02 | ) | |
| Net Realized and Unrealized Gain (Loss) | | | (0.56 | ) | | | 2.06 | | | | 4.51 | | | | (4.90 | ) | |
| Total from Investment Operations | | | (0.58 | ) | | | 2.02 | | | | 4.42 | | | | (4.92 | ) | |
| Distributions from and/or in Excess of: | |
| Net Investment Income | | | — | | | | — | | | | (0.02 | ) | | | — | | |
| Net Realized Gain | | | (0.77 | ) | | | — | | | | — | | | | — | | |
| Total Distributions | | | (0.77 | ) | | | — | | | | (0.02 | ) | | | — | | |
| Redemption Fees | | | 0.00 | ‡ | | | — | | | | — | | | | — | | |
| Net Asset Value, End of Period | | $ | 10.15 | | | $ | 11.50 | | | $ | 9.48 | | | $ | 5.08 | | |
| Total Return++ | | | (5.19 | )% | | | 21.31 | %# | | | 87.08 | % | | | (49.20 | )%# | |
| Ratios and Supplemental Data: | |
| Net Assets, End of Period (Millions) | | $ | 0.5 | | | $ | 0.7 | | | $ | 1.4 | | | $ | 0.1 | | |
| Ratio of Expenses to Average Net Assets (1) | | | 1.55 | %+†† | | | 2.09 | %+††* | | | 2.11 | % | | | 1.31 | %* | |
| Ratio of Expenses to Average Net Assets Excluding Non Operating Expenses | | | N/A | | | | 1.91 | %+††* | | | N/A | | | | N/A | | |
| Ratio of Net Investment Loss to Average Net Assets (1) | | | (0.17 | )%+†† | | | (0.85 | )%+††* | | | (1.03 | )% | | | (0.39 | )%* | |
| Ratio of Rebate from Morgan Stanley Affiliates to Average Net Assets | | | 0.00 | %††§ | | | 0.01 | %††* | | | N/A | | | | N/A | | |
| Portfolio Turnover Rate | | | 39 | % | | | 19 | %# | | | 17 | % | | | 32 | %# | |
| (1) Supplemental Information on the Ratios to Average Net Assets: | |
| Ratios Before Expense Limitation: | |
| Expenses to Average Net Assets | | | 3.67 | %†† | | | 3.61 | %+††* | | | 5.37 | % | | | 12.85 | %* | |
| Net Investment Loss to Average Net Assets | | | (2.29 | )%†† | | | (2.37 | )%+††* | | | (4.29 | )% | | | (11.93 | )%* | |
** On May 21, 2010, the Portfolio acquired substantially all of the assets and liabilities of the Van Kampen Global Growth Fund ("the Predecessor Fund"). Therefore, the per share data and ratios of Class L shares for the period ended December 31, 2010 and prior years reflect the historical per share data of Class C shares of the Predecessor Fund.
^ Commencement of Operations.
† Per share amount is based on average shares outstanding.
‡ Amount is less than $0.005 per share.
++ Calculated based on the net asset value as of the last business day of the period.
+ The Ratios of Expenses and Net Investment Loss reflect the rebate of certain Portfolio expenses in connection with the investments in Morgan Stanley affiliates during the period. The effect of the rebate on the ratios is disclosed in the above table as "Ratio of Rebate from Morgan Stanley Affiliates to Average Net Assets."
†† Reflects overall Portfolio ratios for investment income and non-class specific expenses.
§ Amount is less than 0.005%.
# Not Annualized.
* Annualized.
The accompanying notes are an integral part of the financial statements.
191
2011 Annual Report
December 31, 2011
Financial Highlights
Global Real Estate Portfolio
| | | Class I | |
| | | Year Ended December 31, | |
| Selected Per Share Data and Ratios | | 2011 | | 2010 | | 2009 | | 2008 | | 2007 | |
| Net Asset Value, Beginning of Period | | $ | 8.78 | | | $ | 7.47 | | | $ | 5.49 | | | $ | 10.04 | | | $ | 11.56 | | |
| Income (Loss) from Investment Operations: | |
| Net Investment Income† | | | 0.14 | | | | 0.19 | | | | 0.14 | | | | 0.16 | | | | 0.18 | | |
| Net Realized and Unrealized Gain (Loss) | | | (0.99 | ) | | | 1.31 | | | | 2.11 | | | | (4.67 | ) | | | (1.09 | ) | |
| Total from Investment Operations | | | (0.85 | ) | | | 1.50 | | | | 2.25 | | | | (4.51 | ) | | | (0.91 | ) | |
| Distributions from and/or in Excess of: | |
| Net Investment Income | | | (0.16 | ) | | | (0.19 | ) | | | (0.27 | ) | | | (0.02 | ) | | | (0.40 | ) | |
| Net Realized Gain | | | — | | | | — | | | | — | | | | (0.02 | ) | | | (0.21 | ) | |
| Total Distributions | | | (0.16 | ) | | | (0.19 | ) | | | (0.27 | ) | | | (0.04 | ) | | | (0.61 | ) | |
| Redemption Fees | | | — | | | | — | | | | 0.00 | ‡ | | | 0.00 | ‡ | | | 0.00 | ‡ | |
| Net Asset Value, End of Period | | $ | 7.77 | | | $ | 8.78 | | | $ | 7.47 | | | $ | 5.49 | | | $ | 10.04 | | |
| Total Return++ | | | (9.67 | )% | | | 20.22 | % | | | 41.04 | % | | | (45.00 | )% | | | (7.87 | )% | |
| Ratios and Supplemental Data: | |
| Net Assets, End of Period (Thousands) | | $ | 1,337,853 | | | $ | 1,215,881 | | | $ | 638,744 | | | $ | 473,459 | | | $ | 632,737 | | |
| Ratio of Expenses to Average Net Assets(1) | | | 1.04 | %+†† | | | 1.01 | %+†† | | | 1.01 | %+ | | | 1.05 | %+ | | | 1.02 | %+ | |
| Ratio of Expenses to Average Net Assets Excluding Non Operating Expenses | | | N/A | | | | 1.01 | %+†† | | | 1.01 | %+ | | | 1.04 | %+ | | | 1.02 | %+ | |
| Ratio of Net Investment Income to Average Net Assets(1) | | | 2.12 | %+†† | | | 2.43 | %+†† | | | 2.31 | %+ | | | 1.92 | %+ | | | 1.55 | %+ | |
| Ratio of Rebate from Morgan Stanley Affiliates to Average Net Assets | | | 0.00 | %††§ | | | 0.00 | %††§ | | | 0.00 | %§ | | | 0.00 | %§ | | | 0.00 | %§ | |
| Portfolio Turnover Rate | | | 28 | % | | | 18 | % | | | 59 | % | | | 40 | % | | | 39 | % | |
| (1) Supplemental Information on the Ratios to Average Net Assets: | |
| Ratios Before Expense Limitation: | |
| Expenses to Average Net Assets | | | 1.04 | % | | | N/A | | | | N/A | | | | N/A | | | | N/A | | |
| Net Investment Income to Average Net Assets | | | 2.12 | % | | | N/A | | | | N/A | | | | N/A | | | | N/A | | |
† Per share amount is based on average shares outstanding.
‡ Amount is less than $0.005 per share.
++ Calculated based on the net asset value as of the last business day of the period.
+ The Ratios of Expenses and Net Investment Income reflect the rebate of certain Portfolio expenses in connection with the investments in Morgan Stanley affiliates during the period. The effect of the rebate on the ratios is disclosed in the above table as "Ratio of Rebate from Morgan Stanley Affiliates to Average Net Assets."
†† Reflects overall Portfolio ratios for investment income and non-class specific expenses.
§ Amount is less than 0.005%.
The accompanying notes are an integral part of the financial statements.
192
2011 Annual Report
December 31, 2011
Financial Highlights
Global Real Estate Portfolio
| | | Class P | |
| | | Year Ended December 31, | |
| Selected Per Share Data and Ratios | | 2011 | | 2010 | | 2009 | | 2008 | | 2007 | |
| Net Asset Value, Beginning of Period | | $ | 8.74 | | | $ | 7.44 | | | $ | 5.47 | | | $ | 10.02 | | | $ | 11.56 | | |
| Income (Loss) from Investment Operations: | |
| Net Investment Income† | | | 0.12 | | | | 0.17 | | | | 0.13 | | | | 0.16 | | | | 0.16 | | |
| Net Realized and Unrealized Gain (Loss) | | | (0.98 | ) | | | 1.30 | | | | 2.09 | | | | (4.68 | ) | | | (1.11 | ) | |
| Total from Investment Operations | | | (0.86 | ) | | | 1.47 | | | | 2.22 | | | | (4.52 | ) | | | (0.95 | ) | |
| Distributions from and/or in Excess of: | |
| Net Investment Income | | | (0.15 | ) | | | (0.17 | ) | | | (0.25 | ) | | | (0.01 | ) | | | (0.38 | ) | |
| Net Realized Gain | | | — | | | | — | | | | — | | | | (0.02 | ) | | | (0.21 | ) | |
| Total Distributions | | | (0.15 | ) | | | (0.17 | ) | | | (0.25 | ) | | | (0.03 | ) | | | (0.59 | ) | |
| Redemption Fees | | | — | | | | — | | | | 0.00 | ‡ | | | 0.00 | ‡ | | | 0.00 | ‡ | |
| Net Asset Value, End of Period | | $ | 7.73 | | | $ | 8.74 | | | $ | 7.44 | | | $ | 5.47 | | | $ | 10.02 | | |
| Total Return++ | | | (9.91 | )% | | | 19.90 | % | | | 40.66 | % | | | (45.15 | )% | | | (8.15 | )% | |
| Ratios and Supplemental Data: | |
| Net Assets, End of Period (Thousands) | | $ | 130,244 | | | $ | 67,812 | | | $ | 52,663 | | | $ | 44,555 | | | $ | 13,187 | | |
| Ratio of Expenses to Average Net Assets (1) | | | 1.29 | %+†† | | | 1.26 | %+†† | | | 1.26 | %+ | | | 1.30 | %+ | | | 1.27 | %+ | |
| Ratio of Expenses to Average Net Assets Excluding Non Operating Expenses | | | N/A | | | | 1.26 | %+†† | | | 1.26 | %+ | | | 1.29 | %+ | | | 1.27 | %+ | |
| Ratio of Net Investment Income to Average Net Assets (1) | | | 1.87 | %+†† | | | 2.18 | %+†† | | | 2.08 | %+ | | | 2.32 | %+ | | | 1.39 | %+ | |
| Ratio of Rebate from Morgan Stanley Affiliates to Average Net Assets | | | 0.00 | %††§ | | | 0.00 | %††§ | | | 0.00 | %§ | | | 0.00 | %§ | | | 0.00 | %§ | |
| Portfolio Turnover Rate | | | 28 | % | | | 18 | % | | | 59 | % | | | 40 | % | | | 39 | % | |
| (1) Supplemental Information on the Ratios to Average Net Assets: | |
| Ratios Before Expense Limitation: | |
| Expenses to Average Net Assets | | | 1.29 | % | | | N/A | | | | N/A | | | | 1.32 | %+ | | | N/A | | |
| Net Investment Income to Average Net Assets | | | 1.87 | % | | | N/A | | | | N/A | | | | 2.30 | %+ | | | N/A | | |
† Per share amount is based on average shares outstanding.
‡ Amount is less than $0.005 per share.
++ Calculated based on the net asset value as of the last business day of the period.
+ The Ratios of Expenses and Net Investment Income reflect the rebate of certain Portfolio expenses in connection with the investments in Morgan Stanley affiliates during the period. The effect of the rebate on the ratios is disclosed in the above table as "Ratio of Rebate from Morgan Stanley Affiliates to Average Net Assets."
†† Reflects overall Portfolio ratios for investment income and non-class specific expenses.
§ Amount is less than 0.005%.
The accompanying notes are an integral part of the financial statements.
193
2011 Annual Report
December 31, 2011
Financial Highlights
Global Real Estate Portfolio
| | | Class H | |
| | | Year Ended December 31, | | Period from
January 2,
2008^ to
December 31, | |
| Selected Per Share Data and Ratios | | 2011 | | 2010 | | 2009 | | 2008 | |
| Net Asset Value, Beginning of Period | | $ | 8.72 | | | $ | 7.43 | | | $ | 5.47 | | | $ | 9.95 | | |
| Income (Loss) from Investment Operations: | |
| Net Investment Income† | | | 0.12 | | | | 0.18 | | | | 0.13 | | | | 0.11 | | |
| Net Realized and Unrealized Gain (Loss) | | | (0.98 | ) | | | 1.29 | | | | 2.08 | | | | (4.57 | ) | |
| Total from Investment Operations | | | (0.86 | ) | | | 1.47 | | | | 2.21 | | | | (4.46 | ) | |
| Distributions from and/or in Excess of: | |
| Net Investment Income | | | (0.14 | ) | | | (0.18 | ) | | | (0.25 | ) | | | — | | |
| Net Realized Gain | | | — | | | | — | | | | — | | | | (0.02 | ) | |
| Total Distributions | | | (0.14 | ) | | | (0.18 | ) | | | (0.25 | ) | | | (0.02 | ) | |
| Redemption Fees | | | — | | | | — | | | | 0.00 | ‡ | | | — | | |
| Net Asset Value, End of Period | | $ | 7.72 | | | $ | 8.72 | | | $ | 7.43 | | | $ | 5.47 | | |
| Total Return++ | | | (9.90 | )% | | | 19.96 | % | | | 40.59 | % | | | (44.88 | )%# | |
| Ratios and Supplemental Data: | |
| Net Assets, End of Period (Thousands) | | $ | 9,255 | | | $ | 11,381 | | | $ | 607 | | | $ | 391 | | |
| Ratio of Expenses to Average Net Assets (1) | | | 1.29 | %+†† | | | 1.26 | %+†† | | | 1.26 | %+ | | | 1.70 | %+* | |
| Ratio of Expenses to Average Net Assets Excluding Non Operating Expenses | | | N/A | | | | 1.26 | %+†† | | | 1.26 | %+ | | | 1.29 | %+* | |
| Ratio of Net Investment Income (Loss) to Average Net Assets (1) | | | 1.87 | %+†† | | | 2.18 | %+†† | | | 2.03 | %+ | | | 1.42 | %+* | |
| Rebate from Morgan Stanley Affiliates to Average Net Assets | | | 0.00 | %††§ | | | 0.00 | %††§ | | | 0.00 | %§ | | | 0.00 | %*§ | |
| Portfolio Turnover Rate | | | 28 | % | | | 18 | % | | | 59 | % | | | 40 | %# | |
| (1) Supplemental Information on the Ratios to Average Net Assets: | |
| Ratios Before Expense Limitation: | |
| Expense to Average Net Assets | | | 1.29 | % | | | N/A | | | | N/A | | | | 1.70 | %+* | |
| Net Investment Income to Average Net Assets | | | 1.87 | % | | | N/A | | | | N/A | | | | 1.42 | %+* | |
^ Commencement of Operations.
† Per share amount is based on average shares outstanding.
‡ Amount is less than $0.005 per share.
++ Calculated based on the net asset value which does not reflect sales charges, if applicable, as of the last business day of the period.
+ The Ratios of Expenses and Net Investment Income reflect the rebate of certain Portfolio expenses in connection with the investments in Morgan Stanley affiliates during the period. The effect of the rebate on the ratios is disclosed in the above table as "Ratio of Rebate from Morgan Stanley Affiliates to Average Net Assets."
†† Reflects overall Portfolio ratios for investment income and non-class specific expenses.
§ Amount is less than 0.005%.
# Not Annualized.
* Annualized.
The accompanying notes are an integral part of the financial statements.
194
2011 Annual Report
December 31, 2011
Financial Highlights
Global Real Estate Portfolio
| | | Class L | |
| | | Year Ended December 31, | | Period from
June 16,
2008^ to
December 31, | |
| Selected Per Share Data and Ratios | | 2011 | | 2010 | | 2009 | | 2008 | |
| Net Asset Value, Beginning of Period | | $ | 8.62 | | | $ | 7.35 | | | $ | 5.43 | | | $ | 9.46 | | |
| Income (Loss) from Investment Operations: | |
| Net Investment Income† | | | 0.07 | | | | 0.13 | | | | 0.08 | | | | 0.04 | | |
| Net Realized and Unrealized Gain (Loss) | | | (0.96 | ) | | | 1.28 | | | | 2.08 | | | | (4.05 | ) | |
| Total from Investment Operations | | | (0.89 | ) | | | 1.41 | | | | 2.16 | | | | (4.01 | ) | |
| Distributions from and/or in Excess of: | |
| Net Investment Income | | | (0.10 | ) | | | (0.14 | ) | | | (0.24 | ) | | | — | | |
| Net Realized Gain | | | — | | | | — | | | | — | | | | (0.02 | ) | |
| Total Distributions | | | (0.10 | ) | | | (0.14 | ) | | | (0.24 | ) | | | (0.02 | ) | |
| Redemption Fees | | | — | | | | — | | | | 0.00 | ‡ | | | — | | |
| Net Asset Value, End of Period | | $ | 7.63 | | | $ | 8.62 | | | $ | 7.35 | | | $ | 5.43 | | |
| Total Return++ | | | (10.33 | )% | | | 19.26 | % | | | 39.91 | % | | | (42.45 | )%# | |
| Ratios and Supplemental Data: | |
| Net Assets, End of Period (Thousands) | | $ | 6,418 | | | $ | 5,043 | | | $ | 1,603 | | | $ | 261 | | |
| Ratio of Expenses to Average Net Assets (1) | | | 1.79 | %+†† | | | 1.76 | %+†† | | | 1.76 | %+ | | | 1.81 | %+* | |
| Ratio of Expenses to Average Net Assets Excluding Non Operating Expenses | | | N/A | | | | 1.76 | %+†† | | | 1.76 | %+ | | | 1.80 | %+* | |
| Ratio of Net Investment Income (Loss) to Average Net Assets (1) | | | 1.37 | %+†† | | | 1.68 | %+†† | | | 1.23 | %+ | | | 1.20 | %+* | |
| Ratio of Rebate from Morgan Stanley Affiliates to Average Net Assets | | | 0.00 | %††§ | | | 0.00 | %††§ | | | 0.00 | %§ | | | 0.00 | %*§ | |
| Portfolio Turnover Rate | | | 28 | % | | | 18 | % | | | 59 | % | | | 40 | %# | |
| (1) Supplemental Information on the Ratios to Average Net Assets: | |
| Ratios Before Expense Limitation: | |
| Expenses to Average Net Assets | | | 1.79 | % | | | N/A | | | | N/A | | | | 1.84 | %+* | |
| Net Investment Income to Average Net Assets | | | 1.37 | % | | | N/A | | | | N/A | | | | 1.17 | %+* | |
^ Commencement of Operations.
† Per share amount is based on average shares outstanding.
‡ Amount is less than $0.005 per share.
++ Calculated based on the net asset value as of the last business day of the period.
+ The Ratios of Expenses and Net Investment Income reflect the rebate of certain Portfolio expenses in connection with the investments in Morgan Stanley affiliates during the period. The effect of the rebate on the ratios is disclosed in the above table as "Ratio of Rebate from Morgan Stanley Affiliates to Average Net Assets."
†† Reflects overall Portfolio ratios for investment income and non-class specific expenses.
§ Amount is less than 0.005%.
# Not Annualized.
* Annualized.
The accompanying notes are an integral part of the financial statements.
195
2011 Annual Report
December 31, 2011
Financial Highlights
International Advantage Portfolio
| | | Class I | |
| Selected Per Share Data and Ratios | | Year Ended
December 31,
2011 | | Period from
December 28,
2010^ to
December 31,
2010 | |
| Net Asset Value, Beginning of Period | | $ | 9.99 | | | $ | 10.00 | | |
| Income (Loss) from Investment Operations: | |
| Net Investment Income (Loss)† | | | 0.12 | | | | (0.00 | )‡ | |
| Net Realized and Unrealized Loss | | | (0.26 | ) | | | (0.01 | ) | |
| Total from Investment Operations | | | (0.14 | ) | | | (0.01 | ) | |
| Distributions from and/or in Excess of: | |
| Net Investment Income | | | (0.11 | ) | | | — | | |
| Net Realized Gain | | | (0.09 | ) | | | — | | |
| Total Distributions | | | (0.20 | ) | | | — | | |
| Net Asset Value, End of Period | | $ | 9.65 | | | $ | 9.99 | | |
| Total Return++ | | | (1.31 | )% | | | (0.10 | )%# | |
| Ratios and Supplemental Data:†† | |
| Net Assets, End of Period (Thousands) | | $ | 1,255 | | | $ | 1,198 | | |
| Ratio of Expenses to Average Net Assets (1) | | | 1.24 | %+ | | | 1.25 | %* | |
| Ratio of Net Investment Income (Loss) to Average Net Assets (1) | | | 1.17 | %+ | | | (1.09 | )%* | |
| Ratio of Rebate from Morgan Stanley Affiliates to Average Net Assets | | | 0.01 | % | | | N/A | | |
| Portfolio Turnover Rate | | | 27 | % | | | 0.00 | %# | |
| (1) Supplemental Information on the Ratios to Average Net Assets:†† | |
| Ratios Before Expense Limitation: | |
| Expenses to Average Net Assets | | | 7.08 | %+ | | | 176.40 | %* | |
| Net Investment Loss to Average Net Assets | | | (4.67 | )%+ | | | (176.24 | )%* | |
^ Commencement of Operations.
† Per share amount is based on average shares outstanding.
‡ Amount is less than $0.005 per share.
++ Calculated based on the net asset value as of the last business day of the period.
†† Reflects overall Portfolio ratios for investment income and non-class specific expenses.
+ The Ratios of Expenses and Net Investment Income (Loss) reflect the rebate of certain Portfolio expenses in connection with the investments in Morgan Stanley affiliates during the period. The effect of the rebate on the ratios is disclosed in the above table as "Ratio of Rebate from Morgan Stanley Affiliates to Average Net Assets."
# Not Annualized.
* Annualized.
The accompanying notes are an integral part of the financial statements.
196
2011 Annual Report
December 31, 2011
Financial Highlights
International Advantage Portfolio
| | | Class P | |
| Selected Per Share Data and Ratios | | Year Ended
December 31,
2011 | | Period from
December 28,
2010^ to
December 31,
2010 | |
| Net Asset Value, Beginning of Period | | $ | 9.99 | | | $ | 10.00 | | |
| Income (Loss) from Investment Operations: | |
| Net Investment Income (Loss)† | | | 0.09 | | | | (0.00 | )‡ | |
| Net Realized and Unrealized Loss | | | (0.25 | ) | | | (0.01 | ) | |
| Total from Investment Operations | | | (0.16 | ) | | | (0.01 | ) | |
| Distributions from and/or in Excess of: | |
| Net Investment Income | | | (0.09 | ) | | | — | | |
| Net Realized Gain | | | (0.09 | ) | | | — | | |
| Total Distributions | | | (0.18 | ) | | | — | | |
| Net Asset Value, End of Period | | $ | 9.65 | | | $ | 9.99 | | |
| Total Return++ | | | (1.57 | )% | | | (0.10 | )%# | |
| Ratios and Supplemental Data:†† | |
| Net Assets, End of Period (Thousands) | | $ | 96 | | | $ | 100 | | |
| Ratio of Expenses to Average Net Assets (1) | | | 1.49 | %+ | | | 1.50 | %* | |
| Ratio of Net Investment Income (Loss) to Average Net Assets (1) | | | 0.92 | %+ | | | (1.34 | )%* | |
| Ratio of Rebate from Morgan Stanley Affiliates to Average Net Assets | | | 0.01 | % | | | N/A | | |
| Portfolio Turnover Rate | | | 27 | % | | | 0.00 | %# | |
| (1) Supplemental Information on the Ratios to Average Net Assets:†† | |
| Ratios Before Expense Limitation: | |
| Expenses to Average Net Assets | | | 7.33 | %+ | | | 176.65 | %* | |
| Net Investment Loss to Average Net Assets | | | (4.92 | )%+ | | | (176.49 | )%* | |
^ Commencement of Operations.
† Per share amount is based on average shares outstanding.
‡ Amount is less than $0.005 per share.
++ Calculated based on the net asset value as of the last business day of the period.
†† Reflects overall Portfolio ratios for investment income and non-class specific expenses.
+ The Ratios of Expenses and Net Investment Income (Loss) reflect the rebate of certain Portfolio expenses in connection with the investments in Morgan Stanley affiliates during the period. The effect of the rebate on the ratios is disclosed in the above table as "Ratio of Rebate from Morgan Stanley Affiliates to Average Net Assets."
# Not Annualized.
* Annualized.
The accompanying notes are an integral part of the financial statements.
197
2011 Annual Report
December 31, 2011
Financial Highlights
International Advantage Portfolio
| | | Class H | |
| Selected Per Share Data and Ratios | | Year Ended
December 31,
2011 | | Period from
December 28,
2010^ to
December 31,
2010 | |
| Net Asset Value, Beginning of Period | | $ | 9.99 | | | $ | 10.00 | | |
| Income (Loss) from Investment Operations: | |
| Net Investment Income (Loss)† | | | 0.09 | | | | (0.00 | )‡ | |
| Net Realized and Unrealized Loss | | | (0.25 | ) | | | (0.01 | ) | |
| Total from Investment Operations | | | (0.16 | ) | | | (0.01 | ) | |
| Distributions from and/or in Excess of: | |
| Net Investment Income | | | (0.09 | ) | | | — | | |
| Net Realized Gain | | | (0.09 | ) | | | — | | |
| Total Distributions | | | (0.18 | ) | | | — | | |
| Net Asset Value, End of Period | | $ | 9.65 | | | $ | 9.99 | | |
| Total Return++ | | | (1.57 | )% | | | (0.10 | )%# | |
| Ratios and Supplemental Data:†† | |
| Net Assets, End of Period (Thousands) | | $ | 684 | | | $ | 100 | | |
| Ratio of Expenses to Average Net Assets (1) | | | 1.49 | %+ | | | 1.50 | %* | |
| Ratio of Net Investment Income (Loss) to Average Net Assets (1) | | | 0.92 | %+ | | | (1.34 | )%* | |
| Rebate from Morgan Stanley Affiliates to Average Net Assets | | | 0.01 | % | | | N/A | | |
| Portfolio Turnover Rate | | | 27 | % | | | 0.00 | %# | |
| (1) Supplemental Information on the Ratios to Average Net Assets:†† | |
| Ratios Before Expense Limitation: | |
| Expense to Average Net Assets | | | 7.33 | %+ | | | 176.65 | %* | |
| Net Investment Loss to Average Net Assets | | | (4.92 | )%+ | | | (176.49 | )%* | |
^ Commencement of Operations.
† Per share amount is based on average shares outstanding.
‡ Amount is less than $0.005 per share.
++ Calculated based on the net asset value which does not reflect sales charges, if applicable, as of the last business day of the period.
†† Reflects overall Portfolio ratios for investment income and non-class specific expenses.
+ The Ratios of Expenses and Net Investment Income (Loss) reflect the rebate of certain Portfolio expenses in connection with the investments in Morgan Stanley affiliates during the period. The effect of the rebate on the ratios is disclosed in the above table as "Ratio of Rebate from Morgan Stanley Affiliates to Average Net Assets."
# Not Annualized.
* Annualized.
The accompanying notes are an integral part of the financial statements.
198
2011 Annual Report
December 31, 2011
Financial Highlights
International Advantage Portfolio
| | | Class L | |
| Selected Per Share Data and Ratios | | Year Ended
December 31,
2011 | | Period from
December 28,
2010^ to
December 31,
2010 | |
| Net Asset Value, Beginning of Period | | $ | 9.99 | | | $ | 10.00 | | |
| Income (Loss) from Investment Operations: | |
| Net Investment Income (Loss)† | | | 0.04 | | | | (0.00 | )‡ | |
| Net Realized and Unrealized Loss | | | (0.25 | ) | | | (0.01 | ) | |
| Total from Investment Operations | | | (0.21 | ) | | | (0.01 | ) | |
| Distributions from and/or in Excess of: | |
| Net Investment Income | | | (0.04 | ) | | | — | | |
| Net Realized Gain | | | (0.09 | ) | | | — | | |
| Total Distributions | | | (0.13 | ) | | | — | | |
| Net Asset Value, End of Period | | $ | 9.65 | | | $ | 9.99 | | |
| Total Return++ | | | (2.09 | )% | | | (0.10 | )%# | |
| Ratios and Supplemental Data:†† | |
| Net Assets, End of Period (Thousands) | | $ | 97 | | | $ | 100 | | |
| Ratio of Expenses to Average Net Assets (1) | | | 1.99 | %+ | | | 2.00 | %* | |
| Ratio of Net Investment Income (Loss) to Average Net Assets (1) | | | 0.42 | %+ | | | (1.84 | )%* | |
| Ratio of Rebate from Morgan Stanley Affiliates to Average Net Assets | | | 0.01 | % | | | N/A | | |
| Portfolio Turnover Rate | | | 27 | % | | | 0.00 | %# | |
| (1) Supplemental Information on the Ratios to Average Net Assets:†† | |
| Ratios Before Expense Limitation: | |
| Expenses to Average Net Assets | | | 7.83 | %+ | | | 177.15 | %* | |
| Net Investment Loss to Average Net Assets | | | (5.42 | )%+ | | | (176.99 | )%* | |
^ Commencement of Operations.
† Per share amount is based on average shares outstanding.
‡ Amount is less than $0.005 per share.
++ Calculated based on the net asset value as of the last business day of the period.
†† Reflects overall Portfolio ratios for investment income and non-class specific expenses.
+ The Ratios of Expenses and Net Investment Income (Loss) reflect the rebate of certain Portfolio expenses in connection with the investments in Morgan Stanley affiliates during the period. The effect of the rebate on the ratios is disclosed in the above table as "Ratio of Rebate from Morgan Stanley Affiliates to Average Net Assets."
# Not Annualized.
* Annualized.
The accompanying notes are an integral part of the financial statements.
199
2011 Annual Report
December 31, 2011
Financial Highlights
International Equity Portfolio
| | | Class I | |
| | | Year Ended December 31, | |
| Selected Per Share Data and Ratios | | 2011 | | 2010 | | 2009 | | 2008 | | 2007 | |
| Net Asset Value, Beginning of Period | | $ | 13.61 | | | $ | 13.02 | | | $ | 11.01 | | | $ | 18.92 | | | $ | 20.58 | | |
| Income (Loss) from Investment Operations: | |
| Net Investment Income† | | | 0.32 | | | | 0.26 | | | | 0.27 | | | | 0.44 | | | | 0.43 | | |
| Net Realized and Unrealized Gain (Loss) | | | (1.37 | ) | | | 0.53 | | | | 2.10 | | | | (6.76 | ) | | | 1.53 | | |
| Total from Investment Operations | | | (1.05 | ) | | | 0.79 | | | | 2.37 | | | | (6.32 | ) | | | 1.96 | | |
| Distributions from and/or in Excess of: | |
| Net Investment Income | | | (0.31 | ) | | | (0.20 | ) | | | (0.36 | ) | | | (0.41 | ) | | | (0.46 | ) | |
| Net Realized Gain | | | — | | | | — | | | | — | | | | (1.18 | ) | | | (3.16 | ) | |
| Total Distributions | | | (0.31 | ) | | | (0.20 | ) | | | (0.36 | ) | | | (1.59 | ) | | | (3.62 | ) | |
| Redemption Fees | | | 0.00 | ‡ | | | 0.00 | ‡ | | | 0.00 | ‡ | | | 0.00 | ‡ | | | 0.00 | ‡ | |
| Net Asset Value, End of Period | | $ | 12.25 | | | $ | 13.61 | | | $ | 13.02 | | | $ | 11.01 | | | $ | 18.92 | | |
| Total Return++ | | | (7.63 | )% | | | 6.08 | % | | | 21.56 | % | | | (33.12 | )% | | | 9.84 | % | |
| Ratios and Supplemental Data: | |
| Net Assets, End of Period (Thousands) | | $ | 2,959,403 | | | $ | 3,372,029 | | | $ | 3,148,980 | | | $ | 2,606,704 | | | $ | 5,105,807 | | |
| Ratio of Expenses to Average Net Assets (1) | | | 0.95 | %+†† | | | 0.95 | %+†† | | | 0.94 | %+ | | | 0.95 | %+ | | | 0.93 | %+ | |
| Ratio of Expenses to Average Net Assets Excluding Non Operating Expenses | | | 0.95 | %+†† | | | 0.95 | %+†† | | | 0.94 | %+ | | | 0.95 | %+ | | | 0.93 | %+ | |
| Ratio of Net Investment Income to Average Net Assets (1) | | | 2.36 | %+†† | | | 2.05 | %+†† | | | 2.35 | %+ | | | 2.73 | %+ | | | 1.97 | %+ | |
| Ratio of Rebate from Morgan Stanley Affiliates to Average Net Assets | | | 0.00 | %††§ | | | 0.00 | %††§ | | | 0.01 | % | | | 0.00 | %§ | | | 0.00 | %§ | |
| Portfolio Turnover Rate | | | 34 | % | | | 40 | % | | | 38 | % | | | 34 | % | | | 31 | % | |
| (1) Supplemental Information on the Ratios to Average Net Assets: | |
| Ratios Before Expense Limitation: | |
| Expenses to Average Net Assets | | | 0.98 | %†† | | | 0.98 | %+†† | | | 0.95 | %+ | | | N/A | | | | N/A | | |
| Net Investment Income to Average Net Assets | | | 2.33 | %†† | | | 2.02 | %+†† | | | 2.34 | %+ | | | N/A | | | | N/A | | |
† Per share amount is based on average shares outstanding.
‡ Amount is less than $0.005 per share.
++ Calculated based on the net asset value as of the last business day of the period.
+ The Ratios of Expenses and Net Investment Income reflect the rebate of certain Portfolio expenses in connection with the investments in Morgan Stanley affiliates during the period. The effect of the rebate on the ratios is disclosed in the above table as "Ratio of Rebate from Morgan Stanley Affiliates to Average Net Assets."
†† Reflects overall Portfolio ratios for investment income and non-class specific expenses.
§ Amount is less than 0.005%.
The accompanying notes are an integral part of the financial statements.
200
2011 Annual Report
December 31, 2011
Financial Highlights
International Equity Portfolio
| | | Class P | |
| | | Year Ended December 31, | |
| Selected Per Share Data and Ratios | | 2011 | | 2010 | | 2009 | | 2008 | | 2007 | |
| Net Asset Value, Beginning of Period | | $ | 13.45 | | | $ | 12.87 | | | $ | 10.90 | | | $ | 18.73 | | | $ | 20.40 | | |
| Income (Loss) from Investment Operations: | |
| Net Investment Income† | | | 0.28 | | | | 0.23 | | | | 0.23 | | | | 0.38 | | | | 0.37 | | |
| Net Realized and Unrealized Gain (Loss) | | | (1.34 | ) | | | 0.51 | | | | 2.07 | | | | (6.66 | ) | | | 1.52 | | |
| Total from Investment Operations | | | (1.06 | ) | | | 0.74 | | | | 2.30 | | | | (6.28 | ) | | | 1.89 | | |
| Distributions from and/or in Excess of: | |
| Net Investment Income | | | (0.28 | ) | | | (0.16 | ) | | | (0.33 | ) | | | (0.37 | ) | | | (0.40 | ) | |
| Net Realized Gain | | | — | | | | — | | | | — | | | | (1.18 | ) | | | (3.16 | ) | |
| Total Distributions | | | (0.28 | ) | | | (0.16 | ) | | | (0.33 | ) | | | (1.55 | ) | | | (3.56 | ) | |
| Redemption Fees | | | 0.00 | ‡ | | | 0.00 | ‡ | | | 0.00 | ‡ | | | 0.00 | ‡ | | | 0.00 | ‡ | |
| Net Asset Value, End of Period | | $ | 12.11 | | | $ | 13.45 | | | $ | 12.87 | | | $ | 10.90 | | | $ | 18.73 | | |
| Total Return++ | | | (7.83 | )% | | | 5.78 | % | | | 21.18 | % | | | (33.21 | )% | | | 9.52 | % | |
| Ratios and Supplemental Data: | |
| Net Assets, End of Period (Thousands) | | $ | 916,002 | | | $ | 928,966 | | | $ | 1,131,919 | | | $ | 687,196 | | | $ | 1,019,595 | | |
| Ratio of Expenses to Average Net Assets (1) | | | 1.20 | %+†† | | | 1.20 | %+†† | | | 1.19 | %+ | | | 1.20 | %+ | | | 1.18 | %+ | |
| Ratio of Expenses to Average Net Assets Excluding Non Operating Expenses | | | 1.20 | %+†† | | | 1.20 | %+†† | | | 1.19 | %+ | | | 1.20 | %+ | | | 1.18 | %+ | |
| Ratio of Net Investment Income to Average Net Assets (1) | | | 2.11 | %+†† | | | 1.80 | %+†† | | | 2.02 | %+ | | | 2.43 | %+ | | | 1.71 | %+ | |
| Ratio of Rebate from Morgan Stanley Affiliates to Average Net Assets | | | 0.00 | %††§ | | | 0.00 | %††§ | | | 0.01 | % | | | 0.00 | %§ | | | 0.00 | %§ | |
| Portfolio Turnover Rate | | | 34 | % | | | 40 | % | | | 38 | % | | | 34 | % | | | 31 | % | |
| (1) Supplemental Information on the Ratios to Average Net Assets: | |
| Ratios Before Expense Limitation: | |
| Expenses to Average Net Assets | | | 1.23 | %†† | | | 1.23 | %+†† | | | 1.20 | %+ | | | N/A | | | | N/A | | |
| Net Investment Income to Average Net Assets | | | 2.08 | %†† | | | 1.77 | %+†† | | | 2.01 | %+ | | | N/A | | | | N/A | | |
† Per share amount is based on average shares outstanding.
‡ Amount is less than $0.005 per share.
++ Calculated based on the net asset value as of the last business day of the period.
+ The Ratios of Expenses and Net Investment Income reflect the rebate of certain Portfolio expenses in connection with the investments in Morgan Stanley affiliates during the period. The effect of the rebate on the ratios is disclosed in the above table as "Ratio of Rebate from Morgan Stanley Affiliates to Average Net Assets."
†† Reflects overall Portfolio ratios for investment income and non-class specific expenses.
§ Amount is less than 0.005%.
The accompanying notes are an integral part of the financial statements.
201
2011 Annual Report
December 31, 2011
Financial Highlights
International Opportunity Portfolio
| | | Class I | |
| Selected Per Share Data and Ratios | | Year Ended
December 31,
2011 | | Period from
March 31,
2010^ to
December 31,
2010 | |
| Net Asset Value, Beginning of Period | | $ | 12.07 | | | $ | 10.00 | | |
| Income (Loss) from Investment Operations: | |
| Net Investment Income† | | | 0.08 | | | | 0.03 | | |
| Net Realized and Unrealized Gain (Loss) | | | (1.31 | ) | | | 2.04 | | |
| Total from Investment Operations | | | (1.23 | ) | | | 2.07 | | |
| Distributions from and/or in Excess of: | |
| Net Investment Income | | | (0.10 | ) | | | — | | |
| Net Realized Gain | | | (0.48 | ) | | | — | | |
| Total Distributions | | | (0.58 | ) | | | — | | |
| Net Asset Value, End of Period | | $ | 10.26 | | | $ | 12.07 | | |
| Total Return++ | | | (10.16 | )% | | | 20.70 | %# | |
| Ratios and Supplemental Data:†† | |
| Net Assets, End of Period (Thousands) | | $ | 4,822 | | | $ | 5,672 | | |
| Ratio of Expenses to Average Net Assets (1) | | | 1.15 | %+ | | | 1.15 | %+* | |
| Ratio of Net Investment Income to Average Net Assets (1) | | | 0.67 | %+ | | | 0.33 | %+* | |
| Ratio of Rebate from Morgan Stanley Affiliates to Average Net Assets | | | 0.00 | %§ | | | 0.00 | %§* | |
| Portfolio Turnover Rate | | | 37 | % | | | 18 | %# | |
| (1) Supplemental Information on the Ratios to Average Net Assets:†† | |
| Ratios Before Expense Limitation: | |
| Expenses to Average Net Assets | | | 3.82 | % | | | 4.79 | %+* | |
| Net Investment Loss to Average Net Assets | | | (2.00 | )% | | | (3.31 | )%+* | |
^ Commencement of Operations.
† Per share amount is based on average shares outstanding.
++ Calculated based on the net asset value as of the last business day of the period.
†† Reflects overall Portfolio ratios for investment income and non-class specific expenses.
+ The Ratios of Expenses and Net Investment Income reflect the rebate of certain Portfolio expenses in connection with the investments in Morgan Stanley affiliates during the period. The effect of the rebate on the ratios is disclosed in the above table as "Ratio of Rebate from Morgan Stanley Affiliates to Average Net Assets."
§ Amount is less than 0.005%.
# Not Annualized.
* Annualized.
The accompanying notes are an integral part of the financial statements.
202
2011 Annual Report
December 31, 2011
Financial Highlights
International Opportunity Portfolio
| | | Class P | |
| Selected Per Share Data and Ratios | | Year Ended
December 31,
2011 | | Period from
March 31,
2010^ to
December 31,
2010 | |
| Net Asset Value, Beginning of Period | | $ | 12.04 | | | $ | 10.00 | | |
| Income (Loss) from Investment Operations: | |
| Net Investment Income† | | | 0.05 | | | | 0.01 | | |
| Net Realized and Unrealized Gain (Loss) | | | (1.30 | ) | | | 2.03 | | |
| Total from Investment Operations | | | (1.25 | ) | | | 2.04 | | |
| Distributions from and/or in Excess of: | |
| Net Investment Income | | | (0.05 | ) | | | — | | |
| Net Realized Gain | | | (0.48 | ) | | | — | | |
| Total Distributions | | | (0.53 | ) | | | — | | |
| Net Asset Value, End of Period | | $ | 10.26 | | | $ | 12.04 | | |
| Total Return++ | | | (10.33 | )% | | | 20.40 | %# | |
| Ratios and Supplemental Data:†† | |
| Net Assets, End of Period (Thousands) | | $ | 103 | | | $ | 120 | | |
| Ratio of Expenses to Average Net Assets (1) | | | 1.40 | %+ | | | 1.40 | %+* | |
| Ratio of Net Investment Income to Average Net Assets (1) | | | 0.42 | %+ | | | 0.08 | %+* | |
| Ratio of Rebate from Morgan Stanley Affiliates to Average Net Assets | | | 0.00 | %§ | | | 0.00 | %§* | |
| Portfolio Turnover Rate | | | 37 | % | | | 18 | %# | |
| (1) Supplemental Information on the Ratios to Average Net Assets:†† | |
| Ratios Before Expense Limitation: | |
| Expenses to Average Net Assets | | | 4.07 | % | | | 5.04 | %+* | |
| Net Investment Loss to Average Net Assets | | | (2.25 | )% | | | (3.56 | )%+* | |
^ Commencement of Operations.
† Per share amount is based on average shares outstanding.
++ Calculated based on the net asset value as of the last business day of the period.
†† Reflects overall Portfolio ratios for investment income and non-class specific expenses.
+ The Ratios of Expenses and Net Investment Income reflect the rebate of certain Portfolio expenses in connection with the investments in Morgan Stanley affiliates during the period. The effect of the rebate on the ratios is disclosed in the above table as "Ratio of Rebate from Morgan Stanley Affiliates to Average Net Assets."
§ Amount is less than 0.005%.
# Not Annualized.
* Annualized.
The accompanying notes are an integral part of the financial statements.
203
2011 Annual Report
December 31, 2011
Financial Highlights
International Opportunity Portfolio
| | | Class H | |
| Selected Per Share Data and Ratios | | Year Ended
December 31,
2011 | | Period from
March 31,
2010^ to
December 31,
2010 | |
| Net Asset Value, Beginning of Period | | $ | 12.04 | | | $ | 10.00 | | |
| Income (Loss) from Investment Operations: | |
| Net Investment Income† | | | 0.05 | | | | 0.01 | | |
| Net Realized and Unrealized Gain (Loss) | | | (1.29 | ) | | | 2.03 | | |
| Total from Investment Operations | | | (1.24 | ) | | | 2.04 | | |
| Distributions from and/or in Excess of: | |
| Net Investment Income | | | (0.06 | ) | | | — | | |
| Net Realized Gain | | | (0.48 | ) | | | — | | |
| Total Distributions | | | (0.54 | ) | | | — | | |
| Net Asset Value, End of Period | | $ | 10.26 | | | $ | 12.04 | | |
| Total Return++ | | | (10.30 | )% | | | 20.40 | %# | |
| Ratios and Supplemental Data:†† | |
| Net Assets, End of Period (Thousands) | | $ | 765 | | | $ | 808 | | |
| Ratio of Expenses to Average Net Assets (1) | | | 1.40 | %+ | | | 1.40 | %+* | |
| Ratio of Net Investment Income to Average Net Assets (1) | | | 0.42 | %+ | | | 0.08 | %+* | |
| Rebate from Morgan Stanley Affiliates to Average Net Assets | | | 0.00 | %§ | | | 0.00 | %§* | |
| Portfolio Turnover Rate | | | 37 | % | | | 18 | %# | |
| (1) Supplemental Information on the Ratios to Average Net Assets:†† | |
| Ratios Before Expense Limitation: | |
| Expense to Average Net Assets | | | 4.07 | % | | | 5.04 | %+* | |
| Net Investment Loss to Average Net Assets | | | (2.25 | )% | | | (3.56 | )%+* | |
^ Commencement of Operations.
† Per share amount is based on average shares outstanding.
++ Calculated based on the net asset value which does not reflect sales charges, if applicable, as of the last business day of the period.
†† Reflects overall Portfolio ratios for investment income and non-class specific expenses.
+ The Ratios of Expenses and Net Investment Income reflect the rebate of certain Portfolio expenses in connection with the investments in Morgan Stanley affiliates during the period. The effect of the rebate on the ratios is disclosed in the above table as "Ratio of Rebate from Morgan Stanley Affiliates to Average Net Assets."
§ Amount is less than 0.005%.
# Not Annualized.
* Annualized.
The accompanying notes are an integral part of the financial statements.
204
2011 Annual Report
December 31, 2011
Financial Highlights
International Opportunity Portfolio
| | | Class L | |
| Selected Per Share Data and Ratios | | Year Ended
December 31,
2011 | | Period from
March 31,
2010^ to
December 31,
2010 | |
| Net Asset Value, Beginning of Period | | $ | 12.00 | | | $ | 10.00 | | |
| Income (Loss) from Investment Operations: | |
| Net Investment Loss† | | | (0.01 | ) | | | (0.03 | ) | |
| Net Realized and Unrealized Gain (Loss) | | | (1.29 | ) | | | 2.03 | | |
| Total from Investment Operations | | | (1.30 | ) | | | 2.00 | | |
| Distributions from and/or in Excess of: | |
| Net Realized Gain | | | (0.48 | ) | | | — | | |
| Net Asset Value, End of Period | | $ | 10.22 | | | $ | 12.00 | | |
| Total Return++ | | | (10.81 | )% | | | 20.00 | %# | |
| Ratios and Supplemental Data:†† | |
| Net Assets, End of Period (Thousands) | | $ | 102 | | | $ | 120 | | |
| Ratio of Expenses to Average Net Assets (1) | �� | | 1.90 | %+ | | | 1.90 | %+* | |
| Ratio of Net Investment Loss to Average Net Assets (1) | | | (0.08 | )%+ | | | (0.42 | )%+* | |
| Ratio of Rebate from Morgan Stanley Affiliates to Average Net Assets | | | 0.00 | %§ | | | 0.00 | %§* | |
| Portfolio Turnover Rate | | | 37 | % | | | 18 | %# | |
| (1) Supplemental Information on the Ratios to Average Net Assets:†† | |
| Ratios Before Expense Limitation: | |
| Expenses to Average Net Assets | | | 4.57 | % | | | 5.54 | %+* | |
| Net Investment Loss to Average Net Assets | | | (2.75 | )% | | | (4.06 | )%+* | |
^ Commencement of Operations.
† Per share amount is based on average shares outstanding.
++ Calculated based on the net asset value as of the last business day of the period.
†† Reflects overall Portfolio ratios for investment income and non-class specific expenses.
+ The Ratios of Expenses and Net Investment Loss reflect the rebate of certain Portfolio expenses in connection with the investments in Morgan Stanley affiliates during the period. The effect of the rebate on the ratios is disclosed in the above table as "Ratio of Rebate from Morgan Stanley Affiliates to Average Net Assets."
§ Amount is less than 0.005%.
# Not Annualized.
* Annualized.
The accompanying notes are an integral part of the financial statements.
205
2011 Annual Report
December 31, 2011
Financial Highlights
International Real Estate Portfolio
| | | Class I | |
| | | Year Ended December 31, | |
| Selected Per Share Data and Ratios | | 2011 | | 2010 | | 2009 | | 2008 | | 2007 | |
| Net Asset Value, Beginning of Period | | $ | 18.85 | | | $ | 17.80 | | | $ | 12.59 | | | $ | 25.30 | | | $ | 34.82 | | |
| Income (Loss) from Investment Operations: | |
| Net Investment Income† | | | 0.39 | | | | 0.69 | | | | 0.44 | | | | 0.56 | | | | 0.69 | | |
| Net Realized and Unrealized Gain (Loss) | | | (4.04 | ) | | | 0.98 | | | | 5.40 | | | | (13.15 | ) | | | (6.79 | ) | |
| Total from Investment Operations | | | (3.65 | ) | | | 1.67 | | | | 5.84 | | | | (12.59 | ) | | | (6.10 | ) | |
| Distributions from and/or in Excess of: | |
| Net Investment Income | | | (0.54 | ) | | | (0.62 | ) | | | (0.63 | ) | | | — | | | | (1.77 | ) | |
| Net Realized Gain | | | — | | | | — | | | | — | | | | (0.12 | ) | | | (1.65 | ) | |
| Total Distributions | | | (0.54 | ) | | | (0.62 | ) | | | (0.63 | ) | | | (0.12 | ) | | | (3.42 | ) | |
| Redemption Fees | | | 0.00 | ‡ | | | 0.00 | ‡ | | | 0.00 | ‡ | | | 0.00 | ‡ | | | 0.00 | ‡ | |
| Net Asset Value, End of Period | | $ | 14.66 | | | $ | 18.85 | | | $ | 17.80 | | | $ | 12.59 | | | $ | 25.30 | | |
| Total Return++ | | | (19.92 | )% | | | 9.51 | % | | | 46.54 | % | | | (49.95 | )% | | | (17.59 | )% | |
| Ratios and Supplemental Data: | |
| Net Assets, End of Period (Thousands) | | $ | 207,695 | | | $ | 397,514 | | | $ | 463,649 | | | $ | 427,148 | | | $ | 1,053,018 | | |
| Ratio of Expenses to Average Net Assets (1) | | | 1.00 | %+†† | | | 0.98 | %+†† | | | 0.93 | %+ | | | 0.95 | %+ | | | 0.94 | %+ | |
| Ratio of Expenses to Average Net Assets Excluding Non Operating Expenses | | | N/A | | | | 0.98 | %+†† | | | 0.93 | %+ | | | 0.94 | %+ | | | 0.94 | %+ | |
| Ratio of Net Investment Income to Average Net Assets (1) | | | 2.17 | %+†† | | | 3.97 | %+†† | | | 3.04 | %+ | | | 2.68 | %+ | | | 2.10 | %+ | |
| Ratio of Rebate from Morgan Stanley Affiliates to Average Net Assets | | | 0.00 | %††§ | | | 0.00 | %††§ | | | 0.00 | %§ | | | 0.00 | %§ | | | 0.00 | %§ | |
| Portfolio Turnover Rate | | | 18 | % | | | 64 | % | | | 56 | % | | | 54 | % | | | 55 | % | |
| (1) Supplemental Information on the Ratios to Average Net Assets: | |
| Ratios Before Expense Limitation: | |
| Expenses to Average Net Assets | | | N/A | | | | N/A | | | | N/A | | | | 0.97 | %+ | | | N/A | | |
| Net Investment Income to Average Net Assets | | | N/A | | | | N/A | | | | N/A | | | | 2.66 | %+ | | | N/A | | |
† Per share amount is based on average shares outstanding.
‡ Amount is less than $0.005 per share.
++ Calculated based on the net asset value as of the last business day of the period.
+ The Ratios of Expenses and Net Investment Income reflect the rebate of certain Portfolio expenses in connection with the investments in Morgan Stanley affiliates during the period. The effect of the rebate on the ratios is disclosed in the above table as "Ratio of Rebate from Morgan Stanley Affiliates to Average Net Assets."
†† Reflects overall Portfolio ratios for investment income and non-class specific expenses.
§ Amount is less than 0.005%.
The accompanying notes are an integral part of the financial statements.
206
2011 Annual Report
December 31, 2011
Financial Highlights
International Real Estate Portfolio
| | | Class P | |
| | | Year Ended December 31, | |
| Selected Per Share Data and Ratios | | 2011 | | 2010 | | 2009 | | 2008 | | 2007 | |
| Net Asset Value, Beginning of Period | | $ | 18.83 | | | $ | 17.77 | | | $ | 12.58 | | | $ | 25.33 | | | $ | 34.83 | | |
| Income (Loss) from Investment Operations: | |
| Net Investment Income† | | | 0.34 | | | | 0.64 | | | | 0.39 | | | | 0.63 | | | | 0.58 | | |
| Net Realized and Unrealized Gain (Loss) | | | (4.04 | ) | | | 0.98 | | | | 5.39 | | | | (13.26 | ) | | | (6.74 | ) | |
| Total from Investment Operations | | | (3.70 | ) | | | 1.62 | | | | 5.78 | | | | (12.63 | ) | | | (6.16 | ) | |
| Distributions from and/or in Excess of: | |
| Net Investment Income | | | (0.48 | ) | | | (0.56 | ) | | | (0.59 | ) | | | — | | | | (1.69 | ) | |
| Net Realized Gain | | | — | | | | — | | | | — | | | | (0.12 | ) | | | (1.65 | ) | |
| Total Distributions | | | (0.48 | ) | | | (0.56 | ) | | | (0.59 | ) | | | (0.12 | ) | | | (3.34 | ) | |
| Redemption Fees | | | 0.00 | ‡ | | | 0.00 | ‡ | | | 0.00 | ‡ | | | 0.00 | ‡ | | | 0.00 | ‡ | |
| Net Asset Value, End of Period | | $ | 14.65 | | | $ | 18.83 | | | $ | 17.77 | | | $ | 12.58 | | | $ | 25.33 | | |
| Total Return++ | | | (20.16 | )% | | | 9.26 | % | | | 46.08 | % | | | (50.05 | )% | | | (17.76 | )% | |
| Ratios and Supplemental Data: | |
| Net Assets, End of Period (Thousands) | | $ | 3,400 | | | $ | 5,547 | | | $ | 8,429 | | | $ | 9,141 | | | $ | 97,800 | | |
| Ratio of Expenses to Average Net Assets (1) | | | 1.25 | %+†† | | | 1.23 | %+†† | | | 1.18 | %+ | | | 1.19 | %+ | | | 1.19 | %+ | |
| Ratio of Expenses to Average Net Assets Excluding Non Operating Expenses | | | N/A | | | | 1.23 | %+†† | | | 1.18 | %+ | | | 1.19 | %+ | | | 1.19 | %+ | |
| Ratio of Net Investment Income to Average Net Assets (1) | | | 1.92 | %+†† | | | 3.72 | %+†† | | | 2.74 | %+ | | | 2.66 | %+ | | | 1.76 | %+ | |
| Ratio of Rebate from Morgan Stanley Affiliates to Average Net Assets | | | 0.00 | %††§ | | | 0.00 | %††§ | | | 0.00 | %§ | | | 0.00 | %§ | | | 0.00 | %§ | |
| Portfolio Turnover Rate | | | 18 | % | | | 64 | % | | | 56 | % | | | 54 | % | | | 55 | % | |
| (1) Supplemental Information on the Ratios to Average Net Assets: | |
| Ratios Before Expense Limitation: | |
| Expenses to Average Net Assets | | | N/A | | | | N/A | | | | N/A | | | | 1.22 | %+ | | | N/A | | |
| Net Investment Income to Average Net Assets | | | N/A | | | | N/A | | | | N/A | | | | 2.64 | %+ | | | N/A | | |
† Per share amount is based on average shares outstanding.
‡ Amount is less than $0.005 per share.
++ Calculated based on the net asset value as of the last business day of the period.
+ The Ratios of Expenses and Net Investment Income reflect the rebate of certain Portfolio expenses in connection with the investments in Morgan Stanley affiliates during the period. The effect of the rebate on the ratios is disclosed in the above table as "Ratio of Rebate from Morgan Stanley Affiliates to Average Net Assets."
†† Reflects overall Portfolio ratios for investment income and non-class specific expenses.
§ Amount is less than 0.005%.
The accompanying notes are an integral part of the financial statements.
207
2011 Annual Report
December 31, 2011
Financial Highlights
International Small Cap Portfolio
| | | Class I | |
| | | Year Ended December 31, | |
| Selected Per Share Data and Ratios | | 2011 | | 2010 | | 2009 | | 2008 | | 2007 | |
| Net Asset Value, Beginning of Period | | $ | 13.80 | | | $ | 11.97 | | | $ | 9.53 | | | $ | 17.08 | | | $ | 23.72 | | |
| Income (Loss) from Investment Operations: | |
| Net Investment Income† | | | 0.18 | | | | 0.11 | | | | 0.14 | | | | 0.34 | | | | 0.27 | | |
| Net Realized and Unrealized Gain (Loss) | | | (2.71 | ) | | | 1.76 | | | | 2.47 | | | | (6.66 | ) | | | (1.11 | ) | |
| Total from Investment Operations | | | (2.53 | ) | | | 1.87 | | | | 2.61 | | | | (6.32 | ) | | | (0.84 | ) | |
| Distributions from and/or in Excess of: | |
| Net Investment Income | | | — | | | | (0.04 | ) | | | (0.17 | ) | | | (0.41 | ) | | | (0.27 | ) | |
| Net Realized Gain | | | — | | | | — | | | | — | | | | (0.82 | ) | | | (5.53 | ) | |
| Total Distributions | | | — | | | | (0.04 | ) | | | (0.17 | ) | | | (1.23 | ) | | | (5.80 | ) | |
| Redemption Fees | | | 0.00 | ‡ | | | 0.00 | ‡ | | | 0.00 | ‡ | | | 0.00 | ‡ | | | 0.00 | ‡ | |
| Net Asset Value, End of Period | | $ | 11.27 | | | $ | 13.80 | | | $ | 11.97 | | | $ | 9.53 | | | $ | 17.08 | | |
| Total Return++ | | | (18.33 | )% | | | 15.72 | % | | | 27.45 | % | | | (38.33 | )% | | | (3.22 | )% | |
| Ratios and Supplemental Data: | |
| Net Assets, End of Period (Thousands) | | $ | 213,983 | | | $ | 320,362 | | | $ | 349,589 | | | $ | 316,526 | | | $ | 796,050 | | |
| Ratio of Expenses to Average Net Assets (1) | | | 1.15 | %+†† | | | 1.15 | %+†† | | | 1.14 | %+ | | | 1.13 | %+ | | | 1.09 | %+ | |
| Ratio of Expenses to Average Net Assets Excluding Non Operating Expenses | | | N/A | | | | 1.15 | %+†† | | | 1.14 | %+ | | | 1.12 | %+ | | | 1.09 | %+ | |
| Ratio of Net Investment Income to Average Net Assets (1) | | | 1.33 | %+†† | | | 0.87 | %+†† | | | 1.31 | %+ | | | 2.47 | %+ | | | 1.10 | %+ | |
| Ratio of Rebate from Morgan Stanley Affiliates to Average Net Assets | | | 0.00 | %††§ | | | 0.00 | %††§ | | | 0.00 | %§ | | | 0.00 | %§ | | | 0.00 | %§ | |
| Portfolio Turnover Rate | | | 64 | % | | | 66 | % | | | 127 | % | | | 49 | % | | | 53 | % | |
| (1) Supplemental Information on the Ratios to Average Net Assets: | |
| Ratios Before Expense Limitation: | |
| Expenses to Average Net Assets | | | 1.19 | %†† | | | 1.18 | %+†† | | | N/A | | | | 1.15 | %+ | | | N/A | | |
| Net Investment Income to Average Net Assets | | | 1.29 | %†† | | | 0.84 | %+†† | | | N/A | | | | 2.44 | %+ | | | N/A | | |
† Per share amount is based on average shares outstanding.
‡ Amount is less than $0.005 per share.
++ Calculated based on the net asset value as of the last business day of the period.
+ The Ratios of Expenses and Net Investment Income reflect the rebate of certain Portfolio expenses in connection with the investments in Morgan Stanley affiliates during the period. The effect of the rebate on the ratios is disclosed in the above table as "Ratio of Rebate from Morgan Stanley Affiliates to Average Net Assets."
†† Reflects overall Portfolio ratios for investment income and non-class specific expenses.
§ Amount is less than 0.005%.
The accompanying notes are an integral part of the financial statements.
208
2011 Annual Report
December 31, 2011
Financial Highlights
International Small Cap Portfolio
| | | Class P | |
| | | Year Ended December 31, | | Period from
October 21,
2008^ to
December 31, | |
| Selected Per Share Data and Ratios | | 2011 | | 2010 | | 2009 | | 2008 | |
| Net Asset Value, Beginning of Period | | $ | 13.74 | | | $ | 11.95 | | | $ | 9.53 | | | $ | 9.80 | | |
| Income (Loss) from Investment Operations: | |
| Net Investment Income† | | | 0.14 | | | | 0.07 | | | | 0.01 | | | | 0.00 | ‡ | |
| Net Realized and Unrealized Gain (Loss) | | | (2.69 | ) | | | 1.76 | | | | 2.57 | | | | 0.14 | | |
| Total from Investment Operations | | | (2.55 | ) | | | 1.83 | | | | 2.58 | | | | 0.14 | | |
| Distributions from and/or in Excess of: | |
| Net Investment Income | | | — | | | | (0.04 | ) | | | (0.16 | ) | | | (0.41 | ) | |
| Redemption Fees | | | 0.00 | ‡ | | | 0.00 | ‡ | | | 0.00 | ‡ | | | — | | |
| Net Asset Value, End of Period | | $ | 11.19 | | | $ | 13.74 | | | $ | 11.95 | | | $ | 9.53 | | |
| Total Return++ | | | (18.56 | )% | | | 15.41 | % | | | 27.14 | % | | | 1.56 | %# | |
| Ratios and Supplemental Data: | |
| Net Assets, End of Period (Thousands) | | $ | 82,170 | | | $ | 101,074 | | | $ | 63,326 | | | $ | 119 | | |
| Ratio of Expenses to Average Net Assets (1) | | | 1.40 | %+††** | | | 1.40 | %+††** | | | 1.37 | %+** | | | 1.39 | %+* | |
| Ratio of Expenses to Average Net Assets Excluding Non Operating Expenses | | | N/A | | | | 1.40 | %+††** | | | 1.37 | %+** | | | 1.39 | %+* | |
| Ratio of Net Investment Income to Average Net Assets (1) | | | 1.08 | %+†† | | | 0.62 | %+†† | | | 0.12 | %+ | | | 0.09 | %+* | |
| Ratio of Rebate from Morgan Stanley Affiliates to Average Net Assets | | | 0.00 | %††§ | | | 0.00 | %††§ | | | 0.00 | %§ | | | 0.00 | %§* | |
| Portfolio Turnover Rate | | | 64 | % | | | 66 | % | | | 127 | % | | | 49 | %# | |
| (1) Supplemental Information on the Ratios to Average Net Assets: | |
| Ratios Before Expense Limitation: | |
| Expenses to Average Net Assets | | | 1.44 | %†† | | | 1.43 | %+†† | | | N/A | | | | 1.86 | %+* | |
| Net Investment Income (Loss) to Average Net Assets | | | 1.04 | %†† | | | 0.59 | %+†† | | | N/A | | | | (0.38 | )%+* | |
^ Commencement of Operations.
† Per share amount is based on average shares outstanding.
‡ Amount is less than $0.005 per share.
++ Calculated based on the net asset value as of the last business day of the period.
+ The Ratios of Expenses and Net Investment Income reflect the rebate of certain Portfolio expenses in connection with the investments in Morgan Stanley affiliates during the period. The effect of the rebate on the ratios is disclosed in the above table as "Ratio of Rebate from Morgan Stanley Affiliates to Average Net Assets."
†† Reflects overall Portfolio ratios for investment income and non-class specific expenses.
** Ratios of Expenses to Average Net Assets for Class P may vary by more than the shareholder servicing fees due to fluctuations in daily net asset amounts.
§ Amount is less than 0.005%.
# Not Annualized.
* Annualized.
The accompanying notes are an integral part of the financial statements.
209
2011 Annual Report
December 31, 2011
Financial Highlights
Select Global Infrastructure Portfolio
| | | Class I | |
| Selected Per Share Data and Ratios | | Year Ended
December 31,
2011 | | Period from
September 20,
2010^ to
December 31,
2010 | |
| Net Asset Value, Beginning of Period | | $ | 10.40 | | | $ | 10.00 | | |
| Income from Investment Operations: | |
| Net Investment Income† | | | 0.23 | | | | 0.08 | | |
| Net Realized and Unrealized Gain | | | 1.42 | | | | 0.40 | | |
| Total from Investment Operations | | | 1.65 | | | | 0.48 | | |
| Distributions from and/or in Excess of: | |
| Net Investment Income | | | (0.22 | ) | | | (0.08 | ) | |
| Net Realized Gain | | | (0.33 | ) | | | — | | |
| Total Distributions | | | (0.55 | ) | | | (0.08 | ) | |
| Net Asset Value, End of Period | | $ | 11.50 | | | $ | 10.40 | | |
| Total Return++ | | | 15.95 | % | | | 4.94 | %# | |
| Ratios and Supplemental Data:†† | |
| Net Assets, End of Period (Thousands) | | $ | 12,589 | | | $ | 10,086 | | |
| Ratio of Expenses to Average Net Assets (1) | | | 1.15 | %+ | | | 1.14 | %+* | |
| Ratio of Net Investment Income to Average Net Assets (1) | | | 2.09 | %+ | | | 2.71 | %+* | |
| Ratio of Rebate from Morgan Stanley Affiliates to Average Net Assets | | | 0.00 | %§ | | | 0.01 | %* | |
| Portfolio Turnover Rate | | | 51 | % | | | 6 | %# | |
| (1) Supplemental Information on the Ratios to Average Net Assets:†† | |
| Ratios Before Expense Limitation: | |
| Expenses to Average Net Assets | | | 2.93 | % | | | 3.61 | %+* | |
| Net Investment Income to Average Net Assets | | | 0.31 | % | | | 0.24 | %+* | |
^ Commencement of Operations.
† Per share amount is based on average shares outstanding.
++ Calculated based on the net asset value as of the last business day of the period.
†† Reflects overall Portfolio ratios for investment income and non-class specific expenses.
+ The Ratios of Expenses and Net Investment Income reflect the rebate of certain Portfolio expenses in connection with the investments in Morgan Stanley affiliates during the period. The effect of the rebate on the ratios is disclosed in the above table as "Ratio of Rebate from Morgan Stanley Affiliates to Average Net Assets."
§ Amount is less than 0.005%.
# Not Annualized.
* Annualized.
The accompanying notes are an integral part of the financial statements.
210
2011 Annual Report
December 31, 2011
Financial Highlights
Select Global Infrastructure Portfolio
| | | Class P | |
| Selected Per Share Data and Ratios | | Year Ended
December 31,
2011 | | Period from
September 20,
2010^ to
December 31,
2010 | |
| Net Asset Value, Beginning of Period | | $ | 10.40 | | | $ | 10.00 | | |
| Income from Investment Operations: | |
| Net Investment Income† | | | 0.21 | | | | 0.07 | | |
| Net Realized and Unrealized Gain | | | 1.41 | | | | 0.41 | | |
| Total from Investment Operations | | | 1.62 | | | | 0.48 | | |
| Distributions from and/or in Excess of: | |
| Net Investment Income | | | (0.19 | ) | | | (0.08 | ) | |
| Net Realized Gain | | | (0.33 | ) | | | — | | |
| Total Distributions | | | (0.52 | ) | | | (0.08 | ) | |
| Net Asset Value, End of Period | | $ | 11.50 | | | $ | 10.40 | | |
| Total Return++ | | | 15.67 | % | | | 4.86 | %# | |
| Ratios and Supplemental Data:†† | |
| Net Assets, End of Period (Thousands) | | $ | 115 | | | $ | 104 | | |
| Ratio of Expenses to Average Net Assets (1) | | | 1.40 | %+ | | | 1.39 | %+* | |
| Ratio of Net Investment Income to Average Net Assets (1) | | | 1.84 | %+ | | | 2.46 | %+* | |
| Ratio of Rebate from Morgan Stanley Affiliates to Average Net Assets | | | 0.00 | %§ | | | 0.01 | %* | |
| Portfolio Turnover Rate | | | 51 | % | | | 6 | %# | |
| (1) Supplemental Information on the Ratios to Average Net Assets:†† | |
| Ratios Before Expense Limitation: | |
| Expenses to Average Net Assets | | | 3.18 | % | | | 3.86 | %+* | |
| Net Investment Income (Loss) to Average Net Assets | | | 0.06 | % | | | (0.01 | )%+* | |
^ Commencement of Operations.
† Per share amount is based on average shares outstanding.
++ Calculated based on the net asset value as of the last business day of the period.
†† Reflects overall Portfolio ratios for investment income and non-class specific expenses.
+ The Ratios of Expenses and Net Investment Income reflect the rebate of certain Portfolio expenses in connection with the investments in Morgan Stanley affiliates during the period. The effect of the rebate on the ratios is disclosed in the above table as "Ratio of Rebate from Morgan Stanley Affiliates to Average Net Assets."
§ Amount is less than 0.005%.
# Not Annualized.
* Annualized.
The accompanying notes are an integral part of the financial statements.
211
2011 Annual Report
December 31, 2011
Financial Highlights
Select Global Infrastructure Portfolio
| | | Class H | |
| Selected Per Share Data and Ratios | | Year Ended
December 31,
2011 | | Period from
September 20,
2010^ to
December 31,
2010 | |
| Net Asset Value, Beginning of Period | | $ | 10.40 | | | $ | 10.00 | | |
| Income from Investment Operations: | |
| Net Investment Income† | | | 0.21 | | | | 0.07 | | |
| Net Realized and Unrealized Gain | | | 1.41 | | | | 0.41 | | |
| Total from Investment Operations | | | 1.62 | | | | 0.48 | | |
| Distributions from and/or in Excess of: | |
| Net Investment Income | | | (0.19 | ) | | | (0.08 | ) | |
| Net Realized Gain | | | (0.33 | ) | | | — | | |
| Total Distributions | | | (0.52 | ) | | | (0.08 | ) | |
| Net Asset Value, End of Period | | $ | 11.50 | | | $ | 10.40 | | |
| Total Return++ | | | 15.67 | % | | | 4.86 | %# | |
| Ratios and Supplemental Data:†† | |
| Net Assets, End of Period (Thousands) | | $ | 115 | | | $ | 104 | | |
| Ratio of Expenses to Average Net Assets (1) | | | 1.40 | %+ | | | 1.39 | %+* | |
| Ratio of Net Investment Income to Average Net Assets (1) | | | 1.84 | %+ | | | 2.46 | %+* | |
| Rebate from Morgan Stanley Affiliates to Average Net Assets | | | 0.00 | %§ | | | 0.01 | %* | |
| Portfolio Turnover Rate | | | 51 | % | | | 6 | %# | |
| (1) Supplemental Information on the Ratios to Average Net Assets:†† | |
| Ratios Before Expense Limitation: | |
| Expense to Average Net Assets | | | 3.18 | % | | | 3.86 | %+* | |
| Net Investment Income (Loss) to Average Net Assets | | | 0.06 | % | | | (0.01 | )%+* | |
^ Commencement of Operations.
† Per share amount is based on average shares outstanding.
++ Calculated based on the net asset value which does not reflect sales charges, if applicable, as of the last business day of the period.
†† Reflects overall Portfolio ratios for investment income and non-class specific expenses.
+ The Ratios of Expenses and Net Investment Income reflect the rebate of certain Portfolio expenses in connection with the investments in Morgan Stanley affiliates during the period. The effect of the rebate on the ratios is disclosed in the above table as "Ratio of Rebate from Morgan Stanley Affiliates to Average Net Assets."
§ Amount is less than 0.005%.
# Not Annualized.
* Annualized.
The accompanying notes are an integral part of the financial statements.
212
2011 Annual Report
December 31, 2011
Financial Highlights
Select Global Infrastructure Portfolio
| | | Class L | |
| Selected Per Share Data and Ratios | | Year Ended
December 31,
2011 | | Period from
September 20,
2010^ to
December 31,
2010 | |
| Net Asset Value, Beginning of Period | | $ | 10.40 | | | $ | 10.00 | | |
| Income from Investment Operations: | |
| Net Investment Income† | | | 0.15 | | | | 0.06 | | |
| Net Realized and Unrealized Gain | | | 1.42 | | | | 0.40 | | |
| Total from Investment Operations | | | 1.57 | | | | 0.46 | | |
| Distributions from and/or in Excess of: | |
| Net Investment Income | | | (0.14 | ) | | | (0.06 | ) | |
| Net Realized Gain | | | (0.33 | ) | | | — | | |
| Total Distributions | | | (0.47 | ) | | | (0.06 | ) | |
| Net Asset Value, End of Period | | $ | 11.50 | | | $ | 10.40 | | |
| Total Return++ | | | 15.12 | % | | | 4.72 | %# | |
| Ratios and Supplemental Data:†† | |
| Net Assets, End of Period (Thousands) | | $ | 115 | | | $ | 104 | | |
| Ratio of Expenses to Average Net Assets (1) | | | 1.90 | %+ | | | 1.89 | %+* | |
| Ratio of Net Investment Income to Average Net Assets (1) | | | 1.34 | %+ | | | 1.96 | %+* | |
| Ratio of Rebate from Morgan Stanley Affiliates to Average Net Assets | | | 0.00 | %§ | | | 0.01 | %* | |
| Portfolio Turnover Rate | | | 51 | % | | | 6 | %# | |
| (1) Supplemental Information on the Ratios to Average Net Assets:†† | |
| Ratios Before Expense Limitation: | |
| Expenses to Average Net Assets | | | 3.68 | % | | | 4.36 | %+* | |
| Net Investment Loss to Average Net Assets | | | (0.44 | )% | | | (0.51 | )%+* | |
^ Commencement of Operations.
† Per share amount is based on average shares outstanding.
++ Calculated based on the net asset value as of the last business day of the period.
†† Reflects overall Portfolio ratios for investment income and non-class specific expenses.
+ The Ratios of Expenses and Net Investment Income reflect the rebate of certain Portfolio expenses in connection with the investments in Morgan Stanley affiliates during the period. The effect of the rebate on the ratios is disclosed in the above table as "Ratio of Rebate from Morgan Stanley Affiliates to Average Net Assets."
§ Amount is less than 0.005%.
# Not Annualized.
* Annualized.
The accompanying notes are an integral part of the financial statements.
213
2011 Annual Report
December 31, 2011
Financial Highlights
Advantage Portfolio
| | | Class I** | |
| | | Year Ended
December 31, | | Period from
September 1,
2010 to
December 31, | | Year Ended
August 31, | | Period from
June 30,
2008^ to
August 31, | |
| Selected Per Share Data and Ratios | | 2011 | | 2010 | | 2010 | | 2009 | | 2008 | |
| Net Asset Value, Beginning of Period | | $ | 10.87 | | | $ | 9.15 | | | $ | 7.97 | | | $ | 9.55 | | | $ | 10.00 | | |
| Income (Loss) from Investment Operations: | |
| Net Investment Income† | | | 0.04 | | | | 0.01 | | | | 0.04 | | | | 0.03 | | | | 0.00 | ‡ | |
| Net Realized and Unrealized Gain (Loss) | | | 0.54 | | | | 1.74 | | | | 1.19 | | | | (1.50 | ) | | | (0.45 | ) | |
| Total from Investment Operations | | | 0.58 | | | | 1.75 | | | | 1.23 | | | | (1.47 | ) | | | (0.45 | ) | |
| Distributions from and/or in Excess of: | |
| Net Investment Income | | | (0.07 | ) | | | (0.03 | ) | | | (0.05 | ) | | | (0.11 | ) | | | — | | |
| Net Asset Value, End of Period | | $ | 11.38 | | | $ | 10.87 | | | $ | 9.15 | | | $ | 7.97 | | | $ | 9.55 | | |
| Total Return++ | | | 5.33 | % | | | 19.30 | %# | | | 15.34 | % | | | (15.05 | )% | | | (4.50 | )%# | |
| Ratios and Supplemental Data: | |
| Net Assets, End of Period (Thousands) | | $ | 7,239 | | | $ | 5,015 | | | $ | 4,223 | | | $ | 3,667 | | | $ | 4,392 | | |
| Ratio of Expenses to Average Net Assets (1) | | | 1.05 | %+†† | | | 1.02 | %+††* | | | 1.05 | % | | | 1.05 | % | | | 1.05 | %* | |
| Ratio of Expenses to Average Net Assets Excluding Non Operating Expenses | | | N/A | | | | 0.25 | %+††* | | | N/A | | | | N/A | | | | N/A | | |
| Ratio of Net Investment Income to Average Net Assets (1) | | | 0.39 | %+†† | | | 0.42 | %+††* | | | 0.49 | % | | | 0.49 | % | | | 0.20 | %* | |
| Ratio of Rebate from Morgan Stanley Affiliates to Average Net Assets | | | 0.00 | %††§ | | | 0.03 | %††* | | | N/A | | | | N/A | | | | N/A | | |
| Portfolio Turnover Rate | | | 28 | % | | | 33 | %# | | | 32 | % | | | 14 | % | | | 2 | %# | |
| (1) Supplemental Information on the Ratios to Average Net Assets: | |
| Ratios Before Expense Limitation: | |
| Expenses to Average Net Assets | | | 3.43 | %†† | | | 3.49 | %+††* | | | 4.49 | % | | | 11.78 | % | | | 14.97 | %* | |
| Net Investment Loss to Average Net Assets | | | (1.99 | )%†† | | | (2.05 | )%+††* | | | (2.95 | )% | | | (10.24 | )% | | | (13.72 | )%* | |
** On May 21, 2010, the Portfolio acquired substantially all of the assets and liabilities of the Van Kampen Core Growth Fund ("the Predecessor Fund"). Therefore, the per share data and ratios of Class I shares for the 12-month period ended August 31, 2010 and prior years reflect the historical per share data of Class I shares of the Predecessor Fund.
^ Commencement of Operations.
† Per share amount is based on average shares outstanding.
‡ Amount is less than $0.005 per share.
++ Calculated based on the net asset value as of the last business day of the period.
+ The Ratios of Expenses and Net Investment Income reflect the rebate of certain Portfolio expenses in connection with the investments in Morgan Stanley affiliates during the period. The effect of the rebate on the ratios is disclosed in the above table as "Ratio of Rebate from Morgan Stanley Affiliates to Average Net Assets."
†† Reflects overall Portfolio ratios for investment income and non-class specific expenses.
§ Amount is less than 0.005%.
# Not Annualized.
* Annualized.
The accompanying notes are an integral part of the financial statements.
214
2011 Annual Report
December 31, 2011
Financial Highlights
Advantage Portfolio
| | | Class P | |
| Selected Per Share Data and Ratios | | Year Ended
December 31,
2011 | | Period from
September 1,
2010 to
December 31,
2010 | | Period from
May 21,
2010^ to
August 31,
2010 | |
| Net Asset Value, Beginning of Period | | $ | 10.86 | | | $ | 9.15 | | | $ | 9.00 | | |
| Income (Loss) from Investment Operations: | |
| Net Investment Income† | | | 0.02 | | | | 0.01 | | | | 0.01 | | |
| Net Realized and Unrealized Gain | | | 0.53 | | | | 1.73 | | | | 0.14 | | |
| Total from Investment Operations | | | 0.55 | | | | 1.74 | | | | 0.15 | | |
| Distributions from and/or in Excess of: | |
| Net Investment Income | | | (0.04 | ) | | | (0.03 | ) | | | — | | |
| Net Asset Value, End of Period | | $ | 11.37 | | | $ | 10.86 | | | $ | 9.15 | | |
| Total Return++ | | | 5.07 | % | | | 19.16 | %# | | | 1.56 | %# | |
| Ratios and Supplemental Data:†† | |
| Net Assets, End of Period (Thousands) | | $ | 11 | | | $ | 10 | | | $ | 1 | | |
| Ratio of Expenses to Average Net Assets (1) | | | 1.30 | %+ | | | 1.29 | %+* | | | 1.30 | %* | |
| Ratio of Expenses to Average Net Assets Excluding Non Operating Expenses | | | N/A | | | | 0.52 | %+* | | | N/A | | |
| Ratio of Net Investment Income to Average Net Assets (1) | | | 0.14 | %+ | | | 0.15 | %+* | | | 0.27 | %* | |
| Ratio of Rebate from Morgan Stanley Affiliates to Average Net Assets | | | 0.00 | %§ | | | 0.03 | %* | | | N/A | | |
| Portfolio Turnover Rate | | | 28 | % | | | 33 | %# | | | 32 | %# | |
| (1) Supplemental Information on the Ratios to Average Net Assets:†† | |
| Ratios Before Expense Limitation: | |
| Expenses to Average Net Assets | | | 3.68 | % | | | 3.76 | %+ | | | 2.59 | %* | |
| Net Investment Loss to Average Net Assets | | | (2.24 | )% | | | (2.32 | )%+ | | | (1.02 | )%* | |
^ Commencement of Operations.
† Per share amount is based on average shares outstanding.
++ Calculated based on the net asset value as of the last business day of the period.
†† Reflects overall Portfolio ratios for investment income and non-class specific expenses.
+ The Ratios of Expenses and Net Investment Income reflect the rebate of certain Portfolio expenses in connection with the investments in Morgan Stanley affiliates during the period. The effect of the rebate on the ratios is disclosed in the above table as "Ratio of Rebate from Morgan Stanley Affiliates to Average Net Assets."
§ Amount is less than 0.005%.
# Not Annualized.
* Annualized.
The accompanying notes are an integral part of the financial statements.
215
2011 Annual Report
December 31, 2011
Financial Highlights
Advantage Portfolio
| | | Class H** | |
| | | Year Ended
December 31, | | Period from
September 1,
2010 to
December 31, | | Year Ended
August 31, | | Period from
June 30,
2008^ to
August 31, | |
| Selected Per Share Data and Ratios | | 2011 | | 2010 | | 2010 | | 2009 | | 2008 | |
| Net Asset Value, Beginning of Period | | $ | 10.86 | | | $ | 9.14 | | | $ | 7.96 | | | $ | 9.54 | | | $ | 10.00 | | |
| Income (Loss) from Investment Operations: | |
| Net Investment Income† | | | 0.02 | | | | 0.01 | | | | 0.02 | | | | 0.02 | | | | 0.00 | ‡ | |
| Net Realized and Unrealized Gain (Loss) | | | 0.53 | | | | 1.73 | | | | 1.19 | | | | (1.50 | ) | | | (0.46 | ) | |
| Total from Investment Operations | | | 0.55 | | | | 1.74 | | | | 1.21 | | | | (1.48 | ) | | | (0.46 | ) | |
| Distributions from and/or in Excess of: | |
| Net Investment Income | | | (0.04 | ) | | | (0.02 | ) | | | (0.03 | ) | | | (0.10 | ) | | | — | | |
| Net Asset Value, End of Period | | $ | 11.37 | | | $ | 10.86 | | | $ | 9.14 | | | $ | 7.96 | | | $ | 9.54 | | |
| Total Return++ | | | 5.06 | % | | | 19.13 | %# | | | 15.14 | % | | | (15.16 | )% | | | (4.60 | )%# | |
| Ratios and Supplemental Data: | |
| Net Assets, End of Period (Thousands) | | $ | 996 | | | $ | 1,103 | | | $ | 1,048 | | | $ | 821 | | | $ | 363 | | |
| Ratio of Expenses to Average Net Assets (1) | | | 1.30 | %+†† | | | 1.27 | %+††* | | | 1.30 | % | | | 1.30 | % | | | 1.30 | %* | |
| Ratio of Expenses to Average Net Assets Excluding Non Operating Expenses | | | N/A | | | | 0.50 | %+††* | | | N/A | | | | N/A | | | | N/A | | |
| Ratio of Net Investment Income to Average Net Assets (1) | | | 0.14 | %+†† | | | 0.17 | %+††* | | | 0.14 | % | | | 0.27 | % | | | (0.06 | )%* | |
| Rebate from Morgan Stanley Affiliates to Average Net Assets | | | 0.00 | %††§ | | | 0.03 | %††* | | | N/A | | | | N/A | | | | N/A | | |
| Portfolio Turnover Rate | | | 28 | % | | | 33 | %# | | | 32 | % | | | 14 | % | | | 2 | %# | |
| (1) Supplemental Information on the Ratios to Average Net Assets: | |
| Ratios Before Expense Limitation: | |
| Expense to Average Net Assets | | | 3.68 | %†† | | | 3.74 | %+†† | | | 4.62 | % | | | 11.97 | % | | | 15.46 | %* | |
| Net Investment Loss to Average Net Assets | | | (2.24 | )%†† | | | (2.30 | )%+†† | | | (3.18 | )% | | | (10.40 | )% | | | (14.22 | )%* | |
** On May 21, 2010, the Portfolio acquired substantially all of the assets and liabilities of the Van Kampen Core Growth Fund ("the Predecessor Fund"). Therefore, the per share data and ratios of Class H shares for the 12-month period ended August 31, 2010 and prior years reflect the historical per share data of Class A shares of the Predecessor Fund.
^ Commencement of Operations.
† Per share amount is based on average shares outstanding.
‡ Amount is less than $0.005 per share.
++ Calculated based on the net asset value which does not reflect sales charges, if applicable, as of the last business day of the period.
+ The Ratios of Expenses and Net Investment Income reflect the rebate of certain Portfolio expenses in connection with the investments in Morgan Stanley affiliates during the period. The effect of the rebate on the ratios is disclosed in the above table as "Ratio of Rebate from Morgan Stanley Affiliates to Average Net Assets."
†† Reflects overall Portfolio ratios for investment income and non-class specific expenses.
§ Amount is less than 0.005%.
# Not Annualized.
* Annualized.
The accompanying notes are an integral part of the financial statements.
216
2011 Annual Report
December 31, 2011
Financial Highlights
Advantage Portfolio
| | | Class L** | |
| | | Year Ended
December 31, | | Period from
September 1,
2010 to
December 31, | | Year Ended
August 31, | | Period from
June 30,
2008^ to
August 31, | |
| Selected Per Share Data and Ratios | | 2011 | | 2010 | | 2010 | | 2009 | | 2008 | |
| Net Asset Value, Beginning of Period | | $ | 10.89 | | | $ | 9.16 | | | $ | 7.96 | | | $ | 9.54 | | | $ | 10.00 | | |
| Income (Loss) from Investment Operations: | |
| Net Investment Income† | | | 0.04 | | | | 0.01 | | | | 0.04 | | | | 0.00 | ‡ | | | 0.00 | ‡ | |
| Net Realized and Unrealized Gain (Loss) | | | 0.52 | | | | 1.75 | | | | 1.19 | | | | (1.50 | ) | | | (0.46 | ) | |
| Total from Investment Operations | | | 0.56 | | | | 1.76 | | | | 1.23 | | | | (1.50 | ) | | | (0.46 | ) | |
| Distributions from and/or in Excess of: | |
| Net Investment Income | | | (0.06 | ) | | | (0.03 | ) | | | (0.03 | ) | | | (0.08 | ) | | | — | | |
| Net Asset Value, End of Period | | $ | 11.39 | | | $ | 10.89 | | | $ | 9.16 | | | $ | 7.96 | | | $ | 9.54 | | |
| Total Return++ | | | 5.19 | % | | | 19.20 | %# | | | 15.43 | % | | | (15.40 | )% | | | (4.60 | )%# | |
| Ratios and Supplemental Data: | |
| Net Assets, End of Period (Thousands) | | $ | 208 | | | $ | 155 | | | $ | 156 | | | $ | 160 | | | $ | 147 | | |
| Ratio of Expenses to Average Net Assets (1) | | | 1.09 | %+†† | | | 1.06 | %+††* | | | 1.08 | % | | | 1.48 | % | | | 1.05 | %* | |
| Ratio of Expenses to Average Net Assets Excluding Non Operating Expenses | | | N/A | | | | 0.29 | %+††* | | | N/A | | | | N/A | | | | N/A | | |
| Ratio of Net Investment Income to Average Net Assets (1) | | | 0.35 | %+†† | | | 0.38 | %+††* | | | 0.45 | % | | | (0.01 | )% | | | (0.20 | )%* | |
| Ratio of Rebate from Morgan Stanley Affiliates to Average Net Assets | | | 0.00 | %††§ | | | 0.03 | %††* | | | N/A | | | | N/A | | | | N/A | | |
| Portfolio Turnover Rate | | | 28 | % | | | 33 | %# | | | 32 | % | | | 14 | % | | | 2 | %# | |
| (1) Supplemental Information on the Ratios to Average Net Assets: | |
| Ratios Before Expense Limitation: | |
| Expenses to Average Net Assets | | | 4.18 | %†† | | | 3.53 | %+††* | | | 4.53 | % | | | 12.27 | % | | | 15.79 | %* | |
| Net Investment Loss to Average Net Assets | | | (2.74 | )%†† | | | (2.09 | )%+††* | | | (3.00 | )% | | | (10.80 | )% | | | (14.49 | )%* | |
** On May 21, 2010, the Portfolio acquired substantially all of the assets and liabilities of the Van Kampen Core Growth Fund ("the Predecessor Fund"). Therefore, the per share data and ratios of Class L shares for the 12-month period ended August 31, 2010 and prior years reflect the historical per share data of Class C shares of the Predecessor Fund.
^ Commencement of Operations.
† Per share amount is based on average shares outstanding.
‡ Amount is less than $0.005 per share.
++ Calculated based on the net asset value as of the last business day of the period.
+ The Ratios of Expenses and Net Investment Income reflect the rebate of certain Portfolio expenses in connection with the investments in Morgan Stanley affiliates during the period. The effect of the rebate on the ratios is disclosed in the above table as "Ratio of Rebate from Morgan Stanley Affiliates to Average Net Assets."
†† Reflects overall Portfolio ratios for investment income and non-class specific expenses.
§ Amount is less than 0.005%.
# Not Annualized.
* Annualized.
The accompanying notes are an integral part of the financial statements.
217
2011 Annual Report
December 31, 2011
Financial Highlights
Focus Growth Portfolio
| | | Class I | |
| | | Year Ended December 31, | |
| Selected Per Share Data and Ratios | | 2011 | | 2010 | | 2009 | | 2008 | | 2007 | |
| Net Asset Value, Beginning of Period | | $ | 19.58 | | | $ | 15.27 | | | $ | 8.95 | | | $ | 18.81 | | | $ | 15.19 | | |
| Income (Loss) from Investment Operations: | |
| Net Investment Income (Loss)† | | | (0.06 | ) | | | (0.05 | ) | | | (0.01 | ) | | | 0.00 | ‡ | | | 0.03 | | |
| Net Realized and Unrealized Gain (Loss) | | | (1.37 | ) | | | 4.36 | | | | 6.33 | | | | (9.82 | ) | | | 3.62 | | |
| Total from Investment Operations | | | (1.43 | ) | | | 4.31 | | | | 6.32 | | | | (9.82 | ) | | | 3.65 | | |
| Distributions from and/or in Excess of: | |
| Net Investment Income | | | — | | | | — | | | | — | | | | (0.04 | ) | | | (0.03 | ) | |
| Redemption Fees | | | — | | | | — | | | | — | | | | 0.00 | ‡ | | | 0.00 | ‡ | |
| Net Asset Value, End of Period | | $ | 18.15 | | | $ | 19.58 | | | $ | 15.27 | | | $ | 8.95 | | | $ | 18.81 | | |
| Total Return++ | | | (7.30 | )% | | | 28.23 | % | | | 70.61 | %** | | | (52.19 | )% | | | 24.02 | % | |
| Ratios and Supplemental Data: | |
| Net Assets, End of Period (Thousands) | | $ | 22,377 | | | $ | 17,618 | | | $ | 7,878 | | | $ | 4,879 | | | $ | 13,852 | | |
| Ratio of Expenses to Average Net Assets (1) | | | 0.99 | %+†† | | | 1.00 | %+†† | | | 0.99 | %+ | | | 1.00 | %+ | | | 1.00 | %+ | |
| Ratio of Expenses to Average Net Assets Excluding Non Operating Expenses | | | N/A | | | | 1.00 | %+†† | | | 0.99 | %+ | | | 1.00 | %+ | | | 1.00 | %+ | |
| Ratio of Net Investment Income (Loss) to Average Net Assets (1) | | | (0.29 | )%+†† | | | (0.28 | )%+†† | | | (0.12 | )%+ | | | 0.02 | %+ | | | 0.16 | %+ | |
| Ratio of Rebate from Morgan Stanley Affiliates to Average Net Assets | | | 0.01 | %†† | | | 0.00 | %††§ | | | 0.01 | % | | | 0.00 | %§ | | | 0.00 | %§ | |
| Portfolio Turnover Rate | | | 37 | % | | | 79 | % | | | 11 | % | | | 36 | % | | | 57 | % | |
| (1) Supplemental Information on the Ratios to Average Net Assets: | |
| Ratios Before Expense Limitation: | |
| Expenses to Average Net Assets | | | 1.09 | %†† | | | 1.51 | %+†† | | | 1.88 | %+ | | | 1.29 | %+ | | | 1.13 | %+ | |
| Net Investment Income (Loss) to Average Net Assets | | | (0.39 | )%†† | | | (0.79 | )%+†† | | | (1.01 | )%+ | | | (0.27 | )%+ | | | 0.03 | %+ | |
† Per share amount is based on average shares outstanding.
‡ Amount is less than $0.005 per share.
++ Calculated based on the net asset value as of the last business day of the period.
** Performance was positively impacted by approximately 2.12% due to the receipt of proceeds from the settlements of class action suits involving primarily one of the Portfolio's past holdings. This was a one-time settlement, and as a result, the impact on the NAV and consequently the performance will not likely be repeated in the future. Had these settlements not occurred, the total return for Class I would have been approximately 68.49%.
+ The Ratios of Expenses and Net Investment Income (Loss) reflect the rebate of certain Portfolio expenses in connection with the investments in Morgan Stanley affiliates during the period. The effect of the rebate on the ratios is disclosed in the above table as "Ratio of Rebate from Morgan Stanley Affiliates to Average Net Assets."
†† Reflects overall Portfolio ratios for investment income and non-class specific expenses.
§ Amount is less than 0.005%.
The accompanying notes are an integral part of the financial statements.
218
2011 Annual Report
December 31, 2011
Financial Highlights
Focus Growth Portfolio
| | | Class P | |
| | | Year Ended December 31, | |
| Selected Per Share Data and Ratios | | 2011 | | 2010 | | 2009 | | 2008 | | 2007 | |
| Net Asset Value, Beginning of Period | | $ | 19.00 | | | $ | 14.86 | | | $ | 8.73 | | | $ | 18.32 | | | $ | 14.81 | | |
| Income (Loss) from Investment Operations: | |
| Net Investment Loss† | | | (0.11 | ) | | | (0.08 | ) | | | (0.04 | ) | | | (0.04 | ) | | | (0.01 | ) | |
| Net Realized and Unrealized Gain (Loss) | | | (1.32 | ) | | | 4.22 | | | | 6.17 | | | | (9.55 | ) | | | 3.52 | | |
| Total from Investment Operations | | | (1.43 | ) | | | 4.14 | | | | 6.13 | | | | (9.59 | ) | | | 3.51 | | |
| Distributions from and/or in Excess of: | |
| Net Investment Income | | | — | | | | — | | | | — | | | | (0.00 | )‡ | | | — | | |
| Redemption Fees | | | — | | | | — | | | | — | | | | 0.00 | ‡ | | | 0.00 | ‡ | |
| Net Asset Value, End of Period | | $ | 17.57 | | | $ | 19.00 | | | $ | 14.86 | | | $ | 8.73 | | | $ | 18.32 | | |
| Total Return++ | | | (7.53 | )% | | | 27.86 | % | | | 70.02 | %** | | | (52.27 | )% | | | 23.70 | % | |
| Ratios and Supplemental Data: | |
| Net Assets, End of Period (Thousands) | | $ | 1,588 | | | $ | 1,704 | | | $ | 1,460 | | | $ | 1,069 | | | $ | 2,913 | | |
| Ratio of Expenses to Average Net Assets (1) | | | 1.24 | %+†† | | | 1.25 | %+†† | | | 1.24 | %+ | | | 1.25 | %+ | | | 1.25 | %+ | |
| Ratio of Expenses to Average Net Assets Excluding Non Operating Expenses | | | N/A | | | | 1.25 | %+†† | | | 1.24 | %+ | | | 1.25 | %+ | | | 1.25 | %+ | |
| Ratio of Net Investment Loss to Average Net Assets (1) | | | (0.54 | )%+†† | | | (0.53 | )%+†† | | | (0.38 | )%+ | | | (0.24 | )%+ | | | (0.07 | )%+ | |
| Ratio of Rebate from Morgan Stanley Affiliates to Average Net Assets | | | 0.01 | %†† | | | 0.00 | %††§ | | | 0.01 | % | | | 0.00 | %§ | | | 0.00 | %§ | |
| Portfolio Turnover Rate | | | 37 | % | | | 79 | % | | | 11 | % | | | 36 | % | | | 57 | % | |
| (1) Supplemental Information on the Ratios to Average Net Assets: | |
| Ratios Before Expense Limitation: | |
| Expenses to Average Net Assets | | | 1.34 | %†† | | | 1.76 | %+†† | | | 2.16 | %+ | | | 1.54 | %+ | | | 1.38 | %+ | |
| Net Investment Loss to Average Net Assets | | | (0.64 | )%†† | | | (1.04 | )%+†† | | | (1.30 | )%+ | | | (0.53 | )%+ | | | (0.20 | )%+ | |
† Per share amount is based on average shares outstanding.
‡ Amount is less than $0.005 per share.
++ Calculated based on the net asset value as of the last business day of the period.
** Performance was positively impacted by approximately 2.17% due to the receipt of proceeds from the settlements of class action suits involving primarily one of the Portfolio's past holdings. This was a one-time settlement, and as a result, the impact on the NAV and consequently the performance will not likely be repeated in the future. Had these settlements not occurred, the total return for Class P would have been approximately 67.85%.
+ The Ratios of Expenses and Net Investment Loss reflect the rebate of certain Portfolio expenses in connection with the investments in Morgan Stanley affiliates during the period. The effect of the rebate on the ratios is disclosed in the above table as "Ratio of Rebate from Morgan Stanley Affiliates to Average Net Assets."
†† Reflects overall Portfolio ratios for investment income and non-class specific expenses.
§ Amount is less than 0.005%.
The accompanying notes are an integral part of the financial statements.
219
2011 Annual Report
December 31, 2011
Financial Highlights
Growth Portfolio
| | | Class I | |
| | | Year Ended December 31, | |
| Selected Per Share Data and Ratios | | 2011 | | 2010 | | 2009 | | 2008 | | 2007 | |
| Net Asset Value, Beginning of Period | | $ | 24.24 | | | $ | 19.69 | | | $ | 12.12 | | | $ | 24.69 | | | $ | 20.28 | | |
| Income (Loss) from Investment Operations: | |
| Net Investment Income† | | | 0.01 | | | | 0.06 | | | | 0.05 | | | | 0.05 | | | | 0.10 | | |
| Net Realized and Unrealized Gain (Loss) | | | (0.73 | ) | | | 4.49 | | | | 7.58 | | | | (12.50 | ) | | | 4.41 | | |
| Total from Investment Operations | | | (0.72 | ) | | | 4.55 | | | | 7.63 | | | | (12.45 | ) | | | 4.51 | | |
| Distributions from and/or in Excess of: | |
| Net Investment Income | | | (0.06 | ) | | | (0.00 | )‡ | | | (0.06 | ) | | | (0.10 | ) | | | (0.10 | ) | |
| Net Realized Gain | | | — | | | | — | | | | — | | | | (0.02 | ) | | | — | | |
| Total Distributions | | | (0.06 | ) | | | (0.00 | )‡ | | | (0.06 | ) | | | (0.12 | ) | | | (0.10 | ) | |
| Redemption Fees | | | — | | | | — | | | | 0.00 | ‡ | | | 0.00 | ‡ | | | 0.00 | ‡ | |
| Net Asset Value, End of Period | | $ | 23.46 | | | $ | 24.24 | | | $ | 19.69 | | | $ | 12.12 | | | $ | 24.69 | | |
| Total Return++ | | | (3.01 | )% | | | 23.11 | % | | | 62.97 | %** | | | (50.47 | )% | | | 22.29 | % | |
| Ratios and Supplemental Data: | |
| Net Assets, End of Period (Thousands) | | $ | 622,193 | | | $ | 704,410 | | | $ | 674,070 | | | $ | 543,841 | | | $ | 1,406,866 | | |
| Ratio of Expenses to Average Net Assets | | | 0.71 | %+†† | | | 0.73 | %+†† | | | 0.65 | %+ | | | 0.62 | %+ | | | 0.62 | %+ | |
| Ratio of Expenses to Average Net Assets Excluding Non Operating Expenses | | | N/A | | | | 0.73 | %+†† | | | 0.65 | %+ | | | 0.62 | %+ | | | 0.62 | %+ | |
| Ratio of Net Investment Income to Average Net Assets | | | 0.05 | %+†† | | | 0.27 | %+†† | | | 0.35 | %+ | | | 0.24 | %+ | | | 0.46 | %+ | |
| Ratio of Rebate from Morgan Stanley Affiliates to Average Net Assets | | | 0.00 | %††§ | | | 0.00 | %††§ | | | 0.00 | %§ | | | 0.00 | %§ | | | 0.00 | %§ | |
| Portfolio Turnover Rate | | | 26 | % | | | 35 | % | | | 19 | % | | | 42 | % | | | 50 | % | |
† Per share amount is based on average shares outstanding.
‡ Amount is less than $0.005 per share.
++ Calculated based on the net asset value as of the last business day of the period.
** Performance was positively impacted by approximately 0.25% due to the receipt of proceeds from the settlements of class action suits involving primarily two of the Portfolio's past holdings. This was a one-time settlement, and as a result, the impact on the NAV and consequently the performance will not likely be repeated in the future. Had these settlements not occurred, the total return for Class I shares would have been approximately 62.72%.
+ The Ratios of Expenses and Net Investment Income reflect the rebate of certain Portfolio expenses in connection with the investments in Morgan Stanley affiliates during the period. The effect of the rebate on the ratios is disclosed in the above table as "Ratio of Rebate from Morgan Stanley Affiliates to Average Net Assets."
†† Reflects overall Portfolio ratios for investment income and non-class specific expenses.
§ Amount is less than 0.005%.
The accompanying notes are an integral part of the financial statements.
220
2011 Annual Report
December 31, 2011
Financial Highlights
Growth Portfolio
| | | Class P | |
| | | Year Ended December 31, | |
| Selected Per Share Data and Ratios | | 2011 | | 2010 | | 2009 | | 2008 | | 2007 | |
| Net Asset Value, Beginning of Period | | $ | 23.82 | | | $ | 19.40 | | | $ | 11.94 | | | $ | 24.27 | | | $ | 19.95 | | |
| Income (Loss) from Investment Operations: | |
| Net Investment Income (Loss)† | | | (0.05 | ) | | | 0.00 | ‡ | | | 0.02 | | | | 0.00 | ‡ | | | 0.05 | | |
| Net Realized and Unrealized Gain (Loss) | | | (0.73 | ) | | | 4.42 | | | | 7.46 | | | | (12.27 | ) | | | 4.33 | | |
| Total from Investment Operations | | | (0.78 | ) | | | 4.42 | | | | 7.48 | | | | (12.27 | ) | | | 4.38 | | |
| Distributions from and/or in Excess of: | |
| Net Investment Income | | | (0.01 | ) | | | (0.00 | )‡ | | | (0.02 | ) | | | (0.04 | ) | | | (0.06 | ) | |
| Net Realized Gain | | | — | | | | — | | | | — | | | | (0.02 | ) | | | — | | |
| Total Distributions | | | (0.01 | ) | | | (0.00 | )‡ | | | (0.02 | ) | | | (0.06 | ) | | | (0.06 | ) | |
| Redemption Fees | | | — | | | | — | | | | 0.00 | ‡ | | | 0.00 | ‡ | | | 0.00 | ‡ | |
| Net Asset Value, End of Period | | $ | 23.03 | | | $ | 23.82 | | | $ | 19.40 | | | $ | 11.94 | | | $ | 24.27 | | |
| Total Return++ | | | (3.27 | )% | | | 22.79 | % | | | 62.66 | %** | | | (50.57 | )% | | | 21.93 | % | |
| Ratios and Supplemental Data: | |
| Net Assets, End of Period (Thousands) | | $ | 135,777 | | | $ | 136,585 | | | $ | 99,475 | | | $ | 59,883 | | | $ | 166,717 | | |
| Ratio of Expenses to Average Net Assets | | | 0.96 | %+†† | | | 0.98 | %+†† | | | 0.90 | %+ | | | 0.87 | %+ | | | 0.87 | %+ | |
| Ratio of Expenses to Average Net Assets Excluding Non Operating Expenses | | | N/A | | | | 0.98 | %+†† | | | 0.90 | %+ | | | 0.87 | %+ | | | 0.87 | %+ | |
| Ratio of Net Investment Income (Loss) to Average Net Assets | | | (0.20 | )%+†† | | | 0.02 | %+†† | | | 0.10 | %+ | | | (0.01 | )%+ | | | 0.24 | %+ | |
| Ratio of Rebate from Morgan Stanley Affiliates to Average Net Assets | | | 0.00 | %††§ | | | 0.00 | %††§ | | | 0.00 | %§ | | | 0.00 | %§ | | | 0.00 | %§ | |
| Portfolio Turnover Rate | | | 26 | % | | | 35 | % | | | 19 | % | | | 42 | % | | | 50 | % | |
† Per share amount is based on average shares outstanding.
‡ Amount is less than $0.005 per share.
++ Calculated based on the net asset value as of the last business day of the period.
** Performance was positively impacted by approximately 0.25% due to the receipt of proceeds from the settlements of class action suits involving primarily two of the Portfolio's past holdings. This was a one-time settlement, and as a result, the impact on the NAV and consequently the performance will not likely be repeated in the future. Had these settlements not occurred, the total return for Class P shares would have been approximately 62.41%.
+ The Ratios of Expenses and Net Investment Income (Loss) reflect the rebate of certain Portfolio expenses in connection with the investments in Morgan Stanley affiliates during the period. The effect of the rebate on the ratios is disclosed in the above table as "Ratio of Rebate from Morgan Stanley Affiliates to Average Net Assets."
†† Reflects overall Portfolio ratios for investment income and non-class specific expenses.
§ Amount is less than 0.005%.
The accompanying notes are an integral part of the financial statements.
221
2011 Annual Report
December 31, 2011
Financial Highlights
Insight Portfolio
| | | Class I | |
| Selected Per Share Data and Ratios | | Period from
December 28,
2011^ to
December 31,
2011 | |
| Net Asset Value, Beginning of Period | | $ | 10.00 | | |
| Income (Loss) from Investment Operations: | |
| Net Investment Loss† | | | (0.00 | )‡ | |
| Net Realized and Unrealized Gain | | | 0.06 | | |
| Total from Investment Operations | | | 0.06 | | |
| Net Asset Value, End of Period | | $ | 10.06 | | |
| Total Return++ | | | 0.60 | %# | |
| Ratios and Supplemental Data:†† | |
| Net Assets, End of Period (Thousands) | | $ | 10 | | |
| Ratio of Expenses to Average Net Assets (1) | | | 1.05 | %* | |
| Ratio of Net Investment Loss to Average Net Assets (1) | | | (0.94 | )%* | |
| Portfolio Turnover Rate | | | 0.00 | %# | |
| (1) Supplemental Information on the Ratios to Average Net Assets:†† | |
| Ratios Before Expense Limitation: | |
| Expenses to Average Net Assets | | | 380.17 | %* | |
| Net Investment Loss to Average Net Assets | | | (380.06 | )%* | |
^ Commencement of Operations.
† Per share amount is based on average shares outstanding.
‡ Amount is less than $0.005 per share.
++ Calculated based on the net asset value as of the last business day of the period.
†† Reflects overall Portfolio ratios for investment income and non-class specific expenses.
# Not Annualized.
* Annualized.
The accompanying notes are an integral part of the financial statements.
222
2011 Annual Report
December 31, 2011
Financial Highlights
Insight Portfolio
| | | Class H | |
| Selected Per Share Data and Ratios | | Period from
December 28,
2011^ to
December 31,
2011 | |
| Net Asset Value, Beginning of Period | | $ | 10.00 | | |
| Income (Loss) from Investment Operations: | |
| Net Investment Loss† | | | (0.00 | )‡ | |
| Net Realized and Unrealized Gain | | | 0.06 | | |
| Total from Investment Operations | | | 0.06 | | |
| Net Asset Value, End of Period | | $ | 10.06 | | |
| Total Return++ | | | 0.60 | %# | |
| Ratios and Supplemental Data:†† | |
| Net Assets, End of Period (Thousands) | | $ | 815 | | |
| Ratio of Expenses to Average Net Assets (1) | | | 1.30 | %* | |
| Ratio of Net Investment Loss to Average Net Assets (1) | | | (1.19 | )%* | |
| Portfolio Turnover Rate | | | 0.00 | %# | |
| (1) Supplemental Information on the Ratios to Average Net Assets:†† | |
| Ratios Before Expense Limitation: | |
| Expense to Average Net Assets | | | 380.42 | %* | |
| Net Investment Loss to Average Net Assets | | | (380.31 | )%* | |
^ Commencement of Operations.
† Per share amount is based on average shares outstanding.
‡ Amount is less than $0.005 per share.
++ Calculated based on the net asset value which does not reflect sales charges, if applicable, as of the last business day of the period.
†† Reflects overall Portfolio ratios for investment income and non-class specific expenses.
# Not Annualized.
* Annualized.
The accompanying notes are an integral part of the financial statements.
223
2011 Annual Report
December 31, 2011
Financial Highlights
Insight Portfolio
| | | Class L | |
| Selected Per Share Data and Ratios | | Period from
December 28,
2011^ to
December 31,
2011 | |
| Net Asset Value, Beginning of Period | | $ | 10.00 | | |
| Income (Loss) from Investment Operations: | |
| Net Investment Loss† | | | (0.00 | )‡ | |
| Net Realized and Unrealized Gain | | | 0.06 | | |
| Total from Investment Operations | | | 0.06 | | |
| Net Asset Value, End of Period | | $ | 10.06 | | |
| Total Return++ | | | 0.60 | %# | |
| Ratios and Supplemental Data:†† | |
| Net Assets, End of Period (Thousands) | | $ | 10 | | |
| Ratio of Expenses to Average Net Assets (1) | | | 1.80 | %* | |
| Ratio of Net Investment Loss to Average Net Assets (1) | | | (1.70 | )%* | |
| Portfolio Turnover Rate | | | 0.00 | %# | |
| (1) Supplemental Information on the Ratios to Average Net Assets:†† | |
| Ratios Before Expense Limitation: | |
| Expenses to Average Net Assets | | | 380.92 | %* | |
| Net Investment Loss to Average Net Assets | | | (380.82 | )%* | |
^ Commencement of Operations.
† Per share amount is based on average shares outstanding.
‡ Amount is less than $0.005 per share.
++ Calculated based on the net asset value as of the last business day of the period.
†† Reflects overall Portfolio ratios for investment income and non-class specific expenses.
# Not Annualized.
* Annualized.
The accompanying notes are an integral part of the financial statements.
224
2011 Annual Report
December 31, 2011
Financial Highlights
Opportunity Portfolio
| | | Class I* | |
| | | Year Ended
December 31, | | Period from
July 1,
2010 to
December 31, | | Year Ended June 30, | |
| Selected Per Share Data and Ratios | | 2011 | | 2010 | | 2010 | | 2009^^ | | 2008^^ | | 2007^^ | |
| Net Asset Value, Beginning of Period | | $ | 15.23 | | | $ | 11.91 | | | $ | 9.59 | | | $ | 12.21 | | | $ | 13.05 | | | $ | 10.77 | | |
| Income (Loss) from Investment Operations: | |
| Net Investment Income (Loss)† | | | 0.00 | ‡ | | | 0.02 | | | | (0.02 | ) | | | 0.02 | | | | 0.01 | | | | (0.02 | ) | |
| Net Realized and Unrealized Gain (Loss) | | | (0.07 | ) | | | 3.30 | | | | 2.34 | | | | (2.64 | ) | | | (0.85 | ) | | | 2.30 | | |
| Total from Investment Operations | | | (0.07 | ) | | | 3.32 | | | | 2.32 | | | | (2.62 | ) | | | (0.84 | ) | | | 2.28 | | |
| Net Asset Value, End of Period | | $ | 15.16 | | | $ | 15.23 | | | $ | 11.91 | | | $ | 9.59 | | | $ | 12.21 | | | $ | 13.05 | | |
| Total Return++ | | | (0.46 | )% | | | 27.88 | %# | | | 24.19 | % | | | (21.52 | )% | | | (6.36 | )% | | | 21.17 | % | |
| Ratios and Supplemental Data: | |
| Net Assets, End of Period (Millions) | | $ | 13.2 | | | $ | 13.0 | | | $ | 11.0 | | | $ | 7.5 | | | $ | 1.6 | | | $ | 1.3 | | |
| Ratio of Expenses to Average Net Assets (1) | | | 0.88 | %+†† | | | 0.72 | %+††@ | | | 1.14 | % | | | 0.91 | % | | | 0.87 | % | | | 0.98 | % | |
| Ratio of Expenses to Average Net Assets Excluding Non Operating Expenses | | | N/A | | | | 0.90 | %+††@ | | | 0.96 | % | | | N/A | | | | N/A | | | | N/A | | |
| Ratio of Net Investment Income (Loss) to Average Net Assets (1) | | | 0.01 | %+†† | | | 0.25 | %+††@ | | | (0.14 | )% | | | 0.21 | % | | | 0.10 | % | | | (0.14 | )% | |
| Ratio of Rebate from Morgan Stanley Affiliates to Average Net Assets | | | 0.00 | %††§ | | | 0.00 | %††§@ | | | N/A | | | | N/A | | | | N/A | | | | N/A | | |
| Portfolio Turnover Rate | | | 21 | % | | | 6 | %# | | | 12 | % | | | 33 | % | | | 45 | % | | | 46 | % | |
| (1) Supplemental Information on the Ratios to Average Net Assets: | |
| Ratios Before Expense Limitation: | |
| Expenses to Average Net Assets | | | 0.95 | %†† | | | N/A | | | | N/A | | | | 1.41 | % | | | N/A | | | | N/A | | |
| Net Investment Loss to Average Net Assets | | | (0.06 | )%†† | | | N/A | | | | N/A | | | | (0.29 | )% | | | N/A | | | | N/A | | |
* On May 21, 2010, the Portfolio acquired substantially all of the assets and liabilities of the Van Kampen Equity Growth Fund ("the Predecessor Fund"). Therefore, the per share data and ratios of Class I shares for the 12-month period ended June 30, 2010 and prior years reflect the historical per share data of Class I shares of the Predecessor Fund.
^^ Beginning the year ended June 30, 2010, the Portfolio was audited by Ernst & Young LLP. The previous years were audited by another independent registered public accounting firm.
† Per share amount is based on average shares outstanding.
‡ Amount is less than $0.005 per share.
++ Calculated based on the net asset value as of the last business day of the period.
+ The Ratios of Expenses and Net Investment Income (Loss) reflect the rebate of certain Portfolio expenses in connection with the investments in Morgan Stanley affiliates during the period. The effect of the rebate on the ratios is disclosed in the above table as "Ratio of Rebate from Morgan Stanley Affiliates to Average Net Assets."
†† Reflects overall Portfolio ratios for investment income and non-class specific expenses.
§ Amount is less than 0.005%.
# Not Annualized.
@ Annualized.
The accompanying notes are an integral part of the financial statements.
225
2011 Annual Report
December 31, 2011
Financial Highlights
Opportunity Portfolio
| | | Class P | |
| Selected Per Share Data and Ratios | | Year Ended
December 31,
2011 | | Period from
July 1,
2010 to
December 31,
2010 | | Period from
May 21,
2010^ to
June 30,
2010 | |
| Net Asset Value, Beginning of Period | | $ | 15.19 | | | $ | 11.89 | | | $ | 12.13 | | |
| Income (Loss) from Investment Operations: | |
| Net Investment Income (Loss)† | | | (0.04 | ) | | | 0.00 | ‡ | | | (0.01 | ) | |
| Net Realized and Unrealized Gain (Loss) | | | (0.07 | ) | | | 3.30 | | | | (0.23 | ) | |
| Total from Investment Operations | | | (0.11 | ) | | | 3.30 | | | | (0.24 | ) | |
| Net Asset Value, End of Period | | $ | 15.08 | | | $ | 15.19 | | | $ | 11.89 | | |
| Total Return++ | | | (0.72 | )% | | | 27.75 | %# | | | (1.98 | )%# | |
| Ratios and Supplemental Data:†† | |
| Net Assets, End of Period (Thousands) | | $ | 2,098 | | | $ | 2,113 | | | $ | 1 | | |
| Ratio of Expenses to Average Net Assets (1) | | | 1.13 | %+ | | | 0.97 | %+* | | | 1.39 | %* | |
| Ratio of Expenses to Average Net Assets Excluding Non Operating Expenses | | | N/A | | | | 1.15 | %+* | | | N/A | | |
| Ratio of Net Investment Income (Loss) to Average Net Assets (1) | | | (0.24 | )%+ | | | 0.00 | %§+* | | | (0.71 | )%* | |
| Ratio of Rebate from Morgan Stanley Affiliates to Average Net Assets | | | 0.00 | %§ | | | 0.00 | %§* | | | N/A | | |
| Portfolio Turnover Rate | | | 21 | % | | | 6 | %# | | | 12 | %# | |
| (1) Supplemental Information on the Ratios to Average Net Assets: | |
| Ratios Before Expense Limitation: | |
| Expenses to Average Net Assets | | | 1.20 | %†† | | | N/A | | | | N/A | | |
| Net Investment Loss to Average Net Assets | | | (0.31 | )%†† | | | N/A | | | | N/A | | |
^ Commencement of Operations.
† Per share amount is based on average shares outstanding.
‡ Amount is less than $0.005 per share.
++ Calculated based on the net asset value as of the last business day of the period.
†† Reflects overall Portfolio ratios for investment income and non-class specific expenses.
+ The Ratios of Expenses and Net Investment Income (Loss) reflect the rebate of certain Portfolio expenses in connection with the investments in Morgan Stanley affiliates during the period. The effect of the rebate on the ratios is disclosed in the above table as "Ratio of Rebate from Morgan Stanley Affiliates to Average Net Assets."
§ Amount is less than 0.005%.
# Not Annualized.
* Annualized.
The accompanying notes are an integral part of the financial statements.
226
2011 Annual Report
December 31, 2011
Financial Highlights
Opportunity Portfolio
| | | Class H* | |
| | | Year Ended
December 31, | | Period from
July 1,
2010 to
December 31, | | Year Ended June 30, | |
| Selected Per Share Data and Ratios | | 2011 | | 2010 | | 2010 | | 2009^^ | | 2008^^ | | 2007^^ | |
| Net Asset Value, Beginning of Period | | $ | 15.02 | | | $ | 11.76 | | | $ | 9.49 | | | $ | 12.13 | | | $ | 12.99 | | | $ | 10.75 | | |
| Income (Loss) from Investment Operations: | |
| Net Investment Income (Loss)† | | | (0.04 | ) | | | 0.00 | ‡ | | | (0.06 | ) | | | (0.01 | ) | | | (0.02 | ) | | | (0.05 | ) | |
| Net Realized and Unrealized Gain (Loss) | | | (0.07 | ) | | | 3.26 | | | | 2.33 | | | | (2.63 | ) | | | (0.84 | ) | | | 2.29 | | |
| Total from Investment Operations | | | (0.11 | ) | | | 3.26 | | | | 2.27 | | | | (2.64 | ) | | | (0.86 | ) | | | 2.24 | | |
| Net Asset Value, End of Period | | $ | 14.91 | | | $ | 15.02 | | | $ | 11.76 | | | $ | 9.49 | | | $ | 12.13 | | | $ | 12.99 | | |
| Total Return++ | | | (0.73 | )% | | | 27.72 | %# | | | 23.92 | % | | | (21.83 | )% | | | (6.54 | )% | | | 20.84 | % | |
| Ratios and Supplemental Data: | |
| Net Assets, End of Period (Millions) | | $ | 198.0 | | | $ | 241.0 | | | $ | 220.3 | | | $ | 207.8 | | | $ | 245.5 | | | $ | 194.4 | | |
| Ratio of Expenses to Average Net Assets (1) | | | 1.13 | %+†† | | | 0.97 | %+††@ | | | 1.40 | % | | | 1.14 | % | | | 1.13 | % | | | 1.23 | % | |
| Ratio of Expenses to Average Net Assets Excluding Non Operating Expenses | | | N/A | | | | 1.15 | %+††@ | | | 1.22 | % | | | N/A | | | | N/A | | | | N/A | | |
| Ratio of Net Investment Income (Loss) to Average Net Assets (1) | | | (0.24 | )%+†† | | | 0.00 | %+††§@ | | | (0.46 | )% | | | (0.13 | )% | | | (0.17 | )% | | | (0.43 | )% | |
| Rebate from Morgan Stanley Affiliates to Average Net Assets | | | 0.00 | %††§ | | | 0.00 | %††§@ | | | N/A | | | | N/A | | | | N/A | | | | N/A | | |
| Portfolio Turnover Rate | | | 21 | % | | | 6 | %# | | | 12 | % | | | 33 | % | | | 45 | % | | | 46 | % | |
| (1) Supplemental Information on the Ratios to Average Net Assets: | |
| Ratios Before Expense Limitation: | |
| Expense to Average Net Assets | | | 1.20 | %†† | | | N/A | | | | N/A | | | | 1.49 | % | | | N/A | | | | N/A | | |
| Net Investment Loss to Average Net Assets | | | (0.31 | )%†† | | | N/A | | | | N/A | | | | (0.48 | )% | | | N/A | | | | N/A | | |
* On May 21, 2010, the Portfolio acquired substantially all of the assets and liabilities of the Van Kampen Equity Growth Fund ("the Predecessor Fund"). Therefore, the per share data and ratios of Class H shares for the 12-month period ended June 30, 2010 and prior years reflect the historical per share data of Class A shares of the Predecessor Fund.
^^ Beginning the year ended June 30, 2010, the Portfolio was audited by Ernst & Young LLP. The previous years were audited by another independent registered public accounting firm.
† Per share amount is based on average shares outstanding.
‡ Amount is less than $0.005 per share.
++ Calculated based on the net asset value which does not reflect sales charges, if applicable, as of the last business day of the period.
+ The Ratios of Expenses and Net Investment Income (Loss) reflect the rebate of certain Portfolio expenses in connection with the investments in Morgan Stanley affiliates during the period. The effect of the rebate on the ratios is disclosed in the above table as "Ratio of Rebate from Morgan Stanley Affiliates to Average Net Assets."
†† Reflects overall Portfolio ratios for investment income and non-class specific expenses.
§ Amount is less than 0.005%.
# Not Annualized.
@ Annualized.
The accompanying notes are an integral part of the financial statements.
227
2011 Annual Report
December 31, 2011
Financial Highlights
Opportunity Portfolio
| | | Class L* | |
| | | Year Ended
December 31, | | Period from
July 1,
2010 to
December 31, | | Year Ended June 30, | |
| Selected Per Share Data and Ratios | | 2011 | | 2010 | | 2010 | | 2009^^ | | 2008^^ | | 2007^^ | |
| Net Asset Value, Beginning of Period | | $ | 13.73 | | | $ | 10.78 | | | $ | 8.77 | | | $ | 11.28 | | | $ | 12.18 | | | $ | 10.15 | | |
| Income (Loss) from Investment Operations: | |
| Net Investment Loss† | | | (0.10 | ) | | | (0.03 | ) | | | (0.13 | ) | | | (0.07 | ) | | | (0.12 | ) | | | (0.13 | ) | |
| Net Realized and Unrealized Gain (Loss) | | | (0.06 | ) | | | 2.98 | | | | 2.14 | | | | (2.44 | ) | | | (0.78 | ) | | | 2.16 | | |
| Total from Investment Operations | | | (0.16 | ) | | | 2.95 | | | | 2.01 | | | | (2.51 | ) | | | (0.90 | ) | | | 2.03 | | |
| Net Asset Value, End of Period | | $ | 13.57 | | | $ | 13.73 | | | $ | 10.78 | | | $ | 8.77 | | | $ | 11.28 | | | $ | 12.18 | | |
| Total Return++ | | | (1.17 | )% | | | 27.37 | %# | | | 22.92 | % | | | (22.32 | )% | | | (7.31 | )% | | | 20.00 | % | |
| Ratios and Supplemental Data: | |
| Net Assets, End of Period (Millions) | | $ | 30.8 | | | $ | 39.0 | | | $ | 34.8 | | | $ | 28.6 | | | $ | 41.8 | | | $ | 28.4 | | |
| Ratio of Expenses to Average Net Assets (1) | | | 1.63 | %+†† | | | 1.47 | %+††@ | | | 2.12 | % | | | 1.89 | % | | | 1.89 | % | | | 1.99 | % | |
| Ratio of Expenses to Average Net Assets Excluding Non Operating Expenses | | | N/A | | | | 1.65 | %+††@ | | | 1.94 | % | | | N/A | | | | N/A | | | | N/A | | |
| Ratio of Net Investment Loss to Average Net Assets (1) | | | (0.74 | )%+†† | | | (0.50 | )%+††@ | | | (1.16 | )% | | | (0.90 | )% | | | (0.94 | )% | | | (1.19 | )% | |
| Ratio of Rebate from Morgan Stanley Affiliates to Average Net Assets | | | 0.00 | %††§ | | | 0.00 | %††§@ | | | N/A | | | | N/A | | | | N/A | | | | N/A | | |
| Portfolio Turnover Rate | | | 21 | % | | | 6 | %# | | | 12 | % | | | 33 | % | | | 45 | % | | | 46 | % | |
| (1) Supplemental Information on the Ratios to Average Net Assets: | |
| Ratios Before Expense Limitation: | |
| Expenses to Average Net Assets | | | 1.70 | %†† | | | N/A | | | | N/A | | | | 2.24 | % | | | N/A | | | | N/A | | |
| Net Investment Loss to Average Net Assets | | | (0.81 | )%†† | | | N/A | | | | N/A | | | | (1.25 | )% | | | N/A | | | | N/A | | |
* On May 21, 2010, the Portfolio acquired substantially all of the assets and liabilities of the Van Kampen Equity Growth Fund ("the Predecessor Fund"). Therefore, the per share data and ratios of Class L shares for the 12-month period ended June 30, 2010 and prior years reflect the historical per share data of Class C shares of the Predecessor Fund.
^^ Beginning the year ended June 30, 2010, the Portfolio was audited by Ernst & Young LLP. The previous years were audited by another independent registered public accounting firm.
† Per share amount is based on average shares outstanding.
++ Calculated based on the net asset value as of the last business day of the period.
+ The Ratios of Expenses and Net Investment Loss reflect the rebate of certain Portfolio expenses in connection with the investments in Morgan Stanley affiliates during the period. The effect of the rebate on the ratios is disclosed in the above table as "Ratio of Rebate from Morgan Stanley Affiliates to Average Net Assets."
†† Reflects overall Portfolio ratios for investment income and non-class specific expenses.
§ Amount is less than 0.005%.
# Not Annualized.
@ Annualized.
The accompanying notes are an integral part of the financial statements.
228
2011 Annual Report
December 31, 2011
Financial Highlights
Small Company Growth Portfolio
| | | Class I | |
| | | Year Ended December 31, | |
| Selected Per Share Data and Ratios | | 2011 | | 2010 | | 2009 | | 2008 | | 2007 | |
| Net Asset Value, Beginning of Period | | $ | 14.17 | | | $ | 11.14 | | | $ | 7.64 | | | $ | 13.12 | | | $ | 13.31 | | |
| Income (Loss) from Investment Operations: | |
| Net Investment Income (Loss)† | | | (0.04 | ) | | | 0.01 | | | | (0.03 | ) | | | (0.01 | ) | | | (0.05 | ) | |
| Net Realized and Unrealized Gain (Loss) | | | (1.25 | ) | | | 3.02 | | | | 3.68 | | | | (5.47 | ) | | | 0.45 | | |
| Total from Investment Operations | | | (1.29 | ) | | | 3.03 | | | | 3.65 | | | | (5.48 | ) | | | 0.40 | | |
| Distributions from and/or in Excess of: | |
| Net Investment Income | | | — | | | | — | | | | (0.01 | ) | | | — | | | | — | | |
| Net Realized Gain | | | (0.24 | ) | | | — | | | | (0.14 | ) | | | — | | | | (0.59 | ) | |
| Total Distributions | | | (0.24 | ) | | | — | | | | (0.15 | ) | | | — | | | | (0.59 | ) | |
| Redemption Fees | | | 0.00 | ‡ | | | 0.00 | ‡ | | | 0.00 | ‡ | | | 0.00 | ‡ | | | 0.00 | ‡ | |
| Net Asset Value, End of Period | | $ | 12.64 | | | $ | 14.17 | | | $ | 11.14 | | | $ | 7.64 | | | $ | 13.12 | | |
| Total Return++ | | | (9.12 | )% | | | 27.20 | % | | | 47.92 | % | | | (41.84 | )% | | | 3.04 | % | |
| Ratios and Supplemental Data: | |
| Net Assets, End of Period (Thousands) | | $ | 1,074,392 | | | $ | 1,227,782 | | | $ | 977,515 | | | $ | 638,559 | | | $ | 1,137,839 | | |
| Ratio of Expenses to Average Net Assets (1) | | | 1.05 | %+ | | | 1.05 | %+†† | | | 1.05 | %+ | | | 1.02 | %+ | | | 1.01 | %+ | |
| Ratio of Expenses to Average Net Assets Excluding Non Operating Expenses | | | 1.05 | %+ | | | 1.05 | %+†† | | | 1.05 | %+ | | | 1.02 | %+ | | | 1.01 | %+ | |
| Ratio of Net Investment Income (Loss) to Average Net Assets (1) | | | (0.29 | )%+ | | | 0.10 | %+†† | | | (0.28 | )%+ | | | (0.08 | )%+ | | | (0.35 | )%+ | |
| Ratio of Rebate from Morgan Stanley Affiliates to Average Net Assets | | | 0.00 | %§ | | | 0.00 | %††§ | | | 0.00 | %§ | | | 0.00 | %§ | | | 0.00 | %§ | |
| Portfolio Turnover Rate | | | 26 | % | | | 26 | % | | | 27 | % | | | 34 | % | | | 50 | % | |
| (1) Supplemental Information on the Ratios to Average Net Assets: | |
| Ratios Before Expense Limitation: | |
| Expenses to Average Net Assets | | | 1.10 | % | | | 1.12 | %+†† | | | 1.07 | %+ | | | 1.05 | %+ | | | N/A | | |
| Net Investment Income (Loss) to Average Net Assets | | | (0.34 | )% | | | 0.03 | %+†† | | | (0.30 | )%+ | | | (0.11 | )%+ | | | N/A | | |
† Per share amount is based on average shares outstanding.
‡ Amount is less than $0.005 per share.
++ Calculated based on the net asset value as of the last business day of the period.
+ The Ratios of Expenses and Net Investment Income (Loss) reflect the rebate of certain Portfolio expenses in connection with the investments in Morgan Stanley affiliates during the period. The effect of the rebate on the ratios is disclosed in the above table as "Ratio of Rebate from Morgan Stanley Affiliates to Average Net Assets."
†† Reflects overall Portfolio ratios for investment income and non-class specific expenses.
§ Amount is less than 0.005%.
The accompanying notes are an integral part of the financial statements.
229
2011 Annual Report
December 31, 2011
Financial Highlights
Small Company Growth Portfolio
| | | Class P | |
| | | Year Ended December 31, | |
| Selected Per Share Data and Ratios | | 2011 | | 2010 | | 2009 | | 2008 | | 2007 | |
| Net Asset Value, Beginning of Period | | $ | 13.27 | | | $ | 10.46 | | | $ | 7.19 | | | $ | 12.39 | | | $ | 12.63 | | |
| Income (Loss) from Investment Operations: | |
| Net Investment Loss† | | | (0.07 | ) | | | (0.02 | ) | | | (0.05 | ) | | | (0.03 | ) | | | (0.08 | ) | |
| Net Realized and Unrealized Gain (Loss) | | | (1.16 | ) | | | 2.83 | | | | 3.46 | | | | (5.17 | ) | | | 0.43 | | |
| Total from Investment Operations | | | (1.23 | ) | | | 2.81 | | | | 3.41 | | | | (5.20 | ) | | | 0.35 | | |
| Distributions from and/or in Excess of: | |
| Net Realized Gain | | | (0.24 | ) | | | — | | | | (0.14 | ) | | | — | | | | (0.59 | ) | |
| Redemption Fees | | | 0.00 | ‡ | | | 0.00 | ‡ | | | 0.00 | ‡ | | | 0.00 | ‡ | | | 0.00 | ‡ | |
| Net Asset Value, End of Period | | $ | 11.80 | | | $ | 13.27 | | | $ | 10.46 | | | $ | 7.19 | | | $ | 12.39 | | |
| Total Return++ | | | (9.28 | )% | | | 26.86 | % | | | 47.41 | % | | | (41.97 | )% | | | 2.81 | % | |
| Ratios and Supplemental Data: | |
| Net Assets, End of Period (Thousands) | | $ | 282,988 | | | $ | 530,123 | | | $ | 536,329 | | | $ | 345,302 | | | $ | 698,183 | | |
| Ratio of Expenses to Average Net Assets (1) | | | 1.30 | %+ | | | 1.30 | %+†† | | | 1.30 | %+ | | | 1.27 | %+ | | | 1.26 | %+ | |
| Ratio of Expenses to Average Net Assets Excluding Non Operating Expenses | | | 1.30 | %+ | | | 1.30 | %+†† | | | 1.30 | %+ | | | 1.27 | %+ | | | 1.26 | %+ | |
| Ratio of Net Investment Loss to Average Net Assets (1) | | | (0.54 | )%+ | | | (0.15 | )%+†† | | | (0.53 | )%+ | | | (0.34 | )%+ | | | (0.61 | )%+ | |
| Ratio of Rebate from Morgan Stanley Affiliates to Average Net Assets | | | 0.00 | %§ | | | 0.00 | %††§ | | | 0.00 | %§ | | | 0.00 | %§ | | | 0.00 | %§ | |
| Portfolio Turnover Rate | | | 26 | % | | | 26 | % | | | 27 | % | | | 34 | % | | | 50 | % | |
| (1) Supplemental Information on the Ratios to Average Net Assets: | |
| Ratios Before Expense Limitation: | |
| Expenses to Average Net Assets | | | 1.35 | % | | | 1.37 | %+†† | | | 1.32 | %+ | | | 1.30 | %+ | | | N/A | | |
| Net Investment Loss to Average Net Assets | | | (0.59 | )% | | | (0.22 | )%+†† | | | (0.55 | )%+ | | | (0.37 | )%+ | | | N/A | | |
† Per share amount is based on average shares outstanding.
‡ Amount is less than $0.005 per share.
++ Calculated based on the net asset value as of the last business day of the period.
+ The Ratios of Expenses and Net Investment Loss reflect the rebate of certain Portfolio expenses in connection with the investments in Morgan Stanley affiliates during the period. The effect of the rebate on the ratios is disclosed in the above table as "Ratio of Rebate from Morgan Stanley Affiliates to Average Net Assets."
†† Reflects overall Portfolio ratios for investment income and non-class specific expenses.
§ Amount is less than 0.005%.
The accompanying notes are an integral part of the financial statements.
230
2011 Annual Report
December 31, 2011
Financial Highlights
Small Company Growth Portfolio
| | | Class H | |
| Selected Per Share Data and Ratios | | Period from
November 11,
2011^ to
December 31,
2011 | |
| Net Asset Value, Beginning of Period | | $ | 12.47 | | |
| Loss from Investment Operations: | |
| Net Investment Loss† | | | (0.00 | )‡ | |
| Net Realized and Unrealized Loss | | | (0.43 | ) | |
| Total from Investment Operations | | | (0.43 | ) | |
| Distributions from and/or in Excess of: | |
| Net Realized Gain | | | (0.24 | ) | |
| Redemption Fees | | | 0.00 | ‡ | |
| Net Asset Value, End of Period | | $ | 11.80 | | |
| Total Return++ | | | (3.46 | )%# | |
| Ratios and Supplemental Data: | |
| Net Assets, End of Period (Thousands) | | $ | 32,006 | | |
| Ratio of Expenses to Average Net Assets (1) | | | 1.30 | %+* | |
| Ratio of Net Investment Loss to Average Net Assets (1) | | | (0.26 | )%+* | |
| Ratio of Rebate from Morgan Stanley Affiliates to Average Net Assets | | | 0.00 | %§* | |
| Portfolio Turnover Rate | | | 26 | %* | |
| (1) Supplemental Information on the Ratios to Average Net Assets: | |
| Ratios Before Expense Limitation: | |
| Expenses to Average Net Assets | | | 1.35 | %* | |
| Net Investment Loss to Average Net Assets | | | (0.31 | )%* | |
^ Commencement of Operations
† Per share amount is based on average shares outstanding.
‡ Amount is less than $0.005 per share.
++ Calculated based on the net asset value which does not reflect sales charges, if applicable, as of the last business day of the period.
+ The Ratios of Expenses and Net Investment Loss reflect the rebate of certain Portfolio expenses in connection with the investments in Morgan Stanley affiliates during the period. The effect of the rebate on the ratios is disclosed in the above table as "Ratio of Rebate from Morgan Stanley Affiliates to Average Net Assets."
§ Amount is less than 0.005%.
# Not Annualized.
* Annualized.
The accompanying notes are an integral part of the financial statements.
231
2011 Annual Report
December 31, 2011
Financial Highlights
Small Company Growth Portfolio
| | | Class L | |
| Selected Per Share Data and Ratios | | Period from
November 11,
2011^ to
December 31,
2011 | |
| Net Asset Value, Beginning of Period | | $ | 12.47 | | |
| Loss from Investment Operations: | |
| Net Investment Loss† | | | (0.01 | ) | |
| Net Realized and Unrealized Loss | | | (0.43 | ) | |
| Total from Investment Operations | | | (0.44 | ) | |
| Distributions from and/or in Excess of: | |
| Net Realized Gain | | | (0.24 | ) | |
| Redemption Fees | | | 0.00 | ‡ | |
| Net Asset Value, End of Period | | $ | 11.79 | | |
| Total Return++ | | | (3.54 | )%# | |
| Ratios and Supplemental Data: | |
| Net Assets, End of Period (Thousands) | | $ | 1,657 | | |
| Ratio of Expenses to Average Net Assets (1) | | | 1.80 | %+* | |
| Ratio of Net Investment Loss to Average Net Assets (1) | | | (0.77 | )%+* | |
| Ratio of Rebate from Morgan Stanley Affiliates to Average Net Assets | | | 0.00 | %§* | |
| Portfolio Turnover Rate | | | 26 | %* | |
| (1) Supplemental Information on the Ratios to Average Net Assets: | |
| Ratios Before Expense Limitation: | |
| Expenses to Average Net Assets | | | 1.85 | %* | |
| Net Investment Loss to Average Net Assets | | | (0.82 | )%* | |
^ Commencement of Operations
† Per share amount is based on average shares outstanding.
‡ Amount is less than $0.005 per share.
++ Calculated based on the net asset value as of the last business day of the period.
+ The Ratios of Expenses and Net Investment Loss reflect the rebate of certain Portfolio expenses in connection with the investments in Morgan Stanley affiliates during the period. The effect of the rebate on the ratios is disclosed in the above table as "Ratio of Rebate from Morgan Stanley Affiliates to Average Net Assets."
§ Amount is less than 0.005%.
# Not Annualized.
* Annualized.
The accompanying notes are an integral part of the financial statements.
232
2011 Annual Report
December 31, 2011
Financial Highlights
U.S. Real Estate Portfolio
| | | Class I | |
| | | Year Ended December 31, | |
| Selected Per Share Data and Ratios | | 2011 | | 2010 | | 2009 | | 2008 | | 2007 | |
| Net Asset Value, Beginning of Period | | $ | 14.33 | | | $ | 11.18 | | | $ | 8.87 | | | $ | 15.75 | | | $ | 28.24 | | |
| Income (Loss) from Investment Operations: | |
| Net Investment Income† | | | 0.11 | | | | 0.30 | | | | 0.23 | | | | 0.31 | | | | 0.33 | | |
| Net Realized and Unrealized Gain (Loss) | | | 0.69 | | | | 3.02 | | | | 2.30 | | | | (5.84 | ) | | | (4.87 | ) | |
| Total from Investment Operations | | | 0.80 | | | | 3.32 | | | | 2.53 | | | | (5.53 | ) | | | (4.54 | ) | |
| Distributions from and/or in Excess of: | |
| Net Investment Income | | | (0.14 | ) | | | (0.17 | ) | | | (0.22 | ) | | | (0.31 | ) | | | (0.50 | ) | |
| Net Realized Gain | | | — | | | | — | | | | — | | | | (1.04 | ) | | | (7.45 | ) | |
| Total Distributions | | | (0.14 | ) | | | (0.17 | ) | | | (0.22 | ) | | | (1.35 | ) | | | (7.95 | ) | |
| Redemption Fees | | | — | | | | — | | | | 0.00 | ‡ | | | 0.00 | ‡ | | | 0.00 | ‡ | |
| Net Asset Value, End of Period | | $ | 14.99 | | | $ | 14.33 | | | $ | 11.18 | | | $ | 8.87 | | | $ | 15.75 | | |
| Total Return++ | | | 5.57 | % | | | 29.86 | % | | | 29.65 | % | | | (38.07 | )% | | | (16.63 | )% | |
| Ratios and Supplemental Data: | |
| Net Assets, End of Period (Thousands) | | $ | 773,138 | | | $ | 855,474 | | | $ | 584,820 | | | $ | 448,897 | | | $ | 911,819 | | |
| Ratio of Expenses to Average Net Assets (1) | | | 1.01 | %+ | | | 0.99 | %+†† | | | 0.99 | %+ | | | 0.95 | %+ | | | 0.90 | %+ | |
| Ratio of Expenses to Average Net Assets Excluding Non Operating Expenses | | | 1.00 | %+ | | | 0.98 | %+†† | | | 0.96 | %+ | | | 0.91 | %+ | | | 0.88 | %+ | |
| Ratio of Net Investment Income to Average Net Assets (1) | | | 0.76 | %+ | | | 2.34 | %+†† | | | 2.70 | %+ | | | 2.19 | %+ | | | 1.23 | %+ | |
| Ratio of Rebate from Morgan Stanley Affiliates to Average Net Assets | | | 0.00 | %§ | | | 0.00 | %††§ | | | 0.00 | %§ | | | 0.00 | %§ | | | 0.00 | %§ | |
| Portfolio Turnover Rate | | | 21 | % | | | 41 | % | | | 30 | % | | | 38 | % | | | 38 | % | |
| (1) Supplemental Information on the Ratios to Average Net Assets: | |
| Ratios Before Expense Limitation: | |
| Expenses to Average Net Assets | | | 1.03 | % | | | N/A | | | | 1.00 | %+ | | | 0.96 | %+ | | | N/A | | |
| Net Investment Income to Average Net Assets | | | 0.74 | % | | | N/A | | | | 2.69 | %+ | | | 2.18 | %+ | | | N/A | | |
† Per share amount is based on average shares outstanding.
‡ Amount is less than $0.005 per share.
++ Calculated based on the net asset value as of the last business day of the period.
+ The Ratios of Expenses and Net Investment Income reflect the rebate of certain Portfolio expenses in connection with the investments in Morgan Stanley affiliates during the period. The effect of the rebate on the ratios is disclosed in the above table as "Ratio of Rebate from Morgan Stanley Affiliates to Average Net Assets."
†† Reflects overall Portfolio ratios for investment income and non-class specific expenses.
§ Amount is less than 0.005%.
The accompanying notes are an integral part of the financial statements.
233
2011 Annual Report
December 31, 2011
Financial Highlights
U.S. Real Estate Portfolio
| | | Class P | |
| | | Year Ended December 31, | |
| Selected Per Share Data and Ratios | | 2011 | | 2010 | | 2009 | | 2008 | | 2007 | |
| Net Asset Value, Beginning of Period | | $ | 14.07 | | | $ | 10.99 | | | $ | 8.73 | | | $ | 15.53 | | | $ | 27.96 | | |
| Income (Loss) from Investment Operations: | |
| Net Investment Income† | | | 0.08 | | | | 0.26 | | | | 0.21 | | | | 0.28 | | | | 0.27 | | |
| Net Realized and Unrealized Gain (Loss) | | | 0.66 | | | | 2.96 | | | | 2.25 | | | | (5.77 | ) | | | (4.82 | ) | |
| Total from Investment Operations | | | 0.74 | | | | 3.22 | | | | 2.46 | | | | (5.49 | ) | | | (4.55 | ) | |
| Distributions from and/or in Excess of: | |
| Net Investment Income | | | (0.11 | ) | | | (0.14 | ) | | | (0.20 | ) | | | (0.27 | ) | | | (0.43 | ) | |
| Net Realized Gain | | | — | | | | — | | | | — | | | | (1.04 | ) | | | (7.45 | ) | |
| Total Distributions | | | (0.11 | ) | | | (0.14 | ) | | | (0.20 | ) | | | (1.31 | ) | | | (7.88 | ) | |
| Redemption Fees | | | — | | | | — | | | | 0.00 | ‡ | | | 0.00 | ‡ | | | 0.00 | ‡ | |
| Net Asset Value, End of Period | | $ | 14.70 | | | $ | 14.07 | | | $ | 10.99 | | | $ | 8.73 | | | $ | 15.53 | | |
| Total Return++ | | | 5.26 | % | | | 29.51 | % | | | 29.31 | % | | | (38.26 | )% | | | (16.80 | )% | |
| Ratios and Supplemental Data: | |
| Net Assets, End of Period (Thousands) | | $ | 92,047 | | | $ | 89,321 | | | $ | 116,164 | | | $ | 95,828 | | | $ | 171,578 | | |
| Ratio of Expenses to Average Net Assets (1) | | | 1.26 | %+ | | | 1.24 | %+†† | | | 1.24 | %+ | | | 1.20 | %+ | | | 1.15 | %+ | |
| Ratio of Expenses to Average Net Assets Excluding Non Operating Expenses | | | 1.25 | %+ | | | 1.23 | %+†† | | | 1.21 | %+ | | | 1.16 | %+ | | | 1.13 | %+ | |
| Ratio of Net Investment Income to Average Net Assets (1) | | | 0.54 | %+ | | | 2.09 | %+†† | | | 2.45 | %+ | | | 2.05 | %+ | | | 1.02 | %+ | |
| Ratio of Rebate from Morgan Stanley Affiliates to Average Net Assets | | | 0.00 | %§ | | | 0.00 | %††§ | | | 0.00 | %§ | | | 0.00 | %§ | | | 0.00 | %§ | |
| Portfolio Turnover Rate | | | 21 | % | | | 41 | % | | | 30 | % | | | 38 | % | | | 38 | % | |
| (1) Supplemental Information on the Ratios to Average Net Assets: | |
| Ratios Before Expense Limitation: | |
| Expenses to Average Net Assets | | | 1.28 | % | | | N/A | | | | 1.25 | %+ | | | 1.21 | %+ | | | N/A | | |
| Net Investment Income to Average Net Assets | | | 0.52 | % | | | N/A | | | | 2.44 | %+ | | | 2.04 | %+ | | | N/A | | |
† Per share amount is based on average shares outstanding.
‡ Amount is less than $0.005 per share.
++ Calculated based on the net asset value as of the last business day of the period.
+ The Ratios of Expenses and Net Investment Income reflect the rebate of certain Portfolio expenses in connection with the investments in Morgan Stanley affiliates during the period. The effect of the rebate on the ratios is disclosed in the above table as "Ratio of Rebate from Morgan Stanley Affiliates to Average Net Assets."
†† Reflects overall Portfolio ratios for investment income and non-class specific expenses.
§ Amount is less than 0.005%.
The accompanying notes are an integral part of the financial statements.
234
2011 Annual Report
December 31, 2011
Financial Highlights
U.S. Real Estate Portfolio
| | | Class H | |
| Selected Per Share Data and Ratios | | Period from
November 11,
2011^ to
December 31,
2011 | |
| Net Asset Value, Beginning of Period | | $ | 14.52 | | |
| Income (Loss) from Investment Operations: | |
| Net Investment Income† | | | 0.07 | | |
| Net Realized and Unrealized Loss | | | 0.11 | | |
| Total from Investment Operations | | | 0.18 | | |
| Net Asset Value, End of Period | | $ | 14.70 | | |
| Total Return++ | | | 1.24 | %# | |
| Ratios and Supplemental Data: | |
| Net Assets, End of Period (Thousands) | | $ | 26,644 | | |
| Ratio of Expenses to Average Net Assets (1) | | | 1.25 | %+* | |
| Ratio of Net Investment Income to Average Net Assets (1) | | | 3.81 | %+* | |
| Ratio of Rebate from Morgan Stanley Affiliates to Average Net Assets | | | 0.00 | %§* | |
| Portfolio Turnover Rate | | | 21 | %* | |
| (1) Supplemental Information on the Ratios to Average Net Assets: | |
| Ratios Before Expense Limitation: | |
| Expense to Average Net Assets | | | 1.41 | %* | |
| Net Investment Income to Average Net Assets | | | 3.65 | %* | |
^ Commencement of Operations.
† Per share amount is based on average shares outstanding.
++ Calculated based on the net asset value which does not reflect sales charges, if applicable, as of the last business day of the period.
+ The Ratios of Expenses and Net Investment Income reflect the rebate of certain Portfolio expenses in connection with the investments in Morgan Stanley affiliates during the period. The effect of the rebate on the ratios is disclosed in the above table as "Ratio of Rebate from Morgan Stanley Affiliates to Average Net Assets."
# Not Annualized.
* Annualized.
The accompanying notes are an integral part of the financial statements.
235
2011 Annual Report
December 31, 2011
Financial Highlights
U.S. Real Estate Portfolio
| | | Class L | |
| Selected Per Share Data and Ratios | | Period from
November 11,
2011^ to
December 31,
2011 | |
| Net Asset Value, Beginning of Period | | $ | 14.52 | | |
| Income (Loss) from Investment Operations: | |
| Net Investment Income† | | | 0.06 | | |
| Net Realized and Unrealized Loss | | | 0.11 | | |
| Total from Investment Operations | | | 0.17 | | |
| Net Asset Value, End of Period | | $ | 14.69 | | |
| Total Return++ | | | 1.17 | %# | |
| Ratios and Supplemental Data: | |
| Net Assets, End of Period (Thousands) | | $ | 5,879 | | |
| Ratio of Expenses to Average Net Assets (1) | | | 1.75 | %+* | |
| Ratio of Net Investment Income to Average Net Assets (1) | | | 3.33 | %+* | |
| Ratio of Rebate from Morgan Stanley Affiliates to Average Net Assets | | | 0.00 | %§* | |
| Portfolio Turnover Rate | | | 21 | %* | |
| (1) Supplemental Information on the Ratios to Average Net Assets: | |
| Ratios Before Expense Limitation: | |
| Expenses to Average Net Assets | | | 1.91 | %+* | |
| Net Investment Income to Average Net Assets | | | 3.17 | %+* | |
^ Commencement of Operations.
† Per share amount is based on average shares outstanding.
++ Calculated based on the net asset value as of the last business day of the period.
+ The Ratios of Expenses and Net Investment Income reflect the rebate of certain Portfolio expenses in connection with the investments in Morgan Stanley affiliates during the period. The effect of the rebate on the ratios is disclosed in the above table as "Ratio of Rebate from Morgan Stanley Affiliates to Average Net Assets."
# Not Annualized.
* Annualized.
The accompanying notes are an integral part of the financial statements.
236
2011 Annual Report
December 31, 2011
Financial Highlights
Emerging Markets Debt Portfolio
| | | Class I | |
| | | Year Ended December 31, | |
| Selected Per Share Data and Ratios | | 2011 | | 2010 | | 2009 | | 2008 | | 2007 | |
| Net Asset Value, Beginning of Period | | $ | 12.44 | | | $ | 12.15 | | | $ | 9.94 | | | $ | 11.47 | | | $ | 11.99 | | |
| Income (Loss) from Investment Operations: | |
| Net Investment Income† | | | 0.64 | | | | 0.87 | | | | 0.71 | | | | 1.03 | | | | 0.71 | | |
| Net Realized and Unrealized Gain (Loss) | | | (1.07 | ) | | | 0.92 | | | | 1.64 | | | | (2.15 | ) | | | (0.23 | ) | |
| Total from Investment Operations | | | (0.43 | ) | | | 1.79 | | | | 2.35 | | | | (1.12 | ) | | | 0.48 | | |
| Distributions from and/or in Excess of: | |
| Net Investment Income | | | (0.64 | ) | | | (0.93 | ) | | | (0.09 | ) | | | (0.41 | ) | | | (1.00 | ) | |
| Net Realized Gain | | | (0.14 | ) | | | (0.57 | ) | | | (0.05 | ) | | | — | | | | — | | |
| Total Distributions | | | (0.78 | ) | | | (1.50 | ) | | | (0.14 | ) | | | (0.41 | ) | | | (1.00 | ) | |
| Redemption Fees | | | 0.00 | ‡ | | | 0.00 | ‡ | | | 0.00 | ‡ | | | — | | | | 0.00 | ‡ | |
| Net Asset Value, End of Period | | $ | 11.23 | | | $ | 12.44 | | | $ | 12.15 | | | $ | 9.94 | | | $ | 11.47 | | |
| Total Return++ | | | (3.66 | )% | | | 15.07 | % | | | 23.75 | % | | | (10.07 | )% | | | 4.68 | % | |
| Ratios and Supplemental Data: | |
| Net Assets, End of Period (Thousands) | | $ | 69,557 | | | $ | 28,864 | | | $ | 38,041 | | | $ | 21,887 | | | $ | 52,686 | | |
| Ratio of Expenses to Average Net Assets (1) | | | 0.83 | %+†† | | | 0.84 | %+†† | | | 0.84 | %+ | | | 0.83 | %+ | | | 0.93 | %+^ | |
| Ratio of Expenses to Average Net Assets Excluding Non Operating Expenses | | | N/A | | | | 0.84 | %+†† | | | 0.84 | %+ | | | 0.81 | %+ | | | 0.85 | %+ | |
| Ratio of Net Investment Income to Average Net Assets (1) | | | 5.21 | %+†† | | | 7.12 | %+†† | | | 6.44 | %+ | | | 9.16 | %+ | | | 6.28 | %+ | |
| Ratio of Rebate from Morgan Stanley Affiliates to Average Net Assets | | | 0.02 | %†† | | | 0.01 | %†† | | | 0.01 | % | | | 0.01 | % | | | 0.00 | %§ | |
| Portfolio Turnover Rate | | | 85 | % | | | 109 | % | | | 138 | % | | | 248 | % | | | 155 | % | |
| (1) Supplemental Information on the Ratios to Average Net Assets: | |
| Ratios Before Expense Limitation: | |
| Expenses to Average Net Assets | | | 1.19 | %†† | | | 1.29 | %+†† | | | 1.35 | %+ | | | 1.61 | %+ | | | 1.21 | %+ | |
| Net Investment Income to Average Net Assets | | | 4.85 | %†† | | | 6.67 | %+†† | | | 5.93 | %+ | | | 8.38 | %+ | | | 6.00 | %+ | |
† Per share amount is based on average shares outstanding.
‡ Amount is less than $0.005 per share.
++ Calculated based on the net asset value as of the last business day of the period.
+ The Ratios of Expenses and Net Investment Income reflect the rebate of certain Portfolio expenses in connection with the investments in Morgan Stanley affiliates during the period. The effect of the rebate on the ratios is disclosed in the above table as "Ratio of Rebate from Morgan Stanley Affiliates to Average Net Assets."
†† Reflects overall Portfolio ratios for investment income and non-class specific expenses.
^ Effective June 1, 2006, the Adviser has agreed to limit the ratio of expenses to average net assets to the maximum ratio of 0.85% for Class I shares. Prior to June 1, 2006, the maximum ratio was 1.00% for Class I shares. Prior to May 1, 2004, the maximum ratio was 1.75% for Class I shares.
§ Amount is less than 0.005%.
The accompanying notes are an integral part of the financial statements.
237
2011 Annual Report
December 31, 2011
Financial Highlights
Emerging Markets Debt Portfolio
| | | Class P | |
| | | Year Ended December 31, | |
| Selected Per Share Data and Ratios | | 2011 | | 2010 | | 2009 | | 2008 | | 2007 | |
| Net Asset Value, Beginning of Period | | $ | 12.76 | | | $ | 12.42 | | | $ | 10.18 | | | $ | 11.77 | | | $ | 12.29 | | |
| Income (Loss) from Investment Operations: | |
| Net Investment Income† | | | 0.63 | | | | 0.86 | | | | 0.84 | | | | 0.94 | | | | 0.69 | | |
| Net Realized and Unrealized Gain (Loss) | | | (1.10 | ) | | | 0.94 | | | | 1.53 | | | | (2.13 | ) | | | (0.23 | ) | |
| Total from Investment Operations | | | (0.47 | ) | | | 1.80 | | | | 2.37 | | | | (1.19 | ) | | | 0.46 | | |
| Distributions from and/or in Excess of: | |
| Net Investment Income | | | (0.61 | ) | | | (0.89 | ) | | | (0.08 | ) | | | (0.40 | ) | | | (0.98 | ) | |
| Net Realized Gain | | | (0.14 | ) | | | (0.57 | ) | | | (0.05 | ) | | | — | | | | — | | |
| Total Distributions | | | (0.75 | ) | | | (1.46 | ) | | | (0.13 | ) | | | (0.40 | ) | | | (0.98 | ) | |
| Redemption Fees | | | 0.00 | ‡ | | | 0.00 | ‡ | | | 0.00 | ‡ | | | — | | | | 0.00 | ‡ | |
| Net Asset Value, End of Period | | $ | 11.54 | | | $ | 12.76 | | | $ | 12.42 | | | $ | 10.18 | | | $ | 11.77 | | |
| Total Return++ | | | (3.90 | )% | | | 14.88 | % | | | 23.43 | % | | | (10.34 | )% | | | 4.29 | % | |
| Ratios and Supplemental Data: | |
| Net Assets, End of Period (Thousands) | | $ | 6,784 | | | $ | 6,792 | | | $ | 4,379 | | | $ | 3,640 | | | $ | 870 | | |
| Ratio of Expenses to Average Net Assets (1) | | | 1.08 | %+†† | | | 1.09 | %+†† | | | 1.09 | %+ | | | 1.12 | %+ | | | 1.20 | %+^ | |
| Ratio of Expenses to Average Net Assets Excluding Non Operating Expenses | | | N/A | | | | 1.09 | %+†† | | | 1.09 | %+ | | | 1.10 | %+ | | | 1.10 | %+ | |
| Ratio of Net Investment Income to Average Net Assets (1) | | | 4.96 | %+†† | | | 6.87 | %+†† | | | 7.52 | %+ | | | 8.56 | %+ | | | 5.99 | %+ | |
| Ratio of Rebate from Morgan Stanley Affiliates to Average Net Assets | | | 0.02 | %†† | | | 0.01 | %†† | | | 0.01 | % | | | 0.01 | % | | | 0.00 | %§ | |
| Portfolio Turnover Rate | | | 85 | % | | | 109 | % | | | 138 | % | | | 248 | % | | | 155 | % | |
| (1) Supplemental Information on the Ratios to Average Net Assets: | |
| Ratios Before Expense Limitation: | |
| Expenses to Average Net Assets | | | 1.44 | %†† | | | 1.54 | %+†† | | | 1.62 | %+ | | | 2.31 | %+ | | | 1.49 | %+ | |
| Net Investment Income to Average Net Assets | | | 4.60 | %†† | | | 6.42 | %+†† | | | 6.99 | %+ | | | 7.37 | %+ | | | 5.71 | %+ | |
† Per share amount is based on average shares outstanding.
‡ Amount is less than $0.005 per share.
++ Calculated based on the net asset value as of the last business day of the period.
+ The Ratios of Expenses and Net Investment Income reflect the rebate of certain Portfolio expenses in connection with the investments in Morgan Stanley affiliates during the period. The effect of the rebate on the ratios is disclosed in the above table as "Ratio of Rebate from Morgan Stanley Affiliates to Average Net Assets."
†† Reflects overall Portfolio ratios for investment income and non-class specific expenses.
^ Effective June 1, 2006, the Adviser has agreed to limit the ratio of expenses to average net assets to the maximum ratio of 1.10% for Class P shares. Prior to June 1, 2006, the maximum ratio was 1.25% for Class P shares. Prior to May 1, 2004, the maximum ratio was 2.00% for Class P shares.
§ Amount is less than 0.005%.
The accompanying notes are an integral part of the financial statements.
238
2011 Annual Report
December 31, 2011
Financial Highlights
Emerging Markets Debt Portfolio
| | | Class H | |
| | | Year Ended December 31, | | Period from
January 2,
2008^ to
December 31, | |
| Selected Per Share Data and Ratios | | 2011 | | 2010 | | 2009 | | 2008 | |
| Net Asset Value, Beginning of Period | | $ | 12.76 | | | $ | 12.42 | | | $ | 10.18 | | | $ | 11.86 | | |
| Income (Loss) from Investment Operations: | |
| Net Investment Income† | | | 0.62 | | | | 0.86 | | | | 0.71 | | | | 0.88 | | |
| Net Realized and Unrealized Gain (Loss) | | | (1.09 | ) | | | 0.94 | | | | 1.66 | | | | (2.17 | ) | |
| Total from Investment Operations | | | (0.47 | ) | | | 1.80 | | | | 2.37 | | | | (1.29 | ) | |
| Distributions from and/or in Excess of: | |
| Net Investment Income | | | (0.61 | ) | | | (0.89 | ) | | | (0.08 | ) | | | (0.39 | ) | |
| Net Realized Gain | | | (0.14 | ) | | | (0.57 | ) | | | (0.05 | ) | | | — | | |
| Total Distributions | | | (0.75 | ) | | | (1.46 | ) | | | (0.13 | ) | | | (0.39 | ) | |
| Redemption Fees | | | 0.00 | ‡ | | | 0.00 | ‡ | | | 0.00 | ‡ | | | — | | |
| Net Asset Value, End of Period | | $ | 11.54 | | | $ | 12.76 | | | $ | 12.42 | | | $ | 10.18 | | |
| Total Return++ | | | (3.88 | )% | | | 14.86 | % | | | 23.40 | % | | | (10.70 | )%# | |
| Ratios and Supplemental Data: | |
| Net Assets, End of Period (Thousands) | | $ | 2,955 | | | $ | 2,021 | | | $ | 2,316 | | | $ | 1,758 | | |
| Ratio of Expenses to Average Net Assets (1) | | | 1.08 | %+†† | | | 1.09 | %+†† | | | 1.09 | %+ | | | 1.18 | %+* | |
| Ratio of Expenses to Average Net Assets Excluding Non Operating Expenses | | | N/A | | | | 1.09 | %+†† | | | 1.09 | %+ | | | 1.10 | %+* | |
| Ratio of Net Investment Income to Average Net Assets (1) | | | 4.96 | %+†† | | | 6.87 | %+†† | | | 6.37 | %+ | | | 7.66 | %+* | |
| Rebate from Morgan Stanley Affiliates to Average Net Assets | | | 0.02 | %†† | | | 0.01 | %†† | | | 0.01 | % | | | 0.01 | %* | |
| Portfolio Turnover Rate | | | 85 | % | | | 109 | % | | | 138 | % | | | 248 | %# | |
| (1) Supplemental Information on the Ratios to Average Net Assets: | |
| Ratios Before Expense Limitation: | |
| Expense to Average Net Assets | | | 1.44 | %†† | | | 1.54 | %+†† | | | 1.57 | %+ | | | 2.11 | %+* | |
| Net Investment Income to Average Net Assets | | | 4.60 | %†† | | | 6.42 | %+†† | | | 5.89 | %+ | | | 6.73 | %+* | |
^ Commencement of Operations.
† Per share amount is based on average shares outstanding.
‡ Amount is less than $0.005 per share.
++ Calculated based on the net asset value which does not reflect sales charges, if applicable, as of the last business day of the period.
+ The Ratios of Expenses and Net Investment Income reflect the rebate of certain Portfolio expenses in connection with the investments in Morgan Stanley affiliates during the period. The effect of the rebate on the ratios is disclosed in the above table as "Ratio of Rebate from Morgan Stanley Affiliates to Average Net Assets."
†† Reflects overall Portfolio ratios for investment income and non-class specific expenses.
# Not Annualized.
* Annualized.
The accompanying notes are an integral part of the financial statements.
239
2011 Annual Report
December 31, 2011
Financial Highlights
Emerging Markets Debt Portfolio
| | | Class L | |
| | | Year Ended December 31, | | Period from
January 2,
2008^ to
December 31, | |
| Selected Per Share Data and Ratios | | 2011 | | 2010 | | 2009 | | 2008 | |
| Net Asset Value, Beginning of Period | | $ | 12.54 | | | $ | 12.24 | | | $ | 10.09 | | | $ | 11.84 | | |
| Income (Loss) from Investment Operations: | |
| Net Investment Income† | | | 0.55 | | | | 0.79 | | | | 0.92 | | | | 0.50 | | |
| Net Realized and Unrealized Gain (Loss) | | | (1.07 | ) | | | 0.92 | | | | 1.36 | | | | (1.87 | ) | |
| Total from Investment Operations | | | (0.52 | ) | | | 1.71 | | | | 2.28 | | | | (1.37 | ) | |
| Distributions from and/or in Excess of: | |
| Net Investment Income | | | (0.55 | ) | | | (0.84 | ) | | | (0.08 | ) | | | (0.38 | ) | |
| Net Realized Gain | | | (0.14 | ) | | | (0.57 | ) | | | (0.05 | ) | | | — | | |
| Total Distributions | | | (0.69 | ) | | | (1.41 | ) | | | (0.13 | ) | | | (0.38 | ) | |
| Redemption Fees | | | 0.00 | ‡ | | | 0.00 | ‡ | | | 0.00 | ‡ | | | — | | |
| Net Asset Value, End of Period | | $ | 11.33 | | | $ | 12.54 | | | $ | 12.24 | | | $ | 10.09 | | |
| Total Return++ | | | (4.34 | )% | | | 14.18 | % | | | 22.80 | % | | | (11.85 | )%# | |
| Ratios and Supplemental Data: | |
| Net Assets, End of Period (Thousands) | | $ | 4,965 | | | $ | 4,668 | | | $ | 1,305 | | | $ | 342 | | |
| Ratio of Expenses to Average Net Assets (1) | | | 1.58 | %+†† | | | 1.59 | %+†† | | | 1.59 | %+ | | | 1.72 | %+* | |
| Ratio of Expenses to Average Net Assets Excluding Non Operating Expenses | | | N/A | | | | 1.59 | %+†† | | | 1.59 | %+ | | | 1.60 | %+* | |
| Ratio of Net Investment Income to Average Net Assets (1) | | | 4.46 | %+†† | | | 6.37 | %+†† | | | 8.21 | %+ | | | 8.78 | %+* | |
| Ratio of Rebate from Morgan Stanley Affiliates to Average Net Assets | | | 0.02 | %†† | | | 0.01 | %†† | | | 0.01 | % | | | 0.01 | %* | |
| Portfolio Turnover Rate | | | 85 | % | | | 109 | % | | | 138 | % | | | 248 | %# | |
| (1) Supplemental Information on the Ratios to Average Net Assets: | |
| Ratios Before Expense Limitation: | |
| Expenses to Average Net Assets | | | 1.94 | %†† | | | 2.04 | %+†† | | | 2.02 | %+ | | | 3.03 | %+* | |
| Net Investment Income to Average Net Assets | | | 4.10 | %†† | | | 5.92 | %+†† | | | 7.78 | %+ | | | 7.47 | %+* | |
^ Commencement of Operations.
† Per share amount is based on average shares outstanding.
‡ Amount is less than $0.005 per share.
++ Calculated based on the net asset value as of the last business day of the period.
+ The Ratios of Expenses and Net Investment Income reflect the rebate of certain Portfolio expenses in connection with the investments in Morgan Stanley affiliates during the period. The effect of the rebate on the ratios is disclosed in the above table as "Ratio of Rebate from Morgan Stanley Affiliates to Average Net Assets."
†† Reflects overall Portfolio ratios for investment income and non-class specific expenses.
# Not Annualized.
* Annualized.
The accompanying notes are an integral part of the financial statements.
240
2011 Annual Report
December 31, 2011
Notes to Financial Statements
Morgan Stanley Institutional Fund, Inc. (the "Fund") is registered under the Investment Company Act of 1940, as amended (the "Act"), as an open-end management investment company. The Fund is comprised of twenty-three separate, active, diversified and non-diversified portfolios (individually referred to as a "Portfolio", collectively as the "Portfolios"). The Fund offers up to four different classes of shares for certain Portfolios — Class I shares, Class P shares, Class H shares and Class L shares. Each Portfolio (with the exception of the Asian Equity, Global Advantage, Global Discovery, Global Insight, Global Opportunity, Global Real Estate, International Advantage, International Opportunity, Select Global Infrastructure, Advantage, Insight, Opportunity, Small Company Growth, U.S. Real Estate, and Emerging Markets Debt Portfolios), offers two classes of shares — Class I and Class P. Global Insight and Insight Portfolios offer Class I shares, Class H shares and Class L shares. Asian Equity, Global Advantage, Global Discovery, Global Opportunity, Global Real Estate, International Advantage, International Opportunity, Select Global Infrastructure, Advantage, Opportunity, Small Company Growth, U.S. Real Estate, and Emerging Markets Debt Portfolios offer Class I shares, Class P shares, Class H shares and Class L shares. Each class of shares has identical voting rights (except shareholders of each Class have exclusive voting rights regarding any matter relating solely to that particular Class of shares), dividend, liquidation and other rights. Effective April 29, 2011, Capital Growth Portfolio was renamed Growth Portfolio.
For detailed descriptions of the investment objectives of each of the Portfolios and other related information, please refer to the Prospectuses of the Fund.
The Fund has suspended offering shares of the Small Company Growth Portfolio to new investors. The Fund will continue to offer shares of the Portfolio to existing shareholders. The Fund may recommence offering shares of the Portfolio to new investors in the future.
On November 11, 2011, Small Company Growth Portfolio acquired the net assets of Morgan Stanley Special Growth Fund ("Special Growth Fund"), an open-end investment company. Based on the respective valuations as of the close of business on November 11, 2011, pursuant to a Plan of Reorganization approved by the shareholders of Special Growth Fund on October 27, 2011 ("Reorganization"). The purpose of the transaction was to combine two portfolios managed by Morgan Stanley Investment Management Inc. with comparable investment objectives and strategies. The acquisition was accomplished by a tax-free exchange of 4,225 Class I shares of Small Company Growth Portfolio at a net asset value of $13.34 per share for 2,477 Class I shares of Special Growth Fund; 2,762,585 Class H shares of Small Company Growth Portfolio at a net asset value of $12.47 for 1,463,083 Class A shares and 109,160 Class B shares of Special Growth Fund; 142,996 Class L shares of Small Company Growth Portfolio at a net asset value of $12.47 for 89,674 Class C shares of Special Growth Fund. The net assets of Special Growth Fund before the Reorganization were approximately $36,289,000, including unrealized appreciation of approximately $2,423,000 at November 11, 2011. The investment portfolio of Special Growth Fund, with a fair value of approximately $36,424,000 and identified cost of approximately $34,001,000 on November 11, 2011, was the principal asset acquired by Small Company Growth Portfolio. For financial reporting purposes, assets received and shares issued by Small Company Growth Portfolio were recorded at fair value; however, the cost basis of the investments received from Special Growth Fund was carried forward to align ongoing reporting of Small Company Growth Portfolio's realized and unrealized gains and losses with amounts distributable to shareholders for tax purposes. Immediately prior to the Reorganization, the net assets of Small Company Growth Portfolio were approximately $1,412,832,000. Immediately after the merger, the net assets of Small Company Growth Portfolio were approximately $1,449,121,000.
Upon closing of the Reorganization, shareholders of Special Growth Fund received shares of Small Company Growth Portfolio as follows:
Special Growth
Fund | | Small Company
Growth Portfolio | |
| Class A | | Class H | |
|
| Class B | | Class H | |
|
| Class C | | Class L | |
|
| Class I | | Class I | |
|
Assuming the acquisition had been completed on January 1, 2011, the beginning of the annual reporting period of Small Company Growth Portfolio, Small Company Growth Portfolio's pro forma results of operations for the year ended December 31, 2011, are as follows:
| Net investment loss(1) | | $ | (4,536,000 | ) | |
| Net gain realized and unrealized gain (loss)(2) | | $ | (146,370,000 | ) | |
Net increase (decrease) in net assets resulting
from operations | | $ | (150,906,000 | ) | |
(1) Approximately $(5,631,000) as reported, plus approximately $209,000 Special Growth Fund premerger, plus approximately $886,000 of estimated pro-forma eliminated expenses.
(2) Approximately $(146,782,000) as reported, plus approximately $412,000 Special Growth Fund premerger.
Because the combined investment portfolios have been managed as a single integrated portfolio since the acquisition was completed, it is not practicable to separate the amounts of revenue and earnings of Special Growth Fund that have been included in Small Company Growth Portfolio's Statement of Operations since December 31, 2011.
On November 11, 2011, U.S. Real Estate Portfolio acquired the net assets of Morgan Stanley Real Estate Fund ("Real Estate
241
2011 Annual Report
December 31, 2011
Notes to Financial Statements (cont'd)
Fund"), an open-end investment company. Based on the respective valuations as of the close of business on November 11, 2011, pursuant to a Plan of Reorganization approved by the shareholders of Real Estate Fund on October 27, 2011 ("Reorganization"). The purpose of the transaction was to combine two portfolios managed by Morgan Stanley Investment Management Inc. with comparable investment objectives and strategies. The acquisition was accomplished by a tax-free exchange of 42,903 Class I shares of U.S. Real Estate Portfolio at a net asset value of $14.80 per share for 102,854 Class I shares of Real Estate Fund; 1,878,193 Class H shares of U.S. Real Estate Portfolio at a net asset value of $14.52 for 3,927,044 Class A shares and 528,039 Class B shares of Real Estate Fund; 418,343 Class L shares of U.S. Real Estate Portfolio at a net asset value of $14.52 for 1,005,298 Class C shares of Real Estate Fund. The net assets of Real Estate Fund before the Reorganization were approximately $33,981,000, including unrealized appreciation of approximately $12,071,000 at November 11, 2011. The investment portfolio of Real Estate Fund, with a fair value of approximately $34,585,000 and identified cost of approximately $22,514,000 on November 11, 2011, was the principal asset acquired by U.S. Real Estate Portfolio. For financial reporting purposes, assets received and shares issued by U.S. Real Estate Portfolio were recorded at fair value; however, the cost basis of the investments received from Real Estate Fund was carried forward to align ongoing reporting of U.S. Real Estate Portfolio's realized and unrealized gains and losses with amounts distributable to shareholders for tax purposes. Immediately prior to the Reorganization, the net assets of U.S. Real Estate Portfolio were approximately $882,125,000. Immediately after the merger, the net assets of U.S. Real Estate Portfolio were approximately $916,106,000.
Upon closing of the Reorganization, shareholders of Real Estate Fund received shares of U.S. Real Estate Portfolio as follows:
Real Estate
Fund | | U.S. Real
Estate Portfolio | |
| Class A | | Class H | |
|
| Class B | | Class H | |
|
| Class C | | Class L | |
|
| Class I | | Class I | |
|
Assuming the acquisition had been completed on January 1, 2011, the beginning of the annual reporting period of U.S. Real Estate Portfolio, U.S. Real Estate Portfolio's pro forma results of operations for the year ended December 31, 2011, are as follows:
| Net investment income(1) | | $ | 9,128,000 | | |
| Net realized and unrealized gain (loss)(2) | | $ | 48,748,000 | | |
Net increase (decrease) in net assets resulting
from operations | | $ | 57,876,000 | | |
(1) Approximately $7,100,000 as reported, plus approximately $1,099,000 Real Estate Fund premerger, plus approximately $929,000 of estimated pro-forma eliminated expenses.
(2) Approximately $43,537,000 as reported, plus approximately $5,211,000 Real Estate Fund premerger.
Because the combined investment portfolios have been managed as a single integrated portfolio since the acquisition was completed, it is not practicable to separate the amounts of revenue and earnings of Real Estate Fund that have been included in U.S. Real Estate Portfolio's Statement of Operations since December 31, 2011.
A. Significant Accounting Policies: The following significant accounting policies are in conformity with U.S. generally accepted accounting principles ("GAAP"). Such policies are consistently followed by the Fund in the preparation of its financial statements. GAAP may require management to make estimates and assumptions that affect the reported amounts and disclosures in the financial statements. Actual results may differ from those estimates.
1. Security Valuation: Securities listed on a foreign exchange are valued at their closing price. Unlisted securities and listed securities not traded on the valuation date for which market quotations are readily available are valued at the mean between the current bid and ask prices. Equity securities listed on a U.S. exchange are valued at the latest quoted sales price on the valuation date. Equity securities listed or traded on NASDAQ, for which market quotations are available, are valued at the NASDAQ Official Closing Price. Bonds and other fixed income securities may be valued according to the broadest and most representative market. In addition, bonds and other fixed income securities may be valued on the basis of prices provided by a pricing service. The prices provided by a pricing service take into account broker dealer market price quotations for institutional size trading in similar groups of securities, security quality, maturity, coupon and other security characteristics as well as any developments related to the specific securities. Short-term debt securities purchased with remaining maturities of 60 days or less are valued at amortized cost, unless the Board of Directors (the "Directors") determines such valuation does not reflect the securities' fair value, in which case these securities will be valued at their fair value as determined in good faith under procedures adopted by the Directors.
All other securities and investments for which market values are not readily available, including restricted securities, and those securities for which it is inappropriate to determine prices in accordance with the aforementioned procedures, are valued at fair value as determined in good faith under procedures adopted by the Directors, although the actual calculations may be done by others. Factors considered in making this determination may include, but are not limited to, information obtained by contacting the issuer, analysts, or the appropriate stock exchange (for
242
2011 Annual Report
December 31, 2011
Notes to Financial Statements (cont'd)
exchange-traded securities), analysis of the issuer's financial statements or other available documents and, if necessary, available information concerning other securities in similar circumstances.
Most foreign markets close before the New York Stock Exchange ("NYSE"). Occasionally, developments that could affect the closing prices of securities and other assets may occur between the times at which valuations of such securities are determined (that is, close of the foreign market on which the securities trade) and the close of business on the NYSE. If these developments are expected to materially affect the value of the securities, the valuations may be adjusted to reflect the estimated fair value as of the close of the NYSE, as determined in good faith under procedures established by the Directors.
2. Foreign Currency Translation and Foreign Investments: The books and records of the Fund are maintained in U.S. dollars. Foreign currency amounts are translated into U.S. dollars at the mean of the bid and ask prices of such currencies against U.S. dollars last quoted by a major bank as follows:
• investments, other assets and liabilities at the prevailing rate of exchange on the valuation date;
• investment transactions and investment income at the prevailing rates of exchange on the dates of such transactions.
Although the net assets of the Fund are presented at the foreign exchange rates and market values at the close of the period, the Fund does not isolate that portion of the results of operations arising as a result of changes in the foreign exchange rates from the fluctuations arising from changes in the market prices of securities held at period end. Similarly, the Fund does not isolate the effect of changes in foreign exchange rates from the fluctuations arising from changes in the market prices of securities sold during the period. Accordingly, realized and unrealized foreign currency gains (losses) on investments in securities are included in the reported net realized and unrealized gains (losses) on investment transactions and balances. However, pursuant to U.S. Federal income tax regulations, gains and losses from certain foreign currency transactions and the foreign currency portion of gains and losses realized on sales and maturities of foreign denominated debt securities are treated as ordinary income for U.S. Federal income tax purposes.
Net realized gains (losses) on foreign currency transactions represent net foreign exchange gains (losses) from foreign currency exchange contracts, disposition of foreign currencies, currency gains (losses) realized between the trade and settlement dates on securities transactions, and the difference between the amount of investment income and foreign withholding taxes recorded on the Fund's books and the U.S. dollar equivalent amounts actually received or paid. Net unrealized currency gains (losses) from valuing foreign currency denominated assets and liabilities at period end exchange rates are reflected as a component of unrealized appreciation (depreciation) on the Statements of Assets and Liabilities. The change in unrealized currency gains (losses) on foreign currency translations for the period is reflected in the Statements of Operations.
Foreign security and currency transactions may involve certain considerations and risks not typically associated with those of U.S. dollar denominated transactions as a result of, among other factors, fluctuations of exchange rates in relation to the U.S. dollar, the possibility of lower levels of governmental supervision and regulation of foreign securities markets and the possibility of political or economic instability.
Governmental approval for foreign investments may be required in advance of making an investment under certain circumstances in some countries, and the extent of foreign investments in domestic companies may be subject to limitation in other countries. Foreign ownership limitations also may be imposed by the charters of individual companies to prevent, among other concerns, violations of foreign investment limitations. As a result, an additional class of shares (identified as "Foreign" in the Portfolio of Investments) may be created and offered for investment. The "local" and "foreign shares" market values may differ. In the absence of trading of the foreign shares in such markets, the Fund values the foreign shares at the closing exchange price of the local shares. Such securities, if any, are identified as fair valued in the Portfolio of Investments.
3. Derivatives: Certain Portfolios use derivative instruments for a variety of purposes, including hedging, risk management, portfolio management or to earn income. Derivatives are financial instruments whose value is based on the value of another underlying asset, interest rate, index or financial instrument. A derivative instrument often has risks similar to its underlying instrument and may have additional risks, including imperfect correlation between the value of the derivative and the underlying instrument, risks of default by the other party to certain transactions, magnification of losses incurred due to changes in the market value of the securities, instruments, indices or interest rates to which they relate, and risks that the transactions may not be liquid. The use of derivatives involves risks that are different from, and possibly greater than, the risks associated with other portfolio investments.
243
2011 Annual Report
December 31, 2011
Notes to Financial Statements (cont'd)
Derivatives may involve the use of highly specialized instruments that require investment techniques and risk analyses different from those associated with other portfolio investments. All of a Portfolio's holdings, including derivative instruments, are marked to market each day with the change in value reflected in unrealized appreciation (depreciation). Upon disposition, a realized gain or loss is recognized.
Certain derivative transactions may give rise to a form of leverage. Leverage associated with derivative transactions may cause the Portfolios to liquidate portfolio positions when it may not be advantageous to do so to satisfy its obligations or to meet earmarking or segregation requirements, pursuant to applicable Securities and Exchange Commission rules and regulations, or may cause the Portfolios to be more volatile than if the Portfolios had not been leveraged. Although the Adviser and/or Sub-Adviser seek to use derivatives to further the Portfolios' investment objectives, there is no assurance that the use of derivatives will achieve this result.
Following is a description of the derivative instruments and techniques that certain Portfolio used during the period and their associated risks:
Futures: A futures contract is a standardized agreement between two parties to buy or sell a specific quantity of an underlying instrument at a specific price at a specific future time. The value of a futures contract tends to increase and decrease in tandem with the value of the underlying instrument. Futures contracts are bilateral agreements, with both the purchaser and the seller equally obligated to complete the transaction. Depending on the terms of the particular contract, futures contracts are settled through either physical delivery of the underlying instrument on the settlement date or by payment of a cash settlement amount on the settlement date. During the period the futures contract is open, payments are received from or made to the broker based upon changes in the value of the contract (the variation margin). The risk of loss associated with a futures contract is in excess of the variation margin reflected as part of "Due from (to) Brokers" in the Statements of Assets and Liabilities. A decision as to whether, when and how to use futures involves the exercise of skill and judgment and even a well conceived futures transaction may be unsuccessful because of market behavior or unexpected events. In addition to the derivatives risks discussed above, the prices of futures can be highly volatile, using futures can lower total return, and the potential loss from futures can exceed a Portfolio's initial investment in such contracts.
Foreign Currency Exchange Contracts: In connection with their investments in foreign securities, certain Portfolios also entered into contracts with banks, brokers or dealers to purchase or sell securities or foreign currencies at a future date. A foreign currency exchange contract ("currency contracts") is a negotiated agreement between the contracting parties to exchange a specified amount of currency at a specified future time at a specified rate. The rate can be higher or lower than the spot rate between the currencies that are the subject of the currency contract. Currency contracts are used to protect against uncertainty in the level of future foreign currency exchange rates or to gain or modify exposure to a particular currency. Hedging the Portfolio's currency risks involves the risk of mismatching the Portfolio's objectives under a currency contract with the value of securities denominated in a particular currency. Furthermore, such transactions reduce or preclude the opportunity for gain if the value of the currency should move in the direction opposite to the position taken. There is an additional risk to the effect that currency contracts create exposure to currencies in which a Portfolio's securities are not denominated. Unanticipated changes in currency prices may result in poorer overall performance for a Portfolio than if it had not entered into such currency contracts. A currency contract is marked-to-market daily and the change in market value is recorded by the Portfolio as unrealized gain or loss. The Portfolio records realized gains (losses) when the currency contract is closed equal to the difference between the value of the currency contract at the time it was opened and the value at the time it was closed.
Financial Accounting Standards Board ("FASB") Accounting Standards CodificationTM ("ASC") 815, "Derivatives and Hedging: Overall" ("ASC 815"), is intended to improve financial reporting about derivative instruments by requiring enhanced disclosures to enable investors to better understand how and why the Portfolios use derivative instruments, how these derivative instruments are accounted for and their effects on the Portfolio's financial position and results of operations.
244
2011 Annual Report
December 31, 2011
Notes to Financial Statements (cont'd)
The following table sets forth the fair value of each Portfolio's derivative contracts by primary risk exposure as of December 31, 2011.
| Primary Risk Exposure | | Statements of
Assets and
Liabilities | | Foreign
Currency
Exchange
Contracts
(000) | | Futures
Contracts
(000)(a) | |
| Active International Allocation: | |
| Currency Risk | | Receivables | | $ | 333 | | | $ | — | | |
| Equity Risk | | Receivables | | | — | | | | 180 | | |
| Total Receivables | | | | $ | 333 | | | $ | 180 | | |
| Currency Risk | | Payables | | $ | (598 | ) | | $ | — | | |
| Equity Risk | | Payables | | | — | | | | (324 | ) | |
| Total Payables | | | | $ | (598 | ) | | $ | (324 | ) | |
| International Small Cap: | |
| Currency Risk | | Payables | | $ | (38 | ) | | $ | — | | |
| Emerging Markets Debt: | |
| Currency Risk | | Receivables | | $ | 2 | | | $ | — | | |
| Currency Risk | | Payables | | $ | (101 | ) | | $ | — | | |
(a) This amount represents the cumulative appreciation (depreciation) of futures contracts as reported in the Portfolio of Investments. The Statements of Assets and Liabilities only reflect the current day variation margin.
The following tables set forth by primary risk exposure the Portfolio's realized gains (losses) and change in unrealized appreciation (depreciation) by type of derivative contract for the year ended December 31, 2011 in accordance with ASC 815.
| Realized Gain (Loss) | |
| Portfolio | | Primary Risk
Exposure | | Derivative
Type | | Value
(000) | |
| Active International | | Currency Risk | | Foreign Currency | |
| |
| Allocation | | | | | | Exchange Contracts | | $ | (2,377 | ) | |
| | | | | Equity Risk | | Futures Contracts | | | (6,806 | ) | |
| Total | | | | | | | | | | $ | (9,183 | ) | |
| Change in Unrealized Appreciation (Depreciation) | |
| Portfolio | | Primary Risk
Exposure | | Derivative
Type | | Value
(000) | |
| Active International | | Currency Risk | | Foreign Currency | |
| |
| Allocation | | | | | | Exchange Contracts | | $ | (47 | ) | |
| | | Equity Risk | | Futures Contracts | | | (232 | ) | |
| Total | | | | | | | | | | $ | (279 | ) | |
| Realized Gain (Loss) | |
| Portfolio | | Primary Risk
Exposure | | Derivative
Type | | Value
(000) | |
Emerging Markets
| | Currency Risk
| | Foreign Currency
Exchange Contracts | | $ | (4,951 | ) | |
| Realized Gain (Loss) | |
| Portfolio | | Primary Risk
Exposure | | Derivative
Type | | Value
(000) | |
Global Discovery
| | Currency Risk
| | Foreign Currency
Exchange Contracts | | $ | 12 | | |
| Realized Gain (Loss) | |
| Portfolio | | Primary Risk
Exposure | | Derivative
Type | | Value
(000) | |
International Small Cap
| | Currency Risk
| | Foreign Currency
Exchange Contracts | | $ | (2,119 | ) | |
| Change in Unrealized Appreciation (Depreciation) | |
| Portfolio | | Primary Risk
Exposure | | Derivative
Type | | Value
(000) | |
International Small Cap
| | Currency Risk
| | Foreign Currency
Exchange Contracts | | $ | 1,108 | | |
| Realized Gain (Loss) | |
| Portfolio | | Primary Risk
Exposure | | Derivative
Type | | Value
(000) | |
Emerging Markets Debt
| | Currency Risk
| | Foreign Currency
Exchange Contracts | | $ | (667 | ) | |
| Change in Unrealized Appreciation (Depreciation) | |
| Portfolio | | Primary Risk
Exposure | | Derivative
Type | | Value
(000) | |
Emerging Markets Debt
| | Currency Risk
| | Foreign Currency
Exchange Contracts | | $ | (170 | ) | |
For the year ended December 31, 2011, Active International Allocation Portfolio's average monthly principal amount of foreign currency exchange contracts was approximately $96,340,000 and the average monthly original value of futures contracts was approximately $22,940,000. Emerging Markets, Global Discovery, International Small Cap and Emerging Markets Debt Portfolios' average monthly principal amount of foreign currency exchange contracts were approximately $39,769,000, $58,000, $35,602,000 and $15,884,000, respectively.
4. Structured Investments: Certain Portfolios invested a portion of their assets in structured investments. A structured investment is a derivative security designed to offer a return linked to a particular underlying security, currency or market. Structured investments may come in various forms including notes, warrants and options to purchase securities. The Portfolio will typically use structured investments to gain exposure to a permitted underlying security, currency or market when direct access to a market is limited or inefficient from a tax or cost standpoint. Investments in structured investments involve risks including counterparty risk and market risk. Holders of structured investments bear risks of the underlying investment and are subject to counterparty risk because the Portfolio is relying on the creditworthiness of such counterparty and has no rights with respect to the underlying investment. Certain structured investments may be thinly traded or have a limited trading market and may have the effect of increasing the Portfolio's illiquidity to the extent that the Portfolio, at a particular time, may be unable to find qualified buyers for these securities.
5. Securities Lending: Certain Portfolios lend securities to qualified financial institutions, such as broker-dealers, to earn additional income. Any increase or decrease in the fair value of the securities loaned that might occur and any interest earned or dividends declared on those securities during the term of the loan would remain in the Portfolio. Portfolios that lend securities receive cash or securities as
245
2011 Annual Report
December 31, 2011
Notes to Financial Statements (cont'd)
collateral in an amount equal to or exceeding 100% of the current fair value of the loaned securities. The collateral is marked-to-market daily, by the securities lending agent, to ensure that a minimum of 100% collateral coverage is maintained.
Based on pre-established guidelines, the securities lending agent invests any cash collateral that is received in an affiliated money market portfolio and repurchase agreements backed by the U.S. Treasury and Agency securities. Securities lending income is generated from the earnings on the invested collateral and borrowing fees, less any rebates owed to the borrowers and compensation to the lending agent, and is recorded as "Income from Securities Loaned-Net" in the Portfolios' Statements of Operations. Risks in securities lending transactions are that a borrower may not provide additional collateral when required or return the securities when due, and that the value of the short-term investments will be less than the amount of cash collateral plus any rebate that is required to be returned to the borrower.
The value of the loaned securities and related collateral outstanding at December 31, 2011 were as follows:
| Portfolio | | Value of
Loaned
Securities
(000) | | Value of
Collateral
Outstanding
(000) | | Invested
Cash
Collateral*
(000) | | Uninvested
Cash
Collateral
(000) | | Value of
Non-Cash
Collateral**
(000) | |
Active International
Allocation | | $ | 28,149 | | | $ | 29,350 | | | $ | 28,964 | | | $ | 210 | | | $ | 176 | | |
| Emerging Markets | | | 89,322 | | | | 92,680 | | | | 92,013 | | | | 667 | | | | — | | |
| International Equity | | | 100,073 | | | | 104,123 | | | | 103,374 | | | | 749 | | | | — | | |
Emerging Markets
Debt | | | 841 | | | | 993 | | | | 986 | | | | 7 | | | | — | | |
* The Portfolios invest cash collateral received in Repurchase Agreements and the Morgan Stanley Institutional Liquidity Funds as reported in the Portfolios of Investments.
** The Portfolio received non-cash collateral in the form of U.S. Government Obligations, which the Portfolio cannot sell or repledge and, accordingly, are not reflected in the Portfolio of Investments.
6. Unfunded Commitments: Subject to the terms of a Subscription Agreement between the U.S. Real Estate Portfolio and BRCP REIT I, LLC, the Portfolio has made a subscription commitment of $7,000,000 for which it will receive 7,000,000 shares of common stock. As of December 31, 2011, BRCP REIT I, LLC has drawn down approximately $6,101,000 which represents 87.2% of the commitment.
Subject to the terms of a Subscription Agreement between the U.S. Real Estate Portfolio and BRCP REIT II, LLC, the Portfolio has made a subscription commitment of $9,000,000 for which it will receive 9,000,000 shares of common stock. As of December 31, 2011, BRCP REIT II, LLC has drawn down approximately $8,364,000 which represents 92.9% of the commitment.
Subject to the terms of a Subscription Agreement between the Global Real Estate Portfolio and Exeter Industrial Value Fund LP, the Portfolio has made a subscription commitment of $2,000,000 for which it will receive 2,000,000 shares of common stock. As of December 31, 2011, Exeter Industrial Value Fund LP has drawn down approximately $1,860,000 which represents 93.0% of the commitment.
Subject to the terms of a Subscription Agreement between the U.S. Real Estate Portfolio and Exeter Industrial Value Fund LP, the Portfolio has made a subscription commitment of $8,500,000 for which it will receive 8,500,000 shares of common stock. As of December 31, 2011, Exeter Industrial Value Fund LP has drawn down approximately $7,905,000 which represents 93.0% of the commitment.
Subject to the terms of a Subscription Agreement between the U.S. Real Estate Portfolio and Keystone Industrial Fund, LP, the Portfolio has made a subscription commitment of $7,946,000 for which it will receive 7,946,000 shares of common stock. As of December 31, 2011, Keystone Industrial Fund, LP has drawn down approximately $7,574,000 which represents 95.3% of the commitment.
Subject to the terms of a Subscription Agreement between the Global Real Estate Portfolio and KTR Industrial Fund II LP, the Portfolio has made a subscription commitment of $5,000,000 for which it will receive 5,000,000 shares of common stock. As of December 31, 2011, KTR Industrial Fund II LP has drawn down approximately $4,269,000 which represents 85.4% of the commitment.
Subject to the terms of a Subscription Agreement between the U.S. Real Estate Portfolio and KTR Industrial Fund II LP, the Portfolio has made a subscription commitment of $10,000,000 for which it will receive 10,000,000 shares of common stock. As of December 31, 2011, KTR Industrial Fund II LP has drawn down approximately $8,538,000 which represents 85.4% of the commitment.
Subject to the terms of a Subscription Agreement between the U.S. Real Estate Portfolio and Cabot Industrial Value Fund II, LP, the Portfolio has made a subscription commitment of $7,500,000 for which it will receive 15,000 shares of common stock. As of December 31, 2011, Cabot Industrial Value Fund II, LP has drawn down approximately $7,000,000 which represents 93.3% of the commitment.
Subject to the terms of a Subscription Agreement between the U.S. Real Estate Portfolio and Cabot Industrial Value Fund III, LP, the Portfolio has made a subscription commitment of $7,500,000 for which it will receive 15,000 shares of common stock. As of December 31, 2011, Cabot Industrial
246
2011 Annual Report
December 31, 2011
Notes to Financial Statements (cont'd)
Value Fund III, LP has drawn down approximately $3,256,000 which represents 43.4% of the commitment.
Subject to the terms of a Subscription Agreement between the Global Real Estate Portfolio and Cabot Industrial Value Fund III, LP, the Portfolio has made a subscription commitment of $7,500,000 for which it will receive 15,000 shares of common stock. As of December 31, 2011, Cabot Industrial Value Fund III, LP has drawn down approximately $3,256,000 which represents 43.4% of the commitment.
7. Redemption Fees: The following redemption fees are designed to protect each Portfolio and its shareholders from the effects of short-term trading. Shares of the Active International Allocation, Asian Equity, Emerging Markets, International Advantage, International Equity, International Opportunity, International Real Estate, International Small Cap, Small Company Growth and Emerging Markets Debt Portfolios redeemed within 30 days of purchase may be subject to a 2% redemption fee. These fees, if any, are included on the Statements of Changes in Net Assets.
8. Restricted Securities: Certain Portfolios invest in unregistered or otherwise restricted securities. The term "restricted securities" refers to securities that are unregistered or are held by control persons of the issuer and securities that are subject to contractual restrictions on their resale. As a result, restricted securities may be more difficult to value and the Portfolio may have difficulty disposing of such assets either in a timely manner or for a reasonable price. In order to dispose of an unregistered security, the Portfolio, where it has contractual rights to do so, may have to cause such security to be registered. A considerable period may elapse between the time the decision is made to sell the security and the time the security is registered so that the Portfolio could sell it. Contractual restrictions on the resale of securities vary in length and scope and are generally the result of a negotiation between the issuer and acquirer of the securities. The Portfolio would, in either case, bear market risks during that period. Restricted Securities are identified in the Portfolio of Investments.
9. Fair Value Measurement: FASB ASC 820, "Fair Value Measurements and Disclosures" ("ASC 820"), defines fair value as the value that the Fund would receive to sell an investment or pay to transfer a liability in a timely transaction with an independent buyer in the principal market, or in the absence of a principal market the most advantageous market for the investment or liability. ASC 820 establishes a three-tier hierarchy to distinguish between (1) inputs that reflect the assumptions market participants would use in valuing an asset or liability developed based on market data obtained from sources independent of the reporting entity (observable inputs) and (2) inputs that reflect the reporting entity's own assumptions about the assumptions market participants would use in valuing an asset or liability developed based on the best information available in the circumstances (unobservable inputs) and to establish classification of fair value measurements for disclosure purposes. Various inputs are used in determining the value of the Fund's investments. The inputs are summarized in the three broad levels listed below.
• Level 1 – unadjusted quoted prices in active markets for identical investments
• Level 2 – other significant observable inputs (including quoted prices for similar investments, interest rates, prepayment speeds, credit risk, etc.)
• Level 3 – significant unobservable inputs including the Fund's own assumptions in determining the fair value of investments. Factors considered in making this determination may include, but are not limited to, information obtained by contacting the issuer, analysts, or the appropriate stock exchange (for exchange-traded securities), analysis of the issuer's financial statements or other available documents and, if necessary, available information concerning other securities in similar circumstances
The inputs or methodology used for valuing securities are not necessarily an indication of the risk associated with investing in those securities and the determination of the significance of a particular input to the fair value measurement in its entirety requires judgment and considers factors specific to each security.
In May 2011, FASB issued Accounting Standards Update ("ASU") 2011-04. The amendments in this update are the results of the work of FASB and the International Accounting Standards Board to develop common requirements for measuring fair value and for disclosing information about fair value measurements, which are effective during interim and annual periods beginning after December 15, 2011. Consequently, these amendments improve the comparability of fair value measurements presented and disclosed in the financial statements prepared in accordance with GAAP and International Financial Reporting Standards. At this time, the Fund's management is evaluating the implications of ASU 2011-04.
247
2011 Annual Report
December 31, 2011
Notes to Financial Statements (cont'd)
10. Indemnifications: The Fund enters into contracts that contain a variety of indemnifications. The Fund's maximum exposure under these arrangements is unknown. However, the Fund has not had prior claims or losses pursuant to these contracts and expects the risk of loss to be remote.
11. Other: Security transactions are accounted for on the date the securities are purchased or sold. Realized gains (losses) on the sale of investment securities are determined on the specific identified cost basis. Dividend income and distributions are recorded on the ex-dividend date (except for certain foreign dividends which may be recorded as soon as the Fund is informed of such dividends) net of applicable withholding taxes. Interest income is recognized on the accrual basis except where collection is in doubt. Discounts and premiums on securities purchased are amortized according to the effective yield method over their respective lives. Most expenses of the Fund can be directly attributed to a particular Portfolio. Expenses which cannot be directly attributed are apportioned among the Portfolios based upon relative net assets or other appropriate measures. Income, expenses (other than class specific expenses) and realized and unrealized gains or losses are allocated to each class of shares based upon their relative net assets
Certain Portfolios own shares of real estate investment trusts ("REITs") which report information on the source of their distributions annually. A portion of distributions received from REITs during the year is estimated to be a return of capital and is recorded as a reduction of their cost.
B. Investment Advisory/Sub-Advisory Fees: Morgan Stanley Investment Management Inc. (the "Adviser" or "MS Investment Management"), a wholly-owned subsidiary of Morgan Stanley, provides the Fund with investment advisory services under the terms of an Investment Advisory Agreement (the "Agreement") at the annual rates of the average daily net assets indicated below.
| Portfolio | | Average Daily
Net Assets | | Advisory
Fee | |
| Active International Allocation | | first $1.0 billion | | | 0.65 | % | |
| | | over $1.0 billion | | | 0.60 | | |
| Asian Equity | | first $1.0 billion | | | 0.95 | | |
| | | over $1.0 billion | | | 0.90 | | |
| Emerging Markets | | first $500 million | | | 1.25 | | |
| | | next $500 million | | | 1.20 | | |
| | | next $1.5 billion | | | 1.15 | | |
| | | over $2.5 billion | | | 1.00 | | |
| Global Advantage | | first $1.0 billion | | | 0.90 | | |
| | | over $1.0 billion | | | 0.85 | | |
| Portfolio | | Average Daily
Net Assets | | Advisory
Fee | |
| Global Discovery | | first $1.0 billion | | | 0.90 | % | |
| | | over $1.0 billion | | | 0.85 | | |
| Global Franchise | | first $500 million | | | 0.80 | | |
| | | next $500 million | | | 0.75 | | |
| | | over $1.0 billion | | | 0.70 | | |
| Global Insight | | first $1.0 billion | | | 1.00 | | |
| | | over $1.0 billion | | | 0.95 | | |
| Global Opportunity | | first $750 million | | | 0.90 | | |
| | | next $750 million | | | 0.85 | | |
| | | over $1.5 billion | | | 0.80 | | |
| Global Real Estate* | | | | | | | 0.85 | | |
| International Advantage | | first $1.0 billion | | | 0.90 | | |
| | | over $1.0 billion | | | 0.85 | | |
| International Equity | | first $10 billion | | | 0.80 | | |
| | | over $10 billion | | | 0.75 | | |
| International Opportunity | | first $1.0 billion | | | 0.90 | | |
| | | over $1.0 billion | | | 0.85 | | |
| International Real Estate | | | | | | | 0.80 | | |
| International Small Cap | | first $1.5 billion | | | 0.95 | | |
| | | over $1.5 billion | | | 0.90 | | |
| Select Global Infrastructure | | | | | | | 0.85 | | |
| Advantage | | first $750 million | | | 0.75 | | |
| | | next $750 million | | | 0.70 | | |
| | | over $1.5 billion | | | 0.65 | | |
| Focus Growth | | first $1.0 billion | | | 0.50 | | |
| | | next $1.0 billion | | | 0.45 | | |
| | | next $1.0 billion | | | 0.40 | | |
| | | over $3.0 billion | | | 0.35 | | |
| Growth | | first $1.0 billion | | | 0.50 | | |
| | | next $1.0 billion | | | 0.45 | | |
| | | next $1.0 billion | | | 0.40 | | |
| | | over $3.0 billion | | | 0.35 | | |
| Insight | | first $750 million | | | 0.80 | | |
| | | next $750 million | | | 0.75 | | |
| | | over $1.5 billion | | | 0.70 | | |
| Opportunity | | first $1.0 billion | | | 0.50 | | |
| | | next $1.0 billion | | | 0.45 | | |
| | | next $1.0 billion | | | 0.40 | | |
| | | over $ 3.0 billion | | | 0.35 | | |
| Small Company Growth | | first $1.0 billion | | | 0.92 | | |
| | | next $500 million | | | 0.85 | | |
| | | over $1.5 billion | | | 0.80 | | |
| U.S. Real Estate | | first $500 million | | | 0.80 | | |
| | | next $500 million | | | 0.75 | | |
| | | over $1.0 billion | | | 0.70 | | |
| Emerging Markets Debt | | first $500 million | | | 0.75 | | |
| | | next $500 million | | | 0.70 | | |
| | | over $1.0 billion | | | 0.65 | | |
* Effective July 1, 2011 the investment advisory service fees were reduced to the annual rate based on average daily net assets as follows:
| Global Real Estate | | first $2.5 billion | | | 0.85 | % | |
| | | over $2.5 billion | | | 0.80 | | |
MS Investment Management has agreed to waive fees payable to it and to reimburse the Portfolios for certain expenses, after giving effect to custody fee offsets, if necessary, if the total annual operating expenses, excluding certain investment related
248
2011 Annual Report
December 31, 2011
Notes to Financial Statements (cont'd)
expenses, expressed as a percentage of average daily net assets, exceed the maximum ratios indicated as follows:
| | | Maximum Expense Ratio | |
| | | Class I | | Class P | | Class H | | Class L | |
| Active International Allocation* | | | 0.80 | % | | | 1.05 | % | | | N/A | | | | N/A | | |
| Asian Equity | | | 1.45 | | | | 1.70 | | | | 1.70 | % | | | 2.20 | % | |
| Emerging Markets | | | 1.65 | | | | 1.90 | | | | N/A | | | | N/A | | |
| Global Advantage | | | 1.30 | | | | 1.55 | | | | 1.55 | | | | 2.05 | | |
| Global Discovery | | | 1.35 | | | | 1.60 | | | | 1.60 | | | | 2.10 | | |
| Global Franchise | | | 1.00 | | | | 1.25 | | | | N/A | | | | N/A | | |
| Global Insight | | | 1.35 | | | | N/A | | | | 1.60 | | | | 2.10 | | |
| Global Opportunity | | | 1.25 | | | | 1.50 | | | | 1.50 | | | | 1.55 | | |
| Global Real Estate | | | 1.05 | | | | 1.30 | | | | 1.30 | | | | 1.80 | | |
| International Advantage | | | 1.25 | | | | 1.50 | | | | 1.50 | | | | 2.00 | | |
| International Equity | | | 0.95 | | | | 1.20 | | | | N/A | | | | N/A | | |
| International Opportunity | | | 1.15 | | | | 1.40 | | | | 1.40 | | | | 1.90 | | |
| International Real Estate | | | 1.00 | | | | 1.25 | | | | N/A | | | | N/A | | |
| International Small Cap | | | 1.15 | | | | 1.40 | | | | N/A | | | | N/A | | |
| Select Global Infrastructure | | | 1.15 | | | | 1.40 | | | | 1.40 | | | | 1.90 | | |
| Advantage | | | 1.05 | | | | 1.30 | | | | 1.30 | | | | 1.09 | | |
| Focus Growth | | | 1.00 | | | | 1.25 | | | | N/A | | | | N/A | | |
| Growth | | | 0.80 | | | | 1.05 | | | | N/A | | | | N/A | | |
| Insight | | | 1.05 | | | | N/A | | | | 1.30 | | | | 1.80 | | |
| Opportunity | | | 0.88 | | | | 1.13 | | | | 1.13 | | | | 1.63 | | |
| Small Company Growth | | | 1.05 | | | | 1.30 | | | | 1.30 | | | | 1.80 | | |
| U.S. Real Estate | | | 1.00 | | | | 1.25 | | | | 1.25 | | | | 1.75 | | |
| Emerging Markets Debt | | | 0.85 | | | | 1.10 | | | | 1.10 | | | | 1.60 | | |
* Effective July 1, 2011 the maximum expense ratio was increased to the annual rate expressed as a percentage of average daily net assets as follows:
| | | Class I | | Class P | | Class H | | Class L | |
| Active International Allocation | | | 0.90 | % | | | 1.15 | % | | | N/A | | | | N/A | | |
The fee waivers and/or expense reimbursements will continue for one year or until such time as the Fund's Board of Directors acts to discontinue all or a portion of such waivers and/or expense reimbursements when it deems that such action is appropriate. For the year ended December 31, 2011, the following Portfolios had advisory fees waived and/or certain expenses reimbursed as follows:
| Portfolio | | Advisory Fees
Waived and/or
Reimbursed
(000) | |
| Active International Allocation | | $ | 407 | | |
| Asian Equity | | | 152 | | |
| Global Advantage | | | 130 | | |
| Global Discovery | | | 115 | | |
| Global Franchise | | | 16 | | |
| Global Insight | | | 26 | | |
| Global Opportunity | | | 208 | | |
| Global Real Estate | | | 2 | | |
| International Advantage | | | 126 | | |
| International Equity | | | 1,356 | | |
| International Opportunity | | | 180 | | |
| International Small Cap | | | 153 | | |
| Select Global Infrastructure | | | 210 | | |
| Advantage | | | 162 | | |
| Focus Growth | | | 22 | | |
| Insight | | | 26 | | |
| Portfolio | | Advisory Fees
Waived and/or
Reimbursed
(000) | |
| Opportunity | | $ | 184 | | |
| Small Company Growth | | | 855 | | |
| U.S. Real Estate | | | 140 | | |
| Emerging Markets Debt | | | 238 | | |
The Adviser has entered into Sub-Advisory Agreements with Morgan Stanley Investment Management Limited and Morgan Stanley Investment Management Company (together, the "Sub-Advisers"), each a wholly-owned subsidiary of Morgan Stanley. The Sub-Advisers, subject to the control and supervision of the Fund, its Officers, Directors and the Adviser, and in accordance with the investment objectives, policies and restrictions of the Portfolios, make certain day-to-day investment decisions for certain Portfolios and place certain of the Portfolios' purchase and sales orders. The Adviser pays the Sub-Advisers on a monthly basis a portion of the net advisory fees the Adviser receives from the Portfolios which receive these services.
C. Administration Fees: MS Investment Management (the "Administrator") also provides the Fund with administrative services pursuant to an Administration Agreement for a monthly fee, which on an annual basis equals 0.08% of the average daily net assets of each Portfolio. Under a Sub-Administration Agreement between the Administrator and State Street Bank and Trust Company ("State Street"), State Street provides certain administrative services to the Fund. For such services, the Administrator pays State Street a portion of the fee the Administrator receives from the Fund.
D. Distribution and Shareholder Servicing Fees: Morgan Stanley Distribution, Inc. ("MSDI" or the "Distributor"), a wholly-owned subsidiary of the Adviser, and an indirect subsidiary of Morgan Stanley, serves as the Fund's Distributor of Portfolio shares pursuant to a Distribution agreement. The Fund had adopted Shareholder Service Plans with respect to Class P and Class H shares pursuant to Rule 12b-1 under the Act. Under the Shareholder Service Plans, each applicable Portfolio pays the Distributor a shareholder servicing fee, accrued daily and paid monthly, at an annual rate of 0.25% of the Portfolio's average daily net assets attributable to Class P and Class H shares.
The Fund has adopted a Distribution and Shareholder Services Plan with respect to Class L shares pursuant to Rule 12b-1 under the Act. Under the Distribution and Shareholder Services Plan, each applicable Portfolio pays the Distributor a distribution fee, accrued daily and paid monthly, at an annual rate of 0.50% and a shareholder service fee, accrued daily and paid monthly, at an annual rate of 0.25% of the Portfolio's average daily net assets attributable to Class L shares. The Distributor has agreed to waive for at least one year the 12b-1 fees on Class L shares of the Advantage Portfolio and the Global
249
2011 Annual Report
December 31, 2011
Notes to Financial Statements (cont'd)
Opportunity Portfolio to the extent it exceeds 0.04% and 0.30%, respectively, of the average daily net assets of such shares on an annualized basis. For the year ended December 31, 2011, the Advantage Portfolio waived approximately $1,000 and Global Opportunity Portfolio waived approximately $3,000.
The distribution and shareholder servicing fees are used to support the expenses associated with servicing and maintaining accounts. The Distributor may compensate other parties for providing shareholder support services to investors who purchase Class P, Class H and Class L shares.
E. Dividend Disbursing and Transfer Agent: The Fund's dividend disbursing and transfer agent is Morgan Stanley Services Company Inc. ("Morgan Stanley Services"). Pursuant to a transfer agency agreement, the Fund pays Morgan Stanley Services a fee based on the number of classes, accounts and transactions relating to the Portfolios of the Fund.
F. Custodian Fees: State Street (the "Custodian") serves as Custodian for the Fund in accordance with a custodian agreement. The Custodian holds cash, securities, and other assets of the Fund as required by the Act. Custody fees are payable monthly based on assets held in custody, investment purchases and sales activity and account maintenance fees, plus reimbursement for certain out-of-pocket expenses.
The Fund has entered into an arrangement with its Custodian whereby credits realized on uninvested cash balances were used to offset a portion of each Portfolio's expenses. If applicable, these custodian credits are shown as "Expense Offset" in the Statements of Operations.
G. Portfolio Investment Activity:
1. Security Transactions: For the year ended December 31, 2011, purchases and sales of investment securities, other than long-term U.S. Government securities and short-term investments, were:
| Portfolio | | Purchases
(000) | | Sales
(000) | |
| Active International Allocation | | $ | 97,894 | | | $ | 203,201 | | |
| Asian Equity | | | 639 | | | | 548 | | |
| Emerging Markets | | | 1,004,688 | | | | 1,529,106 | | |
| Global Advantage | | | 2,342 | | | | 889 | | |
| Global Discovery | | | 4,965 | | | | 2,260 | | |
| Global Franchise | | | 163,256 | | | | 50,308 | | |
| Global Insight* | | | 694 | | | | — | | |
| Global Opportunity | | | 6,984 | | | | 4,824 | | |
| Global Real Estate | | | 813,148 | | | | 407,817 | | |
| International Advantage | | | 1,206 | | | | 548 | | |
| International Equity | | | 1,417,070 | | | | 1,425,970 | | |
| International Opportunity | | | 2,427 | | | | 2,498 | | |
| International Real Estate | | | 58,175 | | | | 181,887 | | |
| International Small Cap | | | 239,644 | | | | 289,787 | | |
| Select Global Infrastructure | | | 6,878 | | | | 5,869 | | |
| Advantage | | | 3,467 | | | | 1,894 | | |
| Focus Growth | | | 13,877 | | | | 8,286 | | |
| Growth | | | 221,051 | | | | 225,852 | | |
| Portfolio | | Purchases
(000) | | Sales
(000) | |
| Insight* | | $ | 657 | | | $ | — | | |
| Opportunity | | | 59,105 | | | | 108,398 | | |
| Small Company Growth | | | 411,247 | | | | 701,379 | | |
| U.S. Real Estate | | | 193,358 | | | | 292,505 | | |
| Emerging Markets Debt | | | 87,587 | | | | 48,304 | | |
* For the period December 28, 2011 to December 31, 2011.
There were no purchases and sales of long-term U.S. Government securities for the year ended December 31, 2011.
2. Transactions with Affiliates: The Portfolios invest in the Institutional Class of the Morgan Stanley Institutional Liquidity Funds — (the "Liquidity Funds"), an open-end management investment company managed by the Adviser, both directly, and as a portion of the securities held as collateral on loaned securities. A summary of the Portfolio's transactions in shares of the Liquidity Funds during the year ended December 31, 2011 is as follows:
| Portfolio | | Value
December 31,
2010
(000) | | Purchases
at Cost
(000) | | Sales
(000) | | Dividend
Income
(000) | | Value
December 31,
2011
(000) | |
Active International
Allocation | | $ | 21,765 | | | $ | 184,692 | | | $ | 155,410 | | | $ | 27 | | | $ | 51,047 | | |
| Asian Equity | | | 128 | | | | 547 | | | | 500 | | | | — | @ | | | 175 | | |
| Emerging Markets | | | 107,751 | | | | 649,916 | | | | 620,055 | | | | 48 | | | | 137,612 | | |
| Global Advantage | | | 911 | | | | 1,700 | | | | 2,510 | | | | — | @ | | | 101 | | |
| Global Discovery | | | 960 | | | | 3,093 | | | | 3,919 | | | | — | @ | | | 134 | | |
| Global Franchise | | | 2,873 | | | | 135,451 | | | | 130,512 | | | | 2 | | | | 7,812 | | |
| Global Insight* | | | — | | | | 830 | | | | 327 | | | | — | @ | | | 503 | | |
| Global Opportunity | | | 101 | | | | 5,989 | | | | 5,802 | | | | — | @ | | | 288 | | |
| Global Real Estate | | | 35,380 | | | | 610,946 | | | | 601,101 | | | | 63 | | | | 45,225 | | |
International
Advantage | | | 503 | | | | 779 | | | | 1,282 | | | | — | @ | | | — | | |
| International Equity | | | 155,321 | | | | 1,208,635 | | | | 1,194,965 | | | | 127 | | | | 168,991 | | |
International
Opportunity | | | 65 | | | | 2,051 | | | | 2,044 | | | | — | @ | | | 72 | | |
International Real
Estate | | | 583 | | | | 90,601 | | | | 91,101 | | | | 3 | | | | 83 | | |
International
Small Cap | | | 9,956 | | | | 125,743 | | | | 126,478 | | | | 7 | | | | 9,221 | | |
Select Global
Infrastructure | | | 271 | | | | 4,775 | | | | 4,685 | | | | — | @ | | | 361 | | |
| Advantage | | | 95 | | | | 3,440 | | | | 3,149 | | | | — | @ | | | 386 | | |
| Focus Growth | | | 793 | | | | 17,503 | | | | 16,569 | | | | 2 | | | | 1,727 | | |
| Growth | | | 48,692 | | | | 164,612 | | | | 200,395 | | | | 25 | | | | 12,909 | | |
| Insight* | | | — | | | | 830 | | | | — | | | | — | @ | | | 830 | | |
| Opportunity | | | 3,180 | | | | 79,005 | | | | 80,560 | | | | 3 | | | | 1,625 | | |
Small Company
Growth | | | 44,047 | | | | 562,249 | | | | 574,752 | | | | 51 | | | | 31,544 | | |
| U.S. Real Estate | | | 35,795 | | | | 158,883 | | | | 189,999 | | | | 30 | | | | 4,679 | | |
Emerging Markets
Debt | | | 4,671 | | | | 71,492 | | | | 63,493 | | | | 13 | | | | 12,670 | | |
@ Amount is less than $500.
* For the period December 28, 2011 to December 31, 2011.
Investment Advisory fees paid by each Portfolio are reduced by an amount equal to its pro-rata share of the advisory and administration fees paid by the Portfolios due to its investment in the Liquidity Funds ("Rebate"). For the
250
2011 Annual Report
December 31, 2011
Notes to Financial Statements (cont'd)
year ended December 31, 2011, advisory fees paid were reduced as follows:
| Portfolio | | Rebate
(000) | |
| Active International Allocation | | $ | 26 | | |
| Asian Equity | | | — | @ | |
| Emerging Markets | | | 69 | | |
| Global Advantage | | | — | @ | |
| Global Discovery | | | — | @ | |
| Global Franchise | | | 9 | | |
| Global Opportunity | | | — | @ | |
| Global Real Estate | | | 58 | | |
| International Advantage | | | — | @ | |
| International Equity | | | 131 | | |
| International Opportunity | | | — | @ | |
| International Real Estate | | | 3 | | |
| International Small Cap | | | 7 | | |
| Select Global Infrastructure | | | — | @ | |
| Advantage | | | — | @ | |
| Focus Growth | | | 2 | | |
| Growth | | | 26 | | |
| Opportunity | | | 3 | | |
| Small Company Growth | | | 51 | | |
| U.S. Real Estate | | | 27 | | |
| Emerging Markets Debt | | | 13 | | |
@ Amount is less than $500
The Emerging Markets Portfolio invests in Morgan Stanley Growth Fund, an open-end management investment company advised by an affiliate of the Adviser. The Morgan Stanley Growth Fund has a cost basis of approximately $1,667,000 at December 31, 2011. Advisory fees paid by the Portfolio are reduced by an amount equal to its pro-rata share of the advisory and administration fees paid by the Morgan Stanley Growth Fund. For the year ended December 31, 2011, advisory fees paid were reduced by approximately $156,000 relating to the Portfolio's investment in the Morgan Stanley Growth Fund.
A summary of the Portfolio's transactions in shares of the Morgan Stanley Growth Fund during the year ended December 31, 2011 is as follows:
Value
December 31,
2010
(000) | | Purchases
at Cost
(000) | | Sales
(000) | | Realized
Gain/Loss
(000) | | Dividend
Income
(000) | | Value
December 31,
2011
(000) | |
| $ | 21,813 | | | $ | — | | | $ | 6,434 | | | $ | 5,322 | | | $ | — | | | $ | 7,822 | | |
The Active International Allocation Portfolio invests in Mitsubishi UFJ Financial Group, Inc., an affiliate of the Adviser, Sub-Advisers, Administrator and Distributor. Mitsubishi UFJ Financial Group, Inc. was acquired at a cost of approximately $2,647,000.
A summary of the Portfolio's transactions in shares of the Mitsubishi UFJ Financial Group, Inc. during the year ended December 31, 2011 is as follows:
Value
December 31,
2010
(000) | | Purchases
at Cost
(000) | | Sales
(000) | | Realized
Gain/Loss
(000) | | Dividend
Income
(000) | | Value
December 31,
2011
(000) | |
| $ | 1,371 | | | $ | — | | | $ | 74 | | | $ | (81 | ) | | $ | 33 | | | $ | 1,018 | | |
During the year ended December 31, 2011, the following Portfolios incurred brokerage commissions with Morgan Stanley & Co., LLC, an affiliate of the Adviser, Sub-Advisers, Administrator and Distributor, for portfolio transactions executed on behalf of each Portfolio:
| Portfolio | | Broker
Commissions
(000) | |
| Asian Equity | | $ | — | @ | |
| Emerging Markets | | | 69 | | |
| Global Advantage | | | — | @ | |
| Global Discovery | | | — | @ | |
| Global Franchise | | | — | @ | |
| Global Opportunity | | | — | @ | |
| Global Real Estate | | | 37 | | |
| International Advantage | | | — | @ | |
| International Opportunity | | | — | @ | |
| Select Global Infrastructure | | | — | @ | |
| Advantage | | | — | @ | |
| Focus Growth | | | 1 | | |
| Opportunity Portfolio | | | 14 | | |
| Small Company Growth | | | 7 | | |
| U.S. Real Estate | | | 28 | | |
@ Amount is less than $500
During the year ended December 31, 2011, the following Portfolios incurred brokerage commissions with Citigroup, Inc. and its affiliated broker/dealers, which may be deemed affiliates of the Adviser, Sub-Advisers, Administrator and Distributor under Section 17 of the Act, for portfolio transactions executed on behalf of each Portfolio:
| Portfolio | | Broker
Commissions
(000) | |
| Active International Allocation | | $ | 3 | | |
| Asian Equity | | | — | @ | |
| Emerging Markets | | | 268 | | |
| Global Franchise | | | 5 | | |
| Global Real Estate | | | 23 | | |
| International Equity | | | 120 | | |
| International Real Estate | | | 9 | | |
| International Small Cap | | | 3 | | |
| Select Global Infrastructure | | | 2 | | |
| Focus Growth | | | — | @ | |
| Growth | | | — | @ | |
| Small Company Growth | | | 10 | | |
| U.S. Real Estate | | | 2 | | |
@ Amount is less than $500.
251
2011 Annual Report
December 31, 2011
Notes to Financial Statements (cont'd)
H. Federal Income Taxes: It is each Portfolio's intention to continue to qualify as a regulated investment company and distribute all of its taxable and tax-exempt income. Accordingly, no provision for Federal income taxes is required in the financial statements. Dividend income and distributions to shareholders are recorded on the ex-dividend date.
A Portfolio may be subject to taxes imposed by countries in which it invests. Such taxes are generally based on income and/or capital gains earned or repatriated. Taxes are accrued based on net investment income, net realized gains and net unrealized appreciation as such income and/or gains are earned. Taxes may also be based on transactions in foreign currency and are accrued based on the value of investments denominated in such currency.
FASB ASC 740-10 "Income Taxes — Overall" sets forth a minimum threshold for financial statement recognition of the benefit of a tax position taken or expected to be taken in a tax return. Management has concluded there are no significant uncertain tax positions that would require recognition in the financial statements. If applicable, the Portfolios recognize interest accrued related to unrecognized tax benefits in "Interest Expense" and penalties in "Other Expenses" in the Statements of Operations. The Portfolios file tax returns with the U.S. Internal Revenue Service, New York and various states. Each of the tax years in the four-year period ended December 31, 2011, remains subject to examination by taxing authorities.
The tax character of distributions paid may differ from the character of distributions shown in the Statements of Changes in Net Assets due to short-term capital gains being treated as ordinary income for tax purposes. The tax character of distributions paid during fiscal 2011 and 2010 was as follows:
| | | 2011
Distributions
Paid From: | | 2010
Distributions
Paid From: | |
| Portfolio | | Ordinary
Income
(000) | | Long-term
Capital Gain
(000) | | Ordinary
Income
(000) | | Long-term
Capital Gain
(000) | |
| Active International Allocation | | $ | 6,935 | | | $ | — | | | $ | 9,151 | | | $ | — | | |
| Emerging Markets | | | — | | | | 25,277 | | | | 16,513 | | | | — | | |
| Global Advantage | | | 16 | | | | — | | | | — | | | | — | | |
| Global Discovery | | | 47 | | | | — | | | | — | | | | — | | |
| Global Franchise | | | 3,615 | | | | 2,396 | | | | 2,936 | | | | — | | |
| Global Opportunity | | | 211 | | | | 738 | | | | — | | | | — | | |
| Global Real Estate | | | 28,756 | | | | — | | | | 23,862 | | | | — | | |
| International Advantage | | | 42 | | | | — | | | | — | | | | — | | |
| International Equity | | | 94,031 | | | | — | | | | 60,000 | | | | — | | |
| International Opportunity | | | 106 | | | | 218 | | | | — | | | | — | | |
| International Real Estate | | | 9,425 | | | | — | | | | 13,160 | | | | — | | |
| International Small Cap | | | — | | | | — | | | | 1,418 | | | | — | | |
| Select Global Infrastructure | | | 612 | | | | — | | | | 82 | | | | — | | |
| Advantage | | | 47 | | | | — | | | | 18 | | | | — | | |
| Growth | | | 1,728 | | | | — | | | | 15 | | | | — | | |
| Small Company Growth | | | — | | | | 25,870 | | | | — | | | | — | | |
| U.S. Real Estate | | | 8,410 | | | | — | | | | 12,294 | | | | — | | |
| Emerging Markets Debt | | | 3,852 | | | | 949 | | | | 4,823 | | | | 68 | | |
The amount and character of income and gains to be distributed are determined in accordance with income tax regulations which may differ from GAAP. These book/tax differences are either considered temporary or permanent in nature.
Temporary differences are attributable to differing book and tax treatments for the timing of the recognition of gains (losses) on certain investment transactions and the timing of the deductibility of certain expenses.
Permanent differences, primarily due to differing treatments of gains (losses) related to REIT adjustments, foreign currency transactions, defaulted bonds, paydown adjustments, return of capital from certain securities, expiring capital losses, distribution redesignations, foreign taxes paid on capital gains, net operating losses, nondeductible expenses, merger adjustments, certain equity securities designated as issued by "passive foreign investment companies" and excess distributions, resulted in the following reclassifications among the Portfolios' components of net assets at December 31, 2011:
| Portfolio | | Accumulated
Undistributed
(Distributions
in Excess of) Net
Investment
Income (Loss)
(000) | | Accumulated
Net Realized
Gain (Loss)
(000) | | Paid-in
Capital
(000) | |
| Active International Allocation | | $ | (3,033 | ) | | $ | 3,034 | | | $ | (1 | ) | |
| Asian Equity | | | 1 | | | | 1 | | | | (2 | ) | |
| Emerging Markets | | | (3,952 | ) | | | 4,370 | | | | (418 | ) | |
| Global Advantage | | | (1 | ) | | | 1 | | | | — | | |
| Global Discovery | | | 8 | | | | (8 | ) | | | — | @ | |
| Global Franchise | | | 252 | | | | (251 | ) | | | (1 | ) | |
| Global Insight | | | (— | @) | | | — | @ | | | — | | |
| Global Opportunity | | | 37 | | | | 1 | | | | (38 | ) | |
| Global Real Estate | | | 8,717 | | | | (8,479 | ) | | | (238 | ) | |
| International Advantage | | | — | @ | | | (— | @) | | | — | | |
| International Equity | | | (3,140 | ) | | | 3,140 | | | | — | | |
| International Opportunity | | | (1 | ) | | | 2 | | | | (1 | ) | |
| International Real Estate | | | 1,642 | | | | (1,642 | ) | | | — | | |
| International Small Cap | | | (2,123 | ) | | | 2,123 | | | | — | @ | |
| Select Global Infrastructure | | | (— | @) | | | — | @ | | | — | | |
| Advantage | | | (— | @) | | | — | @ | | | (— | @) | |
| Focus Growth | | | 74 | | | | (1 | ) | | | (73 | ) | |
| Growth | | | 1 | | | | (1 | ) | | | — | | |
| Insight | | | (— | @) | | | — | | | | — | @ | |
| Opportunity | | | 903 | | | | 47 | | | | (950 | ) | |
| Small Company Growth | | | 4,652 | | | | 722 | | | | (5,374 | ) | |
| U.S. Real Estate | | | 2,209 | | | | 902 | | | | (3,111 | ) | |
| Emerging Markets Debt | | | (669 | ) | | | 669 | | | | — | @ | |
@ Amount is less than $500
252
2011 Annual Report
December 31, 2011
Notes to Financial Statements (cont'd)
At December 31, 2011, the components of distributable earnings on a tax basis were as follows:
| Portfolio | | Undistributed
Ordinary
Income
(000) | | Undistributed
Long-term
Capital Gain
(000) | |
| Global Discovery | | $ | 16 | | | $ | — | | |
| Global Insight | | | 1 | | | | — | | |
| Global Opportunity | | | — | | | | 44 | | |
| International Equity | | | 729 | | | | — | | |
| International Real Estate | | | 5,344 | | | | — | | |
| International Small Cap | | | 2,527 | | | | — | | |
| Select Global Infrastructure | | | — | | | | 91 | | |
| Growth | | | 35 | | | | — | | |
| Small Company Growth | | | — | | | | 3,808 | | |
| U.S. Real Estate | | | 335 | | | | — | | |
| Emerging Markets Debt | | | — | | | | 15 | | |
Any Portfolios not shown above had no distributable earnings on a tax basis at December 31, 2011.
At December 31, 2011, cost, unrealized appreciation, unrealized depreciation, and net unrealized appreciation (depreciation) for U.S. Federal income tax purposes of the investments of each of the Portfolios were:
| Portfolio | | Cost
(000) | | Appreciation
(000) | | Depreciation
(000) | | Net
Appreciation
(Depreciation)
(000) | |
Active International
Allocation | | $ | 375,913 | | | $ | 26,271 | | | $ | (66,642 | ) | | $ | (40,371 | ) | |
| Asian Equity | | | 1,682 | | | | 49 | | | | (208 | ) | | | (159 | ) | |
| Emerging Markets | | | 1,353,511 | | | | 152,234 | | | | (117,361 | ) | | | 34,873 | | |
| Global Advantage | | | 2,647 | | | | 156 | | | | (141 | ) | | | 15 | | |
| Global Discovery | | | 4,006 | | | | 201 | | | | (462 | ) | | | (261 | ) | |
| Global Franchise | | | 207,498 | | | | 25,035 | | | | (5,649 | ) | | | 19,386 | | |
| Global Insight | | | 1,198 | | | | 7 | | | | (2 | ) | | | 5 | | |
| Global Opportunity | | | 11,609 | | | | 2,526 | | | | (530 | ) | | | 1,996 | | |
| Global Real Estate | | | 1,703,013 | | | | 73,531 | | | | (300,564 | ) | | | (227,033 | ) | |
| International Advantage | | | 2,164 | | | | 106 | | | | (185 | ) | | | (79 | ) | |
| International Equity | | | 4,058,834 | | | | 363,435 | | | | (436,681 | ) | | | (73,246 | ) | |
| International Opportunity | | | 5,549 | | | | 748 | | | | (524 | ) | | | 224 | | |
| International Real Estate | | | 405,765 | | | | 1,015 | | | | (196,132 | ) | | | (195,117 | ) | |
| International Small Cap | | | 378,009 | | | | 10,071 | | | | (89,224 | ) | | | (79,153 | ) | |
| Select Global Infrastructure | | | 11,449 | | | | 1,595 | | | | (191 | ) | | | 1,404 | | |
| Advantage | | | 7,298 | | | | 1,387 | | | | (257 | ) | | | 1,130 | | |
| Focus Growth | | | 24,079 | | | | 2,912 | | | | (2,977 | ) | | | (65 | ) | |
| Growth | | | 642,208 | | | | 228,712 | | | | (92,092 | ) | | | 136,620 | | |
| Insight | | | 1,487 | | | | 7 | | | | (2 | ) | | | 5 | | |
| Opportunity | | | 210,206 | | | | 62,341 | | | | (26,354 | ) | | | 35,987 | | |
| Small Company Growth | | | 1,213,395 | | | | 326,810 | | | | (138,837 | ) | | | 187,973 | | |
| U.S. Real Estate | | | 824,573 | | | | 126,913 | | | | (52,664 | ) | | | 74,249 | | |
| Emerging Markets Debt | | | 88,095 | | | | 1,863 | | | | (7,550 | ) | | | (5,687 | ) | |
On December 22, 2010, the Regulated Investment Company Modernization Act of 2010 (the "Modernization Act") was signed into law. The Modernization Act modernizes several tax provisions related to Regulated Investment Companies ("RICs") and their shareholders. One key change made by the Modernization Act is that capital losses will generally retain their character as short-term or long-term and may be carried forward indefinitely to offset future gains. These losses are utilized before other capital loss carryforwards that expire. Generally, the Modernization Act is effective for taxable years beginning after December 22, 2010.
At December 31, 2011, the following Portfolios had available for Federal income tax purposes unused short term and long term capital losses that will not expire:
| Portfolio | | Short-term Losses
(No Expiration)
(000) | | Long-term Losses
(No Expiration)
(000) | |
| Asian Equity | | $ | 55 | | | $ | — | | |
| Global Advantage | | | 1 | | | | — | | |
| International Real Estate | | | 3,549 | | | | 88,205 | | |
In addition, at December 31, 2011, the following Portfolios had available capital loss carryforwards to offset future net capital gains, to the extent provided by regulations, through the indicated expiration dates:
| | | Expiration Date December 31, | |
| Portfolio | | 2012
(000) | | 2016
(000) | | 2017
(000) | | 2018
(000) | | Total
(000) | |
| Active International Allocation | | $ | — | | | $ | — | | | $ | 55,336 | | | $ | — | | | $ | 55,336 | | |
| Global Franchise* | | | — | | | | — | | | | 3,809 | | | | — | | | | 3,809 | | |
| Global Real Estate | | | — | | | | — | | | | 130,652 | | | | 41,571 | | | | 172,223 | | |
| International Equity | | | — | | | | 392,794 | | | | 10,156 | | | | — | | | | 402,950 | | |
| International Real Estate | | | — | | | | 98,798 | | | | 217,627 | | | | 66,872 | | | | 383,297 | | |
| International Small Cap | | | — | | | | — | | | | 66,323 | | | | — | | | | 66,323 | | |
| Advantage | | | — | | | | — | | | | 32 | | | | — | | | | 32 | | |
| Focus Growth | | | — | | | | — | | | | 88 | | | | — | | | | 88 | | |
| Growth | | | — | | | | — | | | | 90,712 | | | | — | | | | 90,712 | | |
| Opportunity | | | — | | | | 8,138 | | | | — | | | | — | | | | 8,138 | | |
| Small Company Growth* | | | — | | | | 2,198 | | | | 452 | | | | — | | | | 2,650 | | |
| U.S. Real Estate | | | — | | | | — | | | | 3,508 | | | | — | | | | 3,508 | | |
* Capital loss carryforward from target fund.
The amounts reflected in the capital loss carryforward table for Global Franchise Portfolio includes approximately $7,795,000 capital loss carryforward brought forward as a result of the Portfolio's merger with the Global Value Equity Portfolio in October 2009. Based on certain provisions in the Internal Revenue Code, various limitations regarding the future utilization of these carryforwards may apply. This acquired capital loss carryforward is expected to expire in 2017. During the year ended December 31, 2011, Global Franchise utilized approximately $3,986,000 of its capital loss carryforward.
The amounts reflected in the capital loss carryforward table for Small Company Growth Portfolio includes approximately $2,650,000 capital loss carryforward brought forward as a result of the Portfolio's merger with the Morgan Stanley Special
253
2011 Annual Report
December 31, 2011
Notes to Financial Statements (cont'd)
Growth Fund in November 2011. Based on certain provisions in the Internal Revenue Code, various limitations regarding the future utilization of these carryforwards may apply. The acquired capital loss carryforward is expected to expire in 2016 and 2017.
During the year ended December 31, 2011, the following Portfolios utilized capital loss carryforwards for U.S. Federal income tax purposes as follows:
| Portfolio | | Utilized Capital
Loss Carryforwards
(000) | |
| Active International Allocation | | $ | 15,840 | | |
| Emerging Markets | | | 68,600 | | |
| Global Franchise | | | 3,986 | | |
| Global Real Estate | | | 79,396 | | |
| International Equity | | | 68,754 | | |
| International Opportunity | | | 23 | | |
| International Small Cap | | | 24,747 | | |
| Advantage | | | 122 | | |
| Focus Growth | | | 1,400 | | |
| Growth | | | 76,743 | | |
| Opportunity | | | 24,742 | | |
| Small Company Growth | | | 20,205 | | |
| U.S. Real Estate | | | 87,445 | | |
To the extent that capital loss carryovers are used to offset any future capital gains realized during the carryover period as provided by U.S. Federal income tax regulations, no capital gains tax liability will be incurred by a Portfolio for gains realized and not distributed. To the extent that capital gains are offset, such gains will not be distributed to the shareholders.
Capital losses and specified ordinary losses, including currency losses, incurred after October 31 but within the taxable year are deemed to arise on the first day of the Portfolio's next taxable year. For the year ended December 31, 2011, the Portfolio deferred to January 1, 2012 for U.S. Federal income tax purposes the following losses:
| Portfolio | | Specified Ordinary
Losses
(000) | | Capital
Losses
(000) | |
| Active International Allocation | | $ | 2,015 | | | $ | 3,937 | | |
| Asian Equity | | | — | @ | | | 13 | | |
| Emerging Markets | | | 3,378 | | | | 563 | | |
| Global Advantage | | | 5 | | | | — | | |
| Global Franchise | | | — | | | | 448 | | |
| Global Opportunity | | | — | | | | 114 | | |
| Global Real Estate | | | 2,221 | | | | — | | |
| International Advantage | | | — | | | | 6 | | |
| International Opportunity | | | — | | | | 64 | | |
| International Real Estate | | | — | | | | 5,904 | | |
| International Small Cap | | | — | | | | 1,205 | | |
| Select Global Infrastructure | | | — | | | | 2 | | |
| Advantage | | | 16 | | | | — | | |
| Focus Growth | | | — | | | | 196 | | |
| Opportunity | | | 12 | | | | 2,494 | | |
| Small Company Growth | | | 15 | | | | — | | |
| Emerging Markets Debt | | | 28 | | | | — | | |
@ Amount is less than $500.
I. Other (unaudited): The net assets of certain Portfolios include foreign denominated securities and currency. Changes in currency exchange rates will affect the U.S. dollar value of and investment income from such securities. Further, at times certain of the Portfolios' investments are concentrated in a limited number of countries and regions. This concentration may further increase the risk of the Portfolio.
Global Real Estate, International Real Estate and U.S. Real Estate Portfolios invest a significant portion of their assets in securities of real estate investment trusts (REITs). The market's perception of prospective declines in private real estate values and other financial assets may result in increased volatility of market prices that can negatively impact the valuation of certain issuers held by the Portfolios.
The Emerging Markets Debt Portfolio holds a significant portion of its investments in securities which are traded by a small number of market makers who may also be utilized by the Portfolio to provide pricing information used to value such investments. The amounts realized upon disposition of these securities may differ from the value reflected on the Statements of Assets and Liabilities.
Settlement and registration of foreign securities transactions may be subject to significant risks not normally associated with investments in the United States. In certain markets, including Russia, ownership of shares is defined according to entries in the issuer's share register. In Russia, currently no central registration system exists and the share registrars may not be subject to effective state supervision. It is possible that a Portfolio could lose its share registration through fraud, negligence or even mere oversight. In addition, shares being delivered for sales and cash being paid for purchases may be delivered before the exchange is complete. This may subject the Portfolio to further risk of loss in the event of counterparty's failure to complete the transaction.
254
2011 Annual Report
December 31, 2011
Notes to Financial Statements (cont'd)
At December 31, 2011, certain Portfolios had otherwise unaffiliated record owners of 10% or greater. Investment activities of these shareholders could have a material impact on these Portfolios.
These Portfolios and the aggregate percentage of such owners were as follows:
| | | Percentage of Ownership | |
| Portfolio | | Class I | | Class P | | Class H | | Class L | |
| Active International Allocation | | | — | % | | | 15.2 | % | | | — | % | | | — | % | |
| Emerging Markets | | | 62.2 | | | | 66.8 | | | | — | | | | — | | |
| Global Advantage | | | — | | | | — | | | | 22.5 | | | | — | | |
| Global Discovery | | | — | | | | — | | | | 30.2 | | | | — | | |
| Global Franchise | | | 55.0 | | | | 51.2 | | | | — | | | | — | | |
| Global Insight | | | — | | | | — | | | | 98.8 | | | | — | | |
| Global Opportunity | | | 43.7 | | | | — | | | | — | | | | 33.3 | | |
| Global Real Estate | | | — | | | | 85.4 | | | | 52.8 | | | | — | | |
| International Equity | | | 35.1 | | | | 86.4 | | | | — | | | | — | | |
| International Real Estate | | | 83.9 | | | | — | | | | — | | | | — | | |
| International Small Cap | | | 74.5 | | | | 98.0 | | | | — | | | | — | | |
| Advantage | | | 27.7 | | | | — | | | | — | | | | 24.0 | | |
| Focus Growth | | | 65.7 | | | | 70.8 | | | | — | | | | — | | |
| Growth | | | 45.4 | | | | 69.9 | | | | — | | | | — | | |
| Insight | | | — | | | | — | | | | 98.8 | | | | — | | |
| Opportunity | | | 67.8 | | | | 99.5 | | | | — | | | | 10.7 | | |
| Small Company Growth | | | 37.3 | | | | 64.2 | | | | — | | | | — | | |
| U.S. Real Estate | | | 32.7 | | | | 66.9 | | | | — | | | | — | | |
| Emerging Markets Debt | | | 76.5 | | | | 61.0 | | | | — | | | | — | | |
255
2011 Annual Report
December 31, 2011
Report of Independent Registered Public Accounting Firm
To the Shareholders and Board of Directors of
Morgan Stanley Institutional Fund, Inc.
We have audited the accompanying statements of assets and liabilities of Active International Allocation Portfolio, Asian Equity Portfolio, Emerging Markets Portfolio, Global Advantage Portfolio, Global Discovery Portfolio, Global Franchise Portfolio, Global Opportunity Portfolio, Global Real Estate Portfolio, International Advantage Portfolio, International Equity Portfolio, International Opportunity Portfolio, International Real Estate Portfolio, International Small Cap Portfolio, Select Global Infrastructure Portfolio, Advantage Portfolio, Focus Growth Portfolio, Growth Portfolio (formerly Capital Growth Portfolio), Opportunity Portfolio, Small Company Growth Portfolio, U.S. Real Estate Portfolio, and Emerging Markets Debt Portfolio, including the portfolios of investments, as of December 31, 2011, and the related statements of operations for the year then ended, the statements of changes in net assets and the financial highlights for each of the periods indicated therein. We have also audited the accompanying statements of assets and liabilities, including the portfolios of investments as of December 31, 2011 and the related statements of operations and changes in net assets, and the financial highlights for the period from December 28, 2011 (commencement of operations) to December 31, 2011 for Global Insight Portfolio and Insight Portfolio. The aforementioned twenty-three portfolios of the Morgan Stanley Institutional Fund, Inc. are hereafter referred to as the Portfolios. These financial statements and financial highlights are the responsibility of the Portfolios' management. Our responsibility is to express an opinion on these financial statements and financial highlights based on our audits. The financial highlights for years ended June 30, 2009, 2008 and 2007 for Opportunity Portfolio were audited by another independent registered public accounting firm whose report, dated August 21, 2009, expressed an unqualified opinion on those financial highlights.
We conducted our audits in accordance with the standards of the Public Company Accounting Oversight Board (United States). Those standards require that we plan and perform the audit to obtain reasonable assurance about whether the financial statements and financial highlights are free of material misstatement. We were not engaged to perform an audit of the Portfolios' internal control over financial reporting. Our audits included consideration of internal control over financial reporting as a basis for designing audit procedures that are appropriate in the circumstances, but not for the purpose of expressing an opinion on the effectiveness of the Portfolios' internal control over financial reporting. Accordingly, we express no such opinion. An audit also includes examining, on a test basis, evidence supporting the amounts and disclosures in the financial statements and financial highlights, assessing the accounting principles used and significant estimates made by management, and evaluating the overall financial statement presentation. Our procedures included confirmation of securities owned as of December 31, 2011, by correspondence with the custodian and others or by other appropriate auditing procedures where replies from others were not received. We believe that our audits provide a reasonable basis for our opinion.
In our opinion, the financial statements and financial highlights referred to above present fairly, in all material respects, the financial position of the aforementioned twenty-three portfolios comprising Morgan Stanley Institutional Fund, Inc. at December 31, 2011, the results of their operations, the changes in their net assets and the financial highlights for each of the periods indicated therein, in conformity with U.S. generally accepted accounting principles.

Boston, Massachusetts
February 24, 2012
256
2011 Annual Report
December 31, 2011
Federal Income Tax Information (unaudited)
For Federal income tax purposes, the following information is furnished with respect to the distributions paid by each applicable Portfolio during the taxable year ended December 31, 2011. For corporate shareholders, the following percentages of dividends paid by each Portfolio qualified for the dividends received deduction. Additionally, the following percentages of each Portfolio's dividends was attributable to qualifying U.S. Government obligations. (Please consult your tax advisor to determine if any portion of the dividends you received is exempt from state income tax.)
| Portfolio | | Dividends Received
Deduction % | | Qualifying U.S.
Govt. Income % | |
| Global Advantage | | | 45.6 | % | | | — | % | |
| Global Discovery | | | 15.8 | | | | — | | |
| Global Franchise | | | 44.0 | | | | — | | |
| Global Opportunity | | | 4.9 | | | | — | | |
| Select Global Infrastructure | | | 16.7 | | | | — | | |
| Advantage | | | 100.0 | | | | — | | |
| Growth | | | 100.0 | | | | — | | |
Each of the applicable Portfolios designated and paid the following amounts as a long-term capital gain distribution:
| Portfolio | | Amount
(000) | |
| Emerging Markets | | $ | 25,277 | | |
| Global Franchise | | | 2,396 | | |
| Global Opportunity | | | 738 | | |
| International Opportunity | | | 218 | | |
| Small Company Growth | | | 25,870 | | |
| Emerging Markets Debt | | | 949 | | |
For Federal income tax purposes, the following information is furnished with respect to the earnings of each applicable Portfolio for the taxable year ended December 31, 2011.
When distributed, certain earnings may be subject to a maximum rate of 15% as provided for the Jobs and Growth Tax Relief Reconciliation Act of 2004. Each of the applicable Portfolios designated up to the following maximum amounts as taxable at this lower rate:
| Portfolio | | Amount
(000) | |
| Active International Allocation | | $ | 6,774 | | |
| Global Advantage | | | 17 | | |
| Global Discovery | | | 50 | | |
| Global Franchise | | | 3,864 | | |
| Global Opportunity | | | 81 | | |
| Global Real Estate | | | 4,663 | | |
| International Equity | | | 92,860 | | |
| International Opportunity | | | 80 | | |
| International Real Estate | | | 5,191 | | |
| Select Global Infrastructure | | | 356 | | |
| Advantage | | | 48 | | |
| Growth | | | 1,730 | | |
| U.S. Real Estate | | | 532 | | |
257
2011 Annual Report
December 31, 2011
Federal Income Tax Information (unaudited) (cont'd)
The following Portfolios intend to pass through foreign tax credits and have derived net income from sources within foreign countries amounting to:
| Portfolio | | Foreign Tax
Credits
(000) | | Net Foreign
Source Income
(000) | |
| Active International Allocation | | $ | 423 | | | $ | 13,474 | | |
| Emerging Markets | | | 4,260 | | | | 43,666 | | |
| Global Franchise | | | 146 | | | | 3,442 | | |
| Global Real Estate | | | 1,594 | | | | 31,087 | | |
| International Equity | | | 3,807 | | | | 143,813 | | |
| International Real Estate | | | 411 | | | | 11,003 | | |
| International Small Cap | | | 607 | | | | 9,926 | | |
| Select Global Infrastructure | | | 26 | | | | 303 | | |
In January, each applicable Portfolio provides tax information to shareholders for the preceding calendar year.
258
2011 Annual Report
December 31, 2011
U.S. Privacy Policy (unaudited)
AN IMPORTANT NOTICE CONCERNING OUR U.S. PRIVACY POLICY
This privacy notice describes the U.S. privacy policy of Morgan Stanley Distribution, Inc., and the Morgan Stanley family of mutual funds ("us", "our", "we").
We are required by federal law to provide you with notice of our U.S. privacy policy ("Policy"). This Policy applies to both our current and former clients unless we state otherwise and is intended for individual clients who purchase products or receive services from us for personal, family or household purposes. This Policy is not applicable to partnerships, corporations, trusts or other non-individual clients or account holders, nor is this Policy applicable to individuals who are either beneficiaries of a trust for which we serve as trustee or participants in an employee benefit plan administered or advised by us. This Policy is, however, applicable to individuals who select us to be a custodian of securities or assets in individual retirement accounts, 401(k) accounts, or accounts subject to the Uniform Gifts to Minors Act.
This notice sets out our business practices to protect your privacy; how we collect and share personal information about you; and how you can limit our sharing or certain uses by others of this information. We may amend this Policy at any time, and will inform you of any changes to our Policy as required by law.
WE RESPECT YOUR PRIVACY
We appreciate that you have provided us with your personal financial information and understand your concerns about your information. We strive to safeguard the information our clients entrust to us. Protecting the confidentiality and security of client information is an important part of how we conduct our business.
This notice describes what personal information we collect about you, how we collect it, when we may share it with others, and how certain others may use it. It discusses the steps you may take to limit our sharing of certain information about you with our affiliated companies, including, but not limited to our affiliated banking businesses, brokerage firms and credit service affiliates. It also discloses how you may limit our affiliates' use of shared information for marketing purposes.
Throughout this Policy, we refer to the nonpublic information that personally identifies you as "personal information." We also use the term "affiliated company" in this notice. An affiliated company is a company in our family of companies and includes companies with the Morgan Stanley name. These affiliated companies are financial institutions such as broker-dealers, banks, investment advisers and credit card issuers. We refer to any company that is not an affiliated company as a nonaffiliated third party. For purposes of Section 5 of this notice, and your ability to limit certain uses of personal information by our affiliates, this notice applies to the use of personal information by our affiliated companies.
1. WHAT PERSONAL INFORMATION DO WE COLLECT FROM YOU?
We may collect the following types of information about you: (i) information provided by you, including information from applications and other forms we receive from you, (ii) information about your transactions with us or our affiliates, (iii) information about your transactions with nonaffiliated third parties, (iv) information from consumer reporting agencies, (v) information obtained from our websites, and (vi) information obtained from other sources. For example:
• We collect information such as your name, address, e-mail address, telephone/fax numbers, assets, income and investment objectives through applications and other forms you submit to us.
• We may obtain information about account balances, your use of account(s) and the types of products and services you prefer to receive from us through your dealings and transactions with us and other sources.
• We may obtain information about your creditworthiness and credit history from consumer reporting agencies.
• We may collect background information from and through third-party vendors to verify representations you have made and to comply with various regulatory requirements.
259
2011 Annual Report
December 31, 2011
U.S. Privacy Policy (unaudited) (cont'd)
2. WHEN DO WE DISCLOSE PERSONAL INFORMATION WE COLLECT ABOUT YOU?
We may disclose personal information we collect about you in each of the categories listed above to affiliated and nonaffiliated third parties.
a. Information we disclose to affiliated companies.
We may disclose personal information that we collect about you to our affiliated companies to manage your account(s) effectively, to service and process your transactions, and to let you know about products and services offered by us and affiliated companies, to manage our business, and as otherwise required or permitted by law. Offers for products and services from affiliated companies are developed under conditions designed to safeguard your personal information.
b. Information we disclose to third parties.
We may disclose personal information that we collect about you to nonaffiliated third parties to provide marketing services on our behalf or to other financial institutions with whom we have joint marketing agreements. We may also disclose all of the information we collect to other nonaffiliated third parties for our everyday business purposes, such as to process transactions, maintain account(s), respond to court orders and legal investigations, report to credit bureaus, offer our own products and services, protect against fraud, for institutional risk control, to perform services on our behalf, and as otherwise required or permitted by law.
When we share personal information about you with a nonaffiliated third party, they are required to limit their use of personal information about you to the particular purpose for which it was shared and they are not allowed to share personal information about you with others except to fulfill that limited purpose or as may be permitted or required by law.
3. HOW DO WE PROTECT THE SECURITY AND CONFIDENTIALITY OF PERSONAL INFORMATION WE COLLECT ABOUT YOU?
We maintain physical, electronic and procedural security measures that comply with applicable law and regulations to help safeguard the personal information we collect about you. We have internal policies governing the proper handling of client information by employees. Third parties that provide support or marketing services on our behalf may also receive personal information about you, and we require them to adhere to appropriate security standards with respect to such information.
4. HOW CAN YOU LIMIT OUR SHARING CERTAIN PERSONAL INFORMATION ABOUT YOU WITH OUR AFFILIATED COMPANIES FOR ELIGIBILITY DETERMINATION?
By following the opt-out procedures in Section 6, below, you may limit the extent to which we share with our affiliated companies, personal information that was collected to determine your eligibility for products and services such as your credit reports and other information that you have provided to us or that we may obtain from third parties ("eligibility information"). Eligibility information does not include your identification information or personal information pertaining to our transactions or experiences with you. Please note that, even if you direct us not to share eligibility information with our affiliated companies, we may still share your personal information, including eligibility information, with our affiliated companies under circumstances that are permitted under applicable law, such as to process transactions or to service your account.
5. HOW CAN YOU LIMIT THE USE OF CERTAIN PERSONAL INFORMATION ABOUT YOU BY OUR AFFILIATED COMPANIES FOR MARKETING?
By following the opt-out instructions in Section 6, below, you may limit our affiliated companies from marketing their products or services to you based on personal information we disclose to them. This information may include, for example, your income and account history with us. Please note that, even if you choose to limit our affiliated companies from using personal information about you that we may share with them for marketing their products and services to you, our affiliated companies may use your personal information that they obtain from us to market to you in circumstances permitted by law, such as if the affiliated party has its own relationship with you.
260
2011 Annual Report
December 31, 2011
U.S. Privacy Policy (unaudited) (cont'd)
6. HOW CAN YOU SEND US AN OPT-OUT INSTRUCTION?
If you wish to limit our sharing of eligibility information about you with our affiliated companies, or our affiliated companies' use of personal information for marketing purposes, as described in this notice, you may do so by:
• Calling us at (800) 548-7786
Monday–Friday between 8a.m. and 5p.m. (EST)
• Writing to us at the following address:
Morgan Stanley Services Company Inc.
c/o Privacy Coordinator
201 Plaza Two, 3rd Floor
Jersey City, New Jersey 07311
If you choose to write to us, your request should include: your name, address, telephone number and account number(s) to which the opt-out applies and whether you are opting out with respect to sharing of eligibility information (Section 4 above), or information used for marketing (Section 5 above), or both. Written opt-out requests should not be sent with any other correspondence. In order to process your request, we require that the request be provided by you directly and not through a third party. Once you have informed us about your privacy preferences, your opt-out preference will remain in effect with respect to this Policy (as it may be amended) until you notify us otherwise. If you are a joint account owner, we will accept instructions from any one of you and apply those instructions to the entire account.
Please understand that if you limit our sharing or our affiliated companies' use of personal information, you and any joint account holder(s) may not receive information about our affiliated companies' products and services, including products or services that could help you manage your financial resources and achieve your investment objectives.
If you have more than one account or relationship with us, please specify the accounts to which you would like us to apply your privacy choices. If you have accounts or relationships with our affiliates, you may receive multiple privacy policies from them, and will need to separately notify those companies of your privacy choices for those accounts or relationships.
7. WHAT IF AN AFFILIATED COMPANY BECOMES A NONAFFILIATED THIRD PARTY?
If, at any time in the future, an affiliated company becomes a nonaffiliated third party, further disclosures of personal information made to the former affiliated company will be limited to those described in Section 2(b) above relating to nonaffiliated third parties. If you elected under Section 6 to limit disclosures we make to affiliated companies, or use of personal information by affiliated companies, your election will not apply to use by any former affiliated company of your personal information in their possession once it becomes a nonaffiliated third party.
SPECIAL NOTICE TO RESIDENTS OF VERMONT
The following section supplements our Policy with respect to our individual clients who have a Vermont address and supersedes anything to the contrary in the above Policy with respect to those clients only.
The State of Vermont requires financial institutions to obtain your consent prior to sharing personal information that they collect about you with nonaffiliated third parties, or eligibility information with affiliated companies, other than in certain limited circumstances. Except as permitted by law, we will not share personal information we collect about you with nonaffiliated third parties or eligibility information with affiliated companies, unless you provide us with your written consent to share such information.
SPECIAL NOTICE TO RESIDENTS OF CALIFORNIA
The following section supplements our Policy with respect to our individual clients who have a California address and supersedes anything to the contrary in the above Policy with respect to those clients only.
In response to a California law, if your account has a California home address, your personal information will not be disclosed to nonaffiliated third parties except as permitted by applicable California law, and we will limit sharing such personal information with our affiliates to comply with California privacy laws that apply to us.
261
2011 Annual Report
December 31, 2011
Director and Officer Information (unaudited)
Independent Directors:
Name, Age and Address of
Independent Director | | Position(s)
Held with
Registrant | | Length of Time
Served* | | Principal Occupation(s) During Past 5 Years | | Number of
Portfolios in
Fund Complex
Overseen by
Independent
Director** | | Other Directorships
Held by Independent
Directors†† | |
Frank L. Bowman (67)
c/o Kramer Levin Naftalis &
Frankel LLP
Counsel to the Independent Directors
1177 Avenue of the Americas
New York, NY 10036 | | Director | | Since
August
2006 | | President, Strategic Decisions, LLC (consulting) (since February 2009); Director or Trustee of various Morgan Stanley Funds (since August 2006); Chairperson of the Insurance Sub-Committee of the Compliance and Insurance Committee (since February 2007); served as President and Chief Executive Officer of the Nuclear Energy Institute (policy organization) (February 2005-November 2008); retired as Admiral, U.S. Navy after serving over 38 years on active duty including 8 years as Director of the Naval Nuclear Propulsion Program in the Department of the Navy and the U.S. Department of Energy (1996-2004); served as Chief of Naval Personnel (July 1994-September 1996); and on the Joint Staff as Director of Political Military Affairs (June 1992-July 1994); Knighted as Honorary Knight Commander of the Most Excellent Order of the British Empire; Awarded the Officer de l'Orde National du Mérite by the French Government; elected to the National Academy of Engineering (2009). | | | 102 | | | Director of BP p.l.c.; Director of Naval and Nuclear Technologies LLP; Director of the Armed Services YMCA of the USA and the Naval Submarine League; Director of the American Shipbuilding Suppliers Association; Member of the National Security Advisory Council of the Center for U.S. Global Engagement and a member of the CNA Military Advisory Board; Member of the American Lung Association's President's Council. | |
|
Michael Bozic (71)
c/o Kramer Levin Naftalis & Frankel LLP
Counsel to the Independent Directors
1177 Avenue of the Americas
New York, NY 10036 | | Director | | Since
April
1994 | | Private investor; Chairperson of the Compliance and Insurance Committee (since October 2006); Director or Trustee of various Morgan Stanley Funds (since April 1994); formerly, Chairperson of the Insurance Committee (July 2006-September 2006); Vice Chairman of Kmart Corporation (December 1998-October 2000), Chairman and Chief Executive Officer of Levitz Furniture Corporation (November 1995-November 1998) and President and Chief Executive Officer of Hills Department Stores (May 1991-July 1995); variously Chairman, Chief Executive Officer, President and Chief Operating Officer (1987-1991) of the Sears Merchandise Group of Sears, Roebuck & Co. | | | 104 | | | Director of various business organizations. | |
|
Kathleen A. Dennis (58)
c/o Kramer Levin Naftalis & Frankel LLP
Counsel to the Independent Directors
1177 Avenue of the Americas
New York, NY 10036 | | Director | | Since
August
2006 | | President, Cedarwood Associates (mutual fund and investment management consulting) (since July 2006); Chairperson of the Money Market and Alternatives Sub-Committee of the Investment Committee (since October 2006) and Director or Trustee of various Morgan Stanley Funds (since August 2006); formerly, Senior Managing Director of Victory Capital Management (1993-2006). | | | 102 | | | Director of various non-profit organizations. | |
|
Dr. Manuel H. Johnson (63)
c/o Johnson Smick
Group, Inc.
888 16th Street, N.W.
Suite 740
Washington, D.C. 20006 | | Director | | Since
July
1991 | | Senior Partner, Johnson Smick International, Inc. (consulting firm); Chairperson of the Investment Committee (since October 2006) and Director or Trustee of various Morgan Stanley Funds (since July 1991); Co-Chairman and a founder of the Group of Seven Council (G7C) (international economic commission); formerly, Chairperson of the Audit Committee (July 1991-September 2006); Vice Chairman of the Board of Governors of the Federal Reserve System and Assistant Secretary of the U.S. Treasury. | | | 104 | | | Director of NVR, Inc. (home construction). | |
|
Joseph J. Kearns (69)
c/o Kearns & Associates LLC PMB754
22631 Pacific Coast Highway
Malibu, CA 90265 | | Director | | Since
August
1994 | | President, Kearns & Associates LLC (investment consulting); Chairperson of the Audit Committee (since October 2006) and Director or Trustee of various Morgan Stanley Funds (since August 1994); formerly Deputy Chairperson of the Audit Committee (July 2003-September 2006) and Chairperson of the Audit Committee of various Morgan Stanley Funds (since August 1994); CFO of the J. Paul Getty Trust. | | | 105 | | | Director of Electro Rent Corporation (equipment leasing) and The Ford Family Foundation. | |
|
262
2011 Annual Report
December 31, 2011
Director and Officer Information (unaudited) (cont'd)
Independent Directors: (cont'd)
Name, Age and Address of
Independent Director | | Position(s)
Held with
Registrant | | Length of Time
Served* | | Principal Occupation(s) During Past 5 Years | | Number of
Portfolios in
Fund Complex
Overseen by
Independent
Director** | | Other Directorships
Held by Independent
Directors†† | |
Michael F. Klein (53)
c/o Kramer Levin Naftalis & Frankel LLP
Counsel to the
Independent Directors
1177 Avenue of the Americas
New York, NY 10036 | | Director | | Since
August
2006 | | Managing Director, Aetos Capital, LLC (since March 2000) and Co-President, Aetos Alternatives Management, LLC (since January 2004); Chairperson of the Fixed Income Sub-Committee of the Investment Committee (since October 2006) and Director or Trustee of various Morgan Stanley Funds (since August 2006); formerly, Managing Director, Morgan Stanley & Co., Inc. and Morgan Stanley Dean Witter Investment Management, President, various Morgan Stanley Funds (June 1998-March 2000) and Principal, Morgan Stanley & Co., Inc. and Morgan Stanley Dean Witter Investment Management (August 1997-December 1999). | | | 102 | | | Director of certain investment funds managed or sponsored by Aetos Capital LLC. Director of Sanitized AG and Sanitized Marketing AG (specialty chemicals). | |
|
Michael E. Nugent (75)
c/o Triumph Capital, L.P.
445 Park Avenue
New York, NY 10022 | | Chairperson of the
Board and Director | | Chairperson of the Boards since July 2006 and Director since July 1991 | | General Partner, Triumph Capital, L.P. (private investment partnership); Chairperson of the Boards of various Morgan Stanley Funds (since July 2006); Director or Trustee of various Morgan Stanley Funds (since July 1991); formerly, Chairperson of the Insurance Committee (until July 2006). | | | 104 | | | None. | |
|
W. Allen Reed (64)
c/o Kramer Levin Naftalis & Frankel LLP
Counsel to the
Independent Directors
1177 Avenue of the Americas
New York, NY 10036 | | Director | | Since
August
2006 | | Chairperson of the Equity Sub-Committee of the Investment Committee (since October 2006) and Director or Trustee of various Morgan Stanley Funds (since August 2006); formerly, President and CEO of General Motors Asset Management; Chairman and Chief Executive Officer of the GM Trust Bank and Corporate Vice President of General Motors Corporation (August 1994-December 2005). | | | 102 | | | Director of Temple-Inland Industries (packaging and forest products), Director of Legg Mason, Inc. and Director of the Auburn University Foundation. | |
|
Fergus Reid (79)
c/o Joe Pietryka, Inc.
85 Charles Colman Blvd.
Pawling, NY 12564 | | Director | | Since
June
1992 | | Chairman, Joe Pietryka, Inc.; Chairperson of the Governance Committee and Director or Trustee of various Morgan Stanley Funds (since June 1992). | | | 105 | | | Trustee and Director of certain investment companies in the JPMorgan Funds complex managed by JP Morgan Investment Management Inc. | |
|
263
2011 Annual Report
December 31, 2011
Director and Officer Information (unaudited) (cont'd)
Interested Director:
Name, Age and Address of
Interested Director | | Position(s) Held
with Registrant | | Term of Office
and Length of
Time Served* | | Principal Occupation(s) During Past 5 Years | | Number of
Portfolios in
Fund Complex
Overseen by
Interested
Director** | | Other Directorships
Held by Interested
Director†† | |
James F. Higgins (64)
c/o Morgan Stanley Services
Company Inc.
Harborside Financial Center
201 Plaza Two
Jersey City, NJ 07311 | | Director | | Since
June
2000 | | Director or Trustee of various Morgan Stanley Funds (since June 2000); Senior Advisor of Morgan Stanley (since August 2000). | | | 103 | | | Director of AXA Financial, Inc. and The Equitable Life Assurance Society of the United States (financial services). | |
|
* Each Director serves an indefinite term, until his or her successor is elected.
** The Fund Complex includes (as of December 31, 2011) all open-end and closed-end funds (including all of their portfolios) advised by Morgan Stanley Investment Management Inc. (the "Adviser") and any funds that have an adviser that is an affiliated person of the Adviser (including, but not limited to, Morgan Stanley AIP GP LP).
†† This includes any directorships at public companies and registered investment companies held by the Director at any time during the past five years.
264
2011 Annual Report
December 31, 2011
Director and Officer Information (unaudited) (cont'd)
Executive Officers:
| Name, Age and Address of Executive Officer | | Position(s) Held
with
Registrant | | Term of Office
and Length of
Time Served* | | Principal Occupation(s) During Past 5 Years | |
Arthur Lev (50)
522 Fifth Avenue
New York, NY 10036 | | President and Principal Executive Officer — Equity and Fixed Income Funds | | Since June 2011 | | President and Principal Executive Officer (since June 2011) of the Equity and Fixed Income Funds in the Fund Complex; Head of the Long Only Business of Morgan Stanley Investment Management (since February 2011); Managing Director of the Adviser and various entities affiliated with the Adviser (since December 2006). Formerly, Chief Strategy Officer of Morgan Stanley Investment Management's Traditional Asset Management business (November 2010-February 2011); General Counsel of Morgan Stanley Investment Management (December 2006-October 2010); Partner and General Counsel of FrontPoint Partners LLC (July 2002-December 2006); Managing Director and General Counsel of Morgan Stanley Investment Management (May 2000-June 2002). | |
|
Mary Ann Picciotto (38)
c/o Morgan Stanley Services Company Inc.
Harborside Financial Center
201 Plaza Two
Jersey City, NJ 07311 | | Chief Compliance Officer | | Since
May
2010 | | Managing Director of the Adviser and various entities affiliated with the Adviser; Chief Compliance Officer of various Morgan Stanley Funds (since May 2010); Chief Compliance Officer of the Adviser (since April 2007). | |
|
Stefanie V. Chang Yu (45)
522 Fifth Avenue
New York, NY 10036 | | Vice President | | Since
December
1997 | | Managing Director of the Adviser and various entities affiliated with the Adviser; Vice President of various Morgan Stanley Funds (since December 1997). | |
|
Mary E. Mullin (44)
522 Fifth Avenue
New York, NY 10036 | | Secretary | | Since
June
1999 | | Executive Director of the Adviser and various entities affiliated with the Adviser; Secretary of various Morgan Stanley Funds (since June 1999). | |
|
Francis J. Smith (46)
c/o Morgan Stanley Services Company Inc.
Harborside Financial Center
201 Plaza Two
Jersey City, NJ 07311 | | Treasurer and Principal Financial Officer | | Treasurer since July 2003 and Principal Financial Officer since September 2002 | | Executive Director of the Adviser and various entities affiliated with the Adviser; Treasurer and Principal Financial Officer of various Morgan Stanley Funds (since July 2003). | |
|
* Each Officer serves an indefinite term, until his or her successor is elected.
265
Investment Adviser and Administrator
Morgan Stanley Investment Management Inc.
522 Fifth Avenue
New York, New York 10036
Distributor
Morgan Stanley Distribution, Inc.
100 Front Street, Suite 400
West Conshohocken, Pennsylvania 19428
Dividend Disbursing and Transfer Agent
Morgan Stanley Services Company Inc.
P.O. Box 219804
Kansas City, Missouri 64121
Custodian
State Street Bank and Trust Company
One Lincoln Street
Boston, Massachusetts 02111
Legal Counsel
Dechert LLP
1095 Avenue of the Americas
New York, New York 10036
Independent Registered Public Accounting Firm
Ernst & Young LLP
200 Clarendon Street
Boston, Massachusetts 02116
Reporting to Shareholders
Each Morgan Stanley Fund provides a complete schedule of portfolio holdings in its semi-annual and annual reports within 60 days of the end of the Fund's second and fourth fiscal quarters. The semi-annual reports and the annual reports are filed electronically with the Securities and Exchange Commission (SEC) on Form N-CSRS and Form N-CSR, respectively. Morgan Stanley also delivers the semi-annual and annual reports to Fund shareholders and makes these reports available on its public website, www.morganstanley.com/im. Each Morgan Stanley Fund also files a complete schedule of portfolio holdings with the SEC for the Fund's first and third fiscal quarters on Form N-Q. Morgan Stanley does not deliver the reports for the first and third fiscal quarters to shareholders, nor are the reports posted to the Morgan Stanley public website. You may, however, obtain the Form N-Q filings (as well as the Form N-CSR and N-CSRS filings) by accessing the SEC's website, www.sec.gov. You may also review and copy them at the SEC's public reference room in Washington, DC. Information on the operation of the SEC's Public Reference Room may be obtained by calling the SEC toll free at 1-(800) SEC-0330. You can also request copies of these materials, upon payment of a duplicating fee, by electronic request at the SEC's email address (publicinfo@sec.gov) or by writing the Public Reference section of the SEC, Washington, DC 20549-0102.
Proxy Voting Policies and Procedures and Proxy Voting Record
You may obtain a copy of the Fund's Proxy Voting Policy and Procedures and information regarding how the Fund voted proxies relating to portfolio securities during the most recent twelve-month period ended June 30, without charge, upon request, by calling toll free 1-(800) 548-7786 or by visiting our website at www.morganstanley.com/im. This information is also available on the SEC's website at www.sec.gov.
This report is authorized for distribution only when preceded or accompanied by a prospectus of the Morgan Stanley Institutional Fund, Inc. which describes in detail each Investment Portfolio's investment policies, risks, fees and expenses. Please read the prospectus carefully before you invest or send money. For additional information, including information regarding the investments comprising the Portfolio, please visit our website at www.morganstanley.com/im or call toll free 1-(800) 548-7786.
266
(This Page has been left blank intentionally.)
(This Page has been left blank intentionally.)
Printed in U.S.A.
This Report has been prepared for shareholders and may be distributed
to others only if preceded or accompanied by a current prospectus.
Morgan Stanley Investment Management Inc.
522 Fifth Avenue
New York, New York 10036
© 2012 Morgan Stanley

MSIFIANN
IU12-00334P-Y12/11
Item 2. Code of Ethics.
(a) The Fund has adopted a code of ethics (the “Code of Ethics”) that applies to its principal executive officer, principal financial officer, principal accounting officer or controller, or persons performing similar functions, regardless of whether these individuals are employed by the Fund or a third party.
(b) No information need be disclosed pursuant to this paragraph.
(c) Not applicable.
(d) Not applicable.
(e) Not applicable.
(f)
(1) The Fund’s Code of Ethics is attached hereto as Exhibit 12 A.
(2) Not applicable.
(3) Not applicable.
Item 3. Audit Committee Financial Expert.
The Fund’s Board of Trustees has determined that Joseph J. Kearns, an “independent” Trustee, is an “audit committee financial expert” serving on its audit committee. Under applicable securities laws, a person who is determined to be an audit committee financial expert will not be deemed an “expert” for any purpose, including without limitation for the purposes of Section 11 of the Securities Act of 1933, as a result of being designated or identified as an audit committee financial expert. The designation or identification of a person as an audit committee financial expert does not impose on such person any duties, obligations, or liabilities that are greater than the duties, obligations, and liabilities imposed on such person as a member of the audit committee and Board of Trustees in the absence of such designation or identification
Item 4. Principal Accountant Fees and Services.
(a)(b)(c)(d) and (g). Based on fees billed for the periods shown:
2011
| | Registrant | | Covered Entities(1) | |
Audit Fees | | $ | 767,590 | | N/A | |
| | | | | |
Non-Audit Fees | | | | | |
Audit-Related Fees | | $ | — | (2) | $ | | (2) |
Tax Fees | | $ | 77,090 | (3) | $ | 89,626 | (4) |
All Other Fees | | $ | | | $ | 1,133,094 | |
Total Non-Audit Fees | | $ | 77,090 | | $ | 1,222,720 | |
| | | | | |
Total | | $ | 844,680 | | $ | 1,222,720 | |
2010
| | Registrant | | Covered Entities(1) | |
Audit Fees | | $ | 731,530 | | N/A | |
| | | | | |
Non-Audit Fees | | | | | |
Audit-Related Fees | | $ | — | (2) | $ | — | (2) |
Tax Fees | | $ | 71,340 | (3) | $ | 199,783 | (4) |
All Other Fees | | $ | | | $ | 90,520 | (5) |
Total Non-Audit Fees | | $ | 71,340 | | $ | 290,303 | |
| | | | | |
Total | | $ | 802,870 | | $ | 290,303 | |
N/A- Not applicable, as not required by Item 4.
(1) Covered Entities include the Adviser (excluding sub-advisors) and any entity controlling, controlled by or under common control with the Adviser that provides ongoing services to the Registrant.
(2) Audit-Related Fees represent assurance and related services provided that are reasonably related to the performance of the audit of the financial statements of the Covered Entities’ and funds advised by the Adviser or its affiliates, specifically data verification and agreed-upon procedures related to asset securitizations and agreed-upon procedures engagements.
(3) Tax Fees represent tax compliance, tax planning and tax advice services provided in connection with the preparation and review of the Registrant’s tax returns.
(4) Tax Fees represent tax compliance, tax planning and tax advice services provided in connection with the review of Covered Entities’ tax returns.
(5) All other fees represent project management for future business applications and improving business and operational processes.
(e)(1) The audit committee’s pre-approval policies and procedures are as follows:
APPENDIX A
AUDIT COMMITTEE
AUDIT AND NON-AUDIT SERVICES
PRE-APPROVAL POLICY AND PROCEDURES
OF THE
MORGAN STANLEY RETAIL AND INSTITUTIONAL FUNDS
AS ADOPTED AND AMENDED JULY 23, 2004,(1)
1. Statement of Principles
The Audit Committee of the Board is required to review and, in its sole discretion, pre-approve all Covered Services to be provided by the Independent Auditors to the Fund and Covered Entities in order to assure that services performed by the Independent Auditors do not impair the auditor’s independence from the Fund.
The SEC has issued rules specifying the types of services that an independent auditor may not provide to its audit client, as well as the audit committee’s administration of the engagement of the independent auditor. The SEC’s rules establish two different approaches to pre-approving services, which the SEC considers to be equally valid. Proposed services either: may be pre-approved without consideration of specific case-by-case services by the Audit Committee (“general pre-approval”); or require the specific pre-approval of the Audit Committee or its delegate (“specific pre-approval”). The Audit Committee believes that the combination of these two approaches in this Policy will result in an effective and efficient procedure to pre-approve services performed by the Independent Auditors. As set forth in this Policy, unless a type of service has received general pre-approval, it will require specific pre-approval by the Audit Committee (or by any member of the Audit Committee to which pre-approval authority has been delegated) if it is to be provided by the Independent Auditors. Any proposed services exceeding pre-approved cost levels or budgeted amounts will also require specific pre-approval by the Audit Committee.
The appendices to this Policy describe the Audit, Audit-related, Tax and All Other services that have the general pre-approval of the Audit Committee. The term of any general pre-approval is 12 months from the date of pre-approval, unless the Audit Committee considers and provides a different period and states otherwise. The Audit Committee will annually review and pre-approve the services that may be provided by the Independent Auditors without obtaining specific pre-approval from the Audit Committee. The Audit Committee will add to or subtract from the list of general pre-approved services from time to time, based on subsequent determinations.
(1) This Audit Committee Audit and Non-Audit Services Pre-Approval Policy and Procedures (the “Policy”), adopted as of the date above, supersedes and replaces all prior versions that may have been adopted from time to time.
The purpose of this Policy is to set forth the policy and procedures by which the Audit Committee intends to fulfill its responsibilities. It does not delegate the Audit Committee’s responsibilities to pre-approve services performed by the Independent Auditors to management.
The Fund’s Independent Auditors have reviewed this Policy and believes that implementation of the Policy will not adversely affect the Independent Auditors’ independence.
2. Delegation
As provided in the Act and the SEC’s rules, the Audit Committee may delegate either type of pre-approval authority to one or more of its members. The member to whom such authority is delegated must report, for informational purposes only, any pre-approval decisions to the Audit Committee at its next scheduled meeting.
3. Audit Services
The annual Audit services engagement terms and fees are subject to the specific pre-approval of the Audit Committee. Audit services include the annual financial statement audit and other procedures required to be performed by the Independent Auditors to be able to form an opinion on the Fund’s financial statements. These other procedures include information systems and procedural reviews and testing performed in order to understand and place reliance on the systems of internal control, and consultations relating to the audit. The Audit Committee will approve, if necessary, any changes in terms, conditions and fees resulting from changes in audit scope, Fund structure or other items.
In addition to the annual Audit services engagement approved by the Audit Committee, the Audit Committee may grant general pre-approval to other Audit services, which are those services that only the Independent Auditors reasonably can provide. Other Audit services may include statutory audits and services associated with SEC registration statements (on Forms N-1A, N-2, N-3, N-4, etc.), periodic reports and other documents filed with the SEC or other documents issued in connection with securities offerings.
The Audit Committee has pre-approved the Audit services in Appendix B.1. All other Audit services not listed in Appendix B.1 must be specifically pre-approved by the Audit Committee (or by any member of the Audit Committee to which pre-approval has been delegated).
4. Audit-related Services
Audit-related services are assurance and related services that are reasonably related to the performance of the audit or review of the Fund’s financial statements and, to the extent they are Covered Services, the Covered Entities or that are traditionally performed by the Independent Auditors. Because the Audit Committee believes that the provision of Audit-related services does not impair the independence of the auditor and is consistent with the SEC’s rules on auditor independence, the Audit Committee may grant general pre-approval to Audit-related services. Audit-related services include, among others, accounting consultations related to accounting, financial reporting or disclosure matters
not classified as “Audit services”; assistance with understanding and implementing new accounting and financial reporting guidance from rulemaking authorities; agreed-upon or expanded audit procedures related to accounting and/or billing records required to respond to or comply with financial, accounting or regulatory reporting matters; and assistance with internal control reporting requirements under Forms N-SAR and/or N-CSR.
The Audit Committee has pre-approved the Audit-related services in Appendix B.2. All other Audit-related services not listed in Appendix B.2 must be specifically pre-approved by the Audit Committee (or by any member of the Audit Committee to which pre-approval has been delegated).
5. Tax Services
The Audit Committee believes that the Independent Auditors can provide Tax services to the Fund and, to the extent they are Covered Services, the Covered Entities, such as tax compliance, tax planning and tax advice without impairing the auditor’s independence, and the SEC has stated that the Independent Auditors may provide such services.
Pursuant to the preceding paragraph, the Audit Committee has pre-approved the Tax Services in Appendix B.3. All Tax services in Appendix B.3 must be specifically pre-approved by the Audit Committee (or by any member of the Audit Committee to which pre-approval has been delegated).
6. All Other Services
The Audit Committee believes, based on the SEC’s rules prohibiting the Independent Auditors from providing specific non-audit services, that other types of non-audit services are permitted. Accordingly, the Audit Committee believes it may grant general pre-approval to those permissible non-audit services classified as All Other services that it believes are routine and recurring services, would not impair the independence of the auditor and are consistent with the SEC’s rules on auditor independence.
The Audit Committee has pre-approved the All Other services in Appendix B.4. Permissible All Other services not listed in Appendix B.4 must be specifically pre-approved by the Audit Committee (or by any member of the Audit Committee to which pre-approval has been delegated).
7. Pre-Approval Fee Levels or Budgeted Amounts
Pre-approval fee levels or budgeted amounts for all services to be provided by the Independent Auditors will be established annually by the Audit Committee. Any proposed services exceeding these levels or amounts will require specific pre-approval by the Audit Committee. The Audit Committee is mindful of the overall relationship of fees for audit and non-audit services in determining whether to pre-approve any such services.
8. Procedures
All requests or applications for services to be provided by the Independent Auditors that do not require specific approval by the Audit Committee will be submitted to the Fund’s Chief Financial Officer and must include a detailed description of the services to be
rendered. The Fund’s Chief Financial Officer will determine whether such services are included within the list of services that have received the general pre-approval of the Audit Committee. The Audit Committee will be informed on a timely basis of any such services rendered by the Independent Auditors. Requests or applications to provide services that require specific approval by the Audit Committee will be submitted to the Audit Committee by both the Independent Auditors and the Fund’s Chief Financial Officer, and must include a joint statement as to whether, in their view, the request or application is consistent with the SEC’s rules on auditor independence.
The Audit Committee has designated the Fund’s Chief Financial Officer to monitor the performance of all services provided by the Independent Auditors and to determine whether such services are in compliance with this Policy. The Fund’s Chief Financial Officer will report to the Audit Committee on a periodic basis on the results of its monitoring. Both the Fund’s Chief Financial Officer and management will immediately report to the chairman of the Audit Committee any breach of this Policy that comes to the attention of the Fund’s Chief Financial Officer or any member of management.
9. Additional Requirements
The Audit Committee has determined to take additional measures on an annual basis to meet its responsibility to oversee the work of the Independent Auditors and to assure the auditor’s independence from the Fund, such as reviewing a formal written statement from the Independent Auditors delineating all relationships between the Independent Auditors and the Fund, consistent with Independence Standards Board No. 1, and discussing with the Independent Auditors its methods and procedures for ensuring independence.
10. Covered Entities
Covered Entities include the Fund’s investment adviser(s) and any entity controlling, controlled by or under common control with the Fund’s investment adviser(s) that provides ongoing services to the Fund(s). Beginning with non-audit service contracts entered into on or after May 6, 2003, the Fund’s audit committee must pre-approve non-audit services provided not only to the Fund but also to the Covered Entities if the engagements relate directly to the operations and financial reporting of the Fund. This list of Covered Entities would include:
Morgan Stanley Retail Funds
Morgan Stanley Investment Advisors Inc.
Morgan Stanley & Co. Incorporated
Morgan Stanley DW Inc.
Morgan Stanley Investment Management Inc.
Morgan Stanley Investment Management Limited
Morgan Stanley Investment Management Private Limited
Morgan Stanley Asset & Investment Trust Management Co., Limited
Morgan Stanley Investment Management Company
Morgan Stanley Services Company, Inc.
Morgan Stanley Distributors Inc.
Morgan Stanley Trust FSB
Morgan Stanley Institutional Funds
Morgan Stanley Investment Management Inc.
Morgan Stanley Investment Advisors Inc.
Morgan Stanley Investment Management Limited
Morgan Stanley Investment Management Private Limited
Morgan Stanley Asset & Investment Trust Management Co., Limited
Morgan Stanley Investment Management Company
Morgan Stanley & Co. Incorporated
Morgan Stanley Distribution, Inc.
Morgan Stanley AIP GP LP
Morgan Stanley Alternative Investment Partners LP
(e)(2) Beginning with non-audit service contracts entered into on or after May 6, 2003, the audit committee also is required to pre-approve services to Covered Entities to the extent that the services are determined to have a direct impact on the operations or financial reporting of the Registrant. 100% of such services were pre-approved by the audit committee pursuant to the Audit Committee’s pre-approval policies and procedures (attached hereto).
(f) Not applicable.
(g) See table above.
(h) The audit committee of the Board of Trustees has considered whether the provision of services other than audit services performed by the auditors to the Registrant and Covered Entities is compatible with maintaining the auditors’ independence in performing audit services.
Item 5. Audit Committee of Listed Registrants.
(a) The Fund has a separately-designated standing audit committee established in accordance with Section 3(a)(58)(A) of the Exchange Act whose members are:
Joseph Kearns, Michael Nugent and Allen Reed.
(b) Not applicable.
Item 6. Schedule of Investments
(a) Refer to Item 1.
(b) Not applicable.
Item 7. Disclosure of Proxy Voting Policies and Procedures for Closed-End Management Investment Companies.
Applicable only to reports filed by closed-end funds.
Item 8. Portfolio Managers of Closed-End Management Investment Companies
Applicable only to reports filed by closed-end funds.
Item 9. Closed-End Fund Repurchases
Applicable only to reports filed by closed-end funds.
Item 10. Submission of Matters to a Vote of Security Holders
Not applicable.
Item 11. Controls and Procedures
(a) The Fund’s principal executive officer and principal financial officer have concluded that the Fund’s disclosure controls and procedures are sufficient to ensure that information required to be disclosed by the Fund in this Form N-CSR was recorded, processed, summarized and reported within the time periods specified in the Securities and Exchange Commission’s rules and forms, based upon such officers’ evaluation of these controls and procedures as of a date within 90 days of the filing date of the report.
(b) There were no changes in the registrant’s internal control over financial reporting that occurred during the second fiscal quarter of the period covered by this report that has materially affected, or is reasonably likely to materially affect, the registrant’s internal control over financial reporting.
Item 12. Exhibits
(a) The Code of Ethics for Principal Executive and Senior Financial Officers is attached hereto.
(b) A separate certification for each principal executive officer and principal financial officer of the registrant are attached hereto as part of EX-99.CERT.
SIGNATURES
Pursuant to the requirements of the Securities Exchange Act of 1934 and the Investment Company Act of 1940, the registrant has duly caused this report to be signed on its behalf by the undersigned, thereunto duly authorized.
Morgan Stanley Institutional Fund, Inc. | |
| |
/s/ Arthur Lev | |
Arthur Lev | |
Principal Executive Officer | |
February 15, 2012 | |
Pursuant to the requirements of the Securities Exchange Act of 1934 and the Investment Company Act of 1940, this report has been signed by the following persons on behalf of the registrant and in the capacities and on the dates indicated.
/s/ Arthur Lev | |
Arthur Lev | |
Principal Executive Officer | |
February 15, 2012 | |
| |
/s/ Francis Smith | |
Francis Smith | |
Principal Financial Officer | |
February 15, 2012 | |